SECURITIES AND EXCHANGE COMMISSION
Washington, D.C. 20549
FORM 20-F
| ¨ | REGISTRATION STATEMENT PURSUANT TO SECTION 12(b) OR (g) OF THE SECURITIES EXCHANGE ACT OF 1934 |
OR
| x | ANNUAL REPORT PURSUANT TO SECTION 13 OR 15(d) OF THE SECURITIES EXCHANGE ACT OF 1934 |
For the fiscal year ended December 31, 2005
OR
| ¨ | TRANSITION REPORT PURSUANT TO SECTION 13 OR 15(d) OF THE SECURITIES EXCHANGE ACT OF 1934 |
OR
| ¨ | SHELL COMPANY REPORT PURSUANT TO SECTION 13 OR 15(d) OF THE SECURITIES EXCHANGE ACT OF 1934 |
Date of event requiring this shell company report
Commission file number: 1-10110
BANCO BILBAO VIZCAYA ARGENTARIA, S.A.
(Exact name of Registrant as specified in its charter)
BANK BILBAO VIZCAYA ARGENTARIA, S.A.
(Translation of Registrant’s name into English)
Kingdom of Spain
(Jurisdiction of incorporation)
Plaza de San Nicolás 4
48005 Bilbao
Spain
(Address of principal executive offices)
Securities registered or to be registered pursuant to Section 12(b) of the Act.
| | |
Title of Each Class | | Name of Each Exchange on which Registered |
American Depositary Shares, each representing the right to receive one ordinary share, par value €0.49 per share | | New York Stock Exchange |
| |
| Ordinary shares, par value €0.49 per share | | New York Stock Exchange* |
| |
Non-Cumulative Guaranteed Preference Shares, Series B, nominal value $25 each, of BBVA Preferred Capital Ltd. | | New York Stock Exchange |
| |
Guarantee of Non-Cumulative Guaranteed Preference Shares, Series B, nominal value $25 each, of BBVA Preferred Capital Ltd. | | New York Stock Exchange** |
| * | The ordinary shares are not listed for trading, but are listed only in connection with the registration of the American Depositary Shares, pursuant to requirements of the New York Stock Exchange. |
| ** | The guarantee is not listed for trading, but is listed only in connection with the registration of the corresponding Non-Cumulative Guaranteed Preference Shares of BBVA Preferred Capital Ltd. (a wholly-owned subsidiary of Banco Bilbao Vizcaya Argentaria, S.A.) |
Securities registered or to be registered pursuant to Section 12(g) of the Act.
None
Securities for which there is a reporting obligation pursuant to Section 15(d) of the Act.
None
The number of outstanding shares of each class of stock of the Registrant at December 31, 2005 was:
Ordinary shares, par value €0.49 per share—3,390,852,043
Non-Cumulative Guaranteed Preference Shares, Series B, nominal value $25 each, of BBVA Preferred Capital Ltd.—9,600,000
Indicate by check mark if the registrant is a well-known seasoned issuer, as defined in Rule 405 of the Securities Act.
Yes x No ¨
If this report is an annual or transition report, indicate by check mark if the registrant is not required to file reports pursuant to Section 13 or 15(d) of the Securities Exchange Act of 1934.
Yes¨ No x
Indicate by check mark whether the registrant (1) has filed all reports required to be filed by Section 13 or 15(d) of the Securities Exchange Act of 1934 during the preceding 12 months (or for such shorter period that the registrant was required to file such reports), and (2) has been subject to such filing requirements for the past 90 days.
Yes x No ¨
Indicate by check mark whether the registrant is a large accelerated filer, an accelerated filer, or a non-accelerated filer. See definition of “accelerated filer and large accelerated filer” in Rule 12b-2 of the Exchange Act. (Check One):
Large accelerated filer x Accelerated filer ¨ Non-accelerated filer ¨
Indicate by check mark which financial statement item the registrant has elected to follow.
Item 17¨ Item 18x
If this is an annual report, indicate by check mark whether the registrant is a shell company (as defined in Rule 12b-2 of the Exchange Act).
Yes ¨ No x
BANCO BILBAO VIZCAYA ARGENTARIA, S.A.
TABLE OF CONTENTS
i
ii
GLOSSARY
The terms below are used as follows throughout this Annual Report:
| | • | | “Argentaria” means Argentaria, Caja Postal y Banco Hipotecario, S.A. and its consolidated subsidiaries, unless otherwise indicated or the context otherwise requires. |
| | • | | “BBV” means Banco Bilbao Vizcaya, S.A. and its consolidated subsidiaries, unless otherwise indicated or the context otherwise requires. |
| | • | | “BBVA”, “Bank” or “Group” means Banco Bilbao Vizcaya Argentaria, S.A. and its consolidated subsidiaries unless otherwise indicated or the context otherwise requires. BBVA was formed by the merger of BBV and Argentaria, which was approved by the shareholders of each institution on December 18, 1999. |
| | • | | “Consolidated Financial Statements” means BBVA’s audited consolidated financial statements as of and for the years ended December 31, 2005 and 2004 prepared in accordance with the International Financial Reporting Standards previously adopted by the European Union (“EU-IFRS”). |
FORWARD-LOOKING STATEMENTS
This Annual Report contains statements that constitute forward-looking statements within the meaning of Section 27A of the Securities Act of 1933, Section 21E of the U.S. Securities Exchange Act of 1934, as amended, and the safe harbor provisions of the Private Securities Litigation Reform Act of 1995. Forward-looking statements may include words such as “believe”, “expect”, “estimate”, “project”, “anticipate”, “should”, “intend”, “probability”, “risk”, “VaR”, “target”, “goal”, “objective” and similar expressions or variations on such expressions. Forward-looking statements are not guarantees of future performance and involve risks and uncertainties, and actual results may differ materially from those in the forward-looking statements as a result of various factors. The accompanying information in this Annual Report, including, without limitation, the information under
| | • | | “Item 3. Key Information—Risk Factors”; |
| | • | | “Item 4. Information on the Company”; |
| | • | | “Item 5. Operating and Financial Review and Prospects”; and |
| | • | | “Item 11. Quantitative and Qualitative Disclosures About Market Risk” |
identifies important factors that could cause such differences.
Other important factors that could cause actual results to differ materially from those in forward-looking statements include, among others:
| | • | | general political, economic and business conditions in Spain, the European Union, Latin America and other regions, countries or territories in which we operate; |
| | • | | changes in applicable laws and regulations, including taxes; |
| | • | | the monetary, interest rate and other policies of central banks in Spain, the European Union, the United States and elsewhere; |
| | • | | changes or volatility in interest rates, foreign exchange rates (including the euro to U.S. dollar exchange rate), asset prices, equity markets, commodity prices, inflation or deflation; |
| | • | | the effects of competition in the markets in which we operate, which may be influenced by regulation or deregulation; |
| | • | | changes in consumer spending and savings habits, including changes in government policies which may influence investment decisions; |
| | • | | our ability to hedge certain risks economically; |
| | • | | our success in managing the risks involved in the foregoing, which depends, among other things, on our ability to anticipate events that cannot be captured by the statistical models we use; and |
1
| | • | | force majeure and other events beyond our control. |
Readers are cautioned not to place undue reliance on such forward-looking statements, which speak only as of the date hereof. BBVA undertakes no obligation to release publicly the result of any revisions to these forward-looking statements which may be made to reflect events or circumstances after the date hereof, including, without limitation, changes in its business or acquisition strategy or planned capital expenditures, or to reflect the occurrence of unanticipated events.
CERTAIN TERMS AND CONVENTIONS
First person personal pronouns used in this report, such as “we”, “us”, or “our”, mean BBVA.
In this report, “$”, “U.S. dollars”, and “dollars” refer to United States Dollars, “€” and “euro” refer to Euro.
PRESENTATION OF FINANCIAL INFORMATION
Accounting Principles Affecting 2003, 2002 and 2001
Unless otherwise indicated, the financial information included in this Annual Report with respect to 2003, 2002 and 2001 has been derived from financial statements that have been prepared in accordance with generally accepted accounting principles which were in effect during the above mentioned years for banks in Spain, which include the accounting requirements established by the Bank of Spain (“Spanish GAAP”).
Accounting Principles Affecting 2005 and 2004
Under Regulation (EC) no. 1606/2002 of the European Parliament and of the Council of 19 July 2002, all companies governed by the law of an EU Member State and whose securities are admitted to trading on a regulated market of any Member State must prepare their consolidated financial statements for the years beginning on or after January 1, 2005 in conformity with EU-IFRS. Therefore, the Group is required to prepare its consolidated financial statements for the year ended December 31, 2005 (together with comparative financial information for the year ended December 31, 2004) in conformity with the EU-IFRSs ratified by the European Union at that date. EU-IFRS, as adopted by the European Union and applied by us in our consolidated financial statements as of and for the year ended December 31, 2005, does not differ from IFRS, as published by the International Accounting Standards Board (IASB), effective as of December 31, 2005, and therefore, complies in full with IFRS, as published by the IASB.
EU-IFRS differs in certain significant respects from Spanish GAAP. As a result, our financial information presented under EU-IFRS is not directly comparable to our financial information presented with respect to previous years under Spanish GAAP, and readers should avoid such a comparison. For quantitative information regarding the adjustments required to reconcile our Spanish GAAP financial information to EU-IFRS, see Note 3 to the Consolidated Financial Statements.
See Note 59 to our Consolidated Financial Statements for a quantitative reconciliation of profit for the year and shareholders’ equity from IFRS to U.S. GAAP.
2
The Consolidated Financial Statements have been presented in the same format as that used in the consolidated financial statements included in BBVA’s annual and interim reports to shareholders. This format differs from that required by the United States Securities and Exchange Commission (the “SEC” or “Commission”) for the consolidated financial statements of bank holding companies. Consolidated balance sheets and summary statements of income that reflect the reclassifications required by the Commission are included in Note 59 to the Consolidated Financial Statements.
We managed our business during 2005 along four segmental lines which are discussed in “Item 4. Information on the Company” and whose operating results are described in “Item 5. Operating and Financial Review and Prospects”. Certain numerical information in this Annual Report may not sum due to rounding.
Statistical and Financial Information
The following principles should be noted in reviewing the statistical and financial information contained herein:
| | • | | Average balances, when used, are based on the beginning and the month-end balances during each year. We do not believe that such monthly averages present trends that are materially different from those that would be presented by daily averages. |
| | • | | The book value of BBVA’s ordinary shares held by its consolidated subsidiaries has been deducted from stockholders’ equity. |
| | • | | Unless otherwise stated, any reference to loans refers to both loans and leases. |
| | • | | Interest income figures include interest income on non-accruing loans to the extent that cash payments have been received in the period in which they are due. |
| | • | | Financial information with respect to subsidiaries may not reflect consolidation adjustments. |
PART I
| ITEM 1. | IDENTITY OF DIRECTORS, SENIOR MANAGEMENT AND ADVISERS |
| A. | Directors and Senior Managers |
Not Applicable.
Not Applicable.
Not Applicable.
| ITEM 2. | OFFER STATISTICS AND EXPECTED TIMETABLE |
Not applicable.
A. Selected Financial Data
The historical financial information set forth below has been selected from, and should be read together with, the Consolidated Financial Statements included herein. For information concerning the preparation and presentation of financial information contained herein, see “Presentation of Financial Information”. Also see Note 59 of the Consolidated Financial Statements for a presentation of our shareholders’ equity and net income reconciled to U.S. GAAP.
3
EU-IFRS
| | | | | | |
| | | Year ended December 31, | |
| | | 2005 | | | 2004 | |
| | | (in millions of euro, except per share
/ ADS data (in euro) and
percentages) | |
Consolidated Statement of Income data | | | | | | |
Interest and similar income | | 15,848 | | | 12,352 | |
Interest expense and similar charges | | (8,932 | ) | | (6,447 | ) |
Income from equity instruments | | 292 | | | 255 | |
| | | | | | |
Net interest income | | 7,208 | | | 6,160 | |
Share of profit or loss of entities accounted for using the equity method | | 121 | | | 97 | |
Fee and commission income | | 4,669 | | | 4,057 | |
Fee and commission expenses | | (729 | ) | | (644 | ) |
Insurance activity income | | 487 | | | 391 | |
Gains/losses on financial assets and liabilities (net) | | 980 | | | 762 | |
Exchange differences (net) | | 287 | | | 298 | |
| | | | | | |
Gross income | | 13,023 | | | 11,121 | |
Sales and income from the provision of non-financial services | | 576 | | | 468 | |
Cost of sales | | (451 | ) | | (342 | ) |
Other operating income | | 134 | | | 22 | |
Personnel expenses | | (3,602 | ) | | (3,247 | ) |
Other administrative expenses | | (2,160 | ) | | (1,851 | ) |
Depreciation and amortization | | (449 | ) | | (448 | ) |
Other operating expenses | | (249 | ) | | (132 | ) |
| | | | | | |
Net operating income | | 6,823 | | | 5,591 | |
Impairment losses (net) | | (854 | ) | | (958 | ) |
Provision expense (net) | | (454 | ) | | (850 | ) |
Finance income from non-financial activities | | 2 | | | 9 | |
Finance expenses from non-financial activities | | (2 | ) | | (5 | ) |
Other gains | | 285 | | | 622 | |
Other losses | | (208 | ) | | (271 | ) |
| | | | | | |
Income before tax | | 5,592 | | | 4,138 | |
Income tax | | (1,521 | ) | | (1,029 | ) |
| | | | | | |
Income from ordinary activities | | 4,071 | | | 3,109 | |
Income from discontinued operations (net) | | — | | | — | |
| | | | | | |
Consolidated income for the year | | 4,071 | | | 3,109 | |
Income attributed to minority interests | | (265 | ) | | (186 | ) |
| | | | | | |
Income attributed to the Group | | 3,806 | | | 2,923 | |
| | | | | | |
Per Share/ADS(1) Data | | | | | | |
Net operating income(2) | | 2.02 | | | 1.66 | |
Numbers of shares | | 3,390,852,043 | | | 3,390,852,043 | |
Income attributed to the Group(2) | | 1.12 | | | 0.87 | |
Dividends(2) (3) | | 0.53 | | | 0.44 | |
| (1) | Each American Depositary Share (“ADS”) represents the right to receive one ordinary share. |
| (2) | Calculated on the basis of the weighted average number of BBVA’s ordinary shares outstanding during the relevant period (3,384 million and 3,369 million shares in 2005 and 2004, respectively). |
| (3) | Calculated based on total dividends paid in respect of each period indicated. |
4
EU-IFRS
| | | | | | |
| | | At December 31, | |
| | | 2005 | | | 2004 | |
| | | (in millions of euro,
except per share /
ADS data (in euro)
and percentages) | |
Consolidated balance sheet data | | | | | | |
Total assets | | 392,389 | | | 329,441 | |
Loans and receivables (net) | | 249,397 | | | 196,892 | |
Deposits from other creditors | | 183,375 | | | 150,726 | |
Marketable debt securities and subordinated liabilities | | 76,565 | | | 57,809 | |
Minority interests | | 971 | | | 738 | |
Shareholders’ equity | | 13,034 | | | 10,961 | |
Consolidated ratios | | | | | | |
Profitability ratios: | | | | | | |
Net interest margin(4) | | 1.98 | % | | 1.91 | % |
Return on average total assets(5) | | 1.12 | % | | 0.97 | % |
Return on average equity(6) | | 37.0 | % | | 33.2 | % |
Credit quality data | | | | | | |
Loan loss reserve | | 5,587 | | | 4,622 | |
Loan loss reserve as a percentage of total loans and receivables | | 2.19 | % | | 2.29 | % |
Substandard loans | | 2,346 | | | 2,202 | |
Substandard loans as a percentage of total loans and receivables | | 0.92 | % | | 1.10 | % |
| (1) | Each American Depositary Share (“ADS”) represents the right to receive one ordinary share. |
| (2) | Calculated on the basis of the weighted average number of BBVA’s ordinary shares outstanding during the relevant period (3,384 million and 3,369 million shares in 2005 and 2004, respectively). |
| (3) | Calculated based on total dividends paid in respect of each period indicated. |
| (4) | Represents net interest income as a percentage of average total assets. |
| (5) | Represents income before minority interests as a percentage of average total assets. |
| (6) | Represents net attributable profit as a percentage of average shareholders’ equity. |
U.S. GAAP Information
| | | | | | | | | | |
| | | Year ended December 31, |
| | | 2005 | | 2004 | | 2003 | | 2002 | | 2001 |
| | | (in millions of euro, except per share/
ADS data (in euro) or as otherwise indicated) |
Consolidated statement of income data | | | | | | | | | | |
Net income(1) | | 2,018 | | 3,095 | | 1,906 | | 1,846 | | 680 |
Basic earnings per share/ADS(2)(3) | | 0.595 | | 0.918 | | 0.60 | | 0.58 | | 0.21 |
Diluted earnings per share/ADS(2)(3) | | 0.595 | | 0.918 | | 0.60 | | 0.58 | | 0.21 |
Dividends per share/ADS (in dollars)(3)(4) | | 0.658 | | 0.552 | | 0.34 | | 0.33 | | 0.34 |
Consolidated balance sheet data | | | | | | | | | | |
Total assets(5) | | 401,799 | | 314,350 | | 287,912 | | 290,430 | | 322,612 |
Stockholders’ equity(5) | | 25,375 | | 23,465 | | 19,583 | | 18,908 | | 21,226 |
Basic stockholders’ equity per share/ADS(3) | | 7.48 | | 6.96 | | 6.13 | | 5.92 | | 6.64 |
Diluted stockholders’ equity per share/ADS(3) | | 7.48 | | 6.96 | | 6.13 | | 5.91 | | 6.63 |
| (1) | We generally refer to our income after taxes and minority interests as “net attributable profit”. In the case of the U.S. GAAP information provided above, the term “net income” is used for consistency with Note 59 |
5
| | to our Consolidated Financial Statements, which includes additional U.S. GAAP information and generally refers to “net income” in cases in which we would otherwise use the term “net attributable profit”. |
| (2) | Calculated on the basis of the weighted average number of BBVA’s ordinary shares outstanding during the relevant period. |
| (3) | Each ADS represents the right to receive one ordinary share. |
| (4) | Dividends per share/ADS are translated into dollars for 2001 through 2005, at an average exchange rate for each year, calculated based on the average of the noon buying rates for euro from the Federal Reserve Bank of New York on the last date of each month during the relevant period. |
| (5) | At the end of the reported period. |
Exchange Rates
Spain’s currency is the euro. Unless otherwise indicated, the amounts that have been converted to euro in this Annual Report have been done so at the corresponding exchange rate published by the European Central Bank on December 31 of the relevant year.
For convenience in the analysis of the information, the following tables describe, for the periods and dates indicated, information concerning the noon buying rate for euro, expressed in dollars per €1.00. The term “noon buying rate” refers to the rate of exchange for euros, expressed in U.S. dollars per euro, in the City of New York for cable transfers payable in foreign currencies as certified by the Federal Reserve Bank of New York for customs purposes.
| | |
Year ended December 31 | | Average (1) |
2001 | | 0.8909 |
2002 | | 0.9495 |
2003 | | 1.1411 |
2004 | | 1.2478 |
2005 | | 1.2400 |
2006 (through June 30) | | 1.2410 |
| (1) | The average of the noon buying rates for the euro on the last day of each month during the relevant period. |
| | | | |
Month ended | | High | | Low |
December 31, 2005 | | 1.2041 | | 1.1699 |
January 31, 2006 | | 1.2287 | | 1.1980 |
February 28, 2006 | | 1.2100 | | 1.1860 |
March 31, 2006 | | 1.2197 | | 1.1886 |
April 30, 2006 | | 1.2624 | | 1.2091 |
May 31, 2006 | | 1.2888 | | 1.2607 |
June 30, 2006 | | 1.2522 | | 1.2953 |
The noon buying rate for euro from the Federal Reserve Bank of New York, expressed in dollars per €1.00, on July 6, 2006, was $1.2757.
At December 31, 2005, approximately 29.9% of our assets and approximately 32.6% of our liabilities were denominated in currencies other than euro (principally dollars).
For a discussion of our foreign currency exposure, please see “Item 11. Quantitative and Qualitative Disclosures About Market Risk— Structural Risk —Structural Exchange Rate Risk”.
| B. | Capitalization and Indebtedness |
Not applicable.
| C. | Reasons for the Offer and Use of Proceeds |
Not applicable.
6
Risks Relating to us
Since our loan portfolio is highly concentrated in Spain, adverse changes affecting the Spanish economy could have a material adverse effect on our financial condition.
We historically have developed our lending business in Spain, which continues to be our main place of business. As of December 31, 2005, business activity in Spain accounted for 70.3% of our loan portfolio. See “Item 4. Information on the Company—Selected Statistical Information—Loans by Geographic Area”. Any adverse changes affecting the Spanish economy are likely to have a significant adverse impact on our loan portfolio and, as a result, on our financial condition and results of operations.
A substantial percentage of our customer base is particularly sensitive to adverse developments in the economy, which renders our lending activities relatively riskier than if we lent primarily to higher-income customer segments.
Medium- and small-size companies and middle and lower middle income individuals typically have less financial strength than large companies and high-income individuals and accordingly can be expected to be more negatively affected by adverse developments in the economy. As a result, it is generally accepted that lending to these segments of our existing and targeted customer base represents a relatively higher degree of risk than lending to other groups.
A substantial portion of our loan portfolio consists of residential mortgages and consumer loans to middle and lower middle income customers and commercial loans to medium- and small -size companies. Consequently, during periods of slowdown in economic activity we may experience higher levels of past due amounts which could result in higher levels of allowance for loan losses. We cannot assure you that we will not suffer substantial adverse effects on our base loan portfolio to these customer segments in the event of adverse developments in the economy.
Increased exposure to real estate in Spain makes us more vulnerable to developments in this market.
The sound economic growth, the strength of the labor market and a decrease in interest rates in Spain have caused an increase in the demand for mortgage loans in the last few years. This has had repercussions in housing prices, which have also risen significantly. As residential mortgages are one of our main assets, comprising 44% and 46% of our loan portfolio at December 31, 2004 and 2005, respectively, we are currently highly exposed to developments in real estate markets. A strong increase in interest rates or unemployment in Spain might have a significant negative impact in mortgage payment delinquency rates. An increase in such delinquency rates could have an adverse effect on our business, financial condition and results of operations.
Highly-indebted households and corporations could endanger our asset quality and future revenues.
Spanish households and firms have reached, in recent years, a high level of indebtedness, which represents increased risk for the Spanish banking system. The increase of loans referenced to variable interest rates makes debt service on such loans more vulnerable to changes in interest rates than in the past. The increase in households’ and firms’ indebtedness also limits their ability to incur additional debt, decreasing the number of new products we may otherwise be able to sell them.
A sudden shortage of funds could cause an increase in our costs of funding and an adverse effect on our operating revenues.
Historically, one of our principal sources of funds has been savings and demand deposits. Time deposits represented 29.8% and 29.1% of our total funding at December 31, 2004 and 2005, respectively. Large-denomination time deposits may, under some circumstances, such as during periods of significant changes in market interest rates for these types of deposit products and resulting increased competition for such funds, be a less stable source of deposits than savings and demand deposits. In addition, since we rely heavily on short-term deposits for our funding, we cannot assure you that, in the event of a sudden or unexpected shortage of funds in
7
the banking systems or money markets in which we operate, we will be able to maintain our current levels of funding without incurring higher funding costs or having to liquidate certain of our assets.
We face increasing competition in our business lines.
The markets in which we operate are highly competitive. Financial sector reforms in the markets in which we operate have increased competition among both local and foreign financial institutions, and we believe that this trend will continue. For example, the adoption of the euro as the common currency throughout the European Union (“EU”) is making it easier for European banks to compete against us in Spain. In addition, the trend towards consolidation in the banking industry has created larger and stronger banks with which we must now compete.
We also face competition from non-bank competitors, such as:
| | • | | department stores (for some credit products); |
We cannot assure you that this competition will not adversely affect our business, financial condition and results of operations.
Our business is particularly vulnerable to volatility in interest rates.
Our results of operations are substantially dependent upon the level of our net interest income, which is the difference between interest income from interest-earning assets and interest expense on interest-bearing liabilities. Interest rates are highly sensitive to many factors beyond our control, including deregulation of the financial sectors in the markets in which we operate, monetary policies pursued by the European Union and national governments, domestic and international economic and political conditions and other factors.
Changes in market interest rates could affect the spread between interest rates charged on interest-earning assets and interest rates paid on interest-bearing liabilities and thereby negatively affect our results of operations. For example, an increase in interest rates could cause our interest expense on deposits to increase more significantly and quickly than our interest income from loans, resulting in a reduction in our net interest income.
In addition, income from treasury operations is particularly vulnerable to interest rate volatility. Since approximately 64% of our loan portfolio consists of variable interest rate loans maturing in more than one year, rising interest rates may also bring about an increase in the non-performing loan portfolio.
Our financial statements and periodic disclosure under securities laws may not give you the same information as financial statements prepared under U.S. accounting rules and periodic disclosures provided by domestic U.S. issuers.
Publicly available information about public companies in Spain is generally less detailed and not as frequently updated as the information that is regularly published by or about listed companies in the United States. In addition, although we are subject to the periodic reporting requirements of the United States Securities Exchange Act of 1934 (the “Exchange Act”), the periodic disclosure required of foreign issuers under the Exchange Act is more limited than the periodic disclosure required of U.S. issuers. Finally, we maintain our financial accounts and records and prepare our financial statements in conformity EU-IFRS, which differs in certain respects from U.S. GAAP, the financial reporting standard to which many investors in the United States may be more accustomed.
8
Risks Relating to Latin America
Political events in Mexico could adversely affect our operations.
The Mexican government has exercised, and continues to exercise, significant influence over the Mexican economy. Mexican governmental actions concerning the economy and state-owned enterprises could have a significant effect on Mexican private sector entities in general, and on our Mexican subsidiaries in particular.
Mexico’s presidential elections were held on July 2, 2006. As of the date of this annual report, the outcome of the election is unknown. A vote recount is currently underway, and the results of the election could be contested. The uncertainty over the results of the election could result in political and economic instability and social unrest, which could adversely affect the business, financial condition and results of operations of our Mexican subsidiaries. Moreover, any new administration could implement significant changes in laws, public policies and government programs, which could have a material adverse effect on the business, financial condition and results of operations of our Mexican subsidiaries.
The devaluation of the Argentine peso, high inflation and other adverse macroeconomic conditions in Argentina and related emergency measures adopted by the Argentine Government in 2001 and 2002 have had, and may continue to have, a material adverse effect on our business, financial condition and results of operations.
The Argentine economy experienced a severe crisis in 2001 and 2002, marked by the continued movement of capital out of Argentina, the end of convertibility of the Argentine peso, devaluation, and the return of inflation. The crisis had a strong impact on the financial system and jeopardized the solvency and liquidity of banks. In 2004 and 2005, the Argentine economy stabilized and experienced significant growth, but uncertainty regarding the scope, sustainability and pace of the recovery remained. The Argentine economic and social situation has quickly deteriorated in the past and may quickly deteriorate in the future and we cannot assure you that the Argentine economy will continue to experience sustained growth.
The emergency measures adopted by the Argentine government in response to the economic crisis at the end of 2001 and during 2002 that affected our results of operations included: freezing public debt payments, ending convertibility between the Argentinean peso and the dollar, imposing cash withdrawal limits on savings accounts, re-scheduling of term deposit maturities and converting dollar assets and liabilities to Argentine pesos at different exchange rates.
As a result of the emergency measures described above, we have written off our entire investment in Argentina to date. However, despite our provisions and write-downs, a deterioration in the Argentine economy or further emergency measures adopted by the government in Argentina could have a material adverse effect on our business, financial condition and results of operations.
We cannot assure you that the laws and regulations currently governing the Argentinean economy will not change in the future, or that any changes which may occur will not adversely affect our business, financial condition or results of our operations in the country, or the business which we transact with counterparties located in the country.
Our Latin American subsidiaries’ growth, asset quality and profitability may be affected by volatile macroeconomic conditions, including government default on public debt, in the Latin American countries where they operate.
The Latin American countries in which we operate have experienced significant economic volatility in recent decades, characterized by slow growth, declining investment and significant inflation. This volatility has resulted in fluctuations in the levels of deposits and in the relative economic strength of various segments of the
9
economies to which we lend. Negative and fluctuating economic conditions, such as a changing interest rate environment, also affect our profitability by causing lending margins to decrease and leading to decreased demand for higher-margin products and services.
Negative and fluctuating economic conditions in some Latin American countries could result in government defaults on public debt. This could affect us in two ways: directly, through portfolio losses, and indirectly, through instabilities that a default in public debt could cause to the banking system as a whole, particularly since commercial banks’ exposure to government debt is generally high in several Latin American countries in which we operate.
While we seek to mitigate these risks through what we believe to be conservative risk policies, no assurance can be given that our Latin American subsidiaries’ growth, asset quality and profitability will not be affected by volatile macroeconomic conditions in the Latin American countries in which we operate.
Latin American economies can be directly and negatively affected by adverse developments in other countries.
Financial and securities markets in Latin American countries in which we operate, are to varying degrees, influenced by economic and market conditions in other countries in Latin America and beyond. Negative developments in the economy or securities markets in one country, particularly in an emerging market, may have a negative impact on other emerging market economies. These developments may adversely affect the business, financial condition and operating results of our subsidiaries in Latin America.
We are exposed to foreign exchange and, in some instances, political risks as well as other risks in the Latin American countries in which we operate, which could cause an adverse impact on our business, financial condition and results of operations.
We operate commercial banks in 10 Latin American countries and our overall success as a global business depends, in part, upon our ability to succeed in differing economic, social and political conditions. We are confronted with different legal and regulatory requirements in many of the jurisdictions in which we operate. These include, but are not limited to, different tax regimes and laws relating to the repatriation of funds or nationalization of assets. Our international operations may also expose us to risks and challenges which our local competitors may not be required to face, such as exchange rate risk, difficulty in managing a local entity from abroad, and political risk which may be particular to foreign investors. Our expansion in these markets requires us to respond to rapid changes in market conditions in these countries. We cannot assure you that we will continue to succeed in developing and implementing policies and strategies that are effective in each country in which we operate or that any of the foregoing factors will not have a material adverse effect on our business, financial condition and results of operations.
Regulatory changes in Latin America that are beyond our control may have a material effect on our business, financial condition and results of operations.
A number of banking regulations designed to maintain the safety and soundness of banks and limit their exposure to risk are applicable in certain Latin American countries in which we operate. Local regulations differ in a number of material respects from equivalent regulations in Spain and the United States.
Changes in regulations that are beyond our control may have a material effect on our business and operations. In addition, since some of the banking laws and regulations have been recently adopted, the manner in which those laws and related regulations are applied to the operations of financial institutions is still evolving. No assurance can be given that laws or regulations will be enforced or interpreted in a manner that will not have a material adverse effect on our business, financial condition and results of operations.
| ITEM 4. | INFORMATION ON THE COMPANY |
A. History and Development of the Company
BBVA’s predecessor bank, BBV, was incorporated as a limited liability company (asociedad anónima or “S.A.”) under the Spanish Corporations Law on October 1, 1988. BBVA was formed as the result of a merger by absorption of Argentaria into BBV that was approved by the shareholders of each institution on December 18, 1999 and registered on January 28, 2000. It conducts its business under the commercial name “BBVA”. BBVA is
10
registered with the Commercial Registry of Vizcaya (Spain). It has its registered office at Plaza de San Nicolás 4, Bilbao, Spain, 48005, telephone number 34-94-420-3001. BBVA’s agent in the U.S. for U.S. federal securities law purposes is Raúl Santoro de Mattos Almeida (BBVA New York, 1345 Avenue of the Americas, 45th floor, New York, 10105). BBVA is incorporated for an unlimited term.
Capital Expenditures
Our principal investments are financial, in subsidiaries and in affiliates. The main capital expenditures from 2003 to the date of this Annual Report were the following:
2006
On June 12, 2006, BBVA reached agreements to acquire State National Bancshares Inc. and Texas Regional Bancshares Inc., each of which are U.S. banking groups domiciled in Texas. The acquisition price agreed for State National Bancshares Inc. is approximately $480 million while the acquisition price agreed for Texas Regional Bancshares Inc. is approximately $2,164 million. In both cases, the acquisitions are subject to both shareholder and regulatory approvals.
On March 3, 2006, BBVA purchased 0.43% of BBVA Chile’s share capital for 2,318 million Chilean pesos (€3.7 million), increasing BBVA’s share capital in BBVA Chile to 67.05%. As the share capital of BBVA in BBVA Chile is higher than two thirds of BBVA Chile’s total share capital, BBVA in compliance with Chilean legislation launched a public tender offer for all of BBVA Chile’s share capital. The public tender offer was effective from April 3, 2006 to May 2, 2006. After the acceptance of the public tender offer by 1.13% of BBVA Chile’s outstanding shares, BBVA’s share capital in BBVA Chile increased to 68.18%.
2005
On January 6, 2005, pursuant to the agreement entered into in September 2004 and after obtaining the mandatory authorizations, the Group, through BBVA Bancomer, acquired all the shares of Hipotecaria Nacional, S.A. de C.V., a Mexican company specializing in the mortgage business. The price paid was 4,121 million Mexican pesos (approximately € 276,048 thousand) and the goodwill recognized amounted to € 259,111 thousand at December 31, 2005.
On April 28, 2005, pursuant to the agreement entered into on September 20, 2004 and after obtaining the mandatory authorizations, BBVA, acquired all the shares of Laredo National Bancshares, Inc., a bank holding company located in Texas (United States) which operates in the banking business through two independent banks: Laredo National Bank and South Texas National Bank. The price paid was US$ 859.6 million (approximately € 666,110 thousand) and the goodwill recognized amounted to € 473,941 thousand at December 31, 2005.
On October 31, 2005, the Guarantee Fund for Colombian Financial Institutions, FOGAFIN, sold by public auction 98.78% of the share capital of Banco Granahorrar, S.A. (a Colombian financial institution) to the BBVA Group’s subsidiary in Colombia, BBVA Colombia, S.A. The offer made by BBVA Colombia, S.A. for the acquisition of Banco Granahorrar, S.A. totalled US$ 423.66 million. This transaction was consummated in December 2005 after the required authorizations had been obtained from the supervisory and control bodies. The price paid was 981,572.2 million Colombian pesos, approximately € 364,163 thousand, and the goodwill recognized amounted to € 266,862 thousand at December 31, 2005.
2004
On January 30, 2004, our Board of Directors adopted a resolution to launch a tender offer for the approximately 40.6% of the shares of Bancomer, our Mexican affiliate, which were not already owned by BBVA. The tender offer was launched on February 19, 2004 and expired on March 19, 2004. As a result of the successful completion of the tender offer and subsequent purchases during 2004 of Bancomer’s capital stock, at December 31, 2004, we owned 99.70% of Bancomer’s outstanding shares.
11
On March 18, 2004, the Board of Directors of BBVA Banco Francés, S.A. (“Banco Francés”), our Argentine affiliate, resolved to implement a plan intended to improve Banco Francés’s adjusted stockholders’ equity and enable Banco Francés to comply with new minimum capital requirements established by the Argentine Central Bank. Under this plan, we:
| | • | | acquired from Banco Francés its entire interest in Banco Francés (Cayman) Limited for $238.5 million; and |
| | • | | subscribed to a capital increase by capitalizing a loan we granted to Banco Francés in an amount of $78 million. |
The transactions involving Banco Francés described above did not affect BBVA’s consolidated operating results because (i) in the case of the loan capitalization, BBVA had previously fully provisioned the loan, and (ii) in the case of the purchase of Banco Francés (Cayman) Limited, this entity was already fully consolidated by BBVA.
On October 8, 2004, we acquired all the shares of Valley Bank, a bank licensed in the state of California, for U.S.$16.7 million, which was BBVA’s first commercial banking acquisition in the United States.
2003
During 2003, BBVA acquired 0.176% of the capital stock of Gas Natural S.D.G, S.A. (“Gas Natural”) for €12.7 million, raising its interest in Gas Natural to 3.241% as of December 31, 2003.
During 2003, BBVA purchased 4.76% of the capital stock of Bancomer for a total of €304 million, raising its interest to 59.43% as of December 31, 2003.
Capital Divestitures
Our principal divestitures are financial, in subsidiaries and in affiliates. The main capital divestitures from 2003 to the date of this Annual Report were the following:
2006
On June 14, 2006, BBVA sold its 5.04% capital share in Repsol YPF S.A. The selling procedure was executed through the closing and settlement of hedging equity swaps previously contracted. This sale gave rise to a gain of €523 million.
On May 19, 2006, BBVA sold its stake in the share capital of Banca Nazionale del Lavoro (BNL) to BNP Paribas, for a price of €1,299 million following it’s adhesion on May 12, 2006, as shareholder of BNL, to the public tender offer launched by BNP Paribas to acquire 100% of BNL’s capital. The sale gave rise to a gain of €568.3 million.
On April 5, 2006, BBVA sold its stake of 51% in the share capital of Banc Internacional d´Andorra, S.A. to the rest of the shareholders of said entity, the Andorran founding partners of the bank, for a price of €395.15 million.
2005
There were no significant capital divestures during 2005.
2004
In January 2004, BBVA sold 2.2% of the capital stock of Gas Natural S.D.G., S.A. At the time the transaction closed, BBVA had not completed preparation of its 2003 Consolidated Financial Statements and therefore, in accordance with Spanish GAAP, reflected the amortization of €70 million of consolidation goodwill which resulted from the transaction in such financial statements rather than in its 2004 Consolidated Financial Statements.
12
In March 2004, the Group sold its 24.4% holding in Banco Atlántico, S.A. at the price established by Banco Sabadell, S.A. in its tender offer for all the shares of Banco Atlántico, S.A. This sale gave rise to a gain of €217.7 million for the BBVA Group.
In March 2004, the Group sold its 50% holding in Hilo Direct Seguros y Reaseguros, S.A, which represented all of the Group’s interests. This sale gave rise to a gain of €26 million for the BBVA Group.
In June 2004, the Group sold its 5.0% holding in Acerinox, S.A., which represented all of the Group’s interests. This sale gave rise to a gain of €34.6 million for the BBVA Group.
On September 6, 2004, the Group sold its 17.2% holding in Vidrala, S.A., giving rise to a gain of €19.3 million.
On October 12, 2004, the Group sold the El Salvador welfare business composed of BBVA Crecer AFP and BBVA Seguros, S.A. – Seguros de Personas – in which BBVA had ownership interests of 62% and 51%, respectively, for $42.8 million (€34.76 million), giving rise to a gain of €12.3 million.
In December 2004, the Group sold its 3% holding in Gamesa, S.A., which represented all of the Group’s interests. This sale gave rise to a gain of €53.1 million for the BBVA Group.
In the second quarter of 2004, the Group exercised a sale option it had on its 33.3% holding in Grubarges Inversión Hotelera, S.L., and recognized a gain of €26.3 million on such sale.
During the first six months of 2004, the Group sold its 0.6% holding in Repsol YPF, S.A. These sales gave rise to a loss of €6.5 million for the BBVA Group.
During 2004, the Group purchased and sold shares of Telefónica, S.A. without any material variation in its aggregate holding in such company as of December 31, 2003. These sales gave rise to a gain of €141.7 million.
2003
On January 13, 2003, BBVA announced its intention to sell its Brazilian affiliate, Banco Bilbao Vizcaya Argentaria Brasil, S.A. (“BBV Brasil”) to Banco Bradesco, S.A. (“Bradesco”). On June 9, 2003, upon completion of due diligence, receipt of authorizations from regulatory authorities and approval by the corresponding corporate bodies, BBVA transferred 100% of BBV Brasil to Bradesco, in consideration for which Bradesco paid 35,481,460,311 of its newly-issued ordinary shares and 34,948,501,563 of its newly-issued preferred shares, totaling 4.44% of Bradesco’s share capital, as well as 1,864 million Brazilian Reais in cash, for a total consideration of approximately 2,626 million Brazilian Reais (approximately $900 million). We were required, under Spanish GAAP, to take an extraordinary charge in 2002 relating to exchange rate differences relating to our investment in BBV Brasil accumulated up to December 31, 2002. Under the transaction agreements with Bradesco, in addition to the cash consideration and equity participation described above, we have been granted the right to nominate one member of Bradesco’s board of directors so long as we maintain, subject to exceptions relating to capital increases where shareholders are not offered preemptive rights, at least a 4.0% interest in Bradesco’s share capital. We have agreed for a period of two years from the closing date or so long as we have a right to nominate one member of Bradesco’s board of directors, whichever is longer, that we will not control and/or manage a financial institution in Brazil.
In March 2003, BBVA sold its 25% interest in Metrovacesa Residencial, S.A., resulting in a capital gain of €2.1 million.
On June 5, 2003, BBVA agreed to sell its holding in Crédit Lyonnais, S.A., to Crédit Agricole, S.A. in exchange for €482 million in cash, representing 67% of the total consideration, and 16.3 million shares of Crédit Agricole, S.A., representing the remaining 33% of the total consideration. BBVA immediately sold the Crédit Agricole shares to institutional investors at a price of €16.64 per share, for a total consideration of €271 million. As a result of this transaction, BBVA liquidated its participation in Crédit Lyonnais and recorded a capital gain of €342 million.
In July 2003, BBVA sold 3% of the capital stock of Gamesa,S.A., giving rise to a capital gain of €29.9 million.
13
In the last quarter of 2003, BBVA sold 2.465% of the capital stock of Repsol-YPF, S.A. giving rise to a loss of €73.3 million.
In 2003, a series of purchases and sales of shares of Telefónica, S.A., resulting in a 0.57% net reduction of our holding, gave rise to a capital gain of €220 million.
In 2003, a series of purchases and sales of shares of Iberdrola, S.A., resulting in a 1.02% net reduction of our holding, gave rise to a capital gain of €45.3 million.
In December 2003, BBVA sold its entire 9.9% interest in the Moroccan bank Wafabank, S.A. to Omnium Nord Africain, S.A. The total sale price was 529,505,625 dirhams (approximately €48 million) and gave rise to a capital gain of €3.5 million.
Public Takeover Offers
On June 20, 2005, we launched an exchange offer for the approximately 85.3% of the shares of Banco Nacionale del Lavoro, S.p.A. (“BNL”) which we did not already own (the “BNL Exchange Offer”). Under the terms of the BNL Exchange Offer, BBVA offered one of its ordinary shares for every five ordinary shares of BNL. The final day on which acceptances would be accepted, pursuant to the BNL Exchange Offer’s terms, was July 22, 2005. Prior to the expiration of the acceptance period, the Italian insurance group Unipol Assicurazioni S.p.A. (“Unipol”) announced that it had entered into side agreements with certain entities, as a result of which they controlled 46.95% of BNL’s capital. In light of this and the fact that we did not expect to obtain more than 50% of BNL’s capital pursuant to the BNL Exchange Offer we withdrew our tender offer.
On April 26, 2006, we announced our decision to abandon without effect the shareholders’ agreement executed on April 28, 2004, in relation to BNL.
On May 12, 2006, we reported, as shareholder of BNL, that we adhered to the tender offer launched by BNP Paribas to acquire 100% of BNL´s capital. With the price offered by BNP, the value of BBVA´s stake in the capital of BNL was approximately €1,299 million. The acceptance of the offer gave rise to a capital gain to BBVA of €567 million.
On May 19, 2006, BBVA sold its stake in the share capital of Banca Nazionale del Lavoro (BNL) to BNP Paribas, for a price of €1,299 million.
B. Business Overview
BBVA is a highly diversified international financial group, with strengths in the traditional banking businesses of retail banking, asset management, private banking and wholesale banking. We also have a portfolio of investments in some of Spain’s leading companies.
Business Areas
During 2005, our organizational structure was divided into the following business areas:
| | • | | Retail Banking in Spain and Portugal; |
| | • | | Wholesale and Investment Banking; |
In December 2005, our Board of Directors approved a new organizational structure for the BBVA Group, which has been implemented since the beginning of 2006:
| | • | | Retail Banking in Spain and Portugal; |
14
For purposes of the discussion below, we present our business along the historical business lines existing in 2004 and 2005. The financial information for our business areas for 2005 and 2004 presented below have been prepared on a uniform basis, consistent with our organization structure in 2005. Unless otherwise indicated, the financial information provided below for each business area does not reflect the elimination of transactions between companies within one business area or between different business areas, since we consider these transactions to be an integral part of each business area’s activities. For the presentation and discussion of our consolidated operating results in “Item 5. Operating and Financial Review and Prospects”, however, such intra- and inter-business area transactions are eliminated and the eliminations are generally reflected in the operating results of the Corporate Activities business area.
The following table sets forth information relating to income attributed to the group for each of our business areas for the years ended December 31, 2005 and 2004.
| | | | | | | | | | | | | | | | | | |
| | | Year ended December 31, | |
| | | Income/(Loss)
Attributed to the Group (*) | | | % of Subtotal | | | % of Income/Loss
Attributed to the Group (*) | |
| | | 2005 | | | 2004 | | | 2005 | | | 2004 | | | 2005 | | | 2004 | |
| | | (in millions of euro) | |
Retail Banking in Spain and Portugal | | 1,613 | | | 1,426 | | | 40 | % | | 47 | % | | 42 | % | | 49 | % |
Wholesale and Investment Banking | | 592 | | | 404 | | | 15 | % | | 13 | % | | 16 | % | | 14 | % |
The Americas | | 1,819 | | | 1,194 | | | 45 | % | | 40 | % | | 48 | % | | 40 | % |
| | | | | | | | | | | | | | | | | | |
Subtotal | | 4,024 | | | 3,024 | | | 100 | % | | 100 | % | | 106 | % | | 103 | % |
| | | | | | | | | | | | | | | | | | |
Corporate Activities | | (218 | ) | | (102 | ) | | | | | | | | (6 | )% | | (3 | )% |
Income attributed to the Group(*) | | 3,806 | | | 2,922 | | | | | | | | | 100 | % | | 100 | % |
| | | | | | | | | | | | | | | | | | |
| (*) | Net income after minority interest. |
Retail Banking in Spain and Portugal
The Retail Banking in Spain and Portugal area’s main lines of activity focused on providing banking services to private individuals, retailers and small and medium-sized entities. As of December 31, 2005, this business area conducted its activities through 3,558 branch offices.
The business units included in the Retail Banking in Spain and Portugal business area are:
| | • | | Financial Services, which include: |
| | • | | Personal Financial Services; |
| | • | | Commercial Financial Services; and |
| | • | | Special Financial Services. |
| | • | | Asset Management and Private Banking; |
| | • | | Insurance Business in Europe. |
15
Total net lending in this business area as of December 31, 2005, was approximately €127,959 million, an increase of 20.1% from €106,510 million as of December 31, 2004, due to growth in mortgage lending and personal loans.
The non-performing loan (“NPL”) ratio decreased to 0.62% as of December 31, 2005 from 0.82% as of December 31, 2004.
Total customer funds (deposits, mutual and pension funds and other brokered products) were €126,947 million as of December 31, 2005, an increase of 10.0% from €115,391 million as of December 31, 2004 as a result of an increase in deposits collected during the year. Mutual funds under management were €46,232 million as of December 31, 2005, an increase of 10.1% from €41,988 million as of December 31, 2004. Pension fund assets under management were €15,405 million as of December 31, 2005, an increase of 12.2% from €13,731 million as of December 31, 2004.
Financial services
This business unit’s principal activities were focused on the development of the Financial Services Plan (our business model for this business unit), including:
| | • | | Personal Financial Services: focused on retail customers and aimed at providing customers with more value from their relationship with us by offering a wide range of products and services at attractive prices, which are made available through different channels, along with solutions tailored to their specific needs. |
| | • | | Commercial Financial Services: focused on professionals, businesses and small- and medium-sized enterprises (“SMEs”) by providing them with customized services, a comprehensive range of products and continuous, quality financial advice. |
| | • | | Special Financial Services: focused on the following lines of business (through Finanzia Bank and our online bank, Uno-e Bank, S.A.): financing of cars, consumer items and equipment; e-banking; bill payment; and car and equipment rental. |
Lending by the Financial Services unit increased 20.0% to €123,210 million as of December 31, 2005 from €102,672 million as of December 31, 2004, principally due to strong growth in mortgage loans, which increased 22.9% from December 31, 2004.
Customer funds under management by the Financial Services unit increased 10.6% to €54,957 million as of December 31, 2005 from €49,671 million as of December 31, 2004, principally due to an increase in time deposits. Mutual and pension fund assets managed by the Financial Services unit increased by 9.2% and 14.9%, respectively, as of December 31, 2005 as compared to December 31, 2004.
In 2005, we launched the “Cuentas Claras” campaign, featuring a reduction in the price of various types of services, including financial services, legal assistance and household services. In 2005, we also introduced a rapid cash delivery service, “Dinero Express”, geared towards foreign residents in Spain, along with the “Crédito Fácil” service. In 2005, this “Dinero Express” service conducted approximately 200,000 remittances, totaling approximately €80 million.
In 2005, our Internet banking service, BBVAnet, recorded a 54.8% increase in the number of transactions (totaling approximately €134 million). In addition, we introduced a special platform to improve the security of our Internet services.
Asset Management and Private Banking
This business unit is responsible for the design and management of products to be distributed through the Retail Banking in Spain and Portugal business area’s different networks, as well as for the direct management of our private banking services (through the Personal Banking sub-unit and BBVA Patrimonios). As of December 31,
16
2005, BBVA’s private banking business managed assets totaling approximately €73.1 billion, an increase of 12.3% from December 31, 2004.
BBVA Portugal
As of December 31, 2005, BBVA Portugal’s customer loans amounted to €3,695 million, an increase of 17.3% from 2004. In 2005, mortgage lending was the most dynamic sector, with a 40.2% increase over 2004.
As of December 31, 2005, customer funds managed by BBVA Portugal totaled €3,375 million, representing a 21.9% increase over 2004, principally due to the increase in mutual and pension fund assets under management by BBVA Portugal.
European Insurance
Our European insurance activities are conducted through various insurance companies that provide direct insurance, reinsurance and insurance brokering services in Spain and Portugal and market products for different types of customers (private individuals, SMEs, retailers, professional service firms and providers and self-employed individuals) through this unit’s branch offices.
Wholesale and Investment Banking
The Wholesale and Investment Banking business area focuses on large corporations, governmental and non-governmental organizations, finance companies and institutional investor clients.
The business units included in this business area are:
| | • | | Wholesale Banking, including: |
| | • | | Global Corporate Banking; and |
| | • | | Global Markets and Distribution; |
| | • | | Business and Real Estate Projects; and |
| | • | | Global Transactional Services. |
As of December 31, 2005, lending by the Wholesale and Investment Banking business area totaled €46,896 million, an increase of 14.0% from €41,124 million as of December 31, 2004. Non-performing loans of this business area decreased 27.6% to an NPL ratio of 0.18% as of December 31, 2005, compared to 0.30% as of December 31, 2004, principally due to an improvement in risk quality. Deposits and mutual funds increased 13.4% and 7.1%, respectively, as of December 31, 2005 from December 31, 2004.
Global Corporate Banking
The Global Corporate Banking business unit provides services to large Spanish and foreign corporations. The Global Corporate Banking business unit is present in 15 countries on four continents with its customer and product units: Global and Investment Banking, catering to over 250 large corporate clients in 2005 and grouping together syndicated loan, fixed-income origination, project finance and corporate finance product units; Corporate Banking Iberica, with branches in Madrid, Bilbao, Barcelona, Palma de Mallorca, Lisbon and Porto; Corporate Banking Europe, catering to the European markets from its offices in Milan, Paris, London and Frankfurt; Corporate Banking Asia, with branches in Hong Kong and Tokyo and representation offices in Beijing and Shanghai; and Corporate Banking in the Americas, which, from its New York branch, manages the wholesale banking business in the United States and that of the BBVA Group’s banks in Latin America.
Institutional Banking
The Institutional Banking business unit provides services to public and private sector institutions in Spain, Portugal and Belgium. The BBVA Group operates in these markets under the BBVA brand name and through
17
Banco de Crédito Local (BCL), an institution specializing in the long-term financing of regional public administrations through capital markets transactions.
Global Markets and Distribution
The Global Markets and Distribution business unit has trading floors located in Europe and New York and is responsible for the distribution of fixed-income and equity securities and our custodial services business.
Business and Real Estate Projects
As of December 31, 2005, the Business and Real Estate Projects business unit managed a portfolio of investments in 89 companies, highly diversified across different sectors (industrial, services, utilities and real estate), with an aggregate book value as of December 31, 2005 of €1,188 million and unrealized capital gains as of December 31, 2005 of €1,027 million, an increase of €168 million in unrealized capital gains compared to December 31, 2004. As of December 31, 2005, this business unit’s main investments were in Cementos Lemona, Corporación IBV, Duch, Grupo Anida, Iberia, Técnicas Reunidas and Tubos Reunidos.
Global Transactional Services
The Global Transactional Services business unit supports the other business areas and units of the BBVA Group by providing specialized corporate and institutional business transactional services for corporate and institutional customers, including services such as on-line banking, payment intermediation, factoring and confirming and trade finance.
The Americas
The Americas business area conducts all the activities of the BBVA Group’s banks in North and South America, as well as the BBVA Group’s International Private Banking Services in the region. As of December 31, 2005, this business area conducted its activities through 3,658 branch offices and had an aggregate of 61,604 employees.
The business units included in this business area are:
| | • | | Banks in the Americas, including banks in Mexico and other countries (including Argentina, Chile, Colombia, the United States, Panama, Paraguay, Peru, Uruguay and Venezuela); |
| | • | | Pension Funds and Insurance in the Americas; and |
| | • | | International Private Banking. |
Unless otherwise specified, information included below relating to macroeconomic data in the Latin American countries in which we operate, such as GDP or inflation, has been derived from our internal statistical studies based on information published by local governmental or regulatory authorities.
Economic conditions in the region were favorable in 2005, with an economic upturn in the largest countries in Latin America, reflected in an average growth in GDP of approximately 4%. This positive economic climate is a result of a check on inflation — which decreased to record lows in some countries — and interest rates similar to 2004, though with some relatively important fluctuations over the year, especially in Mexico.
Unlike recent years, local currencies in the Americas appreciated against the euro in 2005, with a resulting positive impact on our consolidated financial statements as of and for the year ended December 31, 2005. See “Item 5. Operating and Financial Review and Prospects — Operating Results — Factors Affecting the Comparability of our Results of Operations and Financial Condition”. Nonetheless, in most cases, variations in average exchange rates were more moderate than in 2004, and, as a result, the overall effect on our results of operations for the year ended December 31, 2005 was not significant.
The following is a brief description of our operations and the economic and political factors that most significantly affect such operations, on a country-by-country basis, in the Americas business area. The operating
18
results described below refer to each individual unit’s contribution to the Americas business area’s operating results, unless otherwise stated.
Banks in the Americas
Mexico
Mexican GDP increased approximately 3% in 2005, mainly due to favorable trends in domestic demand and moderate price increases. Inflation stood at just over 3%, substantially in line with the Bank of Mexico’s long-term goals. The Mexican peso remained strong against the dollar throughout 2005, which limited Mexican exports to the United States.
BBVA Bancomer’s income attributed to the Group for 2005 increased 63.1% to €1,191 million from €730 million in 2004, resulting in a Return on Equity (defined as income attributed to the group divided by average shareholders’ equity) of 39.4% compared to 30.8% in 2004. BBVA Bancomer’s income attributed to the Group in 2005 included €77 million from Hipotecaria Nacional, S.A. de C.V., which we acquired in January 2005.
As of December 31, 2005, lending by BBVA Bancomer totaled €20,378 million, an increase of 80.5% from €11,292 million as of December 31, 2004, while customer funds (deposits, securities sold under agreements to repurchase and mutual funds) increased 32.1% to €43,024 million as of December 31, 2005 from €32,576 million as of December 31, 2004.
Argentina
In 2005, the Argentinean economy benefited from the government’s successful debt exchange, with a GDP growth rate of 9%. This resulted in some pressure on prices, and at year-end 2005 inflation stood at 12.3% for the year.
Banco Francés’s income attributed to the Group for 2005 increased to €90 million from €14 million in 2004.
Chile
The year 2005 was marked by successive increases in interest rates by the Chilean Central Bank (increasing 2.25 percentage points to 4.5% as of December 31, 2005). Chilean GDP increased 6% in 2005, while inflation was 3.7% for the year.
BBVA Chile’s income attributed to the Group for 2005 increased 13.3% to €27 million from €24 million in 2004.
Colombia
Colombia’s GDP increased approximately 5% in 2005, coupled with a low inflation rate, interest rates at record lows, high levels of disposable cash, upwards trends in Colombia’s capital markets and a gradual decline in unemployment.
In December 2005, BBVA Colombia acquired Banco Granahorrar for €364 million pursuant to an auction process. BBVA Colombia’s income attributed to the Group for 2005 increased 181.3% to €47 million from €17 million in 2004.
Panama
Panama’s GDP increased 6% in 2005. BBVA Panama’s income attributed to the Group for 2005 increased 6.8% to €19 million from €18 million in 2004.
Paraguay
Paraguay’s GDP increased 2.7% in 2005, supported by growth in the agricultural industry. BBVA Paraguay’s income attributed to the Group for 2005 increased 21.5% to €10 million from €9 million in 2004.
19
Peru
Peru’s GDP increased 6% in 2005. BBVA Banco Continental’s income attributed to the Group for 2005 increased 114.4% to €47 million from €22 million in 2004.
United States of America
BBVA’s U.S. business unit, which was created in 2005, includes BBVA Puerto Rico, Laredo National Bancshares, BBVA Bancomer USA (former Valley Bank) and Bancomer Transfer Services (BTS). BBVA’s U.S. business unit’s income attributed to the Group was €26 million in 2005.
Uruguay
Uruguay’s GDP increased 6% in 2005. BBVA Uruguay’s loss attributed to the Group for 2005 decreased 33.0% to €2 million from €3 million in 2004.
Venezuela
Venezuela’s GDP increased 9.4% in 2005. BBVA Banco Provincial’s income attributed to the Group for 2005 decreased 34.5% to €55 million from €84 million in 2004.
Pension Funds and Insurance in the Americas
The BBVA Group’s pension fund and insurance companies in the Americas’ income attributed to the Group for 2005 increased 29.6% to €260 million.
As of December 31, 2005, the BBVA Group’s pension fund and insurance companies in the Americas managed €38,541 million in pension fund assets, an increase of 14.7% over December 31, 2004.
The BBVA Group’s insurance companies in the Americas’ income attributed to the Group for 2005 increased 31.8% to €115 million.
International Private Banking
The International Private Banking business unit provides investment advice and manages the assets of high-income international customers. In 2005, this business unit completed the process of concentrating its operations in three centers: Andorra; Switzerland; and Miami (Florida, United States).
Customer funds managed by this business unit increased 3.4% to €14,921 million as of December 31, 2005. The International Private Banking business unit’s income attributed to the Group for 2005 increased 4.8% to €73 million.
Corporate Activities and Other
The Corporate Activities business area includes BBVA’s portfolio of strategic and financial investments and the activities of the Assets and Liabilities Management Committee.
The business units included in this business area are:
| | • | | Holdings in Industrial and Financial Companies; and |
| | • | | The Assets and Liabilities Management Committee. |
Holdings in Industrial and Financial Companies
The Holdings in Industrial and Financial Companies business unit manages the Group’s holdings in listed industrial companies, principally Telefónica, S.A., Iberdrola, S.A. and until June 2006, Repsol YPF, S.A., as well as its financial holdings, which are currently limited to Banco Bradesco S.A. All of these shareholdings are recorded on our consolidated balance sheet prepared in accordance with EU-IFRS as “available-for-sale”. As of
20
December 31, 2005, the portfolio of shareholdings of this business unit had a market value (including equity swaps) of €8,811 million. In 2005, the BBVA Group’s holdings in industrial and financial companies generated €183 million in dividends (an increase of 12.4% over 2004) and net trading income of €298 million, a 22.3% increase over 2004.
Assets and Liabilities Management Committee
The Assets and Liabilities Management Committee (“ALCO”) manages the BBVA Group’s overall financing needs and interest and exchange rate risks. ALCO also manages the BBVA Group’s investments and capital resources in an effort to improve the return on capital for our shareholders.
As of December 31, 2005, ALCO’s portfolio of fixed-income assets, which is held in an effort to reduce the negative effect on BBVA’s net interest income of a fall in interest rates, amounted to €31,249 million. ALCO’s income attributed to the Group for 2005 increased to €63 million.
Supervision and Regulation
The Spanish government traditionally has been closely involved with the Spanish banking system, both as a direct participant through its ownership of the Instituto de Crédito Oficial (“ICO”) and as a regulator retaining an important role in the regulation and supervision of financial institutions.
The Bank of Spain
The Bank of Spain was established in 1962 as a public law entity (entidad de derecho público) that operates as Spain’s autonomous central bank. In addition, it has the ability to function as a private bank. Except in its public functions, the Bank of Spain’s relations with third parties are governed by private law and its actions are subject to the civil and business law codes and regulations.
Until January 1, 1999, the Bank of Spain was also the sole entity responsible for implementing Spanish monetary policy. For a description of monetary policy since the introduction of the euro, see “—Monetary Policy—General”.
Since January 1, 1999, the Bank of Spain has performed the following basic functions attributed to the European System of Central Banks (“ESCB”):
| | • | | defining and implementing the ESCB’s monetary policy, with the principal aim of maintaining price stability across the euro area; |
| | • | | conducting currency exchange operations consistent with the provisions of Article 109 of the Treaty on European Union (“EU Treaty”), and holding and managing the States’ official currency reserves; |
| | • | | promoting the sound working of payment systems in the euro area and |
| | • | | issuing legal tender banknotes. |
Recognizing the foregoing functions as a fully-fledged member of the Eurosystem, theLey de Autonomía del Banco de España (the Bank of Spain Law of Autonomy) stipulates the performance of the following functions by the Bank of Spain:
| | • | | holding and managing currency and precious metal reserves not transferred to the European Central Bank (“ECB”); |
| | • | | supervising the solvency and behavior of credit institutions, other entities and financial markets, for which it has been assigned supervisory responsibility, in accordance with the provisions in force; |
| | • | | promoting the sound working and stability of the financial system and, without prejudice to the functions of the ECB, of national payment systems; |
21
| | • | | placing coins in circulation and the performance, on behalf of the State, of all such other functions entrusted to it in this connection; |
| | • | | preparing and publishing statistics relating to its functions, and assisting the ECB in the compilation of the necessary statistical information; |
| | • | | providing treasury services and acting as financial agent for government debt; |
| | • | | advising the government, preparing the appropriate reports and studies; and |
| | • | | exercising all other powers attributed to it by legislation. |
Subject to the rules and regulations issued by the Ministry of Economy, the Bank of Spain has the following supervisory powers over Spanish banks:
| | • | | conducting periodic inspections of Spanish banks to evaluate a bank’s compliance with current regulations including the preparation of financial statements, account structure and credit policies; |
| | • | | advising a bank’s board of directors and management on its dividend policy; |
| | • | | undertaking extraordinary inspections of banks; and |
| | • | | collaborating with other regulatory entities to impose penalties for infringement or violation of applicable regulations. |
Fondo de Garantía de Depósitos
TheFondo de Garantía de Depósitos en Establecimientos Bancarios (“FGD”), which operates under the guidance of the Bank of Spain, guarantees both bank and securities deposits up to €20,000 per customer for each type of deposit, which is the minimum insured amount for all EU member banks. Pursuant to Bank of Spain regulations, the FGD may purchase doubtful loans or may acquire, recapitalize and sell banks that are experiencing difficulties.
The FGD is funded by annual contributions from member banks. The rate of such contributions in 2005 was 0.06% of the year-end amount of deposits to which the guarantee extended, in accordance with legislation in effect. Nevertheless, once the capital of the FGD exceeds its requirements, the Minister of Economy may reduce the member banks’ contributions and, when the FGD’s funds exceed the capital requirements by one percent or more of the member banks’ deposits, such contributions may be suspended.
In order to safeguard the stability of its members, the FGD may also receive contributions from the Bank of Spain. At December 31, 2005, all of the Spanish banks belonging to the BBVA Group were members of the FGD and thus obligated to make annual contributions to it.
Fondo Garantía Inversores
Royal Decree 948 of August 3, 2001 regulates investor guarantee schemes related to both investment firms and to credit institutions. These schemes are set up through an investment guarantee fund for securities broker and broker-dealer firms and the deposit guarantee funds already in place for credit institutions. A series of specific regulations have also been enacted, defining the system for contributing to the funds.
The General Investment Guarantee Fund Management Company was created in a relatively short period of time and is a business corporation with capital in which all the fund members hold an interest. Member firms must make a joint annual contribution to the fund equal to 0.06% over the 5% of the securities that they hold on their client’s behalf. However, it is foreseen that these contributions may be reduced if the fund reaches a level considered to be sufficient.
Liquidity Ratio
In an effort to implement European monetary policy, effective January 1, 1999, the ECB and the national central banks of the member states of the European Monetary Union (“EMU”) adopted a regulation that requires
22
banks to deposit an amount equal to two percent of their qualifying liabilities, as defined by the regulation, with the central bank of their home country. These deposits will earn an interest rate equal to the average interest rate of the ESCB. Qualifying liabilities for this purpose include:
| | • | | debt securities issued; and |
| | • | | monetary market instruments. |
Furthermore, the liquidity ratio is set at 0% instead of 2% for those qualifying liabilities that have a maturity over two years and are sold under repurchase agreements.
Investment Ratio
In the past, the government used the investment ratio to allocate funds among specific sectors or investments. As part of the liberalization of the Spanish economy, it was gradually reduced to a rate of zero percent as of December 31, 1992. However, the law that established the ratio has not been abolished and the government could re-impose the ratio, subject to applicable EU requirements.
Capital Adequacy Requirements
As part of a program to modernize Spain’s banking regulations, capital adequacy requirements were revised in 1985 and, pursuant to EU directives, amended as of January 1, 1993. The capital adequacy requirements are applicable to BBVA on both a consolidated and individual basis.
The principal characteristics of the capital adequacy requirements pursuant to EU directives are a distinction between “core” and “complementary” capital and the adoption of a ratio of stockholders’ equity to risk-weighted assets. Core capital generally includes:
| | • | | certain nonvoting equity, including certain nonvoting guaranteed preference shares of subsidiaries; |
| | • | | most reserves and generic allowances; |
| | • | | less participation in other financial institutions; and |
| | • | | treasury stock and financing for the acquisition, by persons other than the issuer’s employees, of the issuer’s shares. |
Complementary capital generally includes certain nonvoting equity, revaluation and similar reserves, and subordinated and perpetual debt. The computation of both core and complementary capital is subject to provisions limiting the type of stockholding and the level of control which these stockholdings may give a banking group. The level of non-perpetual subordinated debt taken into account for the calculation of complementary capital may not exceed 50% of core capital. The total amount of complementary capital admissible for computing total capital may not exceed the total amount of core capital.
The consolidated total of core and complementary capital of a banking group calculated in the manner described above may not be less than eight percent of the group’s risk-weighted assets net of specified provisions and amortizations. The calculation of total risk-weighted assets applies minimum multipliers of 0%, 20%, 50% and 100% to the group’s assets. Countries with special loan arrangements with the International Monetary Fund, which have not renegotiated their foreign debt in the five preceding years, receive a 0% risk weight. Pursuant to Bank of Spain regulations, the following loans also receive a 0% risk weighting:
| | • | | credits to Spanish governmental autonomous bodies, credits to Social Security, and credits to certain Spanish governmental public entities; |
| | • | | certain debt securities related to the securitization of the Spanish Nuclear Moratorium; and |
23
| | (a) | the EU and the OECD countries’ governments or central banks, |
| | (b) | governments or central banks of countries with special loan agreements with the International Monetary Fund (provided such countries have not renegotiated their external debt in the five preceding years), or |
| | (c) | Spanish governmental public entities. Loans to autonomous communities, the EU and the OECD regional and local governments, banks, savings banks, brokerage firms and multilateral development banks receive at least a 20% weighting. Residential mortgage loans receive at least a 50% weighting. |
All other loans are weighted at 100%; however, such weighting may be lower if the loan is guaranteed or secured. Off-balance sheet assets are also included in the calculation of risk-weighted assets.
The computation of core capital is subject to reductions of capital in amounts equivalent to unrealized losses on investment securities that are not charged to income and are accounted for as assets under the caption “Asset Accrual Accounts”.
The Basel Committee on Banking Supervision (the “Basel Committee”), which includes the supervisory authorities of thirteen major industrial countries, has adopted an international framework (the “Basel Accord”) for capital measurement and capital standards of banking institutions. The framework provides:
| | • | | definitions for “Tier 1” (core) capital and “Tier 2” (supplemental) capital; |
| | • | | a system for weighting assets and off balance sheet items according to credit risk; and |
| | • | | a requirement that banks engaged in international operations maintain Tier 1 capital of at least 4% of risk-weighted assets and “total” capital, Tier 1 capital plus up to an equal amount of Tier 2 capital, of at least 8% of risk-weighted assets. |
The Basel Committee on Banking Supervision published a new Basel capital accord (also known as Basel II) which, when finalized, will replace the Basel Accord, and will come into effect in December, 2006. EU countries intend to implement the new regulatory framework in January 2007 or January 2008 if advanced risk models are adopted.
As described above, the capital adequacy of Spanish banks is regulated by EU directives applicable to the Spanish banking system as well as to the banking systems of other EU member states. Certain EU member states are parties to the Basel Accord. Spain joined the Basel Accord on February 1, 2001. Each national authority that is a party to the Basel Accord has implemented it in a significantly different fashion. The capital requirements imposed by the Basel Accord are in many respects similar to those imposed by EU directives, Spanish law and the Bank of Spain.
Banks in EU countries are permitted to net the credit exposure arising from certain interest rate and foreign exchange-related derivative contracts (rather than include the entire notional amount of such contracts) in calculating their total risk-adjusted assets for purposes of calculating their capital adequacy ratios, provided that such derivative contracts are subject to regulatory limitations on total credit exposure and the relevant regulatory authorities approve the inclusion in risk-adjusted assets of such credit risks on a net basis.
Spanish banks are permitted to include the net credit exposure arising from interest rate and foreign exchange transactions related to derivative products provided the following conditions are met:
| | • | | all derivative related transactions between the parties form a single agreement; |
| | • | | the incumbent bank has submitted to the Bank of Spain two legal opinions with regard to the validity of the netting provisions; and |
| | • | | the incumbent bank has implemented the appropriate procedures to revise the treatment of netting if there is an amendment of the regulations in force. |
24
In addition, the Bank of Spain may not accept the accounting treatment of netting if the conditions set forth above are not met or if the Bank of Spain does not concur with the legality or validity of the netting provisions.
Concentration of Risk
The Bank of Spain regulates the concentration of risk. Since January 1, 1999, any exposure to a person or group exceeding 10% of a group’s or bank’s regulatory capital has been deemed a concentration. The total amount of exposure represented by all of such concentrations may not exceed 800% of regulatory capital. Exposure to a single person or group may not exceed 25% (20% in the case of an affiliate) of a bank’s or group’s regulatory capital.
Legal and Other Restricted Reserves
We are subject to the legal and other restricted reserves requirements applicable to Spanish companies. Please see “—Capital Adequacy Requirements”. See Note 33 to the Consolidated Financial Statements.
Allowance for Loan Losses
For a discussion of the Bank of Spain regulations relating to allowances for loan losses and country risk, see “—Selected Statistical Information—Assets—Loan Loss Reserve”.
Regulation of the Disclosure of Fees and Interest Rates
Interest rates on most kinds of loans and deposits are not subject to a maximum limit. Banks must publish their preferential rates, rates applied on overdrafts, and fees and commissions charged in connection with banking transactions. Banking clients must be provided with written disclosure adequate to permit customers to ascertain transaction costs. The foregoing regulations are enforced by the Bank of Spain in response to bank client complaints.
Law 44/2002 concerning measures to reform the Spanish financial system contained a rule concerning the calculation of variable interest applicable to loans and credit secured by mortgages, bails, pledges or any other equivalent guarantee.
Employee Pension Plans
Under the relevant collective labor agreements, BBVA and some of its subsidiaries provide supplemental pension payments to certain active and retired employees and their beneficiaries. These payments supplement social security benefits from the Spanish state. See Note 2.2.f to the Consolidated Financial Statements.
Dividends
If a bank meets the Bank of Spain’s minimum capital requirements described above under “—Capital Adequacy Requirements”, it may dedicate all of its net profits to the payment of dividends, although, in practice, banks consult with the Bank of Spain before declaring a dividend. We calculate that as of December 31, 2005, we had approximately €2.07 billion of unrestricted reserves in excess of applicable capital and reserve requirements available for the payment of dividends. Compliance with such requirements notwithstanding, the Bank of Spain may advise a bank against the payment of dividends on grounds of prudence. In no event may dividends be paid from non-distributable reserves. Banks which fail to comply with the capital adequacy ratio by more than 20% are required to devote all of their net profits to increasing their capital ratios. Banks which fail to meet the required ratio by 20% or less must obtain prior approval of the Bank of Spain to distribute any dividends and must devote at least 50% of net profits to increasing their capital ratios. In addition, banks, and their directors and executive officers, that do not comply with the liquidity and investment ratios and capital adequacy requirements may be subject to fines or other sanctions. Compliance with the Bank of Spain’s capital requirements is determined on both a consolidated and individual basis. BBVA’s Spanish subsidiaries are in compliance with these capital adequacy requirements on both a consolidated and individual basis. If a bank has no net profits, the board of directors may propose at the general meeting of the stockholders that a dividend be declared out of retained earnings.
25
The Bank of Spain recommends that interim dividends not exceed an amount equal to one-half of net attributable profit from the beginning of the corresponding fiscal year. No interim dividend may be declared when a bank does not meet the minimum capital requirements and, according to the recommendations of the Bank of Spain, interim dividends may not be declared until the Bank of Spain has sufficient knowledge with respect to the year’s profits. Although banks are not legally required to seek prior approval from the Bank of Spain before declaring interim dividends, the Bank of Spain has asked that banks consult with it on a voluntary basis before declaring interim dividends.
Limitations on Types of Business
Spanish banks are subject to certain limitations on the types of businesses in which they may engage directly, but they are subject to few limitations on the types of businesses in which they may engage indirectly.
Mortgage Legislation
Spanish law limits the prepayment penalties on floating rate mortgage loans and limits the notarial costs and registration fees charged to borrowers in connection with renegotiation of mortgage terms on fixed and floating rate mortgages.
Mutual Fund Regulation
Mutual funds in Spain are regulated by theDirección General del Tesoro y Política Financiera del Ministerio de Economía(the Ministry of the Economy) and by theComisión Nacional del Mercado de Valores (“CNMV”). All mutual funds and mutual fund management companies are required to be registered with the CNMV. Spanish mutual funds are subject to investment limits with respect to single sectors or companies and overall portfolio diversification minimums. In addition, periodic reports including a review of the fund’s performance and any material events affecting the fund are required to be distributed to the fund’s investors and filed with the CNMV.
U.S. Regulation
Banking Regulation
By virtue of our branch in New York, our agency in Miami and our ownership of commercial banks in Texas, California and Puerto Rico, we are subject to the U.S. Bank Holding Company Act of 1956, as amended, which imposes certain restrictions on the activities in which BBVA and its subsidiaries may engage in the United States and subjects us to supervision and regulation by the Board of Governors of the Federal Reserve System (the “Federal Reserve Board”). In addition, certain of our banking activities in the United States are subject to supervision by state banking authorities. We have two securities subsidiaries operating in New York and Puerto Rico, which are regulated by the SEC and the National Association of Securities Dealers.
On June 12, 2000, BBVA and its Miami and New York offices entered into an agreement (the “Written Agreement”) with the Federal Reserve Board. The Written Agreement required BBVA, on behalf of its U.S. offices, to establish programs designed to identify and report known or suspected criminal activity with respect to money laundering and to comply with rules and regulations related to anti-money laundering compliance. BBVA responded to the Written Agreement by enhancing its U.S. internal controls through its Office of the Country Manager, implementing improved compliance policies and procedures, transferring its U.S. private banking activities from its New York branch to its Miami agency, and adopting an enhanced customer due diligence program. These remedial actions were subject to examination by the Federal Reserve Bank of New York and the New York State Banking Department. On February 21, 2003, the Written Agreement was terminated.
U.S. Foreign Corrupt Practices Act
BBVA, as well as all other foreign private issuers with a class of securities registered pursuant to Section 12 of the U.S. Securities Exchange Act of 1934, is subject to the U.S. Foreign Corrupt Practices Act. This Act generally prohibits such issuers and their directors, officers, employees and agents from using any means or instrumentality of U.S. interstate commerce in furtherance of any offer or payment of money to any foreign official or political party for the purpose of influencing a decision of such person in order to obtain or retain business. It also requires that the issuer maintain books and records and a system of internal accounting controls
26
sufficient to provide reasonable assurance that accountability of assets is maintained and accurate financial statements can be prepared. Penalties, fines and imprisonment can be imposed for violations of such Act.
Monetary Policy
General
On May 2, 1998, the EU established the bilateral conversion rates among the member countries that make up the EMU, and on December 31, 1998 the EU established the irrevocable conversion rates between the euro and each of the member countries of the EMU. The exchange rate in Spain was fixed at 166.386 pesetas per euro.
Monetary policy within the 12 members of the euro zone is set by the ECB. The ECB has itself set the objective of containing inflation and will adjust interest rates in line with this policy. It has further declared that it will not set an exchange rate target for the euro.
As of January 1, 1999, the euro became the national currency of the Spanish monetary system, replacing the peseta. However, the peseta was used as a unit of account in any judicial/legal instrument as a fraction of the euro and according to the exchange rate during the transitory period (from January 1, 1999 through December 31, 2001).
On January 1, 1999, the monetary system adopted the euro exclusively as a unit of account. From this date through February 28, 2002, the Bank of Spain, commercial banks, savings banks and credit co-operatives exchanged pesetas into euro free of charge but did not exchange euro into pesetas. Beginning July 1, 2002, only the Bank of Spain was able to perform this exchange, as determined by the Ministry of the Economy.
As of January 1, 2002, all legal instruments that were not denominated in euro during the transitory period were understood to be expressed in the euro unit of account, subject to the established conversion and rounding procedure.
Monetary Policy in the EMU
The integration of Spain into the EMU on January 1, 1999 implied the yielding of monetary policy sovereignty to the ESCB. The ESCB is composed of the ECB and the national central banks of the 12 member countries that form the EMU.
The ESCB determines and executes the single monetary policy of the 12 member countries of the EMU. The ESCB collaborates with the central banks of member countries to take advantage of the experience of the central banks in each of its national markets. The basic tasks to be carried out by the ESCB include:
| | • | | defining and implementing the single monetary policy of the EU; |
| | • | | conducting foreign exchange operations in accordance with the set exchange policy; |
| | • | | holding and managing the official foreign reserves of the member states; and |
| | • | | promoting the smooth operation of the payment systems. |
In addition, the EU Treaty establishes a series of rules designed to safeguard the independence of the system, in its institutional as well as in its administrative functions.
Law Reforming the Spanish Financial System
On November 22, 2002, the Spanish government approved theLey de Medidas de Reforma del Sistema Financiero (“Law 44/2002”), which amended, among others, the Spanish Securities Markets Act of 1988 (the “Securities Markets Act”), the Credit Entities Discipline and Intervention Law and Private Insurance law. Law 44/2002 affects the following matters: market transparency (concept of privileged information); accounting practices of companies (in particular, independence and reliability of external audits and creation of audit committees for every listed company); systems and risk coverage (promotion of the integration of various existing entry settlement systems into one); securitization (assignment of credit rights against public administration within a period before the bankruptcy of the companies, mortgage transfer certificates, territorial
27
bonds, etc.); electronic money (definition and issuance); pre-emptive rights; collective investment schemes (merger of collective investments schemes and guarantees and security interest); venture capital (investments in its group companies, etc.); ring-fencing transactions (extending protection against bankruptcy to some special financial master transactions and OTC transactions); savings banks (legal regime ofcuotas participativas, or participating shares) and other rules concerning the disciplinary regime for listed companies.
On June 18, 2003, the Spanish Government approved theLey de Transparencia(“Law 26/2003”), modifying both the Spanish Securities Markets Act and Law 22/2003, to reinforce the transparency of information regarding listed Spanish companies. This law adds a new chapter, Title X, to the Securities Markets Act, which (i) requires disclosure of shareholder agreements relating to listed companies, (ii) regulates the operation of the general shareholders’ meetings and of the boards of directors of listed companies, (iii) requires the publication of an annual report of corporate governance and (iv) establishes measures designed to increase the availability of information to shareholders.
In addition, this law amends theLey de Sociedades Anonimas (the “Corporate Law”), and requires: (i) offering to shareholders the possibility of exercising voting rights directly or remotely by delegation, so long as the identity of the person who exercises the vote can be properly guaranteed, (ii) an increase in the information that shareholders have the right to obtain from the company and (iii) that existing regulation of the duties and responsibilities of directors be expanded.
Order on Securities Information
On September 27, 2004, the Order on Securities Information (EHA/3050/2004) was published in theOfficial Gazette.
The order is part of an effort to increase the transparency of companies with securities listed on a public stock exchange, which has been implemented by legislation that includes the Law on Reform of the Financial System (44/2002) and Law 26/2003, which amended the Securities Market Law and the Corporations Law in order to increase the transparency of listed corporations.
The transparency laws imposed new obligations with regard to corporate information (e.g., to publish an annual corporate governance report which, among other matters, must include information on related-party transactions between the company and its shareholders, directors and executives).
The order imposes an obligation on companies issuing securities which are admitted to listing on any official Spanish secondary market (e.g., the stock exchanges, the Association of Financial Asset Brokers (AIAF) fixed income market and the financial futures exchange) to include in their biannual information quantified data on all their transactions with related parties.
This obligation is in addition to the obligation to include information on related-party transactions in the annual corporate governance report, as provided by the Corporate Governance Report Order (ECO/3722/2003).
Royal Decree-Law on Measures to Promote Productivity (5/2005)
The Spanish government has published the Royal Decree-Law on Measures to Promote Productivity (5/2005). Among other things, the measures include:
| | • | | implementation of the EU Prospectus Directive (2003/71/EC) into Spanish law; |
| | • | | reform of the system for securities represented by book entry; and |
| | • | | reform of the system for bonds and other debt securities. |
Implementation of the EU Prospectus Directive
The first measure seeks partly to implement the EU Prospectus Directive into Spanish law. The EU Prospectus Directive governs the content of prospectuses that must be delivered when securities are offered to the public or admitted to listing on a regulated market in the EU. The EU Prospectus Directive was required to be implemented by member states by July 1, 2005.
The measure amends Part III of the Securities Market Act, including Articles 25 to 30(2) concerning primary markets.
28
Securities represented by book entry
The new measures also eliminate the requirement that certain securities represented by book entry must be executed in a public instrument. Under Royal Decree-Law 5/2005, a document delivered by the issuer with the key terms of such securities is sufficient.
Debt securities
Royal Decree 5/2005 adds a new Chapter II to Part III (on primary markets) of the Securities Market Act concerning issues of bonds and other debt securities.
The new Chapter II removes certain requirements imposed by Spanish legislation on certain issues of bonds and other debt securities. The following requirements have been removed:
| | • | | to execute a public instrument; |
| | • | | to record the issuance in the Commercial Registry; and |
| | • | | to publish an announcement in theOfficial Gazette of the Commercial Registry. |
Royal Decree on Market Abuse (1333/2005)
This Royal Decree develops the Securities Market Act and completes the implementation into the Spanish legal regime of the European Directive regarding insider trading and market manipulation. This Royal Decree establishes the definitions of insider trading and listing manipulation, regulates activities that could affect market prices and imposes certain disclosure obligations on participants in the market in order to avoid market manipulation.
Law Establishing a European Company with a Corporate Domicile in Spain (19/2005)
This law has amended several provisions of Spanish Company Law with general applicability not only to European companies with a corporate domicile in Spain (sociedades anónimas europeas) but also to all Spanish companies, irrespective of whether such companies are listed on a stock exchange. For instance, one of the most notable amendments to Spanish Company Law is that all Spanish companies are now required to give shareholders at least 30 days’ notice, as opposed to 15 days’ notice previously required, of General Shareholders’ Meetings by publishing a notice in the Official Gazette of the Company Registry and in one daily newspaper.
C. Organizational Structure
Below is a simplified organizational chart of BBVA’s significant subsidiaries as of March 31, 2006. An additional 282 companies are domiciled in the following countries: Andorra, Argentina, Belgium, Bolivia, Brazil, Chile, Colombia, Ecuador, France, Gibraltar, Ireland ,Cayman Islands, Italy, Jersey, Luxembourg, Morocco, Mexico, Netherlands, Panama, Peru, Portugal, Puerto Rico, Spain, United Kingdom, United States of America, Dominican Republic, Uruguay and Venezuela.
| | | | | | | | | | |
Subsidiary | | Country of
Incorporation | | Activity | | BBVA
Voting
Power | | BBVA
Ownership | | Total
Assets |
| | | | | | | (percent) | | (in millions
of euro) |
Administradora de Fondos Para el Retiro-Bancomer, S.A. de C.V. | | Mexico | | Financial services | | 100.00 | | 97.29 | | 114 |
Administradora de Fondos de Pensiones Provida | | Chile | | Financial services | | 64.32 | | 64.32 | | 318 |
Banco Bilbao Vizcaya Argentaria (Portugal), S.A. | | Portugal | | Bank | | 100.00 | | 100.00 | | 4,379 |
Banco Bilbao Vizcaya Argentaria Puerto Rico, S.A. | | Puerto Rico | | Bank | | 100.00 | | 100.00 | | 5,541 |
Banco Continental, S.A. | | Peru | | Bank | | 92.08 | | 46.04 | | 4,806 |
Banco de Crédito Local, S.A. | | Spain | | Bank | | 100.00 | | 100.00 | | 11,759 |
Banco Provincial S.A.—Banco Universal | | Venezuela | | Bank | | 55.60 | | 55.60 | | 4,937 |
BBVA Chile, S.A. | | Chile | | Bank | | 67.05 | | 67.05 | | 6,189 |
29
| | | | | | | | | | |
BBVA Banco Francés, S.A. | | Argentina | | Bank | | 76.10 | | 76.08 | | 3,609 |
BBVA Colombia, S.A. | | Colombia | | Bank | | 95.37 | | 95.37 | | 3,081 |
Banco Granahorrar, S.A. | | Colombia | | Bank | | 98.78 | | 94.21 | | 1,447 |
BBVA Factoring E.F.C., S.A. | | Spain | | Financial services | | 100.00 | | 100.00 | | 4,417 |
BBVA Renting, S.A. | | Spain | | Financial services | | 100.00 | | 99.95 | | 462 |
BBVA Ireland Public Limited Company | | Ireland | | Financial services | | 100.00 | | 100.00 | | 2,662 |
BBVA Paraguay, S.A. | | Paraguay | | Bank | | 99.99 | | 99.99 | | 266 |
BBVA Bancomer, S.A. de C.V. | | Mexico | | Bank | | 100.00 | | 99.96 | | 49,583 |
Hipotecaria Nacional, S.A. de C.V. | | Mexico | | Financial services | | 100.00 | | 99.96 | | 931 |
Pensiones Bancomer, S.A. de C.V. | | Mexico | | Insurance | | 100.00 | | 99.95 | | 1,491 |
Seguros Bancomer | | Mexico | | Insurance | | 100.00 | | 99.97 | | 675 |
BBVA Switzerland | | Switzerland | | Bank | | 100.00 | | 100.00 | | 525 |
BBVA Privanza Bank (Jersey) Ltd. | | Jersey | | Bank | | 100.00 | | 100.00 | | 399 |
BBVA Seguros, S.A. | | Spain | | Insurance | | 99.94 | | 99.94 | | 12,562 |
Finanzia, Banco de Credito, S.A. | | Spain | | Bank | | 100.00 | | 100.00 | | 2,081 |
Uno-e Bank, S.A. | | Spain | | Bank | | 67.00 | | 67.00 | | 1,320 |
Laredo National Bancshares Inc. | | U.S.A | | Bank | | 100.00 | | 100.00 | | 45 |
D. Property, Plants and Equipment
We own and rent a substantial network of properties in Spain and abroad, including 3,578 branch offices in Spain and, principally through our various affiliates, 3,832 branch offices abroad at December 31, 2005. Approximately 47.9% of these properties are rented in Spain from third parties pursuant to short-term leases that may be renewed by mutual agreement. The remaining properties, including most of our major branches and our headquarters, are owned by us.
E. Selected Statistical Information
The following is a presentation of selected statistical information for the periods indicated. Where required under Industry Guide 3, we have provided such selected statistical information separately for our domestic and foreign activities, pursuant to our calculation that our foreign operations are significant according to Rule 9-05 of Regulation S-X.
Average Balances and Rates
The tables below set forth selected statistical information on our average balance sheets, which are based on the beginning and month-end balances in each year. We do not believe that monthly averages present trends materially different from those that would be presented by daily averages. Interest income figures, when used, include interest income on non-accruing loans to the extent that cash payments have been received. Loan fees are included in the computation of interest revenue.
EU-IFRS
| | | | | | | | | | | | | | |
| | | Average Balance Sheet—Assets and Interest from Earning Assets | |
| | | 2005 | | | 2004 | |
| | | Average
Balance | | Interest | | Average
Yield(1) | | | Average
Balance | | Interest | | Average
Yield(1) | |
| | | (in millions of euro, except percentages) | |
Assets | | | | | | | | | | | | | | |
Cash and Balances with central banks | | 10,494 | | 458 | | 4.37 | % | | 9,089 | | 275 | | 3.03 | % |
Debt securities, equity instruments and derivatives | | 116,373 | | 4,328 | | 3.72 | % | | 100,174 | | 3,604 | | 3.60 | % |
Loans and receivables | | 213,520 | | 11,170 | | 5.23 | % | | 181,899 | | 8,626 | | 4.74 | % |
In euro (2) | | 161,011 | | 5,974 | | 3.71 | % | | 139,220 | | 5,297 | | 3.80 | % |
Loans and advances to credit institutions | | 10,653 | | 276 | | 2.59 | % | | 10,144 | | 192 | | 1.89 | % |
30
EU-IFRS
| | | | | | | | | | | | | | |
| | | Average Balance Sheet—Assets and Interest from Earning Assets | |
| | | 2005 | | | 2004 | |
| | | Average
Balance | | Interest | | Average
Yield(1) | | | Average
Balance | | Interest | | Average
Yield(1) | |
| | | (in millions of euro, except percentages) | |
Loans and advances to customers | | 150,358 | | 5,698 | | 3.79 | % | | 129,076 | | 5,105 | | 3.96 | % |
In other currencies (3) | | 52,509 | | 5,196 | | 9.89 | % | | 42,679 | | 3,329 | | 7.80 | % |
Loans and advances to credit institutions | | 9,947 | | 491 | | 3.79 | % | | 13,000 | | 570 | | 4.38 | % |
Loans and advances to customers | | 42,562 | | 4,705 | | 11.06 | % | | 29,679 | | 2,759 | | 9.30 | % |
Other financial income | | — | | 186 | | — | | | — | | 103 | | — | |
Non-earning assets | | 23,668 | | — | | — | | | 30,664 | | — | | — | |
| | | | | | | | | | | | | | |
Total average assets | | 364,055 | | 16,142 | | 4.43 | % | | 321,826 | | 12,608 | | 3.92 | % |
| | | | | | | | | | | | | | |
| (1) | Rates have been presented on a non-taxable equivalent basis. |
| (2) | Amounts reflected in euro correspond to predominantly domestic activities. |
| (3) | Amounts reflected in other currencies correspond to predominantly foreign activities. |
Spanish GAAP
| | | | | | | | | |
| | | Average Balance Sheet—Assets
and Interest from Earning Assets | |
| | | 2003 | |
| | | Average
Balance | | | Interest | | | Average
Yield (1) | |
| | | (in millions of euro, except percentages) | |
Assets | | | | | | | | | |
Credit entities | | 28,777 | | | 1,156 | | | 4.0 | % |
In euro | | 10,479 | | | 222 | | | 2.1 | % |
In other currencies | | 18,298 | | | 934 | | | 5.1 | % |
Lending | | 147,915 | | | 8,015 | | | 5.4 | % |
In euro (5) | | 114,121 | | | 5,185 | | | 4.5 | % |
Government and other agencies | | 12,470 | | | 396 | | | 3.2 | % |
Commercial loans (2) | | 7,363 | | | 336 | | | 4.6 | % |
Secured loans (3) | | 48,654 | | | 2,111 | | | 4.3 | % |
Others (4) | | 45,634 | | | 2,341 | | | 5.1 | % |
In other currencies (6) | | 33,794 | | | 2,831 | | | 8.4 | % |
Secured loans | | 9,547 | | | 599 | | | 6.3 | % |
Others | | 24,247 | | | 2,231 | | | 9.2 | % |
Securities portfolio | | 77,852 | | | 3,788 | | | 4.9 | % |
Fixed income securities | | 68,172 | | | 3,324 | | | 4.9 | % |
In euro | | 40,220 | | | 1,321 | | | 3.3 | % |
In other currencies | | 27,952 | | | 2,002 | | | 7.2 | % |
Equity securities | | 9,680 | | | 464 | | | 4.8 | % |
Holdings of companies carried by the equity method | | 6,814 | | | 319 | | | 4.7 | % |
Other holdings | | 2,866 | | | 145 | | | 5.1 | % |
Other financial income | | — | | | 43 | | | — | |
Non-earning assets | | 24,701 | | | — | | | — | |
| | | | | | | | | |
Total average assets | | 279,245 | | | 13,002 | | | 4.7 | % |
| | | | | | | | | |
Total euro assets/total assets | | 71.34 | % | | 55.65 | % | | — | |
| (1) | Rates have been presented on a non-taxable equivalent basis. |
31
| (2) | Principally short-term lending to companies and businesses. |
| (3) | Principally mortgages loans. |
| (4) | Principally other loans to individuals and companies and consumer loans. |
| (5) | Amounts reflected in euro correspond to predominantly domestic activities. |
| (6) | Amounts reflected in other currencies correspond to predominantly foreign activities. |
EU-IFRS
| | | | | | | | | | | | | | |
| | | Average Balance Sheet—Liabilities and Interest from Interest-
bearing Liabilities | |
| | | 2005 | | | 2004 | |
| | | Average
Balance | | Interest | | Average
Rate(1) | | | Average
Balance | | Interest | | Average
Rate(1) | |
| | | (in millions of euro, except percentages) | |
Liabilities | | | | | | | | | | | | | | |
Deposits from central banks and credit institutions | | 64,804 | | 2,176 | | 3.36 | % | | 67,187 | | 1,814 | | 2.70 | % |
In euro | | 36,453 | | 797 | | 2.19 | % | | 41,327 | | 824 | | 1.99 | % |
In other currencies | | 28,352 | | 1,379 | | 4.86 | % | | 25,860 | | 989 | | 3.83 | % |
Customer deposits | | 159,103 | | 4,433 | | 2.79 | % | | 147,695 | | 2,838 | | 1.92 | % |
In euro (2) | | 87,418 | | 1,078 | | 1.23 | % | | 87,207 | | 1,089 | | 1.25 | % |
In other currencies(3) | | 71,685 | | 3,355 | | 4.68 | % | | 60,488 | | 1,750 | | 2.89 | % |
Debt certificates and subordinated liabilities | | 68,924 | | 1,886 | | 2.74 | % | | 51,518 | | 1,466 | | 2.85 | % |
In euro | | 64,188 | | 1,573 | | 2.45 | % | | 47,455 | | 1,254 | | 2.64 | % |
In other currencies | | 4,736 | | 313 | | 6.61 | % | | 4,063 | | 211 | | 5.20 | % |
Other financial costs | | 0 | | 439 | | — | | | — | | 331 | | — | |
Non-interest-bearing liabilities | | 55,544 | | — | | — | | | 42,688 | | — | | — | |
Shareholder’s equity | | 15,680 | | — | | — | | | 12,739 | | — | | — | |
| | | | | | | | | | | | | | |
Total average liabilities | | 364,055 | | 8,934 | | 2.45 | % | | 321,827 | | 6,448 | | 2.00 | % |
| | | | | | | | | | | | | | |
| (1) | Rates have been presented on a non-taxable equivalent basis. |
| (2) | Amounts reflected in euro correspond to predominantly domestic activities. |
| (3) | Amounts reflected in other currencies correspond to predominantly foreign activities. |
32
Spanish GAAP
| | | | | | | | | |
| | | Average Balance Sheet—Liabilities and
Interest paid on Interest Bearing
Liabilities | |
| | | 2003 | |
| | | Average
Balance | | | Interest | | | Average
Rate(1) | |
| | | (in millions of euro, except percentages) | |
Liabilities | | | | | | | | | |
Credit entities | | 55,061 | | | 1,809 | | | 3.3 | % |
In euro | | 33,407 | | | 818 | | | 2.4 | % |
In other currencies | | 21,654 | | | 992 | | | 4.6 | % |
Customer funds | | 181,977 | | | 4,282 | | | 2.4 | % |
Customer deposits | | 142,279 | | | 3,068 | | | 2.2 | % |
In euro (2) | | 84,868 | | | 1,316 | | | 1.6 | % |
Government and other agencies | | 3,459 | | | 57 | | | 1.6 | % |
Current accounts | | 23,079 | | | 219 | | | 0.9 | % |
Savings accounts | | 16,117 | | | 90 | | | 0.6 | % |
Time accounts | | 26,757 | | | 681 | | | 2.5 | % |
Others | | 15,456 | | | 270 | | | 1.7 | % |
In other currencies (3) | | 57,411 | | | 1,752 | | | 3.1 | % |
Current accounts | | 13,147 | | | 120 | | | 0.9 | % |
Savings accounts | | 6,263 | | | 96 | | | 1.5 | % |
Time accounts | | 32,061 | | | 1,272 | | | 4.0 | % |
Others | | 5,939 | | | 263 | | | 4.4 | % |
Debt securities and other marketable securities | | 39,698 | | | 1,214 | | | 3.1 | % |
In euro | | 33,864 | | | 974 | | | 2.9 | % |
In other currencies | | 5,834 | | | 241 | | | 4.1 | % |
Other financial costs | | — | | | 168 | | | — | |
Non-interest-bearing liabilities | | 42,207 | | | — | | | — | |
Shareholders’ funds | | 12,069 | | | — | | | — | |
Other funds without cost | | 30,138 | | | — | | | — | |
| | | | | | | | | |
Total average liabilities | | 279,245 | | | 6,260 | | | 2.2 | % |
| | | | | | | | | |
Total euro liabilities/total liabilities | | 69.60 | % | | 52.33 | % | | — | |
| (1) | Rates have been presented on a non-taxable equivalent basis. |
| (2) | Amounts reflected in euro correspond to predominantly domestic activities. |
| (3) | Amounts reflected in other currencies correspond to predominantly foreign activities. |
Changes in Net Interest Income-Volume and Rate Analysis
The following table allocates changes in our net interest income between changes in volume and changes in rate for 2005 compared to 2004. Volume and rate variance have been calculated based on movements in average balances over the period and changes in interest rates on average interest-earning assets and average interest-bearing liabilities. The only out-of-period items and adjustments excluded from the following table are interest payments on loans which are made in a period other than the period during which they are due. Loan fees were included in the computation of interest income.
| | | | | | | | | |
| | | 2005/2004 | |
| | | Increase (Decrease) Due to
changes in | |
| | | Volume(1) | | | Rate(1)(2) | | | Net
Change | |
| | | (in millions of euro) | |
Interest income | | | | | | | | | |
Cash and balances with central banks | | 42 | | | 141 | | | 183 | |
Debt securities, equity instruments and derivatives | | 583 | | | 141 | | | 724 | |
Loans and advances to credit institutions | | (84 | ) | | 90 | | | 6 | |
In euro (2) | | 10 | | | 75 | | | 85 | |
In other currencies | | (134 | ) | | 55 | | | (79 | ) |
Loans and advances to customers | | 1,692 | | | 847 | | | 2,539 | |
In euro (2) | | 842 | | | (249 | ) | | 593 | |
In other currencies | | 1,198 | | | 749 | | | 1,946 | |
Other financial income | | — | | | 82 | | | 82 | |
| | | | | | | | | |
Total income | | 1,654 | | | 1,880 | | | 3,534 | |
33
| | | | | | | | | |
| | | 2005/2004 | |
| | | Increase (Decrease) Due to
changes in | |
| | | Volume(1) | | | Rate(1)(2) | | | Net
Change | |
| | | (in millions of euro) | |
Interest expense | | | | | | | | | |
Deposits from central banks and credit institutions | | (64 | ) | | 427 | | | 362 | |
In euro | | (97 | ) | | 70 | | | (28 | ) |
In other currencies | | 95 | | | 294 | | | 390 | |
Customer deposits | | 219 | | | 1,375 | | | 1,595 | |
In euro | | 3 | | | (14 | ) | | (11 | ) |
In other currencies | | 324 | | | 1,282 | | | 1,606 | |
Debt certificates and subordinated liabilities | | 495 | | | (75 | ) | | 421 | |
In euro | | 442 | | | (123 | ) | | 319 | |
In other currencies | | 35 | | | 67 | | | 102 | |
Other financial costs | | — | | | 109 | | | 109 | |
| | | | | | | | | |
Total expense | | 846 | | | 1,640 | | | 2,486 | |
| | | | | | | | | |
Net interest income | | 808 | | | 240 | | | 1,048 | |
| | | | | | | | | |
| (1) | Variances caused by changes in both volume and rate have been allocated proportionally to volume and rate. |
| (2) | Rates have been presented on a non-taxable equivalent basis. |
The following table allocates changes in our net interest income between changes in volume and changes in rate for 2004 compared to 2003 in accordance with generally accepted accounting principles which were in effect during the mentioned years for banks in Spain:
| | | | | | | | | |
| | | 2004/2003 | |
| | | Increase (Decrease) Due to
changes in | |
| | | Volume(2) | | | Rate(1)(2) | | | Net Change | |
| | | (in millions of euro) | |
Interest income | | | | | | | | | |
Credit entities | | (23 | ) | | (34 | ) | | (58 | ) |
In euro | | 24 | | | (11 | ) | | 13 | |
In other currencies | | (87 | ) | | 17 | | | (71 | ) |
Lending | | 880 | | | (937 | ) | | (57 | ) |
In euro | | 787 | | | (751 | ) | | 37 | |
Government and other Agencies | | 53 | | | (55 | ) | | (2 | ) |
Commercial Loans | | 31 | | | (43 | ) | | (12 | ) |
Secured loans | | 447 | | | (420 | ) | | 27 | |
Others | | 241 | | | (217 | ) | | 24 | |
In other currencies | | (92 | ) | | (2 | ) | | (94 | ) |
Secured Loans | | 23 | | | (26 | ) | | (3 | ) |
Other | | (135 | ) | | 44 | | | (91 | ) |
Securities portfolio | | 305 | | | (76 | ) | | 229 | |
Fixed income securities | | 263 | | | (273 | ) | | (10 | ) |
34
| | | | | | | | | |
In euro | | 207 | | | (133 | ) | | 73 | |
In other currencies | | (65 | ) | | (19 | ) | | (84 | ) |
Equity securities | | 42 | | | 198 | | | 240 | |
Holdings in companies carried by the equity method | | (37 | ) | | 155 | | | 118 | |
Other holdings | | 84 | | | 38 | | | 122 | |
Other assets | | 4 | | | 51 | | | 54 | |
| | | | | | | | | |
Total assets | | 1,118 | | | (949 | ) | | 168 | |
| | | | | | | | | |
Interest expense | | | | | | | | | |
Credit entities | | 366 | | | (360 | ) | | 6 | |
In euro | | 168 | | | (161 | ) | | 7 | |
In other currencies | | 197 | | | (197 | ) | | (1 | ) |
Customer funds | | 244 | | | (445 | ) | | (201 | ) |
Customer deposits | | 90 | | | (343 | ) | | (253 | ) |
In euro | | 23 | | | (249 | ) | | (226 | ) |
Government and other agencies | | 7 | | | 1 | | | 7 | |
Current accounts | | 8 | | | (53 | ) | | (45 | ) |
Savings accounts | | 10 | | | (19 | ) | | (9 | ) |
Time accounts | | (102 | ) | | (40 | ) | | (142 | ) |
Others | | 43 | | | (80 | ) | | (37 | ) |
In other currencies | | 82 | | | (109 | ) | | (27 | ) |
Current accounts | | 10 | | | (3 | ) | | 7 | |
Savings accounts | | 8 | | | (9 | ) | | (1 | ) |
Time accounts | | 80 | | | (151 | ) | | (71 | ) |
Others | | (39 | ) | | 77 | | | 39 | |
Debt securities and other marketable securities | | 190 | | | (138 | ) | | 52 | |
In euro | | 229 | | | (131 | ) | | 99 | |
In other currencies | | (73 | ) | | 27 | | | (47 | ) |
Other liabilities | | 10 | | | 26 | | | 36 | |
| | | | | | | | | |
Total liabilities | | 538 | | | (697 | ) | | (159 | ) |
| | | | | | | | | |
Net interest income | | 580 | | | (252 | ) | | 327 | |
| | | | | | | | | |
| (1) | Rates have been presented on a non-taxable equivalent basis. |
| (2) | Variances caused by changes in both volume and rate have been allocated proportionally to volume and rate. |
Interest Earning Assets—Margin and Spread
The following table analyzes the levels of our average earning assets and illustrates the comparative gross and net yields and spread obtained for each of the years indicated.
EU-IFRS
| | | | | | |
| | | Year ended December 31, | |
| | | 2005 | | | 2004 | |
| | | (in millions of euro, except percentages) | |
Average interest earning assets | | 340,387 | | | 291,163 | |
Gross yield(1) | | 4.74 | % | | 4.33 | % |
Net yield(2) | | 4.43 | % | | 3.92 | % |
Net interest margin(3) | | 2.12 | % | | 2.12 | % |
Average effective rate paid on all interest-bearing liabilities | | 2.45 | % | | 2.00 | % |
Spread(4) | | 2.29 | % | | 2.33 | % |
35
Spanish GAAP
| | | |
| | | Year ended December 31,
2003 | |
| | | (in millions of euro,
except percentages) | |
Average earning assets | | 254,544 | |
Gross yield(1) | | 5.10 | % |
Net yield(2) | | 2.41 | % |
Net interest margin(3) | | 2.65 | % |
Average effective rate paid on all interest-bearing liabilities | | 2.20 | % |
Spread(4) | | 2.90 | % |
| (1) | Gross yield represents total interest income divided by average interest earning assets. |
| (2) | Net yield represents total interest income divided by total average assets. |
| (3) | Net interest margin represents net interest income as percentage of average interest earning assets. |
| (4) | Spread is the difference between gross yield and the average cost of interest-bearing liabilities. |
ASSETS
Interest-Bearing Deposits in Other Banks
As of December 31, 2005, interbank deposits represented 6.77% of our assets. Of such interbank deposits, 47.43% were held outside of Spain and 52.57% in Spain. We believe that our deposits are generally placed with highly rated banks and have a lower risk than many loans we could make in Spain. Such deposits, however, are subject to the risk that the deposit banks may fail or the banking system of certain of the countries in which a portion of our deposits are made may face liquidity or other problems.
Securities Portfolio
As of December 31, 2005, our securities were carried on our Consolidated Balance Sheet at a book value of €94.74 billion, representing 24.14% of our assets. €17.23 billion or 18.19% of our securities consisted of Spanish Treasury bonds and Treasury bills. The average yield during 2005 on Treasury bonds and Treasury bills that BBVA held was 4.63%, compared to an average yield of approximately 5.23% earned on loans and leases during 2005. The market or appraised value of our total securities portfolio as of December 31, 2005 was €94.90 billion. See Notes 11, 12, 13 and 15 to the Consolidated Financial Statements. For a discussion of our investments in affiliates, see Note 18 to the Consolidated Financial Statements. For a discussion of the manner in which we value our securities, see Notes 2.1 and 2.2.c to the Consolidated Financial Statements.
The following table analyzes the book value and market value of our ownership of debt securities and equity securities at December 31, 2004 and December 31, 2005. Investments in affiliated companies consolidated under the equity method are not included in the table below.
EU-IFRS
| | | | | | | | |
| | | 2005 | | 2004 |
| | | Book Value | | Market or
appraised | | Book Value | | Market or
appraised |
| | | Thousands of Euros |
DEBT SECURITIES | | | | | | | | |
TRADING PORTFOLIO | | | | | | | | |
Domestic: | | | | | | | | |
Spanish Government Securities | | 2,344,643 | | 2,344,643 | | 6,776,570 | | 6,776,570 |
Securities of, or guaranteed by, the Spanish government | | 257,041 | | 257,041 | | 448,492 | | 448,492 |
Other debt securities | | 1,495,321 | | 1,495,321 | | 1,059,904 | | 1,059,904 |
Total Domestic | | 4,097,005 | | 4,097,005 | | 8,284,966 | | 8,284,966 |
Total International | | 20,406,502 | | 20,406,502 | | 22,111,613 | | 22,111,613 |
| | | | | | | | |
TOTAL TRADING PORTFOLIO | | 24,503,507 | | 24,503,507 | | 30,396,579 | | 30,396,579 |
| | | | | | | | |
36
| | | | | | | | |
AVAILABLE FOR SALE PORTFOLIO | | | | | | | | |
Domestic: | | | | | | | | |
Spanish Government Securities | | 13,006,983 | | 13,006,983 | | 14,776,179 | | 14,776,179 |
Other Spanish Government securities | | 1,173,493 | | 1,173,493 | | 1,561,653 | | 1,561,653 |
Securities of, or guaranteed by, the Spanish government | | 2,902 | | 2,902 | | 5,983 | | 5,983 |
Other securities of the Spanish government | | 90,104 | | 90,104 | | 93,416 | | 93,416 |
Other debt securities | | 2,431,401 | | 2,431,401 | | 2,621,807 | | 2,621,807 |
Total Domestic | | 16,704,883 | | 16,704,883 | | 19,059,038 | | 19,059,038 |
International: | | | | | | | | |
United States: | | | | | | | | |
US Treasury | | 252,011 | | 252,011 | | 14,486 | | 14,486 |
Other US Government agencies | | 2,705,939 | | 2,705,939 | | 1,031,575 | | 1,031,575 |
States and political subdivisions | | 51,672 | | 51,672 | | 56,254 | | 56,254 |
Other government securities | | 50 | | 50 | | 0 | | 0 |
Other US securities | | 979,906 | | 979,906 | | 647,877 | | 647,877 |
Other countries: | | | | | | | | |
Securities of other foreign Governments | | 21,792,844 | | 21,792,844 | | 16,407,867 | | 16,407,867 |
Other debt securities outside Spain | | 8,484,673 | | 8,484,673 | | 7,820,130 | | 7,820,130 |
Total International | | 34,267,094 | | 34,267,094 | | 25,978,189 | | 25,978,189 |
| | | | | | | | |
TOTAL AVAILABLE FOR SALE | | 50,971,977 | | 50,971,977 | | 45,037,227 | | 45,037,227 |
| | | | | | | | |
HELD TO MATURITY PORTFOLIO | | | | | | | | |
Domestic: | | | | | | | | |
Spanish Government | | 363,022 | | 374,594 | | 337,434 | | 346,357 |
Other debt securities | | 842,116 | | 862,679 | | 265,420 | | 273,162 |
Total Domestic | | 1,205,138 | | 1,237,273 | | 602,854 | | 619,519 |
Total International | | 2,754,127 | | 2,797,975 | | 1,618,648 | | 1,645,227 |
| | | | | | | | |
TOTAL HELD TO MATURITY | | 3,959,265 | | 4,035,248 | | 2,221,502 | | 2,264,746 |
| | | | | | | | |
TOTAL DEBT SECURITIES | | 79,434,749 | | 79,510,732 | | 77,655,308 | | 77,698,552 |
| | | | | | | | |
EQUITY SECURITIES | | | | | | | | |
TRADING PORTFOLIO | | 6,245,534 | | 6,245,534 | | 5,690,885 | | 5,690,885 |
| | | | | | | | |
AVAILABLE FOR SALE PORTFOLIO | | | | | | | | |
Domestic: | | | | | | | | |
Equity listed | | 6,190,118 | | 6,190,118 | | 6,683,561 | | 6,683,561 |
Equity unlisted | | 71,318 | | 134,466 | | 110,876 | | 178,630 |
Other equities | | 1,134,017 | | 1,134,017 | | 207,759 | | 207,759 |
Total Domestic | | 7,395,453 | | 7,458,601 | | 7,002,196 | | 7,069,950 |
International: | | | | | | | | |
United States: | | | | | | | | |
Equity listed | | 15,580 | | 15,580 | | 41 | | 41 |
Equity unlisted | | 10,149 | | 10,149 | | 3,769 | | 3,769 |
Other equities | | 24,025 | | 25,959 | | 6,477 | | 6,477 |
Other countries: | | | | | | | | |
Equity listed | | 1,312,564 | | 1,312,564 | | 623,213 | | 623,213 |
Equity unlisted | | 45,451 | | 45,451 | | 270,135 | | 270,135 |
Other equities | | 258,788 | | 273,099 | | 60,486 | | 60,486 |
Total International | | 1,666,557 | | 1,682,802 | | 964,121 | | 964,121 |
| | | | | | | | |
TOTAL AVAILABLE FOR SALE | | 9,062,010 | | 9,141,403 | | 7,966,317 | | 8,034,071 |
| | | | | | | | |
TOTAL EQUITY SECURITIES | | 15,307,544 | | 15,386,937 | | 13,657,202 | | 13,724,956 |
| | | | | | | | |
TOTAL INVESTMENT SECURITIES | | 94,742,293 | | 94,897,662 | | 91,312,510 | | 91,423,508 |
| | | | | | | | |
37
The following table analyzes the book value and market value of our ownership of debt and equity securities at December 31, 2003. Investments in affiliated companies consolidated under the equity method are not included in the table below.
Spanish GAAP
| | | | |
| | | At December 31, 2003 |
| | | Book
Value | | Market or
Appraised* |
| | | Million of Euros |
Government debt securities | | | | |
Trading portfolio: | | | | |
Spanish government securities | | 5,616 | | 5,616 |
Securities of, or guaranteed by, the Spanish government | | — | | — |
Available-for-sale portfolio: | | | | |
Bank of Spain certificates of deposit | | — | | — |
Spanish Treasury bills | | 601 | | 601 |
Other fixed interest securities: | | | | |
Securities of, or guaranteed by, the Spanish government | | 12,114 | | 12,297 |
Held to maturity securities | | 614 | | 652 |
| | | | |
Total government securities | | 18,945 | | 19,166 |
| | | | |
Debentures and other debt securities | | | | |
Trading portfolio: | | | | |
Other fixed income securities | | 20,015 | | 20,015 |
Available-for-sale portfolio: | | | | |
Other fixed income securities listed in Spain | | 3,092 | | 3,117 |
U.S. Treasury securities | | 12 | | 12 |
Securities of other U.S. government agencies and corporations | | 1,515 | | 1,510 |
Securities of other foreign governments | | 23,645 | | 23,792 |
Other fixed interest securities listed outside of Spain | | 3,586 | | 3,596 |
Other fixed interest securities not listed | | 560 | | 563 |
Held to maturity portfolio | | 511 | | 543 |
| | | | |
Total debentures and other debt securities | | 52,936 | | 53,148 |
| | | | |
Equity securities | | | | |
Trading securities: | | | | |
Equity securities | | 2,029 | | 2,029 |
Investment securities: | | | | |
Equity listed | | 501 | | 523 |
Equity unlisted | | 562 | | 645 |
| | | | |
Total equity securities | | 3,092 | | 3,196 |
| | | | |
Total securities portfolio | | 74,973 | | 75,510 |
| | | | |
| * | Market values for listed securities are determined on the basis of their quoted values at the end of the year. Appraised values are used for unlisted securities based on our estimate or on unaudited financial statements, when available. |
38
The following table analyzes the maturities of our investment and fixed income securities excluding trading portfolio by type and geographical area as of December 31, 2005.
| | | | | | | | | | | | | | | | | | | | | | |
| | | Maturing at one year or
less | | | Maturing after one year
to five years | | | Maturing after five year
to ten years | | | Maturing after ten
years | | | Total |
| | | Amount | | Yield % | | | Amount | | Yield % | | | Amount | | Yield % | | | Amount | | Yield % | | |
| | | (millions of euros, except percentages) |
DEBT SECURITIES AVAILABLE FOR SALE PORTFOLIO | | | | | | | | | | | | | | | | | | | | | | |
Domestic: | | | | | | | | | | | | | | | | | | | | | | |
Spanish Government | | 5,071,719 | | 4.18 | % | | 3,228,527 | | 5.49 | % | | 872,908 | | 4.84 | % | | 3,833,830 | | 4.92 | % | | 13,006,984 |
Other Spanish Government securities | | 387,476 | | 5.09 | % | | 400,953 | | 5.62 | % | | 241,520 | | 6.68 | % | | 143,544 | | 6.00 | % | | 1,173,493 |
Securities of, or guaranteed by, the Spanish government | | 2,902 | | 0.10 | % | | — | | — | | | — | | — | | | — | | — | | | 2,902 |
Other securities of the Spanish government | | 5,023 | | 0.00 | % | | 2,805 | | 10.87 | % | | — | | — | | | 82,277 | | 11.48 | % | | 90,104 |
Other debt securities | | 280,842 | | 3.36 | % | | 416,792 | | 5.43 | % | | 387,665 | | 4.15 | % | | 1,346,102 | | 2.14 | % | | 2,431,401 |
| | | | | | | | | | | | | | | | | | | | | | |
Total Domestic | | 5,747,962 | | 4.20 | % | | 4,049,077 | | 5.50 | % | | 1,502,092 | | 4.96 | % | | 5,405,753 | | 4.36 | % | | 16,704,883 |
| | | | | | | | | | | | | | | | | | | | | | |
International: | | | | | | | | | | | | | | | | | | | | | | |
United States: | | | | | | | | | | | | | | | | | | | | | | |
US Treasury | | 27,136 | | 3.22 | % | | 50 | | 3.90 | % | | 224,770 | | 1.97 | % | | 56 | | 3.36 | % | | 252,011 |
Other US Government agencies | | 236,646 | | 3.38 | % | | 861,179 | | 3.97 | % | | 231,967 | | 4.56 | % | | 1,376,147 | | 4.24 | % | | 2,705,939 |
States and political subdivisions | | 3,534 | | 5.10 | % | | 13,343 | | 4.02 | % | | 2,058 | | 4.91 | % | | 32,738 | | 4.77 | % | | 51,673 |
Other government securities | | — | | — | | | 50 | | — | | | — | | — | | | — | | — | | | 50 |
Other US securities | | 265,799 | | 4.13 | % | | 207,570 | | 4.11 | % | | 77,488 | | 5.60 | % | | 429,049 | | 6.82 | % | | 979,905 |
Other countries: | | | | | | | | | | | | | | | | | | | | | | |
Securities of other foreign Governments | | 5,653,837 | | 4.92 | % | | 8,480,822 | | 5.68 | % | | 4,451,103 | | 6.66 | % | | 3,207,083 | | 8.08 | % | | 21,792,845 |
Other debt securities outside Spain | | 1,244,452 | | 4.18 | % | | 1,999,918 | | 4.17 | % | | 2,407,707 | | 4.34 | % | | 2,832,595 | | 4.70 | % | | 8,484,672 |
| | | | | | | | | | | | | | | | | | | | | | |
Total International | | 7,431,404 | | 4.71 | % | | 11,562,932 | | 5.26 | % | | 7,395,092 | | 5.68 | % | | 7,877,667 | | 6.11 | % | | 34,267,094 |
| | | | | | | | | | | | | | | | | | | | | | |
Total Available for sale | | 13,179,366 | | 4.49 | % | | 15,612,009 | | 5.32 | % | | 8,897,184 | | 5.56 | % | | 13,283,419 | | 5.39 | % | | 50,971,977 |
| | | | | | | | | | | | | | | | | | | | | | |
HELD TO MATURITY PORTFOLIO | | | | | | | | | | | | | | | | | | | | | | |
Domestic: | | | | | | | | | | | | | | | | | | | | | | |
Spanish Government | | — | | — | | | 182,690 | | 4.59 | % | | 180,332 | | 4.99 | % | | — | | — | | | 363,022 |
Other debt securities | | — | | — | | | 90,736 | | 3.53 | % | | 685,753 | | 4.02 | % | | 65,627 | | 4.53 | % | | 842,116 |
International: | | 282,874 | | 5.12 | % | | 853,031 | | 4.01 | % | | 1,546,023 | | 4.29 | % | | 72,199 | | 5.27 | % | | 2,754,127 |
| | | | | | | | | | | | | | | | | | | | | | |
Total Held to maturity | | 282,874 | | 5.12 | % | | 1,126,457 | | 4.07 | % | | 2,412,108 | | 4.27 | % | | 137,826 | | 4.92 | % | | 3,959,265 |
| | | | | | | | | | | | | | | | | | | | | | |
TOTAL DEBT SECURITIES | | 13,462,240 | | 4.50 | % | | 16,738,466 | | 5.24 | % | | 11,309,291 | | 5.28 | % | | 13,473,945 | | 5.39 | % | | 54,931,242 |
| (1) | Rates have been presented on a non-taxable equivalent basis. |
Loan Portfolio
As of December 31, 2005, our total loans and leases amounted to €222.0 billion, or 56.6% of total assets. During 2005, our loans in Spain increased by 18.0% compared to 2004. Our foreign loans increased by 60.4%, compared to 2004, as a result of the growth in lending in the Latin American countries where we operate. In local currency terms, the most significant growth in loans were of 18.2% in Chile, 34.3% in Peru, 21.0% in Colombia, 62.7% in Venezuela and 36.4% in Mexico. Net of our loan loss reserve, loans and leases amounted to €216.9 billion as of December 31, 2005. For a discussion of certain mandatory ratios relating to our loan portfolio, see “—Supervision and Regulation—Liquidity Ratio” and “—Investment Ratio”.
39
Loans by Geographic Area
The following table analyzes, by domicile of the customer, our net loans and leases for each of the years indicated.
| | | | | | |
| | | At December 31, | |
| EU-IFRS | | 2005 | | | 2004 | |
| | | (in millions of euro) | |
Domestic | | 156,127 | | | 137,687 | |
Foreign: | | | | | | |
Western Europe | | 14,662 | | | 6,645 | |
Central and South America | | 43,490 | | | 27,099 | |
United States | | 6,196 | | | 3,044 | |
Other | | 1,519 | | | 1,118 | |
| | | | | | |
Total foreign | | 65,867 | | | 37,906 | |
| | | | | | |
Total lending | | 221,994 | | | 175,593 | |
Valuation adjustments | | (5,144 | ) | | (3,510 | ) |
Total net lending | | 216,850 | | | 172,083 | |
| | | | | | |
| | | | | | |
| | | At December 31, |
| Spanish GAAP | | 2003 | | 2002 | | 2001 |
| | | (in millions of euro) |
Domestic | | 113,485 | | 101,013 | | 97,910 |
Foreign: | | | | | | |
Western Europe | | 8,082 | | 7,261 | | 8,241 |
Central and South America | | 23,016 | | 28,321 | | 36,202 |
United States | | 3,118 | | 757 | | 4,157 |
Other | | 1,126 | | 3,963 | | 3,710 |
| | | | | | |
Total foreign | | 35,342 | | 40,302 | | 52,310 |
| | | | | | |
Total net lending | | 148,827 | | 141,315 | | 150,220 |
| | | | | | |
Loans by Type of Customer
The following table analyzes by domicile and type of customer our net loans and leases for each of the years indicated. The analyses by type of customer are based principally on the requirements of the regulatory authorities in each country.
| | | | |
| | | At December 31, |
| EU-IFRS | | 2005 | | 2004 |
| | | (in millions of euro) |
Domestic: | | | | |
Government | | 16,089 | | 16,039 |
Agriculture | | 1,550 | | 1,272 |
Industrial | | 14,774 | | 13,216 |
Real estate and construction | | 24,937 | | 19,952 |
Commercial and financial | | 11,736 | | 13,998 |
Loans to individuals | | 67,964 | | 54,725 |
Lease financing | | 5,910 | | 5,014 |
Other | | 13,167 | | 13,471 |
| | | | |
Total domestic | | 156,127 | | 137,687 |
| | | | |
40
| | | | | | |
Foreign: | | | | | | |
Government | | 6,036 | | | 2,686 | |
Agriculture | | 955 | | | 529 | |
Industrial | | 3,155 | | | 9,360 | |
Real estate and construction | | 11,624 | | | 4,457 | |
Commercial and financial | | 24,459 | | | 8,083 | |
Loans to individuals | | 14,619 | | | 9,262 | |
Lease financing | | 816 | | | 352 | |
Other | | 4,203 | | | 3,177 | |
| | | | | | |
Total foreign | | 65,867 | | | 37,906 | |
| | | | | | |
Total loans and leases | | 221,994 | | | 175,593 | |
Loan loss reserve | | (5,144 | ) | | (3,510 | ) |
| | | | | | |
Total net lending | | 216,850 | | | 172,083 | |
| | | | | | |
| | | | | | | | | |
| | | At December 31, | |
| Spanish GAAP | | 2003 | | | 2002 | | | 2001 | |
| | | (in millions of euro) | |
Domestic: | | | | | | | | | |
Government | | 13,403 | | | 12,562 | | | 12,196 | |
Agriculture | | 1,057 | | | 698 | | | 533 | |
Industrial | | 11,991 | | | 11,970 | | | 11,378 | |
Real estate and construction | | 14,823 | | | 13,652 | | | 12,767 | |
Commercial and financial | | 12,742 | | | 9,336 | | | 8,677 | |
Loans to individuals | | 44,160 | | | 38,515 | | | 36,105 | |
Lease financing | | 4,160 | | | 3,217 | | | 2,685 | |
Other | | 13,333 | | | 12,923 | | | 10,900 | |
| | | | | | | | | |
Total domestic | | 115,669 | | | 102,873 | | | 95,241 | |
Foreign | | 37,602 | | | 43,540 | | | 60,907 | |
| | | | | | | | | |
Total loans and leases | | 153,271 | | | 146,413 | | | 156,148 | |
Loan loss reserve | | (4,444 | ) | | (5,098 | ) | | (5,928 | ) |
| | | | | | | | | |
Total net lending | | 148,827 | | | 141,315 | | | 150,220 | |
| | | | | | | | | |
The following table sets forth a breakdown, by currency, of our net loan portfolio for 2004 and 2005.
| | | | |
| | | At December 31, |
| EU-IFRS | | 2005 | | 2004 |
| | | (in millions of euro) |
In euro | | 164,309 | | 140,398 |
In other currencies | | 52,541 | | 31,685 |
| | | | |
Total | | 216,850 | | 172,083 |
| | | | |
41
| | | | | | |
| | | At December 31, |
| Spanish GAAP | | 2003 | | 2002 | | 2001 |
| | | (in millions of euro) |
In euro | | 120,152 | | 106,590 | | 98,982 |
In other currencies | | 28,675 | | 34,725 | | 51,238 |
| | | | | | |
Total | | 148,827 | | 141,315 | | 150,220 |
As of December 31, 2005, loans by BBVA and its subsidiaries to companies we are required to account for by the equity method amounted to €267.6 million, compared to €227.2 million as of December 31, 2004. Loans outstanding to the Spanish government and its agencies amounted to €22.13 billion, or 9.97% of our total loans and leases as of December 31, 2005, compared to €20.35 billion, or 11.59% of our total loans and leases as of December 31, 2004. None of our loans to companies controlled by the Spanish government are guaranteed by the government and, accordingly, we apply normal credit criteria in extending credit to such entities. Moreover, we carefully monitor such loans because governmental policies necessarily affect such borrowers.
Diversification in our loan portfolio is our principal means of reducing the risk of loan losses. We also carefully monitor our loans to borrowers in sectors or countries experiencing liquidity problems. Our exposure to our five largest borrowers as of December 31, 2005, excluding government-related loans, amounted to €8.48 billion, or approximately 3.82% of our total outstanding loans and leases.
Maturity and Interest Sensitivity
The following table sets forth an analysis by maturity of our total loans and leases by domicile of the office that issued the loan and type of customer as of December 31, 2005. The determination of maturities is based on contract terms.
| | | | | | | | |
| EU-IFRS | | Maturity | | |
| | | Due in One
Year or Less | | Due After One
Year Through
Five Years | | Due After
Five Years | | Total |
| | | (in millions of euros) | | |
Domestic: | | | | | | | | |
Government | | 5,247 | | 2,676 | | 8,166 | | 16,089 |
Agriculture | | 953 | | 444 | | 153 | | 1,550 |
Industrial | | 6,124 | | 3,445 | | 5,205 | | 14,774 |
Real estate and construction | | 3,237 | | 5,756 | | 15,944 | | 24,937 |
Commercial and financial | | 10,340 | | 1,001 | | 395 | | 11,736 |
Loans to individuals | | 14,432 | | 17,779 | | 35,753 | | 67,964 |
Lease financing | | 176 | | 3,098 | | 2,636 | | 5,910 |
Other | | 8,557 | | 2,686 | | 1,924 | | 13,167 |
| | | | | | | | |
Total domestic | | 49,066 | | 36,885 | | 70,176 | | 156,127 |
| | | | | | | | |
Foreign: | | | | | | | | |
Government | | 671 | | 1,263 | | 4,102 | | 6,036 |
Agriculture | | 513 | | 311 | | 131 | | 955 |
Industrial | | 1,708 | | 731 | | 716 | | 3,155 |
Real estate and construction | | 2,163 | | 3,236 | | 6,225 | | 11,624 |
Commercial and financial | | 11,408 | | 10,059 | | 2,992 | | 24,459 |
Loans to individuals | | 2,319 | | 8,132 | | 4,168 | | 14,619 |
Lease financing | | 480 | | 200 | | 136 | | 816 |
Other | | 1,897 | | 1,251 | | 1,055 | | 4,203 |
| | | | | | | | |
Total foreign | | 21,159 | | 25,183 | | 19,525 | | 65,867 |
Total loans and leases | | 70,225 | | 62,068 | | 89,701 | | 221,994 |
| | | | | | | | |
42
The following table sets forth a breakdown of our fixed and variable rate loans which had a maturity of one year or more as of December 31, 2005.
| | | | | | |
| | | Interest Sensitivity of
Outstanding Loans and Leases
Maturing in More Than One
Year |
| | | Domestic | | Foreign | | Total |
| | | (in millions of euro) |
Fixed rate | | 33,727 | | 21,135 | | 54,862 |
Variable rate | | 73,332 | | 23,575 | | 96,907 |
| | | | | | |
Total | | 107,059 | | 44,710 | | 151,769 |
| | | | | | |
Loan Loss Reserve
For a discussion of loan loss reserves, see “Item 5. Operating and Financial Review and Prospects—Critical accounting policies—Allowance for loan losses” and Note 2.2.c.4) to the Consolidated Financial Statements.
43
The following table provides information, by domicile of customer, regarding our loan loss reserve and movements of loan charge-offs and recoveries for periods indicated.
| | | | | | |
| | | At December 31, | |
| EU-IFRS | | 2005 | | | 2004 | |
| | | (in millions of euro,
except percentages) | |
Loan loss reserve at beginning of period: | | | | | | |
Domestic | | 2,374 | | | 1,771 | |
Foreign | | 2,248 | | | 3,274 | |
| | | | | | |
Total loan loss reserve at beginning of period | | 4,622 | | | 5,046 | |
| | | | | | |
Loans charged off: | | | | | | |
Government and other Agencies | | 0 | | | 0 | |
Real estate and loans to individuals | | (138 | ) | | (103 | ) |
Commercial and financial | | (76 | ) | | (36 | ) |
Other | | 0 | | | 0 | |
Total Domestic | | (215 | ) | | (134 | ) |
Foreign | | (452 | ) | | (579 | ) |
| | | | | | |
Total loans charged off | | (667 | ) | | (713 | ) |
| | | | | | |
Provision for loan losses: | | | | | | |
Domestic | | 624 | | | 737 | |
Foreign | | 196 | | | 408 | |
| | | | | | |
Total provision for loan losses | | 820 | | | 1,145 | |
Acquisition and disposition of subsidiaries | | 144 | | | — | |
Effect of foreign currency translation | | 370 | | | (146 | ) |
Other | | 297 | | | (708 | ) |
| | | | | | |
Loan loss reserve at end of period: | | | | | | |
Domestic | | 3,079 | | | 2,374 | |
Foreign | | 2,507 | | | 2,248 | |
Total loan loss reserve at end of period | | 5,587 | | | 4,622 | |
Loan loss reserve as a percentage of total loans and leases at end of period | | 2.52 | % | | 2.63 | % |
Net loan charge-offs as a percentage of total loans and leases at end of period | | 0.30 | % | | 0.41 | % |
44
Our loan loss reserves as a percentage of total loans and leases declined from 2.63% as of December 31, 2004, to 2.52% as of December 31, 2005, principally due to the increase in the volume of loans granted in 2005.
We do not maintain records allocating the amount of charge-offs and the amount of recoveries by loan category. See “—Substandard Loans” for information as to the breakdown as of December 31, 2005 by loan category of substandard loans. Also, at the time that a loan is charged off in accordance with Bank of Spain guidelines, it will normally be substantially or fully reserved and, accordingly, such charge-off would have a very limited effect on our net attributable profit or shareholders’ equity. Accordingly, we believe that information relating to domestic reserves and charge-offs by loan category is of less relevance than would be the case for a U.S. bank.
| | | | | | | | | |
| | | At December 31, | |
| Spanish GAAP | | 2003 | | | 2002 | | | 2001 | |
| | | (in millions of euro, except percentages) | |
Loan loss reserve at beginning of period: | | | | | | | | | |
Domestic | | 1,599 | | | 1,375 | | | 1,222 | |
Foreign | | 3,747 | | | 4,945 | | | 6,933 | |
Acquisition and disposition of subsidiaries | | — | | | (2 | ) | | 12 | |
Total loan loss reserve at beginning of period | | 5,346 | | | 6,318 | | | 8,167 | |
| | | | | | | | | |
Loans written off: | | | | | | | | | |
Domestic | | (292 | ) | | (337 | ) | | (409 | ) |
Foreign | | (931 | ) | | (1,205 | ) | | (4,929 | ) |
of which due to FOBAPROA(*) | | | | | | | | (3,259 | ) |
| | | | | | | | | |
Total loans written off | | (1,223 | ) | | (1,542 | ) | | (5,338 | ) |
| | | | | | | | | |
Recoveries of loans previously written off: | | | | | | | | | |
Domestic | | 105 | | | 112 | | | 124 | |
Foreign | | 122 | | | 96 | | | 164 | |
| | | | | | | | | |
Total recoveries of loans previously written off | | 227 | | | 208 | | | 288 | |
Net loans written off | | (996 | ) | | (1,334 | ) | | (5,050 | ) |
| | | | | | | | | |
Provision for possible loan losses: | | | | | | | | | |
Domestic | | 468 | | | 504 | | | 464 | |
Foreign | | 809 | | | 1,238 | | | 1,455 | |
Total | | 1,277 | | | 1,742 | | | 1,919 | |
Effect of foreign currency translation | | (711 | ) | | (1,441 | ) | | 715 | |
Other | | (179 | ) | | 61 | | | 569 | |
| | | | | | | | | |
Total provision for possible loan losses | | 387 | | | 362 | | | 3,203 | |
| | | | | | | | | |
Loan loss reserve at end of period: | | | | | | | | | |
Domestic | | 1,832 | | | 1,599 | | | 1,375 | |
Foreign | | 2,905 | | | 3,747 | | | 4,945 | |
| | | | | | | | | |
Total loan loss reserve at end of period | | 4,737 | | | 5,346 | | | 6,320 | |
| | | | | | | | | |
| (*) | Due to accounting adjustments relating to FOBAPROA promissory notes. |
45
FOBAPROA adjustments
The foregoing table indicates that a €3,259 million charge off of loans in 2002 related to FOBAPROA promissory notes. Of this balance, €2,690 million related to a reduction to the provision for possible loan losses and the remaining €569 million related to other items which increased the provision for possible loan losses. BBVA’s ownership of the FOBAPROA promissory notes, which were held by Bancomer, arose in connection with measures taken by the Mexican Government during the Mexican economic crisis in 1994 and 1995. Under these measures, Mexican banks, including Bancomer, were allowed to transfer to the Mexican government the right to collect on a portion of their loan portfolio that was experiencing payment difficulties. In exchange, the Mexican government issued to such banks FOBAPROA promissory notes, guaranteed in part by the Mexican government, in an amount equal to the book value (net of provisions) of the loans transferred. The banks, however, remained responsible for 25% of the losses arising from the difference between the amount of the FOBAPROA promissory notes at the time exchanged, plus the accumulated accrued interest on such promissory notes, and the amount the Mexican government was able to recover on the loans transferred to it.
Since the Mexican government only guaranteed up to 75% of the FOBAPROA promissory notes, in 2001 BBVA concluded that the amount not guaranteed by the Mexican government was not collectible. Under Spanish GAAP, this 25% was considered a loss and was written off, with a reduction of assets and of the Allowance for Loan Losses on BBVA’s Consolidated Balance Sheets.
Substandard Loans
We classify loans as substandard loans in accordance to the requirements under IFRS in respect of “impaired loans”. As we described in Note 2.2.c.4 to the Consolidated Financial Statements, loans are considered to be impaired loans, and accrual of the interest thereon is suspended, when there are reasonable doubts that the loans will be recovered in full and/or the related interest will be collected for the amounts and on the dates initially agreed upon, taking into account the guarantees received by the consolidated entities to assure (in part or in full) the performance of transactions. In addition, all loans that are 90 days past due, even if well-collateralized and in the process of being collected, are automatically considered non-accrual if they are classified as substandard loans.
When the recovery of any recognized amount is considered to be remote, this amount is removed from the consolidated balance sheet, without prejudice to any actions taken by the consolidated entities in order to collect the amount until their rights extinguish in full through expiry, forgiveness or for other reasons.
Interest on all of our substandard non-accrual loans is not credited to income until actually collected. The amount of gross interest income that would have been recorded in respect of our substandard loans as of December 31, 2004 and 2005 under EU-IFRS was €750 million and €1,052 million, respectively.
Amounts collected in relation to impaired loans and receivables are used to recognize the related accrued interest and any excess amount is used to reduce the principal not yet repaid. The approximate amount of interest income on our substandard loans which was included in net attributable profit under Spanish GAAP in 2003 was €357.4 million. The approximate amount of interest income on our substandard loans which was included in income attributed to the Group in 2004 and 2005 under EU-IFRS was €138.3 million and 148.1 million, respectively
46
The following table provides information, by domicile of customer, regarding our substandard loans for periods indicated.
EU-IFRS
| | | | | | |
| | | At December 31, | |
| | | 2005 | | | 2004 | |
| | | (in millions of euro, except
percentages) | |
Substandard loans: | | | | | | |
Domestic | | 849 | | | 954 | |
Public sector | | 33 | | | 33 | |
Other resident sectors | | 721 | | | 832 | |
Non-resident sector | | 96 | | | 89 | |
Country risk | | 5 | | | 7 | |
Other | | 90 | | | 82 | |
Foreign | | 1,497 | | | 1,248 | |
Public sector | | 89 | | | 74 | |
Other resident sectors | | 73 | | | 48 | |
Non-resident sector | | 1,335 | | | 1,126 | |
Country risk | | 1 | | | 3 | |
Other | | 1,334 | | | 1,123 | |
| | | | | | |
Total substandard loans | | 2,346 | | | 2,202 | |
| | | | | | |
Total loan loss reserve | | 5,587 | | | 4,622 | |
| | | | | | |
Substandard loans net of reserves | | (3,241 | ) | | (2,420 | ) |
Substandard loans as a percentage of loans and receivables | | 0.92 | % | | 1.10 | % |
Substandard loans (net of reserves) as a percentage of loans and receivables | | (1.27 | %) | | (1.21 | )% |
Spanish GAAP
| | | | | | | | | |
| | | At December 31, | |
| | | 2003 | | | 2002 | | | 2001 | |
| | | (in millions of euro, except percentages) | |
Substandard loans: | | | | | | | | | |
Non-performing loans | | 2,672 | | | 3,474 | | | 2,737 | |
Public sector | | 535 | | | 508 | | | 41 | |
Other resident sectors | | 733 | | | 771 | | | 786 | |
Non-resident sector | | | | | | | | | |
Country risk | | 12 | | | 196 | | | 27 | |
Other | | 1,392 | | | 1,999 | | | 1,883 | |
Other non-performing loans | | 454 | | | 57 | | | 6 | |
Resident sector | | — | | | — | | | — | |
Non-resident sector | | 454 | | | 57 | | | 6 | |
| | | | | | | | | |
Total substandard loans | | 3,127 | | | 3,531 | | | 2,743 | |
| | | | | | | | | |
Loan loss reserve | | | | | | | | | |
Credit loan loss reserve | | 4,444 | | | 5,098 | | | 5,928 | |
Other loan loss reserve—Fixed income portfolio | | 121 | | | 125 | | | 253 | |
Credit entities | | 171 | | | 123 | | | 139 | |
| | | | | | | | | |
Total loan loss reserve | | 4,736 | | | 5,346 | | | 6,320 | |
| | | | | | | | | |
Substandard loans net of reserves | | (1,609 | ) | | (1,815 | ) | | (3,577 | ) |
Non-performing loans as a percentage of total loans and leases | | 1.74 | % | | 2.37 | % | | 1.75 | % |
Non performing loans (net of reserves) as a percentage of total loans | | (1.16 | )% | | (1.11 | )% | | (2.04 | )% |
47
Our total substandard loans amounted to €2,346 million as of December 31, 2005, compared to €2,202 million as of December 31, 2004, principally due to the consolidation of the companies acquired during 2005, and the effect of the appreciation of Latin American currencies with respect to the euro. As a result of the increase in loan loss reserves described above under “—Loan Loss Reserve” and the small increase in total substandard loans described above, our substandard loans as a percentage of total loans and receivables decreased from 1.10% to 0.92% and our loan loss reserves as a percentage of substandard loans increased from 209.90% to 238.15%, in each case as of December 31, 2004 and December 31, 2005, respectively.
We experience higher substandard loans in our Latin American operations, as a percentage of total loans, than in our Spanish operations and actively monitor the higher risk profile of the loan portfolios of our Latin American operations.
As of December 31, 2005, we do not believe that there is a material amount of loans not included in the foregoing table where known information about possible credit problems of the borrowers gives rise to serious doubts as to the ability of the borrowers to comply with the currently applicable loan repayment terms.
The following table provides information, by domicile and type of customer, regarding our substandard loans and the loan loss reserves taken for each substandard loan category, as of December 31, 2005.
EU-IFRS
| | | | | | | |
| | | Substandard
Loans | | Loan
Loss
Reserve | | Substandard
Loans as a
percentage
of Loans in
Category | |
| | | (in millions of euro) | |
Domestic: | | | | | | | |
Government | | 33 | | 66 | | 0.21 | % |
Agricultural | | 10 | | 7 | | 0.65 | % |
Industrial | | 84 | | 53 | | 0.57 | % |
Real estate and construction | | 120 | | 78 | | 0.48 | % |
Commercial and financial | | 119 | | 85 | | 1.01 | % |
Loans to individuals | | 410 | | 200 | | 0.60 | % |
Other | | 73 | | 53 | | 0.40 | % |
| | | | | | | |
Total domestic | | 849 | | 542 | | 0.55 | % |
Foreign: | | | | | | | |
Country risk | | 20 | | 88 | | | |
Other | | 1,477 | | 1,404 | | | |
| | | | | | | |
Total foreign | | 1,497 | | 1,492 | | 2.28 | % |
General reserve | | | | 3,553 | | | |
| | | | | | | |
Total substandard loans | | 2,346 | | 5,587 | | 1.06 | % |
| | | | | | | |
Foreign Country Outstandings
The following tables sets forth, as of the end of the years indicated, the aggregate amounts of our cross-border outstandings (which consist of loans, interest-bearing deposits with other banks, acceptances and other monetary assets denominated in a currency other than the home-country currency of the office where the item is booked) where outstandings in the borrower’s country exceeded 1% of our total assets at December 31, 2005,
48
and at December 31, 2004. Cross-border outstandings do not include loans in local currency made by our subsidiary banks to customers in other countries to the extent that such loans are funded in the local currency or hedged. As a result, they do not include the vast majority of the loans made by our Latin American subsidiaries.
EU-IFRS
| | | | | | | | | | |
| | | At December 31, | |
| | | 2005 | | | 2004 | |
| | | Amount | | % of
Total Assets | | | Amount | | % of
Total Assets | |
| | | (in millions of euro, except percentages) | |
O.E.C.D. | | | | | | | | | | |
United Kingdom | | 5,497 | | 1.40 | % | | 2,326 | | 0.71 | % |
Mexico | | 5,961 | | 1.52 | % | | 5,892 | | 1.79 | % |
Other O.E.C.D. | | 5,239 | | 1.34 | % | | 4,313 | | 1.31 | % |
| | | | | | | | | | |
Total O.E.C.D. | | 16,697 | | 4.26 | % | | 12,531 | | 3.80 | % |
| | | | | | | | | | |
Central and South America | | 3,747 | | 0.95 | % | | 3,005 | | 0.91 | % |
Other | | 1,785 | | 0.45 | % | | 1,208 | | 0.37 | % |
| | | | | | | | | | |
Total | | 22,229 | | 5.67 | % | | 16,744 | | 5.08 | % |
| | | | | | | | | | |
Spanish GAAP
| | | | | |
| | | At December 31, | |
| | | 2003 | |
| | | Amount | | % of
Total Assets | |
| | | (in millions of euro, except
percentages) | |
O.E.C.D. | | | | | |
United Kingdom | | 3,532 | | 1.23 | % |
Mexico | | 6,682 | | 2.33 | % |
Other O.E.C.D. | | 4,335 | | 1.51 | % |
| | | | | |
Total O.E.C.D. | | 14,549 | | 5.07 | % |
| | | | | |
Central and South America | | 3,595 | | 1.25 | % |
Other | | 1,265 | | 0.44 | % |
| | | | | |
Total | | 19,409 | | 6.76 | % |
| | | | | |
49
The following tables sets forth the amounts of our cross-border outstandings as of December 31 of each year indicated by type of borrower where outstandings in the borrower’s country exceeded 1% of our total assets.
EU-IFRS
| | | | | | | | |
| | | Governments | | Banks and
Other
Financial
Institutions | | Commercial,
Industrial
and Other | | Total |
| | | (in millions of euro) |
2005 | | | | | | | | |
Mexico | | 2,650 | | 739 | | 2,572 | | 5,961 |
United Kingdom | | — | | 3,701 | | 1,796 | | 5,497 |
| | | | | | | | |
Total | | 2,650 | | 4,440 | | 4,368 | | 11,458 |
| | | | | | | | |
| | | | |
2004 | | | | | | | | |
Mexico | | 2,494 | | 892 | | 2,507 | | 5,892 |
United Kingdom | | — | | 1,360 | | 966 | | 2,326 |
| | | | | | | | |
Total | | 2,494 | | 2,252 | | 3,473 | | 8,218 |
| | | | | | | | |
Spanish GAAP
| | | | | | | | |
| | | Governments | | Banks and
Other
Financial
Institutions | | Commercial,
Industrial
and Other | | Total |
| | | (in millions of euro) |
2003 | | | | | | | | |
Mexico | | 3,662 | | 702 | | 2,318 | | 6,682 |
United Kingdom | | — | | 2,426 | | 1,106 | | 3,532 |
| | | | | | | | |
Total | | 3,662 | | 3,128 | | 3,424 | | 10,214 |
| | | | | | | | |
The Bank of Spain requires that minimum reserves be maintained for cross-border risk arising with respect to loans and other outstandings to countries, or residents of countries, falling into certain categories established by the Bank of Spain on the basis of the level of perceived transfer risk. The category that a country falls into is determined by us, subject to review by the Bank of Spain.
The following table shows the minimum required reserves with respect to each category of country. For BBVA’s level of coverage as of December 31, 2005.
| | |
Categories(1) | | Minimum Percentage of
Coverage (Outstandings
Within Category) |
Countries belonging to the OECD whose currencies are quoted in the Spanish foreign exchange market | | 0.0 |
Countries with transitory difficulties(2) | | 10.1 |
Doubtful countries(2) | | 22.8 |
Very doubtful countries(2)(3) | | 83.5 |
Bankrupt countries(4) | | 100.0 |
| (1) | Any outstanding which is guaranteed may be treated, for the purposes of the foregoing, as if it were an obligation of the guarantor. |
| (2) | Coverage for the aggregate of these three categories must equal at least 35% of outstanding loans within the three categories. The Bank of Spain has recommended up to 50% aggregate coverage. |
| (3) | Outstandings to very doubtful countries are treated as substandard under Bank of Spain regulations. |
| (4) | Outstandings to bankrupt countries must be charged off immediately. As a result, no such outstandings are reflected on our consolidated balance sheet. Notwithstanding the foregoing minimum required reserves, certain interbank outstandings with an original maturity of three months or less have minimum required reserves of 50%. We met or exceeded the minimum percentage of required coverage with respect to each of the foregoing categories. |
50
Our exposure to borrowers in countries with difficulties (the last 4 categories in the foregoing table), excluding our exposure to subsidiaries or companies we manage and trade-related debt, amounted to €927 million €378 million and €690 million as of December 31, 2003, 2004 and 2005, respectively. These figures do not reflect loan loss reserves of 66.2%, 30.0% and 11.9%, respectively, against the relevant amounts outstanding at such dates. Deposits with or loans to borrowers in all such countries as of December 31, 2005 did not in the aggregate exceed 0.18% of our total assets.
The country-risk exposures described in the preceding paragraph as of December 31, 2005, 2004 and 2003 do not include exposures for which insurance policies have been taken out with third parties that include coverage of the risk of confiscation, expropriation, nationalization, nontransfer, nonconvertibility and, if appropriate, war and political violence. The sums insured as of December 31, 2005, 2004 and 2003, amounted to $108 million, $153 million and $466 million, respectively (approximately €91 million, €113 million and €369 million, respectively based on a euro/dollar exchange rate on December 31, 2005 of $1.00 = €0.85, on December 31, 2004 of $1.00=€0.73 and on December 31, 2003 of $1.00 = €0.79).
LIABILITIES
Deposits
The principal components of our customer deposits are domestic demand and savings deposits and foreign time deposits. The following tables provide information regarding our deposits by principal geographic area for the dates indicated.
EU-IFRS
| | | | | | | | |
| | | At December 31, 2005 |
| | | Customer
Deposits | | Bank of Spain and
Other Central Banks | | Other Credit
Institutions | | Total |
| | | (in millions of euro) |
Domestic | | 62,471,990 | | 19,652,319 | | 8,487,493 | | 90,611,802 |
Foreign: | | | | | | | | |
Western Europe | | 43,018,989 | | — | | 15,615,660 | | 58,634,649 |
Latin America | | 11,871,560 | | 1,512,672 | | 7,750,921 | | 21,135,153 |
United States | | 58,172,985 | | 2,368 | | 5,388,919 | | 63,564,272 |
Other | | 5,903,602 | | — | | 7,725,480 | | 13,629,082 |
| | | | | | | | |
Total foreign | | 118,967,136 | | 1,515,040 | | 36,480,980 | | 156,963,156 |
| | | | | | | | |
Total | | 181,439,126 | | 21,167,359 | | 44,968,473 | | 247,574,958 |
| | | | | | | | |
| |
| | | At December 31, 2004 |
| | | Customer
Deposits | | Bank of Spain and Other Central
Banks | | Other Credit
Institutions | | Total |
| | | (in millions of euro) |
Domestic | | 77,221,614 | | 17,907,860 | | 13,012,661 | | 108,142,135 |
Foreign: | | | | | | | | |
Western Europe | | 11,937,071 | | — | | 16,882,647 | | 28,819,718 |
Latin America | | 46,054,545 | | 2,228,168 | | 7,135,061 | | 55,417,774 |
United States | | 7,852,097 | | — | | 775,779 | | 8,627,876 |
Other | | 5,175,346 | | — | | 5,853,690 | | 11,029,036 |
| | | | | | | | |
Total foreign | | 71,019,059 | | 2,228,168 | | 30,647,177 | | 103,894,404 |
| | | | | | | | |
Total | | 148,240,673 | | 20,136,028 | | 43,659,838 | | 212,036,539 |
| | | | | | | | |
51
Spanish GAAP
| | | | | | | | |
| | | At December 31, 2003 |
| | | Customer
Deposits | | Bank of Spain and
Other Central
Banks | | Other
Credit
Institutions | | Total |
| | | (in millions of euro) |
Domestic | | 74,032 | | 18,374 | | 14,863 | | 107,269 |
Foreign: | | | | | | | | |
Western Europe | | 10,914 | | — | | 11,078 | | 21,992 |
Latin America | | 44,674 | | 2,550 | | 9,175 | | 56,399 |
United States | | 3,381 | | — | | 1,687 | | 5,068 |
Other | | 8,048 | | — | | 3,842 | | 11,890 |
| | | | | | | | |
Total foreign | | 67,017 | | 2,550 | | 25,782 | | 95,349 |
| | | | | | | | |
Total | | 141,049 | | 20,924 | | 40,645 | | 202,618 |
| | | | | | | | |
For an analysis of our deposits, including non-interest bearing demand deposits, interest-bearing demand deposits, saving deposits and time deposits, see Note 26 to the Consolidated Financial Statements.
As of December 31, 2005, the maturity of our time deposits (excluding interbank deposits) in denominations of $100,000 (approximately €80,645 considering the noon buying rate as of December 31, 2005) or greater was as follows:
| | | | | | |
| | | At December 31, 2005 |
| | | Domestic | | Foreign | | Total |
| | | (in millions of euro) |
3 months or Under | | 7,038 | | 36,779 | | 43,817 |
Over 3 to 6 months | | 1,221 | | 4,507 | | 5,728 |
Over 6 to 12 months | | 592 | | 2,458 | | 3,050 |
Over 12 months | | 4,271 | | 291 | | 4,562 |
| | | | | | |
Total | | 13,122 | | 44,035 | | 57,157 |
| | | | | | |
Time deposits from Spanish and foreign financial institutions amounted to €28.8 billion as of December 31, 2005, substantially all of which were in excess of $100,000 (approximately €80,645 as of December 31, 2005).
Large denomination deposits may be a less stable source of funds than demand and savings deposits because they are more sensitive to variations in interest rates. For a breakdown by currency of deposits as of December 31, 2005 and 2004, see Note 26 to the Consolidated Financial Statements.
Short-term Borrowings
Securities sold under agreements to repurchase and promissory notes issued by us constituted the only categories of short-term borrowings that equaled or exceeded 30% of stockholders’ equity at December 31, 2004 and 2005.
EU-IFRS
| | | | | | | | | | |
| | | At December 31, | |
| | | 2005 | | | 2004 | |
| | | Amount | | Average Rate | | | Amount | | Average Rate | |
| | | (in millions of euro, except percentages) | |
Securities sold under agreements to repurchase | | | | | | | | | | |
At December 31 | | 48,254 | | 3.54 | % | | 38,529 | | 3.36 | % |
Average during year | | 38,467 | | 3.52 | % | | 43,488 | | 3.44 | % |
Maximum quarter-end balance | | 48,254 | | — | | | 49,642 | | — | |
Bonds, debentures outstanding and subordinated debt | | | | | | | | | | |
At December 31 | | 14,273 | | 3.54 | % | | 7,082 | | 2.81 | % |
Average during year | | 10,324 | | 3.61 | % | | 7,628 | | 2.39 | % |
Maximum quarter-end balance | | 14,273 | | — | | | 9,568 | | — | |
Bank promissory notes: | | | | | | | | | | |
At December 31 | | 7,569 | | 2.58 | % | | 6,255 | | 2.20 | % |
Average during year | | 6,894 | | 2.34 | % | | 5,675 | | 2.08 | % |
Maximum quarter-end balance | | 7,569 | | — | | | 6,255 | | — | |
Total short-term borrowings at December 31 | | 70,096 | | 3.44 | % | | 51,866 | | 3.14 | % |
52
Spanish GAAP
| | | | | |
| | | At December 31, | |
| | | 2003 | |
| | | Amount | | Average Rate | |
| | | (in millions of euro, except
percentages) | |
Securities sold under agreements to repurchase (principally Spanish Treasury bills): | | | | | |
At December 31 | | 38,483 | | 2.81 | % |
Average during year | | 36,759 | | 3.52 | % |
Maximum quarter-end balance | | 38,483 | | — | |
Bonds, debentures outstanding and subordinated debt | | | | | |
At December 31 | | 8,173 | | 3.00 | % |
Average during year | | 7,829 | | 3.09 | % |
Maximum quarter-end balance | | 10,764 | | — | |
Bank promissory notes: | | | | | |
At December 31 | | 6,087 | | 2.11 | % |
Average during year | | 4,666 | | 2.13 | % |
Maximum quarter-end balance | | 6,219 | | — | |
Total short-term borrowings at December 31 | | 52,743 | | 2.76 | % |
Return on Equity
The following table sets out our return on equity ratios:
EU-IFRS
| | | | |
| | | As of or for the year ended
December 31, |
| | | 2005 | | 2004 |
ROE (income attributed to the group/average equity) | | 37.0 | | 33.2 |
ROA (income before minority interests/average total assets) | | 1.12 | | 0.97 |
RORWA (income before minority interests/risk weighted assets) | | 1.91 | | 1.62 |
Dividend pay-out ratio | | 47.3 | | 53.4 |
Equity to assets ratio | | 3.32 | | 3.32 |
Spanish GAAP
| | |
| | | As of or for the year ended
December 31, 2003 |
ROE (income attributed to the group/average equity) | | 18.4 |
ROA (income before minority interests/average total assets) | | 1.04 |
RORWA (income before minority interests/risk weighted assets) | | 1.74 |
Dividend pay-out ratio | | 55.0 |
Equity to assets ratio | | 4.32 |
53
F. Competition
The commercial banking sector in Spain has undergone significant consolidation. In the majority of the markets where we provide financial services, Santander Central Hispano is our strongest competitor.
We face strong competition in all of our principal areas of operation. The deregulation of interest rates on deposits in the past decade has led to increased competition for large demand deposits in Spain and the widespread promotion of interest-bearing demand deposit accounts and mutual funds. The capturing of customer funds in Spain had been characterized for several years by a large shift of deposits into mutual funds. However, in recent years both types of assets have recorded substantial growth. In 2004, mutual fund assets under management grew by 12.0% and in 2005 by 12,9%. The trend in deposits has been favorable and deposits in the banking sector increased by 14.3% and 26.8% in 2004 and 2005, respectively.
Spanish savings banks and money market mutual funds provide strong competition for savings deposits, which form an important part of our deposit base, and, in the case of savings banks, for other retail banking services. Credit cooperatives, which are active principally in rural areas, where they provide savings bank and loan services and related services such as the financing of agricultural machinery and supplies, are also a source of competition.
The entry of on-line banks into the Spanish banking system has increased competition, mainly in customer funds businesses such as deposits and especially in saving and time deposits. Insurance companies and other financial services firms also compete for customer funds. Like the commercial banks, savings banks, insurance companies and other financial services firms are expanding the services offered to consumers in Spain. We face competition in mortgage loans from saving banks and, to a lesser extent, cooperatives.
The EU Directive on Investment Services took effect on December 31, 1995. The EU Directive permits all brokerage houses authorized to operate in other member states of the EU to carry out investment services in Spain. Although the EU Directive is not specifically addressed to banks, it affects the activities of banks operating in Spain.
Foreign banks also have a strong presence in Spain. As of December 31, 2005, approximately 85 foreign banks, of which 65 were branches, operated in Spain and several foreign banks have acquired small and medium-sized Spanish banks.
| ITEM 4A. | UNRESOLVED STAFF COMMENTS |
Not applicable.
| ITEM 5. | OPERATING AND FINANCIAL REVIEW AND PROSPECTS |
Overview
2005 witnessed the continued expansion of the world economy which, with growth of over 4% in terms of global GDP (according to our internal estimates), notably withstood the pressure exerted by rising oil prices. As economic growth gathered momentum and inflation risk rose, the U.S. Federal Reserve gradually increased its official interest rates from 1% in June 2004 to 4.25% at year-end 2005, in spite of which long-term interest rates remained very low (on average, in 2005, the 10 year rate was the same as in 2004), resulting in a flattening of the rate curve.
On December 1, 2005, the European Central Bank signaled an imminent rise in interest rates when it set its official rate at 2.25%, following two-and-a-half years in which it had stood at 2.00%. Although this triggered an upswing in Euribor in the fourth quarter of 2005, in 2005, 10-year interest rates were lower, on average, than in 2004. In 2005, the European economy grew at a slower rate than in 2004. However, according to the Spanish National Institute of Statistics (Instituto Nacional de Estadística) the Spanish economy reported 3.4% growth, up
54
from 3.1% in 2004, fuelled by burgeoning domestic consumer demand and household and corporate investment; this growth figure also reflects the adverse contribution of the foreign sector and rising inflation.
Latin America, one of the regions benefiting from the international economic climate, achieved growth in 2005 of more than 4% in terms of GDP (according to our internal estimates). In what proved to be the third consecutive year of significant expansion, the economic performance of this region was characterized by the fact that most of the Latin American countries experienced economic growth in 2005. The increase in raw materials prices, the appreciation of the nominal exchange rate of the local currencies and the reduction in risk premiums all had a favorable impact on the region. Interest rates in Mexico, which peaked in May 2005, began to fall back at the end of August of that year; this, combined with the appreciation of the Mexican peso against the U.S. dollar, helped to keep inflation at an all-time low.
Critical Accounting Policies
The BBVA Group’s consolidated financial statements as of and for the years ended December 31, 2005 and December 31, 2004 were prepared by the Bank’s directors in accordance with EU-IFRS and by applying the basis of consolidation, accounting policies and measurement bases described in Note 2 to the Consolidated Financial Statements, so that they present fairly the Group’s equity and financial position at December 31, 2005 and December 31, 2004, and the results of its operations, the changes in consolidated equity and the consolidated cash flows in 2005 and 2004. These consolidated financial statements were prepared on the basis of the accounting records kept by the Bank and by each of the other Group companies and include the adjustments and reclassifications required to unify the accounting policies and measurement bases used by the Group (Note 2.2 to the Consolidated Financial Statements).
In preparing the consolidated financial statements estimates were occasionally made by the Group and the consolidated companies in order to quantify certain of the assets, liabilities, income, expenses and commitments reported herein. These estimates relate mainly to the following:
| | • | | The impairment losses on certain assets. |
| | • | | The assumptions used in the actuarial calculation of the post-employment benefit liabilities and commitments. |
| | • | | The useful life of tangible and intangible assets. |
| | • | | The measurement of goodwill arising on consolidation. |
| | • | | The fair value of certain unquoted assets. |
Although these estimates were made on the basis of the best information available at December 31, 2005 on the events analyzed, events that take place in the future might make it necessary to change these estimates (upwards or downwards) in coming years.
The presentation format used and EU-IFRS applied vary in certain respects from the presentation format and accounting rules required to be applied under generally accepted accounting principles in the United States (“U.S. GAAP”) and other rules that are applicable to U.S. banks. The tables included in Note 59 to our Consolidated Financial Statements give the effect that application of U.S. GAAP would have on income for the year and shareholders’ equity as reported under EU-IFRS.
Note 2 to the Consolidated Financial Statements contains a summary of our significant accounting policies. We consider certain of these policies to be particularly important due to their effect on the financial reporting of our financial condition and because they require management to make difficult, complex or subjective judgments, some of which may relate to matters that are inherently uncertain. Our reported financial condition and results of operations are sensitive to accounting methods, assumptions and estimates that underlie the preparation of the Consolidated Financial Statements. The nature of critical accounting policies, the judgments and other uncertainties affecting application of those policies and the sensitivity of reported results to changes in conditions and assumptions are factors to be considered when reviewing our Consolidated Financial Statements and the discussion below. We have identified the following accounting policies as critical to the understanding of our results of operations, since the application of these policies requires significant management assumptions and estimates that could result in materially different amounts to be reported if conditions or underlying circumstances were to change.
Fair value of financial instruments
The fair value of an asset or a liability on a given date is taken to be the amount for which it could be bought or sold on that date by two knowledgeable, independent parties in an arm’s length transaction acting prudently. The most objective and common reference for the fair value of an asset or a liability is the price that would be paid for it on an organized, transparent and deep market (“quoted price” or “market price”).
If there is no market price for a given asset or liability, its fair value is estimated on the basis of the price established in recent transactions involving similar instruments and, in the absence thereof, by using mathematical measurement models sufficiently tried and trusted by the international financial community. Such estimates would take into consideration the specific features of the asset or liability to be measured and, in particular, the various types of risk associated with the asset or liability. However, the limitations inherent to the
55
measurement models developed and the possible inaccuracies of the assumptions required by these models may signify that the fair value of an asset or liability thus estimated does not coincide exactly with the price for which the asset or liability could be purchased or sold on the date of its measurement.
Derivatives and other futures transactions
These instruments include unmatured foreign currency purchase and sale transactions, unmatured securities purchase and sale transactions, futures transactions relating to securities, exchange rates or interest rates, forward interest rate agreements, options relating to exchange rates, securities or interest rates and various types of financial swaps.
All derivatives are recognized in the balance sheet at fair value from the date of arrangement. If the fair value of a derivative is positive, it is recorded as an asset and if it is negative, it is recorded as a liability. Unless there is evidence to the contrary, it is understood that on the date of arrangement the fair value of the derivatives is equal to the transaction price. Changes in the fair value of derivatives after the date of arrangement are recognized with a balancing entry under the heading Gains or Losses on Financial Assets and Liabilities in the consolidated income statement. Specifically, the fair value of the standard financial derivatives included in the held for trading portfolios is equal to their daily quoted price, If, under exceptional circumstances, their quoted price cannot be established on a given date, these derivatives are measured using methods similar to those used to measure over-the-counter (“OTC”) derivatives.
The fair value of OTC derivatives is equal to the sum of the future cash flows arising from the instrument, discounted at the measurement date (“present value” or “theoretical close”); these derivatives are measured using methods recognized by the financial markets, including the net present value (NPV) method and option price calculation models.
Financial derivatives that have as their underlying equity instruments whose fair value cannot be determined in a sufficiently objective manner and are settled by delivery of those instruments, are measured at cost.
Goodwill in consolidation
The positive differences between the cost of business combinations and the acquired percentage of the net fair value of the assets, liabilities and contingent liabilities of the acquirees are recorded as goodwill on the asset side of the balance sheet. Goodwill represents the future economic benefits from assets that cannot be individually identified and separately recognized. Goodwill is not amortized but is submitted to impairment analysis. Any impaired goodwill is written off.
Goodwill is allocated to one or more cash-generating units expected to benefit from the synergies arising from business combinations. The cash-generating units represent the Group’s business and/or geographical segments as managed internally by its directors.
The cash-generating units to which goodwill has been allocated are tested for impairment based on the carrying amount of the unit including the allocated goodwill. Such testing is performed at least annually and whenever there is an indication of impairment.
For the purpose of determining the impairment of a cash-generating unit to which goodwill has been allocated, the carrying amount of that unit, adjusted by the theoretical amount of the goodwill attributable to the minority interest, shall be compared with its recoverable amount. The resulting loss shall be apportioned by reducing, firstly, the carrying amount of the goodwill allocated to that unit and, secondly, if there are still impairment losses remaining to be recognized, the carrying amount of the rest of the assets. This shall be done by allocating the remaining loss in proportion to the carrying amount of each of the assets in the unit. It will be taken into account that no impairment of goodwill attributable to the minority interest may be recognized, In any case, impairment losses on goodwill can never be reversed.
56
Pension commitments and other commitments to employees
Pension and post-retirement benefit costs and credits are based on actuarial calculations. Inherent in these calculations are assumptions including discount rates, rate of salary increase and expected return on plan assets. Changes in pension and post-retirement costs may occur in the future as a consequence of changes in interest rates, expected return on assets or other assumptions. See Note 2.2.f) to the Consolidated Financial Statements contains a summary of our significant accounting policies and the actuarial Assumptions used.
Allowance for loan losses
Our loan loss reserve is intended to cover losses in connection with substandard loans (including risks and other losses relating to certain performing loans and operations). As we describe in Note 2.2.c.4) to the Consolidated Financial Statements, a loan is considered to be an impaired or substandard loan—and therefore its carrying amount is adjusted to reflect the effect of its impairment—when there is objective evidence that events have occurred which, in the case of loans, give rise to a negative impact on the future cash flows that were estimated at the time the transaction was arranged.
As a general rule, the carrying amount of an impaired loan is adjusted with a charge to the consolidated income statement for the year in which the impairment becomes known, and the recoveries of previously recognized impairment losses are recognized in the consolidated income statement for the year in which the impairment is reversed or reduced.
The amount of the impairment losses incurred on these instruments relates to the positive difference between their respective carrying amounts and the present values of their expected future cash flows. The following is to be taken into consideration when estimating the future cash flows:
| | • | | all the amounts that are expected to be obtained over the residual life of the instrument, including, where appropriate, those which may result from the guarantees provided for the instrument (after deducting the costs required for foreclosure and subsequent sale); |
| | • | | the various types of risk to which each instrument is subject; and |
| | • | | the circumstances in which collections will foreseeably be made. |
These cash flows are subsequently discounted using the instrument’s effective interest rate (if its contractual rate is fixed) or the effective contractual interest rate at the discount date (if it is variable).
The possible impairment losses on these assets are determined:
| | • | | individually, for all significant loans and for those which, although not significant, cannot be classified in homogenous groups of instruments of similar characteristics, i.e., by instrument type, debtor’s industry and geographical location, type of guarantee, age of past-due amounts, etc. |
| | • | | collectively, in all other cases. |
Criteria for determining impairment losses resulting from materialization of the insolvency risk of the obligors have been established. Under these criteria, a loan is impaired due to insolvency:
| | • | | when there is evidence of a deterioration of the obligor’s ability to pay, either because it is in arrears or for other reasons, and/or |
| | • | | when country risk materializes; country risk is considered to be the risk associated with debtors resident in a given country due to circumstances other than normal commercial risk. |
Similarly, different classifications of transactions have been established on the basis of the nature of the obligors, the conditions of the countries in which they reside, transaction status, type of associated guarantees, and time in arrears. For each of these risk groups minimum impairment losses (“identified losses”) that must be recognized in the financial statements of consolidated entities are established by BBVA.
In addition to the recognition of identified losses, provisioning, for the losses inherent in loans not measured at fair value through profit or loss and in contingent risks classified as standard is recognized taking into account the historical experience of impairment and the other circumstances known at the time of the assessment. For these purposes, inherent losses are the losses incurred at the date of the financial statements, calculated using statistical procedures, that have not been allocated to specific transactions.
The Group has implemented a methodology which complies with IFRS and is consistent with by the Bank of Spain requirements related to the determination of the level of provisions required to cover inherent losses. The aforementioned methodology takes as the first step the classification of portfolios considered as normal risk (debt instruments not valued at their fair value with changes in the income statement, as with contingent risks and contingent commitments). Once the portfolios have been classified in the aforementioned groups, the Bank of Spain, based on its experience and the information available to it with respect to
the Spanish banking sector, has determined the method and amount of the parameters that entities should apply in the calculation of the provisions for inherent losses in debt instruments and contingent risks classified as normal risk.
The Group estimates the provisions to be made to create these allowances using models based on our own credit loss experience and management’s estimates of future credit losses. The Group has developed internal risk models, based on historical information available for each country and type of risk (homogenous portfolios). For a discussion of our credit risk management system, see “Item 11. Quantitative and Qualitative Disclosures about Market Risk”. These models produce a range of results that comprises the level of provisions that we arrive at using the model established by the Bank of Spain as explained above. These internal models may be applied in future periods but are subject to local regulatory review (the Bank of Spain). In order for each internal model to be considered valid by the local regulator, the calculation should be methodologically correct, and be supported by historical information which covers at least one complete economic cycle and stored in databases which are consistent with information that has been audited by both the Group’s internal audit function and external auditors.
The development of the internal model has led to the introduction of databases that can be used to accurately estimate the risk parameters required in the calculation of capital and expected loss, following best practices in the market and the guidelines of the New Capital Accord (Basel II).
Although there should be no substantial difference in the calculation of loan allowances between IFRS and U.S. GAAP, the Bank has included in the reconciliation of stockholders’ equity and net income a difference between IFRS and U.S. GAAP related to the determination of allowance losses not allocated to specific loans. According to U.S. GAAP, the loan loss allowance should represent the best estimate of probable losses in possible scenarios. Under IFRS, the Bank has additionally applied the statistical percentages obtained from historical trends as determined by the Bank of Spain’s guidance. As a result, the loan allowances not allocated to specific loans, as determined by using this method, are higher than those meeting the requirements of U.S. GAAP, being the amounts determined under both generally accepted accounting principles within the range of possible estimated losses calculated internally by the Group.
The estimates of the portfolio’s inherent risks and overall recovery vary with changes in the economy, individual industries, countries and individual borrowers’ or counterparties’ ability and willingness to repay their obligations. The degree to which any particular assumption affects the allowance for credit losses depends on the severity of the change and its relationship to the other assumptions.
Key judgments used in determining the allowance for loan losses include: (i) risk ratings for pools of commercial loans and leases; (ii) market and collateral values and discount rates for individually evaluated loans; (iii) product type classifications for consumer and commercial loans and leases; (iv) loss rates used for consumer and commercial loans and leases; (v) adjustments made to assess current events and conditions; (vi) considerations regarding domestic, global and individual countries economic uncertainty; and (vii) overall credit conditions.
A. Operating Results
Factors Affecting the Comparability of our Results of Operations and Financial Condition
We are exposed to foreign exchange rate risk in that our reporting currency is the euro, whereas certain of our subsidiaries keep their accounts in other currencies, principally Mexican pesos, Argentine pesos, Chilean pesos and Colombian pesos, Venezuelan bolivars, Peruvian nuevos soles and U.S. dollars. For example, if Latin American currencies and the U.S. dollar depreciate against the euro, when the results of operations of our Latin American subsidiaries are included in our Consolidated Financial Statements, the euro value of their results declines, even if, in local currency terms, their results of operations and financial condition have remained the same or improved relative to the prior year. Accordingly, declining exchange rates may limit the ability of our results of operations, stated in euro, to fully describe the performance in local currency terms of our Latin American subsidiaries. By contrast, the appreciation of Latin American currencies and the U.S. dollar against the euro would have a positive impact on the results of operations of our Latin American subsidiaries, when their results of operations are included in our Consolidated Financial Statements.
The assets and liabilities of our subsidiaries which keep their accounts in currencies other than the euro have been translated to euro at the period-end exchange rates for inclusion in our Consolidated Financial Statements. Income statement items have been translated at the average exchange rates for the period. The following table sets forth the exchange rates of several Latin American currencies against the euro, expressed in local currency per €1.00 at December 31, 2005 and 2004, respectively, according to the European Central Bank.
| | | | | | | |
| | | As of December 31, | | Change | |
| | | 2005 | | 2004 | | 2005/2004 | |
Mexican peso | | 12.6357 | | 15.1823 | | 16.8 | % |
Venezuelan bolivar | | 2,531.65 | | 2,610.97 | | 3.0 | % |
Colombian peso | | 2,695.42 | | 3,205.13 | | 15.9 | % |
Chilean peso | | 606.80 | | 759.30 | | 20.1 | % |
Peruvian new sol | | 4.0434 | | 4.4745 | | 9.6 | % |
Argentinean peso | | 3.5907 | | 4.0488 | | 11.3 | % |
U.S. dollar | | 1.1797 | | 1.3621 | | 13.4 | % |
As shown in the table above, in 2005, the main Latin American currencies and the U.S. dollar appreciated against the euro, which had a positive impact on our results of operations for 2005 compared to 2004 and therefore affects the comparability of our historical results of operations for these two years.
57
BBVA Group Results of Operations
The changes in the Group’s consolidated income statements for 2005 and 2004 were as follows:
| | | | | | | | | |
| | | Year ended
December 31, | | | Change | |
| | | 2005 | | | 2004 | | | 2005/2004 | |
| | | (in millions of euro) | | | (in percentages) | |
Consolidated Statement of Income | | | | | | | | | |
Interest and similar income | | 15,848 | | | 12,352 | | | 28.3 | |
Interest expense and similar charges | | (8,932 | ) | | (6,447 | ) | | 38.5 | |
Income from equity instruments | | 292 | | | 255 | | | 14.6 | |
| | | | | | | | | |
Net interest income | | 7,208 | | | 6,160 | | | 17.0 | |
Share of profit or loss of entities accounted for using the equity method | | 122 | | | 97 | | | 25.2 | |
Fee and commission income | | 4,669 | | | 4,057 | | | 15.1 | |
Fee and commission expenses | | (729 | ) | | (644 | ) | | 13.2 | |
Insurance activity income | | 487 | | | 391 | | | 24.7 | |
Gains/(losses) on financial assets and liabilities (net) | | 980 | | | 762 | | | 28.7 | |
Exchange differences (net) | | 287 | | | 298 | | | (3.7 | ) |
| | | | | | | | | |
Gross income | | 13,024 | | | 11,121 | | | 17.1 | |
| | | |
Sales and income from the provision of non-financial services | | 576 | | | 468 | | | 23.1 | |
Cost of sales | | (451 | ) | | (342 | ) | | 31.9 | |
Other operating income | | 134 | | | 22 | | | n.m. | (1) |
Personnel expenses | | (3,602 | ) | | (3,247 | ) | | 10.9 | |
Other administrative expenses | | (2,160 | ) | | (1,851 | ) | | 16.7 | |
Depreciation and amortization | | (449 | ) | | (448 | ) | | n.m. | (1) |
Other operating expenses | | (249 | ) | | (132 | ) | | 88.7 | |
Net operating income | | 6,823 | | | 5,591 | | | 22.0 | |
| | | | | | | | | |
Impairment losses (net) of which: | | (854 | ) | | (958 | ) | | (10.8 | ) |
Loan loss provisions | | (813 | ) | | (784 | ) | | 3.7 | |
Provisioning expense (net) | | (454 | ) | | (850 | ) | | (46.6 | ) |
Finance income from non-financial activities | | 2 | | | 9 | | | (71.8 | ) |
Finance expenses from non-financial activities | | (2 | ) | | (5 | ) | | (61.2 | ) |
Other gains | | 285 | | | 622 | | | (54.2 | ) |
Other losses | | (208 | ) | | (271 | ) | | (23.2 | ) |
| | | | | | | | | |
Income before tax | | 5,592 | | | 4,138 | | | 35.2 | |
Income tax | | (1,521 | ) | | (1,029 | ) | | 47.9 | |
| | | | | | | | | |
Income from ordinary activities | | 4,071 | | | 3,109 | | | 31.0 | |
Profit or loss from discontinued operations (net) | | — | | | — | | | — | |
Consolidated income for the period | | 4,071 | | | 3,109 | | | 31.0 | |
Income attributed to minority interests | | (265 | ) | | (186 | ) | | 42.3 | |
| | | | | | | | | |
Income attributed to the group | | 3,806 | | | 2,923 | | | 30.2 | |
| | | | | | | | | |
Net interest income
The following table summarizes the principal components of net interest income for 2005 compared to 2004.
| | | | | | | | |
| | | Year ended
December 31, | | | Change |
| | | 2005 | | | 2004 | | | 2005/2004 |
| | | (in millions of euros) | | | (in percentages) |
Interest and similar income | | 15,848 | | | 12,352 | | | 28.3 |
Interest expense and similar charges | | (8,932 | ) | | (6,447 | ) | | 38.5 |
Income from equity instruments | | 292 | | | 255 | | | 14.6 |
| | | | | | | | |
Net interest income | | 7,208 | | | 6,160 | | | 17.0 |
| | | | | | | | |
58
Net interest income for 2005 amounted to €7,208 million, a 17.0% increase from €6,160 million in 2004. This increase is principally due to an increase in the BBVA Group’s overall business volume, which was driven mainly by increases in loans and advances to customers, primarily individuals in Spain and in the commercial and financial and real estate and construction sectors outside of Spain. Low interest rates in Spain during 2005 reduced the spread between the interest we paid on interest-bearing liabilities, principally deposits, and the interest we earned on our interest-earning assets, principally loans, in our core Spanish market. This low yield spread was offset by the significant increase in business volume in Spain during 2005 and an increase in both interest rates and business volume in Latin America, most significantly in Mexico, which resulted in a higher yield spread, and an increase in net interest income generated by the Americas business area, most significantly in Mexico.
Share of Profit or Loss of Entities Accounted for Using the Equity Method
Our share of profit from entities accounted for using the equity method was €122 million in 2005 compared to €97 million in 2004. Our share of profit from entities accounted for using the equity method in 2005 related mainly to our interests in Banca Nazionale del Lavoro S.p.A. and Corporación IBV.
Net Fee and Commission Income
Fee and Commission Income
The breakdown of fee and commission income in 2005 and 2004 is as follows:
| | | | | | | |
| | | Year ended
December 31, | | Change | |
| | | 2005 | | 2004 | | 2005/2004 | |
| | | (in millions of euros) | | (in percentages) | |
Commitment fees | | 50 | | 41 | | 22.6 | |
Contingent liabilities | | 177 | | 160 | | 10.8 | |
Documentary credits | | 31 | | 27 | | 6.9 | |
Bank and other guarantees | | 145 | | 133 | | 9.6 | |
Arising from exchange of foreign currencies and banknotes | | 18 | | 17 | | 7.0 | |
Collection and payment services | | 2,019 | | 1,732 | | 16.5 | |
Securities services | | 1,948 | | 1,739 | | 12.0 | |
Counselling on and management of one-off transactions | | 16 | | 15 | | 10.2 | |
Financial and similar counselling services | | 11 | | 6 | | 66.5 | |
Factoring transactions | | 19 | | 17 | | 10.4 | |
Non-banking financial products sales | | 40 | | 46 | | (12.9 | ) |
Other fees and commissions | | 372 | | 284 | | 30.9 | |
| | | | | | | |
Fee and commission income | | 4,669 | | 4,057 | | 15.1 | |
| | | | | | | |
Fee and commission income for 2005 amounted to €4,669 million, a 15.1% increase from €4,057 million in 2004, mainly due to:
| | • | | a 16.5% increase in collection and payment services to €2,019 million in 2005 from €1,732 million in 2004, primarily due to an increase in fees and commissions relating to retail banking services in Latin America, most significantly in Mexico; and |
| | • | | a 12.0% increase in securities services to €1,948 million in 2005 from €1,739 million in 2004, primarily attributable to an increase in brokerage fees as a result of increased trading activity by our customers in 2005 due in part to favorable market conditions. |
59
Fee and Commission Expenses
The breakdown of the fee and commission expenses in 2005 and 2004 is as follows:
| | | | | | | |
| | | Year ended
December 31, | | Change | |
| | | 2005 | | 2004 | | 2005/2004 | |
| | | (in millions of euro) | | (in percentages) | |
Brokerage fees on lending and deposit transactions | | 13 | | 8 | | 52.0 | |
Fees and commissions assigned to third parties | | 519 | | 430 | | 20.8 | |
Other fees and commissions | | 197 | | 206 | | (4.2 | ) |
| | | | | | | |
Fee and commission expenses | | 729 | | 644 | | 13.2 | |
| | | | | | | |
Fee and commission expenses for 2005 amounted to €729 million, a 13.2% increase from €644 million in 2004, mainly due to a 20.8% increase in fees and commissions assigned to third parties to €519 million in 2005 from €430 million in 2004, primarily due to an increase in fees paid to intermediary service providers as a result of increased business volumes.
Net Fee and Commission Income
As a result of the foregoing, net fee and commission income for 2005 totaled €3,940 million, a 15.4% increase from €3,413 million in 2004.
Insurance Activity Income
Net insurance activity income for 2005 amounted to €487 million, a 24.7% increase from €391 million in 2004, relating mainly to growth in our insurance business in Spain and Portugal, as well as in the Americas.
Gains or Losses on Financial Assets and Liabilities (Net)
Gains on financial assets (net) amounted to €980 million in 2005, a 28.7% increase from €762 million in 2004. The 56.0% decrease in gains from available-for-sale financial assets to €429 million in 2005 from €974 million in 2004, (mainly due to a lower volume of sales of available-for-sale financial assets in 2005 compared to 2004) and the 19.2% decrease in gains from securities held for trading to €898 million in 2005 from €1,111 million in 2004, (mainly due to decreases in the fair value of securities held for trading purposes, principally fixed income public debt securities) where partially offset by the significant 62% decrease in losses on derivatives held for trading purposes to €508 million in 2005 from €1,338 million in 2004, reflecting less volatile market conditions in 2005;
Gross Income
As a result of the foregoing, gross income amounted to €13,024 million in 2005, a 17.1% increase from €11,120 million in 2004.
60
Personnel Expenses
The breakdown of personnel expenses in 2005 and 2004 is as follows:
| | | | | | | |
| | | Year ended
December 31, | | Change | |
| | | 2005 | | 2004 | | 2005/2004 | |
| | | (in millions of euro) | | (in percentages) | |
Wages and salaries | | 2,743 | | 2,460 | | 11.6 | |
Social security costs | | 472 | | 437 | | 8.0 | |
Transfers to internal pension provisions (Note 2.2.f) | | 69 | | 59 | | 16.8 | |
Contributions to external pension funds (Note 2.2.f) | | 56 | | 57 | | (2.8 | ) |
Other personnel expenses | | 262 | | 234 | | 11.8 | |
| | | | | | | |
Personnel expenses | | 3,602 | | 3,247 | | 10.9 | |
| | | | | | | |
Personnel expenses for 2005 amounted to €3,602 million, a 10.9% increase from €3,247 million in 2004, mainly due to an 11.6% increase in wages and salaries to €2,743 million in 2005 from €2,460 million in 2004 as a result of an increase in the average number of employees of the BBVA Group to 90,744 in 2005 from 84,704 in 2004. The increase in the average number of employees in 2005 was due mainly to the addition of employees resulting from the acquisition of Hipotecaria Nacional, S.A. de C.V. in January 2005, the acquisition of Laredo National Bancshares, Inc. in April 2005 and the acquisition of an approximately 99% interest in Banco Granahorrar, S.A. in December 2005.
Other Administrative Expenses
The breakdown of other administrative expenses during in 2005 and 2004 is as follows:
| | | | | | |
| | | Year ended
December 31, | | Change |
| | | 2005 | | 2004 | | 2005/2004 |
| | | (in millions of euros) | | (in percentages) |
Technology and systems | | 434 | | 411 | | 5.5 |
Communications | | 203 | | 183 | | 11.0 |
Advertising | | 212 | | 144 | | 47.3 |
Property, fixtures and materials | | 415 | | 361 | | 15.0 |
Taxes other than income tax | | 213 | | 153 | | 39.6 |
Other expenses | | 683 | | 599 | | 14.1 |
| | | | | | |
Other administrative expenses | | 2,160 | | 1,851 | | 16.7 |
| | | | | | |
Other administrative expenses amounted to €2,160 million in 2005, a 16.7% increase from €1,851 million in 2004. This increase was mainly due to increases in other expenses, advertising expenses and taxes other than income tax.
We calculate our efficiency ratio as (i) the sum of gross income, sales and income from the provision of non-financial services and other operating income, divided by (ii) the sum of cost of sales, personnel expenses, other administrative expenses and other operating expenses. Our efficiency ratio was 43.2% in 2005 compared to 44.6% in 2004. Including depreciation and amortization expense, our efficiency ratio was 46.7% in 2005 compared to 48.6% in 2004.
Net Operating Income
Our net operating income for 2005 was €6,823 million, an increase of 22.0% from €5,591 million in 2004.
Impairment Losses (Net)
Impairment losses (net) was €854 million in 2005, a decrease of 10.8% from 2004. This decrease is mainly due to the fact that, in 2004, impairment losses reflected €145 million that corresponded to the impairment of goodwill relating to Banca Nazionale del Lavoro, S.p.A. in the fourth quarter of 2004.
61
Provision Expense (Net)
Provision expense (net) was €454 million in 2005, a decrease of 46.6% from €850 million in 2004, reflecting a decrease in charges relating to early retirement plans. See Note 2.2(f)1.1.2 to the Consolidated Financial Statements.
Other Gains and Losses (Net)
The breakdown of other gains and losses during in 2005 and 2004 is as follows:
| | | | | | | |
| | | Year ended
December 31, | | Change | |
| | | 2005 | | 2004 | | 2005/2004 | |
| | | (in millions of euros) | | (in percentages) | |
Net gains on sales of held-to-maturity investments | | 108 | | 103 | | 4.8 | |
Net gains on sale of long-term investments | | 40 | | 317 | | (87.4 | ) |
Income from the provision of non-typical services | | 4 | | 5 | | (18.6 | ) |
Other income | | 133 | | 197 | | (32.5 | ) |
| | | | | | | |
Other gains | | 285 | | 622 | | (54.2 | ) |
| | | | | | | |
| | | |
Net losses on fixed assets disposals | | 22 | | 22 | | 0.1 | |
Net losses on long-term investments due to write-downs | | 12 | | 9 | | 28.7 | |
Other losses | | 174 | | 240 | | (27.4 | ) |
| | | | | | | |
Other Losses | | 208 | | 271 | | (23.2 | ) |
| | | | | | | |
| | | |
Other gains (net) | | 77 | | 351 | | (78.2 | ) |
| | | | | | | |
Other gains (net) was €77 million in 2005 compared to €351 million in 2004. In 2005, we sold small stakes in various companies compared to more significant sales in 2004 of interests in companies, including Banco Atlántico, Direct Seguros, Grubarges Inversión Hotelera, S.L. and Vidrala, S.A.
Income Tax
Income tax expense was €1,521 million in 2005, an increase of 47.9% from €1,029 million in 2004. Our effective tax rate (income tax expense as a percentage of our income before tax) was 27.2% in 2005 compared to 24.9% in 2004, principally reflecting the change in the composition of our pre-tax income.
Income Attributed to Minority Interests
Income attributed to minority interests amounted to €265 million in 2005, an increase of 42.3% from €186 million in 2004, mainly due to the increased profit of most of our majority owned subsidiaries and the impact of the appreciation of Latin American currencies when translating the profit of certain of these subsidiaries into euro.
Income Attributed to the Group
As a result of the foregoing, income attributed to the group amounted to €3,806 million in 2005, a 30.2% increase from €2,923 million in 2004.
Results of Operations by Business Areas
As described under “Item 4. Information on the Company- Business Overview”, our business areas during 2005 were the following:
| | • | | Retail Banking in Spain and Portugal; |
62
| | • | | Wholesale and Investment Banking; |
Retail Banking in Spain and Portugal
| | | | | | | | | |
| | | Year ended
December 31, | | | Change | |
| | | 2005 | | | 2004 | | | 2005/2004 | |
| | | (in millions of euros) | | | (in percentages) | |
Net interest income | | 3,182 | | | 3,015 | | | 5.6 | |
Share of profit of entities accounted for using the equity method | | 1 | | | 1 | | | (29.7 | ) |
Net fee and commission income | | 1,602 | | | 1,477 | | | 8.5 | |
Insurance activity income | | 309 | | | 257 | | | 20.3 | |
| | | | | | | | | |
Basic income(1) | | 5,094 | | | 4,750 | | | 7.2 | |
Gains on financial assets and liabilities (net) | | 108 | | | 55 | | | 96.3 | |
| | | | | | | | | |
Gross income | | 5,203 | | | 4,805 | | | 8.3 | |
Sales and income from the provision of non-financial services | | 23 | | | 27 | | | (16.2 | ) |
Personnel expenses and other administrative expenses | | (2,250 | ) | | (2,179 | ) | | 3.2 | |
Depreciation and amortization | | (103 | ) | | (107 | ) | | (3.9 | ) |
Other operating income and expenses (net) | | 49 | | | 36 | | | 35.6 | |
| | | | | | | | | |
Net operating income | | 2,922 | | | 2,583 | | | 13.1 | |
Impairment losses (net) | | (474 | ) | | (409 | ) | | 15.9 | |
Net loan loss provisions | | (476 | ) | | (409 | ) | | 16.3 | |
Other writedowns | | 2 | | | — | | | n.m. | (2) |
Provision expense (net) | | — | | | (4 | ) | | n.m. | (2) |
Other gains and losses (net) | | 21 | | | 12 | | | 80.4 | |
Gains on disposals of investments | | 11 | | | 3 | | | n.m. | (2) |
Other | | 10 | | | 9 | | | 14.5 | |
| | | | | | | | | |
Income before tax | | 2,469 | | | 2,181 | | | 13.2 | |
Income tax | | (852 | ) | | (751 | ) | | 13.4 | |
| | | | | | | | | |
Income from ordinary activities | | 1,618 | | | 1,430 | | | 13.1 | |
Income attributed to minority interests | | (4 | ) | | (4 | ) | | 13.1 | |
| | | | | | | | | |
Income attributed to the group | | 1,614 | | | 1,427 | | | 13.1 | |
| | | | | | | | | |
| (1) | Basic income for this business area consists of net interest income, share of profit of entities accounted for using the equity method and net fees and commissions. Basic income is not a line item in our Consolidated Financial Statements. |
Net Interest Income
Net interest income of this business area for 2005 amounted to €3,182 million for 2005, a 5.6% increase from €3,015 million in 2004, principally due to an increase in this business area’s overall business volume, which was driven mainly by increases in loans and advances to customers, primarily individuals and in the real estate
63
and construction sectors. Low interest rates in Spain during 2005 reduced the spread between the interest we paid on interest-bearing liabilities, principally deposits, and the interest we earned on our interest-earning assets, principally loans, in Spain. This low yield spread was offset by the significant increase in business volume in Spain during 2005.
Net Fee and Commission Income
Net fee and commission income of this business area for 2005 amounted to €1,602 million, an increase of 8.5% from €1,477 million in 2004, principally attributable to a 12.1% increase in fee and commission income for banking services to €922 million in 2005 from €822 million in 2004 due to increased transaction volumes, a 3.9% increase in fee and commission income from mutual and pension fund management to €680 million in 2005 from €654 million in 2004 due to an increase in funds under management and a 20.3% increase in fee and commission income from the development and distribution of insurance products to €309 million in 2005 from €257 million in 2004 as a result of our cross-selling efforts to our retail banking customers.
Basic Income
Basic income of this business area for 2005 amounted to €5,094 million, an increase of 7.2% from €4,750 million in 2004, principally attributable to the increases in net interest income and net fee and commission income and, to a lesser extent, an increase in insurance activity income.
Gross Income
As a result of the foregoing, gross income of this business area for 2005 amounted to €5,203 million, an increase of 8.3% compared to €4,805 million in 2004.
Personnel and Other Administrative Expenses
Personnel and other administrative expenses of this business area for 2005 amounted to €2,250 million, an increase of 3.2% compared to €2,179 million in 2004, despite an increase of 161 branches in our branch network in Spain and Portugal in 2005, reflecting continued savings achieved through our efficiency plans.
As a result of the foregoing, the efficiency ratio of this business area was 41.4% in 2005 compared to 43.4% in 2004. Including depreciation and amortization expense of this business area, the efficiency ratio of this business area was 43.3% in 2005 compared to 45.6% in 2004.
Net Operating Income
Net operating income of this business area for 2005 was €2,922 million, a 13.1% increase from €2,583 million in 2004.
Impairment Losses (Net)
Impairment losses (net) of this business area for 2005 was €474 million, a 15.9% increase from €409 million in 2004, mainly due to a 16.3% increase in net loan loss provisions to €476 million in 2005 from €409 million in 2004. The increase in loan loss provisions was principally due to an increase in the size of our loan portfolio. The Retail Banking in Spain and Portugal business area’s non-performing loan ratio was 0.62% at December 31, 2005 compared to 0.82% at December 31, 2004.
Income Attributed to the Group
As a result of the foregoing, income attributed to the group from this business area for 2005 was €1,614 million, an increase of 13.1% from €1,427 million in 2004.
64
Wholesale and Investment Banking
| | | | | | | | | |
| | | Year ended
December 31, | | | Change | |
| | | 2005 | | | 2004 | | | 2005/2004 | |
| | | (in millions of euros) | | | (in percentages) | |
Net interest income | | 440 | | | 423 | | | 4.1 | |
Share of profit of entities accounted for using the equity method | | 51 | | | 104 | | | (50.9 | ) |
Net fee and commission income | | 227 | | | 190 | | | 19.2 | |
Insurance activity income | | — | | | — | | | — | |
| | | | | | | | | |
Basic income(1) | | 718 | | | 717 | | | 0.1 | |
Gains on financial assets and liabilities (net) | | 418 | | | 196 | | | 113.0 | |
| | | | | | | | | |
Gross income | | 1,136 | | | 914 | | | 24.4 | |
Sales and income from the provision of non-financial services | | 95 | | | 81 | | | 17.4 | |
Personnel expenses and other administrative expenses | | (360 | ) | | (324 | ) | | 11.1 | |
Depreciation and amortization | | (7 | ) | | (7 | ) | | 5.4 | |
Other operating income and expenses (net) | | 22 | | | (2 | ) | | n.m. | (2) |
| | | | | | | | | |
Net operating income | | 886 | | | 662 | | | 33.9 | |
Impairment losses | | (115 | ) | | (233 | ) | | (50.8 | ) |
Net loan loss provisions | | (114 | ) | | (233 | ) | | (50.8 | ) |
Other writedowns | | — | | | — | | | n.m. | (2) |
Provision expense (net) | | 5 | | | 6 | | | (18.1 | ) |
Other gains and losses (net) | | 29 | | | 57 | | | (49.1 | ) |
Gains on disposals of investments | | 16 | | | 41 | | | (60.3 | ) |
Other | | 13 | | | 16 | | | (19.5 | ) |
| | | | | | | | | |
Income before tax | | 806 | | | 493 | | | 63.7 | |
Income tax | | (211 | ) | | (85 | ) | | 148.7 | |
| | | | | | | | | |
Income from ordinary activities | | 596 | | | 408 | | | 46.0 | |
Income attributed to minority interests | | (4 | ) | | (4 | ) | | (10.1 | ) |
| | | | | | | | | |
Income attributed to the group | | 592 | | | 404 | | | 46.6 | |
| | | | | | | | | |
| (1) | Basic income for this business area consists of net interest income, share of profit of entities accounted for using the equity method and net fees and commissions. Basic income is not a line item in our Consolidated Financial Statements. |
Net Interest Income
Net interest income of this business area for 2005 amounted to €440 million for 2005, a 4.1% increase from €423 million in 2004, principally due to an increase in lending to corporate customers.
Net Fee and Commission Income
Net fee and commission income of this business area for 2005 amounted to €227 million, an increase of 19.2% from €190 million in 2004, principally due to an increase in underwriting fees and commissions and fee income from wholesale banking services.
Basic Income
Basic income of this business area for 2005 remained stable at €718 million compared to €717 million in 2004, principally attributable to the increases in net interest income and net fee and commission income, offset in
65
part by a decrease in share of profit of entities accounted for using the equity as a result of the sale of our interests in certain entities accounted for by the equity method in 2004.
Gains on Financial Assets and Liabilities (Net)
Gains on financial assets and liabilities (net) of this business area for 2005 amounted to €418 million, an increase of 113.0% from €196 million in 2004, mainly attributable to gains on derivatives held for trading purposes.
Gross Income
As a result of the foregoing, gross income of this business area for 2005 amounted to €1,136 million, an increase of 24.4% compared to €914 million in 2004.
Personnel and Other Administrative Expenses
Personnel and other administrative expenses of this business area for 2005 amounted to €360 million, an increase of 11.1% compared to €324 million in 2004, mainly due to an increase in business activity and an increase in the average number of employees in 2005.
As a result of the foregoing, the efficiency ratio of this business area was 29.2% in 2005 compared to 32.5% in 2004. Including depreciation and amortization expense of this business area, the efficiency ratio of this business area was 29.7% in 2005 compared to 33.2% in 2004.
Net Operating Income
Net operating income of this business area for 2005 was €886 million, a 33.9% increase from €662 million in 2004.
Impairment Losses (Net)
Impairment losses (net) of this business area for 2005 was €115 million, a 50.8% decrease from €233 million in 2004, mainly due to the lower level of defaults in 2005. The Wholesale and Investment Banking business area’s non-performing loan ratio was 0.18% at December 31, 2005 compared to 0.30% at December 31, 2004.
Other Gains and Losses (Net)
Other gains (net) of this business area for 2005 was €16 million, a 60.3% decrease from €41 million in 2004. Other gains (net) of this business area for 2004 reflected gains on the sale of our holdings in Grubarges Inversión Hotelera, S.L. (€26.3 million) and Vidrala, S.A. (€19.3 million).
Income Attributed to the Group
As a result of the foregoing, income attributed to the group from this business area for 2005 was €592 million, an increase of 46.6% from €404 million in 2004.
The Americas
As discussed above under “—Factors Affecting the Comparability of our Results of Operations and Financial Condition”, in 2005, the appreciation of the currencies of the Latin American countries in which we operate against the euro positively affected, to a limited extent, the results of operations of our Latin American subsidiaries in euro terms. By contrast, in 2004, the depreciation of the currencies of the Latin American countries in which we operate against the euro negatively affected the results of operations of our Latin American subsidiaries in euro terms.
In addition, the results of operations of this business area were impacted by the acquisition of Hipotecaria Nacional, S.A. de C.V. in January 2005, the acquisition of Laredo National Bancshares, Inc. in April 2005 and the acquisition of an approximately 99% interest in Banco Granahorrar, S.A. in December 2005, each of which are consolidated in our Consolidated Financial Statements as from their respective date of acquisition.
66
| | | | | | | | | | | | |
| | | Year ended
December 31, | | | Change | |
| | | 2005 | | | 2004 | | | 2005/2004 | | | 2005/2004(1) | |
| | | (in millions of euro) | | | (in percentages) | |
Net interest income | | 3,797 | | | 2,865 | | | 32.6 | | | 29.4 | |
Share of profit of entities accounted for using the equity method | | (1 | ) | | — | | | n.m. | (2) | | n.m. | (2) |
Net fee and commission income | | 2,056 | | | 1,735 | | | 18.5 | | | 15.1 | |
Insurance activity income | | 241 | | | 171 | | | 40.7 | | | 35.0 | |
| | | | | | | | | | | | |
Basic income(3) | | 6,092 | | | 4,771 | | | 27.7 | | | 24.3 | |
Gains on financial assets and liabilities (net) | | 349 | | | 248 | | | 40.7 | | | 37.9 | |
| | | | | | | | | | | | |
Gross income | | 6,441 | | | 5,019 | | | 28.3 | | | 25.0 | |
Sales and income from the provision of non-financial services | | 6 | | | 4 | | | 65.2 | | | 59.1 | |
Personnel expenses and other administrative expenses | | (2,767 | ) | | (2,221 | ) | | 24.6 | | | 21.4 | |
Depreciation and amortization | | (226 | ) | | (226 | ) | | (0.1 | ) | | (3.6 | ) |
Other operating income and expenses (net) | | (163 | ) | | (144 | ) | | 13.3 | | | 10.5 | |
| | | | | | | | | | | | |
Net operating income | | 3,291 | | | 2,431 | | | 35.4 | | | 31.9 | |
Impairment losses | | (394 | ) | | (310 | ) | | 27.2 | | | 20.7 | |
Net loan loss provisions | | (359 | ) | | (310 | ) | | 15.7 | | | 9.8 | |
Other writedowns | | (36 | ) | | — | | | n.m. | (2) | | n.m. | (2) |
Provision expense (net) | | (132 | ) | | (187 | ) | | (29.5 | ) | | (30.8 | ) |
Other gains and losses (net) | | 3 | | | 2 | | | 69.4 | | | n.m. | (2) |
Gains on disposals of investments | | 2 | | | 16 | | | (87.7 | ) | | (88.0 | ) |
Other | | 1 | | | (14 | ) | | n.m. | (2) | | n.m. | (2) |
| | | | | | | | | | | | |
Income before tax | | 2,768 | | | 1,936 | | | 43.0 | | | 39.9 | |
Income tax | | (725 | ) | | (534 | ) | | 36.0 | | | 31.8 | |
| | | | | | | | | | | | |
Income from ordinary activities | | 2,043 | | | 1,402 | | | 45.7 | | | 43.0 | |
Income attributed to minority interests | | (223 | ) | | (208 | ) | | 7.5 | | | 9.1 | |
| | | | | | | | | | | | |
Income attributed to the group | | 1,820 | | | 1,195 | | | 52.3 | | | 48.7 | |
| | | | | | | | | | | | |
| (1) | At constant exchange rates from 2004. |
| (3) | Basic income for this business area consists of net interest income, share of profit of entities accounted for using the equity method, net fee and commission income and insurance activity income. Basic income is not a line item in our Consolidated Financial Statements. |
Net Interest Income
Net interest income of this business area for 2005 amounted to €3,797 million for 2005, a 32.6% increase from €2,865 million in 2004, principally due to an increase in both interest rates and business volume in Latin America, most significantly in Mexico, which resulted in a higher yield spread.
Net Fee and Commission Income
Net fee and commission income of this business area for 2005 amounted to €2,056 million, an increase of 18.5% from €1,735 million in 2004, principally due to an increase in fee and commission income from mutual and pension fund management and an increase in fee income from retail banking services.
67
Insurance Activity Income
Insurance activity income of this business area for 2005 was €241 million, an increase of 40.7% from €171 million in 2004, principally due to an growth in our insurance business.
Basic Income
Basic income of this business area for 2005 amounted to €6,092 million, an increase of 27.7% from €4,771 million in 2004, principally attributable to the increases in net interest income and net fee and commission income and, to a lesser extent, an increase in insurance activity income.
Gains on Financial Assets and Liabilities (Net)
Gains on financial assets and liabilities (net) of this business area for 2005 amounted to €349 million, an increase of 40.7% from €248 million in 2004, mainly as a result of gains on derivatives held for trading purposes, gains from available-for-sale financial assets and gains from securities held for trading purposes attributable to favorable conditions in the capital markets in the second half of 2005.
Gross Income
As a result of the foregoing, gross income of this business area for 2005 amounted to €6,441 million, an increase of 28.3% compared to €5,019 million in 2004.
Personnel and Other Administrative Expenses
Personnel and other administrative expenses of this business area for 2005 amounted to €2,767 million, an increase of 24.6% compared to €2,221 million in 2004, mainly due to increased business activity as well and the consolidation of Hipotecaria Nacional, S.A. de C.V., Laredo National Bancshares, Inc. and Banco Granahorrar, S.A. in 2005.
As a result of the foregoing, the efficiency ratio of this business area was 42.9% in 2005 compared to 44.2% in 2004. Including depreciation and amortization expense of this business area, the efficiency ratio of this business area was 46.4% in 2005 compared to 48.7% in 2004.
Net Operating Income
Net operating income of this business area for 2005 was €3,291 million, a 35.4% increase from €2,431 million in 2004.
Impairment Losses (Net)
Impairment losses (net) of this business area for 2005 was €394 million, a 27.2% increase from €310 million in 2004, mainly due to a 15.7% increase in net loan loss provisions to €359 million in 2005 from €310 million in 2004. The increase in loan loss provisions was principally due to an increase in the size of our loan portfolio, though the rate of growth of net loan loss provisions for this business area in 2005 was less than the rate of growth of the loan portfolio of this business area in that year. The Americas business area’s non-performing loan ratio was 2.67% in 2005 compared to 3.44% in 2004.
Income Attributed to the Group
As a result of the foregoing, income attributed to the group from this business area for 2005 was €1,820 million, an increase of 52.3% from €1,195 million in 2004.
68
Corporate Activities
| | | | | | | | | |
| | | Year ended
December 31, | | | Change | |
| | | 2005 | | | 2004 | | | 2005/2004 | |
| | | (in millions of euros) | | | (in percentages) | |
Net interest income | | (212 | ) | | (143 | ) | | 47.8 | |
Share of profit of entities accounted for using the equity method | | 71 | | | (8 | ) | | n.m. | (1) |
Net fee and commission income | | 56 | | | 11 | | | n.m. | (1) |
Insurance activity loss | | (63 | ) | | (38 | ) | | 68.0 | |
| | | | | | | | | |
Basic loss(2) | | (148 | ) | | (178 | ) | | (16.7 | ) |
Gains on financial assets and liabilities (net) | | 391 | | | 560 | | | (30.1 | ) |
| | | | | | | | | |
Gross income | | 243 | | | 382 | | | (36.4 | ) |
Sales and income from the provision of non-financial services | | 2 | | | 15 | | | (86.5 | ) |
Personnel expenses and other administrative expenses | | (386 | ) | | (374 | ) | | 3.3 | |
Depreciation and amortization | | (113 | ) | | (108 | ) | | 4.1 | |
Other operating income and expenses (net) | | (23 | ) | | — | | | n.m. | (1) |
| | | | | | | | | |
Net operating loss | | (277 | ) | | (85 | ) | | 224.7 | |
Impairment losses | | 129 | | | (6 | ) | | n.m. | (1) |
Net loan loss provisions | | 136 | | | 168 | | | (19.0 | ) |
Other writedowns | | (7 | ) | | (174 | ) | | (95.8 | ) |
Provision expense (net) | | (328 | ) | | (666 | ) | | (50.8 | ) |
Other gains and losses (net) | | 24 | | | 285 | | | (91.6 | ) |
Gains on disposals of investments | | — | | | 249 | | | n.m. | (1) |
Other | | 24 | | | 36 | | | (31.6 | ) |
Loss before tax | | (452 | ) | | (472 | ) | | (4.4 | ) |
Income tax | | 266 | | | 340 | | | (21.7 | ) |
Loss from ordinary activities | | (185 | ) | | (132 | ) | | 40.2 | |
| | | | | | | | | |
Income or loss attributed to minority interests | | (33 | ) | | 30 | | | n.m. | (1) |
| | | | | | | | | |
Loss attributed to the group | | (219 | ) | | (102 | ) | | 113.3 | |
| | | | | | | | | |
| (2) | Basic income/(loss) for this business area consists of net interest income/(expense), share of profit/(loss) of entities accounted for using the equity method, net fee and commission income and insurance activity income/(loss). Basic income/(loss) is not a line item in our Consolidated Financial Statements. |
Net Interest Income/(Expense)
Net interest expense of this business area for 2005 amounted to €212 million for 2005, a 47.8% increase from €143 million in 2004, principally due to increased costs relating to derivatives we enter into to hedge exchange rate risk in Latin America.
Share of Profit/(Loss) of Entities Accounted for Using the Equity Method
Share of profit of entities accounted for using the equity method of this business area for 2005 amounted to €71 million compared to share of loss of entities accounted for using the equity method of this business area for 2004 of €8 million. Share of profit of entities accounted for using the equity method of this business area for 2005 related principally to our share of the profit in 2005 of Banca Nazionale del Lavoro, S.p.A., which had losses in 2004.
69
Basic Income/(Loss)
Basic loss of this business area for 2005 amounted to €148 million, a decrease of 16.7% from €178 million in 2004, principally attributable to share of profit of entities accounted for using the equity method and an increase in net fee and commission income, offset in part by an increase in net interest expense.
Gains on Financial Assets and Liabilities (Net)
Gains on financial assets and liabilities (net) of this business area for 2005 amounted to €391 million, a decrease of 30.1% from €560 million in 2004. Gains on financial assets and liabilities (net) in 2004 reflected gains on the sale of shares of Acerinox S.A
Gross Income
As a result of the foregoing, gross income of this business area for 2005 amounted to €243 million, a decrease of 36.4% compared to €382 million in 2004.
Net Operating Income/(Loss)
Net operating loss of this business area for 2005 was €277 million, a 224.7% increase from €85 million in 2004.
Impairment Losses (Net)
Recoveries of impairment losses in this business area for 2005 was €129 million compared to impairment losses (net) of €6 million in 2004. Impairment losses (net) in 2004 mainly reflected the amortization of €193 million of goodwill relating to Banca Nazionale del Lavoro, S.p.A., €145 million of which corresponded to the early amortization of goodwill relating to this entity in the fourth quarter of 2004.
Other Gains and Losses (Net)
Other gains and losses (net) of this business area for 2005 was €24 million, a 91.6% decrease from €285 million in 2004. Other gains (net) of this business area in 2004 mainly reflected gains relating to the sale of shares of Banco Atlántico and Direct Seguros.
Income/(Loss) Attributed to the Group
As a result of the foregoing, loss attributed to the group from this business area for 2005 was €219 million, an increase of 113.3% from €102 million in 2004.
Material Differences between U.S. GAAP and EU-IFRS
As of December 31, 2005 and 2004, our Consolidated Financial Statements have been prepared in accordance with EU-IFRS, which differ in certain respects from U.S. GAAP. The tables included in Note 59 to our Consolidated Financial Statements give the effect that application of U.S. GAAP would have on income for the year and shareholders’ equity as reported under IFRS.
The transition of the Group’s consolidated financial statements to IFRS has been carried out by applying IFRS 1: First-Time Adoption of International Financial Reporting Standards, being January 1, 2004 the beginning of the earliest period presented for comparative purposes under the new accounting standards. This date is considered as the date of transition to IFRS.
As a general rule, the IFRS in force at December 31, 2005 must be applied retrospectively to prepare an opening balance sheet at the date of transition and all following periods. IFRS 1 provides for certain exemptions from full retrospective application of IFRS in the opening balance sheet. The main exemptions are disclosed in Note 3 to our Consolidated Financial Statements.
70
Reconciliation to U.S. GAAP
Shareholders’ equity would have been €25,375 million at December 31, 2005 under U.S. GAAP compared to €16,330 million at December 31, 2005 under IFRS, while shareholders’ equity would have been €23,465 million at December 31, 2004 under U.S. GAAP compared to €13,068 million at December 31, 2004 under IFRS. The increase in shareholders’ equity under U.S. GAAP at December 31, 2005 and December 31, 2004 as compared with shareholders’ equity under IFRS at each of those dates is principally due to the goodwill that arose from the business combinations with Argentaria (2000) and Bancomer (2004). See Note 59 to our Consolidated Financial Statements.
Net income would have been €2,018 million in 2005 under U.S. GAAP compared to income attributed for the year of €3,086 million in 2005 under IFRS, while net income would have been €3,095 million in 2004 under U.S. GAAP compared to income for the year of €2,923 million in 2004 under IFRS. The decrease in net income in 2005 under U.S. GAAP as compared with income attributed for the year in 2005 under IFRS is principally due to the application of IFRS-1 principals for the first-time adoption of IFRS. Pursuant to IFRS-1, we have taken certain charges to shareholders’ equity as of January 1, 2004, while under U.S. GAAP we have taken these charges to shareholders’ equity as of January 1, 2005. See note 59.
See note 59 to our Consolidated Financial Statements for a quantitative reconciliation of net income and shareholders’ equity from IFRS to U.S. GAAP.
B. Liquidity and Capital Resources
Our principal source of funds is our customer deposit base, which consists primarily of demand, savings and time deposits. In addition to relying on our customer deposits, we also access the interbank market (overnight and time deposits) and domestic and international capital markets for our additional liquidity requirements. To access the capital markets, we have in place a series of domestic and international programs for the issuance of commercial paper and medium- and long-term debt. We also generally maintain a diversified portfolio of liquid assets and securitized assets. Another source of liquidity is our generation of cash flow. Finally, we supplement our funding requirements, to a very limited extent, with borrowings from the Bank of Spain, mostly short-term and at market interest rates, which is a common practice in Spain.
The following table shows the balances at December 31, 2005 and 2004 of our principal sources of funds:
| | | | |
| | | 2005 | | 2004 |
| | | (in millions of euro) |
Customer deposits | | 182,179 | | 149,075 |
Due to credit entities | | 66,315 | | 64,349 |
Debt securities in issue | | 76,565 | | 57,810 |
Total | | 325,059 | | 271,234 |
Deposit Base
Our total customer funds (customer deposits, excluding assets sold under repurchase agreements, marketable debt securities and subordinated debt) amounted to €160 billion as of December 31, 2005, an increase of 21.6% from €132 billion as of December 31, 2004. Including assets sold under repurchase agreements, customer funds amounted to €182 billion as of December 31, 2005, an increase of 22.2% from €149 billion as of December 31, 2004. Customer funds increased principally due to an increase in time deposits and savings accounts from customers outside Spain.
Interbank and Capital Markets
We have increased debt issuances in the domestic and international capital markets in order to finance our activities and as of December 31, 2005, we had €60,887 million of senior debt outstanding, comprising €53,469 million in bonds and debentures and €7,418 million in promissory notes and other securities, compared to €44,203 million, €37,830 million and €6,372 million outstanding as of December 31, 2004, respectively. See Note 26.4 to the Consolidated Financial Statements. A total of €9,179 million in subordinated debt and €4,127 million in preferred stock issued or guaranteed by Banco Bilbao Vizcaya Argentaria S.A. was outstanding as of December 31,
71
2005, compared to €8,100 million and €3,809 million outstanding as of December 31, 2004, respectively. See Note 26.5 to the Consolidated Financial Statements.
The average maturity of our outstanding debt as of December 31, 2005 was the following:
| | |
Senior debt | | 2 years |
Subordinated debt | | 8 years |
The cost and availability of debt financings are influenced by credit ratings. A reduction in these ratings could increase the cost of, and reduce our access to, debt financing. As of December 31, 2005, our credit ratings were as follows:
| | | | | | |
| | | Short Term | | Long Term | | Financial Strength |
Moody’s | | P1 | | Aa2 | | B+ |
Fitch—IBCA | | F1+ | | AA- | | B |
Standard & Poor’s | | A1+ | | AA- | | — |
Generation of Cash Flow
We operate in Spain and over 20 other countries, mainly in Europe and Latin America. Other than in Argentina and Venezuela, we are not aware of any legal or economic restrictions on the ability of our subsidiaries to transfer funds to our parent company in the form of cash dividends, loans or advances, capital repatriation or otherwise. There is no assurance that in the future such restrictions will not be adopted or that, if adopted, they will not negatively affect our liquidity. The geographic diversification of our businesses, however, limits the effect of any restrictions that could be adopted in any given country.
We believe that our working capital is sufficient for our present requirements and to pursue our planned business strategies.
Capital
Under the Bank of Spain’s capital adequacy regulations, as of December 31, 2005 and 2004, we were required to have a ratio of consolidated stockholders’ equity to risk-weighted assets and off-balance sheet items (net of certain amounts) of not less than 8%.
As of December 31, 2004, this ratio was 10.67% and our shareholders’ equity exceeded the minimum level required by 33%. As of December 31, 2005, this ratio was 9.26% and our shareholders’ equity exceeded the minimum level required by 16%. However, based purely on the framework of the Basel Accord and using such additional assumptions as we consider appropriate, we have estimated that as of December 31, 2004 and 2005 our consolidated Tier I risk-based capital ratio was 8.1% and 7.5%, respectively, and our consolidated total risk-based capital ratio (consisting of both Tier I capital and Tier II capital) was 12.5% and 12.0%, respectively. The Basel Accord recommends that these ratios be at least 4% and 8%, respectively.
For qualitative and quantitative information on the principal risks we face, including market, credit, liquidity, operational and legal risks, see “Item 11. Quantitative and Qualitative Disclosures About Market Risk”.
C. Research and Development, Patents and Licenses, etc.
In 2005, the BBVA Group continued to foster the use of new technologies as a key component of its global development strategy. It explored new business and growth opportunities, focusing on three major areas: emerging technologies; asset capture/exploitation; and the customer as the focal point of its banking business.
We did not incur in significant research and development expenses in 2003, 2004 and 2005.
72
D. Trend Information
The European financial services sector is likely to remain competitive with increasing numbers of providers of financial services and alternative distribution channels. Further consolidation in the sector (through mergers, acquisitions or alliances) is likely as the other major banks look to increase their market share or combine with complementary businesses. It is foreseeable that regulatory changes will take place in the future that will diminish barriers to such consolidation transactions.
The following are the most important trends, uncertainties and events that are reasonably likely to have a material adverse effect on us or that would cause the financial information disclosed herein not to be indicative of our future operating results or financial condition:
| | • | | uncertainties relating to economic growth expectations and interest rate cycles, especially in the United States, where the high current account deficit of the U.S economy may translate into an upward adjustment of risk premium and higher global interest rates, and the impact they may have over the yield curve and exchange rates. In this scenario, the Spanish economy could perform similarly to how it performed during the recession at the beginning of the 1990s; |
| | • | | the effect that an economic slowdown may have over Latin American markets and fluctuations in local interest and exchange rates; |
| | • | | the chance that a worsening in the macroeconomic environment will further deteriorate the quality of credit. In the short-term, oil prices are expected to remain high, representing a negative factor to employment; |
| | • | | a downturn in capital markets or a downturn in investor confidence, linked to factors such as geopolitical risk; |
| | • | | inflationary pressures and the resulting negative effect they may have on interest rates and economic growth; |
| | • | | although it is foreseeable that entry barriers to domestic markets in Europe will be lowered, our plans for expansion into other European markets could be affected by entry barriers in such countries; and |
| | • | | a severe decline in housing prices in the various countries where we hold mortgages over residential homes as collateral. |
E. Off-Balance Sheet Arrangements
In addition to loans, we had outstanding the following contingent liabilities and commitments at the dates indicated:
| | | | |
| | | At December 31, |
| | | 2005 | | 2004 |
| | | (in millions of euro) |
Contingent liabilities: | | | | |
Rediscounts, endorsements and acceptances | | 42 | | 39 |
Guarantees and other sureties | | 25,790 | | 17,574 |
Other contingent liabilities | | 4,030 | | 3,945 |
| | | | |
Total contingent liabilities | | 29,862 | | 21,558 |
| | | | |
Commitments: | | | | |
Balances drawable by third parties: | | | | |
Credit entities | | 2,816 | | 2,665 |
Public authorities | | 3,128 | | 1,638 |
Other domestic customers | | 36,063 | | 29,617 |
Foreign customers | | 42,994 | | 26,797 |
| | | | |
Total balances drawable by third parties | | 85,001 | | 60,717 |
Other commitments | | 4,497 | | 6,045 |
| | | | |
Total commitments | | 89,498 | | 66,762 |
| | | | |
Total contingent liabilities and commitments | | 119,360 | | 88,320 |
| | | | |
73
In addition to the contingent liabilities and commitments described above, the following table provides information regarding off-balance-sheet funds managed by us as of December 31, 2005 and 2004:
| | | | |
| | | As of December 31, |
| | | 2005 | | 2004 |
| | | (in millions of euro) |
Mutual funds | | 59,003 | | 51,040 |
Pension funds | | 53,959 | | 41,491 |
Other managed assets | | 30,926 | | 31,968 |
| | | | |
Total | | 143,888 | | 124,499 |
| | | | |
Our off-balance sheet funds increased in 2005 principally due to the launch of new products and the positive change in market trends over the course of 2005.
See Note 42 to the Consolidated Financial Statements for additional information with respect to our off-balance sheet arrangements.
Agreement with Terra Networks
In connection with the agreement by Banco Bilbao Vizcaya Argentaria, S.A. and Terra Networks (subsequently merged into Telefónica, S.A.) to integrate Uno-e Bank and the individual consumer financing business of Finanzia (part of the Retail Banking in Spain and Portugal business area), Banco Bilbao Vizcaya Argentaria, S.A. entered into an agreement with Terra Networks which gives Terra Networks (or its successor) a liquidity mechanism over its shares in the combined entity and that replaces a previous liquidity mechanism entered into on May 15, 2002. The current liquidity mechanism provides Terra Networks (or its successor) the right to sell its stake in Uno-e Bank to Banco Bilbao Vizcaya Argentaria, S.A. between April 1, 2005 and September 30, 2007 at a price equal to the higher of (i) the market value of the securities as determined by an investment bank, and (ii) the amount obtained by multiplying (a) the after-tax profits of Uno-e Bank times (b) Banco Bilbao Vizcaya Argentaria, S.A. price/earnings ratio times (c) the percentage holding in Uno-e Bank that Terra Networks (or its successor) intends to sell. However, in no event can the sale price under (i) or (ii) above be less than €148.5 million if Uno-e Bank does not achieve certain net ordinary revenue and pre-tax income targets.
F. Tabular Disclosure of Contractual Obligations
Our consolidated contractual obligations as of December 31, 2005 are as follows:
| | | | | | | | |
| | | Less Than
One Year | | One to Five
Years | | Over
Five Years | | Total |
| | | (in millions of euro) |
Senior debt | | 37,803 | | 16,326 | | 8,713 | | 62,842 |
Subordinated debt | | 1,139 | | 947 | | 11,637 | | 13,723 |
Capital lease obligations | | — | | — | | — | | — |
Operating lease obligations | | 86 | | 9 | | 27 | | 122 |
Purchase obligations | | 21 | | 170 | | — | | 191 |
| | | | | | | | |
Total (*) | | 39,049 | | 17,452 | | 20,377 | | 76,878 |
| | | | | | | | |
| (*) | Interest to be paid are not included. |
74
| ITEM 6. | DIRECTORS, SENIOR MANAGEMENT AND EMPLOYEES |
The BBVA board of directors is very conscious of the importance of a good corporate governance system to run the structure and operation of its corporate bodies in the best interests of the company and its shareholders.
Thus, the bank’s board of directors is subject to regulations that reflect and develop the principles and elements that have shaped BBVA’s system of corporate governance. These comprise standards for the internal regime and operation of the board and its committees, as well as the rights and obligations of directors in pursuit of their duties, which are contained in the directors charter. Shareholders and investors may find these on the company website (www.bbva.com).
The Annual General Meeting has its own set of regulations on issues such as how it operates and what rights shareholders enjoy regarding AGMs. These establish the possibility of exercising or delegating votes over remote communication media.
The board of directors has also approved a report on Corporate Governance for the year ended December 31, 2005, according to the guidelines laid down in prevailing disclosure regulations for listed companies. It can be found on the BBVA website.
This site was created as an instrument to facilitate information and communication with shareholders. It provides special direct access to all information considered relevant to BBVA’s corporate governance system, laid out in a clear, readable manner.
A. Directors and Senior Management
BBVA is managed by a Board of Directors, which, in accordance with BBVA’s current bylaws (Estatutos), must consist of no less than 9 and no more than 16 members. In accordance with the resolutions approved by the General Shareholders’ Meeting on March 18, 2006, we currently have 15 directors.
Directors are appointed to the Board of Directors by our shareholders. All members of the Board of Directors are elected to serve five-year terms. One-fifth of the members are subject to re-election every year by the shareholders at a general meeting. Directors must resign at the age of 70. The Chairman of the Board must resign his or her chairmanship upon reaching the age of 65, but may continue to serve as a director thereafter, until reaching the age of 70. The President and Chief Operating Officer and other executive directors must resign from their management positions upon reaching the age of 62, at which point they must also submit their resignation as directors to the Board of Directors. The Board of Directors may nonetheless determine that such executive directors may continue to serve on the Board of Directors.
One of the characteristic elements of BBVA’s Corporate Governance System is to have a majority of independent directors on its governing bodies, especially on the Board of Directors. We consider directors to be independent when they do not hold any other position with BBVA or any of our subsidiaries and they:
| | • | | do not own, directly or indirectly, over 3% of our shares and have not been appointed by a shareholder holding over 3% of our shares; |
| | • | | are not an entity designated to serve on our Board of Directors, or a representative of any such entity, which holds one or more directorships (an institutional director); |
| | • | | have not served as an executive officer, an executive director or as an employee of BBVA’s external auditor, in each case within the last three years; |
| | • | | do not have a significant relationship with BBVA, directly or as a partner, shareholder, manager or employee of an entity that has such a relationship, where the relationship could be considered to affect such director’s independence; |
75
| | • | | do not have a family relationship with any director failing to meet the criteria described above and |
| | • | | do not possess any other quality or characteristic that, in the judgment of the Board of Directors, might compromise such director’s independence. |
An institutional director is an external director designated by virtue of her or his relationship with a person or entity that is a significant shareholder of BBVA. For this purpose we consider a significant shareholder to be a person or entity that owns, directly or indirectly, at least 5% of the share capital or voting rights of BBVA. If a lower percentage of shares or voting rights allows such person or entity to exercise significant influence over BBVA, such person or their designee shall also be considered an institutional director.
Regulations of the Board of Directors
The following discussion provides a brief description of several significant matters covered in the Regulations of the Board of Directors.
Appointment and Re-election of Directors
The Regulations of the Board of Directors provide that the qualifications of the persons proposed for appointment as directors shall be assessed by the Appointments and Compensation Committee of the Board of Directors with due reference to the candidates’ personal and professional attributes, as well as the needs of BBVA’s governing bodies.
When proposals for re-electing directors are made, the Board of Directors will evaluate the performance of directors proposed for a further term, their dedication, and such other considerations that may affect the advisability of reelecting such directors.
Term of Directorships
Directors shall retire from their directorships at the age of 70 except our Chairman and Chief Executive Officer who shall retire from his executive position at the age of 65, but may continue to serve on the Board of Directors until reaching age 70. Resignation should occur in the first session of the Board of Directors to be held after the General Shareholders’ Meeting that approves the accounts for the year in which a director reaches age 65 or 70 as the case may be.
Executive directors, other than our Chairman and Chief Executive Officer, are required to resign from their management positions at the age of 62, following the same timing rules as established in the paragraph above. Following such resignation, the executive director shall place his or her directorship at the disposal of the Board of Directors, which may agree that they should continue to serve as a member of the Board of Directors, notwithstanding their resignation from their executive position.
One-fifth of the members of the Board of Directors shall be elected by the General Shareholders’ Meeting each year. Directors may serve an unlimited number of terms.
Performance of Directors’ Duties
The members of the Board of Directors shall carry out the duties inherent in their directorship and membership on any Board Committee in accordance with applicable law, BBVA’s bylaws, the Regulations of the Board of Directors and resolutions adopted by BBVA’s Board of Directors.
Each director will be required to attend the meetings of the Board of Directors and Committees of which he or she is a member, except in cases duly justified, and participate in the deliberations, discussions and debates thereof with regard to the matters which arise at such meetings.
76
The directors shall have sufficient information to be able to form opinions on issues raised by the Board of Directors and its Committees, and the information shall be furnished as far in advance as required. Additionally, directors may propose to the Board of Directors that external experts be consulted to assist the Board to consider matters of special complexity or importance.
Directors shall keep confidential the deliberations of the Board of Directors and the Committees of which he or she is a member, and all information to which they may have access in the discharge of their duties, which they shall use exclusively in pursuit of their duties and with due diligence. Directors’ obligation of confidentiality shall remain in force after they have ceased to serve on the Board of Directors.
Ethics and Code of Conduct
Directors shall behave ethically in their activities and in good faith, consistent with applicable statutory, requirements and the principles comprising BBVA’s values.
The Regulations of the Board of Directors regulate conflicts of interest that may arise between, the interests of the directors and/or their family members, and the interests of BBVA and set forth the circumstances where a director’s activities may be incompatible with their duties as a member of the Board of Directors.
Directors shall abstain from attending and taking part in matters which may give rise to a conflict of interest.
Directors shall not be present during the deliberations of the Board of Directors or Committees of which he or she is a member when such deliberations relate to matters in which they may have a direct or indirect interest. Directors are also prohibited from carrying out personal, professional or commercial transactions with BBVA or its subsidiaries, other than normal banking transactions, unless such transactions are entered into in connection with transparent and open bidding procedures and at market prices.
Directors shall also abstain from having a direct or indirect stake in businesses or companies in which BBVA or its subsidiaries has an interest, unless (i) the stake predates their joining the Board of Directors, or BBVA or its subsidiaries acquires its or their interest, as the case may be, after they join the Board of Directors, or (ii) the companies are listed on a domestic or international stock exchange, or (iii) the director’s stake is authorized by the Board of Directors.
Directors may not use their position with BBVA to obtain, directly or indirectly, a material advantage, nor take advantage of any business opportunity of which they become aware as a result of their membership on the Board of Directors.
Incompatibilities
In pursuit of their duties, directors shall be subject to rules on incompatible activities.
The Regulations of the Board of Directors establish specific rules regarding director activities that are incompatible membership on the Board of Directors, except for those cases expressly authorized by the Board.
Under the incompatibility rules, directors may not: (i) provide professional services or be an employee, manager or director of companies competing with BBVA or any of BBVA’s subsidiaries; (ii) hold a directorship or equivalent position in any company in which BBVA holds an interest or (iii) perform any activity that may in any way adversely affect BBVA’s public image.
As an exception, on our initiative, executive directors may perform management tasks in subsidiaries directly or indirectly controlled by BBVA with the consent of the Executive Committee, and other companies in which BBVA participates with the consent of the Board of Directors.
The non-executive directors may serve as directors for companies in which BBVA directly or indirectly holds an ownership interest if such position is not held as a result of our ownership interest and with the prior consent
77
of the Board of Directors. This limitation does not apply where we have acquired an interest in another company in the ordinary course of our asset management, derivatives coverage or other similar business lines.
Directors’ Resignation and Dismissal
Directors shall resign their office when the term for which they were appointed has expired, unless they are re-elected.
Furthermore, in the following circumstances directors must tender their resignation to the Board and accept its decision regarding their continuity in office:
| | • | | when they are affected by circumstances of incompatibility or prohibition as defined in current Spanish legislation, in BBVA’s Bylaws or in the Directors’ Charter; |
| | • | | when there is a significant change in their professional status or in the condition that led to their appointment; |
| | • | | in the event of a serious breach of their obligations related to the performance of their duties as directors; and |
| | • | | when, through action in their capacity as directors, serious harm has been caused to the corporate assets or when they have lost the commercial and professional reputation required for the office of director of the Bank. |
Incompatibility After Severance
Directors who cease to belong to the Board of Directors may not provide services to any other financial institution competing with BBVA or any of its subsidiaries for two years after leaving the Board of Directors, unless the Board of Directors expressly authorizes otherwise. Such authorization may be denied on the ground of BBVA’s best interest.
78
The Board of Directors
The Board of Directors is currently comprised of 15 members. The following table sets forth the names of the members of the Board of Directors as of the date of this Annual Report on Form 20-F, their date of appointment and, if applicable, reelection, their current positions and their present principal outside occupation and five-year employment history.
| | | | | | | | |
Name | | Current Position | | Date Nominated | | Date Reelected | | Present Principal Outside Occupation and
Five-Year Employment History(*) |
| Francisco González Rodríguez(1) | | Chairman and Chief Executive Officer | | December 18, 1999 | | February 26, 2005 | | Chairman, Argentaria, May 1996 –January 2000; Chairman, BBVA, since January 2000. Director of BBVA Bancomer Servicios, S.A.; Grupo Financiero BBVA Bancomer, S.A. C.V. and BBVA Bancomer S.A. |
| | | | |
| José Ignacio Goirigolzarri Tellaeche(1) | | President and Chief Operating Officer | | December 18, 2001 | | March 1,
2003 | | Director, Telefónica, S.A., April 2000–April 2003; Vice President, Repsol YPF, S.A., 2002–2003; Managing Director, Banking in America, BBVA, 2000 – 2001. Director of BBVA Bancomer Servicios, S.A.; Director, Grupo Financiero BBVA Bancomer and BBVA Bancomer, S.A.; President and Chief Operating Officer, BBVA, since 2001. |
| | | | |
| Tomás Alfaro Drake(2) | | Independent Director | | March 18,
2006 | | | | Director of Business Management and Administration and Business Sciences programs at Universidad Francisco de Vitoria, since 1998. |
| | | | |
| Juan Carlos Álvarez Mezquíriz(1)(3) | | Independent Director | | December 18, 1999 | | March 18,
2006 | | Managing Director, Grupo Eulen; Director, Bodegas Vega Sicilia, S.A. |
| | | | |
| Richard C. Breeden | | Independent Director | | October 29,
2002 | | February 28, 2004 | | Chairman, Richard C. Breeden & Co.; Chairman, President and CEO, Equivest Finance, Inc., 1996 – 2002; Bankruptcy Trustee, Bennett Funding Group, 1996-2002. |
| | | | |
| Ramón Bustamante y de la Mora(2)(4) | | Independent Director | | December 18, 1999 | | February 26, 2005 | | Director, Ctra. Inmo. Urba. Vasco-Aragonesa, S.A. |
79
| | | | | | | | |
| José Antonio Fernández Rivero(4) | | Independent Director | | February 28, 2004 | | | | Appointed Group General Manager, 2000; From 2003 to 2005: Deputy Chairman of Telefónica and Member of its Audit and Regulation Committees, Member of the Board and Executive Committee of Iberdrola, Director of Banco de Crédito Local, and Chairman of Adquira. |
| | | | |
| Ignacio Ferrero Jordi(1)(3) | | Independent Director | | December 18, 1999 | | February 26, 2005 | | Chairman, Nutrexpa, S.A. Director La Piara S.A.; Director Lladró Comercial S.A. |
| | | | |
| Román Knörr Borrás(1) | | Independent Director | | May 28,
2002 | | March 1,
2003 | | Chairman, Carbónicas Alavesas, S.A.; Director, Mediasal 2000, S.A. and President of the Alava Chamber of Commerce; Chairman, Confebask (Basque Business Confederation) from 1999 to 2005; Director of Aguas de San Martín de Veri, S.A. until January 2006. |
| | | | |
| Ricardo Lacasa Suárez(2)(4) | | Independent Director | | May 28,
2002 | | March 1,
2003 | | Appointed Director of BBVA and Chairman of the Audit and Compliance Committee in 2002. |
| | | | |
| Carlos Loring Martínez de Irujo(2)(3) | | Independent Director | | February 28, 2004 | | March 18,
2006 | | He was a partner of J&A Garrigues, from 1977 until 2004; Director of the Department of Mergers and Acquisitions, of Banking and Capital Markets, Member of the Management Committee since 1985. |
| | | | |
| José Maldonado Ramos(4)(5) | | Director and General Secretary | | December 18, 1999 | | February 28, 2004 | | Director, Telefónica S.A., February 1999 – April 2003; Secretary of the Board of Directors and Director and General Secretary, Argentaria, May 1997 – 2000; Director and General Secretary, BBVA, since January 2000. |
| | | | |
| Enrique Medina Fernández(1)(4) | | Independent Director | | December 18, 1999 | | February 28, 2004 | | Director and Secretary, Sigma Enviro, S.A. |
| | | | |
| Susana Rodríguez Vidarte(2) | | Independent Director | | May 28,
2002 | | March 18,
2006 | | Dean of Deusto “La Comercial” University since 1996. |
| | | | |
| Telefónica, S.A.(6)(7) | | Non-Independent External Director | | April 17,
2000 | | February 26, 2005 | | |
| (*) | Where no date is provided, the position is currently held. |
| (1) | Member of the Executive Committee. |
80
| (2) | Member of the Audit and Compliance Committee. |
| (3) | Member of the Appointments and Compensation Committee. |
| (4) | Member of the Risk Committee. |
| (5) | Secretary of the Board of Directors. |
| (6) | Represented by Mr. Angel Vilá Boix |
| (7) | See “Item 7. Major Shareholders and Related Party Transactions—Related Party Transactions—Uno-e Bank Agreement.” |
Executive Officers (“Comité de Dirección”)
Our executive officers were each appointed for an indefinite term. In December 2005 our Executive Committee was enlarged from 12 members to 18, their positions as of the date of this Annual Report on Form 20-F are as follows:
| | | | |
Name | | Current Position | | Present Principal Outside Occupation and Five-Year Employment History(*) |
| Francisco González Rodríguez | | Chairman and Chief Executive Officer | | Chairman, Argentaria, May 1996 – January 2000; Chairman, BBVA, since January 2000. Director of BBVA Bancomer Servicios, S.A; Grupo Financiero BBVA Bancomer, S.A. C.V. and BBVA Bancomer S.A. |
| | |
| José Ignacio Goirigolzarri Tellaeche | | President and Chief Operating Officer | | Director, Telefónica, S.A. April 2000 – April 2003; Vice President, Repsol YPF, S.A., April 2002 – April 2003; Director, BBVA Bancomer Servicios, S.A., Grupo Financiero BBVA Bancomer and BBVA Bancomer, S.A.; Managing Director, Banking in America, BBVA, 2000 – 2001. |
| | |
| José Maldonado Ramos | | Director and General Secretary | | Director, Telefónica S.A., February 1999 – April 2003; Director and General Secretary, Argentaria (BBVA since January 2001), since May 1997. |
| | |
| José María Abril Pérez | | Wholesale and Investment Banking | | Director, Repsol S.A. (1996-2002); Director, Cía. Inmob. Metro. Vasco Central (Metrovacesa) (1994-2002); Director, Gas Natural S.A. (1997-2002); Director, Bodegas y Bebidas S.A.(1997-2001); Director, Corp. IBV Servicios Tecnológicos S.A. (1995-2002); Chairman, S.A. Proyectos Industri. Conjuntos (2000-2002); Director, Iberia Líneas Aéreas de España, S.A. (2000-2002); Managing Director, Industrial Group, BBVA, since 1999. |
81
| | | | |
| Eduardo Arbizu Lostao | | Head of Legal department | | Head of Legal department of BBVA, since 2002; Chief Executive Officer, Barclays Bank Spain, 1997 – 2002. |
| | |
| Ángel Cano Fernández | | Human Resources and Services
| | Chief Financial Officer, BBVA, 2001–2002, Controller, BBVA, 2000–2001; Controller, Argentaria, 1998–2000. |
| | |
| Manuel González Cid | | Finance Division
| | Deputy General Manager, BBVA – Head of the Merger Office, 1999 – 2001; Head of Corporate Development, BBVA, 2001 – 2002. Director and Vicepresident of Repsol 2003-2005. |
| | |
| Manuel Méndez del Río | | Risks
| | Managing Director, Risk Management, BBVA, since 1999. |
| | |
| Vitalino Nafría Aznar | | Retail Banking Spain and Portugal
| | Director of Telefónica S.A. since December 2005; Managing Director, BBVA Bancomer, 2002-2006; Chief Executive Officer, BBV Mexico, 1998 – 2000. |
| | |
| Ignacio Sánchez-Asiaín Sanz | | South
America | | Managing Director, Asset Management and Private Banking, BBVA, since 2001; Managing Director, Americas Banking, 2001; Managing Director, Business Development, Americas Banking, 2000 – 2001. |
| | |
| José Sevilla Álvarez | | Head of the Office of the Chairman | | Head of Finance Division, Latin American Banking, BBV, 1998 – December 2001; Head of Business Development, BBVA, December 2001 – January 2003; Head of the Office of the Chairman, with responsibility for accountancy, internal audit and compliance, since January 2003. |
| | |
| Javier Ayuso Canals | | Corporate Communications | | Head of Information Relations, BBVA, 2000-2001. Corporate Communications Director, BBVA, December 2001. |
| | |
| Javier Bernal Dionis | | Business development and
innovation – retail banking Spain and Portugal | | Director of “Doctor Music Networks”, 2000-2004. Innovation and Development Director, BBVA, 2004-2006. Director Iniciativas Residenciales en Internet S.A. (Atrea) since 2005. |
| | |
| José María García Meyer-Dohner | | USA
| | BBVA Business Management and Coordination Manager for Mexico, 2000-2001. Commercial Banking Manager for BBVA Bancomer, 2001-2004. Retail Banking Manager for USA, August 2004. |
| | |
| Jaime Guardiola Romojaro | | MEXICO
| | Chairman BBVA Puerto Rico, 2000-2001. Deputy Chairman and Managing Director BBVA Banco Francés, 2001-2003. Managing Director and Vicepresident BBVA Bancomer Mexico, January 2003. |
82
| | | | |
| Juan Asúa Madariaga | | Smes And Large Companies
| | Global Corporate Banking Director, BBVA, 2000. E-Commerce Director, BBVA, 2000-2001. Corporate Global Banking Director, BBVA, 2001-2005. |
| | |
| Jose Barreiro Hernández | | Global Operations
| | Spanish Markets Director, BBVA, 2000-2001. Head of Global Markets and Distribution, Trading and Equity, BBVA, 2001-2005. |
| | |
| Vicente Rodero Rodero | | Comercial Banking Spain | | BBVA Corporate Banking Director for Mexico, 1995-1999. BBVA Personal Banking Director, 1999-2003. BBVA Regional Director for Madrid, 2003-2004. BBVA Commercial Banking Director for Spain, September 2004. |
| (*) | Where no date is provided, positions are currently held. |
Compliance with NYSE Listing Standards on Corporate Governance
On November 4, 2003, the SEC approved new rules proposed by the New York Stock Exchange (the “NYSE”) intended to strengthen corporate governance standards for listed companies. In compliance therewith, the following is a summary of the significant differences between our corporate governance practices and those applicable to domestic issuers under the NYSE listing standards.
Independence of the Directors on the Board of Directors and Committees
Under the NYSE corporate governance rules, (i) a majority of a U.S. company’s board of directors must be composed of independent directors, (ii) a majority of the audit committee must be composed of independent directors and by July 31, 2005, all members of the audit committee must be independent and (iii) all U.S. companies listed on the NYSE must have a compensation committee and a nominations committee and all members of such committees must be independent. In each case, the independence of directors must be established pursuant to highly detailed rules promulgated by the NYSE and, in the case of the audit committee, the NYSE and the SEC.
Spanish law does not contain any requirement that members of the board of directors or the committees thereof be independent, nor does Spanish law provide any definition of what constitutes independence for the purpose of board or committee membership or otherwise. In addition, Spanish law does not require that a company have a compensation committee or a nominations committee, although there is a non-binding recommendation for listed companies in Spain to have these committees and for them to be composed of a majority of non-executive directors.
As described above under “—Directors and Senior Management,” BBVA considers directors to be independent when they do not hold any other position with BBVA or any of our subsidiaries and they:
| | • | | do not own, directly or indirectly, over 3% of our shares and have not been appointed by a shareholder holding over 3% of our shares; |
| | • | | are not an entity designated to serve on our Board of Directors, or a representative of any such entity, which holds one or more directorships (an institutional director); |
| | • | | have not served as an executive officer, an executive director or as an employee of BBVA’s external auditor, in each case within the last three years; |
| | • | | do not have a significant relationship with BBVA, directly or as a partner, shareholder, manager or employee of an entity that has such a relationship, where the relationship could be considered to affect such director’s independence; |
| | • | | do not have a family relationship with any director failing to meet the criteria described above; and |
83
| | • | | do not possess any other quality or characteristic that, in the judgment of the Board of Directors, might compromise such director’s independence. |
Our Board of Directors has a large majority of non-executive directors and 11 out of the 15 members of our Board are independent under the definition of independence described above. In addition, our Audit and Compliance Committee is composed exclusively of independent directors and the committee Chairman is required to have experience in financial management and an understanding of the standards and accounting procedures required by the governmental authorities that regulate the banking sector. In accordance with the non-binding recommendation, BBVA’s Board of Directors has created an Appointments and Compensation Committee which is composed exclusively of independent directors.
Separate Meetings for Independent Directors
In accordance with the NYSE corporate governance rules, independent directors must meet periodically outside of the presence of the executive directors. Under Spanish law, this practice is not contemplated as such. We note, however, that our independent directors meet periodically outside the presence of our executive directors anytime the Audit and Compliance Committee or the Appointments and Compensation Committee meet, since these Committees are comprised solely of independent directors. In addition, our independent directors meet outside the presence of our executive directors as often as they deem fit, and usually prior to meetings of the Board of Directors or its Committees.
Code of Ethics
The NYSE listing standards require U.S. companies to adopt a code of business conduct and ethics for directors, officers and employees, and promptly disclose any waivers of the code for directors or executive officers. For information with respect to BBVA’s code of business conduct and ethics see “Item 16B. Code of Ethics”.
B. Compensation
Under BBVA’s bylaws, the Board of Directors is permitted to distribute up to four percent of BBVA’s annual net income to its members, but only after legally required reserve provisions have been made and after distribution of four percent of BBVA’s net income in the form of dividends to its shareholders.
The Board of Directors, at the proposal of the Appointments and Compensation Committee, which is comprised solely of independent directors, approves BBVA’s system for remuneration of members of the Board of Directors. The compensation criteria adopted by the Appointments and Compensation Committee are based on the responsibilities of the members of the Board of Directors, including their service on Board Committees, as well as the limitations service on the Board of Directors and its Committees places on other professional activities that may be pursued by the directors. This Committee adopted in 2003 criteria for the compensation of directors and determined that executive directors would be compensated solely pursuant to their employment contracts relating to their executive positions with BBVA.
84
The following table presents information regarding the compensation (in thousands of euro) paid to each member of our Board of Directors serving during 2005.
| | | | | | | | | | | | | | |
Director | | Board of
Directors | | Executive Committee | | Audit Committee | | Appointments
and
remuneration Committee | | Risks Committee | | Chairman
of a
Committee | | Total |
Alvarez Mezquiriz, Juan Carlos | | 115 | | 146 | | | | 37 | | | | | | 298 |
Breeden, Richard C. | | 312 | | | | | | | | | | | | 312 |
Bustamante y de la Mora, Ramón | | 115 | | | | 62 | | | | 94 | | | | 271 |
Fernández Rivero, José A.(1) | | 115 | | | | | | | | | | 187 | | 302 |
Ferrero Jordi, Ignacio | | 115 | | | | 62 | | | | | | 94 | | 271 |
Knörr Borrás, Román | | 115 | | 146 | | | | | | | | | | 261 |
Lacasa Suárez, Ricardo | | 115 | | | | | | | | 94 | | 156 | | 365 |
Loring Martínez Irujo, Carlos | | 115 | | | | 62 | | 37 | | | | | | 214 |
Medina Fernández, Enrique | | 115 | | 146 | | | | | | 94 | | | | 355 |
Rodríguez Vidarte, Susana | | 115 | | | | 62 | | | | | | | | 177 |
San Martín Espinós, José María | | 115 | | 146 | | | | 37 | | | | | | 298 |
Telefónica | | 115 | | | | | | | | | | | | 115 |
TOTAL | | 1,577 | | 584 | | 248 | | 111 | | 282 | | 437 | | 3,239 |
| | | | | | | | | | | | | | |
| (1) | D. José Antonio Fernández Rivero also received compensation in the year ended December 31, 2005 in the amount of €652 thousand relating to his early retirement payments as a former BBVA senior executive. |
Compensation paid to BBVA’s executive directors, which under BBVA’s bylaws must be based solely on their employment contracts relating to their executive positions with BBVA, in 2005 was as follows (in thousands of euro):
| | | | | | |
| | | Fixed
Pay | | Variable
Pay | | Total* |
Chairman of the Board | | 1,649 | | 2,486 | | 4,135 |
Chief Operating Officer & President | | 1,220 | | 2,097 | | 3,317 |
General Secretary | | 544 | | 645 | | 1,189 |
| * | In aggregate, executive directors also received €33,000 in 2005 as benefit in kind. |
Remuneration paid to members of the Management Committee in 2005, excluding executive directors, came to €6,730 thousand of fixed remuneration and €15,751 thousand of variable remuneration. The number of members of the management committee grew from 12 to 18 in December 2005. The information given here covers all members at December 31, 2005, excluding executive directors.
The following table provides the provisions recorded at December 31, 2005 for welfare benefit obligations for the non-executive members of the Board of Directors (in thousands of euro):
| | |
| | | Cumulative Amount |
Álvarez Mezquiriz, Juan Carlos | | 248 |
Bustamante y de la Mora, Ramón | | 259 |
Fernández Rivero, José Antonio | | 101 |
Ferrero Jordi, Ignacio | | 258 |
Knörr Borrás, Román | | 195 |
Lacasa Suárez, Ricardo | | 245 |
Loring Martínez de Irujo, Carlos | | 75 |
Medina Fernández, Enrique | | 369 |
Rodríguez Vidarte, Susana | | 131 |
San Martín Espinós, José María | | 346 |
Total | | 2,227 |
85
In addition, during 2005 a total of €70,000 was paid in insurance premiums for the non executive members of the Board of Directors.
The following table provides the provisions recorded at December 31, 2005 for welfare benefit obligations for the executive directors that are members of the Board of Directors (in thousands of euro):
| | |
Executive Directors | | Cumulative
Amount |
Chairman of the Board | | 43,242 |
Chief Operating Officer & President | | 38,545 |
Secretary General | | 5,986 |
BBVA’s bylaws, in article 50 bis, grant the Bank’s executive directors (Chairman, COO and Company Secretary) rights to compensation in the event of severance. This is reflected in the contracts that BBVA, duly represented by the independent directors members of the Appointments and Remuneration Committee by virtue of the authority delegated to them by the Board of Directors, entered into with the Chairman and the Company Secretary in 2001 and the COO in 2002. The Board of Directors was informed of the same. Each of these contracts specifies how these rights are to be applied, under the terms and conditions laid out below.
In the case of termination of employment for causes other than voluntary termination, retirement, disability or gross negligence to perform their duties, BBVA will pay an indemnity consistent with the amount that results from the multiplication by five of the executive director’s gross compensation (fixed and ordinary variable compensation) in respect of the year prior to the termination.
In addition, the terminated indemnified director shall also be entitled to receive an amount equal to the cumulative value of pension benefits accrued on behalf of such director in accordance with actuarial studies and regulations governing pension benefits currently in force.
In order to receive these indemnity payments, the executive director must resign as a director and executive officer of BBVA and renounce any other entitlements to indemnity payments they may have in addition to the payments described above. In addition, the terminated indemnified executive director shall be prohibited from working for companies that compete with BBVA or its affiliates for two years following such director’s termination.
Incentive Plans
At BBVA’s General Shareholders’ Meeting held on March 18, 2006, a long-term remuneration plan (the “Plan”) that remunerates participants with BBVA shares was approved for members of BBVA’s senior management team, including executive directors and members of the management committee. The Plan was approved with a view to aligning senior managers’ interests with shareholders’ interests.
The Plan allocates a number of “theoretical shares” to Plan participants as a function of a Plan participant’s annual variable pay over the preceding three years and their level of responsibility within the Group. Whether a Plan participant will receive the number of “theoretical shares” that were allocated to him or her at the beginning of the Plan will depend on whether BBVA achieves certain financial benchmarks (based on total shareholders’ return, or “TSR”, defined as gain in listed value plus dividends) as compared to other European peer banks between January 1, 2006 and December 31, 2008. The specific number of BBVA shares to be delivered to each beneficiary of the Plan when it concludes, should the terms and conditions it establishes be met, shall equal the result of multiplying the number of “theoretical shares” allocated by a coefficient of between
86
0 and 2, which will be calculated as a function of the spread between BBVA’s TSR during the term of the Plan and the TSR performance of 14 European peer banks.
If such financial benchmarks are met, and all other terms and conditions of the Plan that apply are satisfied, settlements will be made in the first half of 2009. The maximum number of BBVA shares approved for delivery in connection with the Plan is 22 million, representing 0.65% of BBVA’s share capital at April 25, 2006.
In addition, at such General Shareholders’ Meeting, a remuneration plan for non-executive directors (the “Non-Executive Director Plan”), which replaces the prior benefit scheme for non-executive directors, was also approved. The Non-Executive Director Plan allocates a number of “theoretical shares” to non-executive directors each year that they serve on BBVA’s Board of Directors, instead of recording provisions for the welfare benefit obligations of such non-executive directors. The number of theoretical shares granted will be equivalent in value to 20% of the total remuneration paid to such non-executive director during his or her previous year of service, and the shares will be delivered to a participating non-executive director upon such a non-executive director ceasing to be a non-executive director, so long as such non-executive director has not ceased to be a non-executive director as a result of a serious breach of his or her duties as a director.
In addition, the multi-year remuneration plan for the management team, including executive directors and the Management Committee, for the years 2003 to 2005, will be settled in the first half of 2006 according to the terms and conditions of the plan.
Advance Payments and Personal Loans to Directors and Executive Officers
The total of advance payments and personal loans granted by BBVA and its consolidated subsidiaries to the members of the Board of Directors and outstanding as of December 31, 2005 amounted to €698 thousand euros. As of December 31, 2005, no guarantees had been extended to secure obligations or commitments of members of the Board of Directors.
The total of advance payments and personal loans granted by BBVA to executive officers (excluding executive directors) and outstanding as of December 31, 2005 amounted to €4,249 thousand euros. This figure includes information concerning current members of our Executive Committee excluding executives directors (15 members). As of December 31, 2005, no guarantees had been extended to secure executive officers’ obligations or commitments. For information with respect to advance payments and personal loans to executive directors see “Item 7. Major Shareholders and Related Party Transactions—Related Party Transactions.”
C. Board Practices
Committees
The Board of Directors has created the Executive Committee, the Audit and Compliance Committee, the Appointments and Compensation Committee and the Risk Committee. These Committees are discussed below.
Executive Committee
BBVA’s Board of Directors is assisted in fulfilling its responsibilities by the Executive Committee (Comisión Delegada Permanente) of the Board of Directors The Board of Directors delegates all management functions, except those that it must retain due to legal or statutory requirements, to the Executive Committee.
87
As of May, 2006, BBVA’s Executive Committee was comprised of two executive directors and four independent directors, as follows.
| | |
| Chairman and Chief Executive Officer: | | Mr. Francisco González Rodriguez |
| |
| President and Chief Operating Officer: | | Mr. José Ignacio Goirigolzarri Tellaeche |
| |
| Members: | | Mr. Juan Carlos Álvarez Mezquíriz Mr. Ignacio Ferrero Jordi Mr. Román Knörr Borrás Mr. Enrique Medina Fernández |
The Executive Committee is also responsible for the matters delegated to it by the Board of Directors, so long as such matters are also consistent with its authority as set forth in BBVA’s bylaws. Such matters include the management of BBVA and establishment of BBVA’s general policy guidelines, review and authorization of investments by BBVA, approval or rejection of transactions and initiation of internal investigations and audits in any area of BBVA’s business. The Executive Committee generally holds meetings two times a month, but may meet as often as deemed necessary by the Committee chairman or at the request of a majority of the Committee’s members. During 2005, the Executive Committee held a total of 22 meetings.
Audit and Compliance Committee
The Audit and Compliance Committee supervises preparation of BBVA’s consolidated financial statements and is responsible for the functioning of BBVA’s internal control function. The Audit and Compliance Committee is required under our bylaws to have a minimum of four members, one of whom acts as Chairman, appointed by the Board of Directors. The committee Chairman is required to have experience in financial management and an understanding of the standards and accounting procedures required by the governmental authorities that regulate the banking sector.
At May, 2006, the Audit and Compliance Committee members were:
| | |
Chairman: | | Mr. Ricardo Lacasa Suárez |
| |
Members: | | Mr. Tomás Alfaro Drake Mr. Ramón Bustamante y de la Mora Mr. Carlos Loring Martínez de Irujo Mrs. Susana Rodríguez Vidarte |
The Audit and Compliance Committee’s governing charter, which has been approved by the Board of Directors, sets forth its responsibilities and procedures. The Audit and Compliance Committee is generally responsible for assisting the Board of Directors with preparation of BBVA’s Consolidated Financial Statements and supervising BBVA’s internal control procedures.
In this regard, the Audit and Compliance Committee’s principal responsibilities include:
| | • | | Supervising the sufficiency, adequacy and effectiveness of BBVA’s internal control systems to ensure the accuracy, reliability, sufficiency and clarity of (i) BBVA’s financial statements contained in annual and quarterly reports and (ii) accounting or financial information which may be requested by the Bank of Spain or other regulators, including regulators in countries outside of Spain where BBVA operates. |
| | • | | Monitoring BBVA’s compliance with applicable domestic and international regulations relating to money laundering, conduct in securities markets, data protection and competition, as well as ensuring that requests for information or remedial action by regulators holding competency in these areas are fulfilled. |
88
| | • | | Ensuring that the ethical and other codes of conduct applicable to BBVA’s personnel meet regulatory requirements and are otherwise adequate. |
| | • | | Monitoring compliance by BBVA directors with BBVA’s Regulations of the Board of Directors, as well as with regulations applicable to directors’ conduct in the securities markets. |
To ensure the accuracy, reliability, sufficiency and clarity of BBVA’s Consolidated Financial Statements, the Audit and Compliance Committee closely supervises the preparation of such financial statements, holding frequent meetings with BBVA executives responsible for preparation of the Consolidated Financial Statements as well as with BBVA’s external auditor.
The Audit and Compliance Committee is responsible for selecting BBVA’s external auditor, which is appointed at the General Shareholders’ Meeting, and supervising the performance by such external auditor of the services it was contracted to perform, in accordance with the terms of the engagement. In particular, the Audit and Compliance Committee’s supervision of the external auditor is aimed at ensuring compliance with regulatory requirements as well as with BBVA’s internal policies.
The Audit and Compliance Committee is responsible for ensuring that BBVA’s external auditor is independent. This duty is discharged by the Audit and Compliance Committee through its monitoring of the external auditor’s activities, including assessing whether any report, opinion or recommendation delivered by the external auditor is conditioned on any other relationship of the external auditor with BBVA and by prohibiting the delivery of consulting and auditing services by the same external auditing firm, other than in special circumstances receiving the Committee’s (or the Chairman’s, if such authority is delegated to him) specific prior approval.
The Audit and Compliance Committee is also responsible for supervising BBVA’s internal audit and reviews and approves BBVA’s internal audit schedule for each fiscal year and monitors the execution of the internal audit through ongoing contact with BBVA’s chief internal audit officer. During the year ended December 31, 2005, the Audit and Compliance Committee held a total of 13 meetings.
In order to effectively discharge its duties, the Audit and Compliance Committee may request that BBVA staff from any area of its operations attend its meetings to provide additional information or expertise regarding any topic on the Committee’s agenda. External experts may also be contracted to attend Committee meetings to provide expertise in areas relevant to the Committee’s duties that, due to their technical nature or as a result of conflicts of interest that may exist, cannot be advised upon by internal staff.
Appointments and Compensation Committee
The Appointments and Compensation Committee assists the Board of Directors in selecting candidates proposed to be appointed as members of the Board of Directors and in setting director compensation, though the Board of Directors itself must approve such matters. On behalf of the Board of Directors, this Committee evaluates the qualification of the persons proposed to be appointed as members of the Board of Directors and considers the suitability of the candidates’ personal and professional attributes for such appointment. The Committee also assists the Board of Directors with setting director compensation, taking into account the responsibilities of members of the Board of Directors as well as the limitations service on the Board of Directors places on other professional activities that may be pursued by the directors. The Appointments and Compensation Committee determines the remuneration and other benefits for BBVA’s Chairman and CEO and other executive directors. The Committee also analyzes proposals for multi-annual incentive plans for senior management.
As of May, 2006, the members of the Appointments and Compensation Committee were:
| | |
Chairman: | | Mr. Carlos Loring Martínez de Irujo |
| |
Members: | | Mr. Juan Carlos Álvarez Mezquíriz |
| | Mr. Ignacio Ferrero Jordi |
89
During 2005, the Appointments and Compensation Committee held a total of 5 meetings. The Committee may meet as often as it deems necessary in order to discharge its responsibilities.
The Appointments and Compensation Committee may request that BBVA staff from any area of its operations attend its meetings to provide additional information or expertise regarding any topic on the Committee’s agenda. External experts may also be contracted to attend Committee meetings to provide expertise in areas that, due to their technical nature or as a result of conflicts of interest that may exist, cannot be advised upon by internal staff.
Risk Committee
The Risk Committee is responsible for supervising the analysis and periodic monitoring of the various risks BBVA faces on behalf of the Board of Directors. Though the Executive Committee is required to approve BBVA’s overall risk strategies and policies, the Risk Committee analyzes these matters and makes recommendations to the Executive Committee relating thereto. The Risk Committee also monitors the overall level of credit, market and other risks BBVA assumes, reviews transactions delegated to it for approval and verifies that BBVA has established the procedures and structures representing the best practices for risk management in the market.
The Committee is required to be comprised of a majority of non-executive directors. At May, 2006, the members of the Risk Committee were:
| | |
Chairman: | | Mr. José Antonio Fernández Rivero |
| |
Members: | | Mr. Ramón Bustamante y de la Mora Mr. Ricardo Lacasa Suárez Mr. José Maldonado Ramos Mr. Enrique Medina Fernández |
The Risk Committee is governed by a charter approved by the Board of Directors. The charter states that the Risk Committee may meet as often as necessary to discharge its responsibilities. During 2005, the Risks Committee held a total of 82 meetings.
D. Employees
As of December 31, 2005, we, through our various affiliates, had 94,681 employees. Approximately 75.50% of our employees in Spain held technical, managerial and executive positions, while the remainder were clerical and support staff. The table below sets forth the number of BBVA employees by geographic area.
| | | | | | | | |
Country | | BBVA | | Banks | | Companies | | Total |
Spain | | 29,569 | | 681 | | 900 | | 31,150 |
United Kingdom | | 127 | | — | | 4 | | 131 |
France | | 111 | | — | | — | | 111 |
Italy | | 49 | | — | | — | | 49 |
Germany | | 6 | | — | | — | | 6 |
Switzerland | | 2 | | 86 | | — | | 88 |
Portugal | | — | | 891 | | — | | 891 |
Belgium | | 35 | | — | | — | | 35 |
Jersey | | — | | 22 | | — | | 22 |
Russia | | 3 | | — | | — | | 3 |
Andorra | | — | | 238 | | — | | 238 |
Ireland | | — | | 6 | | — | | 6 |
Gibraltar | | — | | 2 | | — | | 2 |
90
| | | | | | | | |
Total Europe | | 29,902 | | 1,926 | | 904 | | 32,732 |
New York | | 121 | | 23 | | — | | 144 |
Miami | | 99 | | — | | — | | 99 |
Grand Cayman | | 5 | | — | | — | | 5 |
EEUU | | — | | 2,066 | | — | | 2,066 |
Total North America | | 225 | | 2,089 | | — | | 2,314 |
Panama | | — | | 245 | | — | | 245 |
Puerto Rico | | — | | 1,120 | | — | | 1,120 |
Argentina | | — | | 6,851 | | — | | 6,851 |
Brazil | | 5 | | — | | — | | 5 |
Colombia | | — | | 6,849 | | — | | 6,849 |
Venezuela | | — | | 5,653 | | — | | 5,653 |
México | | — | | 31,146 | | — | | 31,146 |
Uruguay | | 28 | | 145 | | — | | 173 |
Paraguay | | — | | 99 | | — | | 99 |
Bolivia | | — | | — | | 187 | | 187 |
Chile | | — | | 3,630 | | — | | 3,630 |
El Salvador | | — | | — | | — | | — |
Dominican Republic | | — | | — | | 91 | | 91 |
Cuba | | 1 | | — | | — | | 1 |
Peru | | — | | 3,377 | | — | | 3,377 |
Ecuador | | — | | — | | 145 | | 145 |
Total Latin America | | 34 | | 59,115 | | 423 | | 59,572 |
Hong Kong | | 47 | | — | | — | | 47 |
Japan | | 9 | | — | | — | | 9 |
Iran | | 2 | | — | | — | | 2 |
China | | 5 | | — | | — | | 5 |
Total Asia | | 63 | | — | | — | | 63 |
Total | | 30,224 | | 63,130 | | 1,327 | | 94,681 |
| | | | | | | | |
The terms and conditions of employment in private sector banks in Spain are negotiated with trade unions representing bank employees. Wage negotiations take place on an industry-wide basis. This process has historically produced collective bargaining agreements binding upon all Spanish banks and their employees. The collective bargaining agreement in application during 2005 came into effect as of January 1, 2005 and will apply until December 31, 2006.
As of December 31, 2005, we had 2.359 temporary employees in our Spanish offices.
E. Share Ownership
As of December 31, 2006 the members of the Board of Directors owned an aggregate of 38,089,296 BBVA shares as shown in the table below:
| | | | | | | | | |
Name | | Directly
Owned
Shares | | Indirectly
Owned
Shares | | Total Shares | | % of
Capital
Stock | |
Francisco González Rodríguez | | 698 | | 1,155,208 | | 1,155,906 | | 0.0341 | % |
José Ignacio Goirigolzarri Tellaeche | | 466 | | 420,241 | | 420,707 | | 0.0124 | % |
Juan Carlos Álvarez Mezquiriz | | 30,530 | | — | | 30,530 | | 0.0009 | % |
Richard C. Breeden | | 8,000 | | — | | 8,000 | | 0.0002 | % |
Ramón Bustamante y de la Mora | | 10,139 | | — | | 10,139 | | 0.0003 | % |
José Antonio Fernández Rivero | | 50,000 | | — | | 50,000 | | 0.0015 | % |
Ignacio Ferrero Jordi | | 2,462 | | 51,300 | | 53,762 | | 0.0016 | % |
Román Knörr Borrás | | 20,767 | | 1,964 | | 22,731 | | 0.0007 | % |
Ricardo Lacasa Suárez | | 8,688 | | — | | 8,688 | | 0.0003 | % |
Carlos Loring Martínez De Irujo | | 9,149 | | — | | 9,149 | | 0.0003 | % |
José Maldonado Ramos | | 11,537 | | — | | 11,537 | | 0.0003 | % |
Enrique Medina Fernández | | 27,629 | | 1,036 | | 28,665 | | 0.0008 | % |
Susana Rodríguez Vidarte | | 10,547 | | 2,028 | | 12,575 | | 0.0004 | % |
José María San Martín Espinós | | 18,490 | | 33,087 | | 51,577 | | 0.0015 | % |
Teléfonica de España, S.A. | | 0 | | 36,215,330 | | 36,215,330 | | 1.0680 | % |
| | | | | | | | | |
Total | | 209,102 | | 37,880,194 | | 38,089,296 | | 1.1233 | % |
| | | | | | | | | |
91
No member of the Board of Directors or any executive officers held options over BBVA’s shares as of December 31, 2005.
As of December 31, 2005 the executive officers (excluding executive directors) and their families owned 7,072,945 shares. None of our executive officers holds 1% or more of BBVA’s shares.
As of December 31, 2005 a total of 17,625 employees (excluding executive officers and directors) owned 158,972,886 shares, which represents 0.5595% of our capital stock.
| ITEM 7. | MAJOR SHAREHOLDERS AND RELATED PARTY TRANSACTIONS |
A. Major Shareholders
As of March 31, 2006, no shareholder beneficially held more than five percent of BBVA’s shares. To our knowledge, no other person, corporation or government owned beneficially, directly or indirectly, five percent or more of BBVA’s shares. BBVA’s major shareholders do not have voting rights which are different from those held by the rest of its shareholders. To the extent known to us, BBVA is not controlled, directly or indirectly, by any other corporation, government or any other natural or legal person. As of March 31, 2006, there were 940,542 registered holders of BBVA’s shares, with a total of 758,382,502 shares held by 67 shareholders with registered addresses in the United States. Since certain of such shares and ADRs are held by nominees, the foregoing figures are not representative of the number of beneficial holders. BBVA’s directors and executive officers did not own any ADRs as of March 31, 2006.
B. Related Party Transactions
Loans to Directors, Executive Officers and Related Parties.
The loans granted at December 31, 2005, to members of the Board of Directors of Banco Bilbao Vizcaya Argentaria, S.A. totalled €698 thousand. At December 31, 2005, no guarantees had been provided on their behalf. The loans granted at December 31, 2005, to 18 members of the Management Committee, excluding the executive directors, amounted to €4,249 thousand. At December 31, 2005, no guarantees had been provided on behalf of members of the Management Committee.
At December 31, 2005, the loans granted to parties related to key personnel (the aforementioned members of the Board of Directors of Banco Bilbao Vizcaya Argentaria, S.A. and of the Management Committee) totalled €10,324 thousand. At December 31, 2005, the other exposure to parties related to key personnel (guarantees, finance leases and commercial loans) amounted to €22,712 thousand.
Related Party Transactions in the Ordinary Course of Business.
Loans extended to related parties were made in the ordinary course of business, on substantially the same terms, including interest rates and collateral, as those prevailing at the time for comparable transactions with other persons, and did not involve more than the normal risk of collectibility or present other unfavorable features.
BBVA subsidiaries engage, on a regular and routine basis, in a number of customary transactions with other BBVA subsidiaries, including:
| | • | | overnight call deposits; |
| | • | | foreign exchange purchases and sales; |
92
| | • | | derivative transactions, such as forward purchases and sales; |
| | • | | money market fund transfers; |
| | • | | letters of credit for imports and exports; |
and other similar transactions within the scope of the ordinary course of the banking business, such as loans and other banking services to BBVA’s shareholders, to employees of all levels, to the associates and family members of all the above and to other BBVA non-banking subsidiaries or affiliates. All these transactions have been made:
| | • | | in the ordinary course of business; |
| | • | | on substantially the same terms, including interest rates and collateral, as those prevailing at the time for comparable transactions with other persons and |
| | • | | did not involve more than the normal risk of collectibility or present other unfavorable features. |
C. Interests of Experts and Counsel
Not applicable.
| ITEM 8. | FINANCIAL INFORMATION |
A. Consolidated Statements and Other Financial Information
Financial Information
See Item 18.
Dividends
The table below sets forth the amount of interim, final and total dividends paid by BBVA on its shares for the years 2001 to 2005, adjusted to reflect all stock splits. The rate used to convert Euro (€) amounts to Dollars was the Noon Buying Rate at the end of each year.
| | | | | | | | | | | | | | | | | | | | | | | | | | | | | | |
| | | Per Share |
| | | First Interim | | Second Interim | | Third Interim | | Final | | Total |
| | | € | | $ | | € | | $ | | € | | $ | | € | | $ | | € | | $ |
2001 | | € | 0.085 | | $ | 0.076 | | € | 0.085 | | $ | 0.076 | | € | 0.085 | | $ | 0.076 | | € | 0.128 | | $ | 0.114 | | € | 0.383 | | $ | 0.341 |
2002 | | € | 0.090 | | $ | 0.086 | | € | 0.090 | | $ | 0.086 | | € | 0.090 | | $ | 0.086 | | € | 0.078 | | $ | 0.075 | | € | 0.348 | | $ | 0.334 |
2003 | | € | 0.090 | | $ | 0.103 | | € | 0.090 | | $ | 0.103 | | € | 0.090 | | $ | 0.103 | | € | 0.114 | | $ | 0.130 | | € | 0.384 | | $ | 0.438 |
2004 | | € | 0.100 | | $ | 0.125 | | € | 0.100 | | $ | 0.125 | | € | 0.100 | | $ | 0.125 | | € | 0.142 | | $ | 0.177 | | € | 0.442 | | $ | 0.552 |
2005 | | € | 0.115 | | $ | 0.143 | | € | 0.115 | | $ | 0.143 | | € | 0.115 | | $ | 0.143 | | € | 0.186 | | $ | 0.231 | | € | 0.531 | | $ | 0.658 |
BBVA has paid annual dividends to its shareholders since the date it was founded. Historically, BBVA has paid interim dividends each year. The total dividend for a year is proposed by the Board of Directors following the end of the year to which it relates. The unpaid portion of this dividend (the final dividend) is paid after the approval of our financial statements by the shareholders at the General Shareholders’ Meeting. Interim and final dividends are payable to holders of record on the dividend payment date. Unclaimed dividends revert to BBVA five years after declaration.
While BBVA expects to declare and pay dividends on its shares on a quarterly basis in the future, the payment of dividends will depend upon its earnings, financial condition, governmental regulations and policies and other factors.
93
Subject to the terms of the deposit agreement, holders of ADRs are entitled to receive dividends attributable to the shares represented by the ADSs evidenced by their ADRs to the same extent as if they were holders of such shares.
For a description of BBVA’s access to the funds necessary to pay dividends on the shares, see “Item 4. Information on the Company—Supervision and Regulation—Dividends”. In addition, BBVA may not pay dividends except out of its unrestricted reserves available for the payment of dividends, after taking into account the Bank of Spain’s capital adequacy requirements. Capital adequacy requirements are applied by the Bank of Spain on both a consolidated and individual basis. See “Item 4. Information on the Company—Supervision and Regulation—Capital Adequacy Requirements” and “Item 5. Operating and Financial Review and Prospects—Liquidity and Capital Resources—Capital”. Under Spain’s capital adequacy requirements, we estimate that as of December 31, 2005, BBVA had approximately €2.8 billion of reserves in excess of applicable capital and reserve requirements, which were not restricted as to the payment of dividends.
Legal Proceedings
On March 15, 2002, the Bank of Spain announced that it was opening an administrative proceeding against BBVA and certain individuals who have served as members of BBVA’s board of directors or as executive officers. This announcement was the result of BBVA’s voluntary disclosure to the Bank of Spain on January 19, 2001 that BBVA funds then amounting to approximately Ptas. 37,427 million (approximately €225 million) had been held in offshore accounts and not been reflected in its financial statements. These funds had been generated largely as a result of capital gains realized on transactions in BBV and Argentaria shares and were included in our financial statements in 2000. See Note 32.2.B.15 to our consolidated financial statements included in our Annual Report on Form 20-F for 2002. The Bank of Spain subsequently conducted a confidential investigation which led to the commencement of its administrative proceeding. The Bank of Spain’s administrative proceeding was suspended upon commencement of the proceeding initiated by the National Criminal Court (discussed below) and has remained suspended pending completion of such proceeding.
At the time the Bank of Spain proceeding was suspended, no formal charges had been made by the Bank of Spain relating to the facts and events under investigation. BBVA is therefore unable to determine what, if any, charges will be made by the Bank of Spain and to what conduct any such charges may relate. However, based on BBVA’s assessment of the probable charges and penalties that could be imposed by the Bank of Spain and that since the initiation of the Bank of Spain proceeding, BBVA has continued to be engaged regularly in extending commercial and other types of credit and accepting demand and other types of deposits, BBVA believes that once the Bank of Spain proceeding is recommenced after the conclusion of the National Criminal Court’s proceeding, resolution of such proceeding would not have a material adverse effect on BBVA or its consolidated financial position or results of operations.
National Criminal Court (Audiencia Nacional)
On April 9, 2002, Tribunal No. 5 of Spain’s National Criminal Court presided by Judge Baltasar Garzón commenced a criminal proceeding regarding the previously unreported funds and suspended the administrative proceeding initiated by the Bank of Spain. The National Criminal Court proceeding was initially directed at 28 of BBVA’s former directors and executive officers and was subsequently split into two separate proceedings. One proceeding relating to the use of the unreported funds to create pension accounts, has been resolved by the National Criminal Court in 2005, with just one person indicted from the former five people charged . The second proceeding, which generally relates to the unreported funds, is still in the investigation phase and is directed at four of our former directors and two former executive officers. None of these directors and executive officers continue to serve as directors on BBVA’s Board of Directors or are affiliated with BBVA in any other capacity.
Spanish National Market Commission (the “CNMV”)
On May 22, 2002, the Spanish securities market regulator, the CNMV, instituted administrative proceedings against BBVA for alleged violations of the Spanish Securities Markets Act of 1988 in connection with the same events being investigated by the Bank of Spain. As with the Bank of Spain proceeding, the National Criminal Court requested that the CNMV suspend its proceedings until resolution of the National Criminal Court’s criminal proceeding described above. The CNMV proceeding was suspended on January 7, 2003 and has remained suspended pending completion of the proceeding initiated by the National Criminal Court.
94
Based on BBVA’s assessment of the probable charges and penalties that could be imposed by the CNMV, and the fact that since the initiation of the CNMV proceeding the CNMV has not restricted BBVA from continuing to be actively involved in capital markets transactions in Spain, including by conducting offerings of its own debt and equity securities, BBVA believes that once the CNMV proceeding is recommenced after the conclusion of the National Criminal Court’s proceeding, resolution of such proceeding would not have a material adverse effect on BBVA or its consolidated financial position or results of operations.
Internal Control Procedures
As a result of our discovery that BBVA funds had been held in offshore accounts and not been reflected in its financial statements, we have implemented several accounting internal control procedures in order to obtain reasonable assurance that breaches of our internal controls do not occur. For example, BBVA has significantly strengthened its internal audit function. BBVA’s internal audit department is responsible for such matters as verifying accuracy and completeness of BBVA’s financial reporting and ensuring the compliance, appropriateness and effectiveness of BBVA’s internal control systems and procedures. BBVA has also enhanced its internal audit function, including by broadening the scope of its internal audit activities to include all of BBVA’s diverse operations, both in terms of business area and geographical location. In addition, in 2002, BBVA implemented a “Directors Plan” in respect of fiscal years 2003 and 2004 to further strengthen its internal controls. As part of this plan, BBVA’s internal audit function was further expanded to include review of information and documentation used by the management of each business unit, review of BBVA’s financial statement consolidation process and review and assessment of BBVA’s compliance with capital adequacy requirements. In addition, the Directors Plan provides for the standardization of internal audit work procedures, from making initial contact with the business area or unit being audited to documenting the results of the audit.
BBVA has also reinforced its internal compliance department. This department, whose functions have been established by the Audit and Compliance Committee of BBVA’s Board of Directors, is responsible for developing and implementing internal norms and procedures to ensure compliance with legal requirements and ethical guidelines established by BBVA, such as BBVA’s Code of Conduct. For example, this department is responsible for establishing internal controls and procedures related to matters such as the prevention of money-laundering and trading in BBVA’s securities.
Besides the accounting internal control procedures implemented by BBVA described above, in order to further obtain reasonable assurance that breaches of BBVA’s internal controls do not occur, BBVA has taken a series of steps to strengthen its corporate governance structures in keeping with the most recent trends in this area and new legislation that has taken effect in Spain and the other countries in which BBVA operates. For a description of these corporate governance structures, see “Item 6—Directors, Senior Management and Employees”.
Other Proceedings
Puerto Rico
Two proceedings, which were described in our 2001 Annual Report on Form 20-F, were initiated in Spain based on the testimony of a former BBV Puerto Rico employee. One of these proceedings, related to allegations of money laundering has been definitively closed by the judge during 2005 due to the fact that there was no evidence of any wrongdoing. The other proceeding is based on allegations of bribery against BBVA and certain of its employees. To date, however, no person has been charged with any wrongdoing or named as a defendant in connection with this proceeding.
BBVA Privanza Bank Ltd. (Jersey)
A proceeding was initiated alleging that certain employees of BBVA Privanza Bank Ltd. (Jersey) cooperated in the creation of accounts and financial products in Jersey which were allegedly used by Spanish individuals to avoid Spanish tax obligations. The proceedings also included an allegation of a tax offense due to the purported non-consolidation of a fully-owned subsidiary. This proceeding is ongoing and charges have not been brought against any BBVA employee or director.
95
In light of the surrounding events and circumstances, our legal advisers do not expect that the proceedings described above will have a material effect on us.
B. Significant Changes
No significant change has occurred since the date of the Consolidated Financial Statements.
| ITEM 9. | THE OFFER AND LISTING |
BBVA’s shares are listed on the Spanish Stock Exchanges in Madrid, Bilbao, Barcelona and Valencia and quoted on the Automated Quotation System of the Spanish Stock Exchanges (the “Automated Quotation System”). On August 19, 2005 BBVA´s Shares were admitted for listing on the Mexican stock market. They are also listed on the Frankfurt, Milan, Zurich and London stock exchanges as well as been quoted on SEAQ International in London. Our ADSs are listed on the New York Stock Exchange. Each ADS represent the right to receive one share.
Fluctuations in the exchange rate between the euro and the dollar will affect the dollar equivalent of the euro price of BBVA’s shares on the Spanish Stock Exchanges and the price of BBVA’s ADSs on the New York Stock Exchange. Cash dividends are paid by BBVA in euro, and exchange rate fluctuations between the euro and the dollar will affect the dollar amounts received by holders of American Depositary Receipts (“ADRs”) on conversion by The Bank of New York (acting as depositary) of cash dividends on the shares underlying the ADSs evidenced by such ADRs.
The table below sets forth, for the periods indicated, the high and low sales closing prices for the shares of BBVA on the Automated Quotation System.
| | | | |
| | | Euro per Share |
| | | High | | Low |
Fiscal year ended December 31, 2001 | | | | |
Annual | | 17.20 | | 9.50 |
First Quarter | | 17.20 | | 13.92 |
Second Quarter | | 16.47 | | 14.75 |
Third Quarter | | 15.77 | | 9.50 |
Fourth Quarter | | 14.80 | | 11.50 |
Fiscal year ended December 31, 2002 | | | | |
Annual | | 14.21 | | 7.24 |
First Quarter | | 14.21 | | 12.26 |
Second Quarter | | 13.90 | | 10.93 |
Third Quarter | | 11.99 | | 7.42 |
Fourth Quarter | | 10.60 | | 7.24 |
Fiscal year ended December 31, 2003 | | | | |
Annual | | 10.95 | | 6.89 |
First Quarter | | 10.25 | | 6.89 |
Second Quarter | | 9.68 | | 7.78 |
Third Quarter | | 10.10 | | 8.86 |
Fourth Quarter | | 10.95 | | 8.91 |
Fiscal year ended December 31, 2004 | | | | |
Annual | | 13.09 | | 10.22 |
First Quarter | | 11.28 | | 10.22 |
Second Quarter | | 11.42 | | 10.40 |
Third Quarter | | 11.39 | | 10.55 |
Fourth Quarter | | 13.09 | | 11.36 |
96
| | | | |
Fiscal year ended December 31, 2005 | | | | |
Annual | | 15.17 | | 11.95 |
First Quarter | | 13.38 | | 12.30 |
Second Quarter | | 12.93 | | 11.95 |
Third Quarter | | 14.59 | | 12.67 |
Fourth Quarter | | 15.17 | | 14.12 |
Fiscal year ended December 31, 2006 | | | | |
First Quarter | | 17.26 | | 15.02 |
Month ended January 31, 2006 | | 16.62 | | 15.02 |
Month ended February 28, 2006 | | 17.26 | | 16.22 |
Month ended March 31, 2006 | | 17.25 | | 16.66 |
Month ended April 30, 2006 | | 17.51 | | 16.61 |
Month ended May 31, 2006 | | 17.60 | | 15.84 |
Month ended June 30, 2006 (through June 20) | | 16.24 | | 14.91 |
From January 1, 2005 through December 31, 2005 the percentage of outstanding shares held by BBVA and its affiliates ranged between 0.0706% and 0.6590% respectively, calculated on a monthly basis. On May 12, 2006, the percentage of outstanding shares held by BBVA and its affiliates was 0.166%.
97
The table below sets forth the reported high and low sales closing prices for the ADSs of BBVA on the New York Stock Exchange for the periods indicated.
| | | | |
| | | Dollars per ADS |
| | | High | | Low |
Fiscal year ended December 31, 2001 | | | | |
Annual | | 16.63 | | 8.99 |
First Quarter | | 16.63 | | 12.22 |
Second Quarter | | 14.40 | | 12.65 |
Third Quarter | | 13.16 | | 8.99 |
Fourth Quarter | | 13.44 | | 10.25 |
Fiscal year ended December 31, 2002 | | | | |
Annual | | 12.77 | | 6.93 |
First Quarter | | 12.77 | | 10.82 |
Second Quarter | | 12.50 | | 10.67 |
Third Quarter | | 11.73 | | 7.14 |
Fourth Quarter | | 10.58 | | 6.93 |
Fiscal year ended December 31, 2003 | | | | |
Annual | | 13.85 | | 7.67 |
First Quarter | | 10.81 | | 7.67 |
Second Quarter | | 11.16 | | 8.46 |
Third Quarter | | 11.16 | | 10.28 |
Fourth Quarter | | 13.85 | | 10.54 |
Fiscal year ended December 31, 2004 | | | | |
Annual | | 17.77 | | 12.47 |
First Quarter | | 14.45 | | 12.51 |
Second Quarter | | 13.80 | | 12.47 |
Third Quarter | | 13.96 | | 12.82 |
Fourth Quarter | | 17.77 | | 14.12 |
Fiscal year ended December 31, 2005 | | | | |
Annual | | 17.91 | | 15.08 |
First Quarter | | 17.64 | | 16.14 |
Second Quarter | | 16.47 | | 15.12 |
Third Quarter | | 17.64 | | 15.08 |
Fourth Quarter | | 17.91 | | 16.85 |
Fiscal year ended December 31, 2006 | | | | |
First Quarter | | 20.91 | | 18.21 |
Month ended January 31, 2006 | | 20.24 | | 18.21 |
Month ended February 28, 2006 | | 20.44 | | 19.34 |
Month ended March 31, 2006 | | 20.91 | | 19.91 |
Month ended April 30, 2006 | | 22.06 | | 20.22 |
Month ended May 31, 2006 | | 22.55 | | 20.36 |
Month ended June 30, 2006 (through June 20) | | 21.03 | | 18.61 |
Securities Trading in Spain
The Spanish securities market for equity securities consists of the Automated Quotation System and the four stock exchanges located in Madrid, Bilbao, Barcelona and Valencia. During 2005, the Automated Quotation System accounted for the majority of the total trading volume of equity securities on the Spanish stock exchanges.
Automated Quotation System. The Automated Quotation System links the four local exchanges, providing those securities listed on it with a uniform continuous market that eliminates certain of the differences among the local exchanges. The principal feature of the system is the computerized matching of buy and sell orders at the time of entry of the order. Each order is executed as soon as a matching order is entered, but can be modified or
98
canceled until executed. The activity of the market can be continuously monitored by investors and brokers. The Automated Quotation System is operated and regulated by Sociedad de Bolsas, S.A. (“Sociedad de Bolsas”), a corporation owned by the companies that manage the local exchanges. All trades on the Automated Quotation System must be placed through a bank, brokerage firm, an official stock broker or a dealer firm member of a Spanish stock exchange directly. Since January 1, 2000, Spanish banks have been allowed to place trades on the Automated Quotation System and have been allowed to become members of the Spanish stock exchanges.
In a pre-opening session held from 8:30 a.m. to 9:00 a.m. each trading day, an opening price is established for each security traded on the Automated Quotation System based on orders placed at that time. The legal regime concerning opening prices was changed by an internal rule issued by theSociedad de Bolsas. The new legal regime sets forth that all references to maximum changes in share prices will be substituted by a definition of prices and creation of static and dynamic ranks for each listed share to be published on a periodic basis by theSociedad de Bolsas. The computerized trading hours are from 9:00 a.m. to 5:30 p.m., during which time the trading price of a security is permitted to vary by up to the stated level. If the quoted price exceeds this limit, trading in the security is suspended until the next day. Between 5:30 p.m. and 5:35 p.m. a closing price is established for each security through an auction system similar to the one held for the pre-opening early in the morning.
Between 5:30 p.m. and 8:00 p.m., trades may occur outside the computerized matching system without prior authorization of theSociedad de Bolsas at a price within the range of 5% above the higher of the average price and closing price for the day and 5% below the lower of the average price and closing price for the day, if, among other things, the trade involves more than €300,000 and more than 20% of the average daily trading volume of the stock during the preceding three months. At any time trades may take place (with the prior authorization of theSociedad de Bolsas) at any price if:
| | • | | the trade involves more than €1.5 million and more than 40% of the average daily volume of the stock during the preceding three months; |
| | • | | the transaction derives from a merger or spin-off process, or from the reorganization of a group of companies; |
| | • | | the transaction is executed for the purposes of settling a litigation or completing a complex group of contracts or |
| | • | | theSociedad de Bolsas finds other justifiable cause. |
Information with respect to the computerized trades between 9:00 a.m. and 5:30 p.m. is made public immediately, and information with respect to trades outside the computerized matching system is reported to theSociedad de Bolsas by the end of the trading day and published in theBoletín de Cotizaciónand in the computer system by the beginning of the next trading day.
Clearance and Settlement System.
Law 44/2002 and Rule 689/2003 of March 27, 2003 approved by the Spanish Ministry of Economy have promoted the integration of the two main existing book entry settlement systems existing in Spain, the non-gilts settlement systemServicio de Compensación y Liquidación de Valores (“SCLV”) and the gilts settlement systemCentral de Anotaciones en Cuenta, into one system to be known asSociedad de Gestión de los Sistemas de Registro Compensación y Liquidación de Valores (the “Iberclear”).
Notwithstanding the above, rules concerning the book entry settlement system enacted before this amendment by the SCLV and the Bank of Spain are still in force, but any reference to the SCLV must be substituted by Iberclear.
Under this new regulation, transactions carried out on the Spanish stock exchanges are cleared and settled through Iberclear. Only members of Iberclear are entitled to use it, and membership is restricted to authorized members of the Spanish stock exchanges, the Bank of Spain (when an agreement, approved by the Spanish Ministry of Economy and Finance, is reached with Iberclear) and, with the approval of the CNMV, other brokers not members of the Spanish stock exchanges, banks, savings banks and foreign settlement and clearance systems. The clearance and settlement system and its members are responsible for maintaining records of
99
purchases and sales under the book-entry system. Shares of listed Spanish companies are held in book-entry form. Iberclear, which manages the clearance and settlement system, maintains a registry reflecting the number of shares held by each of its member entities (each anentidad participada), as well as the amount of such shares held on behalf of beneficial owners. Each member entity, in turn, maintains a registry of the owners of such shares. Spanish law considers the legal owner of the shares to be:
| | • | | the member entity appearing in the records of Iberclear as holding the relevant shares in its own name, or |
| | • | | the investor appearing in the records of the member entity as holding the shares. |
The SCLV has introduced the so-called “D+3 Settlement System” by which the settlement of any transactions must be made three working days following the date on which the transaction was carried out.
Obtaining legal title to shares of a company listed on a Spanish stock exchange requires the participation of a Spanish official stockbroker, broker-dealer, bank or other entity authorized under Spanish law to record the transfer of shares. To evidence title to shares, at the owner’s request the relevant member entity must issue a certificate of ownership. In the event the owner is a member entity, Iberclear is in charge of the issuance of the certificate with respect to the shares held in the member entity’s name.
Brokerage commissions are not regulated. Brokers’ fees, to the extent charged, will apply upon transfer of title of our shares from the depositary to a holder of ADRs, and upon any later sale of such shares by such holder. Transfers of ADSs do not require the participation of an official stockbroker. The deposit agreement provides that holders depositing our shares with the depositary in exchange for ADSs or withdrawing our shares in exchange for ADSs will pay the fees of the official stockbroker or other person or entity authorized under Spanish law applicable both to such holder and to the depositary.
Securities Market Legislation
The Securities Markets Act was enacted in 1988 with the purpose of reforming the organization and supervision of the Spanish securities markets. This legislation and the regulation implementing it:
| | • | | established an independent regulatory authority, the CNMV, to supervise the securities markets; |
| | • | | established a framework for the regulation of trading practices, tender offers and insider trading; |
| | • | | required stock exchange members to be corporate entities; |
| | • | | required companies listed on a Spanish stock exchange to file annual audited financial statements and to make public quarterly financial information; |
| | • | | established the legal framework for the Automated Quotation System; |
| | • | | exempted the sale of securities from transfer and value added taxes; |
| | • | | deregulated brokerage commissions and |
| | • | | provided for transfer of shares by book-entry or by delivery of evidence of title. |
On February 14, 1992, Royal Decree No. 116/92 established the clearance and settlement system and the book-entry system, and required that all companies listed on a Spanish stock exchange adopt the book-entry system.
On November 16, 1998, the Securities Markets Act was amended in order to adapt it to Directive 93/22/CEE on investment services (later amended by Directive 95/26/CE and Directive 97/9/CE of the European Parliament and Council on investors indemnity systems).
On November 22, 2002, the Securities Markets Act was amended by Law 44/2002 in order to update Spanish financial law to global financial markets. See “Item 4. Information on the Company—Business Overview— Supervision and Regulation—Monetary Policy—Law Reforming the Spanish Financial System”.
100
On June 18, 2003, the Spanish Government approved theLey de Transparencia(“Law 26/2003”), modifying both the Securities Markets Act and the Corporate Law, to reinforce the transparency of information available regarding listed Spanish companies. This law adds a new chapter, Title X, to the Securities Markets Act, which (i) requires disclosure of shareholders’ agreements relating to listed companies; (ii) regulates the operation of the general shareholders’ meetings and of boards of directors of listed companies; (iii) requires the publication of an annual report on corporate governance and (iv) establishes measures designed to increase the availability of information to shareholders.
Trading by the Bank and its Affiliates in the Shares
Trading by subsidiaries in their parent companies shares is restricted by the Spanish Companies Act.
Neither BBVA nor its affiliates may purchase BBVA’s shares unless the making of such purchases is authorized at a meeting of BBVA’s shareholders by means of a resolution establishing, among other matters, the maximum number of shares to be acquired within a maximum period of 18 months. Restricted reserves equal to the purchase price of any shares that are purchased by BBVA or its subsidiaries must be made by the purchasing entity. The total number of shares held by BBVA and its subsidiaries may not exceed five percent of BBVA’s total capital. It is the practice of Spanish banking groups, including ours, to establish subsidiaries to trade in their parent company’s shares in order to meet imbalances of supply and demand, to provide liquidity (especially for trades by their customers) and to modulate swings in the market price of their parent company’s shares.
Reporting Requirements
Any entity which transfers five percent, or any multiple of five percent, of the capital stock of a company listed on a Spanish stock exchange must, within seven days after that transfer, report the transfer to such company, to the stock exchange on which such company is listed and to the CNMV. In addition, any company listed on a Spanish stock exchange must report on a non-public basis any acquisition by such company (or an affiliate) of the company’s own shares if such acquisition, together with any previous one from the date of the last communication, exceeds 1% of its capital stock, regardless of the balance retained. Members of the Board of Directors must report any transfer or acquisition of share capital of a company listed on the Spanish stock exchanges, regardless of the size of the transaction. Additionally, since we are a credit entity, any individual or company which intends to acquire a significant participation in BBVA’s share capital must obtain prior approval from the Bank of Spain in order to carry out the transaction. See “Item 10. Additional Information—Exchange Controls—Restrictions on Acquisitions of Shares”.
Royal Decree 2590/98 has amended Royal Decree 377/91 by incorporating new reporting requirements in connection with any entity acting from a tax haven or a country where no securities regulatory commission exists, in which case the threshold of five percent is reduced to one percent. Furthermore, Royal Decree 2590/98 has extended the meaning of “transfer” to include voting agreements between shareholders.
Each Spanish bank is required to provide to the Bank of Spain a list dated the last day of each quarter of all the bank’s shareholders that are financial institutions and other non-financial institution shareholders owning at least 0.25% of a bank’s total share capital. Furthermore, the banks are required to inform the Bank of Spain, as soon as they become aware, and in any case not later than in 15 days, of each acquisition by a person or a group of at least one percent of such bank’s total share capital.
| ITEM 10. | ADDITIONAL INFORMATION |
A. Share Capital
Not applicable.
B. Memorandum and Articles of Association
Spanish law and BBVA’s bylaws are the main sources of regulation affecting the company. All rights and obligations of BBVA’s shareholders are contained in its bylaws and in Spanish law.
On March 1, 2003, BBVA’s shareholders adopted a resolution amending its bylaws. The amendments were to: (i) Article 31 in order to cease limiting the exercise of shareholders’ voting rights to 10% of BBVA’s total share
101
capital; (ii) Article 34 in order to change the maximum and minimum number of seats on the Board of Directors to 18 and 9, respectively and (iii) Article 48 in order to comply with Law 44/2002.
On February 28, 2004, BBVA’s shareholders adopted a resolution amending its bylaws. The amendments were to: (i) Article 24 in order to expand shareholders’ rights to participate in shareholders’ meetings by proxy or representative; (ii) Article 29 in order to enhance shareholders’ ability to obtain information regarding the Company; (iii) Article 31 regarding the procedures for the adoption of shareholder resolutions; (iv) Article 35 regarding the requirements for being a director; (v) Article 38 regarding the chairman and secretary of the Board of Directors; (vi) Article 45 regarding nomination and composition of the Board of Directors; (vii) Article 37 to make a technical amendment required by virtue of the amendment to Article 35 and (viii) Article 34 to reduce the maximum number of directors from 18 to 16.
On March 18, 2006, BBVA´s shareholders adopted a resolution amending article 53 of its by-laws in order to contemplate the possibility of remunerating members of the board of directors through delivery of shares, share options or remuneration indexed to the share price, according to article 130 of Spanish Companies Act,.
Registry and Company’s Objects and Purposes
BBVA is registered with the Commercial Registry of Vizcaya (Spain). Its registration number at the Commercial Registry of Vizcaya is volume 2,083, Company section folio 1, sheet BI-17-1, 1st entry. Its corporate objects and purposes are to: (i) directly or indirectly conduct all types of activities, transactions, acts, agreements and services relating to the banking business which are permitted or not prohibited by law and all banking ancillary activities; (ii) acquire, hold and dispose of securities and (iii) make public offers for the acquisition and sale of securities and all types of holdings in any kind of company. BBVA’s objects and purposes are contained in Article 3 of the bylaws.
Certain Powers of the Board of Directors
In general, provisions limiting the powers of BBVA’s directors are not contained in its bylaws. Such limitations, where they exist, often (i) limit a director’s power to vote on a proposal, arrangement or contract in which the director is materially interested; (ii) limit the power to vote compensation to themselves; (iii) limit borrowing powers exercisable by the directors and how such borrowing powers can be varied or (iv) require retirement of directors at a certain age. The powers of BBVA’s directors in these and other matters, however, are limited by and subject to BBVA’s internal regulations. In addition, BBVA’s Board of Directors is subject to the Regulations of the Board of Directors, which contains a series of ethical standards. See “Item 6. Directors, Senior Management and Employees”.
The provisions of BBVA’s bylaws that relate to compensation of directors are in strict accordance with the relevant provisions of Spanish law. The main provisions of the bylaws that relate to these matters are those that, in accordance with applicable Spanish law, allow the members of the Board of Directors to determine their administrative expenses or agree on such additional benefits they consider appropriate or necessary, up to four percent of our paid-up capital per year, which may only be paid after the minimum yearly dividend of four percent of the paid-in capital has been paid to our shareholders.
As of the date of the filing of this Annual Report, 11 of the 15 members of the Board of Directors were independent.
Members of the Board of Directors are elected for a term in office of five years. One-fifth of the Board of Directors is re-elected annually. The members of the Board of Directors may be re-elected for an unlimited number of terms.
Certain Provisions Regarding Preferred Shares
The bylaws authorize BBVA to issue ordinary, non-voting, redeemable and preferred shares. As of the date of the filing of this Annual Report, BBVA has no non-voting, redeemable or preferred shares outstanding.
The characteristics of preferred shares must be agreed by the Board of Directors before they are issued.
Only shares that have been issued as redeemable may be redeemed by BBVA. Redemption of shares may only occur according to the terms set forth when they are issued. Redeemable shares must be fully paid-up at the
102
time of their subscription. If the right to redeem redeemable shares is exclusively given to BBVA, it may not be exercised until at least three years after the issue. Redemption of shares must be financed against profits, free reserves or the proceeds of new securities issued especially for financing the redemption of an issue. If financed against profits or free reserves, BBVA must create a reserve for the amount of the par value of the redeemed shares. If the redemption is not financed against profits, free reserves or a new issue, it may only be done in compliance with the requirements of a reduction in share capital by the refund of contributions.
Holders of non-voting shares, if issued, are entitled to a minimum annual dividend, fixed or variable, set out at the time of the issue. The right of non-voting shares to accumulate unpaid dividends whenever funds to pay dividends are not available, any preemptive rights associated with non-voting shares, and the ability of holders of non-voting shares to recover voting rights also must be established at the time of the issue. Non-voting shares are entitled to the dividends to which ordinary shares are entitled in addition to their minimum dividend.
Certain Provisions Regarding Shareholders Rights
As of the date of the filing of this Annual Report, BBVA’s capital is comprised of one class of ordinary shares, all of which have the same rights.
Once all legal reserves and funds have been provided for out of the net profits of any given fiscal year, shareholders have the right to the distribution of an annual dividend of at least four percent of our paid-in capital. Shareholders will participate in the distribution of dividends in proportion to their paid-in capital. The right to collect a dividend lapses after five years as of the date in which it was first available to the shareholders. Shareholders also have the right to participate in proportion to their paid-in capital in any distribution resulting from our liquidation.
Each shareholder present at a General Shareholders’ Meeting is entitled to one vote per each share. However, unpaid shares with respect to which a shareholder is in default of the resolutions of the Board of Directors relating to their payment will not be entitled to vote. The bylaws contain no provisions regarding cumulative voting.
On March 1, 2003, BBVA’s shareholders passed a resolution amending the bylaws to, among other things, remove the provision which stated that no shareholder may cast a number of votes greater than those corresponding to shares representing 10% of BBVA’s share capital.
The bylaws do not contain any provisions relating to sinking funds or potential liability of shareholders to further capital calls by BBVA.
The bylaws do not specify what actions or quorums are required to change the rights of shareholders. Under Spanish law, the rights of shareholders may only be changed by an amendment to the bylaws that complies with the requirements explained below under “—Shareholders’ Meetings”, plus the affirmative vote of the majority of the shares of the class that will be affected by the amendment.
Shareholders’ Meetings
General meetings may be ordinary or extraordinary. Ordinary general meetings are held within the first six months of each financial year in order to review, among other things, the management of the company, and to approve, if applicable, annual financial statements for the previous fiscal year. Extraordinary general meetings are those meetings that are not ordinary. In any case, the requirements mentioned below for constitution and adoption of resolutions are applicable to both categories of general meetings.
General meetings must be convoked by the Board of Directors, whether by their own decision or upon the request of shareholders holding at least five percent of BBVA’s share capital. General meetings must generally be advised, according to Spanish recent regulation, at least one month in advance by means of an advertisement published in the Official Companies Registry Gazette (Boletín Oficial del Registro Mercantil) (Borme) and in one of the widely-circulated newspapers.
As of the date of the filing of this Annual Report, shareholders have the right to attend general meetings if they:
| | • | | own at least 500 shares; |
103
| | • | | have registered their shares in the appropriate account registry at least five days prior to the date for which the general meeting has been convened and |
| | • | | retain the ownership of at least 500 shares until the general meeting takes place. |
Additionally, holders of fewer than 500 shares may aggregate their shares to reach at least such number of shares and appoint a shareholder as proxy to attend the general meeting.
General meetings will be validly constituted on first call with the presence of at least 25% of BBVA’s voting capital, either in person or by proxy. No minimum quorum is required to hold a general meeting on second call. In either case, resolutions will be agreed by the majority of the votes. However, a general meeting will only be validly held with the presence of 50% of BBVA’s voting capital on first call or of 25% of the voting capital on second call, in the case of resolutions concerning the following matters:
| | • | | capital increases or decreases; |
| | • | | any other amendment to the bylaws. |
In these cases, resolutions may only be approved by the vote of the majority of the shares if at least 50% of the voting capital is present at the meeting. If the voting capital present at the meeting is less than 50%, then resolutions may only be adopted by two-thirds of the shares present.
Additionally, our bylaws state that, in order to adopt resolutions regarding a change in corporate purpose or the total liquidation or dissolution of BBVA, at least two-thirds of the voting capital must be present at the meeting on first call and at least 60 percent of voting capital must be present on second call.
Restrictions on the Ownership of Shares
Our bylaws do not provide for any restrictions on the ownership of our ordinary shares. Spanish law, however, provides for certain restrictions which are described below under “—Exchange Controls—Restrictions on Acquisitions of Shares”.
Restrictions on Foreign Investments
Spanish stock exchanges are open to foreign investors. However, the acquisition of 50% or more of the share capital of a Spanish company by a person or entity residing in a tax haven must in certain cases be notified to the Ministry of Economy and Treasury prior to its execution. All other investments in BBVA’s shares by foreign entities or individuals only require the notification of the Spanish authorities through the Spanish intermediary that took part in the investment once it is executed.
Current Spanish regulations provide that once all applicable taxes have been paid, see “—Exchange Controls”, foreign investors may freely transfer out of Spain any amounts of invested capital, capital gains and dividends.
Change of Control Provisions
In addition to the restrictions on acquisitions of BBVA’s shares discussed above, certain antitrust freeze-out regulations may also delay, defer or prevent a change of control of BBVA or any of its subsidiaries in the event of a merger, acquisition or corporate restructuring. In Spain, the application of both Spanish and European antitrust regulations require that prior notice of domestic or cross-border merger transactions be given in order to obtain a “non-opposition” ruling from antitrust authorities.
Spanish regulation of takeover bids may also delay, defer or prevent a change of control of BBVA or any of its subsidiaries in the event of a merger, acquisition or corporate restructuring. Spanish regulation of takeover bids contained in Royal Decree 1197/1991 was as amended by Royal Decree 432/2003 dated April 11, 2003. See “—Exchange Controls—Tender Offers”. Regulations on public takeover bids require a bid to be launched if the
104
acquisition of the listed company grants control to the purchaser, regardless of whether the acquired stake reaches the 25% threshold. The new rules state that it is necessary to launch a tender offer if the bidder intends to acquire less than 25% of the target’s share capital but intends to appoint more than one-third and less than one-half plus one of the target’s directors.
Since BBVA is a credit entity, it is necessary to obtain approval from the Bank of Spain in order to acquire a number of shares considered to be a significant participation by Law 26/1988, of July 29, 1998. See “—Exchange Controls—Restrictions on Acquisitions of Shares”. Also, any agreement that contemplates BBVA’s merger with another credit entity will require the authorization of the Ministry of Economy. This could also delay, defer or prevent a change of control of BBVA or any of its subsidiaries that are credit entities in the event of a merger.
C. Material Contracts
During the past two years BBVA was not a party to any contract outside its ordinary course of business that was material to it as a whole.
D. Exchange Controls
In 1991, Spain adopted the EU standards for free movement of capital and services. As a result, exchange controls and restrictions on foreign investments have generally been abolished and foreign investors may transfer invested capital, capital gains and dividends out of Spain without limitation as to amount, subject to applicable taxes. See “—Taxation”.
Pursuant to Spanish Law 18/1992 on Foreign Investments(Ley 18/1992, de 1 de julio) and Royal Decree 664/1999 (Real Decreto 664/1999, de 23 de abril), foreign investors may freely invest in shares of Spanish companies, except in the case of certain strategic industries.
Shares in Spanish companies held by foreign investors must be reported to the Spanish Registry of Foreign Investments by the depositary bank or relevant Iberclear member. When a foreign investor acquires shares that are subject to the reporting requirements of the CNMV, notice must be given by the foreign investor directly to the Registry of Foreign Investments in addition to the notices of majority interests that must be sent to the CNMV and the applicable stock exchanges. This notice must be given through a bank or other financial institution duly registered with the Bank of Spain and the CNMV or through bank accounts opened with any branch of such registered entities.
Investment by foreigners domiciled in enumerated tax haven jurisdictions is subject to special reporting requirements under Royal Decree 1080/1997(Real Decreto 1980/1997, de 5 de julio).
On July 5, 2003, Law 19/2003(Ley sobre el regimen juridico de los movimientos de capitales y de las transacciones economicas con el exterior y sobre determinadas medidas de prevencion del blanqueo de capitales), came into effect. This law is an update to other Spanish exchange control and money laundering prevention laws.
Restrictions on Acquisitions of Shares
Spanish law provides that any individual or corporation that intends to acquire, directly or indirectly, a significant participation (participación significativa) in a Spanish bank must obtain the prior approval of the Bank of Spain, including the amount of such participation, the terms and conditions of the acquisition and the period in which it is intended to execute the transaction. A significant participation is considered five percent of the outstanding share capital of a bank or a lower percentage if such holding allows for the exercise of a significant influence.
Any individual or company that intends to increase, directly or indirectly, its significant participation in such a way that its share capital or voting rights after the acquisition reaches or exceeds 10%, 15%, 20%, 25%, 33%, 40%, 50%, 66% or 75% is required to give prior notice to the Bank of Spain of such transaction. Any acquisition without such prior notification, or before three months have elapsed after the date of such notification, or against the objection of the Bank of Spain, will produce the following results:
| | • | | the acquired shares will have no voting rights; and |
105
| | • | | if considered appropriate, the target bank may be taken over or its directors replaced and a sanction imposed. |
The Bank of Spain has a period of three months to object to a proposed transaction. Such objection may be based on the fact that the Bank of Spain does not consider the acquiring person suitable to guarantee the sound and prudent operation of the target bank.
Any individual or institution that intends to sell its significant participation or reduce the above mentioned percentages, or which, because of such sale, loses control of the entity, must give prior notice to the Bank of Spain, indicating the amount to be sold and the period in which the transaction is to be executed. Non-compliance with this requirement will result in sanctions.
The Ministry of Economy and the Treasury, following a proposal by the Bank of Spain, may, whenever the control by a person with a significant participation may jeopardize the sound and prudent management of a credit institution, adopt any of the following measures as deemed appropriate:
| | • | | suspend the voting rights corresponding to such shares for up to three years; |
| | • | | take control of the bank or replace the directors or |
| | • | | revoke the bank’s license. |
Tender Offers
As stated above, the Spanish legal regime concerning takeover bids was amended by Royal Decree 432/2003 of April 11, 2003, in order to introduce more cases in which it is necessary to launch a takeover in order to acquire a stake of the share capital of a listed company. Subject to certain exceptions, any individual or corporation proposing to acquire shares of a company’s share capital (or other securities that may directly or indirectly give the right to subscribe for such shares), which is fully or partly admitted for trading on a Spanish stock exchange, may not do so without first launching a public tender offer on the terms and conditions laid down in the Royal Decree, if it intends to appoint more than one-third but less than one-half of the directors of the target company.
E. Taxation
Spanish Tax Considerations
The following is a summary of the material Spanish tax consequences to U.S. Residents (as defined below) of the acquisition, ownership and disposition of BBVA’s ADSs or ordinary shares. This summary does not address all tax considerations that may be relevant to all categories of potential purchasers, some of whom (such as life insurance companies, tax-exempt entities, dealers in securities or financial institutions) may be subject to special rules. In particular, the summary deals only with the U.S. Holders (as defined below) that will hold ADSs or ordinary shares as capital assets and who do not at any time own individually, nor are treated as owning, 25% or more of BBVA’s shares, including ADSs.
As used in this particular section, the following terms have the following meanings:
(1) “U.S. Holder” means a beneficial owner of BBVA’s ADSs or ordinary shares that is for U.S. federal income tax purposes:
| | • | | a citizen or a resident of the United States, |
| | • | | a corporation or other entity treated as a corporation, created or organized under the laws of the United States or any political subdivision thereof, or |
| | • | | an estate or trust the income of which is subject to United States federal income tax without regard to its source. |
106
(2) “Treaty” means the Convention between the United States and the Kingdom of Spain for the Avoidance of Double Taxation and the Prevention of Fiscal Evasion with Respect to Taxes on Income, together with a related Protocol.
(3) “U.S. Resident” means a U.S. Holder that is a resident of the United States for the purposes of the Treaty and entitled to the benefits of the Treaty, whose holding is not effectively connected with (1) a permanent establishment in Spain through which such holder carries on or has carried on business, or (2) a fixed base in Spain from which such holder performs or has performed independent personal services.
Holders of ADSs or ordinary shares should consult their tax advisors, particularly as to the applicability of any tax treaty. The statements regarding Spanish tax laws set out below are based on interpretations of those laws in force as of the date of this Annual Report. Such statements also assume that each obligation in the Deposit Agreement and any related agreement will be performed in full accordance with the terms of those agreements.
Taxation of Dividends
Under Spanish law, dividends paid by BBVA to a holder of ordinary shares or ADSs who is not resident in Spain for tax purposes and does not operate through a permanent establishment in Spain, are subject to Spanish Non-Resident Income Tax, withheld at source, currently at a 15% tax rate. For these purposes, upon distribution of the dividend, BBVA or its paying agent will withhold an amount equal to the tax due according to the rules set forth above (i.e., applying the general withholding tax rate of 15%), transferring the resulting net amount to the depositary. Under the Treaty, if you are a U.S. Resident, you are also entitled to a tax rate of 15%. This tax rate is expected to change with the approval of bill 121/000080 onIncome tax of the Natural persons and of partial modification of the Laws of the Taxes on Societies, on the Revenue of Not residents and on the Patrimony, which is at the present in it’s approval procedure in the Spanish Congress. This bill, intended to become effective on January 1, 2007, would increase the tax rate on dividends to an 18%. For more information on these reform please refer to the Spanish Congress web page www.congreso.es .
Taxation of Rights
Distribution of preemptive rights to subscribe for new shares made with respect to your shares in BBVA will not be treated as income under Spanish law and, therefore, will not be subject to Spanish Non-Resident Income Tax. The exercise of such preemptive rights is not considered a taxable event under Spanish law and thus is not subject to Spanish tax. Capital gains derived from the disposition of preemptive rights obtained by U.S. Residents are generally not taxed in Spain provided that certain conditions are met (See “—Taxation of Capital Gains” below).
Taxation of Capital Gains
Under Spanish law, any capital gains derived from securities issued by persons residing in Spain for tax purposes are considered to be Spanish source income and, therefore, are taxable in Spain. For Spanish tax purposes, income obtained by you, if you are a U.S. Resident, from the sale of BBVA’s ADSs or ordinary shares will be treated as capital gains. Spanish Non-Resident Income Tax is currently levied at a 35% tax rate on capital gains obtained by persons who are not residents of Spain for tax purposes, who are not entitled to the benefit of any applicable treaty for the avoidance of double taxation and who do not operate through a fixed base or a permanent establishment in Spain.
Notwithstanding the above, capital gains derived from the transfer of shares on an official Spanish secondary stock market by any holder who is resident in a country that has entered into a treaty for the avoidance of double taxation with an “exchange of information” clause (the Treaty contains such a clause) will be exempt from taxation in Spain. Additionally, capital gains realized by non-residents of Spain who are entitled to the benefit of an applicable treaty for the avoidance of double taxation will, in the majority of cases, not be taxed in Spain (since most tax treaties provide for taxation only in the taxpayer’s country of residence). If you are a U.S. Resident, under of the Treaty, capital gains arising from the disposition of ordinary shares or ADSs will not be taxed in Spain. You will be required to establish that you are entitled to this exemption by providing to the
107
relevant Spanish tax authorities an IRS certificate of residence in the United States, together with the corresponding Spanish tax form.
Spanish Wealth Tax
If you do not reside in Spain and you hold shares located in Spain, you are subject to Spanish Wealth Tax (Spanish Law 19/1991), which imposes a tax on property located in Spain on the last day of any year. It is possible that the Spanish tax authorities may contend that all shares of a Spanish corporation and all ADSs representing such shares are located in Spain for Spanish tax purposes. If such a view were to prevail, and you are a non-resident of Spain who held BBVA’s ADSs or ordinary shares on the last day of any year, you would be subject to the Spanish Wealth Tax for such year at marginal rates varying between 0.2% and 2.5% of the average market value of such ordinary shares or ADSs during the last quarter of such year. U.S. Residents should consult their tax advisors with respect to the applicability of Spanish Wealth Tax.
Spanish Inheritance and Gift Taxes
Transfers of BBVA’s shares or ADRs upon death or by gift are subject to Spanish inheritance and gift taxes (Spanish Law 29/1987), if the transferee is a resident in Spain for tax purposes, or if BBVA’s shares or ADSs are located in Spain, regardless of the residence of the beneficiary. In this regard, the Spanish tax authorities may argue that all shares of a Spanish corporation and all ADSs representing such shares are located in Spain for Spanish tax purposes. The applicable tax rate, after applying all relevant factors, ranges between 7.65% and 81.6% for individuals, approximately.
Alternatively, corporations that are non-resident of Spain that receive BBVA’s shares or ADSs as a gift are subject to Spanish Non-Resident Income Tax at a 35% tax rate on the fair market value of such ordinary shares or ADSs as a capital gain. If the donee is a United States resident corporation, the exclusions available under the Treaty described in “—Taxation of Capital Gains” above will be applicable.
Spanish Transfer Tax
Transfers of BBVA’s ordinary shares or ADSs will be exempt from Transfer Tax (Impuesto sobre Transmisiones Patrimoniales) or Value-Added Tax. Additionally, no stamp duty will be levied on such transfers.
U.S. Tax Considerations
The following summary describes the material U.S. federal income tax consequences of the acquisition, ownership and disposition of ADSs or ordinary shares, but it does not purport to be a comprehensive description of all of the tax considerations that may be relevant to a particular person’s decision to acquire such securities. The summary applies only to U.S. Holders (as defined under “Spanish Tax Considerations” above) that hold ADSs or ordinary shares as capital assets for tax purposes and does not address all of the tax consequences that may be relevant to holders subject to special rules, such as:
| | • | | certain financial institutions; |
| | • | | dealers and traders in securities or foreign currencies; |
| | • | | persons holding ADSs or ordinary shares as part of a hedge, straddle, conversion transaction or other integrated transaction; |
| | • | | persons whose “functional currency” for U.S. federal income tax purposes is not the U.S. dollar; |
| | • | | persons liable for the alternative minimum tax; |
| | • | | tax-exempt organizations; |
| | • | | partnerships or other entities classified as partnerships for U.S. federal income tax purposes; |
| | • | | persons who acquired our ADSs or ordinary shares pursuant to the exercise of any employee stock option or otherwise as compensation; or |
108
| | • | | persons who own or are deemed to own 10% or more of our voting shares. |
The summary is based upon the tax laws of the United States including the Internal Revenue Code of 1986, as amended to the date hereof (the “Code”), administrative pronouncements, judicial decisions and final, temporary and proposed Treasury regulations, as of the date hereof. These laws are subject to change, possibly with retroactive effect. In addition, the summary is based on the Treaty (as defined under “Spanish Tax Considerations” above) and is based in part on representations of the depositary and assumes that each obligation provided for in or otherwise contemplated by BBVA’s deposit agreement or any other related document will be performed in accordance with its terms. Prospective purchasers of the ADSs or ordinary shares are urged to consult their tax advisors as to the U.S., Spanish or other tax consequences of the purchase, ownership and disposition of ADSs or ordinary shares in their particular circumstances, including the effect of any U.S. state or local tax laws.
For United States federal income tax purposes, U.S. Holders of ADSs will generally be treated as the owners of the underlying ordinary shares represented by those ADSs. Accordingly, no gain or loss will be recognized if a U.S. Holder exchanges ADSs for the underlying ordinary shares represented by those ADSs.
The U.S. Treasury has expressed concerns that parties to whom ADSs are pre-released may be taking actions that are inconsistent with the claiming of foreign tax credits for U.S. holders of ADSs. Such actions would also be inconsistent with the claiming of the reduced rate of tax applicable to dividends received by certain noncorporate U.S. Holders, as described below. Accordingly, the analysis of the creditability of Spanish taxes described below, and the availability of the reduced tax rate for dividends received by certain noncorporate U.S. Holders, could be affected by future actions that may be taken by the parties to whom the ADSs are released.
This discussion assumes that BBVA was not a passive foreign investment company (“PFIC”) for 2005 (as discussed below).
Taxation of Distributions
Distributions, before reduction for any Spanish income tax withheld by BBVA or its paying agent, made with respect to ADSs or ordinary shares (other than certain pro rata distributions of BBVA’s capital stock or rights to subscribe for shares of its capital stock) will be includible in the income of a U.S. Holder as ordinary dividend income, to the extent paid out of our current or accumulated earnings and profits (as determined in accordance with U.S. federal income tax principles). The amount of such dividends will be treated as foreign source dividend income and not be eligible for the “dividends received deduction” generally allowed to U.S. corporations under the Code. Subject to applicable limitations and the discussion above regarding concerns expressed by the U.S. Treasury, dividends paid to noncorporate U.S. Holders in taxable years beginning before January 1, 2009 will be taxable at a maximum tax rate of 15%. Noncorporate U.S. Holders should consult their own tax advisors to determine the implications of the rules regarding this favorable rate in their particular circumstances.
The amount of the distribution will equal the U.S. dollar value of the euro received, calculated by reference to the exchange rate in effect on the date such distribution is received (which, for U.S. Holders of ADSs, will be the date such distribution is received by the depositary), whether or not the depositary or U.S. Holder in fact converts any euro received into U.S. dollars at that time. If the dividend is converted into U.S. dollars on the date of receipt, a U.S. Holder generally should not be required to recognize foreign currency gain or loss in respect of the dividend income. A U.S. Holder may have foreign currency gain or loss if such dividend is not converted into U.S. dollars on the date of its receipt.
Subject to applicable limitations that may vary depending upon a U.S. Holder’s circumstances and subject to the discussion above regarding concerns expressed by the U.S. Treasury, a U.S. Holder will be entitled to a credit against its U.S. federal income tax liability, or a deduction in computing its U.S. federal taxable income, for Spanish income taxes withheld by BBVA or its paying agent. A U.S. Holder must satisfy minimum holding period requirements in order to be eligible to claim a foreign tax credit for foreign taxes withheld on dividends. The rules governing foreign tax credits are complex and, therefore, U.S. Holders should consult their tax regarding the availability of foreign tax credits in their particular circumstances.
109
Sale and Other Disposition of ADSs or Shares
Gain or loss realized by a U.S. Holder on (i) the sale or exchange of ADSs or ordinary shares or (ii) the depositary’s sale or exchange of ordinary shares received as distributions on the ADSs, will be subject to U.S. federal income tax as capital gain or loss in an amount equal to the difference between the U.S. Holder’s tax basis in the ADSs or ordinary shares and the amount realized on the disposition. Such gain or loss will be long-term capital gain or loss if the U.S. Holder held the ordinary shares or ADSs for more than one year. Gain or loss, if any, will generally be U.S. source for foreign tax credit purposes. The deductibility of capital losses is subject to limitations.
Passive Foreign Investment Company Rules
Based upon certain proposed Treasury regulations (“Proposed Regulations”) we believe that we were not a “passive foreign investment company”, or “PFIC”, for U.S. federal income tax purposes for our taxable year. However, since our PFIC status depends upon the composition of our income and assets and the market value of our assets (including, among others, less than 25% owned equity investments) from time to time and since there is no guarantee that the Proposed Regulations will be adopted in their current form, there can be no assurance that we will not be considered a PFIC for any taxable year.
If we were treated as a PFIC for any taxable year during which a U.S. Holder held ADSs or ordinary shares, gain recognized by such U.S. Holder on a sale or other disposition of an ADS or an ordinary share would be allocated ratably over the U.S. Holder’s holding period for the ADS or the ordinary share. The amounts allocated to the taxable year of the sale or other exchange and to any year before we became a PFIC would be taxed as ordinary income. The amount allocated to each other taxable year would be subject to tax at the highest rate in effect for ordinary income of taxpayers of the U.S. Holder’s type for such taxable year, and an interest charge would be imposed on the amount allocated to such taxable year. Similar tax rules would apply to any distribution in respect of ADSs or ordinary shares in excess of 125% of the average of the annual distributions on ADSs or ordinary shares received by the U.S. Holder during the preceding three years or the U.S. Holder’s holding period, whichever is shorter. Additionally, if we were a PFIC for any taxable year during which a U.S. Holder held an ADS or ordinary share, such U.S. Holder would be required to make an annual return on IRS Form 8621 for that year, describing the distributions received from BBVA and any gain realized on the disposition of ADSs or ordinary shares. Certain elections may be available (including a mark-to-market election) to U.S. persons that may mitigate the adverse consequences resulting from PFIC status.
Information Reporting and Backup Withholding
Information returns may be filed with the Internal Revenue Service in connection with payments of dividends on, and the proceeds from a sale or other disposition of, ADSs or ordinary shares. A U.S. Holder may be subject to U.S. backup withholding on these payments if the U.S. Holder fails to provide its taxpayer identification number to the paying agent and comply with certain certification procedures or otherwise establish an exemption from backup withholding. The amount of any backup withholding from a payment to a U.S. Holder will be allowed as a credit against the U.S. Holder’s U.S. federal income tax liability and may entitle the U.S. Holder to a refund, provided that the required information is furnished to the Internal Revenue Service.
F. Dividends and Paying Agents
Not applicable.
G. Statement by Experts
Not applicable.
H. Documents on Display
The documents concerning BBVA which are referred to in this Annual Report may be inspected at its offices at Plaza de San Nicolás 4, 48005 Bilbao, Spain. In addition, we are subject to the information requirements of the Exchange Act, except that as a foreign issuer, we are not subject to the proxy rules or the short-swing profit disclosure rules of the Exchange Act. In accordance with these statutory requirements, we file or furnish reports and other information with the SEC. Reports and other information filed or furnished by BBVA with the SEC may
110
be inspected and copied at the public reference facilities maintained by the SEC at 100 F Street, N.E., Washington, D.C. 20549. Copies of such material may also be inspected at the offices of the New York Stock Exchange, 11 Wall Street, New York, New York 10005, on which BBVA’s ADSs are listed. In addition, the SEC maintains a web site that contains information filed electronically with the SEC, which can be accessed over the internet at http://www.sec.gov.
I. Subsidiary Information
Not applicable.
111
| ITEM 11. | QUANTITATIVE AND QUALITATIVE DISCLOSURES ABOUT MARKET RISK |
RISK MANAGEMENT
BBVA’s different types of business activities involve many types of risk which require a single risk management system for the entire organization. The BBVA Group has developed its own overall management system for the proper identification, measurement and evaluation of risk.
This system’s main features are the following:
| | • | | Experience-based risk valuation criteria. |
| | • | | Homogeneous application to all the Group’s activities and businesses. |
| | • | | Based on a corporate risk governance framework which, in accordance with the recommendations of supervisory bodies, establishes a clear separation of functions and responsibilities and guarantees the independence of the risk function. |
| | • | | Enables the Group to manage each type of risk (credit, market, structural and operational), both separately and integrated with the others. |
To that end, the Group’s risk-management system incorporates three types of elements:
| | • | | Consistent measuring and monitoring tools that cover the business activities and risks involved in, among others, customer portfolios, products, processes and balance sheets. |
| | • | | Databases that enable the necessary information to be gathered, calculation engines and management systems that help to obtain figures for expected losses and economic capital from the most basic aggregate levels, providing the measurements that make up the basis of overall risk management. |
| | • | | Management criteria, circuits and procedures, translated into risk policies that ensure the management model is integrated into the day-to-day decision-making process from the most basic level to the highest ones such as the Risk Committee of the board of directors and the board itself. |
Proper integration of these components enables an overall risk profile to be drawn up and monitored per business unit and type of risk, quantified in terms of economic capital and expected losses.
Under this general framework and in line with its business strategy, the Group determines and applies risk policies in its day-to-day business, setting maximum values of credit risk exposure for counterparties or groups, establishing limits for maximum exposure to market and structural risks and analyzing operational risks incurred in its various activities in order to mitigate their impact.
BBVA is working to meet the Basel II Capital Accord which will enable capital consumption to be determined on the basis of internal models as from 2008. The group is in the process of validating its advanced internal models (IRB Advanced) for credit risk measurement. In the short term, within the framework of current regulations, the Bank has began using its own internal market risk model (after obtaining proper authorization) to calculate capital.
OVERALL RISK MAP
As of December 31, 2005, the Group’s consumption of economic capital was €15,701 million, a 23% increase as compared to December 31, 2004. Economic capital is a measure of the maximum losses that can be incurred with a set confidence level (99.9%) consistent with a target level of solvency. Measurements of economic capital fit into management accounting by business units and their intrinsic valuation.
By type of risk, credit risk continued to account for the largest portion (60%) of the Group’s use of economic capital at December 31, 2005. At the same date, market risk, which includes structural balance sheet risks associated with variations in interest and exchange rates and equities portfolio risk, accounted for 25% of total
112
economic capital and operational risk accounted for 11% of total economic capital. Non-banking activities accounted for the remaining 4% of total economic capital.
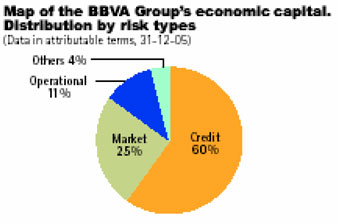
The accompanying graph shows the distribution of economic capital of the Group, by business area as of December 31, 2005.
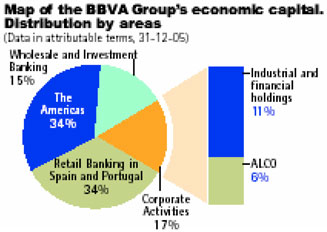
The distribution of economic capital as of December 31, 2005, is as follows: 34% of the economic capital corresponds to Retail Banking in Spain and Portugal, 34% to the Americas area, 15% to Wholesale and Investment Banking and 17% to Corporate Activities.
The average yield adjusted to risks by business area is the following:
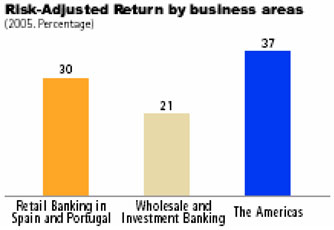
Economic capital distribution by country is the following at December 31, 2005: 53% in Spain, 22% in Mexico, 5% in other investment grade countries and territories in the Americas, such as Mexico, Chile and Puerto
113
Rico, and 7% in non-investment grade countries and territories in the Americas. The remaining 14% of economic capital is distributed in the different countries where the corporate activities business area and our other businesses operate.
Map of the BBVA Group’s economical capital
Geographical distribution
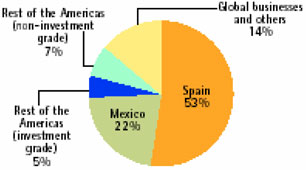
The Group’s financial solvency level is controlled by the monitoring of two ratios that relate to the risk weighted assets of the Group to core capital (level 0) and total capital (level 1). Total capital (level 1) includes in the calculation preferred shares and eligible subordinated debt, which are not included in the core capital (le vel 0) calculation. As of December 31, 2005, the ratios were 8.8% and 14.7%, respectively, for level 0 and level 1, better than the 8% and 12.5% medium and long-term benchmark ratios that have been established by BBVA in accordance with BBVA’s current rating levels.
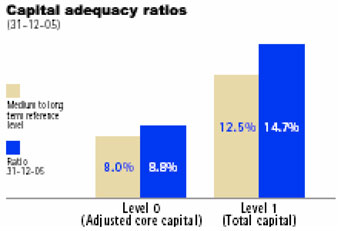
CREDIT RISK MANAGEMENT
Methodologies for credit risk quantification
A credit risk profile is drawn up in two ways: (i) expected loss and (ii) economic capital, which relates to unexpected loss. The Group has implemented tools for loan classification (ratings and scorings) and an infrastructure for keeping records of past risk to allow for an estimation of the necessary inputs (probability of default, loss in the event of default and exposure upon default) for calculating expected loss and economic capital. These techniques, in turn, play a key role on two levels: internal risk management and compliance with regulatory requirements.
We believe these tools are an essential component of our risk management framework. Their use alongside data on costs and returns allows up to apply measures in order to assess how risk and return are
114
combined. Such measures have a wide range of possible applications, from decision-making on business strategy to decisions-making on individual transactions.
The development of the internal Risk-Adjusted Return (RAR) information system (supporting the internal risk model) has led to the introduction of databases that can be used to estimate the risk parameters required in the calculation of economic capital and expected loss, following best practices in the market and the guidelines of Basel II.
BBVA continues to develop its RAR project in order to create the historical default database and the economic capital, expected loss and RAR calculations at the transaction level. During 2005, our subsidiaries in Mexico, Colombia and Peru concluded their credit risk calculations. With these countries and the banks in Spain, more than 80% of the risk is already covered. In 2006, our subsidiaries in Argentina, Chile, Venezuela and Puerto Rico are expected to finish their credit risk calculations.
BBVA Master Scale
BBVA has a master scale designed for the homogeneous classification of the Group’s different risk portfolios. Two versions of this scale exist: the narrow one, which classifies outstanding risks into 17 groups, and the broad one, which breaks them down into 34 categories.
BBVA MASTER SCALE
(Narrow version)
| | | | | | |
Master scale rating | | Default probability (in basis points) |
| | Average | | Minimum
From > - | | Maximum
to < |
AAA | | 1 | | 0 | | 2 |
AA+ | | 2 | | 2 | | 3 |
AA | | 3 | | 3 | | 4 |
AA- | | 4 | | 4 | | 5 |
A+ | | 5 | | 5 | | 6 |
A | | 8 | | 6 | | 9 |
A- | | 10 | | 9 | | 11 |
BBB+ | | 14 | | 11 | | 17 |
BBB | | 20 | | 17 | | 24 |
BBB- | | 31 | | 24 | | 39 |
BB+ | | 51 | | 39 | | 67 |
BB | | 88 | | 67 | | 116 |
BB- | | 150 | | 116 | | 194 |
B+ | | 255 | | 194 | | 335 |
B | | 441 | | 335 | | 581 |
B- | | 785 | | 581 | | 1,061 |
C | | 2,122 | | 1,061 | | 4,243 |
Probability of default
BBVA has two classification tools (scorings and ratings) that allow for measuring the creditworthiness of transactions or customers, as applicable, by allocating a score. BBVA also allocates the probability of default by using BBVA’s historical databases to ascertain how this probability varies in terms of the scores allocated by these tools and of other potentially relevant factors (e.g. the seasoning of the transaction).
Scorings
These are the tools used to score retail transactions (consumer loans, mortgages, credit cards, retailers, etc.). The accompanying graphs show the default rates, at one-year intervals, for some of the Group’s tools. The time at which the maximum probability of default is reached is called peak seasoning. The default rates are shown for consumer and mortgage tools at one-year intervals in terms of the contracts’ seasoning in years. Given that the seasoning process is very fast, the default rates for credit card tools are shown on a monthly basis.
115
Ratings
Rating tools classify customers (not retail-type transactions). The Group has different rating tools for classifying different customer segments.
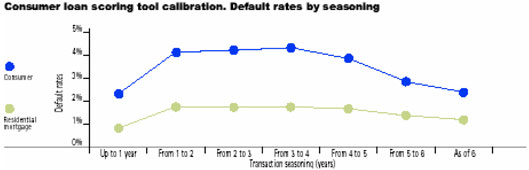
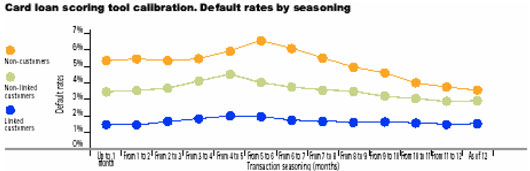
The following graph shows the adjusted probabilities of default for the tool for rating small- and medium sized business (“SMEs”) (firms with turnover between €5 million and €150 million) against the historical record of defaults.

In those wholesale portfolios in which the default rate is very low (e.g., sovereign borrowers, financial institutions and large corporate) internal information is complemented by external data on defaults provided by rating agencies.
Once the probability of default has been obtained for transactions/customers and adjusted to the business cycle, this probability is linked to the BBVA Group master scale.
116
LGD (Loss given default)
In 2005, the BBVA Group continued to further its knowledge and analysis of Loss Given Default (“LGD”) rates in its portfolios, both at the facility level (retail) and the obligor level (for non-retail exposures). Defined as the percentage of risk exposure that is not expected to be recovered in the event of default, LGD constitutes one of the key factors in quantitative risk assessment.
The method the BBVA Group mainly uses for the calculation of LGD is the “Workout LGD”. This method is based on discounting the cash flows of the defaulted exposure that have been collected at different times of the recovery process. In the case of portfolios with low default rates, which do not have enough data to obtain a reliable estimate by means of the Workout LGD method, other methods are used, such as external sources for obtaining market references on LGD rates suited to the internal portfolio.
The graph provided below shows the LGD rate distribution for BBVA’s mortgage portfolio in Spain. This bimodal LGD pattern is also repeated in other operating areas. It may be noted that in an extremely high percentage of cases (90%) involving mortgages, almost all the outstanding debt is recovered, whereas small recoveries are observed only in few cases.
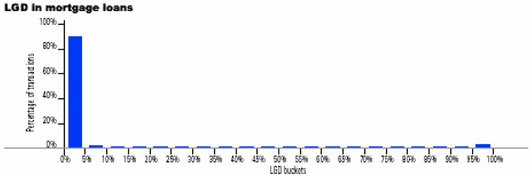
As in the case of the calculation of probabilities, the databases built in the RAR project are used to analyze the link between the LGD and the nature of the transactions or customers.
For illustrative purposes, a number of analyses carried out on the BBVA portfolio in Spain are shown below.
a) Seasoning
One of the key factors for determining LGD is the period elapsed between contract arrangement and default. The graph shows that the longer the seasoning of the contract, the lower its LGD. The axis on the left corresponds to average LGD, while the axis on the right reflects the percentage of cases for each portfolio time period.
117
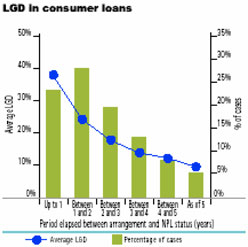
b) Loan/value ratio

c) Time elapsed in default
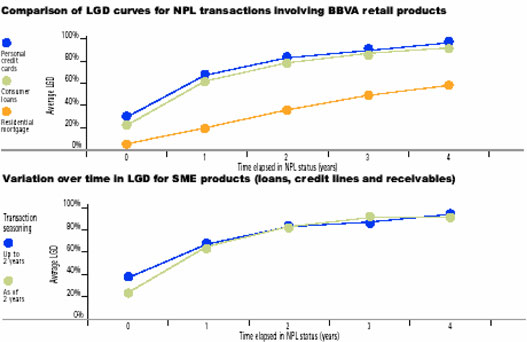
118
LGD FOR MORTGAGE LOANS WITH LTV BETWEEN 65% AND 85%
| | | | | | | | | | | | | | | | | | | | | |
| | | Time in NPL status (in years) | |
Transaction seasoning | | Not in NPL status (period - 0) | | | Upto 1 | | | Between
1 and 2 | | | Between
2 and 3 | | | Between
3 and 4 | | | Between
4 and 5 | | | As of 6 | |
Upto 1 year | | 7.3 | % | | 27.9 | % | | 50.4 | % | | 65.1 | % | | 71.8 | % | | 75.2 | % | | 100 | % |
Between 1 and 2 years | | 5.7 | % | | 23.0 | % | | 45.3 | % | | 57.8 | % | | 63.0 | % | | 65.2 | % | | 100 | % |
Between 2 and 3 years | | 4.2 | % | | 17.4 | % | | 33.7 | % | | 54.9 | % | | 59.5 | % | | 61.5 | % | | 100 | % |
Between 3 and 4 years | | 3.4 | % | | 17.4 | % | | 33.7 | % | | 38.3 | % | | 41.3 | % | | 50.7 | % | | 100 | % |
| | | | | | | | | | | | | | | | | | | | | |
As of 4 years | | 3.1 | % | | 17.4 | % | | 33.7 | % | | 38.3 | % | | 41.3 | % | | 50.7 | % | | 100 | % |
| | | | | | | | | | | | | | | | | | | | | |
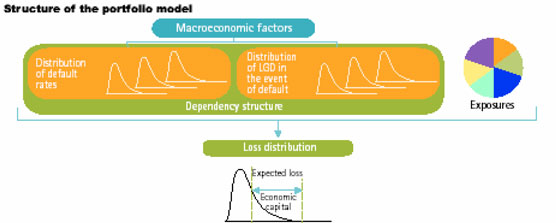
CREDIT RISK IN 2005
The Group’s maximum exposure to credit risk stood at €455,282 million at year-end 2005, a year-on-year increase of 24.2%. By business areas, Retail Banking in Spain and Portugal accounted for 40.1% of the exposure, Wholesale and Investment Banking for 32.2% and the Americas for 24.2%.
MAXIMUM EXPOSURE TO CREDIT RISK
(Million euros. 31-12-05)
| | | | | | | | | | | |
| | | GROUP
TOTAL | | Retail
Banking | | Wholesale
Banking | | The
Americas | | Others | |
GROSS CREDIT RISK (DRAWN) | | 252,275 | | 137,914 | | 69,412 | | 48,522 | | (3,573 | ) |
Loans and receivables | | 222,413 | | 131,114 | | 47,724 | | 45,720 | | (2,145 | ) |
Contingent liabilities | | 29,862 | | 6,800 | | 21,688 | | 2,802 | | (1,428 | ) |
| | | | | |
TRADING ACTIVITIES | | 118,005 | | 11,411 | | 35,136 | | 40,132 | | 31,327 | |
Credit entities | | 27,470 | | 282 | | 13,400 | | 10,431 | | 3,357 | |
Fixed income | | 82,010 | | 11,129 | | 16,708 | | 26,202 | | 27,970 | |
Derivatives | | 8,526 | | — | | 5,028 | | 3,498 | | — | |
| | | | | |
THIRD-PARTY LIABILITIES | | 85,001 | | 33,263 | | 41,845 | | 21,410 | | (11,571 | ) |
| | | | | | | | | | | |
TOTAL | | 455,282 | | 182,588 | | 146,393 | | 110,063 | | 16,236 | |
| | | | | | | | | | | |
All items recorded significant increases at December 31, 2005 compared to December 31, 2004: customer lending risks (55% of the total, including contingent liabilities) rose by 27.3%, third-party liabilities (accounting for 19%) rose by 40.0% and the potential exposure to lending risk in market activities including potential exposure for derivatives (26% of the total) rose by 9.7%. These significant increases were principally due to increases in the Group’s lending activities.
119
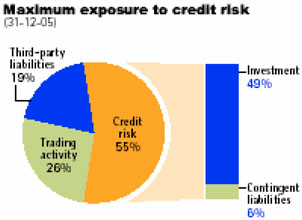
Insofar as lending risk is concerned, the acquisition in 2005 of Laredo National Bancshares, Hipotecaria Nacional and Granahorrar, as well as the strengthening of currencies in the Americas against the euro, altered the distribution by business and geographical areas. 2005 thus witnessed an increase in the relative weight of the Americas and a fall off in Retail Banking in Spain and Portugal by 3.3 percentage points (now accounting for 53.9% of the Group’s total risk) and by 0.5 percentage points in Wholesale and Investment Banking, down to 27.1% of the total.
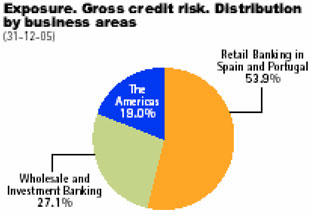
By geographical area, the Group in Spain (including branches abroad, largely in Europe) accounts for 78.9% of gross credit risk, the rest of Europe accounts for 2.6% of gross credit risk and exposure in the Americas accounts for 18.5% (14.5% in 2004) of gross credit risk. The vast majority of gross credit risk exposure in the Americas at December 31, 2005 (75.9%, as opposed to 73.9% at December 31, 2004) is concentrated in investment grade countries.
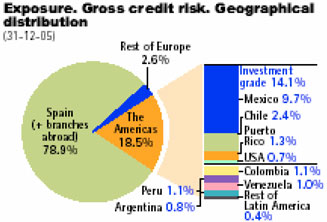
120
The accompanying table provides a breakdown of customer lending distribution by sector at year-end 2005. Lending to the resident private sector in Spain amounted to €140 billion, with risks being equally divided between lending to private individuals (50%) and business activities (50%), without significant concentrations in sectors more sensitive to the current economic climate.
CUSTOMER LENDING BY SECTORS
(Million euros. 31-12-05)
| | | | | | |
| | | Total | | Residents | | Non-residents |
Public Sector | | 22,125 | | 16,089 | | 6,036 |
Agriculture | | 2,504 | | 1,550 | | 955 |
Industry | | 17,930 | | 14,774 | | 3,155 |
Real estate and development | | 36,562 | | 24,937 | | 11,624 |
Commercial and financial | | 36,194 | | 11,736 | | 24,459 |
Loans to individual customers | | 82,583 | | 67,964 | | 14,619 |
Leasing | | 6,726 | | 5,910 | | 816 |
Others | | 17,370 | | 13,167 | | 4,203 |
| | | | | | |
SUBTOTAL | | 221,995 | | 156,128 | | 65,866 |
| | | | | | |
Interest, fees and others | | 418 | | 109 | | 309 |
| | | | | | |
TOTAL | | 222,413 | | 156,237 | | 66,176 |
| | | | | | |
The distribution of the exposure by ratings, including companies, financial entities, institutions and sovereign obligors, reveals that over 59% of the exposure to lending risk is concentrated in customers with an “A” rating or higher, as shown in following graph.
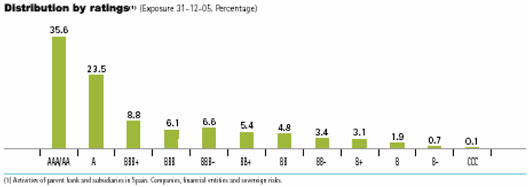
If sovereign risks are excluded, 52% of our exposure is still rated “A” or higher and 77% of the exposure has a rating equal to or better than “BBB-”.
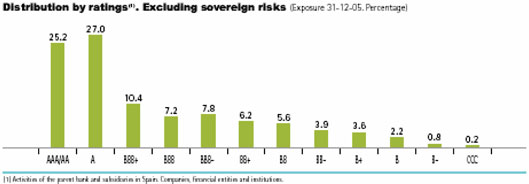
121
The distribution of the exposure by ratings of companies is the following:
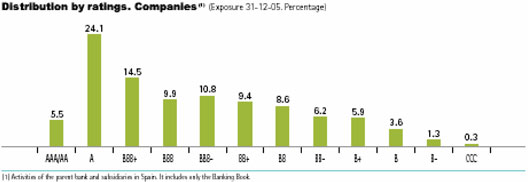
Expected losses
In accordance with the above ratings distribution, the Group’s expected losses (adjusted upwards in line with the business cycle) are estimated to be €1,664 million at December 31, 2005.
As seen in the following graph, at December 31, 2005 attributable expected losses by main business areas according to their exposure – Retail Banking in Spain and Portugal accounts for 41% of the exposure and Wholesale and Investment Banking accounts for 30% – stand at 0.42% and 0.08%, respectively, with the expected loss in Mexico being 0.99% and expected losses in the rest of the Americas being 1.17%.
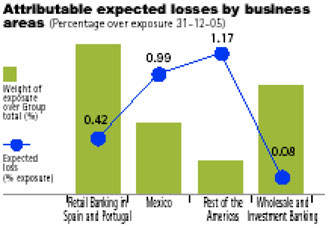
RISK STATISTICS FOR THE MAIN BBVA, S.A. PORTFOLIOS
(31-12-05)
| | | | | | | | | | |
Portfolios | | Expense(1) | | Expected losses | | Economic capital |
| | Million euros | | Million euros | | % | | Million euros | | % |
Consumer loans | | 6,278 | | 62 | | 0.99 | | 285 | | 4.54 |
Mortgage | | 56,826 | | 98 | | 0.17 | | 978 | | 1.72 |
SMEs | | 15,952 | | 63 | | 0.40 | | 571 | | 3.58 |
Corporates | | 39,273 | | 28 | | 0.07 | | 803 | | 2.04 |
| (1) | Includes off-balance sheet positions to which the corresponding conversion factors are applied. |
| | Segmentation according to fund used for rating. |
Concentration
The BBVA Group has credit risk exposure (investment and guarantees) to 79 groups of companies that exceeds €200 million, amounting to a total risk of €37,151 million at December 31, 2005 — 14.7% of the Group’s overall risk, of which 95% has an investment grade loan rating. From the perspective of transaction source, at
122
December 31, 2005, 67% is concentrated in Spain, 21% in the foreign network and 12% in Latin America (9% in Mexico). The major sectors in which the credit exposure is concentrated are: institutional (30%), real-estate and development (17%), telecommunications (10%) and utilities (10%).
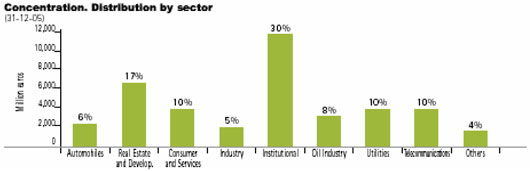
Non-performing loans (NPL)
Over the course of 2005, BBVA has continued its trend of improvement in credit risk quality indicators. The value of NPL (customer lending and contingent liabilities) stood at €2,382 million at year-end 2005, as compared to €2,248 million at December 31, 2004. Nonetheless, adjusting for the impact of changes in consolidation in Mexico, the United States and Colombia resulting from acquisitions of Hipotecaria Nacional, S.A. de C.V. de México, Laredo National Bancshares, Inc. and Fondo de Garantías de Instituciones Financieras de Colombia, FOGAFIN, respectively, and of exchange rate variations, NPL went down by €189 million at December 31, 2005 compared to December 31, 2004.
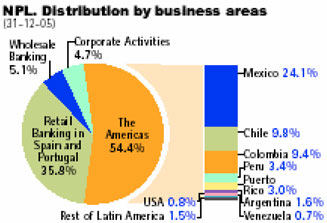
This decrease is due to a new reduction in the non-performing loans ratio over credit risk, despite the more stringent criteria for NPL accounting, falling from 1.08% at December 31, 2004 to 0.86% at December 31, 2005, and to a better recovery rate rising to 36.5% of the critical mass (which is composed of the existing NPL at the end of 2004 plus the NPL originated during 2005), as opposed to 31.4% for 2004.
The accompanying table provides a breakdown of movements in non-performing loans in 2005 and 2004.
123
TREND IN NPL
(Million euros)
| | | | | | |
| | | 2005 | | | 2004 | |
BEGINNING BALANCE | | 2,248 | | | 3,028 | |
| | | | | | |
Entries | | 1,943 | | | 1,988 | |
Recoveries | | (1,531 | ) | | (1,575 | ) |
NET ENTRY | | 412 | | | 413 | |
| | | | | | |
Transfers to write-offs | | (667 | ) | | (713 | ) |
Exchange differences and others | | 389 | | | (480 | ) |
| | | | | | |
FINAL BALANCE | | 2,382 | | | 2,248 | |
| | | | | | |
All business areas recorded a good performance in 2005, based on the trend in net entries, as shown in the table provided.
NPL TREND BY BUSINESS AREAS
(million euros)
| | | | | | | | | | | | | | | | | | | | | | | |
| | | Retail
Banking | | | Wholesale
Banking | | | The Americas | | | Others |
| | | 2005 | | | 2004 | | | 2005 | | | 2004 | | | 2005 | | | 2004 | | | 2005 | | | 2004 |
BEGINNING BALANCE | | 940 | | | 1,040 | | | 169 | | | 255 | | | 1,046 | | | 1,687 | | | 93 | | | 46 |
| | | | | | | | | | | | | | | | | | | | | | | |
NET ENTRY | | 121 | | | 170 | | | (39 | ) | | (44 | ) | | 326 | | | 260 | | | 4 | | | 27 |
| | | | | | | | | | | | | | | | | | | | | | | |
Transfers to write-offs | | (205 | ) | | (219 | ) | | (15 | ) | | (36 | ) | | (443 | ) | | (458 | ) | | (4 | ) | | — |
Exchange differences and others | | (3 | ) | | (51 | ) | | 8 | | | (6 | ) | | 367 | | | (443 | ) | | 17 | | | 20 |
| | | | | | | | | | | | | | | | | | | | | | | |
FINAL BALANCE | | 853 | | | 940 | | | 123 | | | 169 | | | 1,296 | | | 1,046 | | | 110 | | | 93 |
| | | | | | | | | | | | | | | | | | | | | | | |
As a result of strong growth in lending and the containment of past-due balances, there was a further reduction in the Group’s NPL ratio of 19 basis points, down to 0.94% at year-end 2005, as opposed to 1.13% at year-end 2004.
All business areas reduced their NPL ratio at December 31, 2005 compared to December 31, 2004: Retail Banking in Spain and Portugal by 20 basis points to 0.62%; Wholesale and Investment Banking by 12 basis points to 0.18%; and the Americas by 77 basis points to 2.67%.
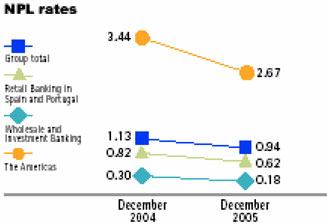
Given that provisioning for credit risk in the customer lending portfolio rose by 21.8% to €6,015 million at December 31, 2005, the BBVA Group’s NPL coverage rate increased to 252.5% at year-end 2005 (219.7% at year-end 2004), thereby reinforcing the Group’s solvency. This performance has been recorded across the board in all business areas, rising to 315.7% in Retail Banking, 728.7% in Wholesale Banking and 183.8% in the Americas.
124
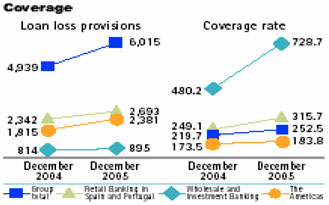
RISK MANAGEMENT IN MARKET AREAS
The BBVA Group manages jointly credit and market risk in trading activity, within a limits system framework approved by the Executive Committee and adapted to the nature of the business.
The most widely used measurement model is Value-at-Risk, or VaR (the maximum loss that could be incurred by the portfolios for a given confidence level, as a result of adverse fluctuations in market variables), with a confidence level of 99%, and a one-day horizon. This measurement includes basis risk, spread, convexity and other risks associated with embedded options and structured products.
The structure for market risk limits has been supplemented and reinforced in 2005. It includes an overall VaR per business unit and involves specific sub-limits according to the type of risk, business activity and trading unit.
Risk monitoring in terms of VaR is undertaken using two complementary and dynamic methods. Priority is given to the use of limits based on the measuring of 1-day VaR with equally weighted observations of the daily information on the past year’s market (VaR without smoothing), and monitoring is also made of the VaR that gives greatest importance to the immediate past (with exponential smoothing). Limits are likewise established for economic capital and VaR stress situations, considering the impact of past financial crises and potential and foreseeable future scenarios.
The dynamic nature of the limits allows for linking authorized risk levels for market business units to their performance over the year, reducing the limits in the event of negative aggregate results. In order to foresee and mitigate the effects of these situations, loss limits and other control measures, such as delta sensitivities, are also introduced. The proactive management of this limits structure is accompanied by a broad range of indicators and warning alerts that immediately trigger procedures designed to cope with those situations that might possibly compromise the activities of the business area.
125
MARKET RISK 2005
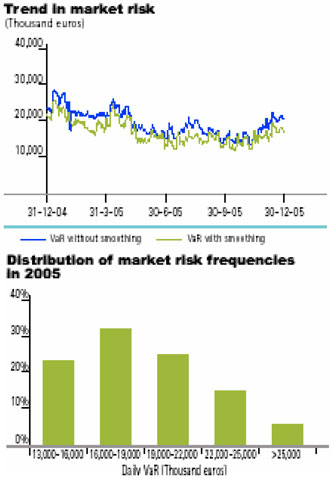
MARKET RISK BY RISK FACTORS IN 2005
(Thousands euros)
| | | | | | | | | | |
| | | | | | Daily VaR |
| | | 31-12-05 | | | Average | | | Maximum | | Minimum |
Interest(1) | | 14,232 | | | 12,150 | | | 20,178 | | 7,005 |
Exchange rate(1) | | 1,717 | | | 1,646 | | | 5,692 | | 475 |
Equity(1) | | 2,024 | | | 2,113 | | | 4,751 | | 1,026 |
Vega and correlation | | 5,009 | | | 5,487 | | | 6,985 | | 4,243 |
Diversification effect | | (2,559 | ) | | (2,357 | ) | | — | | — |
| | | | | | | | | | |
TOTAL | | 20,424 | | | 19,040 | | | 28,314 | | 12,918 |
| | | | | | | | | | |
| (1) | Includes gamma risk of fixed-income, exchange rate and equity options, respectively. Interest risk includes the spread. |
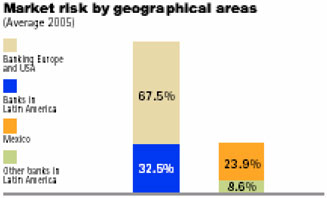
126
Regarding the limit system framework, the average use of limits by the Group’s main business units, as calculated without exponential smoothing, at December 31, 2005, amounted to 23% for trading activities in developed markets, 66% for Bancomer trading activities and 50% for the remaining Latin American trading activities.
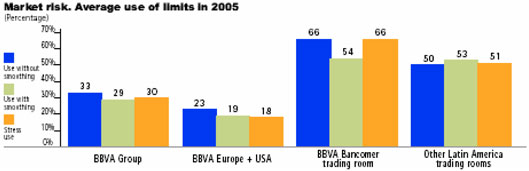
The following graph shows the back-testing comparison in 2005, which makes a day-to-day comparison between recent management results (profits and losses) and risks level estimated by the model (Daily Var).
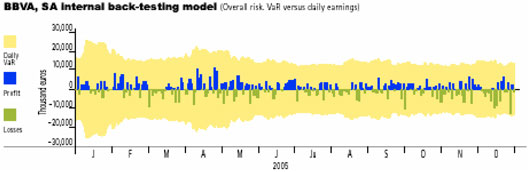
CREDIT RISK IN MARKET ACTIVITIES
Our system for measuring credit risk in OTC transactions is based on Monte Carlo simulation for all transactions. Our system:
| | • | | takes into account the portfolio effect, considering correlations that exist between the different market variables, thereby reflecting the offsetting effect between transactions; |
| | • | | incorporates the term effect, whereby portfolios comprising short and long-term transactions are dealt with jointly; |
| | • | | measures risk with counterparties with whom legal netting and collateral contracts are set (ISDA, CSA, CMOF, etc.); and |
| | • | | enables the credit risk posed by exotic products to be quantified more accurately. |
The net market value of the instruments in our OTC portfolio at December 31, 2005 was €1,254 million, with a 75 month average residual term, whereas the portfolio’s gross replacement value was €12,951 million at December 31, 2005.
127
OTC DERIVATIVES. EQUIVALENT MAXIMUM EXPOSURE
(Million euros)
| | | | | | | | | | |
OTC financial instruments | | Gross
replacement
value | | Net
replacement
value | | | Equivalent
maximum
exposure | | | Weighted
average
term |
IRS | | 10,032 | | 1,715 | | | 12,120 | | | 68 |
FRAs | | 24 | | 13 | | | 31 | | | 12 |
Interest rate options | | 509 | | (154 | ) | | 606 | | | 56 |
OTC interest rate diversification | | | | | | | (25 | ) | | |
| | | | | | | | | | |
TOTAL OTC INTEREST RATE | | 10,565 | | 1,575 | | | 12,732 | | | 68 |
| | | | | | | | | | |
Forward FX | | 633 | | 42 | | | 1,308 | | | 31 |
Currency swaps | | 419 | | 58 | | | 788 | | | 66 |
Currency options | | 102 | | (92 | ) | | 92 | | | 23 |
OTC exchange rate diversification | | | | | | | (309 | ) | | |
| | | | | | | | | | |
TOTAL OTC EXCHANGE RATE | | 1,155 | | 8 | | | 1,879 | | | 58 |
| | | | | | | | | | |
OTC equity | | 623 | | [588 | ] | | 728 | | | 31 |
Fixed income and others | | 609 | | 260 | | | 986 | | | 121 |
OTC equity and others diversification | | | | | | | (146 | ) | | |
| | | | | | | | | | |
TOTAL OTC EQUITY AND OTHERS | | 1,231 | | (328 | ) | | 1,569 | | | 110 |
| | | | | | | | | | |
TOTAL DIVERSIFICATION | | | | | | | (404 | ) | | |
| | | | | | | | | | |
TOTAL | | 12,951 | | 1,254 | | | 15,777 | | | 75 |
| | | | | | | | | | |
DISTRIBUTION BY MATURITIES. MAXIMUM EXPOSURE IN OTC FINANCIAL INSTRUMENTS
(Million euros)
| | | | | | | | | | | | | | | | | | |
| | | 2005 |
Type of product | | Upto
6 months | | | Upto
1 year | | Upto
3 years | | Upto
5 years | | Upto
10 years | | Upto
15 years | | | Upto
25 years | | As of
15 years |
OTC interest rate | | 12,732 | | | 12,540 | | 11,171 | | 6,802 | | 4,098 | | 1,071 | | | 718 | | 185 |
OTC exchange rate | | 1,879 | | | 1,202 | | 798 | | 438 | | 248 | | 79 | | | 58 | | 1 |
OTC equity and others | | 1,522 | | | 1,569 | | 1,527 | | 1,071 | | 734 | | 543 | | | 425 | | 91 |
Total diversification | | (358 | ) | | | | | | | | | | (1 | ) | | | | |
| | | | | | | | | | | | | | | | | | |
TOTAL | | 15,777 | | | 15,312 | | 13,496 | | 8,311 | | 5,080 | | 1,692 | | | 1,201 | | 277 |
| | | | | | | | | | | | | | | | | | |
The counterparty risk assumed in this activity involves entities with a high credit rating, equal to or higher than “A-” in 90% of cases. The exposure at December 31, 2005 is mainly concentrated in financial entities (89%) while the remaining 11% exposure is due to corporations and other clients.
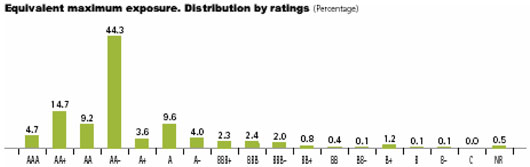
At December 31, 2005, as categorized by geographic areas, the greater exposure lies in Europe (74%) and North America (21%), which together accounted for 95% of our total exposure.
128
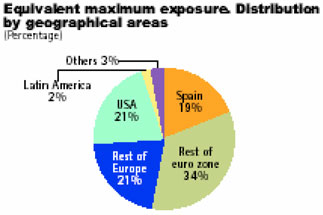
STRUCTURAL RISKS
STRUCTURAL RISK MANAGEMENT
The BBVA Group’s exposure to variations in market interest rates is one of the financial risks inherent to banking. Both the parallel movements of yield curves and the change in their slope, as well as the embedded options sensitivity present in certain banking operations, are taken into account when assessing risk.
The Assets and Liabilities Committee (ALCO) actively manages the BBVA Group’s asset and liability risk, excluding trading activity, in accordance with the exposure profile established by the BBVA Group. Decision-making explicitly considers interest rate risk measures, whose monitoring and supervision are carried out by the Risk Area, as an independent unit responsible for this assessment, as well as the design of systems for measuring, monitoring, reporting and supervising limits policies. The increasing sophistication of financial products and the strategies designed by the ALCO, as well as risk assessment models, have led to the BBVA Group including new measurement tools in 2005 in order to further enlarge upon its scope for calculation and analysis.
The following table of gaps shows the different asset and liability items at December 31, 2005 distributed by time periods in accordance with their date of maturity or repricing, depending on whether they are fixed or variable rate.
MATRIX OF MATURITIES OR REPRICING DATES ON THE CONSOLIDATED BALANCE SHEET IN EUROS. EX TRADING ACTIVITY
(Thousand euros)
| | | | | | | | | | | | | | | | | | | | | | | |
| | | Balance | | 1 month | | | 1-3
months | | | 3-12
months | | 1-2
years | | 2-3
years | | | 3-4
years | | 4-5
years | | | As of
5 years | |
ASSETS | | | | | | | | | | | | | | | | | | | | | | | |
Money market | | 22,152,972 | | 11,371,856 | | | 6,368,653 | | | 2,998,655 | | 53,257 | | 107,798 | | | 430,407 | | 613,376 | | | 208,969 | |
Lending | | 151,893,957 | | 26,451,775 | | | 38,874,654 | | | 70,207,121 | | 4,563,639 | | 3,365,508 | | | 2,083,676 | | 1,384,401 | | | 4,963,182 | |
Securities portfolio | | 31,892,613 | | 5,904,803 | | | 1,544,025 | | | 8,305,483 | | 4,554,387 | | 2,467,314 | | | 2,397,515 | | 570,977 | | | 5,148,109 | |
Other sensitive assets | | 15,020,680 | | 12,685,504 | | | 48,275 | | | 185,190 | | 49,118 | | 807,053 | | | 892,497 | | 203,784 | | | 169,2 68 | |
Derivatives | | 59,138,298 | | 5,939,477 | | | 6,213,714 | | | 3,702,912 | | 7,224,242 | | 3,052,961 | | | 6,919,629 | | 8,832,821 | | | 17,252,542 | |
| | | | | | | | | | | | | | | | | | | | | | | |
TOTAL SENSITIVE ASSETS | | 280,098,530 | | 62,333,416 | | | 53,049,322 | | | 85,399,351 | | 16,444,644 | | 9,800,644 | | | 12,723,723 | | 11,605,350 | | | 28,742,071 | |
| | | | | | | | | | | | | | | | | | | | | | | |
LIABILITIES | | | | | | | | | | | | | | | | | | | | | | | |
Money market | | 11,889,969 | | 8,579,119 | | | 2,638,078 | | | 603,658 | | — | | — | | | — | | — | | | 68,114 | |
Customer funds | | 78,986,774 | | 16,906,164 | | | 6,087,826 | | | 6,517,900 | | 589,579 | | 11,164,717 | | | 1,169,648 | | 18 ,568,199 | | | 17,981,740 | |
Wholesale financing | | 70,514,749 | | 7,202,093 | | | 28,074,446 | | | 2,547,345 | | 3,50,734 | | 536,475 | | | 5,287,789 | | 7,588,348 | | | 15,777,519 | |
Other sensitive liabilities | | 53,614,098 | | 36,098,031 | | | 4,861,219 | | | 5,724,512 | | 1,303,269 | | 963,372 | | | 619,97 4 | | 487,765 | | | 3,565,957 | |
Derivatives | | 62,016,353 | | 19,350,156 | | | 29,744,088 | | | 7,718,755 | | 588,303 | | 613,016 | | | 677,039 | | 323,511 | | | 3,001,495 | |
TOTAL SENSITIVE LIABILITIES | | 277,021,944 | | 88,135,562 | | | 71,405,658 | | | 23,112,169 | | 5,981,885 | | 13,267,581 | | | 7,754,450 | | 26,988,822 | | | 40,395,816 | |
| | | | | | | | | | | | | | | | | | | | | | | |
GAPS | | 3,076,587 | | (25,802,146 | ) | | (18,356,336 | ) | | 62,287,182 | | 10,462,759 | | (3,466,937 | ) | | 4,969,273 | | (15,363,463 | ) | | (11,653,745 | ) |
| | | | | | | | | | | | | | | | | | | | | | | |
129
This characterization of the balance sheet leads to an initial approach to repricing, complemented by the subsequent quantification of the impact on net interest income and the economic value of the BBVA Group in the light of changes in market interest rates. The following graph shows the interest rate risk profile for the BBVA Group’s main entities at December 31, 2005.
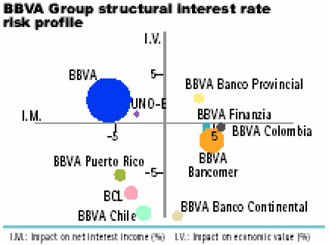
Bearing in mind that sensitivity measures do not contain all sources of interest rate risk, an in-depth analysis was carried out in 2005 on foreseeable scenarios and risk measurements on the basis of curve simulation processes, thereby enabling an assessment of different changes in slope, curvature and parallel movements to be made. These simulations provide statistical distributions of impact on net interest income and economic value, thereby specifying the maximum negative variations for a predetermined confidence level.
The limit structure for asset and liability interest rate risk was expanded in 2005 to include an economic capital limit for asset and liability interest rate risk, in addition to sensitivity limits for net interest income and economic value, which implies setting a 99% confidence level for unexpected economic losses through interest rate risk. This limit structure, which is approved annually by the Executive Committee, is one of the main tools the BBVA Group has for the risk supervision of asset and liability interest rate risk. The graph provided shows the average use of limits in 2005, in which interest rate risk has shown an upward trend within a context of rising interest rates.
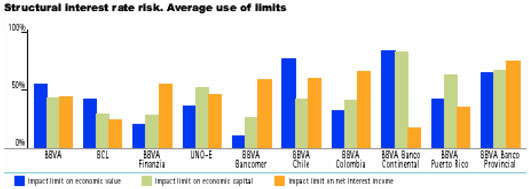
In 2005, the ALCO adopted a hands-on approach to asset and liability interest rate risk, with both hedging derivatives and balance-sheet instruments. At year-end 2005, there was a fixed interest rate asset portfolio of €31,249 million, with a view to offsetting or reducing the negative effect of the decline in interest rates on the Group’s net interest income. In 2005, the portfolio generated €264 million in net interest income and €80 million in net trading income.
130
STRUCTURAL EXCHANGE RATE RISK
The measurement of structural exchange rate risk quantifies the exposure to losses in the value of the BBVA Group’s strategic investments as a result of exchange rate variations. Investments in Latin America, which account for a long position in foreign currencies, are the main source of structural exchange rate risk in the BBVA Group.
The Risk Area makes regular assessments on the basis of a 99% value-at-risk model based on stochastic simulations that also consider the possibility of exchange rate crises, adjusted to the specific characteristics of exchange rate markets and to the nature of structural exchange rate positions. The horizon is adjusted for each currency depending on market liquidity and existing management possibilities. This measurement constitutes the economic capital or unexpected loss through structural exchange rate risk, providing an individual breakdown of the contribution each currency makes to risk.
This calculation procedure is applied both to the net positions derived from the investment’s net asset value, and to the results forecast, taking into account possible hedges of the exchange rate position by the ALCO.
Exchange rate risk management was undertaken in 2005 with the strengthening of Latin American currencies against the dollar, as well as of the dollar against the euro. The net exposure of investment has increased over this period by the increased value of the investments. Accordingly, the risk level has followed an upward trend, always within the limit for economic capital authorized by the Executive Committee and which, on average, has consumed 64% in 2005.
At year-end 2005, BBVA maintained a 44% global coverage of the BBVA balance sheet in the Americas, with levels of perfect hedge of 39% in Mexico, 100% in the United States, 75% in Chile and 29% in Peru. These coverage levels do not consider long positions in dollars held by certain affiliate banks at the local level. In 2005, the transfer to reserves resulting from the strengthening of Group affiliate banks’ base currencies against the euro rose to almost €700 million, whereas the financial cost of the capital hedge was €57 million net of tax. In addition, BBVA’s results hedging policy in 2005 reduced the results of financial transactions by €70 million net of taxes, a sum that has been offset by the higher than expected results, expressed in euros, that the Group’s units in the Americas recorded.
LIQUIDITY RISK
The ultimate goal of liquidity risk management and monitoring in the BBVA Group is to ensure that each unit meets its payment obligations, without having to obtain funds on burdensome terms.
The Risk Area assesses and monitors liquidity in a very different manner to the way it is managed. Accordingly, it permanently monitors quantitative and qualitative indicators that reflect the overall positioning in terms of liquidity, anticipating possible stresses both in the short term, basically up to 90 days, as in the medium term, and within a twelve-month horizon, as well as in the liquidity profile foreseeable for the coming years.
The limits structure authorized by the Executive Committee and reported and monitored by the Board’s Risk Committee is one of the key components of BBVA’s policy on liquidity management and supervision. It encompasses such aspects as, for example, the concentration degree, the capacity for market access, the future repercussions of the business model and different qualitative elements that underpin the market situation and the perception it has of the entity.
In addition, analyses are made of stress scenarios and payment and collection flow simulations in order to assess the impact of hypothetical scenarios on both assets and liabilities and profits and losses. These analyses are part of the crisis situation liquidity monitoring model as outlined in the Contingency Plan, which sets forth responsibilities and actions to be taken in the event of system-wide stress or that specific to liquidity.
Generally speaking, there were no liquidity stress situations in 2005. Accordingly, the consumption of authorized limits in BBVA has been moderate, with levels averaging between 40% and 65% in the main parameters.
131
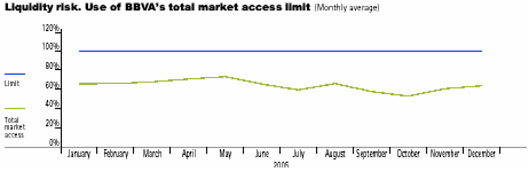
STRUCTURAL RISK MANAGEMENT IN THE EQUITY PORTFOLIO
The BBVA Group’s exposure to structural risk in the equity portfolio stems largely from holdings held in industrial and financial companies with medium/long-term investment horizons, reduced by the net short positions held in derivative instruments over the same underlying assets in order to limit the portfolio’s sensitivity in the event of possible decreases in share prices or stock market indices.
Regarding the internal structural risk management of the equity portfolio, the Executive Committee sets out the risk policies for the business units and approves the maximum limits for the risk assumed in positions of this nature. The Risks Area effectively monitors the levels of risk assumed, assessing it and ensuring compliance with prevailing limits and policies. Regarding discretional positions, and in addition to stop-loss limits established by strategy and by portfolio, BBVA has established an early warning system for results (loss-triggers) which forestall the possible exceeding of those limits.
The internal model for measuring economic capital attributed to the Group’s positions in structural risk in the equity portfolio is based on a statistical analysis of assets, for a horizon determined by the liquidity of the positions and with the confidence level corresponding to the entity’s objective rating.
The average consumption of the main economic capital limits stood at 53% at December 31, 2005. The favorable trend in stock market prices in 2005 has involved a moderate increase in the sensitivity of the Group’s positions in structural risk in the equity portfolio on a year-on-year basis, which has been partially offset by the divestments effected and by hands-on management through derivative instruments. The aggregate sensitivity figure for the Group’s equity positions in the event of a 1% drop in share prices amounts, at year-end 2005, to €84 million, with 75% concentrated in highly liquid equity securities in the European Union.
OPERATIONAL RISK
Management model
BBVA is a pioneering bank in the formulation of a process management model that considers operational risk as a form of risk that is different from credit and market risk. This is reflected in the in-house definition the Group uses: operational risk applies to anything that is not credit or market risk.
This is a highly complex type of risk, due both to the causes that give rise to it and to its consequences. In fact, all the processes that take place in the Group have, to a greater or lesser extent, operational risk.
Given that operational risk is present in all Group processes, it is held responsible when the final outcome of a process does not turn out as planned, if this deviation cannot be attributed to credit or market risk. This definition provides a better meaning of operational risk, as long as it is located within its natural setting, namely, in processes.
132
In order to facilitate its management, operational risk needs to be identified, measured, assessed and mitigated. A set of tools has been designed accordingly to help raise awareness of operational risk and which enables it to be gauged over time. These tools are divided into two groups: qualitative and quantitative. The former are used to identify and measure operational risk without there being a need for events to occur. On the other hand, quantitative tools measure operational risk once the events have occurred.
BBVA classifies operational risk into eight major categories:
1) Processes: human error and mistakes in operating procedures
2) External fraud: criminal activities committed by persons unrelated to BBVA
3) Internal fraud: criminal activities committed by Group staff and unauthorized activities
4) Technology: computer failures (hardware and software) or breakdowns in communications
5) Human resources: failures in human resources policy. Health and safety at work
6) Commercial practices: poor sales practices and defective products
7) Disasters: damages to assets caused naturally or intentionally
8) Suppliers: non-fulfilment of services arranged.
Operational risk management in business and support areas is arranged through an Operational Risk Committee in each area, consisting of those people responsible for process management and with decision-making powers for changing them. Each area has someone in the position ofOperational Risk Manager to coordinate these tasks. Based on the information available in the different corporate tools implemented in each unit, the Operational Risk Committee meets regularly at the request of theOperational Risk Manager and takes the necessary decisions on mitigation, bearing in mind their cost.
Implementation of the tools
In 2005, the Group has pursued a far-reaching implementation scheme with a view to completing the risk map. Following are details of the situation at year-end 2005:
Ev-Ro: This is the basic qualitative tool for the identification and valuation of operational risk factors by business or shared resources areas. The collated data are used to draw up risk maps (distribution by types of risk and support areas). This Group tool identifies risk factors that lead to losses, as well as other factors leading to losses of future revenues.
Among those risk factors that have been identified so far, 20% are deemed to be high priority. These risk factors are not all different, as it is quite often the case that some of them are repeated in different areas. At year-end 2005, the implementation degree in the Group stood at 98% (94% completed and 4% underway), as is shown in the accompanying graph.
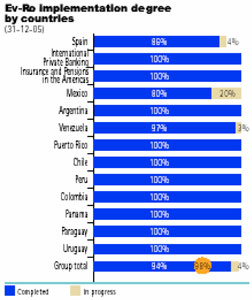
133
The following graphs show a display of risk factor distribution, by types of risk, in both Spain and Latin America at December 31, 2005. The quantification of operational risk factors facilitates the development and implementation of measures for mitigating each risk.

TransVaR: This is an operational risk management tool that uses indicators. It is a hybrid tool, as it has both qualitative and quantitative aspects. The data input takes place within the units that manage the processes by gathering basic indicators that provide data on 22 generic indicators common to the entire Group. It has been noted that the level of operational risk clearly diminishes in those units that have implemented this tool. Its implementation degree at the end of 2005 stood at 86%, as shown in the following graph.
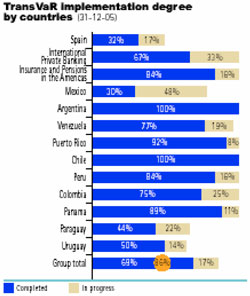
SIRO: It is a corporate database that contains all those operational risk events, since January 2002, that constitute a heavy loss or cost for the organization. Events are classified by types of risk and business lines. There is a local Siro in each country that uploads its data each month into a Global Siro, where they are consolidated.
External databases are also used in the Group. Thus, BBVA is one of the founding members of the world’s first database created for such purposes: Operational Risk Exchange (ORX), a non-profit organization located in Zurich whose purpose is to disclose, on an anonymous basis, operational risk events exceeding €20,000. This information serves a dual purpose: on the one hand, it completes the data held when calculating capital and, on the other, it is used as a benchmark. ORX was set up in 2002 with 12 members, and it currently consists of 23 of the world’s major banks.
Reputational risk
RepTool is the tool for the qualitative management of reputational risk in the Group. Corporate reputation is an intangible asset that each company projects onto its investors, customers and employees (both current and
134
potential), resulting in attraction, rejection or indifference. BBVA understands reputational risk to be what exposes us to uncertainty as a result of the perception that different groups may have of our entity. The stakeholders most affected are customers, shareholders and employees. Reputational risk is a consequence of the materialization of other kinds of risk, mainly operational risk.
The scheme for implementing RepTool continued in 2005, and by year-end 2005 it had been completed in the following units: Global Markets and Distribution, International Private Banking, Global Corporate Banking, Products and Businesses and Special Financial Services. A total of 334 factors have been identified for reputational risks, which are circumstances that have the potential to become reputational events. RepTool classifies these risk functions in terms of the type of action required to mitigate them. The following graph shows risk distribution in terms of action plan.
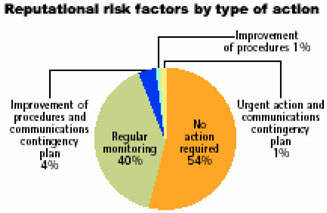
Basel II
The BBVA Group has informed the Bank of Spain of its intention to rate operational risk in AMA (advanced management approaches). This is the most demanding methodology in terms of information gathering and management. Accordingly, successful completion requires a two-year transition period, beginning in January 2006. During this time, implementation is to be made of qualitative and quantitative tools, risk capital is to be calculated and the Group is to prove it has management mechanisms capable of mitigating risk, wherever this is important.
Operational risk capital
The first estimates were made in 2005 for operational risk capital on the basis of AMA models. Within the range of possible approaches, use has been made of the LDA (Loss Distribution Approach) method, which estimates the distribution of losses in accordance with the operational events an entity has to face, by adjusting accordingly two factors that, in turn, determine it: the frequency of events and their impact.
The calculations made use of SIRO as their main source of information. In order to enrich the data provided by this in-house database and consider the impact of possible events not yet included in it, use has been made of the ORX external database and scenario simulation has also been included, with information provided by the Ev-Ro tool.
RISK MANAGEMENT IN NON-BANKING ACTIVITIES
Insurance
BBVA operates in the insurance sector in different countries and with multiple products. Given that the main business of insurance companies is to provide risk coverage for third parties, risk management serves a threefold purpose:
1) To continuously improve risk assessment and management techniques in order to ensure that current products are increasingly competitive and, therefore, generate more value for both customers and company alike.
135
2) To permit the launch of products that cover new risks, with a joint perspective of risk control and value creation.
3) To introduce those controls and metrics that at all times ensure companies uphold the solvency the Group requires.
In the insurance business, and in addition to credit and market risk companies are exposed to, there are technical risks, such as those related to the performance of risks they insure for third parties. Concerning technical risks, an analysis is made of: a) mortality rates, which affect life assurance and accident insurance; b) life-expectancy rates, which affect endowment policies and annuities; and c) other technical risks involving “general risks” (cars, homes, etc.).
Furthermore, operational risk control is very important, as several processes coexist in the company: a) investment management, in which the business activity is akin to an asset management firm; b) customer management, due to product marketing through the Group’s networks or those pertaining to its companies or third parties; and c) claim management, through the treatment of events that had been previously covered by the company.
An analysis was undertaken in 2005 of our insurance companies’ core products and a review has been made of the calculation of economic capital, fine-tuning methodologies in accordance with central BBVA criteria.
The following graphs show the distribution of economic capital in BBVA’s insurance business in Europe and in the Americas.
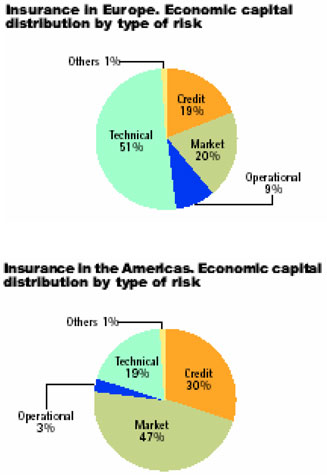
136
Insofar as new products, each launch involves an analysis of the embedded value and its risk-adjusted return, as well as the economic capital consumed.
Limits have likewise been laid down for credit and market risk as approved by the Group’s Executive Committee and supervised by Risk units (both centrally and in each business area).
Asset Management
BBVA is present in various facets of the asset management business: mutual funds, pension funds, UDI trusts ( UDI stands for “Unidad de Inversión”, a currency unit introduced in Mexico during the 1990’s), investment companies and discretionary portfolios.
The Group has entities dedicated to third-party asset management (trust management) in numerous countries, whose aim, in return for a fee, is to manage risks for the account of third parties with two possible investment mandates: maximize returns for an expected level of risk or optimize risk for an expected level of returns.
Therefore, from the perspective of risks, the duty of trusteeship undertaken with the customer involves the following: use of the finest technology available in order to assess how risk and returns are best combined for each investor profile and remit; ensure the ability to identify, measure and assess the risks assumed by the investor; identify and address possible conflicts of interest that might arise; and inform the investor in a clear manner about the risks assumed and the returns obtained.
In view of the fact that, generally speaking, it is the customer who assumes the credit and market risks, the most important risk for BBVA is the operational one, which stems from two basic sources (through selection, performance of transactions, monitoring, etc.) and customer management (through the process of calculation and assessment, information, subscriptions and reimbursements, etc.).
The Group is currently developing the process of adapting customers to their risk profile, as well as providing clear information on the results obtained in terms of risk and returns. The inclusion of, for instance, volatility metrics, index-backed returns and value at risk, have yet to become standard practice in the market, and the focus is on reporting what best suits each type of product and what the investor more readily understands.
Regarding guaranteed funds, the provision of the guarantee is assessed and monitored by the Bank, in terms of embedded options and taking into account both market and credit risk. This assessment is complemented by an admission procedure for each new guaranteed fund.
Credit and market risk limits have been introduced for the investment in equity approved by the Group’s Executive Committee and supervized by Risk units.
The following graph shows the distribution of economic capital in BBVA’s asset management and private banking business in Spain and Portugal.
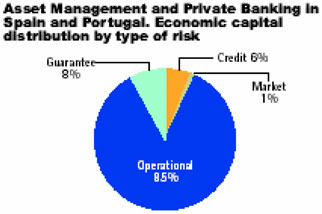
137
The following graph shows the distribution of economic capital in BBVA’s pension business in the Americas.
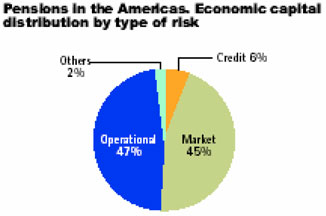
The management model
The Group has two aims in risk management in the Insurance and Asset Management units: a) the use of homogenous methods and processes applying a company-wide standard; and b) assessment through the risk departments in each company.
The achievement of this dual objective implies a two-tier organization:
| | 1) | A dedicated Non-banking Central Risk unit in the Group, whose mission it is to provide companies with all collective experience and shared methodology in terms of risks, as well as ensure that each company undertakes the proper identification, measurement, assessment and supervision of risks. The Group, therefore, is the one to define the methods to be used in all business activities, guaranteeing homogeneity in the treatment of each type of risk and thereby enabling aggregation. |
| | 2) | Risk units in the business areas, focusing on risk identification, measurement and assessment, applying Group methods and reporting to the Central Unit. Accordingly, they implement methods and procedures that are established for the Group as a whole and carry out all those duties required for proper risk monitoring to facilitate business development. |
This arrangement allows for centralized supervision with decentralized assessment, thereby streamlining the process.
A key component in the risk management model in these areas is the New Products Committee where, convened by Risk units in the business areas, all departments adopt a multidisciplinary approach to the review and validation of the new products to be offered to customers, new assets for portfolios and new activities to be undertaken.
| ITEM 12. | DESCRIPTION OF SECURITIES OTHER THAN EQUITY SECURITIES |
Not applicable.
PART II
| ITEM 13. | DEFAULTS, DIVIDEND ARREARAGES AND DELINQUENCIES |
Not applicable.
138
| ITEM 14. | MATERIAL MODIFICATIONS TO THE RIGHTS OF SECURITY HOLDERS AND USE OF PROCEEDS |
Not applicable.
| ITEM 15. | CONTROLS AND PROCEDURES |
As of December 31, 2005, BBVA, under the supervision and with the participation of BBVA’s management, including our chairman and chief executive officer, president and chief operating officer and head of the office of the chairman, whose responsibilities include accountancy, internal audit and compliance, performed an evaluation of the effectiveness of BBVA’s disclosure controls and procedures. BBVA’s management necessarily applied its judgment in assessing the costs and benefits of such controls and procedures, which by their nature can provide only reasonable assurance regarding management’s control objectives. Based on this evaluation, BBVA’s chairman and chief executive officer, president and chief operating officer and head of the office of the chairman concluded that BBVA’s disclosure controls and procedures are effective at the reasonable assurance level for gathering, analyzing and disclosing the information BBVA is required to disclose in the reports it files under the Securities Exchange Act of 1934, within the time periods specified in the SEC’s rules and forms. There has been no change in BBVA’s internal control over financial reporting that occurred during the period covered by this annual report that has materially affected, or is reasonably likely to materially affect, BBVA’s internal control over financial reporting.
| ITEM 16A. | AUDIT COMMITTEE FINANCIAL EXPERT |
We have not determined whether any particular member of our Audit and Compliance Committee is a “financial expert” and, therefore, have not named any particular member of such Committee as our “Audit Committee Financial Expert” in accordance with SEC rules and regulations. The charter for our Audit and Compliance Committee which was approved by our Board of Directors, however, provides that the Chairman of the Audit and Compliance Committee is required to have experience in financial matters as well as knowledge of the accounting standards and principles required by BBVA’s regulators. In addition, we believe that the remaining members of the Audit and Compliance Committee have an understanding of applicable generally accepted accounting principles, experience analyzing and evaluating financial statements that present a breadth and level of complexity of accounting issues that are generally comparable to the breadth and complexity of issues that can reasonably be expected to be raised by our Consolidated Financial Statements, an understanding of internal controls over financial reporting, and an understanding of audit committee functions. Our Audit and Compliance Committee has experience overseeing and assessing the performance of BBVA and its consolidated subsidiaries and our external auditors with respect to the preparation, auditing and evaluation of our consolidated financial statements.
BBVA’s Code of Ethics and Conduct applies to its chief executive officer, chief financial officer and chief accounting officer. This code establishes the principles that guide these officers’ respective actions: ethical conduct, professional standards and confidentiality. It also establishes the limitations and defines the conflicts of interest arising from their status as senior executives. We have not waived compliance with, nor made any amendment to, the Code of Ethics and Conduct. BBVA’s Code of Ethics and Conduct can be found on its website at www.bbva.com.
| ITEM 16C. | PRINCIPAL ACCOUNTANT FEES AND SERVICES |
The following table provides information on the aggregate fees billed by our principal accountants, Deloitte, S.L., by type of service rendered for the periods indicated.
139
| | | | | | |
| | | Year ended
December 31, |
Services Rendered | | 2005 | | 2004 | | 2003 |
| | | (thousands of euro) |
Audit Fees (1) | | 3,459 | | 3,756 | | 3,971 |
Audit-Related Fees (2) | | 1,205 | | 1,932 | | 161 |
Tax Fees (3) | | — | | — | | — |
All Other Fees (4) | | 1,197 | | 348 | | 561 |
Total | | 5,861 | | 6,036 | | 4,693 |
| (1) | Aggregate fees billed for each of the last three fiscal years for professional services rendered by Deloitte, S.L. for the audit of BBVA’s annual financial statements or services that are normally provided by Deloitte, S.L. in connection with statutory and regulatory filings or engagements for those fiscal years. Total audit fees billed by Deloitte, S.L. and its worldwide affiliates, were €7,660 thousand, €6,766 thousand and €8,282 thousand in 2005, 2004 and 2003, respectively. |
| (2) | Aggregate fees billed in each of the last three fiscal years for assurance and related services by Deloitte, S.L. that are reasonably related to the performance of the audit or review of BBVA’s financial statements and are not reported under (1) above. |
| (3) | Aggregate fees billed in each of the last three fiscal years for professional services rendered by Deloitte, S.L. for tax compliance, tax advice, and tax planning. |
| (4) | Aggregate fees billed in each of the last three fiscal years for products and services provided by Deloitte, S.L. other than the services reported in (1), (2) and (3) above. Services in this category consisted primarily of employee education courses and verification of the security of information systems. |
The Audit And Compliance Committee’s Pre-Approval Policies And Procedures
In order to assist in ensuring the independence of our external auditor, the charter of our Audit and Compliance Committee provides that our external auditor is generally prohibited from providing us with non-audit services, other than under the specific circumstance described below. For this reason, our Audit and Compliance Committee has developed a pre-approval policy regarding the contracting of BBVA’s external auditor, or any affiliate of the external auditor, for professional services. The professional services covered by such policy include audit and non-audit services provided to BBVA or any of its subsidiaries reflected in agreements dated on or after May 6, 2003.
The pre-approval policy is as follows:
| | 1. | The hiring of BBVA’s external auditor or any of its affiliates is prohibited, unless there is no other firm available to provide the needed services at a comparable cost and that could deliver a similar level of quality. |
| | 2. | In the event that there is no other firm available to provide needed services at a comparable cost and delivering a similar level of quality, the external auditor (or any of its affiliates) may be hired to perform such services, but only with the pre-approval of the Audit and Compliance Committee. |
| | 3. | The Chairman of the Audit and Compliance Committee has been delegated the authority to approve the hiring of BBVA’s external auditor (or any of its affiliates). In such an event, however, the Chairman would be required to inform the Audit and Compliance Committee of such decision at the Committee’s next meeting. |
| | 4. | The hiring of the external auditor for any of BBVA’s subsidiaries must also be pre-approved by the Audit and Compliance Committee. |
| | 5. | Agreements entered into prior to May 6, 2003 between BBVA or any of its subsidiaries and any of their respective external auditors, required the approval of the Audit and Compliance Committee in the event that services provided under such agreements continued after May 6, 2004. |
| ITEM 16D. | EXEMPTIONS FROM THE LISTING STANDARDS FOR AUDIT COMMITTEES |
Not applicable.
140
| ITEM 16E. | PURCHASES OF EQUITY SECURITIES BY THE ISSUER AND AFFILIATED PURCHASERS |
| | | | | | | | |
Period of Fiscal Year | | (a) Total
Number of
Ordinary
Shares
Purchased | | (b) Average Price
Paid per Share (or
Unit) | | (c) Total Number of
Shares (or Units)
Purchased as Part of
Publicly Announced
Plans or Programs | | (d) Maximum Number (or
Approximate Dollar Value) of
Shares (or Units) that May Yet
Be Purchased Under the Plans or
Programs |
January 1 to January 31 | | 15,884,036 | | 12.73 | | — | | — |
February 1 to February 28 | | 29,300,184 | | 13.08 | | — | | — |
March 1 to March 31 | | 29,686,831 | | 12.81 | | — | | — |
April 1 to April 30 | | 22,480,738 | | 12.38 | | 6,782,248 | | 118,679,822 |
May 1 to May 31 | | 11,223,456 | | 12.46 | | 3,868,449 | | 118,679,822 |
June 1 to June 30 | | 32,898,864 | | 12.71 | | 14,591,436 | | 118,679,822 |
July 1 to July 31 | | 34,987,195 | | 13.01 | | 3,043,795 | | 118,679,822 |
August 1 to August 31 | | 33,656,730 | | 13.76 | | 8,937,822 | | 118,679,822 |
September 1 to September 30 | | 8,592,198 | | 13.99 | | 83,187 | | 118,679,822 |
October 1 to October 31 | | 25,793,704 | | 14.24 | | — | | — |
November 1 to November 30 | | 15,371,807 | | 14.88 | | — | | — |
December 1 to December 31 | | 19,620,294 | | 14.82 | | — | | — |
Total | | 279,496,037 | | | | 37,306,937 | | 118,679,822 |
On March 29, 2005, we announced that our Board of Directors had resolved to launch a share buy-back program of our own shares subject to the following conditions: (i) the number of such shares to be purchased shall not exceed 3.5% of our share capital; (ii) the purchase price shall not be higher than €14.5 per share and (iii) the period of the share buy-back program shall expire on September 30, 2005. Between April 18 and September 30, 2005, we purchased an aggregate of 37,306,937 of our ordinary shares pursuant to the share buy-back program, representing 1.10% of our capital stock. By September 30, 2005, all the shares bought under the share buy-back program had been sold.
During 2005, we sold a total of 274,760,734 shares (including those purchased under the share buy back program) for an average price of €13.80 per share.
PART III
| ITEM 17. | FINANCIAL STATEMENTS |
We have responded to Item 18 in lieu of this item.
| ITEM 18. | FINANCIAL STATEMENTS |
Reference is made to Item 19 for a list of all financial statements filed as a part of this Annual Report.
(a) Index to Financial Statements
141
(b) Index to Exhibits:
| | |
Exhibit
Number | | Description |
| |
| 1.1 | | Amended and Restated Bylaws (Estatutos) of the Registrant. |
| |
| 4.1 | | Plan of Merger between Banco Bilbao Vizcaya, S.A. and Argentaria, Caja Postal y Banco Hipotecario, S.A.* |
| |
| 4.2 | | Master Agreement of Strategic Alliance between Telefónica and BBVA, together with an English translation.** |
| |
| 8.1 | | Consolidated Companies Composing Registrant. |
| |
| 10.1 | | Consent of Deloitte, S.L. |
| |
| 12.1 | | Section 302 Chief Executive Officer Certification. |
| |
| 12.2 | | Section 302 President and Chief Operating Officer Certification. |
| |
| 12.3 | | Section 302 Head of the Office of the Chairman Certification. |
| |
| 13.1 | | Section 906 Certification. |
| * | Incorporated by reference to BBVA’s Registration Statement on Form F-4 (File No. 333-11090) filed with the Securities and Exchange Commission on November 4, 1999. |
| ** | Incorporated by reference to BBVA’s 1999 Annual Report on Form 20-F. |
We will furnish to the Commission, upon request, copies of any unfiled instruments that define the rights of holders of our long-term debt.
142
SIGNATURES
Pursuant to the requirements of Section 12 of the Securities Exchange Act of 1934, the Registrant certifies that it meets all of the requirements for filing on Form 20-F and had duly caused this Annual Report to be signed on its behalf by the undersigned, thereto duly authorized.
| | |
| BANCO BILBAO VIZCAYA ARGENTARIA, S.A. |
| |
| By: | | /s/ JOSÉ SEVILLA ÁLVAREZ |
Name: | | José Sevilla Álvarez |
Title: | | Head of the Office of the Chairman |
Date: July 7, 2006
Item 5. INDEX TO CONSOLIDATED FINANCIAL STATEMENTS AS OF AND FOR THE YEAR ENDED DECEMBER 31, 2005
F-1
REPORT OF INDEPENDENT REGISTERED PUBLIC ACCOUNTING FIRM
To the Board of Directors and Shareholders of Banco Bilbao Vizcaya Argentaria, S.A.:
We have audited the accompanying consolidated balance sheets of BANCO BILBAO VIZCAYA ARGENTARIA, S.A. (“the Company”) and subsidiaries composing the BANCO BILBAO VIZCAYA ARGENTARIA Group (“the Group”—Note 4) as of December 31, 2005 and 2004, and the related consolidated statements of income, cash flows and consolidated statements of changes in equity for the years then ended. These consolidated financial statements are the responsibility of the controlling Company’s Directors. Our responsibility is to express an opinion on these consolidated financial statements based on our audits.
We conducted our audits in accordance with the standards of the Public Company Accounting Oversight Board (United States of America). Those standards require that we plan and perform the audit to obtain reasonable assurance about whether the consolidated financial statements are free of material misstatements. The Company is not required to have, nor were we engaged to perform, an audit of its internal control over financial reporting. Our audits included consideration of internal control over financial reporting as a basis for designing audit procedures that are appropriate in the circumstances, but not for the purpose of expressing an opinion on the effectiveness of the Company’s internal control over financial reporting. Accordingly, we express no such opinion. An audit includes examining, on a test basis, evidence supporting the amounts and disclosures in the consolidated financial statements. An audit also includes assessing the accounting principles used and significant estimates made by management, as well as evaluating the overall financial statements presentation. We believe that our audits provide a reasonable basis for our opinion.
In our opinion, the consolidated financial statements referred to above present fairly, in all material aspects, the financial position of Banco Bilbao Vizcaya Argentaria, S.A. and Companies composing the Banco Bilbao Vizcaya Argentaria Group as of December 31, 2005 and 2004, the results of their operations and their cash flows for the years then ended, in conformity with International Financial Reporting Standards adopted by the European Union (EU-IFRSs).
The consolidated financial statements referred to above, the consolidated financial statements for 2005 are the first that the Group has prepared in accordance with International Financial Reporting Standards adopted by the European Union (EU-IFRSs), which require, in general, that the consolidated financial statements present comparative information. In this regard, as required by EU-IFRS 1, First Time Adoption of International Financial Reporting Standards, for comparison purposes the Parent’s directors present, in addition to the consolidated figures for 2005 for each item in the consolidated balance sheet, consolidated income statement, consolidated cash flow statement, consolidated statement of changes in equity and notes to the consolidated financial statements, the figures for 2004, which were obtained by applying the EU-IFRS in force at December 31, 2005. Accordingly, the figures for 2004 differ from those contained in the approved consolidated financial statements for 2004, which were prepared in accordance with the accounting principles generally accepted in Spain in force in that year. The differences arising from the application of EU-IFRS to the consolidated equity at January, 1 and December, 31 2004, and to the Group’s consolidated net income for 2004 are detailed in Note 3 to the consolidated financial statements referred to above.
International Financial Reporting Standards adopted by European Union vary in certain significant respects from accounting principles generally accepted in the United States of America (U.S. GAAP). Information relating to the nature and effect of such differences is presented in Note 59 to the consolidated financial statements. Such Note explains that the Group under U.S. GAAP changed its method of recognition of actuarial gains and losses regarding defined benefit plans from deferral method to immediate recognition in 2005.
DELOITTE, S.L.
Madrid – Spain, February 13, 2006, except for the Note 59 as to which the date is July 7, 2006.
F-2
BANCO BILBAO VIZCAYA ARGENTARIA, S.A. AND COMPANIES
COMPOSING THE BANCO BILBAO VIZCAYA ARGENTARIA GROUP
CONSOLIDATED BALANCE SHEETS AS OF DECEMBER 31, 2005 AND 2004
(Notes 1 to 5)
- Thousands of Euros -
| | | | |
| | | 2005 | | 2004 |
| ASSETS | | | | |
CASH AND BALANCES WITH CENTRAL BANKS (Note 10) | | 12,341,317 | | 10,123,090 |
FINANCIAL ASSETS HELD FOR TRADING (Note 11) | | 44,011,781 | | 47,036,060 |
Loans and advances to credit institutions | | — | | — |
Money market operations through counterparties | | — | | — |
Loans and advances to other debtors | | — | | — |
Debt securities | | 24,503,507 | | 30,396,579 |
Other equity instruments | | 6,245,534 | | 5,690,885 |
Trading derivatives | | 13,262,740 | | 10,948,596 |
OTHER FINANCIAL ASSETS AT FAIR VALUE THROUGH PROFIT OR LOSS (Note 12) | | 1,421,253 | | 1,059,490 |
Loans and advances to credit institutions | | — | | — |
Money market operations through counterparties | | — | | — |
Loans and advances to other debtors | | — | | — |
Debt securities | | 282,916 | | 58,771 |
Other equity instruments | | 1,138,337 | | 1,000,719 |
AVAILABLE-FOR-SALE FINANCIAL ASSETS (Note 13) | | 60,033,988 | | 53,003,545 |
Debt securities | | 50,971,978 | | 45,037,228 |
Other equity instruments | | 9,062,010 | | 7,966,317 |
LOANS AND RECEIVABLES (Note 14) | | 249,396,647 | | 196,892,203 |
Loans and advances to credit institutions | | 27,470,224 | | 16,702,957 |
Money market operations through counterparties | | — | | 241,999 |
Loans and advances to other debtors | | 216,850,480 | | 172,083,072 |
Debt securities | | 2,291,889 | | 5,497,509 |
Other financial assets | | 2,784,054 | | 2,366,666 |
HELD-TO-MATURITY INVESTMENTS (Note 15) | | 3,959,265 | | 2,221,502 |
CHANGES IN THE FAIR VALUE OF THE HEDGED ITEMS IN PORTFOLIO HEDGES OF INTEREST RATE RISK | | — | | — |
HEDGING DERIVATIVES (Note 16) | | 3,912,696 | | 4,273,450 |
NON-CURRENT ASSETS HELD FOR SALE (Note 17) | | 231,260 | | 159,155 |
Loans and advances to credit institutions | | — | | — |
Loans and advances to other debtors | | — | | — |
Debt securities | | — | | — |
Equity instruments | | — | | — |
Tangible assets | | 231,260 | | 159,155 |
Other assets | | — | | — |
INVESTMENTS (Note 18) | | 1,472,955 | | 1,399,140 |
Associates | | 945,858 | | 910,096 |
Jointly controlled entities | | 527,097 | | 489,044 |
INSURANCE CONTRACTS LINKED TO PENSIONS | | — | | — |
REINSURANCE ASSETS (Note 19) | | 235,178 | | 80,268 |
TANGIBLE ASSETS (Note 20) | | 4,383,389 | | 3,939,636 |
Property, plants and equipment | | 3,840,520 | | 3,337,728 |
Investment properties | | 76,742 | | 162,649 |
Other assets leased out under an operating lease | | 466,127 | | 439,259 |
INTANGIBLE ASSETS (Note 21) | | 2,070,049 | | 821,084 |
Goodwill | | 1,857,854 | | 710,493 |
F-3
| | | | |
| | | 2005 | | 2004 |
| ASSETS | | | | |
Other intangible assets | | 212,195 | | 110,591 |
TAX ASSETS (Note 35) | | 6,420,745 | | 5,990,696 |
Current | | 254,151 | | 165,959 |
Deferred | | 6,166,594 | | 5,824,737 |
PREPAYMENTS AND ACCRUED INCOME (Note 22) | | 557,278 | | 717,755 |
OTHER ASSETS (Note 23) | | 1,941,693 | | 1,724,082 |
Inventories | | 339,472 | | 279,897 |
Other | | 1,602,221 | | 1,444,185 |
| | | | |
TOTAL ASSETS | | 392,389,494 | | 329,441,156 |
| | | | |
The accompanying Notes 1 to 59 and Exhibit 8.1 are an integral part of the consolidated balance sheet at December 31, 2005.
F-4
- Thousands of Euros -
| | | | |
| | | 2005 | | 2004 |
| LIABILITIES AND EQUITY | | | | |
FINANCIAL LIABILITIES HELD FOR TRADING (Note 11) | | 16,270,865 | | 14,134,413 |
Deposits from credit institutions | | — | | — |
Money market operations through counterparties | | — | | — |
Deposits from other creditors | | — | | — |
Debt certificates (including bonds) | | — | | — |
Trading derivatives | | 13,862,644 | | 12,802,912 |
Short positions | | 2,408,221 | | 1,331,501 |
OTHER FINANCIAL LIABILITIES AT FAIR VALUE THROUGH PROFIT OR LOSS (Note 24) | | 740,088 | | 834,350 |
Deposits from credit institutions | | — | | — |
Deposits from other creditors | | 740,088 | | 834,350 |
Debt certificates (including bonds) | | — | | — |
FINANCIAL LIABILITIES AT FAIR VALUE THROUGH EQUITY (Note 25) | | — | | — |
Deposits from credit institutions | | — | | — |
Deposits from other creditors | | — | | — |
Debt certificates (including bonds) | | — | | — |
FINANCIAL LIABILITIES AT AMORTISED COST (Note 26) | | 329,505,250 | | 275,583,527 |
Deposits from central banks | | 21,189,193 | | 23,301,105 |
Deposits from credit institutions | | 45,125,943 | | 44,048,115 |
Money market operations through counterparties | | 23,252 | | 657,997 |
Deposits from other creditors | | 182,635,181 | | 149,891,799 |
Debt certificates (including bonds) | | 62,841,755 | | 45,482,121 |
Subordinated liabilities | | 13,723,262 | | 12,327,377 |
Other financial liabilities | | 3,966,664 | | 2,875,013 |
CHANGES IN THE FAIR VALUE OF THE HEDGED ITEMS IN PORTFOLIO HEDGES OF INTEREST RATE RISK | | — | | 183,201 |
HEDGING DERIVATIVES (Note 16) | | 2,870,086 | | 3,131,572 |
LIABILITIES ASSOCIATED WITH NON-CURRENT ASSETS HELD FOR SALE | | — | | — |
Deposits from central banks | | — | | — |
Deposits from credit institutions | | — | | — |
Deposits from other creditors | | — | | — |
Debt certificates (including bonds) | | — | | — |
Other liabilities | | — | | — |
LIABILITIES UNDER INSURANCE CONTRACTS (Note 27) | | 10,500,567 | | 8,114,429 |
PROVISIONS (Note 28) | | 8,701,085 | | 8,391,848 |
Provisions for pensions and similar obligations | | 6,239,744 | | 6,304,284 |
Provisions for taxes | | 146,971 | | 173,229 |
Provisions for contingent exposures and commitments | | 452,462 | | 348,782 |
Other provisions | | 1,861,908 | | 1,565,553 |
TAX LIABILITIES (Note 35) | | 2,100,023 | | 1,620,795 |
Current | | 598,285 | | 223,656 |
Deferred | | 1,501,738 | | 1,397,139 |
ACCRUED EXPENSES AND DEFERRED INCOME (Note 22) | | 1,709,690 | | 1,265,780 |
OTHER LIABILITIES (Note 23) | | 2,689,728 | | 2,375,978 |
EQUITY HAVING THE NATURE OF FINANCIAL LIABILITY | | — | | — |
| | | | |
TOTAL LIABILITIES | | 375,087,382 | | 315,635,893 |
| | | | |
The accompanying Notes 1 to 59 and Exhibit 8.1 are an integral part of the consolidated balance sheet at 31 December 2005.
F-5
| | | | | | |
| | | 2005 | | | 2004 | |
| EQUITY | | | | | | |
MINORITY INTERESTS (Note 29) | | 971,490 | | | 737,539 | |
VALUATION ADJUSTMENTS | | 3,294,955 | | | 2,106,914 | |
Available-for-sale financial assets | | 3,002,784 | | | 2,320,133 | |
Financial liabilities at fair value through equity | | — | | | — | |
Cash flow hedges | | (102,538 | ) | | (24,776 | ) |
Hedges of net investments in foreign operations | | (443,561 | ) | | 282,895 | |
Exchange differences | | 838,270 | | | (471,338 | ) |
Non-current assets held for sale | | — | | | — | |
SHAREHOLDERS’ EQUITY | | 13,035,667 | | | 10,960,810 | |
Capital (Note 31) | | 1,661,518 | | | 1,661,518 | |
Issued | | 1,661,518 | | | 1,661,518 | |
Unpaid and uncalled (-) | | — | | | — | |
Share premium (Note 32) | | 6,658,390 | | | 6,682,603 | |
Reserves (Note 33) | | 2,172,158 | | | 745,134 | |
Accumulated reserves (losses) | | 1,933,243 | | | 444,193 | |
Retained earnings | | — | | | — | |
Reserves (losses) of entities accounted for using the equity method | | 238,915 | | | 300,941 | |
Associates | | (60,542 | ) | | 8,153 | |
Jointly controlled entities | | 299,457 | | | 292,788 | |
Other equity instruments | | 141 | | | — | |
Equity component of compound financial instruments | | — | | | — | |
Other | | 141 | | | — | |
Less: Treasury shares (Note 34) | | (96,321 | ) | | (35,846 | ) |
Income attributed to the Group | | 3,806,425 | | | 2,922,596 | |
Less: Dividends and remuneration | | (1,166,644 | ) | | (1,015,195 | ) |
| | | | | | |
TOTAL EQUITY | | 17,302,112 | | | 13,805,263 | |
| | | | | | |
TOTAL LIABILITIES AND EQUITY | | 392,389,494 | | | 329,441,156 | |
| | | | | | |
| | |
| | | 2005 | | | 2004 (*) | |
| MEMORANDUM ITEMS | | | | | | |
CONTINGENT EXPOSURES (Note 38) | | 29,861,597 | | | 21,557,649 | |
Financial guarantees | | 29,176,854 | | | 21,102,311 | |
Assets earmarked for third-party obligations | | — | | | 5,215 | |
Other contingent exposures | | 684,743 | | | 450,123 | |
CONTINGENT COMMITMENTS (Note 38) | | 89,498,392 | | | 66,762,402 | |
Drawable by third parties | | 85,001,452 | | | 60,716,878 | |
Other commitments | | 4,496,940 | | | 6,045,524 | |
The accompanying Notes 1 to 59 and Exhibit 8.1 are an integral part of the consolidated balance sheet at December 31, 2005.
F-6
BANCO BILBAO VIZCAYA ARGENTARIA, S.A. AND COMPANIES COMPOSING THE
BANCO BILBAO VIZCAYA ARGENTARIA GROUP
CONSOLIDATED INCOME STATEMENTS
FOR THE YEARS ENDED DECEMBER 31, 2005 AND 2004
(Notes 1 to 5)
- Thousands of Euros -
| | | | | | |
| | | 2005 | | | 2004 | |
INTEREST AND SIMILAR INCOME (Note 43) | | 15,847,674 | | | 12,352,338 | |
INTEREST EXPENSE AND SIMILAR CHARGES (Note 44) | | (8,932,200 | ) | | (6,447,944 | ) |
Income on equity having the nature of a financial liability | | — | | | — | |
Other | | (8,932,200 | ) | | (6,447,944 | ) |
INCOME FROM EQUITY INSTRUMENTS (Note 45) | | 292,495 | | | 255,146 | |
| | | | | | |
NET INTEREST INCOME | | 7,207,969 | | | 6,159,540 | |
| | | | | | |
SHARE OF PROFIT OR LOSS OF ENTITIES ACCOUNTED FOR USING THE EQUITY METHOD | | 121,495 | | | 97,040 | |
Associates | | 87,491 | | | 3,753 | |
Jointly controlled entities | | 34,004 | | | 93,287 | |
FEE AND COMMISSION INCOME (Note 46) | | 4,669,124 | | | 4,056,981 | |
FEE AND COMMISSION EXPENSES (Note 47) | | (729,128 | ) | | (643,959 | ) |
INSURANCE ACTIVITY INCOME (Note 48) | | 486,923 | | | 390,618 | |
Insurance and reinsurance premium income | | 2,916,831 | | | 2,062,030 | |
Reinsurance premiums paid | | (63,403 | ) | | (71,931 | ) |
Benefits paid and other insurance-related expenses | | (1,785,514 | ) | | (1,704,113 | ) |
Reinsurance income | | 44,228 | | | 8,534 | |
Net provisions for insurance contract liabilities | | (1,274,283 | ) | | (413,744 | ) |
Finance income | | 904,318 | | | 708,901 | |
Finance expense | | (255,254 | ) | | (199,059 | ) |
GAINS OR LOSSES ON FINANCIAL ASSETS AND LIABILITIES (NET) (Note 49) | | 980,164 | | | 761,857 | |
Held for trading | | 897,484 | | | 1,110,551 | |
Other financial instruments at fair value through profit or loss | | 33,022 | | | 1,296 | |
Available-for-sale financial assets | | 428,560 | | | 974,412 | |
Loans and receivables | | 129,203 | | | 13,932 | |
Other | | (508,105 | ) | | (1,338,334 | ) |
EXCHANGE DIFFERENCES (NET) | | 287,014 | | | 297,972 | |
| | | | | | |
GROSS INCOME | | 13,023,561 | | | 11,120,049 | |
| | | | | | |
SALES AND INCOME FROM THE PROVISION OF NON-FINANCIAL SERVICES (Note 50) | | 576,373 | | | 468,236 | |
COST OF SALES (Note 50) | | (450,594 | ) | | (341,745 | ) |
OTHER OPERATING INCOME | | 134,559 | | | 22,306 | |
PERSONNEL EXPENSES (Note 51) | | (3,602,242 | ) | | (3,247,050 | ) |
OTHER ADMINISTRATIVE EXPENSES (Note 52) | | (2,160,478 | ) | | (1,850,845 | ) |
DEPRECIATION AND AMORTISATION | | (448,692 | ) | | (448,206 | ) |
Tangible assets (Note 20) | | (361,042 | ) | | (363,312 | ) |
Intangible assets (Note 21) | | (87,650 | ) | | (84,894 | ) |
OTHER OPERATING EXPENSES | | (249,403 | ) | | (132,139 | ) |
| | | | | | |
NET OPERATING INCOME | | 6,823,084 | | | 5,590,606 | |
| | | | | | |
IMPAIRMENT LOSSES (NET) | | (854,327 | ) | | (958,194 | ) |
Available-for-sale financial assets | | (7,928 | ) | | 55,856 | |
Loans and receivables | | (813,080 | ) | | (783,909 | ) |
Held-to-maturity investments | | (1 | ) | | — | |
Non-current assets held for sale | | (33,159 | ) | | 4,222 | |
Investments | | — | | | (39,508 | ) |
Tangible assets | | (1,589 | ) | | 2,135 | |
Goodwill | | — | | | (196,990 | ) |
F-7
| | | | | | |
| | | 2005 | | | 2004 | |
Other intangible assets | | — | | | — | |
Other assets | | 1,430 | | | — | |
PROVISION EXPENSE (NET) | | (454,182 | ) | | (850,557 | ) |
FINANCE INCOME FROM NON-FINANCIAL ACTIVITIES (Note 53) | | 2,467 | | | 8,737 | |
FINANCE EXPENSES FROM NON-FINANCIAL ACTIVITIES (Note 53) | | (1,826 | ) | | (4,712 | ) |
OTHER GAINS (Note 54) | | 284,816 | | | 622,180 | |
Gains on disposal of tangible assets | | 107,838 | | | 102,874 | |
Gains on disposal of investments | | 40,157 | | | 317,510 | |
Other | | 136,821 | | | 201,796 | |
OTHER LOSSES (Note 54) | | (208,279 | ) | | (271,220 | ) |
Losses on disposal of tangible assets | | (22,477 | ) | | (22,450 | ) |
Losses on disposal of investments | | (11,751 | ) | | (9,127 | ) |
Other | | (174,051 | ) | | (239,643 | ) |
| | | | | | |
INCOME BEFORE TAX | | 5,591,753 | | | 4,136,840 | |
| | | | | | |
INCOME TAX (Note 35) | | (1,521,181 | ) | | (1,028,631 | ) |
INCOME FROM ORDINARY ACTIVITIES | | 4,070,572 | | | 3,108,209 | |
INCOME FROM DISCONTINUED OPERATIONS (NET) | | — | | | — | |
| | | | | | |
CONSOLIDATED INCOME FOR THE YEAR | | 4,070,572 | | | 3,108,209 | |
| | | | | | |
INCOME ATTRIBUTED TO MINORITY INTERESTS (Note 29) | | (264,147 | ) | | (185,613 | ) |
| | | | | | |
INCOME ATTRIBUTED TO THE GROUP | | 3,806,425 | | | 2,922,596 | |
| | | | | | |
The accompanying Notes 1 to 59 and Exhibit 8.1 are an integral part of the consolidated income statement for 2005.
F-8
BANCO BILBAO VIZCAYA ARGENTARIA, S.A. AND COMPANIES COMPOSING THE
BANCO BILBAO VIZCAYA ARGENTARIA GROUP
STATEMENTS OF CHANGES IN CONSOLIDATED EQUITY FOR THE YEARS ENDED
DECEMBER 31, 2005 AND 2004 (Notes 1 to 5) - Thousands of Euros -
| | | | | | |
| | | 2005 | | | 2004 | |
NET INCOME RECOGNISED DIRECTLY IN EQUITY | | 1,188,041 | | | 415,589 | |
| | | | | | |
Available-for-sale financial assets | | 682,651 | | | 642,754 | |
Revaluation gains/losses | | 1,478,792 | | | 1,963,264 | |
Amounts transferred to income statement | | (428,560 | ) | | (974,412 | ) |
Income tax | | (367,581 | ) | | (346,098 | ) |
Reclassifications | | — | | | — | |
Other financial liabilities at fair value | | — | | | — | |
Revaluation gains/losses | | — | | | — | |
Amounts transferred to income statement | | — | | | — | |
Income tax | | — | | | — | |
Reclassifications | | — | | | — | |
Cash flow hedges | | (77,762 | ) | | (38,722 | ) |
Revaluation gains/losses | | (119,634 | ) | | (59,572 | ) |
Amounts transferred to income statement | | — | | | — | |
Amounts transferred to the initial carrying amount of the hedged items | | — | | | — | |
Income tax | | 41,872 | | | 20,850 | |
Reclassifications | | — | | | — | |
Hedges of net investments in foreign operations | | (726,456 | ) | | 282,895 | |
Revaluation gains/losses | | (1,117,625 | ) | | 435,223 | |
Amounts transferred to income statement | | — | | | — | |
Income tax | | 391,169 | | | (152,328 | ) |
Reclassifications | | — | | | — | |
Exchange differences | | 1,309,608 | | | (471,338 | ) |
Translation gains/losses | | 2,014,782 | | | (725,135 | ) |
Amounts transferred to income statement | | — | | | — | |
Income tax | | (705,174 | ) | | 253,797 | |
Reclassifications | | — | | | — | |
Non-current assets held for sale | | — | | | — | |
Revaluation gains | | — | | | — | |
Amounts transferred to income statement | | — | | | — | |
Income tax | | — | | | — | |
Reclassifications | | — | | | — | |
| | | | | | |
CONSOLIDATED INCOME FOR THE YEAR | | 4,070,572 | | | 3,108,209 | |
| | | | | | |
Published consolidated income for the year | | 4,070,572 | | | 3,108,209 | |
Adjustments due to changes in accounting policy (*) | | — | | | — | |
Adjustments made to correct errors (*) | | — | | | — | |
| | | | | | |
TOTAL INCOME AND EXPENSES FOR THE YEAR | | 5,258,613 | | | 3,523,798 | |
| | | | | | |
Parent | | 4,994,466 | | | 3,338,185 | |
Minority interests | | 264,147 | | | 185,613 | |
MEMORANDUM ITEM: EQUITY ADJUSTMENTS ALLOCABLE TO PRIOR YEARS | | — | | | — | |
Due to changes in accounting policies | | — | | | — | |
• Shareholder’s Equity | | — | | | — | |
• Valuation adjustments | | — | | | — | |
• Minority interests | | — | | | — | |
Due to errors | | — | | | — | |
• Shareholder’s Equity | | — | | | — | |
• Valuation adjustments | | — | | | — | |
• Minority interests | | — | | | — | |
The accompanying Notes 1 to 59 and Exhibit 8.1 are an integral part of the statement of changes in
consolidated equity for the year ended December 31, 2005.
F-9
BANCO BILBAO VIZCAYA ARGENTARIA, S.A. AND COMPANIES COMPOSING THE
BANCO BILBAO VIZCAYA ARGENTARIA GROUP
CONSOLIDATED CASH FLOW STATEMENTS FOR THE YEARS
ENDED DECEMBER 31, 2005 AND 2004 (Notes 1 to 5)
- Thousands of Euros -
| | | | | | |
| | | 2005 | | | 2004 | |
CASH FLOWS FROM OPERATING ACTIVITIES | | | | | | |
Consolidated profit for the year | | 4,070,572 | | | 3,108,209 | |
| | | | | | |
Adjustment to profit: | | 4,354,633 | | | 3,251,332 | |
Depreciation of tangible assets (+) | | 361,042 | | | 363,312 | |
Amortisation of intangible assets (+) | | 87,650 | | | 84,894 | |
Impairment losses (net) (+/-) | | 854,327 | | | 958,194 | |
Net provisions for insurance contract liabilities (+/-) | | 1,274,283 | | | 413,744 | |
Provision expense (net) (+/-) | | 454,182 | | | 850,557 | |
Gains/Losses on disposal of tangible assets (+/-) | | (85,361 | ) | | (80,424 | ) |
Gains/Losses on disposal of investments (+/-) | | (28,406 | ) | | (308,383 | ) |
Share of profit or loss of entities accounted for using the equity method (net of dividends) (+/-) | | (121,495 | ) | | (97,040 | ) |
Taxes (+/-) | | 1,521,181 | | | 1,028,631 | |
Other non-monetary items (+/-) | | 37,230 | | | 37,847 | |
| | | | | | |
Adjusted profit | | 8,425,205 | | | 6,359,541 | |
| | | | | | |
Net increase/decrease in operating assets | | (55,959,375 | ) | | (30,388,985 | ) |
| | | | | | |
Financial assets held for trading | | 3,330,819 | | | (10,299,383 | ) |
Loans and advances to credit institutions | | — | | | — | |
Money market operations through counterparties | | — | | | — | |
Loans and advances to other debtors | | — | | | — | |
Debt securities | | 5,893,072 | | | (1,731,181 | ) |
Other equity instruments | | (554,470 | ) | | (3,661,105 | ) |
Trading derivatives | | (2,007,783 | ) | | (4,907,097 | ) |
Other financial assets at fair value through profit or loss | | (361,763 | ) | | (102,013 | ) |
Loans and advances to credit institutions | | — | | | — | |
Money market operations through counterparties | | — | | | — | |
Loans and advances to other debtors | | — | | | — | |
Debt securities | | (224,145 | ) | | (58,771 | ) |
Other equity instruments | | (137,618 | ) | | (43,242 | ) |
Available-for-sale financial assets | | (4,024,366 | ) | | (271,581 | ) |
Debt securities | | (5,998,254 | ) | | 2,280,133 | |
Other equity instruments | | 1,973,888 | | | (2,551,715 | ) |
Loans and receivables | | (54,290,431 | ) | | (21,282,492 | ) |
Loans and advances to credit institutions | | (10,773,069 | ) | | 4,206,274 | |
Money market operations through counterparties | | 241,999 | | | 157,998 | |
Loans and advances to other debtors | | (46,158,632 | ) | | (25,208,703 | ) |
Debt securities | | 3,204,972 | | | 710,578 | |
Other financial assets | | (805,701 | ) | | (1,148,639 | ) |
Other operating assets | | (613,634 | ) | | 1,566,484 | |
| | | | | | |
Net increase/decrease in operating liabilities | | 53,544,980 | | | 27,562,514 | |
| | | | | | |
Financial liabilities held for trading | | 2,136,452 | | | 7,786,360 | |
Deposits from credit institutions | | — | | | — | |
Money market operations through counterparties | | — | | | — | |
Deposits from other creditors | | — | | | — | |
Debt certificates (including bonds) | | — | | | — | |
Trading derivatives | | 1.059.732 | | | 7.918.086 | |
Short positions | | 1,076,720 | | | (131,726 | ) |
F-10
| | | | | | | | |
| | | 2005 | | | 2004 | |
Other financial liabilities at fair value through profit or loss | | (94,262) | | | (123,127 | ) |
Deposits from credit institutions | | — | | | — | |
Deposits from other creditors | | (94,262) | | | (123,127 | ) |
Debt certificates (including bonds) | | — | | | — | |
Financial liabilities at fair value through equity | | — | | | — | |
Deposits from credit institutions | | — | | | — | |
Deposits from other creditors | | — | | | — | |
Debt certificates (including bonds) | | — | | | — | |
Financial liabilities measured at amortised cost | | 51,218,706 | | | 22,047,117 | |
Deposits from central banks | | 1,031,331 | | | (723,613 | ) |
Deposits from credit institutions | | 1,308,632 | | | 5,552,861 | |
Money market operations through counterparties | | (634,752 | ) | | 514,759 | |
Deposits from other creditors | | 31,823,914 | | | 5,315,333 | |
Debt certificates (including bonds) | | 16,555,131 | | | 10,502,918 | |
Other financial liabilities | | 1,134,450 | | | 884,859 | |
Other operating liabilities | | 284,084 | | | (2,147,836 | ) |
| | | | | | | | |
Total net cash flows from operating activities (1) | | 6,010,810 | | | 3,533,071 | |
| | | | | | | | |
CASH FLOWS FROM INVESTING ACTIVITIES | | (4,190,926) | | | (2,104,591 | ) |
Investments (-) | | (4,832,207) | | | (3,363,952 | ) |
Group entities, jointly controlled entities and associates | | (84,491) | | | (403,094 | ) |
Tangible assets | | (1,487,654) | | | (635,335 | ) |
Intangible assets | | (1,375,290) | | | (99,917 | ) |
Held-to-maturity investments | | (1,884,772) | | | (2,225,606 | ) |
Other financial assets | | — | | | — | |
Other assets | | — | | | — | |
Divestments (+) | | 641,281 | | | 1,259,361 | |
Group entities, jointly controlled entities and associates | | 10,676 | | | 488,339 | |
Tangible assets | | 509,380 | | | 644,861 | |
Intangible assets | | 121,225 | | | 126,161 | |
Held-to-maturity investments | | — | | | — | |
Other financial assets | | — | | | — | |
Other assets | | — | | | — | |
| | | | | | | | |
Total net cash flows from investing activities (2) | | (4,190,926) | | | (2,104,591 | ) |
| | | | | | | | |
CASH FLOWS FROM FINANCING ACTIVITIES | | (555,819) | | | 507,462 | |
Issuance/Redemption of capital (+/-) | | — | | | 1,998,750 | |
Acquisition of own equity instruments (-) | | (3,839,510) | | | (3,220,752 | ) |
Disposal of own equity instruments (+) | | 3,779,037 | | | 3,266,937 | |
Issuance/Redemption of non-voting equity units (+/-) | | — | | | — | |
Issuance/Redemption of other equity instruments (+/-) | | — | | | — | |
Issuance/Redemption of capital having the nature of a financial liability (+/-) | | — | | | — | |
Issuance/Redemption of subordinated liabilities (+/-) | | 1,387,248 | | | 1,030,243 | |
Issuance/Redemption of other long-term liabilities (+/-) | | — | | | — | |
Increase/Decrease in minority interests (+/-) | | 233,951 | | | (1,179,625 | ) |
Dividends/Interest paid (-) | | (1,595,222) | | | (1,349,369 | ) |
Other items relating to financing activities (+/-) | | (521,323) | | | (38,722 | ) |
| | | | | | | | |
Total net cash flows from financing activities (3) | | (555,819) | | | 507,462 | |
| | | | | | | | |
EFFECT OF EXCHANGE RATE CHANGES ON CASH OR CASH EQUIVALENTS (4) | | 929,971 | | | 77,273 | |
| | | | | | | | |
NET INCREASE/DECREASE IN CASH OR CASH EQUIVALENTS (1+2+3+4) | | 2,194,036 | | | 2,013,215 | |
| | | | | | | | |
Cash or cash equivalents at beginning of year | | 10,123,090 | | | 8,109,875 | |
Cash or cash equivalents at end of year | | 12,317,126 | | | 10,123,090 | |
The accompanying Notes 1 to 59 and Exhibit 8.1 are an integral part of the consolidated cash flow statement for the year ended December 31, 2005.
F-11
BANCO BILBAO VIZCAYA ARGENTARIA, S.A. AND COMPANIES COMPOSING THE
BANCO BILBAO VIZCAYA ARGENTARIA GROUP
NOTES TO THE CONSOLIDATED FINANCIAL STATEMENTS FOR THE YEAR ENDED
DECEMBER 31, 2005
1. Introduction, basis of presentation of the consolidated financial statements at December 31, 2005 and other information
1.1. Introduction
Banco Bilbao Vizcaya Argentaria, S.A. (“the Bank” or “BBVA”) is a private-law entity governed by the rules and regulations applicable to banks operating in Spain. The Bank conducts its business through branches and offices located throughout Spain and abroad.
The articles of association and other public information on the Bank can be consulted both at its registered office (Plaza San Nicolás, 4, Bilbao) and on its official website, www.bbva.com.
In addition to the operations carried on directly by it, the Bank is the head of a group of subsidiaries, jointly controlled entities and associates that engage in various business activities and which compose, together with the Bank, the Banco Bilbao Vizcaya Argentaria Group (“the Group” or “BBVA Group”). Therefore, the Bank is obliged to prepare, in addition to its own financial statements, the Group’s consolidated financial statements.
The Group’s consolidated financial statements for 2004 were approved by the shareholders at the Bank’s Annual General Meeting on February 26, 2005. The 2005 consolidated financial statements of the Group and the 2005 financial statements of the Bank and of substantially all the Group companies have not yet been approved by their shareholders at the respective Annual General Meetings. However, the Bank’s Board of Directors considers that the aforementioned financial statements will be approved without any changes.
1.2. Basis of presentation of the consolidated financial statements
Under Regulation (EC) no, 1606/2002 of the European Parliament and of the Council of July 19, 2002, all companies governed by the law of an EU Member State and whose securities are admitted to trading on a regulated market of any Member State must prepare their consolidated financial statements for the years beginning on or after January 1, 2005 in conformity with the International Financial Reporting Standards previously adopted by the European Union (“EU-IFRSs”). Therefore, the Group is required to prepare its consolidated financial statements for the year ending December 31, 2005 in conformity with the EU-IFRSs ratified by the European Union at that date.
In order to adapt the accounting system of Spanish credit institutions to the new standards, the Bank of Spain issued Circular 4/2004 of 22 December 2004 on Public and Confidential Financial Reporting Rules and Formats.
The BBVA Group’s consolidated financial statements of 2005 were prepared by the Bank’s directors (at the Board Meeting on February 10, 2006) in accordance with EU-IFRSs, taking into account Bank of Spain Circular 4/2004, and by applying the basis of consolidation, accounting policies and measurement bases described in Note 2, so that they present fairly the Group’s equity and financial position at 31 December 2005, and the results of its operations, the changes in consolidated equity and the consolidated cash flows in 2005. These consolidated financial statements were prepared on the basis of the accounting records kept by the Bank and by each of the other Group companies and include the adjustments and reclassifications required to unify the accounting policies and measurement bases used by the Group (Note 2.2).
All accounting policies and measurement bases with a significant effect on the consolidated financial statements were applied in their preparation.
1.3. Comparative information
The consolidated financial statements for the year ended December 31, 2005 are the first to have been prepared in accordance with EU-IFRSs; these standards entail, with respect to the rules in force (Bank of Spain Circular 4/1991) when the
F-12
Group’s consolidated financial statements for 2004 were prepared, significant changes in the accounting policies, measurement bases and presentation of the financial statements making up the annual financial statements. The main effects of the adaptation to EU-IFRSs are explained in Note 3.
The information relating to 2004 contained in these notes to the consolidated financial statements is presented, solely for comparison purposes, with information relating to 2005 and, accordingly, it does not constitute the Group’s statutory consolidated financial statements for 2004.
1.4. Responsibility for the information and for the estimates made
The information in these BBVA Group consolidated financial statements is the responsibility of the Group’s directors. In preparing these consolidated financial statements estimates were occasionally made by the Group and the consolidated companies in order to quantify certain of the assets, liabilities, income, expenses and commitments reported herein. These estimates relate mainly to the following:
| | • | | The impairment losses on certain assets. |
| | • | | The assumptions used in the actuarial calculation of the post-employment benefit liabilities and commitments (Note 2.2.f). |
| | • | | The useful life of tangible and intangible assets. |
| | • | | The measurement of goodwill arising on consolidation (Note 21). |
| | • | | The fair value of certain unquoted assets. |
Although these estimates were made on the basis of the best information available at December 31, 2005 on the events analysed, events that take place in the future might make it necessary to change these estimates (upwards or downwards) in coming years.
1.5. Environmental impact
At December 31, 2005 the Group’s consolidated financial statements did not disclose any item that should be included in the environmental information document envisaged in the related Ministry of the Economy Order dated October 8, 2001.
1.6. Detail of agents of credit institutions
The detail of agents de BBVA required pursuant to Article 22 of Royal Decree 1245/1995 of 14 July of the Ministry of Economy and Finance is included in the financial statements of the Bank.
1.7. Report on the activity of the Customer Care Department and the Customer Ombudsman
The report on the activity of the Customer Care Department and the Customer Ombudsman required pursuant to Article 17 of Ministry of Economy and Finance Order ECO/734/2004 of 11 March is included in the management report of the Group.
1.8. Minimum capital
Law 13/1992 of June 1, 1992 and Bank of Spain Circular 5/1993 and subsequent amendments thereto regulate the minimum capital requirements for Spanish credit institutions – both as individual entities and as consolidated groups – and the manner in which these capital requirements are to be calculated.
At December 31, 2005 and 2004 the Group’s qualifying capital exceeded the minimum required under the aforementioned legislation.
2. Basis of consolidation, accounting policies and measurement bases applied
2.1. Basis of consolidation
a) Subsidiaries
The Parent’s subsidiaries are included in the BBVA Group consolidated financial statements using the full consolidation method. “Subsidiaries” are defined as entities over which the Group has the capacity to exercise control taken to be the power to govern the financial and operating policies of an entity so as to obtain benefits from its activities, is, in general but not exclusively, presumed to exist when the Parent owns directly or indirectly, of half or more of the voting power of the investee or, even if this percentage is lower or zero, when, for example, there are agreements with other shareholders of the investee that give the Group control.
F-13
In this connection, there are several companies forming part of the BBVA Banco Continental (Peru) Group which, although less than 50% owned by the Group, are fully consolidated because the agreements entered into with the other shareholders give the Group effective control. These companies are Banco Continental, S.A. (parent), Continental Bolsa, S.A.B., Continental, S.A. Sociedad Administradora de Fondos, Continental Sociedad Titulizadora and Inmuebles y Recuperaciones Continental. Similarly, Banco Provincial Overseas, N,V, is fully consolidated due to the ownership of Group of 48% over Inversiones Banpro International Inc. N.V., which owns 100% of this bank.
The financial statements of the subsidiaries are fully consolidated with those of the Bank. Accordingly, all material balances and effects of the transactions between consolidated companies were eliminated on consolidation. Since the accounting policies and measurement bases used in preparing the Group’s consolidated financial statements at December 31, 2005 may differ from those used by certain Group companies, the required adjustments and reclassifications were made on consolidation to unify the policies and bases used and to make them compliant with EU-IFRSs.
The share of third parties in the Group’s equity is presented under the heading Minority Interests in the consolidated balance sheet and their share in the profit or loss for the year is presented under the heading Income Attributed to Minority Interests in the consolidated income statement (Note 29).
The results of subsidiaries acquired during the year are included in the consolidated income statement from the date of acquisition to year-end, similarly, the results of subsidiaries disposed of during the year are included in the consolidated income statement from the beginning of the year to the date of disposal.
Note 4 contains information on the most significant investments and divestments in subsidiaries that took place in 2005 and 2004.
Appendix I includes the salient information on these companies.
b) Jointly controlled entities
“Jointly controlled entities” are defined as entities that are not subsidiaries but which are controlled jointly by two or more unrelated entities; they form part of the definition of “joint ventures”, which are deemed to exist when two or more entities (“venturers”) are bound by a contractual agreement that establishes joint control.
EU-IFRSs envisage two methods for the recognition of jointly controlled entities: the equity method and the proportionate consolidation method. Under the proportionate consolidation method, the aggregation of balances and subsequent eliminations are only made in proportion to the Group’s ownership interest in the capital of these entities. The assets and liabilities assigned by the Group to jointly controlled operations and the Group’s share of the jointly controlled assets are recognised in the consolidated balance sheet classified according to their specific nature. Similarly, the Group’s share of the income and expenses of joint ventures is recognised in the consolidated income statement on the basis of their nature. This method was applied to the following entities: Advera, S.A., Holding de Participaciones Industriales 2000, S.A. and PSA Finance Argentina Compañía Financiera, S.A.
Since the accounting policies and measurement bases used in preparing the Group’s consolidated financial statements at December 31, 2005 may differ from those used by certain Group companies, the required adjustments and reclassifications were made on consolidation to unify the policies and bases used and to make them compliant with EU-IFRSs.
Appendix II includes the salient information on these companies.
The Group opted to value its ownership interests, using the equity method, since it considered that this better reflected the financial situation of these holdings; this decision did not have a material economic impact on the margins in the consolidated income statement in 2005 and 2004.
The joint ventures that the Group accounted for using the equity method at December 31, 2005, are listed in Appendix III.
Had these entities been consolidated by the proportionate consolidation method, the Group’s total assets at December 31, 2005 and 2004, would have increased by approximately EUR 779,776 thousand and EUR 747,802 thousand, respectively.
At December 31, 2004, in addition to the companies referred to in the preceding paragraph, the joint ventures Azeler Automoción, S.A. and Iniciativas Residenciales en Internet, S.A. were recognised as joint ventures that were accounted for using the equity method (Note 18.2).
F-14
c) Associates
“Associates” are defined as entities over which the Group is in a position to exercise significant influence, but not control. Significant influence is presumed to exist when the Group owns directly or indirectly 20% or more of the voting power of the investee.
However, certain entities in which the Group owns 20% or more of the voting rights are not included as Group associates, since it is considered that the Group does not have the capacity to exercise significant influence over these entities. The investments in these entities, which do not represent material amounts for the Group, are classified as available-for-sale investments.
Banca Nazionale del Lavoro, S.p.A., the Italian entity in which the Group held a 14.427% ownership interest at December 31, 2005 and a 14.639% ownership interest at December 31, 2004, was considered to be an associate because the Group has the capacity to exercise a significant influence over this entity, basically as a result of the related shareholders’ agreement (Note 18.1).
Investments in associates are accounted for using the equity method, i.e. at the Group’s share of net assets of the investee, after taking into account the dividends received therefrom and other equity eliminations.
Since the accounting policies and measurement bases used in preparing the Group’s consolidated financial statements at December 31, 2005 may differ from those used by certain associates, the required adjustments and reclassifications were made on consolidation to unify the policies and bases used and to make them compliant with EU-IFRSs.
Appendix III contains the salient information on the associates.
2.2. Accounting policies and measurement bases applied
The accounting policies and measurement bases used in preparing these consolidated financial statements were as follows:
a) First-time adoption of International Financial Reporting Standards
IFRS-EU 1 sets forth the criteria that must be adopted when implementing EU-IFRSs for the first time. These criteria are contained in Transitional Provision One of Bank of Spain Circular 4/2004.
In accordance with these standards, companies are required to prepare an opening EU-IFRS balance sheet at January 1, 2004. The accounting policies used in the opening balance sheet may differ from those applied in accordance with the previous accounting rules, and the adjustments resulting from these differences in criteria will, as a general rule, be recognised directly in reserves (retained earnings).
Additionally, IFRS-EU 1 describes the exemptions from the general accounting criteria contained in the EU-IFRSs for the preparation of the opening balance sheet. The main criteria used by the Group in preparing the opening balance sheet are indicated in Note 3 in the section entitled “Main effects of adaptation to International Financial Reporting Standards (IFRSs)”.
b) Fair value
The fair value of an asset or a liability on a given date is taken to be the amount for which it could be bought or sold on that date by two knowledgeable, independent parties in an arm’s length transaction acting prudently. The most objective and common reference for the fair value of an asset or a liability is the price that would be paid for it on an organised, transparent and deep market (“quoted price” or “market price”).
If there is no market price for a given asset or liability, its fair value is estimated on the basis of the price established in recent transactions involving similar instruments and, in the absence thereof, by using mathematical measurement models sufficiently tried and trusted by the international financial community. Such estimates would take into consideration the specific features of the asset or liability to be measured and, in particular, the various types of risk associated with the asset or liability. However, the limitations inherent to the measurement models developed and the possible inaccuracies of the assumptions required by these models may signify that the fair value of an asset or liability thus estimated does not coincide exactly with the price for which the asset or liability could be purchased or sold on the date of its measurement.
c) Financial instruments
c.1) Classification
Financial assets/liabilities held for trading: these include the financial assets and liabilities acquired with the intention of generating a profit from short-term fluctuations in their prices or from differences between their purchase and sale prices.
F-15
These headings also include financial derivatives not considered to qualify for hedge accounting and, in the case of financial liabilities held for trading, the financial liabilities arising from the outright sale of financial assets purchased under reverse repurchase agreements or borrowed (“short positions”).
Other financial assets and financial liabilities at fair value through profit or loss: the heading Other Financial Assets at Fair Value through Profit or Loss includes the financial assets not held for trading that:
| | • | | are hybrid financial assets and contain an embedded derivative whose fair value cannot reliably be determined, or |
| | • | | are managed jointly with “liabilities under insurance contracts” measured at fair value, with financial derivatives whose purpose and effect is to significantly reduce exposure to changes in fair value, or with financial liabilities and derivatives whose purpose is to significantly reduce overall interest rate risk exposure, |
The heading Other Financial Liabilities at Fair Value through Profit or Loss includes the financial liabilities not held for trading that are hybrid financial liabilities and contain an embedded derivative whose fair value cannot be reliably estimated.
Financial instruments involved in this category are permanently subject to an integrated and consistent system of measuring, managing and controlling risks and profit or loss that enables all the financial instruments involved to be monitored and identified and allows the effective reduction of risk to be checked.
These headings include both the investment and customer deposits through unit-linked life insurance policies (in which the policyholder assumes the investment risk).
Available-for-sale financial assets: these include debt securities not classified as held-to-maturity investments or as financial assets at fair value through profit or loss, and equity instruments issued by entities other than subsidiaries, associates and those jointly controlled, provided that such instruments have not been classified as held for trading or as other financial assets at fair value through profit or loss.
Loans and receivables: this heading relates to the financing granted to third parties, classified on the basis of the nature thereof, irrespective of the nature of the borrower and the form of financing granted, and includes finance leases in which consolidated companies act as lessors.
The consolidated companies generally intend to hold the loans and credits granted by them until their final maturity; therefore, they are presented in the consolidated balance sheet at their amortised cost (which includes any corrections required to reflect the estimated losses on their recovery).
Held-to-maturity investments: this heading includes debt securities for which the Group, from inception and at any subsequent date, has the intention to hold until final maturity, since it has the financial capacity to do so.
Financial liabilities at fair value through equity: these include financial liabilities associated with available-for-sale financial assets arising as a result of a transfer of assets in which the transferor neither transfers nor retains substantially all the risks and rewards of ownership of the assets.
Financial liabilities at amortised cost: this heading includes, irrespective of their instrumentation and maturity, the financial liabilities not included in any other heading in the consolidated balance sheet which relate to the typical deposit-taking activities carried on by financial institutions.
Equity having the nature of a financial liability: this heading includes the liabilities issued by the consolidated entities which, although capital for legal purposes, do not meet the requirements for classification as equity. It also includes equity instruments issued by the consolidated entities that do not carry any voting rights.
F-16
c.2) Measurement
All financial instruments are initially recognised at fair value which, in the absence of evidence to the contrary, shall be the transaction price. These instruments will subsequently be measured on the basis of their classification. In the case of quoted financial instruments, fair value will be taken to be their market price. For unquoted financial instruments, fair value will be obtained using the valuation techniques customarily used in the market.
Financial assets:
Financial assets are measured at fair value, except for:
| • | | Held-to-maturity investments, and |
| • | | Equity instruments whose fair value cannot be determined in a sufficiently objective manner and financial derivatives that have those instruments as their underlying and are settled by delivery of those instruments. |
Loans and receivables and held-to-maturity investments are measured at amortised cost using the effective interest rate method. Amortised cost is understood to be the acquisition cost of a financial asset or liability minus principal repayments, plus or minus the systematic amortisation (as reflected in the income statements) of any difference between the initial cost and the maturity amount, In the case of financial assets, amortised cost also includes any value adjustments for impairment.
The effective interest rate is the discount rate that exactly equates the carrying amount of a financial instrument to all its estimated cash flows of all kinds during its residual life. For fixed rate financial instruments, the effective interest rate coincides with the contractual interest rate established on the acquisition date plus, where applicable, the fees and commissions which, because of their nature, can be equated with a rate of interest. In the case of floating rate financial instruments, the effective interest rate coincides with the rate of return prevailing in all connections until the date on which the reference interest rate is to be revised for the first time.
Equity instruments whose fair value cannot be determined in a sufficiently objective manner and financial derivatives that have those instruments as their underlying and are settled by delivery of those instruments are measured at acquisition cost adjusted, where appropriate, by any related impairment loss.
Financial liabilities:
Financial liabilities are measured at amortised cost, except for:
| • | | Those included under the headings Financial Liabilities Held for Trading, Financial Liabilities at Fair Value through Profit or Loss and Financial Liabilities at Fair Value through Equity and the financial liabilities designated as hedged items in fair value hedges or as hedging instruments, which are all measured at fair value, and |
| • | | Financial derivatives that have as their underlying equity instruments whose fair value cannot be determined in a sufficiently objective manner and are settled by delivery of those instruments; these derivatives are measured at cost. |
c.3) Recognition of changes in the measurement of financial assets and liabilities
Based on the classification of financial instruments, any changes in the carrying amounts of the financial assets and liabilities classified as held for trading and as other financial assets and liabilities though profit or loss are recognised with a balancing entry in the consolidated income statement. A distinction is made between the changes resulting from the accrual of interest and similar items, which are recorded under the headings Interest and Similar Income or Interest Expense and Similar Charges, as appropriate, and those arising for other reasons, which are recorded at their net amount under the heading Gains or Losses on Financial Assets and Liabilities in the consolidated income statement.
Valuation adjustments arising on available-for-sale non-monetary financial assets are recognised temporarily under the heading Valuation Adjustments - Available-for-Sale Financial Assets, unless they relate to exchange differences, in which case they are recognised temporarily under the heading Valuation Adjustments - Exchange Differences.
Items charged or credited to the headings Valuation Adjustments - Available-for-Sale Financial Assets and Valuation Adjustments - Exchange Differences remain in the Group’s consolidated equity until the asset giving rise to them is removed from the consolidated balance sheet, whereupon they are charged or credited to the consolidated income statement.
F-17
Valuation adjustments arising on non-current assets held for sale and the liabilities associated with them are recognised with a balancing entry under the heading Valuation Adjustments - Non-Current Assets Held for Sale.
Valuation adjustments arising on financial liabilities at fair value through equity are recognised with a balancing entry under the heading Valuation Adjustments - Financial Liabilities at Fair Value through Equity.
In the specific case of financial instruments designated as hedged items or qualifying for hedge accounting (Note 2.2.e), valuation differences are recognised as follows:
| • | | In fair value hedges, the differences arising on both the hedging instruments and the hedged items – with regard to the type of risk being hedged – are recognised directly in the consolidated income statement. |
| • | | In cash flow hedges and hedges of net investments in foreign operations, the valuation differences relating to the ineffective portion of the hedging transaction are recognised directly in the consolidated income statement. |
| • | | In cash flow hedges, the valuation differences arising on the effective portion of the hedging instruments are recognised temporarily under the heading Valuation Adjustments - Cash Flow Hedges. |
| • | | In hedges of net investments in foreign operations, the valuation differences arising on the effective portion of the hedging instruments are recognised temporarily under the heading Valuation Adjustments - Hedges of Net Investments in Foreign Operations. |
In the two last-mentioned cases, the valuation differences are not recognised in profit or loss until the gains or losses of the hedged item are recognised in the income statement or until the date of maturity of the hedged item.
In fair value portfolio hedges of interest rate risk, the gains or losses that arise on measuring the hedging instruments are recognised directly in the consolidated income statement, whereas the gains or losses due to changes in the fair value of the hedged amount are recorded in the consolidated income statement with a balancing entry under the heading Changes in the Fair Value of the Hedged Items in Portfolio Hedges of Interest Rate Risk on the asset or liability side of the balance sheet, as appropriate.
In cash flow portfolio hedges of interest rate risk, the effective portion of the change in value of the hedging instrument is recognised temporarily under the heading Valuation Adjustments - Cash Flow Hedges until the forecast transactions are performed, at which time it is recorded in the consolidated income statement. The ineffective portion of the change in value of hedging derivatives is recognised directly in the consolidated income statement.
c.4) Impairment
A financial asset is considered to be impaired – and therefore its carrying amount is adjusted to reflect the effect of its impairment – when there is objective evidence that events have occurred which:
| • | | In the case of debt instruments (loans and debt securities), give rise to a negative impact on the future cash flows that were estimated at the time the transaction was arranged. |
| • | | In the case of equity instruments, mean that the carrying amount of these instruments cannot be recovered. |
As a general rule, the carrying amount of impaired financial instruments is adjusted with a charge to the consolidated income statement for the year in which the impairment becomes known, and the recoveries of previously recognised impairment losses are recognised in the consolidated income statement for the year in which the impairment is reversed or reduced.
Balances are considered to be impaired, and accrual of the interest thereon is suspended, when there are reasonable doubts that the balances will be recovered in full and/or the related interest will be collected for the amounts and on the dates initially agreed upon, taking into account the guarantees received by the consolidated entities to assure (in part or in full) the performance of transactions. Amounts collected in relation to impaired loans and receivables are used to recognise the related accrued interest and any excess amount is used to reduce the principal not yet repaid.
When the recovery of any recognised amount is considered to be remote, this amount is removed from the consolidated balance sheet, without prejudice to any actions taken by the consolidated entities in order to collect the amount until their rights extinguish in full through expiry, forgiveness or for other reasons.
F-18
Debt instruments carried at amortised cost:
The amount of the impairment losses incurred on these instruments relates to the positive difference between their respective carrying amounts and the present values of their expected future cash flows. However, the market value of quoted debt instruments is deemed to be a fair estimate of the present value of their future cash flows.
The following is to be taken into consideration when estimating the future cash flows of debt instruments:
| • | | All the amounts that are expected to be obtained over the residual life of the instrument; including, where appropriate, those which may result from the guarantees provided for the instrument (after deducting the costs required for foreclosure and subsequent sale), |
| • | | The various types of risk to which each instrument is subject, and |
| • | | The circumstances in which collections will foreseeably be made. |
These cash flows are subsequently discounted using the instrument’s effective interest rate (if its contractual rate is fixed) or the effective contractual interest rate at the discount date (if it is variable).
The possible impairment losses on these assets are determined:
| • | | Individually, for all significant debt instruments and for those which, although not significant, cannot be classified in homogenous groups of instruments of similar characteristics, i.e. by instrument type, debtor’s industry and geographical location, type of guarantee, age of past-due amounts, etc. |
| • | | Collectively, in all other cases. |
Criteria for determining impairment losses resulting from materialization of the insolvency risk of the obligors have been established. Under these criteria, a debt instrument is impaired due to insolvency:
| • | | When there is evidence of a deterioration of the obligor’s ability to pay, either because it is in arrears or for other reasons, and/or |
| • | | When country risk materialises; country risk is considered to be the risk associated with debtors resident in a given country due to circumstances other than normal commercial risk. |
Similarly, different classifications of transactions has been established on the basis of the nature of the obligors, the conditions of the countries in which they reside, transaction status, type of associated guarantees, and time in arrears for each of these risk groups it establishes the minimum impairment losses (“identified losses”) that must be recognised in the financial statements of consolidated entities.
In addition to the recognition of identified losses, it requires provisioning for the losses inherent in debt instruments not measured at fair value through profit or loss and in contingent risks classified as standard, taking into account the historical experience of impairment and the other circumstances known at the time of the assessment. For these purposes, inherent losses are the losses incurred at the date of the financial statements, calculated using statistical procedures, that have not been allocated to specific transactions.
Inherent losses are quantified by applying the parameters established by the Bank of Spain on the basis of its experience and of information on the Spanish banking industry.
Other debt instruments:
The impairment losses on debt securities included in the available-for-sale financial asset portfolio are equal to the positive difference between their acquisition cost (net of any principal repayment) and their fair value after deducting any impairment loss previously recognised in the consolidated income statement.
When there is objective evidence that the negative differences arising on measurement of these assets are due to impairment, they are no longer considered as Valuation Adjustments - Available-for-Sale Financial Assets and are recognised in the consolidated income statement. If all or part of the impairment losses are subsequently recovered, the amount is recognised in the consolidated income statement for the year in which the recovery occurred.
Similarly, in the case of debt instruments classified as non-current assets held for sale, losses previously recorded in equity are considered to be realised – and are recognised in the consolidated income statement – on the date the instruments are so classified.
F-19
Equity instruments measured at fair value:
The criteria for quantifying and recognising impairment losses on these instruments are similar to those for other debt instruments, with the exception that any recovery of these losses recognised is under the heading Valuation Adjustments—Available-for-Sale Financial Assets.
Equity instruments measured at cost:
The impairment losses on equity instruments measured at acquisition cost are equal to the difference between their carrying amount and the present value of expected future cash flows discounted at the market rate of return for similar securities. These impairment losses are determined taking into account the equity of the investee (except for valuation adjustments due to cash flow hedges) per the last approved (consolidated) balance sheet, adjusted for the unrealised gains at the measurement date.
Impairment losses are recognised in the consolidated income statement for the year in which they arise as a direct reduction of the cost of the instrument. These losses may only be reversed subsequently in the event of the sale of the assets.
d) Recognition of income and expenses
The most significant criteria used by the Group to recognise its income and expenses are summarised as follows:
Interest income and expenses and similar items:
As a general rule, interest income and expenses and similar items are recognised on the basis of their year of accrual using the effective interest method. Specifically, dividends received from other companies are recognised as income when the consolidated companies’ right to receive them arises.
However, when a debt instrument is deemed to be impaired individually or is included in a group of instruments that are impaired because of amounts more than three months past-due, the recognition of accrued interest in the consolidated income statement is interrupted. This interest is recognised for accounting purposes when it is received, as a recovery of the impairment loss.
Commissions, fees and similar items:
Income and expenses relating to commissions and similar fees are recognised in the consolidated income statement using criteria that vary according to their nature. The most significant income and expense items in this connection are:
| • | | Those relating linked to financial assets and liabilities measured at fair value through profit or loss, which are recognised when collected. |
| • | | Those arising from transactions or services that are provided over a year of time, which are recognised over the life of these transactions or services. |
| • | | Those relating to a single act, which are recognised when the single act is carried out. |
Non-financial income and expenses:
These are recorded for accounting purposes on an accrual basis.
Deferred collections and payments:
These are recorded for accounting purposes at the amount resulting from discounting the expected cash flows at market rates.
Loan arrangement fees and commissions:
The financial fees and commissions that arise on the arrangement of loans, basically origination and analysis fees, must be deferred and recognised in the income statement over the life of the loan. The direct costs incurred in arranging these transactions can be deducted from the amount thus recognised.
e) Financial derivatives and hedge accounting
Financial derivatives are instruments that permit the transfer to third parties of all or part of the credit and/or market risks associated with balances and transactions. The underlyings used in these derivatives can be interest rates, specific indices, the prices of certain securities, cross-currency exchange rates or other similar references.
F-20
All derivatives are recognised in the balance sheet at fair value from the date of arrangement. If the fair value of a derivative is positive, it is recorded as an asset and if it is negative, it is recorded as a liability. Unless there is evidence to the contrary, it is understood that on the date of arrangement the fair value of the derivatives is equal to the transaction price. Changes in the fair value of derivatives after the date of arrangement are recognised with a balancing entry under the heading Gains or Losses on Financial Assets and Liabilities in the consolidated income statement. Specifically, the fair value of the standard financial derivatives included in the held for trading portfolios is equal to their daily quoted price. If, under exceptional circumstances, their quoted price cannot be established on a given date, these derivatives are measured using methods similar to those used to measure over-the-counter (“OTC”) derivatives.
The fair value of OTC derivatives is equal to the sum of the future cash flows arising from the instrument, discounted at the measurement date (“present value” or “theoretical close”); these derivatives are measured using methods recognised by the financial markets, including the net present value (NPV) method and option price calculation models.
Financial derivatives that have as their underlying equity instruments whose fair value cannot be determined in a sufficiently objective manner and are settled by delivery of those instruments, are measured at cost.
Hedge accounting
A financial derivative may be considered as qualifying for hedge accounting only if it meets the following three conditions:
- It must hedge one of the following three types of risk:
| • | | Changes in the value of assets and liabilities due to fluctuations in the interest rate and/or exchange rate to which the position or balance to be covered (“fair value hedge”), |
| • | | Changes in the estimated cash flows arising from financial assets and liabilities and highly probable transactions which an entity plans to carry out (“cash flow hedge”), |
| • | | Net investment in a foreign operation (“hedge of net investments in foreign operations”), which, in practice, is equivalent to a cash flow hedge. |
- It must effectively eliminate a significant portion of the risk inherent in the hedged item or position over the expected term of the hedge, which means that:
| • | | At the date of arrangement the hedge is expected, under normal conditions, to be highly effective (“prospective effectiveness”). |
| • | | There is sufficient evidence that the hedge was fully effective during the whole life of the hedged item or position (“retrospective effectiveness”). |
- Lastly, there must be adequate documentation evidencing the specific designation of the financial derivative to hedge certain balances or transactions and the manner in which this hedge is expected to be achieved (provided that this is in line with the Group’s management of own risks).
Most of the hedges arranged by the Group are fair value hedges.
Portfolio hedge of interest rate risk
A portfolio hedge of interest rate risk is that which hedges the interest rate risk exposure of a certain amount of financial assets or financial liabilities forming part of the overall financial instrument portfolio, but not the interest rate risk exposure of specific instruments. Portfolio hedges can take the form of fair value or cash flow hedges.
The gains or losses arising from changes in the fair value of the interest rate risk of effectively financial instruments are charged or credited, as appropriate, to the heading Changes in the Fair Value of the Hedged Items in Portfolio Hedges of Interest Rate Risk on the asset or liability side of the consolidated balance sheet.
At December 31, 2005, the Group had no portfolio hedge of interest rate risk operations.
F-21
f) Pension commitments and other commitments to employees
1. Companies in Spain
1.1. Post-employment benefits:
Following is a description of the most significant accounting criteria and the salient data relating to the post-employment benefit commitments of certain Group companies in Spain. These commitments include the undertaking to supplement the public social security benefits in the event of retirement, permanent disability or death; compensation and indemnities payable; and contributions to employee welfare systems for early retirees and post-employment welfare benefits.
1.1.1. Public social security system benefit supplement
Under the collective labour agreement in force, Spanish banks are required to supplement the social security benefits received by employees or their beneficiary rightholders in the event of retirement (except for those hired after March 8, 1980), permanent disability, death of spouse or death of parent.
The employee welfare systems in place at the Group’s Spanish banks supersede and improve the terms and conditions of the collective labour agreement for the banking industry; the commitments envisaged in the event of retirement, death and disability cover all employees, including those hired on or after March 8, 1980. The Group’s Spanish banks externalised all their commitments to serving and retired employees pursuant to Royal Decree 1588/1999 of 15 October. These commitments are instrumented in Pension Plans, insurance contracts with a non-Group company and insurance contracts with BBVA Seguros, S.A. de Seguros y Reaseguros, which is 99.93% owned by the Banco Bilbao Vizcaya Argentaria Group. These employee welfare systems include defined contribution commitments, the amounts of which are determined, on a case-by-case basis, as a percentage of certain remuneration items and/or as a pre-established annual amount. Defined benefit commitments are funded by insurance contracts and internal Group provisions.
Defined contribution commitments: the current contributions made by the Group’s Spanish companies for defined contribution retirement commitments covering substantially all current employees, which are recognised with a charge to the heading Personnel Expenses – Transfers to Pension Plans in the accompanying consolidated income statements, amounted to EUR 38,099 thousand and EUR 42,503 thousand in 2005 and 2004, respectively.
Defined benefit commitments: The Group’s Spanish companies have defined benefit commitments for permanent disability and death of current employees and early retirees; for death of certain retired employees; and defined-benefit retirement commitments applicable only to certain groups of serving employees (unvested benefits), or early retired employees (vested benefits) and of retired employees (ongoing benefits).
The present values of the vested obligations are quantified on a case-by-case basis. The valuation method used for current employees is the projected unit credit method, which views each year of service as giving rise to an additional unit of benefit entitlement and measures each unit separately. The actuarial assumptions used in quantifying these obligations are unbiased and mutually compatible. Specifically, the most significant actuarial assumptions used in 2005 and 2004 were as follows:
| | • | | Mortality tables: PERM/F 2000 P |
| | • | | Discount rate: 4% (cumulative annual)/AA corporate bond yield curve |
| | • | | Consumer price index: 1.5% (cumulative annual) |
| | • | | Salary growth rate: at least 2.5% (cumulative annual; depending on employee group) |
| | • | | Retirement ages: those relating to the earliest dates at which the employees are entitled to retire |
The defined benefit commitments at December 31, 2005 and 2004 were as follows:
| | | | |
| | | Thousands of Euros |
| | | 2005 | | 2004 |
Pension commitments to retired employees | | 3,202,581 | | 3,244,431 |
Pension contingencies in respect of current employees | | 240,405 | | 227,307 |
| | | | |
| | 3,442,986 | | 3,471,738 |
| | |
Coverage at end of each year: | | | | |
Internal provisions | | 2,816,020 | | 2,826,237 |
Insurance contracts with unrelated insurance companies | | 626,966 | | 645,501 |
| | | | |
Total | | 3,442,986 | | 3,471,738 |
| | | | |
The changes in 2005 and 2004 in the present value of the vested obligation for defined benefit commitments covered by the Group’s internal provisions were as follows:
| | | | | | |
| | | Thousands of Euros | |
| | | 2005 | | | 2004 | |
Present actuarial value at beginning of the year | | 2,826,237 | | | 3,240,686 | |
+ Interest cost | | 106,926 | | | 112,988 | |
+ Normal cost for the year | | 19,440 | | | (100 | ) |
- Payments made | | (145,347 | ) | | (135,676 | ) |
+/- Other | | 1,635 | | | (359,041 | ) |
+/- Past service cost and actuarial losses (gains). | | 7,129 | | | (32,620 | ) |
| | | | | | |
Present actuarial value at end of the year | | 2,816,020 | | | 2,826,237 | |
| | | | | | |
F-22
The present actuarial value of the vested obligation for defined benefit commitments covered by insurance contracts with a non-Group company amounted to EUR 626,966 thousand and EUR 645,501 thousand at December 31, 2005 and 2004, respectively.
1.1.2. Early retirements
The commitments to early retirees include the compensation and indemnities and contributions to external pension funds payable during the year of early retirement. The commitments relating to this group of employees after they have reached the age of effective retirement are included in the employee welfare system.
In 2005 and 2004, the Group offered certain employees the possibility of taking early retirement before reaching the age stipulated in the collective labour agreement in force. This offer was accepted by 677 and 1,372 employees, The total cost of these agreements amounts to EUR 286,279 thousand and EUR 571,628 thousand at December 31, 2005 and 2004, respectively (EUR 186,081 thousand and EUR 371,558 thousand, net of the related tax effect, respectively) and the corresponding provisions were recognised with a charge to the heading Provision Expense (Net) - Transfers to Funds for Pensions and Similar Obligations - Early Retirements in the accompanying consolidated income statement for 2005,
The present values of the vested obligations are quantified on a case-by-case basis. The actuarial assumptions used in quantifying these obligations are unbiased and mutually compatible. Specifically, the most significant actuarial assumptions used in 2005 and 2004 were as follows:
| | • | | Mortality tables: PERM/F 2000 P |
| | • | | Discount rate: 4% (cumulative annual) /AA corporate bond yield curve |
| | • | | Consumer price index: 1.5% (cumulative annual) |
| | • | | Retirement ages: those agreed upon contractually for each individual employee, relating to the earliest dates at which the employees are entitled to retire. |
The changes in 2005 and 2004 in the present value of the vested obligation for commitments to early retirees in Spain were as follows:
| | | | | | |
| | | Thousands of Euros | |
| | | 2005 | | | 2004 | |
Present actuarial value at beginning of the year | | 2,656,743 | | | 2,461,263 | |
+ Interest cost | | 94,528 | | | 86,904 | |
+ Early retirements in the year | | 286,279 | | | 571,628 | |
- Payments made | | (477,197 | ) | | (466,413 | ) |
+/- Other changes | | 5,929 | | | (3,068 | ) |
+/- Actuarial losses (gains) | | 16,285 | | | 6,429 | |
| | | | | | |
Present actuarial value at end of the year | | 2,582,567 | | | 2,656,743 | |
| | | | | | |
1.1.3. Post-employment welfare benefits
Certain Spanish Group companies have welfare benefit commitments the effects of which extend beyond the retirement of the employees entitled to the benefits. These commitments relate to certain current employees and retirees, depending upon the employee group to which they belong.
The present values of the vested obligations for post-employment welfare benefits are quantified on a case-by-case basis. The valuation method used for current employees is the projected unit credit method. The actuarial assumptions used in quantifying these obligations are unbiased and mutually compatible. Specifically, the most significant actuarial assumptions used in 2005 and 2004 were as follows:
| | • | | Mortality tables: PERM/F 2000 P |
| | • | | Discount rate: 4% (cumulative annual)/AA corporate bond yield curve |
| | • | | Consumer price index: 1.5% (cumulative annual) |
| | • | | Retirement ages: those relating to the earliest dates at which the employees are entitled to retire. |
F-23
The detail of these commitments at December 31, 2005 and 2004 is as follows:
| | | | |
| | | Thousands of Euros |
| | | 2005 | | 2004 |
Post-employment welfare benefit commitments to retired employees | | 158,889 | | 155,786 |
Vested post-employment welfare benefit contingencies in respect of current employees | | 51,721 | | 48,107 |
| | | | |
Total | | 210,610 | | 203,893 |
Coverage at end of each year: | | | | |
Internal provisions (*) | | 210,610 | | 203,893 |
The changes in 2005 and 2004 in the present value of the vested obligation for post-employment welfare benefit commitments were as follows:
| | | | | | |
| | | Thousands of Euros | |
| | | 2005 | | | 2004 | |
Present actuarial value at the beginning of the year | | 203,893 | | | 202,217 | |
+ Interest cost | | 8,227 | | | 7,857 | |
+ Normal cost for the year | | 2,165 | | | 2,051 | |
- Payments made | | (12,193 | ) | | (11,566 | ) |
+/- Other movements | | (362 | ) | | — | |
+/- Actuarial losses (gains) | | 8,880 | | | 3,334 | |
| | | | | | |
Present actuarial value at end of the year | | 210,610 | | | 203,893 | |
| | | | | | |
1.1.4. Summary
Following is a summary of the charges recorded in the 2005 and 2004 consolidated income statements for the post-employment compensation commitments of Group companies in Spain:
| | | | | |
| | | Thousands of Euros | |
| | | 2005 | | 2004 | |
Interest expense and similar charges: | | | | | |
Interest cost of pension funds | | 210,999 | | 208,977 | |
Personnel expenses: | | | | | |
Socials attentions | | 2,165 | | 2,051 | |
Transfers to pension plans | | 61,019 | | 44,286 | |
Provision expense (net): | | | | | |
Transfers to funds for pensions and similar obligations | | | | | |
Pension funds | | 33,426 | | (29,720 | ) |
Early retirement | | 286,279 | | 571,628 | |
| | | | | |
Total | | 593,888 | | 797,222 | |
| | | | | |
At December 31, 2005 and 2004 there were no unrecognized actuarial gains or losses arising from differences between the actuarial assumptions and what had actually occurred or, where appropriate, from the effects of changes in the actuarial assumptions used.
1.2. Other commitments to employees:
1.2.1. Compensation in kind
Certain Spanish Group companies are obliged to deliver partially or fully subsidised goods and services under the collective labour agreements applicable to them and/or the related corporate agreements. The most significant employee welfare benefits granted by the Group’s Spanish banks, in terms of the type of compensation and the event giving rise to the commitment, are loans to employees, life insurance, study aid and long-service bonuses.
F-24
The scope of application of these employee welfare benefits varies from one company to another depending on the specific agreements that govern them. They may also be applied differently to employees of the same company, when different agreements are in force for each of the various employee groups.
Long-service bonuses are a form of long-term compensation, entitlement to which is conditional upon the qualifying beneficiary employees remaining in service for a stipulated number of years (15, 25, 40 or 50 years’ effective service in the case of share-based bonuses and 45 years’ effective service in the case of cash bonuses).
The present values of the vested obligations for long-service cash bonuses and for the gifts relating to long-service share-based bonuses (the treatment applicable to share-based payment is summarised in section 1.2.2 below) was quantified on a case-by-case basis using the projected unit credit valuation method. The main actuarial assumptions used in quantifying these obligations are unbiased and mutually compatible. Specifically, the most significant actuarial assumptions used in 2005 and 2004 were as follows:
| | • | | Mortality tables: PERM/F 2000 P |
| | • | | Disability tables: IASS – 90 (reflecting the experience of the Spanish Social Security authorities) |
| | • | | Assumed interest rate: 4% (cumulative annual) / AA corporate bond yield curve |
| | • | | Retirement ages: those relating to the earliest dates at which the employees are entitled to retire. |
The changes in 2005 and 2004 in the present value of the vested obligation for these commitments were as follows:
| | | | | | |
| | | Thousands of Euros | |
| | | 2005 | | | 2004 | |
Present actuarial value at beginning of the year | | 31,590 | | | 30,693 | |
+ Interest cost | | 1,318 | | | 1,228 | |
+ Normal cost for the year | | 1,377 | | | 1,323 | |
- Payments made | | (545 | ) | | (735 | ) |
- Cash settlements for long-service bonus redemptions due to early retirement | | (2,464 | ) | | (570 | ) |
+/- Actuarial losses (gains) | | (1,243 | ) | | (349 | ) |
Present actuarial value at end of year Coverage at end of each year: | | 30,033 | | | 31,590 | |
Internal provisions | | 30,033 | | | 31,590 | |
Since all other employee welfare benefits for current employees accrue and are settled on a yearly basis, it is not necessary to record a provision in this connection.
The total cost of the employee welfare benefits provided by the Group’s Spanish companies to their current employees in the 2005 and 2004 was EUR 29,723 thousand and EUR 34,746 thousand, respectively, and these amounts were recognised with a charge to Personnel Expenses - Other in the accompanying consolidated income statements.
1.2.2. Bank share-based compensation system
In 2005 and 2004 the Bank had no target-based compensation plans involving the delivery of stock options or shares of Banco Bilbao Vizcaya Argentaria, S.A.
However, the Bank is obliged, under the related corporate agreement, to deliver shares of Banco Bilbao Vizcaya Argentaria, S.A. to certain of its employees when they complete a given number of years of effective service:
| | |
| | | Number
of Shares |
15 years | | 180 |
25 years | | 360 |
40 years | | 720 |
50 years | | 900 |
F-25
The present values of the vested obligation at December 31, 2005 and 2004, in terms of the probable number of shares, were quantified on a case-by-case basis using the projected unit credit method. The main actuarial assumptions used in quantifying this obligation are summarised as follows:
| | • | | Mortality tables: PERM/F 2000 P |
| | • | | Disability tables: IASS – 90 (reflecting the experience of the Spanish Social Security authorities) |
| | • | | Retirement ages: those relating to the earliest dates at which the employees are entitled to retire. |
The changes in 2005 and 2004 in the present value of the vested obligation, in terms of the probable number of shares, for share-based long-service bonuses were as follows:
| | | | | | |
| | | Number of Shares | |
| | | 2005 | | | 2004 | |
Present actuarial value at the beginning of the year | | 6,658,067 | | | 6,932,004 | |
+ Year accrual | | 399,753 | | | 385,661 | |
- Deliveries made | | (269,100 | ) | | (305,100 | ) |
+/- Actuarial losses (gains) | | 157,747 | | | (354,498 | ) |
| | | | | | |
Present actuarial value at the end of year | | 6,946,467 | | | 6,658,067 | |
| | | | | | |
In March 1999, pursuant to a resolution adopted by the Bank’s shareholders at the Annual General Meeting on February 27, 1999, 32,871,301 new shares were issued at a price of EUR 2.14 per share (similar to the average reference price of the share-based commitments to Group employees existing at that date which the new shares were assigned to fund), These shares were subscribed and paid by a non-Group company and, simultaneously, the Bank acquired a call option on these shares which can be exercised on any date, at one or several times, prior to December 31, 2011, at an exercise price equal to the share issue price, adjusted on the basis of the related antidilution clauses. On several occasions since 1999 the call option was partially exercised to meet share-based commitments to Group employees. At December 31, 2004, the Bank still held an option on a total of 4,826,645 shares at a price of EUR 2.09 per share, which were assigned in full to share-based long-service bonuses. In 2005 the option was exercised on a total of 269,100 shares to settle long-service bonuses when they fell due (305,100 shares in 2004),
At December 31, 2005, the Bank still held an option on a total of 4,557,545 shares (4,826,645 shares at December 31, 2004) and, in addition, it had arranged a futures transaction with a non-Group entity on a total of 2,388,922 shares at an exercise price of EUR 15.06 per share (1,831,422 shares at an exercise price of EUR 12.30 per share at December 31, 2004).
The changes in 2005 and 2004 in the related internal provisions, which take into account the present value of the vested obligation, at any given date, in terms of the probable number of shares and the instruments assigned to the commitment, were as follows:
| | | | | | |
| | | Thousands of Euros | |
| | | 2005 | | | 2004 | |
Internal provision at beginning of year | | 32,614 | | | 33,692 | |
+ Normal cost for the year | | 5,879 | | | 4,389 | |
- Payments relating to partial exercises of the call option (Settlement of long-service bonuses when they fall due) | | (562 | ) | | (638 | ) |
+/- Collections / (Payments) due to quarterly settlements of futures transactions | | 5,244 | | | 1,685 | |
+/- Actuarial losses (gains) | | 2,375 | | | (6,514 | ) |
| | | | | | |
Internal provision at end of year | | 45,550 | | | 32,614 | |
| | | | | | |
In the last quarter of 2005, certain Group companies implemented a corporate programme for its permanent employees to enable them to acquire, at a discount, shares of Banco Bilbao Vizcaya Argentaria, S.A. with a possibility of financing the first phase through a personal loan. The conditions of the first phase of the programme comprise an initial discount of 4% of the employees’ initial investment, subject to the shares being held for a period of two years and to the delivery in shares of 3% of the initial investment after three and five years, respectively, if the initially acquired shares are held for that long. The total number of shares acquired as part of this programme amounted to 2.5 million at a market price of EUR 14.68 per share. The unamortized balance of the financing granted to employees amounts to EUR 30,064 thousand at December 31, 2005.
F-26
2. Companies abroad
2.1. Pension benefit supplement
Certain Group companies abroad and part of the Foreign Network of Banco Bilbao Vizcaya Argentaria, S.A., have post-employment benefit commitments to certain current and/or retired employees. The aggregate data, broken down by type of commitment, are as follows:
Defined contribution commitments in group companies abroad: the current contributions made by Group companies abroad for defined contribution commitments to current employees, which amounted to EUR 17,714 thousand and EUR 14,916 thousand in 2005 and 2004, respectively, are recognised with a charge to Personnel Expenses - Transfers to Pension Plans in the accompanying consolidated income statements.
Defined benefit commitments recovered in internal funds: the accrued liability for defined benefit commitments to current and/or retired employees, net, where appropriate, of the specific assets assigned to fund them, amounted to EUR 279,086 thousand and EUR 288,677 thousand at December 31, 2005 and 2004, respectively, and is included under Provisions – Provisions for Pensions and Similar Obligations in the accompanying consolidated balance sheets. Of these amounts, EUR 167,119 thousand and EUR 147,969 thousand relate to BBVA Bancomer, S.A. for the funding of vested commitments for pension supplements, long-service bonuses, and post-retirement medical services and life insurance, and EUR 40,778 thousand and EUR 84,089 thousand relate to BBVA Portugal, S.A. for the funding of vested commitments for pension supplements.
The aforementioned assets assigned to the funding of commitments are the assets that are to be used directly to settle employee benefit obligations and which meet the following conditions: they are not owned by the Group entities; they are available only to pay post-employment benefits; and they cannot be returned to the Group entities.
The present values of the vested obligations of Group companies abroad are quantified on a case-by-case basis, and the projected unit credit valuation method is used for current employees. As a general rule, the actuarial assumptions used are as follows: the discount rate is the AA corporate bond yield curve; the mortality tables are those applicable in each local market when an insurance contract is arranged; and the inflation and salary growth rates are those applicable in each local market. These assumptions should be prudent and mutually compatible.
The main actuarial assumptions used in quantifying the commitments of BBVA Bancomer, S.A. at December 31, 2005 and 2004 are summarised as follows:
| • | | Mortality tables: EMSSA 97 |
| • | | Discount rate: 9.20% cumulative annual (10.25% cumulative annual at December 31, 2004) |
| • | | Consumer price index: 4.00% cumulative annual (5.0% cumulative annual at December 31, 2004) |
| • | | Salary growth rate: at least 6.60% cumulative annual, depending on the commitment (7.63% cumulative annual at December 31, 2004) |
| • | | Expected rate of return: 9.2% cumulative annual (10.25% cumulative annual at December 31, 2004) |
The changes in 2005 and 2004 in the present value of the vested obligations of Bancomer, S.A., in the value of the assets assigned to fund these commitments and in the balances of Provisions – Provisions for Pensions and Similar Obligations relating to Bancomer, S.A. were as follows:
| | | | | | |
| | | Thousands of Euros | |
| | | 2005 | | | 2004 | |
Present actuarial value at beginning of year | | 478,478 | | | 466,516 | |
Value of the assets assigned to funding of commitments | | (330,509 | ) | | (324,318 | ) |
| | | | | | |
Balance at begining of year | | 147,969 | | | 142,198 | |
| | | | | | |
Present actuarial value at end of year | | 632,783 | | | 478,478 | |
Value of assets assigned to funding of commitments | | (465,664 | ) | | (330,509 | ) |
| | | | | | |
Balance at end of year | | 167,119 | | | 147,969 | |
| | | | | | |
| | | | | | |
| | | Thousands of Euros | |
| | | 2005 | | | 2004 | |
Balance at begining of year | | 147,969 | | | 142,198 | |
+Finance Expenses | | 47,187 | | | 44,814 | |
- Finance Income | | (33,326 | ) | | (32,753 | ) |
+ Normal cost for the year | | 22,711 | | | 16,327 | |
+/- Payments made and other net variations | | (36,569 | ) | | (12,077 | ) |
+/- Exchange differences | | 29,097 | | | (10,540 | ) |
+/- Actuarial losses (gains) | | (9,950 | ) | | — | |
Balance at end of year | | 167,119 | | | 147,969 | |
F-27
The main actuarial assumptions used in quantifying the commitments of BBVA Portugal, S.A. at December 31, 2005 and 2004 are summarised as follows:
| | • | | Mortality tables: TV 88/90 |
| | • | | Disability tables: 50% EKV 80 |
| | • | | Turnover tables: 50% MSSL for employees hired prior to 1995 |
| | • | | Discount rate: 4.50% (cumulative annual) |
| | • | | Consumer price index: 2.00% (cumulative annual) |
| | • | | Salary growth rate: 3.00% (cumulative annual) |
| | • | | Expected rate of return: 4.50% (cumulative annual) |
The changes in 2005 and 2004 in the present value of the vested obligations of BBVA Portugal, S.A., in the value of the assets assigned to fund these commitments and in the balances of Provisions – Provisions for Pensions and Similar Obligations relating to BBVA Portugal, S.A. were as follows:
| | | | | | |
| | | Thousands of Euros | |
| | | 2005 | | | 2004 | |
Present actuarial value at beginning of year | | 268,415 | | | 249,438 | |
Value of the assets assigned to funding of commitments | | (184,326 | ) | | (175,897 | ) |
| | | | | | |
Balance at beginning of year | | 84,089 | | | 73,541 | |
| | | | | | |
Present actuarial value at end of year | | 262,153 | | | 268,415 | |
Value of assets assigned to funding of commitments | | (221,375 | ) | | (184,326 | ) |
| | | | | | |
Balance at end of year | | 40,778 | | | 84,089 | |
| | | | | | |
| | | | | | |
| | | Thousands of Euros | |
| | | 2005 | | | 2004 | |
Balance at beginning of year | | 84,089 | | | 73,541 | |
+Finance Expenses | | 8,437 | | | 10,458 | |
- Finance Income | | (9,930 | ) | | (9,334 | ) |
+ Normal cost for the year | | 3,985 | | | 14,375 | |
+/- Payments made and other net variations | | (48,987 | ) | | (10,242 | ) |
+/- Actuarial losses (gains) | | 3,184 | | | 5,291 | |
Balance at end of year | | 40,778 | | | 84,089 | |
2.2. Post-employment welfare benefits:
BBVA Bancomer, S.A.’s accrued liability for defined benefit commitments to current and former employees, net of the specific assets assigned to fund them, amounted to EUR 351,461 thousand and EUR 283,921 thousand at December 31, 2005 and 2004, respectively and is included under the heading Provisions – Provisions for Pensions and Similar Obligations in the accompanying consolidated balance sheets.
The main actuarial assumptions used to quantify the current values of the commitments accrued in connection with the aforementioned agreement, at December 31, 2005 and 2004, are as follows:
| | • | | Mortality tables: EMSSA 97 |
| | • | | Discount rate: 9.20% cumulative annual rate at December 31, 2005 (10.25% cumulative annual rate at December 31, 2004). |
| | • | | Consumer price index: 4.00% cumulative annual rate at December 31, 2005 (5.00% cumulative annual rate at December 31, 2004). |
| | • | | Rate of inflation for medical services: 6.08% cumulative annual rate at December 31, 2005 (7.10% cumulative annual rate at December 31, 2004). |
| | • | | Expected rate of return: 9.20% cumulative annual rate at December 31, 2005 (10.25% cumulative annual rate at December 31, 2004). |
F-28
The changes in 2005 and 2004 were as follows:
| | | | | | |
| | | Thousands of Euros | |
| | | 2005 | | | 2004 | |
Present actuarial value at beginning of year | | 324,043 | | | 319,885 | |
Value of the assets assigned to funding of commitments | | (40,122 | ) | | (22,887 | ) |
| | | | | | |
Balance at beginning of year | | 283,921 | | | 296,998 | |
| | | | | | |
Present actuarial value at end of year | | 436,434 | | | 324,043 | |
Value of assets assigned to funding of commitments | | (84,973 | ) | | (40,122 | ) |
| | | | | | |
Balance at end of year | | 351,461 | | | 283,921 | |
| | | | | | |
| | | | | | |
| | | Thousands of Euros | |
| | | 2005 | | | 2004 | |
Balance at beginning of year | | 283,921 | | | 296,998 | |
+Finance Expenses | | 32,953 | | | 30,288 | |
- Finance Income | | (3,896 | ) | | (2,692 | ) |
+ Normal cost for the year | | 9,001 | | | 1,759 | |
+/- Payments made and other net variations | | (40,771 | ) | | (22,465 | ) |
+/- Actuarial losses (gains) | | 57,925 | | | (19,967 | ) |
+/- Exchange differences | | 12,328 | | | — | |
| | | | | | |
Balance at end of year | | 351,461 | | | 283,921 | |
| | | | | | |
2.3. Summary:
The charges recorded in the 2005 and 2004 consolidated income statements for the post-employment benefit commitments of Group companies abroad totalled EUR 110,550 thousand and EUR 82,787 thousand, respectively.
At December 31, 2005 and 2004 there were no unrecognized actuarial gains or losses arising from differences between the actuarial assumptions and what had actually occurred or, where appropriate, from the effects of changes in the actuarial assumptions used.
3. Termination benefits
Termination benefits must be recognised when the company is committed to severing its contractual relationship with its employees and, to this end, has a formal detailed redundancy plan. There are currently no redundancy plans making it necessary to record a provision in this connection.
g) Exchange differences
The Group’s functional currency is the euro. Therefore, all balances and transactions denominated in currencies other than the euro are deemed to be denominated in “foreign currency”. Foreign currency balances are translated to euros in two consecutive stages:
| | • | | Translation of foreign currency to the functional currency of the entities and branches, and |
| | • | | Translation to euros of the balances held in the functional currencies of entities whose functional currency is not the euro. |
Translation of foreign currency to the functional currency: foreign currency transactions performed by the consolidated entities and their branches are initially recognised in their respective financial statements at the equivalent value in their functional currencies, translated using the exchange rates prevailing at the transaction date. Subsequently, for the purpose of presentation in their separate financial statements, the consolidated entities translate the foreign currency balances to their functional currencies using the average spot exchange rates at year-end.
Entities whose functional currency is not the euro: the balances in the financial statements of consolidated entities whose functional currency is not the euro are translated to euros as follows:
| | • | �� | Assets and liabilities: at the average spot exchange rates at December 31, 2005 and 2004. |
F-29
| | • | | Income and expenses and cash flows: at the average exchange rates for 2005 and 2004. |
| | • | | Equity items: at the historical exchange rates. |
The exchange differences arising on the translation of foreign currency balances to the functional currency of the consolidated entities and their branches are generally recorded in the consolidated income statement. Exceptionally, the exchange differences arising on non-monetary items whose fair value is adjusted with a balancing item in equity are recorded under the heading Valuation Adjustments - Exchange Differences.
The exchange differences arising on the translation to euros of balances in the functional currencies of the consolidated entities whose functional currency is not the euro are recorded under the heading Valuation Adjustments - Exchange Differences in the consolidated balance sheet until the item to which they relate is derecognised, at which time they are recorded in the income statement.
The breakdown of the main foreign currency balances in the consolidated balance sheet at December 31, 2005 and 2004, based on the nature of the related items, is as follows:
| | | | |
| | | Equivalent Value in Thousands
of Euros |
| | | Assets | | Liabilities |
2005 | | | | |
Cash and balances with Central Banks | | 9,091,495 | | — |
Financial assets/liabilities held for trading | | 17,137,145 | | 1,571,117 |
Available-for-sale financial assets | | 15,476,934 | | — |
Loans and receivables | | 66,632,376 | | — |
Investments | | 63,267 | | — |
Tangible assets | | 1,680,676 | | |
Financial liabilities at amortised cost | | — | | 118,665,788 |
Other | | 7,327,584 | | 7,531,901 |
| | | | |
Total | | 117,409,477 | | 127,768,806 |
| | | | |
| | | | |
| | | Equivalent Value in Thousands
of Euros |
| | | Assets | | Liabilities |
2004 | | | | |
Cash and balances with Central Banks | | 6,176,800 | | — |
Financial assets/liabilities held for trading | | 15,637,769 | | 2,329,659 |
Available-for-sale financial assets | | 10,587,927 | | — |
Loans and receivables | | 47,381,972 | | — |
Investments | | 94,957 | | — |
Tangible assets | | 1,256,658 | | — |
Financial liabilities at amortised cost | | — | | 91,845,928 |
Other | | 5,640,993 | | 4,522,866 |
| | | | |
Total | | 86,777,076 | | 98,698,453 |
| | | | |
h) Entities and branches located in hyperinflationary economics
None of the functional currencies of the consolidated subsidiaries and associates and their branches located abroad relate to hyperinflationary economies as defined by IFRSs. Accordingly, at December 31, 2005 and 2004 it was not necessary to adjust the financial statements of any of the consolidated subsidiaries or associates to correct for the effect of inflation.
i) Non-current assets held for sale and liabilities associated with non-current assets held for sale
The heading Non-current Assets Held for Sale reflects the carrying amount of the assets – composing a “disposal group” or forming part of a business unit that the Group intends to sell (“discontinued operations”) – which will very probably be sold in their current condition within one year from the date of the consolidated financial statements. Therefore, the carrying amount of these assets – which can be financial or non-financial – will foreseeably be recovered through the price obtained on their sale.
Specifically, the assets received by the consolidated entities from their debtors in full or part settlement of the debtors’ payment obligations are treated as non-current assets held for sale (foreclosed assets), unless the consolidated entities have decided to make continuing use of these assets.
F-30
Symmetrically, the heading Liabilities Associated with Non-current Assets Held for Sale reflects the balances payable arising on disposal groups and discontinued operations.
j) Sales and income from the provision of non-financial services
This heading shows the carrying amount of the sales of assets and income from the services provided by the consolidated Group companies that are not financial institutions. In the case of the Group, these companies are mainly real estate and services companies.
k) Insurance and reinsurance contracts
In accordance with standard accounting practice in the insurance sector, the consolidated insurance entities credit the amounts of the premiums they write and expense the cost of the claims incurred on final settlement thereof. Insurance entities are required to accrue at year-end the amount unearned at that date credited to their income statements and the incurred costs not charged to income.
The most significant accruals recorded by the consolidated entities in relation to direct insurance contracts arranged by them are: unearned premiums, unexpired risks, claims, mathematical reserves, life insurance policies in which the investment risk is borne by the policyholder, and bonuses (profit-sharing) and rebates.
The technical provisions for inward reinsurance are determined using criteria similar to those applied for direct insurance; these provisions are generally calculated on the basis of the information provided by the cedants. The technical provisions for direct insurance and inward reinsurance are presented in the consolidated balance sheet under the heading Liabilities under Insurance Contracts (Note 27).
The technical provisions for reinsurance ceded – which are calculated on the basis of the reinsurance contracts entered into and by applying the same criteria as those used for direct insurance - are presented in the consolidated balance sheet under the heading Reinsurance Assets (Note 19).
Reinsurance assets and Liabilities under insurance contracts-
The heading Reinsurance Assets includes the amounts that the consolidated entities are entitled to receive under the reinsurance contracts entered into by them with third parties and, more specifically, the share of the reinsurer in the technical provisions recorded by the consolidated insurance entities.
The heading Liabilities under Insurance Contracts includes the technical reserves recorded by the consolidated entities to cover claims arising from insurance contracts in force at year-end.
The profit or loss reported by the Group’s insurance companies on their insurance activities are recorded under the heading Insurance activity income in the consolidated income statement (Note 48).
l) Tangible assets
Non-current tangible assets for own use:
Functional non-current assets, including both tangible assets intended to be held for continuing use received by the consolidated entities in full or part settlement of financial assets representing receivables from third parties and tangible assets acquired under finance leases – are presented at acquisition cost less any accumulated depreciation and, where appropriate, any estimated impairment losses (net carrying amount higher than fair value).
For this purpose, the acquisition cost of foreclosed assets held for own use is equal to the carrying amount of the financial assets delivered in exchange for their foreclosure.
Depreciation is calculated, using the straight-line method, on the basis of the acquisition cost of the assets less their residual value; the land on which the buildings and other structures stand has an indefinite life and, therefore, is not depreciated.
The year tangible asset depreciation charge is recognised with a balancing entry in the consolidated income statement and is based on the application of the following depreciation rates (determined on the basis of the average years of estimated useful life of the various assets):
| | |
| | | Annual
Percentage |
| |
Buildings for own use | | 1,33% to 4% |
Furniture | | 8% to 10% |
Fixtures | | 6% to 12% |
Office supplies and computerisation | | 8% to 25% |
Remodelling of rented offices | | 6% |
F-31
At each accounting close, the consolidated entities analyse whether there is any internal or external indication that the carrying amounts of their tangible assets exceed the related recoverable amounts. If there is such an indication, the carrying amount of the asset in question is reduced to its recoverable amount and the future depreciation charges are adjusted in proportion to the asset’s new remaining useful life and / or to its revised carrying amount.
Similarly, if there is any indication that the value of a tangible asset has been recovered, the consolidated entities recognise the reversal of the impairment loss recorded in prior years and, consequently, adjust the future depreciation charges. In no circumstances may the reversal of an impairment loss on an asset raise its carrying amount above that which it would have if no impairment losses had been recognised in prior years.
Upkeep and maintenance expenses relating to tangible assets held for own use is charged to the income statement for the year in which they are incurred.
Investments properties and other assets leased out under an operating lease:
The heading Investment Properties in the consolidated balance sheet reflects the net values of the land, buildings and other structures held either to earn rentals or for capital appreciation.
The criteria used to recognise the acquisition cost of assets leased out under operating leases, to calculate their depreciation and their respective estimated useful lives and to record the impairment losses thereon are the same as those described in relation to functional tangible assets.
m) Business combinations
A business combination is the bringing together of two or more separate entities or businesses into one single entity or group of entities. As a result of a business combination, which is accounted for using the purchase method, the Group obtains control over one or several entities.
The purchase method addresses business combinations from the perspective of the acquirer. The acquirer must recognise the assets acquired and the liabilities and contingent liabilities assumed, including those not previously recognised by the acquiree.
This method involves measuring the cost of the business combination and assigning it, at the date of acquisition, to the identifiable assets, liabilities and contingent liabilities measured at fair value.
In addition, any purchases of minority interests after the date on which the Group obtains control of the acquiree are recorded as equity transactions, i.e. the difference between the price paid and the carrying amount of the percentage of minority interests acquired is charged directly to equity.
n) Intangible assets
Goodwill
The positive differences between the cost of business combinations and the acquired percentage of the net fair value of the assets, liabilities and contingent liabilities of the acquirees are recorded as goodwill on the asset side of the balance sheet. In other words, goodwill represents the future economic benefits from assets that cannot be individually identified and separately recognised. Goodwill is not amortised but is subject to impairment analysis. Any impaired goodwill is written off.
Goodwill is allocated to one or more cash-generating units expected to benefit from the synergies arising from business combinations. The cash-generating units represent the Group’s business and/or geographical segments as managed internally by its directors.
The cash-generating units to which goodwill has been allocated are tested for impairment based on the carrying amount of the unit including the allocated goodwill. Such testing is performed at least annually and whenever there is an indication of impairment.
For the purpose of determining the impairment of a cash-generating unit to which goodwill has been allocated, the carrying amount of that unit, adjusted by the theoretical amount of the goodwill attributable to the minority interest, shall be compared with its recoverable amount. The resulting loss shall be apportioned by reducing, firstly, the carrying amount of the goodwill allocated to that unit and, secondly, if there are still impairment losses remaining to be recognised, the carrying amount of the rest of the assets. This shall be done by allocating the remaining loss in proportion to the carrying amount of each of the assets in the unit. It will be taken into account that no impairment of goodwill attributable to the minority interest may be recognised. In any case, impairment losses on goodwill can never be reversed.
F-32
Other intangible assets
These assets can have an indefinite useful life – when, based on an analysis of all relevant factors, it is concluded that there is no foreseeable limit to the year over which the asset is expected to generate net cash flows for the consolidated entities – or a finite useful life, in all other cases.
Intangible assets with indefinite useful lives are not amortised, but rather at the end of each reporting year the consolidated entities review the remaining useful lives of the assets in order to ensure that they continue to be indefinite or, if this is not the case, to take the appropriate steps. The Group has not recognised any intangible assets with indefinite useful lives.
Intangible assets with finite lives are amortised over those useful lives using methods similar to those used to depreciate tangible assets.
In both cases the consolidated entities recognise any impairment loss on the carrying amount of these assets with charge to the heading Impairment Losses (Net) - Other Intangible Assets in the consolidated income statement. The criteria used to recognise the impairment losses on these assets and, where applicable, the recovery of impairment losses recognised in prior years are similar to those used for tangible assets.
o) Inventories
Inventories are assets, other than financial instruments, that are held for sale in the ordinary course of business, that are in the process of production, construction or development for such sale, or that are to be consumed in the production process or in the rendering of services. The balance of the heading Other Assets - Inventories in the consolidated balance sheet included the land and other property held for sale in the property development business (Note 23).
Inventories are measured at the lower of cost and net realisable value, which is the estimated selling price of inventories in the ordinary course of business less the estimated costs of completion and the estimated costs necessary to make the sale.
The amount of any write-down of inventories, such as that reflecting damage, obsolescence, and reduction of the sale price, to net realisable value and any other losses is recognised as an expense in the year in which the write-down or loss occurs. Subsequent reversal of any write-down is recognised in the consolidated income statement for the year in which it occurs.
When inventories are sold, the carrying amount of those inventories is derecognised and recorded as an expense in the year in which the related revenue is recognised. The expense is included under the heading Cost of Sales in the accompanying consolidated income statement (Note 50) when it relates to activities that do not form part of the consolidated Group, or under the heading Other Operating Expenses in other cases.
p) Tax assets and liabilities
Spanish corporation tax expense and the expense for similar taxes applicable to the consolidated entities abroad are recognised in the consolidated income statement, except when they result from transactions the gains or losses on which are recognised directly in equity, in which case the related tax effect is also recognised in equity.
The current income tax expense is calculated by aggregating the current tax arising from the application of the related tax rate to the taxable profit (or tax loss) for the year (after deducting the tax credits allowable for tax purposes) and the change in deferred tax assets and liabilities recognised in the income statement.
Deferred tax assets and liabilities include temporary differences, measured at the amount expected to be payable or recoverable on differences between the carrying amounts of assets and liabilities and their tax bases, and tax loss and tax credit carryforwards. These amounts are measured at the tax rates that are expected to apply in the year when the asset is realised or the liability settled.
Deferred tax assets are recognised to the extent that it is considered probable that the consolidated entities will have sufficient taxable profits in the future against which the deferred tax assets can be utilised.
The deferred tax assets and liabilities recognised are reassessed at each balance sheet date in order to ascertain whether they still exist, and the appropriate adjustments are made on the basis of the findings of the analyses performed.
Income and expenses recognised directly in equity are recorded as temporary differences.
q) Financial guarantees
“Financial guarantees” are defined as contracts whereby an entity undertakes to make specific payments for a third party if the latter does not do so, irrespective of the various legal forms they may have.
F-33
Financial guarantees are measured at fair value which, on initial recognition and in the absence of evidence to the contrary, is the present value of the cash flows to be received, using an interest rate similar to that of the financial assets granted by the entity with a similar term and risk. Simultaneously, the present value of the future cash flows receivable, calculated using the aforementioned interest rate, is recognised under the heading Other Financial Assets.
Subsequent to initial recognition, contracts are treated as follows:
| • | | The value of contracts recorded under the heading Other Financial Assets is discounted by recording the differences in the consolidated income statement as interest income. |
| • | | The fair value of guarantees recorded under the heading Accrued Expenses and Deferred Income - Other on the liability side of the balance sheet is allocated to the consolidated income statement as fee and commission income on a straight-line basis over the expected life of the guarantee, or by another method provided that it more adequately reflects the economic risks and rewards of the guarantee. |
r) Leases
Leases are classified as finance leases when they transfer substantially the risks and rewards incidental to ownership of the asset forming the subject matter of the contract.
When the consolidated entities act as the lessor of an asset, the aggregate present values of the lease payments receivable from the lessee plus the guaranteed residual value (normally the exercise price of the lessee’s purchase option on expiration of the lease agreement) are recorded as financing provided to third parties and, therefore, are included under the heading Loans and Receivables in the consolidated balance sheet.
Leases other than finance leases are classified as operating leases, Assets provided under operating leases to Group entities are treated in the consolidated financial statements as assets held for own use and in the individual financial statements of the owner as other assets leased out under an operating lease or as investment property.
F-34
s) Provisions and contingent liabilities
Provisions are present obligations arising from legal or contractual requirements, valid expectations created by Group companies in third parties regarding the assumption of certain types of responsibilities, or virtual certainty as to the future course of regulation in particular respects, especially proposed new legislation that the Group cannot avoid.
Provisions are recognised in the balance sheet when each and every one of the following requirements is met: the Group has a present obligation resulting from a past event and, at the balance sheet date, it is more likely than not that the obligation will have to be settled; it is probable that to settle the obligation the entity will have to give up resources embodying economic benefits; and a reliable estimate can be made of the amount of the obligation.
Contingent liabilities are possible obligations of the entity that arise from past events and whose existence is conditional on the occurrence or non-occurrence of one or more future events beyond the control of the entity. They include the present obligations of the entity when it is not probable that an outflow of resources embodying economic benefits will be required to settle them or when, in extremely rare cases, their amount cannot be measured with sufficient reliability.
Contingent assets are possible assets that arise from past events and whose existence is conditional on, and will be confirmed only by the occurrence or non-occurrence of, events beyond the control of the entity, Contingent assets are not recognised in the balance sheet or in the income statement; however, they are disclosed in the notes to financial statements, provided that it is probable that these assets will give rise to an increase in resources embodying economic benefits.
t) Transfers of financial assets and derecognition of financial assets and liabilities
The accounting treatment of transfers of financial assets depends on the extent to which the risks and rewards associated with the transferred assets are transferred to third parties. If substantially all the risks and rewards are transferred to third parties, the transferred financial asset is derecognised and, at the same time, any right or obligation retained or created as a result of the transfer is recognised.
If substantially all the risks and rewards associated with the transferred financial asset are retained, the transferred financial asset is not derecognised and continues to be measured using the same criteria as those used prior to the transfer.
Financial assets are only derecognised when the cash flows they generate have extinguished or when substantially all the risks and rewards incidental to them have been transferred. Similarly, financial liabilities are only derecognised when the obligations they generate have extinguished or when they are acquired (with the intention either settle them or re-sell them).
u) Other equity instruments
The balance of the heading Shareholder’s Equity - Treasury Shares in the consolidated balance sheet relates to Bank shares held by certain consolidated companies at December 31, 2005 and 2004. These shares are carried at acquisition cost, and the gains or losses arising on their disposal are credited or debited, as appropriate, to the heading Shareholder’s Equity—Other Equity Instruments in the consolidated balance sheet (Note 34).
All the shares of the Bank held by consolidated entities at December 31, 2005 and 2004 represented 0.22% and 0.08%, respectively, of the issued share capital at those dates (the transactions involving treasury shares in the years from January 1, to December 31, 2005 and 2004 are summarised in Note 34).
F-35
3.Reconciliation of the closing balances for 2003 and 2004 to the opening balances for 2004 and 2005
EU-IFRS 1 requires that the first consolidated financial statements prepared in accordance with EU-IFRSs include a reconciliation of the closing balances for the immediately preceding year to the opening balances for the year to which these financial statements refer.
The reconciliation of the balances in the consolidated balance sheets and consolidated income statements is shown in Appendixes VI, VII and VIII, and the reconciliation adjustments to equity are shown in Appendix IX. The definition of certain terms used therein is as follows:
| | • | | 2003 closing: the balances at December 31, 2003 in accordance with the standards in force at that date (Bank of Spain Circular 4/1991). |
| | • | | 2004 opening: the balances resulting from considering the effect on the closing balances for the preceding year of the adjustments and reclassifications made under the new standards in force since January 1. |
| | • | | 2004 closing: the balances at December 31, 2004 in accordance with Bank of Spain Circular 4/1991 in force at that date, |
| | • | | 2005 opening: the balances at January 1, 2005 resulting from considering the effect on the closing balances for the preceding year of the adjustments and reclassifications made under the new standards in force. |
| | • | | 2004 re-expressed balances: balances of year 2004 in accordance with new standards. |
Main effects of adaptation to International Financial Reporting Standards (IFRSs)
The estimated main effects of adaptation to the new standards are as follows:
a)Basis of consolidation
The entry into force of EU-IFRSs led to a change in the basis of consolidation for certain companies (Note 2.1). The effects of this change were as follows:
| | • | | The companies over which the Group exercises control, regardless of their business activity, were fully consolidated; the greatest economic impact resulting from this change was that relating to insurance companies and real estate companies, and |
| | • | | Certain investments were considered to be available-for-sale assets, since the Group could not demonstrate that it exercised significant influence over the investees. |
b)Goodwill
Under the new standards goodwill is defined as the difference between the cost and the net fair value of the assets, liabilities and contingent liabilities acquired.
The main change is that goodwill is no longer amortised and is tested for impairment at least annually. In addition, goodwill must be stated in local currency, although that arising prior to January 1, 2004 can continue to be expressed in euros. The Group decided to initially recalculate in local currency the goodwill existing at January 1, 2004, the date of transition to EU-IFRSs.
Investments acquired subsequent to the obtainment of control over a company (i.e. transactions involving the purchase of equity interests from minority shareholders) were treated as “equity transactions”. The goodwill recorded on the transactions performed after control was obtained were written off against the heading Minority Interests and the surplus amount against the heading Reserves.
F-36
c)Financial instruments
In accordance with the new standards, financial assets and liabilities held for trading are measured at fair value through profit or loss. Also, the gains and losses on the available-for-sale securities portfolio are recorded, net of their tax effect, in the equity account Valuation Adjustments.
As regards the classification of equity securities portfolios, under IFRSs significant influence is presumed to exist when an ownership interest of 20% is held in an investee. The Group classified Banca Nazionale del Lavoro, S.p.A. (BNL) as an associate, i.e. a company over which significant influence is exercised, since it considered that, although its equity interest is less than 20% (general criterion), the current shareholders’ agreement gives it significant influence over the management of this entity. The entities classified as associates under the previous accounting standards and in which the Group has an ownership interest of less than 20% were reclassified to the available-for-sale portfolio (except for BNL), since it is considered that the Group does not exercise significant influence over them (Note 2.1). Therefore, in accordance with the new standards in force, the goodwill of these entities was derecognised, their accumulated prior years’ profits or losses accounted for by the equity method were eliminated from reserves and, in addition, the differences relating from measuring these investments at market value were recorded under the heading Valuation Adjustments.
The recognition, measurement and disclosure criteria included in IASs 32 and 39, were applied retrospectively to January 1, 2004.
January 1, 2004 was considered to be the date of application of the rules on the derecognition of financial instruments. Transactions which on or after that date met the recognition and derecognition requirements included in IASs 32 and 39 were removed from the balance sheet (Note 14.3). However, the securitization funds created subsequent to January 1, 2004 through the transfer of derecognised loans, of which the Group retains certain of the risks or rewards, were included in the consolidated financial statements.
d)Loan portfolio provisioning
The BBVA Group estimated the impact of recording the provisions for the loan portfolio using the methods described in Note 2.2.c for estimating the impairment of financial instruments.
e)Loan arrangement fees
As a result of the application of the new accounting treatment for these fees (Note 2.2.d), the BBVA Group estimated the impact of reversing the fees and commissions credited to income in prior years with a charge to equity, using as a balancing entry the item “Accrued Expenses and Deferred Income”. With regard to 2004, the portion of these fees and commissions relating to that year were recognised in the income statement.
f)Pensions
Under EU-IFRSs the assumptions used to measure defined benefit pension commitments must be unbiased and mutually compatible, and the market interest rate relating to high quality assets must be used for discounting purposes, IFRSs also stipulate that, for employees subject to Spanish labour legislation, the actuarial assumptions to be used must be based on the applicable Spanish legislation and the actuarial assumptions published by the Directorate-General of Insurance and Pension Funds (DGSFP).
Also noteworthy in this connection is the treatment of the risks insured with Group companies pursuant to Royal Decree 1588/1999 on Externalisation as internal provisions (and their measurement as such) in the consolidated financial statements. The assets assigned are measured independently on the basis of their nature.
As a result of the application of these criteria, the Group reviewed all its actuarial assumptions for existing commitments and recognized all the deficits relating to externalised commitments existing at January 1, 2004, the date of transition to EU-IFRSs.
All cumulative unrecognized actuarial losses at January 1, 2004 were recognised with a charge to reserves.
g)Derivatives
Under EU-IFRSs all derivatives are measured at fair value through profit or loss. Hedging transactions require greater documentation and yearic monitoring of their effectiveness. In fair value hedges, changes in the fair value of the hedged item are recognised in income, and the related carrying amount is adjusted. The BBVA Group’s review of the validity of the transactions classified as hedges demonstrated that most of the hedges were highly effective.
The most significant impacts of EU-IFRSs are the recognition in reserves of the unrealised gains existing at the date of transition (January 1, 2004) and the recognition in profit or loss of the changes in the unrealised gains or losses for the year.
F-37
In the case of transactions that were designated as subject to hedge accounting at January 1, 2004 but which did not comply with the conditions of IAS 39 to be so designated, hedge accounting was discontinued. Net positions designated as hedged items under the previous standards and rules were replaced as hedged items at January 1, 2004 by an amount of assets or liabilities of the net positions.
Transactions initiated before January 1, 2004 were not designated as hedges retrospectively.
h)Preference shares
Preference shares that do not comply with Rule Fifty-Four of Bank of Spain Circular 4/2004 are classified under the heading Equity Having the Nature of a Financial Liability on the liability side of the balance sheet.
This reclassification has no effect on the calculation of eligible equity for the purposes of Bank of Spain Circular 5/1993, since these preference shares are still included in tier-one capital.
i)Tangible assets
In the case of tangible assets, the Group used as attributed cost on the revaluation date the amounts revalued prior to January 1, 2004, on the basis of the legislation then in force. In this connection, the revaluations performed under Spanish law and the adjustments for inflation made by subsidiaries in countries with inflation accounting were considered to be valid.
Also, certain tangible asset items were recognised at fair value and, therefore, this value was used as attributed cost at January 1, 2004.
j)Equity-instrument-based employee compensation
As permitted by IFRS 1 and Transitional Provision One of Bank of Spain Circular 4/2004, IFRS 2 were not applied to the equity instruments granted to employees before November 7, 2002 title to which had not yet passed to these employees on January 1, 2005.
k)Cumulative exchange differences
The cumulative exchange differences at January 1, 2004 of all businesses abroad were definitively charged or credited to reserves. Consequently, the exchange gains or losses arising on the subsequent sale or disposal by other means of businesses abroad relate only to the exchange differences that arose after January 1, 2004.
l)Transactions involving own equity instruments
The gains or losses obtained on transactions involving treasury shares are recognised as changes in equity and these shares continue to be carried at their acquisition cost. Under the previous accounting standards, these gains or losses were recognised in the income statement.
4. Banco Bilbao Vizcaya Argentaria Group
Banco Bilbao Vizcaya Argentaria, S.A. (BBVA) is the Group’s parent company. Its individual financial statements are prepared on the basis of the accounting policies and methods contained in Bank of Spain Circular 4/2004.
The Bank represented approximately 63.01% of the Group’s assets and 26.60% of consolidated profit before tax at December 31, 2005 (63.47% and 21.2%, respectively, at December 31, 2004), after the related consolidation adjustments and eliminations.
Summarised below are the financial statements of Banco Bilbao Vizcaya Argentaria, S.A. at December 31, 2005 and 2004:
F-38
BANCO BILBAO VIZCAYA ARGENTARIA, S.A.
BALANCE SHEETS AT DECEMBER 31, 2005 AND 2004 (SUMMARIZED)
- Thousands of Euros –
| | | | | | |
| | | 2005 | | | 2004 | |
ASSETS | | | | | | |
CASH AND BALANCES WITH CENTRAL BANKS | | 2,707,634 | | | 3,584,389 | |
FINANCIAL ASSETS HELD FOR TRADING | | 31,223,865 | | | 33,786,124 | |
AVAILABLE-FOR-SALE FINANCIAL ASSETS | | 32,895,371 | | | 27,320,242 | |
LOANS AND RECEIVABLES | | 183,250,928 | | | 149,381,995 | |
HELD-TO-MATURITY INVESTMENTS | | 3,959,264 | | | 2,221,502 | |
HEDGING DERIVATIVES | | 2,505,102 | | | 4,033,289 | |
NON-CURRENT ASSETS HELD FOR SALE | | 29,722 | | | 51,919 | |
INVESTMENTS | | 13,296,918 | | | 12,068,994 | |
INSURANCE CONTRACTS LINKED TO PENSIONS | | 2,089,985 | | | 2,097,376 | |
TANGIBLE ASSETS | | 2,060,765 | | | 2,034,013 | |
INTANGIBLE ASSETS | | 51,920 | | | 37,316 | |
TAX ASSETS | | 3,939,982 | | | 3,308,695 | |
PREPAYMENTS AND ACCRUED INCOME | | 512,377 | | | 310,954 | |
OTHER ASSETS | | 616,788 | | | 426,173 | |
| | | | | | |
TOTAL ASSETS | | 279,140,621 | | | 240,662,981 | |
| | | | | | |
| | |
| | | 2005 | | | 2004(*) | |
TOTAL LIABILITIES AND EQUITY | | | | | | |
LIABILITIES | | | | | | |
FINANCIAL LIABILITIES HELD FOR TRADING | | 14,579,963 | | | 11,735,827 | |
FINANCIAL LIABILITIES AT AMORTISED COST | | 242,037,543 | | | 206,918,252 | |
CHANGES IN THE FAIR VALUE OF THE HEDGED ITEMS IN PORTFOLIO HEDGES OF INTEREST RATE RISK | | — | | | 183,201 | |
HEDGING DERIVATIVES | | 947,007 | | | 2,317,121 | |
PROVISIONS | | 6,376,428 | | | 6,292,468 | |
TAX LIABILITIES | | 1,579,989 | | | 786,274 | |
ACCRUED EXPENSES AND DEFERRED INCOME | | 762,477 | | | 718,074 | |
OTHER LIABILITIES | | 7,004 | | | 1,262 | |
EQUITY HAVING THE NATURE OF A FINANCIAL LIABILITY | | — | | | — | |
| | | | | | |
TOTAL LIABILITIES | | 266,290,411 | | | 228,952,479 | |
| | | | | | |
EQUITY | | | | | | |
VALUATION ADJUSTMENTS | | 1,809,782 | | | 933,037 | |
SHAREHOLDERS’ EQUITY | | 11,040,428 | | | 10,777,465 | |
Capital | | 1,661,518 | | | 1,661,518 | |
Share premium | | 6,658,390 | | | 6,682,603 | |
Reserves | | 2,001,854 | | | 1,877,718 | |
Other equity instruments | | 141 | | | — | |
Less: Treasury shares | | (29,773 | ) | | (8,500 | ) |
Profit attributed to the Group | | 1,918,142 | | | 1,581,382 | |
Less: Dividends and remuneration | | (1,169,844 | ) | | (1,017,256 | ) |
| | | | | | |
TOTAL EQUITY | | 12,850,210 | | | 11,710,502 | |
| | | | | | |
TOTAL EQUITY AND LIABILITIES | | 279,140,621 | | | 240,662,981 | |
| | | | | | |
F-39
BANCO BILBAO VIZCAYA ARGENTARIA, S.A.
INCOME STATEMENTS
FOR THE YEARS ENDED DECEMBER 31, 2005 AND 2004 (SUMMARIZED)
- Thousands of Euros –
| | | | | | |
| | | 2005 | | | 2004 | |
INTEREST AND SIMILAR INCOME | | 7,169,319 | | | 6,382,852 | |
INTEREST EXPENSE AND SIMILAR CHARGES | | (4,473,854 | ) | | (3,701,087 | ) |
INCOME FROM EQUITY INSTRUMENTS | | 1,056,912 | | | 1,091,478 | |
| | | | | | |
NET INTEREST INCOME | | 3,752,377 | | | 3,773,243 | |
| | | | | | |
FEE AND COMMISSION INCOME | | 1,928,985 | | | 1,689,587 | |
FEE AND COMMISSION EXPENSES | | (330,718 | ) | | (326,743 | ) |
GAINS/LOSSES ON FINANCIAL ASSETS AND LIABILITIES (NET) | | 529,671 | | | 189,643 | |
EXCHANGE DIFFERENCES (NET) | | 132,573 | | | 205,341 | |
| | | | | | |
GROSS INCOME | | 6,012,888 | | | 5,531,071 | |
| | | | | | |
OTHER OPERATING INCOME | | 80,690 | | | 80,326 | |
PERSONNEL EXPENSES | | (2,014,427 | ) | | (1,938,901 | ) |
OTHER ADMINISTRATIVE EXPENSES | | (804,027 | ) | | (757,170 | ) |
DEPRECIATION AND AMORTISATION | | (196,843 | ) | | (207,526 | ) |
OTHER OPERATING EXPENSES | | (62,807 | ) | | (56,649 | ) |
| | | | | | |
NET OPERATING INCOME | | 3,015,654 | | | 2,651,151 | |
| | | | | | |
IMPAIRMENT LOSSES (NET) | | (441,825 | ) | | (601,981 | ) |
PROVISION EXPENSE (NET) | | (378,539 | ) | | (670,962 | ) |
OTHER GAINS | | 107,872 | | | 448,368 | |
OTHER LOSSES | | (34,985 | ) | | (2,472 | ) |
| | | | | | |
INCOME BEFORE TAX | | 2,268,177 | | | 1,824,104 | |
| | | | | | |
INCOME TAX | | (350,035 | ) | | (242,722 | ) |
INCOME FROM ORDINARY ACTIVITIES | | 1,918,142 | | | 1,581,382 | |
INCOME FROM DISCONTINUED OPERATIONS (NET) | | — | | | — | |
| | | | | | |
INCOME FOR THE YEAR | | 1,918,142 | | | 1,581,382 | |
| | | | | | |
BANCO BILBAO VIZCAYA ARGENTARIA, S.A.
STATEMENTS OF CHANGES IN EQUITY FOR THE YEARS ENDED DECEMBER 31, 2005
AND 2004 (SUMMARIZED)
- Thousands of Euros–
| | | | | |
| | | 2005 | | | 2004 |
NET INCOME RECOGNISED DIRECTLY IN EQUITY | | 876,745 | | | 291,581 |
Available-for-sale financial assets | | 992,180 | | | 279,767 |
Financial liabilities at fair value through equity | | — | | | — |
Cash flow hedges | | (65,607 | ) | | — |
Hedges of net investments in foreign operations | | — | | | — |
Exchange differences | | (49,828 | ) | | 11,814 |
Non-current assets held for sale | | — | | | — |
INCOME FOR THE YEAR | | 1,918,142 | | | 1,581,382 |
TOTAL INCOME AND EXPENSES FOR THE YEAR | | 2,794,887 | | | 1,872,963 |
F-40
BANCO BILBAO VIZCAYA ARGENTARIA, S.A.
CASH FLOW STATEMENTS FOR THE YEARS ENDED DECEMBER 31, 2005 AND 2004
(SUMMARIZED)
- Thousands of Euros –
| | | | | | |
| | | 2005 | | | 2004 | |
CASH FLOWS FROM OPERATING ACTIVITIES | | | | | | |
Consolidated profit for the year | | 1,918,142 | | | 1,581,382 | |
Adjustment to profit: | | 1,414,257 | | | 1,445,596 | |
Adjusted profit | | 3,332,399 | | | 3,026,978 | |
Net increase/decrease in operating assets | | (35,678,851 | ) | | (19,824,845 | ) |
Financial assets held for trading | | 2,562,259 | | | (4,127,044 | ) |
Available-for-sale financial assets | | (4,130,001 | ) | | 1,676,829 | |
Loans and receivables | | (34,133,846 | ) | | (18,220,954 | ) |
Other operating assets | | 22,737 | | | 846,324 | |
Net increase/decrease in operating liabilities | | 35,212,225 | | | 22,358,151 | |
Financial liabilities held for trading | | 2,844,136 | | | 1,036,983 | |
Financial liabilities measured at amortised cost | | 33,983,507 | | | 21,055,019 | |
Other operating liabilities | | (1,615,418 | ) | | 266,149 | |
Total net cash flows from operating activities (1) | | 2,865,773 | | | 5,560,284 | |
CASH FLOWS FROM INVESTING ACTIVITIES | | | | | | |
Investments (-) | | 2,982,316 | | | 6,613,831 | |
Divestments (+) | | 266,755 | | | 752,289 | |
Total net cash flows from investing activities (2) | | (2,715,561 | ) | | (5,861,542 | ) |
CASH FLOWS FROM FINANCING ACTIVITIES | | | | | | |
Issuance/Redemption of capital (+/-) | | — | | | 1,998,750 | |
Acquisition of own equity instruments (-) | | 2,619,475 | | | 2,228,215 | |
Disposal of own equity instruments (+) | | 2,615,499 | | | 2,280,902 | |
Issuance/Redemption of non-voting equity units (+/-) | | — | | | — | |
Issuance/Redemption of other equity instruments (+/-) | | 141 | | | — | |
Issuance/Redemption of capital having the nature of a financial liability (+/-) | | — | | | — | |
Issuance/Redemption of subordinated liabilities (+/-) | | 701,763 | | | 784,458 | |
Issuance/Redemption of other long-term liabilities (+/-) | | — | | | — | |
Dividends/Interest paid (-) | | 1,600,483 | | | 1,352,353 | |
Other items relating to financing activities (+/-) | | (115,435 | ) | | (14,516 | ) |
Total net cash flows from financing activities (3) | | (1,017,990 | ) | | 1,469,026 | |
EFFECT OF EXCHANGE RATE CHANGES ON CASH OR CASH EQUIVALENTS (4) | | (1,623 | ) | | 573 | |
NET INCREASE/DECREASE IN CASH OR CASH EQUIVALENTS (1+2+3+4) | | (869,401 | ) | | 1,168,341 | |
Cash or cash equivalents at beginning of year | | 3,576,883 | | | 2,408,542 | |
Cash or cash equivalents at end of year | | 2,707,482 | | | 3,576,883 | |
F-41
The total assets and finance income of the Group’s most significant subsidiaries at December 31, 2005 and 2004 are as follows:
| | | | | | | | | | |
| | | | | Thousands of Euros |
| | | | | 2005 | | 2004 |
| | | COUNTRY | | Total Assets | | Interest and Similar Income | | Total Assets | | Interest and Similar Income |
BBVA Bancomer Group | | Mexico | | 59,219,806 | | 5,495,088 | | 47,641,124 | | 3,498,240 |
BBVA Chile Group | | Chile | | 6,468,472 | | 486,809 | | 5,040,878 | | 323,876 |
BBVA Puerto Rico | | Puerto Rico | | 5,852,238 | | 258,016 | | 3,977,188 | | 196,720 |
BBVA Banco Francés Group | | Argentina | | 4,273,340 | | 398,241 | | 3,436,801 | | 285,231 |
BBVA Banco Provincial Group | | Venezuela | | 5,133,080 | | 454,128 | | 3,620,137 | | 393,699 |
BVA Continental Group | | Peru | | 4,555,641 | | 251,337 | | 3,133,771 | | 174,526 |
BBVA Colombia Group | | Colombia | | 4,740,948 | | 290,508 | | 2,331,336 | | 220,608 |
Appendix V includes a detail of the fully consolidated subsidiaries which, based on the information available, were more than 5% owned by non-Group shareholders at December 31, 2005.
At December 31, 2005 and 2004, certain foreign non-BBVA Group credit institutions held significant ownership interests in the following fully consolidated companies:
2005
| | • | | A.F.P. Provida (a Bank of New York investee as a depositary in ADR’s programme) |
2004
| | • | | A.F.P. Horizonte Colombia (a Granahorrar investee) |
| | • | | A.F.P. Provida (a Bank of New York investee as a depositary in ADR’s programme) |
The changes in the ownership interests held by the Group in the most significant subsidiaries and the situation of these interests at December 31, 2005 were as follows:
BBVA-Bancomer Group (Mexico)-
Grupo Financiero BBV-Probursa, S.A. de C.V. and the companies in its group, including most notably Banco Bilbao Vizcaya México, S.A., joined the Group in July 1995. In the first half of 2000, it was resolved to merge Grupo Financiero BBV-Probursa, S.A. de C.V. into Grupo Financiero BBVA Bancomer, S.A. de C.V. Following this merger, which was carried out in July 2000, the Group’s ownership interest in Grupo Financiero BBVA Bancomer, S.A. de C.V. was 36.6%.
In the year from 2001 to 2003, the Group acquired various holdings in the share capital of Grupo Financiero BBVA Bancomer, S.A. de C.V., as a result of which its ownership interest was 59.43% at December 31, 2003.
On March 20, 2004, the BBVA Group completed the tender offer on 40.6% of the share capital of Grupo Financiero BBVA Bancomer, S.A. de C.V. The final number of shares presented in the offer and accepted by BBVA was 3,660,295,210, which represented 39.45% of the share capital of the Mexican entity. Following the acquisition of these shares through the tender offer, the ownership interest held by BBVA in the capital of Grupo Financiero BBVA Bancomer, S.A. de C.V. was 98.88%, which, as a result of the purchase of shares subsisting in the market, increased to 99.70% at December 31, 2004.
At December 31, 2005, following the purchase of shares subsisting in the market, BBVA held an ownership interest of 99.96% in the share capital of Grupo BBVA Financiero Bancomer, S.A.
F-42
BBVA Banco Francés (Argentina)-
In December 1996, the Group acquired 30% of BBVA Banco Francés, S.A. (formerly Banco Francés Río de la Plata, S.A.) and assumed its management. Further acquisitions and a capital increase prior to December 31, 2003 brought the Group’s ownership interest to 79.6% at that date.
On January 21, 2004, BBVA Banco Francés, S.A. presented the new formulation of the regularization and reorganization plan (which had begun in 2002) requested by the Argentine authorities. The new plan envisaged, mainly, the sale of this company’s subsidiary BBVA Banco Francés (Cayman) Ltd. to BBVA, S.A., which was carried out on March 18, 2004, and the conversion into equity of a USD 78 million loan granted by BBVA, S.A. to BBVA Banco Francés, S.A.
In compliance with the commitment thus assumed, on April 22, 2004, the Annual General Meeting of BBVA Banco Francés, S.A. authorized a capital increase with a par value of ARP 385 million, which was carried out in October 2004, BBVA subscribed to the capital increase at BBVA Banco Francés, S.A. through the conversion into equity of a USD 78 million loan it had granted to this investee. On February 23, 2005, the Superintendant of Financial and Exchange Institutions considered that the regularization and reorganization plan had been completed.
At December 31, 2004 and 2005, the ownership interest held in this company was 76.14% and 76.08%, respectively.
Consolidar Group (Argentina)-
The Consolidar Group joined the Group in October 1997, when a 63.33% ownership interest was reached through BBVA Banco Francés.
At December 31, 2004 and 2005, the Group held ownership interests of 53.89%, 65.96% and 66.67% in Consolidar Administradora de Fondos de Jubilación y Pensiones (AFJP), S.A., Consolidar Cía. de Seguros de Vida, S.A. and Consolidar Seguros de Retiro, S.A., respectively, through Banco Francés.
Banco Bilbao Vizcaya Argentaria Puerto Rico, S.A.-
In July 1998 BBV Puerto Rico absorbed PonceBank, an entity with total assets of USD 1,095 million, through a capital increase of USD 166 million. Also in 1998, BBV Puerto Rico acquired the assets and liabilities of Chase Manhattan Bank in Puerto Rico for a disbursement of USD 50 million.
At December 31, 2004 and 2005, the ownership interest held in this company was 100%.
BBVA Chile Group-
In September 1998, the Group acquired a 44% holding in Banco BHIF, S.A., currently BBVA Chile, S.A., and assumed the management of the group headed by this Chilean financial institution. In 1999 additional shares were acquired, bringing the Group’s total holding in this entity to 53.3% at December 31, 1999.
At December 31, 2004, the ownership interest held in BBVA Chile, S.A. was 66.27%, and additional acquisitions of capital in 2005 brought this figure up to 66.62%.
A.F.P. Provida, S.A. (Chile)-
On July 1, 1999, the Group acquired a 41.17% holding in, and assumed the management of, Administradora de Fondos de Pensiones Provida, S.A. Subsequent investments brought the holding to 64.32% in December 2004.
The ownership interest held by the Group at December 31, 2005 was 64.32%.
BBVA Banco Provincial Group (Venezuela)-
In March 1997, the Group acquired 40% of the share capital of Banco Provincial, S.A. and higher-percentage holdings in the other Provincial Group companies; consequently, it assumed the management of this group. Further acquisitions made in subsequent years raised the Bank’s holding in the Provincial Group to 55.60% at December 31, 2004 and 2005.
F-43
BBVA Banco Continental Group (Peru)-
In April 1995, the Group acquired 75% of the share capital of Banco Continental, S.A. through Holding Continental, S.A. (50%-owned by the Group) and assumed the management of the financial group headed by Banco Continental, S.A. Subsequently, in 2004 Holding Continental, S.A. increased its ownership interest in Banco Continental, S.A. to 92.04%, and this percentage remained unchanged in 2005.
BBVA Colombia Group-
In August 1996, the Group acquired 40% of the ordinary shares (equal to 35.1% of the total share capital) of Banco Ganadero, S.A. (currently BBVA Colombia, S.A.). Subsequently, additional holdings were acquired, bringing the ownership interest to 95.37% at December 31, 2003.
At December 31, 2005 and 2004, the ownership interest held by the Group was 95.37%.
Changes in the Group in 2005-
The most noteworthy acquisitions of subsidiaries in 2005 were as follows:
| | • | | On 6 January, pursuant to the agreement entered into in September 2004 and after obtaining the mandatory authorisations, the Group, through BBVA Bancomer, acquired all the shares of Hipotecaria Nacional, S.A. de C.V., a Mexican company specialising in the mortgage business. The price paid was MXP 4,121 million (approximately EUR 276,048 thousands) and the goodwill recognised amounted to EUR 259,111 thousands at December 31, 2005. |
| | • | | On 28 April, pursuant to the agreement entered into on September 20, 2004 and after obtaining the mandatory authorisations, BBVA, S.A. acquired all the shares of Laredo National Bancshares, Inc., a bank holding located in Texas (United States) which operates in the banking business through two independent banks: Laredo National Bank and South Texas National Bank. The price paid was USD 859.6 million (approximately EUR 666,110 thousands) and the goodwill recognised amounted to EUR 473,941 thousands at December 31, 2005. |
| | • | | On October 31, 2005, the Guarantee Fund for Colombian Financial Institutions, FOGAFIN, sold by public auction 98.78% of the share capital of Banco Granahorrar, S.A. (a Colombian financial institution) to the BBVA Group’s subsidiary in Colombia, BBVA Colombia, S.A. The financial offer made by BBVA Colombia for the acquisition of Banco Granahorrar, S.A. totalled USD 423.66 million. This transaction was performed in December 2005 after authorisation had been obtained from the related supervisory and control bodies. The price paid was Colombian pesos 981,572.2 million, approximately EUR 364,163 thousands, and the goodwill recognised amounted to EUR 266,862 thousands at December 31, 2005. |
Changes in the Group in 2004-
The most noteworthy transactions in 2004 were as follows:
| | • | | On March 31, 2004, Finanzia Renting, S.A. was merged into BBVA Renting, S.A., effective for accounting purposes from January 1, 2004. These two companies were wholly-owned investees of BBVA. |
| | • | | On July 21, 2004, the deed was executed for the merger of Corporación Área Inmobiliaria, S.L. into BBVA Área Inmobiliaria, S.L. through the transfer en bloc of the assets and liabilities of the former to the latter, and the dissolution of the former. On this same date the deed was executed whereby BBVA Área Inmobiliaria, S.L. changed its name to Anida Grupo Inmobiliario, S.L. |
| | • | | On October 8, 2004, the Group completed the purchase of all the shares of Valley Bank, an entity located in California, for USD 16.7 million (EUR 13.13 million). This was BBVA’s first commercial banking transaction in mainland USA. |
| | • | | On October 12, 2004, the Group sold the El Salvador welfare business comprising BBVA Crecer AFP and BBVA Seguros, S.A. – Seguros de Personas - in which BBVA had ownership interests of 62% and 51%, respectively, for USD 42.8 million (EUR 32.83 million), giving rise to a gain of EUR 12.3 million. |
F-44
5. Distribution of profit
In 2005 the Board of Directors of Banco Bilbao Vizcaya Argentaria, S.A. resolved to pay the shareholders three interim dividends out of 2005 profit, amounting to a total of EUR 0.345 gross per share. The aggregate amount of the interim dividends declared at December 31, 2005, net of the amount collected and to be collected by the consolidable Group companies, was EUR 1,166,644 thousand and is recorded under Dividends and Remuneration in the related consolidated balance sheet (Note 23). The last of the aforementioned interim dividends, which amounted to EUR 0.115 gross per share and was paid to the shareholders on January 10, 2006, was recorded under the heading Financial Liabilities at Amortised Cost – Other Financial Liabilities in the consolidated balance sheet at December 31, 2005 (Note 26).
The provisional accounting statements prepared in 2005 by Banco Bilbao Vizcaya Argentaria, S.A. in accordance with legal requirements evidencing the existence of sufficient liquidity for the distribution of the interim dividends were as follows:
| | | | | | | | |
| | | Thousands of Euros | |
| | | 31/05/05
Dividend 1 | | 31/08/05
Dividend 2 | | | 30/11/05
Dividend 3 | |
Interim dividend- | | | | | | | | |
Profit at each of the dates indicated, after the provision for income tax | | 502,337 | | 1,156,526 | | | 1,630,026 | |
Less- | | | | | | | | |
Interim dividends paid | | — | | (389,948 | ) | | (779,896 | ) |
| | | | | | | | |
Maximum amount distributable | | 502,337 | | 766,578 | | | 850,130 | |
| | | | | | | | |
Amount of proposed interim dividend | | 389,948 | | 389,948 | | | 389,948 | |
| | | | | | | | |
The Bank’s Board of Directors will propose to the shareholders at the Annual General Meeting that a final dividend of EUR 0.0186 per share be paid out of 2005 income. Based on the number of shares representing the share capital at December 31, 2005 (Note 32), the final dividend would amount to EUR 630,698 thousand and profit would be distributed as follows:
| | |
| | | Thousands of Euros |
Net profit for 2005 (Note 4) | | 1,918,142 |
| | |
Distribution: | | |
Dividends | | |
- Interim | | 1,166,844 |
- Final | | 630,698 |
To voluntary reserves | | 117,600 |
F-45
6. Earnings per share
Basic earnings per share are determined by dividing net profit or losses attributable to the Group in a given year by the weighted average number of shares outstanding during the year, excluding the average number of treasury shares held.
Diluted earnings per share are determined using a method similar to that used to calculate basic earnings per share; however, the weighted average number of shares outstanding is adjusted to take into account the potential dilutive effect of share options, warrants and convertible debt instruments outstanding at year-end.
The “diluted number” of shares linked to warrants outstanding at year-end is determined in two stages: firstly, the hypothetical liquid amount that would be received on the exercise of these warrants is divided by the annual average price of the share and, secondly, the difference between the amount thus quantified and the present number of potential shares is calculated; this represents the theoretical number of shares issued disregarding the dilutive effect. Profit or loss for the year is not adjusted.
Therefore:
| | | | |
| | | Thousands of Euros |
| | | 2005 | | 2004 |
Net profit for the year (thousands of euros) | | 3,806,425 | | 2,922,596 |
Weighted average number of shares outstanding (millions of shares) | | 3,384 | | 3,369 |
Basic earnings per share (euros) | | 1.12 | | 0.87 |
Diluted earnings per share (euros) | | 1.12 | | 0.87 |
7. Basis and methodology for segment reporting
Segment information is a fundamental tool for monitoring and managing the Group’s various businesses. Preparation of this information starts at the lowest-level units, and all the accounting data relating to the business managed by these units are recorded. Subsequently, on the basis of its established organisational structure, the Group classifies and combines the units to form the various segments. Also, the legal-entity companies composing the Group are assigned to the various businesses. If the diversity of a given company’s business so requires, its activity and results are assigned to various units.
After defining the composition of each business segment, the Group applies the management adjustments inherent to the model. The most significant adjustments are as follows:
| | – | Equity: the Group allocates economic capital commensurate with the risks incurred by each business and assesses capital requirements in respect of credit, market and operational risk. Initially, it quantifies the amount of shareholders’ (capital and reserves) attributable to the risks relating to each segment. This amount is used as a basis to determine the return on equity (ROE) of each business. Subsequently, the Group assigns all other eligible funds (eligible subordinated debt and preference shares) issued by the Group, and the costs associated thereto, to each segment. In the Americas business area (except for Argentina and International Private Banking, which apply this method), the Bank assigns as capital the underlying carrying amount of the ownership interest held by the BBVA Group and records the amounts relating to minority interests under Eligible Capital – Other. |
| | – | Inter-segment transfer pricing: the rates used to calculate the margins of each business are adjusted to the maturities and interest-rate review years of the various assets and liabilities composing each unit’s balance sheet. |
| | – | Assignment of operating expenses: in line with the new accounting standards, BBVA has perfected its expense allocation procedures. Direct and indirect expenses are attributed to the various segments, except for those not closely and specifically related to the segment’s business, i.e. expenses that are of a distinctly corporate or institutional nature for the Group as a whole. |
The primary basis of segment reporting relates to the Group’s business segments: Retail Banking Spain and Portugal, Wholesale and Investment Banking and Business in the Americas, which relate to the Group’s highest level of management.
The Corporate Activities area handles the Group’s general management functions. These consist basically of managing BBVA’s structural interest and exchange rate positions, liquidity and own funds. This area also includes the unit responsible for managing the industrial portfolio and investments.
F-46
The secondary basis of segment reporting relates to geographical segments. Information is prepared for the Group companies located in the Americas, detailing the banking, pension and insurance activities carried on in each of the countries.
Accordingly, the current composition of the Group’s main business segments is as follows:
| | – | Retail Banking Spain and Portugal: this segment includes the retail, asset management and private banking businesses conducted by the Group in Spain and Portugal. Therefore, it combines the individual-customer and SME segments in the domestic market, the Finanzia/Uno-e Group (which engages in e-banking, consumer finance, card distribution and renting activities), the Private Banking business, the pension and mutual fund managers, the insurance business and BBVA Portugal. This Area also includes the Depositary Unit that in 2004 was in Investment Banking. |
| | – | Wholesale and Investment Banking: this segment encompasses the (domestic and international) corporate banking business and institutional banking business carried on by the Group with large enterprises and institutions. It also includes the cash room businesses located in Spain, Europe and New York, the equity securities distribution and origination business, securities custody services, and the business and real estate project activities not conducted through equity interests held by the Group in large corporations. |
| | – | The Americas: this segment comprises the activity and results of the Group’s banks in the Americas and of their investees, including pension fund managers and insurance companies, as well as the International Private Banking business. |
This segmentation is based on the current internal organisational structure established by the BBVA Group for the management and monitoring of its business activities in 2005. On December 20, 2005 the Board of Directors approved a new organisational structure for the BBVA Group.
The detail of the contribution to attributed income of each of the aforementioned segments, and of their efficiency ratios and ROEs for the year from January 1 to December 31, 2005 is as follows:
| | | | | | | | | | | | | | | | | | | | | |
BUSINESS SEGMENTS 2005 | | TOTAL
ASSETS
(Thousands of Euros) | | | % TOTAL
ASSETS /
GROUP
ASSETS | | | ATTRIBUTED
INCOME (Thousands of Euros) | | | % ATTRIB,
INCOME /
GROUP
PROFIT | | | Efficiency Ratio Incl, Amortisation/ Depreciation | | | Efficiency Ratio Excl, Amortisation/ Depreciation | | | % ROE | |
Retail Banking Spain and Portugal | | 145,722,691 | | | 37.14 | % | | 1,613,578 | | | 42.4 | % | | 43.3 | % | | 41.4 | % | | 32.1 | % |
Wholesale and Investment Banking | | 164,730,390 | | | 41.98 | % | | 591,811 | | | 15.5 | % | | 29.7 | % | | 29.2 | % | | 25.9 | % |
The Americas | | 104,711,649 | | | 26.69 | % | | 1,819,565 | | | 47.8 | % | | 46.4 | % | | 42.9 | % | | 33.8 | % |
Corporate Activities | | 35,903,646 | | | 9.15 | % | | (218,529 | ) | | (5.7 | )% | | — | | | — | | | — | |
Inter-segment positions (1) | | (58,678,882 | ) | | (14.96 | )% | | — | | | — | | | — | | | — | | | — | |
| | | | | | | | | | | | | | | | | | | | | |
Total | | 392,389,494 | | | 100.0 | % | | 3,806,425 | | | 100.0 | % | | 46.7 | % | | 43.2 | % | | 37.0 | % |
| | | | | | | | | | | | | | | | | | | | | |
| | | | | | | |
BUSINESS SEGMENTS 2004 | | TOTAL
ASSETS
(Thousands of Euros) | | | % TOTAL
ASSETS /
GROUP
ASSETS | | | ATTRIBUTED
INCOME (Thousands of Euros) | | | % ATTRIB,
INCOME /
GROUP
PROFIT | | | Efficiency Ratio Incl, Amortisation/ Depreciation | | | Efficiency Ratio Excl, Amortisation/ Depreciation | | | % ROE | |
Retail Banking Spain and Portugal | | 127,347,238 | | | 38.66 | % | | 1,426,517 | | | 48.8 | % | | 45.6 | % | | 43.4 | % | | 32.5 | % |
Wholesale and Investment Banking | | 147,280,601 | | | 44.71 | % | | 403,739 | | | 13.8 | % | | 33.2 | % | | 32.5 | % | | 17.7 | % |
The Americas | | 74,845,022 | | | 22.72 | % | | 1,194,821 | | | 40.9 | % | | 48.7 | % | | 44.2 | % | | 26.1 | % |
Corporate Activities | | 20,266,295 | | | 6.15 | % | | (102,439 | ) | | (3.5 | )% | | — | | | — | | | — | |
Inter-segment positions (1) | | (40,298,000 | ) | | (12.23 | )% | | — | | | — | | | — | | | — | | | — | |
| | | | | | | | | | | | | | | | | | | | | |
Total | | 329,441,156 | | | 100.0 | % | | 2,922,638 | | | 100.0 | % | | 48.6 | % | | 44.6 | % | | 44.67 | % |
| | | | | | | | | | | | | | | | | | | | | |
| (1) | The negative amount recorded under Inter-Segment Positions contains crossed positions between the various business segments. |
F-47
8. Remuneration of the Bank’s directors and senior management
Remuneration and other benefits paid to directors and to members of the Management Committee
| | • | | Remuneration of non-executive directors |
The detail, by item, of the remuneration paid to the non-executive members of the Board of Directors in 2005 is as follows:
| | | | | | | | | | | | | | |
| | | Thousands of euros |
| | | BOARD | | STANDING
COMMITTEE | | AUDIT | | APPOINMENTS
AND
COMPENSATION | | RISK | | COMMITTEE
CHAIRMANSHIP | | TOTAL |
JUAN CARLOS ALVAREZ MEZQUIRIZ | | 115 | | 146 | | — | | 37 | | — | | — | | 298 |
RICHARD C. BREEDEN | | 312 | | — | | — | | — | | — | | — | | 312 |
RAMON BUSTAMANTE Y DE LA MORA | | 115 | | — | | 62 | | — | | 94 | | — | | 271 |
JOSE ANTONIO FERNANDEZ RIVERO (*) | | 115 | | — | | — | | — | | — | | 187 | | 302 |
IGNACIO FERRERO JORDI | | 115 | | — | | 62 | | — | | — | | 94 | | 271 |
ROMAN KNÖRR BORRAS | | 115 | | 146 | | — | | — | | — | | — | | 261 |
RICARDO LACASA SUAREZ | | 115 | | — | | — | | — | | 94 | | 156 | | 365 |
CARLOS LORING MARTINEZ DE IRUJO | | 115 | | — | | 62 | | 37 | | — | | — | | 214 |
ENRIQUE MEDINA FERNANDEZ | | 115 | | 146 | | — | | — | | 94 | | — | | 355 |
SUSANA RODRIGUEZ VIDARTE | | 115 | | — | | 62 | | — | | — | | — | | 177 |
JOSE MARIA SAN MARTIN ESPINOS | | 115 | | 146 | | — | | 37 | | — | | — | | 298 |
TELEFONICA ESPAÑA, S.A. | | 115 | | — | | — | | — | | — | | — | | 115 |
| | | | | | | | | | | | | | |
TOTAL | | 1,577 | | 584 | | 248 | | 111 | | 282 | | 437 | | 3,239 |
| | | | | | | | | | | | | | |
| (*) | In 2005 this director received, in addition to the amounts shown in the preceding table, a total of EUR 652 thousand relating to his early retirement bonus as a former BBVA senior executive. |
| | • | | Remuneration of executive directors |
The detail, by item, of the remuneration paid to the executive directors in 2005 is as follows:
| | | | | | |
| | | Thousands of Euros |
| | | FIXED
REMUNERATIONS | | VARIABLE
REMUNERATION (*) | | TOTAL (**) |
CHAIRMAN | | 1,649 | | 2,486 | | 4,135 |
CHIEF EXECUTIVE OFFICER | | 1,220 | | 2,097 | | 3,317 |
GENERAL SECRETARY | | 544 | | 645 | | 1,189 |
TOTAL | | 3,413 | | 5,228 | | 8,641 |
| * | Figures relating to variable remuneration for 2004 paid in 2005. |
| ** | In addition, the executive directors received remuneration in kind totalling EUR 33 thousand in 2005, of which EUR 7 thousand goes to chairman; EUR 14 thousands to Chief Excecutive Officer; EUR 12 thousands to general secretary. |
The executive directors earned the following amounts of variable remuneration in 2005, and these amounts, which are recognised under the heading Accrued Expenses and Deferred Income in the financial statements, will be paid in the first quarter of 2006:
| | |
| | | Thousand
of euros |
Chairman | | 2,744 |
Chief Executive Officer | | 2,304 |
General Secretary | | 703 |
F-48
| | • | | Remuneration of the members of the Management Committee |
The remuneration paid in 2005 to the members of BBVA’s Management Committee, excluding executive directors, comprised EUR 6,730 thousand of fixed remuneration and EUR 15,751 thousand of variable remuneration earned in 2004 and received in 2005.
In addition, the members of the Management Committee, excluding executive directors, received remuneration in kind totalling EUR 521 thousand in 2005.
The members of the Management Committee earned variable remuneration totalling EUR 14,012 thousand in 2005, and this amount, which is recognised under the heading Accrued Expenses and Deferred Income in the financial statements, will be paid in the first quarter of 2006.
The membership of the Management Committee increased from 12 to 18 in December 2005. This section includes information relating to all the members of the Management Committee at December 31, 2005, excluding executive directors.
| | • | | Long-term incentive plan for 2003 to 2005 |
The multi-year remuneration plan for the management team, including executive directors and the Management Committee, for the years from 2003 to 2005, will be settled in the first half of 2006. This plan established certain long-term (2003/2005) objectives taking into consideration the BBVA Group’s position regarding earnings per share, efficiency and ROE in comparison to its benchmark competitors. Under the plan, a sliding scale would be applied to the ordinary variable remuneration received by beneficiaries over its three-year term.
At the end of the 2003/2005 period, following publication by the benchmark entities of their final data, the average earnings per share, efficiency and ROE figures for the three-year period will be calculated.
Taking into account the 2003 and 2004 data and the published information for 2005, it is estimated that the amounts to be paid to the executive directors when the multi-year remuneration plan is settled will be as follows: the Chairman, EUR 4,812 thousand; the Chief Executive Officer, EUR 4,034 thousand and the Director-General Secretary, EUR 1,229 thousand.
These amounts were recorded under the heading Accrued Expenses and Deferred Income with a charge to Personnel Expenses in 2003, 2004 and 2005, respectively.
Also, it is considered that the amounts to be paid to the members of the Management Committee in settlement of the multi-year remuneration plan will total EUR 16,939 thousand were recorded under the heading Accrued Expenses and Deferred Income with a charge to Personnel Expenses in 2003, 2004 and 2005, respectively.
The implementation of the long-term incentive plan does not entail the granting to the beneficiaries of BBVA shares or share options.
F-49
| | • | | Welfare benefit obligations |
The provisions recorded at December 31, 2005 to cater for welfare benefit obligations to non-executive members of the Board of Directors were as follows:
| | |
DIRECTORS | | Thousand of
Euros |
JUAN CARLOS ALVAREZ MEZQUIRIZ | | 248 |
RAMON BUSTAMANTE Y DE LA MORA | | 259 |
JOSE ANTONIO FERNANDEZ RIVERO | | 101 |
IGNACIO FERRERO JORDI | | 258 |
ROMAN KNÖRR BORRAS | | 195 |
RICARDO LACASA SUAREZ | | 245 |
CARLOS LORING MARTINEZ DE IRUJO | | 75 |
ENRIQUE MEDINA FERNANDEZ | | 369 |
SUSANA RODRIGUEZ VIDARTE | | 131 |
JOSEMARIA SAN MARTIN ESPINOS | | 346 |
| | |
TOTAL | | 2,227 |
| | |
Of this cumulative total, EUR 623 thousand were recorded with a charge to income in 2005.
The provisions recorded at 2005 year-end to cater for welfare benefit obligations to executive directors were as follows:
| | |
| | | Thousand
of Euros |
CHAIRMAN | | 43,242 |
CHIEF EXECUTIVE OFFICER | | 38,545 |
GENERAL SECRETARY | | 5,986 |
| | |
Total | | 87,773 |
| | |
Of this cumulative total, EUR 14,272 thousand was recorded with a charge to income in 2005.
Also, insurance premiums amounting to EUR 70 thousand were paid on behalf of members of the Board of Directors.
As stipulated in their contracts, the Bank’s executive directors (Chairman, Chief Executive Officer and Director-General Secretary) are entitled to receive termination benefits in the event that they are terminated for a reason other than their own free will, retirement, disability or serious breach of their duties.
Per the terms of their respective contracts, the termination benefits payable to these executive directors in the event of their termination as such in 2006 would be: EUR 122,568 thousand.
Entitlement to receive these termination benefits is conditional upon these directors’ handing in their notice as such, resigning from any posts they hold at other entities in representation of the Bank, relinquishing their pre-existing labour relations with the Bank (including that of senior management) and waiving any termination benefits other than those specified.
From the termination date, the individual concerned will be barred, for a period of two years, from providing services to other financial institutions that compete with the Bank or its subsidiaries, as stipulated by Board regulations.
9. Risk exposure
Activities concerned with financial instruments may involve the assumption or transfer of one or more types of risk by financial entities. The risks associated with financial instruments are:
Market risks: these arise as a consequence of holding financial instruments whose value may be affected by changes in market conditions; they include three types of risk:
Currency risk, which arises as a result of changes in the exchange rate between currencies.
F-50
Fair value interest rate risk, which arises as a result of changes in market interest rates.
Price risk, which arises as a result of changes in market prices, due either to factors specific to the individual instrument or to factors that affect all instruments traded on the market.
Credit risk: this is the risk that one of the parties to the financial instrument agreement will fail to honour its contractual obligations due to the insolvency or incapacity of the individuals or legal entities involved and will cause the other party to incur a financial loss.
Liquidity risk: occasionally referred to as funding risk, this arises either because the entity may be unable to sell a financial asset quickly at an amount close to its fair value, or because the entity may encounter difficulty in finding funds to meet commitments associated with financial instruments.
The Group has developed a global risk management system based on three components: a corporate risk management structure, with segregated functions and responsibilities; a set of tools, circuits and procedures that make up the different risk management systems; and an internal control system. Following is a summary of each of the three components:
- Corporate risk management structure
The Board of Directors is the body that determines the Group’s risk policy. It approves, where appropriate, any non-delegated financial transactions or programmes involving credit risk, with no restrictions as to the amount. It also authorises the operating limits and the delegation of powers relating to credit risk, market risk and structural risk.
These tasks are performed by the Standing Committee, which reports to the Board.
The Board has a Lending Committee, a specialized body whose functions include, inter alia: assessment of the Group’s risk management in terms of risk profile and capital map, broken down by business and area of activity; evaluation of the general risk policies and establishment of limits by type of risk or business, and of management resources, procedures and systems, structures and processes; approval of individual or group risks that may affect the Bank’s solvency, in keeping with the established delegation system; analysis and approval, where appropriate, of credit risks in terms of maximum customer or group exposure; monitoring of the Group’s various risks, ensuring they comply with the profile defined by the Group; ensuring compliance with the recommendations of regulatory and supervisory bodies, and implementation of these recommendations in the Group’s risk management model; and analysis of the Group’s risk control systems.
The Asset-Liability Committee (ALCO) is the body responsible for actively managing the Group’s structural liquidity, interest rate and currency risks, and its core capital.
The Internal Risk Committee, which is composed of the persons responsible for Group risk management at corporate level, develops and implements the risk management model at BBVA and ensures that the risks assumed by the Group are in line with the target risk profile defined by the governing bodies.
The Technical Transactions Committee analyses and approves, where appropriate, the financial transactions and programmes that are within its level of authorisation, and refers any transactions exceeding the scope of its delegated powers to the Lending Committee.
- Tools, circuits and procedures
The Group has implemented an integral risk management system designed to cater for the needs arising in relation to the various types of risk; this prompted it to equip the management processes for each risk with measurement tools for risk acceptance, assessment and monitoring and to define the appropriate circuits and procedures, which are reflected in manuals that also include management criteria. Specifically, the main risk management activities performed are as follows: calculation of the risk exposures of the various portfolios, considering any related mitigating factors (netting, collateral, etc.); calculation of the probability of default (PD), loss severity and expected loss of each portfolio, and assignment of the PD to the new transactions (ratings and scorings); measurement of the values-at-risk of the portfolios based on various scenarios using historical and Monte Carlo simulations; establishment of limits to the potential losses based on the various risks incurred; determination of the possible impacts of the structural risks on the income statement; setting of limits and alerts to safeguard the Group’s liquidity; identification and quantification of operational risks by business line to enable the mitigation of these risks through corrective measures; and definition of efficient circuits and procedures which contribute to the achievement of the targets set.
F-51
Internal control – risk maps
The Group has an independent function which, in keeping with the recommendations of the regulators, draws up Risk Maps identifying any gaps in the Group’s risk management and the best practices, and establishes working plans with the various business areas to remedy these gaps.
Market risk management
a.1) Risk management in market areas
The BBVA Group manages together credit and market risks in the market and treasury areas through their Central Risk Unit.
The detail, by instrument, of the risk exposure at December 31, 2005 and 2004 is as follows:
| | | | |
| | | Thousands of Euros |
| | | 2005 | | 2004 |
Credit institutions | | 27,470,224 | | 16,702,957 |
Fixed-income securities | | 82,009,555 | | 83,211,589 |
Derivatives | | 8,525,664 | | 7,607,036 |
| | | | |
Total | | 118,005,443 | | 107,521,582 |
| | | | |
The BBVA Group manages together credit and market risks in the market and treasury areas through their Central Risk Unit.
In the market areas the Group has legal compensation rights and contractual compensation agreements which give rise to a reduction of EUR 10,749 million in credit risk exposure at December 31, 2005.
With regard to market risk (including interest rate risk, currency risk and equity price risk), BBVA’s limit structure determines an overall VaR limit for each business unit and specific sublimits by type of risk, activity and desk. The Bank also has in place limits on losses and other control mechanisms such as delta sensitivity calculations, which are supplemented by a range of indicators and alerts which automatically activate procedures aimed at addressing any situations that might have a negative effect on the activities of the business area.
The market risk profile at December 31, 2005 and 2004 was as follows:
| | | | |
| | | Thousands of Euros |
| | | 2005 | | 2004 |
Interest risk | | 11,284 | | 12,322 |
Spread risk | | 3,343 | | 3,967 |
Currency risk | | 1,717 | | 1,216 |
Stock-market risk | | 2,024 | | 2,261 |
Vega risk | | 4,443 | | 3,904 |
Correlation risk | | 1,817 | | 1,986 |
a.2) Structural interest rate risk
The aim of on-balance-sheet interest rate risk management is to maintain the BBVA Group’s exposure to market interest rate fluctuations at levels in keeping with its risk strategy and profile. To this end, the ALCO actively manages the balance sheet through transactions intended to optimize the level of risk assumed in relation to the expected results, thus enabling the Group to comply with the tolerable risk limits.
The ALCO bases its activities on the interest rate risk measurements performed by the Risk Area. Acting as an independent unit, the Risk Area periodically quantifies the impact of interest rate fluctuations on the BBVA Group’s net interest income and economic value.
In addition to measuring sensitivity to 100-basis-point changes in market interest rates, the Group performs probabilistic calculations to determine the economic capital for structural interest rate risk in the BBVA Group’s banking activity (excluding the Treasury Area) based on interest rate curve simulation models.
All these risk measurements are subsequently analysed and monitored, and the levels of risk assumed and the degree of compliance with the limits authorised by the Standing Committee are reported to the various managing bodies of the BBVA Group.
F-52
Following is a detail of the average interest rate risk exposure levels of the main financial institutions of the BBVA Group in 2005:
| | | | | | | | | | |
| | | Average Impact on Net Interest Income |
| | | 100 Basis-Point Increase | | 100 Basis-Point Decrease |
Entities | | EURO | | DOLLAR | | OTHER | | TOTAL | | TOTAL |
BBVA | | -156 | | -8 | | -4 | | -166 | | +168 |
Other Europe | | +2 | | -0 | | -0 | | +2 | | -3 |
BBVA Bancomer | | — | | +19 | | +90 | | +109 | | -108 |
BBVA Chile | | — | | +0 | | -4 | | -4 | | +4 |
BBVA Colombia | | — | | -0 | | +7 | | +7 | | -7 |
BBVA Banco Continental | | — | | +3 | | -2 | | +1 | | -1 |
BBVA Banco Provincial | | — | | +1 | | +7 | | +8 | | -7 |
BBVA Puerto Rico | | — | | -3 | | — | | -3 | | +0 |
| | | | | | | | | | |
| | | Average Impact on Economic Value |
| | | 100 Basis-Point Increase | | 100 Basis-Point
Decrease |
Entities | | EURO | | DOLLAR | | OTHER | | TOTAL | | TOTAL |
BBVA | | +483 | | +28 | | -3 | | +508 | | -580 |
Other Europe | | -20 | | -0 | | -0 | | -20 | | +21 |
BBVA Bancomer | | — | | +7 | | -4 | | +3 | | +5 |
BBVA Chile | | — | | +1 | | -47 | | -46 | | +50 |
BBVA Colombia | | — | | -1 | | +4 | | +3 | | -3 |
BBVA Banco Continental | | — | | -16 | | -7 | | -23 | | +25 |
BBVA Banco Provincial | | — | | +0 | | +7 | | +7 | | -7 |
BBVA Puerto Rico | | — | | +0 | | — | | +0 | | -12 |
As part of the measurement process, the Group established the assumptions regarding the evolution and behaviour of certain items, such as those relating to products with no explicit or contractual maturity. These assumptions are based on studies that estimate the relationship between the interest rates on these products and market rates and enable specific balances to be classified into trend-based balances maturing at long term and seasonal or volatile balances with short-term residual maturity.
a.3) Structural currency risk
Structural currency risk derives mainly from exposure to exchange rate fluctuations arising in relation to the Group’s foreign subsidiaries and from the endowment funds of the branches abroad financed in currencies other than the investment currency.
The ALCO is responsible for arranging hedging transactions to limit the net worth impact of fluctuations in exchange rates, based on their projected trend, and to guarantee the equivalent euro value of the foreign currency earnings expected to be obtained from these investments.
Structural currency risk management is based on the measurements performed by the Risk Area. These measurements use an exchange rate scenario simulation model which quantifies possible changes in value with a confidence interval of 99% and a pre-established time horizon. The Standing Committee limits the economic capital or unexpected loss arising from the currency risk of the foreign-currency investments.
F-53
At December 31, 2005, the coverage of structural currency risk exposure stood at 44%.
a.4) Structural equity price risk
The BBVA Group’s exposure to structural equity price risk derives mainly from investments in industrial and financial companies with medium- to long-term investment horizons. It is reduced by the net short positions held in derivative instruments on the same underlyings in order to limit the sensitivity of the portfolio to possible falls in prices. At December 31, 2005, the aggregate sensitivity of the Group’s equity positions to a 1% fall in the price of the shares amounted to EUR 84 million, 75% of which is concentrated in highly liquid European Union equities. This figure is determined by considering the exposure on shares measured at market price or, in the absence thereof, at fair value, including the net positions in equity swaps and options on the same underlyings in delta equivalent terms. Treasury Area portfolio positions are not included in the calculation.
The Risk Area measures and effectively monitors the structural equity price risk. To this end, it estimates the sensitivity figures and the capital required to cover the possible unexpected losses arising from fluctuations in the value of the companies in the investment portfolio, with a confidence interval equal to the entity’s target rating, taking into account the liquidity of the positions and the statistical behaviour of the assets under consideration. These measurements are supplemented by periodic stress- and back-testing and scenario analyses.
b) Credit risk management
Loans and receivables –
The detail, by nature of the related financial instrument, of the carrying amounts of the financial assets included under Loans and Receivables in the accompanying consolidated balance sheets at December 31, 2005 and 2004 is shown in Note 14.
The detail, by heading, of the Group’s maximum credit risk exposure at December 31, 2005 and 2004 is as follows:
| | | | |
| | | Thousands of Euros |
| | | 2005 | | 2004 |
Gross credit risk (amount drawn down) | | 252,274,622 | | 198,230,469 |
Loans and receivables | | 222,413,025 | | 176,672,820 |
Contingent liabilities | | 29,861,597 | | 21,557,649 |
Market activities | | 118,005,443 | | 107,533,914 |
Drawable by third parties | | 85,001,452 | | 60,716,878 |
| | | | |
Total | | 455,281,517 | | 366,481,261 |
| | | | |
The detail, by geographical area, of the aforementioned balance at December 31, 2005 and 2004 is as follows:
| | | | |
| | | Thousands of Euros |
| | | 2005 | | 2004 |
Gross credit risk (amount drawn down) | | 252,274,622 | | 198,230,469 |
Spain | | 199,043,387 | | 163,821,433 |
Other European countries | | 6,462,795 | | 5,721,920 |
The Americas | | 46,768,440 | | 28,687,116 |
Mexico | | 24,499,054 | | 14,714,176 |
Puerto Rico | | 3,293,317 | | 2,484,770 |
Chile | | 5,918,357 | | 3,941,860 |
USA | | 1,797,094 | | 56,691 |
Argentina | | 2,109,233 | | 1,695,668 |
Peru | | 2,846,359 | | 1,959,688 |
Colombia | | 2,845,845 | | 1,446,183 |
Venezuela | | 2,397,018 | | 1,543,935 |
Other | | 1,062,163 | | 844,145 |
| | | | |
Total | | 252,274,622 | | 198,230,469 |
| | | | |
At December 31, 2005, 79 corporate groups had drawn down loans of more than EUR 200 million, which taken together constitute a total risk exposure of EUR 37,151 million, 14.7% of the total for the Group at December 31, 2005. 95% of these corporate groups have an investment grade rating. The breakdown, based on the geographical area in which the transaction was originated, is as follows: 67% in Spain, 21% in the Bank’s branches abroad, and 12% in Latin America (9% in Mexico alone). The detail, by sector, is as follows: Institutional (30%), Real Estate and Construction (17%), Telecommunications (10%), Consumer Goods and Services (10%), and Electricity and Gas (10%).
F-54
The exposure to the business activity on the private sector of the Spanish companies shows high credit quality; 80.7% of the portfolio has a rating equal or high than BBB (investment grade) and 59.1 is focused in the A level or higher, as indicated in next chart:
| | |
RATINGS | | % exposure |
AAA/AA | | 35.6 |
A | | 23.5 |
BBB+ | | 8.8 |
BBB | | 6.1 |
BBB- | | 6.6 |
BB+ | | 5.4 |
BB | | 4.8 |
BB- | | 3.4 |
B+ | | 3.1 |
B | | 1.9 |
B- | | 0.7 |
CCC | | 0.1 |
| | |
Total | | 100 |
| | |
Loans and advances to other debtors –
The detail, by transaction type, status, sector and geographical area, of the carrying amounts of the financial assets included under Loans and Advances to Other Debtors in the accompanying consolidated balance sheets at December 31, 2005 and 2004, disregarding the impairment losses, is shown in Note 14.3.
The Group’s lending to the private sector resident in Spain totalled EUR 140 billion. Its risk exposure is highly diversified between financing provided to individuals and businesses, and there are no significant concentrations in the sectors that are more sensitive to the current economic scenario.
Past-due and overdrawn customer loans included in Receivable on Demand and Other amounted to EUR 1,023 million at December 31, 2005 (EUR 946 million at December 31, 2004).
Impaired assets –
The detail, by nature of the related financial instrument, of the carrying amounts of the financial assets included under the heading Impaired Assets in the accompanying consolidated balance sheets at December 31, 2005 and 2004 is shown in Note 14.4.
The detail, by geographical area, of the impaired assets at December 31, 2005 and 2004 is as follows:
| | | | |
| | | Thousands of Euros |
| | | 2005 | | 2004 |
Spain | | 1,051,072 | | 1,169,599 |
Other European countries | | 37,419 | | 33,708 |
The Americas | | 1,293,838 | | 1,044,746 |
Mexico | | 573,004 | | 433,314 |
Puerto Rico | | 71,482 | | 62,102 |
Chile | | 234,513 | | 172,190 |
USA | | 18,576 | | 0 |
Peru | | 82,139 | | 66,498 |
Argentina | | 38,464 | | 71,892 |
Colombia | | 223,041 | | 160,548 |
Venezuela | | 15,795 | | 22,588 |
Other | | 36,824 | | 55,614 |
| | | | |
Total | | 2,382,329 | | 2,248,053 |
| | | | |
The changes in the period from January 1, 2005 to December 31, 2005 in impaired loans and advances to other debtors in the foregoing detail are detailed in Note 14.4.
F-55
At December 31, 2005 and 2004, the doubtful balances of the various business segments were as follows:
| | | | |
| | | Thousands of Euros |
| | | 2005 | | 2004 |
Retail Banking Spain and Portugal | | 852,844 | | 940,215 |
Wholesale and Investment Banking | | 122,769 | | 169,476 |
The Americas | | 1,295,765 | | 1,046,136 |
Corporate Activities | | 110,951 | | 92,226 |
| | | | |
Total (*) | | 2,382,329 | | 2,248,053 |
| | | | |
| (*) | Includes contingent liabilities. |
Impairment losses –
The changes in the balance of the provisions for impairment losses on the assets included under Loans and Receivables are shown in Note 14.4.
In addition, at December 31, 2005, the provisions for impairment losses on off-balance-sheet items amounted to EUR 452 million (EUR 349 million at December 31, 2004) (Note 28).
c) Liquidity risk
The aim of liquidity risk management and control is to ensure that the Bank’s payment commitments can be met without having to resort to borrowing funds under onerous conditions.
The Group’s liquidity risk is monitored using a dual approach: the short-term approach (90-day time horizon), which focuses basically on the management of payments and collections of Treasury and Markets, ascertains the Bank’s possible liquidity requirements; and the structural, medium- and long-term approach, which focuses on the financial management of the balance sheet as a whole.
The Risk Area performs a control function and is totally independent of the management areas of each of the approaches and of the Group’s various units.
For each entity, the management areas request an outline of the quantitative and qualitative limits and alerts for short-, medium- and long-term liquidity risk, which is authorized by the Standing Committee. Also, the Risk Area performs periodic (daily and monthly) risk exposure measurements, develops the related valuation tools and models, conducts periodic stress tests, measures the degree of concentration on interbank counterparties, prepares the policies and procedures manual, and monitors the authorised limits and alerts.
The liquidity risk data are sent periodically to the Group’s ALCO and to the management areas involved. As established in the Contingency Plan, the Technical Liquidity Group (GTL), in the event of an alert of a possible crisis, conducts an initial analysis of the Bank’s short- and long-term liquidity situation. The GTL comprises personnel from the Short-Term Cash Desk, Financial Management and Risk Central Unity on Markets Areas-Structural Risk. If the alert is serious, the GTL reports the matter to the Liquidity Committee, which is composed of the managers of the related areas. The Liquidity Committee is responsible, in situations requiring urgent attention, for calling a meeting of the Crisis Committee chaired by the CEO.
F-56
10. Cash and balances with central banks
The breakdown of the balance of this heading in the consolidated balance sheets at December 31, 2005 and 2004 is as follows:
| | | | |
| | | Thousands of Euros |
| | | 2005 | | 2004 |
Cash | | 2,408,841 | �� | 1,790,632 |
Balances at the Bank of Spain | | 2,387,142 | | 3,140,392 |
Balances at other central banks | | 7,545,334 | | 5,192,066 |
| | | | |
Total(*) | | 12,341,317 | | 10,123,090 |
| | | | |
| (*) | Includes Valuation Adjustments. |
11. Financial assets and liabilities held for trading
11.1. Breakdown of the balance
The breakdown of the balances of these headings in the consolidated balance sheets at December 31, 2005 and 2004 is as follows:
| | | | | | | | |
| | | Thousands of Euros |
| | | 2005 | | 2004 |
| | | Receivable | | Payable | | Receivable | | Payable |
Debt securities | | 24,503,507 | | — | | 30,396,579 | | — |
Other equity instruments | | 6,245,534 | | — | | 5,690,885 | | — |
Trading derivatives | | 13,262,740 | | 13,862,644 | | 10,948,596 | | 12,802,912 |
Short positions | | — | | 2,408,221 | | — | | 1,331,501 |
| | | | | | | | |
Total | | 44,011,781 | | 16,270,865 | | 47,036,060 | | 14,134,413 |
| | | | | | | | |
11.2. Debt securities
The breakdown of the balance of this heading in the consolidated balance sheets at December 31, 2005 and 2004 is as follows:
| | | | |
| | | Thousands of Euros |
| | | 2005 | | 2004 |
Issued by central banks | | 141,820 | | 294,242 |
Spanish government bonds | | 2,501,499 | | 6,906,877 |
Foreign government bonds | | 13,132,841 | | 14,654,416 |
Issued by Spanish financial institutions | | 923,835 | | 747,864 |
Issued by foreign financial institutions | | 5,022,035 | | 4,879,106 |
Other debt securities | | 2,780,373 | | 2,914,074 |
Securities lending | | 1,104 | | — |
| | | | |
Total | | 24,503,507 | | 30,396,579 |
| | | | |
The debt securities included under Financial Assets Held for Trading earned average annual interest of 5.29% in 2005 (7.02% in 2004).
F-57
The detail, by geographical area, of the balance of Debt Securities is as follows:
| | | | |
| | | Thousands of Euros |
| | | 2005 | | 2004 |
Europe | | 9,331,740 | | 16,795,670 |
United States | | 3,187,479 | | 2,394,949 |
Latin America | | 11,518,730 | | 10,826,552 |
Rest of the world | | 465,558 | | 379,408 |
| | | | |
Total | | 24,503,507 | | 30,396,579 |
| | | | |
11.3. Other equity instruments
The breakdown of the balance of this heading in the consolidated balance sheets at December 31, 2005 and 2004 is as follows:
| | | | |
| | | Thousands of Euros |
| | | 2005 | | 2004 |
Shares of Spanish companies | | 3,326,259 | | 2,998,917 |
Credit institutions | | 502,968 | | 272,833 |
Other | | 2,823,291 | | 2,726,084 |
| | |
Shares of foreign companies | | 1,273,550 | | 1,493,200 |
Credit institutions | | 140,167 | | 86,741 |
Other | | 1,133,383 | | 1,406,459 |
Share in the net assets of mutual funds | | 1,645,725 | | 1,198,768 |
| | | | |
Total | | 6,245,534 | | 5,690,885 |
| | | | |
F-58
11.4. Trading derivatives
The detail, by transaction type and market, of the balances of this heading in the consolidated balance sheet at December 31, 2005 and 2004 is as follows:
| | | | | | | | | | | | | | | | | | |
2005 Thousands of Euros | | Currency Risk | | | Interest Rate Risk | | | Equity Price Risk | | | Credit Risk | | | Other Risks | | | Total | |
Organised markets | | | | | | | | | | | | | | | | | | |
Financial futures | | 4,069 | | | (5,833 | ) | | (53 | ) | | 39,747 | | | 10,724 | | | 48,654 | |
Options | | (299 | ) | | (279 | ) | | 253,062 | | | — | | | — | | | 252,484 | |
Other products | | — | | | 593 | | | — | | | — | | | — | | | 593 | |
OTC markets | | | | | | | | | | | | | | | | | | |
Credit institutions | | | | | | | | | | | | | | | | | | |
Forward transactions | | 107,695 | | | 128,384 | | | (7,614 | ) | | — | | | — | | | 228,465 | |
Future rate agreements (FRAs) | | — | | | 20 | | | — | | | — | | | — | | | 20 | |
Swaps | | (7,656 | ) | | (78,072 | ) | | 29,639 | | | (1,896 | ) | | | | | (57,985 | ) |
Options | | (92,819 | ) | | 154,547 | | | (189,327 | ) | | — | | | (4,132 | ) | | (131,731 | ) |
Other products | | (2,276 | ) | | (235,129 | ) | | — | | | — | | | — | | | (237,405 | ) |
Other financial Institutions | | | | | | | | | | | | | | | | | | |
Forward transactions | | (25,389 | ) | | — | | | — | | | — | | | — | | | (25,389 | ) |
Future rate agreements (FRAs) | | — | | | (68 | ) | | — | | | — | | | — | | | (68 | ) |
Swaps | | — | | | (108,432 | ) | | (4,830 | ) | | (592 | ) | | — | | | (113,854 | ) |
Options | | (31,527 | ) | | (177,943 | ) | | (40,845 | ) | | — | | | — | | | (250,315 | ) |
Other products | | (262 | ) | | 54,917 | | | — | | | — | | | — | | | 54,655 | |
Other sectors | | | | | | | | | | | | | | | | | | |
Forward transactions | | (168,653 | ) | | — | | | 214 | | | — | | | — | | | (168,439 | ) |
Future rate agreements (FRAs) | | — | | | 1,736 | | | — | | | — | | | — | | | 1,736 | |
Swaps | | | | | 421,392 | | | (346,225 | ) | | (1,471 | ) | | — | | | 73,696 | |
Options | | (12,434 | ) | | 294,900 | | | (557,431 | ) | | — | | | — | | | (274,965 | ) |
Other products | | (56 | ) | | | | | — | | | — | | | — | | | (56 | ) |
| | | | | | | | | | | | | | | | | | |
Total | | (229,607 | ) | | 450,733 | | | (863,410 | ) | | 35,788 | | | 6,592 | | | (599,904 | ) |
| | | | | | | | | | | | | | | | | | |
of which: Asset Trading Derivatives | | 1,301,581 | | | 9,836,714 | | | 1,921,374 | | | 98,444 | | | 104,627 | | | 13,262,740 | |
| | | | | | | | | | | | | | | | | | |
of which: Liability Trading Derivatives | | (1,531,188 | ) | | (9,385,981 | ) | | (2,784,784 | ) | | (62,656 | ) | | (98,035 | ) | | (13,862,644 | ) |
| | | | | | | | | | | | | | | | | | |
F-59
| | | | | | | | | | | | | | | |
2004 Thousands of Euros | | Currency
Risk | | | Interest
Rate Risk | | | Equity
Price Risk | | | Credit
Risk | | | Total | |
Organised markets | | | | | | | | | | | | | | | |
Options | | 4,434 | | | (18 | ) | | (56,911 | ) | | — | | | (52,495 | ) |
OTC markets | | | | | | | | | | | | | | | |
Credit institutions | | | | | | | | | | | | | | | |
Forward transactions | | (58,944 | ) | | 865 | | | — | | | — | | | (58,079 | ) |
Future rate agreements (FRAs) | | — | | | (1,829 | ) | | — | | | — | | | (1,829 | ) |
Swaps | | (7,521 | ) | | (631,399 | ) | | (15,728 | ) | | (331 | ) | | (654,979 | ) |
Options | | 31,208 | | | (29,367 | ) | | (176,823 | ) | | | | | (174,982 | ) |
Other financial Institutions | | | | | | | | | | | | | | | |
Forward transactions | | (110,128 | ) | | — | | | — | | | — | | | (110,128 | ) |
Future rate agreements (FRAs) | | — | | | (47 | ) | | — | | | — | | | (47 | ) |
Swaps | | (14,052 | ) | | (382,059 | ) | | (5,094 | ) | | (287 | ) | | (401,492 | ) |
Options | | 1,068 | | | (36,310 | ) | | 13,356 | | | | | | (21,886 | ) |
Other sectors | | | | | | | | | | | | | | | |
Forward transactions | | (737,767 | ) | | — | | | — | | | — | | | (737,767 | ) |
Future rate agreements (FRAs) | | — | | | 677 | | | — | | | — | | | 677 | |
Swaps | | (94,137 | ) | | 530,896 | | | (15,768 | ) | | (721 | ) | | 420,270 | |
Options | | 36,108 | | | (25,765 | ) | | (71,922 | ) | | — | | | (61,579 | ) |
| | | | | | | | | | | | | | | |
Total | | (949,731 | ) | | (574,356 | ) | | (328,890 | ) | | (1,338 | ) | | (1,854,316 | ) |
| | | | | | | | | | | | | | | |
of which: Asset Trading Derivatives | | 2,030,065 | | | 8,611,741 | | | 285,815 | | | 20,975 | | | 10,948,596 | |
| | | | | | | | | | | | | | | |
of which: Liability Trading Derivatives | | (2,979,796 | ) | | (9,186,097 | ) | | (614,705 | ) | | (22,314 | ) | | (12,802,912 | ) |
| | | | | | | | | | | | | | | |
12. Other financial assets at fair value through profit or loss
The detail of the balance of this heading in the consolidated balance sheets at December 31, 2005 and 2004, based on the nature of the related transactions, is as follows:
| | | | |
| | | Thousands of Euros |
| | | 2005 | | 2004 |
Debt securities | | 282,916 | | 58,771 |
Unit-linked products | | 282,916 | | 58,771 |
Other equity instruments | | 1,138,337 | | 1,000,719 |
Other securities | | 264,249 | | 241,618 |
Unit-linked products | | 874,088 | | 759,101 |
| | | | |
Total | | 1,421,253 | | 1,059,490 |
| | | | |
F-60
13. Available-for-sale financial assets
13.1. Breakdown of the balance
The detail of the balance of this heading in the consolidated balance sheets at December 31, 2005 and 2004, based on the nature of the related transactions, is as follows:
| | | | | | |
| | | Thousands of Euros | |
| | | 2005 | | | 2004 | |
Debt securities | | 50,731,597 | | | 44,814,277 | |
Issued by central banks | | 514,633 | | | 450,698 | |
Spanish government bonds | | 14,277,305 | | | 16,318,064 | |
Foreign government bonds | | 21,919,543 | | | 16,137,449 | |
of which: doubtfully receivable from foreign general government | | 3,056 | | | 346,484 | |
Issued by credit institutions | | 9,523,871 | | | 7,149,153 | |
Resident | | 773,652 | | | 608,017 | |
Nonresident | | 8,750,219 | | | 6,541,136 | |
of which: doubtfully receivable from foreign credit institutions | | 81 | | | — | |
| | |
Other debt securities | | 4,496,245 | | | 4,758,913 | |
Resident | | 1,583,903 | | | 2,001,701 | |
Nonresident | | 2,912,342 | | | 2,757,212 | |
of which: doubtfully receivable from nonresidents | | — | | | 1,030 | |
Other (Securities lending) | | — | | | — | |
| | |
Other equity instruments | | 6,058,891 | | | 8,032,779 | |
Shares of Spanish companies | | 3,840,320 | | | 6,124,453 | |
Credit institutions | | 16,587 | | | 18,803 | |
Quoted | | — | | | 2,216 | |
Unquoted | | 16,587 | | | 16,587 | |
Other | | 3,823,733 | | | 6,105,650 | |
Quoted | | 3,731,873 | | | 6,012,753 | |
Unquoted | | 91,860 | | | 92,897 | |
| | |
Shares of foreign companies | | 738,300 | | | 1,032,959 | |
Credit institutions | | 272,256 | | | 260,399 | |
Quoted | | 236,847 | | | 245,747 | |
Unquoted | | 35,409 | | | 14,652 | |
Other | | 466,044 | | | 772,560 | |
Quoted | | 398,976 | | | 493,509 | |
Unquoted | | 67,068 | | | 279,051 | |
| | |
Shares in the net assets of mutual funds | | 1,480,271 | | | 875,367 | |
| | | | | | |
Total gross | | 56,790,488 | | | 52,847,056 | |
| | | | | | |
Prepayments and accrued income and adjustments for hedging derivatives | | 3,381,799 | | | 305,891 | |
Impairment losses | | (138,299 | ) | | (149,402 | ) |
| | | | | | |
Total net | | 60,033,988 | | | 53,003,545 | |
| | | | | | |
In 2005 and 2004, EUR 428,560 thousand and EUR 974,412 thousand, respectively, were debited to Valuation Adjustments and recorded under Gains/Losses on Financial Assets and Liabilities in the consolidated income statements for 2005 and 2004.
F-61
The detail, by geographical area, of the debt securities and other equity instruments included under this heading, disregarding accruals and impairment losses:
| | | | |
| | | Thousands of Euros |
| | | 2005 | | 2004 |
Europe | | 42,174,090 | | 41,377,085 |
United States | | 4,129,727 | | 1,575,299 |
Latin America | | 9,820,752 | | 9,000,123 |
Rest of the world | | 665,919 | | 894,549 |
| | | | |
Total | | 56,790,488 | | 52,847,056 |
| | | | |
13.2. Impairment losses
Following is a summary of the changes in 2005 and 2004 in the impairment losses on available-for-sale financial assets:
| | | | | | |
| | | Thousands of Euros | |
| | | 2005 | | | 2004 | |
Balance at beginning of year | | 149,402 | | | 192,797 | |
| | | | | | |
Increase in impairment losses charged to income | | 8,183 | | | — | |
Decrease in impairment losses credited to income | | (27,615 | ) | | (68,815 | ) |
Elimination of impaired balance due to transfer of asset to write-off | | (17,161 | ) | | — | |
Transfers | | 1,501 | | | — | |
Exchange differences | | 23,989 | | | 25,420 | |
| | | | | | |
Balance at end of year | | 138,299 | | | 149,402 | |
| | | | | | |
Of which: | | | | | | |
-Determined individually | | 83,928 | | | 85,782 | |
-Determined collectively | | 54,371 | | | 63,620 | |
At December 31, 2005 and 2004, the balances of the individually determined impairment losses related in full to debt securities from countries belonging to the Latin America geographical area.
14. Loans and receivables
14. 1. Breakdown of the balance
The detail of the balance of this heading in the consolidated balance sheets at December 31, 2005 and 2004, based on the nature of the related financial instrument, is as follows:
| | | | | | |
| | | Thousands of Euros | |
| | | 2005 | | | 2004 | |
Loans and advances to credit institutions | | 27,373,957 | | | 16,603,694 | |
Money market operations through counterparties | | — | | | 241,999 | |
Loans and advances to other debtors | | 221,994,586 | | | 175,593,496 | |
Debt securities | | 2,292,537 | | | 5,497,509 | |
Other financial assets | | 2,784,054 | | | 2,366,666 | |
| | | | | | |
Total gross | | 254,445,134 | | | 200,303,364 | |
| | | | | | |
Less: valuation adjustments (*) | | (5,048,487 | ) | | (3,411,161 | ) |
| | | | | | |
Total net | | 249,396,647 | | | 196,892,203 | |
| | | | | | |
| (*) | The valuation adjustments shown above relate to the accrual of interest and similar income and to the valuation adjustments of the hedging derivatives associated with loans and advances. |
F-62
14. 2. Loans and advances to credit institutions
The detail of the balance of this heading in the consolidated balance sheets at December 31, 2005 and 2004, based on the nature of the related financial instrument, is as follows:
| | | | |
| | | Thousands of Euros |
| | | 2005 | | 2004 |
Reciprocal accounts | | 379,827 | | 396,719 |
Deposits with agreed maturity | | 13,202,414 | | 9,429,882 |
Demand deposits | | 540,982 | | 342,951 |
Other accounts | | 791,623 | | 443,547 |
Reverse repurchase agreements | | 12,459,111 | | 5,990,595 |
| | | | |
Total, gross | | 27,373,957 | | 16,603,694 |
| | | | |
Less: valuation adjustments | | 96,267 | | 99,263 |
| | | | |
Total, net | | 27,470,224 | | 16,702,957 |
| | | | |
14. 3. Loans and advances to other debtors
The detail, by loan type, status, sector and geographical area, of the balance of this heading in the consolidated balance sheets at December 31, 2005 and 2004, disregarding the balance of the impairment losses, is as follows:
| | | | | | |
| | | Thousands of Euros | |
| | | 2005 | | | 2004 | |
By loan type and status - | | | | | | |
Financial paper | | 6,566 | | | 48,540 | |
Commercial credit | | 20,101,790 | | | 12,289,969 | |
Secured loans | | 101,527,208 | | | 77,221,108 | |
Credit accounts | | 19,312,007 | | | 17,028,327 | |
Other loans | | 61,671,944 | | | 53,703,804 | |
Reverse repurchase agreements | | 1,176,327 | | | 719,798 | |
Receivable on demand and other | | 8,716,758 | | | 6,595,709 | |
Finance leases | | 7,138,174 | | | 5,784,623 | |
Impaired assets (*) | | 2,343,812 | | | 2,201,614 | |
| | | | | | |
Total gross | | 221,994,586 | | | 175,593,492 | |
| | | | | | |
Valuation adjustments | | (5,144,106 | ) | | (3,510,420 | ) |
| | | | | | |
Total net | | 216,850,480 | | | 172,083,072 | |
| | | | | | |
| (*) | EUR (2,260) thousand of accrued interest are included |
Through several of its financial institutions the Group provides financing to its customers to enable them to acquire both personal and real property through finance lease contracts which are recorded under this heading.
F-63
The breakdown, by borrower sector, of the balance of this heading at December 31, 2005 and 2004 is as follows:
| | | | |
Thousands of Euros | | 2005 | | 2004 |
Public sector | | 22,125,331 | | 20,345,386 |
Agriculture | | 2,504,423 | | 1,607,838 |
Industry | | 17,929,750 | | 16,714,665 |
Real estate and construction | | 36,561,531 | | 25,232,071 |
Trade and finance | | 36,194,157 | | 17,703,404 |
Loans to individuals | | 82,583,257 | | 70,613,165 |
Leases | | 6,725,825 | | 6,340,870 |
Other | | 17,370,312 | | 17,036,093 |
| | | | |
Total | | 221,994,586 | | 175,593,496 |
| | | | |
The detail, by geographical area, of the balance of Loans and Advances to Other Debtors at December 31, 2005 and 2004 is as follows:
| | | | |
Thousands of Euros | | 2005 | | 2004 |
Europe | | 170,789,741 | | 144,332,632 |
United States | | 6,196,086 | | 3,043,899 |
Latin America | | 43,490,220 | | 27,099,398 |
Rest of the world | | 1,518,539 | | 1,117,567 |
| | | | |
Total | | 221,994,586 | | 175,593,496 |
| | | | |
Of the total balance of Loans and Advances to Other Debtors, EUR 5,468,142 thousand and EUR 1,972,784 thousand relate to loans securitised through three securitisation funds created by the Group at December 31, 2005 and 2004, respectively; since the Group retains the risks and rewards of these loans, they cannot be derecognised. The detail of these loans, based on the nature of the related financial instrument, is as follows (see Notes 2.2.t, 3.c and 42):
| | | | |
| | | Thousands of Euros |
SECURITISATIONS | | 2005 | | 2004 |
Derecognised on the balance sheet | | 1,587,209 | | 2,096,440 |
Securitised mortgage assets | | 376,180 | | 387,855 |
Other securitised assets | | 1,211,029 | | 1,708,585 |
Retained on the balance sheet | | 5,468,142 | | 1,972,784 |
Securitised mortgage assets | | 2,249,752 | | 579,351 |
Other securitised assets | | 3,218,390 | | 1,393,433 |
| | | | |
Total | | 7,055,351 | | 4,069,224 |
| | | | |
F-64
14.4. Impaired assets and impairment losses
The changes in 2005 and 2004 in the Impaired Assets balance were as follows:
| | | | | | |
| | | Thousands of Euros | |
| | | 2005 | | | 2004 | |
Balance at beginning of year | | 2,201,614 | | | 2,923,849 | |
| | | | | | |
Additions | | 1,939,737 | | | 2,004,660 | |
Recoveries | | (1,527,040 | ) | | (1,559,012 | ) |
Transfers to write-off | | (666,534 | ) | | (713,188 | ) |
Exchange differences and other | | 398,295 | | | (454,695 | ) |
| | | | | | |
Balance at end of year | | 2,346,072 | | | 2,201,614 | |
| | | | | | |
The changes in the balance of the provisions covering the impairment losses on the assets included under Loans and Receivables were as follows:
| | | | | | |
| | | Thousands of Euros | |
| | | 2005 | | | 2004 | |
Balance at beginning of year | | 4,621,654 | | | 5,045,608 | |
| | | | | | |
Increase in impairment losses charged to income | | 1,418,758 | | | 1,718,549 | |
Decrease in impairment losses credited to income | | (597,704 | ) | | (574,755 | ) |
Acquisition of subsidiaries in the year | | 145,884 | | | 1,095 | |
Disposal of entities in the year | | (2,034 | ) | | — | |
Recovery of fixed-income security provisions | | — | | | 14,067 | |
Elimination of impaired balance due to transfer of asset to write-off | | (666,534 | ) | | (713,188 | ) |
Transfers to written-off loans | | 2,960 | | | (21,226 | ) |
Exchange differences | | 370,128 | | | (146,401 | ) |
Other | | 293,544 | | | (702,095 | ) |
| | | | | | |
Balance at end of year | | 5,586,656 | | | 4,621,654 | |
| | | | | | |
Of which: | | | | | | |
-Determined individually | | 2,041,573 | | | 1,867,695 | |
-Determined collectively | | 3,545,083 | | | 2,753,959 | |
| | |
Of which: | | | | | | |
Based on the nature of the asset covered: | | 5,586,656 | | | 4,621,654 | |
Loans and advances to credit institutions | | 17,423 | | | 31,860 | |
Loans and advances to other debtors | | 5,562,545 | | | 4,589,748 | |
Debt securities | | 648 | | | — | |
Other financial assets | | 6,040 | | | 46 | |
| | |
Of which: | | | | | | |
By geographical area: | | 5,586,656 | | | 4,621,654 | |
Europe | | 3,179,172 | | | 2,783,002 | |
United States | | 39,444 | | | 1,169 | |
Latin America | | 2,350,656 | | | 1,821,313 | |
Rest of the world | | 17,384 | | | 16,170 | |
F-65
EUR 666,534 thousand and EUR 713,188 thousand of financial assets were derecognised in 2005 and 2004 because the probability of recovering them was considered to be remote.
At December 31, 2005 and 2004, financial income amounting to EUR 1,051,687 thousand and EUR 750,018 thousand had accrued, respectively, but was not recorded in the consolidated income statement because there were doubts regarding its collectability.
15. Held-to-maturity investments
At December 31, 2005 and 2004, the detail of the balance of this heading in the consolidated balance sheets was as follows:
| | | | | | |
| | | Thousands of Euros | |
| | | 2005 | | | 2004 | |
Quoted Spanish government bonds | | 363,022 | | | 337,435 | |
Quoted foreign government bonds | | 2,272,187 | | | 1,297,558 | |
Issued by Spanish credit institutions | | 264,150 | | | 154,065 | |
Issued by foreign credit institutions | | 481,940 | | | 325,191 | |
Debentures and bonds | | 583,080 | | | 111,357 | |
Issued by other resident sectors | | 583,080 | | | 111,357 | |
| | | | | | |
Total, gross | | 3,964,379 | | | 2,225,606 | |
Impairment losses | | (5,114 | ) | | (4,104 | ) |
| | | | | | |
Total, net | | 3,959,265 | | | 2,221,502 | |
| | | | | | |
All these balances are in Europe.
The gross changes in 2005 and 2004 in the balance of this heading in the consolidated balance sheets are summarised as follows:
| | | | | |
| | | Thousands of Euros |
| | | 2005 | | | 2004 |
Balance at beginning of year | | 2,225,606 | | | — |
Acquisitions | | 1,884,773 | | | 2,225,606 |
Redemptions | | (146,000 | ) | | — |
| | | | | |
Balance at end of year | | 3,964,379 | | | 2,225,606 |
| | | | | |
Following is a summary of the changes in 2005 and 2004 in the impairment losses on held-to-maturity investments:
| | | | | |
| | | Thousands of Euros | |
| | | 2005 | | 2004 | |
Balance at beginning of year | | 4,104 | | — | |
Increase in impairment losses charged to income | | 1,008 | | 4,106 | |
Other | | 2 | | (2 | ) |
| | | | | |
Balance at end of year | | 5,114 | | 4,104 | |
| | | | | |
-Determined collectively | | 5,114 | | 4,104 | |
F-66
16. Hedging derivatives (receivable and payable)
The detail of the fair value of the hedging derivatives held by the Group at December 31, 2005 and 2004 and recognised in the consolidated balance sheets is as follows:
| | | | | | | | | | | | |
2005 Thousands of Euros | | Exchange Risk | | | Interest Rate Risk | | | Equity Price Risk | | | Total | |
Organised Markets | | | | | | | | | | | | |
Fair value hedge | | — | | | (8,067 | ) | | (2,377 | ) | | (10,444 | ) |
Credit institutions | | | | | | | | | | | | |
Fair value hedge | | (1,715,271 | ) | | 740,877 | | | 31,370 | | | (943,024 | ) |
Cash flow hedge | | 1,599,175 | | | (150,024 | ) | | — | | | 1,449,151 | |
Hedges of net investments in foreign operations | | (35 | ) | | — | | | | | | (35 | ) |
Other financial institutions | | | | | | | | | | | | |
Fair value hedge | | — | | | 194,522 | | | (307 | ) | | 194,215 | |
Other sectors | | | | | | | | | | | | |
Fair value hedge | | — | | | 355,317 | | | (2,832 | ) | | 352,484 | |
Cash flow hedge | | — | | | 227 | | | — | | | 227 | |
Hedges of net investments in foreign operations | | 35 | | | | | | — | | | 35 | |
| | | | | | | | | | | | |
Total | | (116,096 | ) | | 1,132,851 | | | 25,854 | | | 1,042,609 | |
| | | | | | | | | | | | |
of which: Asset Hedging Derivatives | | 1,599,176 | | | 2,281,663 | | | 31,857 | | | 3,912,696 | |
| | | | | | | | | | | | |
of which: Liability Hedging Derivatives | | (1,715,271 | ) | | (1,148,812 | ) | | (6,003 | ) | | (2,870,086 | ) |
| | | | | | | | | | | | |
| | | | | | | | | |
2004 Thousands of Euros | | Interest Rate Risk | | | Equity Price Risk | | | Total | |
Credit institutions | | | | | | | | | |
Fair value hedge | | 761,929 | | | (235,013 | ) | | 526,916 | |
Cash flow hedge | | (34,210 | ) | | — | | | (34,210 | ) |
Fair value macro-hedge | | 118,290 | | | — | | | 118,290 | |
Other financial Institutions | | | | | | | | | |
Fair value hedge | | 72,339 | | | 163 | | | 72,502 | |
Fair value macro-hedge | | 15,369 | | | — | | | 15,369 | |
Other sectors | | | | | | | | | |
Fair value hedge | | 391,957 | | | — | | | 391,957 | |
Cash flow hedge | | 1,512 | | | — | | | 1,512 | |
Fair value macro-hedge | | 49,542 | | | | | | 49,542 | |
| | | | | | | | | |
Total | | 1,376,728 | | | (234,850 | ) | | 1,141,877 | |
| | | | | | | | | |
of which: Asset Hedging Derivatives | | 3,834,083 | | | 439,367 | | | 4,273,450 | |
| | | | | | | | | |
of which: Liability Hedging Derivatives | | (2,457,355 | ) | | (674,217 | ) | | (3,131,572 | ) |
| | | | | | | | | |
F-67
17. Non-current assets held for sale and liabilities associated with non-current assets held for sale
The balance of Non-Current Assets Held for Sale relates in full to foreclosed assets.
The changes in 2005 and 2004 in the balance of this heading in the consolidated balance sheets were as follows:
| | | | | | |
| | | Thousands of Euros | |
| | | 2005 | | | 2004 | |
Revalued cost- | | | | | | |
Balances beginning at 2004 | | 338,860 | | | 385,620 | |
| | | | | | |
Additions | | 122,438 | | | 84,968 | |
Retirements | | (212,304 | ) | | (170,986 | ) |
Acquisition of subsidiaries in the year | | 90,903 | | | 7,409 | |
Transfers | | 8,431 | | | 37,630 | |
Exchange difference and other | | 52,955 | | | (5,781 | ) |
| | | | | | |
Balance at December 31, 2005 | | 401,283 | | | 338,860 | |
| | | | | | |
| | |
Impairment- | | | | | | |
Balances beginning at 2004 | | 179,705 | | | 202,448 | |
| | | | | | |
Additions | | 31,093 | | | 51,529 | |
Retirements | | (51,533 | ) | | (61,567 | ) |
Acquisition of subsidiaries in the year | | 28,205 | | | — | |
Transfers | | 4,084 | | | (250 | ) |
Exchange difference and other | | (21,531 | ) | | (12,455 | ) |
Balance at December 31, 2005 | | 170,023 | | | 179,705 | |
| | | | | | |
Balance at end of year | | 231,260 | | | 159,155 | |
| | | | | | |
At December 31, 2005 and 2004, there were no liabilities associated with non-current assets held for sale.
The fair value of these items was determined by reference to appraisals performed by companies registered as valuers in each of the geographical areas in which the assets are located.
Most of the non-current assets held for sale recorded as assets in the consolidated balance sheets at December 31, 2005 and 2004 relate to properties. These properties classified as “non-current assets held for sale” are assets available for sale, which is considered highly probable. The sale of most of these assets is expected to be completed within one year of the date on which they are classified as “non-current assets held for sale”.
18. Investments
18.1. Investments in associates
The most significant investment in associates at December 31, 2005 and 2004 was that held in Banca Nazionale del Lavoro S.p.A. (“BNL”), in which the Group owned 14.427% and 14.639% of the share capital respectively.
On March 28, 2005, the Bank’s Board of Directors resolved to launch a tender offer for the voluntary exchange of all the ordinary shares of BNL. Once the relevant authorisations had been obtained from the competent bodies, the shareholders approved the details of the transaction at the Special General Meeting held on June 13, 2005.
Prior to the expiration of the acceptance period of BBVA’s offer (22 July), the Italian insurance group Unipol Assicurazioni S.p.A. (“Unipol”) announced that it had entered into side agreements with certain entities, as a result of which they controlled 46.95% of BNL’s capital. In view of this situation, and since it did not expect to obtain more than 50% of BNL’s capital, the Group withdrew its tender offer for the voluntary exchange of shares.
F-68
As permitted by Italian legislation, in August Unipol presented a tender offer for all the shares of BNL, subject to obtainment of the relevant authorisation. However, on February 3, 2006, the Bank of Italy ultimately refused to grant Unipol authorisation to launch the offer. On that same day, Unipol announced that it had reached an agreement with the French entity BNP Paribas (“BNP”) for the sale of the BNL shares held by it, and notified BNP of its intention to launch a tender offer on all BNL’s capital.
At the date of preparation of these financial statements, the transactions described in the preceding paragraph had not been performed since the related authorisation had not been obtained. Accordingly, the shareholders’ agreement under which the Group has significant influence over the Board of Directors of BNL (Note 2.1-c) remains in force, and the Group’s investment in BNL is recorded under the heading “Investments - Associates” in the accompanying balance sheet.
The gross changes in 2005 and 2004 in Investments - Associates in the consolidated balance sheets were as follows:
| | | | | | |
| | | Thousands of Euros | |
| | | 2005 | | | 2004 | |
Balance at beginning of year | | 910,096 | | | 1,186,154 | |
| | | | | | |
Acquisitions | | 9,647 | | | 212,281 | |
Disposals | | (10,676 | ) | | (307,505 | ) |
Transfers | | 36,791 | | | (180,834 | ) |
| | | | | | |
Balance at end of year | | 945,858 | | | 910,096 | |
| | | | | | |
18.2. Investments in jointly controlled entities
At December 31, 2005 and 2004, all these investments are consolidated by the equity method (see Note 2.1.b).
The changes relating to 2005 reflect the sale of Azeler Automoción, S.A. and to the consolidation of Iniciativas Residenciales en Internet, S.A. by the full consolidation method.
18.3. Notifications of the acquisition of investments
Appendix IV lists the Group’s acquisitions and disposals of holdings in associates or jointly controlled entities and the notification dates thereof, in compliance with Article 86 of the Spanish Corporations Law and Article 53 of Securities Market Law 24/1988.
18.4. Impairment
No evidence of impairment was disclosed in respect of the Group’s investments in associates and jointly controlled entities.
19. Reinsurance assets
The most representative companies composing the insurance business of the consolidated Group are as follows: BBVA Seguros, S.A., Assegurances Principat, S.A., Seguros Bancomer, S.A., BBVA Seguros de Vida, S.A. and Consolidar Group’s insurance companies.
At December 31, 2005 and 2004, the detail of the balance of this heading in the consolidated balance sheets was as follows:
| | | | | |
| | | Thousands of Euros |
| | | 2005 | | | 2004 |
Reinsurance assets | | 223,276 | | | 80,245 |
Reinsurer’s share of technical provisions | | 223,276 | | | 80,245 |
Debtors arising from insurance and reinsurance operations | | 11,902 | | | 23 |
Debtors arising from reinsurance operations | | 11,917 | | | — |
Deposits received for outward reinsurance | | (15 | ) | | 23 |
| | | | | |
Total | | 235,178 | | | 80,268 |
| | | | | |
F-69
20. Tangible assets
The detail of the changes in 2005 and 2004 in this heading in the consolidated balance sheets, based on the nature of the related items, is as follows:
| | | | | | | | | | | | | | | | | | |
| | | Thousands of Euros | |
2005 | | Property, plants and equipment | | | Investment Properties | | | Assets Leased out under an Operating Lease | | | Total | |
| | Land and Buildings | | | Work in Progress | | | Furniture, Fixtures and Vehicles | | | | |
Deemed cost- | | | | | | | | | | | | | | | | | | |
Balances at January 1, 2005 | | 2,765,508 | | | 9,068 | | | 4,357,093 | | | 194,518 | | | 566,386 | | | 7,892,573 | |
| | | | | | | | | | | | | | | | | | |
Additions | | 109,089 | | | 19,351 | | | 374,831 | | | 5,094 | | | 239,553 | | | 747,918 | |
Retirements | | (148,671 | ) | | (6,758 | ) | | (159,614 | ) | | (38,868 | ) | | (113,749 | ) | | (467,660 | ) |
Acquisition of subsidiaries in the year | | 158,848 | | | 10,102 | | | 124,147 | | | — | | | — | | | 293,097 | |
Disposal of entities in the year | | (5,594 | ) | | (462 | ) | | (3,531 | ) | | — | | | — | | | (9,587 | ) |
Transfers | | 2,844 | | | (7,512 | ) | | 6,912 | | | (34,377 | ) | | — | | | (32,133 | ) |
Exchange difference and other | | 270,297 | | | (4,682 | ) | | 276,508 | | | (33,216 | ) | | (62,268 | ) | | 446,639 | |
| | | | | | | | | | | | | | | | | | |
Balance at December 31, 2005 | | 3,152,321 | | | 19,107 | | | 4,976,346 | | | 93,151 | | | 629,922 | | | 8,870,847 | |
| | | | | | | | | | | | | | | | | | |
| | | | | | |
Accumulated depreciation- | | | | | | | | | | | | | | | | | | |
Balances at January 1, 2005 | | (663,965 | ) | | (897 | ) | | (3,013,054 | ) | | (31,869 | ) | | (127,127 | ) | | (3,836,912 | ) |
| | | | | | | | | | | | | | | | | | |
Additions | | (52,348 | ) | | — | | | (218,681 | ) | | (1,389 | ) | | (88,624 | ) | | (361,042 | ) |
Retirements | | 41,417 | | | 1,011 | | | 142,521 | | | 4,294 | | | 53,717 | | | 242,960 | |
Acquisition of subsidiaries in the year | | (28,631 | ) | | — | | | (79,702 | ) | | — | | | — | | | (108,333 | ) |
Disposal of entities in the year | | 119 | | | — | | | 2,254 | | | 1,083 | | | — | | | 3,456 | |
Transfers | | (10,131 | ) | | — | | | 4,422 | | | 5,709 | | | — | | | — | |
Exchange difference and other | | (83,416 | ) | | (114 | ) | | (319,846 | ) | | 7,144 | | | (1,761 | ) | | (397,993 | ) |
| | | | | | | | | | | | | | | | | | |
Balance at December 31, 2005 | | (796,955 | ) | | — | | | (3,482,086 | ) | | (15,028 | ) | | (163,795 | ) | | (4,457,864 | ) |
| | | | | | | | | | | | | | | | | | |
| | | | | | |
Impairment- | | | | | | | | | | | | | | | | | | |
Balances at January 1, 2005 | | (116,025 | ) | | — | | | — | | | — | | | — | | | (116,025 | ) |
| | | | | | | | | | | | | | | | | | |
Additions | | (2,176 | ) | | — | | | — | | | (1,375 | ) | | — | | | (3,551 | ) |
Retirements | | 9,515 | | | — | | | — | | | — | | | — | | | 9,515 | |
Acquisition of subsidiaries in the year | | (1,855 | ) | | — | | | — | | | — | | | — | | | (1,855 | ) |
Exchange difference and other | | 82,328 | | | — | | | — | | | (6 | ) | | — | | | 82,322 | |
| | | | | | | | | | | | | | | | | | |
Balance at December 31, 2005 | | (28,213 | ) | | — | | | — | | | (1,381 | ) | | — | | | (29,594 | ) |
| | | | | | | | | | | | | | | | | | |
| | | | | | |
Net tangible assets- | | | | | | | | | | | | | | | | | | |
| | | | | | | | | | | | | | | | | | |
Balance at January 1, 2005 | | 1,985,518 | | | 8,171 | | | 1,344,039 | | | 162,649 | | | 439,259 | | | 3,939,636 | |
| | | | | | | | | | | | | | | | | | |
Balance at December 31, 2005 | | 2,327,153 | | | 19,107 | | | 1,494,260 | | | 76,742 | | | 466,127 | | | 4,383,389 | |
| | | | | | | | | | | | | | | | | | |
F-70
| | | | | | | | | | | | | | | | | | |
2004 | | Thousands of Euros | |
| | Property, plants and equipment | | | Investment Properties | | | Assets Leased out under an Operating Lease | | | Total | |
| | Land and Buildings | | | Work in Progress | | | Furniture, Fixtures and Vehicles | | | | |
Deemed cost- | | | | | | | | | | | | | | | | | | |
Balances at January 1, 2004 | | 2,746,953 | | | 11,519 | | | 4,511,749 | | | 169,293 | | | 462,585 | | | 7,902,099 | |
| | | | | | | | | | | | | | | | | | |
Additions | | 60,822 | | | — | | | 356,902 | | | 16,645 | | | 200,967 | | | 635,336 | |
Retirements | | (32,467 | ) | | (2,451 | ) | | (433,427 | ) | | — | | | (37,945 | ) | | (506,290 | ) |
Transfers | | 111 | | | — | | | (15,740 | ) | | 8,580 | | | (21,580 | ) | | (28,629 | ) |
Exchange difference and other | | (9,911 | ) | | — | | | (62,391 | ) | | — | | | (37,641 | ) | | (109,943 | ) |
| | | | | | | | | | | | | | | | | | |
Balance at December 31, 2004 | | 2,765,508 | | | 9,068 | | | 4,357,093 | | | 194,518 | | | 566,386 | | | 7,892,573 | |
| | | | | | | | | | | | | | | | | | |
| | | | | | |
Accumulated depreciation- | | | | | | | | | | | | | | | | | | |
Balances at January 1, 2004 | | (643,263 | ) | | — | | | (3,111,237 | ) | | (23,504 | ) | | (157,871 | ) | | (3,935,875 | ) |
Additions | | (45,869 | ) | | (897 | ) | | (234,195 | ) | | (8,365 | ) | | (73,986 | ) | | (363,312 | ) |
Retirements | | 16,830 | | | — | | | 351,871 | | | — | | | 43,901 | | | 412,602 | |
Transfers | | 9,004 | | | — | | | (872 | ) | | — | | | — | | | 68,961 | |
Exchange difference and other | | (667 | ) | | — | | | (18,621 | ) | | — | | | 60,829 | | | (19,288 | ) |
| | | | | | | | | | | | | | | | | | |
Balance at December 31, 2004 | | (663,965 | ) | | (897 | ) | | (3,013,054 | ) | | (31,869 | ) | | (127,127 | ) | | (3,836,912 | ) |
| | | | | | | | | | | | | | | | | | |
| | | | | | |
Impairment- | | | | | | | | | | | | | | | | | | |
Balances at January 1, 2004 | | (157,970 | ) | | — | | | (9,424 | ) | | — | | | (323 | ) | | (167,717 | ) |
Additions | | (2,467 | ) | | — | | | (7,393 | ) | | — | | | — | | | (9,860 | ) |
Retirements | | 5,887 | | | — | | | 16,817 | | | — | | | 323 | | | 23,027 | |
Exchange difference and other | | 38,525 | | | — | | | — | | | — | | | — | | | 38,525 | |
Balance at December 31, 2004 | | (116,025 | ) | | — | | | — | | | — | | | — | | | (116,025 | ) |
| | | | | | |
Net tangible assets- | | | | | | | | | | | | | | | | | | |
| | | | | | | | | | | | | | | | | | |
Balances at January 1, 2004 | | 1,945,720 | | | 11,519 | | | 1,391,088 | | | 145,789 | | | 304,391 | | | 3,798,507 | |
| | | | | | | | | | | | | | | | | | |
Balances at December 31, 2004 | | 1,985,518 | | | 8,171 | | | 1,344,039 | | | 162,649 | | | 439,259 | | | 3,939,636 | |
| | | | | | | | | | | | | | | | | | |
The net tangible asset impairment losses charged to the accompanying consolidated income statements for 2005 and 2004 amounted to EUR 1,589 thousand and EUR 2,135 thousand, respectively.
The gains and losses on tangible asset disposals amounted to EUR 107,838 thousand and EUR 22,477 thousand in 2005 (EUR 102,874 thousand and EUR 22,450 thousand in 2004) and are presented under the headings Others Gains and Others Losses the accompanying consolidated income statements (Note 54).
The carrying amount at December 31, 2005 and 2004 of the tangible assets relating to foreign subsidiaries was EUR 1,825,050 thousand and EUR 1,457,362 thousand, respectively. Also, the amount of the assets held under finance leases on which the purchase option is expected to be exercised was not material at December 31, 2005 and 2004.
The main real estate companies forming part of the consolidated Group are as follows: Anida Desarrollos Inmobiliarios, S.L., Montealiaga, S.A. and Desarrollo Urbanístico de Chamartín S.A.
The contribution of these companies to the consolidated income statement is recorded under Sales and Income from the Provision of Non-Financial Services (Note 50).
F-71
The main consolidated Group companies engaging in operating leases are: Finanzia Autorenting, S.A. and Automercantil-Comercio e Aluger de Vehículos Autom., Lda.
21. Intangible assets
21.1. Goodwill
The detail, by company, of the changes in 2005 and 2004 in the balance of this heading in the consolidated balance sheets is as follows:
| | | | | | | | | | | | |
| | | Thousands of Euros |
2005 | | Balance at beginning of year | | Additions | | Other | | | Exchange Differences | | | Balance at end of year |
Grupo Financiero BBVA Bancomer, S.A. de C.V. | | 513,589 | | — | | — | | | 103,513 | | | 617,102 |
Laredo Group | | — | | 433,250 | | — | | | 40,691 | | | 473,941 |
Granahorrar Bank, S.A. | | — | | 266,862 | | — | | | — | | | 266,862 |
Hipotecaria Nacional, S.A. de C.V. | | — | | 223,902 | | — | | | 35,209 | | | 259,111 |
Provida Group | | 104,047 | | — | | — | | | 26,151 | | | 130,198 |
BBVA Chile, S.A. | | 32,349 | | — | | 195 | | | 7,988 | | | 40,532 |
BBVA Puerto Rico, S.A. | | 33,741 | | — | | — | | | 5,293 | | | 39,034 |
BBVA (Portugal), S.A. | | 15,914 | | — | | — | | | — | | | 15,914 |
Finanzia, Banco de Crédito, S.A. | | 5,163 | | — | | — | | | — | | | 5,163 |
Valley Bank | | 5,690 | | — | | (975 | ) | | 376 | | | 5,091 |
Other companies | | — | | 4,906 | | — | | | — | | | 4,906 |
| | | | | | | | | | | | |
TOTAL FULLY CONSOLIDATED COMPANIES | | 710,493 | | 928,920 | | (780 | ) | | 219,221 | | | 1,857,854 |
| | | | | | | | | | | | |
| |
| | | Thousands of Euros |
2004 | | Balance at beginning of year | | Additions | | Other | | | Exchange Differences | | | Balance at end of year |
FULLY CONSOLIDATED COMPANIES | | | | | | | | | | | | |
Grupo Financiero BBVA Bancomer, S.A. de C.V. | | 549,574 | | — | | — | | | (35,985 | ) | | 513,589 |
BBVA Pensiones Chile | | 84,423 | | — | | — | | | (1,200 | ) | | 83,223 |
Provida Group | | 54,144 | | — | | — | | | (971 | ) | | 53,173 |
BBVA Puerto Rico, S.A. | | 36,457 | | — | | — | | | (2,716 | ) | | 33,741 |
BBVA (Portugal), S.A. | | 15,914 | | — | | — | | | — | | | 15,914 |
Finanzia, Banco de Crédito, S.A. | | 5,163 | | — | | — | | | — | | | 5,163 |
Valley Bank | | — | | 6,085 | | — | | | (395 | ) | | 5,690 |
Other companies | | | | | | | | | | | | |
| | | | | | | | | | | | |
TOTAL FULLY CONSOLIDATED COMPANIES | | 745,675 | | 6,085 | | — | | | (41,267 | ) | | 710,493 |
| | | | | | | | | | | | |
COMPANIES ACCOUNTED FOR USING THE EQUITY METHOD | | | | | | | | | | | | |
Banca Nazionale del Lavoro, S.p.A. | | 250,460 | | — | | (250,460 | ) | | — | | | — |
| | | | | | | | | | | | |
TOTAL COMPANIES ACCOUNTED FOR USING THE EQUITY METHOD | | 996,135 | | 6,085 | | (250,460 | ) | | (41,267 | ) | | 710,493 |
| | | | | | | | | | | | |
F-72
Based on the estimates and projections available to the Bank’s directors, the forecast revenues of these companies attributable to the Group support perfectly the carrying amount of the goodwill recorded.
With regard to the acquisitions made in the year, the assignment of intangible assets EUR 50,200 thousands.
Once the impairment analysis was performed as described in Note 2.2.m) no impairment of goodwill was recorded at December 31, 2005.
21.2. Other intangible assets
The detail of the balance of this heading in the consolidated balance sheets at December 31, 2005 and 2004 is as follows:
| | | | | | | |
| | | Thousands of Euros | | Average Useful Life |
| | | 2005 | | | 2004 | |
Computer software acquisition expense | | 44,972 | | | 23,438 | | 5 |
Other deferred charges | | 80,312 | | | 48,865 | | 5 |
Other intangible assets | | 92,011 | | | 38,287 | | 5 |
Impairment | | (5,100 | ) | | — | | |
| | | | | | | |
Total | | 212,195 | | | 110,591 | | |
| | | | | | | |
The changes in 2004 and 2005 in the balance of Intangible Assets were as follows:
| | | | | | |
| | | Thousands of Euros | |
| | | 2005 | | | 2004 | |
Balance at beginning of year | | 110,591 | | | 101,653 | |
| | | | | | |
Additions | | 227,929 | | | 86,415 | |
Year amortisation | | (87,650 | ) | | (84,894 | ) |
Exchange differences and other | | (33,575 | ) | | 7,417 | |
Impairment | | (5,100 | ) | | — | |
| | | | | | |
Balance at end of year | | 212,195 | | | 110,591 | |
| | | | | | |
22. Prepayments and accrued income and accrued expenses and deferred income
The detail of the balance of these headings in the consolidated balance sheets at December 31, 2005 and 2004 is as follows:
| | | | |
| | | Thousands of Euros |
| | | 2005 | | 2004 |
Assets - | | | | |
Prepaid expenses | | 199,111 | | 149,532 |
Other prepayments and accrued income | | 14,013 | | 256,126 |
Other accrual accounts | | 344,154 | | 312,097 |
| | | | |
Total | | 557,278 | | 717,755 |
| | | | |
| | |
Liabilities - | | | | |
Unmatured accrued expenses | | 1,146,815 | | 867,228 |
Other accrued expenses and deferred income | | 562,875 | | 398,552 |
| | | | |
Total | | 1,709,690 | | 1,265,780 |
| | | | |
F-73
23. Other assets and liabilities
The detail of the balances of these headings in the consolidated balance sheets at December 31, 2005 and 2004 was as follows:
| | | | |
| | | Thousands of Euros |
| | | 2005 | | 2004 |
Assets | | | | |
Inventories (*) | | 339,472 | | 279,897 |
Transactions in transit | | 8,787 | | 25,065 |
Taxes receivable | | 101,197 | | 266,673 |
Other | | 1,492,237 | | 1,152,447 |
| | | | |
Total | | 1,941,693 | | 1,724,082 |
| | | | |
Liabilities | | | | |
Transactions in transit | | 24,211 | | 16,019 |
Tax collection accounts | | 2,084,712 | | 2,273,548 |
Other | | 580,805 | | 86,411 |
| | | | |
Total | | 2,689,728 | | 2,375,978 |
| | | | |
| (*) | The balance of the heading Inventories in the consolidated financial statements relates basically to the following companies: Anida Desarrollos Inmobiliarios, S.L., Montealiaga, S.A. Desarrollo Urbanístico Chamartín, S.A. |
24 Other financial liabilities at fair value through profit or loss
The balance of this heading in the consolidated balance sheet at December 31, 2005 and 2004 amounted to EUR 740,088 thousand and EUR 834,350 thousand and related to deposits from other creditors through the so-called unit-linked life insurance policies (in which the policyholder bears the risk).
25 Financial liabilities at fair value through equity
At December 31, 2005 and 2004 there were no financial liabilities at fair value through equity.
26 Financial liabilities at amortised cost
The detail of the items composing the balances of this heading in the accompanying consolidated balance sheets is as follows:
| | | | |
| | | Thousands of Euros |
| | | 2005 | | 2004 |
Deposits from central banks | | 21,189,193 | | 20,301,105 |
Deposits from credit institutions | | 45,125,943 | | 44,048,115 |
Money markets operations | | 23,252 | | 657,997 |
Deposits from other creditors | | 182,635,181 | | 149,891,799 |
Debt certificates (including bonds) | | 62,841,755 | | 45,482,121 |
Subordinated liabilities | | 13,723,262 | | 12,327,377 |
Other financial liabilities | | 3,966,664 | | 2,875,013 |
| | | | |
Total | | 329,505,250 | | 275,583,527 |
| | | | |
F-74
26.1. Deposits from central banks
The breakdown of the balance of this heading in the consolidated balance sheets is as follows:
| | | | |
| | | Thousands of Euros |
| | | 2005 | | 2004 |
Banco de España | | | | |
Credit account drawdowns | | 6,822,123 | | 11,066,829 |
Other State debt and Treasury bills under repurchase agreement | | 385,791 | | 222,092 |
Other assets under repurchase agreement | | 8,931,130 | | 4,481,829 |
Other central banks | | 5,028,315 | | 4,365,278 |
Valuation adjustments | | 21,834 | | 165,077 |
| | | | |
Total | | 21,189,193 | | 20,301,105 |
| | | | |
At December 31, 2005 and 2004, the financing limit assigned to the Group by the Bank of Spain and other central banks was EUR 10,003,353 thousand and EUR 13,932,391 thousand, respectively, of which EUR 6,822,123 thousand and EUR 11,249,454 thousand had been drawn down.
26.2 Deposits from credit institutions
The breakdown of the balance of this heading in the consolidated balance sheets, based on the nature of the related transactions, is as follows:
| | | | |
| | | Thousands of Euros |
| | | 2005 | | 2004 |
Reciprocal accounts | | 271,075 | | 62,231 |
Deposits with agreed maturity | | 28,807,457 | | 25,958,006 |
Demand deposits | | 1,053,651 | | 938,790 |
Other accounts | | 1,113,102 | | 353,452 |
Repurchase agreements | | 13,723,185 | | 16,347,359 |
Valuation adjustments | | 157,473 | | 388,277 |
| | | | |
Total | | 45,125,943 | | 44,048,115 |
| | | | |
The detail, by geographical area, of this heading at December 31, 2005 is as follows:
| | | | | | | | |
| | | Thousands of Euros |
| | | Demand Deposits | | Deposits with Agreed Maturity | | Funds Received Under Financial Asset Transfers | | TOTAL |
Europe | | 1,033,225 | | 14,814,501 | | 8,255,127 | | 24,102,853 |
United States | | 68,568 | | 3,670,356 | | 1,649,995 | | 5,388,919 |
Latin America | | 1,289,817 | | 2,643,338 | | 3,818,063 | | 7,751,218 |
Rest of the world | | 46,218 | | 7,679,262 | | — | | 7,725,480 |
| | | | | | | | |
Total | | 2,437,828 | | 28,807,457 | | 13,723,185 | | 44,968,470 |
| | | | | | | | |
F-75
The detail, by geographical area, of this heading at December 31, 2004 is as follows:
| | | | | | | | |
| | | Thousands of Euros |
| | | Demand Deposits | | Deposits with Agreed Maturity | | Funds Received Under Financial Asset Transfers | | TOTAL |
Europe | | 888,625 | | 17,896,390 | | 11,110,293 | | 29,895,308 |
United States | | 625 | | 173,143 | | 602,011 | | 775,779 |
Latin America | | 350,798 | | 2,149,208 | | 4,635,055 | | 7,135,061 |
Rest of the world | | 114,425 | | 5,739,265 | | — | | 5,853,690 |
| | | | | | | | |
Total | | 1,354,473 | | 25,958,006 | | 16,347,359 | | 43,659,838 |
| | | | | | | | |
26.3 Deposits from other creditors
The breakdown of the balance of this heading in the accompanying consolidated balance sheets, based on the nature of the related transactions, is as follows:
| | | | |
| | | Thousands of Euros |
| | | 2005 | | 2004 |
General government | | 17,673,354 | | 11,193,877 |
Spanish | | 9,753,109 | | 4,861,198 |
Foreign | | 7,920,245 | | 6,332,679 |
Other resident sectors - | | 79,754,851 | | 74,857,893 |
Current accounts | | 20,644,607 | | 21,293,205 |
Savings accounts | | 20,628,845 | | 18,235,544 |
Fixed-term deposits | | 20,435,029 | | 19,537,882 |
Reverse repos | | 12,029,507 | | 12,503,084 |
Other accounts | | 5,381,823 | | 2,000,023 |
Valuation adjustments | | 635,040 | | 1,288,155 |
| | |
Non-resident sectors | | 85,206,976 | | 63,840,029 |
Current accounts | | 18,717,430 | | 14,203,508 |
Savings accounts | | 11,370,344 | | 7,374,054 |
Fixed-term deposits | | 45,266,207 | | 37,894,962 |
Repurchase agreements | | 9,215,471 | | 3,981,250 |
Other accounts | | 76,512 | | 23,284 |
| | | | |
Valuation adjustments | | 561,012 | | 362,971 |
| | | | |
Total | | 182,635,181 | | 149,891,799 |
| | | | |
Of which: | | | | |
In euros | | 100,623,473 | | 88,987,322 |
In foreign currency | | 82,011,708 | | 60,904,477 |
F-76
The detail, by geographical area, of this heading at December 31, 2005 is as follows:
| | | | | | | | | | |
| | | Thousands of Euros |
| | | Demand Deposits | | Savings Deposits | | Deposits with Agreed Maturity | | Repos | | TOTAL |
Europe | | 30,302,830 | | 21,682,976 | | 36,354,699 | | 17,150,477 | | 105,490,982 |
United States | | 17,045,731 | | 10,166,885 | | 22,974,535 | | 7,985,834 | | 58,172,985 |
Latin America | | 1,007,346 | | 354,453 | | 10,374,599 | | 135,162 | | 11,871,560 |
Rest of the world | | 775,704 | | 518,374 | | 4,609,475 | | 49 | | 5,903,602 |
| | | | | | | | | | |
Total | | 49,131,611 | | 32,722,688 | | 74,313,308 | | 25,271,522 | | 181,439,129 |
| | | | | | | | | | |
The detail, by geographical area, of this heading at December 31, 2004 is as follows:
| | | | | | | | | | |
| | | Thousands of Euros |
| | | Demand Deposits | | Savings Deposits | | Deposits with Agreed Maturity | | Repos | | TOTAL |
Europe | | 29,745,644 | | 18,560,468 | | 27,155,322 | | 13,697,251 | | 89,158,685 |
United States | | 648,658 | | 468,762 | | 6,734,521 | | 156 | | 7,852,097 |
Latin America | | 13,114,743 | | 6,962,493 | | 22,137,721 | | 3,839,588 | | 46,054,545 |
Rest of the world | | 197,899 | | 43,044 | | 4,934,403 | | — | | 5,175,346 |
| | | | | | | | | | |
Total | | 43,706,944 | | 26,034,767 | | 60,961,967 | | 17,536,995 | | 148,240,673 |
| | | | | | | | | | |
26.4 Debt certificates (including bonds)
The breakdown of the balance of this heading in the accompanying consolidated balance sheets is as follows:
| | | | |
| | | Thousands of Euros |
| | | 2005 | | 2004 |
Promissory notes and bills | | 7,417,516 | | 6,372,310 |
Bonds and debentures issued: | | 55,424,239 | | 39,109,811 |
Mortgage-backed securities | | 26,926,995 | | 19,036,759 |
Other non-convertible securities | | 26,542,102 | | 18,793,732 |
Valuation adjustments | | 1,955,142 | | 1,279,320 |
| | | | |
Total | | 62,841,755 | | 45,482,121 |
| | | | |
F-77
26.4.1. Bonds and debentures issued:
The detail, disregarding valuation adjustments, of the balance of this account in the accompanying consolidated balance sheets, based on the currency in which the bonds and debentures are issued, and of the related interest rates is as follows:
| | | | |
| | | Thousands of Euros |
| | | 2005 | | 2004 |
In euros- | | | | |
Non-convertible bonds and debentures at floating interest rates | | 18,488,246 | | 13,732,198 |
Non-convertible bonds and debentures at a weighted fixed interest rate of 4.16% | | 5,213,827 | | 4,266,690 |
Mortgaged bonds | | 26,683,165 | | 18,811,281 |
Valuation adjustments | | 1,939,639 | | 1,265,560 |
| | |
In foreign currencies- | | | | |
Non-convertible bonds and debentures at floating interest rates | | 2,613,766 | | 405,956 |
Non-convertible bonds and debentures at a weighted fixed interest rate of 5.40% | | 226,263 | | 388,705 |
Mortgaged bonds | | 243,830 | | 225,661 |
Valuation adjustments | | 15,503 | | 13,760 |
| | | | |
Total | | 55,424,239 | | 39,109,811 |
| | | | |
The valuation adjustments include mostly adjustments for accrued interest, hedging transactions and issuance fees.
Most of the foreign-currency issues are denominated in U.S. dollars.
26.4.2. Promissory notes and bills:
These promissory notes were issued mainly by Banco de Financiación, S.A., and the detail thereof, by term and currency, disregarding valuation adjustments, is as follows:
| | | | |
| | | Thousands of Euros |
| | | 2005 | | 2004 |
BY CURRENCY | | | | |
In euros | | 6,724,347 | | 5,458,822 |
In other currencies | | 693,169 | | 913,488 |
| | | | |
Total | | 7,417,516 | | 6,372,310 |
| | | | |
26.5. Subordinated liabilities
The detail, by company, of this heading in the consolidated balance sheets at December 31, 2005 and 2004 is as follows:
| | | | |
| | | Thousand of euros |
| | | 2005 | | 2004 |
Subordinated debt | | 9,178,935 | | 8,100,383 |
Preference shares | | 4,127,786 | | 3,808,893 |
Valuation adjustments | | 416,541 | | 418,101 |
| | | | |
Total | | 13,723,262 | | 12,327,377 |
| | | | |
In 2005 and 2004 the subordinated debt and preference shares bore interest of EUR 556,121 thousand and EUR 539,027 thousand, respectively (Note 44).
F-78
26.5.1. Subordinated debt
These issues are non-convertible subordinated debt and, accordingly, for debt seniority purposes, they rank behind ordinary debt.
The detail, disregarding valuation adjustments, of the balance of this heading in the accompanying consolidated balance sheets, based on the related issue currency and interest rate, is as follows:
| | | | | | | | | | |
ISSUER | | Currency | | Thousands of Euros | | Prevailing Interest Rate 2005 | | Maturity Date |
| | | 2005 | | 2004 | | |
ISSUES IN EUROS | | | | | | | | | | |
BBVA | | | | | | | | | | |
July -96 | | EUR | | 79,307 | | 84,142 | | 9.33 | | 22-dec-2006 |
July -96 | | EUR | | 27,332 | | 27,947 | | 9.37 | | 22-dec-2016 |
February -97 | | EUR | | 60,101 | | 60,101 | | 6.97 | | 18-dec-2007 |
September -97 | | EUR | | 36,061 | | 36,061 | | 6.65 | | 17-dec-2007 |
December -01 | | EUR | | 1,500,000 | | 1,500,000 | | 3.50 | | 1-jan-2017 |
July -03 | | EUR | | 600,390 | | 600,000 | | 2.54 | | 17-jul-2013 |
November -03 | | EUR | | 749,782 | | 750,000 | | 4.50 | | 12-nov-2015 |
October -04 | | EUR | | 992,000 | | 1,000,000 | | 4.37 | | 20-oct-2019 |
| | | | | |
BBVA CAPITAL FUNDING, LTD | | | | | | | | | | |
September -95 | | EUR | | — | | 13,613 | | 3.10 | | 5-sep-2005 |
March -97 | | EUR | | 45,735 | | 45,735 | | 2.71 | | 20-mar-2007 |
October -97 | | EUR | | 76,694 | | 76,694 | | 2.38 | | 8-oct-2007 |
October -97 | | EUR | | 228,588 | | 228,616 | | 6.00 | | 24-dec-2009 |
July -99 | | EUR | | 73,000 | | 73,000 | | 6.35 | | 16-oct-2015 |
February -00 | | EUR | | 500,002 | | 500,000 | | 6.38 | | 25-feb-2010 |
December -00 | | EUR | | — | | 750,000 | | 2.71 | | 4-dec-2010 |
July -01 | | EUR | | 500,002 | | 500,000 | | 5.50 | | 4-jul-2011 |
October -01 | | EUR | | 60,000 | | 60,000 | | 5.73 | | 10-oct-2011 |
October-01 | | EUR | | 40,000 | | 40,000 | | 6.08 | | 10-oct-2016 |
October -01 | | EUR | | 50,000 | | 50,000 | | 2.79 | | 15-oct-2016 |
November -01 | | EUR | | 55,000 | | 55,000 | | 2.96 | | 2-nov-2016 |
December -01 | | EUR | | 56,002 | | 56,000 | | 3.18 | | 20-dec-2016 |
| | | | | |
BBVA SUBORDINATED CAPITAL S.A.U, | | | | | | | | | | |
May -05 | | EUR | | 480,444 | | — | | 2.74 | | 23-may-2017 |
October -05 | | EUR | | 150,000 | | — | | 2.49 | | 13-oct-2020 |
October -05 | | EUR | | 250,000 | | — | | 2.44 | | 20-oct-2017 |
| | | | | |
ISSUES IN FOREIGN CURRENCIES | | | | | | | | | | |
| | | | | |
BBVA PUERTO RICO S.A. | | | | | | | | | | |
September -04 | | USD | | 42,384 | | 36,708 | | 4.20 | | 23-sep-2014 |
| | | | | |
BBVA BANCO FRANCES S.A. | | | | | | | | | | |
March-98 | | USD | | — | | 4,118 | | 7.07 | | 31-mar-2005 |
| | | | | |
BBVA GLOBAL FINANCE LTD. | | | | | | | | | | |
July -95 | | USD | | — | | 110,124 | | 6.88 | | 1-jul-2005 |
July -95 | | USD | | — | | 36,708 | | 2.36 | | 15-jan-2005 |
December -95 | | USD | | 169,535 | | 146,832 | | 7.00 | | 1-dec-2025 |
December -95 | | USD | | 63,575 | | 55,062 | | 4.48 | | 9-may-2006 |
December -95 | | USD | | — | | 55,062 | | 2.45 | | 11-may-2005 |
| | | | | |
BANCO BILBAO VIZCAYA ARGENTARIA , CHILE | | | | | | | | | | |
| | CLP | | 172,053 | | 93,552 | | Various | | Various |
| | | | | |
BBVA BANCOMER S.A. | | | | | | | | | | |
November -98 | | MNX | | 197,853 | | 157,406 | | 9.44 | | 28-sep-2006 |
July -05 | | USD | | 420,809 | | | | 5.38 | | 22-jul-2015 |
| | | | | |
BBVA CAPITAL FUNDING, LTD | | | | | | | | | | |
August -95 | | JPY | | — | | 21,480 | | 3.45 | | 9-aug-2010 |
October -95 | | USD | | — | | 71,600 | | 5.40 | | 26-oct-2015 |
October -95 | | JPY | | 72,000 | | 110,124 | | 6.00 | | 26-oct-2015 |
February -96 | | USD | | 211,918 | | 183,540 | | 6.38 | | 14-feb-2006 |
November -96 | | USD | | 169,535 | | 146,832 | | 4.89 | | 27-nov-2006 |
| | | | | |
BBVA BANCOMER CAPITAL TRUST INC | | | | | | | | | | |
February -01 | | USD | | 423,837 | | 364,326 | | 10.50 | | 16-feb-2011 |
| | | | | |
LNB CAPITAL TRUST I | | | | | | | | | | |
November -01 | | USD | | 17,800 | | — | | 6.44 | | 8-dec-2031 |
| | | | | |
LNB STATUTORY TRUST I | | | | | | | | | | |
December -01 | | USD | | 25,430 | | — | | 6.64 | | 18-dec-2031 |
| | | | | |
BBVA SUBORDINATED CAPITAL S.A.U, | | | | | | | | | | |
October -05 | | JPY | | 144,000 | | — | | 2.75 | | 22-oct-2035 |
October -05 | | GBP | | 437,766 | | — | | 4.79 | | 21-oct-2015 |
| | | | | | | | | | |
Total | | | | 9,178,935 | | 8,100,383 | | — | | — |
| | | | | | | | | | |
F-79
In 2005 and 2004 there were no early redemptions of these issues.
The issues of BBVA Capital Funding, LTD. and BBVA Global Finance, LTD. are guaranteed (secondary liability) by the Bank, and the issue of Bancomer Capital Trust Inc. is guaranteed (secondary liability) by BBVA Bancomer. The issues of LNB Capital Trust 1 and LNB Statutory Trust 1 are guaranteed (secondary liability) by Laredo National Bank
26.5.2. Preference Shares
The detail, by company, of this heading in the consolidated balance sheets at December 31, 2005 and 2004 is as follows:
| | | | |
| | | Thousands of Euros |
| | | 2005 | | 2004 |
BBVA International, LTD. (1) | | 1,340,000 | | 1,341,230 |
BBVA Preferred Capital, LTD. (2) | | 203,447 | | 176,198 |
BBVA Privanza International (Gibraltar), LTD. (2) | | 59,339 | | 51,646 |
BBVA Capital Finance, S.A. | | 1,975,000 | | 1,980,966 |
BBVA Capital Funding | | — | | 258,853 |
BBVA International Preferred, S.A.U. | | 550,000 | | — |
| | | | |
Total | | 4,127,786 | | 3,808,893 |
| | | | |
| (1) | Listed on the Spanish AIAF fixed-income market, and the Luxembourg, Frankfurt and Amsterdam stock exchanges, |
| (2) | Listed on the New York Stock Exchange, |
F-80
The foregoing balances include several issues of non-cumulative non-voting preference shares guaranteed by Banco Bilbao Vizcaya Argentaria, S.A., the detail being as follows:
| | | | | | | |
2005 | | Currency | | Amount Issued (Millions) | | Fixed Annual Dividend | |
BBVA Privanza International (Gibraltar), LTD.- | | | | | | | |
June -97 | | USD | | 70 | | 7.76 | % |
BBVA International, LTD.- | | | | | | | |
April -01 | | EUR | | 340 | | 7.00 | % |
March -02 | | EUR | | 500 | | 3.50 | % |
December -02 | | EUR | | 500 | | 3.25 | |
BBVA Preferred Capital, LTD.- | | | | | | | |
June -01 | | USD | | 240 | | 7.75 | % |
BBVA Capital Finance, S.A. | | | | | | | |
December -03 | | EUR | | 350 | | 2.75 | % |
July -04 | | EUR | | 500 | | 3.00 | % |
December -04 | | EUR | | 1,125 | | 3.00 | % |
BBVA International Preferred, S.A.U. | | | | | | | |
September-05 | | EUR | | 550 | | 3.80 | % |
| | | |
2004 | | Currency | | Amount Issued (Millions) | | Fixed Annual Dividend | |
BBVA Privanza International (Gibraltar), LTD.- | | | | | | | |
June -97 | | USD | | 70 | | 7.76 | % |
BBVA International, LTD.- | | | | | | | |
April -01 | | EUR | | 340 | | 7.00 | % |
March -02 | | EUR | | 500 | | 3.50 | % |
December -02 | | EUR | | 500 | | 3.25 | % |
BBVA Capital Funding, LTD.- | | | | | | | |
April -98 | | EUR | | 256 | | 6.36 | % |
BBVA Preferred Capital, LTD.- | | | | | | | |
June -01 | | USD | | 240 | | 7.75 | % |
BBVA Capital Finance, S.A. | | | | | | | |
December -03 | | EUR | | 350 | | 2.75 | % |
July -04 | | EUR | | 500 | | 3.00 | % |
December -04 | | EUR | | 1,125 | | 3.00 | % |
During 2005, the EUR 256 millions issued redemption option was exercised BBVA Capital Funding, LTD.
These issues were subscribed by third parties outside the Group and are wholly or partially redeemable at the Company’s option after five or ten years from the issue date, depending on the terms of each issue.
F-81
27. Liabilities under insurance contracts
The detail of the balance of this heading in the consolidated balance sheets at December 31, 2005 and 2004 is as follows:
| | | | |
| | | Thousands of Euros |
| | | 2005 | | 2004 |
Technical provisions for: | | | | |
Mathematical reserves | | 9,023,585 | | 7,026,605 |
Provision for unpaid claims reported | | 419,123 | | 125,682 |
Other insurance technical provisions | | 1,057,859 | | 962,142 |
| | | | |
Total | | 10,500,567 | | 8,114,429 |
| | | | |
28. Provisions
The detail of the balance of this heading in the consolidated balance sheets at December 31, 2005 and 2004 is as follows:
| | | | |
| | | Thousands of Euros |
| | | 2005 | | 2004 |
Provisions for pensions and similar obligations | | 6,239,744 | | 6,304,284 |
Provisions for taxes | | 146,971 | | 173,229 |
Provisions for contingent exposures and commitments | | 452,462 | | 348,782 |
Other provisions | | 1,861,908 | | 1,565,553 |
| | | | |
Total | | 8,701,085 | | 8,391,848 |
| | | | |
The changes in 2005 and 2004 in the balances of the headings Provisions – Provisions for Pensions and Provisions – Other Provisions in the accompanying consolidated balance sheets were as follows:
| | | | | | | | | | | | | | | | | | |
| | | 2005 | | | 2004 | |
Thousand of Euros | | Provision for Pensions and similar obligation | | | Commitments and contingent risks provisions | | | Provisions for taxes and other provisions | | | Provision for Pensions and similar obligation | | | Commitments and contingent risks provisions | | | Provisions for taxes and other provisions | |
Balance at beginning of year | | 6,304,284 | | | 348,782 | | | 1,738,782 | | | 6,481,288 | | | 279,708 | | | 1,874,006 | |
Add- | | | | | | | | | | | | | | | | | | |
Year provision with a charge to income for the year | | 646,948 | | | 114,028 | | | 278,249 | | | 883,638 | | | 126,173 | | | 424,578 | |
Acquisition of subsidiaries | | — | | | — | | | 42,355 | | | — | | | — | | | 497 | |
Transfers and other Changes | | 97,630 | | | 9,566 | | | 317,849 | | | 4,714 | | | 1,412 | | | 330,248 | |
Less- | | | | | | | | | | | | | | | | | | |
Available funds | | — | | | (12,378 | ) | | (160,048 | ) | | — | | | (12,673 | ) | | (153,465 | ) |
Payments to early Retirees (Note 2.2.f) | | (777,746 | ) | | — | | | — | | | (658,904 | ) | | — | | | — | |
Provisions used and other changes | | (31,372 | ) | | (7,536 | ) | | (204,761 | ) | | (406,452 | ) | | (45,802 | ) | | (649,401 | ) |
Transfer | | — | | | — | | | — | | | — | | | (36 | ) | | (87,474 | ) |
Disposal of subsidiaries | | — | | | — | | | (3,547 | ) | | — | | | — | | | (207 | ) |
| | | | | | | | | | | | | | | | | | |
Balances at end of Year | | 6,239,744 | | | 452,462 | | | 2,008,879 | | | 6,304,284 | | | 348,782 | | | 1,738,782 | |
| | | | | | | | | | | | | | | | | | |
F-82
The year provisions for pensions charged to income in 2005 under the headings “interest expenses and similar charges”, “personal expenses” and “provision expenses” in the consolidated income statement amounted to EUR 255,370, 68,893 and 322,685 thousand. The amount charged in this respect in 2004 was EUR 210,342, 58,982 y 614,314 thousand (Note 2.2.f).
Also, year provisions totalling EUR 278,249 thousand relating to the heading Provisions—Other Provisions were recorded in 2005 in the accompanying consolidated income statement. The amount charged in this respect in 2004 was EUR 424,578 thousand.
F-83
29. Minority interests
The detail, by consolidated company, of the balance of the heading Minority Interests is as follows:
| | | | |
| | | Thousands of Euros |
| | | 2005 | | 2004 |
By company- | | | | |
BBVA Colombia Group | | 16,467 | | 14,059 |
BBVA Chile Group | | 120,998 | | 87,615 |
BBVA Banco Continental Group | | 222,304 | | 171,035 |
BBVA Banco Provincial Group | | 203,860 | | 165,485 |
Provida Group | | 70,544 | | 52,921 |
Banc Internacional d’Andorra, S.A. | | 185,713 | | 142,677 |
Other companies | | 151,604 | | 103,747 |
| | | | |
Total | | 971,490 | | 737,539 |
| | | | |
The detail, by consolidated company, of the balance of the heading Income Attributed to Minority Interests is as follows:
| | | | |
| | | Thousands of Euros |
| | | 2005 | | 2004 |
By company- | | | | |
BBVA Colombia Group | | 4,166 | | 2,943 |
BBVA Chile Group | | 13,526 | | 4,829 |
BBVA Banco Continental Group | | 59,689 | | 39,721 |
BBVA Banco Provincial Group | | 47,279 | | 65,834 |
Provida Group | | 18,169 | | 8,831 |
Banc Internacional d’Andorra, S.A. | | 41,607 | | 34,264 |
Other companies | | 79,711 | | 29,191 |
| | | | |
Total | | 264,147 | | 185,613 |
| | | | |
F-84
30. Changes in total equity
The changes in equity in the years ended December 31, 2005 and 2004 were as follows:
| | | | | | | | | | | | | | | | | | | | | | |
| | | Thousands of euros | |
2005 | | Share Capital | | Reserves | | | Profit for the Year | | | Treasury Shares and Other Equity Instruments | | | Valuation Adjustments | | Minority Interests | | | Interim Dividends | | | Total Equity | |
Balances at January 1, 2005 | | 1,661,518 | | 7,427,737 | | | 2,922,596 | | | (35,846 | ) | | 2,106,914 | | 737,539 | | | (1,015,195 | ) | | 13,805,263 | |
| | | | | | | | | | | | | | | | | | | | | | |
Valuation adjustments | | — | | — | | | — | | | — | | | 604,889 | | 2,569 | | | — | | | 607,458 | |
Distribution of prior Years’ profit | | — | | 1,427,165 | | | (1,427,165 | ) | | — | | | — | | | | | — | | | — | |
Dividends | | — | | — | | | (1,495,431 | ) | | — | | | — | | (9,312 | ) | | 1,015,195 | | | (489,548 | ) |
Gains or losses on transactions involving treasury shares and other Equity instruments | | — | | 34,093 | | | — | | | (60,334 | ) | | — | | (626 | ) | | — | | | (26,867 | ) |
Profit for the year | | — | | — | | | 3,806,425 | | | — | | | — | | | | | (1,166,644 | ) | | 2,639,781 | |
Dividends paid to minority shareholders | | — | | — | | | — | | | — | | | — | | (55,010 | ) | | — | | | (55,010 | ) |
Changes in the composition of the Group | | — | | — | | | — | | | — | | | — | | (7,612 | ) | | — | | | (7,612 | ) |
Exchange differences | | — | | — | | | — | | | — | | | 583,152 | | 42,750 | | | — | | | 625,902 | |
Share of minority interests in profit for the year | | — | | — | | | — | | | — | | | — | | 264,147 | | | — | | | 264,147 | |
Other | | — | | (58,447 | ) | | — | | | — | | | — | | (2,955 | ) | | — | | | (61,402 | ) |
| | | | | | | | | | | | | | | | | | | | | | |
Balances at 31 December 2005 | | 1,661,518 | | 8,830,548 | | | 3,806,425 | | | (96,180 | ) | | 3,294,955 | | 971,490 | | | (1,166,644 | ) | | 17,302,112 | |
| | | | | | | | | | | | | | | | | | | | | | |
F-85
| | | | | | | | | | | | | | | | | | | | | | | |
| | | Thousands of euros | |
2004 | | Share Capital | | Reserves | | | Profit for the Year | | | Treasury Shares and Other Equity Instruments | | | Valuation Adjustments | | | Minority Interests | | | Interim Dividends | | | Total Equity | |
Balances at January 1, 2004 | | 1,565,968 | | 5,780,075 | | | 2,226,701 | | | (82,001 | ) | | 1,691,325 | | | 1,917,164 | | | (859,896 | ) | | 12,239,336 | |
Valuation adjustments | | — | | — | | | — | | | — | | | 604,032 | | | 9,154 | | | — | | | 613,186 | |
Distribution of prior years’ profit | | — | | 977,264 | | | (977,264 | ) | | — | | | — | | | — | | | — | | | — | |
Dividends | | — | | — | | | (1,249,437 | ) | | — | | | — | | | (48,621 | ) | | 859,896 | | | (438,162 | ) |
Gains or losses on transactions involving treasury shares and other equity instruments | | — | | — | | | — | | | 46,155 | | | — | | | — | | | — | | | 46,155 | |
Profit for the year | | — | | — | | | 2,922,596 | | | — | | | — | | | — | | | (1,015,195 | ) | | 1,907,401 | |
Capital increases and reductions | | 95,550 | | 1,903,200 | | | — | | | — | | | — | | | 11,556 | | | — | | | 2,010,306 | |
Dividends paid to minority shareholders | | — | | — | | | — | | | — | | | — | | | (63,074 | ) | | — | | | (63,074 | ) |
Changes in the composition of the Group | | — | | (1,375,898 | ) | | — | | | — | | | — | | | (1,224,655 | ) | | — | | | (2,600,553 | ) |
Exchange differences | | — | | — | | | — | | | — | | | (188,443 | ) | | 23,716 | | | — | | | (164,727 | ) |
Share of minority interests in profit for the year | | — | | — | | | — | | | — | | | — | | | 185,613 | | | — | | | 185,613 | |
Other | | — | | 143,096 | | | — | | | — | | | — | | | (73,314 | ) | | — | | | 69,782 | |
| | | | | | | | | | | | | | | | | | | | | | | |
Balances at 31 December 2004 | | 1,661,518 | | 7,427,737 | | | 2,922,596 | | | (35,846 | ) | | 2,106,914 | | | 737,539 | | | (1,015,195 | ) | | 13,805,263 | |
| | | | | | | | | | | | | | | | | | | | | | | |
31. Capital stock
At December 31, 2005, the capital of Banco Bilbao Vizcaya Argentaria, S.A. amounted to EUR 1,661,517,501.07, and consisted of 3,390,852,043 fully subscribed and paid registered shares of EUR 0.49 par value each.
There were no variations in capital in the year from January 1 and December 31, 2005. In February 2004, as a result of the tender offer launched on 40.6% of the capital stock of BBVA Bancomer, S.A., capital was increased through the issuance of 195,000,000 shares, with a price per share of €10.25 (consisting of a par value of €0.49 and additional paid-in capital of €9.76).
The shares of Banco Bilbao Vizcaya Argentaria, S.A. are quoted on the computerized trading system of the Spanish stock exchanges and on the New York, Frankfurt, London, Zurich and Milan stock markets, and on 19 August 2005 were admitted for listing on the Mexican stock market.
Also, at December 31, 2005, the shares of BBVA Banco Continental, S.A., Banco Provincial C,A,, BBVA Colombia, S.A., BBVA Chile, S.A., BBVA Banco Francés, S.A. and AFP Provida were quoted on their respective local stock markets and, in the case of the last two entities, on the New York Stock Exchange.
In addition, BBVA Banco Francés, S.A. is quoted on the Latin-American market of the Madrid Stock Exchange.
On May 16, 2005, the Board of Directors of BBVA Chile resolved to delist BBVA Chile from the New York Stock Exchange
F-86
At December 31, 2005, no individual shareholder owned more than 5% of the capital of the Bank.
At the Annual General Meeting on February 28, 2004 the shareholders resolved to delegate to the Board of Directors, in accordance with Article 153.1.b) of the Spanish Corporations Law, the power to increase capital, on one or several occasions, by a maximum par value equal to 50% of the Company’s subscribed and paid capital at the date of the resolution, i.e. EUR 830,758,750.54. The legally stipulated year within which the directors can carry out this increase is five years. At December 31, 2005, the Board of Directors had not made use of this power.
At December 31, 2005, the resolutions adopted by the shareholders at the Annual General Meetings on March 1, 2003 and March 9, 2002 were still in force. These resolutions authorized the issuance of up to EUR 6,000 million of debentures convertible to and/or exchangeable for Bank shares and empowered the Board of Directors to issue, on one or several occasions, warrants on shares of the Company up to a maximum of EUR 1,500 million, fully or partially convertible to or exchangeable for Company shares. At December 31, 2005, no issues had been made under these authorisations.
At the BBVA Special General Meeting held on June 14, 2005 the shareholders resolved to increase the Bank’s capital by a par value of EUR 260,254,745.17 to cater for the consideration established in the tender offer for the acquisition of up to 2,655,660,664 ordinary shares of Banca Nazionale del Lavoro S.p.A. and delegated to the Board of Directors the power to carry out the capital increase within a maximum year of one year from the date of the resolution. At December 31, 2005, this capital increase had not taken place.
In addition to the aforementioned resolutions, at the Annual General Meetings held in February 2004 and February 2005, the shareholders authorized the Board of Directors, for a year of five years, to issue fixed-income securities of any class or type, up to a maximum of EUR 121,750 million.
At December 31, 2005, there were no significant capital increases in progress at any of the Group companies.
32. Share premium
The balance of this heading in the consolidated balance sheet amounts to EUR 6,658,390 thousand and includes, inter alia, the amounts of the share premiums arising from the capital increases and the surpluses arising from the merger of Banco Bilbao, S.A. and Banco Vizcaya, S.A., amounted to EUR 641,142 thousands.
The revised Spanish Corporations Law expressly permits the use of the share premium balance to increase capital and establishes no specific restrictions as to its use.
33. Reserves
The breakdown of the balance of this heading in the accompanying consolidated balance sheets is as follows:
| | | | | |
| | | Thousands of Euros | |
| | | 2005 | | 2004 | |
Legal reserve | | 332,303 | | 313,194 | |
Restricted reserve for retired capital | | 87,918 | | 87,918 | |
Restricted reserve for Parent Company shares | | 356,821 | | 20,826 | |
Restricted reserve for redenomination of capital in euros | | 1,861 | | 1,861 | |
Revaluation Royal Decree-Law 7/1996 | | 176,281 | | 176,281 | |
| | |
Voluntary reserves | | 1,046,670 | | 1,277,638 | |
Consolidation reserves attributed to the Bank and dependents companies | | 170,163 | | (1,132,584 | ) |
| | | | | |
Total | | 2,172,158 | | 745,134 | |
| | | | | |
F-87
33.1. Legal reserve:
Under the revised Corporations Law, 10% of profit for each year must be transferred to the legal reserve until the balance of this reserve reaches 20% of capital. This limit had already been reached by Banco Bilbao Vizcaya Argentaria, S.A. at December 31, 2005. The legal reserve can be used to increase capital provided that the remaining reserve balance does not fall below 10% of the increased capital amount.
Except as mentioned above, until the legal reserve exceeds 20% of capital, it can only be used to offset losses, provided that sufficient other reserves are not available for this purpose.
33.2. Restricted reserves:
Pursuant to the revised Corporations Law and to Law 46/1998 on the introduction of the euro, the respective restricted reserves were recorded in relation to treasury shares held by the Group, customer loans secured by Bank shares, the reduction of the par value of each share in April 2000 and the redenomination of capital in euros.
33.3. Revaluation Royal Decree-Law 7/1996 (Asset revaluations):
Prior to the merger, Banco de Bilbao, S.A. and Banco de Vizcaya, S.A. availed themselves of the asset revaluation provisions of the applicable enabling legislation. In addition, on December 31, 1996, the Bank revalued its tangible assets pursuant to Royal Decree-Law 7/1996 by applying the maximum coefficients authorized, up to the limit of the market value arising from the existing measurements. The resulting increases in the cost and accumulated depreciation of tangible assets and, where appropriate, in the cost of equity securities, were allocated as follows:
| | | |
| | | Thousands of Euros 2005 | |
Legal revaluations of tangible assets:: | | | |
Cost | | | |
Less - | | 186,692 | |
Single revaluation tax (3%) | | (5,601 | ) |
Balance at December 31, 1999 | | 181,091 | |
Adjustment as a result of review by the tax authorities in 2000 | | (4,810 | ) |
| | | |
Total | | 176,281 | |
| | | |
Following the review of the balance of the account Revaluation Reserve Royal Decree-Law 7/1996 by the tax authorities in 2000, this balance can only be used, free of tax, to offset recorded losses and to increase capital through January 1, 2007. From that date, the remaining balance of this account can also be taken to unrestricted reserves, provided that the surplus has been depreciated or the revalued assets have been transferred or derecognised. If this balance were used in a manner other than that described above, it would be subject to tax.
F-88
33.4 Reserves and losses at consolidated companies:
The breakdown, by company or corporate group, of the balances of these headings in the accompanying consolidated balance sheets is as follows:
| | | | | | |
| | | Thousands of Euros | |
| | | 2005 | | | 2004 | |
Fully and proportionately consolidated companies: | | 5,382,488 | | | 4,102,068 | |
| | |
BBVA Bancomer Group | | 2,228,304 | | | 1,752,690 | |
BBVA Continental Group | | 84,936 | | | 66,868 | |
Provida Group | | 231,836 | | | 235,555 | |
BBVA Colombia Group | | 181,438 | | | 159,783 | |
BBVA Banco Francés Group | | 367,701 | | | 338,750 | |
BBVA Chile Group | | (2,849 | ) | | 1,439 | |
BBVA Banco Provincial Group | | 146,566 | | | 102,756 | |
Banco Bilbao Vizcaya Argentaria Uruguay, S.A. | | (464 | ) | | 2,538 | |
BBVA International Investment Corporation | | (432,772 | ) | | (423,816 | ) |
Banc International D’Andorra, S.A. | | 141,733 | | | 103,257 | |
Banco Bilbao Vizcaya Argentaria (Portugal), S.A. | | (100,472 | ) | | (106,397 | ) |
Banco Bilbao Vizcaya Argentaria Puerto Rico | | 183,272 | | | 168,651 | |
BBVA Suiza (BBVA Switzerland) | | 145,860 | | | 121,679 | |
BBVA Seguros, S.A. | | 230,428 | | | 70,024 | |
Finanzia, Banco de Crédito, S.A. | | 71,880 | | | 61,212 | |
Banco Industrial de Bilbao, S.A. | | 87,067 | | | 85,101 | |
BBVA Privanza Bank (Jersey), Ltd. | | 66,957 | | | 64,787 | |
BBVA Luxinvest, S,A | | 699,585 | | | 688,489 | |
Cartera e Inversiones S.A., Cia, De | | 238,309 | | | 44,361 | |
Corporación General Financiera, S.A. | | 458,307 | | | 393,429 | |
Corporación Industrial y Servicios, S.L. | | 27,948 | | | 110,150 | |
Cidessa UNO, S.L. | | 67,362 | | | 71,002 | |
BBVA Ireland, P.L.C. | | 71,071 | | | 61,917 | |
Bilbao Vizcaya América B,V, | | (266,936 | ) | | (217,321 | ) |
BBVA Cartera de Inversiones | | 58,220 | | | 56,405 | |
Anida Grupo Inmobiliario | | 189,292 | | | 184,575 | |
BBVA Pensiones Chile, S.A. | | 13,139 | | | (53,619 | ) |
Compañía Chilena de Inversiones | | (61,423 | ) | | (68,710 | ) |
BBVA Puerto Rico Holding Corporation | | (165,288 | ) | | (165,264 | ) |
SEAF, Sociedad de Estudios y Análisis Financieros S,A | | 59,648 | | | 59,129 | |
BBV América,S.L. | | 247,958 | | | 161,748 | |
Bilbao Vizcaya Holding, S.A. | | 24,096 | | | 9,269 | |
BBVA Renting, S.A. | | 49,557 | | | 38,715 | |
Corporación Alimentación y Bebidas, S.A. | | 18,532 | | | 10,470 | |
BBVA Factoring E,F,C, S.A. | | 44,576 | | | 33,441 | |
BBVA Patrimonios Gestora, SGIIC, S.A. | | 19,447 | | | 10,609 | |
Almacenes Generales de Depósitos, S.A.E, DE | | 82,195 | | | 26,175 | |
Banco,de Crédito Local, S.A. | | (263,601 | ) | | (267,153 | ) |
BBVA Participaciones Internacional, S.L. | | 42,829 | | | 37,726 | |
Anida Desarrollos Inmobilarios ,S.L. | | 22,427 | | | (37,731 | ) |
Ibertrade, LTD. | | (53,960 | ) | | (41,948 | ) |
Other | | 127,777 | | | 151,327 | |
| | |
Companies accounted for using the equity method: | | 238,915 | | | 300,941 | |
Onexa, S.A. De C.V. | | (324 | ) | | (21,006 | ) |
Banca Nazionale de Lavoro, S.p.A. | | (124,882 | ) | | 66,084 | |
Corporación IBV Participaciones Empresariales, S.A. | | 298,098 | | | 197,603 | |
Tubos Reunidos, S.A. | | 49,653 | | | 47,964 | |
Other | | 16,370 | | | 10,296 | |
| | | | | | |
Total | | 5,621,403 | | | 4,403,009 | |
| | | | | | |
F-89
For the purpose of allocating the reserves and accumulated losses at consolidated companies shown in the foregoing table, the transfers of reserves arising from the dividends paid and the writedowns or transactions between these companies are taken into account in the year in which they took place.
In the individual financial statements of the subsidiaries giving rise to the balances recorded under the heading Reserves and Losses at Consolidated Companies—Fully and Proportionately Consolidated Companies” shown in the foregoing table, at December 31, 2005 and 2004, EUR 1,556,797 thousand and EUR 1,162,989 thousand were treated as restricted reserves, all of which are reflected as restricted reserves for Parent Company shares.
34. Treasury shares
In 2005 and 2004 the Group companies performed the following transactions involving Bank shares:
| | | | | | |
| | | Number of Shares | | | Thousand of Euros | |
Balance at December 31, 2003 | | 7,493,411 | | | 82,001 | |
+ Purchases | | 277,652,703 | | | 3,213,465 | |
- Sales | | (282,272,150 | ) | | (3,266,937 | ) |
+/- Other | | | | | 7,317 | |
Balance at December 31, 2004 | | 2,873,964 | | | 35,846 | |
+ Purchases | | 279,496,037 | | | 3,839,510 | |
- Sales | | (274,760,734 | ) | | (3,756,669 | ) |
+/- Other | | | | | (5,976 | ) |
Balance at December 31, 2005 | | 7,609,267 | | | 112,711 | |
| | | | | | |
Balance of options sold on BBVA shares | | | (16,390 | ) |
| | | | | | |
TOTAL | | | 96,321 | |
| | | | | | |
The average purchase price of the Bank’s shares in 2005 was EUR 13.74 per share and the average selling price of the Bank’s shares in 2005 was EUR 13.80 per share.
The net gains or losses on transactions with shares issued by the Bank were recognised in equity under the heading Reserves. At December 31, 2005, the gains on transactions involving treasury shares amounted to EUR 34,234 thousand.
35. Tax matters
Pursuant to current legislation, the Consolidated Tax Group includes Banco Bilbao Vizcaya Argentaria, S.A., as the Parent, and the Spanish subsidiaries that meet the requirements provided for in Spanish legislation regulating the taxation of the consolidated profits of corporate groups.
The Group’s other banks and subsidiaries file individual tax returns in accordance with the tax legislation in force in each country.
| b) | Years open for review by the tax authorities |
At December 31, 2005 and 2004, the Consolidated Tax Group had 2001 and subsequent years open for review by the tax authorities for the main taxes applicable to it.
F-90
In general, the other Spanish consolidated companies, except for those at which the statute-of-limitations year has been interrupted by the commencement of a tax audit, have the last four years open for review by the tax authorities for the main taxes applicable to them.
In 2005, as a result of the tax audit conducted by the tax authorities, tax assessments were issued against several Group companies for the years up to and including 2000, some of which were signed on a contested basis. After considering the temporary nature of certain of the items assessed, the amounts, if any, that might arise from these assessments were provisioned in full in at 2005 year-end.
In view of the varying interpretations that can be made of the applicable tax legislation, the outcome of the tax audits of the open years that could be conducted by the tax authorities in the future could give rise to contingent tax liabilities which cannot be objectively quantified at the present time. However, the Banks’ Board of Directors and its tax advisers consider that the possibility of these contingent liabilities becoming actual liabilities is remote and, in any case, the tax charge which might arise therefrom would not materially affect the Group’s consolidated financial statements.
The reconciliation of the corporation tax expense resulting from the application of the standard tax rate to the corporation tax expense recognised is as follows:
| | | | | | |
| | | Thousands of Euros | |
| | | 2005 | | | 2004 | |
Corporation tax at 35% | | 1,957,114 | | | 1,447,894 | |
| | | | | | |
Decreases due to permanent differences: | | | | | | |
Tax credits and tax relief at consolidated Companies | | (360,446 | ) | | (501,273 | ) |
Other items, net | | 10,837 | | | 250,572 | |
Net increases (decreases) due to temporary differences | | (263,481 | ) | | 80,231 | |
Charge for income tax and other taxes | | 1,344,024 | | | 1,277,424 | |
Deferred tax assets and liabilities recorded (utilised) | | 263,481 | | | (80,231 | ) |
Income tax and other taxes accrued in the year | | 1,607,505 | | | 1,197,193 | |
Adjustments to prior years’ income tax and other Taxes | | (86,324 | ) | | (168,562 | ) |
| | | | | | |
Income tax and other taxes | | 1,521,181 | | | 1,028,631 | |
| | | | | | |
The effective tax rate is as follows:
| | | | | | |
| | | Thousands of Euros | |
| | | 2005 | | | 2004 | |
Consolidated Tax Group | | 2,771,398 | | | 2,651,930 | |
Other Spanish entities | | 56,277 | | | 54,593 | |
Foreign entities | | 2,764,078 | | | 1,430,317 | |
| | 5,591,753 | | | 4,136,840 | |
Income tax | | 1,521,181 | | | 1,028,631 | |
| | | | | | |
Effective tax rate | | 27,20 | % | | 24,87 | % |
| | | | | | |
F-91
d) Tax recognised in equity
In addition to the income tax recognised in the consolidated income statements, in 2005 and 2004 the Group recognised the following amounts in consolidated equity:
| | | | | | |
| | | Thousands of Euros | |
| | | 2005 | | | 2004 | |
Charges to equity | | | | | | |
| | |
Fixed-income portfolio | | (179,245 | ) | | (197,278 | ) |
Equity portfolio | | (1,018,056 | ) | | (881,992 | ) |
| | |
Credits to equity | | | | | | |
Other | | 55,796 | | | — | |
| | | | | | |
Total | | (1,141,505 | ) | | (1,079,270 | ) |
| | | | | | |
e) Deferred taxes
The balance of the heading Tax Assets in the consolidated balance sheets includes the tax receivables relating to deferred tax assets; in turn, the balance of the heading Tax Liabilities includes the liability relating to the Group’s various deferred tax liabilities.
The detail of these balances is as follows:
| | | | | | |
| | | Thousands of Euros | |
| | | 2005 | | | 2004 | |
Deferred tax assets: | | 6,420,745 | | | 5,590,696 | |
| | | | | | |
Of which: | | | | | | |
Pensions commitments | | 1,645,126 | | | 1,289,825 | |
Portfolio | | 1,129,248 | | | 1,196,557 | |
Loan loss provisions | | 1,195,382 | | | 1,431,655 | |
Tax losses and other | | 1,300,780 | | | 1,657,077 | |
| | | | | | |
Deferred tax liabilities: | | 2,100,023 | | | 1,620,795 | |
| | | | | | |
Of which: | | | | | | |
Free depreciation and other | | (1,218,567 | ) | | (1,170,362 | ) |
f) Tax assessments issued to BBVA Seguros, S.A. and Senorte Vida y Pensiones, S.A
In 1990, 1994 and 1995, tax assessments for 1986 to 1990 were issued to BBVA Seguros, S.A. (formerly Euroseguros, S.A.) and Senorte Vida y Pensiones, S.A. totalling EUR 88,066 thousand of principal and EUR 39,072 thousand of late-payment interest, plus EUR 66,057 thousand of penalties, after correction pursuant to the revised General Tax Law. The companies filed pleadings and appeals against the assessments and several administrative decisions and court rulings were handed down in 1997 through 2000. As a result of application of the criteria set forth in these court rulings, some of which have been appealed against by the Group and by the Spanish tax authorities, the tax debts would be reduced to EUR 50,677 thousand of principal and EUR 19,851 thousand of interest. In order to file these appeals, the Bank provided guarantees totalling EUR 97,876 thousand to the tax authorities. In 2003 further court rulings were handed down, which have been appealed against. However, the Bank’s directors and legal advisers consider that, in any case, the possible effects of these rulings would not materially affect the consolidated financial statements and, additionally, in accordance with the accounting principle of prudence, adequate provisions have been recorded therefor. Lastly, in 2005 the check relating to Senorte Vida y Pensiones was completed with no material effect on the Group.
F-92
36. Residual maturity of transactions
Following is a detail, by maturity, of the balances of certain headings in the consolidated balance sheets at December 31, 2005:
| | | | | | | | | | | | | | |
| | | Thousand of euros |
| | | Total | | Demand | | Up to 1
Month | | 1 to 3 3 Months | | 3 to 12 Months | | 1 to 5 Years | | Over 5 Years |
ASSETS - | | | | | | | | | | | | | | |
Cash and balances with central banks | | 12,341,317 | | 2,408,841 | | 9,932,476 | | — | | — | | — | | — |
Loans and receivables: | | | | | | | | | | | | | | |
Of Which: | | | | | | | | | | | | | | |
| | | | | | | |
Loans and advances to credit Institutions | | 27,470,224 | | 920,809 | | 14,406,234 | | 7,074,788 | | 3,600,686 | | 1,255,227 | | 212,480 |
| | | | | | | |
Loans and advances to other debtors | | 216,850,480 | | 1,957,316 | | 20,319,977 | | 19,169,107 | | 32,436,869 | | 56,711,286 | | 86,255,924 |
Other financial assets | | 2,784,054 | | 2,784,054 | | — | | — | | — | | — | | — |
Fixed income portfolio | | 81,726,639 | | — | | 2,630,394 | | 5,260,788 | | 18,341,691 | | 32,144,671 | | 23,349,094 |
| | | | | | | | | | | | | | |
LIABILITIES - | | | | | | | | | | | | | | |
Financial liabilities at amortised cost: | | | | | | | | | | | | | | |
Deposits from central banks | | 21,189,193 | | 11,872,272 | | 9,316,921 | | — | | — | | — | | — |
Deposits from credit institutions | | 45,125,943 | | 5,095,717 | | 25,207,663 | | 9,072,826 | | 3,280,331 | | 1,959,966 | | 509,441 |
Money market operations through Counterparties | | 23,252 | | — | | 23,252 | | — | | — | | — | | — |
Deposits from other creditors | | 182,635,181 | | 83,166,800 | | 34,282,998 | | 8,893,767 | | 9,625,098 | | 46,127,859 | | 538,659 |
Debt certificates including bonds | | 62,841,755 | | — | | 5,977,138 | | 29,117,419 | | 2,708,442 | | 16,326,244 | | 8,712,512 |
Subordinated liabilities | | 13,723,232 | | — | | — | | 628,459 | | 510,270 | | 947,181 | | 11,637,352 |
Other financial liabilities | | 3,966,664 | | 3,966,664 | | — | | — | | — | | — | | — |
37. Fair value of assets and liabilities
Following is a comparison of the carrying amounts of the Group’s financial assets and liabilities and their respective fair values at year-end:
| | | | |
2005 Thousand of euros | | Book value | | Fair Value |
Assets | | | | |
CASH AND BALANCES WITH CENTRAL BANKS | | 12,341,317 | | 12,341,317 |
FINANCIAL ASSETS HELD FOR TRADING | | 44,011,781 | | 44,011,781 |
OTHER FINANCIAL ASSETS AT FAIR VALUE THROUGH PROFIT OR LOSS | | 1,421,253 | | 1,421,253 |
AVAILABLE-FOR-SALE FINANCIAL ASSETS | | 60,033,988 | | 60,033,988 |
LOANS AND RECEIVABLES | | 249,396,647 | | 249,514,581 |
HELD-TO-MATURITY INVESTMENTS | | 3,959,265 | | 4,035,248 |
HEDGING DERIVATIVES | | 3,912,696 | | 3,912,696 |
| | |
Liabilities | | | | |
FINANCIAL LIABILITIES HELD FOR TRADING | | 16,270,865 | | 16,270,865 |
OTHER FINANCIAL LIABILITIES AT FAIR VALUE THROUGH PROFIT OR LOSS | | 740,088 | | 740,088 |
FINANCIAL LIABILITIES AT AMORTISED COST | | 329,505,250 | | 323,015,482 |
HEDGING DERIVATIVES | | 2,870,086 | | 2,870,086 |
F-93
| | | | |
2004 Thousand of euros | | Book value | | Fair Value |
Assets | | | | |
CASH AND BALANCES WITH CENTRAL BANKS | | 10,123,090 | | 10,123,090 |
FINANCIAL ASSETS HELD FOR TRADING | | 47,036,060 | | 47,036,060 |
OTHER FINANCIAL ASSETS AT FAIR VALUE THROUGH PROFIT OR LOSS | | 1,059,490 | | 1,059,490 |
AVAILABLE-FOR-SALE FINANCIAL ASSETS | | 53,003,545 | | 53,003,545 |
LOANS AND RECEIVABLES | | 196,892,203 | | 197,226,006 |
HELD-TO-MATURITY INVESTMENTS | | 2,221,502 | | 2,264,421 |
HEDGING DERIVATIVES | | 4,723,450 | | 4,723,450 |
| | |
Liabilities | | | | |
FINANCIAL LIABILITIES HELD FOR TRADING | | 14,134,413 | | 16,270,865 |
OTHER FINANCIAL LIABILITIES AT FAIR VALUE THROUGH PROFIT OR LOSS | | 834,350 | | 740,088 |
FINANCIAL LIABILITIES AT AMORTISED COST | | 275,583,527 | | 274,821,153 |
HEDGING DERIVATIVES | | 3,131,572 | | 3,131,572 |
38. Financial guarantees and drawable by third parties
The memorandum items Contingent Exposures and Contingent Commitments in the consolidated balance sheets include the amounts that would be payable by the consolidated entities on behalf of third parties if the parties originally obliged to pay fail to do so, in connection with the commitments assumed by those entities in the course of their ordinary business.
The breakdown of the balances of these items at December 31, 2005 and 2004 is as follows:
| | | | |
| | | Thousands of Euros |
| | | 2005 | | 2004 |
Contingent exposures- | | 29,861,597 | | 21,557,649 |
Collateral, bank guarantees and indemnities | | 25,789,616 | | 17,573,555 |
Rediscounts, endorsements and acceptances | | 41,742 | | 38,921 |
Other | | 4,030,239 | | 3,945,173 |
| | |
Contingent Commitments- | | 89,498,392 | | 66,762,402 |
Drawable by third parties: | | 85,001,452 | | 60,716,878 |
Credit institutions | | 2,816,351 | | 2,665,031 |
General government sector | | 3,127,773 | | 1,637,821 |
Other resident sectors | | 36,062,799 | | 29,617,468 |
Non-resident sector | | 42,994,529 | | 26,796,558 |
Other commitments | | 4,496,940 | | 6,045,524 |
| | | | |
Total | | 119,359,989 | | 88,320,051 |
| | | | |
Since a significant portion of these amounts will reach maturity without any payment obligation materializing for the consolidated companies, the aggregate balance of these commitments cannot be considered as an actual future requirement for financing or liquidity to be provided by the Group to third parties.
Income from the guarantee instruments is recorded under the heading Fee and Commission Income in the consolidated income statement and is calculated by applying the rate established in the related contract to the nominal amount of the guarantee.
F-94
39. Assets assigned to other own and third-party obligations
At December 31, 2005 and 2004, the face amount of the assets owned by the consolidated entities pledged as security for own transactions, amounted to €64,440,394 thousand and €52,768,086 thousand, respectively, and related basically to the pledge of certain assets as security for financing liabilities with the Bank of Spain and to a portion of the assets asigned to mortgage bond issues, which pursuant to the Mortgage Market Law are admitted as security for obligation to third parties.
At December 31, 2005, there are no assets assigned to third-party obligations. At December 31, 2004, the balance of this caption amounted to €5,215 thosand.
40. Other contingent assets
As of December 31, 2005 and 2004, there are not significant contingent assets registered in consolidated financial statements attached.
41 Purchase and sale commitments
The financial instruments sold with a commitment to subsequently repurchase them are not derecognized from the consolidated balance sheets and the amount received from the sale is considered financing from third parties.
At December 31, 2005 and 2004, the consolidated entities had sold financial assets totalling EUR 48,311,628 thousand and EUR 37,836,241 thousand, respectively, with a commitment to subsequently repurchase them, and had purchased financial assets totalling EUR 13,636,016 thousand and EUR 6,718,828 thousand, respectively, with a commitment to subsequently resell them.
42. Transactions for the account of third parties
The detail of the most significant items composing this heading is as follows:
| | | | |
| | | Thousands of Euros |
| | | 2005 | | 2004 |
Financial instruments entrusted by third parties | | 502,274,442 | | 448,515,742 |
Asset transfers | | 7,055,351 | | 4,069,224 |
Derecognised in full from the balance sheet | | 1,587,209 | | 2,096,440 |
Retained in full on the balance sheet | | 5,468,142 | | 1,972,784 |
Conditional bills and other securities received for collection | | 3,765,253 | | 3,879,312 |
Off-balance-sheet customer funds | | | | |
Managed by the Group | | 143,888,172 | | 124,498,577 |
- Investment companies and mutual funds | | 59,002,787 | | 51,040,176 |
- Pension funds | | 53,958,782 | | 41,490,401 |
- Customer portfolios managed on a discretionary basis | | 30,926,603 | | 31,968,000 |
| | | | |
Total | | 656,983,218 | | 581,227,053 |
| | | | |
43. Interest and similar income
The breakdown of the most significant interest and similar income earned by the Group in 2005 and 2004 is as follows:
| | | | | |
| | | Thousands of Euros | |
| | | 2005 | | 2004 | |
Central banks | | 458,272 | | 275,282 | |
Loans and advances to credit institutions | | 713,779 | | 747,330 | |
Loans and advances to other debtors: | | 10,190,534 | | 7,809,691 | |
General government | | 436,905 | | 393,969 | |
Resident sector | | 4,852,472 | | 4,298,604 | |
Non-resident sector | | 4,901,157 | | 3,117,118 | |
Debt securities | | 3,624,304 | | 3,310,590 | |
Rectification of income as a result of hedging transactions | | 530,136 | | (31,843 | ) |
Other income | | 330,649 | | 241,288 | |
| | | | | |
Total | | 15,847,674 | | 12,352,338 | |
| | | | | |
F-95
44 Interest expense and similar charges
The breakdown of the balance of this heading in the accompanying consolidated income statements is as follows:
| | | | | | |
| | | Thousands of Euros | |
| | | 2005 | | | 2004 | |
Bank of Spain and other central banks | | 288,006 | | | 287,884 | |
Deposits from credit institutions | | 1,985,215 | | | 1,499,735 | |
Deposits from other creditors | | 4,070,843 | | | 2,962,928 | |
Debt certificates (including bonds) | | 2,454,517 | | | 1,913,658 | |
Promissory notes, bills and debt securities | | 1,898,396 | | | 1,374,631 | |
Subordinated liabilities | | 556,121 | | | 539,027 | |
Rectification of expenses as a result of hedging transactions | | (303,826 | ) | | (546,747 | ) |
Cost attributable to pension funds (Note 2.f) | | 255,370 | | | 210,342 | |
Other charges | | 182,075 | | | 120,144 | |
| | | | | | |
Total | | 8,932,200 | | | 6,447,944 | |
| | | | | | |
45. Income from equity instruments
The amount recorded under this heading relates in full to dividends from other shares and equity instruments, which amounted to EUR 292,495 thousand at December 31, 2005 and EUR 255,146 thousand at December 31, 2004.
46. Fee and commission income
The breakdown of the balance of this heading in the accompanying consolidated statements of income is as follows:
| | | | |
| | | Thousands of Euros |
| | | 2005 | | 2004 |
Commitment fees | | 50,130 | | 40,875 |
Contingent liabilities | | 176,745 | | 159,484 |
Documentary credits | | 31,418 | | 26,875 |
Bank and other guarantees | | 145,327 | | 132,609 |
Arising from exchange of foreign currencies and banknotes | | 17,752 | | 16,589 |
Collection and payment services | | 2,018,500 | | 1,732,119 |
Securities services | | 1,947,746 | | 1,739,055 |
Counselling on and management of one-off transactions | | 16,423 | | 14,906 |
Financial and similar counselling services | | 10,790 | | 6,482 |
Factoring transactions | | 18,815 | | 17,041 |
Non-banking financial products sales | | 40,424 | | 46,388 |
Other fees and commissions | | 371,799 | | 284,042 |
| | | | |
Total | | 4,669,124 | | 4,056,981 |
| | | | |
F-96
47 Fee and commission expenses
The breakdown of the balance of this heading in the accompanying consolidated income statements is as follows:
| | | | |
| | | Thousands of Euros |
| | | 2005 | | 2004 |
Brokerage fees on lending and deposit transactions | | 12,843 | | 8,449 |
Fees and commissions assigned to third parties | | 519,302 | | 429,884 |
Other fees and commissions | | 196,983 | | 205,626 |
| | | | |
Total | | 729,128 | | 643,959 |
| | | | |
48 Insurance activity income
This heading in the accompanying consolidated income statement reflects the contribution of the consolidated insurance and reinsurance companies to the Group’s gross income. The detail of the balance of this heading is as follows:
| | | | | | |
| | | Thousands of Euros | |
| | | 2005 | | | 2004 | |
Premium income | | 2,916,831 | | | 2,062,030 | |
Finance income | | 904,318 | | | 708,901 | |
Reinsurance premiums paid | | (63,403 | ) | | (71,931 | ) |
Benefits paid and other insurance-related expenses | | (1,785,514 | ) | | (1,704,113 | ) |
Finance expense | | (255,254 | ) | | (199,059 | ) |
Net provisioning expense | | (1,274,283 | ) | | (413,744 | ) |
Recoveries of insurance expenses and other revenues | | 44,228 | | | 8,534 | |
| | | | | | |
Total | | 486,923 | | | 390,618 | |
| | | | | | |
49. Gains/Losses on financial assets and liabilities
The detail of the balance of this heading in the accompanying consolidated income statements is as follows:
| | | | | | |
| | | Thousands of Euros | |
| | | 2005 | | | 2004 | |
Financial assets held for trading | | 897,484 | | | 1,110,551 | |
Financial assets at fair value through profit or loss | | 33,022 | | | 1,296 | |
Available-for-sale financial assets | | 428,560 | | | 974,412 | |
Loans and receivables | | 129,203 | | | 13,932 | |
Other operating assets | | (508,105 | ) | | (1,338,334 | ) |
| | | | | | |
Total | | 980,164 | | | 761,857 | |
| | | | | | |
F-97
The breakdown, by type, of the financial instruments which gave rise to the above balances is as follows:
| | | | | | |
| | | Thousands of Euros | |
| | | 2005 | | | 2004 | |
Debt instruments | | 48,354 | | | 346,232 | |
Equity instruments | | 1,111,223 | | | 817,505 | |
Loans and advances to other debtors | | 193,399 | | | — | |
Derivatives | | (415,128 | ) | | (455,172 | ) |
Deposits from other creditors | | (318 | ) | | — | |
Other | | 42,634 | | | 53,292 | |
| | | | | | |
Total | | 980,164 | | | 761,857 | |
| | | | | | |
50. Sales and income from the provision of non-financial services and cost of sales
These headings of the accompanying consolidated statements of income show, respectively, sales of assets and income from the provision of services that constitute the typical activity of non-financial consolidated entities forming part of the Group and the related costs of sales. The main lines of business of these entities are as follows:
| | | | | | | | |
| | | Thousands of Euros |
| | | 2005 | | 2004 |
| | | Sales/ Income | | Cost of Sales | | Sales/ Income | | Cost of
Sales |
Real estate | | 285,323 | | 214,763 | | 226,296 | | 132,455 |
Services and other | | 291,050 | | 235,831 | | 241,940 | | 209,290 |
| | | | | | | | |
Total | | 576,373 | | 450,594 | | 468,236 | | 341,745 |
| | | | | | | | |
51. Personnel expenses
The detail of the balance of this heading in the accompanying consolidated income statements is as follows:
| | | | |
| | | Thousands of Euros |
| | | 2005 | | 2004 |
Wages and salaries | | 2,743,684 | | 2,459,582 |
Social security costs | | 471,799 | | 436,651 |
Transfers to internal pension provisions (Note 2.2.f) | | 68,893 | | 58,982 |
Contributions to external pension funds (Note 2.2.f) | | 55,813 | | 57,419 |
Other personnel expenses | | 262,053 | | 234,416 |
| | | | |
Total | | 3,602,242 | | 3,247,050 |
| | | | |
The average number of employees in the Group, by professional category and country, was as follows:
| | | | |
| | | 2005 | | 2004 |
| Spanish banks | | | | |
| | |
- Executives | | 1,087 | | 1,054 |
- Other line personnel | | 21,807 | | 21,427 |
- Clerical staff | | 7,429 | | 7,954 |
- Abroad | | 674 | | 662 |
| | | | |
| | 30,997 | | 31,097 |
| Companies abroad | | | | |
| | |
- Mexico | | 24,721 | | 24,688 |
- Venezuela | | 5,568 | | 5,779 |
- Argentina | | 3,428 | | 3,396 |
- Colombia | | 3,487 | | 3,327 |
- Peru | | 2,358 | | 2,308 |
- Other | | 5,561 | | 4,483 |
| | | | |
| | 45,123 | | 43,981 |
Pension fund managers | | 7,078 | | 5,415 |
Other non-banking companies | | 7,546 | | 4,211 |
| | | | |
Total | | 90,744 | | 84,704 |
| | | | |
F-98
52. Other administrative expenses
The breakdown of the balance of this heading in the consolidated income statements is as follows:
| | | | |
| | | Thousands of Euros |
| | | 2005 | | 2004 |
Technology and systems | | 434,274 | | 411,524 |
Communications | | 202,578 | | 182,552 |
Advertising | | 211,677 | | 143,706 |
Property, fixtures and materials | | 415,421 | | 361,368 |
Taxes other than income tax | | 213,210 | | 152,775 |
Other expenses | | 683,318 | | 598,920 |
| | | | |
Total | | 2,160,478 | | 1,850,845 |
| | | | |
The heading Property, Fixtures and Materials includes expenses relating to operating leases of buildings amounting to EUR 157,804 thousand and EUR 139,241 thousand in 2005 and 2004, respectively. The consolidated companies do not expect to terminate the lease contracts early.
The balance of the heading Other Administrative Expenses in the foregoing table includes the audit fees paid by the Group companies to their respective auditors, the detail for 2005 being as follows:
| | |
| | | Thousands of Euros |
Audits of the companies audited by firms belonging to the Deloitte worldwide organisation | | 7,660 |
Other reports required pursuant to applicable legislation and tax regulations issued by the national supervisory bodies of the countries in which the Group operates, reviewed by firms belonging to the Deloitte worldwide organisation | | 1,205 |
Fees for audits conducted by other firms | | 2,385 |
The detail of the other services provided to the various Group companies in 2005 is as follows:
| | |
| | | Thousands of Euros |
Firms belonging to the Deloitte worldwide organisation | | 1,787 |
Other firms | | 5,428 |
F-99
53. Finance income and expenses from non-financial activities
The amount recorded under these headings relates in full to finance income and expenses from the Group’s real estate and renting companies and amounted to revision of services that constitute the typical activity of non-financial consolidated entities forming part of the Group and amounted to EUR 641 thousand and EUR 4,025 thousand at December 31, 2005 and 2004, respectively.
54. Other gains and other losses
The breakdown of the balances of these headings in the accompanying consolidated income statements is as follows:
| | | | |
| | | Thousands of Euros |
| | | 2005 | | 2004 |
Losses | | 208,279 | | 271,220 |
Net losses on fixed asset disposals | | 22,477 | | 22,450 |
Net losses on sales long-term investments due to write-downs | | 11,751 | | 9,127 |
Other losses | | 174,051 | | 239,643 |
| | |
Income | | 284,816 | | 622,180 |
Net gains on fixed asset disposals | | 107,838 | | 102,874 |
Net gains on sales of long-term investments | | 40,157 | | 317,510 |
Income from the provision of non-typical services | | 3,852 | | 4,733 |
Other income | | 132,969 | | 197,063 |
| | | | |
Total | | 76,537 | | 350,960 |
| | | | |
55. Transactions with non-consolidated associates and jointly controlled entities
55.1. Transactions with BBVA Group
The balances of the main aggregates in the consolidated financial statements arising from the transactions carried out by the Group with associated and jointly controlled companies (Note 2.1-b and c), which consist of ordinary business and financial transactions carried out on an arm’s-length basis, in 2005, are as follows:
| | | | |
| | | Thousands of euros |
| | | 2005 | | 2004 |
Assets: | | | | |
Due from credit institutions | | 4,636 | | 594 |
Total net lending | | 267,654 | | 227,206 |
| | |
Liabilities: | | | | |
Due to credit institutions | | 1,966 | | 134 |
Deposits | | 19,070 | | 47,208 |
Debt certificates (including bonds) | | 256,881 | | 82,363 |
| | |
Memorandum accounts: | | | | |
Contingent liabilities | | 35,218 | | 97,694 |
Commitments and contingents liabilities | | 44,133 | | 96,439 |
| | |
Statement of income: | | | | |
Financial Revenues | | 7,745 | | 6,230 |
Financial Expenses | | 5,569 | | 1,705 |
F-100
There are no other material effects on the financial statements of the Group arising from dealings with these companies, other than the effects arising from using the equity method (Note 2.1-c), and from the insurance policies to cover pension or similar commitments (Note 2.2-f).
At December 31, 2005 and 2004, the notional amount of the futures transactions arranged by the Group with the main related companies amounted to approximately EUR 7,619,019 thousand and EUR 5,047,704 thousand, respectively.
In addition, as part of its normal activity, the Group has entered into agreements and commitments of various types with shareholders of subsidiaries and associates, which have no material effects on the consolidated financial statements.
55.2. Transactions with key entity personnel
The information on the remuneration of key personnel (members of the Board of Directors of BBVA, S.A. and of the Management Committee) is included in Note 8.
The loans granted at December 31, 2005, to members of the Board of Directors of BBVA, S.A. totalled EUR 698 thousand. At December 31, 2005, no guarantees had been provided on their behalf.
The loans granted at December 31, 2005, to 18 members of the Management Committee, excluding the executive directors, amounted to EUR 4,249 thousand. At December 31, 2005, no guarantees had been provided on behalf of members of the Management Committee.
At December 31, 2005, the loans granted to parties related to key personnel (the aforementioned members of the Board of Directors of BBVA, S.A. and of the Management Committee) totalled EUR 10,324 thousand. At December 31, 2005, the other exposure to parties related to key personnel (guarantees, finance leases and commercial loans) amounted to EUR 22,712 thousand.
The demand and time deposits held on an arm’s length basis as part of BBVA’s ordinary banking business by directors, Management Committee members and their related parties totalled EUR 6,838 thousand at December 31, 2005.
In addition, BBVA and other Group companies, in the normal course of their business and in their capacity as financial institutions, habitually perform transactions with members of the Board of Directors of BBVA, S.A. and of the Management Committee and their respective related parties. All these transactions, which are scantly material, are conducted on an arm’s length basis.
The provisions recorded at December 31, 2005 to cover post-employment benefit obligations to the members of the Management Committee, excluding the executive directors, amounted to EUR 50,292 thousand, of which EUR 12,538 thousand were charged to 2005 income.
55.3. Transactions with other related parties
There are no other material transactions with other related parties.
56. Other information
On March 22, 2002, BBVA notified the supervisory authorities of the stock markets on which its shares are listed that the Bank of Spain had commenced a proceeding against BBVA and 16 of its former directors and executives. These proceedings arose as a result of the existence of funds belonging to BBV that were not included in the entity’s financial statements until they were voluntarily regularized by being recorded in the 2000 consolidated income statement as extraordinary income, for which the related corporation tax was recorded and paid. These funds totalled Ptas. 37,343 million (approximately EUR 225 million) and arose basically from the gains on the sale of shares of Banco de Vizcaya, S.A. and Banco Bilbao Vizcaya, S.A. from 1987 to 1992, and on the purchase and sale by BBV of shares of Argentaria, Caja Postal and Banco Hipotecario, S.A. in 1997 and 1998.
After dissolving the legal vehicles where the unrecorded funds were located and including the funds in its accounting records, BBVA notified the Bank of Spain of these matters on January 19, 2001. The Bank of Spain’s supervisory services commenced an investigation into the origin of the funds, their use and the persons involved, the findings of which were included in the supervisory services’ report dated March 11, 2002. On March 15, 2002, the Bank of Spain notified the Bank of the commencement of a proceeding relating to these events.
F-101
On May 22, 2002, the Council of the Spanish National Securities Market Commission (CNMV) commenced a proceeding against BBVA for possible contravention of the Securities Market Law (under Article 99 ñ) thereof) owing to the same events as those which gave rise to the Bank of Spain’s proceeding.
Since various court proceedings are in progress to determine the possible criminal liability of the persons involved in the aforementioned events, the conduct of the two administrative proceedings was stayed until the final court decision is handed down.
At the date of preparation of these consolidated financial statements, none of the persons party to the proceedings or prosecuted in relation to the events referred to above was a member of the Board of Directors or the Management Committee or held executive office at BBVA, BBVA is not party to the criminal proceedings and no charges or claim for liability have been levelled against the Bank.
The proceedings DP 161/00 initiated in 2000 relating to the alleged participation of certain BBVA Privanza Bank employees in purported tax offences resulting from the marketing of BBVA Privanza Jersey fiduciary products, as well as to the purported tax offence by BBVA, S.A. for not including in its balance sheet the net assets of Canal Trust Company (a wholly-owned subsidiary of BBVA Privanza) are still at the initial investigative stage.
The Group’s legal advisers do not expect the aforementioned administrative and criminal proceedings to have any material impact on the Bank.
57. Detail of the Directors’ holdings in companies with similar business activities
Pursuant to Article 127 ter. of the Spanish Corporations Law, introduced by Law 26/2003 of 17 July amending Securities Market Law 24/1988 of 28 July, and the revised Corporations Law, in order to reinforce the transparency of listed companies, set forth below are the companies engaging in an activity that is identical, similar or complementary to that which constitutes the corporate purpose of BBVA, in which the members of the Board of Directors have a direct or indirect ownership interest.
F-102
| | | | | | |
| | | Ownership Interest |
Surname(s) and First Name | | Company | | Number of Shares | | Type of Ownership
Interest |
Breeden, Richard C. | | — | | — | | — |
Bustamante y de la Mora, Ramón | | — | | — | | — |
Fernández Rivero, José Antonio | | — | | — | | — |
Ferrero Jordi, Ignacio | | Santander Central Hispano | | 10,800 | | Indirect |
| | Banco Popular Español | | 2,950 | | Indirect |
Goirigolzarri Tellaeche, José Ignacio | | — | | — | | — |
González Rodríguez, Francisco | | Bancoval | | 76,040 | | Indirect |
Knörr Borrás, Román | | Santander Central Hispano | | 14,724 | | Indirect |
Lacasa Suárez, Ricardo | | Banco Popular Español | | 91,440 | | Direct |
Loring Martínez de Irujo, Carlos | | — | | — | | — |
Maldonado Ramos, José | | — | | — | | — |
Medina Fernández, Enrique | | Banco Popular Español | | 3,212 | | Indirect |
| | Royal Bank of Scotland | | 754 | | Indirect |
| | Santander Central Hispano | | 3,659 | | Indirect |
Rodríguez Vidarte, Susana | | — | | — | | — |
San Martín Espinós, José María | | Santander Central Hispano | | 1,009 | | Direct |
Vilá Boix, Angel (Telefónica de España, S.A.) | | Banco Sabadell | | 3,125 | | Direct |
| | BNP Paribas | | 500 | | Direct |
F-103
58. Subsequent events
Acquisition of State National Bancshares Inc. and Texas Regional Bancshares Inc.
On June 12, 2006, BBVA reached agreements to acquire State National Bancshares Inc. and Texas Regional Bancshares Inc., both US banking groups domiciled in Texas. The acquisition price agreed for State National Bancshares Inc is of approximately $480 million while the acquisition price agreed for Texas Regional Bancshares Inc. is of approximately $2,164 million. In both cases, the acquisitions accomplishment is subject to the approval of the transaction by 2/3 of the capital represented in the general shareholders’ meetings of each entity as provided by the applicable legislation, as well as obtaining the necessary administrative authorizations.
These acquisitions will be funded by own sources and the gains obtained by the sales described below:
| | • | | On May 19, 2006, BBVA sold its stake in the share capital of Banca Nazionale del Lavoro, S.p.A. (BNL) to BNP Paribas, for a price of €1,299 million following it’s adhesion on May 12, 2006, as shareholder of BNL, to the public tender offer launched by BNP Paribas to acquire 100% of BNL’s capital. The sale gave rise to a gain of €568.3 million. |
| | • | | On June 14, 2006, BBVA sold its 5.04% capital share in Repsol YPF S.A. The selling procedure was executed through the closing and settlement of hedging equity swaps previously contracted. This sale gave rise to a gain of €523 million. |
Other events
On March 3, 2006, BBVA purchased 0.43% of BBVA Chile capital share for 2,318 million Chilean pesos (approximately €3.7 million), increasing BBVA’s capital share on BBVA Chile up to 67.05%. As the capital share of BBVA in BBVA Chile is higher than the two thirds of the total capital share, BBVA in compliance with the Chilean legislation launched a public offer for all of BBVA Chile capital share. The public offer was effective from April 3, 2006 until May 2, 2006. After the acceptance of the public offer by 1.13% of BBVA Chile capital share, BBVA’s capital share on BBVA Chile increased up to 68.18%.
On April 5, 2006, BBVA sold its stake of 51% in the share capital of Banc Internacional d´Andorra, S.A. to the rest of the shareholders of said entity, the Andorran founding partners of this bank, for a price of €395.15 million. This sale gave rise to a gain of €184.0 million.
59. DIFFERENCES BETWEEN IFRS AND UNITED STATES GENERALLY ACCEPTED ACCOUNTING PRINCIPLES AND OTHER REQUIRED DISCLOSURES.
As described in Note 1, the accompanying consolidated financial statements of the BBVA Group are presented in the formats stipulated by Bank of Spain Circulars and were prepared by applying the generally accepted accounting principles for International Financial Reporting Standards (IFRSs), endorsed by the European Union pursuant to Regulation (EC) Nº 1606/2002 of the European Parliament of the Council of 19 July 2002. Such formats and accounting principles vary in certain respects from those generally accepted in the United States (“U.S. GAAP”). Our consolidated financial statements as of December 31, 2005 and 2004 would not present any difference had the standards issued by the International Accounting Standards Board (IASB) been applied instead of those endorsed by the EU.
Following is a summary of the main differences between IFRS and U.S. generally accepted accounting principles:
| | |
• Net income and Stockholders’ Equity reconciliation between IFRS and U.S. GAAP | | A |
| |
• Consolidated Financial Statements | | B |
| |
• Additional information required by U.S. GAAP | | C |
The preparation of these financial statements requires management to make estimates and assumptions that affect the reported amounts and allocations of assets and liabilities and disclosures of contingent assets and liabilities and the reported amounts of revenues and expenses during the reported period. Actual results could differ from those estimated but any difference should not be material.
F-104
IFRS 1First-time adoption provides first-time adopters of IFRS with a number of exemptions and exceptions from full retrospective application (see Note 3). Net income and stockholders’ equity under IFRSs and the reconciling item to U.S. GAAP shown below would have been different if IFRSs had been applied fully retrospectively.
(59.A) NET INCOME AND STOCKHOLDERS’ EQUITY RECONCILIATION BETWEEN IFRS AND U.S. GAAP.
Accounting practices used by the Bank in preparing the consolidated financial statements conform with IFRS, but do not conform with U.S. GAAP. A summarized reconciliation of stockholders’ equity as of December 31, 2005 and 2004 and net income for the years 2005 and 2004 to U.S. GAAP is set forth below.
The following tables set forth the adjustments to consolidated net income and to consolidated stockholders’ equity which would be required if U.S. GAAP had been applied to the accompanying consolidated financial statements:
| | | | | | | | |
| | | Item # | | Increase (Decrease) Year
Ended December 31, | |
| | | | 2005 | | | 2004 | |
| | | | | (Thousands of Euros,
except per share data) | |
NET INCOME | | | | | | | | |
Profit for the year under IFRS | | | | 4,070,572 | | | 3,108,209 | |
Income attributed to the minority interest under IFRS (*) | | | | (264,147 | ) | | (185,613 | ) |
Income attributed to the Group under IFRS | | | | 3,806,425 | | | 2,922,596 | |
Adjustments to conform to U.S. GAAP: | | | | | | | | |
Business combination with Argentaria | | 1 | | (33,836 | ) | | (18,868 | ) |
Valuation of assets | | 2 | | (2,453 | ) | | 20,414 | |
Valuation of financial instruments | | 3 | | 26,902 | | | 247,935 | |
Accounting of goodwill | �� | 4 | | (478,450 | ) | | (316,215 | ) |
Translation of financial statements in high-inflation countries | | 5 | | — | | | — | |
Impact of SFAS 133 | | 6 | | (99,551 | ) | | (69,344 | ) |
Loans adjustments | | 7 | | (303,277 | ) | | 196,940 | |
Intangible assets | | 8 | | (147,955 | ) | | 93,679 | |
Tax effect of US GAAP adjustments and deferred taxation under SFAS 109 | | 9 | | 694,230 | | | 11,908 | |
| | | | | | | | |
Net income in accordance with U.S. GAAP before changes in accounting principles | | | | 3,462,035 | | | 3,089,046 | |
Changes in accounting principles | | | | | | | | |
Pension plan cost | | 10 | | (2,164,038 | ) | | 607 | |
Tax effect of Pension plan cost adjustment | | 9 | | 719,691 | | | 5,590 | |
| | | | | | | | |
Net income in accordance with U.S. GAAP | | | | 2,017,688 | | | 3,095,343 | |
| | | |
Other comprehensive income, (loss) net of tax: | | | | | | | | |
Foreign currency translation adjustments | | | | 1,138,449 | | | (308,751 | ) |
Unrealized gains on securities: | | | | | | | | |
Unrealized holding gains (losses) arising during period, net of tax | | | | 882,753 | | | 874,845 | |
Reclassification adjustment, net of tax | | | | — | | | (274,599 | ) |
Derivative instruments and hedging activities | | | | (118,586 | ) | | (11,375 | ) |
Comprehensive income (losses) in accordance with U.S. GAAP | | | | 3,920,304 | | | 3,375,463 | |
Net income per share (Euros) | | | | 0.595 | | | 0.918 | |
F-105
| | | | | | | | |
| | | Item # | | Increase (Decrease) Year
Ended December 31, | |
| | | | 2005 | | | 2004 | |
| | | | | (Thousands of Euros) | |
STOCKHOLDERS’ EQUITY | | | | | | | | |
Total Stockholders’ equity under IFRS | | | | 17,302,112 | | | 13,805,263 | |
Minority interests under IFRS (*) | | | | (971,490 | ) | | (737,539 | ) |
Total stockholders’ equity without minority interest under IFRS | | | | 16,330,622 | | | 13,067,724 | |
Adjustments to conform to U.S. GAAP: | | | | | | | | |
Business combination with Argentaria | | 1 | | 5,558,853 | | | 5,587,640 | |
Valuation of assets | | 2 | | (151,062 | ) | | (148,608 | ) |
Valuation of financial instruments | | 3 | | 67,029 | | | 205,004 | |
Accounting of goodwill | | 4 | | 3,417,857 | | | 3,359,281 | |
Translation of financial statements in high-inflation countries | | 5 | | (267,843 | ) | | (224,484 | ) |
Impact of SFAS 133 | | 6 | | 142,786 | | | 315,636 | |
Loans adjustments | | 7 | | 1,669,728 | | | 1,996,335 | |
Intangible assets | | 8 | | — | | | 195,966 | |
| Tax effect of US GAAP adjustments and deferred taxation under SFAS 109 | | 9 | | (1,392,558 | ) | | (1,959,840 | ) |
| | | | | | | | |
Stockholders’ equity in accordance with U.S. GAAP before changes in accounting principles | | | | 25,375,412 | | | 22,394,654 | |
Changes in accounting principles | | | | | | | | |
Pension plan cost | | 10 | | — | | | 1,589,071 | |
Tax effect of Pension plan cost adjustment | | 9 | | — | | | (518,453 | ) |
| | | | | | | | |
Stockholders’ equity in accordance with U.S. GAAP | | | | 25,375,412 | | | 23,465,272 | |
| (*) | Under IFRS stockholders’ equity and net income includes the equity and net income corresponding to the shareholders of both the Parent and the minority interests. Under U.S. GAAP, stockholder’s equity and net income is made up only of the equity portion attributed to equity holders of the Parent. Therefore, for reporting purpose, the Minority Interests portion is excluded of shareholder’s equity and net income. |
The differences included in the tables above are explained in the following items:
| 1. | Business Combination with Argentaria- |
Banco Bilbao Vizcaya, S.A. and Argentaria, Caja Postal y Banco Hipotecario, S.A. (Argentaria) merged, being January 28, 2000 the date from which such merger was legally effective. According to Spanish GAAP at that date, this business combination was accounted for using the method of pooling of interest and therefore no goodwill was accounted. IFRS 1First-time adoption of International Reporting Standards grants an exemption to apply IFRS 3Business Combinationsprospectively and thus not to restate business combinations that occurred before the date of transition to IFRSs, which is January 1, 2004. Therefore, this merger has been accounted for using the method of pooling of interest and no goodwill was accounted. Since the transaction did not comply with the requirements of APB 16 for pooling of interest method, under U.S. GAAP this business combination was accounted for using the purchase method. The excess of the fair value of the new shares issued in exchange for the Argentaria shares over the net worth of Argentaria under U.S. GAAP as of the date of the merger, amounted to approximately €6,315,622 thousand and was calculated considering the necessary adjustments to the net worth of Argentaria as of January 28, 2000 under Spanish GAAP, as described below:
F-106
| | | |
| | | (thousands of euro) | |
Approximate Argentaria net worth as of January 28, 2000 under Spanish GAAP | | 3,454,449 | |
| | | |
(i) Reversal of the net effect of the restatement of fixed assets and equity securities | | (129,338 | ) |
(ii) Reduction for employees and third party loans issued to purchase shares of capital stock | | (122,606 | ) |
(iii) Goodwill amortization adjustments | | 100,734 | |
(iv) Up-front premium reversal | | 107,888 | |
(v) Valuation of investment securities | | 1,926,143 | |
(vi) Effect of adjustments to conform to U.S. GAAP for investments in affiliated Companies | | (87,167 | ) |
(vii) Tax effect of above mentioned adjustments | | (607,916 | ) |
(viii) Other adjustments | | 34,601 | |
| | | |
Subtotal | | 1,222,339 | |
| | | |
Approximate Argentaria net worth as of January 28, 2000 under U.S. GAAP | | 4,676,788 | |
| | i. | Revaluation of property and equity securities |
Certain of the Spanish and foreign consolidated companies had stepped up (increased) the cost and accumulated depreciation of property and equipment and, where appropriate, the carrying values of their equity investment securities pursuant to the relevant local legislation. Also, the buildings and equity securities owned by certain of the companies in the Group, whose shareholders’ meetings adopted merger resolutions in 1991, were stepped up. Under U.S. GAAP these step ups are not permitted to be reflected in the financial statements.
| | ii. | - Employee and other third party loans |
Certain Group banks granted loans to shareholders, employees and customers for the acquisition of Argentaria, Caja Postal y Banco Hipotecario, S.A. shares. Under Spanish GAAP, these loans were recorded in the consolidated financial statements under the caption “Credit, Loans and Discounts”. Under U.S. GAAP, these loans should be recorded as a reduction of stockholders’ equity because the only recourse for collection was the shares themselves.
Under Spanish GAAP, the general policy of the Group was to amortize goodwill over a maximum period of 10 years. However, a different period was used to amortize goodwill in some of the subsidiaries acquired. Until 2001, for purposes of calculating the effect of applying U.S. GAAP, goodwill arising on acquisitions was amortized in 10 years. Since 2001, as it is required in SFAS 142, goodwill is not amortized.
Additionally, in 1998 and as a result of the merger, goodwill from Banco Exterior de España, S.A. was fully written off for Spanish GAAP purposes. Until 2001, under U.S. GAAP this goodwill was amortized over the estimated economic life as there was no economic or fair value basis for the impairment made under Spanish GAAP. Since 2001, as it is required in SFAS 142, goodwill is not amortized.
| | iv. | - Up-front premium reversal |
In 1998 the Bank arranged hedging transactions for which it paid a premium, which was recorded under the “Extraordinary Losses” caption in the statement of income for 1998, to mitigate the adverse effect of the negative spread that arise between the average return on the mortgage loans financed by certain mortgage bonds and the fixed interest rates of such mortgage bonds. Under U.S. GAAP, the premium was recognized at inception as an asset, amortized over the life of the hedging transaction under SFAS 80 and that upon adoption of SFAS 133 the derivative has been recorded at fair value through income, as it does not qualify for hedge accounting under U.S. GAAP.
| | v. | - Valuation of investment securities |
Under SFAS 115, available-for-sale securities must be recorded at market value against stockholders’ equity.
| | vi. | - Investments in affiliated Companies |
Under Spanish GAAP, investments in non-consolidated listed affiliated companies owned over 3% and in non-consolidated unlisted affiliated companies owned over 20% were recorded by the equity method. Under U.S. GAAP investments in affiliated companies over 20% but less than 50% are accounted for by the equity method and those exceeding 50% by the global integration method. Listed investments of less than 20% are accounted for at market value.
F-107
The excess of the fair value of the new shares issued in exchange for the Argentaria shares over the net worth of Argentaria, was allocated to the following specific items:
| | | |
2000 | | Thousands of
Euros | |
Net Lending | | 610,785 | |
Investment Securities-Held to Maturity | | 305,903 | |
Premises and Equipment | | 129,338 | |
Other assets and liabilities | | (113,255 | ) |
Long Term Debt | | (172,521 | ) |
Tax Effect | | (220,360 | ) |
Goodwill | | 5,775,732 | |
| | | |
| | 6,315,622 | |
| | | |
For U.S. GAAP purposes, BBVA amortizes the excess of the fair value assigned to the specific items over their remaining life. The amortization of the excess allocated to specific assets and liabilities amounts to €33,836 thousand (net of tax) and €18,868 thousand (net of tax) in 2005 and 2004, respectively. Up to December 31, 2001 BBVA amortized the goodwill on a straight line basis over a period of 25 years. From January, 2002 BBVA stopped the amortization of the remaining goodwill pursuant to the SFAS 142 and it has been assigned to different Reporting Units and tested for impairment as described in Item 2.2.n. As of December 31, 2005 goodwill amounted to €5,332,924 thousand.
This adjustment basically refers to following:
- Revaluation of property and equity securities
As described in Note 33.3, certain of the Spanish and foreign consolidated companies restated the cost and accumulated depreciation of property and equipment pursuant to the relevant legislation. Also, equity securities were revalued pursuant to the applicable enabling legislation on account revaluations. Under U.S. GAAP these revaluations are not permitted to be reflected in the financial statements.
In accordance with IFRSs, fixed asset depreciation is computed on the restated value and the total amount charged to income is deductible for corporate income tax purposes. In addition, results on sales or dispositions of both fixed assets and equity investments are determined as the difference between the selling price and the net restated value.
The amounts of the adjustments indicated below have been calculated to reflect the reversal of the additional depreciation on the revalued property and equipment (€8,984 thousand and €9,312 thousand in 2005 and 2004, respectively) and the additional income that would have resulted if the Group had not restated the equity securities and fixed assets that have been sold (€14,026 thousand and €15,032 thousand in 2005 and 2004, respectively). The adjustment to stockholders’ equity reflects the reversal of the unamortized revaluation surplus (€297,728 thousand and €320,738 thousand in 2005 and 2004, respectively).
- Valuation of property
As described in Note 3.i), in accordance with IFRS 1First-time adoption of International Financial Reporting Standards, certain property and equipment items were recognized at fair value and, therefore, this lower value was used as deemed cost at January 1, 2004.
Under U.S. GAAP, these adjustments to the deemed cost are not permitted due to they do not reflect an actual impairment.
As a consequence, there is an adjustment between U.S. GAAP and IFRSs in order to reflect in the income statement the additional depreciation on the revalued property and equipment (€3,079 thousand in both 2005 and 2004). The adjustment to stockholders’ equity reflects the reversal of the adjustments to the attributed cost (€146,666 thousand and €149,746 thousand in 2005 and 2004, respectively).
| 3. | Valuation of financial instruments- |
Group’s criteria of accounting for such securities are described in Note 2.2.c. As described in Note 3.c), in accordance with IFRS 1First-time adoption of International Financial Reporting Standards, the recognition, measurement and disclosure criteria included in IASs 32 and 39, were applied retrospectively to January 1, 2004 (the date of transition to IFRSs).
This adjustment mainly refers to following:
F-108
Debt securities
Under IFRS 1, debt securities included in available-for-sale portfolio were recognized at fair value of the date of transition to IFRSs (January 1, 2004) through shareholders’ equity.
Under U.S. GAAP, in years ended before January 1, 2004, some unrealized losses regarding certain debt securities were recorded like ‘other-than- temporary’ impairments.
As a consequence, there is an adjustment between U.S. GAAP and IFRSs in order to reflect in the income statement the additional income due to debt securities that have been sold (€17,140 thousand and €203,969 thousand in 2005 and 2004, respectively). The adjustment to stockholders’ equity reflects the reversal of the adjustments to the fair value (increase €72,973 thousand and decrease €18,694 thousand in 2005 and 2004, respectively).
Equity securities
Under IFRS 1, equity securities included in available-for-sale portfolio were recognized at fair value of the date of transition to IFRSs (January 1, 2004) through shareholders’ equity.
Under U.S. GAAP, in years before January 1, 2004, some unrealized losses regarding certain equity securities were recorded like “other-than-temporary” impairments.
The final adjustment is done with other equity securities and reflects the reversal of effects in net income (increase €10,324 thousand and €44,108 thousand in 2005 and 2004, respectively) and reflects the record of the fair value of equity securities through stockholders’ equity (decrease €51,447 thousand in 2005 and increase €208,182 thousand in 2004).
| 4. | Accounting of goodwill- |
The breakdown of this adjustment is as follows:
| | | | | | | | | | | | |
| | | Thousand of euros | |
| | | Stockholders’ equity | | | Net Income | |
| | | 2005 | | | 2004 | | | 2005 | | | 2004 | |
Goodwill charged to reserves in 1998 and 1999 | | 65,522 | | | 65,522 | | | — | | | — | |
Different period of amortization of goodwill reversed | | 98,948 | | | 98,948 | | | — | | | — | |
Amortization under Spanish GAAP not reversed under U.S. GAAP | | (154,074 | ) | | (154,074 | ) | | — | | | — | |
Reversal of amortization | | 970,477 | | | 970,477 | | | — | | | — | |
Reversal of Step Acquisition | | 3,203,836 | | | 2,774,636 | | | — | | | — | |
Step Acquisition of BBVA Bancomer | | (788,073 | ) | | (363,384 | ) | | (458,493 | ) | | (316,607 | ) |
Others | | 21,221 | | | (32,844 | ) | | (19,957 | ) | | 392 | |
| | | | | | | | | | | | |
Adjustment 4 in reconciliation to U.S. GAAP | | 3,417,857 | | | 3,359,281 | | | (478,450 | ) | | (316,215 | ) |
| | | | | | | | | | | | |
The mains reasons that cause a difference between IFRSs and U.S. GAAP in the amount of goodwill are the following ones:
Goodwill charged to reserves in 1998 and 1999
Goodwill that arose in 1998 and 1999 as a result of mergers and acquisitions through share exchanges was amortized in full with a charge to reserves, which was not acceptable under U.S. GAAP. Under U.S. GAAP the goodwill was amortized until 2001 over a period of ten years except for the goodwill arising in 2000 in the merger of Banca Catalana, S.A., Banco de Comercio, S.A., Banco de Negocios Argentaria, S.A. and Banco de Alicante, S.A. where the economic life was five years. Since 2001, as it is required in SFAS 142, goodwill is not amortized.
Impairment
A discounted cash flow model was selected as the main method to determine the fair value of its Reporting Units, although other methodologies such as using quoted market values and market multiples were also used. Cash flow estimates require judgment and the Bank believes that assumptions used in determining the cash flows are consistent with assumptions marketplace participants would use in their estimates of their fair value.
F-109
The principal BBVA Group’s goodwill assigned to each Reporting Unit as of December 31, 2005 and 2004 for annual impairment test purposes are the following:
| | | | |
| | | Millions of Euros |
| | | 2005 | | 2004 |
Retail Banking in Spain and Portugal | | 3,968 | | 3,967 |
Wholesale and Investment Banking | | 1,674 | | 1,679 |
Pensions in America | | 312 | | 260 |
México | | 3,600 | | 3,021 |
Chile | | 78 | | 60 |
United States | | 481 | | — |
Colombia | | 267 | | — |
Puerto Rico | | 91 | | 79 |
Expected cash flows have been calculated using the “maximum payable dividend” for each period, considering net income and excess of minimum capital required. For financial statements and macroeconomics scenarios, a five year horizon was used to determine fair value. The risk free rate, the market risk premium and the country risk premium (when applicable) were considered to determine the discount rate used for each Reporting Unit.
Year 2005 and 2004 analysis
As of December 31, 2005 and 2004, the Group has performed the required annual impairment tests of goodwill. As a result of Step 1 procedures of the above mentioned impairment test, the carrying amount of the Reporting Unit did not exceed its fair value.
Reversal of step acquisition
Under IFRS, investments acquired subsequent to obtaining control over a company (i.e. transactions involving the purchase of equity interests from minority shareholders) were treated as “equity transactions”. The amount of goodwill recorded under prior GAAP, at January 1, 2004, transition date to IFRSs, under IFRSs was recorded on the transactions performed after control was obtained were charged to Minority Interests and the surplus amount were charged to shareholders’ equity.
Under U.S. GAAP, these acquisitions are accounted for by using “purchase method” and, as a consequence, there is an adjustment between IFRS and U.S. GAAP in order to reflect the reversal of goodwill recorded prior to January 1, 2004, and the increase of shareholders’ equity.
Step Acquisition of BBVA Bancomer
As it is explained in Note 4 on March 20, 2004, BBVA completed the tender offer on 40.6% of the capital stock of Grupo Financiero BBVA Bancomer, S.A. de C.V. (“Bancomer”). The final number of shares presented in the offer and accepted by BBVA was 3,660,295,210, which represent 39.45% of the capital stock of Bancomer. Following the acquisition of these shares through the tender offer, the ownership interest held by BBVA in the capital of Bancomer was 98.88%. Lastly, as of December 31, 2004, as a result of the purchase of shares subsisting in the market, BBVA’s holding in Bancomer increased to 99.70%.
BBVA Bancomer, S.A. de C.V. was consolidated by Group BBVA since July 2000, when the merger of Grupo Financiero BBV-Probursa, S.A. de C.V. (a wholly-owned subsidiary of BBVA) and Grupo Financiero BBVA Bancomer, S.A. de C.V. was carried out.
Since March 20, 2004 the BBVA Group’s income statement reflected a decrease in Minority Interest caption due to the business combination described above while the rest of income statement’s captions did not changed because Bancomer already was a fully consolidated company before the acquisition of minority interest.
The cash paid for the acquired entity was €3,324 million. In connection with this business combination there are no contingent payments, options, or commitments specified in the acquisition agreement.
Under IFRSs, the business combination is registered as equity transaction and no amounts were allocated to assets or liabilities of the company acquired. Under U.S. GAAP once the process of allocating the acquisition price to all assets and liabilities of the company acquired, the goodwill amounted to €1,060.2 million. The whole amount of goodwill is allocated to the Mexico reporting unit in the Banking in America segment.
F-110
The conciliation of the net worth acquired and the fair value of the assets and liabilities acquired for purposes of U.S. GAAP was as follows:
| | | |
| | | Thousand of
Euros | |
Net worth acquired | | 1,207,051 | |
Investment securities | | (32,365 | ) |
Net loans and leases | | 621,671 | |
Premises and equipment | | (28,158 | ) |
Intangible assets | | 969,996 | |
Other Assets | | 189,585 | |
Time Deposits | | (124,176 | ) |
Long term debt | | (49,585 | ) |
Other liabilities | | (490,468 | ) |
| | | |
Fair value under U.S. GAAP | | 2,263,551 | |
| | | |
The identified intangible assets are related to ‘core deposits’, which were calculated according to the purchase method and are amortized in a period of 40 months. Additionally, the allocated amount of net loans and leases are amortized in a weighted-average period of 3 years. Under U.S. GAAP, the adjustment (net of tax) in the income statement amounted to €458,493 thousand and €316,607 thousand in 2005 and 2004, respectively, mainly due to the additional amortization expenses of assets and liabilities subject to amortization.
The “Other liabilities” caption includes basically temporary differences arising form different accounting and tax values of assets and liabilities allocated in the acquisition. Because the amounts allocated to certain assets are non deductible under Spanish Tax Law, additional goodwill and the corresponding deferred tax liabilities have been considered under U.S. GAAP.
The following unaudited proforma information presents a summary of the effect in the BBVA Group’s consolidated results of operations as if the acquisitions described above had occurred on January 1, 2004.
| | |
| | | Year ended
December 31, 2004 |
| | | Millions of euros |
Revenues | | 7,069 |
Net Income | | 2,865 |
Basic EPS (Euros) | | 0.84 |
These unaudited proforma results have been prepared for comparative purposes only. They do not purport to be indicative of the results of operations that actually would have resulted had these operations occurred at January 1, 2004, or future results of operations of the company acquired.
Since Bancomer was consolidated by Group BBVA since July 1, 2000, there are not purchased research and development assets acquired and written off.
There are not series of individually immaterial business combinations completed during the period and material in the aggregate.
| 5. | Translation of financial statements in high-inflation countries- |
As indicated in Note 2.h), after the transition date to IFRSs, which is January 1, 2004, none of the functional currencies of the consolidated subsidiaries and associates and their branches located abroad relate to hyperinflationary economies as defined by IFRSs. Accordingly, at 31 December 2005 and 2004 it was not necessary to adjust the financial statements of any of the consolidated subsidiaries or associates to correct for the effect of inflation.
In accordance to the exemption provided by IFRS 1 First-time Adoption of International Financial Reporting Standards, the cumulative effect of inflation recorded prior to January 1, 2004 (transition date to IFRS) mainly relating to items of property, plant and equipment has not been removed. Therefore, the previous GAAP restated amounts have been used as deemed cost of property, plant and equipment as of the transition date.
However, in prior years, under U.S. GAAP, the financial statements of operating units in a highly inflationary economy were remeasured as if the functional currency of the operating unit were the same as that of the parent reporting currency. For the purposes of this requirement, a highly inflationary economy is one that has cumulative inflation of approximately 100 percent or more over a 3-year period. None of the countries were BBVA owns subsidiaries are highly inflationary countries.
F-111
The adjustment reflects the reversal of the charges to shareholders’ equity arising from inflation registered in dependent companies established in “non highly inflationary economies” (€267,843 thousand and €224,484 thousand in 2005 and 2004, respectively).
In accordance with IFRS 1First-time adoption of International Financial Reporting Standards, we designed certain derivative instruments as hedging instruments as of January 1, 2004, and all cumulative effects of the change were accounted for in equity as of January 1, 2004.
However, under U.S. GAAP, such derivatives do not qualify for hedge accounting, since they were not designated and documented as hedging instruments at the inception of the hedging relationship.
As a consequence, there is an adjustment between U.S. GAAP and IFRSs in order to reflect the charge to shareholders’ equity amounted to €63,590 thousand and €12,136 thousand in 2005 and 2004, respectively. The charges in income statement due to this adjustment amounted to €53,446 thousand and €79,581 thousand in 2005 and 2004, respectively.
Hedges of interest rate risk portfolios
At December 31, 2004, under IFRSs the Group had designed hedge of portfolios to hedge global interest rate risk exposures. These transactions were permanently subject to an integrated and consistent system of risk management (e.g. estimate value at risk -VaR- of the transactions to check the equity risk is reduced due to the use of derivatives…) that measures, controls and manages the risks and the results of the operations involved. The Group considered the fair value all the derivatives and the hedged deposits. The net gains and losses were recorded in the income statement.
At December 31, 2005 the Group had no portfolio hedge of interest rate risk operations.
Under U.S. GAAP, this hedge cannot qualify as a hedge. As a consequence, there is an adjustment between U.S. GAAP and IFRSs which effect in income statement amounted to decrease €36,528 thousand and increase €70,904 thousand in 2005 and 2004, respectively. The effect in shareholders’ equity amounted €147,913 thousand and €184,441 thousand in 2005 and 2004, respectively.
Other derivatives
All material intercompany accounts and transactions between the consolidated companies are eliminated in consolidation. This consolidation principle also applies with respect to intercompany derivative transactions.
As of December 31, 2005, the application of SFAS 133 gave rise to a decrease of €6,023 thousand in net income and an increase of €58,463 thousand in shareholders’ equity. As of December 31, 2004, the application of this method gave rise to an increase of €141,128 thousand in shareholders’ equity.
The effect in Other Comprehensive Income is produced basically by valuating the derivative instruments hedging the available-for-sale portfolio, which under IFRSs are considered hedged items, and therefore are not marked to market, but under U.S. GAAP are not qualified as a hedge.
The effect in Income Statement is registered basically in the item “gains or losses on financial assets and liabilities”.
The fair value of derivatives that afforded hedge accounting treatment under IFRSs but did not qualify as hedges under U.S. GAAP as of December, 31 2005 and 2004 amounted negative to €69,214 thousand and negative to €106,913 thousand, respectively.
The fair value of derivatives that afforded hedge accounting treatment under IFRSs and qualify as hedges under U.S. GAAP as of December, 31 2005 and 2004 amounted negative to €25,988 thousand and positive to €43,968 thousand, respectively.
Under IAS 39, as we described in Note 2.2.c.4) to the Consolidated Financial Statements, a loan is considered to be an impaired loan – and therefore its carrying amount is adjusted to reflect the effect of its impairment – when there is objective evidence that events have occurred which, in the case of loans give rise to a negative impact on the future cash flows that were estimated at the time the transaction was arranged.
F-112
As a general rule, the carrying amount of an impaired loan is adjusted with a charge to the consolidated income statement for the year in which the impairment becomes known, and the recoveries of previously recognized impairment losses are recognized in the consolidated income statement for the year in which the impairment is reversed or reduced.
The amount of the impairment losses incurred on these instruments relates to the positive difference between their respective carrying amounts and the present values of their expected future cash flows.
The possible impairment losses on these assets are determined:
| | • | | Individually, for all significant loans and for those which, although not significant, cannot be classified in homogenous groups of instruments of similar characteristics, i.e. by instrument type, debtor’s industry and geographical location, type of guarantee, age of past-due amounts, etc. |
| | • | | Collectively, in all other cases. |
The provisions for the losses that are inherent in a group of loans are recognized taking into account the historical experience of impairment and the other circumstances known at the time of the assessment. These provisions, that have not been allocated to individual loans, are calculated by using statistical procedures.
Although there should be no substantial difference in the calculation of loan allowances between IFRS and U.S. GAAP, however, the Bank has included in the reconciliation of stockholders equity and net income a difference between IFRS and U.S. GAAP related to the determination of allowance losses not allocated to specific loans. According to U.S. GAAP, the loan loss allowance should represent the best estimate of probable losses in possible scenarios. Under IFRS, the Bank has additionally applied the statistical percentages obtained from historical trends as determined by the Bank of Spain’s guidance. As a result, the loan allowances not allocated to specific loans, as determined by using this method, are higher than those meeting the requirements of U.S. GAAP, being the amounts determined under both GAAP within the range of possible estimated losses calculated internally by the Group.
Under IFRSs intangible assets with finite lives are amortised over those useful lives. At transition date, the estimated useful lives were reviewed. In accordance with IFRS 1First-time adoption of International Financial Reporting Standards, the previous GAAP restated amounts have been used as deemed cost of certain intangible assets and the differences respect to the previous carrying amounts of these intangible assets were accounted for in shareholders’ equity as of January 1, 2004.
Under U.S. GAAP, this adjustment is considered a change in accounting estimates and, in accordance with APB 20Accounting changes, the cumulative effect of the adjustment is reflected in the current year’s income statement.
On a pro-forma basis, had the recognition in income statement of this adjustment been adopted at the beginning of the earliest period presented, the effect in the Group’s net income for 2004 under U.S. GAAP would have been negative in €105 million (the effect in basic and diluted earnings per share would have been negative in 0.031).
| 9. | Tax effect of U.S. GAAP adjustments and deferred taxation under SFAS No. 109- |
The previous adjustments to net income and stockholders’ equity do not include their related effects on corporate tax (except for the adjustments mentioned in Item 1, the acquisition of BBVA Bancomer, S.A. de C.V. described in Item 5 and loans adjustments described in Item 7, which are disclosed under “Tax effect of above mentioned adjustments” item on the reconciliation statements.
As described in Note 2.p) under IFRSs deferred tax assets and liabilities include temporary differences, measured at the amount expected to be payable or recoverable on differences between the carrying amounts of assets and liabilities and their tax bases, and tax loss and tax credit carryforwards. These amounts are measured at the tax rates that are expected to apply in the year when the asset is realized or the liability settled.
As a result of the application of Statement of Financial Accounting Standards No. 109 (“SFAS 109”),Accounting for Income Taxes, the timing differences originated by the revaluation of property and equity securities and by certain provision for coverage of loan losses have been reversed.
F-113
In the reconciliation to U.S. GAAP, the Group has recorded as of December 31, 2005, deferred tax assets of €160,506 thousand (negative €2,166,045 thousand as of December 31, 2004) and deferred tax liabilities of €450,852 thousand (€210,493 as of December 31, 2004).
SFAS 109 requires providing a valuation allowance when it is more likely than not that some portion of the deferred tax asset will not be realized. As of December 31, 2005 and 2004 the valuation allowance amounted to €278,261 thousand and €344,950 thousand, respectively.
The following is a reconciliation of the income tax provision under IFRSs to that under U.S.GAAP:
| | | | | | |
| | | 2005 | | | 2004 | |
| | | Thousands of Euros | |
Income tax provision under IFRSs | | 1,521,181 | | | 1,028,631 | |
Tax effect of U.S. GAAP adjustments and deferred taxation under SFAS 109 | | (1,668,657 | ) | | (158,314 | ) |
Income tax provision under U.S. GAAP | | (147,476 | ) | | 870,317 | |
Following is a reconciliation of the deferred tax assets and liabilities recorded under IFRSs and those that should be recorded under SFAS 109.
| | | | | | | | | | | |
| | | 2005 | | 2004 | |
| | | Deferred tax
assets | | | Deferred tax
liabilities | | Deferred tax
assets | | | Deferred tax
liabilities | |
| | | Thousands of Euros | |
As reported under IFRSs | | 5,553,710 | | | 1,501,738 | | 5,801,891 | | | 1,397,139 | |
Less- | | | | | | | | | | | |
Timing differences recorded under IFRSs and reversed in the reconciliation to U.S. GAAP | | (1,333,337 | ) | | — | | (345,287 | ) | | — | |
Tax effect of IFRSs to U.S. GAAP reconciliation adjustments | | (15,926 | ) | | — | | (2,350,060 | ) | | (411,456 | ) |
Plus- | | | | | | | | | | | |
Tax effect of IFRSs to U.S. GAAP reconciliation adjustments | | 176,432 | | | 450,852 | | 184,015 | | | 621,949 | |
As reported under SFAS 109 (gross) | | 4,380,879 | | | 1,952,590 | | 3,290,559 | | | 1,607,632 | |
Valuation reserve | | (278,261 | ) | | — | | (344,950 | ) | | — | |
As reported under SFAS 109 (net) | | 4,102,618 | | | 1,952,590 | | 2,945,609 | | | 1,607,632 | |
Following is an analysis of deferred tax assets and liabilities as of December 31, 2005 and 2004 estimated in accordance with U.S. GAAP:
| | | | | | |
| | | December 31, | |
| | | 2005 | | | 2004 | |
| | | (Thousands of Euros) | |
Deferred Tax assets | | | | | | |
Loan loss reserves | | 610,977 | | | 667,315 | |
Unrealized losses on securities pension liability | | 1,645,126 | | | 1,098,916 | |
Fixed assets | | 135,711 | | | 70,233 | |
Net operating loss carryforward | | 664,447 | | | 843,567 | |
Investments and derivatives | | 444,488 | | | 246,645 | |
Goodwill | | 8,055 | | | 20,207 | |
Other | | 872,075 | | | 343,676 | |
Total deferred tax assets | | 4,380,879 | | | 3,290,559 | |
Valuation reserve | | (278,261 | ) | | (344,950 | ) |
Net tax asset | | 4,102,618 | | | 2,945,609 | |
Deferred tax liabilities | | | | | | |
Unrealized gains on investments | | (1,273,870 | ) | | (1,121,963 | ) |
Gains on sales of investments | | (67,368 | ) | | — | |
Fixed assets | | (160,746 | ) | | — | |
Goodwill | | (346,914 | ) | | (485,669 | ) |
Other | | (103,692 | ) | | — | |
Total deferred tax liabilities | | (1,952,590 | ) | | (1,607,632 | ) |
Valuation reserve | | — | | | — | |
Net tax liabilities | | (1,952,590 | ) | | (1,607,632 | ) |
F-114
Reconciliation between the federal statutory tax rate and the effective income tax rate follows:
| | | | | | |
| | | 2005 | | | 2004 | |
| | | % percentages | |
Corporate income tax at the standard rate of 35% | | 35.00 | | | 35.00 | |
Decrease arising from permanent differences | | (6.25 | ) | | (6.06 | ) |
Adjustments to the provision for prior years’ corporate income tax and others taxes | | (1.54 | ) | | (4.07 | ) |
Income tax provision under IFRSs | | 27.20 | | | 24.87 | |
Tax effect of U.S. GAAP adjustments and deferred taxation under SFAS 109 | | (77.13 | ) | | (3.76 | ) |
Income tax provision under U.S. GAAP | | (6.82 | ) | | 20.64 | |
Prior years both under Spanish GAAP and U.S. GAAP, the cumulative actuarial losses and certain losses were amortized in a straight-line method over the average expected years of work of employees.
In accordance with IFRS 1 First-time adoption of International Financial Reporting Standards, all cumulative actuarial losses were accounted for in equity as of January 1, 2004 (see Note 3 to Consolidated Financial Statements), and in future years all cumulative actuarial losses will be accounted for in income statement instead of use the corridor basis.
Under U.S. GAAP, both methods are available in accordance to SFAS 87. Therefore, we decided to change from January 1, 2005 and in future years all cumulative actuarial losses will be accounted for in income statement.
Under U.S. GAAP, in accordance with APB 20 Accounting changes, the cumulative effect of the change is reflected in the current year’s income statement.
As a consequence, there is an adjustment between U.S. GAAP and IFRSs in order to reflect the reversal of the charges to shareholders’ equity as of January 1, 2004 (€1,589,071 thousand). Additionally, in 2005 the charges in income statement due to this adjustment amounted to €2,164,038 thousand. Shareholders’ equity as of December 31, 2005 is the same under both IFRS and U.S. GAAP.
We consider that the recognition in income statement is preferable due to it reflects better the financial position and results of the company.
On a pro-forma basis, had the recognition in income statement of all cumulative actuarial losses been adopted at the beginning of the earliest period presented, the effect net of tax in the Group’s net income for 2004 under U.S. GAAP would have been negative in €1,444,347 thousand (the effect in basic and diluted earnings per share would have been negative in 0.428).
| 11. | Other Comprehensive Income |
SFAS No. 130,Reporting comprehensive income establishes standards for reporting and display of comprehensive income and its components in a full set of general-purpose financial statements.
Comprehensive income is defined as the change in equity of a business enterprise during a period from transactions and other events and circumstances from nonowner sources. It includes all changes in equity during a period except those resulting from investments by owners and distributions to owners.
The accumulated balances of other comprehensive income for the years ended December 31, 2005 and 2004 were as follows:
| | | | | | | | | | | |
| | | Foreign
currency
translation
adjustments | | | Unrealized
gains on
securities | | Gains on
Derivative
Instruments | | | Other
Comprehensive
income | |
| | | Thousands of Euros | |
Balance as of December 31, 2003 | | (3,413,689 | ) | | 1,646,529 | | 40,043 | | | (1,727,117 | ) |
Changes in 2004 | | (308,751 | ) | | 600,246 | | (11,375 | ) | | 280,120 | |
Balance as of December 31, 2004 | | (3,722,440 | ) | | 2,246,775 | | 28,668 | | | (1,446,997 | ) |
Changes in 2005 | | 1,138,449 | | | 882,753 | | (118,586 | ) | | 1,902,616 | |
Balance as of December 31, 2005 | | (2,583,991 | ) | | 3,129,528 | | (89,918 | ) | | 455,619 | |
F-115
Taxes allocated to each component of other comprehensive income in 2005 and 2004 were as follows:
| | | | | | | | | | | | | | | | | | |
| | | 2005 | | | 2004 | |
| | | Before Tax
Amount | | | Tax
expense
or benefit | | | Net of tax
amount | | | Before Tax
Amount | | | Tax
expense
or benefit | | | Net of tax
amount | |
| | | Thousands of Euros | |
Foreign currency translations adjustment | | 1,138,449 | | | — | | | 1,138,449 | | | (308,751 | ) | | — | | | (308,751 | ) |
Unrealized gains on securities: | | | | | | | | | | | | | | | | | | |
Unrealized holding gains arising during the period | | 1,219,434 | | | (336,681 | ) | | 882,753 | | | 1,245,770 | | | (370,925 | ) | | 874,845 | |
Reclassification adjustment | | — | | | — | | | — | | | (517,549 | ) | | 243,050 | | | (274,599 | ) |
| | | | | | | | | | | | | | | | | | |
| | 1,219,434 | | | (336,681 | ) | | 882,753 | | | 728,121 | | | (127,875 | ) | | 600,246 | |
Derivatives Instruments and Hedging Activities | | (159,600 | ) | | 41,014 | | | (118,586 | ) | | (14,252 | ) | | 2,877 | | | (11,375 | ) |
| | | | | | | | | | | | | | | | | | |
Other comprehensive income | | 2,198,283 | | | (295,667 | ) | | 1,902,616 | | | 405,118 | | | (124,998 | ) | | 280,120 | |
| | | | | | | | | | | | | | | | | | |
SFAS No. 128,Earnings per Share, specifies the computation, presentation and disclosure requirements for earnings per share (EPS).
Basic earnings per share is computed by dividing income available to common stockholders (the numerator) by the weighted-average number of common shares outstanding (the denominator), which may include contingently issuable shares where all necessary conditions for issuance have been satisfied. Diluted earnings per share include the determinants of basic earnings per share and, in addition, give effect to dilutive potential common shares that were outstanding during the period.
As indicated in Notes 59.10 of this Annual Report, effective on January 1, 2004, which supposed a change in our accounting policy related to pensions for U.S. GAAP purposes. As described in Note 3, upon adoption of IFRS, the cumulative effect of this change as of January 1, 2004 was recognized in shareholders’ equity, in accordance with IFRS 1 First-Time Adoption of International Financial Reporting Standards.
The computation of basis and diluted earnings per share for the years ended December 31, 2005 and 2004 is presented in the following table:
| | | | | |
| | | 2005 | | | 2004 |
| | | Thousands of Euros, except per
share data |
Numerator for basic earnings per share: | | | | | |
Income available to common stockholders (IFRS). | | 3,806,425 | | | 2,922,596 |
Income available to common stockholders (U.S. GAAP): | | | | | |
Before cumulative effect of changes in accounting principles | | 3,462,035 | | | 3,095,343 |
Cumulative effect of changes in accounting principles | | (1,444,347 | ) | | — |
After cumulative effect of changes in accounting principles | | 2,017,688 | | | 3,095,343 |
Numerator for diluted earnings per share: | | | | | |
Income available to common stockholders (IFRS) | | 3,806,425 | | | 2,922,596 |
Income available to common stockholders (U.S. GAAP): | | | | | |
Before cumulative effect of changes in accounting principles | | 3,462,035 | | | 3,095,343 |
Cumulative effect of changes in accounting principles | | (1,444,347 | ) | | — |
After cumulative effect of changes in accounting principles | | 2,017,688 | | | 3,095,343 |
Denominator for basic earnings per share | | 3,390,852,043 | | | 3,372,153,413 |
Denominator for diluted earnings per share | | 3,390,852,043 | | | 3,372,168,559 |
IFRS | | | | | |
Basic earnings per share (Euros) | | 1.123 | | | 0.867 |
Diluted earnings per share (Euros) | | 1.123 | | | 0.867 |
U.S. GAAP | | | | | |
Before cumulative effect of changes in accounting principles: | | | | | |
Basic earnings per share (Euros) | | 1.021 | | | 0.918 |
Diluted earnings per share (Euros) | | 1.021 | | | 0.918 |
After cumulative effect of changes in accounting principles: | | | | | |
Basic earnings per share (Euros) | | 0.595 | | | 0.918 |
Diluted earnings per share (Euros) | | 0.595 | | | 0.918 |
F-116
In November 2002, the FASB issued Interpretation No. 45,Guarantor’s Accounting and Disclosure Requirements for Guarantees, Including Indirect Guarantees of Indebtedness of Others (FIN 45). This interpretation requires certain disclosures to be made by a guarantor in its interim and annual financial statements about its obligations under certain guarantees that it has issued. It also requires a guarantor to recognize, at the inception of a guarantee, a liability for the fair value of the obligation undertaken in issuing the guarantee.
Under IFRSs, financial guarantees are measured at fair value which, on initial recognition and in the absence of evidence to the contrary, is the present value of the cash flows to be received, using an interest rate similar to that of the financial assets granted by the entity with a similar term and risk. Simultaneously, the present value of the future cash flows receivable, calculated using the aforementioned interest rate, is recognized under the heading Other Financial Assets.
Subsequent to initial recognition, contracts are treated as follows:
| | • | | The value of contracts recorded under the heading Other Financial Assets is discounted by recording the differences in the consolidated income statement as interest income. |
| | • | | The fair value of guarantees recorded under the heading Accrued Expenses and Deferred Income—Other on the liability side of the balance sheet is allocated to the consolidated income statement as fee and commission income on a straight-line basis over the expected life of the guarantee, or by another method provided that it more adequately reflects the economic risks and rewards of the guarantee. Such treatment is consistent with what is required under FIN 45 (par. 9.a.). |
According to IFRSs, all outstanding contingent liabilities and commitments that might in the future affect the net worth of the Bank should be recorded in memorandum accounts. These amounts represent the maximum principal which the Bank may be required to disburse and the maximum potential exposure if all such obligations were ultimately to become worthless. These include, principally, commercial and stand-by letters of credit, bankers acceptances, loan commitments and guarantees. Note 38 to the financial statements contain disclosures about our contingent liabilities and commitments.
In addition, under IFRSs, obligations reflected in memorandum accounts which fall within the scope of FIN 45 are evaluated in terms of credit risk, following criteria analogous to those described in Note 2.c.4), which substantially meet SFAS 5 provisions, and a liability is recorded accordingly.
When a guarantee is issued by the Bank as part of a transaction with multiple elements with an unrelated party (i.e. embedded in other contracts), the fair value of such guarantee is recorded as a liability at the inception. The fair value is estimated using the net present value of expected future payments.
Based on the discussions above, accounting criteria under IFRSs for treatment of contingent liabilities do not differ significantly from that required by FIN 45 under U.S. GAAP. Therefore, we believe that the adoption of FIN 45 does not have a material impact on the Bank’s financial position or results of operations.
The Group issued various noncumulative, nonvoting, preferred stock guaranteed by Banco Bilbao Vizcaya Argentaria, S.A., the parent company (see Note 26.5). These issues were subscribed by third parties outside the Group and are wholly or partially redeemable at the Company’s option after five or ten years from the issue date, depending on the terms of each issue.
Under IFRSs, as of December 31, 2005 and 2004, all preferred stocks to variable interest entities issuers of preferred stock are classified as liabilities.
Under U.S. GAAP, this classification is consistent with the requirement by FIN 46-R.
| 15. | SFAS 140- Accounting For The Transfers And Servicing Of Financial Assets And Extinguishments Of Liabilities |
In September 2000, the Financial Accounting Standards Board issued Statement No. 140 (“SFAS 140”),Accounting For The Transfers And Servicing Of Financial Assets And Extinguishments Of Liabilities, which replaces SFAS 125 (of the same title). SFAS 140 revises certain standards in the accounting for securitizations and other transfers of financial assets and collateral, and requires some disclosures relating to securitization transactions and collateral, but it carries over most of SFAS 125’s provisions.
F-117
As explained in Note 2.t) the accounting of transfer of Financial Assets under IFRSs does not present significant differences with respect to U.S. GAAP. During 2005 and 2004 the Group transferred loans to securizitation funds (See Note 14.3).
| 16. | New Accounting Standards |
Statements of Financial Accounting Standards No. 123 (Revised 2004): Share-Based Payment
In December 2004, the FASB issued SFAS No. 123 (revised 2004), Shared Based Payments (SFAS 123R). This statement eliminates the option to apply the intrinsic value measurement provisions of Accounting Principles Board (“APB”) Opinion No. 25, “Accounting for Stock Issued to Employees” to stock compensation awards issued to employees. Rather, SFAS 123R requires companies to measure the cost of employee services received in exchange for an award of equity instruments based on the grant-date fair value of the award. That cost will be recognized over the period during which an employee is required to provide services in exchange for the award—the requisite service period (usually the vesting period). SFAS 123R applies to all awards granted after the required effective date, December 15, 2005, and to awards modified, repurchased, or cancelled after that date. SFAS 123R will be effective for our fiscal year beginning January 1, 2006. The Company does not anticipate that adoption of this Standard will have a material effect on its financial position, results of operations, or cash flows.
SAB No. 107: Shared Based Payment
On March 29, 2005, the SEC released a Staff Accounting Bulletin (SAB) relating to the FASB accounting standard for stock options and other share-based payments. The interpretations in SAB No. 107, “Share-Based Payment,” (SAB 107) express views of the SEC Staff regarding the application of SFAS No. 123 (revised 2004), “Share-Based Payment “(Statement 123R). Among other things, SAB 107 provides interpretive guidance related to the interaction between Statement 123R and certain SEC rules and regulations, as well as provides the Staff’s views regarding the valuation of share-based payment arrangements for public companies. The Company does not anticipate that adoption of SAB 107 will have any effect on its financial position, results of operations or cash flows.
Statements of Financial Accounting Standards No. 153: Exchanges of Non-monetary Assets—An Amendment of APB Opinion No. 29
On December 16, 2004, the FASB issued SFAS No.153, “Exchanges of Non-monetary Assets—an amendment of APB Opinion No. 29”, which amends Accounting Principles Board Opinion No. 29 “Accounting for Nonmonetary Transactions”. This amendment is based on the idea that exchange transactions should be valued in accordance with the value of the exchanged assets. The exception made for similar non-monetary productive assets is eliminated and substituted by a more extensive exception related to non-monetary assets with a non-commercial consideration. APB No. 29 stated that the exchange transaction of a productive asset for a similar one should be recorded at the book value of the exchanged asset.
SFAS No. 153 will be applicable for non-monetary asset exchange transactions occurring in fiscal periods beginning after June 15, 2005. The Company does not anticipate that adoption of SFAS No. 153 will have any effect on its financial position, results of operations or cash flows.
EITF 04-1: Accounting for Preexisting Relationships between the Parties to a Business Combination
This Issue addresses the accounting for preexisting relationships between the parties to a business combination. The consensuses in this Issue should be applied to business combinations consummated and goodwill impairment tests performed in reporting periods beginning after October 13, 2004. The application of this new accounting literature by BBVA had no impact on its financial position, cash flows or results of Operations.
SFAS No. 154, “Accounting Changes and Error Corrections”
In May 2005, the FASB issued SFAS No. 154, “Accounting Changes and Error Corrections” which replaces Accounting Principles Board Opinions No. 20 “Accounting Changes” and SFAS No. 3, “Reporting Accounting Changes in Interim Financial Statements-An Amendment of APB Opinion No. 28”. This statement provides guidance on the accounting for and reporting of accounting changes and error corrections. It establishes retrospective application, or the latest practicable date, as the required method for reporting a change in accounting principle and the reporting of a correction of an error. This statement is effective for accounting changes and corrections of errors made in fiscal years beginning after December 15, 2005. The Bank will apply these requirements to any accounting changes after the implementation date.
FASB Interpretation No. 47: Accounting for Conditional Asset Retirement Obligations, an interpretation of FASB Statement No. 143
On March 2005, FASB issued Interpretation No. 47. The Board concluded that asset retirement obligations within the scope of Statement 143 that meet the definition of a liability in Concepts Statement 6 should be recognized as a liability at fair value if
F-118
fair value can be reasonably estimated. The Board believes that when an existing law, regulation, or contract requires an entity to perform an asset retirement activity, an unambiguous requirement to perform the retirement activity exists, even if that activity can be deferred indefinitely. At some point, deferral is no longer possible, because no tangible asset will last forever, except land. Therefore, the obligation to perform the asset retirement activity is unconditional even though uncertainty exists about the timing and (or) method of settlement. The use of an expected value technique to measure the fair value of the liability reflects any uncertainty about the amount and timing of future cash outflows. This Interpretation is effective no later than December 31, 2005, for calendar-year enterprises. The application of this new accounting literature by BBVA had no impact on its financial position, cash flows or results of Operations.
Statement of Financial Accounting Standards No. 155 Accounting for Certain Hybrid Financial Instruments an amendment of FASB Statements No. 133 and 140
On February 2006 the FASB issued this Statement that amends FASB Statements No. 133, Accounting for Derivative Instruments and Hedging Activities, and No. 140, Accounting for Transfers and Servicing of Financial Assets and Extinguishments of Liabilities. This Statement resolves issues addressed in Statement 133 Implementation Issue No. D1, “Application of Statement 133 to Beneficial Interests in Securitized Financial Assets.”
This Statement permits fair value remeasurement for any hybrid financial instrument that contains an embedded derivative that otherwise would require bifurcation, clarifies which interest-only strips and principal-only strips are not subject to the requirements of Statement 133, establishes a requirement to evaluate interests in securitized financial assets to identify interests that are freestanding derivatives or that are hybrid financial instruments that contain an embedded derivative requiring bifurcation, clarifies that concentrations of credit risk in the form of subordination are not embedded derivatives and amends Statement 140 to eliminate the prohibition on a qualifying special purpose entity from holding a F-145 derivative financial instrument that pertains to a beneficial interest other than another derivative financial instrument. This Statement is effective for all financial instruments acquired or issued after the beginning of an entity’s first fiscal year that begins after September 15, 2006. Earlier adoption is permitted as of the beginning of an entity’s fiscal year, provided the entity has not yet issued financial statements, including financial statements for any interim period for that fiscal year. The Company does not anticipate that the adoption of this new statement at the required effective date will have a significant effect in its results of operations, financial position or cash flows.
Statement of Financial Accounting Standards No. 156 Accounting for Servicing of Financial Assets an amendment of FASB Statement No. 140
On March 2006 the FASB issued this Statement that amends FASB Statements No. 140, Accounting for Transfers and Servicing of Financial Assets and Extinguishments of Liabilities, with respect to the accounting for separately recognized servicing assets and servicing liabilities.
The new Statement should be adopted as of the beginning of the first fiscal year that begins after September 15, 2006. The Company does not anticipate that the adoption of this new statement at the required effective date will have a significant effect in its results of operations, financial position or cash flows.
The Meaning of Other-Than-Temporary Impairment and Its Application to Certain Investments
On November 2, 2005, the FASB issued Financial Staff Position (“FSP”) FAS 115-1 and FAS 124-1, “The Meaning of Other-Than-Temporary Impairment and Its Application to Certain Investments,” which nullifies certain requirements of Emerging Issues Task Force (“EITF”) Issue No. 03-1, “The Meaning of Other-Than-Temporary Impairment and Its Application to Certain Investments” and supersedes EITF Abstracts Topic No. D-44, “Recognition of Other-Than-Temporary Impairment Upon the Planned Sale of a Security whose Cost Exceeds Fair Value.” The guidance in this FSP will be applied to reporting periods beginning after December 15, 2005. The Company does not expect that the adoption of this guidance will have a material effect on its financial position, results of operations or cash flows.
(59.B) CONSOLIDATED FINANCIAL STATEMENTS
1. Differences relating to the financial statements presentation-
In addition to differences between IFRSs and U.S. GAAP affecting to net income and/or stockholders’ equity, there are differences relating to the financial statements presentation exist between IFRSs and U.S. GAAP presentation following the formatting guidelines in Regulation S-X of the Securities and Exchange Commission of the United States. Although these differences do not cause differences between IFRSs and U.S. GAAP reported net income and/or stockholders’ equity.
F-119
2. Consolidated Financial Statements under Regulation S-X-
Following are the consolidated balance sheets of the BBVA Group as of December 31, 2005 and 2004 and the consolidated statement of income for each of the years ended December 31, 2005 and 2004, in the format for banks and bank holding companies required by Regulation S-X of the Securities and Exchange Commission of the United States of America, and, accordingly, prepared under U.S. GAAP (after reconciliation adjustments described above in Note 59.a).
BANCO BILBAO VIZCAYA ARGENTARIA GROUP
CONSOLIDATED BALANCE SHEETS AS OF DECEMBER 31, 2005 AND 2004
(Currency—Thousands of Euros)
| | | | | | |
| | | 2005 | | | 2004 | |
Assets | | | | | | |
Cash and due from banks | | 4,114,296 | | | 2,837,318 | |
Interest-bearing deposits in other banks | | 23,237,556 | | | 18,544,453 | |
Securities purchased under agreements to resell | | 13,636,016 | | | 6,967,755 | |
Trading securities | | 45,433,034 | | | 30,470,952 | |
Investments securities | | 64,048,011 | | | 53,239,797 | |
Net Loans and leases: | | | | | | |
Loans and leases, net of unearned income | | 224,066,730 | | | 174,330,506 | |
Less: Allowance for loan losses | | (3,916,928 | ) | | (3,344,681 | ) |
Hedging derivatives | | 3,971,149 | | | 4,381,045 | |
Premises and equipment, net | | 3,702,092 | | | 2,731,828 | |
Investments in affiliated companies | | 1,434,573 | | | 3,757,119 | |
Intangible assets | | 706,546 | | | 978,346 | |
Goodwill in consolidation | | 10,344,816 | | | 8,573,433 | |
Accrual accounts | | 557,278 | | | 2,773,476 | |
Others assets | | 10,463,964 | | | 8,108,241 | |
| | | | | | |
Total assets | | 401,799,133 | | | 314,349,588 | |
| | | | | | |
Liabilities and Stockholders’ Equity | | | | | | |
Liabilities | | | | | | |
Demand deposits | | 57,973,113 | | | 46,271,237 | |
Savings deposits | | 32,722,688 | | | 26,239,800 | |
Time deposits | | 103,245,406 | | | 94,272,031 | |
Due to Bank of Spain | | 6,822,123 | | | 11,150,701 | |
Trading account liabilities | | 16,270,865 | | | — | |
Hedging derivatives | | 2,870,086 | | | 3,131,572 | |
Short-term borrowings | | 70,096,211 | | | 51,866,398 | |
Long-term debt | | 55,604,604 | | | 38,910,700 | |
Taxes payable | | 2,550,875 | | | 152,905 | |
Accounts payable | | 6,123,905 | | | 1,168,358 | |
Accrual accounts | | 1,709,690 | | | 3,521,230 | |
Pension allowance | | 6,239,744 | | | 3,275,995 | |
Other Provisions | | 2,461,341 | | | 1,729,906 | |
Others liabilities | | 10,995,194 | | | 8,611,656 | |
| | | | | | |
Total liabilities | | 375,685,845 | | | 290,302,489 | |
Stockholders’ equity | | | | | | |
Capital stock | | 1,661,518 | | | 1,661,518 | |
Additional paid-in capital | | 6,658,390 | | | 8,177,101 | |
Dividends | | (1,166,644 | ) | | (1,015,195 | ) |
Other capital instruments | | (96,321 | ) | | (35,846 | ) |
Retained earnings | | 17,233,146 | | | 14,677,694 | |
| | | | | | |
Total stockholders’ equity excluding minority interest | | 25,375,412 | | | 23,465,272 | |
| | | | | | |
Minority interest | | 737,876 | | | 581,827 | |
Total liabilities and stockholders’ equity | | 401,799,133 | | | 314,349,588 | |
F-120
BANCO BILBAO VIZCAYA ARGENTARIA GROUP
CONSOLIDATED STATEMENTS OF INCOME FOR THE YEARS ENDED
DECEMBER 31, 2005 AND 2004
(Currency—Thousands of Euros)
| | | | | | |
| | | 2005 | | | 2004 | |
Interest Income | | | | | | |
Interest and fees on loans and leases | | 9,892,700 | | | 7,573,162 | |
Interest on deposits in other banks | | 970,755 | | | 721,811 | |
Interest on securities purchased under agreements to resell | | 280,703 | | | 389,421 | |
Interest on investment securities | | 4,510,024 | | | 2,414,141 | |
| | | | | | |
Total interest income | | 15,654,182 | | | 11,098,535 | |
Interest Expense | | | | | | |
Interest on deposits | | (4,950,595 | ) | | (3,441,055 | ) |
Interest on Bank of Spain &Deposit Guarantee Fund | | (141,048 | ) | | (287,884 | ) |
Interest on short-term borrowings | | (2,411,310 | ) | | (1,372,614 | ) |
Interest on long term debt | | (1,415,449 | ) | | (1,077,813 | ) |
| | | | | | |
Total interest expense | | (8,918,402 | ) | | (6,179,366 | ) |
| | | | | | |
Net Interest Income | | 6,735,780 | | | 4,919,169 | |
| | | | | | |
Provision for loan losses | | (943,120 | ) | | (662,988 | ) |
| | | | | | |
Net Interest Income after provision for loan losses | | 5,792,660 | | | 4,256,181 | |
| | | | | | |
Non-interest income | | | | | | |
Contingent liabilities (collected) | | 176,745 | | | 159,510 | |
Collection and payments services (collected) | | 2,018,500 | | | 1,752,683 | |
Securities services (collected) | | 1,947,746 | | | 1,758,088 | |
Other transactions (collected) | | 526,133 | | | 489,063 | |
Ceded to other entities and correspondents (paid) | | (532,145 | ) | | (504,702 | ) |
Other transactions (paid) | | (196,983 | ) | | (275,373 | ) |
Gains (losses) from: | | | | | | |
Affiliated companies’ securities | | 149,901 | | | 965,939 | |
Investment securities | | 1,199,897 | | | 3,178,038 | |
Foreign exchange, derivatives and other, net | | (108,914 | ) | | 312,504 | |
Other income | | 1,444,981 | | | (947,053 | ) |
| | | | | | |
Total non-interest income | | 6,625,861 | | | 6,888,697 | |
| | | | | | |
Non-interest expense | | | | | | |
Salaries and employee benefits | | (3,602,242 | ) | | (3,252,101 | ) |
Occupancy expense of premise, depreciation and maintenance, net | | (844,079 | ) | | (728,605 | ) |
General and administrative expenses | | (1,745,057 | ) | | (1,135,679 | ) |
Amortization of goodwill | | — | | | — | |
Net provision for specific allowances | | (396,272 | ) | | (244,942 | ) |
Other expenses | | (1,499,046 | ) | | (1,451,492 | ) |
Minority shareholder’s interest | | (297,576 | ) | | (250,266 | ) |
| | | | | | |
Total non-interest expense | | (8,384,272 | ) | | (7,062,785 | ) |
| | | | | | |
Income Before Income Taxes | | 4,034,249 | | | 4,082,093 | |
| | | | | | |
Income tax expense | | (572,214 | ) | | (986,750 | ) |
| | | | | | |
Income before change of accounting principles | | 3,462,035 | | | 3,095,343 | |
Changes in accounting principles: pensions (note 59.A.10) | | (2,164,038 | ) | | — | |
Tax effect of changes in accounting principles | | 719,691 | | | — | |
Net Consolidated Income for the year | | 2,017,688 | | | 3,095,343 | |
| | | | | | |
3. Consolidated Statements of Changes in Stockholders equity -
Composition of stockholders’ equity (considering the final dividend) of December 31, 2005 and 2004, is presented in Note 30, The variation in stockholders’ equity under U.S. GAAP as of December 31, 2005 and 2004 is as follows:
F-121
| | | | | | |
| | | 2005 | | | 2004 | |
| | | Thousands of Euros | |
Balance at the beginning of the year | | 23,465,272 | | | 19,583,034 | |
| | | | | | |
Net income for the year | | 2,017,688 | | | 3,095,343 | |
Dividends paid | | (1,648,145 | ) | | (1,379,519 | ) |
Capital increase | | — | | | 1,998,750 | |
Other comprehensive income | | 1,902,616 | | | 280,120 | |
Foreign Currency Translation Adjustment | | 1,138,449 | | | (308,751 | ) |
Unrealized Gains on Securities | | 882,753 | | | 600,246 | |
Derivatives Instruments and Hedging Activities (SFAS 133) | | (118,586 | ) | | (11,375 | ) |
Other variations | | (362,018 | ) | | (112,456 | ) |
| | | | | | |
Balance at the end of the year | | 25,375,412 | | | 23,465,272 | |
| | | | | | |
(59.C) MAIN DISCLOSURES REQUIRED BY U.S. ACCOUNTING REGULATIONS FOR BANKS AND ADDITIONAL DISCLOSURES REQUIRED UNDER U.S. GAAP
1. Investment Securities-
The breakdown of the Group’s investment securities portfolio by issuer is as follows:
| | | | | | | | | | | | | | | | | | |
| | | 2005 | | | 2004 | |
| | | Book
Value | | Fair
Value(1) | | Unrealized
Gains | | Unrealized
Losses | | | Book
Value | | Fair
Value(1) | | Unrealized
Gains | | Unrealized
Losses | |
| | | Thousands of Euros | |
DEBT SECURITIES- | | | | | | | | | | | | | | | | | | |
TRADING PORTFOLIO(*) | | | | | | | | | | | | | | | | | | |
Domestic- | | 4,097,005 | | 4,097,005 | | — | | — | | | 8,284,966 | | 8,284,966 | | — | | — | |
Spanish Government | | 2,344,643 | | 2,344,643 | | — | | — | | | 6,776,570 | | 6,776,570 | | — | | — | |
Securities of, or guaranteed by, the Spanish government | | 257,041 | | 257,041 | | — | | — | | | 448,492 | | 448,492 | | — | | — | |
Other debt securities | | 1,495,321 | | 1,495,321 | | — | | — | | | 1,059,904 | | 1,059,904 | | — | | — | |
International | | 20,406,502 | | 20,406,502 | | — | | — | | | 22,111,613 | | 22,111,613 | | — | | — | |
TOTAL TRADING | | 24,503,507 | | 24,503,507 | | — | | — | | | 30,396,579 | | 30,396,579 | | — | | — | |
AVAILABLE FOR SALE PORTFOLIO (*) | | | | | | | | | | | | | | | | | | |
Domestic- | | 16,704,883 | | 16,704,883 | | 887,394 | | (228 | ) | | 19,059,038 | | 19,059,038 | | 842,245 | | (4,921 | ) |
Spanish Government | | 13,006,983 | | 13,006,983 | | 632,852 | | — | | | 14,776,179 | | 14,776,179 | | 813,361 | | (4,921 | ) |
Other Spanish Government securities | | 1,173,493 | | 1,173,493 | | 117,982 | | (181 | ) | | 1,561,653 | | 1,561,653 | | 2,083 | | — | |
Securities of, or guaranteed by, the Spanish government | | 2,902 | | 2,902 | | — | | — | | | 5,983 | | 5,983 | | — | | — | |
Other securities of the Spanish government | | 90,104 | | 90,104 | | 32,769 | | — | | | 93,416 | | 93,416 | | 24,970 | | — | |
Other debt securities | | 2,431,401 | | 2,431,401 | | 103,791 | | (47 | ) | | 2,621,807 | | 2,621,807 | | 1,831 | | — | |
International- | | 34,267,095 | | 34,267,095 | | 1,022,929 | | (52,208 | ) | | 25,978,189 | | 25,978,189 | | 548,650 | | (35,638 | ) |
United States- | | | | | | | | | | | | | | | | | | |
US Treasury | | 252,011 | | 252,011 | | — | | — | | | 14,486 | | 14,486 | | 398 | | — | |
Other US Government agencies | | 2,705,939 | | 2,705,939 | | 744 | | (13,576 | ) | | 1,031,575 | | 1,031,575 | | 18,970 | | (5,549 | ) |
States and political subdivisions | | 51,672 | | 51,672 | | 712 | | (298 | ) | | 56,254 | | 56,254 | | 440 | | — | |
Other government securities | | 50 | | 50 | | — | | — | | | — | | — | | — | | — | |
Other US securities | | 979,906 | | 979,906 | | 15,628 | | (6,929 | ) | | 647,877 | | 647,877 | | 10,513 | | (5,597 | ) |
Other countries- | | | | | | | | | | | | | | | | | | |
Securities of other foreign Governments | | 21,792,844 | | 21,792,844 | | 935,385 | | (27,469 | ) | | 16,407,867 | | 16,407,867 | | 485,894 | | (5,808 | ) |
Other debt securities | | 8,484,672 | | 8,484,672 | | 70,460 | | (3,936 | ) | | 7,820,130 | | 7,820,130 | | 32,435 | | (18,684 | ) |
TOTAL AVAILABLE FOR SALE | | 50,971,978 | | 50,971,978 | | 1,910,323 | | (52,436 | ) | | 45,037,227 | | 45,037,227 | | 1,390,895 | | (40,559 | ) |
HELD TO MATURITY PORTFOLIO | | | | | | | | | | | | | | | | | | |
Domestic- | | 1,205,138 | | 1,237,273 | | 32,613 | | (478 | ) | | 602,854 | | 619,519 | | 16,665 | | — | |
Spanish Government | | 363,022 | | 374,594 | | 11,572 | | — | | | 337,434 | | 346,357 | | 8,923 | | — | |
Other debt securities | | 842,116 | | 852,679 | | 21,041 | | (478 | ) | | 265,420 | | 273,162 | | 7,742 | | — | |
International | | 2,754,127 | | 2,797,975 | | 44,831 | | (983 | ) | | 1,618,648 | | 1,645,227 | | 26,579 | | — | |
TOTAL HELD TO MATURITY | | 3,959,265 | | 4,035,248 | | 77,444 | | (1,461 | ) | | 2,221,502 | | 2,264,746 | | 43,244 | | — | |
TOTAL DEBT SECURITIES | | 79,434,750 | | 79,510,733 | | 1,987,767 | | (53,897 | ) | | 77,655,308 | | 77,698,552 | | 1,434,139 | | (40,559 | ) |
| | | | | | | | | | | | | | | | | | |
F-122
| | | | | | | | | | | | | | | | | | |
| | | 2005 | | | 2004 | |
| | | Book Value | | Fair Value(1) | | Unrealized
Gains | | Unrealized
Losses | | | Book Value | | Fair
Value(1) | | Unrealized
Gains | | Unrealized
Losses | |
| | | Thousands of Euros | |
EQUITY SECURITIES | | | | | | | | | | | | | | | | | | |
TRADING PORTFOLIO(*) | | 6,245,534 | | 6,245,534 | | — | | — | | | 5,690,885 | | 5,690,885 | | — | | — | |
AVAILABLE FOR SALE PORTFOLIO(*) | | | | | | | | | | | | | | | | | | |
Domestic- | | 7,395,453 | | 7,458,601 | | 2,293,165 | | (8 | ) | | 7,002,196 | | 7,069,950 | | 2,094,095 | | (8 | ) |
Equity listed | | 6,190,118 | | 6,190,118 | | 2,137,737 | | — | | | 6,683,561 | | 6,683,561 | | 2,024,634 | | — | |
Equity unlisted | | 71,318 | | 134,466 | | 63,156 | | (8 | ) | | 110,876 | | 178,630 | | 67,762 | | (8 | ) |
Other equities | | 1,134,017 | | 1,134,017 | | 92,272 | | — | | | 207,759 | | 207,759 | | 1,699 | | — | |
International- | | 1,666,557 | | 1,682,802 | | 750,325 | | (20,134 | ) | | 964,121 | | 964,121 | | 155,575 | | — | |
United States- | | | | | | | | | | | | | | | | | | |
Equity listed | | 15,580 | | 15,580 | | — | | (3,955 | ) | | 41 | | 41 | | — | | — | |
Equity unlisted | | 10,149 | | 10,149 | | — | | — | | | 3,769 | | 3,769 | | — | | — | |
Other equities | | 24,025 | | 25,959 | | 1,934 | | — | | | 6,477 | | 6,477 | | — | | — | |
Other countries- | | | | | | | | | | | | | | | | | | |
Equity listed | | 1,312,564 | | 1,312,564 | | 734,080 | | (16,179 | ) | | 623,213 | | 623,213 | | 156,544 | | — | |
Equity unlisted | | 45,451 | | 45,451 | | — | | — | | | 270,135 | | 270,135 | | — | | — | |
Other equities | | 258,788 | | 273,099 | | 14,311 | | — | | | 60,486 | | 60,486 | | — | | — | |
TOTAL AVAILABLE FOR SALE | | 9,062,010 | | 9,141,403 | | 3,043,490 | | (20,142 | ) | | 7,966,317 | | 8,034,071 | | 2,250,639 | | (8 | ) |
TOTAL EQUITY SECURITIES | | 15,307,544 | | 15,386,937 | | 3,043,490 | | (20,142 | ) | | 13,657,202 | | 13,724,956 | | 2,250,639 | | (8 | ) |
| | | | | | | | | | | | | | | | | | |
TOTAL INVESTMENT SECURITIES | | 94,742,293 | | 94,897,662 | | 5,031,257 | | (74,039 | ) | | 91,312,510 | | 91,423,508 | | 3,684,778 | | (40,567 | ) |
| | | | | | | | | | | | | | | | | | |
| (1) | The Fair Values are determined based on year-end quoted market process for listed securities and on management’s estimate for unlisted securities. |
As of December 31, 2005 there are not unrealized losses that are not deemed to be other-than-temporarily impaired greater of twelve months.
An analysis of the book value of investments, exclusive of valuation reserves, by contractual maturity and fair value of the debt securities portfolio is shown below:
| | | | | | | | | | |
| | | 2005 |
| | | BOOK VALUE |
| | | Due in one
year or less | | Due after one
year through
five years | | Due after five
years through
ten years | | Due after ten
years | | Total |
| | | Thousand of euros |
TRADING PORTFOLIO* | | | | | | | | | | |
Domestic- | | 1,790,632 | | 1,231,242 | | 648,132 | | 427,000 | | 4,097,006 |
Spanish Government | | 1,365,593 | | 571,111 | | 349,175 | | 58,764 | | 2,344,643 |
Securities of, or guaranteed by, the Spanish government | | 143,115 | | 39,733 | | 68,697 | | 5,496 | | 257,041 |
Other debt securities | | 281,924 | | 620,398 | | 230,260 | | 362,740 | | 1,495,322 |
International | | 7,895,074 | | 9,552,771 | | 2,524,532 | | 434,124 | | 20,406,501 |
TOTAL TRADING PORTFOLIO | | 9,865,706 | | 10,784,013 | | 3,172,664 | | 861,124 | | 24,503,507 |
AVAILABLE FOR SALE PORTFOLIO* | | | | | | | | | | |
Domestic- | | 5,747,962 | | 4,049,077 | | 1,502,092 | | 5,405,753 | | 16,704,885 |
Spanish Government | | 5,071,720 | | 3,228,527 | | 872,908 | | 3,833,830 | | 13,006,984 |
Other Spanish Government securities | | 387,476 | | 400,953 | | 241,520 | | 143,544 | | 1,173,493 |
Securities of, or guaranteed by, the Spanish government | | 2,902 | | — | | — | | — | | 2,902 |
Other securities of the Spanish government | | 5,023 | | 2,805 | | — | | 82,277 | | 90,104 |
Other debt securities | | 280,842 | | 416,792 | | 387,665 | | 1,346,102 | | 2,431,401 |
International- | | 7,431,404 | | 11,562,932 | | 7,395,092 | | 7,877,667 | | 34,267,094 |
United States- | | | | | | | | | | |
US Treasury | | 27,136 | | 50 | | 224,770 | | 56 | | 252,011 |
Other US Government agencies | | 236,646 | | 861,179 | | 231,967 | | 1,376,147 | | 2,705,939 |
States and political subdivisions | | 3,534 | | 13,343 | | 2,058 | | 32,738 | | 51,673 |
Other government securities | | — | | 50 | | — | | — | | 50 |
Other US securities | | 265,799 | | 207,570 | | 77,488 | | 429,049 | | 979,905 |
Other countries- | | | | | | | | | | |
Securities of other foreign Governments | | 5,653,837 | | 8,480,822 | | 4,451,103 | | 3,207,083 | | 21,792,845 |
Other debt securities outside Spain | | 1,244,452 | | 1,999,918 | | 2,407,707 | | 2,832,595 | | 8,484,672 |
TOTAL AVAILABLE FOR SALE | | 13,179,366 | | 15,612,009 | | 8,897,184 | | 13,283,419 | | 50,971,979 |
HELD TO MATURITY PORTFOLIO | | | | | | | | | | |
Domestic- | | — | | 273,426 | | 866,085 | | 65,627 | | 1,205,138 |
Spanish Government | | — | | 182,690 | | 180,332 | | — | | 363,022 |
Other debt securities | | — | | 90,736 | | 685,753 | | 65,627 | | 842,116 |
International - | | 282,874 | | 853,031 | | 1,546,023 | | 72,199 | | 2,754,127 |
TOTAL HELD TO MATURITY | | 282,874 | | 1,126,457 | | 2,412,108 | | 137,826 | | 3,959,265 |
TOTAL | | 23,147,946 | | 27,522,479 | | 14,481,956 | | 14,290,061 | | 79,434,751 |
| * | As we describe in Note 2.2.c the book value a market value are the same for “Trading portfolio” and “Available for sale portfolio” |
F-123
| | | | | | | | | | |
| | | 2005 |
| | | MARKET VALUE |
| | | Due in
one year
or less | | Due after one
year through
five years | | Due after five
years through
ten years | | Due after
ten years | | Total |
| | | Thousand of euros |
HELD TO MATURITY PORTFOLIO | | | | | | | | | | |
Domestic- | | — | | 276,116 | | 892,941 | | 68,216 | | 1,237,273 |
Spanish Government | | — | | 185,002 | | 189,592 | | — | | 374,594 |
Other debt securities | | — | | 91,114 | | 703,349 | | 68,216 | | 862,679 |
International - | | 282,841 | | 858,877 | | 1,578,956 | | 77,301 | | 2,797,975 |
TOTAL HELD TO MATURITY | | 282,841 | | 1,134,993 | | 2,471,897 | | 137,826 | | 4,035,248 |
| | | | | | | | | | |
| | | 2004 |
| | | BOOK VALUE |
| | | Due in one
year or less | | Due after one
year through
five years | | Due after five
years through
ten years | | Due after
ten years | | Total |
| | | Thousand of euros |
TRADING PORTFOLIO* | | | | | | | | | | |
Domestic- | | 3,995,951 | | 2,819,838 | | 580,275 | | 888,901 | | 8,284,966 |
Spanish Government | | 3,325,192 | | 2,294,645 | | 402,924 | | 753,808 | | 6,776,570 |
Securities of, or guaranteed by, the Spanish government | | 311,020 | | 137,472 | | — | | — | | 448,492 |
Other debt securities | | 359,738 | | 387,721 | | 177,351 | | 135,093 | | 1,059,904 |
International | | 7,541,491 | | 9,865,558 | | 4,258,965 | | 444,076 | | 22,111,613 |
TOTAL TRADING PORTFOLIO | | 11,537,443 | | 12,685,396 | | 4,839,240 | | 1,334,500 | | 30,396,579 |
AVAILABLE FOR SALE PORTFOLIO* | | | | | | | | | | |
Domestic- | | 3,501,940 | | 9,019,584 | | 1,669,789 | | 4,867,724 | | 19,059,037 |
Spanish Government | | 2,812,608 | | 8,294,746 | | 1,068,639 | | 2,600,186 | | 14,776,179 |
Other Spanish Government securities | | 601,778 | | 469,323 | | 276,610 | | 213,942 | | 1,561,652 |
Securities of, or guaranteed by, the Spanish government | | 5,983 | | — | | — | | — | | 5,983 |
Other securities of the Spanish government | | 3,285 | | 11,672 | | 14,068 | | 64,391 | | 93,416 |
Other debt securities | | 78,286 | | 243,843 | | 310,472 | | 1,989,205 | | 2,621,807 |
| * | As we describe in Note 2.2c the book value a market value are the same for “Traiding portfolio” and “Available for sale portfolio” |
F-124
| | | | | | | | | | |
| | | 2004 |
| | | BOOK VALUE |
| | | Due in one
year or less | | Due after one
year through
five years | | Due after five
years through
ten years | | Due after ten
years | | Total |
| | | Thousand of euros |
International- | | 5,460,387 | | 9,069,876 | | 5,814,641 | | 5,633,288 | | 25,978,191 |
United States- | | | | | | | | | | |
US Treasury | | 14,245 | | 34 | | 41 | | 166 | | 14,486 |
Other US Government agencies | | 327,142 | | 57,685 | | 70,029 | | 576,719 | | 1,031,575 |
States and political subdivisions | | 383 | | 12,495 | | — | | 43,376 | | 56,254 |
Other government securities | | — | | — | | — | | — | | — |
Other US securities | | 96,839 | | 129,706 | | 85,791 | | 335,542 | | 647,877 |
Other countries- | | | | | | | | | | |
Securities of other foreign Governments | | 4,217,177 | | 6,838,969 | | 3,609,275 | | 1,742,447 | | 16,407,868 |
Other debt securities outside Spain | | 804,601 | | 2,030,987 | | 2,049,506 | | 2,935,038 | | 7,820,131 |
TOTAL AVAILABLE FOR SALE | | 8,962,326 | | 18,089,460 | | 7,484,430 | | 10,501,012 | | 45,037,228 |
HELD TO MATURITY PORTFOLIO | | | | | | | | | | |
Domestic- | | — | | 195,496 | | 352,104 | | 55,254 | | 602,854 |
Spanish Government | | — | | 177,793 | | 138,296 | | 21,345 | | 337,434 |
Other debt securities | | — | | 17,703 | | 213,808 | | 33,909 | | 265,420 |
International - | | 150,079 | | 876,579 | | 487,296 | | 104,694 | | 1,618,648 |
TOTAL HELD TO MATURITY | | 150,079 | | 1,072,075 | | 839,400 | | 159,948 | | 2,221,502 |
TOTAL | | 20,649,848 | | 31,846,931 | | 13,163,070 | | 11,995,459 | | 77,655,309 |
| | | | | | | | | | |
| | | 2004 |
| | | MARKET VALUE |
| | | Due in
one year
or less | | Due after one
year through
five years | | Due after five
years through
ten years | | Due after
ten years | | Total |
| | | Thousand of euros |
HELD TO MATURITY PORTFOLIO | | | | | | | | | | |
Domestic- | | — | | 198,695 | | 363,862 | | 56,962 | | 619,519 |
Spanish Government | | — | | 180,537 | | 144,129 | | 21,691 | | 346,357 |
Other debt securities | | — | | 18,158 | | 219,733 | | 35,271 | | 273,162 |
International - | | 150,112 | | 882,243 | | 502,535 | | 110,337 | | 1,645,227 |
TOTAL HELD TO MATURITY | | 150,112 | | 1,080,938 | | 866,397 | | 167,299 | | 2,264,746 |
As of December 2005 and 2004, the carrying values of non-traded (unlisted) equity securities available for sale portfolio amounted to €210,924 and €403,187 thousand, respectively.
Under both IFRS and U.S. GAAP, the methodology used to estimate the fair value of non-traded or unlisted securities is as follows:
| | • | | Debt securities: fair value is considered to be the present value of the cash flows, using market interest rates (discounted cash flows). |
| | • | | Equity securities: underlying book value is the general rule under Spanish GAAP. As previously explained in the general comments, in some cases in which trigger events indicate that a specific investment could be impaired, a specific valuation of fair value is used and all available factors are considered by management to determine the fair value both under Spanish and U.S. GAAP. If it is available a valuation of the company, it is used as a better measure of fair value under both Spanish and U.S. GAAP. |
These methodologies include an evaluation of credit risk, market conditions (volatility, interest rate evolution, macroeconomic variables, etc…) or futures expectations.
As of December 2004, unrealized losses of debt securities and equity securities correspond basically to Latinamerican securities not listed held by Group BBVA, respectively.
F-125
2. Loans and Accounting by Creditors for Impairment of a Loan-
The balance of the recorded investment in impaired loans (substandard loans) and of the related valuation allowance as of December 31, 2005 and 2004 is as follows:
| | |
| | | 2005 |
| | | Thousands of
Euros |
Impaired loans requiring no reserve | | 55,044 |
Impaired loans requiring valuation allowance | | 2,291,028 |
| | |
Total impaired loans | | 2,346,072 |
| | |
Valuation allowance on impaired loans | | 1,267,521 |
| | |
The roll-forward of allowance is shown in Note 28 under IFRSs. The reconciliation item to U.S. GAAP is in Note 59.A.7
| | |
| | | 2005 |
| | | Thousands
of Euros |
Interest revenue that would have been recorded if accruing | | 1,051,687 |
Net interest revenue recorded | | 148,098 |
3. Investments In And Indebtedness Of And To Affiliates-
See Note 18 and Exhibit 8.1 for detailed information of investments in associates. Aggregated summarized financial information with respect to significant affiliated companies under IFRS for the year ended December 31, 2005 is presented below:
| | | | | |
| | | Thousands of Euros | |
2005 | | Equity method | | Proportional Method | |
Net sales | | 762,674 | | 2,562 | |
Operating income | | 158,606 | | (617 | ) |
Net income | | 121,752 | | (978 | ) |
Current assets | | 2,251,259 | | 2,111 | |
Noncurrent assets | | 11,815,458 | | 72,897 | |
Current liabilities | | 1,543,243 | | 432 | |
Non-current liabilities | | 12,523,475 | | 74,576 | |
The following table shows the book value and fair value of quoted investments companies accounted for using the equity method in the Group:
| | | | | | | | |
| | | Thousands of Euros |
| | | Book value | | Fair value |
Companies- | | 2005 | | 2004 | | 2005 | | 2004 |
Banca Nazionale del Lavoro, S.P.A | | 726,400 | | 1,105,832 | | 1,234,415 | | 970,294 |
Tubos Reunidos, S.A. | | 57,775 | | 20,493 | | 119,921 | | 9,942 |
4. Deposits-
The breakdowns of deposits from credit entities and customers as of December 31, 2005 and 2004, by domicile and type are included in Note 26.
As of December 31, 2005 and 2004, the time deposits, both domestic and international, (other than interbank deposits) in denominations of €80 thousand (approximately US$ 100 thousand) or more amounted to €28.8 billion and €50.1 billion, respectively.
F-126
5. Short-Term Borrowings-
Under IFRS, the information about “Short-Term borrowings” is not required as it is under S-X Regulations. Therefore this information is not disclosed in the preceding pages. The analysis of short-term borrowings is as follows:
| | | | | | | | | | |
| | | At December 31,
2005 | | | At December 31,
2004 | |
| | | Amount | | Average
Rate | | | Amount | | Average
Rate | |
| | | (in thousands of euro, except
percentages) | |
Securities sold under agreements to repurchase (principally Spanish Treasury bills): | | | | | | | | | | |
At December 31 | | 48,254 | | 3.54 | % | | 38,529 | | 3.36 | % |
Average during year | | 38,467 | | 3.52 | % | | 43,488 | | 3.44 | % |
Maximum quarter-end balance | | 48,254 | | — | | | 49,642 | | — | |
Bank promissory notes: | | | | | | | | | | |
At December 31 | | 7,569 | | 2.58 | % | | 6,255 | | 2.20 | % |
Average during year | | 6,894 | | 2.34 | % | | 5,675 | | 2.08 | % |
Maximum quarter-end balance | | 7,569 | | — | | | 6,255 | | — | |
Bonds and subordinated debt | | | | | | | | | | |
At December 31 | | 14,273 | | 3.54 | % | | 7,082 | | 2.81 | % |
Average during year | | 10,324 | | 3.61 | % | | 7,628 | | 2.39 | % |
Maximum quarter-end balance | | 14,273 | | — | | | 9,568 | | — | |
Total short-term borrowings at December 31 | | 70,096 | | 3.44 | % | | 51,866 | | 3.14 | % |
At December 31, 2005 and 2004, short-term borrowings include €23,040,106 thousand and €21,050,740 thousand, respectively, of securities sold under agreements to repurchase from Bank of Spain and other Spanish and foreign financial Institutions.
6. Long Term Debt-
See Notes 26 and 36.
7. Derivative Financial Instruments and Hedging Activities-
The breakdown of the Derivative Financial Instruments under IFRS is shown in Notes 11 and 16.
7.1. Objectives for the holding of positions in derivatives and strategies for the achievement of these objectives
The holding of positions in derivatives is the result of the Group’s need to manage the risks incurred by it in the course of its normal business activities. Derivatives represent another of the tools available to the Group, and are necessary for the management of:
| | • | | Market Risk: Positions taken by the Group mostly in order to satisfy its customers’ needs (franchise model). In most cases the derivatives used are: Interest-Rate Derivatives, to manage the risks arising as a result of long- and short-term variations in interest rates; Exchange-Rate Derivatives, to mitigate exposure to exchange-rate fluctuations; and Equity Security Derivatives, to manage price risks. |
| | • | | Structural Interest-Rate Risk: Structural interest-rate risk is defined as an entity’s exposure to variations in market interest rates arising from mismatches in the maturity and repricing dates of the entity’s assets and liabilities, including derivatives. The Asset and Liability Committee (ALCO) is the body responsible for actively managing BBVA’s balance sheet in order to stabilize net interest income without prejudice to net asset value. Basically, the derivatives used to achieve this goal are interest-rate derivatives. |
| | • | | Structural Exchange-Rate Risk: An entity’s structural exchange-rate risk refers to the potential losses in the value of structural positions arising from variations in exchange rates. The Asset and Liability Committee (ALCO) is the body responsible for managing this risk, for which purpose it uses exchange- and interest-rate derivatives. |
7.1.1. Risk Management Policies
Market Risk
Managed by the Central Market Risk Unit, market risk is to be found in the Group’s market or treasury activities, which are characterized by the holding of positions sensitive to fluctuations in market prices. The Market Risk Unit, which is organically separate from and independent of the business units, is responsible for adapting and administering risk measurement and control tools and for regularly monitoring that the business units comply with the risk limits and policies. The Unit also periodically reports to the Standing Committee, the Lending Committee, the Management Committee and the Internal Risk Committee on levels of risk, results and the degree of compliance with such limits in the Group, at individual and aggregate level.
F-127
One of the basic pillars of the BBVA Group’s market risk management model is the limit structure, which consists of an overall VaR limit for each business unit, supplemented by a series of specific sublimits by desk, business line, and risk or product type.
Proposals for the overall limits for all the business units and for certain sublimits are approved by the Standing Committee. The business units, together with the Risk Area, are responsible for distributing these limits by desk, business line or risk type. These VaR limits are supplemented by others based on non-statistical measures such as delta sensitivity, nominal exposure or stop-loss on the results of the markets areas. This limit structure is part of the Group’s general control system, which includes the definition of a variety of prior warning signs which trigger the contingency plans to attempt to prevent situations that might adversely affect the Bank’s results.
The purpose of the market risk management and measurement model currently in place at the BBVA Group is to measure both general market risk and specific risks, for which the Group employs the Value-at-Risk (VaR) methodology, which aims to measure the maximum loss that can occur in the value of the portfolio as a result of fluctuations in general conditions on the financial markets, as shown by changes in interest rates, exchange rates and equity security prices, if the portfolio is maintained for a certain period. To these three major risk factors must be added basis risk (which arises, for example, when there are debt positions the interest-rate risk on which is hedged by swap transactions, generating a risk because there is a variable spread between the interest-rate curves relevant for the valuation of these positions) and spread risk (associated with corporate securities or credit derivatives on corporate issuers), together with, in the case of option positions, volatility and convexity risk and, in certain cases, correlation risk, since all the above are risk factors that might influence the market prices of certain products.
The VaR model used is the covariance matrix, with a confidence level of 99% and a time horizon of one day, improved to take into account convexity and other risks associated with option positions and structured derivative products. In addition, periodical supplementary settlement VaR calculations are performed for certain business units, which include adjustments to factor in the specific liquidity of the position, taking into account the liquidity conditions on the financial markets at any time.
The Group has continued to implement its new risk measurement platform which, in addition to the advantage of enabling market risk to be integrated with credit risk, thus facilitating an overall view of existing risk, makes it possible to calculate market risk using the covariance matrix, the historical simulation and the Monte Carlo simulation methodologies.
The market risk measurement model includes a back-testing or ex post contrast program, which to a certain extent guarantees the suitability of the risk measures that are performed. In order to validate the VaR measurement system, comparisons are made, inter alia, of the levels of ex ante risk provided by the model with the ex post results obtained by the units each day.
Stress-testing is an essential supplementary tool for market risk management, especially in the wake of the recent crises in Argentina and Brazil and the upheaval in the financial markets after the events of September 11, 2001. Accordingly, in order to strengthen risk management and control, the BBVA Group periodically calculates the exposure to losses of each business unit in response to events beyond the predetermined confidence interval for the daily measurement of market risk. This enables senior management to ascertain whether the level of exposure to losses under these potential scenarios fits in with the Bank’s appetite for risk, and to design, on the basis of that exposure, the contingency plans that must be implemented immediately if an unusual situation similar to those examined should occur.
Structural Interset-rate risk
The responsibility for controlling and monitoring structural interest-rate risk falls on the Risk Area, which periodically measures this risk from a dual perspective: on the one hand, from the net interest income standpoint and, on the other, from that of the economic value. In the former case, net interest income is projected for the next 12 months; and in the case of the analysis of economic value, a discounted current value is calculated of expected future flows in the balance sheet. The impacts of fluctuations in interest rates on both measures are calculated by using both parallel displacements in interest-rate curves and shocks that take into account changes of slope and curvature. Several interest-rate curve simulation methodologies have been developed to determine these changes of slope and curvature and these methodologies are used to calculate expected losses in net interest income and in economic value, with a confidence level of 99%.
Structural Exchange-Rate Risk
The Risk Area periodically measures structural exchange-rate risk using a statistical simulation model that includes certain exchange-rate crisis scenarios to which certain estimated probabilities of occurrence are assigned. Another factor in the model is the projection at one year of the exchange rates of the currencies involved. Every month the total risk is calculated in annual VaR terms with a confidence interval of 99%.
F-128
7.1.2. Transactions whose risks are hedged for U.S. GAAP purposes
| | 1. | Available for sale fixed rate debt securities: this risk is hedged using interest-rate derivatives (interest-rate swaps through which the fixed-coupon of the bond is exchanged for a variable return). |
| | 2. | Long term fixed rate debt issued: this risk is hedged using interest-rate derivatives (interest-rate swaps which replicate, on the collection leg, the payment resulting from the issue and transform it into a variable cost for the Bank). |
| | 3. | Foreign currency of a net investment in a foreign subsidiary: the risk of a net investment in a foreign operation is exchanged for the currency in which the investment is denominated. |
| | 4. | Available for sale equity securities: this risk is hedged using equity swaps through which the risk of variation in the price per books of the portfolio is transferred to the counterparty. |
| | 5. | Fixed rate loans: this risk is hedged using interest-rate derivatives (interest-rate swaps through which the fixed-coupon of the loans is exchanged for a variable return). |
| | 6. | Floating interest rate loans in foreign currencies: this risk is hedged using currency swaps. |
7.2. Accounting for Derivative Instruments and Hedging Activities
Under SFAS 133 the accounting for changes in fair value of a derivative instrument depends on its intended use and the resulting designation.
If the derivative is designated as a fair value hedge, the changes in the fair value of the derivative and the hedged item attributable to the hedged risk are recognized in earnings.
If the derivative is designated as a cash flow hedge, the effective portions of changes in the fair value of the derivative are recorded in Other Comprehensive Income and are recognized in the income statement when the hedged item affects earnings. Ineffective portions of changes in the fair value of cash flow hedges are recognized in earnings.
The gain or loss on a hedging derivative instrument that is designated as, and is effective as, an economic hedge of the net investment in a foreign operation is reported in the same way as a translation adjustment to the extent it is effective as a hedge. The ineffective portion of net investment hedges is reported in earnings.
Hedging transactions must be formally documented, designated and the company must describe the way the effectiveness is going to be assessed.
On the other hand when the derivative is designated as a trading transaction the changes in the fair value must be recognized currently in earnings.
7.3. Additional disclosures required by U.S. GAAP: Fair Value Methods
The methods used by the Group in estimating the fair value of its derivative instruments are as follows:
Forward purchases/sales of foreign currency
Estimated fair value of these financial instruments is based on quoted market prices.
Forward purchases/sales of government debt securities
Estimated fair value of these financial instruments is based on quoted market prices, since they are mostly traded in organized markets.
Options and financial futures
Derivatives traded in organized markets are valued based on quoted market prices.
For options and futures traded in OTC markets, the fair value is estimated based on theoretical year-end closing prices. These year-end closing prices are calculated according to generally accepted models estimating the amounts the Group would receive or pay based upon the yield curve/ volatilities prevailing at year-end or prices.
F-129
Forward rate agreements and interest rate swaps
Fair values of these contracts are estimated based on the discounted future cash flows related to the interest rates to be collected or paid, using for this purpose the yield curve prevailing at year-end.
8. Pension liabilities-
See Note 2.2.f for a detail of the pension commitments under IFRS.
9. Disclosures About Fair Value Of Financial Instruments (SFAS 107)-
As required by SFAS No. 107,Disclosures about Fair Value of Financial Instruments, (“SFAS No. 107”) the Group presents estimate fair value information about financial instruments for which it is practicable to estimate that value in Note 37. Fair value of a financial instrument is the amount for which the instrument could be exchanged in a current transaction between willing parties, other than in a forced or liquidation sale. Fair value is best determined by values quoted through active trading markets. Active trading markets are characterized by numerous transactions of similar financial instruments between willing buyers and willing sellers. Because no active trading market exists for various types of financial instruments, many of the fair values disclosed were derived using present value discounted cash flow or other valuation techniques. As a result, the Group’s ability to actually realize these derived values cannot be assured.
The estimated fair values disclosed under SFAS No. 107 may vary significantly between institutions based on the estimates and assumptions used in the various valuation methodologies. SFAS No. 107 excludes disclosure of goodwill, core deposits, nonfinancial assets such as fixed assets as well as certain financial instruments such as investments in affiliated companies.
Accordingly, the aggregate estimate fair values presented do not represent the underlying value of the Group.
The following methods and assumptions were used by the Group in estimating its fair value disclosures for financial instruments for which it is practicable to estimate such value:
a) Cash and due from banks
For these short-term instruments, the carrying amount is a reasonable estimate of fair value.
b) Interest-bearing deposits in other banks and securities purchased under agreement to resell
The fair value represents the present value of estimated future cash flows discounted at the average year-end market rates for each type of instrument.
c) Investment securities
c.1) Fixed income:
(i) Listed securities: at closing market prices as of December 31, 2005 and 2004.
(ii) Unlisted securities: on the basis of market prices of other listed fixed-income securities of similar interest rate, credit risk and maturity. If no similar listed fixed-income securities can be identified, the fair value is estimated by discounting future cash-flows using year-end rates based on market rates available on securities with similar credit and maturity characteristics.
c.2) Equity securities:
(i) Listed securities with less than 3% ownership: fair values are based on the 2005 and 2004 closing market price.
(ii) Unlisted securities: at underlying book value per the December 31, 2005 and 2004 financial statements of each investee, or otherwise based on the latest financial statements currently available.
d) Loans and leases
The fair value of the Group’s loan portfolio is based on the credit and interest rate characteristics of the individual loans within each sector of the portfolio. The fair value of loans was estimated by discounting scheduled cash flows through the estimated maturity using prevailing market rates at year-end, and is implemented as follows:
d.1) The estimate of the provision for probable loan losses includes consideration of risk premiums applicable to various types of loans based on factors such as the current situation of the economic sector in which each borrower operates,
F-130
the economic situation of each borrower and guarantees obtained. Accordingly, the allowance for probable loan losses is considered a reasonable estimate of the discount required to reflect the impact of credit risk.
d.2) For fixed and floating-rate loans for which the interest rate was similar to the average rates available for each type of loan (such as commercial or mortgage loans) as of December 31, 2005 and 2004, the carrying amount, net of the related allowance for probable loan losses, is considered a reasonable estimate of fair value.
d.3) For the remaining loans which the Group determined were at rates different to those currently offered, the fair values are estimated as the present value of future cash flows discounted at the average year-end market interest rates at which similar loans are being granted to borrowers with similar credit ratings and remaining maturities.
e) Deposits and Short Term Borrowings
The fair value represents the present value of estimated future cash flows discounted at the average year-end market rates for each type of instrument.
f) Long-Term Debt
The fair value is estimated on the basis of the discounted present value of the cash flows over the remaining term of such debt. The discount rates were determined based on market rates available as of December 31, 2005 and 2004 on debt with similar credit and maturity characteristics of the Group’s.
g) Commitments and Contingencies
g.1) Guarantees and other sureties provided and documentary credits:
It is estimated that the differential, if any, between the fee charged by the Group for these transactions and the average year-end market fee would not give rise to a material difference.
g.2) Derivative Products:
The fair value of these products as of December 31, 2005 and 2004, considering the related discounted cash-flows and the year-end prevailing rates and market values is presented in Note 11.
10. Segment Information-
In addition to Note 7, provide the following disclosures about segment information:
| | • | | Retail Banking in Spain and Portugal: formed by BBVA’s retail banking, asset management and private banking businesses in Spain and Portugal, covering the residential customer and small and medium entities (“SME”) segments in these markets. This area also includes the Finanzia / Uno-e group (which specializes in the e-banking business, consumer financing and card product distribution), BBVA Portugal, our private banking businesses, our mutual and pension fund management and insurance businesses. |
| | • | | Wholesale and Investment Banking: includes BBVA’s business activities with large companies and institutions through national and international corporate banking and institutional banking. In addition, this business area includes our trading businesses located in Spain, Europe and New York, our equity distribution and origination business and security deposit and custody service business, as well as the real estate business which is not developed by the group through interests in large corporations. |
| | • | | Banking in America: includes the operations of each of our subsidiary banks in Latin America and their investee companies, including pension management companies and insurance companies, as well as our international private banking business. |
| | • | | Corporate Activities and Other: includes our holdings in large industrial corporations and in financial entities, as well as the activities and results of our support units, such as the Assets and Liabilities Management Committee (ALCO). In addition, this business area includes our other operations or activities that, by their nature, cannot be assigned to another business area, such as country risk provisions and amortization of goodwill (except for those relating to the holdings owned by the Business and Real Estate Projects unit, which is included in the Wholesale and Investment Banking business area). |
This structure of areas is in line with the internal organization established to manage and monitor the businesses in the BBVA Group during the year 2005. The balance for the financial year 2004, were drawn up following the same criteria.
F-131
The business areas contribution to net attributable profit and total assets are shown in the following tables:
| | | | | | |
| | | 2005 | | | 2004 | |
| | | Millions of Euros | |
Business Area contribution to net attributable profit | | | | | | |
Retail Banking | | 1,614 | | | 1,426 | |
Wholesale and Investment Banking | | 592 | | | 404 | |
Banking in América | | 1,819 | | | 1,195 | |
Corporate Activities and others | | (219 | ) | | (102 | ) |
| | | | | | |
Net Attributable profit | | 3,806 | | | 2,923 | |
| | |
| | | 2005 | | | 2004 | |
| | | Millions of Euros | |
Business Area contribution to total assets | | | | | | |
Retail Banking | | 145,723 | | | 127,347 | |
Wholesale and investment Banking | | 164,730 | | | 147,281 | |
Banking in America | | 104,712 | | | 74,845 | |
Corporate Activities | | 35,903 | | | 20,266 | |
| | | | | | |
Total assets for reportable segments | | 451,068 | | | 369,739 | |
Intearea Positions | | (58,679 | ) | | (40,298 | ) |
Consolidated total assets | | 392,389 | | | 329,441 | |
The differences between “Total Assets for Reportable Segments” and “Consolidated Total Assets” are due to the following reasons:
| | • | | Balance sheet for reportable segments is designed with management criteria which differs from balance sheet formats for Banks required by Bank of Spain. |
| | • | | Balance sheet for reportable segments does not eliminate intearea positions. |
| | • | | Balance sheet for reportable segments does not consider the intra-group eliminations made during the consolidation process. As a consequence the amounts of “Total Assets for Reportable Segments” significantly differ from “Consolidated Total Assets”. |
The accounting policies of the segments are principally the same as those described in Note 2. The accounting structure has been adjusted to the management structure, through the corresponding internal adjustments. Operating costs are divided among all the business areas in accordance with the scales that measure their distribution on the basis of the nature of the spending and consumption variables. This is also applied to ordinary corporate cost. The business areas are not affected by corporate decisions, such as the treatment of goodwill generated in investment or the constitution of extraordinary provisions.
| | | | | | | | | | | | | | | | | | | | | | | | | | | |
(Millions of Euros) | | Retail Banking in Spain and
Portugal | | | Wholesale and
Investment Banking | | | America | |
| | 2005 | | | 2004 | | | 05-04 % | | | 2005 | | | 2004 | | | 05-04 % | | | 2005 | | | 2004 | | | 05-04 % | |
NET INTEREST INCOME | | 3,182 | | | 3,015 | | | 5.6 | | | 440 | | | 423 | | | 4.1 | | | 3,797 | | | 2,865 | | | 32.6 | |
Net fee income | | 1 | | | 1 | | | (29.7 | ) | | 51 | | | 104 | | | (50.9 | ) | | (1 | ) | | 0 | | | n.m. | |
Net income by the equity method | | 1,602 | | | 1,477 | | | 8.5 | | | 227 | | | 190 | | | 19.2 | | | 2,056 | | | 1,735 | | | 18.5 | |
Income from Insurance activities | | 309 | | | 257 | | | 20.3 | | | — | | | — | | | — | | | 241 | | | 171 | | | 40.7 | |
BASIC MARGIN | | 5,094 | | | 4,750 | | | 7.2 | | | 718 | | | 717 | | | 0.1 | | | 6,092 | | | 4,771 | | | 27.7 | |
Net trading income | | 108 | | | 55 | | | 96.3 | | | 418 | | | 196 | | | 113.0 | | | 349 | | | 248 | | | 40.7 | |
ORDINARY REVENUES | | 5,203 | | | 4,805 | | | 8.3 | | | 1,136 | | | 662 | | | 24.4 | | | 6,441 | | | 5,019 | | | 28.3 | |
Net revenues from non-financial activities | | 23 | | | 27 | | | (16.2 | ) | | 95 | | | (233 | ) | | 17.4 | | | 6 | | | 4 | | | 65.2 | |
Personnel and general administrative expenses | | (2,250 | ) | | (2,179 | ) | | 3.2 | | | (360 | ) | | (233 | ) | | 11.1 | | | (2,767 | ) | | (2,221 | ) | | 24.6 | |
Depreciation and amortization | | (103 | ) | | (107 | ) | | (3.9 | ) | | (7 | ) | | (0 | ) | | 5.4 | | | (226 | ) | | (226 | ) | | (0.1 | ) |
Other operating income and expenses (net) | | 49 | | | 36 | | | 35.6 | | | 22 | | | 6 | | | n.m. | | | (163 | ) | | (144 | ) | | 13.3 | |
OPERATING PROFIT | | 2,922 | | | 2,583 | | | 13.1 | | | 886 | | | 662 | | | 33.9 | | | 3,291 | | | 2,431 | | | 35.4 | |
Impairment losses on financial assets (net) | | (474 | ) | | (409 | ) | | 15.9 | | | (115 | ) | | (233 | ) | | (50.8 | ) | | (394 | ) | | (310 | ) | | 27.2 | |
. Loan loss provisions | | (476 | ) | | (409 | ) | | 16.3 | | | (114 | ) | | (233 | ) | | (50.8 | ) | | (359 | ) | | (310 | ) | | 15.7 | |
. Other | | 2 | | | (0 | ) | | n.m. | | | (0 | ) | | (0 | ) | | n.m. | | | (36 | ) | | 0 | | | n.m. | |
Provisions (net) | | 0 | | | (4 | ) | | n.m. | | | 5 | | | 6 | | | (18.1 | ) | | (132 | ) | | (187 | ) | | (29.5 | ) |
Other income/losses (net) | | 21 | | | 12 | | | 80.4 | | | 29 | | | 57 | | | (49.1 | ) | | 3 | | | 2 | | | 69.4 | |
. From disposal of equity holdings | | 11 | | | 3 | | | n.m. | | | 16 | | | 41 | | | (60.3 | ) | | 2 | | | 16 | | | (87.7 | ) |
. Other | | 10 | | | 9 | | | 14.5 | | | 13 | | | 16 | | | (19.5 | ) | | 1 | | | (14 | ) | | n.m. | |
PRE - TAX PROFIT | | 2,469 | | | 2,181 | | | 13.2 | | | 806 | | | 493 | | | 63.7 | | | 2,768 | | | 1,936 | | | 43.0 | |
Corporate income tax | | (852 | ) | | (751 | ) | | 13.4 | | | (211 | ) | | (85 | ) | | 148.7 | | | (725 | ) | | (534 | ) | | 36.0 | |
NET INCOME | | 1,618 | | | 1,430 | | | 13.1 | | | 596 | | | 408 | | | 46.0 | | | 2,043 | | | 1,402 | | | 45.7 | |
Minority interests | | (4 | ) | | (4 | ) | | 13.1 | | | (4 | ) | | (4 | ) | | (10.1 | ) | | (223 | ) | | (208 | ) | | 7.5 | |
NET ATTRIBUTABLE PROFIT | | 1,614 | | | 1,427 | | | 13.1 | | | 592 | | | 404 | | | 46.6 | | | 1,820 | | | 1,195 | | | 52.3 | |
F-132
| | | | | | | | | | | | | | | | | | |
(Millions of Euros) | | Corporate activities and others | | | Total Group | |
| | 2005 | | | 2004 | | | 05-04 % | | | 2005 | | | 2004 | | | 05-04 % | |
NET INTEREST INCOME | | (212 | ) | | (143 | ) | | 47.8 | | | 7,208 | | | 6,160 | | | 17.0 | |
Net fee income | | 71 | | | (8 | ) | | n.m. | | | 121 | | | 97 | | | 25.2 | |
Net income by the equity method | | 56 | | | 11 | | | n.m. | | | 3,940 | | | 3,413 | | | 15.4 | |
Net fee income | | (63 | ) | | (38 | ) | | 68.0 | | | 487 | | | 391 | | | 24.7 | |
BASIC MARGIN | | (148 | ) | | (178 | ) | | (16.7 | ) | | 11,756 | | | 10,060 | | | 16.9 | |
Net trading income | | 391 | | | 560 | | | (30.1 | ) | | 1,267 | | | 1,060 | | | 19.6 | |
ORDINARY REVENUES | | 243 | | | 382 | | | (36.4 | ) | | 13,024 | | | 11,120 | | | 17.1 | |
Net revenues from non-financial activities | | 2 | | | 15 | | | (86.5 | ) | | 126 | | | 126 | | | (0.6 | ) |
Personnel and general administrative expenses | | (386 | ) | | (374 | ) | | 3.3 | | | (5,762 | ) | | (5,098 | ) | | 13.0 | |
Depreciation and amortization | | (113 | ) | | (108 | ) | | 4.1 | | | (449 | ) | | (448 | ) | | 0.1 | |
Other operating income and expenses (net) | | (23 | ) | | (0 | ) | | n.m. | | | (115 | ) | | (110 | ) | | 4.6 | |
OPERATING PROFIT | | (277 | ) | | (85 | ) | | 224.7 | | | 6,823 | | | 5,591 | | | 22.0 | |
Impairment losses on financial assets (net) | | 129 | | | (6 | ) | | n.m. | | | (854 | ) | | (958 | ) | | (10.8 | ) |
. Loan loss provisions | | 136 | | | 168 | | | (19.0 | ) | | (813 | ) | | (784 | ) | | 3.7 | |
. Other | | (7 | ) | | (174 | ) | | (95.8 | ) | | (41 | ) | | (174 | ) | | (76.3 | ) |
Provisions (net) | | (328 | ) | | (666 | ) | | (50.8 | ) | | (454 | ) | | (851 | ) | | (46.6 | ) |
Other income/losses (net) | | 24 | | | 285 | | | (91.6 | ) | | 77 | | | 355 | | | (78.3 | ) |
. From disposal of equity holdings | | (0 | ) | | 249 | | | n.m. | | | 29 | | | 308 | | | (90.7 | ) |
. Other | | 24 | | | 36 | | | (31.6 | ) | | 49 | | | 47 | | | 4.4 | |
PRE - TAX PROFIT | | (452 | ) | | (472 | ) | | (4.4 | ) | | 5,592 | | | 4,137 | | | 35.2 | |
Corporate income tax | | 266 | | | 340 | | | (21.7 | ) | | (1,521 | ) | | (1,029 | ) | | 47.9 | |
NET INCOME | | (185 | ) | | (132 | ) | | 40.2 | | | 4,071 | | | 3,108 | | | 31.0 | |
Minority interests | | (33 | ) | | 30 | | | n.m. | | | (264 | ) | | (186 | ) | | 42.3 | |
NET ATTRIBUTABLE PROFIT | | (219 | ) | | (102 | ) | | 113.3 | | | 3,806 | | | 2,923 | | | 30.2 | |
F-133