UNITED STATES
SECURITIES AND EXCHANGE COMMISSION
WASHINGTON, D.C. 20549
FORM 20-F
| ¨ | REGISTRATION STATEMENT PURSUANT TO SECTION 12(b) OR (g) OF THE SECURITIES EXCHANGE ACT OF 1934 |
OR
| x | ANNUAL REPORT PURSUANT TO SECTION 13 OR 15(d) OF THE SECURITIES EXCHANGE ACT OF 1934 |
For the fiscal year ended December 31, 2013
OR
| ¨ | TRANSITION REPORT PURSUANT TO SECTION 13 OR 15(d) OF THE SECURITIES EXCHANGE ACT OF 1934 |
For the transition period from to
OR
| ¨ | SHELL COMPANY REPORT PURSUANT TO SECTION 13 OR 15(d) OF THE SECURITIES EXCHANGE ACT OF 1934 |
Date of event requiring this shell company report
Commission file number: 1-10110
BANCO BILBAO VIZCAYA ARGENTARIA, S.A.
(Exact name of Registrant as specified in its charter)
BANK BILBAO VIZCAYA ARGENTARIA, S.A.
(Translation of Registrant’s name into English)
Kingdom of Spain
(Jurisdiction of incorporation or organization)
Plaza de San Nicolás, 4
48005 Bilbao
Spain
(Address of principal executive offices)
Ricardo Gómez Barredo
Paseo de la Castellana, 81
28046 Madrid
Spain
Telephone number +34 91 537 7000
Fax number +34 91 537 6766
(Name, Telephone, E-mail and /or Facsimile Number and Address of Company Contact Person)
Securities registered or to be registered pursuant to Section 12(b) of the Act.
| | |
Title of Each Class | | Name of Each Exchange on which Registered |
American Depositary Shares, each representing the right to receive one ordinary share, par value €0.49 per share | | New York Stock Exchange |
| Ordinary shares, par value €0.49 per share | | New York Stock Exchange* |
Guarantee of Non-Cumulative Guaranteed Preferred Securities, Series C, liquidation preference $1,000 each, of BBVA International Preferred, S.A. Unipersonal | | New York Stock Exchange** |
| Guarantee of Guaranteed Fixed Rate Senior Notes due 2014 of BBVA U.S. Senior, S.A. Unipersonal | | New York Stock Exchange*** |
| Guarantee of Guaranteed Floating Rate Senior Notes due 2014 of BBVA U.S. Senior, S.A. Unipersonal | | New York Stock Exchange**** |
| Guarantee of Guaranteed Fixed Rate Senior Notes due 2015 of BBVA U.S. Senior, S.A. Unipersonal | | New York Stock Exchange*** |
| * | The ordinary shares are not listed for trading, but are listed only in connection with the registration of the American Depositary Shares, pursuant to requirements of the New York Stock Exchange. |
| ** | The guarantee is not listed for trading, but is listed only in connection with the registration of the corresponding Non-Cumulative Guaranteed Preferred Securities of BBVA International Preferred, S.A. Unipersonal (a wholly-owned subsidiary of Banco Bilbao Vizcaya Argentaria, S.A.). |
| *** | The guarantee is not listed for trading, but is listed only in connection with the registration of the corresponding Guaranteed Fixed Rate Senior Notes of BBVA U.S. Senior, S.A. Unipersonal (a wholly-owned subsidiary of Banco Bilbao Vizcaya Argentaria, S.A.). |
| **** | The guarantee is not listed for trading, but is listed only in connection with the registration of the corresponding Guaranteed Floating Rate Senior Notes of BBVA U.S. Senior, S.A. Unipersonal (a wholly-owned subsidiary of Banco Bilbao Vizcaya Argentaria, S.A.). |
Securities registered or to be registered pursuant to Section 12(g) of the Act.
None
Securities for which there is a reporting obligation pursuant to Section 15(d) of the Act.
None
The number of outstanding shares of each class of stock of the Registrant as of December 31, 2013, was:
Ordinary shares, par value €0.49 per share—5,785,954,443
Indicate by check mark if the registrant is a well-known seasoned issuer, as defined in Rule 405 of the Securities Act.
Yes x No ¨
If this report is an annual or transition report, indicate by check mark if the registrant is not required to file reports pursuant to Section 13 or 15(d) of the Securities Exchange Act of 1934.
Yes ¨ No x
Indicate by check mark whether the registrant (1) has filed all reports required to be filed by Section 13 or 15(d) of the Securities Exchange Act of 1934 during the preceding 12 months (or for such shorter period that the registrant was required to file such reports), and (2) has been subject to such filing requirements for the past 90 days.
Yes x No ¨
Indicate by check mark whether the registrant has submitted electronically and posted on its corporate Web site, if any, every Interactive Data File required to be submitted and posted pursuant to Rule 405 of Regulation S-T (Section 232.405 of this chapter) during the preceding 12 months (or for such shorter period that the registrant was required to submit and post such files).
Yes ¨ No ¨
Indicate by check mark whether the registrant is a large accelerated filer, an accelerated filer, or a non-accelerated filer. See definition of “accelerated filer and large accelerated filer” in Rule 12b-2 of the Exchange Act. (Check One):
Large accelerated filer x Accelerated filer ¨ Non-accelerated filer ¨
Indicate by check mark which basis of accounting the registrant has used to prepare the financial statements included in this filing:
| | | | |
| U.S. GAAP ¨ | | International Financial Reporting Standards as Issued by the International Accounting Standards Board x | | Other ¨ |
If “Other” has been checked in response to the previous question, indicate by check mark which financial statement item the registrant has elected to follow.
Item 17 ¨ Item 18 ¨
If this is an annual report, indicate by check mark whether the registrant is a shell company (as defined in Rule 12b-2 of the Exchange Act).
Yes ¨ No x
BANCO BILBAO VIZCAYA ARGENTARIA, S.A.
TABLE OF CONTENTS
2
CERTAIN TERMS AND CONVENTIONS
The terms below are used as follows throughout this report:
| | • | | “BBVA”, “Bank”, the “Company”, the “Group” or the “BBVA Group” means Banco Bilbao Vizcaya Argentaria, S.A. and its consolidated subsidiaries unless otherwise indicated or the context otherwise requires. |
| | • | | “BBVA Bancomer” means Grupo Financiero BBVA Bancomer, S.A. de C.V. and its consolidated subsidiaries, unless otherwise indicated or the context otherwise requires. |
| | • | | “BBVA Compass” means BBVA Compass Bancshares, Inc. and its consolidated subsidiaries, unless otherwise indicated or the context otherwise requires. |
| | • | | “Consolidated Financial Statements” means our audited consolidated financial statements as of and for the years ended December 31, 2013, 2012 and 2011 prepared in accordance with the International Financial Reporting Standards adopted by the European Union (“EU-IFRS”) required to be applied under the Bank of Spain’s Circular 4/2004 and in compliance with International Financial Reporting Standards as issued by the International Accounting Standards Board (“IFRS-IASB”). |
| | • | | “Latin America” refers to Mexico and the countries in which we operate in South America and Central America. |
First person personal pronouns used in this report, such as “we”, “us”, or “our”, mean BBVA, unless otherwise indicated or the context otherwise requires.
In this report, “$”, “U.S. dollars”, and “dollars” refer to United States Dollars and “€” and “euro” refer to Euro.
CAUTIONARY STATEMENT REGARDING FORWARD-LOOKING STATEMENTS
This Annual Report contains statements that constitute forward-looking statements within the meaning of Section 27A of the Securities Act of 1933, as amended (the “Securities Act”) Section 21E of the U.S. Securities Exchange Act of 1934, as amended (the “Exchange Act”), and the safe harbor provisions of the Private Securities Litigation Reform Act of 1995. Forward-looking statements may include words such as “believe”, “expect”, “estimate”, “project”, “anticipate”, “should”, “intend”, “probability”, “risk”, “VaR”, “target”, “goal”, “objective” and similar expressions or variations on such expressions and includes statements regarding future growth rates. Forward-looking statements are not guarantees of future performance and involve risks and uncertainties, and actual results may differ materially from those in the forward-looking statements as a result of various factors. The accompanying information in this Annual Report, including, without limitation, the information under the items listed below, identifies important factors that could cause such differences:
| | • | | “Item 3. Key Information—Risk Factors”; |
| | • | | “Item 4. Information on the Company”; |
| | • | | “Item 5. Operating and Financial Review and Prospects”; and |
| | • | | “Item 11. Quantitative and Qualitative Disclosures About Market Risk”. |
Other important factors that could cause actual results to differ materially from those in forward-looking statements include, among others:
| | • | | general political, economic and business conditions in Spain, the European Union (“EU”), Latin America, the United States and other regions, countries or territories in which we operate; |
3
| | • | | changes in applicable laws and regulations, including increased capital and provision requirements; |
| | • | | the monetary, interest rate and other policies of central banks in Spain, the EU, the United States, Mexico and elsewhere; |
| | • | | changes or volatility in interest rates, foreign exchange rates (including the euro to U.S. dollar exchange rate), asset prices, equity markets, commodity prices, inflation or deflation; |
| | • | | ongoing market adjustments in the real estate sectors in Spain, Mexico and the United States; |
| | • | | the effects of competition in the markets in which we operate, which may be influenced by regulation or deregulation; |
| | • | | changes in consumer spending and savings habits, including changes in government policies which may influence investment decisions; |
| | • | | our ability to hedge certain risks economically; |
| | • | | downgrades in our credit ratings, including as a result of a decline in the Kingdom of Spain’s credit ratings; |
| | • | | the success of our acquisitions divestitures, mergers and strategic alliances; |
| | • | | our success in managing the risks involved in the foregoing, which depends, among other things, on our ability to anticipate events that cannot be captured by the statistical models we use; and |
| | • | | force majeure and other events beyond our control. |
Readers are cautioned not to place undue reliance on such forward-looking statements, which speak only as of the date hereof. We undertake no obligation to release publicly the result of any revisions to these forward-looking statements which may be made to reflect events or circumstances after the date hereof, including, without limitation, changes in our business or acquisition strategy or planned capital expenditures, or to reflect the occurrence of unanticipated events.
PRESENTATION OF FINANCIAL INFORMATION
Accounting Principles
Under Regulation (EC) no. 1606/2002 of the European Parliament and of the Council of July 19, 2002, all companies governed by the law of an EU Member State and whose securities are admitted to trading on a regulated market of any Member State must prepare their consolidated financial statements for the years beginning on or after January 1, 2005 in conformity with EU-IFRS. The Bank of Spain issued Circular 4/2004 of December 22, 2004 on Public and Confidential Financial Reporting Rules and Formats (as amended or supplemented from time to time, “Circular 4/2004”), which requires Spanish credit institutions to adapt their accounting system to the principles derived from the adoption by the European Union of EU-IFRS.
Differences between EU-IFRS required to be applied under the Bank of Spain’s Circular 4/2004 and IFRS-IASB are not material for the three years ended December 31, 2013. Accordingly, the Consolidated Financial Statements included in this Annual Report have been prepared in accordance with EU-IFRS required to be applied under the Bank of Spain’s Circular 4/2004 and in compliance with IFRS-IASB.
The financial information as of and for the years ended December 31, 2012, 2011, 2010 and 2009 may differ from previously reported financial information as of such dates and for such periods in our respective annual reports for certain prior years, mainly as a result of the implementation of changes in the accounting standards set out in IFRS 10 and 11 that came into force in 2013.
4
Statistical and Financial Information
The following principles should be noted in reviewing the statistical and financial information contained herein:
| | • | | Average balances, when used, are based on the beginning and the month-end balances during each year. We do not believe that such monthly averages present trends that are materially different from those that would be presented by daily averages. |
| | • | | The book value of BBVA’s ordinary shares held by its consolidated subsidiaries has been deducted from equity. |
| | • | | Unless otherwise stated, any reference to loans refers to both loans and advances. |
| | • | | Interest income figures include interest income on non-accruing loans to the extent that cash payments have been received in the period in which they are due. |
| | • | | Financial information with respect to subsidiaries may not reflect consolidation adjustments. |
| | • | | Certain numerical information in this Annual Report may not sum due to rounding. In addition, information regarding period-to-period changes is based on numbers which have not been rounded. |
PART I
| ITEM 1. | IDENTITY OF DIRECTORS, SENIOR MANAGEMENT AND ADVISERS |
Not Applicable.
| ITEM 2. | OFFER STATISTICS AND EXPECTED TIMETABLE |
Not Applicable.
| A. | Selected Consolidated Financial Data |
The historical financial information set forth below for the years ended December 31, 2013, 2012 and 2011 has been selected from, and should be read together with, the Consolidated Financial Statements included herein. The audited financial statements for 2010 and 2009 are not included in this document, and they instead can be found in the respective annual reports on Form 20-F for certain prior years previously filed by us.
5
For information concerning the preparation and presentation of the financial information contained herein, see “Presentation of Financial Information”.
| | | | | | | | | | | | | | | | | | | | |
| | | Year Ended December 31, | |
| | | 2013 | | | 2012 | | | 2011 | | | 2010 | | | 2009 | |
| | | (In Millions of Euros, Except Per Share/ADS Data (In Euros)) | |
Consolidated Statement of Income Data | | | | | | | | | | | | | | | | | | | | |
Interest and similar income | | | 23,512 | | | | 24,815 | | | | 23,229 | | | | 21,130 | | | | 23,773 | |
Interest and similar expenses | | | (9,612 | ) | | | (10,341 | ) | | | (10,505 | ) | | | (7,814 | ) | | | (9,893 | ) |
Net interest income | | | 13,900 | | | | 14,474 | | | | 12,724 | | | | 13,316 | | | | 13,880 | |
Dividend income | | | 235 | | | | 390 | | | | 562 | | | | 529 | | | | 443 | |
Share of profit or loss of entities accounted for using the equity method | | | 694 | | | | 1,039 | | | | 787 | | | | 331 | | | | 118 | |
Fee and commission income | | | 5,478 | | | | 5,290 | | | | 4,874 | | | | 4,864 | | | | 4,841 | |
Fee and commission expenses | | | (1,228 | ) | | | (1,134 | ) | | | (980 | ) | | | (831 | ) | | | (790 | ) |
Net gains (losses) on financial assets and liabilities | | | 1,608 | | | | 1,636 | | | | 1,070 | | | | 1,372 | | | | 821 | |
Net exchange differences | | | 903 | | | | 69 | | | | 410 | | | | 455 | | | | 651 | |
Other operating income | | | 4,995 | | | | 4,765 | | | | 4,212 | | | | 3,537 | | | | 3,395 | |
Other operating expenses | | | (5,627 | ) | | | (4,705 | ) | | | (4,019 | ) | | | (3,240 | ) | | | (3,145 | ) |
Administration costs | | | (9,701 | ) | | | (9,396 | ) | | | (8,634 | ) | | | (8,007 | ) | | | (7,486 | ) |
Depreciation and amortization | | | (1,095 | ) | | | (978 | ) | | | (810 | ) | | | (754 | ) | | | (690 | ) |
Provisions (net) | | | (609 | ) | | | (641 | ) | | | (503 | ) | | | (475 | ) | | | (446 | ) |
| | | | | |
Impairment losses on financial assets (net) | | | (5,612 | ) | | | (7,859 | ) | | | (4,185 | ) | | | (4,718 | ) | | | (5,473 | ) |
Impairment losses on other assets (net) | | | (467 | ) | | | (1,123 | ) | | | (1,883 | ) | | | (489 | ) | | | (1,619 | ) |
Gains (losses) on derecognized assets not classified as non-current assets held for sale | | | (1,915 | ) | | | 3 | | | | 44 | | | | 41 | | | | 20 | |
Negative goodwill | | | — | | | | 376 | | | | — | | | | 1 | | | | 99 | |
Gains (losses) in non-current assets held for sale not classified as discontinued operations | | | (399 | ) | | | (624 | ) | | | (271 | ) | | | 127 | | | | 859 | |
Operating profit before tax | | | 1,160 | | | | 1,582 | | | | 3,398 | | | | 6,059 | | | | 5,478 | |
Income tax | | | (46 | ) | | | 352 | | | | (158 | ) | | | (1,345 | ) | | | (1,085 | ) |
Profit from continuing operations | | | 1,114 | | | | 1,934 | | | | 3,240 | | | | 4,714 | | | | 4,394 | |
| | | | | |
Profit from discontinued operations (net) (3) | | | 1,866 | | | | 393 | | | | 245 | | | | 281 | | | | 201 | |
Profit | | | 2,981 | | | | 2,327 | | | | 3,485 | | | | 4,995 | | | | 4,595 | |
Profit attributable to parent company | | | 2,228 | | | | 1,676 | | | | 3,004 | | | | 4,606 | | | | 4,210 | |
Profit attributable to non-controlling interests | | | 753 | | | | 651 | | | | 481 | | | | 389 | | | | 385 | |
| | | | | |
Per share/ADS (1) Data | | | | | | | | | | | | | | | | | | | | |
Numbers of shares outstanding (at period end) | | | 5,785,954,443 | | | | 5,448,849,545 | | | | 4,903,207,003 | | | | 4,490,908,285 | | | | 3,747,969,121 | |
Profit attributable to parent company (2) | | | 0.40 | | | | 0.32 | | | | 0.62 | | | | 1.10 | | | | 1.02 | |
Dividends declared | | | 0.100 | | | | 0.200 | | | | 0.200 | | | | 0.270 | | | | 0.420 | |
| (1) | Each American Depositary Share (“ADS”) represents the right to receive one ordinary share. |
| (2) | Calculated on the basis of the weighted average number of BBVA’s ordinary shares outstanding during the relevant period including the average number of estimated shares to be converted and, for comparative purposes, a correction factor to account for the capital increases carried out in November 2010, April 2011, October 2011, April 2012, October 2012, April 2013 and October 2013, and excluding the weighted average number of treasury shares during the period (5,692 million, 5,622 million, 5,093 million, 4,388 million and 4,259 million shares in 2013, 2012, 2011, 2010 and 2009, respectively). With respect to the years ended December 31, 2013, 2012 and 2011, see Note 5 to the Consolidated Financial Statements. |
| (3) | For 2013, includes the capital gains from the sale of Afore Bancomer in Mexico and the South America pension fund administrators, as well as the earnings posted by these companies up to the date of these sales. |
6
| | | | | | | | | | | | | | | | | | | | |
| | | As of and for Year Ended December 31, | |
| | | 2013 | | | 2012 | | | 2011 | | | 2010 | | | 2009 | |
| | | (In Millions of Euros, Except Percentages) | |
Consolidated Balance Sheet Data | | | | | | | | | | | | | | | | | | | | |
Total assets | | | 582,575 | | | | 621,072 | | | | 582,838 | | | | 552,738 | | | | 535,065 | |
Common stock | | | 2,835 | | | | 2,670 | | | | 2,403 | | | | 2,201 | | | | 1,837 | |
Loans and receivables (net) | | | 350,945 | | | | 371,347 | | | | 369,916 | | | | 364,707 | | | | 346,117 | |
Customer deposits | | | 300,490 | | | | 282,795 | | | | 272,402 | | | | 275,789 | | | | 254,183 | |
Debt certificates and subordinated liabilities | | | 74,676 | | | | 98,070 | | | | 96,427 | | | | 102,599 | | | | 117,817 | |
Non-controlling interest | | | 2,371 | | | | 2,372 | | | | 1,893 | | | | 1,556 | | | | 1,463 | |
Total equity | | | 44,850 | | | | 43,802 | | | | 40,058 | | | | 37,475 | | | | 30,763 | |
Consolidated ratios | | | | | | | | | | | | | | | | | | | | |
Profitability ratios: | | | | | | | | | | | | | | | | | | | | |
Net interest margin(1) | | | 2.32 | % | | | 2.38 | % | | | 2.29 | % | | | 2.38 | % | | | 2.56 | % |
Return on average total assets(2) | | | 0.5 | % | | | 0.4 | % | | | 0.6 | % | | | 0.9 | % | | | 0.9 | % |
Return on average equity(3) | | | 5.0 | % | | | 4.0 | % | | | 8.0 | % | | | 15.8 | % | | | 16.0 | % |
Credit quality data | | | | | | | | | | | | | | | | | | | | |
Loan loss reserve(4) | | | 14,995 | | | | 14,159 | | | | 9,139 | | | | 9,473 | | | | 8,805 | |
Loan loss reserve as a percentage of total loans and receivables (net) | | | 4.27 | % | | | 3.81 | % | | | 2.47 | % | | | 2.60 | % | | | 2.54 | % |
Non-performing asset ratio (NPA ratio)(5) | | | 6.9 | % | | | 5.1 | % | | | 4.0 | % | | | 4.1 | % | | | 4.3 | % |
Impaired loans and advances to customers | | | 25,445 | | | | 19,960 | | | | 15,416 | | | | 15,361 | | | | 15,197 | |
Impaired contingent liabilities to customers(6) | | | 410 | | | | 312 | | | | 217 | | | | 324 | | | | 405 | |
| | | | | | | | | | | | | | | | | | | | |
| | | 25,855 | | | | 20,272 | | | | 15,633 | | | | 15,685 | | | | 15,602 | |
| | | | | | | | | | | | | | | | | | | | |
Loans and advances to customers | | | 338,557 | | | | 356,278 | | | | 351,634 | | | | 348,253 | | | | 332,162 | |
Contingent liabilities to customers | | | 36,183 | | | | 36,891 | | | | 37,126 | | | | 35,816 | | | | 32,614 | |
| | | | | | | | | | | | | | | | | | | | |
| | | 374,740 | | | | 393,169 | | | | 388,760 | | | | 384,069 | | | | 364,776 | |
| | | | | | | | | | | | | | | | | | | | |
| (1) | Represents net interest income as a percentage of average total assets. |
| (2) | Represents profit as a percentage of average total assets. |
| (3) | Represents profit attributable to parent company as a percentage of average equity, excluding “Non-controlling interest”. |
| (4) | Represents impairment losses of loans and receivables to credit institutions, loans and advances to customers and debt securities. See Note 13 to the Consolidated Financial Statements. |
| (5) | Represents the sum of impaired loans and advances to customers and impaired contingent liabilities to customers divided by the sum of loans and advances to customers and contingent liabilities to customers. |
| (6) | We include contingent liabilities in the calculation of our non-performing asset ratio (NPA ratio). We believe that impaired contingent liabilities should be included in the calculation of our NPA ratio where we have reason to know, as of the reporting date, that they are impaired. The credit risk associated with contingent liabilities (consisting mainly of financial guarantees provided to third-parties on behalf of our customers) is evaluated and provisioned according to the probability of default of our customers’ obligations. If impaired contingent liabilities were not included in the calculation of our NPA ratio, such ratio would generally be higher for the periods covered, amounting to approximately 7.5%, 5.6%, 4.4%, 4.4% and 4.6% as of December 31, 2013, 2012, 2011, 2010 and 2009, respectively. |
Exchange Rates
Spain’s currency is the euro. Unless otherwise indicated, the amounts that have been converted to euro in this Annual Report have been done so at the corresponding exchange rate published by the European Central Bank (“ECB”) on December 31 of the relevant year.
For convenience in the analysis of the information, the following tables describe, for the periods and dates indicated, information concerning the noon buying rate for euro, expressed in dollars per €1.00. The term “noon
7
buying rate” refers to the rate of exchange for euros, expressed in U.S. dollars per euro, in the City of New York for cable transfers payable in foreign currencies as certified by the Federal Reserve Bank of New York for customs purposes.
| | | | |
Year ended December 31 | | Average (1) | |
2009 | | | 1.3955 | |
2010 | | | 1.3216 | |
2011 | | | 1.4002 | |
2012 | | | 1.2908 | |
2013 | | | 1.3303 | |
2014 (through April, 25, 2014) | | | 1.3728 | |
| (1) | Calculated by using the average of the exchange rates on the last day of each month during the period. |
| | | | | | | | |
Month ended | | High | | | Low | |
September 30, 2013 | | | 1.3537 | | | | 1.3120 | |
October 31, 2013 | | | 1.3810 | | | | 1.3490 | |
November 30, 2013 | | | 1.3606 | | | | 1.3357 | |
December 31, 2013 | | | 1.3816 | | | | 1.3552 | |
January 31, 2014 | | | 1.3682 | | | | 1.3500 | |
February 28, 2014 | | | 1.3806 | | | | 1.3507 | |
March 31, 2014 | | | 1.3927 | | | | 1.3731 | |
April 30, 2014 (through April 25, 2014) | | | 1.3898 | | | | 1.3704 | |
The noon buying rate for euro from the Federal Reserve Bank of New York, expressed in dollars per €1.00, on April 25, 2014, was $1.3838.
As of December 31, 2013, approximately 40% of our assets and approximately 40% of our liabilities were denominated in currencies other than euro. See Note 2.2.16 to our Consolidated Financial Statements.
For a discussion of our foreign currency exposure, please see “Item 11. Quantitative and Qualitative Disclosures About Market Risk—Market Risk Management—Market Risk in Non-Trading Portfolio in 2013—Structural Risk Structural Currency Risk”.
| B. | Capitalization and Indebtedness |
Not Applicable.
| C. | Reasons for the Offer and Use of Proceeds |
Not Applicable.
Risks Relating to Us and Our Business
The Bank is subject to substantial regulation, and regulatory and governmental oversight. Adverse regulatory developments or changes in government policy could have a material adverse effect on its business, results of operations and financial condition
The financial services industry is among the most highly regulated industries in the world. The Bank’s operations are subject to ongoing regulation and associated regulatory risks, including the effects of changes in laws, regulations, policies and interpretations, in Spain, the European Union, the United States and the other markets where it operates. This is particularly the case in the current market environment, which is witnessing increased
8
levels of government and regulatory intervention in the banking sector which the Bank expects to continue for the foreseeable future. As a result, we may further be subject to an increasing incidence or amount of liability or regulatory sanctions and may be required to make greater expenditures and devote additional resources to address potential liability.
The regulations which most significantly affect the Bank, or which could most significantly affect the Bank in the future, include regulations relating to capital and provisions requirements, which have become increasingly more strict in the past three years, steps taken towards achieving a fiscal and banking union in the European Union, and regulatory reforms in the United States. These risks are discussed in further detail below.
In addition, the Bank is subject to substantial regulation relating to other matters such as liquidity. The Bank considers that future liquidity standards could require maintaining a greater proportion of its assets in highly-liquid but lower-yielding financial instruments, which would negatively affect the Bank’s net interest margin.
The Bank is also subject to other regulations, such as those related to anti-money laundering, privacy protection and transparency and fairness in customer relations.
Moreover, the Bank’s regulators, as part of their supervisory function, periodically review the Bank’s allowance for loan losses. Such regulators may require the Bank to increase its allowance for loan losses or to recognize further losses. Any such additional provisions for loan losses, as required by these regulatory agencies, whose views may differ from those of the Bank’s management, could have an adverse effect on the Bank’s earnings and financial condition.
Recent Spanish regulatory developments include (i) Royal Decree-Law 2/2012, of February 3 and Law 8/2012 of October 30, which increased coverage requirements to be met by December 31, 2012 for performing and non-performing real estate assets, (ii) Law 9/2012, of November 14 (“Law 9/2012”) which established a new regime on restructuring and resolution of credit institutions and a statutory loss absorbency regime applicable within the framework of restructuring and resolution processes, which was based on the June 2012 draft of the proposed EU Recovery and Resolution Directive (“RRD”), and (iii) Royal Decree-Law 14/2013, of November 29 (“RD-L 14/2013”) which partially incorporated Capital Requirements Directive IV (“CRD IV”) into Spanish law. In addition, on February 5, 2014 a new Bank of Spain Circular 2/2014, of January 31, was published. By means of this new circular, the Bank of Spain has made certain regulatory determinations under the Capital Requirements Regulation (which is directly applicable in EU member states, without the need to be implemented by national laws) (“CRR”) pursuant to the delegation contained in RD-L 14/2013 including, among other things, certain rules concerning the applicable transitional regime on capital requirements and the treatment of deductions and. establishes a 4.5% common equity tier 1 requirement and a 6% tier 1 capital requirement.
Adverse regulatory developments or changes in government policy relating to any of the foregoing or other matters could have a material adverse effect on the Bank’s business, results of operations and financial condition. Furthermore, regulatory fragmentation, with some countries implementing new and more stringent standards or regulations, could adversely affect the Bank’s ability to compete with financial institutions based in other jurisdictions which do not need to comply with such new standards or regulations.
Capital requirements
Increasingly onerous capital requirements constitute one of the Bank’s main regulatory concerns.
As a Spanish financial institution, Banco Bilbao Vizcaya Argentaria, S.A. is subject to CRD IV, through which the European Union has implemented the Basel III capital standards and which are in the process of being phased in until January 1, 2019. The CRR entered into force on January 1, 2014 and the CRD IV Directive has already been partially implemented in Spain as of January 1, 2014 by RD-L 14/2013. RD-L 14/2013 has repealed, with effect from January 1, 2014, any Spanish regulatory provisions that may be incompatible with CRR.
Despite the CRD IV/Basel III framework setting minimum transnational levels of regulatory capital and a measured phase-in, many national authorities have started a race to the top for capital by gold-plating both requirements and the associated implementation calendars.
9
For example, in the last three years the Bank of Spain and the European Banking Authority (the “EBA”) have imposed new capital requirements in advance of the entering into force of CRD IV. These measures have included Bank of Spain Circular 3/2008 (“Circular 3/2008”) of May 22, on the calculation and control of minimum capital requirements, which was amended by Bank of Spain Circular 4/2011 (“Circular 4/2011”) and which implemented Capital Requirements Directive III in Spain. In addition, some of the requirements of Basel III were already implemented by the Spanish Government in 2011 with Royal Decree-Law 2/2011 (“RD-L 2/2011”) of February 18 (as amended by Law 9/2012) which established a new minimum requirement in terms of capital on risk-weighted assets (“Capital Principal”) and required such capital to be greater than 9% from January 1, 2013. RD-L 14/2013 repealed, with effect from January 1, 2014, Title I of Royal Decree-Law 2/2011, which imposed the minimum Capital Principal requirement with respect to credit institutions. Despite such repeal, the Bank of Spain has been given powers to prohibit or restrict, until December 31, 2014, any distributions of Tier 1 Capital by credit institutions (including the Bank) which would have been comprised in the minimum Capital Principal requirements stipulated in RD-L 2/2011, provided such distributions, in aggregate terms, imply not fulfilling by up to 20% of the minimum Capital Principal legally required as at December 31, 2013, the Capital Principal requirement on a temporary basis and any credit institution making any such distribution would further risk non-compliance with additional capital requirements that could be imposed by the Bank of Spain.
Furthermore, following an evaluation of the capital levels of 71 financial institutions throughout Europe (including the Bank) based on data available as of September 30, 2011, the EBA issued a recommendation on December 8, 2011 pursuant to which, on an exceptional and temporary basis, financial institutions based in the EU should reach a new minimum Core Tier 1 ratio (9%) by June 30, 2012. This recommendation has been replaced by the EBA recommendation of July 22, 2013 on the preservation of Core Tier 1 capital during the transition to CRD IV implementation. This new recommendation provides for the maintenance of a nominal floor of capital denominated in the relevant reporting currency of Core Tier 1 capital corresponding to the amount of capital needed as at June 30, 2012 to meet the requirements of the above recommendation of December 8, 2011. Competent authorities may waive this requirement for institutions which maintain a minimum of 7% of common equity Tier 1 capital under CRD IV rules applied after the transitional period.
Finally, in order to complete the implementation of CRD IV initiated by RD-L 14/2013, the Spanish Ministry of Economy and Competitiveness has prepared and recently published a draft of a new comprehensive law on the supervision and solvency of financial institutions.
Additionally, the Mexican government introduced the Basel III capital standards in 2012 and the Basel III transposition in the United States will be effective in 2015. This lack of uniformity may lead to an uneven playing field and to competition distortions. Moreover, regulatory fragmentation, with some countries bringing forward the application of Basel III requirements or increasing such requirements, could adversely affect a bank with global operations such as the Bank and could undermine its profitability.
At its meeting of January 12, 2014, the oversight body of the Basel Committee endorsed the definition of the leverage ratio set forth in CRD IV, to promote consistent disclosure, starting on January 1, 2015. There will be a mandatory minimum capital requirement on January 1, 2018, with an initial minimum leverage ratio of 3% that can be raised after calibration.
There can be no assurance that the implementation of these new standards or recommendations will not adversely affect the Bank’s ability to pay dividends, or require it to issue additional securities that qualify as regulatory capital, to liquidate assets, to curtail business or to take any other actions, any of which may have adverse effects on the Bank’s business, financial condition and results of operations. Furthermore, increased capital requirements may negatively affect the Bank’s return on equity and other financial performance indicators.
Tax treatment of deferred tax assets following the implementation of CRD IV
In addition to introducing new capital requirements, CRD IV provides that the deferred tax assets (“DTAs”) of a financial institution must be deducted from its regulatory capital (specifically from its core capital or CET1 Capital) for prudential reasons, as there is generally no guarantee that DTAs will retain their value in the event of the institution facing difficulties.
10
This new deduction introduced by CRD IV has a significant impact on Spanish banks due to the particularly restrictive nature of certain aspects of Spanish tax law. For example, in some EU countries when a bank reports a loss the tax authorities refund a portion of taxes paid in previous years but in Spain the bank must earn profits in subsequent years in order for this set-off to take place. Additionally, Spanish tax law does not recognize as tax-deductible certain amounts recorded as costs in the accounts of a bank, unlike the tax legislation of other EU countries.
Due to these differences and the greater impact of the requirements of CRD IV with respect to DTAs, the Spanish regulator implemented certain amendments to the Spanish Law on Corporate Income Tax (Royal Decree Law 4/2004 of March 5, as amended) through RD-L 14/2013. This provides for certain DTAs to be treated as a direct claim against the tax authorities if a Spanish bank is unable to reverse those temporary differences within 18 years or if it is liquidated, becomes insolvent or incurs accounting losses. This amendment will allow a Spanish bank not to deduct such DTAs from its regulatory capital.
However, there can be no assurance that the tax amendments implemented by RD-L 14/2013 will not be challenged by the European Commission, that the final interpretation of these amendments will not change (as further clarifying regulation is expected during 2014) and that Spanish banks will ultimately be allowed to maintain certain DTAs as regulatory capital. If this regulation is challenged, this may negatively affect the Bank’s regulatory capital and therefore its ability to pay dividends or require it to issue additional securities that qualify as regulatory capital, to liquidate assets, to curtail business or to take any other actions, any of which may have a material adverse effect on the Bank’s business, financial condition and results of operations.
Contributions for assisting in the restructuring of the Spanish banking sector
Royal Decree-Law 6/2013 of March 22, on protection for holders of certain savings and investment products and other financial measures, included a requirement for banks, including the Bank, to make an exceptional one-off contribution to the Deposit Guarantee Fund (Fondo de Garantía de Depósitos) in addition to the annual contribution to be made by member institutions, equal to €3.00 per each €1,000 of deposits held as of December 31, 2012. The purpose of such contribution was for the Deposit Guarantee Fund to be able to purchase at market prices the unlisted shares of certain Spanish financial institutions involved in restructuring or resolution processes under Law 9/2012 (none of which are part of the Group). There can be no assurance that additional funding requirements will not be imposed by the Spanish authorities for assisting in the restructuring of the Spanish banking sector.
Steps taken towards achieving an EU fiscal and banking union
In June 2012, a number of agreements were reached to reinforce the monetary union, including the definition of a broad roadmap towards a single banking and fiscal union. While support for a banking union in Europe exists and significant advances have been made in terms of the development of a single-rule book through CRD IV, there is ongoing debate on the extent and pace of integration. On September 13, 2012, the European Parliament approved a proposal for the creation of the Single Supervisory Mechanism, so that 128 of the largest EU banks (including the Bank) will come under the ECB’s direct oversight from November 2014. Other issues include the representation and voting power of non-Eurozone countries, the accountability of the ECB to European institutions as part of the Single Supervision Mechanism, the final status of the EBA, the development of a new bank resolution regime and the creation of a common deposit-guarantee scheme. In particular, the RRD and the Deposit Guarantee Schemes Directive were submitted to the European Parliament in June 2013. An agreement on the RRD was reached in the February 2014 ECOFIN. The final approval of the RRD is expected by April-May 2014. The RRD is expected to enter into force in 2015, but the bail-in tool will only be operational from 2016. The final regulation on direct recapitalization of banks by the European Stability Mechanism (ESM) is still pending. European leaders have also supported the reinforcement of the fiscal union but continue negotiating on how to achieve it.
Prior to the ECB assuming the supervision of European banks (including the Bank), the ECB is conducting, with the help of national supervisors, external advisors, consultants and other appraisers, a comprehensive assessment consisting of three elements: (i) a supervisory risk assessment, which will assess the main risks on the balance sheet including liquidity, funding and leverage; (ii) an asset quality review, which will focus on credit and
11
market risks; and (iii) a stress test to examine the need to strengthen capital or take other corrective measures which could affect the Group’s business, financial condition and results of operations. It is expected that the results of this comprehensive agreement will be released at the end of 2014.
Regulations adopted towards achieving a banking and/or fiscal union in the EU and decisions adopted by the ECB in its future capacity as the Bank’s main supervisory authority may have a material impact on the Bank’s business, financial condition and results of operations.
In addition, on January 29, 2014, the European Commission released its proposal on the structural reforms of the European banking sector that will impose new constraints on the structure of European banks. The proposal aims at ensuring the harmonization between the divergent national initiatives in Europe, and includes a prohibition of proprietary trading such as in the US Volcker Rule and a mechanism to require the separation of trading activities including market making such as in the UK Banking Reform.
Regulatory reforms initiated in the United States
The Bank’s operations may also be affected by other regulatory reforms in response to the financial crisis, including measures such as those concerning systemic financial institutions and the enactment in the United States in July 2010 of the Dodd-Frank Act. In July 2013, U.S. federal bank regulators issued final rules implementing many elements of the Basel III framework and other U.S. capital reforms. In December 2013, the Federal Reserve, the OCC, the FDIC, the CFTC and the SEC issued final rules to implement the Volcker Rule, as required by the Dodd-Frank Act. The Volcker Rule prohibits an insured depository institution, its affiliates and any company that controls an insured depository institution from engaging in proprietary trading and from investing in or sponsoring certain covered funds, such as hedge funds and private equity funds, in each case subject to certain limited exceptions. The final rules also impose significant compliance and reporting obligations.
In February 2014, the Federal Reserve approved a final rule to enhance its supervision and regulation of the U.S. operations of foreign banking organizations (“FBOs”) such as BBVA. Under this rule, FBOs with $50 billion or more in U.S. assets held outside of their U.S. branches and agencies (“Large FBOs”), such as BBVA, will be required to create a separately capitalized top-tier U.S. intermediate holding company (“IHC”) that will hold all of the Large FBO’s U.S. bank and nonbank subsidiaries, such as Compass Bank and BBVA Compass. The IHC will be subject to U.S. risk-based and leverage capital, liquidity, risk management, stress testing and other enhanced prudential standards on a consolidated basis. Under the final rule, a Large FBO that is subject to the IHC requirement may request permission from the Federal Reserve to establish multiple IHCs or use an alternative organizational structure. The final rule also permits the Federal Reserve to apply the IHC requirement in a manner that takes into account the separate operations of multiple foreign banks that are owned by a single Large FBO. Although U.S. branches and agencies of Large FBOs will not be required to be held beneath an IHC, such branches and agencies will be subject to liquidity, and, in certain circumstances, asset maintenance requirements. Large FBOs generally will be required to form IHCs and comply with enhanced prudential standards beginning July 1, 2016, although an IHC’s compliance with applicable U.S. leverage ratio requirements is generally delayed until January 1, 2018, and certain enhanced prudential standards will apply to BBVA’s top-tier U.S. bank holding company, BBVA Compass, beginning January 1, 2015. The Federal Reserve has stated that it will issue, at a later date, final rules to implement certain other enhanced prudential standards under the Dodd-Frank Act for large bank holding companies and Large FBOs, including single counterparty credit limits and an early remediation framework. The rule does not constitute any significant additional burden for FBOs that already organized their main US subsidiaries through a BHC structure such as BBVA. Indeed, those FBOs would have anyway been subject to US prudential standards.
In addition, the Federal Reserve and other U.S. regulators issued for public comment in October 2013 a proposed rule that would introduce a quantitative liquidity coverage ratio requirement on certain large banks and bank holding companies. The proposed liquidity coverage ratio is broadly consistent with the Basel Committee’s revised Basel III liquidity rules, but is more stringent in several important respects. The Federal Reserve has also stated that it intends, through future rulemakings, to apply the Basel III liquidity coverage ratio and net stable funding ratio to the U.S. operations of some or all large FBOs.
12
Although there remains uncertainty as to how regulatory implementation of these laws will occur, various elements of the new laws may cause changes that impact the profitability of the Bank’s business activities and require that it changes certain of its business practices, and could expose the Bank to additional costs (including increased compliance costs). These changes may also cause the Bank to invest significant management attention and resources to make any necessary changes.
Taxation of the financial sector
On February 14, 2013 the European Commission published its proposal for a Council Directive implementing a common financial transaction tax, which was intended to take effect on January 1, 2014 but negotiations are still ongoing. The proposed Directive aims to ensure that the financial sector makes a fair and substantial contribution to covering the costs of the recent crisis and creating a level playing field with other sectors from a taxation point of view. In Spain, legislation passed in March 2013 imposed extraordinary levies on deposits (see “—Contributions for assisting in the restructuring of the Spanish banking sector”) but the final terms of this tax are expected to be adopted in 2014, along with other tax reforms. It is expected that the Spanish Government will set a tax on outstanding deposits to be paid annually by banks, which will subsequently be distributed to regional authorities. There can be no assurance that additional national or transnational bank levies or financial transaction taxes will not be adopted by the authorities of the jurisdictions where the Bank operates. Any such additional levies and taxes could have a material adverse effect on the Bank’s business, financial condition, results of operations and prospects.
Withdrawals of deposits or other sources of liquidity may make it more difficult or costly for the Group to fund its business on favorable terms or cause the Group to take other actions
Historically, one of the Group’s principal sources of funds has been savings and demand deposits. Large-denomination time deposits may, under some circumstances, such as during periods of significant interest rate-based competition for these types of deposits, be a less stable source of deposits than savings and demand deposits. The level of wholesale and retail deposits may also fluctuate due to other factors outside the Group’s control, such as a loss of confidence (including as a result of political initiatives, including bail-in and/or confiscation and/or taxation of creditors’ funds) or competition from investment funds or other products. The expected introduction of national taxes on outstanding deposits could be negative for the market in Spain. Moreover, there can be no assurance that, in the event of a sudden or unexpected withdrawal of deposits or shortage of funds in the banking systems or money markets in which the Group operates, the Group will be able to maintain its current levels of funding without incurring higher funding costs or having to liquidate certain of its assets. In addition, if public sources of liquidity, such as the ECB extraordinary measures adopted in response to the financial crisis since 2008, are removed from the market, there can be no assurance that the Group will be able to maintain its current levels of funding without incurring higher funding costs or having to liquidate certain of its assets or taking additional deleverage measures.
The Group’s earnings and financial condition have been, and its future earnings and financial condition may continue to be, materially affected by depressed asset valuations resulting from poor market conditions
Financial markets, among other matters, reflect the perception of risk, economic conditions and economic policies in their present and short to mid-term future outlooks. Especially in 2012, negative growth expectations and lack of confidence that policy changes would solve problems led to steep falls in asset values and a severe reduction in market liquidity. Additionally, in dislocated markets, hedging and other risk management strategies may not be as effective as they are in more normal market conditions due in part to the decreasing credit quality of hedge counterparties. Severe market events such as the sovereign debt crisis, rising risk premiums and falls in share market prices, have resulted in the Group recording large write-downs on its credit market exposures in recent years. Any deterioration in economic and financial market conditions could lead to further impairment charges and write-downs.
13
The Group faces increasing competition in its business lines
The markets in which the Group operates are highly competitive and the Group believes that this trend will continue. In addition, the trend towards consolidation in the banking industry has created larger and stronger banks with which the Group must now compete, some of which have recently received public capital from the European Stability Mechanism. Foreign competitors or funds may consider acquiring the institutions who have received such public capital in future auctions, such as occurred with respect to Novagalicia Banco, which was acquired by Banesco, a Venezuelan bank.
The Group also faces competition from non-bank competitors, such as payment platforms, ecommerce businesses, department stores (for some credit products), automotive finance corporations, leasing companies, factoring companies, mutual funds, pension funds, insurance companies and public debt (as a result of the high yields which have recently been offered as a consequence of the sovereign debt crisis, there has been a crowding out effect in the financial markets).
There can be no assurance that this competition will not adversely affect the Group’s business, financial condition, cash flows and results of operations.
The Group’s business is particularly vulnerable to volatility in interest rates
The Group’s results of operations are substantially dependent upon the level of its net interest income, which is the difference between interest income from interest-earning assets and interest expense on interest-bearing liabilities. Interest rates are highly sensitive to many factors beyond its control, including fiscal and monetary policies of governments and central banks, regulation of the financial sectors in the markets in which it operates, domestic and international economic and political conditions and other factors. Changes in market interest rates can affect the interest rates that the Group receives on its interest-earning assets differently than the rates that it pays for its interest-bearing liabilities. This may, in turn, result in a reduction of the net interest income the Group receives, which could have a material adverse impact on its results of operations.
In addition, the high proportion of loans referenced to variable interest rates makes debt service on such loans more vulnerable to changes in interest rates. In addition, a rise in interest rates could reduce the demand for credit and the Group’s ability to generate credit for its clients, as well as contribute to an increase in the credit default rate. As a result of these and the above factors, significant changes or volatility in interest rates could have a material adverse impact on the Group’s business, financial condition or results of operations.
The Group has a substantial amount of commitments with personnel considered wholly unfunded due to the absence of qualifying plan assets
The Group’s commitments with personnel which are considered to be wholly unfunded are recognized under the heading “Provisions—Funds for Pensions and Similar Obligations” in its consolidated balance sheets included in the Consolidated Financial Statements. These amounts, which comprise “Post-employment benefits”, “Early retirements” and “Post-employment welfare benefits”, are considered wholly unfunded due to the absence of qualifying plan assets.
The Group faces liquidity risk in connection with its ability to make payments on these unfunded amounts which it seeks to mitigate, with respect to “Post-employment benefits”, by maintaining insurance contracts which were contracted with insurance companies owned by the Group. The insurance companies have recorded in their balance sheets specific assets (fixed interest deposit and bonds) assigned to the funding of these commitments. The insurance companies also manage derivatives (primarily swaps) to mitigate the interest rate risk in connection with the payments of these commitments. The Group seeks to mitigate liquidity risk with respect to “Early retirements” and “Post-employment welfare benefits” through oversight by the Assets and Liabilities Committee (“ALCO”) of the Group. The Group’s ALCO manages a specific asset portfolio to mitigate the liquidity risk regarding the payments of these commitments. These assets are government and covered bonds which are issued at fixed interest rates with maturities matching the aforementioned commitments. The Group’s ALCO also manages derivatives (primarily swaps) to mitigate the interest rate risk in connection with the payments of these commitments. Should the Bank fail to adequately manage liquidity risk and interest rate risk either as described above or otherwise, it could have a material adverse effect on the Group’s business, financial condition, cash flows and results of operations.
14
We may face risks related to our acquisitions and divestitures
Our mergers and acquisitions activity involves divesting our interests in some businesses and strengthening other business areas through acquisitions. We may not complete these transactions in a timely manner, on a cost-effective basis or at all. Even though we review the companies we plan to acquire, it is generally not feasible for these reviews to be complete in all respects. As a result, we may assume unanticipated liabilities, or an acquisition may not perform as well as expected. In addition, transactions such as these are inherently risky because of the difficulties of integrating people, operations and technologies that may arise. There can be no assurance that any of the businesses we acquire can be successfully integrated or that they will perform well once integrated. Acquisitions may also lead to potential write-downs due to unforeseen business developments that may adversely affect our results of operations.
Our results of operations could also be negatively affected by acquisition or divestiture-related charges, amortization of expenses related to intangibles and charges for impairment of long-term assets. We may be subject to litigation in connection with, or as a result of, acquisitions or divestitures, including claims from terminated employees, customers or third parties, and we may be liable for future or existing litigation and claims related to the acquired business or divestiture because either we are not indemnified for such claims or the indemnification is insufficient. These effects could cause us to incur significant expenses and could materially adversely affect our business, financial condition, cash flows and results of operations.
We are party to lawsuits, tax claims and other legal proceedings
Due to the nature of our business, we and our subsidiaries are involved in litigation, arbitration and regulatory proceedings in jurisdictions around the world, the financial outcome of which is unpredictable. An adverse outcome or settlement in these proceedings could result in significant costs and may have a material adverse effect on the Group’s business, financial condition, cash flows, results of operations and reputation. In addition, responding to the demands of litigation may divert management’s time and attention and financial resources. While we believe that we have provisioned such risks appropriately based on the opinions and advice of our legal advisors and in accordance with applicable accounting rules, it is possible that losses resulting from such risks, if proceedings are decided in whole or in part adversely to us, could exceed the amount of provisions made for such risks. See “Item 8. Financial information—Consolidated Statements and Other Financial Information—Legal proceedings” and Note 25 to the Consolidated Financial Statements for additional information on our legal, regulatory and arbitration proceedings.
Risks Relating to Spain and Europe
Economic conditions in the European Union and Spain could have a material adverse effect on our business, financial condition and results of operations
The crisis in worldwide financial and credit markets led to a global economic slowdown in recent years, with many economies around the world showing significant signs of weakness or slow growth. While there has been a significant reduction in risk premiums in Europe since the second half of 2012 and economic growth has resumed positive figures since the second quarter of 2013, the possibility of future deterioration of the economic scenario exists. Any such deterioration could adversely affect the cost and availability of funding for Spanish and European banks, including us, and the quality of our loan portfolio, require us to take impairments on our exposures to the sovereign debt of one or more countries in the Eurozone or otherwise adversely affect our business, financial condition and results of operations.
The probability of country defaults or rupture of the Eurozone has decreased significantly since 2012. However, if one or more EU Member States were to exit from the European Monetary Union (“EMU”), this could materially adversely affect the European and global economy, cause a redenomination of financial instruments or other contractual obligations from the euro to a different currency and substantially disrupt capital, interbank, banking and other markets, among other effects, any of which could have a material adverse effect on the Group’s business, results of operations, financial condition and cash flows. In addition, tensions among Member States of the EU, and Euro-skepticism in certain EU countries, could pose additional difficulties in the EU’s ability to react to an economic crisis.
15
In addition, the risk of low inflation (inflation continues to be positive but well below the 2% growth rate of harmonized indices of consumer prices) or deflation (i.e., a continued period with negative rates of inflation) in the Eurozone cannot be completely ruled out. If economic conditions in the European Union and Spain deteriorate as a result, this could have a material adverse effect on our business, financial condition and results of operations.
Additionally, certain upcoming events such as the European Parliamentary elections, could have an adverse impact on the progress that has been made in establishing a European banking union and strengthening the monetary union of the Eurozone or could otherwise cause instability in the Eurozone.
The Bank is dependent on its credit ratings and any reduction of its or the Kingdom of Spain’s credit ratings could materially and adversely affect the Group’s business, financial condition and results of operations
The Bank is rated by various credit rating agencies. The Bank’s credit ratings are an assessment by rating agencies of its ability to pay its obligations when due. Any actual or anticipated decline in the Bank’s credit ratings to below investment grade or otherwise may increase the cost of and decrease the Bank’s ability to finance itself in the capital markets, secured funding markets (by affecting its ability to replace downgraded assets with better rated ones), interbank markets, through wholesale deposits or otherwise, harm its reputation, require it to replace funding lost due to the downgrade, which may include the loss of customer deposits, and make third parties less willing to transact business with the Group or otherwise materially adversely affect its business, financial condition and results of operations. Furthermore, any decline in the Bank’s credit ratings to below investment grade or otherwise could breach certain of the Bank’s agreements or trigger additional obligations under such agreements, such as a requirement to post additional collateral, which could materially adversely affect the Group’s business, financial condition and results of operations.
Since the Bank has substantial operations in Spain, its credit ratings may be adversely affected by the assessment by rating agencies of the creditworthiness of the Kingdom of Spain. Any decline in the Kingdom of Spain’s sovereign credit ratings could result in a decline in the Bank’s credit ratings.
In addition, the Group holds a substantial amount of securities issued by the Kingdom of Spain, autonomous communities within Spain and other Spanish issuers. Any decline in the Kingdom of Spain’s credit ratings could also adversely affect the value of the Kingdom of Spain’s and other Spanish issuers’ respective securities held by the Group or otherwise materially adversely affect the Group’s business, financial condition and results of operations. Furthermore, the counterparties to many of the Group’s loan agreements could be similarly affected by any decline in the Kingdom of Spain’s credit rating, which could limit their ability to raise additional capital or otherwise adversely affect their ability to repay their outstanding commitments to the Group and, in turn, materially and adversely affect the Group’s business, financial condition and results of operations.
Since the Bank’s loan portfolio is highly concentrated in Spain, adverse changes affecting the Spanish economy could have a material adverse effect on its financial condition
The Group has historically developed its lending business in Spain, which continues to be its main place of business. The Group’s loan portfolio in Spain has been adversely affected by the deterioration of the Spanish economy since 2009. While the last quarter of 2013 showed signs of a slowdown of such deterioration pattern, given the concentration of the Group’s loan portfolio in Spain, any adverse changes affecting the Spanish economy are likely to have a significant adverse impact on the Group’s business financial condition and results of operations.
After rapid economic growth until 2007, Spanish gross domestic product (“GDP”) contracted in the period 2009-10 and 2012-13. The GDP is growing again since the second half of 2013 and the Bank’s Economic Research Department (“BBVA Research”) estimates that the Spanish economy will maintain this positive trend in the years to come based on the improvement of the foreign demand and the measures adopted by the authorities in response to the economic crisis, including the structural reforms to foster competitiveness and productivity and the measures to reduce the public deficit. However, in the case that foreign demand is lower than expected and/or the measures and
16
reforms do not contribute to enhancing competitiveness and productivity, the estimated positive scenario for the Spanish economy could be revised downwards. It is worth noting that the effects of the financial crisis were particularly pronounced in Spain given the country’s heightened need for foreign financing as reflected by its high current account and public deficit. Real or perceived difficulties in making the payments associated with this deficit can further damage Spain’s economic situation and increase the costs of financing its public deficit. The aforementioned may be exacerbated by the circumstances referred to below:
The Spanish economy is particularly sensitive to economic conditions in the rest of the euro area, the primary market for Spanish goods and services exports. Also, the interruption of the incoming recovery in the Eurozone might have a deep impact on Spanish economy growth.
Lastly, a change in the current recovery of the labor market might be very worrisome since it would affect households’ gross disposable income.
Exposure to the Spanish real estate market makes the Group vulnerable to developments in this market
In the years prior to 2008, population increase, economic growth, declines in unemployment rates and increases in levels of household disposable income, together with low interest rates within the EU, led to an increase in the demand for mortgage loans in Spain. This increased demand and the widespread availability of mortgage loans affected housing prices, which rose significantly. After this buoyant period, demand began to adjust in mid-2006. Since the last quarter of 2008, the supply of new homes has been adjusting sharply downward in the residential market in Spain, but a significant excess of unsold homes still exists in the market. Spanish real estate prices continued to decline during 2012 in light of deteriorating economic conditions. Housing demand has remained weak and housing transactions continued to decrease during 2013 but are expected to stabilize in 2014.
The Group has substantial exposure to the Spanish real estate market and the continuing deterioration of Spanish real estate prices could materially and adversely affect its business, financial condition and results of operations. The Group is exposed to the Spanish real estate market due to the fact that Spanish real estate assets secure many of its outstanding loans and due to the significant amount of Spanish real estate assets held on its balance sheet, including real estate received in lieu of payment for certain underlying loans. Furthermore, the Group has restructured certain of the loans it has made relating to real estate and the capacity of the borrowers to repay those restructured loans may be materially adversely affected by declining real estate prices.
If Spanish real estate prices fail to recover, the Group’s business may be materially adversely affected, which could materially and adversely affect its financial condition and results of operations.
Highly-indebted households and corporations could endanger the Group’s asset quality and future revenues
Spanish households and businesses have reached, in recent years, a high level of indebtedness, which represents increased risk for the Spanish banking system. In addition, the high proportion of loans referenced to variable interest rates makes debt service on such loans more vulnerable to upward movements in interest rates. Highly indebted households and businesses are less likely to be able to service debt obligations as a result of adverse economic events, which could have an adverse effect on the Group’s loan portfolio and, as a result, on its financial condition and results of operations. Moreover, the increase in households’ and businesses’ indebtedness also limits their ability to incur additional debt, decreasing the number of new products the Group may otherwise be able to sell them and limiting the Group’s ability to attract new customers in Spain satisfying its credit standards, which could have an adverse effect on the Group’s ability to achieve its growth plans.
Risks Relating to Latin America
Events in Mexico could adversely affect the Group’s operations
The Mexican operations are relevant to the Group. The Group faces several types of risks in Mexico which could adversely affect its banking operations in Mexico or the Group as a whole. Despite signs of recovery following Mexico’s recession in 2009, economic conditions remain uncertain in Mexico. In addition, drug-related violence remains as a significant challenge for Mexico.
17
The Mexican economy grew by 1.2% in 2013 and is expected to grow by 3.4% in 2014. However, part of 2013 was characterized by a more acute downturn than originally forecasted due to the considerable slowdown in the industrial sector, partially driven by the weak private demand and also a contraction in public demand. The slowdown in the rate of job creation and the contribution of salaries to disposable income in real terms have been significant factors underlying the downturn in domestic demand. Another fact to consider is the low foreign-currency inflows from remittances, which continue to decline.
Delinquency rates on loans have increased in the past three years. If there is an increase in unemployment rates (which were 4.9% in 2013, 5.0% in 2012 and 5.2% in 2011 and are expected to be 4.6% in 2014), as a result for example of a more pronounced or prolonged slowdown in Europe or the United States, such rates may increase.
In addition, average inflation was 3.8% in 2013, exceeding the target set by the Mexican Central Bank. Any tightening of the monetary policy, including to address upward inflationary pressures, could make it more difficult for customers of the Group’s mortgage and consumer loan products in Mexico to service their debts, which could have a material adverse effect on the business, financial condition, cash flows and results of operations of the Bank’s Mexican subsidiary or the Group as a whole.
In addition, the Bank’s operations are subject to regulatory risks, including the effects of changes in laws, regulations, policies and interpretations, in Mexico. On January 9, 2014, certain financial reforms which had been proposed in May 2013, were adopted. Such measures address the following matters (i) the establishment of a new mandate for development banks, (ii) the promotion of competition to reduce interest rates, (iii) the creation of incentives for banks to give more credit and (iv) the strengthening of the banking system.
Moreover, according to the mandate of the Law for Transparent and Ordered Financial Services in place (last modified in 2010), the Mexican National Commission for the Protection and Defense of Financial Services Users (Comisión Nacional para la Defensa de los Usuarios de los Servicios Financieros) (“Condusef”) has continued to request that banks submit several of their service contracts to revision by the Condusef (for example, contracts relating to credit cards and insurance), in order to check that they comply with the relevant transparency and clarity requirements. Condusef does not have systematic ways to evaluate and grade service contracts, and this reflects on a substantial variation in grades from one year to the next and no clear instructions for adequating such contracts. The Law Committee of the Banking Association (ABM) is coordinating the creation of a working group that is expected to propose improvements in the process. In addition, Condusef has asked banks to formulate new procedures so that beneficiaries of deposit accounts can collect the funds in the case of the death of the account owner. We may have to incur compliance costs in connection with any new measures adopted by Condusef.
Furthermore, the Anti-Money Laundering Law (Ley Federal para la Prevención e Identificación de Operaciones con Recursos de Procedencia Ilícita) became effective in July 2013. The Law establishes more severe penalties for non-compliance and sets forth enhanced information requirements for some transactions.
Any of the risks referred to above or risks that may result from other adverse developments in laws, regulations, public policies or otherwise in Mexico may adversely affect the business, financial condition, operating results and cash flows of the Bank’s Mexican subsidiary or the Group as a whole.
The Bank’s Latin American subsidiaries’ growth, asset quality and profitability may be affected by volatile macroeconomic conditions, including significant inflation and government default on public debt, in the Latin American countries where they operate
The Latin American countries in which the Group operates have experienced significant economic volatility in recent decades, characterized by recessions, foreign exchange crises and significant inflation. This volatility has resulted in fluctuations in the levels of deposits and in the relative economic strength of various segments of the economies to which the Group lends. Negative and fluctuating economic conditions, such as a changing interest rate environment, also affect the Group’s profitability by causing lending margins to decrease and leading to decreased demand for higher-margin products and services. In addition, significant inflation (such as inflation recently experienced by Venezuela and Argentina) and local currency devaluations (such as in Venezuela and Argentina) can negatively affect the Group’s results of operations.
18
The start of the withdrawal of monetary stimuli by the Federal Reserve in the U.S., and the slowing of economic activity in several emerging markets led to an increase in volatility in the international financial markets in recent years. Latin America, like other emerging markets, has been one of the hardest hit in this new environment, particularly as Latin America benefited significantly from the increase in liquidity and the expansion in demand by countries such as China in recent years.
Many of the main challenges for the region relate to the evolution of external factors, including the crisis in Europe or the fiscal adjustment measures in the U.S., and the increasing use of macro-prudential measures to control global liquidity, which could deter financial flows to enter in Latin American countries. In addition, inflationary pressure in some countries in the region (with inflation in some countries exceeding the relevant central banks’ targets) has led to different approaches from central banks when dealing with turbulence in the financial markets. Price overheating could leave Latin America economies more vulnerable to an adverse external shock since the more important role of exports in their GDP is making them more dependent on the maintenance of high terms of trade. Moreover, uncertainty on the evolution of the global economy and lower global liquidity will likely contribute to a slight depreciation in exchange rates in most countries. This would result in monetary policy being less likely to act as a stabilizer in case of domestic overheating. The region needs to promote reforms to increase productivity and to consolidate growth in the long term, as the sustainable growth of per capita income cannot be based only on capital accumulation and employment growth.
In addition, negative and fluctuating economic conditions in some Latin American countries could result in government defaults on public debt. This could affect the Group in two ways: directly, through portfolio losses, and indirectly, through instabilities that a default in public debt could cause to the banking system as a whole, particularly since commercial banks’ exposure to government debt is generally high in several Latin American countries in which the Group operates.
While the Group seeks to mitigate these risks through what it believes to be conservative risk policies, no assurance can be given that its Latin American subsidiaries’ growth, asset quality and profitability will not be further affected by volatile macroeconomic conditions in the Latin American countries in which it operates.
Latin American economies can be directly and negatively affected by adverse developments in other countries
Financial and securities markets in Latin American countries in which the Group operates are, to varying degrees, influenced by economic and market conditions in other countries in Latin America and beyond. The region’s growth decelerated in 2012 and 2013, registering a growth rate of 2.1% (considering Argentina, Brazil, Chile, Colombia, Peru and Venezuela), in particular due to the economic slowdown of Brazil and Argentina, and was 2.6% in 2013. The region is expected to grow by 2.4% in 2014. The international financial outlook for Latin America has become less benign in recent months. Latin America, together with other emerging markets, has been one of the hardest hit regions by the economic crisis, with capital outflows, increases in sovereign spreads, stock market falls and devaluations in exchange rates. There has also been an adjustment in the prices of some of the most important export commodities during 2013. In addition, the outlook for foreign balances in Latin America worsened in 2013 due to the above mentioned correction in raw material prices and weak foreign demand.
Negative developments in the economy or securities markets in one country or area, particularly in the U.S., China or in Europe under current circumstances, may have a negative impact on emerging market economies. Among the main global risks for Latin American countries are those currently posed by the effects of the withdrawal of monetary stimuli or tapering in the U.S. by the Federal Reserve and the lower foreign demand of commodities mainly from Asian countries. Any such developments may adversely affect the business, financial condition, operating results and cash flows of BBVA’s subsidiaries in Latin America. These economies are also vulnerable to conditions in global financial markets and especially to commodities price fluctuations and these vulnerabilities usually reflect adversely in financial market conditions through exchange rate fluctuations, interest rate volatility and deposits volatility. For example, at the beginning of the financial crisis these economies were hit by a simultaneous drop in commodity export prices, a collapse in demand for non-commodity exports and a sudden halting of foreign bank loans. Even though most of these countries withstood the triple shock, with limited damage
19
to their financial sectors, non-performing loan ratios rose and bank deposits and loans contracted. These trends have been corrected in recent months in most countries. As a global economic recovery remains fragile, there are risks of a relapse. If the global financial crisis continues and, in particular, if the effects on the Chinese, European and U.S. economies intensify, the business, financial condition, operating results and cash flows of BBVA’s subsidiaries in Latin America are likely to be materially adversely affected.
The Group is exposed to foreign exchange and, in some instances, political risks as well as other risks in the Latin American countries in which it operates, which could cause an adverse impact on its business, financial condition and results of operations
The Group operates commercial banks and insurance and other financial services companies in various Latin American countries and its overall success as a global business depends, in part, upon its ability to succeed in differing economic, social and political conditions. The Group is confronted with different legal and regulatory requirements in many of the jurisdictions in which it operates. These include, but are not limited to, different tax regimes and laws relating to the repatriation of funds or nationalization or expropriation of assets. The Group’s international operations may also expose it to risks and challenges which its local competitors may not be required to face, such as exchange rate risk, difficulty in managing a local entity from abroad, and political risk which may be particular to foreign investors, or the distribution of dividends. For instance, the repatriation of dividends paid and the payments of dividends by our Venezuelan and Argentinean subsidiaries need to be approved in advance by the relevant local authorities. Market outlook for the withdrawal of monetary stimuli or tapering in the U.S., together with the risk of an increased slowdown in China, triggered widespread devaluation in exchange rates in the region in 2013.
The Group’s presence in Latin American markets also requires it to respond to rapid changes in market conditions in these countries. There can be no assurance that the Group will succeed in developing and implementing policies and strategies that are effective in each country in which it operates or that any of the foregoing factors will not have a material adverse effect on its business, financial condition and results of operations.
Regulatory changes in Latin America that are beyond the Group’s control may have a material effect on its business, financial condition, results of operations and cash flows
A number of banking regulations designed to maintain the safety and soundness of banks and limit their exposure to risk are applicable in certain Latin American countries in which the Group operates. Local regulations differ in a number of material respects from equivalent regulations in Spain and the United States.
Changes in regulations may have a material effect on its business and operations, particularly in Venezuela and Argentina. In addition, since some of the banking laws and regulations have been recently adopted, the manner in which those laws and related regulations are applied to the operations of financial institutions is still evolving. No assurance can be given that laws or regulations will be enforced or interpreted in a manner that will not have a material adverse effect on the Group’s business, financial condition, results of operations and cash flows.
Risks Relating to the United States
Adverse economic conditions in the United States may have a material effect on the Group’s business, financial condition, results of operations and cash flows
As a result of the business of the Bank’s subsidiaries in the United States, the Group is vulnerable to developments in this market, particularly the real estate market. The recent crisis had a significant effect on the real economy and resulted in significant volatility and uncertainty in markets and economies around the world. The recovery is still weak, as the economy is growing at low rates and unemployment is persistently high. The U.S. economy registered a 1.9% growth rate for 2013, down from 2.8% in 2012. A 2.5% growth rate is expected for 2014. Worsening economic conditions in the United States could have a material adverse effect on the business, financial condition, results of operations and cash flows of the Bank’s subsidiary BBVA Compass, or the Group as a whole, and could require the Bank to provide BBVA Compass with additional capital.
20
A further reduction in expansive monetary policies (“tapering”) could increase exchange rate volatility
In order to stimulate their economies, countries such as the United States and Japan are currently carrying out expansive monetary policies. A reduction of this stimulus (“tapering”), such as that being implemented by the United States, could potentially increase exchange rate volatility. The change of direction in U.S. monetary policy has had a global impact. The emerging economies are being subjected to capital outflows and currency depreciation, intensified in some cases by domestic events that have increased uncertainty regarding the management of their respective local economic policies. There continues to be a differentiation between economies depending on their fundamentals: higher external deficits and more dependence on short-term and foreign-currency funding are associated with greater vulnerability to capital outflows and currency depreciation. The monetary tightening being introduced by some of these countries to control currency depreciation and inflation expectations may have a negative impact on growth. This might especially impact emerging economies such as Asia, Latin America and Turkey, which would negatively affect the business, financial condition, operating results and cash flows of the Bank’s subsidiaries in such regions.
Risks Relating to Other Countries
The Group’s business in Asia exposes it to regulatory, economic and geopolitical risk relating to emerging markets in the region, particularly in China
BBVA’s ownership interest in members of the CITIC Group, a Chinese banking group, are a 29.7% stake in CITIC International Financial Holdings Ltd (“CIFH”) and a 9.9% stake in China CITIC Bank Corporation Limited (“CNCB”). CIFH is a banking entity headquartered in Hong Kong and CNCB is a banking entity headquartered in China. As a result of the Group’s expansion into Asia, it is exposed to increased risks relating to emerging markets in the region, particularly in China. The Chinese government has exercised, and continues to exercise, significant influence over the Chinese economy. Chinese governmental actions, including changes in laws or regulations or in the interpretation of existing laws or regulations, concerning the economy and state-owned enterprises, or otherwise affecting the Group’s activity, could have a significant effect on Chinese private sector entities in general, and on CIFH or CNCB in particular. Chinese authorities have implemented a series of monetary tightening and macro prudential policies to slow credit growth and to contain rises in real estate prices. These could undermine profitability in the banking sector generally and CIFH’s and CNCB’s respective profitability in particular. The Group’s business in China may also be affected by the increased credit quality risks resulting from the increase in local government debt and financial stresses in smaller companies as their access to various forms of non-bank credit is tightened.
In addition, while the Group believes long term prospects in both China and Hong Kong are positive, particularly for the consumer finance market, near term risks are present from the impact of a slowdown in global growth, which could result in tighter financing conditions and could pose risks to credit quality. China’s GDP growth has moderated following efforts to avert overheating and steer the economy towards a soft landing. For 2013, China registered a 7.7% growth in GDP and 7.6% growth is expected for 2014. While there was uncertainty at the beginning of 2013 regarding the sustainability of its growth and the possibility of a hard landing, the economy recovered in the second half of 2013, although some of the more recent data on confidence and expectations of manufacturing activity are once again below market expectations.
In addition, fundamental changes in China’s economic policy have been announced. At the third plenum of the Chinese Communist Party, the authorities reiterated their commitment to maintaining high rates of growth, while at the same time proposing measures that will strengthen the role of the market in allocating resources and a rebalancing of the Chinese economy from a model of investment and exports towards increasing household consumption. These measures have high execution risks. For example, the rapid growth of credit is being reflected in liquidity tensions in the interbank market which are particularly affecting the shadow banking sector and a continuation of these tensions could have adverse effects on the stability of the system.
Any of these developments could have a material adverse effect on the Group’s investments in China and Hong Kong or the business, financial condition, results of operations and cash flows of the Group.
21
Since Garanti operates primarily in Turkey, economic, political and other developments in Turkey may have a material adverse effect on Garanti’s business, financial condition and results of operations and the value of the Bank’s investment in Garanti
In 2011, the Bank acquired a 25.01% interest in Türkiye Garanti Bankası A.Ş. (“Garanti”). Most of Garanti’s operations are conducted, and most of its customers are located, in Turkey. Accordingly, Garanti’s ability to recover on loans, its liquidity and financial condition and its results of operations are substantially dependent upon the economic, political and other conditions prevailing in or that otherwise affect Turkey. For instance, if the Turkish economy is adversely affected by, among other factors, a reduction in the level of economic activity, continuing inflationary pressures, devaluation or depreciation of the Turkish Lira, a natural disaster or an increase in domestic interest rates, then a greater portion of Garanti’s customers may not be able to repay loans when due or meet their other debt service requirements to Garanti, which would increase Garanti’s past due loan portfolio and could materially reduce its net income and capital levels.
After growing by approximately 2.4% in 2012 and 3.9% in 2013, the Turkish economy is expected to grow at a slower pace in 2014. In addition, inflation was 8.7% in 2012 and 7.6% in 2013, and may increase in 2014. The recent civil developments and political situation in Turkey as well as the interest rate increases to address the depreciation of the Turkish lira could adversely affect economic growth. The political crisis deepened in December 2013 and may continue. Furthermore, Turkey’s recent credit boom led to the rapid widening of its current account deficit, which reached a multi-year high of 9.9% of GDP in 2011, 5.9% in 2012 and around 7.4% in 2013. Turkey is an emerging market and it is subject to greater risks than more developed markets, as witnessed by the recent civil developments, which may also have an adverse effect on the financial sector. Financial turmoil in any emerging market could negatively affect other emerging markets, including Turkey, or the global economy in general. Moreover, financial turmoil in emerging markets tends to adversely affect stock prices and debt securities prices of other emerging markets as investors move their money to more stable and developed markets, and may reduce liquidity to companies located in the affected markets. An increase in the perceived risks associated with investing in emerging economies in general, or Turkey in particular, could dampen capital flows to Turkey and adversely affect the Turkish economy.
In addition, actions taken by the Turkish government could adversely affect Garanti’s business and prospects. For example, currency restrictions and other restraints on transfer of funds may be imposed by the Turkish government, Turkish government regulation or administrative polices may change unexpectedly or otherwise negatively affect Garanti, the Turkish government may increase its participation in the economy, including through nationalizations of assets, or the Turkish government may impose burdensome taxes or tariffs. The occurrence of any or all of the above risks could have a material adverse effect on Garanti’s business, financial condition and results of operations and the value of the Bank’s investment in Garanti. Moreover, political uncertainty or instability within Turkey and in some of its neighboring countries (including as a result of the ongoing civil war in Syria) has historically been one of the potential risks associated with investments in Turkish companies.
Furthermore, a significant majority of Garanti’s total securities portfolio is invested in securities issued by the Turkish government. In addition to any direct losses that Garanti might incur, a default, or the perception of increased risk of default, by the Turkish government in making payments on its securities or the possible downgrade in Turkey’s credit rating would likely have a significant negative impact on the value of the government securities held in Garanti’s securities portfolio and the Turkish banking system generally and make such government securities difficult to sell, and may have a material adverse effect on Garanti’s business, financial condition and results of operations and the value of the Bank’s investment in Garanti.
Any of the risks referred to above could have a material adverse effect on Garanti’s business, financial condition and results of operations and the value of the Bank’s investment in Garanti.
The Bank entered into a shareholders’ agreement with Doğuş Holding A. Ş. in connection with the Garanti acquisition
The Bank entered into a shareholders’ agreement with Doğuş Holding A.Ş. (Doğuş)¸ in connection with the Garanti acquisition. Pursuant to the shareholders’ agreement, the Bank and Doğuş have agreed to manage Garanti through the appointment of board members and senior management. Doğuş is one of the largest Turkish
22
conglomerates and has business interests in the financial services, construction, tourism and automotive sectors. Any financial reversal, negative publicity or other adverse circumstance relating to Doğuş could adversely affect Garanti or the Bank. Furthermore, the Bank must successfully cooperate with Doğuş in order to manage Garanti and grow its business. It is possible that the Bank and Doğuş will be unable to agree on the management or operational strategies to be followed by Garanti, which could adversely affect Garanti’s business, financial condition and results of operations and the value of the Bank’s investment and lead to the Bank’s failure to achieve the expected benefits from the Garanti acquisition.
Other Risks
Weaknesses or failures in the Group’s internal processes, systems and security could materially adversely affect its results of operations, financial condition or prospects, and could result in reputational damage
Operational risks, through inadequate or failed internal processes, systems (including financial reporting and risk monitoring processes) or security, or from people-related or external events, including the risk of fraud and other criminal acts carried out against Group companies, are present in the Group’s businesses. These businesses are dependent on processing and reporting accurately and efficiently a high volume of complex transactions across numerous and diverse products and services, in different currencies and subject to a number of different legal and regulatory regimes. Any weakness in these internal processes, systems or security could have an adverse effect on the Group’s results, the reporting of such results, and on the ability to deliver appropriate customer outcomes during the affected period. In addition, any breach in security of the Group’s systems could disrupt its business, result in the disclosure of confidential information and create significant financial and legal exposure for the Group. Although the Group devotes significant resources to maintain and regularly update its processes and systems that are designed to protect the security of its systems, software, networks and other technology assets, there is no assurance that all of its security measures will provide absolute security. Any damage to the Group’s reputation (including to customer confidence) arising from actual or perceived inadequacies, weaknesses or failures in its systems, processes or security could have a material adverse effect on its results of operations, financial condition or prospects.
The financial industry is increasingly dependent on information technology systems, which may fail, may not be adequate for the tasks at hand or may no longer be available
Banks and their activities are increasingly dependent on highly sophisticated information technology (“IT”) systems. IT systems are vulnerable to a number of problems, such as software or hardware malfunctions, computer viruses, hacking and physical damage to vital IT centers. IT systems need regular upgrading and banks may not be able to implement necessary upgrades on a timely basis or upgrades may fail to function as planned. Furthermore, failure to protect financial industry operations from cyber-attacks could result in the loss or compromise of customer data or other sensitive information. These threats are increasingly sophisticated and there can be no assurance that banks will be able to prevent all breaches and other attacks on its IT systems. In addition to costs that may be incurred as a result of any failure of IT systems, banks could face fines from bank regulators if it fails to comply with applicable banking or reporting regulations.
Compliance with anti-money laundering and anti-terrorism financing rules involves significant cost and effort
Group companies are subject to rules and regulations regarding money laundering and the financing of terrorism. Monitoring compliance with anti-money laundering and anti-terrorism financing rules can put a significant financial burden on banks and other financial institutions and pose significant technical problems. Although the Group believes that its current policies and procedures are sufficient to comply with applicable rules and regulations, it cannot guarantee that its Group-wide anti-money laundering and anti-terrorism financing policies and procedures completely prevent situations of money laundering or terrorism financing. Any of such events may have severe consequences, including sanctions, fines and notably reputational consequences, which could have a material adverse effect on the Group’s financial condition and results of operations.
23
Our financial statements and periodic disclosure under securities laws may not give you the same information as financial statements prepared under U.S. accounting rules and periodic disclosures provided by domestic U.S. issuers
Publicly available information about public companies in Spain is generally less detailed and not as frequently updated as the information that is regularly published by or about listed companies in the United States. In addition, although we are subject to the periodic reporting requirements of the Exchange Act, the periodic disclosure required of foreign private issuers under the Exchange Act is more limited than the periodic disclosure required of U.S. issuers. Finally, we maintain our financial accounts and records and prepare our financial statements in conformity EU-IFRS required to be applied under the Bank of Spain’s Circular 4/2004 and in compliance with IFRS-IASB, which differs in certain respects from U.S. GAAP, the financial reporting standard to which many investors in the United States may be more accustomed.
ITEM 4. INFORMATION ON THE COMPANY
| A. | History and Development of the Company |
BBVA’s predecessor bank, BBV, was incorporated as a limited liability company (a “sociedad anónima” or S.A.) under the Spanish Corporations Law on October 1, 1988. BBVA was formed following the merger of Argentaria into BBV, which was approved by the shareholders of each entity on December 18, 1999 and registered on January 28, 2000. It conducts its business under the commercial name “BBVA”. BBVA is registered with the Commercial Registry of Vizcaya (Spain). It has its registered office at Plaza de San Nicolás 4, Bilbao, Spain, 48005, and operates out of Paseo de la Castellana, 81, 28046, Madrid, Spain telephone number +34-91-374-6201. BBVA’s agent in the U.S. for U.S. federal securities law purposes is Banco Bilbao Vizcaya Argentaria, S.A., New York Branch (1345 Avenue of the Americas, New York, New York 10105 (Telephone: 212-728-1660)). BBVA is incorporated for an unlimited term.
Capital Expenditures
Our principal investments are financial investments in our subsidiaries and affiliates. The main capital expenditures from 2011 to the date of this Annual Report were the following:
2013
Acquisition of Unnim Vida. On February 1, 2013, Unnim Banc, S.A. reached an agreement with Aegon Spain Holding B.V. to acquire its 50% stake in Unnim Vida, S.A. de Seguros y Reaseguros (“Unnim Vida”). As a result BBVA Group’s total holding in the share capital of Unnim Vida is 100%.
2012
Acquisition of Unnim.On March 7, 2012, the Management Commission of the Fund for Orderly Bank Restructuring (Fondo de Restructuración Ordenada Bancaria or “FROB”) accepted BBVA’s offer to acquire Unnim Banc, S.A. (“Unnim”). The FROB, the Deposit Guarantee Fund of Credit Institutions (Fondo de Garantía de Depósitos or “FGD”) and BBVA entered into a purchase agreement, by virtue of which BBVA acquired 100% of the shares of Unnim for a purchase price of €1.
In addition, BBVA, the FGD, the FROB and Unnim signed a Protocol of Financial Measures for the restructuring of Unnim, which regulates the Asset Protection Scheme through which the FGD will be responsible for 80% of the losses incurred by a predetermined asset portfolio of Unnim for a period of 10 years following the transaction.
On July 27, 2012, following the completion of the transaction, BBVA became the holder of 100% of the capital of Unnim.
24
2011
Acquisition of a capital holding in the Turkish bank Garanti. On March 22, 2011, through the execution of the agreements signed in November 2010 with the Doğuş group and having obtained the corresponding authorizations, BBVA completed the acquisition of a 24.89% holding of the share capital of Türkiye Garanti Bankası A.Ş. (“Garanti”). Subsequently, an additional 0.12% holding was acquired through the stock exchanges, increasing the BBVA Group’s total holding in the share capital of Garanti to 25.01% as of December 31, 2011. The total amount spent on these acquisitions totaled $5,876 million (approximately €4,140 million at the exchange rate on the date of the transaction).
The agreements with the Doğuş group include an arrangement for the joint management of the bank and the appointment of some of the members of its Board of Directors by the BBVA Group. BBVA also has a perpetual option to purchase an additional 1% of Garanti, which will become exercisable on March 22, 2016. Considering its current shareholding structure, if the BBVA Group were to exercise this option, it would have effective control of Garanti. For additional information, see Note 3 to the Consolidated Financial Statements.
Purchase of Credit Uruguay Banco. On January 18, 2011, after obtaining the corresponding authorizations, the purchase of Credit Uruguay Banco was completed for approximately €78 million, generating goodwill for an insignificant amount.
Capital increase in CNCB. BBVA participated in the capital increase carried out by China CITIC Bank Corporation Limited (“CNCB”) in 2011, in order to maintain its stake in CNCB (15%), with a payment of €425 million.
Capital Divestitures
Our principal divestitures are financial divestitures in our subsidiaries and in affiliates. The main capital divestitures from 2011 to the date of this Annual Report were the following:
2013
Sale of BBVA Panama
On July 20, 2013, BBVA announced that it had reached an agreement with Leasing Bogotá S.A., Panamá, a subsidiary of Grupo Aval Acciones y Valores, S.A., for the sale of BBVA’s direct and indirect ownership interest (98.92%) in Banco Bilbao Vizcaya Argentaria (Panamá), S.A. (“BBVA Panamá”). On December 19, 2013, after having obtained the necessary approvals, BBVA completed the sale.
The total consideration that BBVA received pursuant to this sale amounted to approximately $645 million. BBVA received part of the consideration through the distribution of dividends from BBVA Panamá prior to the closing of the transaction amounting to $140 million (such amount reduced the purchase price to be paid to BBVA on closing).
After deducting such distribution of dividends the capital gain for BBVA, gross of taxes, amounted to approximately €230 million which was recognized under the heading “Gains (losses) in non-current assets held for sale not classified as discontinued operations” in the consolidated income statement in 2013. See Note 52.1 to our Consolidated Financial Statements for additional information.
Sale of pension businesses in Latin America
On May 24, 2012, we announced our decision to conduct a study on strategic alternatives for our pension business in Latin America. The alternatives considered in this process included the total or partial sale of the businesses of the Pension Fund Administrators (AFP) in Chile, Colombia and Peru, and the Retirement Fund Administrator (Afore) in Mexico. For additional information, see Note 3 to the Consolidated Financial Statements.
25
On October 2, 2013, with the sale of AFP Provida (as defined below), BBVA finalized this process. Below is a description of each of the transactions that have been carried out during this process:
Sale of AFP Provida (Chile)
On February 1, 2013, BBVA reached an agreement with MetLife, Inc., for the sale of the 64.3% stake that BBVA held direct and indirectly in the Chilean Pension Fund manager Administradora de Fondos de Pensiones Provida S.A. (“AFP Provida”).
On October 2, 2013, BBVA completed the sale. The total amount in cash received by BBVA was approximately $1,540 million, taking into account the purchase price amounting to roughly $1,310 million as well as the dividends paid by AFP Provida since February 1, 2013 amounting to roughly $230 million. The gain on disposal, attributable to the parent company net of taxes, amounted to approximately €500 million which was recognized under the heading “Profit from discontinued operations (net)” in the consolidated income statement in 2013. See Note 52.2 to our Consolidated Financial Statements for additional information.
Sale of BBVA AFP Horizonte S.A. (Peru)
On April 23, 2013, BBVA sold its wholly-owned Peruvian subsidiary AFP Horizonte S.A. to AFP Integra S.A. and Profuturo AFP, S.A. who have each acquired 50% of AFP Horizonte, S.A. The total consideration paid for such shares was approximately $544 million. This consideration consisted in a cash payment of approximately $516 million and the distribution of a dividend prior to the closing of approximately $28 million.
The gain on disposal, attributable to parent company net of taxes, amounted to approximately €206 million at the moment of the sale and such gain was recognized under the heading “Profit from discontinued operations (net)” in the consolidated income statement in 2013. See Note 52.2 to our Consolidated Financial Statements for additional information.
Sale of BBVA AFP Horizonte S.A. (Colombia)
On December 24, 2012, BBVA reached an agreement with Sociedad Administradora de Fondos de Pensiones y Cesantías Porvenir, S.A., a subsidiary of Grupo Aval Acciones y Valores, S.A., for the sale to the former of the total stake that BBVA held directly or indirectly in the Colombian company BBVA Horizonte Sociedad Administradora de Fondos de Pensiones y Cesantías S.A.
On April 18, 2013, after having obtained the necessary approvals, BBVA completed the sale. The adjusted total price was $541.4 million. The gain on disposal, attributable to parent company net of taxes, amounted to approximately €255 million at the moment of the sale, and was recognized under the heading “Profit from discontinued operations (net)” in the consolidated income statement in 2013. See Note 52.2 to our Consolidated Financial Statements for additional information.
Sale of Afore Bancomer (Mexico)
On November 27, 2012, BBVA reached an agreement to sell to Afore XXI Banorte, S.A. de C.V. its entire stake directly or indirectly held in the Mexican subsidiary Administradora de Fondos para el Retiro Bancomer, S.A. de C.V. Once the corresponding authorization was obtained from the competent authorities, the sale was closed on January 9, 2013.
The total sale price was $1,735 million (approximately €1,327 million). The gain on disposal, attributable to parent company net of taxes, was approximately €771 million. See Note 52.2 to our Consolidated Financial Statements for additional information.
New agreement with CITIC Group
As of October 17, 2013, BBVA reached a new agreement with the CITIC Group which contemplated the sale of BBVA’s 5.1% stake in China CITIC Bank Corporation Limited (CNCB) to CITIC Limited for an amount of approximately €944 million. After this sale, the stake of BBVA in CNCB was reduced to 9.9%.
26
BBVA and the CITIC Group also agreed to adapt their strategic cooperation agreement to the new circumstances by removing the exclusivity obligations that affected the activities of BBVA in China and agreeing to negotiate new areas of cooperation among both banks.
As a result of the changes referred to above, the Company began accounting for its investment in CNCB as an “Available-for-sale financial asset” as of October 1, 2013. See Note 12 to our Consolidated Financial Statements for additional information.
The change in the accounting criteria and the sale referred to above resulted in a loss attributable to the BBVA Group at the time of the sale of approximately €2,600 million which was recognized under the heading “Gains (losses) on derecognized assets not classified as non-current assets held for sale” in the consolidated income statement in 2013. See Note 51 to our Consolidated Financial Statements for additional information.
2012
In June 2012, BBVA reached an agreement to sell its business in Puerto Rico to Oriental Financial Group Inc. The sale price was $500 million (approximately €385 million at the exchange rate on the date of the transaction). Gross capital losses from this sale amounted to approximately €15 million (taking into account the exchange rate at the time of the transaction and the earnings of the sold companies up to the closing of the transaction, on December 18, 2012). See Note 51 to our Consolidated Financial Statements for additional information.
2011
During 2011, BBVA sold its participation in certain non-strategic associates and also concluded the liquidation and merger of several issuers, financial services and real estate affiliates.
BBVA is a highly diversified international financial group, with strengths in the traditional banking businesses of retail banking, asset management, private banking and wholesale banking. We also have investments in some of Spain’s leading companies.
Operating Segments
The main changes in the reporting structure of the Group’s operating segments in 2013 are as follows:
| | • | | As a result of the increasingly geographical orientation of the Group’s reporting structure, certain portfolios, finance and structural euro balance sheet positions managed by the Assets and Liabilities Committee (ALCO) that were previously reported under the Corporate Center (formerly, Corporate Activities) are now part of the Spain segment (described below) of the Group. |
| | • | | Due to the particularities of their management, the assets and results pertaining to the real estate business in Spain are now presented under a separate segment: Real Estate Activity in Spain. This new segment includes lending to real estate developers (which was previously included in the Spain segment) and foreclosed real estate assets (which were previously included in the Corporate Center segment). |
Set forth below are the Group’s current six operating segments:
| | • | | Real Estate Activity in Spain |
27
For comparison purposes, the Group’s 2012 and 2011 financial information by operating segment has been restated to reflect the Group’s current reporting structure.
In addition to the operating segments referred to above, the Group has a Corporate Center which includes those items that have not been allocated to an operating segment. It includes the Group’s general management functions, including: costs from central units that have a strictly corporate function; management of structural exchange rate positions carried out by the Financial Planning unit; specific issues of capital instruments to ensure adequate management of the Group’s overall capital position; proprietary portfolios such as industrial holdings and their corresponding results; certain tax assets and liabilities; provisions related to commitments with pensioners; and goodwill and other intangibles. It also comprises the following items (i) with respect to 2013, the earnings from the sale of the pension businesses in Mexico, Colombia, Peru and Chile and also the earnings of these businesses until their sale; the capital gain from the sale of BBVA Panama; and the impact of the reduction of the stake in CNCB (which led to the repricing at market value of BBVA’s stake in CNCB, as well as the impact of the equity-adjusted earnings from CNCB, excluding dividends), (ii) with respect to 2012, the badwill generated by the Unnim acquisition, the capital gain from the sale of BBVA Puerto Rico, the earnings from the pension business in Latin America, and the equity-adjusted earnings from CNCB (excluding dividends), and (iii) with respect to 2011, the results from the pension business in Latin America and the equity-adjusted earnings from CNCB (excluding dividends).
Set forth below is financial information for each of the Group’s current operating segments as of and for the years ended December 31, 2013, 2012 and 2011.
The breakdown of the Group’s total assets by operating segments as of December 31, 2013, 2012 and 2011 is as follows:
| | | | | | | | | | | | |
| | | As of December 31, | |
| Total Assets by Operating Segment | | 2013 | | | 2012 | | | 2011 | |
| | | (In Millions of Euros) | |
Spain | | | 315,561 | | | | 345,362 | | | | 323,249 | |
Real Estate Activity in Spain | | | 20,563 | | | | 21,923 | | | | 22,558 | |
Eurasia (*) | | | 41,223 | | | | 48,324 | | | | 53,439 | |
Mexico | | | 82,171 | | | | 81,723 | | | | 72,156 | |
South America | | | 78,141 | | | | 77,474 | | | | 62,651 | |
United States | | | 53,042 | | | | 53,892 | | | | 53,090 | |
| | | | | | | | | | | | |
Subtotal Assets by Operating Segments | | | 590,700 | | | | 628,698 | | | | 587,143 | |
| | | | | | | | | | | | |
Corporate Center and other adjustments (**) | | | (8,125 | ) | | | (7,626 | ) | | | (4,305 | ) |
| | | | | | | | | | | | |
Total Assets BBVA Group | | | 582,575 | | | | 621,072 | | | | 582,838 | |
| | | | | | | | | | | | |
| (*) | The information is presented under management criteria, pursuant to which Garanti’s information has been proportionally integrated based on our 25.01% interest in Garanti. |
| (**) | Other adjustments include adjustments made to account for the fact that, in our Consolidated Financial Statements, Garanti is accounted for using the equity method rather than using the management criteria referred above. For more information see “Item 5. Operating and Financial Review and Prospects”. |
28
The following table sets forth information relating to the profit attributable to the parent company by each of BBVA’s operating segments for the years ended December 31, 2013, 2012 and 2011:
| | | | | | | | | | | | | | | | | | | | | | | | |
| | | Profit/(Loss)
Attributable to Parent
Company | | | % of Profit/(Loss)
Attributable to Parent
Company | |
| | | For the Year Ended December 31, | |
| | | 2013 | | | 2012 | | | 2011 | | | 2013 | | | 2012 | | | 2011 | |
| | | (In Millions of Euros) | | | (In Percentage) | |
Spain | | | 583 | | | | 1,162 | | | | 1,075 | | | | 18.1 | | | | 136.2 | | | | 40.5 | |
Real Estate Activity in Spain | | | (1,254 | ) | | | (4,044 | ) | | | (809 | ) | | | (38.9 | ) | | | (474.1 | ) | | | (30.5 | ) |
Eurasia | | | 454 | | | | 404 | | | | 563 | | | | 14.1 | | | | 47.4 | | | | 21.2 | |
Mexico | | | 1,805 | | | | 1,689 | | | | 1,638 | | | | 55.9 | | | | 198.0 | | | | 61.7 | |
South America | | | 1,249 | | | | 1,199 | | | | 898 | | | | 38.7 | | | | 140.6 | | | | 33.8 | |
United States | | | 390 | | | | 443 | | | | (713 | ) | | | 12.1 | | | | 51.9 | | | | (26.9 | ) |
| | | | | | | | | | | | | | | | | | | | | | | | |
Subtotal Operating Segments | | | 3,227 | | | | 853 | | | | 2,654 | | | | 100.0 | | | | 100.0 | | | | 100.0 | |
| | | | | | | | | | | | | | | | | | | | | | | | |
Corporate Center | | | (999 | ) | | | 823 | | | | 351 | | | | | | | | | | | | | |
| | | | | | | | | | | | | | | | | | | | | | | | |
Profit attributable to Parent Company | | | 2,228 | | | | 1,676 | | | | 3,004 | | | | | | | | | | | | | |
| | | | | | | | | | | | | | | | | | | | | | | | |
The following table sets forth information relating to the income of each operating segment for the years ended December 31, 2013, 2012 and 2011 and reconciles the income statement of the various operating segments to the consolidated income statement of the Group:
| | | | | | | | | | | | | | | | | | | | | | | | | | | | | | | | | | | | | | | | |
| | | Operating Segments | | | | | | | | | | | | | |
| | | Spain | | | Real
Estate
Activity
in Spain | | | Eurasia(*) | | | Mexico | | | South
America | | | United
States | | | Corporate
Center | | | Total | | | Adjustments
(**) | | | BBVA
Group | |
| | | (In Millions of Euros) | |
2013 | | | | | | | | | | | | | | | | | | | | | | | | | | | | | | | | | | | | | | | | |
Net interest income | | | 3,830 | | | | (3 | ) | | | 911 | | | | 4,484 | | | | 4,703 | | | | 1,407 | | | | (719 | ) | | | 14,613 | | | | (713 | ) | | | 13,900 | |
Operating profit/(loss) before tax | | | 222 | | | | (1,840 | ) | | | 593 | | | | 2,362 | | | | 2,387 | | | | 534 | | | | (1,507 | ) | | | 2,750 | | | | (1,590 | ) | | | 1,160 | |
| | | | | | | | | | | | | | | | | | | | | | | | | | | | | | | | | | | | | | | | |
Profit | | | 583 | | | | (1,254 | ) | | | 454 | | | | 1,805 | | | | 1,249 | | | | 390 | | | | (999 | ) | | | 2,228 | | | | — | | | | 2,228 | |
| | | | | | | | | | | | | | | | | | | | | | | | | | | | | | | | | | | | | | | | |
2012 | | | | | | | | | | | | | | | | | | | | | | | | | | | | | | | | | | | | | | | | |
Net interest income | | | 4,748 | | | | (20 | ) | | | 851 | | | | 4,178 | | | | 4,288 | | | | 1,551 | | | | (473 | ) | | | 15,122 | | | | (648 | ) | | | 14,474 | |
Operating profit/(loss) before tax | | | 1,652 | | | | (5,705 | ) | | | 508 | | | | 2,229 | | | | 2,271 | | | | 619 | | | | (826 | ) | | | 749 | | | | 833 | | | | 1,582 | |
| | | | | | | | | | | | | | | | | | | | | | | | | | | | | | | | | | | | | | | | |
Profit | | | 1,162 | | | | (4,044 | ) | | | 404 | | | | 1,689 | | | | 1,199 | | | | 443 | | | | 823 | | | | 1,676 | | | | — | | | | 1,676 | |
| | | | | | | | | | | | | | | | | | | | | | | | | | | | | | | | | | | | | | | | |
2011 | | | | | | | | | | | | | | | | | | | | | | | | | | | | | | | | | | | | | | | | |
Net interest income | | | 4,248 | | | | 104 | | | | 806 | | | | 3,782 | | | | 3,159 | | | | 1,518 | | | | (465 | ) | | | 13,152 | | | | (428 | ) | | | 12,724 | |
Operating profit/(loss) before tax | | | 1,515 | | | | (1,216 | ) | | | 722 | | | | 2,153 | | | | 1,677 | | | | (1,053 | ) | | | (852 | ) | | | 2,946 | | | | 452 | | | | 3,398 | |
| | | | | | | | | | | | | | | | | | | | | | | | | | | | | | | | | | | | | | | | |
Profit | | | 1,075 | | | | (809 | ) | | | 563 | | | | 1,638 | | | | 898 | | | | (713 | ) | | | 351 | | | | 3,004 | | | | — | | | | 3,004 | |
| | | | | | | | | | | | | | | | | | | | | | | | | | | | | | | | | | | | | | | | |
| (*) | The information is presented under management criteria, pursuant to which Garanti’s information has been proportionally integrated based on our 25.01% interest in Garanti. |
| (**) | Other adjustments include adjustments made to account for the fact that, in our Consolidated Financial Statements, Garanti is accounted for using the equity method rather than using the management criteria referred above. For more information see “Item 5. Operating and Financial Review and Prospects”. |
29
Spain
The Spain operating segment includes all of BBVA’s banking and non-banking businesses in Spain, other than those included in the Corporate Center area and Real Estate Activity in Spain. The main business units included in this operating segment are:
| | • | | Spanish Retail Network: including the segments of individual customers, private banking, small companies and businesses in the domestic market; |
| | • | | Corporate and Business Banking (CBB): which manages small and medium sized enterprises (SMEs), companies and corporations, public institutions and developer segments; |
| | • | | Corporate and Investment Banking (C&IB): responsible for business with large corporations and multinational groups and the trading floor and distribution business in Spain; and |
| | • | | Other units: which include the insurance business unit in Spain (BBVA Seguros), and the Asset Management unit, which manages Spanish mutual funds and pension funds. |
In addition, it includes certain portfolios, finance and structural euro balance sheet positions as described above.
The following table sets forth information relating to the activity of this operating segment for the years ended December 31, 2013, 2012 and 2011:
| | | | | | | | | | | | |
| | | As of December 31, | |
| | | 2013 | | | 2012 | | | 2011 | |
| | | (In Millions of Euros) | |
| | | |
Total Assets | | | 315,561 | | | | 345,362 | | | | 323,249 | |
| | | |
Loans and advances to customers | | | 178,081 | | | | 193,101 | | | | 194,147 | |
Of which: | | | | | | | | | | | | |
Residential mortgages | | | 77,575 | | | | 84,602 | | | | 76,900 | |
Consumer finance | | | 6,703 | | | | 7,663 | | | | 8,077 | |
Loans | | | 4,962 | | | | 6,043 | | | | 6,500 | |
Credit cards | | | 1,741 | | | | 1,620 | | | | 1,577 | |
Loans to enterprises | | | 36,969 | | | | 47,635 | | | | 55,349 | |
Loans to public sector | | | 21,694 | | | | 24,772 | | | | 25,092 | |
| | | |
Customer deposits under management (*) | | | 147,782 | | | | 133,802 | | | | 109,160 | |
Current and savings accounts | | | 53,380 | | | | 47,449 | | | | 44,044 | |
Time deposits | | | 74,435 | | | | 62,587 | | | | 44,719 | |
Other customer funds | | | 19,967 | | | | 23,765 | | | | 20,397 | |
| | | |
Off-balance sheet funds | | | 42,911 | | | | 40,134 | | | | 43,048 | |
Mutual funds | | | 22,298 | | | | 19,116 | | | | 19,598 | |
Pension funds | | | 20,428 | | | | 18,577 | | | | 17,224 | |
Other placements | | | 185 | | | | 2,441 | | | | 6,227 | |
Loans and advances to customers of this operating segment as of December 31, 2013 amounted to €178,081 million, a 7.8% decrease from the €193,101 million recorded as of December 31, 2012, mainly as a result of lower lending activity due to the deteriorated economic situation in Spain.
30
Customer deposits under management of this operating segment as of December 31, 2013 amounted to €147,782 million, a 10.4% increase from the €133,802 million recorded as of December 31, 2012, as a result of the growth of time deposits (18.9% year-on-year), due to the boosting of the multichannel business and a higher than 80% deposits renewal rate every month of 2013 despite the declining interest rates.
Mutual funds of this operating segment as of December 31, 2013 amounted to €22,298 million, a 16.6% increase from the €19,116 million recorded as of December 31, 2012, due to the boosting of the commercial strategy during the second half of the year and improving market trends.
Pension funds of this operating segment as of December 31, 2013 amounted to €20,428 million, a 10.0% increase from the €18,577 million recorded as of December 31, 2012, as a result of the higher level of newly signed individual pension plans when compared to 2012.
This operating segment’s non-performing assets ratio increased to 6.4% as of December 31, 2013, from 4.1% as of December 31, 2012, mainly due to the declining lending volumes and the deterioration of refinanced loans. This operating segment non-performing assets coverage ratio decreased to 41% as of December 31, 2013, from 48% as of December 31, 2012.
Real Estate Activity in Spain
This operating segment has been set up with the aim of providing specialized and structured management of the real estate assets accumulated by the Group as a result of the economic crisis in Spain. It includes primarily lending to real estate developers (which was previously included in the Spain segment) and foreclosed real estate assets (which were previously included in the Corporate Center).
The exposure, including loans and advances to customers and foreclosed assets, to the real estate sector in Spain is declining. As of December 31, 2013, the balance stood at €14,570 million, 6.5% lower than as of December 31, 2012. In 2013 there was an increase in the balance of non-performing developer loans, primarily with respect to refinanced loans. Within the exposure to the Spanish real estate sector, property securing mortgage loans to private individuals has increased year-on-year by 14.6%.
As of December 31, 2013, the segment’s coverage of non-performing and potential problem loans was 51% and overall coverage of real estate exposure was 45%. In the latter part of 2013, sales of owned real estate assets picked up pace and 21,383 units were sold during 2013.
Eurasia
This operating segment covers the retail and wholesale banking businesses of the Group in the rest of Europe and Asia. It also includes BBVA’s stakes in the Turkish bank Garanti and the Chinese banks CNCB and CIFH. Following management criteria, assets and liabilities corresponding to our 25.01% stake in Garanti are included in every balance sheet line.
31
The following table sets forth information relating to the business activity of this operating segment for the years ended December 31, 2013, 2012 and 2011:
| | | | | | | | | | | | |
| | | As of December 31, | |
| | | 2013 | | | 2012 | | | 2011 | |
| | | (In Millions of Euros) | |
| | | |
Total Assets | | | 41,223 | | | | 48,324 | | | | 53,439 | |
| | | |
Loans and advances to customers | | | 28,397 | | | | 30,228 | | | | 34,740 | |
Of which: | | | | | | | | | | | | |
Residential mortgages | | | 4,156 | | | | 4,291 | | | | 4,203 | |
Consumer finance | | | 3,983 | | | | 4,262 | | | | 3,729 | |
Loans | | | 2,743 | | | | 3,051 | | | | 2,767 | |
Credit cards | | | 1,240 | | | | 1,211 | | | | 962 | |
Loans to enterprises | | | 18,361 | | | | 19,777 | | | | 25,056 | |
Loans to public sector | | | 251 | | | | 102 | | | | 107 | |
| | | |
Customer deposits under management (*) | | | 16,475 | | | | 16,484 | | | | 20,384 | |
Current and savings accounts | | | 3,148 | | | | 3,098 | | | | 2,773 | |
Time deposits | | | 9,009 | | | | 9,576 | | | | 9,679 | |
Other customer funds | | | 4,318 | | | | 3,810 | | | | 7,933 | |
| | | |
Off-balance sheet funds | | | 1,966 | | | | 2,016 | | | | 1,729 | |
Mutual funds | | | 1,332 | | | | 1,408 | | | | 1,255 | |
Pension funds | | | 634 | | | | 608 | | | | 474 | |
Loans and advances to customers of this operating segment as of December 31, 2013 amounted to €28,397 million, a 6.1% decrease from the €30,228 million recorded as of December 31, 2012, as a result of the deleveraging of the wholesale business and the negative impact of the Turkish lira exchange rate.
Customer deposits under management of this operating segment as of December 31, 2013 amounted to €16,475 million, a 0.1% decrease from the €16,484 million recorded as of December 31, 2012, as a result of lower time deposit volumes.
Mutual funds of this operating segment as of December 31, 2013 amounted to €1,332 million, a 5.4% decrease from the €1,408 million recorded as of December 31, 2012, due to a decline of mutual funds in Turkey which more than offset the growth in Portugal.
Pension funds of this operating segment as of December 31, 2013 amounted to €634 million, a 4.3% increase from the €608 million recorded as of December 31, 2012, mainly as a result of increases in Turkey and Portugal.
This operating segment’s non-performing assets ratio increased to 3.4% as of December 31, 2013 from 2.8% as of December 31, 2012, mainly as a result of a lower volume of loans and advances to customers and an increase in non-performing loans, as a result of the consolidation of prudent risk management policy by BBVA (wholesale business and Portugal). This operating segment non-performing assets coverage ratio was 87% as of December 31, 2012 and 2013.
32
Mexico
The Mexico operating segment comprises the banking and insurance businesses conducted in Mexico by the BBVA Bancomer financial group. The following table sets forth information relating to the business activity of this operating segment for the years ended December 31, 2013, 2012 and 2011:
| | | | | | | | | | | | |
| | | As of December 31, | |
| | | 2013 | | | 2012 | | | 2011 | |
| | | (In Millions of Euros) | |
| | | |
Total Assets | | | 82,171 | | | | 81,723 | | | | 72,156 | |
| | | |
Loans and advances to customers | | | 40,129 | | | | 39,052 | | | | 34,450 | |
Of which: | | | | | | | | | | | | |
Residential mortgages | | | 8,985 | | | | 9,399 | | | | 8,854 | |
Consumer finance | | | 10,096 | | | | 9,785 | | | | 8,220 | |
Loans | | | 4,748 | | | | 4,421 | | | | 3,734 | |
Credit cards | | | 5,348 | | | | 5,364 | | | | 4,486 | |
Loans to enterprises | | | 13,975 | | | | 12,512 | | | | 10,938 | |
Loans to public sector | | | 3,594 | | | | 3,590 | | | | 3,313 | |
| | | |
Customer deposits under management (*) | | | 34,726 | | | | 34,071 | | | | 37,130 | |
Current and savings accounts | | | 24,498 | | | | 23,707 | | | | 21,103 | |
Time deposits | | | 6,409 | | | | 7,157 | | | | 7,398 | |
Other customer funds | | | 3,819 | | | | 3,207 | | | | 2,629 | |
| | | |
Off-balance sheet funds | | | 19,680 | | | | 19,896 | | | | 17,623 | |
Mutual funds | | | 16,896 | | | | 17,492 | | | | 15,612 | |
Other placements | | | 2,784 | | | | 2,404 | | | | 2,011 | |
Loans and advances to customers of this operating segment as of December 31, 2013 amounted to €40,129 million, a 2.8% increase from the €39,052 million recorded as of December 31, 2012, mainly due to the increase in financing to medium-sized enterprises.
Customer deposits under management of this operating segment as of December 31, 2013 amounted to €34,726 million, a 1.9% increase from the €34,071 million recorded as of December 31, 2012, mainly as a result of the increase in customer deposits in U.S. dollars in Mexico.
Mutual funds of this operating segment as of December 31, 2013 amounted to €16,896 million, a 3.4% decrease from the €17,492 million recorded as of December 31, 2012, mainly as a result of a decrease in fixed-income products.
This operating segment’s non-performing assets ratio decreased to 3.6% as of December 31, 2013, from 3.7% as of December 31, 2012. This operating segment non-performing assets coverage ratio decreased to 110% as of December 31, 2013, from 114% as of December 31, 2012. Both changes are mainly as a result of the increase in loans and advances to customers.
33
South America
The South America operating segment manages the BBVA Group’s banking and insurance businesses in the region.
The business units included in the South America operating segment are:
| | • | | Retail and Corporate Banking: includes banks in Argentina, Chile, Colombia, Paraguay, Peru, Uruguay and Venezuela. |
| | • | | Insurance businesses:includes insurance businesses in Argentina, Chile, Colombia, and Venezuela. |
The following table sets forth information relating to the business activity of this operating segment for the years ended December 31, 2013, 2012 and 2011:
| | | | | | | | | | | | |
| | | As of December 31, | |
| | | 2013 | | | 2012 | | | 2011 | |
| | | (In Millions of Euros) | |
| | | |
Total Assets | | | 78,141 | | | | 77,474 | | | | 62,651 | |
| | | |
Loans and advances to customers | | | 48,470 | | | | 48,721 | | | | 40,213 | |
Of which: | | | | | | | | | | | | |
Residential mortgages | | | 8,533 | | | | 8,627 | | | | 7,018 | |
Consumer finance | | | 13,112 | | | | 13,033 | | | | 9,849 | |
Loans | | | 9,441 | | | | 9,570 | | | | 7,352 | |
Credit cards | | | 3,670 | | | | 3,463 | | | | 2,496 | |
Loans to enterprises | | | 18,565 | | | | 17,529 | | | | 15,912 | |
Loans to public sector | | | 601 | | | | 625 | | | | 766 | |
| | | |
Customer deposits under management (*) | | | 58,881 | | | | 56,933 | | | | 44,890 | |
Current and savings accounts | | | 37,639 | | | | 34,339 | | | | 26,120 | |
Time deposits | | | 15,869 | | | | 17,107 | | | | 15,094 | |
Other customer funds | | | 5,374 | | | | 5,487 | | | | 3,676 | |
| | | |
Off-balance sheet funds | | | 6,552 | | | | 6,436 | | | | 5,698 | |
Mutual funds | | | 2,952 | | | | 3,355 | | | | 3,037 | |
Pension funds | | | 3,600 | | | | 3,081 | | | | 2,661 | |
Loans and advances to customers of this operating segment as of December 31, 2013 amounted to €48,470 million, a 0.5% decrease from the €48,721 million recorded as of December 31, 2012, mainly due to the negative effect of exchange rate movements which offset the increased activity in credit cards, customer finance and, to a lesser extent, mortgage lending.
Customer deposits under management of this operating segment as of December 31, 2013 amounted to €58,881 million, a 3.4% increase from the €56,933 million recorded as of December 31, 2012, mainly due to an increase in the balance of current and saving accounts, which was partially offset by the negative effect of exchange rate movements.
Mutual funds of this operating segment as of December 31, 2013 amounted to €2,952 million, a 12.0% decrease from the €3,355 million recorded as of December 31, 2012, mainly as a result of the positive performance in Peru and Chile.
34
Pension funds of this operating segment as of December 31, 2013 amounted to €3,600 million, a 16.8% increase from the €3,081 million recorded as of December 31, 2012, mainly as a result of the increased volumes in Bolivia.
This operating segment’s non-performing assets ratio was 2.1% as of December 31, 2012 and 2013. This operating segment non-performing assets coverage ratio decreased to 141% as of December 31, 2013, from 146% as of December 31, 2012.
United States
This operating segment encompasses the Group’s business in the United States. BBVA Compass accounted for approximately 95 per cent of the area’s balance sheet as of December 31, 2013. Given its weight, most of the comments below refer to BBVA Compass. This operating segment also covers the assets and liabilities of the BBVA office in New York, which specializes in transactions with large corporations.
The following table sets forth information relating to the business activity of this operating segment for the years ended December 31, 2013, 2012 and 2011:
| | | | | | | | | | | | |
| | | As of December 31, | |
| | | 2013 | | | 2012 | | | 2011 | |
| | | (In Millions of Euros) | |
| | | |
Total Assets | | | 53,042 | | | | 53,892 | | | | 53,090 | |
| | | |
Loans and advances to customers | | | 38,067 | | | | 36,892 | | | | 38,775 | |
Of which: | | | | | | | | | | | | |
Residential mortgages | | | 9,591 | | | | 9,109 | | | | 7,787 | |
Consumer finance | | | 4,464 | | | | 4,422 | | | | 4,584 | |
Loans | | | 3,984 | | | | 3,942 | | | | 4,134 | |
Credit cards | | | 481 | | | | 480 | | | | 450 | |
Loans to enterprises | | | 19,427 | | | | 19,292 | | | | 20,926 | |
Loans to public sector | | | 2,772 | | | | 1,961 | | | | 1,533 | |
| | | |
Customer deposits under management (*) | | | 38,448 | | | | 37,721 | | | | 35,127 | |
Current and savings accounts | | | 29,800 | | | | 29,060 | | | | 26,458 | |
Time deposits | | | 7,300 | | | | 7,885 | | | | 7,269 | |
Other customer funds | | | 1,348 | | | | 775 | | | | 1,399 | |
Loans and advances to customers of this operating segment as of December 31, 2013 amounted to €38,067 million, a 3.2% increase from the €36,892 million recorded as of December 31, 2012, as a result of growth in all of the segment’s portfolios.
Customer deposits under management of this operating segment as of December 31, 2013 amounted to €38,448 million, a 1.9% increase from the €37,721 million recorded as of December 31, 2012, mainly due to an increase in the balance of current and saving accounts.
This operating segment’s non-performing assets ratio decreased to 1.2% as of December 31, 2013, from 2.4% as of December 31, 2012. This operating segment non-performing assets coverage ratio increased to 138% as of December 31, 2013, from 90% as of December 31, 2012. Both changes are mainly as a result of the decrease in impaired loans and advances to customers due to improvements in credit quality and increases in repayments.
Insurance Activity
See Note 18 to our Consolidated Financial Statements for information on our insurance activity.
35
Monetary Policy
The integration of Spain into the European Monetary Union (“EMU”) on January 1, 1999 implied the yielding of monetary policy sovereignty to the Eurosystem. The “Eurosystem” is composed of the ECB and the national central banks of the 17 member countries that form the EMU.
The Eurosystem determines and executes the policy for the single monetary union of the 17 member countries of the EMU. The Eurosystem collaborates with the central banks of member countries to take advantage of the experience of the central banks in each of its national markets. The basic tasks carried out by the Eurosystem include:
| | • | | defining and implementing the single monetary policy of the EMU; |
| | • | | conducting foreign exchange operations in accordance with the set exchange policy; |
| | • | | lending to national monetary financial institutions in collateralized operations; |
| | • | | holding and managing the official foreign reserves of the member states; and |
| | • | | promoting the smooth operation of the payment systems. |
In addition, the Treaty on European Union (“EU Treaty”) establishes a series of rules designed to safeguard the independence of the system, in its institutional as well as in its administrative functions.
Supervision and Regulation
The Spanish government traditionally has been closely involved with the Spanish banking system, both as a direct participant through its ownership of ICO and as a regulator retaining an important role in the regulation and supervision of financial institutions.
The Bank of Spain
The Bank of Spain was established in 1962 as a public law entity (entidad de derecho público) that operates as Spain’s autonomous central bank. In addition, it has the ability to function as a private bank. Except in its public functions, the Bank of Spain’s relations with third parties are governed by private law and its actions are subject to the civil and business law codes and regulations.
Until January 1, 1999, the Bank of Spain was also the sole entity responsible for implementing Spanish monetary policy. For a description of monetary policy since the introduction of the euro, see “—Monetary Policy”.
Since January 1, 1999, the Bank of Spain has performed the following basic functions attributed to the Eurosystem:
| | • | | defining and implementing the Eurosystem’s monetary policy, with the principal aim of maintaining price stability across the euro area; |
| | • | | conducting currency exchange operations consistent with the provisions of Article 111 of the EU Treaty, and holding and managing the Member States’ official currency reserves; |
| | • | | promoting the sound working of payment systems in the euro area; and |
| | • | | issuing legal tender banknotes. |
Recognizing the foregoing functions as a fully-fledged member of the Eurosystem, the Bank of Spain Law of Autonomy (Ley de Autonomía del Banco de España) stipulates the performance of the following functions by the Bank of Spain:
| | • | | holding and managing currency and precious metal reserves not transferred to the ECB; |
36
| | • | | supervising the solvency and behavior of credit institutions, other entities and financial markets, for which it has been assigned supervisory responsibility, in accordance with the provisions in force; |
| | • | | promoting the sound working and stability of the financial system and, without prejudice to the functions of the ECB, of national payment systems; |
| | • | | placing coins in circulation and the performance, on behalf of the State, of all such other functions entrusted to it in this connection; |
| | • | | preparing and publishing statistics relating to its functions, and assisting the ECB in the compilation of the necessary statistical information; |
| | • | | providing treasury services and acting as financial agent for government debt; |
| | • | | advising the government, preparing the appropriate reports and studies; and |
| | • | | exercising all other powers attributed to it by legislation. |
Subject to the rules and regulations issued by the Ministry of Economy, the Bank of Spain has the following supervisory powers over Spanish banks:
| | • | | conducting periodic inspections of Spanish banks to evaluate a bank’s compliance with current regulations including the preparation of financial statements, account structure and credit policies; |
| | • | | advising a bank’s board of directors and management on its dividend policy; |
| | • | | undertaking extraordinary inspections of banks; and |
| | • | | collaborating with other regulatory entities to impose penalties for infringement or violation of applicable regulations. |
It is expected that the European Central Bank (ECB) will assume its new banking supervision responsibilities in the autumn of 2014. Under the new supervision system, the ECB will directly supervise significant credit institutions (including the Bank). It will work closely with the national competent authorities to supervise all other credit institutions under the overall oversight of the ECB. The ECB may decide at any time to take responsibility for a less-significant credit institution.
Deposit Guarantee Fund of Credit Institutions
The Deposit Guarantee Fund of Credit Institutions (Fondo de Garantía de Depósitos or “FGD”), which operates under the guidance of the Bank of Spain, was set up by virtue of Royal Decree-Law 16/2011, of October 14. It is an independent legal entity and enjoys full authority to fulfill its functions. Royal Decree-Law 16/2011 unified the three previous guarantee funds that existed in Spain: the Deposit Guarantee Fund of Saving Banks, the Deposit Guarantee Fund of Credit Entities and the Deposit Guarantee Fund of Banking Establishments.
The main objective of the FGD is to guarantee deposits and securities held by credit institutions, up to the limit of €100,000. It also has the authority to carry out any such actions necessary to reinforce the solvency and operation of credit institutions in difficulty, with the purpose of defending the interests of depositors and deposit guarantee funds.
The FGD is funded by annual contributions from member banks. Pursuant to Royal Decree-Law 19/2011, the current rate of our annual contributions is equal to 0.2% of the year-end amount of bank deposits to which the guarantee extends and 0.2% over 5% of the securities held on our clients’ behalf as of December 31.
In addition, pursuant to Royal Decree-Law 771/2011, during 2011 an additional contribution was made in connection with deposits the remuneration of which exceeded the level established by the Bank of Spain in its Circular 3/2011, of June 30. This contribution was repealed in 2012 pursuant to Royal Decree-Law 24/2012, of August 31.
37
Finally, Royal Decree-Law 6/2013 established a special contribution of 0.3% of the deposits held as of December 31, 2012. The first tranche of such contribution, amounting to two fifths of it, had to be disbursed within the first 20 working days of 2014, subject to the deductions allowed by Royal Decree-Law 6/2013. The second tranche, for the remaining 60% of the special contribution, will have to be disbursed from 2014 onwards within a maximum of seven years, in accordance with the payment schedule set by the FGD’s Management Committee.
As of December 31, 2013, 2012 and 2011, all of the Spanish banks belonging to the BBVA Group were members of the FGD and thus obligated to make annual contributions to it.
Investment Guarantee Fund
Royal Decree 948/2001, of August 3, regulates investor guarantee schemes (Fondo de Garantía de Inversores) related to both investment firms and to credit institutions. These schemes are set up through an investment guarantee fund for securities broker and broker-dealer firms and the deposit guarantee funds already in place for credit institutions. A series of specific regulations have also been enacted, defining the system for contributing to the funds.
The General Investment Guarantee Fund Management Company was created in a relatively short period of time and is a business corporation with capital in which all the fund members hold an interest. Member firms must make a joint annual contribution to the fund equal to 0.06% over the 5% of the securities that they hold on their client’s behalf. However, it is foreseen that these contributions may be reduced if the fund reaches a level considered to be sufficient.
Liquidity Ratio
In an effort to implement European Union monetary policy, effective January 1, 1999, the ECB and the national central banks of the member states of the EMU adopted a regulation that requires banks to deposit an amount equal to two percent of their qualifying liabilities, as defined by the regulation, with the central bank of their home country. These deposits will earn an interest rate equal to the average interest rate of the European System of Central Banks (“ESCB”). Qualifying liabilities for this purpose include:
| | • | | debt securities issued; and |
| | • | | monetary market instruments. |
Furthermore, the liquidity ratio is set at 0% instead of 2% for those qualifying liabilities that have a maturity over two years and are sold under repurchase agreements.
Investment Ratio
In the past, the government used the investment ratio to allocate funds among specific sectors or investments. As part of the liberalization of the Spanish economy, it was gradually reduced to a rate of zero percent as of December 31, 1992. However, the law that established the ratio has not been abolished and the government could re-impose the ratio, subject to applicable EU requirements.
Fund for Orderly Bank Restructuring
The crisis that has affected the financial markets since 2007 obliged the Spanish authorities to create the Fund for Orderly Bank Restructuring (Fondo de Restructuración Ordenada Bancaria or “FROB”) by Decree-Law 9/2009, of June 26. Its purpose is to help the restructuring processes undertaken by credit institutions and strengthen their capital positions subject to certain conditions. The FROB will support the restructuring strategy of those institutions that require assistance, in three distinct stages:
| | • | | search for a private solution by the credit institution itself; |
38
| | • | | adopt measures to tackle any weaknesses that may affect the viability of credit institutions; and |
| | • | | initiate a restructuring process in which the Fund itself has to intervene directly. |
The FROB has to act in what is an absolutely exceptional situation that is closely linked to the development of the financial crisis. In order to comply with its objectives, FROB will be funded jointly from the Spanish national budget and theFGD. The FROB will be able to raise funds on securities markets through the issue of debt securities, lending and engaging in any other debt transaction necessary to fulfill its objects.
Law 9/2012, of November 14 (see “—Law 9/2012 of November 14, on Restructuring and Resolution of Credit Entities”) grants the FROB the power to implement early intervention measures (for mild difficulties), restructuring measures (for temporary troubles, able to be coped with by means of public financial support) and orderly resolution measures (for non-viable institutions). It also provides for the creation of an Asset Management Company intended to purchase certain problematic assets from state aided banks in order to ease their viability. The FROB is entitled to require entities receiving state aids to transfer those problematic assets.
Capital Requirements
Bank of Spain Circular 3/2008 (“Circular 3/2008”), of May 22, on the calculation and control of minimum capital requirements, regulates the minimum capital requirements for Spanish credit institutions, on an individual and consolidated group basis, and sets forth how to calculate capital meeting such requirements, as well as the various internal capital adequacy assessment processes credit institutions should have in place and the information they should disclose to the market.
Circular 3/2008 is the final implementation, for credit institutions, of the legislation on capital and consolidated supervision of financial institutions, which was contained in Law 36/2007, of November 16, amending Law 13/1985, of May 25, on the investment ratios, capital and reporting requirements of financial intermediaries, and other financial regulations, which also includes Royal Decree 216/2008, of February 15, on the capital of financial institutions. Circular 3/2008 also conforms Spanish legislation to Directive 2006/48/EC of the European Parliament and of the Council, of June 14, 2006, and Directive 2006/49/EC of the European Parliament and of the Council, of June 14, 2006. The minimum capital requirements for credit institutions and their consolidated groups were thoroughly revised in both EC directives based on the Capital Accord adopted by the Basel Committee on Banking Supervision (“Basel II”).
The minimum capital requirements established by Circular 3/2008 are calculated on the basis of the Group’s exposure (i) to credit risk and dilution risk (on the basis of the assets, obligations and contingent exposures and commitments that present these risks, depending on their amounts, characteristics, counterparties, guarantees, etc.); (ii) to counterparty risk and position and settlement risk in the trading book; (iii) to foreign exchange risk (on the basis of the overall net foreign currency position); and (iv) to operational risk. Additionally, the Group is subject to compliance with the risk concentration limits established in Circular 3/2008 and with the requirements related to corporate governance, internal capital adequacy assessment, measurement of interest rate risk and certain additional public disclosure obligations set forth therein. With a view to ensuring compliance with the aforementioned objectives, the Group performs integrated management of these risks, in accordance with its internal policies. See Note 7 to the Consolidated Financial Statements.
As of December 31, 2013, 2012 and 2011, the eligible capital of the Group exceeded the minimum required under the regulations then in force. See Note 33 to the Consolidated Financial Statements.
Under Basel II calculation of the minimum regulatory capital requirements under the standards, referred to as “Pillar 1”, is supplemented with an internal capital adequacy assessment and supervisory review process, referred to as “Pillar 2”. The Group’s internal capital adequacy assessment process is based on the internal model for the quantification of the economic capital required on the basis of the Group’s overall risk profile. Finally, Basel II standards establish, through what is referred to as “Pillar 3”, strict transparency requirements regarding the information on risks to be disclosed to the market.
39
Circular 3/2008 was modified by Circular 9/2010, of December 22, and Circular 4/2011, of November 30, in order to proceed with the implementation in Spain of the changes to the solvency framework approved at a European level and known as CRD II (Directive 2009/27/EC, of April 7, Directive 2009/89/EC of July 27 and Directive 2009/111/EC, of September 16) and CRD III (Directive 2010/76/EU, of November 24).
The main changes considered in these directives are:
| | • | | European harmonization of large exposures limits: a bank will be restricted in lending beyond a certain limit (25% of regulatory capital) to any one party. |
| | • | | Obligation to establish and maintain, for categories of staff whose professional activities have a material impact on the risk profile of a bank, remuneration policies and practices that are consistent with effective risk management. |
| | • | | Improved quality of banks’ capital: additional loss absorbency criteria for hybrid capital instruments have been introduced, anticipating Basel III recommendations. |
| | • | | Improved liquidity risk management: for banking groups that operate in multiple countries, their liquidity risk management—i.e., how they fund their operations on a day-to-day basis—will also be discussed and coordinated within ‘colleges of supervisors’. |
| | • | | Improved risk management for securitized products: rules on securitized debt—the repayment of which depends on the performance of a dedicated pool of loans—have been tightened. Firms that re-package loans into tradable securities will be required to retain some risk exposure to these securities, while firms that invest in the securities will be allowed to make their decisions only after conducting comprehensive due diligence. If they fail to do so, they will be subject to capital penalties. |
| | • | | Strengthened capital requirements have been introduced to cover risks in the trading book and related to re-securitizations. |
As part of a wider plan of the Spanish Government for the strengthening of the financial sector, the Royal Decree-Law 2/2011, of February 18 (“RD-L 2/2011”), established a new stricter minimum capital requirement for Spanish credit institutions of a minimum of 8%. This ratio was 10% for those institutions that are not listed on an stock exchange, which have a small presence of private investors, and are dependent upon wholesale funding markets for over 20% of their assets, since they have more limited access to the capital markets.
The entry into force of RD-L 2/2011 opened up a new stage in the process of restructuring and strengthening of the Spanish savings banks. The focus was on recapitalizing institutions that need more capital and encouraging savings banks to merge or to transfer their financial activity to a bank to ease their access to capital markets and wholesale funding.
Pursuant to the Memorandum of Understanding agreed by Spain and the Eurogroup in July 2012, from January 2013, Law 9/2012 replaced the minimum capital requirements of 8% and 10% referred to above with a single minimum requirement of 9%. The criteria for calculating the ratio was also modified to make it similar to the criteria that was used for purposes of carrying out the EU Capital Exercise (EBA/REC/2011/1).
As of December 31 2013, the “Capital Principal” ratio of the BBVA Group (as calculated in accordance with Law 9/2012 exceeded the minimum requirements in €7,000 millions approximately.
As shown below, we fulfilled the minimum capital requirements as required by Law 9/2012 as of December 31, 2013 and December 31, 2012:
| | | | | | | | |
| | | Basel II Capital Ratio | | | Law 9/2012 “Capital Principal”
ratio | |
Minimum required | | | 8 | % | | | 9 | % |
December 2013 | | | 14.9 | % | | | 11.2 | % |
December 2012 | | | 13.0 | % | | | 10.5 | % |
40
The minimum Capital Principal requirements established by RD-L 2/2011, were derogated by Royal Decree-Law 14/2013, of November 29 with effect as of January 1, 2014.
For additional information on how these ratios were calculated, please see “Item 5. Operating and Financial Review and Prospects—Liquidity and Capital Resources—Capital.”
On July 17, 2013, the CRD IV package, which transposes (through the adoption of a Regulation and a Directive) the new global standards on bank capital (the Basel III agreement) into EU law, entered into force.
The new framework divides the current CRD (Capital Requirements Directive) into two legislative instruments: a directive governing the access to deposit-taking activities and a regulation establishing the prudential requirements institutions need to comply with.
While Member States will have to transpose the directive into national law, the CRR is directly applicable, without a need to be implemented by national laws.
These new rules, which are in effect since January 1, 2014 tackle some of the vulnerabilities shown by the banking institutions during the crisis. They set stronger prudential requirements for banks, requiring them to keep sufficient capital reserves and liquidity. In addition, a leverage ratio back stop mechanism is being defined in order to limit the growth of the total balance sheet as compared to available own funds.
This new framework is intended to make EU banks more solid and to strengthen their capacity to adequately manage the risks linked to their activities, and absorb any losses they may incur in doing business.
Capital Management
Basel Capital Accord—Basel II—Economic Capital
The Group’s capital management is performed at both the regulatory and economic levels.
Regulatory capital management is based on the analysis of the capital base and the capital ratios (core capital, Tier 1, etc.) using Basel (“BIS”) and Bank of Spain criteria. See Note 33 to the Consolidated Financial Statements.
The aim is to achieve a capital structure that is as efficient as possible in terms of both cost and compliance with the requirements of regulators, ratings agencies and investors. Active capital management includes securitizations, sales of assets, and preferred and subordinated issues of equity and hybrid instruments. In recent years we have taken various actions in connection with our capital management and in order to comply with various capital requirements applicable to us. We may make securities issuances or undertake asset sales in the future, which could involve outright sales of businesses or reductions in interests held by us, which could be material and could be undertaken at less than their respective book values, resulting in material losses thereon, in connection with our capital management and in order to comply with capital requirements or otherwise.
The Bank has obtained the Bank of Spain’s approval with respect to its internal model of capital estimation (“IRB”) concerning certain portfolios and its operational risk internal model.
From an economic standpoint, capital management seeks to optimize value creation at the Group and at its different business units.
The Group allocates economic capital (“CER”) commensurate with the risks incurred by each business. This is based on the concept of unexpected loss at a certain level of statistical confidence, depending on the Group’s targets in terms of capital adequacy. These targets are applied at two levels: the first is core equity, which determines the allocated capital. The Group uses this amount as a basis for calculating the return generated on the equity (“ROE”) in each business. The second level is total capital, which determines the additional allocation in terms of
41
subordinated debt and preference shares. The CER calculation combines lending risk, market risk (including structural risk associated with the balance sheet and equity positions), operational risk and fixed asset and technical risks in the case of insurance companies.
Stockholders’ equity, as calculated under BIS rules, is an important metric for the Group. However, for the purpose of allocating capital to operating segments the Group prefers CER. It is risk-sensitive and thus better reflects management policies for the individual businesses and the business portfolio. These provide an equitable basis for assigning capital to businesses according to the risks incurred and make it easier to compare returns.
To internal effects of management and pursuit of the operating segments, the Group realizes a capital allocation to each operating segment.
Concentration of Risk
The Bank of Spain regulates the concentration of risk. Since January 1, 1999, any exposure to a person or group exceeding 10% of a group’s or bank’s regulatory capital has been deemed a concentration. The total amount of exposure represented by all of such concentrations may not exceed 800% of regulatory capital. Exposure to a single person or group may not exceed 25% (20% in the case of non-consolidated companies of the economic group) of a bank’s or group’s regulatory capital.
Legal and Other Restricted Reserves
We are subject to the legal and other restricted reserves requirements applicable to Spanish companies. Please see “—Capital Requirements”.
Impairment on Financial Assets
For a discussion of allowances for loan losses and country risk, see Note 2.2.1 to the Consolidated Financial Statements.
Regulation of the Disclosure of Fees and Interest Rates
Interest rates on most kinds of loans and deposits are not subject to a maximum limit. Banks must publish their preferential rates, rates applied on overdrafts, and fees and commissions charged in connection with banking transactions. Banking clients must be provided with written disclosure adequate to permit customers to ascertain transaction costs. The foregoing regulations are enforced by the Bank of Spain in response to bank client complaints.
Law 44/2002, of November 22, concerning measures to reform the Spanish financial system, contained a rule concerning the calculation of variable interest applicable to loans and credit secured by mortgages, bails, pledges or any other equivalent guarantee.
Employee Pension Plans
Under the relevant collective labor agreements, BBVA and some of its subsidiaries provide supplemental pension payments to certain active and retired employees and their beneficiaries. These payments supplement social security benefits from the Spanish state. See Note 2.2.12 and Note 26 to the Consolidated Financial Statements.
Dividends
A bank may dedicate all of its net profits and its distributable reserves to the payment of dividends. In no event may dividends be paid from non-distributable reserves.
Although banks are not legally required to seek prior approval from the Bank of Spain before declaring interim dividends, the Bank of Spain had asked that banks consult with it on a voluntary basis before declaring interim dividends. It should be noted that the Bank of Spain recommended in 2013 and 2014 to Spanish banks to limit cash dividend payouts up to 25% of their consolidated earnings.
42
Going forward, BBVA intends to substitute progressively the current shareholder pay-out policy with a policy to pay the full amount of the dividends in cash and in line with the performance of the Group earnings, with the final aim of having an annual pay-out of between 35% and 40% of the profits obtained in each financial year, depending on market circumstances and the applicable regulatory framework.
Effective since January 1, 2014, new banking regulation (Basel III, transposed into European Law under the CRD IV Directive) has affected the restrictions to dividend payments that may be applicable in the following years, in circumstances where solvency requirements are not fulfilled. Financial entities will be required to hold a combined buffer requirement above the minimum capital requirements in order to be able to distribute freely their distributable results. This mechanism will not be in force until 2016 and will not be fully applicable until 2019.
Our bylaws allow for dividends to be paid in cash or in kind as determined by shareholder resolution.
Scrip Dividend
As in 2011 and 2012, during 2013, a scrip dividend scheme called “Dividend Option” was successfully approved by the annual general meeting of shareholders held on March 15, 2013. The BBVA annual general meeting of shareholders held on March 14, 2014 passed four resolutions adopting four different free-of-charge capital increases for the implementation of a new “Dividend Option” scheme. These resolutions will allow the Board of Directors to implement, depending on the situation on the markets, the regulatory framework, the earnings obtained and possible recommendations on dividend payouts, the Dividend Option during a period of one year since the approval of such resolutions.
Upon the execution of each such free-of-charge capital increase, BBVA shareholders will have the option to receive their remuneration in newly issued free-of-charge shares or in cash. For additional information on the “Dividend Option” scheme, including its tax implications, see “Item 10. Additional Information—Taxation—Spanish Tax Considerations—Taxation of Dividends—Scrip Dividend” and “Item 10. Additional Information—Taxation—U.S. Tax Considerations—Taxation of Distributions”.
The “Dividend Option” is implemented as an alternative remuneration scheme for BBVA shareholders with the aim to provide BBVA shareholders with a flexible option to receive newly issued free-of-charge shares of the Bank, whilst maintaining the possibility to choose to receive the entire remuneration in cash, in line with the current trend that is being put into practice by other entities in the domestic and international markets.
Shareholders may have the “Dividend Option” available to them on different dates. However, it should be noted that each capital increase is independent of the other, so that one may be executed on a different date than the other and either one, or both of them, may even not be implemented.
BBVA’s Board of Directors, at its March 26, 2014 meeting, approved the execution of a capital increase on the terms approved by the annual general meeting of shareholders held on March 14, 2014 in connection with the implementation of the “Dividend Option”. The number of new shares issued as a consequence of the execution of the capital increase was 101,214,267.
Limitations on Types of Business
Spanish banks are subject to certain limitations on the types of businesses in which they may engage directly, but they are subject to few limitations on the types of businesses in which they may engage indirectly.
Mortgage Legislation
Law 2/1981, of March 25, on mortgage market, as amended by Law 41/2007, regulates the different aspects of the Spanish mortgage market and establishes additional rules for the mortgage and financial system.
Royal Decree 716/2009, of April 24, implements several aspects of Law 2/1981, of March 25. The most significant aspects implemented by Royal Decree 716/2009 are, among others, (i) the modification on the loan-to-value ratio requirement intending to improve the quality of Spanish mortgage-backed securities; (ii) the elimination
43
of many of the administrative requirements for the issuance of covered bonds and mortgage bonds; and (iii) the implementation of a special accounting record of the loans and credit facilities used to back issuances of covered bonds and mortgage-backed bonds.
Increasing social pressure for the reform of mortgage legislation in Spain has resulted in recent changes to such legislation (which are described below) and may result in further changes to such legislation in the future.
Royal Decree 6/2012, of March 9, on Urgent measures to protect mortgage debtors without financial resources introduced measures to enable the restructuring of mortgage debt and easing of collateral foreclosure aimed to protect especially vulnerable debtors.
Such measures include the following:
| | • | | the moderation of interest rates charged on mortgage arrears; |
| | • | | the improvement of extrajudicial procedures as an alternative to legal foreclosure; |
| | • | | the introduction of a voluntary code of conduct among lenders for regulated mortgage debt restructuring affecting especially vulnerable debtors; and |
| | • | | where restructuring is unviable, lenders may, where appropriate and on an optional basis, offer the debtor partial debt forgiveness. |
In addition, Royal Decree 27/2012, of November 15, on Urgent measures to enhance the protection of mortgage debtors provided for a two year moratorium, from the date of its adoption, on evictions applicable to debtor groups especially susceptible to social exclusion, which may resultantly remain at their homes for such period.
Mutual Fund Regulation
Mutual funds in Spain are regulated by the Ministry of the Economy (Dirección General del Tesoro y Política Financiera del Ministerio de Economía) and by the Spanish Securities Market Commission (Comisión Nacional del Mercado de Valores or “CNMV”). All mutual funds and mutual fund management companies are required to be registered with the CNMV. Spanish mutual funds may be subject to investment limits with respect to single sectors or companies and overall portfolio diversification minimums. In addition, periodic reports including a review of the fund’s performance and any material events affecting the fund are required to be distributed to the fund’s investors and filed with the CNMV.
Spanish Corporate Enterprises Act
The consolidated text of the Corporate Enterprises Act adopted under Legislative Royal Decree 1/2010, of July 2, repealed the former Companies Act, adopted under Legislative Royal Decree 1564/1989, of December 22. This royal legislative decree has consolidated the legislation for joint stock companies (“sociedades anónimas”) and limited liability companies (“sociedades de responsabilidad limitada”) in a single text, bringing together the contents of the two aforementioned acts, as well as a part of the Securities Exchange Act. The consolidated text also includes the articles of the Commercial Code that address limited partnerships, a derivative corporate device that is barely used in practice. Law 25/2011, of August 1, partially amended the Corporate Enterprises Act and incorporated Directive 2007/36/EC, of July 11, on the exercise of certain rights of shareholders in listed companies.
Spanish Auditing Law
Law 12/2010, of June 30, amended Law 19/1988, of July 12, on Accounts Audit, Law 24/1988, of July 28, on Securities Exchanges and the consolidated text of the former Companies Act adopted by Legislative Royal Decree 1564/1989, of December 22 (currently, the Corporate Enterprises Act), for its adaptation to EU regulations. This law transposed Directive EU/2006/43 which regulates aspects, among others, related to: authorization and registry of auditors and auditing companies, confidentiality and professional secrecy which the auditors may observe, rules on independency and liability as well as certain rules on the composition and functions of the auditing committee. The Royal Decree 1/2011, of July 1, approved the consolidated text of the Accounts Audit Law 12/2010 and repealed Law 19/1988, of July 12.
44
Law 9/2012 of November 14, on Restructuring and Resolution of Credit Entities
Law 9/2012, of November 14, 2012, on restructuring and resolution of credit entities, sets up a comprehensive framework to deal with financial institutions in stressed situations. Depending on the financial entity’s situation, three types of measures can be applied: early intervention (for mild difficulties), restructuring measures (for temporary troubles, able to be coped with by means of public financial support) and orderly resolution (for non-viable institutions). Law 9/2012 also grants the Fund for Orderly Bank Restructuring (FROB) the power to implement these measures and provides for the creation of an Asset Management Company which will allow the removal from the balance sheet of state aided banks of certain problematic assets in order to ease their viability. The FROB is entitled to commit the entities receiving state aids to transfer those problematic assets.
Law 9/2012 also establishes the burden sharing regime between the public sector and the private stakeholders, defining the mechanism by means of which the owners of hybrid capital instruments could be forced to bear part of the losses of a troubled institution. This burden sharing could be done through exchanges of hybrid capital instruments into capital instruments, direct or conditioned cash repurchases, or reduction and anticipated amortization of the nominal value of the relevant instruments.
U.S. Regulation
Banking Regulation
BBVA is a bank holding company within the meaning of the Bank Holding Company Act of 1956, as amended (the “BHC Act”). As such, BBVA is subject to the regulation and supervision of the Board of Governors of the Federal Reserve System (the “Federal Reserve”). BBVA’s direct and indirect activities and investments in the United States are limited to banking activities and certain non-banking activities that are “closely related to banking,” as determined by the Federal Reserve, and certain other activities permitted under the BHC Act. BBVA also is required to obtain the prior approval of the Federal Reserve before acquiring, directly or indirectly, the ownership or control of more than 5% of any class of voting securities of any U.S. bank or bank holding company.
A bank holding company is required to act as a source of financial strength for its U.S. bank subsidiaries. Among other things, this source of strength obligation may result in a requirement for BBVA, as controlling shareholder, to inject capital into its U.S. bank subsidiary.
BBVA’s U.S. bank subsidiary, Compass Bank (“Compass Bank”), and BBVA’s U.S. branch are also subject to supervision and regulation by a variety of other U.S. regulatory agencies. In addition to supervision by the Federal Reserve, BBVA’s New York branch is licensed and supervised by the New York State Department of Financial Services. Compass Bank is an Alabama state-chartered bank, is a member of the Federal Reserve System, and has branches in Alabama, Arizona, California, Colorado, Florida, New Mexico, and Texas. Compass Bank is supervised and inspected by the Federal Reserve and the State of Alabama Banking Department. In addition, certain aspects of Compass Bank’s branch operations in Arizona, California, Colorado, Florida, New Mexico, and Texas are subject to inspection by the respective state banking regulators in such states. Compass Bank is also a depository institution insured by, and subject to the regulation of, the Federal Deposit Insurance Corporation (the “FDIC”).
On May 14, 2013, BBVA Compass Bancshares, Inc., the Company’s former mid-tier U.S. bank holding company, was merged into BBVA USA Bancshares, Inc., the Company’s top-tier U.S. bank holding company. Subsequent to the merger, the surviving entity’s name was changed to BBVA Compass Bancshares, Inc. (“BBVA Compass”). Compass Bank is a direct subsidiary of BBVA Compass. BBVA Compass is a bank holding company within the meaning of the BHC Act and is subject to supervision and regulation by the Federal Reserve.
BBVA Bancomer, S.A.’s agency office in Houston, Texas is a non-FDIC insured agency office of BBVA Bancomer, S.A., an indirect subsidiary of BBVA that is licensed under the laws of the State of Texas and supervised by the Texas Department of Banking and the Federal Reserve.
45
Bancomer Transfer Services, Inc., a non-banking affiliate of BBVA and a direct subsidiary of BBVA Bancomer USA, Inc., is licensed as a money transmitter by the State of California Department of Financial Institutions, the Texas Department of Banking, and certain other state regulatory agencies. Bancomer Transfer Services, Inc. is also registered as a money services business with the Financial Crimes Enforcement Network of the U.S. Department of the Treasury.
A major focus of U.S. governmental policy relating to financial institutions in recent years has been aimed at fighting money laundering and terrorist financing. Regulations applicable to BBVA and certain of its affiliates impose obligations to maintain appropriate policies, procedures, and controls to detect, prevent, and report money laundering. In particular, Title III of the Uniting and Strengthening America by Providing Appropriate Tools Required to Intercept and Obstruct Terrorism Act of 2001 (USA PATRIOT Act), as amended, requires financial institutions operating in the United States to (i) give special attention to correspondent and payable-through bank accounts, (ii) implement enhanced reporting due diligence, and ‘know your customer’ standards for private banking and correspondent banking relationships, (iii) scrutinize the beneficial ownership and activity of certain non-U.S. and private banking customers (especially for so-called politically exposed persons), and (iv) develop new anti-money laundering programs, due diligence policies and controls to ensure the detection and reporting of money laundering. Such required compliance programs are intended to supplement compliance programs under the Bank Secrecy Act and the sanctions programs administered by the Office of Foreign Assets Control. Failure of a financial institution to maintain and implement adequate programs to combat money laundering and terrorist financing could have serious legal and reputational consequences for the institution.
Regulation of Other U.S. Entities
BBVA’s indirect U.S. broker-dealer subsidiary, BBVA Securities Inc. (“BSI”), is subject to regulation and supervision by the SEC and the Financial Industry Regulatory Authority (“FINRA”) with respect to its securities activities, as well as various U.S. state regulatory authorities. Additionally, the securities underwriting and dealing activities of BSI are subject to regulation and supervision by the Federal Reserve.
The activities of the Group’s U.S. investment adviser affiliates are regulated and supervised by the SEC.
In addition, the Group’s U.S. insurance agency affiliate is subject to regulation and supervision by various U.S. state insurance regulatory authorities.
Dodd-Frank Act
In July 2010, the United States enacted the Dodd-Frank Wall Street Reform and Consumer Protection Act (the “Dodd-Frank Act”), which provides a broad framework for significant regulatory changes that extends to almost every area of U.S. financial regulation. The Dodd-Frank Act addresses, among other issues, systemic risk oversight, bank capital standards, the resolution of failing systemically significant U.S. financial institutions, over-the-counter derivatives, restrictions on the ability of banking entities to engage in proprietary trading activities and invest in certain private equity funds, hedge funds and other covered funds (known as the “Volcker Rule”), consumer and investor protection, hedge fund registration, municipal advisor registration and regulation, securitization, investment advisor registration and regulation and the role of credit-rating agencies.
Compass Bank has registered with the SEC and the Municipal Securities Rulemaking Board as a municipal advisor pursuant to the Dodd-Frank Act’s municipal advisor registration requirements.
On March 31, 2013 BBVA registered as a “swap dealer” (as defined in the Commodity Exchange Act and the regulations promulgated thereunder (the “CEA”)) under Title VII of the Dodd-Frank Act. This registration subjects BBVA to regulation and supervision by the U.S. Commodity Futures Trading Commission (the “CFTC”). BBVA’s world-wide swap activities are also subject to regulations adopted by the European Commission pursuant to the European Market Infrastructure Regulation (“EMIR”) and the EU’s Markets in Financial Instruments Directive (“MiFID”) and other European regulations and directives. The CFTC will deem BBVA to have complied with certain Dodd-Frank Act Title VII provisions for which, subject to certain conditions, the CFTC has found certain corresponding European provisions to be essentially identical or comparable, provided BBVA complies with such European provisions, as applicable.
46
Currently BBVA is not considering registration as a “security-based swap dealer” with the SEC.
Compass Bank (and other entities of the Group) may register as a swap dealer if required by its swap activities or if it is determined to be beneficial to its business.
U.S. regulators are implementing many provisions of the Dodd-Frank Act through detailed rulemaking, and the implementation process will likely continue for several more years. As it is implemented, the Dodd-Frank Act and related rules are expected to result in additional costs and impose certain limitations and restrictions affecting the conduct of our businesses, although uncertainty remains about the final details, impact and timing of many provisions.
Among other changes, the Dodd-Frank Act requires that the Federal banking agencies, including the Federal Reserve, establish minimum leverage and risk-based capital requirements applicable to insured depository institutions, bank and thrift holding companies and systemically important non-bank financial companies. These minimum requirements must be not less than the generally applicable risk-based capital and leverage capital requirements, and not quantitatively lower than the requirements in effect for insured depository institutions as of the date of enactment of the Dodd-Frank Act. In response to these requirements, the Federal banking agencies have adopted a rule effectively establishing a permanent capital floor for covered institutions equal to the risk-based capital requirements under the banking agencies’ Basel I capital adequacy guidelines. In July 2013, the Federal banking agencies issued the U.S. Basel III final rule implementing the Basel III capital framework for U.S. banks and bank holding companies and also implementing certain provisions of the Dodd-Frank Act. Certain aspects of the final rule, such as the new minimum capital ratios and the revised methodology for calculating risk-weighted assets, will become effective on January 1, 2015 for BBVA Compass and Compass Bank. Other aspects of the final rule, such as the capital conservation buffer and the new regulatory deductions from and adjustments to capital, will be phased in over several years beginning on January 1, 2015. The Dodd-Frank Act also provides Federal banking agencies with tools to impose greater capital, leverage and liquidity requirements and other enhanced prudential standards, particularly for financial institutions that pose significant systemic risk and bank holding companies with greater than $50 billion in assets. To be considered “well capitalized,” BBVA on a consolidated basis, BBVA Compass and Compass Bank are required to maintain a Tier 1 risk-based capital ratio of at least 6% and a total risk-based capital ratio of at least 10%. BBVA Compass is also required to maintain a leverage ratio of at least 5% in order to be “well capitalized.” Under the U.S. Basel III final rule, Compass Bank will be required to maintain the following in order to meet the “well capitalized” test: a common equity tier 1 capital to risk-weighted assets ratio of at least 6.5%, a total risk-based capital ratio of at least 10% and a tier 1 risk-based capital ratio of at least 8%, and a leverage ratio of at least 5%.
The Federal Reserve approved a final rule in February 2014 to enhance its supervision and regulation of the U.S. operations of Large FBOs such as BBVA. Under the Federal Reserve’s rule, Large FBOs with $50 billion or more in U.S. assets held outside of their U.S. branches and agencies, such as BBVA, will be required to create a separately capitalized top-tier U.S. intermediate holding company that will hold all of the Large FBOs’ U.S. bank and nonbank subsidiaries, such as Compass Bank and BBVA Compass. An intermediate holding company will be subject to U.S. risk-based and leverage capital, liquidity, risk management, stress testing and other enhanced prudential standards on a consolidated basis. Under the final rule, a Large FBO that is subject to the IHC requirement may request permission from the Federal Reserve to establish multiple IHCs or use an alternative organizational structure. The final rule also permits the Federal Reserve to apply the IHC requirement in a manner that takes into account the separate operations of multiple foreign banks that are owned by a single Large FBO. Although U.S. branches and agencies of Large FBOs will not be required to be held beneath an IHC, such branches and agencies will be subject to liquidity, and, in certain circumstances, asset maintenance requirements. Large FBOs generally will be required to establish IHCs and comply with the enhanced prudential standards beginning July 1, 2016. An IHC’s compliance with applicable U.S. leverage ratio requirements is generally delayed until January 1, 2018. FBOs that have $50 billion or more in non-branch/agency U.S. assets as of June 30, 2014, such as BBVA, will be required to submit an implementation plan by January 1, 2015 on how the FBO will comply with the intermediate holding company requirement. As a bank holding company, BBVA Compass will be required to comply with the enhanced prudential standards applicable under the final rule to top-tier U.S.-based bank holding companies beginning on January 1, 2015 and until BBVA forms or designates an IHC and the IHC becomes subject to corresponding enhanced prudential standards. The Federal Reserve has stated that it will issue, at a later date, final
47
rules to implement certain other enhanced prudential standards under the Dodd-Frank Act for large bank holding companies and Large FBOs, including single counterparty credit limits and an early remediation framework. Under the early remediation framework, the Federal Reserve would implement prescribed regulations and penalties against the FBO and its U.S. operations and certain of its officers and directors, if the FBO and/or its U.S. operations do not meet certain requirements, and would authorize the termination of U.S. operations under certain circumstances. The February 2014 final rule could affect BBVA’s U.S. operations.
In addition, the Federal Reserve and other U.S. regulators issued for public comment in October 2013 a proposed rule that would introduce a quantitative liquidity coverage ratio requirement on certain large banks and bank holding companies. The proposed liquidity coverage ratio is broadly consistent with the Basel Committee’s revised Basel III liquidity rules, but is more stringent in several important respects. The Federal Reserve has also stated that it intends, through future rulemakings, to apply the Basel III liquidity coverage ratio and net stable funding ratio to the U.S. operations of some or all Large FBOs.
Under capital plan and stress test rules adopted by the Federal Reserve, BBVA Compass is required to conduct periodic stress tests and submit an annual capital plan to the Federal Reserve for review, which must, among other things, include a description of planned capital actions and demonstrate the company’s ability to maintain minimum capital above existing minimum capital ratios and above a Tier 1 common equity-to-total risk-weighted asset ratio of 5% under both expected and stressed conditions over a minimum nine-quarter planning horizon. BBVA Compass has submitted annual capital plans in January 2012 and January 2013. Beginning in 2014, BBVA Compass will participate in the Comprehensive Capital Analysis and Review (“CCAR”) program and will submit a CCAR plan in January 2015. Based on a qualitative and quantitative assessment, including a supervisory stress test conducted as part of the CCAR process, the Federal Reserve Board will either object to a large U.S. bank holding company’s capital plan, in whole or in part, or provide a notice of non-objection to the company by March 31 of a calendar year for plans submitted by the January submission date. If the Federal Reserve Board objects to a capital plan, the bank holding company may not make any capital distribution other than those with respect to which the Federal Reserve Board has indicated its non-objection.
In addition, the Dodd-Frank Act and implementing rules issued by the Federal Reserve Board impose stress test requirements on both BBVA Compass and Compass Bank. BBVA Compass began conducting semi-annual company-run stress tests in October 2013 and is subject to an annual supervisory stress test conducted by the Federal Reserve Board.
On December 10, 2013, U.S. regulators issued final rules to implement the Dodd-Frank Act’s Volcker Rule. The Volcker Rule limits the ability of banking entities to sponsor or invest in certain covered funds and to engage in certain types of proprietary trading unrelated to serving clients subject to certain exclusions and exemptions. The final rules also limit the ability of banking entities and their affiliates to enter into certain transactions with such funds with which they or their affiliates have certain relationships. The final rules contain exemptions for market-making, hedging, underwriting, trading in U.S. government and agency obligations as well as certain foreign government obligations, trading solely outside the United States, and also permit certain ownership interests in certain types of funds to be retained. The final rules extended the deadline for financial institutions, including BBVA and its subsidiaries, to conform to the Volcker Rule, and implement a compliance program, until July 2015 (with the possibility of two one-year extensions under certain circumstances). As it was finally approved in mid-December 2013, BBVA continues to assess the impact of the Volcker Rule to its business operations. Further implementation efforts may be necessary based on subsequent regulatory interpretations, guidelines or examinations.
The Dodd-Frank Act also changes the FDIC deposit insurance assessment framework (the amounts paid by FDIC-insured institutions into the deposit insurance fund of the FDIC), primarily by basing assessments on an FDIC-insured institution’s total assets less tangible equity rather than on U.S. domestic deposits, which is expected to shift a greater portion of the aggregate assessments to large banks (such as Compass Bank).
The so-called “push-out” provision, Section 716 of the Dodd-Frank Act, prohibits U.S. federal assistance to be provided to any swaps entity, including any swap dealer, with respect to certain types of swaps, subject to certain exceptions. The swap activities of BBVA’s New York branch already conformed to the requirements of this provision, as there were no swaps subject to push-out in the New York branch books. Should Compass Bank
48
become a swap dealer, it will need to restrict its swap activities to conform to the Dodd-Frank Act “push-out” provision. There are various qualitative and quantitative restrictions on the extent to which BBVA and its non-bank subsidiaries can borrow or otherwise obtain credit from their U.S. banking affiliates or engage in certain other transactions involving those subsidiaries. In general, these transactions must be on terms that would ordinarily be offered to unaffiliated entities, must be secured by designated amounts of specified collateral and are subject to quantitative limitations. These restrictions also apply to certain transactions of our New York branch with our U.S. broker-dealer affiliate BSI and to Compass Bank with its non-banking affiliates. Since July 2012, the Dodd-Frank Act has broadened these restrictions to subject credit exposure arising from derivative transactions, securities borrowing and lending transactions, as well as repurchase/reverse repurchase agreements to the above-mentioned collateral and quantitative limitations.
New consumer protection regulations that may be adopted by the Consumer Financial Protection Bureau, established under the Dodd-Frank Act, could affect the nature of the activities which a bank with over $10 billion in assets (including Compass Bank) may conduct, and may impose restrictions and limitations on the conduct of such activities.
The Durbin Amendment to the Dodd-Frank Act required the Federal Reserve to establish a cap on the rate merchants pay banks for electronic clearing of debit transactions (i.e., the interchange rate). The Federal Reserve issued final rules, effective October 1, 2011, for establishing standards, including a cap, for debit card interchange fees and prohibiting network exclusivity arrangements and routing restrictions. The final rule established standards for assessing whether debit card interchange fees received by debit card issuers were reasonable and proportional to the costs incurred by issuers for electronic debit transactions. The interchange fee allowed by the rule reduced the average interchange fee by approximately 50%.
In July 2013, a decision by a Washington D.C. District Court judge invalidated the Federal Reserve’s interchange rule, ruling that the new lower interchange fees had been inappropriately set too high by the Federal Reserve. The Federal Reserve has appealed the decision and a stay on the rule is in effect. It is not possible to predict the outcome of this litigation and how the Federal Reserve, if required to do so, would revise the interchange rule.
The Dodd-Frank Act requires the SEC to cause issuers with listed securities, which may include foreign private issuers such as BBVA, to establish a “clawback” policy to recoup previously awarded employee compensation in the event of an accounting restatement. The Dodd-Frank Act also grants the SEC discretionary rule-making authority to impose a new fiduciary standard on brokers, dealers and investment advisers, and expands the extraterritorial jurisdiction of U.S. courts over actions brought by the SEC or the United States with respect to violations of the antifraud provisions in the Securities Act, the Exchange Act and the Investment Advisers Act of 1940.
Disclosure of Iranian Activities under Section 13(r) of the Exchange Act
We are disclosing the following information pursuant to Section 13(r) of the Exchange Act, which requires an issuer to disclose whether it or any of its affiliates knowingly engaged in certain activities, transactions or dealings relating to Iran or with natural persons or entities designated by the U.S. government under specified Executive Orders, including activities not prohibited by U.S. law and conducted outside the United States by non-U.S. affiliates in compliance with local law. In order to comply with this new requirement, we have requested relevant information from our affiliates globally.
Legacy contractual obligations related to counter indemnities. Before 2007, BBVA Group issued certain counter indemnities to its non-Iranian customers in Europe for various business activities relating to Iran in support of guarantees provided by Bank Melli, three of which remained outstanding during 2013. Estimated gross revenue for 2013 from these counter indemnities, which includes fees and/or commissions, did not exceed $9,000 and was entirely derived from payments made by BBVA Group’s non-Iranian customers in Europe. BBVA Group does not allocate direct costs to fees and commissions and therefore has not disclosed a separate profits measure. In addition, in accordance with Council Regulation (EU) Nr. 267/2012 of March 23, payments of any amounts due to Bank Melli under these counter indemnities have been blocked. BBVA Group is committed to terminating these business relationships as soon as contractually possible and does not intend to enter into new business relationships involving Bank Melli.
49
Letters of credit. During 2013, BBVA Group had credit exposure to Bank Sepah arising from a letter of credit issued by such Iranian Bank Sepah to a non-Iranian client of BBVA Group in Europe. This letter of credit, which was granted before 2004, was used to secure a loan granted by BBVA Group to a client in order to finance certain Iran-related activities. This loan was supported by the Spanish export credit agency (CESCE). The loan related to the client’s’ exportation of goods to Iran (consisting of goods relating to a pelletizing plant for iron concentration and equipment). Estimated gross revenue for 2013 from this loan, which includes fees and/or commissions, did not exceed $12,000. Payments of any amounts due by Bank Sepah in 2013 under this letter of credit referred to above were initially blocked and thereafter released upon authorization by the relevant Spanish authorities. In addition, during 2013, BBVA Group received an indemnity payment from CESCE (which totaled approximately $7 million) in connection with a letter of credit which had been granted by Bank Mellat before 2004 and which matured in 2012. The loan underlying this letter of credit was granted by BBVA Group to a Spanish customer in connection with its provision of engineering services and supply of equipment for the construction of a petrochemical plant in Iran. This loan was supported by CESCE. BBVA Group does not allocate direct costs to fees and commissions and therefore has not disclosed a separate profits measure in connection with the two letters of credit referred to above.
BBVA Group is committed to terminating the outstanding business relationship with Bank Sepah as soon as contractually possible and does not intend to enter into new business relationships involving Bank Sepah or Bank Mellat.
Bank accounts. In 2013, BBVA Group maintained one account (which was closed in March 2013) for a company that produces farm vehicles and tractors and a number of accounts for certain of its employees (some of whom have the Iranian nationality). BBVA Group believes that 51% of the share capital of such company is controlled by an Iranian company in which the Iranian Government might have an interest. Estimated gross revenue for 2013 from these accounts, which includes fees and/or commissions, did not exceed $6,100. BBVA Group does not allocate direct costs to fees and commissions and therefore has not disclosed a separate profits measure. BBVA Group is committed to terminating its business relationships with the employees of this company as soon as contractually possible and does not intend to enter into new business relationships involving this company or its employees.
Iranian embassy-related activity. BBVA Group maintains bank accounts in Spain for three employees of the Iranian embassy in Spain. In addition, BBVA Group maintains bank accounts in Venezuela for seven employees of the Iranian embassy in Venezuela. Moreover, prior to 2013, BBVA Group provided one employee of the Iranian embassy in Venezuela with an insurance against theft at ATMs which expired on November 6, 2013. Estimated gross revenue for 2013 from embassy-related activity, which includes fees and/or commissions, did not exceed $1,100. BBVA Group does not allocate direct costs to fees and commissions and therefore have not disclosed a separate profits measure. BBVA Group is committed to terminating these business relationships as soon as legally possible.
| C. | Organizational Structure |
As of December 31, 2013, the BBVA Group was made up of 301 consolidated entities and 127 entities accounted for using the equity method.
The companies are principally domiciled in the following countries: Argentina, Belgium, Bolivia, Brazil, Cayman Islands, Chile, Colombia, Ecuador, France, Germany, Ireland, Italy, Luxembourg, Mexico, Netherlands, Netherlands Antilles, Peru, Portugal, Spain, Switzerland, United Kingdom, United States of America, Uruguay and Venezuela. In addition, BBVA has an active presence in Asia.
50
Below is a simplified organizational chart of BBVA’s most significant subsidiaries as of December 31, 2013.
| | | | | | | | | | | | | | | | |
| | | Country of
Incorporation | | Activity | | BBVA
Voting Power | | | BBVA
Ownership | | | Total Assets | |
| | | | | | | (in Percentages) | | | (In Millions
of Euros) | |
BBVA BANCOMER, S.A. DE C.V. | | Mexico | | Bank | | | 100.00 | | | | 99.97 | | | | 75,330 | |
COMPASS BANK | | United States | | Bank | | | 100.00 | | | | 100.00 | | | | 56,106 | |
BANCO PROVINCIAL S.A. - BANCO UNIVERSAL | | Venezuela | | Bank | | | 55.21 | | | | 55.21 | | | | 22,932 | |
BBVA SEGUROS, S.A. DE SEGUROS Y REASEGUROS | | Spain | | Insurance | | | 99.95 | | | | 99.95 | | | | 16,243 | |
BANCO CONTINENTAL, S.A. | | Peru | | Bank | | | 46.12 | | | | 46.12 | | | | 14,804 | |
BANCO BILBAO VIZCAYA ARGENTARIA CHILE, S.A. | | Chile | | Bank | | | 68.18 | | | | 68.18 | | | | 13,903 | |
BBVA COLOMBIA, S.A. | | Colombia | | Bank | | | 95.43 | | | | 95.43 | | | | 13,114 | |
BBVA BANCO FRANCES, S.A. | | Argentina | | Bank | | | 75.96 | | | | 75.96 | | | | 6,349 | |
BANCO BILBAO VIZCAYA ARGENTARIA (PORTUGAL), S.A. | | Portugal | | Bank | | | 100.00 | | | | 100.00 | | | | 5,471 | |
PENSIONES BANCOMER, S.A. DE C.V. | | Mexico | | Insurance | | | 100.00 | | | | 100.00 | | | | 3,576 | |
SEGUROS BANCOMER, S.A. DE C.V. | | Mexico | | Insurance | | | 100.00 | | | | 99.97 | | | | 3,050 | |
BANCO BILBAO VIZCAYA ARGENTARIA URUGUAY, S.A. | | Uruguay | | Bank | | | 100.00 | | | | 100.00 | | | | 2,133 | |
BBVA SUIZA, S.A. (BBVA SWITZERLAND) | | Switzerland | | Bank | | | 100.00 | | | | 100.00 | | | | 1,356 | |
UNO-E BANK, S.A. | | Spain | | Bank | | | 100.00 | | | | 100.00 | | | | 1,329 | |
BBVA PARAGUAY, S.A. | | Paraguay | | Bank | | | 100.00 | | | | 100.00 | | | | 1,322 | |
| D. | Property, Plants and Equipment |
We own and rent a substantial network of properties in Spain and abroad, including 3,230 branch offices in Spain and, principally through our various affiliates, 4,282 branch offices abroad as of December 31, 2013. As of December 31, 2013, approximately 76% of our branches in Spain and 55% of our branches abroad were rented from third parties pursuant to short-term leases that may be renewed by mutual agreement.
BBVA, through a real estate company of the Group, is constructing its new corporate headquarters at a development area in the north of Madrid (Spain). As of December 31, 2013, the accumulated investment for this project amounted to € 686 million.
| E. | Selected Statistical Information |
The following is a presentation of selected statistical information for the periods indicated. Where required under Industry Guide 3, we have provided such selected statistical information separately for our domestic and foreign activities, pursuant to our calculation that our foreign operations are significant according to Rule 9-05 of Regulation S-X.
Average Balances and Rates
The tables below set forth selected statistical information on our average balance sheets, which are based on the beginning and month-end balances in each year. We do not believe that monthly averages present trends materially different from those that would be presented by daily averages. Interest income figures, when used, include interest income on non-accruing loans to the extent that cash payments have been received. Loan fees are included in the computation of interest revenue.
| | | | | | | | | | | | | | | | | | | | | | | | | | | | | | | | | | | | |
| | | Average Balance Sheet - Assets and Interest from Earning Assets | |
| | | Year Ended December 31, 2013 | | | Year Ended December 31, 2012 | | | Year Ended December 31, 2011 | |
| | | Average
Balance | | | Interest | | | Average
Yield (1) | | | Average
Balance | | | Interest | | | Average
Yield (1) | | | Average
Balance | | | Interest | | | Average
Yield (1) | |
| | | (In Millions of Euros, Except Percentages) | |
Assets | | | | | | | | | | | | | | | | | | | | | | | | | | | | | | | | | | | | |
Cash and balances with central banks | | | 26,463 | | | | 262 | | | | 0.99 | % | | | 24,574 | | | | 259 | | | | 1.05 | % | | | 19,991 | | | | 250 | | | | 1.25 | % |
Debt securities, equity instruments and derivatives | | | 166,013 | | | | 4,385 | | | | 2.64 | % | | | 164,435 | | | | 4,414 | | | | 2.68 | % | | | 139,644 | | | | 3,969 | | | | 2.84 | % |
Loans and receivables | | | 361,246 | | | | 18,736 | | | | 5.19 | % | | | 372,458 | | | | 19,939 | | | | 5.35 | % | | | 360,107 | | | | 18,796 | | | | 5.22 | % |
Loans and advances to credit institutions | | | 25,998 | | | | 411 | | | | 1.58 | % | | | 25,122 | | | | 442 | | | | 1.76 | % | | | 25,209 | | | | 606 | | | | 2.40 | % |
Loans and advances to customers | | | 335,248 | | | | 18,325 | | | | 5.47 | % | | | 347,336 | | | | 19,497 | | | | 5.61 | % | | | 334,898 | | | | 18,190 | | | | 5.43 | % |
In Euros (2) | | | 204,124 | | | | 5,835 | | | | 2.86 | % | | | 217,533 | | | | 7,267 | | | | 3.34 | % | | | 219,864 | | | | 7,479 | | | | 3.40 | % |
In other currencies (3) | | | 131,125 | | | | 12,489 | | | | 9.52 | % | | | 129,802 | | | | 12,230 | | | | 9.42 | % | | | 115,034 | | | | 10,712 | | | | 9.31 | % |
Other financial income | | | — | | | | — | | | | | | | | — | �� | | | — | | | | | | | | — | | | | — | | | | | |
Non-earning assets | | | 45,982 | | | | 128 | | | | 0.28 | % | | | 46,613 | | | | 203 | | | | 0.44 | % | | | 37,074 | | | | 214 | | | | 0.58 | % |
| | | | | | | | | | | | | | | | | | | | | | | | | | | | | | | | | | | | |
Total average assets | | | 599,705 | | | | 23,512 | | | | 3.92 | % | | | 608,081 | | | | 24,815 | | | | 4.08 | % | | | 556,816 | | | | 23,229 | | | | 4.17 | % |
| | | | | | | | | | | | | | | | | | | | | | | | | | | | | | | | | | | | |
| (1) | Rates have been presented on a non-taxable equivalent basis. |
| (2) | Amounts reflected in euro correspond to predominantly domestic activities. |
| (3) | Amounts reflected in other currencies correspond to predominantly foreign activities. |
51
| | | | | | | | | | | | | | | | | | | | | | | | | | | | | | | | | | | | |
| | | Average Balance Sheet - Liabilities and Interest Paid on Interest Bearing Liabilities | |
| | | Year Ended December 31, 2013 | | | Year Ended December 31, 2012 | | | Year Ended December 31, 2011 | |
| | | Average
Balance | | | Interest | | | Average
Yield (1) | | | Average
Balance | | | Interest | | | Average
Yield (1) | | | Average
Balance | | | Interest | | | Average
Yield (1) | |
| | | (In Millions of Euros, Except Percentages) | |
Liabilities | | | | | | | | | | | | | | | | | | | | | | | | | | | | | | | | | | | | |
Deposits from central banks and credit institutions | | | 86,600 | | | | 1,551 | | | | 1.79 | % | | | 104,231 | | | | 2,089 | | | | 2.00 | % | | | 74,027 | | | | 1,881 | | | | 2.54 | % |
Customer deposits | | | 290,105 | | | | 4,366 | | | | 1.51 | % | | | 271,828 | | | | 4,531 | | | | 1.67 | % | | | 269,842 | | | | 5,176 | | | | 1.92 | % |
In Euros (2) | | | 153,634 | | | | 1,734 | | | | 1.13 | % | | | 146,996 | | | | 1,828 | | | | 1.24 | % | | | 153,773 | | | | 2,295 | | | | 1.49 | % |
In other currencies (3) | | | 136,470 | | | | 2,632 | | | | 1.93 | % | | | 124,832 | | | | 2,703 | | | | 2.16 | % | | | 116,069 | | | | 2,881 | | | | 2.48 | % |
Debt certificates and subordinated liabilities | | | 94,130 | | | | 2,812 | | | | 2.99 | % | | | 102,563 | | | | 2,783 | | | | 2.71 | % | | | 108,735 | | | | 2,590 | | | | 2.38 | % |
Other financial costs | | | — | | | | — | | | | — | | | | — | | | | — | | | | — | | | | — | | | | — | | | | — | |
Non-interest-bearing liabilities | | | 82,257 | | | | 883 | | | | 1.07 | % | | | 86,627 | | | | 938 | | | | 1.08 | % | | | 65,515 | | | | 858 | | | | 1.31 | % |
Stockholders’ equity | | | 46,614 | | | | — | | | | — | | | | 42,832 | | | | — | | | | — | | | | 38,696 | | | | — | | | | — | |
| | | | | | | | | | | | | | | | | | | | | | | | | | | | | | | | | | | | |
Total average liabilities | | | 599,705 | | | | 9,612 | | | | 1.60 | % | | | 608,081 | | | | 10,341 | | | | 1.70 | % | | | 556,816 | | | | 10,505 | | | | 1.89 | % |
| | | | | | | | | | | | | | | | | | | | | | | | | | | | | | | | | | | | |
| (1) | Rates have been presented on a non-taxable equivalent basis. |
| (2) | Amounts reflected in euro correspond to predominantly domestic activities. |
| (3) | Amounts reflected in other currencies correspond to predominantly foreign activities. |
Changes in Net Interest Income-Volume and Rate Analysis
The following table allocates changes in our net interest income between changes in volume and changes in rate for 2013 compared to 2012, and 2012 compared to 2011. Volume and rate variance have been calculated based on movements in average balances over the period and changes in interest rates on average interest-earning assets and average interest-bearing liabilities. The only out-of-period items and adjustments excluded from the following table are interest payments on loans which are made in a period other than the period during which they are due. Loan fees were included in the computation of interest income.
| | | | | | | | | | | | |
| | | 2013 / 2012 | |
| | | Increase (Decrease) Due to Changes in | |
| | | Volume (1) | | | Rate (1) (2) | | | Net Change | |
| | | (In Millions of Euros) | |
Interest income | | | | | | | | | | | | |
Cash and balances with central banks | | | 20 | | | | (16 | ) | | | 4 | |
Securities portfolio and derivatives | | | 42 | | | | (71 | ) | | | (29 | ) |
Loans and advances to credit institutions | | | 15 | | | | (46 | ) | | | (31 | ) |
Loans and advances to customers | | | (679 | ) | | | (494 | ) | | | (1,173 | ) |
In Euros | | | (448 | ) | | | (984 | ) | | | (1,432 | ) |
In other currencies | | | 125 | | | | 135 | | | | 259 | |
Other assets | | | (3 | ) | | | (72 | ) | | | (75 | ) |
| | | | | | | | | | | | |
Total income | | | (342 | ) | | | (961 | ) | | | (1,303 | ) |
| | | | | | | | | | | | |
Interest expense | | | | | | | | | | | | |
Deposits from central banks and credit institutions | | | (353 | ) | | | (185 | ) | | | (538 | ) |
Customer deposits | | | 305 | | | | (469 | ) | | | (164 | ) |
In Euros | | | 83 | | | | (176 | ) | | | (94 | ) |
In other currencies | | | 252 | | | | (323 | ) | | | (71 | ) |
Debt certificates and subordinated liabilities | | | (229 | ) | | | 257 | | | | 28 | |
Other liabilities | | | (47 | ) | | | (7 | ) | | | (55 | ) |
| | | | | | | | | | | | |
Total expense | | | (142 | ) | | | (586 | ) | | | (729 | ) |
| | | | | | | | | | | | |
Net interest income | | | (200 | ) | | | (375 | ) | | | (575 | ) |
| | | | | | | | | | | | |
| (1) | Variances caused by changes in both volume and rate have been allocated proportionally to volume and rate. |
| (2) | Rates have been presented on a non-taxable equivalent basis. |
52
| | | | | | | | | | | | |
| | | 2012 / 2011 | |
| | | Increase (Decrease) Due to Changes in | |
| | | Volume (1) | | | Rate (1) (2) | | | Net Change | |
| | | (In Millions of Euros) | |
Interest income | | | | | | | | | | | | |
Cash and balances with central banks | | | 57 | | | | (48 | ) | | | 9 | |
Securities portfolio and derivatives | | | 705 | | | | (260 | ) | | | 445 | |
Loans and advances to credit institutions | | | (2 | ) | | | (162 | ) | | | (164 | ) |
Loans and advances to customers | | | 676 | | | | 631 | | | | 1,307 | |
In euro | | | (79 | ) | | | (133 | ) | | | (212 | ) |
In other currencies | | | 1,375 | | | | 143 | | | | 1,519 | |
Other assets | | | 55 | | | | (66 | ) | | | (11 | ) |
| | | | | | | | | | | | |
Total income | | | 2,139 | | | | (552 | ) | | | 1,586 | |
| | | | | | | | | | | | |
Interest expense | | | | | | | | | | | | |
Deposits from central banks and credit institutions | | | 768 | | | | (560 | ) | | | 208 | |
Customer deposits | | | 38 | | | | (683 | ) | | | (645 | ) |
In euro | | | (101 | ) | | | (366 | ) | | | (467 | ) |
In other currencies | | | 217 | | | | (396 | ) | | | (178 | ) |
Debt certificates and subordinated liabilities | | | (147 | ) | | | 341 | | | | 194 | |
Other liabilities | | | 277 | | | | (197 | ) | | | 79 | |
| | | | | | | | | | | | |
Total expense | | | 967 | | | | (1,131 | ) | | | (164 | ) |
| | | | | | | | | | | | |
Net interest income | | | 1,172 | | | | 579 | | | | 1,750 | |
| | | | | | | | | | | | |
| (1) | Variances caused by changes in both volume and rate have been allocated proportionally to volume and rate. |
| (2) | Rates have been presented on a non-taxable equivalent basis. |
53
Interest Earning Assets—Margin and Spread
The following table analyzes the levels of our average earning assets and illustrates the comparative gross and net yields and spread obtained for each of the years indicated.
| | | | | | | | | | | | |
| | | December 31, | |
| | | 2013 | | | 2012 | | | 2011 | |
| | | (In Millions of Euro, except Percentages) | |
Average interest earning assets | | | 553,722 | | | | 561,468 | | | | 519,742 | |
Gross yield (1) | | | 4.2 | % | | | 4.4 | % | | | 4.5 | % |
Net yield (2) | | | 3.9 | % | | | 4.1 | % | | | 4.2 | % |
Net interest margin(3) | | | 2.5 | % | | | 2.6 | % | | | 2.4 | % |
Average effective rate paid on all interest-bearing liabilities | | | 2.0 | % | | | 2.2 | % | | | 2.3 | % |
Spread (4) | | | 2.2 | % | | | 2.3 | % | | | 2.1 | % |
| (1) | Gross yield represents total interest income divided by average interest earning assets. |
| (2) | Net yield represents total interest income divided by total average assets. |
| (3) | Net interest margin represents net interest income as percentage of average interest earning assets. |
| (4) | Spread is the difference between gross yield and the average cost of interest-bearing liabilities. |
ASSETS
Interest-Bearing Deposits in Other Banks
As of December 31, 2013, interbank deposits represented 3.66% of our assets. Of such interbank deposits, 24.75% were held outside of Spain and 75.25% in Spain. We believe that our deposits are generally placed with highly rated banks and have a lower risk than many loans we could make in Spain. Such deposits, however, are subject to the risk that the deposit banks may fail or the banking system of certain of the countries in which a portion of our deposits are made may face liquidity or other problems.
Securities Portfolio
As of December 31, 2013, our securities were carried on our consolidated balance sheet at a carrying amount of €112,248 million, representing 19.3% of our assets. €36,630 million, or 32.6%, of our securities consisted of Spanish Treasury bonds and Treasury bills. The average yield during 2013 on investment securities that BBVA held was 3.6%, compared to an average yield of approximately 5.2% earned on loans and receivables during 2013. The market or appraised value of our total securities portfolio as of December 31, 2013, was €112,248 million. See Notes 10, 12 and 14 to the Consolidated Financial Statements. For a discussion of our investments in affiliates, see Note 17 to the Consolidated Financial Statements. For a discussion of the manner in which we value our securities, see Notes 2.2.1 and 8 to the Consolidated Financial Statements.
54
The following tables analyze the carrying amount and fair value of debt securities as of December 31, 2013, December 31, 2012 and December 31, 2011, respectively. The trading portfolio is not included in the tables below because the amortized costs and fair values of these items are the same. See Note 10 to the Consolidated Financial Statements.
| | | | | | | | | | | | | | | | |
| | | As of December 31, 2013 | |
| | | Amortized
cost | | | Fair Value (1) | | | Unrealized
Gains | | | Unrealized
Losses | |
| | | (In Millions of Euros) | |
DEBT SECURITIES - | | | | | | | | | | | | | | | | |
| | | | |
AVAILABLE FOR SALE PORTFOLIO | | | | | | | | | | | | | | | | |
| | | | | | | | | | | | | | | | |
Domestic - | | | 39,224 | | | | 40,116 | | | | 1,008 | | | | (115 | ) |
| | | | | | | | | | | | | | | | |
Spanish Government and other government agencies debt securities | | | 30,688 | | | | 31,379 | | | | 781 | | | | (90 | ) |
Other debt securities | | | 8,536 | | | | 8,738 | | | | 227 | | | | (25 | ) |
Issued by Central Banks | | | — | | | | — | | | | — | | | | — | |
Issued by credit institutions | | | 5,907 | | | | 6,027 | | | | 124 | | | | (4 | ) |
Issued by other institutions | | | 2,629 | | | | 2,711 | | | | 103 | | | | (21 | ) |
| | | | | | | | | | | | | | | | |
International - | | | 31,323 | | | | 31,690 | | | | 956 | | | | (589 | ) |
| | | | | | | | | | | | | | | | |
Mexico | | | 10,433 | | | | 10,583 | | | | 328 | | | | (178 | ) |
Mexican Government and other government agencies debt securities | | | 9,028 | | | | 9,150 | | | | 281 | | | | (160 | ) |
Other debt securities | | | 1,404 | | | | 1,433 | | | | 47 | | | | (19 | ) |
Issued by Central Banks | | | — | | | | — | | | | — | | | | — | |
Issued by credit institutions | | | 84 | | | | 93 | | | | 11 | | | | (2 | ) |
Issued by other institutions | | | 1,320 | | | | 1,340 | | | | 36 | | | | (16 | ) |
The United States | | | 5,962 | | | | 5,937 | | | | 58 | | | | (82 | ) |
U.S. Treasury and other U.S. government agencies debt securities | | | 171 | | | | 170 | | | | 3 | | | | (4 | ) |
States and political subdivisions debt securities | | | 884 | | | | 885 | | | | 8 | | | | (7 | ) |
Other debt securities | | | 4,907 | | | | 4,881 | | | | 46 | | | | (72 | ) |
Issued by Central Banks | | | — | | | | — | | | | — | | | | — | |
Issued by credit institutions | | | 234 | | | | 233 | | | | 2 | | | | (2 | ) |
Issued by other institutions | | | 4,674 | | | | 4,648 | | | | 44 | | | | (70 | ) |
Other countries | | | 14,928 | | | | 15,170 | | | | 570 | | | | (329 | ) |
Other foreign governments and other government agencies debt securities | | | 7,128 | | | | 7,199 | | | | 333 | | | | (261 | ) |
Other debt securities | | | 7,801 | | | | 7,971 | | | | 237 | | | | (67 | ) |
Issued by Central Banks | | | 1,209 | | | | 1,208 | | | | 9 | | | | (10 | ) |
Issued by credit institutions | | | 4,042 | | | | 4,166 | | | | 175 | | | | (51 | ) |
Issued by other institutions | | | 2,550 | | | | 2,597 | | | | 54 | | | | (6 | ) |
| | | | | | | | | | | | | | | | |
TOTAL AVAILABLE FOR SALE PORTFOLIO | | | 70,547 | | | | 71,806 | | | | 1,964 | | | | (704 | ) |
| | | | | | | | | | | | | | | | |
| | | | |
HELD TO MATURITY PORTFOLIO | | | | | | | | | | | | | | | | |
| | | | | | | | | | | | | | | | |
Domestic - | | | — | | | | — | | | | — | | | | — | |
| | | | | | | | | | | | | | | | |
International - | | | — | | | | — | | | | — | | | | — | |
| | | | | | | | | | | | | | | | |
TOTAL HELD TO MATURITY PORTFOLIO | | | — | | | | — | | | | — | | | | — | |
| | | | | | | | | | | | | | | | |
| | | | |
TOTAL DEBT SECURITIES | | | 70,547 | | | | 71,806 | | | | 1,964 | | | | (704 | ) |
| | | | | | | | | | | | | | | | |
| (1) | Fair values for listed securities are determined on the basis of their quoted values at the end of the period. Appraised values are used for unlisted securities based on our estimates and valuation techniques. See Note 8 to the Consolidated Financial Statements. |
55
| | | | | | | | | | | | | | | | |
| | | As of December 31, 2012 | |
| | | Amortized cost | | | Fair Value (1) | | | Unrealized Gains | | | Unrealized Losses | |
| | | (In Millions of Euros) | |
DEBT SECURITIES - | | | | | | | | | | | | | | | | |
| | | | |
AVAILABLE FOR SALE PORTFOLIO | | | | | | | | | | | | | | | | |
| | | | | | | | | | | | | | | | |
Domestic - | | | 34,955 | | | | 34,366 | | | | 388 | | | | (977 | ) |
| | | | | | | | | | | | | | | | |
Spanish Government and other government agencies debt securities | | | 25,375 | | | | 24,761 | | | | 243 | | | | (857 | ) |
Other debt securities | | | 9,580 | | | | 9,605 | | | | 145 | | | | (120 | ) |
Issued by Central Banks | | | — | | | | — | | | | — | | | | — | |
Issued by credit institutions | | | 7,868 | | | | 7,880 | | | | 71 | | | | (59 | ) |
Issued by other institutions | | | 1,712 | | | | 1,725 | | | | 74 | | | | (61 | ) |
| | | | | | | | | | | | | | | | |
International - | | | 28,211 | | | | 29,182 | | | | 1,620 | | | | (649 | ) |
| | | | | | | | | | | | | | | | |
Mexico | | | 8,230 | | | | 9,191 | | | | 962 | | | | (1 | ) |
Mexican Government and other government agencies debt securities | | | 7,233 | | | | 8,066 | | | | 833 | | | | — | |
Other debt securities | | | 997 | | | | 1,125 | | | | 129 | | | | (1 | ) |
Issued by Central Banks | | | — | | | | — | | | | — | | | | — | |
Issued by credit institutions | | | 333 | | | | 388 | | | | 56 | | | | (1 | ) |
Issued by other institutions | | | 664 | | | | 737 | | | | 73 | | | | — | |
The United States | | | 6,927 | | | | 7,028 | | | | 189 | | | | (88 | ) |
U.S. Treasury and other U.S. government agencies debt securities | | | 228 | | | | 228 | | | | 1 | | | | (1 | ) |
States and political subdivisions debt securities | | | 485 | | | | 496 | | | | 20 | | | | (9 | ) |
Other debt securities | | | 6,214 | | | | 6,304 | | | | 168 | | | | (78 | ) |
Issued by Central Banks | | | — | | | | — | | | | — | | | | — | |
Issued by credit institutions | | | 150 | | | | 154 | | | | 11 | | | | (7 | ) |
Issued by other institutions | | | 6,064 | | | | 6,150 | | | | 157 | | | | (71 | ) |
Other countries | | | 13,054 | | | | 12,963 | | | | 469 | | | | (560 | ) |
Other foreign governments and other government agencies debt securities | | | 5,557 | | | | 5,395 | | | | 212 | | | | (374 | ) |
Other debt securities | | | 7,497 | | | | 7,568 | | | | 257 | | | | (186 | ) |
Issued by Central Banks | | | 1,158 | | | | 1,159 | | | | 2 | | | | (1 | ) |
Issued by credit institutions | | | 4,642 | | | | 4,750 | | | | 209 | | | | (101 | ) |
Issued by other institutions | | | 1,697 | | | | 1,659 | | | | 46 | | | | (84 | ) |
| | | | | | | | | | | | | | | | |
TOTAL AVAILABLE FOR SALE PORTFOLIO | | | 63,166 | | | | 63,548 | | | | 2,008 | | | | (1,626 | ) |
| | | | | | | | | | | | | | | | |
| | | | |
HELD TO MATURITY PORTFOLIO | | | | | | | | | | | | | | | | |
| | | | | | | | | | | | | | | | |
Domestic - | | | 7,278 | | | | 6,849 | | | | 4 | | | | (433 | ) |
| | | | | | | | | | | | | | | | |
Spanish Government and other government agencies debt securities | | | 6,469 | | | | 6,065 | | | | 2 | | | | (406 | ) |
Other domestic debt securities | | | 809 | | | | 784 | | | | 2 | | | | (27 | ) |
Issued by Central Banks | | | — | | | | — | | | | — | | | | — | |
Issued by credit institutions | | | 250 | | | | 249 | | | | 2 | | | | (3 | ) |
Issued by other institutions | | | 559 | | | | 535 | | | | — | | | | (24 | ) |
| | | | | | | | | | | | | | | | |
International - | | | 2,884 | | | | 3,011 | | | | 127 | | | | — | |
| | | | | | | | | | | | | | | | |
Foreign government and other government agency debt securities | | | 2,741 | | | | 2,862 | | | | 121 | | | | — | |
Other debt securities | | | 143 | | | | 149 | | | | 6 | | | | — | |
| | | | | | | | | | | | | | | | |
TOTAL HELD TO MATURITY PORTFOLIO | | | 10,162 | | | | 9,860 | | | | 131 | | | | (433 | ) |
| | | | | | | | | | | | | | | | |
| | | | |
TOTAL DEBT SECURITIES | | | 73,328 | | | | 73,408 | | | | 2,139 | | | | (2,059 | ) |
| | | | | | | | | | | | | | | | |
| (1) | Fair values for listed securities are determined on the basis of their quoted values at the end of the period. Appraised values are used for unlisted securities based on our estimates and valuation techniques. See Note 8 to the Consolidated Financial Statements. |
56
| | | | | | | | | | | | | | | | |
| | | As of December 31, 2011 | |
| | | Amortized cost | | | Fair Value (1) | | | Unrealized Gains | | | Unrealized Losses | |
| | | (In Millions of Euros) | |
DEBT SECURITIES - | | | | | | | | | | | | | | | | |
| | | | |
AVAILABLE FOR SALE PORTFOLIO | | | | | | | | | | | | | | | | |
| | | | | | | | | | | | | | | | |
Domestic - | | | 24,943 | | | | 23,447 | | | | 183 | | | | (1,679 | ) |
| | | | | | | | | | | | | | | | |
Spanish Government and other government agencies debt securities | | | 20,531 | | | | 19,209 | | | | 58 | | | | (1,380 | ) |
Other debt securities | | | 4,412 | | | | 4,238 | | | | 125 | | | | (299 | ) |
Issued by Central Banks | | | — | | | | — | | | | — | | | | — | |
Issued by credit institutions | | | 3,297 | | | | 3,130 | | | | 80 | | | | (247 | ) |
Issued by other institutions | | | 1,115 | | | | 1,108 | | | | 45 | | | | (52 | ) |
| | | | | | | | | | | | | | | | |
International - | | | 26,084 | | | | 25,969 | | | | 1,039 | | | | (1,154 | ) |
| | | | | | | | | | | | | | | | |
Mexico | | | 4,799 | | | | 4,974 | | | | 175 | | | | — | |
Mexican Government and other government agencies debt securities | | | 4,727 | | | | 4,890 | | | | 163 | | | | — | |
Other debt securities | | | 72 | | | | 84 | | | | 12 | | | | — | |
Issued by Central Banks | | | — | | | | — | | | | — | | | | — | |
Issued by credit institutions | | | 59 | | | | 70 | | | | 11 | | | | — | |
Issued by other institutions | | | 14 | | | | 15 | | | | 1 | | | | — | |
The United States | | | 7,332 | | | | 7,339 | | | | 242 | | | | (235 | ) |
U.S. Treasury and other U.S. government agencies debt securities | | | 486 | | | | 482 | | | | 8 | | | | (12 | ) |
States and political subdivisions debt securities | | | 507 | | | | 535 | | | | 28 | | | | — | |
Other debt securities | | | 6,339 | | | | 6,322 | | | | 206 | | | | (223 | ) |
Issued by Central Banks | | | — | | | | — | | | | — | | | | — | |
Issued by credit institutions | | | 629 | | | | 615 | | | | 22 | | | | (36 | ) |
Issued by other institutions | | | 5,710 | | | | 5,708 | | | | 184 | | | | (186 | ) |
Other countries | | | 13,953 | | | | 13,656 | | | | 622 | | | | (919 | ) |
Other foreign governments and other government agencies debt securities | | | 8,235 | | | | 7,977 | | | | 344 | | | | (602 | ) |
Other debt securities | | | 5,718 | | | | 5,679 | | | | 278 | | | | (317 | ) |
Issued by Central Banks | | | 843 | | | | 852 | | | | 10 | | | | (0 | ) |
Issued by credit institutions | | | 3,067 | | | | 2,986 | | | | 184 | | | | (265 | ) |
Issued by other institutions | | | 1,808 | | | | 1,841 | | | | 84 | | | | (51 | ) |
| | | | | | | | | | | | | | | | |
TOTAL AVAILABLE FOR SALE PORTFOLIO | | | 51,027 | | | | 49,416 | | | | 1,222 | | | | (2,833 | ) |
| | | | | | | | | | | | | | | | |
| | | | |
HELD TO MATURITY PORTFOLIO | | | | | | | | | | | | | | | | |
| | | | | | | | | | | | | | | | |
Domestic - | | | 7,373 | | | | 6,848 | | | | 1 | | | | (526 | ) |
| | | | | | | | | | | | | | | | |
Spanish Government and other government agencies debt securities | | | 6,520 | | | | 6,060 | | | | 1 | | | | (461 | ) |
Other domestic debt securities | | | 853 | | | | 788 | | | | — | | | | (65 | ) |
Issued by Central Banks | | | — | | | | — | | | | — | | | | - | |
Issued by credit institutions | | | 255 | | | | 244 | | | | — | | | | (11 | ) |
Issued by other institutions | | | 598 | | | | 544 | | | | — | | | | (54 | ) |
| | | | | | | | | | | | | | | | |
International - | | | 3,582 | | | | 3,342 | | | | 12 | | | | (252 | ) |
| | | | | | | | | | | | | | | | |
Foreign government and other government agency debt securities | | | 3,376 | | | | 3,149 | | | | 9 | | | | (236 | ) |
Other debt securities | | | 206 | | | | 193 | | | | 3 | | | | (16 | ) |
| | | | | | | | | | | | | | | | |
TOTAL HELD TO MATURITY PORTFOLIO | | | 10,955 | | | | 10,190 | | | | 13 | | | | (778 | ) |
| | | | | | | | | | | | | | | | |
| | | | |
TOTAL DEBT SECURITIES | | | 61,982 | | | | 59,606 | | | | 1,235 | | | | (3,611 | ) |
| | | | | | | | | | | | | | | | |
| (1) | Fair values for listed securities are determined on the basis of their quoted values at the end of the period. Appraised values are used for unlisted securities based on our estimates and valuation techniques. See Note 8 to the Consolidated Financial Statements. |
57
As of December 31, 2013 the carrying amount of the debt securities classified within the available for sale portfolio by rating categories defined by external rating agencies, were as follows:
| | | | | | | | |
| | | As of December 31, 2013 | |
| | | Debt Securities Available for Sale | |
| | | Carrying Amount
(In Millions of
Euros) | | | % | |
AAA | | | 847 | | | | 1.2 | % |
AA+ | | | 4,927 | | | | 6.9 | % |
AA | | | 198 | | | | 0.3 | % |
AA- | | | 748 | | | | 1.0 | % |
A+ | | | 554 | | | | 0.8 | % |
A | | | 8,463 | | | | 11.8 | % |
A- | | | 4,588 | | | | 6.4 | % |
BBB+ | | | 7,203 | | | | 10.0 | % |
BBB | | | 29,660 | | | | 41.3 | % |
BBB- | | | 9,152 | | | | 12.7 | % |
BB+ or below | | | 3,548 | | | | 4.9 | % |
Without rating | | | 1,918 | | | | 2.7 | % |
| | | | | | | | |
TOTAL | | | 71,806 | | | | 100.0 | % |
The following tables analyze the carrying amount and fair value of our ownership of equity securities as of December 31, 2013, 2012 and 2011, respectively. See Note 10 to the Consolidated Financial Statements.
| | | | | | | | | | | | | | | | |
| | | As of December 31, 2013 | |
| | | Amortized cost | | | Fair Value (1) | | | Unrealized Gains | | | Unrealized Losses | |
| | | (In Millions of Euros) | |
EQUITY SECURITIES - | | | | | | | | | | | | | | | | |
| | | | |
AVAILABLE FOR SALE PORTFOLIO | | | | | | | | | | | | | | | | |
Domestic - | | | 3,331 | | | | 3,337 | | | | 54 | | | | (47 | ) |
Equity listed | | | 3,270 | | | | 3,277 | | | | 54 | | | | (46 | ) |
Equity unlisted | | | 61 | | | | 60 | | | | — | | | | (1 | ) |
International - | | | 2,584 | | | | 2,629 | | | | 55 | | | | (10 | ) |
United States - | | | 471 | | | | 471 | | | | — | | | | — | |
Equity listed | | | 16 | | | | 16 | | | | — | | | | — | |
Equity unlisted | | | 455 | | | | 455 | | | | — | | | | — | |
Other countries - | | | 2,113 | | | | 2,158 | | | | 55 | | | | (10 | ) |
Equity listed | | | 2,014 | | | | 2,051 | | | | 46 | | | | (9 | ) |
Equity unlisted | | | 99 | | | | 107 | | | | 9 | | | | (1 | ) |
| | | | | | | | | | | | | | | | |
TOTAL AVAILABLE FOR SALE PORTFOLIO | | | 5,915 | | | | 5,966 | | | | 109 | | | | (57 | ) |
| | | | | | | | | | | | | | | | |
| | | | |
TOTAL EQUITY SECURITIES | | | 5,915 | | | | 5,966 | | | | 109 | | | | (57 | ) |
| | | | | | | | | | | | | | | | |
| | | | |
TOTAL INVESTMENT SECURITIES | | | 76,462 | | | | 77,772 | | | | 2,073 | | | | (761 | ) |
| | | | | | | | | | | | | | | | |
| (1) | Fair values for listed securities are determined on the basis of their quoted values at the end of the year. Appraised values are used for unlisted securities based on our estimates or on unaudited financial statements, when available. |
58
| | | | | | | | | | | | | | | | |
| | | As of December 31, 2012 | |
| | | Amortized
cost | | | Fair Value (1) | | | Unrealized
Gains | | | Unrealized
Losses | |
| | | (In Millions of Euros) | |
EQUITY SECURITIES - | | | | | | | | | | | | | | | | |
AVAILABLE FOR SALE PORTFOLIO | | | | | | | | | | | | | | | | |
Domestic - | | | 3,378 | | | | 3,118 | | | | 124 | | | | (384 | ) |
Equity listed | | | 3,301 | | | | 3,043 | | | | 122 | | | | (380 | ) |
Equity unlisted | | | 77 | | | | 75 | | | | 2 | | | | (4 | ) |
International - | | | 862 | | | | 834 | | | | 16 | | | | (44 | ) |
United States - | | | 506 | | | | 503 | | | | 1 | | | | (4 | ) |
Equity listed | | | 32 | | | | 29 | | | | 1 | | | | (4 | ) |
Equity unlisted | | | 474 | | | | 474 | | | | — | | | | — | |
Other countries - | | | 356 | | | | 331 | | | | 15 | | | | (40 | ) |
Equity listed | | | 262 | | | | 230 | | | | 8 | | | | (40 | ) |
Equity unlisted | | | 94 | | | | 101 | | | | 7 | | | | — | |
| | | | | | | | | | | | | | | | |
| | | | |
TOTAL AVAILABLE FOR SALE PORTFOLIO | | | 4,240 | | | | 3,952 | | | | 140 | | | | (428 | ) |
| | | | | | | | | | | | | | | | |
TOTAL EQUITY SECURITIES | | | 4,240 | | | | 3,952 | | | | 140 | | | | (428 | ) |
| | | | | | | | | | | | | | | | |
TOTAL INVESTMENT SECURITIES | | | 77,568 | | | | 77,360 | | | | 2,279 | | | | (2,487 | ) |
| | | | | | | | | | | | | | | | |
| (1) | Fair values for listed securities are determined on the basis of their quoted values at the end of the year. Appraised values are used for unlisted securities based on our estimates or on unaudited financial statements, when available. |
| | | | | | | | | | | | | | | | |
| | | As of December 31, 2011 | |
| | | Amortized
cost | | | Fair Value (1) | | | Unrealized
Gains | | | Unrealized
Losses | |
| | | (In Millions of Euros) | |
EQUITY SECURITIES - | | | | | | | | | | | | | | | | |
| | | | |
AVAILABLE FOR SALE PORTFOLIO | | | | | | | | | | | | | | | | |
Domestic - | | | 3,838 | | | | 4,304 | | | | 468 | | | | (2 | ) |
Equity listed | | | 3,803 | | | | 4,269 | | | | 468 | | | | (2 | ) |
Equity unlisted | | | 35 | | | | 35 | | | | — | | | | — | |
International - | | | 993 | | | | 920 | | | | 18 | | | | (91 | ) |
United States - | | | 600 | | | | 590 | | | | 2 | | | | (12 | ) |
Equity listed | | | 41 | | | | 29 | | | | — | | | | (12 | ) |
Equity unlisted | | | 559 | | | | 561 | | | | 2 | | | | — | |
Other countries - | | | 393 | | | | 330 | | | | 16 | | | | (79 | ) |
Equity listed | | | 318 | | | | 244 | | | | 5 | | | | (79 | ) |
Equity unlisted | | | 75 | | | | 86 | | | | 11 | | | | — | |
| | | | | | | | | | | | | | | | |
| | | | |
TOTAL AVAILABLE FOR SALE PORTFOLIO | | | 4,832 | | | | 5,225 | | | | 486 | | | | (93 | ) |
| | | | | | | | | | | | | | | | |
| | | | |
TOTAL EQUITY SECURITIES | | | 4,832 | | | | 5,225 | | | | 486 | | | | (93 | ) |
| | | | | | | | | | | | | | | | |
| | | | |
TOTAL INVESTMENT SECURITIES | | | 66,813 | | | | 64,830 | | | | 1,721 | | | | (3,704 | ) |
| | | | | | | | | | | | | | | | |
| (1) | Fair values for listed securities are determined on the basis of their quoted values at the end of the year. Appraised values are used for unlisted securities based on our estimates or on unaudited financial statements, when available. |
59
The following table analyzes the maturities of our debt investment and fixed income securities, excluding trading portfolio, by type and geographical area as of December 31, 2013.
| | | | | | | | | | | | | | | | | | | | | | | | | | | | | | | | | | | | |
| | | Maturity at One
Year or Less | | | Maturity After
One Year to Five
Years | | | Maturity After
Five Years to 10
Years | | | Maturity After 10
Years | | | Total | |
| | | Amount | | | Yield
% (1) | | | Amount | | | Yield
% (1) | | | Amount | | | Yield
% (1) | | | Amount | | | Yield
% (1) | | | Amount | |
| | | (Millions of Euros, Except Percentages) | |
DEBT SECURITIES | | | | | | | | | | | | | | | | | | | | | | | | | | | | | | | | | | | | |
AVAILABLE-FOR-SALE PORTFOLIO | | | | | | | | | | | | | | | | | | | | | | | | | | | | | | | | | | | | |
Domestic | | | | | | | | | | | | | | | | | | | | | | | | | | | | | | | | | | | | |
Spanish government and other government agencies debt securities | | | 983 | | | | 4.02 | | | | 16,484 | | | | 3.65 | | | | 6,326 | | | | 4.42 | | | | 7,585 | | | | 5.08 | | | | 31,379 | |
Other debt securities | | | 2,645 | | | | 3.74 | | | | 5,173 | | | | 3.87 | | | | 542 | | | | 3.33 | | | | 377 | | | | 5.58 | | | | 8,738 | |
| | | | | | | | | | | | | | | | | | | | | | | | | | | | | | | | | | | | |
Total Domestic | | | 3,629 | | | | 3.81 | | | | 21,657 | | | | 3.71 | | | | 6,868 | | | | 4.28 | | | | 7,962 | | | | 5.12 | | | | 40,116 | |
| | | | | | | | | | | | | | | | | | | | | | | | | | | | | | | | | | | | |
International | | | | | | | | | | | | | | | | | | | | | | | | | | | | | | | | | | | | |
Mexico | | | 2,401 | | | | 5.31 | | | | 4,243 | | | | 4.36 | | | | 588 | | | | 4.06 | | | | 3,351 | | | | 0.77 | | | | 10,583 | |
Mexican Government and other government agencies debt securities | | | 2,141 | | | | 5.31 | | | | 3,758 | | | | 4.23 | | | | 335 | | | | 5.03 | | | | 2,915 | | | | 0.04 | | | | 9,150 | |
Other debt securities | | | 260 | | | | 5.30 | | | | 485 | | | | 5.28 | | | | 253 | | | | 2.94 | | | | 436 | | | | 3.06 | | | | 1,433 | |
United States | | | 334 | | | | 2.15 | | | | 3,446 | | | | 2.15 | | | | 1,642 | | | | 2.58 | | | | 515 | | | | 4.41 | | | | 5,937 | |
U.S. Treasury and other government agencies debt securities | | | 77 | | | | 2.63 | | | | 83 | | | | 0.37 | | | | 10 | | | | 2.16 | | | | — | | | | — | | | | 170 | |
States and political subdivisions debt securities | | | 58 | | | | 2.01 | | | | 223 | | | | 2.93 | | | | 485 | | | | 2.42 | | | | 119 | | | | 1.69 | | | | 885 | |
Other debt securities | | | 199 | | | | 1.99 | | | | 3,140 | | | | 2.15 | | | | 1,147 | | | | 2.68 | | | | 395 | | | | 5.25 | | | | 4,881 | |
Other countries | | | 3,328 | | | | 2.91 | | | | 6,551 | | | | 4.78 | | | | 2,787 | | | | 9.21 | | | | 2,504 | | | | 5.88 | | | | 15,170 | |
Securities of foreign governments (2) | | | 727 | | | | 4.52 | | | | 3,612 | | | | 5.58 | | | | 1,638 | | | | 12.00 | | | | 1,223 | | | | 6.39 | | | | 7,199 | |
Other debt securities of other countries | | | 2,601 | | | | 2.62 | | | | 2,939 | | | | 3.78 | | | | 1,149 | | | | 4.84 | | | | 1,281 | | | | 5.32 | | | | 7,971 | |
| | | | | | | | | | | | | | | | | | | | | | | | | | | | | | | | | | | | |
Total International | | | 6,063 | | | | 3.94 | | | | 14,240 | | | | 3.98 | | | | 5,017 | | | | 6.42 | | | | 6,370 | | | | 2.88 | | | | 31,690 | |
| | | | | | | | | | | | | | | | | | | | | | | | | | | | | | | | | | | | |
TOTAL AVAILABLE-FOR-SALE | | | 9,692 | | | | 3.88 | | | | 35,897 | | | | 3.81 | | | | 11,885 | | | | 5.16 | | | | 14,332 | | | | 4.08 | | | | 71,806 | |
| | | | | | | | | | | | | | | | | | | | | | | | | | | | | | | | | | | | |
| | | | | | | | | |
HELD-TO-MATURITY PORTFOLIO | | | | | | | | | | | | | | | | | | | | | | | | | | | | | | | | | | | | |
Domestic | | | | | | | | | | | | | | | | | | | | | | | | | | | | | | | | | | | | |
Spanish government | | | — | | | | — | | | | — | | | | — | | | | — | | | | — | | | | — | | | | — | | | | — | |
60
| | | | | | | | | | | | | | | | | | | | | | | | | | | | | | | | | | | | |
| | | Maturity at One
Year or Less | | | Maturity After
One Year to Five
Years | | | Maturity After
Five Years to 10
Years | | | Maturity After 10
Years | | | Total | |
| | | Amount | | | Yield
%(1) | | | Amount | | | Yield
%(1) | | | Amount | | | Yield
%(1) | | | Amount | | | Yield
%(1) | | | Amount | |
Other debt securities | | | | | | | | | | | | | | | | | | | | | | | | | | | | | | | | | | | | |
| | | | | | | | | | | | | | | | | | | | | | | | | | | | | | | | | | | | |
Total Domestic | | | — | | | | — | | | | — | | | | — | �� | | | — | | | | — | | | | — | | | | — | | | | — | |
| | | | | | | | | | | | | | | | | | | | | | | | | | | | | | | | | | | | |
Total International | | | — | | | | — | | | | — | | | | — | | | | — | | | | — | | | | — | | | | — | | | | — | |
| | | | | | | | | | | | | | | | | | | | | | | | | | | | | | | | | | | | |
TOTAL HELD-TO-MATURITY | | | — | | | | — | | | | — | | | | — | | | | — | | | | — | | | | — | | | | — | | | | — | |
| | | | | | | | | | | | | | | | | | | | | | | | | | | | | | | | | | | | |
TOTAL DEBT SECURITIES | | | 9,692 | | | | 3.88 | | | | 35,897 | | | | 3.81 | | | | 11,885 | | | | 5.16 | | | | 14,332 | | | | 4.08 | | | | 71,806 | |
| | | | | | | | | | | | | | | | | | | | | | | | | | | | | | | | | | | | |
| (1) | Rates have been presented on a non-taxable equivalent basis. |
| (2) | Securities of other foreign Governments mainly include investments made by our subsidiaries in securities issued by the Governments of the countries where they operate. |
Loans and Advances to Credit Institutions
As of December 31, 2013, our total loans and advances to credit institutions amounted to €22,792 million, or 3.9% of total assets. Net of our valuation adjustments, loans and advances to credit institutions amounted to €22,862 million as of December 31, 2013, or 3.9% of our total assets.
Loans and Advances to Customers
As of December 31, 2013, our total loans and advances amounted to €336,758 million, or 57.8% of total assets. Net of our valuation adjustments, loans and advances amounted to €323,607 million as of December 31, 2013, or 55.6% of our total assets. As of December 31, 2013 our loans in Spain amounted to €187,400 million. Our foreign loans amounted to €149,358 million as of December 31, 2013. For a discussion of certain mandatory ratios relating to our loan portfolio, see “—Business Overview—Supervision and Regulation—Liquidity Ratio” and “—Business Overview— Supervision and Regulation—Investment Ratio”.
Loans by Geographic Area
The following table analyzes, by domicile of the customer, our net loans and advances as of December 31, 2013, 2012 and 2011:
| | | | | | | | | | | | |
| | | As of December 31, | |
| | | 2013 | | | 2012 | | | 2011 | |
| | | (In Millions of Euros) | |
Domestic | | | 187,400 | | | | 205,216 | | | | 203,459 | |
Foreign | | | | | | | | | | | | |
Western Europe | | | 17,519 | | | | 19,979 | | | | 22,392 | |
Latin America | | | 92,223 | | | | 90,588 | | | | 79,262 | |
United States | | | 36,047 | | | | 36,040 | | | | 39,384 | |
Other | | | 3,569 | | | | 3,151 | | | | 5,742 | |
Total foreign | | | 149,358 | | | | 149,757 | | | | 146,780 | |
| | | | | | | | | | | | |
Total loans and advances | | | 336,758 | | | | 354,973 | | | | 350,239 | |
Valuation adjustments | | | (13,151 | ) | | | (12,810 | ) | | | (7,696 | ) |
| | | | | | | | | | | | |
Total net lending | | | 323,607 | | | | 342,163 | | | | 342,543 | |
| | | | | | | | | | | | |
61
Loans by Type of Customer
The following table analyzes by domicile and type of customer our net loans and advances for each of the years indicated. The analyses by type of customer are based principally on the requirements of the regulatory authorities in each country.
| | | | | | | | | | | | |
| | | As of December 31, | |
| | | 2013 | | | 2012 | | | 2011 | |
| | | (In Millions of Euros) | |
Domestic | | | | | | | | | | | | |
Government | | | 22,166 | | | | 25,408 | | | | 25,372 | |
Agriculture | | | 1,275 | | | | 1,402 | | | | 1,566 | |
Industrial | | | 13,774 | | | | 16,240 | | | | 16,710 | |
Real estate and construction | | | 25,323 | | | | 30,319 | | | | 30,022 | |
Commercial and financial | | | 15,534 | | | | 17,021 | | | | 22,367 | |
Loans to individuals (1) | | | 90,364 | | | | 94,991 | | | | 87,420 | |
Other | | | 18,964 | | | | 19,836 | | | | 20,002 | |
| | | | | | | | | | | | |
Total domestic | | | 187,400 | | | | 205,216 | | | | 203,458 | |
| | | | | | | | | | | | |
Foreign | | | | | | | | | | | | |
Government | | | 10,234 | | | | 9,509 | | | | 9,569 | |
Agriculture | | | 3,707 | | | | 3,337 | | | | 3,131 | |
Industrial | | | 14,905 | | | | 14,491 | | | | 18,124 | |
Real estate and construction | | | 15,163 | | | | 16,904 | | | | 19,396 | |
Commercial and financial | | | 31,635 | | | | 34,891 | | | | 32,369 | |
Loans to individuals | | | 59,527 | | | | 56,252 | | | | 50,018 | |
Other | | | 14,187 | | | | 14,373 | | | | 14,173 | |
| | | | | | | | | | | | |
Total foreign | | | 149,358 | | | | 149,757 | | | | 146,780 | |
| | | | | | | | | | | | |
Total loans and advances | | | 336,758 | | | | 354,973 | | | | 350,239 | |
| | | | | | | | | | | | |
Valuation adjustments | | | (13,151 | ) | | | (12,810 | ) | | | (7,696 | ) |
| | | | | | | | | | | | |
Total net lending | | | 323,607 | | | | 342,163 | | | | 342,543 | |
| | | | | | | | | | | | |
| (1) | Includes mortgage loans to households for the acquisition of housing. |
The following table sets forth a breakdown, by currency, of our net loan portfolio for 2013, 2012 and 2011.
| | | | | | | | | | | | |
| | | As of December 31, | |
| | | 2013 | | | 2012 | | | 2011 | |
| | | (In Millions of Euros) | |
In euros | | | 190,090 | | | | 211,346 | | | | 215,500 | |
In other currencies | | | 133,517 | | | | 130,817 | | | | 127,043 | |
| | | | | | | | | | | | |
Total net lending | | | 323,607 | | | | 342,163 | | | | 342,543 | |
| | | | | | | | | | | | |
As of December 31, 2013, loans by BBVA and its subsidiaries to associates and jointly controlled companies amounted to €792 million, compared to €820 million as of December 31, 2012. Loans outstanding to the Spanish government and its agencies amounted to €22,166 million, or 6.6% of our total loans and advances as of December 31, 2013, compared to €25,407 million, or 7.2% of our total loans and advances as of December 31, 2012. None of our loans to companies controlled by the Spanish government are guaranteed by the government and, accordingly, we apply normal credit criteria in extending credit to such entities. Moreover, we carefully monitor such loans because governmental policies necessarily affect such borrowers.
62
Diversification in our loan portfolio is our principal means of reducing the risk of loan losses. We also carefully monitor our loans to borrowers in sectors or countries experiencing liquidity problems. Our exposure to our five largest borrowers as of December 31, 2013, excluding government-related loans, amounted to €18,122 million or approximately 5.4% of our total outstanding loans and advances. As of December 31, 2013 there did not exist any concentration of loans exceeding 10% of our total outstanding loans and advances, other than by category as disclosed in the chart above.
Maturity and Interest Sensitivity
The following table sets forth an analysis by maturity of our total loans and advances by domicile of the office that issued the loan and type of customer as of December 31, 2013. The determination of maturities is based on contract terms.
| | | | | | | | | | | | | | | | |
| | | Maturity | | | | |
| | | Due in One
Year or Less | | | Due After One
Year Through
Five Years | | | Due After Five
Years | | | Total | |
| | | (In Millions of Euros) | |
Domestic | | | | | | | | | | | | | | | | |
Government | | | 10,995 | | | | 6,988 | | | | 4,183 | | | | 22,166 | |
Agriculture | | | 605 | | | | 426 | | | | 244 | | | | 1,275 | |
Industrial | | | 10,911 | | | | 2,036 | | | | 827 | | | | 13,774 | |
Real estate and construction | | | 11,880 | | | | 7,808 | | | | 5,635 | | | | 25,323 | |
Commercial and financial | | | 10,237 | | | | 2,123 | | | | 3,174 | | | | 15,534 | |
Loans to individuals | | | 14,549 | | | | 16,819 | | | | 58,996 | | | | 90,364 | |
Other | | | 11,795 | | | | 4,178 | | | | 2,991 | | | | 18,964 | |
| | | | | | | | | | | | | | | | |
Total domestic | | | 70,972 | | | | 40,378 | | | | 76,050 | | | | 187,400 | |
| | | | | | | | | | | | | | | | |
Foreign | | | | | | | | | | | | | | | | |
Government | | | 1,506 | | | | 1,252 | | | | 7,476 | | | | 10,234 | |
Agriculture | | | 1,990 | | | | 1,186 | | | | 531 | | | | 3,707 | |
Industrial | | | 7,606 | | | | 4,238 | | | | 3,061 | | | | 14,905 | |
Real estate and construction | | | 4,746 | | | | 5,986 | | | | 4,431 | | | | 15,163 | |
Commercial and financial | | | 14,463 | | | | 14,143 | | | | 3,029 | | | | 31,635 | |
Loans to individuals | | | 9,044 | | | | 15,832 | | | | 34,651 | | | | 59,527 | |
Other | | | 6,864 | | | | 4,769 | | | | 2,554 | | | | 14,187 | |
| | | | | | | | | | | | | | | | |
Total foreign | | | 46,219 | | | | 47,406 | | | | 55,733 | | | | 149,358 | |
| | | | | | | | | | | | | | | | |
Total loans and advances | | | 117,191 | | | | 87,784 | | | | 131,783 | | | | 336,758 | |
| | | | | | | | | | | | | | | | |
The following table sets forth a breakdown of our fixed and variable rate loans which had a maturity of one year or more as of December 31, 2013.
| | | | | | | | | | | | |
| | | Interest Sensitivity of Outstanding Loans and
Advances Maturing in More Than One Year | |
| | | Domestic | | | Foreign | | | Total | |
| | | (In Millions of Euros) | |
Fixed rate | | | 13,952 | | | | 48,262 | | | | 62,214 | |
Variable rate | | | 102,476 | | | | 54,877 | | | | 157,353 | |
| | | | | | | | | | | | |
Total loans and advances | | | 116,428 | | | | 103,139 | | | | 219,567 | |
| | | | | | | | | | | | |
63
Impairment losses on financial assets
For a discussion of loan loss reserves, see “Item 5. Operating and Financial Review and Prospects—Critical Accounting Policies—Impairment losses on financial assets” and Note 2.2.1 to the Consolidated Financial Statements.
The following table provides information, by domicile of customer, regarding our loan loss reserve and movements of loan charge-offs and recoveries for periods indicated.
| | | | | | | | | | | | | | | | | | | | |
| | | As of and for the year ended December 31, | |
| | | 2013 | | | 2012 | | | 2011 | | | 2010 | | | 2009 | |
| | | (In Millions of Euros, except Percentages) | |
Loan loss reserve at beginning of period: | | | | | | | | | | | | | | | | | | | | |
Domestic | | | 9,649 | | | | 4,694 | | | | 4,935 | | | | 4,853 | | | | 3,765 | |
Foreign | | | 4,510 | | | | 4,445 | | | | 4,539 | | | | 3,952 | | | | 3,740 | |
| | | | | | | | | | | | | | | | | | | | |
Total loan loss reserve at beginning of period | | | 14,159 | | | | 9,139 | | | | 9,473 | | | | 8,805 | | | | 7,505 | |
| | | | | |
Loans charged off: | | | | | | | | | | | | | | | | | | | | |
Total domestic(1) | | | (1,965 | ) | | | (2,283 | ) | | | (1,977 | ) | | | (1,774 | ) | | | (966 | ) |
Total foreign(2) | | | (1,709 | ) | | | (1,824 | ) | | | (2,062 | ) | | | (2,628 | ) | | | (2,876 | ) |
| | | | | | | | | | | | | | | | | | | | |
Total Loans charged off: | | | (3,673 | ) | | | (4,107 | ) | | | (4,039 | ) | | | (4,402 | ) | | | (3,842 | ) |
| | | | | |
Provision for possible loan losses: | | | | | | | | | | | | | | | | | | | | |
Domestic | | | 3,417 | | | | 5,867 | | | | 2,229 | | | | 2,038 | | | | 3,079 | |
Foreign | | | 2,522 | | | | 2,286 | | | | 2,261 | | | | 2,778 | | | | 2,307 | |
| | | | | | | | | | | | | | | | | | | | |
Total Provision for possible loan losses | | | 5,939 | | | | 8,153 | | | | 4,490 | | | | 4,816 | | | | 5,386 | |
| | | | | |
Acquisition and disposition of subsidiaries | | | (30 | ) | | | 2,066 | | | | 32 | | | | — | | | | — | |
Effect of foreign currency translation | | | (557 | ) | | | 40 | | | | (98 | ) | | | 344 | | | | (29 | ) |
Other | | | (842 | ) | | | (1132 | ) | | | (720 | ) | | | (90 | ) | | | (216 | ) |
| | | | | | | | | | | | | | | | | | | | |
| | | | | |
Loan loss reserve at end of period: | | | | | | | | | | | | | | | | | | | | |
Domestic | | | 10,514 | | | | 9,649 | | | | 4,694 | | | | 4,935 | | | | 4,853 | |
Foreign | | | 4,481 | | | | 4,510 | | | | 4,445 | | | | 4,539 | | | | 3,952 | |
| | | | | | | | | | | | | | | | | | | | |
Total Loan loss reserve at end of period | | | 14,995 | | | | 14,159 | | | | 9,139 | | | | 9,473 | | | | 8,805 | |
| | | | | | | | | | | | | | | | | | | | |
Loan loss reserve as a percentage of total loans and receivables at end of period | | | 4.27 | % | | | 3.81 | % | | | 2.47 | % | | | 2.60 | % | | | 2.54 | % |
Net loan charge-offs as a percentage of total loans and receivables at end of period | | | 1.05 | % | | | 1.11 | % | | | 1.09 | % | | | 1.21 | % | | | 1.11 | % |
| (1) | Loans charged off in 2013 were mainly related to the real estate sector. Loans charged off in 2012 were also mainly related to the real estate sector. |
| (2) | Loans charged off in 2013 include €1,592 million related to real estate loans and loans to individuals and others, €114 million related to commercial and financial loans and €3 million related to loans to governmental and non-governmental agencies. Loans charged off in 2012 include €1,628 million related to real estate loans and loans to individuals and others, €195 million related to commercial and financial loans and €1 million related to loans to governmental and non-governmental agencies. |
64
When the recovery of any recognized amount is considered to be remote, this amount is removed from the consolidated balance sheet, without prejudice to any actions taken by the consolidated entities in order to collect the amount until their rights extinguish in full through expiry, forgiveness or for other reasons.
The loans charged off amounted to €3,673 million during the year ended December 31, 2013 compared to €4,107 million during the year ended December 31, 2012.
Our loan loss reserves as a percentage of total loans and advances increased to 4.3% as of December 31, 2013 from 3.8% as of December 31, 2012
Impaired Loans
As described in Note 2.2.1 to the Consolidated Financial Statements, loans are considered to be impaired loans when there are reasonable doubts that the loans will be recovered in full and/or the related interest will be collected for the amounts and on the dates initially agreed upon, taking into account the guarantees received by the consolidated entities to assure (in part or in full) the performance of transactions.
Amounts collected in relation to impaired loans and receivables are used to recognize the related accrued interest and any excess amount is used to reduce the principal not yet repaid. The approximate amount of interest income on our impaired loans which was included in profit attributable to parent company in 2013, 2012, 2011, 2010 and 2009 was € 253.3 million, €228.1 million, €203.4 million, €203.5 million and €192.3 million , respectively.
The following table provides information regarding our impaired loans, by domicile and type of customer, as of the dates indicated:
| | | | | | | | | | | | | | | | | | | | |
| | | As of December 31, | |
| | | 2013 | | | 2012 | | | 2011 | | | 2010 | | | 2009 | |
| | | (In Millions of Euros, Except %) | |
Impaired loans | | | | | | | | | | | | | | | | | | | | |
Domestic | | | 20,985 | | | | 15,165 | | | | 11,043 | | | | 10,954 | | | | 10,973 | |
Public sector | | | 158 | | | | 145 | | | | 130 | | | | 111 | | | | 61 | |
Other resident sector | | | 20,826 | | | | 15,019 | | | | 10,913 | | | | 10,843 | | | | 10,912 | |
Foreign | | | 4,493 | | | | 4,836 | | | | 4,409 | | | | 4,518 | | | | 4,338 | |
Public sector | | | 11 | | | | 20 | | | | 6 | | | | 12 | | | | 25 | |
Non-resident sector | | | 4,482 | | | | 4,816 | | | | 4,403 | | | | 4,506 | | | | 4,313 | |
Total impaired loans | | | 25,478 | | | | 20,001 | | | | 15,452 | | | | 15,472 | | | | 15,311 | |
Total loan loss reserve | | | (14,995 | ) | | | (14,159 | ) | | | (9,139 | ) | | | (9,473 | ) | | | (8,805 | ) |
Impaired loans net of reserves | | | 10,483 | | | | 5,842 | | | | 6,313 | | | | 5,999 | | | | 6,506 | |
Our total impaired loans amounted to €25,478 million as of December 31, 2013, a 27.4% increase compared to €20,001 million as of December 31, 2012. This increase is mainly attributable to the increase in impaired loans in the “Other resident sector” as a result of the deterioration in the real estate sector in Spain.
As mentioned in Note 2.2.1 to the Consolidated Financial Statements, our loan loss reserve includes loss reserve for impaired assets and loss reserve for unimpaired assets but which present an inherent loss. As of December 31, 2013, the loss reserve for impaired assets amounted to €12,599 million, a 34.1% increase compared to €9,394 million as of December 31, 2012. This increase in our loss reserve for impaired assets is mainly due to the deterioration of the real estate sector in Spain. As of December 31, 2013, the loss reserve for unimpaired assets amounted to €2,396 million, a 49.7% decrease compared to €4,764 million as of December 31, 2012. The decrease in our loan loss reserve for unimpaired assets is due to the transfer of certain assets to impaired assets.
65
The following table provides information, by domicile and type of customer, regarding our impaired loans and the loan loss reserves to customers taken for each impaired loan category, as of December 31, 2013.
| | | | | | | | | | | | |
| | | Impaired Loans | | | Loan Loss Reserve | | | Impaired Loans as a
percentage of Loans by
Type | |
| | | (In Millions of Euros) | | | | |
Domestic: | | | | | | | | | | | | |
Government | | | 158 | | | | (11 | ) | | | 0.71 | % |
Credit institutions | | | — | | | | — | | | | — | |
Other sectors | | | 20,826 | | | | (10,268 | ) | | | 12.60 | % |
Agriculture | | | 142 | | | | (70 | ) | | | 11.18 | % |
Industrial | | | 1,804 | | | | (886 | ) | | | 13.10 | % |
Real estate and construction | | | 10,387 | | | | (6,084 | ) | | | 41.02 | % |
Commercial and other financial | | | 1,103 | | | | (579 | ) | | | 7.10 | % |
Loans to individuals | | | 5,745 | | | | (1,660 | ) | | | 6.36 | % |
Other | | | 1,645 | | | | (988 | ) | | | 8.67 | % |
| | | | | | | | | | | | |
Total Domestic | | | 20,985 | | | | (10,279 | ) | | | 10.89 | % |
| | | | | | | | | | | | |
Foreign: | | | | | | | | | | | | |
Government | | | 11 | | | | (4 | ) | | | 0.11 | % |
Credit institutions | | | 33 | | | | (26 | ) | | | 0.19 | % |
Other sectors | | | 4,449 | | | | (2,290 | ) | | | 3.20 | % |
Agriculture | | | 170 | | | | (137 | ) | | | 4.59 | % |
Industrial | | | 288 | | | | (159 | ) | | | 1.93 | % |
Real estate and construction | | | 1,734 | | | | (715 | ) | | | 11.44 | % |
Commercial and other financial | | | 269 | | | | (166 | ) | | | 0.85 | % |
Loans to individuals | | | 1,202 | | | | (646 | ) | | | 2.02 | % |
Other | | | 785 | | | | (467 | ) | | | 5.54 | % |
| | | | | | | | | | | | |
Total Foreign | | | 4,493 | | | | (2,320 | ) | | | 2.69 | % |
| | | | | | | | | | | | |
General reserve | | | — | | | | (2,396 | ) | | | | |
| | | | | | | | | | | | |
Total impaired loans | | | 25,478 | | | | (14,995 | ) | | | 7.26 | % |
| | | | | | | | | | | | |
Troubled Debt Restructurings
As of December 31, 2013, “troubled debt restructurings”, as described in Note 7 to our Consolidated Financial Statements, totaling €9,658 million were not considered impaired loans. For additional information on our restructured or renegotiated loans, see Note 7 to our Consolidated Financial Statements.
Potential Problem Loans
The identification of “Potential problem loans” is based on the analysis of historical non-performing assets ratios trends, categorized by products/clients and geographical locations. This analysis is focused on the identification of portfolios with non-performing assets ratios higher than our average non-performing assets ratios. Once these portfolios are identified, we segregate such portfolios into groups with similar characteristics based on the activities to which they are related, geographical location, type of collateral, solvency of the client and loan to value ratio.
66
The non-performing assets ratios in our domestic real estate and construction portfolio was 41.02% as of December 31, 2013 (compared to 26.1% as of December 31, 2012), substantially higher than the average non-performing asset ratio for all of our domestic activities (10.89% as of December 31. 2013 and 7.2% as of December 31, 2012) and the average non-performing assets ratio for all of our consolidated activities (6.9% as of December 31, 2013 and 5.1% as of December 31, 2012) as of such date. Within such portfolio, construction loans and property development loans (which exclude mainly infrastructure and civil construction) had a non-performing asset ratio of 43.9% as of such date (compared to 28.1% as of December 31, 2012). Year-on-year increases in non-performing assets ratio were mainly due to the deterioration of economic conditions. Given such non-performing assets ratio, we performed an analysis in order to define the level of loan provisions attributable to these loan portfolios (see Note 2.2.1 to our Consolidated Financial Statements). The table below sets forth additional information on our domestic real estate and construction portfolio “Potential problem loans” as of December 31, 2013:
| | | | | | | | | | | | |
| | | Book Value | | | Allowance for
Loan Losses | | | % of Loans in
Each Category to
Total Loans to
Customers | |
| | | (In Millions of Euros, Except Percentages) | |
Domestic (1) | | | | | | | | | | | | |
Impaired loans | | | 8,838 | | | | 4,735 | | | | 2.5 | % |
Special monitoring loans | | | 1,445 | | | | 502 | | | | 0.4 | % |
Of which: | | | | | | | | | | | | |
Troubled debt restructurings | | | 924 | | | | 322 | | | | 0.3 | % |
| (1) | Potential problem loans outside of Spain as of December 31, 2013 were not significant. |
Foreign Country Outstandings
The following table sets forth, as of the end of the years indicated, the aggregate amounts of our cross-border outstandings (which consist of loans, interest-bearing deposits with other banks, acceptances and other monetary assets denominated in a currency other than the home-country currency of the office where the item is booked) where outstandings in the borrower’s country exceeded 1% of our total assets as of December 31, 2013, December 31, 2012 and December 31, 2011. Cross-border outstandings do not include loans in local currency made by our subsidiary banks to customers in other countries to the extent that such loans are funded in the local currency or hedged. As a result, they do not include the vast majority of the loans made by our subsidiaries in South America, Mexico and United States.
| | | | | | | | | | | | | | | | | | | | | | | | |
| | | 2013 | | | 2012 | | | 2011 | |
| | | Amount | | | % of Total
Assets | | | Amount | | | % of Total
Assets | | | Amount | | | % of Total
Assets | |
| | | (In Millions of Euros, Except Percentages) | |
United Kingdom | | | 5,727 | | | | 1.0 | % | | | 5,769 | | | | 0.93 | % | | | 5,570 | | | | 1.0 | % |
Mexico | | | 1,432 | | | | 0.2 | % | | | 1,539 | | | | 0.25 | % | | | 1,885 | | | | 0.3 | % |
Other OECD | | | 6,242 | | | | 1.1 | % | | | 6,217 | | | | 1.01 | % | | | 6,455 | | | | 1.1 | % |
| | | | | | | | | | | | | | | | | | | | | | | | |
Total OECD | | | 13,401 | | | | 2.3 | % | | | 13,525 | | | | 2.18 | % | | | 13,910 | | | | 2.4 | % |
Central and South America | | | 3,461 | | | | 0.6 | % | | | 2,167 | | | | 0.35 | % | | | 3,148 | | | | 0.5 | % |
Other | | | 4,903 | | | | 0.8 | % | | | 3,366 | | | | 0.54 | % | | | 4,316 | | | | 0.7 | % |
| | | | | | | | | | | | | | | | | | | | | | | | |
Total | | | 21,765 | | | | 3.7 | % | | | 19,058 | | | | 3.07 | % | | | 21,374 | | | | 3.7 | % |
| | | | | | | | | | | | | | | | | | | | | | | | |
67
The following table sets forth the amounts of our cross-border outstandings as of December 31 of the years indicated below by type of borrower where outstandings in the borrower’s country exceeded 1% of our total assets.
| | | | | | | | | | | | | | | | |
| | | Governments | | | Banks and Other
Financial Institutions | | | Commercial,
Industrial and Other | | | Total | |
| | | (In Millions of Euros) | |
As of December 31, 2013 | | | | | | | | | | | | | | | | |
Mexico | | | 22 | | | | 8 | | | | 1,401 | | | | 1,432 | |
United Kingdom | | | — | | | | 3,703 | | | | 2,024 | | | | 5,727 | |
| | | | | | | | | | | | | | | | |
Total | | | 22 | | | | 3,711 | | | | 3,426 | | | | 7,159 | |
| | | | | | | | | | | | | | | | |
| | | | |
As of December 31, 2012 | | | | | | | | | | | | | | | | |
Mexico | | | 3 | | | | 47 | | | | 1,490 | | | | 1,539 | |
United Kingdom | | | — | | | | 3,668 | | | | 2,100 | | | | 5,768 | |
| | | | | | | | | | | | | | | | |
Total | | | 3 | | | | 3,715 | | | | 3,590 | | | | 7,307 | |
| | | | | | | | | | | | | | | | |
| | | | |
As of December 31, 2011 | | | | | | | | | | | | | | | | |
Mexico | | | 31 | | | | 210 | | | | 1,644 | | | | 1,885 | |
United Kingdom | | | — | | | | 3,516 | | | | 2,054 | | | | 5,570 | |
| | | | | | | | | | | | | | | | |
Total | | | 31 | | | | 3,726 | | | | 3,698 | | | | 7,454 | |
| | | | | | | | | | | | | | | | |
The Bank of Spain requires that minimum reserves be maintained for cross-border risk arising with respect to loans and other outstandings to countries, or residents of countries, falling into certain categories established by the Bank of Spain on the basis of the level of perceived transfer risk. The category that a country falls into is determined by us, subject to review by the Bank of Spain.
The following table shows the minimum required reserves with respect to each category of country for BBVA’s level of coverage as of December 31, 2013.
| | | | |
Categories (1) | | Minimum
Percentage of
Coverage
(Outstandings
Within Category) | |
Countries belonging to the OECD whose currencies are listed in the Spanish foreign exchange market | | | 0.0 | |
Countries with transitory difficulties (2) | | | 10.1 | |
Doubtful countries (2) | | | 22.8 | |
Very doubtful countries (2)(3) | | | 83.5 | |
Bankrupt countries (4) | | | 100.0 | |
| (1) | Any outstanding which is guaranteed may be treated, for the purposes of the foregoing, as if it were an obligation of the guarantor. |
| (2) | Coverage for the aggregate of these three categories (countries with transitory difficulties, doubtful countries and very doubtful countries) must equal at least 35% of outstanding loans within the three categories. The Bank of Spain has recommended up to 50% aggregate coverage. |
| (3) | Outstandings to very doubtful countries are treated as impaired under Bank of Spain regulations. |
| (4) | Outstandings to bankrupt countries must be charged off immediately. As a result, no such outstandings are reflected on our consolidated balance sheet. Notwithstanding the foregoing minimum required reserves, certain interbank outstandings with an original maturity of three months or less have minimum required reserves of 50%. We met or exceeded the minimum percentage of required coverage with respect to each of the foregoing categories. |
Our exposure to borrowers in countries with difficulties (the last four categories in the foregoing table), excluding our exposure to subsidiaries or companies we manage and trade-related debt, amounted to €271 million, €269 million and €363 million as of December 31, 2013, 2012 and 2011, respectively. These figures do not reflect loan loss reserves of 14.3%, 14.3%, and 12.4% respectively, against the relevant amounts outstanding at such dates. Deposits with or loans to borrowers in all such countries as of December 31, 2013 did not in the aggregate exceed 0.1% of our total assets.
68
The country-risk exposures described in the preceding paragraph as of December 31, 2013, 2012 and 2011 do not include exposures for which insurance policies have been taken out with third parties that include coverage of the risk of confiscation, expropriation, nationalization, non-transfer, non-convertibility and, if appropriate, war and political violence. The sums insured as of December 31, 2013, 2012 and 2011 amounted to $125 million, $47 million and $58 million, respectively (approximately €91 million, €36 million and €45 million, respectively, based on a euro/dollar exchange rate on December 31, 2013 of $1.00 = €0.73, on December 31, 2012 of $1.00 = €0.76, and on December 31, 2011 of $1.00 = €0.77).
LIABILITIES
Deposits
The principal components of our customer deposits are domestic demand and savings deposits and foreign time deposits. The following tables provide information regarding our deposits by principal geographic area for the dates indicated, disregarding any valuation adjustments and accrued interest.
| | | | | | | | | | | | | | | | |
| | | As of December 31, 2013 | |
| | | Customer
Deposits | | | Bank of Spain
and Other
Central Banks | | | Other Credit
Institutions | | | Total | |
| | | (In Millions of Euros) | |
Total Domestic | | | 142,829 | | | | 25,103 | | | | 9,149 | | | | 177,082 | |
Foreign | | | | | | | | | | | | | | | | |
Western Europe | | | 19,244 | | | | 36 | | | | 26,826 | | | | 46,106 | |
Mexico | | | 40,913 | | | | 5,238 | | | | 5,831 | | | | 51,982 | |
South America | | | 56,218 | | | | 127 | | | | 3,750 | | | | 60,094 | |
United States | | | 39,128 | | | | — | | | | 5,716 | | | | 44,844 | |
Other | | | 1,272 | | | | 190 | | | | 982 | | | | 2,444 | |
Total Foreign | | | 156,775 | | | | 5,591 | | | | 43,105 | | | | 205,471 | |
| | | | | | | | | | | | | | | | |
Total | | | 299,604 | | | | 30,694 | | | | 52,254 | | | | 382,552 | |
| | | | | | | | | | | | | | | | |
| | | | | | | | | | | | | | | | |
| | | As of December 31, 2012 | |
| | | Customer
Deposits | | | Bank of Spain
and Other
Central Banks | | | Other Credit
Institutions | | | Total | |
| | | (In Millions of Euros) | |
Total Domestic | | | 137,011 | | | | 45,808 | | | | 11,642 | | | | 194,461 | |
Foreign | | | | | | | | | | | | | | | | |
Western Europe | | | 13,203 | | | | 350 | | | | 18,661 | | | | 32,214 | |
Mexico | | | 37,267 | | | | — | | | | 14,861 | | | | 52,128 | |
South America | | | 54,749 | | | | 32 | | | | 4,308 | | | | 59,089 | |
United States | | | 38,834 | | | | — | | | | 5,594 | | | | 44,428 | |
Other | | | 624 | | | | — | | | | 380 | | | | 1,002 | |
Total Foreign | | | 144,676 | | | | 383 | | | | 43,803 | | | | 188,862 | |
| | | | | | | | | | | | | | | | |
Total | | | 281,687 | | | | 46,190 | | | | 55,445 | | | | 383,323 | |
| | | | | | | | | | | | | | | | |
69
| | | | | | | | | | | | | | | | |
| | | As of December 31, 2011 | |
| | | Customer
Deposits | | | Bank of Spain
and Other
Central Banks | | | Other Credit
Institutions | | | Total | |
| | | (In Millions of Euros) | |
Total Domestic | | | 124,927 | | | | 24,570 | | | | 9,220 | | | | 158,717 | |
Foreign | | | | | | | | | | | | | | | | |
Western Europe | | | 27,588 | | | | 7,827 | | | | 24,981 | | | | 60,396 | |
Mexico | | | 36,292 | | | | — | | | | 11,320 | | | | 47,612 | |
South America | | | 43,396 | | | | 228 | | | | 3,593 | | | | 47,217 | |
United States | | | 37,199 | | | | 241 | | | | 6,253 | | | | 43,693 | |
Other | | | 1,852 | | | | — | | | | 960 | | | | 2,812 | |
Total Foreign | | | 146,327 | | | | 8,296 | | | | 47,107 | | | | 201,730 | |
| | | | | | | | | | | | | | | | |
Total | | | 271,254 | | | | 32,866 | | | | 56,327 | | | | 360,447 | |
| | | | | | | | | | | | | | | | |
For an analysis of our deposits, including non-interest bearing demand deposits, interest-bearing demand deposits, saving deposits and time deposits, see Note 23 to the Consolidated Financial Statements.
As of December 31, 2013, the maturity of our time deposits (excluding interbank deposits) in denominations of $100,000 (approximately €72,574 considering the noon buying rate as of December 31, 2013) or greater was as follows:
| | | | | | | | | | | | |
| | | As of December 31, 2013 | |
| | | Domestic | | | Foreign | | | Total | |
| | | (In Millions of Euros) | |
3 months or under | | | 11,291 | | | | 19,003 | | | | 30,294 | |
Over 3 to 6 months | | | 7,143 | | | | 2,544 | | | | 9,687 | |
Over 6 to 12 months | | | 13,349 | | | | 4,935 | | | | 18,284 | |
Over 12 months | | | 18,967 | | | | 7,176 | | | | 26,143 | |
| | | | | | | | | | | | |
Total | | | 50,749 | | | | 33,675 | | | | 84,424 | |
| | | | | | | | | | | | |
Time deposits from Spanish and foreign financial institutions amounted to €27,088 million as of December 31, 2013, substantially all of which were in excess of $100,000 (approximately €72,574 considering the noon buying rate as of December 31, 2013).
Large denomination deposits may be a less stable source of funds than demand and savings deposits because they are more sensitive to variations in interest rates. For a breakdown by currency of customer deposits as of December 31, 2013, 2012 and 2011, see Note 23 to the Consolidated Financial Statements.
70
Short-term Borrowings
Securities sold under agreements to repurchase and promissory notes issued by us constituted the only categories of short-term borrowings that equaled or exceeded 30% of stockholders’ equity as of December 31, 2013, 2012 and 2011.
| | | | | | | | | | | | | | | | | | | | | | | | |
| | | 2013 | | | 2012 | | | 2011 | |
| | | Amount | | | Average
Rate | | | Amount | | | Average
Rate | | | Amount | | | Average
Rate | |
| | | (In Millions of Euros, Except Percentages) | |
Securities sold under agreements to repurchase (principally Spanish Treasury bills) | | | | | | | | | | | | | | | | | | | | | | | | |
As of December 31 | | | 43,602 | | | | 1.0 | % | | | 47,644 | | | | 1.9 | % | | | 59,001 | | | | 2.0 | % |
Average during year | | | 42,978 | | | | 1.2 | % | | | 50,008 | | | | 1.8 | % | | | 49,670 | | | | 2.0 | % |
Maximum quarter-end balance | | | 51,698 | | | | — | | | | 55,947 | | | | — | | | | 59,001 | | | | — | |
Bank promissory notes | | | | | | | | | | | | | | | | | | | | | | | | |
As of December 31 | | | 1,252 | | | | 1.3 | % | | | 10,893 | | | | 3.7 | % | | | 2,362 | | | | 1.8 | % |
Average during year | | | 6,699 | | | | 3.0 | % | | | 10,802 | | | | 3.0 | % | | | 9,582 | | | | 1.2 | % |
Maximum quarter-end balance | | | 8,791 | | | | — | | | | 13,590 | | | | — | | | | 14,300 | | | | — | |
Bonds and Subordinated debt | | | | | | | | | | | | | | | | | | | | | | | | |
As of December 31 | | | 15,185 | | | | 5.8 | % | | | 19,333 | | | | 3.3 | % | | | 11,522 | | | | 3.8 | % |
Average during year | | | 16,693 | | | | 2.9 | % | | | 16,156 | | | | 3.9 | % | | | 11,945 | | | | 4.0 | % |
Maximum quarter-end balance | | | 19,037 | | | | — | | | | 19,332 | | | | — | | | | 15,530 | | | | — | |
| | | | | | | | | | | | | | | | | | | | | | | | |
Total short-term borrowings as of December 31 | | | 60,038 | | | | 3.7 | % | | | 77,870 | | | | 2.5 | % | | | 72,885 | | | | 2.3 | % |
| | | | | | | | | | | | | | | | | | | | | | | | |
Return on Equity
The following table sets out our return on equity ratios:
| | | | | | | | | | | | |
| | | As of or for the Year Ended December 31, | |
| | | 2013 | | | 2012 | | | 2011 | |
| | | (In Percentages) | |
Return on equity (1) | | | 5.0 | | | | 4.0 | | | | 8.0 | |
Return on assets (2) | | | 0.5 | | | | 0.4 | | | | 0.6 | |
Dividend pay-out ratio (3) | | | 32.9 | | | | 79.6 | | | | 37.4 | |
Equity to assets ratio (4) | | | 7.8 | | | | 7.0 | | | | 6.8 | |
| (1) | Represents profit attributable to parent company for the year as a percentage of average stockholder’s funds for the year. |
| (2) | Represents profit attributable to parent company as a percentage of average total assets for the year. |
| (3) | Represents dividends declared by BBVA (including the cash remuneration paid under the “Dividend Option” scheme) as a percentage of profit attributable to parent company. This ratio does not take into account the non-cash remuneration paid by BBVA under the “Dividend Option” scheme (in the form of BBVA shares or ADSs). See “—Business Overview—Supervision and Regulation—Dividends—Scrip Dividend” and “Item 8. Financial Information—Consolidated Statements and Other Financial Information—Dividends”. |
| (4) | Represents average total equity over average total assets. |
The commercial banking sector in Spain has undergone significant consolidation. In the majority of the markets where we provide financial services, the Banco Santander Group is our largest competitor, but the restructuring process that is underway has increased the size of certain banks, such as Bankia (an integration of seven regional saving banks, led by Caja Madrid), La Caixa (which in 2012 acquired Banco de Valencia) and Banco Sabadell.
We face strong competition in all of our principal areas of operations. The deregulation of interest rates on deposits in the past decade led to increased competition for large demand deposits in Spain and the widespread
71
promotion of interest-bearing demand deposit accounts and mutual funds. The Bank of Spain, through its Circular 3/2011, of June 30, required that a higher contribution be made to the FGD in connection with deposits the remuneration of which exceeded certain thresholds dependent on the evolution of the Euribor. However, this new requirement was removed in the summer of 2012. Former Spanish savings banks, many of which have become banks and received financial or other support from the Spanish government and the European Stability Mechanism, and money market mutual funds provide strong competition for savings deposits and, in the case of savings banks, for other retail banking services. While the European Commission has imposed certain size limits to institutions receiving public capital, such limits affect only entities that account for around 30% of the total assets of the Spanish financial system which, in addition, have a relatively long period (five years) to comply with such limits. Some of these entities remain particularly active in some sectors, for example, in lending to small and medium enterprises (SMEs).
Credit cooperatives, which are active principally in rural areas, where they provide savings and loan services and related services such as the financing of agricultural machinery and supplies, are also a source of competition. The entry of on-line banks into the Spanish banking system has also increased competition, including in customer funds businesses such as deposits. Insurance companies and other financial services firms also compete for customer funds. In addition, despite their recent decrease, the high interest rates offered by Spanish public debt has made it a strong competitor to deposits. Like the commercial banks, former savings banks, insurance companies and other financial services firms are expanding the services offered to consumers in Spain. We face competition in mortgage loans from saving banks and, to a lesser extent, cooperatives.
Furthermore, the EU Directive on Investment Services took effect on December 31, 1995. The EU Directive permits all brokerage houses authorized to operate in other member states of the EU to carry out investment services in Spain. Although the EU Directive is not specifically addressed to banks, it affects the activities of banks operating in Spain. Besides, several initiatives have been implemented recently in order to facilitate the creation of a Pan-European financial market. For example, SEPA (Single Euro Payments Area) which is a payment-integration initiative for simplification of bank transfers, direct debits and payment cards mainly within the EU and the MiFID project (Markets in Financial Instruments Directive), which aims to create a European framework for investment services. In addition, steps are being taken towards achieving a banking union in Europe (as agreed at a Eurogroup meeting in June, 2012). It has been decided that the ECB will be the single supervisor of around 130 entities (including us) in the Eurozone beginning in May-June 2014. In addition, there will be a single resolution mechanism. The EU Commission proposal is expected to be approved in the first quarter of 2014. Final rules on the European Stability Mechanism (ESM) direct recapitalization of banks are still pending. The creation of a common deposit-guarantee scheme is expected to be the final step, of the integration process and a harmonization of national mechanisms is expected.
Following the recent financial turmoil, a number of banks have disappeared or have been absorbed by other banks. The trend indicates that this will continue in the future, with a number of mergers and acquisitions between financial entities. In Spain, Royal Decree-Laws 2/2012, of February 3, and the RD-L 18/2012, of May 11, represent an additional step in the reform of the Spanish financial system which, with the purpose of achieving a stronger banking sector, is expected to intensify this process. In addition, the Memorandum of Understanding signed by the government in order to receive ESM funds reinforces this objective. In the U.S., the government has facilitated the purchase of troubled banks by other competitors, and European governments, including the Spanish government, have expressed their willingness to facilitate these types of operations.
In the United States, where we operate through BBVA Compass, the competitive landscape has also been significantly affected by the financial crisis. The U.S. banking industry has experienced significant impairment on its assets since 2009, which has resulted in continuing losses in select product categories and slow loan growth. U.S. commercial banks have in large part recovered from the crisis, although the mortgage delinquency rate remains significantly high at 8.4% in December 2014, according to the Federal Reserve. Commercial banks continue to make strides toward healthy balance sheets, with delinquency and charge-off rates falling throughout 2013.Consumer delinquencies of the system have actually fallen below pre-crisis levels. Commercial real estate asset quality remains high, being their delinquency rate 2.4% in December 2013 according to the Federal Reserve. Asset quality has come a long way since the crisis, and we expect the positive trends to continue on the back of rising economic confidence.
72
In Mexico, where we operate through BBVA Bancomer, the banking industry remained solvent throughout the financial crisis. The banking system has remained solid during 2013, as the Financial System Stability Council (Consejo de Estabilidad del Sistema Financiero, CESF) stated last September. However, total bank lending to the private sector and traditional bank deposits have slowed during 2013, due to slower growth in economic activity and employment in the formal sector.
In Mexico, changes in banking regulation could have a significant potential impact on competition. In particular, the government proposed a Financial Reform Initiative in May 2013 that was approved in January 2014. The reform includes:
| | • | | Changes in the mandate of development banks (public banks) to foster the growth of the financial system; |
| | • | | Measures to promote competition in the financial sector in order to make financial services cheaper; |
| | • | | Additional incentives to boost lending; and |
| | • | | An improvement of prudential regulation to strengthen the financial and banking systems. |
ITEM 4A. UNRESOLVED STAFF COMMENTS
None.
| ITEM 5. | OPERATING AND FINANCIAL REVIEW AND PROSPECTS |
Overview
In the fourth quarter of 2013, global economic growth reached 3.5% year-on-year (based on our own estimates), confirming the improvement in the previous quarter. In the second half of 2013, the recession in the Eurozone came to an end, GDP growth accelerated in the U.S., growth in Japan started to show the positive impact of an ultra-expansive monetary policy and some emerging economies recovered from a difficult period in the summer, although with an increasing differentiation between the various geographies. In short, the fourth quarter of 2013 showed an overall positive scenario that increases the probability of a global recovery in 2014-15, though with vulnerability to risk factors.
We believe that the Federal Reserve’s decision to start withdrawing the extraordinary liquidity made available since 2008 is a sign of the strength of the U.S. cycle. There has been an upturn in employment and private spending which has not required additional monetary measures. In addition, the agreement reached on the 2014-15 budget could stimulate investment and lead to growth of more than the 2.5% expected for 2014. Altogether, the beginning of the end of quantitative easing is a process full of uncertainty which will also have an impact on global financial conditions.
In the EMU, expected growth of approximately 1% and 2% in 2014 and 2015, respectively, require an on-going improvement in funding access for governments, corporates and banks, and also for households in peripheral economies in the region. 2014 will be crucial for ending the fragmentation caused by the absence of common and effective bank regulation and supervision and resolution mechanisms, beyond national boundaries and regulatory niches. Risks relating to Europe include periods of instability as we approach events that could alter the outlook, such as the European Parliamentary elections, or the publication of the results of the EBA stress test and the ECB asset quality review of the European banking sector.
Another element of risk in Europe is the possibility of getting too close to a situation in which deflation is a real risk given how difficult it is to get out of a spiral of deflation and lack of growth. Although deflation is unlikely, the scope for response in the region as a whole is restricted, given the current configuration of the EMU. The ECB could implement additional measures, from making available new cheap fixed-cost funding for the banking system to considering a quantitative easing.
The global economic outlook would be clearer were it not for the complications that the end of monetary stimuli in the U.S. is causing in emerging economies, highlighting the disparity in their economic growth and
73
financial vulnerability. This is the result of their differing degrees of global financial integration and their different individual economic policies. Those economies with greater external imbalances and that tend to rely on short-term finance are the ones that are at the greatest risk of capital inflows coming to a sudden stop and thus of an adjustment with the potential for cross-border contagion. Thus these countries could need more restrictive monetary policies to tackle these scenarios (or in some more extreme cases, fiscal consolidation). China is a special case, with a trade surplus and barriers that prevent financial contagion beyond its borders. Nonetheless, it could be a source of global instability if the measures to restrict the growth of credit result in a sharp economic deceleration that reduces demand in some of the most financially vulnerable economies.
Critical Accounting Policies
The Consolidated Financial Statements as of and for the years ended December 31, 2013, 2012 and 2011 were prepared by the Bank’s directors in accordance with EU-IFRS required to be applied under the Bank of Spain’s Circular 4/2004, and in compliance with IFRS-IASB, and by applying the basis of consolidation, accounting policies and measurement bases described in Note 2 to the Consolidated Financial Statements, so that they present fairly the Group’s equity and financial position as of and for the years ended December 31, 2013, 2012 and 2011, and its results of operations and consolidated cash flows in 2013, 2012 and 2011. The Consolidated Financial Statements were prepared on the basis of the accounting records kept by the Bank and by each of the other Group companies and include the adjustments and reclassifications required to unify the accounting policies and measurement bases used by the Group. See Note 2.2 to the Consolidated Financial Statements.
In preparing the Consolidated Financial Statements estimates were made by the Group and the consolidated companies in order to quantify certain of the assets, liabilities, income, expenses and commitments reported herein. These estimates relate mainly to the following:
| | • | | The impairment on certain financial assets. |
| | • | | The assumptions used to quantify other provisions and for the actuarial calculation of the post-employment benefit liabilities and commitments. |
| | • | | The useful life and impairment losses of tangible and intangible assets. |
| | • | | The measurement of goodwill. |
| | • | | The fair value of certain unlisted financial assets and liabilities. |
Although these estimates were made on the basis of the best information available as of December 31, 2013, 2012 and 2011, respectively, on the events analyzed, events that take place in the future might make it necessary to revise these estimates (upwards or downwards) in coming years.
Note 2 to the Consolidated Financial Statements contains a summary of our significant accounting policies. We consider certain of these policies to be particularly important due to their effect on the financial reporting of our financial condition and because they require management to make difficult, complex or subjective judgments, some of which may relate to matters that are inherently uncertain. Our reported financial condition and results of operations are sensitive to accounting methods, assumptions and estimates that underlie the preparation of the Consolidated Financial Statements. The nature of critical accounting policies, the judgments and other uncertainties affecting application of those policies and the sensitivity of reported results to changes in conditions and assumptions are factors to be considered when reviewing our Consolidated Financial Statements and the discussion below. We have identified the following accounting policies as critical to the understanding of our results of operations, since the application of these policies requires significant management assumptions and estimates that could result in materially different amounts to be reported if conditions or underlying circumstances were to change.
74
Fair value of financial instruments
The fair value of an asset or a liability on a given date is taken to be the price that would be received upon the sale of an asset, or paid, upon the transfer of a liability in an orderly transaction between market participants at the measurement date. The most objective and common reference for the fair value of an asset or a liability is the price that would be paid for it on an organized, transparent and deep market (“quoted price” or “market price”).
If there is no market price for a given asset or liability, its fair value is estimated on the basis of the price established in recent transactions involving similar instruments and, in the absence thereof, by using mathematical measurement models sufficiently tried and trusted by the international financial community. Such estimates would take into consideration the specific features of the asset or liability to be measured and, in particular, the various types of risk associated with the asset or liability. However, the limitations inherent to the measurement models developed and the possible inaccuracies of the assumptions required by these models may signify that the fair value of an asset or liability thus estimated does not coincide exactly with the price for which the asset or liability could be purchased or sold on the date of its measurement.
See Notes 2.2.1 and 8 to the Consolidated Financial Statements, which contains a summary of our significant accounting policies.
Derivatives and other future transactions
These instruments include outstanding foreign currency purchase and sale transactions, outstanding securities purchase and sale transactions, futures transactions relating to securities, exchange rates or interest rates, forward interest rate agreements, options relating to exchange rates, securities or interest rates and various types of financial swaps.
All derivatives are recognized on the balance sheet at fair value from the date of arrangement. If the fair value of a derivative is positive, it is recorded as an asset and if it is negative, it is recorded as a liability. Unless there is evidence to the contrary, it is understood that on the date of arrangement the fair value of the derivatives is equal to the transaction price. Changes in the fair value of derivatives after the date of arrangement are recognized with a balancing entry under the heading “Gains or Losses on Financial Assets and Liabilities” in the consolidated income statement.
Specifically, the fair value of the standard financial derivatives included in the held for trading portfolios is equal to their daily quoted price. If, under exceptional circumstances, their quoted price cannot be established on a given date, these derivatives are measured using methods similar to those used to measure over-the-counter (“OTC”) derivatives.
The fair value of OTC derivatives is equal to the sum of the future cash flows arising from the instruments discounted at the measurement date (“present value” or “theoretical value”). These derivatives are measured using methods recognized by the financial markets, including the net present value (“NPV”) method and option price calculation models.
Financial derivatives that have as their underlying equity instruments, whose fair value cannot be determined in a sufficiently objective manner and are settled by delivery of those instruments, are measured at cost.
Financial derivatives designated as hedging items are included in the heading of the balance sheet “Hedging derivatives”. These financial derivatives are valued at fair value.
See Note 2.2.1 to the Consolidated Financial Statements, which contains a summary of our significant accounting policies with respect to these instruments.
75
Goodwill in consolidation
Pursuant to IFRS 3, if the difference on the date of a business combination between the sum of the consideration transferred, the amount of all the non-controlling interests and the fair value of equity interest previously held in the acquired entity, on one hand, and the fair value of the assets acquired and liabilities assumed, on the other hand, is positive, it is recorded as goodwill on the asset side of the balance sheet. Goodwill represents the future economic benefits from assets that cannot be individually identified and separately recognized. Goodwill is not amortized and is subject periodically to an impairment analysis. Any impaired goodwill is written off.
If the difference is negative, it is recognized directly in the income statement under the heading “Negative goodwill in business combinations”.
Goodwill is allocated to one or more cash-generating units, or CGUs, expected to benefit from the synergies arising from business combinations. The CGUs units represent the Group’s smallest identifiable business and/or geographical segments as managed internally by its directors within the Group.
The CGUs to which goodwill has been allocated are tested for impairment based on the carrying amount of the unit including the allocated goodwill. Such testing is performed at least annually and whenever there is an indication of impairment.
For the purpose of determining the impairment of a CGU to which a part or all of goodwill has been allocated, the carrying amount of that unit, adjusted by the theoretical amount of the goodwill attributable to the non-controlling interest, shall be compared to its recoverable amount. The resulting loss shall be apportioned by reducing, firstly, the carrying amount of the goodwill allocated to that unit and, secondly, if there are still impairment losses remaining to be recognized, the carrying amount of the rest of the assets. This shall be done by allocating the remaining loss in proportion to the carrying amount of each of the assets in the unit. In any case, impairment losses on goodwill can never be reversed.
See Notes 2.2.7 and 2.2.8 to the Consolidated Financial Statements, which contains a summary of our significant accounting policies related to goodwill.
The results from each of these tests on the dates mentioned were as follows:
As of December 31, 2013, no indicators of impairment had been identified in any of the main CGUs. The Group’s most significant goodwill corresponded to the CGU in the United States. The calculation of the impairment loss used the cash flow projections estimated by the Group’s management, based on the latest budgets available for the next five years. As of December 31, 2013, the Group used a sustainable growth rate of 4.0% (the same rate was considered as of December 31, 2012 and 2011) to extrapolate the cash flows in perpetuity starting on the fifth year (2018), based on the real GDP growth rate of the United States and the income recurrence. The rate used to discount the cash flows is the cost of capital assigned to the CGU, 10.8% as of December 31, 2013 (11.2% and 11.4% as of December 31, 2012 and 2011, respectively), which consists of the free risk rate plus a risk premium.
If the discount rate had increased or decreased by 50 basis points, the recoverable amount would have decreased or increased by €691million and €801 million respectively. If the growth rate had increased or decreased by 50 basis points, the recoverable amount would have increased or decreased by €648 million and €560 million respectively.
As of December 31, 2012, there were no indications of significant impairment losses on the principal Group’s CGUs, except for insignificant impairments on the goodwill of the Retail Banking Euro (estimated to amount to €49 million) and the goodwill of the Corporate & Investment Banking Euro (estimated to amount to €4 million). These amounts have been recognized under “Impairment losses on other assets (net)—Goodwill and other intangible assets” in the consolidated income statement for 2012.
76
As of December 31, 2011, impairment losses of €1,444 million were estimated in the United States CGU which were recognized under “Impairment losses on other assets (net)—Goodwill and other intangible assets” in the consolidated income statement for 2011. This loss was the result of a downward revision of the cash flows projections estimated for this CGU, as a result of the following factors:
| | • | | the economic recovery was slower than expected and demand for loans was lower than forecasted; this, together with a low interest rate forecast implied a bigger than expected slowdown in net interest income growth; and |
| | • | | growing regulatory pressure, with the implementation of new regulations, will imply lower than expected fee income, mainly related to the use of credit cards, while operating costs will rise with respect to our initial expectations. |
Both the U.S. CGU’s fair values and the fair values assigned to its assets and liabilities were based on the estimates and assumptions that the Group’s management deemed most likely given the circumstances. However, some changes to the valuation assumptions used could result in differences in the impairment test result. If the discount rate had increased or decreased by 50 basis points, the difference between the carrying amount and its recoverable amount would have increased or decreased by up to €585 million and €671 million, respectively, as of December 31, 2011. If the growth rate had increased or decreased by 50 basis points, the difference between the carrying amount and its recoverable amount would have increased or decreased by €517 million and €452 million, respectively, as of such date.
Insurance contracts
The methods and techniques used to calculate the mathematical reserves for insurance contracts mainly involve the valuation of the estimated future cash flows, discounted at the technical interest rate for each contract. Changes in insurance mathematical reserves may occur in the future as a consequence of changes in interest rates and other key assumptions. See Note 18 to the Consolidated Financial Statements, which contains a summary of our significant accounting policies and assumptions about our most significant insurance contracts.
Post-employment benefits and other long term commitments to employees
Pension and post-retirement benefit costs and credits are based on actuarial calculations. Inherent in these calculations are assumptions including discount rates, rate of salary increase and expected return on plan assets. Changes in pension and post-retirement costs may occur in the future as a consequence of changes in interest rates, expected return on assets or other assumptions. See Note 2.2.12 to the Consolidated Financial Statements, which contains a summary of our significant accounting policies about pension and post-retirement benefit costs and credits.
Impairment losses on financial assets
As we describe in Note 2.2.1 to the Consolidated Financial Statements, a loan is considered to be an impaired loan and, therefore, its carrying amount is adjusted to reflect the effect of its impairment when there is objective evidence that events have occurred which give rise to a negative impact on the future cash flows that were estimated at the time the transaction was arranged. The potential impairment of these assets is determined individually or collectively.
Impairment losses on financial assets collectively evaluated for impairment are calculated by using statistical procedures, and they are deemed equivalent to the portion of losses incurred on the date that the consolidated financial statements are prepared that has yet to be allocated to specific assets. The BBVA Group estimates losses through statistical processes that apply historical data and other specific parameters that, although having been generated as of closing date for these consolidated financial statements, have arisen on an individual basis following the reporting date.
The incurred loss is calculated taking into account three key factors: exposure at default, probability of default and loss given default.
| | • | | Exposure at default (EAD) is the amount of risk exposure at the date of default by the counterparty. |
77
| | • | | Probability of default (PD) is the probability of the counterparty failing to meet its principal and/or interest payment obligations. The PD is associated with the rating/scoring of each counterparty/transaction. In addition, the PD calculation includes the following parameters: |
| | - | | The ‘point-in-time’ parameter converts a ‘through-the-cycle’ probability of default (defined as the average probability of default over a complete economic cycle) into the probability of default at the reporting date (‘point-in-time’ probability). |
| | - | | The loss identification period (‘LIP’) parameter, which is the time lag period between the occurrence of a specific impairment or loss event and when objective evidence of impairment becomes apparent on an individual basis; in other words, the time lag period between the loss event and the date an entity identified its occurrence. The analysis of LIPs is performed on a homogenous portfolio basis. |
A PD of 100% is assigned when a loan is considered impaired. The definition of default used includes amounts past due by 90 days or more and cases in which there is no default but there are doubts as to the solvency of the counterparty (subjective doubtful assets).
| | • | | Loss given default (LGD) is the estimate of the loss arising in the event of default. It depends mainly on the characteristics of the counterparty, and the valuation of the guarantees or collateral associated with the asset. |
In order to calculate the LGD at each balance sheet date, the Group evaluates the estimated cash flows from the sale of the collateral by estimating its sale price (in the case of real estate collateral, the Group takes into account declines in property values which could affect the value of such collateral) and its estimated cost of sale. In the event of a default, the Group becomes contractually entitled to the property at the end of the foreclosure process or if it purchases the property from borrowers in distress, and such property is recognized in the financial statements. After the initial recognition of these assets classified as “Non-current assets held for sale” (see Note 2.2.4 to the Consolidated Financial Statements) or “Inventories” (see Note 2.2.6 to the Consolidated Financial Statements), they are valued at the lower of their carrying amount and their fair value less their estimated selling price.
The Bank of Spain requires that the calculation of the allowance for collective losses incurred must also be calculated based on the information provided by the Bank of Spain until the Spanish regulatory authority has verified and approved these internal models.
For the years ended December 31, 2013, 2012 and 2011, there is no material difference in the amount of allowances for loan losses calculated in accordance with EU-IFRS required to be applied under the Bank of Spain’s Circular 4/2004 and IFRS-IASB.
The estimates of the portfolio’s inherent risks and overall recovery vary with changes in the economy, individual industries, countries and individual borrowers’ or counterparties’ ability and willingness to repay their obligations. The degree to which any particular assumption affects the allowance for credit losses depends on the severity of the change and its relationship to the other assumptions.
Key judgments used in determining the allowance for loan losses include: (i) risk ratings for pools of commercial loans and leases; (ii) market and collateral values and discount rates for individually evaluated loans; (iii) product type classifications for consumer and commercial loans and leases; (iv) loss rates used for consumer and commercial loans and leases; (v) adjustments made to assess current events and conditions; (vi) considerations regarding domestic, global and individual countries economic uncertainty; and (vii) overall credit conditions.
Cybersecurity and fraud management
The BBVA Group has established computer security controls to prevent and mitigate potential computer attacks that may materially affect the Group’s results. These controls are part of the risk assessment and mitigation system established in our corporate operational risk and internal control structure in order to ensure compliance with the Sarbanes-Oxley Act, with a view to guaranteeing the proper identification and effective control of such risks. In the implementation, audit and review of such controls we have identified no material risk to our operations, owing to the effective mitigation of such risk that such security controls have provided.
78
We have divided identified risks into two categories distinguishing between risks that may affect the availability of our computer systems and their supporting processes and risks that may affect the confidentiality and integrity of the information processed by such systems.
Risks related to lack of availability are managed and mitigated through our Business Continuity Plans and our Systems Continuity Plans.
We have 127 Business Continuity Plans in operation across 26 countries. A number of such plans have been activated during the past year as a result of the tropical storms that affected Mexico and the riots and blockade that affected Venezuela.
The European Union Critical Infrastructure Protection Directive was incorporated into Spanish law in 2011. We believe that BBVA is fully prepared to fulfill any possible obligations and requirements set forth therein.
The risks identified that may affect the confidentiality and integrity of our information are managed and mitigated within the programs established throughout the BBVA Group in our respective Information Security Master Plans. Master Plans are updated on a continuous basis taking into account new technological risks faced by the Group, and establish both organizational and technical mechanisms to support new technological challenges with the necessary security measures.
The BBVA Group has not undergone any security incidents which individually or in the aggregate can be considered material.
For the type of business and operations carried out by the BBVA Group, we have identified no cyber security incident related risks that could remain undetected for an extended period of time and represent a material risk. Moreover, and with regard to any possible banking-related cyber security risks which might affect the Group, there is no public evidence of incidents occurring within the financial sector which might represent a material risk to the Group.
In 2013, management of fraud in the BBVA Group has focused on improving processes and tools to improve prevention and reduce fraud.
Factors Affecting the Comparability of our Results of Operations and Financial Condition
Trends in Exchange Rates
We are exposed to foreign exchange rate risk in that our reporting currency is the euro, whereas certain of our subsidiaries keep their accounts in other currencies, principally Mexican pesos, U.S. dollars, Argentine pesos, Chilean pesos, Colombian pesos, Venezuelan bolivars fuerte and New Peruvian soles. For example, if Latin American currencies and the U.S. dollar depreciate against the euro, when the results of operations of our subsidiaries in the countries using these currencies are included in our consolidated financial statements, the euro value of their results declines, even if, in local currency terms, their results of operations and financial condition have remained the same or improved relative to the prior period. Accordingly, declining exchange rates may limit the ability of our results of operations, stated in euro, to fully describe the performance in local currency terms of our subsidiaries. By contrast, the appreciation of Latin American currencies and the U.S. dollar against the euro would have a positive impact on the results of operations of our subsidiaries in the countries using these currencies when their results of operations are included in our consolidated financial statements. We are also exposed to fluctuations of the Turkish lira as a result of our investment in Garanti and, to a lesser extent, to the Chinese yuan as a result of our investments in the CITIC Group.
The assets and liabilities of our subsidiaries which maintain their accounts in currencies other than the euro have been converted to the euro at the period-end exchange rates for inclusion in our Consolidated Financial Statements. Income statement items have been converted at the average exchange rates for the period. The following table sets forth the
79
exchange rates of several Latin American currencies, the U.S. dollar, the Turkish lira and the Chinese yuan against the euro, expressed in local currency per €1.00 for 2013, 2012 and 2011 and as of December 31, 2013, 2012 and 2011 according to the European Central Bank (“ECB”).
| | | | | | | | | | | | | | | | | | | | | | | | |
| | | Average Exchange Rates | | | Period-End Exchange Rates | |
| | | Year Ended
December 31,
2013 | | | Year Ended
December 31,
2012 | | | Year Ended
December 31,
2011 | | | As of
December 31,
2013 | | | As of
December 31,
2012 | | | As of
December 31,
2011 | |
Mexican peso | | | 16.9627 | | | | 16.9033 | | | | 17.2906 | | | | 18.0731 | | | | 17.1845 | | | | 18.0512 | |
U.S. dollar | | | 1.3281 | | | | 1.2850 | | | | 1.3916 | | | | 1.3791 | | | | 1.3194 | | | | 1.2939 | |
Argentine peso | | | 7.2767 | | | | 5.8434 | | | | 5.7467 | | | | 8.9890 | | | | 6.4768 | | | | 5.5679 | |
Chilean peso | | | 658.3278 | | | | 625.0000 | | | | 672.0430 | | | | 722.5434 | | | | 633.3122 | | | | 674.7638 | |
Colombian peso | | | 2,481.3896 | | | | 2,309.4688 | | | | 2,570.6941 | | | | 2,659.5745 | | | | 2,331.0023 | | | | 2,512.5628 | |
Peruvian new sol | | | 3.5903 | | | | 3.3896 | | | | 3.8323 | | | | 3.8535 | | | | 3.3678 | | | | 3.4890 | |
Venezuelan bolivar | | | 8.0453 | | | | 5.5187 | | | | 5.9765 | | | | 8.6775 | | | | 5.6616 | | | | 5.5569 | |
Turkish lira | | | 2.5339 | | | | 2.3139 | | | | 2.3383 | | | | 2.9605 | | | | 2.3551 | | | | 2.4432 | |
Chinese Yuan | | | 8.1644 | | | | 8.1063 | | | | 8.9932 | | | | 8.3491 | | | | 8.2207 | | | | 8.1588 | |
During 2013, all of the above currencies depreciated against the euro in average terms. Similarly, there was a year-on-year depreciation of these currencies against the euro as of December 31, 2013. The effect of changes in exchange rates on the year-on-year comparison of the Group’s income statement and balance sheet was negative.
BBVA Group Results of Operations for 2013 Compared to 2012
The changes in the Group’s consolidated income statements for 2013 and 2012 were as follows:
| | | | | | | | | | | | |
| | | Year Ended
December 31, | | | | |
| | | 2013 | | | 2012 | | | Change | |
| | | (In Millions of Euros) | | | (In %) | |
Interest and similar income | | | 23,512 | | | | 24,815 | | | | (5.3 | ) |
Interest expense and similar charges | | | (9,612 | ) | | | (10,341 | ) | | | (7.0 | ) |
| | | | | | | | | | | | |
Net interest income | | | 13,900 | | | | 14,474 | | | | (4.0 | ) |
| | | | | | | | | | | | |
Dividend income | | | 235 | | | | 390 | | | | (39.7 | ) |
Share of profit or loss of entities accounted for using the equity method | | | 694 | | | | 1,039 | | | | (33.2 | ) |
Fee and commission income | | | 5,478 | | | | 5,290 | | | | 3.6 | |
Fee and commission expenses | | | (1,228 | ) | | | (1,134 | ) | | | 8.3 | |
Net gains (losses) on financial assets and liabilities | | | 1,608 | | | | 1,636 | | | | (1.7 | ) |
Net exchange differences | | | 903 | | | | 69 | | | | n.m. | (1) |
Other operating income | | | 4,995 | | | | 4,765 | | | | 4.8 | |
Other operating expenses | | | (5,627 | ) | | | (4,705 | ) | | | 19.6 | |
Administration costs | | | (9,701 | ) | | | (9,396 | ) | | | 3.2 | |
Personnel expenses | | | (5,588 | ) | | | (5,467 | ) | | | 2.2 | |
General and administrative expenses | | | (4,113 | ) | | | (3,929 | ) | | | 4.7 | |
Depreciation and amortization | | | (1,095 | ) | | | (978 | ) | | | 12.0 | |
Provisions (net) | | | (609 | ) | | | (641 | ) | | | (5.0 | ) |
Impairment losses on financial assets (net) | | | (5,612 | ) | | | (7,859 | ) | | | (28.6 | ) |
Impairment losses on other assets (net) | | | (467 | ) | | | (1,123 | ) | | | (58.4 | ) |
Gains (losses) on derecognized assets not classified as non-current assets held for sale | | | (1,915 | ) | | | 3 | | | | n.m. | (1) |
Negative goodwill | | | — | | | | 376 | | | | (100.0 | ) |
Gains (losses) in non-current assets held for sale not classified as discontinued operations | | | (399 | ) | | | (624 | ) | | | (36.1 | ) |
| | | | | | | | | | | | |
Operating profit before tax | | | 1,160 | | | | 1,582 | | | | (26.7 | ) |
| | | | | | | | | | | | |
Income tax | | | (46 | ) | | | 352 | | | | n.m. | (1) |
| | | | | | | | | | | | |
Profit from continuing operations | | | 1,114 | | | | 1,934 | | | | (42.4 | ) |
| | | | | | | | | | | | |
Profit from discontinued operations (net) | | | 1,866 | | | | 393 | | | | n.m. | (1) |
| | | | | | | | | | | | |
Profit | | | 2,980 | | | | 2,327 | | | | 28.1 | |
| | | | | | | | | | | | |
Profit attributable to parent company | | | 2,228 | | | | 1,676 | | | | 32.9 | |
Profit attributable to non-controlling interests | | | 753 | | | | 651 | | | | 15.7 | |
| | | | | | | | | | | | |
80
The changes in our consolidated income statements for 2013 and 2012 were as follows:
Net interest income
The following table summarizes the principal components of net interest income for 2013 compared to 2012.
| | | | | | | | | | | | |
| | | Year Ended
December 31, | | | | |
| | | 2013 | | | 2012 | | | Change | |
| | | (In Millions of Euros) | | | (In %) | |
Interest and similar income | | | 23,512 | | | | 24,815 | | | | (5.3 | ) |
Interest expense and similar charges | | | (9,612 | ) | | | (10,341 | ) | | | (7.0 | ) |
| | | | | | | | | | | | |
Net interest income | | | 13,900 | | | | 14,474 | | | | (4.0 | ) |
| | | | | | | | | | | | |
Net interest income for the year ended December 31, 2013 amounted to €13,900 million, a 4.0% decrease compared with the €14,474 million recorded for the year ended December 31, 2012 mainly due to the decrease in the yield on loans, as a result of the difficult economic conditions in Spain, characterized by a low lending activity and pressure on margins (which was higher than the decline in the cost of deposits) and the impact of the elimination of mortgage floor clauses.
Dividend income
Dividend income for the year ended December 31, 2013 amounted to €235 million, a 40% decrease compared with the €390 million recorded for the year ended December 31, 2012 mainly due to the year-on-year decrease in the dividends received from Telefónica, S.A., which decreased from €0.53 per share in 2012 to €0.35 per share in 2013.
Share of profit or loss of entities accounted for using the equity method
Share of profit or loss of entities accounted for using the equity method for the year ended December 31, 2013 amounted to €694 million, a 33% decrease compared with the €1,039 million recorded for the year ended December 31, 2012 mainly due to the decreased profits of CIFH and CNCB (during the nine months in which we accounted for our participation in CNCB under the equity method), and Garanti.
Fee and commission income
The breakdown of fee and commission income for 2013 and 2012 is as follows:
| | | | | | | | | | | | |
| | | Year Ended
December 31, | | | | |
| | | 2013 | | | 2012 | | | Change | |
| | | (In Millions of Euros) | | | (In %) | |
Commitment fees | | | 190 | | | | 186 | | | | 2.2 | |
Contingent risks | | | 316 | | | | 334 | | | | (5.4 | ) |
Letters of credit | | | 50 | | | | 56 | | | | (10.7 | ) |
Bank and other guarantees | | | 266 | | | | 278 | | | | (4.3 | ) |
Arising from exchange of foreign currencies and banknotes | | | 23 | | | | 24 | | | | (4.2 | ) |
Collection and payment services income | | | 3,095 | | | | 2,881 | | | | 7.4 | |
Bills receivables | | | 68 | | | | 77 | | | | (11.7 | ) |
Current accounts | | | 349 | | | | 381 | | | | (8.4 | ) |
Credit and debit cards | | | 1,989 | | | | 1,756 | | | | 13.3 | |
Checks | | | 237 | | | | 222 | | | | 6.8 | |
Transfers and others payment orders | | | 329 | | | | 313 | | | | 5.1 | |
Rest | | | 123 | | | | 132 | | | | (6.8 | ) |
Securities services income | | | 1,142 | | | | 1,120 | | | | 2.0 | |
Securities underwriting | | | 74 | | | | 100 | | | | (26.0 | ) |
Securities dealing | | | 205 | | | | 194 | | | | 5.7 | |
Custody securities | | | 323 | | | | 328 | | | | (1.5 | ) |
Investment and pension funds | | | 413 | | | | 375 | | | | 10.1 | |
Rest assets management | | | 127 | | | | 123 | | | | 3.3 | |
Counseling on and management of one-off transactions | | | 14 | | | | 7 | | | | 100.0 | |
Financial and similar counseling services | | | 45 | | | | 41 | | | | 9.8 | |
Factoring transactions | | | 37 | | | | 38 | | | | (2.6 | ) |
Non-banking financial products sales | | | 109 | | | | 97 | | | | 12.4 | |
Other fees and commissions | | | 507 | | | | 562 | | | | (9.8 | ) |
| | | | | | | | | | | | |
Fee and commission income | | | 5,478 | | | | 5,290 | | | | 3.6 | |
| | | | | | | | | | | | |
81
Fee and commission income increased by 3.6% to €5,478 million for the year ended December 31, 2013 from €5,290 million for the year ended December 31, 2012 due principally to the increased activity in credit and debit cards in Mexico and South America, where the impact of the hyperinflation of Venezuela was significant.
Fee and commission expenses
The breakdown of fee and commission expenses for 2013 and 2012 is as follows:
| | | | | | | | | | | | |
| | | Year Ended
December 31, | | | | |
| | | 2013 | | | 2012 | | | Change | |
| | | (In Millions of Euros) | | | (In %) | |
Brokerage fees on lending and deposit transactions | | | 1 | | | | 3 | | | | (66.7 | ) |
Fees and commissions assigned to third parties | | | 894 | | | | 817 | | | | 9.4 | |
Credit and debit cards | | | 762 | | | | 685 | | | | 11.2 | |
Transfers and others payment orders | | | 49 | | | | 42 | | | | 16.7 | |
Securities dealing | | | 5 | | | | 11 | | | | (54.5 | ) |
Rest | | | 78 | | | | 79 | | | | (1.3 | ) |
Other fees and commissions | | | 333 | | | | 314 | | | | 6.1 | |
| | | | | | | | | | | | |
Fee and commission expenses | | | 1,228 | | | | 1,134 | | | | 8.3 | |
| | | | | | | | | | | | |
Fee and commission expenses increased by 8.3% to €1,228 million for the year ended December 31, 2013 from €1,134 million for the year ended December 31, 2012, primarily due to the greater business activity in credit and debit cards in South America, mainly as a result of the hyperinflation of Venezuela.
Net gains (losses) on financial assets and liabilities and net exchange differences
Net gains (losses) on financial assets and liabilities decreased by 1.7% to €1,608 million for the year ended December 31, 2013 from €1,636 million for the year ended December 31, 2012.
The table below provides a breakdown of net gains (losses) on financial assets and liabilities for 2013 and 2012:
| | | | | | | | | | | | |
| | | Year Ended
December 31, | | | | |
| | | 2013 | | | 2012 | | | Change | |
| | | (In Millions of Euros) | | | (In %) | |
Financial assets held for trading | | | 540 | | | | 653 | | | | (17.3 | ) |
Other financial assets designated at fair value through profit or loss | | | 49 | | | | 69 | | | | (29.0 | ) |
Other financial instruments not designated at fair value through profit or loss | | | 1,019 | | | | 914 | | | | 11.5 | |
Available-for-sale financial assets | | | 1,046 | | | | 801 | | | | 30.6 | |
Loans and receivables | | | 126 | | | | 51 | | | | 147.1 | |
Other | | | (153 | ) | | | 62 | | | | n.m. | (1) |
| | | | | | | | | | | | |
Net gains (losses) on financial assets and liabilities | | | 1,608 | | | | 1,636 | | | | (1.7 | ) |
| | | | | | | | | | | | |
82
Net exchange differences increased to €903 million for the year ended December 31, 2013 from €69 million for the year ended December 31, 2012, due primarily to the evolution of foreign currencies and the structural management of exchange rates, mainly by entering into derivatives transactions.
Other operating income and expenses (net)
Other operating income amounted to €4,995 million for the year ended December 31, 2013 a 4.8% increase compared to €4,765 million for the year ended December 31, 2012, due primarily to increased income derived from insurance and reinsurance contracts.
Other operating expenses for the year ended December 31, 2013, amounted to €5,627 million, a 19.6% increase compared to the €4,705 million recorded for the year ended December 31, 2012 due primarily to increased provisions related to insurance and reinsurance contracts, expenses related to inflation and higher contributions to deposit guarantee funds in the countries in which we operate.
Administration costs
Administration costs for the year ended December 31, 2013 amounted to €9,701 million, a 3.2% increase compared with the €9,396 million recorded for the year ended December 31, 2012 mainly due to the investments made to implement our expansion and technological transformation plans in Mexico and South America as well as the incorporation of Unnim at the end of July 2012.
The table below provides a breakdown of personnel expenses for 2013 and 2012.
| | | | | | | | | | | | |
| | | Year Ended
December 31, | | | | |
| | | 2013 | | | 2012 | | | Change | |
| | | (In Millions of Euros) | | | (In %) | |
Wages and salaries | | | 4,232 | | | | 4,192 | | | | 1.0 | |
Social security costs | | | 693 | | | | 657 | | | | 5.5 | |
Transfers to internal pension provisions | | | 70 | | | | 54 | | | | 29.6 | |
Contributions to external pension funds | | | 80 | | | | 84 | | | | (4.8 | ) |
Other personnel expenses | | | 513 | | | | 480 | | | | 6.9 | |
| | | | | | | | | | | | |
Personnel expenses | | | 5,588 | | | | 5,467 | | | | 2.2 | |
| | | | | | | | | | | | |
Wages and salaries expenses increased 1% from €4,192 million in 2012 to €4,232 million in 2013.
The table below provides a breakdown of general and administrative expenses for 2013 and 2012:
| | | | | | | | | | | | |
| | | Year Ended
December 31, | | | | |
| | | 2013 | | | 2012 | | | Change | |
| | | (In Millions of Euros) | | | (In %) | |
Technology and systems | | | 791 | | | | 735 | | | | 7.6 | |
Communications | | | 294 | | | | 311 | | | | (5.5 | ) |
Advertising | | | 336 | | | | 359 | | | | (6.4 | ) |
Property, fixtures and materials | | | 920 | | | | 873 | | | | 5.4 | |
Of which: | | | | | | | | | | | | |
Rent expenses | | | 470 | | | | 490 | | | | (4.1 | ) |
Taxes other than income tax | | | 421 | | | | 417 | | | | 1.0 | |
Other expenses | | | 1,351 | | | | 1,234 | | | | 9.5 | |
| | | | | | | | | | | | |
General and administrative expenses | | | 4,113 | | | | 3,929 | | | | 4.7 | |
| | | | | | | | | | | | |
83
Technology and systems expenses increased from €735 million in 2012 to €791 million in 2013. Other expenses increased from €1,234 million in 2012 to €1,351 million in 2013 mainly due to the increase of outsourced services in Mexico.
Depreciation and amortization
Depreciation and amortization for the year ended December 31, 2013 was €1,095 million, a 12% increase compared with the €978 million recorded for the year ended December 31, 2012 mainly due to the amortization of software and tangible assets for own use.
Provisions (net)
Provisions (net) for the year ended December 31, 2013 was €609 million, a 5% decrease compared with the €641 million recorded for the year ended December 31, 2012 when higher provisions were recognized due to remeasurements arising from changes in financial assumptions used to calculate early retirements in Spain and other similar benefits commitments.
Impairment losses on financial assets (net)
Impairment losses on financial assets (net) for the year ended December 31, 2013 was a loss of €5,612 million, a 29% decrease compared with the €7,859 million loss recorded for the year ended December 31, 2012 mainly due to the fact that during 2013 there were lower write-downs to address the deterioration of the loans related to real estate in Spain (although there was an increase in impairment losses on non-real estate loans in Spain). The Group’s non-performing assets ratio was 6.9% as of December 31, 2013, compared to 5.1% as of December 31, 2012.
Impairment losses on other assets (net)
Impairment losses on other assets (net) for the year ended December 31, 2013 amounted to €467 million, a 58.4% decrease compared to the €1,123 million recorded for the year ended December 31, 2012, when impairments losses on real estate inventories were higher as a result of the deterioration of the value of these assets.
Gains (losses) on derecognized assets not classified as non-current assets held for sale
Gains (losses) on derecognized assets not classified as non-current assets held for sale for the year ended December 31, 2013 amounted to a loss of €1,915 million, compared to a gain of €3 million recognized for the year ended December 31, 2012 mainly due to the realized losses related to the sale of the stake in CNCB amounting to approximately €2,600 million, offset in part by gains from the realized gains of the reinsurance agreement with Scor Global Life. See “Item 4. Information on the Company—History and Development of the Company—Capital Divestitures—2013—New agreement with CITIC Group” for additional information.
Negative goodwill
There was no negative goodwill for the year ended December 31, 2013. Negative goodwill for the year ended December 31, 2012 amounted to a gain of €376 million. Negative goodwill for the year ended December 31, 2012 was derived from the acquisition of Unnim. See “Item 4. Information on the Company—History and Development of the Company—Capital Expenditures—2012— Acquisition of Unnim” and Note 20.1 to our Consolidated Financial Statements for additional information.
84
Gains (losses) in non-current assets held for sale not classified as discontinued operations
Gains (losses) in non-current assets held for sale not classified as discontinued operations for the year ended December 31, 2013, amounted to a loss of €399 million, a 36.1% decrease compared to a loss of €624 million for the year ended December 31, 2012. This decrease was primarily due to the sale of BBVA Panamá that partially offset the high provisions made in connection with real estate foreclosed assets in Spain in 2013.
Operating profit before tax
As a result of the foregoing, operating profit before tax for the year ended December 31, 2013 was €1,160 million, a 26.7% decrease from the €1,582 million recorded for the year ended December 31, 2012.
Income tax
Income tax for the year ended December 31, 2013 was an expense of €46 million, compared to a benefit of €352 million recorded for the year ended December 31, 2012. The low tax rate is mainly due to the high proportion of revenues with low or zero tax rates (primarily dividends and equity accounted earnings), the high proportion of results coming from Latin America, which carry a lower effective tax rate, and the high provisions made with respect to real estate assets.
Profit from continuing operations
As a result of the foregoing, profit from continuing operations for the year ended December 31, 2013 was €1,114 million, a 42.4% decrease from the €1,934 million recorded for the year ended December 31, 2012.
Profit from discontinued operations (net)
Profit from discontinued operations for the year ended December 31, 2013 was €1,866 million, compared to the €393 million registered for the year ended December 31, 2012, due to the divestment in 2013 of the pension business in Latin America. See “Item 4. Information on the Company—History and Development of the Company—Capital Divestitures—2013” for additional information.
Profit
As a result of the foregoing, profit for the year ended December 31, 2013 was €2,980 million, a 28.1% increase from the €2,327 million recorded for the year ended December 31, 2012.
Profit attributable to parent company
Profit attributable to parent company for the year ended December 31, 2013 was €2,228 million, a 32.9% increase from the €1,676 million recorded for the year ended December 31, 2012.
Profit attributable to non-controlling interests
Profit attributable to non-controlling interests for the year ended December 31, 2013 was €753 million, a 15.7% increase over the €651 million registered for the year ended December 31, 2012, principally due to the positive performance of our Venezuelan and Peruvian operations where there are significant minority shareholders.
85
BBVA Group Results of Operations for 2012 Compared to 2011
The changes in the Group’s consolidated income statements for 2012 and 2011 were as follows:
| | | | | | | | | | | | |
| | | Year Ended
December 31, | | | | |
| | | 2012 | | | 2011 | | | Change | |
| | | (In Millions of Euros) | | | (In %) | |
Interest and similar income | | | 24,815 | | | | 23,229 | | | | 6.8 | |
Interest expense and similar charges | | | (10,341 | ) | | | (10,505 | ) | | | (1.6 | ) |
| | | | | | | | | | | | |
Net interest income | | | 14,474 | | | | 12,724 | | | | 13.8 | |
| | | | | | | | | | | | |
Dividend income | | | 390 | | | | 562 | | | | (30.6 | ) |
Share of profit or loss of entities accounted for using the equity method | | | 1,039 | | | | 787 | | | | 32.0 | |
Fee and commission income | | | 5,290 | | | | 4,874 | | | | 8.5 | |
Fee and commission expenses | | | (1,134 | ) | | | (980 | ) | | | 15.7 | |
Net gains (losses) on financial assets and liabilities | | | 1,636 | | | | 1,070 | | | | 52.9 | |
Net exchange differences | | | 69 | | | | 410 | | | | (83.2 | ) |
Other operating income | | | 4,765 | | | | 4,212 | | | | 13.1 | |
Other operating expenses | | | (4,705 | ) | | | (4,019 | ) | | | 17.1 | |
Administration costs | | | (9,396 | ) | | | (8,634 | ) | | | 8.8 | |
Personnel expenses | | | (5,467 | ) | | | (5,053 | ) | | | 8.2 | |
General and administrative expenses | | | (3,929 | ) | | | (3,581 | ) | | | 9.7 | |
Depreciation and amortization | | | (978 | ) | | | (810 | ) | | | 20.7 | |
Provisions (net) | | | (641 | ) | | | (503 | ) | | | 27.4 | |
Impairment losses on financial assets (net) | | | (7,859 | ) | | | (4,185 | ) | | | 87.8 | |
Impairment losses on other assets (net) | | | (1,123 | ) | | | (1,883 | ) | | | (40.4 | ) |
Gains (losses) on derecognized assets not classified as non-current assets held for sale | | | 3 | | | | 44 | | | | (93.2 | ) |
Negative goodwill | | | 376 | | | | — | | | | n.m. | (1) |
Gains (losses) in non-current assets held for sale not classified as discontinued operations | | | (624 | ) | | | (271 | ) | | | 130.3 | |
| | | | | | | | | | | | |
Operating profit before tax | | | 1,582 | | | | 3,398 | | | | (53.4 | ) |
| | | | | | | | | | | | |
Income tax | | | 352 | | | | (158 | ) | | | n.m. | (1) |
| | | | | | | | | | | | |
Profit from continuing operations | | | 1,934 | | | | 3,240 | | | | (40.3 | ) |
| | | | | | | | | | | | |
Profit from discontinued operations (net) | | | 393 | | | | 245 | | | | 60.4 | |
| | | | | | | | | | | | |
Profit | | | 2,327 | | | | 3,485 | | | | (33.2 | ) |
| | | | | | | | | | | | |
Profit attributable to parent company | | | 1,676 | | | | 3,004 | | | | (44.2 | ) |
Profit attributable to non-controlling interests | | | 651 | | | | 481 | | | | 35.3 | |
| | | | | | | | | | | | |
The changes in our consolidated income statements for 2012 and 2011 were as follows:
Net interest income
The following table summarizes the principal components of net interest income for 2012 compared to 2011.
| | | | | | | | | | | | |
| | | Year Ended December 31, | | | | |
| | | 2012 | | | 2011 | | | Change | |
| | | (In Millions of Euros) | | | (In %) | |
Interest and similar income | | | 24,815 | | | | 23,229 | | | | 6.8 | |
Interest expense and similar charges | | | (10,341 | ) | | | (10,505 | ) | | | (1.6 | ) |
| | | | | | | | | | | | |
Net interest income | | | 14,474 | | | | 12,724 | | | | 13.8 | |
| | | | | | | | | | | | |
Net interest income increased 13.8% to €14,474 million for the year ended December 31, 2012 from €12,724 million for the year ended December 31, 2011 due to the reduction of the cost of deposits in Spain, Mexico and South America and
86
strong business activity in Mexico and South America. These positive effects were partially offset by the performance of the Unites States, where net interest income continued to be negatively affected by the Guaranty run-off, lower business volume in Corporate Investment Banking, and the current environment of low interest rates with a practically flat curve.
Dividend income
Dividend income decreased 30.6% to €390 million for the year ended December 31, 2012 from €562 million for the year ended December 31, 2011. This decrease was primarily due to the year-on-year decrease in the dividends received from Telefónica, S.A., which decreased from €1.52 per share in 2011 to €0.53 per share in 2012. Telefónica, S.A. has publicly announced that it will pay no dividends until November 2013.
Share of profit or loss of entities accounted for using the equity method
Share of profit or loss of entities accounted for using the equity method increased 32% to €1,039 million for the year ended December 31, 2012 from €787 million for the year ended December 31, 2011. This increase was mainly attributable to the fact that we accounted for the profit of Garanti for the full year ended December 31, 2012, compared with only nine months for the year ended December 31, 2011, and to a lesser extent to the increased profit of CNCB.
Fee and commission income
The breakdown of fee and commission income for 2012 and 2011 is as follows:
| | | | | | | | | | | | |
| | | Year Ended December 31, | | | | |
| | | 2012 | | | 2011 | | | Change | |
| | | (In Millions of Euros) | | | (In %) | |
Commitment fees | | | 186 | | | | 157 | | | | 18.5 | |
Contingent risks | | | 334 | | | | 302 | | | | 10.6 | |
Letters of credit | | | 56 | | | | 51 | | | | 9.8 | |
Bank and other guarantees | | | 278 | | | | 251 | | | | 10.8 | |
Arising from exchange of foreign currencies and banknotes | | | 24 | | | | 25 | | | | (4.0 | ) |
Collection and payment services income | | | 2,881 | | | | 2,560 | | | | 12.5 | |
Bills receivables | | | 77 | | | | 66 | | | | 16.7 | |
Current accounts | | | 381 | | | | 348 | | | | 9.5 | |
Credit and debit cards | | | 1,756 | | | | 1,518 | | | | 15.7 | |
Checks | | | 222 | | | | 228 | | | | (2.6 | ) |
Transfers and others payment orders | | | 313 | | | | 276 | | | | 13.4 | |
Rest | | | 132 | | | | 124 | | | | 6.5 | |
Securities services income | | | 1,120 | | | | 1,079 | | | | 3.8 | |
Securities underwriting | | | 100 | | | | 70 | | | | 42.9 | |
Securities dealing | | | 194 | | | | 192 | | | | 1.0 | |
Custody securities | | | 328 | | | | 329 | | | | (0.3 | ) |
Investment and pension funds | | | 375 | | | | 372 | | | | 0.8 | |
Rest assets management | | | 123 | | | | 116 | | | | 6.0 | |
Counseling on and management of one-off transactions | | | 7 | | | | 12 | | | | (41.7 | ) |
Financial and similar counseling services | | | 41 | | | | 56 | | | | (26.8 | ) |
Factoring transactions | | | 38 | | | | 33 | | | | 15.2 | |
Non-banking financial products sales | | | 97 | | | | 90 | | | | 7.8 | |
Other fees and commissions | | | 562 | | | | 560 | | | | 0.4 | |
| | | | | | | | | | | | |
Fee and commission income | | | 5,290 | | | | 4,874 | | | | 8.5 | |
| | | | | | | | | | | | |
Fee and commission income increased by 8.5% to €5,290 million for the year ended December 31, 2012 from €4,874 million for the year ended December 31, 2011 due principally to greater business activity in Mexico and South America, where credit and debit cards commissions increased by 8.1% and 41.8% respectively.
87
Fee and commission expenses
The breakdown of fee and commission expenses for 2012 and 2011 is as follows:
| | | | | | | | | | | | |
| | | Year Ended
December 31, | | | | |
| | | 2012 | | | 2011 | | | Change | |
| | | (In Millions of Euros) | | | (In %) | |
Brokerage fees on lending and deposit transactions | | | 3 | | | | 4 | | | | (25.0 | ) |
Fees and commissions assigned to third parties | | | 817 | | | | 682 | | | | 19.8 | |
Credit and debit cards | | | 685 | | | | 554 | | | | 23.6 | |
Transfers and others payment orders | | | 42 | | | | 31 | | | | 35.5 | |
Securities dealing | | | 11 | | | | 14 | | | | (21.4 | ) |
Rest | | | 79 | | | | 83 | | | | (4.8 | ) |
Other fees and commissions | | | 314 | | | | 294 | | | | 6.8 | |
| | | | | | | | | | | | |
Fee and commission expenses | | | 1,134 | | | | 980 | | | | 15.7 | |
| | | | | | | | | | | | |
Fee and commission expenses increased by 15.7% to €1,134 million for the year ended December 31, 2012 from €980 million for the year ended December 31, 2011, primarily due to the greater business activity in Mexico and South America.
Net gains (losses) on financial assets and liabilities and net exchange differences
Net gains (losses) on financial assets and liabilities increased by 52.9% to €1,636 million for the year ended December 31, 2012 from €1,070 million for the year ended December 31, 2011. This increase is mainly attributable to the increase in the net gains on “Available-for-sale financial assets”, which reflects the capital gains derived from the repurchase of securitization bonds and subordinated debt (which has generated gross capital gains of approximately €444 million) and, to a lesser extent, the capital gains derived from the sale of public debt in South America. In addition, net gains on “Loans and receivables” increased by 88.9% from €27 million in 2011 to €51 million in 2012, primarily due to the higher activity on loan sales mainly in Mexico and South America. These increases were partially offset by the 37.9% year-on-year decrease in the net gains on “Financial assets held for trading”, which was primarily due to the turbulences in the markets which resulted in lower intermediation income in Spain and Mexico.
The table below provides a breakdown of net gains (losses) on financial assets and liabilities for 2012 and 2011:
| | | | | | | | | | | | |
| | | Year Ended
December 31, | | | | |
| | | 2012 | | | 2011 | | | Change | |
| | | (In Millions of Euros) | | | (In %) | |
Financial assets held for trading | | | 653 | | | | 1,004 | | | | (35.0 | ) |
Other financial assets designated at fair value through profit or loss | | | 69 | | | | 16 | | | | n.m. | (1) |
Other financial instruments not designated at fair value through profit or loss | | | 914 | | | | 50 | | | | n.m. | (1) |
Available-for-sale financial assets | | | 801 | | | | 80 | | | | n.m. | (1) |
Loans and receivables | | | 51 | | | | 27 | | | | 88.9 | |
Rest | | | 62 | | | | (57 | ) | | | n.m. | (1) |
| | | | | | | | | | | | |
Net gains (losses) on financial assets and liabilities | | | 1,636 | | | | 1,070 | | | | 52.9 | |
| | | | | | | | | | | | |
Net exchange differences decreased to €69 million for the year ended December 31, 2012 from €410 million for the year ended December 31, 2011, due primarily to the evolution of foreign currencies.
88
Other operating income and expenses (net)
Other operating income amounted to €4,765 million for the year ended December 31, 2012 a 13.1% increase compared to €4,212 million for the year ended December 31, 2011, due primarily to increased income derived from insurance and reinsurance contracts.
Other operating expenses for the year ended December 31, 2012, amounted to €4,705 million, a 17.1% increase compared to the €4,019 million recorded for the year ended December 31, 2011 due primarily to higher contributions to deposit guarantee funds in the countries in which we operate and to increased provisions related to insurance and reinsurance contracts.
Administration costs
Administration costs comprise personnel expenses and general and administrative expenses and for the year ended December 31, 2012 were €9,396 million, an 8.8% increase from the €8,634 million recorded for the year ended December 31, 2011, due primarily to the investments made to implement our expansion and technological transformation plans and, to a lesser extent, to the acquisition of Unnim in the second half of 2012.
The table below provides a breakdown of personnel expenses for 2012 and 2011.
| | | | | | | | | | | | |
| | | Year Ended December 31, | | | | |
| | | 2012 | | | 2011 | | | Change | |
| | | (In Millions of Euros) | | | (In %) | |
Wages and salaries | | | 4,192 | | | | 3,911 | | | | 7.2 | |
Social security costs | | | 657 | | | | 600 | | | | 9.5 | |
Transfers to internal pension provisions | | | 54 | | | | 51 | | | | 5.9 | |
Contributions to external pension funds | | | 84 | | | | 80 | | | | 5.0 | |
Other personnel expenses | | | 480 | | | | 411 | | | | 16.8 | |
| | | | | | | | | | | | |
Personnel expenses | | | 5,467 | | | | 5,053 | | | | 8.2 | |
| | | | | | | | | | | | |
Wages and salaries expenses increased from €3,911 million in 2011 to €4,192 million in 2012 mainly due to the acquisition of Unnim, in the second half of 2012 and, to a lesser extent, to the high inflation recorded in South America and the expansion plans carried out during 2012.
The table below provides a breakdown of general and administrative expenses for 2012 and 2011:
| | | | | | | | | | | | |
| | | Year Ended December 31, | | | | |
| | | 2012 | | | 2011 | | | Change | |
| | | (In Millions of Euros) | | | (In %) | |
Technology and systems | | | 735 | | | | 639 | | | | 15.0 | |
Communications | | | 311 | | | | 275 | | | | 13.1 | |
Advertising | | | 359 | | | | 355 | | | | 1.1 | |
Property, fixtures and materials | | | 873 | | | | 808 | | | | 8.0 | |
Of which: | | | | | | | | | | | | |
Rent expenses | | | 490 | | | | 457 | | | | 8.3 | |
Taxes other than income tax | | | 417 | | | | 345 | | | | 20.9 | |
Other expenses | | | 1,234 | | | | 1,159 | | | | 6.5 | |
| | | | | | | | | | | | |
General and administrative expenses | | | 3,929 | | | | 3,581 | | | | 9.7 | |
| | | | | | | | | | | | |
Technology and systems expenses increased from €639 million in 2011 to €735 million in 2012. In recent years, we have undertaken significant investments in global technology projects, particularly in the area of transformation and innovation. We started up a number of projects in 2012, including the implementation of the new BBVA Compass technological platform in all our branches in the United States. Progress has also been made in the Group’s multichannel distribution model.
89
Depreciation and amortization
Depreciation and amortization for the year ended December 31, 2012 amounted to €978 million a 20.7% increase compared to €810 million recorded for the year ended December 31, 2011, due primarily to the amortization of software and tangible assets for own use.
Provisions (net)
Provisions (net) for the year ended December 31, 2012 amounted to €641 million, a 27.4% increase compared to €503 million recorded for the year ended December 31, 2011, primarily to cover early retirement benefits, other allocations to pension funds and transfers to provisions for contingent liabilities.
Impairment losses on financial assets (net)
Impairment losses on financial assets (net) for the year ended December 31, 2012 amounted to €7,859 million, an 87.8% increase compared to the €4,185 million recorded for the year ended December 31, 2011. This increase is mainly due to the increase of provisions in connection with assets related to the real estate business in Spain to cover the additional impairment in the value of such assets owing to the worsening macroeconomic conditions in Spain. The Group’s non-performing assets ratio was 5.1% as of December 31, 2012, compared to 4.0% as of December 31, 2011.
Impairment losses on other assets (net)
Impairment losses on other assets (net) for the year ended December 31, 2012 amounted to €1,123 million, a 40.4% decrease compared to the €1,883 million recorded for the year ended December 31, 2011, when an impairment in goodwill of €1,444 million was registered. However, impairments losses on real estate inventories were higher in 2012 than in 2011, as a result of the continuing deterioration of the value of these assets.
Gains (losses) on derecognized assets not classified as non-current assets held for sale
Gains (losses) on derecognized assets not classified as non-current assets held for sale for the year ended December 31, 2012 amounted to a gain of €3 million, a 93.2% decrease compared to €44 million for the year ended December 31, 2011.
Negative goodwill
Negative goodwill for the year ended December 31, 2012 amounted to a gain of €376 million, compared with no gain for the year ended December 31, 2011. Negative goodwill for the year ended December 31, 2012 was derived from the acquisition of Unnim. See “Item 4. Information on the Company—History and Development of the Company—Capital Expenditures—2012—Acquisition of Unnim” and Note 20.1 to our Consolidated Financial Statements for additional information.
Gains (losses) in non-current assets held for sale not classified as discontinued operations
Gains (losses) in non-current assets held for sale not classified as discontinued operations for the year ended December 31, 2012, amounted to a loss of €624 million, compared to a loss of €271 million for the year ended December 31, 2011. This increase was primarily due to the higher provisions made in connection with real estate foreclosed assets in Spain and sales of these assets which amounted to a loss of €83 million in 2012 compared to a gain of €127 million in 2011.
Operating profit before tax
As a result of the foregoing, operating profit before tax for the year ended December 31, 2012 was €1,582 million, a 53.4% decrease from the €3,398 million recorded for the year ended December 31, 2011.
Income tax
Income tax for the year ended December 31, 2012 was a benefit of €352 million, compared to an expense of €158 million recorded for the year ended December 31, 2011, due to lower operating profit before tax, the higher proportion of
90
revenues with low or zero tax rates (primarily dividends and equity accounted earnings), the higher proportion of results coming from Latin America, which carry a lower effective tax rate, and the higher provisions made with respect to real estate assets.
Profit from continuing operations
As a result of the foregoing, profit from continuing operations for the year ended December 31, 2012 was €1,934 million, a 40.3% decrease from the €3,240 million recorded for the year ended December 31, 2011.
Profit from discontinued operations (net)
Profit from discontinued operations for the year ended December 31, 2012 was €393 million, a 60.4% increase from the €245 million recorded for the year ended December 31, 2011, due to increased activity in the insurance and pension business. See “Item 4. Information on the Company—History and Development of the Company—Capital Divestitures—2013”.
Profit
As a result of the foregoing, profit for the year ended December 31, 2012 was €2,327 million, a 33.2% decrease from the €3,485 million recorded for the year ended December 31, 2011.
Profit attributable to parent company
Profit attributable to parent company for the year ended December 31, 2012 was €1,676 million, a 44.2% decrease from the €3,004 million recorded for the year ended December 31, 2011.
Profit attributable to non-controlling interests
Profit attributable to non-controlling interests for the year ended December 31, 2012 was €651 million, a 35.3% increase over the €481 million recorded for the year ended December 31, 2011, principally due to the positive performance of our Venezuelan and Peruvian operations where there are significant minority shareholders.
91
Results of Operations by Operating Segment
The information contained in this section is presented under management criteria
The tables set forth below reconcile the income statement of our operating segments presented in this section to the consolidated income statement of the Group. The “Adjustments” column reflects the differences between the Group income statement and the income statement calculated in accordance with management operating segment reporting criteria, which are the following:
| | • | | The treatment of Garanti: Under management criteria, 25.01% of the assets liabilities and income statement of Garanti are included in every line of the balance sheet and income statement, respectively, while for purposes of the Group financial statements the participation in Garanti is accounted under “Share of profit or loss of entities accounted for using the equity method”. |
| | • | | The creation of a line in the income statement called “Profit from corporate operations” which is in place of “Profit from discontinued operations” that includes the following: |
| | – | The earning from the transaction entered into by BBVA Seguros and SCOR Global Life Reinsurance Ireland plc. (“SCOR”), pursuant to which SCOR assumed a quota share of 90% of the majority of BBVA Seguros’ single premium and regular premium business in Spain in the Spain operating segment. The gross impact is €630 million, and |
| | – | The earnings from the sale of the pension businesses in Mexico, Colombia, Peru and Chile and also the earnings of these businesses until their sale (€1,866 million net); the capital gain from the sale of BBVA Panama (€230 million gross); and the reduction of the stake in CNCB (which led to the repricing at market value of BBVA’s stake in CNCB, as well as the impact of the equity-adjusted earnings from CNCB, excluding dividends, (negative €2,374 million gross), in the Corporate Center. |
| | – | The badwill generated by the Unnim acquisition (€376 million net), the capital gain from the sale of BBVA Puerto Rico (negative €15 million gross), the earnings from the pension business in Latin America (€392 million net), and the equity-adjusted earnings from CNCB, excluding dividends, (€550 million gross), in the Corporate Center. |
| | – | The earnings from the pension business in Latin America and the equity accounted earning from CNCB (excluding dividends), in the Corporate Center. |
92
| | | | | | | | | | | | | | | | | | | | | | | | | | | | | | | | | | | | | | | | |
| | | For the Year Ended December 31, 2013 | |
| | | Spain | | | Real
estate
activity in
Spain | | | Eurasia | | | Mexico | | | United
States | | | South
America | | | Corporate
center | | | Total | | | Adjustments | | | Group
Income | |
| | | (In Millions of Euros) | |
Net interest income | | | 3,830 | | | | (3 | ) | | | 911 | | | | 4,484 | | | | 1,407 | | | | 4,703 | | | | (719 | ) | | | 14,613 | | | | (713 | ) | | | 13,900 | |
| | | | | | | | | | | | | | | | | | | | | | | | | | | | | | | | | | | | | | | | |
Net fees and commissions | | | 1,376 | | | | 8 | | | | 391 | | | | 1,184 | | | | 557 | | | | 976 | | | | (61 | ) | | | 4,431 | | | | (181 | ) | | | 4,250 | |
Net gains (losses) on financial assets and liabilities and net exchange differences | | | 807 | | | | 67 | | | | 194 | | | | 208 | | | | 139 | | | | 764 | | | | 347 | | | | 2,527 | | | | (16 | ) | | | 2,511 | |
Other operating income and expenses (net) (*) | | | 82 | | | | (111 | ) | | | 225 | | | | 325 | | | | (3 | ) | | | (812 | ) | | | 119 | | | | (175 | ) | | | 472 | | | | 297 | |
Administration costs | | | (2,903 | ) | | | (130 | ) | | | (683 | ) | | | (2,173 | ) | | | (1,296 | ) | | | (2,213 | ) | | | (671 | ) | | | (10,068 | ) | | | 367 | | | | (9,701 | ) |
Depreciation and amortization | | | (111 | ) | | | (23 | ) | | | (51 | ) | | | (163 | ) | | | (179 | ) | | | (173 | ) | | | (434 | ) | | | (1,133 | ) | | | (571 | ) | | | (1,704 | ) |
Impairment losses on financial assets (net) | | | (2,577 | ) | | | (643 | ) | | | (330 | ) | | | (1,439 | ) | | | (78 | ) | | | (701 | ) | | | (8 | ) | | | (5,776 | ) | | | 164 | | | | (5,612 | ) |
Provisions (net) and other gains (losses) | | | (282 | ) | | | (1,008 | ) | | | (65 | ) | | | (64 | ) | | | (14 | ) | | | (157 | ) | | | (80 | ) | | | (1,670 | ) | | | (1,111 | ) | | | (2,781 | ) |
| | | | | | | | | | | | | | | | | | | | | | | | | | | | | | | | | | | | | | | | |
Operating profit/ (loss) before tax | | | 222 | | | | (1,840 | ) | | | 593 | | | | 2,362 | | | | 534 | | | | 2,387 | | | | (1,507 | ) | | | 2,750 | | | | (1,590 | ) | | | 1,160 | |
| | | | | | | | | | | | | | | | | | | | | | | | | | | | | | | | | | | | | | | | |
Income tax | | | (60 | ) | | | 595 | | | | (139 | ) | | | (557 | ) | | | (144 | ) | | | (530 | ) | | | 241 | | | | (593 | ) | | | 547 | | | | (46 | ) |
| | | | | | | | | | | | | | | | | | | | | | | | | | | | | | | | | | | | | | | | |
Profit from continuing operations | | | 163 | | | | (1,245 | ) | | | 454 | | | | 1,805 | | | | 390 | | | | 1,856 | | | | (1,266 | ) | | | 2,158 | | | | (1,044 | ) | | | 1,114 | |
| | | | | | | | | | | | | | | | | | | | | | | | | | | | | | | | | | | | | | | | |
Profit from discontinued operations/ Profit from corporate operations (net) (**) | | | 440 | | | | — | | | | — | | | | — | | | | — | | | | — | | | | 383 | | | | 823 | | | | 1,043 | | | | 1,866 | |
| | | | | | | | | | | | | | | | | | | | | | | | | | | | | | | | | | | | | | | | |
Profit | | | 603 | | | | (1,245 | ) | | | 454 | | | | 1,805 | | | | 390 | | | | 1,856 | | | | (883 | ) | | | 2,981 | | | | — | | | | 2,981 | |
| | | | | | | | | | | | | | | | | | | | | | | | | | | | | | | | | | | | | | | | |
Profit attributable to non-controlling interests | | | (20 | ) | | | (9 | ) | | | — | | | | (1 | ) | | | — | | | | (608 | ) | | | (116 | ) | | | (753 | ) | | | — | | | | (753 | ) |
| | | | | | | | | | | | | | | | | | | | | | | | | | | | | | | | | | | | | | | | |
Profit attributable to parent company | | | 583 | | | | (1,254 | ) | | | 454 | | | | 1,805 | | | | 390 | | | | 1,249 | | | | (999 | ) | | | 2,228 | | | | — | | | | 2,228 | |
| | | | | | | | | | | | | | | | | | | | | | | | | | | | | | | | | | | | | | | | |
| (*) | Includes share of profit or loss of entities accounted for using the equity method. |
| (**) | For Group income this line represents “Profit from discontinued operations” and for operating segments it represents “Profit from corporate operations”. |
| | | | | | | | | | | | | | | | | | | | | | | | | | | | | | | | | | | | | | | | |
| | | For the Year Ended December 31, 2012 | |
| | | Spain | | | Real
estate
activity in
Spain | | | Eurasia | | | Mexico | | | United
States | | | South
America | | | Corporate
center | | | Total | | | Adjustments | | | Group
Income | |
| | | (In Millions of Euros) | |
Net interest income | | | 4,748 | | | | (20 | ) | | | 851 | | | | 4,178 | | | | 1,551 | | | | 4,288 | | | | (473 | ) | | | 15,122 | | | | (648 | ) | | | 14,474 | |
| | | | | | | | | | | | | | | | | | | | | | | | | | | | | | | | | | | | | | | | |
Net fees and commissions | | | 1,342 | | | | 18 | | | | 451 | | | | 1,073 | | | | 581 | | | | 913 | | | | (25 | ) | | | 4,353 | | | | (197 | ) | | | 4,156 | |
Net gains (losses) on financial assets and liabilities and net exchange differences | | | 256 | | | | (29 | ) | | | 131 | | | | 219 | | | | 153 | | | | 443 | | | | 594 | | | | 1,767 | | | | (62 | ) | | | 1,705 | |
Other operating income and expenses (net) (*) | | | 318 | | | | (53 | ) | | | 232 | | | | 286 | | | | (41 | ) | | | (284 | ) | | | 192 | | | | 650 | | | | 839 | | | | 1,489 | |
Administration costs | | | (2,788 | ) | | | (103 | ) | | | (724 | ) | | | (2,033 | ) | | | (1,321 | ) | | | (2,120 | ) | | | (679 | ) | | | (9,768 | ) | | | 372 | | | | (9,396 | ) |
Depreciation and amortization | | | (99 | ) | | | (24 | ) | | | (54 | ) | | | (133 | ) | | | (185 | ) | | | (173 | ) | | | (350 | ) | | | (1,018 | ) | | | (601 | ) | | | (1,619 | ) |
Impairment losses on financial assets (net) | | | (1,853 | ) | | | (3,799 | ) | | | (328 | ) | | | (1,320 | ) | | | (72 | ) | | | (593 | ) | | | (15 | ) | | | (7,980 | ) | | | 121 | | | | (7,859 | ) |
Provisions (net) and other gains (losses) | | | (273 | ) | | | (1,695 | ) | | | (49 | ) | | | (41 | ) | | | (46 | ) | | | (202 | ) | | | (70 | ) | | | (2,377 | ) | | | 1,009 | | | | (1,368 | ) |
| | | | | | | | | | | | | | | | | | | | | | | | | | | | | | | | | | | | | | | | |
Operating profit/ (loss) before tax | | | 1,652 | | | | (5,705 | ) | | | 508 | | | | 2,229 | | | | 619 | | | | 2,271 | | | | (826 | ) | | | 749 | | | | 833 | | | | 1,582 | |
| | | | | | | | | | | | | | | | | | | | | | | | | | | | | | | | | | | | | | | | |
Income tax | | | (487 | ) | | | 1,659 | | | | (105 | ) | | | (539 | ) | | | (177 | ) | | | (494 | ) | | | 418 | | | | 276 | | | | 76 | | | | 352 | |
| | | | | | | | | | | | | | | | | | | | | | | | | | | | | | | | | | | | | | | | |
Profit from continuing operations | | | 1,165 | | | | (4,046 | ) | | | 404 | | | | 1,690 | | | | 442 | | | | 1,777 | | | | (408 | ) | | | 1,024 | | | | 910 | | | | 1,934 | |
| | | | | | | | | | | | | | | | | | | | | | | | | | | | | | | | | | | | | | | | |
Profit from discontinued operations/ Profit from corporate operations (net) (**) | | | — | | | | — | | | | — | | | | — | | | | — | | | | — | | | | 1,303 | | | | 1,303 | | | | (910 | ) | | | 393 | |
| | | | | | | | | | | | | | | | | | | | | | | | | | | | | | | | | | | | | | | | |
Profit | | | 1,165 | | | | (4,046 | ) | | | 404 | | | | 1,690 | | | | 442 | | | | 1,777 | | | | 895 | | | | 2,327 | | | | — | | | | 2,327 | |
| | | | | | | | | | | | | | | | | | | | | | | | | | | | | | | | | | | | | | | | |
Profit attributable to non-controlling interests | | | (3 | ) | | | 3 | | | | — | | | | (1 | ) | | | — | | | | (578 | ) | | | (72 | ) | | | (651 | ) | | | — | | | | (651 | ) |
| | | | | | | | | | | | | | | | | | | | | | | | | | | | | | | | | | | | | | | | |
Profit attributable to parent company | | | 1,162 | | | | (4,044 | ) | | | 404 | | | | 1,689 | | | | 443 | | | | 1,199 | | | | 823 | | | | 1,676 | | | | — | | | | 1,676 | |
| | | | | | | | | | | | | | | | | | | | | | | | | | | | | | | | | | | | | | | | |
| (*) | Includes share of profit or loss of entities accounted for using the equity method. |
| (**) | For Group income this line represents “Profit from discontinued operations” and for operating segments it represents “Profit from corporate operations”. |
93
| | | | | | | | | | | | | | | | | | | | | | | | | | | | | | | | | | | | | | | | |
| | | For the Year Ended December 31, 2011 | |
| | | Spain | | | Real
estate
activity in
Spain | | | Eurasia | | | Mexico | | | United
States | | | South
America | | | Corporate
center | | | Total | | | Adjustments | | | Group
Income | |
| | | (In Millions of Euros) | |
Net interest income | | | 4,248 | | | | 104 | | | | 806 | | | | 3,782 | | | | 1,518 | | | | 3,159 | | | | (465 | ) | | | 13,152 | | | | (428 | ) | | | 12,724 | |
| | | | | | | | | | | | | | | | | | | | | | | | | | | | | | | | | | | | | | | | |
Net fees and commissions | | | 1,291 | | | | 22 | | | | 391 | | | | 1,015 | | | | 611 | | | | 722 | | | | (21 | ) | | | 4,031 | | | | (137 | ) | | | 3,894 | |
Net gains (losses) on financial assets and liabilities and net exchange differences | | | 238 | | | | 12 | | | | 114 | | | | 296 | | | | 132 | | | | 485 | | | | 204 | | | | 1,481 | | | | (1 | ) | | | 1,480 | |
Other operating income and expenses (net) (*) | | | 468 | | | | (14 | ) | | | 156 | | | | 229 | | | | (79 | ) | | | (267 | ) | | | 371 | | | | 864 | | | | 678 | | | | 1,542 | |
Administration costs | | | (2,737 | ) | | | (88 | ) | | | (602 | ) | | | (1,826 | ) | | | (1,253 | ) | | | (1,732 | ) | | | (659 | ) | | | (8,898 | ) | | | 264 | | | | (8,634 | ) |
Depreciation and amortization | | | (101 | ) | | | (13 | ) | | | (44 | ) | | | (105 | ) | | | (166 | ) | | | (152 | ) | | | (259 | ) | | | (839 | ) | | | (474 | ) | | | (1,313 | ) |
Impairment losses on financial assets (net) | | | (1,619 | ) | | | (481 | ) | | | (111 | ) | | | (1,180 | ) | | | (320 | ) | | | (449 | ) | | | (66 | ) | | | (4,226 | ) | | | 41 | | | | (4,185 | ) |
Provisions (net) and other gains (losses) | | | (274 | ) | | | (757 | ) | | | 13 | | | | (59 | ) | | | (1,496 | ) | | | (89 | ) | | | 44 | | | | (2,618 | ) | | | 508 | | | | (2,110 | ) |
| | | | | | | | | | | | | | | | | | | | | | | | | | | | | | | | | | | | | | | | |
Operating profit/ (loss) before tax | | | 1,515 | | | | (1,216 | ) | | | 722 | | | | 2,153 | | | | (1,053 | ) | | | 1,677 | | | | (852 | ) | | | 2,946 | | | | 452 | | | | 3,398 | |
| | | | | | | | | | | | | | | | | | | | | | | | | | | | | | | | | | | | | | | | |
Income tax | | | (438 | ) | | | 405 | | | | (159 | ) | | | (514 | ) | | | 340 | | | | (346 | ) | | | 505 | | | | (206 | ) | | | 48 | | | | (158 | ) |
| | | | | | | | | | | | | | | | | | | | | | | | | | | | | | | | | | | | | | | | |
Profit from continuing operations | | | 1,077 | | | | (810 | ) | | | 563 | | | | 1,639 | | | | (713 | ) | | | 1,332 | | | | (347 | ) | | | 2,740 | | | | 500 | | | | 3,240 | |
| | | | | | | | | | | | | | | | | | | | | | | | | | | | | | | | | | | | | | | | |
Profit from discontinued operations/ Profit from corporate operations (net) (**) | | | 1 | | | | 1 | | | | — | | | | — | | | | 1 | | | | — | | | | 745 | | | | 748 | | | | (503 | ) | | | 245 | |
| | | | | | | | | | | | | | | | | | | | | | | | | | | | | | | | | | | | | | | | |
Profit | | | 1,077 | | | | (810 | ) | | | 563 | | | | 1,639 | | | | (713 | ) | | | 1,332 | | | | 398 | | | | 3,485 | | | | — | | | | 3,485 | |
| | | | | | | | | | | | | | | | | | | | | | | | | | | | | | | | | | | | | | | | |
Profit attributable to non-controlling interests | | | (2 | ) | | | 2 | | | | 1 | | | | (1 | ) | | | — | | | | (434 | ) | | | (47 | ) | | | (481 | ) | | | — | | | | (481 | ) |
| | | | | | | | | | | | | | | | | | | | | | | | | | | | | | | | | | | | | | | | |
Profit attributable to parent company | | | 1,075 | | | | (809 | ) | | | 563 | | | | 1,638 | | | | (713 | ) | | | 898 | | | | 351 | | | | 3,004 | | | | — | | | | 3,004 | |
| | | | | | | | | | | | | | | | | | | | | | | | | | | | | | | | | | | | | | | | |
| (*) | Includes share of profit or loss of entities accounted for using the equity method. |
| (**) | For Group income this line represents “Profit from discontinued operations” and for operating segments it represents “Profit from corporate operations”. |
94
Results of Operations by Operating Segment for 2013 Compared to 2012
SPAIN
| | | | | | | | | | | | |
| | | Year Ended
December 31, | | | | |
| | | 2013 | | | 2012 | | | Change | |
| | | (In Millions of Euros) | | | (In %) | |
| | | |
Net interest income | | | 3,830 | | | | 4,748 | | | | (19.3 | ) |
| | | | | | | | | | | | |
Net fees and commissions | | | 1,376 | | | | 1,342 | | | | 2.5 | |
Net gains (losses) on financial assets and liabilities and net exchange differences | | | 807 | | | | 256 | | | | 215.2 | |
Other operating income and expenses (net) | | | 82 | | | | 318 | | | | (74.2 | ) |
| | | |
Administration costs | | | (2,903 | ) | | | (2,788 | ) | | | 4.1 | |
Depreciation and amortization | | | (111 | ) | | | (99 | ) | | | 12.2 | |
Impairment losses on financial assets (net) | | | (2,577 | ) | | | (1,853 | ) | | | 39.1 | |
Provisions (net) and other gains (losses) | | | (282 | ) | | | (273 | ) | | | 3.3 | |
| | | | | | | | | | | | |
Operating profit before tax | | | 222 | | | | 1,652 | | | | (86.5 | ) |
| | | | | | | | | | | | |
Income tax | | | (60 | ) | | | (487 | ) | | | (87.8 | ) |
| | | | | | | | | | | | |
Profit from continuing operations | | | 163 | | | | 1,165 | | | | (86.0 | ) |
| | | | | | | | | | | | |
Profit from corporate operations (net) | | | 440 | | | | — | | | | n.m. | (1) |
| | | | | | | | | | | | |
Profit | | | 603 | | | | 1,165 | | | | (48.3 | ) |
| | | | | | | | | | | | |
Profit attributable to non-controlling interests | | | (20 | ) | | | (3 | ) | | | n.m. | (1) |
| | | | | | | | | | | | |
Profit attributable to parent company | | | 583 | | | | 1,162 | | | | (49.8 | ) |
| | | | | | | | | | | | |
Net interest income
Net interest income of this operating segment for 2013 was €3,830 million, a 19.3% decrease compared to the €4,748 million recorded for 2012, as a result of reduced lending activity and narrow spreads due to current environment of low rates and the impact of the elimination of the mortgage floor clauses.
Net fees and commissions
Net fees and commissions of this operating segment amounted to €1,376 million for 2013, a 2.5% increase from the €1,342 million recorded for 2012, primarily due to the greater contribution from fees and commissions from mutual and pension funds, as well as those from the activity with customers in wholesale banking transactions.
Net gains (losses) on financial assets and liabilities and net exchange differences
Net gains (losses) on financial assets and liabilities and net exchange differences of this operating segment for 2013 was a gain of €807 million compared with the €256 million gain recorded for 2012, mainly due to the favorable performance of Spain’s Global Markets unit.
Other operating income and expenses (net)
Other operating income and expenses (net) of this operating segment for 2013 was a gain of €82 million, a 74.2% decrease from the €318 million gain recorded for 2012, primarily due to increased contributions to the Deposit Guarantee Fund and the lower revenue from dividends received from financial assets held for trading.
95
Administration costs
Administration costs of this operating segment for 2013 were €2,903 million, a 4.1% increase from the €2,788 million recorded for 2012, primarily due to an increase in general and personnel expenses due to the incorporation of Unnim at the end of July 2012.
Impairment losses on financial assets (net)
Impairment losses on financial assets (net) of this operating segment for 2013 was €2,577 million, a 39.1% increase from the €1,853 million recorded for 2012 which is mainly attributable to the increase in loan-loss provisions for restructured loans. This operating segment’s non-performing assets ratio increased to 6.4% as of December 31, 2013, from 4.1% as of December 31, 2012.
Operating profit before tax
As a result of the foregoing, the operating profit before tax of this operating segment for 2013 was €222 million, compared with operating profit before tax of €1,652 million recorded in 2012.
Income tax
Income tax of this operating segment for 2013 was an expense of €60 million, compared with a €487 million expense recorded in 2012, primarily as a result of the lower operating profit before tax.
Profit from corporate operations (net)
Profit from corporate operations for this operating segment for 2013 was a gain of €440 million compared with no gain or loss for 2012, due to the capital gain generated by the VIF (Value of In-Force) monetization transaction entered into by BBVA Seguros and SCOR Global Life Reinsurance Ireland plc. (“SCOR”), pursuant to which SCOR assumed a quota share of 90% of the majority of BBVA Seguros’ single premium and regular premium business in Spain (consisting mainly of life risk insurance policies).
Profit attributable to parent company
As a result of the foregoing, profit attributable to parent company of this operating segment for 2013 was €583 million, a 49.8% decrease from the €1,162 million recorded in 2012.
96
REAL ESTATE ACTIVITY IN SPAIN
| | | | | | | | | | | | |
| | | Year Ended
December 31, | | | | |
| | | 2013 | | | 2012 | | | Change | |
| | | (In Millions of Euros) | | | (In %) | |
| | | |
Net interest income | | | (3 | ) | | | (20 | ) | | | (87.1 | ) |
| | | | | | | | | | | | |
Net fees and commissions | | | 8 | | | | 18 | | | | (54.0 | ) |
Net gains (losses) on financial assets and liabilities and net exchange differences | | | 67 | | | | (29 | ) | | | n.m. | (1) |
Other operating income and expenses (net) | | | (111 | ) | | | (53 | ) | | | n.m. | (1) |
Administration costs | | | (130 | ) | | | (103 | ) | | | 26.3 | |
| | | |
Depreciation and amortization | | | (23 | ) | | | (24 | ) | | | (4.7 | ) |
Impairment losses on financial assets (net) | | | (643 | ) | | | (3,799 | ) | | | (83.1 | ) |
Provisions (net) and other gains (losses) | | | (1,008 | ) | | | (1,695 | ) | | | (40.6 | ) |
| | | | | | | | | | | | |
Operating profit/loss before tax | | | (1,840 | ) | | | (5,705 | ) | | | (67.7 | ) |
| | | | | | | | | | | | |
Income tax | | | 595 | | | | 1,659 | | | | (64.1 | ) |
| | | | | | | | | | | | |
Profit from continuing operations | | | (1,245 | ) | | | (4,046 | ) | | | (69.2 | ) |
| | | | | | | | | | | | |
Profit from corporate operations (net) | | | — | | | | — | | | | n.m. | (1) |
| | | | | | | | | | | | |
Profit | | | (1,245 | ) | | | (4,046 | ) | | | (69.2 | ) |
| | | | | | | | | | | | |
Profit attributable to non-controlling interests | | | (9 | ) | | | 3 | | | | n.m. | (1) |
| | | | | | | | | | | | |
Profit attributable to parent company | | | (1,254 | ) | | | (4,044 | ) | | | (69.0 | ) |
| | | | | | | | | | | | |
Net interest income
Net interest income of this operating segment for 2013 was a loss of €3 million, an 87.1% decrease compared to the €20 million loss recorded for 2012 mainly as a result of a decrease in interest expense and similar charges.
Net fees and commissions
Net fees and commissions of this operating segment amounted to €8 million for 2013, a 54.0% decrease from the €18 million recorded for 2012.
Net gains (losses) on financial assets and liabilities and net exchange differences
Net gains (losses) on financial assets and liabilities and net exchange differences of this operating segment for 2013 was a gain of €67 million compared with the €29 million loss recorded for 2012 mainly as a result of the development during 2013 of a policy of divestment of non-real estate investments aimed to take advantage of the more favorable market situation.
Other operating income and expenses (net)
Other operating income and expenses (net) of this operating segment for 2013 was a loss of €111 million compared to the €53 million loss recorded for 2012, as a result of the higher level of foreclosed assets which resulted in higher maintenance costs than in the prior year.
Administration costs
Administration costs of this operating segment for 2013 were €130 million, a 26.3% increase from the €103 million recorded for 2012, primarily due to increased personnel expenses, as a result of the allocation of additional staff to this segment in order to carry out its activity.
Impairment losses on financial assets (net)
Impairment losses on financial assets (net) of this operating segment for 2013 was €643 million, an 83.1% decrease from the €3,799 million recorded for 2012 which is mainly attributable to the existence of lower losses in the real estate sector in Spain in 2013.
97
Operating profit / (loss) before tax
As a result of the foregoing, the operating loss before tax of this operating segment for 2013 was €1,840 million, compared with operating loss before tax of €5,705 million recorded in 2012.
Income tax
Income tax of this operating segment for 2013 was a gain of €595 million, a 64.1% decrease compared with a €1,659 million gain recorded in 2012, primarily as a result of the lower operating loss before tax.
Profit / (loss) attributable to parent company
As a result of the foregoing, loss attributable to parent company of this operating segment for 2013 was €1,254 million, a 69.0% decrease from the €4,046 million loss recorded in 2012.
EURASIA
In accordance with IFRS 8, the information for the Eurasia operating segment is presented under management criteria, pursuant to which Garanti’s information has been proportionally integrated based on our 25.01% interest in Garanti.
| | | | | | | | | | | | |
| | | Year Ended
December 31, | | | | |
| | | 2013 | | | 2012 | | | Change | |
| | | (In Millions of Euros) | | | (In %) | |
| | | |
Net interest income | | | 911 | | | | 851 | | | | 7.0 | |
| | | | | | | | | | | | |
Net fees and commissions | | | 391 | | | | 451 | | | | (13.4 | ) |
Net gains (losses) on financial assets and liabilities and net exchange differences | | | 194 | | | | 131 | | | | 47.8 | |
Other operating income and expenses(net) | | | 225 | | | | 232 | | | | (2.7 | ) |
Administration costs | | | (683 | ) | | | (724 | ) | | | (5.8 | ) |
Depreciation and amortization | | | (51 | ) | | | (54 | ) | | | (6.7 | ) |
Impairment losses on financial assets (net) | | | (330 | ) | | | (328 | ) | | | 0.5 | |
Provisions (net) and other gains (losses) | | | (65 | ) | | | (49 | ) | | | 31.5 | |
| | | | | | | | | | | | |
Operating profit before tax | | | 593 | | | | 508 | | | | 16.6 | |
| | | | | | | | | | | | |
Income tax | | | (139 | ) | | | (105 | ) | | | 32.6 | |
| | | | | | | | | | | | |
Profit from continuing operations | | | 454 | | | | 404 | | | | 12.4 | |
| | | | | | | | | | | | |
Profit from corporate operations (net) | | | — | | | | — | | | | n.m. | (1) |
| | | | | | | | | | | | |
Profit | | | 454 | | | | 404 | | | | 12.4 | |
| | | | | | | | | | | | |
Profit attributable to non-controlling interests | | | — | | | | — | | | | n.m. | (1) |
| | | | | | | | | | | | |
Profit attributable to parent company | | | 454 | | | | 404 | | | | 12.4 | |
| | | | | | | | | | | | |
In 2013, the Turkish lira depreciated against the Euro in average terms, resulting in a negative exchange rate effect on our income statement for the year ended December 31, 2013. See “Factors Affecting the Comparability of our Results of Operations and Financial Condition.”
Net interest income
Net interest income of this operating segment for 2013 was €911 million, a 7.0% increase compared to the €851 million recorded for 2012, as a result of increased activity and favorable spreads mainly in Garanti.
Net fees and commissions
Net fees and commissions of this operating segment amounted to €391 million for 2013, a 13.4% decrease from the €451 million recorded for 2012, due to lower revenue from wholesale customers.
98
Net gains (losses) on financial assets and liabilities and net exchange differences
Net gains (losses) on financial assets and liabilities and net exchange differences of this operating segment for 2013 was a gain of €194 million a 47.8% increase compared to the €131 million gain recorded for 2012, mainly due to the earnings from of the Eurasia Global Markets unit.
Other operating income and expenses (net)
Other operating income and expenses (net) of this operating segment for 2013 was a gain of €225 million, a 2.7% decrease from the €232 million gain recorded for 2012.
Administration costs
Administration costs of this operating segment for 2013 were €683 million, a 5.8% decrease from the €724 million recorded for 2012, despite the expansion plans implemented by Garanti throughout the year. Since the close of 2012, the Turkish bank’s branch network has expanded by 65 offices and the ATM network by 495 units, to which the costs arising from the launch of i-Garanti before the summer of 2013 should be added.
Impairment losses on financial assets (net)
Impairment losses on financial assets (net) of this operating segment for 2013 was €330 million, a 0.5% increase from the €328 million recorded for 2012. This operating segment’s non-performing assets ratio increased to 3.4% as of December 31, 2013, from 2.8% as of December 31, 2012.
Operating profit before tax
As a result of the foregoing, the operating profit before tax of this operating segment for 2013 was €593 million, a 16.6% increase from the €508 million recorded for 2012.
Income tax
Income tax of this operating segment for 2013 was an expense of €139 million, a 32.6% increase compared with a €105 million expense recorded in 2012, primarily as a result of the increased operating profit before tax.
Profit attributable to parent company
As a result of the foregoing, profit attributable to parent company of this operating segment for 2013 was €454 million, a 12.4% increase from the €404 million recorded in 2012.
MEXICO
| | | | | | | | | | | | |
| | | Year Ended
December 31, | | | | |
| | | 2013 | | | 2012 | | | Change | |
| | | (In Millions of Euros) | | | (In %) | |
| | | |
Net interest income | | | 4,484 | | | | 4,178 | | | | 7.3 | |
| | | | | | | | | | | | |
| | | |
Net fees and commissions | | | 1,184 | | | | 1,073 | | | | 10.3 | |
Net gains (losses) on financial assets and liabilities and net exchange differences | | | 208 | | | | 219 | | | | (4.6 | ) |
Other operating income and expenses (net) | | | 325 | | | | 286 | | | | 13.4 | |
Administration costs | | | (2,173 | ) | | | (2,033 | ) | | | 6.9 | |
Depreciation and amortization | | | (163 | ) | | | (133 | ) | | | 22.1 | |
Impairment losses on financial assets (net) | | | (1,439 | ) | | | (1,320 | ) | | | 9.0 | |
Provisions (net) and other gains (losses) | | | (64 | ) | | | (41 | ) | | | 56.9 | |
| | | | | | | | | | | | |
Operating profit before tax | | | 2,362 | | | | 2,229 | | | | 5.9 | |
| | | | | | | | | | | | |
Income tax | | | (557 | ) | | | (539 | ) | | | 3.2 | |
| | | | | | | | | | | | |
Profit from continuing operations | | | 1,805 | | | | 1,690 | | | | 6.8 | |
| | | | | | | | | | | | |
Profit from corporate operations (net) | | | — | | | | — | | | | n.m. | (1) |
| | | | | | | | | | | | |
Profit | | | 1,805 | | | | 1,690 | | | | 6.8 | |
| | | | | | | | | | | | |
Profit attributable to non-controlling interests | | | (1 | ) | | | (1 | ) | | | 2.3 | |
| | | | | | | | | | | | |
Profit attributable to parent company | | | 1,805 | | | | 1,689 | | | | 6.8 | |
| | | | | | | | | | | | |
99
In 2013, the Mexican peso slightly depreciated against the Euro in average terms, resulting in a negative exchange rate effect on our income statement for the year ended December 31, 2013. See “Factors Affecting the Comparability of our Results of Operations and Financial Condition.”
Net interest income
Net interest income of this operating segment for 2013 was €4,484 million, a 7.3% increase compared to the €4,178 million recorded for 2012, as a result of an increased activity in lending and funding.
Net fees and commissions
Net fees and commissions of this operating segment amounted to €1,184 million for 2013, a 10.3% increase from the €1,073 million recorded for 2012. This growth in income from fees and commissions has been driven by a larger number of card transactions and the increase in revenue from our participation in market issues by our corporate customers.
Net gains (losses) on financial assets and liabilities and net exchange differences
Net gains (losses) on financial assets and liabilities and net exchange differences of this operating segment for 2013 was a gain of €208 million a 4.6% decrease compared to the €219 million gain recorded for 2012 primarily due to lower earnings from gains on equity instruments and debt instruments.
Other operating income and expenses (net)
Other operating income and expenses (net) of this operating segment for 2013 was a gain of €325 million, a 13.4% increase from the €286 million gain recorded for 2012, due to higher earnings from the insurance business as a result of an increase in activity and a lower level of claims.
Administration costs
Administration costs of this operating segment for 2013 were €2,173 million, a 6.9% increase from the €2,033 million recorded for 2012. This increase is the result of the implementation of the area’s “Investment Plan”, designed to remodel the branch network, the launch of projects for investment in technology and the construction of new corporate headquarters, as well as other strategies aimed at boosting commercial activity.
Impairment losses on financial assets (net)
Impairment losses on financial assets (net) of this operating segment for 2013 was €1,439 million, a 9.0% increase from the €1,320 million recorded for 2012, in line with the growth of the activity in the year. This operating segment’s non-performing assets ratio decreased to 3.6% as of December 31, 2013, from 3.7% as of December 31, 2012.
Operating profit before tax
As a result of the foregoing, the operating profit before tax of this operating segment for 2013 was €2,362 million, a 5.9% increase from the €2,229 million recorded for 2012.
Income tax
Income tax of this operating segment for 2013 was an expense of €557 million, a 3.2% increase compared with a €539 million expense recorded in 2012, as a result of the increased operating profit before tax.
100
Profit attributable to parent company
As a result of the foregoing, profit attributable to parent company of this operating segment for 2013 was €1,805 million, a 6.8% increase from the €1,689 million recorded in 2012.
SOUTH AMERICA
| | | | | | | | | | | | |
| | | Year Ended
December 31, | | | | |
| | | 2013 | | | 2012 | | | Change | |
| | | (In Millions of Euros) | | | (In %) | |
| | | |
Net interest income | | | 4,703 | | | | 4,288 | | | | 9.7 | |
| | | | | | | | | | | | |
| | | |
Net fees and commissions | | | 976 | | | | 913 | | | | 6.9 | |
Net gains (losses) on financial assets and liabilities and net exchange differences | | | 764 | | | | 443 | | | | 72.3 | |
Other operating income and expenses (net) | | | (812 | ) | | | (284 | ) | | | n.m. | (1) |
Administration costs | | | (2,213 | ) | | | (2,120 | ) | | | 4.4 | |
Depreciation and amortization | | | (173 | ) | | | (173 | ) | | | (0.5 | ) |
Impairment losses on financial assets (net) | | | (701 | ) | | | (593 | ) | | | 18.3 | |
Provisions (net) and other gains (losses) | | | (157 | ) | | | (202 | ) | | | (22.6 | ) |
| | | | | | | | | | | | |
Operating profit before tax | | | 2,387 | | | | 2,271 | | | | 5.1 | |
| | | | | | | | | | | | |
Income tax | | | (530 | ) | | | (494 | ) | | | 7.4 | |
| | | | | | | | | | | | |
Profit from continuing operations | | | 1,856 | | | | 1,777 | | | | 4.5 | |
| | | | | | | | | | | | |
Profit from corporate operations (net) | | | — | | | | — | | | | n.m. | (1) |
| | | | | | | | | | | | |
Profit | | | 1,856 | | | | 1,777 | | | | 4.5 | |
| | | | | | | | | | | | |
Profit attributable to non-controlling interests | | | (608 | ) | | | (578 | ) | | | 5.1 | |
| | | | | | | | | | | | |
Profit attributable to parent company | | | 1,249 | | | | 1,199 | | | | 4.1 | |
| | | | | | | | | | | | |
The average exchange rates against the Euro of the currencies of the countries in which we operate in South America, decreased in 2013, resulting in a negative impact on the results of operations of the South America operating segment expressed in Euro. See “-Factors Affecting the Comparability of our Results of Operations and Financial Condition.”
Net interest income
Net interest income of this operating segment for 2013 was €4,703 million, a 9.7% increase compared to the €4,288 million recorded for 2012, mainly due to the increase in volume of customer loans and deposits during the period and the maintenance of customer spreads
Net fees and commissions
Net fees and commissions of this operating segment amounted to €976 million for 2013, a 6.9% increase from the €913 million recorded for 2012, in line with the increased activity in the region. In addition, fees and commissions benefited from a payment by VISA of €16 million in the second quarter of 2013 related to an increase in card usage volumes.
Net gains (losses) on financial assets and liabilities and net exchange differences
Net gains (losses) on financial assets and liabilities and net exchange differences of this operating segment for 2013 was a gain of €764 million a 72.3% increase compared to the €443 million gain recorded for 2012, as a result of the positive effect of exchange differences due to the assets in U.S. dollars in the region.
101
Other operating income and expenses (net)
Other operating income and expenses (net) of this operating segment for 2013 was a loss of €812 million, compared to the €284 million loss recorded for 2012. This line includes basically the adjustment for hyperinflation in Venezuela, which has been more negative in 2013 than in the previous year, and the increased contribution to deposit guarantee funds in the different countries. These two effects have more than offset the good performance of the insurance business in the area.
Administration costs
Administration costs of this operating segment for 2013 were €2,213 million, a 4.4% increase from the €2,120 million recorded for 2012. This increase in expenses is mainly due to two factors: the expansion and technological transformation plans being implemented, and the negative impact of high inflation in the area.
Impairment losses on financial assets (net)
Impairment losses on financial assets (net) of this operating segment for 2013 was €701 million, an 18.3% increase from the €593 million recorded for 2012. Excluding the effect of the recovery of provisions registered in 2012, the increase would be in line with the activity growth in the year. In addition, there was an increase in impairment losses on financial assets in Chile as a result of higher losses recognized in the mortgage portfolio.
This operating segment’s non-performing asset ratio was 2.1% as of December 31, 2013 and 2012.
Operating profit before tax
As a result of the foregoing, the operating profit before tax of this operating segment for 2013 was €2,387 million, a 5.1% increase from the €2,271 million recorded for 2012.
Income tax
Income tax of this operating segment for 2013 was an expense of €530 million, a 7.4% increase compared with a €494 million expense recorded in 2012 as a result of the increased operating profit before tax.
Profit attributable to parent company
As a result of the foregoing, profit attributable to parent company of this operating segment for 2013 was €1,249 million, a 4.1% increase from the €1,199 million recorded in 2012.
UNITED STATES
| | | | | | | | | | | | |
| | | Year Ended
December 31, | | | | |
| | | 2013 | | | 2012 | | | Change | |
| | | (In Millions of Euros) | | | (In %) | |
| | | |
Net interest income | | | 1,407 | | | | 1,551 | | | | (9.3 | ) |
| | | | | | | | | | | | |
Net fees and commissions | | | 557 | | | | 581 | | | | (4.0 | ) |
Net gains (losses) on financial assets and liabilities and net exchange differences | | | 139 | | | | 153 | | | | (8.6 | ) |
Other operating income and expenses (net) | | | (3 | ) | | | (41 | ) | | | (93.9 | ) |
Administration costs | | | (1,296 | ) | | | (1,321 | ) | | | (1.9 | ) |
Depreciation and amortization | | | (179 | ) | | | (185 | ) | | | (3.0 | ) |
Impairment losses on financial assets (net) | | | (78 | ) | | | (72 | ) | | | 8.7 | |
Provisions (net) and other gains (losses) | | | (14 | ) | | | (46 | ) | | | (69.1 | ) |
| | | | | | | | | | | | |
Operating profit before tax | | | 534 | | | | 619 | | | | (13.7 | ) |
| | | | | | | | | | | | |
Income tax | | | (144 | ) | | | (177 | ) | | | (18.5 | ) |
| | | | | | | | | | | | |
Profit from continuing operations | | | 390 | | | | 442 | | | | (11.8 | ) |
| | | | | | | | | | | | |
Profit from corporate operations (net) | | | — | | | | — | | | | n.m. | (1) |
| | | | | | | | | | | | |
Profit | | | 390 | | | | 442 | | | | (11.8 | ) |
| | | | | | | | | | | | |
Profit attributable to non-controlling interests | | | — | | | | — | | | | n.m. | (1) |
| | | | | | | | | | | | |
Profit attributable to parent company | | | 390 | | | | 442 | | | | (11.8 | ) |
| | | | | | | | | | | | |
102
In 2013 the U.S. dollar depreciated against the Euro in average terms, resulting in a negative exchange rate effect on our income statement. See “-Factors Affecting the Comparability of our Results of Operations and Financial Condition.”
Net interest income
Net interest income of this operating segment for 2013 was €1,407 million, a 9.3% decrease compared to the €1,551 million recorded for 2012, mainly due to the low interest rates, which offset the positive effect of improved activity over the year.
Net fees and commissions
Net fees and commissions of this operating segment amounted to €557 million for 2013, a 4.0% decrease from the €581 million recorded for 2012. Fees and commissions have been strongly influenced by the coming into force of restrictive regulations on fees and commissions and the sale of our insurance business in 2012, which have had a negative impact.
Net gains (losses) on financial assets and liabilities and net exchange differences
Net gains (losses) on financial assets and liabilities and net exchange differences of this operating segment for 2013 was a gain of €139 million an 8.6% decrease compared to the €153 million gain recorded for 2012. This decrease was mainly attributable to lower earnings from gains on derivatives and customer deposits.
Other operating income and expenses (net)
Other operating income and expenses (net) of this operating segment for 2013 was a loss of €3 million, compared to the €41 million loss recorded for 2012, mainly due to lower contributions to the Federal Deposit Insurance Corporation (FDIC) resulting from the lowering of the contribution requirements.
Administration costs
Administration costs of this operating segment for 2013 were €1,296 million, a 1.9% decrease from the €1,321 million recorded for 2012.
Impairment losses on financial assets (net)
Impairment losses on financial assets (net) of this operating segment for 2013 was €78 million, an 8.7% increase from the €72 million recorded for 2012, mainly due to the absence of recoveries, unlike in 2012. This operating segment’s non-performing assets ratio decreased to 1.2% as of December 31, 2013, from 2.4% as of December 31, 2012.
Operating profit before tax
As a result of the foregoing, the operating profit before tax of this operating segment for 2013 was €534 million, a 13.7% decrease from the €619 million recorded for 2012.
Income tax
Income tax of this operating segment for 2013 was an expense of €144 million, an 18.5% decrease compared with a €177 million expense recorded in 2012, due to lower profit before tax.
103
Profit attributable to parent company
As a result of the foregoing, profit attributable to parent company of this operating segment for 2013 was €390 million, an 11.8% decrease from the €443 million recorded in 2012.
CORPORATE CENTER
| | | | | | | | | | | | |
| | | Year Ended
December 31, | | | | |
| | | 2013 | | | 2012 | | | Change | |
| | | (In Millions of Euros) | | | (In %) | |
| | | |
Net interest income | | | (719 | ) | | | (473 | ) | | | 51.9 | |
| | | | | | | | | | | | |
Net fees and commissions | | | (61 | ) | | | (25 | ) | | | 142.4 | |
Net gains (losses) on financial assets and liabilities and net exchange differences | | | 347 | | | | 594 | | | | (41.6 | ) |
Other operating income and expenses (net) | | | 119 | | | | 192 | | | | (38.2 | ) |
Administration costs | | | (671 | ) | | | (679 | ) | | | (1.2 | ) |
Depreciation and amortization | | | (434 | ) | | | (350 | ) | | | 24.1 | |
Impairment losses on financial assets (net) | | | (8 | ) | | | (15 | ) | | | (48.5 | ) |
Provisions (net) and other gains (losses) | | | (80 | ) | | | (70 | ) | | | 14.6 | |
| | | | | | | | | | | | |
Operating profit/loss before tax | | | (1,507 | ) | | | (826 | ) | | | 82.3 | |
| | | | | | | | | | | | |
Income tax | | | 241 | | | | 418 | | | | (42.4 | ) |
| | | | | | | | | | | | |
Profit/loss from continuing operations | | | (1,266 | ) | | | (408 | ) | | | n.m. | (1) |
| | | | | | | | | | | | |
Profit from corporate operations (net) | | | 383 | | | | 1,303 | | | | (70.6 | ) |
| | | | | | | | | | | | |
Profit/loss | | | (883 | ) | | | 895 | | | | n.m. | (1) |
| | | | | | | | | | | | |
Profit/loss attributable to non-controlling interests | | | (116 | ) | | | (72 | ) | | | 60.8 | |
| | | | | | | | | | | | |
Profit/loss attributable to parent company | | | (999 | ) | | | 823 | | | | n.m. | (1) |
| | | | | | | | | | | | |
Net interest income
Net interest income of this operating segment for 2013 was a loss of €719 million, a 51.9% increase compared to the €473 million loss recorded for 2012. Net interest income has been negatively affected by the rising cost of wholesale finance resulting from the instability in the Euro zone area throughout 2012, which had a negative impact in our interest expenses for the year ended December 31, 2013 as a result of the wholesale funding raised in 2012.
Net fees and commissions
Net fees and commissions of this operating segment amounted to a loss of €61 million for 2013 compared to a loss of €25 million recorded for 2012.
Net gains (losses) on financial assets and liabilities and net exchange differences
Net gains (losses) on financial assets and liabilities and net exchange differences of this operating segment for 2013 was a gain of €347 million a 41.6% decrease compared to the €594 million gain recorded for 2012, primarily as a result of lower net trading income.
Other operating income and expenses (net)
Other operating income and expenses (net) of this operating segment for 2013 was a gain of €119 million, a 38.2% decrease compared to the €192 million gain recorded for 2012, due mainly to the lower revenue from dividends received from Telefónica, S.A., which decreased from €0.53 per share in 2012 to €0.35 per share in 2013.
104
Administration costs
Administration costs of this operating segment for 2013 were €671 million, a 1.2% decrease from the €679 million recorded for 2012.
Impairment losses on financial assets (net)
Impairment losses on financial assets (net) of this operating segment for 2013 was €8 million, a 48.5% decrease compared to the €15 million recorded for 2012.
Operating profit / (loss) before tax
As a result of the foregoing, the operating loss before tax of this operating segment for 2013 was €1,507 million, an 82.3% increase from the €826 million loss recorded for 2012.
Income tax
Income tax of this operating segment for 2013 was a gain of €241 million, a 42.4% decrease compared with a €418 million gain recorded in 2012 mainly as a result of lower revenues with low or zero taxes.
Profit from corporate operations (net)
Profit from corporate operations for this operating segment for 2013 was a gain of €383 million compared with a gain of €1,303 million for 2012. This heading comprises the following items: (i) with respect to 2013, the earnings from the sale of the pension businesses in Mexico, Colombia, Peru and Chile and also the earnings of these businesses until their sale; the capital gain from the sale of BBVA Panama; and the impact of the signing of the new agreement with the CITIC Group (which led to the repricing at market value of BBVA’s stake in CNCB, as well our accounting of as the equity-adjusted earnings from CNCB, excluding dividends), and (ii) with respect to 2012, the badwill generated by the Unnim acquisition; the earnings of the sale of BBVA Puerto Rico; the earnings from the pension business in Latin America and the equity-adjusted earnings from CNCB (excluding dividends).
Profit / (loss) attributable to parent company
As a result of the foregoing, loss attributable to parent company of this operating segment for 2013 was €999 million compared to a profit of €823 million recorded in 2012.
Results of Operations by Operating Segment for 2012 Compared to 2011
SPAIN
| | | | | | | | | | | | |
| | | Year Ended
December 31, | | | | |
| | | 2012 | | | 2011 | | | Change | |
| | | (In Millions of Euros) | | | (In %) | |
| | | |
Net interest income | | | 4,748 | | | | 4,248 | | | | 11.8 | |
| | | | | | | | | | | | |
Net fees and commissions | | | 1,342 | | | | 1,291 | | | | 4.0 | |
Net gains (losses) on financial assets and liabilities and net exchange differences | | | 256 | | | | 238 | | | | 7.6 | |
Other operating income and expenses (net) | | | 318 | | | | 468 | | | | (32.0 | ) |
| | | |
Administration costs | | | (2,788 | ) | | | (2,737 | ) | | | 1.9 | |
Depreciation and amortization | | | (99 | ) | | | (101 | ) | | | (1.3 | ) |
Impairment losses on financial assets (net) | | | (1,853 | ) | | | (1,619 | ) | | | 14.4 | |
Provisions (net) and other gains (losses) | | | (273 | ) | | | (274 | ) | | | (0.6 | ) |
| | | | | | | | | | | | |
Operating profit before tax | | | 1,652 | | | | 1,515 | | | | 9.1 | |
| | | | | | | | | | | | |
Income tax | | | (487 | ) | | | (438 | ) | | | 11.2 | |
| | | | | | | | | | | | |
Profit from continuing operations | | | 1,165 | | | | 1,077 | | | | 8.2 | |
| | | | | | | | | | | | |
Profit from corporate operations (net) | | | — | | | | 1 | | | | n.m. | (1) |
| | | | | | | | | | | | |
Profit | | | 1,165 | | | | 1,077 | | | | 8.2 | |
| | | | | | | | | | | | |
Profit attributable to non-controlling interests | | | (3 | ) | | | (2 | ) | | | 47.1 | |
| | | | | | | | | | | | |
Profit attributable to parent company | | | 1,162 | | | | 1,075 | | | | 8.1 | |
| | | | | | | | | | | | |
105
Spain’s income statement for 2012 was adversely affected by the significant loan-loss provisions made to reflect the steady impairment of our real estate portfolios. The acquisition of Unnim in July 2012 had a non-material impact on the performance of this area.
Net interest income
Net interest income of this operating segment for 2012 was €4,748 million, an 11.8% increase compared to the €4,248 million recorded for 2011, due mainly to the reduction of the cost of deposits that more than offset the decrease in income from loans.
Net fees and commissions
Net fees and commissions of this operating segment amounted to €1,342 million for 2012, a 4.0% increase from the €1,291 million recorded for 2011, primarily due to an increase in securities services income.
Net gains (losses) on financial assets and liabilities and net exchange differences
Net gains (losses) on financial assets and liabilities and net exchange differences of this operating segment for 2012 was a gain of €256 million, a 7.6% increase compared to the €238 million gain recorded for 2011, mainly due to the higher net gains on financial assets which were partially offset by the negative effect of exchanges differences.
Other operating income and expenses (net)
Other operating income and expenses (net) of this operating segment for 2012 was a gain of €318 million, a 32% decrease from the €468 million gain recorded for 2011, primarily due to increased contributions to the Deposit Guarantee Fund.
Administration costs
Administration costs of this operating segment for 2012 were €2,788 million, a 1.9% increase from the €2,737 million recorded for 2011, primarily due to an increase in general and personnel expenses due to the acquisition of Unnim.
Impairment losses on financial assets (net)
Impairment losses on financial assets (net) of this operating segment for 2012 was €1,853 million, a 14.4% increase from the €1,619 million recorded for 2011 mainly due to the deterioration of economic conditions in Spain. This operating segment’s non-performing assets ratio increased to 4.05% as of December 31, 2012, from 3.06% as of December 31, 2011, due to the increase in impaired loans which was partially offset by a decrease in loans and advances to customers.
Provisions (net) and other gains (losses)
Provisions (net) and other gains (losses) for 2012 was an expense of €273 million, a 0.6% decrease from the €274 million expense recorded in 2011.
Operating profit / (loss) before tax
As a result of the foregoing, the operating loss before tax of this operating segment for 2012 was €1,652 million, compared with operating profit before tax of €1,515 million recorded in 2011.
106
Income tax
Income tax of this operating segment for 2012 was €487 million, an 11.2% increase from the €438 million expense recorded in 2011.
Profit attributable to parent company
As a result of the foregoing, profit attributable to parent company of this operating segment for 2012 was a gain of €1,162 million, an 8.1% increase from the €1,075 million recorded in 2011.
REAL ESTATE ACTIVITY IN SPAIN
| | | | | | | | | | | | |
| | | Year Ended
December 31, | | | | |
| | | 2012 | | | 2011 | | | Change | |
| | | (In Millions of Euros) | | | (In %) | |
| | | |
Net interest income | | | (20 | ) | | | 104 | | | | n.m. | (1) |
| | | | | | | | | | | | |
Net fees and commissions | | | 18 | | | | 22 | | | | (17.4 | ) |
Net gains (losses) on financial assets and liabilities and net exchange differences | | | (29 | ) | | | 12 | | | | n.m. | (1) |
Other operating income and expenses(net) | | | (53 | ) | | | (14 | ) | | | 294.5 | |
Administration costs | | | (103 | ) | | | (88 | ) | | | 16.8 | |
| | | |
Depreciation and amortization | | | (24 | ) | | | (13 | ) | | | 83.2 | |
Impairment losses on financial assets (net) | | | (3,799 | ) | | | (481 | ) | | | n.m. | (1) |
Provisions (net) and other gains (losses) | | | (1,695 | ) | | | (757 | ) | | | 123.8 | |
| | | | | | | | | | | | |
Operating profit before tax | | | (5,705 | ) | | | (1,216 | ) | | | n.m. | (1) |
| | | | | | | | | | | | |
Income tax | | | 1,659 | | | | 405 | | | | n.m. | (1) |
| | | | | | | | | | | | |
Profit from continuing operations | | | (4,046 | ) | | | (810 | ) | | | n.m. | (1) |
| | | | | | | | | | | | |
Profit from corporate operations (net) | | | — | | | | 1 | | | | n.m. | (1) |
| | | | | | | | | | | | |
Profit | | | (4,046 | ) | | | (810 | ) | | | n.m. | (1) |
| | | | | | | | | | | | |
Profit attributable to non-controlling interests | | | 3 | | | | 2 | | | | 45.6 | |
| | | | | | | | | | | | |
Profit attributable to parent company | | | (4,044 | ) | | | (809 | ) | | | n.m. | (1) |
| | | | | | | | | | | | |
Net interest income
Net interest income of this operating segment for 2012 was an expense of €20 million, compared to an income of €104 million recorded for 2011.
Net fees and commissions
Net fees and commissions of this operating segment amounted to €18 million for 2012, a 17.4% decrease from the €22 million recorded for 2011.
Net gains (losses) on financial assets and liabilities and net exchange differences
Net gains (losses) on financial assets and liabilities and net exchange differences of this operating segment for 2012 was a loss of €29 million compared with the €12 million gain recorded for 2011, mainly due to the losses on financial assets.
Other operating income and expenses (net)
Other operating income and expenses (net) of this operating segment for 2012 was a loss of €53 million, compared to the loss of €14 million recorded for 2011.
107
Administration costs
Administration costs of this operating segment for 2012 were €103 million, a 16.8% increase from the €88 million recorded for 2011.
Impairment losses on financial assets (net)
Impairment losses on financial assets (net) of this operating segment for 2012 was €3,799 million, compared to the €481 million recorded for 2011. This increase was mainly attributable to the impairment of assets related to the real estate sector as a result of the deterioration of economic conditions in Spain.
Provisions (net) and other gains (losses)
Provisions (net) and other gains (losses) for 2012 was an expense of €1,695 million, compared to the €757 million expense recorded in 2011, primarily due to an increase in provisions for foreclosed assets and real estate assets as a result of the deterioration of economic conditions in Spain.
Operating profit / (loss) before tax
As a result of the foregoing, the operating loss before tax of this operating segment for 2012 was €5,705 million, compared with operating loss before tax of €1,216 million recorded in 2011.
Income tax
Income tax of this operating segment for 2012 was a benefit of €1,659 million, compared to the €405 million benefit recorded in 2011, primarily as a result of the increase in the operating loss before tax.
Profit attributable to parent company
As a result of the foregoing, profit attributable to parent company of this operating segment for 2012 was a loss of €4,044 million, compared to the €809 million recorded in 2011.
EURASIA
In accordance with IFRS 8, the information for the Eurasia operating segment is presented under management criteria, pursuant to which Garanti’s information has been proportionally integrated based on our 25.01% interest in Garanti.
| | | | | | | | | | | | |
| | | Year Ended
December 31, | | | | |
| | | 2012 | | | 2011 | | | Change | |
| | | (In Millions of
Euros) | | | (In %) | |
| | | |
Net interest income | | | 851 | | | | 806 | | | | 5.5 | |
| | | | | | | | | | | | |
Net fees and commissions | | | 451 | | | | 391 | | | | 15.4 | |
Net gains (losses) on financial assets and liabilities and net exchange differences | | | 131 | | | | 114 | | | | 14.9 | |
Other operating income and expenses(net) | | | 232 | | | | 156 | | | | 48.8 | |
Administration costs | | | (724 | ) | | | (602 | ) | | | 20.3 | |
Depreciation and amortization | | | (54 | ) | | | (44 | ) | | | 23.7 | |
Impairment losses on financial assets (net) | | | (328 | ) | | | (111 | ) | | | 195.5 | |
Provisions (net) and other gains (losses) | | | (49 | ) | | | 13 | | | | n.m. | (1) |
| | | | | | | | | | | | |
Operating profit before tax | | | 508 | | | | 722 | | | | (29.6 | ) |
| | | | | | | | | | | | |
Income tax | | | (105 | ) | | | (159 | ) | | | (34.2 | ) |
| | | | | | | | | | | | |
Profit from continuing operations | | | 404 | | | | 563 | | | | (28.3 | ) |
| | | | | | | | | | | | |
Profit from corporate operations (net) | | | — | | | | — | | | | n.m. | (1) |
| | | | | | | | | | | | |
Profit | | | 404 | | | | 563 | | | | (28.3 | ) |
| | | | | | | | | | | | |
Profit attributable to non-controlling interests | | | — | | | | 1 | | | | n.m. | (1) |
| | | | | | | | | | | | |
Profit attributable to parent company | | | 404 | | | | 563 | | | | (28.3 | ) |
| | | | | | | | | | | | |
108
Net interest income
Net interest income of this operating segment for 2012 was €851 million, a 5.5% increase compared to the €806 million recorded for 2011 primarily due to increased net interest income from Garanti.
Net fees and commissions
Net fees and commissions of this operating segment amounted to €451 million for 2012, a 15.4% increase from the €391 million recorded for 2011 primarily due to increased net fees and commissions from Garanti.
Net gains (losses) on financial assets and liabilities and net exchange differences
Net gains on financial assets and liabilities and net exchange differences of this operating segment for 2012 was €131 million, a 14.9% increase compared with the €114 million recorded for 2011, primarily due to the positive impact of exchange rates.
Other operating income and expenses (net)
Other operating income and expenses (net) of this operating segment for 2012 was a gain of €232 million, a 48.8% increase from the €156 million gain recorded for 2011, primarily due to the increased dividends from CNCB.
Administration costs
Administration costs of this operating segment for 2012 were €724 million, a 20.3% increase over the €602 million recorded for 2011, primarily due to the Garanti.
Impairment losses on financial assets (net)
Impairment losses on financial assets (net) of this operating segment for 2012 was €328 million, a 195.5% increase from the €111 million recorded for 2011 due to the loan-loss provisions made in Portugal due to the ongoing deterioration of the economic situation. The operating segment’s non-performing assets ratio increased to 2.8% as of December 31, 2012 from 1.5% as of December 31, 2011.
Operating profit before tax
As a result of the foregoing, operating profit before tax of this operating segment for 2012 was €508 million, a 29.6% decrease from the €722 million recorded in 2011.
Income tax
Income tax of this operating segment for 2012 was €105 million, a 34.2% decrease from the €159 million recorded in 2011, primarily as a result of the decrease in operating profit before tax.
Profit attributable to parent company
As a result of the foregoing, profit attributable to parent company of this operating segment for 2012 was €404 million, a 28.3% decrease from the €563 million recorded in 2011.
109
MEXICO
| | | | | | | | | | | | |
| | | Year Ended
December 31, | | | | |
| | | 2012 | | | 2011 | | | Change | |
| | | (In Millions of Euros) | | | (In %) | |
| | | |
Net interest income | | | 4,178 | | | | 3,782 | | | | 10.5 | |
| | | | | | | | | | | | |
| | | |
Net fees and commissions | | | 1,073 | | | | 1,015 | | | | 5.7 | |
Net gains (losses) on financial assets and liabilities and net exchange differences | | | 219 | | | | 296 | | | | (26.2 | ) |
Other operating income and expenses(net) | | | 286 | | | | 229 | | | | 25.0 | |
Administration costs | | | (2,033 | ) | | | (1,826 | ) | | | 11.3 | |
Depreciation and amortization | | | (133 | ) | | | (105 | ) | | | 27.0 | |
Impairment losses on financial assets (net) | | | (1,320 | ) | | | (1,180 | ) | | | 11.9 | |
Provisions (net) and other gains (losses) | | | (41 | ) | | | (59 | ) | | | (30.4 | ) |
| | | | | | | | | | | | |
Operating profit before tax | | | 2,229 | | | | 2,153 | | | | 3.5 | |
| | | | | | | | | | | | |
Income tax | | | (539 | ) | | | (514 | ) | | | 4.9 | |
| | | | | | | | | | | | |
Profit from continuing operations | | | 1,690 | | | | 1,639 | | | | 3.1 | |
| | | | | | | | | | | | |
Profit from corporate operations (net) | | | — | | | | — | | | | n.m. | (1) |
| | | | | | | | | | | | |
Profit | | | 1,690 | | | | 1,639 | | | | 3.1 | |
| | | | | | | | | | | | |
Profit attributable to non-controlling interests | | | (1 | ) | | | (1 | ) | | | (16.1 | ) |
| | | | | | | | | | | | |
Profit attributable to parent company | | | 1,689 | | | | 1,638 | | | | 3.1 | |
| | | | | | | | | | | | |
In 2012 the Mexican peso appreciated against the euro in average terms, resulting in a positive exchange rate effect on our income statement for 2012. See “-Factors Affecting the Comparability of our Results of Operations and Financial Condition.”
Net interest income
Net interest income of this operating segment for 2012 was €4,178 million, a 10.5% increase from the €3,782 million recorded for 2011, due primarily to increased business activity, with greater volumes of lending and customer funds, and sound price management, which effects were partially offset by the impact of lower interest rates throughout the year.
Net fees and commissions
Net fees and commissions of this operating segment amounted to €1,073 million for 2012, a 5.7% increase from the €1,015 million recorded for 2011, due to increased transactions by customers with credit cards and the higher volume of assets under management of mutual funds.
Net gains (losses) on financial assets and liabilities and net exchange differences
Net gains on financial assets and liabilities and net exchange differences of this operating segment for 2012 amounted to €219 million, a 26.2% decrease from the €296 million for 2011, primarily due to lower brokerage revenues.
Other operating income and expenses (net)
Other operating income and expenses (net) of this operating segment for 2012, was a gain €286 million, a 25.0% increase from the €229 million gain recorded for 2011, principally due to growth in the insurance business.
Administration costs
Administration costs of this operating segment for 2012 amounted to €2,033 million, an 11.3% increase from the €1,826 million recorded for 2011, primarily due to the investment in technology and infrastructure. The number of ATMs grew over the year to 7,733 units, while the POS terminals increased by 9,176 units.
110
Impairment losses on financial assets (net)
Impairment losses on financial assets (net) of this operating segment for 2012 was €1,320 million, an 11.9% increase from the €1,180 million recorded for 2011, in line with the activity increase in the area. The operating segment’s non-performing assets ratio increased to 3.8% as of December 31, 2012 from 3.7% as of December 31, 2011.
Operating profit before tax
As a result of the foregoing, operating profit before tax of this operating segment for 2012 was €2,229 million, a 3.5% increase from the €2,153 million recorded for 2011.
Income tax
Income tax of this operating segment for 2012 was €539 million, a 4.9% increase from the €514 million recorded for 2011.
Profit from continuing operations
Profit from continuing operations of this operating segment for 2012 was €1,690 million, a 3.1% increase from the €1,639 million recorded for 2011.
Profit attributable to parent company
As a result of the foregoing, profit attributable to parent company of this operating segment for 2012 was €1,689 million, a 3.1% increase from the €1,638 million recorded for 2011.
SOUTH AMERICA
| | | | | | | | | | | | |
| | | Year Ended
December 31, | | | | |
| | | 2012 | | | 2011 | | | Change | |
| | | (In Millions of Euros) | | | (In %) | |
| | | |
Net interest income | | | 4,288 | | | | 3,159 | | | | 35.7 | |
| | | | | | | | | | | | |
| | | |
Net fees and commissions | | | 913 | | | | 722 | | | | 26.4 | |
Net gains (losses) on financial assets and liabilities and net exchange differences | | | 443 | | | | 485 | | | | (8.6 | ) |
Other operating income and expenses(net) | | | (284 | ) | | | (267 | ) | | | 6.4 | |
Administration costs | | | (2,120 | ) | | | (1,732 | ) | | | 22.4 | |
Depreciation and amortization | | | (173 | ) | | | (152 | ) | | | 14.3 | |
Impairment losses on financial assets (net) | | | (593 | ) | | | (449 | ) | | | 32.1 | |
Provisions (net) and other gains (losses) | | | (202 | ) | | | (89 | ) | | | 127.7 | |
| | | | | | | | | | | | |
Operating profit before tax | | | 2,271 | | | | 1,677 | | | | 35.4 | |
| | | | | | | | | | | | |
Income tax | | | (494 | ) | | | (346 | ) | | | 43.0 | |
| | | | | | | | | | | | |
Profit from continuing operations | | | 1,777 | | | | 1,332 | | | | 33.4 | |
| | | | | | | | | | | | |
Profit from corporate operations (net) | | | — | | | | — | | | | n.m. | (1) |
| | | | | | | | | | | | |
Profit | | | 1,777 | | | | 1,332 | | | | 33.4 | |
| | | | | | | | | | | | |
Profit attributable to non-controlling interests | | | (578 | ) | | | (434 | ) | | | 33.4 | |
| | | | | | | | | | | | |
Profit attributable to parent company | | | 1,199 | | | | 898 | | | | 33.5 | |
| | | | | | | | | | | | |
The average exchange rates of the currencies of the countries in which we operate in South America, except for the Argentine peso, against the euro, increased in 2012, resulting in a positive impact on the results of operations of the South America operating segment expressed in euro. See “-Factors Affecting the Comparability of our Results of Operations and Financial Condition.”
111
Net interest income
Net interest income of this operating segment for 2012 was €4,288 million, a 35.7% increase from the €3,159 million recorded in 2011, mainly due to the increase in volume of customer loans and deposits during the period, combined with sound price management.
Net fees and commissions
Net fees and commissions of this operating segment amounted to €913 million in 2012, a 26.4% increase from the €722 million recorded in 2011, primarily due to the increasing pace of business in most of the countries throughout the region.
Net gains (losses) on financial assets and liabilities and net exchange differences
Net gains on financial assets and liabilities and net exchange differences of this operating segment in 2012 were €443 million, an 8.6% decrease from the €485 million recorded in 2011. Net gains on financial assets and liabilities and net exchange differences of this operating segment in 2011 were positively affected by the revaluation of the U.S. dollar positions of BBVA Provincial in Venezuela, and no similar revaluation was recorded in 2012.
Other operating income and expenses (net)
Other operating income and expenses (net) of this operating segment for 2012, was a loss of €284 million, a 6.4% increase from the loss of €267 million recorded for 2011, principally due to the impact of Venezuela as a hyperinflationary economy since 2009 and the greater contribution made to the deposit guarantee funds in the countries in which we operate.
Administration costs
Administration costs of this operating segment in 2012 were €2,120 million, a 22.4% increase from the €1,732 million recorded in 2011, primarily due to the implementation of growth plans and the higher inflation recorded in the area.
Impairment losses on financial assets (net)
Impairment losses on financial assets (net) of this operating segment in 2012 was €593 million, 32.1% increase from the €449 million recorded in 2011, primarily due to the growth of loans and advances to customers. The operating segment’s non-performing assets ratio was 2.1% as of December 31, 2012, compared with 2.2% as of December 31, 2011.
Operating profit before tax
As a result of the foregoing, operating profit before tax of this operating segment in 2012 amounted to €2,271 million, a 35.4% increase compared to the €1,677 million recorded in 2011.
Income tax
Income tax of this operating segment in 2012 was €494 million, a 43% increase from the €346 million recorded in 2011.
Profit from continuing operations
Profit from continuing operations of this operating segment for 2012 was €1,777 million, a 33.4% increase from the €1,332 million recorded for 2011.
Profit attributable to parent company
Profit attributable to parent company of this operating segment in 2012 was €1,199 million, a 33.5% increase from the €898 million recorded in 2011.
112
UNITED STATES
| | | | | | | | | | | | |
| | | Year Ended
December 31, | | | | |
| | | 2012 | | | 2011 | | | Change | |
| | | (In Millions of Euros) | | | (In %) | |
| | | |
Net interest income | | | 1,551 | | | | 1,518 | | | | 2.2 | |
| | | | | | | | | | | | |
Net fees and commissions | | | 581 | | | | 611 | | | | (4.9 | ) |
Net gains (losses) on financial assets and liabilities and net exchange differences | | | 153 | | | | 132 | | | | 15.2 | |
Other operating income and expenses(net) | | | (41 | ) | | | (79 | ) | | | (48.0 | ) |
Administration costs | | | (1,321 | ) | | | (1,253 | ) | | | 5.4 | |
Depreciation and amortization | | | (185 | ) | | | (166 | ) | | | 11.1 | |
Impairment losses on financial assets (net) | | | (72 | ) | | | (320 | ) | | | (77.5 | ) |
Provisions (net) and other gains (losses) | | | (46 | ) | | | (1,496 | ) | | | (96.9 | ) |
| | | | | | | | | | | | |
Operating profit before tax | | | 619 | | | | (1,053 | ) | | | n.m. | (1) |
| | | | | | | | | | | | |
Income tax | | | (177 | ) | | | 340 | | | | n.m. | (1) |
| | | | | | | | | | | | |
Profit from continuing operations | | | 442 | | | | (713 | ) | | | n.m. | (1) |
| | | | | | | | | | | | |
Profit from corporate operations (net) | | | — | | | | 1 | | | | n.m. | (1) |
| | | | | | | | | | | | |
Profit | | | 442 | | | | (713 | ) | | | n.m. | (1) |
| | | | | | | | | | | | |
Profit attributable to non-controlling interests | | | — | | | | — | | | | n.m. | (1) |
| | | | | | | | | | | | |
Profit attributable to parent company | | | 442 | | | | (713 | ) | | | n.m. | (1) |
| | | | | | | | | | | | |
In 2012 the U.S. dollar appreciated against the euro in average terms, resulting in a positive exchange rate effect on our income statement in 2012. See “-Factors Affecting the Comparability of our Results of Operations and Financial Condition.”
Net interest income
Net interest income of this operating segment for 2012 was €1,551 million, a 2.2% increase from the €1,518 million recorded in 2011, primarily as a result of the appreciation of the U.S. dollar.
Net fees and commissions
Net fees and commissions of this operating segment in 2012 were €581 million, a 4.9% decrease from the €611 million recorded in 2011, due primarily to the coming into force of restrictive regulations on fees and commissions. This negative effect was partially offset by the positive performance of service fees from new residential mortgages.
Net gains (losses) on financial assets and liabilities and net exchange differences
Net gains (losses) on financial assets and liabilities and net exchange differences of this operating segment in 2012 were €153 million, a 15.2% increase from the €132 million recorded in 2011, mainly due to the appreciation of the U.S. dollar.
Other operating income and expenses (net)
Other operating income and expenses (net) of this operating segment in 2012 were an expense of €41 million, compared to an expense of €79 million recorded in 2011 mainly due to lower contributions to the Federal Deposit Insurance Corporation (FDIC).
Administration costs
Administration costs of this operating segment in 2012 were €1,321 million, a 5.4% increase from the €1,253 million recorded in 2011.
113
Depreciation and amortization
Depreciation and amortization of this operating segment for 2012 was €185 million, an 11.1% increase from €166 million in 2011.
Impairment losses on financial assets (net)
Impairment losses on financial assets (net) of this operating segment for 2012 was €72 million, a 77.5% decrease from the €320 million recorded for 2011, primarily due to the improvement in the loan-book mix. The non-performing assets ratio of this operating segment as of December 31, 2012 decreased to 2.4% from 3.5% as of December 31, 2011.
Provisions (net) and other gains (losses)
Provisions (net) and other gains (losses) for 2012 reflected losses of €46 million, compared to the €1,496 million losses recorded for 2011. Provisions (net) and other gains (losses) for 2011 were mainly related to impairment losses for goodwill (totaling €1,444 million). This goodwill adjustment was of an accounting nature and did not have any negative impact on the liquidity or capital adequacy of either the operating segment or the Group.
Operating profit before tax
As a result of the foregoing, the operating profit before tax of this operating segment for 2012 was a gain of €619 million, compared to a loss of €1,053 million recorded in 2011.
Income tax
Income tax of this operating segment for 2012 was a loss of €177 million, compared to a gain of €340 million recorded in 2011.
Profit attributable to parent company
Profit attributable to parent company of this operating segment for 2012 was a gain of €442 million, compared to a loss of €713 million recorded in 2011.
CORPORATE CENTER
| | | | | | | | | | | | |
| | | Year Ended
December 31, | | | | |
| | | 2012 | | | 2011 | | | Change | |
| | | (In Millions of
Euros) | | | (In %) | |
| | | |
Net interest income | | | (473 | ) | | �� | (465 | ) | | | 1.7 | |
| | | | | | | | | | | | |
Net fees and commissions | | | (25 | ) | | | (21 | ) | | | 19.0 | |
Net gains (losses) on financial assets and liabilities and net exchange differences | | | 594 | | | | 204 | | | | 191.7 | |
Other operating income and expenses(net) | | | 192 | | | | 371 | | | | (48.2 | ) |
Administration costs | | | (679 | ) | | | (659 | ) | | | 3.0 | |
Depreciation and amortization | | | (350 | ) | | | (259 | ) | | | 35.2 | |
Impairment losses on financial assets (net) | | | (15 | ) | | | (66 | ) | | | (76.7 | ) |
Provisions (net) and other gains (losses) | | | (70 | ) | | | 44 | | | | n.m. | (1) |
| | | | | | | | | | | | |
Operating profit/loss before tax | | | (826 | ) | | | (852 | ) | | | (3.0 | ) |
| | | | | | | | | | | | |
Income tax | | | 418 | | | | 505 | | | | (17.1 | ) |
| | | | | | | | | | | | |
Profit/loss from continuing operations | | | (408 | ) | | | (347 | ) | | | 17.5 | |
| | | | | | | | | | | | |
Profit from corporate operations (net) | | | 1,303 | | | | 745 | | | | 74.9 | |
| | | | | | | | | | | | |
Profit | | | 895 | | | | 398 | | | | 125.0 | |
| | | | | | | | | | | | |
Profit/loss attributable to non-controlling interests | | | (72 | ) | | | (47 | ) | | | 53.5 | |
| | | | | | | | | | | | |
Profit attributable to parent company | | | 823 | | | | 351 | | | | 134.6 | |
| | | | | | | | | | | | |
114
Net interest income
Net interest income of this operating segment for 2012 was an expense of €473 million compared to an expense of €465 million recorded in 2011. Net interest income has been negatively affected by the rising cost of wholesale finance resulting from the instability in the Euro zone area.
Net fees and commissions
Net fees and commissions of this operating segment amounted to an expense of €25 million for 2012, a 19% increase from the €21 million expense recorded for 2011.
Net gains (losses) on financial assets and liabilities and net exchange differences
Net gains (losses) on financial assets and liabilities and net exchange differences of this operating segment for 2012 were a gain of €594 million, a 191.7% increase from the €204 million gain recorded in 2011, primarily as a result of the capital gains derived from the repurchase of securitization bonds and subordinated debt carried out in 2012.
Other operating income and expenses (net)
Other operating income and expenses (net) of this operating segment for 2012 was a gain of €192 million, a 48.2% decrease from the €371 million gain recorded in 2011. Other operating income and expenses (net) of this operating segment for both years was primarily composed of Telefónica, S.A.’s dividends, which decreased from €1.52 per share in 2011 to €0.53 per share in 2012.
Administration costs
Administration costs of this operating segment for 2012 were €679 million, a 3% increase from the €659 million recorded in 2011, primarily due to the increase in costs associated with certain investments that are currently being undertaken including for the upgrading of systems, infrastructure and image and brand identity.
Depreciation and amortization
Depreciation and amortization of this operating segment for 2012 was €350 million, a 35.2% increase from the €259 million recorded in 2011, primarily due to charges related to corporate offices and software amortization.
Impairment losses on financial assets (net)
Impairment losses on financial assets (net) of this operating segment for 2012 was a loss of €15 million compared with a loss of €66 million recorded for 2011.
Provisions (net) and other gains (losses)
Provisions (net) and other gains (losses) for 2012 was a loss of €70 million, compared to the €44 million gain recorded in 2011.
Operating profit / (loss) before tax
As a result of the foregoing, operating loss before tax of this operating segment for 2012 was a loss of €826 million, compared to a loss of €852 million in 2011.
Income tax
Income tax of this operating segment for 2012 was €418 million, a 17.1% decrease from the €505 million recorded for 2011.
115
Profit from corporate operations (net)
With respect to 2012, this heading includes the earnings from the following corporate operations completed by the Group in 2012: the badwill generated by the Unnim acquisition, the earnings of the sale of BBVA Puerto Rico, the earnings from the sold pension businesses and the equity-adjusted earnings from CNCB (excluding dividends). Profit from corporate operations (net) of this operating segment for 2012 was €1,303 million, compared to the €745 million recorded for 2011, that included the results from the pension business in Latin America and the equity-accounted earnings from CNCB (also excluding dividends).
Profit attributable to parent company
Profit attributable to parent company of this operating segment for 2012 was a gain of €823 million, compared to a loss of €351 million in 2011.
| B. | Liquidity and Capital Resources |
Liquidity risk management and controls are explained in Note 7.3 to the Consolidated Financial Statements. In addition, information on outstanding contractual maturities of assets and liabilities is provided in Note 7.4 to the Consolidated Financial Statements. For information concerning our short-term borrowing, see “Item 4. Information on the Company—Selected Statistical Information—LIABILITIES—Short-term Borrowings”.
Liquidity and finance management of the BBVA Group’s balance sheet seeks to fund the growth of the banking business at suitable maturities and costs, using a wide range of instruments that provide access to a large number of alternative sources of finance.
A core principle in the BBVA Group’s liquidity and finance management is the financial independence of its banking subsidiaries. This aims to ensure that the cost of liquidity is correctly reflected in price formation. Accordingly, we maintain a liquidity pool at an individual entity level at each of Banco Bilbao Vizcaya Argentaria, S.A. and our banking subsidiaries, including BBVA Compass, BBVA Bancomer and our Latin American subsidiaries. The only exception to this principle is Banco Bilbao Vizcaya Argentaria (Portugal), S.A., which is funded by Banco Bilbao Vizcaya Argentaria, S.A. Banco Bilbao Vizcaya Argentaria (Portugal), S.A. represented 0.91% of our total consolidated assets and 0.56% of our total consolidated liabilities as of December 31, 2013.
Our principal source of funds is our customer deposit base, which consists primarily of demand, savings and time deposits. In addition to relying on our customer deposits, we also access the interbank market (overnight and time deposits) and domestic and international capital markets for our additional liquidity requirements. To access the capital markets, we have in place a series of domestic and international programs for the issuance of commercial paper and medium- and long-term debt. We also generally maintain a diversified liquidity pool of liquid assets and securitized assets at an individual entity level (except with respect to Banco Bilbao Vizcaya Argentaria (Portugal), S.A.). Another source of liquidity is our generation of cash flow from our operations. Finally, we supplement our funding requirements with borrowings from the Bank of Spain and from the European Central Bank (“ECB”) or the respective central banks of the countries where our subsidiaries are located. See Note 9 to the Consolidated Financial Statements for information on our borrowings from central banks.
The table below shows the types and amounts of securities included within the liquidity pool of Banco Bilbao Vizcaya Argentaria, S.A. and Banco Bilbao Vizcaya Argentaria (Portugal), S.A. and each of our significant subsidiaries as of December 31, 2013:
| | | | | | | | | | | | | | | | |
| | | BBVA
Eurozone (1) | | | BBVA
Bancomer | | | BBVA
Compass | | | Others | |
| | | (In Millions of Euros) | |
Cash and balances with central banks | | | 10,826 | | | | 6,159 | | | | 1,952 | | | | 6,843 | |
Assets for credit operations with central banks | | | 32,261 | | | | 3,058 | | | | 9,810 | | | | 7,688 | |
Central governments issues | | | 16,500 | | | | 229 | | | | 904 | | | | 7,199 | |
Of Which: Spanish government securities | | | 14,341 | | | | — | | | | — | | | | — | |
Other issues | | | 15,761 | | | | 2,829 | | | | 2,224 | | | | 489 | |
Loans | | | — | | | | — | | | | 6,682 | | | | — | |
Other non-eligible liquid assets | | | 4,735 | | | | 425 | | | | 278 | | | | 396 | |
| | | | | | | | | | | | | | | | |
Accumulated available balance | | | 47,822 | | | | 9,642 | | | | 12,040 | | | | 14,927 | |
| | | | | | | | | | | | | | | | |
| (1) | Includes Banco Bilbao Vizcaya Argentaria, S.A. and Banco Bilbao Vizcaya Argentaria (Portugal), S.A. |
116
The following table shows the balances as of December 31, 2013, 2012 and 2011 of our principal sources of funds (including accrued interest, hedge transactions and issue expenses):
| | | | | | | | | | | | |
| | | As of December 31, | |
| | | 2013 | | | 2012 | | | 2011 | |
| | | (in Millions of Euros) | |
Deposits from central banks | | | 30,893 | | | | 46,475 | | | | 32,877 | |
Deposits from credit institutions | | | 52,423 | | | | 55,675 | | | | 56,601 | |
Customer deposits | | | 300,490 | | | | 282,795 | | | | 272,402 | |
Debt certificates | | | 64,120 | | | | 86,255 | | | | 81,124 | |
Subordinated liabilities | | | 10,556 | | | | 11,815 | | | | 15,303 | |
Other financial liabilities | | | 5,659 | | | | 7,590 | | | | 7,410 | |
| | | | | | | | | | | | |
Total | | | 464,141 | | | | 490,605 | | | | 465,717 | |
| | | | | | | | | | | | |
Customer deposits
Customer deposits amounted to €300,490 million as of December 31, 2013, compared to €282,795 million as of December 31, 2012 and €272,402 million as of December 31, 2011. The increase from December 31, 2012 to December 31, 2013 was primarily due to the positive performance of time deposits held by households and companies.
Our customer deposits, excluding assets sold under repurchase agreements, amounted to €272,630 million as of December 31, 2013 compared to €253,746 million as of December 31, 2012 and €228,423 million as of December 31, 2011.
Amounts due to credit institutions
Amounts due to credit institutions, including central banks, amounted to €83,316 million as of December 31, 2013, compared to €102,150 million as of December 31, 2012 and €89,478 million as of December 31, 2011. The decrease as of December 31, 2013 compared to December 31, 2012, was related to decreased deposits from central banks, mainly from the ECB long-term financing.
| | | | | | | | | | | | |
| | | As of December 31, | |
| | | 2013 | | | 2012 | | | 2011 | |
| | | (in Millions of Euros) | |
Deposits from credit institutions | | | 52,423 | | | | 55,675 | | | | 56,601 | |
Deposits from central banks | | | 30,893 | | | | 46,475 | | | | 32,877 | |
| | | | | | | | | | | | |
Total Deposits from Credit Institutions | | | 83,316 | | | | 102,150 | | | | 89,478 | |
| | | | | | | | | | | | |
Capital markets
We have continued making debt issuances in the domestic and international capital markets in order to finance our activities and as of December 31, 2013 we had €64,120 million of senior debt outstanding, comprising €62,802 million in bonds and debentures and €1,318 million in promissory notes and other securities, compared to €86,255
117
million, €75,099 million and €11,156 million outstanding as of December 31, 2012, respectively (€81,124 million, €73,633 million and €7,491 million outstanding, respectively, as of December 31, 2011). See Note 23.3 to the Consolidated Financial Statements.
In addition, we had a total of €8,432 million in subordinated debt and €1,827 million in preferred securities outstanding as of December 31, 2013, compared to €9,259 million and €1,847 million outstanding as of December 31, 2012, respectively.
The breakdown of the outstanding subordinated debt and preferred securities by entity issuer, maturity, interest rate and currency is disclosed in Appendix VI of the Consolidated Financial Statements.
The following is a breakdown as of December 31, 2013 of the maturities of our debt certificates (including bonds) and subordinated liabilities, disregarding any valuation adjustments and accrued interest (regulatory equity instruments have been classified according to their contractual maturity):
| | | | | | | | | | | | | | | | | | | | | | | | | | | | |
| | | Demand | | | Up to 1
Month | | | 1 to 3
Months | | | 3 to 12
Months | | | 1 to 5
Years | | | Over 5
Years | | | Total | |
| | | (in Millions of Euros) | |
Debt certificates (including bonds) | | | — | | | | 4,039 | | | | 383 | | | | 9,901 | | | | 35,581 | | | | 12,640 | | | | 62,544 | |
Subordinated liabilities | | | — | | | | 38 | | | | 1 | | | | 993 | | | | 1,389 | | | | 7,847 | | | | 10,268 | |
| | | | | | | | | | | | | | | | | | | | | | | | | | | | |
Total | | | — | | | | 4,077 | | | | 384 | | | | 10,894 | | | | 36,970 | | | | 20,487 | | | | 72,812 | |
| | | | | | | | | | | | | | | | | | | | | | | | | | | | |
Generation of Cash Flow
We operate in Spain, Mexico, the United States and over 30 other countries, mainly in Europe, Latin America, and Asia. Our banking subsidiaries around the world, including BBVA Compass, are subject to supervision and regulation by a variety of regulatory bodies relating to, among other things, the satisfaction of minimum capital requirements. The obligation to satisfy such capital requirements may affect the ability of our banking subsidiaries, including BBVA Compass, to transfer funds to us in the form of cash dividends, loans or advances. In addition, under the laws of the various jurisdictions where our subsidiaries, including BBVA Compass, are incorporated, dividends may only be paid out of funds legally available therefor. For example, BBVA Compass is incorporated in Alabama and under Alabama law it is not able to pay any dividends without the prior approval of the Superintendent of Banking of Alabama if the dividend would exceed the total net earnings for the year combined with the bank’s retained net earnings of the preceding two years.
Even where minimum capital requirements are met and funds are legally available therefore, the relevant regulator could advise against the transfer of funds to us in the form of cash dividends, loans or advances, for prudence reasons or otherwise.
There is no assurance that in the future other similar restrictions will not be adopted or that, if adopted, they will not negatively affect our liquidity. The geographic diversification of our businesses, however, could help to limit the effect on the Group any restrictions that could be adopted in any given country.
We believe that our working capital is sufficient for our present requirements and to pursue our planned business strategies.
See Note 53 of the Consolidated Financial Statements for additional information on our Consolidated Statements of Cash Flows.
Capital
Our estimated capital ratios are based on our interpretation, expectations and understanding of the respective requirements, and are necessarily subject to further regulatory clarity and rulemaking.
118
Under the Bank of Spain’s capital adequacy regulations applicable as of December 31, 2013, 2012 and 2011, we were required to have a ratio of consolidated stockholders’ equity to risk-weighted assets and off-balance sheet items (net of certain amounts) of not less than 8%. As of December 31, 2013, this ratio was 12.9%, up from 10.8% as of December 31, 2012, and our stockholders’ equity exceeded the minimum level required by 60.9%, up from 35.4% as of December 31, 2012. As of December 31, 2011, this ratio was 10.9% and our stockholders’ equity exceeded the minimum level required by 36.5%. For additional information on the calculation of these ratios, see Note 33 to the Consolidated Financial Statements.
Based on the Basel II framework, our estimated consolidated ratios as of December 31, 2013 and 2012 are as follows:
| | | | | | | | | | | | |
| | | As of December 31, | | | As of December 31, | | | % Change | |
| | | 2013 | | | 2012 | | | 2013-2012 | |
| | | (in Millions of Euros) | |
Stockholders’ funds | | | 44,527 | | | | 43,614 | | | | 6.2 | |
Adjustments | | | (7,035 | ) | | | (9,401 | ) | | | (6.2 | ) |
Mandatory convertible bonds | | | — | | | | 1,238 | | | | (100.0 | ) |
CORE CAPITAL | | | 37,492 | | | | 35,451 | | | | 5.8 | |
Preferred securities | | | 2,905 | | | | 1,860 | | | | 56.2 | |
Adjustments | | | (786 | ) | | | (1,860 | ) | | | (57.7 | ) |
CAPITAL (TIER I) | | | 39,611 | | | | 35,451 | | | | 11.7 | |
Subordinated debt and other | | | 9,481 | | | | 10,022 | | | | (5.4 | ) |
Deductions | | | (786 | ) | | | (2,636 | ) | | | (70.2 | ) |
OTHER ELIGIBLE CAPITAL (TIER II) | | | 8,695 | | | | 7,386 | | | | 17.7 | |
CAPITAL BASE (TIER I + TIER II) (a) | | | 48,306 | | | | 42,836 | | | | 12.8 | |
Minimum capital requirement (BIS II Regulations) | | | 25,888 | | | | 26,323 | | | | (1.7 | ) |
CAPITAL SURPLUS | | | 22,418 | | | | 16,514 | | | | 35.8 | |
RISK WEIGHTED ASSETS (b) | | | 323,605 | | | | 329,033 | | | | (1.6 | ) |
| | | |
BIS RATIO (a)/(b) | | | 14.90 | % | | | 13.02 | % | | | | |
CORE CAPITAL | | | 11.60 | % | | | 10.77 | % | | | | |
TIER I | | | 12.20 | % | | | 10.77 | % | | | | |
TIER II | | | 2.70 | % | | | 2.24 | % | | | | |
The Group’s capital base, calculated in accordance with the rules set forth in the Basel II capital accord, stood at €48,306 million as of December 31, 2013, compared with €42,836 million as of December 31, 2012.
Risk-weighted assets (“RWA”) decreased slightly in 2013, reaching €323,605 million as of December 31, 2013 (compared with €329,033 million as of December 31, 2012). This decrease was mainly due to the deleveraging process in Spain, reduced activity with wholesale customers, exchange rate effects and the sale of our Panama subsidiary.
The minimum capital requirements under BIS II (8% of RWA) amounted to €25,888 million as of December 31, 2013. Thus, excess capital resources (over the required 8% of RWA) stood at € 22,418 million. Therefore, as of December 31, 2013, the Group’s capital resources were 86.6% higher than the minimum required levels.
The quality of the capital base improved during 2013, since core capital as of December 31, 2013 amounted to €37,492 million, compared with €35,451 million as of December 31, 2012. This increase was principally due to the generation of earnings attributed both to the Group and to non-controlling interests and the positive impact of the sale of 5,1% of CNCB and other corporate operations, sale of pension funds administrators in Latin America and sale of our Panama subsidiary (see Note 3 of the Consolidated Financial Statements for additional information).
Core capital accounted for 11.6% of RWA as of December 31, 2013, compared with 10.8% as of December 31, 2012, an increase of 80 basis points compared with December 31, 2012.
119
Tier I capital stood at €39,611 million or 12.2% of RWA as of December 31, 2013, 140 basis points higher than on December 31, 2012. Preferred securities and contingent convertible notes accounted for 7.33% of Tier I capital as of December 31, 2013.
As of December 31, 2013, Tier II capital was €8,695 million or 2.7% of RWA, 50 basis points higher than on December 31, 2012, due mainly to the impact of the sale of 5.1% of CNCB .
By aggregating Tier I and Tier II capital, as of December 31, 2013, the BIS total capital ratio is 14.9%, compared with 13.9% as of December 31, 2012.
Other Requirements on Minimum Capital Levels
In addition to the requirements referred to above, in 2011, the European Banking Authority (“EBA”) issued a recommendation pursuant to which financial institutions based in the EU should reach a new minimum Core Tier 1 (CT1) ratio of 9%, after setting an additional buffer against sovereign risk holdings, by June 30, 2012.
Furthermore, on July 22, 2013, EBA published a recommendation about capital preservation addressed to the supervisory authorities in all EU member states. The recommendation aims to preserve the enhance capital base built as of June 30, 2012, in response to the EBA’s 2011 recapitalization. For BBVA Group, this limit was set at €32,152 million, and, as of December 31, 2013, the EBA CT1 stood at €35,038 million, with a surplus of €2,886 million over the limit.
| C. | Research and Development, Patents and Licenses, etc. |
In 2013, we continued to foster the use of new technologies as a key component of our global development strategy. We explored new business and growth opportunities, focusing on three major areas: emerging technologies; digital banking; and data driven initiatives, in each case with the customer as the focal point of our banking business.
The BBVA Group is not materially dependent on the issuance of patents, licenses and industrial, mercantile or financial contracts or on new manufacturing processes in carrying out its business purpose.
The European financial services sector is likely to remain competitive. Further consolidation in the sector (through mergers, acquisitions or alliances) is likely as the other major banks look to increase their market share or combine with complementary businesses or via acquisition of distressed entities. It is foreseeable that, in the framework of the banking union, regulatory changes will take place in the future that will diminish barriers to such consolidation transactions. However, some of the hurdles that should be dealt with are the result of local preferences and their impact on legal culture, as it is the case with consumer protection rules. If there are clear local consumer preferences, leading to specific local consumer protection rules, the same products cannot be sold across all the jurisdictions in which the Group operates, which reduces potential synergies.
In addition, there are other challenges which are unrelated to the interest or preferences of consumers, such as the Value Added Tax regime for banks. The Value Added Tax regime for banks is consistent with a more general trend of increasing pressure on financial systems. Within the Euro area, several countries are imposing new taxes on the financial industry, such as bank levies, financial activity taxes or financial transactions taxes. In addition, the introduction of a general Financial Transaction Tax at a EU-level is being discussed. Differing tax regimes could set incentives for banks to operate, or transactions to take place, in those geographies where the tax pressure is lower. The implementation of new regulations in countries where we operate which results in increased tax pressure, or our inability to operate in geographies where the tax pressure is lower, could have a material impact on our profitability.
Regarding restructuring and resolution of credit institutions, an agreement on the RRD was reached in the February 2014 ECOFIN. The final approval of the RRD is expected by April-May 2014. The RRD is expected to enter into force in 2015, but the bail-in tool, which is one of the cornerstones of the RRD, will only be operational from 2016. The RRD sets a common framework for all EU countries with the intention to preempt bank crises and resolve financial institutions in an orderly manner in the event of failure, whilst preserving essential bank operations and minimizing taxpayers’ costs, thus helping restore confidence in Europe’s financial sector.
120
With respect to banking structural reforms, the European Commission released a proposal in January 2014. The proposal is twofold and imposes: (i) a prohibition on proprietary trading and (ii) an annual supervisory examination of trading activities that may trigger the separation of market-making, complex derivatives and risky securitization if the thresholds on a certain number of metrics are breached (a wider separation is possible under supervisory discretion). The reform would apply to Global Systemically Important Banks and banks with significant trading activities. This initiative raises concerns from a global perspective. First, if implemented, it will affect activities that are essential for the well-functioning of the markets such as market-making. Further, it may also foster concentration in risky trading business lines with increased systemic risk by applying structural separation on a too large scope of banks including those predominantly retail banks that may be forced to divest from their trading activities as they would no longer be viable.
Regarding consumer protection rules, initiatives such as the review of the Markets in Financial Instruments Directive (MiFID II), the EU Commission consultation on the legislative steps for the Packaged Retail Investment Products (PRIPs) or the EU proposal for a regulation on a new Key Information Document for investment products (of July 3, 2012) could entail significant costs for our operations. In addition, it is unclear whether these initiatives will be applied equally across European countries, and differences in the implementation of these initiatives could affect the level-playing-field in the industry.
Regarding MiFID, on October 20, 2011, the European Commission presented a legislative proposal to review the MiFID in order to set clearer and more comprehensive rules across all financial instruments, in line with G-20 recommendations and specific U.S. Dodd-Frank Act provisions, which was approved by the European Parliament and the Council on January 14, 2014. The approved Directive includes enhanced transparency requirements concerning trading activities in equity markets, tougher rules for algorithmic and high frequency trading activities and stricter requirements for portfolio management, investment advice and the offer of complex financial products such as structured products. These stricter rules on investment advice include, among others, telephone recordings, stricter categorization of clients, limits to “execution only” services for retail clients and stricter information duties for complex products. According to estimates published by the European Commission, the MiFID review is estimated to impose initial compliance costs of between €512 and €732 million and ongoing costs of between €312 and €586 million per year in the aggregate for participants in the EU banking sector. This represents an impact for initial and ongoing costs of 0.10% to 0.15% and 0.06% to 0.12%, respectively, of total operating spending in the EU banking sector. However, banking industry estimates are higher since the European Commission’s estimates do not account for all costs associated with the implementation of the MiFID review, including IT costs to be incurred in order to comply with the new transparency requirements. In addition, the MiFID review represents an overhaul of our business model, mainly regarding our investment advice services.
Regarding PRIPs, the measures planned by the European Commission aim to achieve higher transparency in the packaged retail investment products sector by requiring that certain mandatory information is made available to investors prior to making an investment decision and imposing stricter commercial practices. The MiFID provisions are considered to be a benchmark on conduct of business and the management of conflicts of interest. The preparation and provision to investors of the proposed mandatory information, as well as the revision of our commercial practices and the monitoring of the implementation of the new rules, are expected to entail costs for BBVA.
121
Finally, regulators have decided to increase transparency in the benchmark setting process. There are several initiatives that point in this direction. Among others there is a EU proposal for benchmark indices which is at an early stage of negotiation and is not expected to see the light before the end of 2014. In addition, the new Euribor EBF Code of Conduct, which will entry into force in April 2014, aims at improving governance procedures. Both initiatives stressed the need to base index quotes on real market transactions.
The following are the most important trends, uncertainties and events that are reasonably likely to have a material adverse effect on us or that would cause the financial information disclosed herein not to be indicative of our future operating results or financial condition:
| | • | | the prolonged downturn in the Spanish economy and sustained unemployment above historical averages; |
| | • | | the restructuring and consolidation of the Spanish banking sector, |
| | • | | doubts about the fragile recovery of European economies (both peripheral and core Eurozone economies), difficulties in the banking union process and current financial markets fragmentation; |
| | • | | uncertainties relating to the sustainability of any recovery in economic growth and interest rate cycles, especially taking into account the United States’ tapering; |
| | • | | the fragility of the recovery from the financial crisis triggered by defaults on subprime mortgages and related asset-backed securities in the United States which has significantly disrupted the liquidity of financial institutions and markets; |
| | • | | the fragility of the Greek, Italian, Portuguese, Cypriot and Irish economies, which could affect the funding costs of Spanish financial institutions and the Spanish Government; |
| | • | | the effects of the withdrawal of significant monetary and fiscal stimulus programs and uncertainty over government responses to growing public deficits, in particular in emerging economies which have experienced capital outflows and currency depreciations; |
| | • | | uncertainty over regulation of the financial industry, including the potential limitation on the size or scope of the activities of certain financial institutions, the regulation on systemic financial institutions or additional capital requirements, coming both from the Bank of Spain, European authorities or globally; |
| | • | | uncertainty over the minimum solvency levels to be required in the future to the financial institutions by the Spanish government or the European authorities; |
| | • | | the continued downward adjustment in the housing sector in Spain, which could further negatively affect credit demand and household wealth, disposable income and consumer confidence. The existence of a significant over supply in the housing market in Spain and the pessimistic expectations about house price increases may postpone investment decisions, therefore negatively affecting mortgage growth rates; |
| | • | | continued volatility in capital markets or a downturn in investor confidence, linked to factors such as geopolitical risk, particularly in the Middle East. Continued or new crises in the region, could cause an increase in oil prices, generating inflationary pressures that could have a negative effect on interest rates and economic growth; |
| | • | | the effect that an economic slowdown or the US tapering may have over Latin American markets and fluctuations in local interest and exchange rates; and |
| | • | | although it is foreseeable that entry barriers to domestic markets in Europe will be lowered, our plans for expansion into other European markets could be affected by entry barriers in such countries by protectionist policies of national governments, which are generally higher in times of crisis. |
122
| E. | Off-Balance Sheet Arrangements |
In addition to loans, we had outstanding the following contingent liabilities and commitments at the dates indicated:
| | | | | | | | | | | | |
| | | As of December 31, | |
| | | 2013 | | | 2012 | | | 2011 | |
| | | (In Millions of Euros) | |
ContingentRisk | | | | | | | | | | | | |
Rediscounts, endorsements and acceptances | | | 39 | | | | 36 | | | | 35 | |
Collateral, bank guarantees and indemnities | | | 28,082 | | | | 29,976 | | | | 29,532 | |
Other contingent risks | | | 5,422 | | | | 7,007 | | | | 8,062 | |
Total contingent risk | | | 33,543 | | | | 37,019 | | | | 37,629 | |
| | | | | | | | | | | | |
ContingentCommitments | | | | | | | | | | | | |
Balances drawable by third parties: | | | | | | | | | | | | |
Credit Institutions | | | 1,583 | | | | 1,946 | | | | 2,417 | |
Government and other government agency | | | 4,354 | | | | 1,360 | | | | 3,143 | |
Other resident sectors | | | 20,713 | | | | 21,982 | | | | 24,119 | |
Non-resident sector | | | 60,892 | | | | 58,231 | | | | 56,696 | |
Total balances drawable by third parties | | | 87,542 | | | | 83,519 | | | | 86,375 | |
Other contingent liabilities | | | 6,628 | | | | 6,623 | | | | 4,313 | |
Totalcontingent liabilities | | | 94,170 | | | | 90,142 | | | | 90,688 | |
| | | | | | | | | | | | |
Totalcontingentrisk andcontingent liabilities | | | 127,213 | | | | 127,161 | | | | 128,317 | |
| | | | | | | | | | | | |
In addition to the contingent liabilities and commitments described above, the following table provides information regarding off-balance sheet funds managed by us as of December 31, 2013, 2012 and 2011:
| | | | | | | | | | | | |
| | | As of December 31, | |
| | | 2013 | | | 2012 | | | 2011 | |
| | | (In Millions of Euros) | |
Mutual funds | | | 43,600 | | | | 40,118 | | | | 43,134 | |
Pension funds | | | 21,074 | | | | 84,500 | | | | 73,783 | |
Other managed assets | | | 31,073 | | | | 28,138 | | | | 26,349 | |
Total | | | 95,747 | | | | 152,756 | | | | 143,266 | |
| | | | | | | | | | | | |
See Note 38 to the Consolidated Financial Statements for additional information with respect to our off-balance sheet arrangements.
| F. | Tabular Disclosure of Contractual Obligations |
Our consolidated contractual obligations as of December 31, 2013 based on when they are due, were as follows:
| | | | | | | | | | | | | | | | | | | | |
| | | Less Than
One Year | | | One to Three
Years | | | Three to Five
Years | | | Over Five
Years | | | Total | |
| | | (In Millions of Euros) | |
| | | | | |
Senior debt | | | 14,323 | | | | 32,737 | | | | 2,844 | | | | 12,640 | | | | 62,544 | |
Subordinated debt | | | 1,032 | | | | 725 | | | | 664 | | | | 7,847 | | | | 10,268 | |
Deposits from customers | | | 255,530 | | | | 30,360 | | | | 2,720 | | | | 10,994 | | | | 299,604 | |
Capital lease obligations | | | — | | | | — | | | | — | | | | — | | | | — | |
Operating lease obligations | | | 264 | | | | 397 | | | | 270 | | | | 2,530 | | | | 3,462 | |
Purchase obligations | | | 39 | | | | — | | | | — | | | | — | | | | 39 | |
| | | | | |
Post-employment benefits(1) | | | 859 | | | | 1,526 | | | | 1,256 | | | | 2,084 | | | | 5,726 | |
Insurance commitments | | | 1,440 | | | | 1,613 | | | | 878 | | | | 5,903 | | | | 9,834 | |
| | | | | | | | | | | | | | | | | | | | |
Total(2) | | | 273,487 | | | | 67,358 | | | | 8,633 | | | | 41,998 | | | | 391,477 | |
| | | | | | | | | | | | | | | | | | | | |
| (1) | Represents the Group’s estimated aggregate amounts for pension commitments in defined-benefit plans and other post-employment commitments (such as early retirement and welfare benefits), based on certain actuarial assumptions. Post-employment benefits are detailed in Note 26.2 to the Consolidated Financial Statements. |
| (2) | Interest to be paid is not included (see Note 23 to the Consolidated Financial Statements). The majority of the senior and subordinated debt was issued at variable rates. The financial cost of such issuances for 2013, 2012 and 2011 is detailed in Note 39.2 to the Consolidated Financial Statements. |
| ITEM 6. | DIRECTORS, SENIOR MANAGEMENT AND EMPLOYEES |
Our Board of Directors is committed to a good corporate governance system in the design and operation of our corporate bodies in the best interests of the Company and our shareholders.
Our Board of Directors is subject to Board regulations that reflect and implement the principles and elements of BBVA’s concept of corporate governance. These Board regulations comprise standards for the internal management and operation of the Board and its committees, as well as the rights and obligations of directors in pursuit of their duties, which are contained in the directors’ charter.
Shareholders’ general meetings are subject to their own set of regulations on issues such as how they operate and what rights shareholders enjoy regarding such meetings. These establish the possibility of exercising or delegating votes over remote communication media.
123
Our Board of Directors has approved a report on corporate governance and a report on director’s remuneration for 2013, according to the forms set forth under Spanish regulation for listed companies.
Shareholders and investors may find the documents referred to above on our website (www.bbva.com).
Our website was created as an instrument to facilitate information and communication with shareholders. It provides special direct access to all information considered relevant to BBVA’s corporate governance system in a user-friendly manner. In addition, all the information required by article 539 of the Corporate Enterprises Act can be accessed on BBVA’s website (http://shareholdersandinvestors.bbva.com/TLBB/tlbb/bbvair/ing/governance/index.jsp) in the section entitled Corporate Governance.
| A. | Directors and Senior Management |
We are managed by a Board of Directors that currently has 14 members.
Pursuant to article one of the Board regulations, Bank directorships may be executive or external. Executive directors have been conferred general powers to represent the Company on a permanent basis; they perform senior-management duties or are employees of the Company or its Group companies. All other Board members will be considered external.
Independent directors are those external directors who have been appointed in view of their personal and professional qualifications and can carry out their duties without being compromised by their relationships with us, our significant shareholders or our senior management. Under the Board regulations, independent directors may not:
| (i) | Have been employees or executive directors in Group companies, unless three or five years, respectively, have passed since they ceased to be so. |
| (ii) | Receive any amount or benefit from the Company or its Group companies for any reason other than remuneration of their directorship, unless it is insignificant. |
Neither dividends nor supplementary pension payments that the director may receive from earlier professional or employment relationships shall be taken into account for the purposes of this section, provided they are not subject to conditions and the company paying them may not at its own discretion suspend, alter or revoke their accrual without breaching its obligations.
| (iii) | Be or have been a partner in the external auditors’ firm or in charge of the auditor’s report with respect to the Company or any other Group company during the last three years. |
| (iv) | Be executive director or senior manager in any other company on which a Company executive director or senior manager is external director. |
| (v) | Maintain or have maintained during the past year an important business relationship with the Company or any of its Group companies, either on his/her own behalf or as relevant shareholder, director or senior manager of a company that maintains or has maintained such relationship. |
Business relationships shall mean relationships as provider of goods and/or services, including financial, advisory and/or consultancy services.
| (vi) | Be significant shareholders, executive directors or senior managers of any organization that receives or has received significant donations from the Company or its Group during the last three years. |
Those who are merely trustees on a foundation receiving donations shall not be ineligible under this item.
| (vii) | Be married to or linked by equivalent emotional relationship, or related by up to second-degree family ties to an executive director or senior manager of the Company. |
124
| (viii) | Have not been proposed by the Appointments Committee for appointment or renewal. |
| (ix) | Fall within the cases described under items i), v), vi) or vii) above, with respect to any significant shareholder or shareholder represented on the Board. In cases of family relationships described under item vii), the limitation shall not only apply to the shareholder, but also to the directors it nominates for the Company’s Board. |
Directors owning shares in the Company may be independent providing they comply with the above conditions and their shareholding is not legally considered as significant.
Regulations of the Board of Directors
The principles and elements comprising our corporate governance are set forth in our Board regulations, which govern the internal procedures and the operation of the Board and its committees and directors’ rights and duties as described in their charter.
The Board regulations can be read on the Bank’s corporate website (www.bbva.com).
The following provides a brief description of several significant matters covered in the regulations of the Board of Directors.
Appointment and Re-election of Directors
The proposals that the Board submits to the Company’s annual shareholders’ general meeting for the appointment or re-election of directors and the resolutions to appoint directors made by the Board of Directors shall be approved at the proposal of the Appointments Committee in the case of independent directors and on the basis of a report from said committee in the case of all other directors.
To such end, the Appointments Committee assesses the skills, knowledge and experience required on the Board and the capacities the candidates must offer to cover any vacant seats. It evaluates how much time and work members may need to carry out their duties properly as a function of the needs that the Company’s governing bodies may have at any time.
Term of Directorships and Director Age Limit
Directors shall stay in office for the term defined by our bylaws (three years). If a director has been co-opted, they shall stay in office until the first shareholders’ general meeting is held. The general meeting may then ratify their appointment for the term of office remaining to the director whose vacancy they have covered through co-option, or else appoint them for the term of office established under our bylaws.
BBVA’s Board of Directors regulations establish an age limit for sitting on the Bank’s Board. Directors must present their resignation at the first Board meeting following the annual shareholders’ general meeting approving the accounts of the year in which they reach the age of seventy-five.
Evaluation
Article 17 of the Board regulations indicates that the Board of Directors will be responsible for assessing the quality and efficiency in the operation of the Board and its Committees, on the basis of the reports that said Committees submit. The Board is also tasked with assessing the performance of the Chairman of the Board and, where pertinent, of the Company’s Chief Executive Officer, on the basis of the report submitted by the Appointments Committee.
Moreover, article 5 of the Board regulations establishes that the Chairman, who is responsible for the efficient running of the Board, will organize and coordinate with the Chairs of the relevant Committees to carry out periodic assessments of the Board and of the Chief Executive Officer of the Bank, when this post is not also held by the Chairman.
125
Pursuant to the provisions of these Board regulations, as in previous years, in 2013 the Board of Directors assessed the quality and efficiency of its own operation and of its Committees, as well as the performance of the duties of the Chairman, both as Chairman of the Board and as Chief Executive Officer of the Bank.
Performance of Directors’ Duties
Board members must comply with their duties as defined by legislation and by the bylaws in a manner that is faithful to the interests of the Company.
They shall participate in the deliberations, discussions and debates arising on matters put to their consideration and shall have sufficient information to be able to form a sound opinion on the questions corresponding to our governing bodies. They may request additional information and advice if they so require in order to perform their duties. Their participation in the Board’s meetings and deliberations shall be encouraged.
The directors may also request help from external experts with respect to business submitted to their consideration whose complexity or special importance makes it advisable.
Conflicts of Interest
The rules comprising the BBVA directors’ charter detail different situations in which conflicts of interest could arise between directors, their family members and/or organizations with which they are linked, and the BBVA Group. They establish procedures for such cases, in order to avoid conduct contrary to our best interests.
These rules help ensure directors’ conduct reflects stringent ethical codes, in keeping with applicable standards and according to core values of the BBVA Group.
Incompatibilities
Directors are also subject to a regime of incompatibilities, which places strict constraints on holding posts on governing bodies of Group companies or companies in which the Group has a holding. Non-executive directors may not sit on the boards of subsidiaries or related companies because of the Group’s holding in them, whilst executive directors may only do so if they have express authority.
Directors who cease to be members of the Bank’s Board may not offer their services to any other financial institution competing with the Bank or of its subsidiaries for two years after leaving, unless expressly authorized by the Board. Such authorization may be denied on the grounds of corporate interest.
Directors’ Resignation and Dismissal
Furthermore, in the following circumstances, reflected in the Board regulations, directors must tender their resignation to the Board and accept its decision regarding their continuity in office (formalizing said resignation when the Board so resolves):
| | • | | When barred (on grounds of incompatibility or other) under prevailing legal regulations, under the bylaws or under the directors’ charter. |
| | • | | When significant changes occur in their professional situation or that may affect the condition by virtue of which they were appointed to the Board. |
| | • | | When they are in serious dereliction of their duties as directors. |
| | • | | When the director, acting as such, has caused severe damage to the Company’s assets or its reputation or credit, and/or no longer displays the commercial and professional honor required to hold a Bank directorship. |
126
The Board of Directors
Our Board of Directors is currently comprised of 14 members.
The following table sets forth the names of the members of the Board of Directors as of that date of this Annual Report on Form 20-F, their date of appointment and, if applicable, re-election, their current positions and their present principal outside occupation and employment history.
| | | | | | | | | | |
Name (*) | | Birth Year | | Current Position | | Date Nominated | | Date Re-elected | | Present Principal Outside Occupation
and Employment History (**) |
Francisco González Rodríguez (1) | | 1944 | | Chairman and Chief Executive Officer | | January 28, 2000 | | March 15, 2013 | | Chairman and CEO of BBVA, since January 2000; Director of Grupo Financiero BBVA Bancomer, S.A. de C.V. and BBVA Bancomer S.A., Institución de Banca Múltiple, Grupo Financiero BBVA Bancomer. |
Ángel Cano Fernández (1) | | 1961 | | President and Chief Operating Officer | | September 29, 2009 | | March 15, 2013 | | President and Chief Operating Officer of BBVA, since September 2009. Director of Grupo Financiero BBVA Bancomer S.A. de C.V., BBVA Bancomer, S.A., Institución de Banca Múltiple, Grupo Financiero BBVA Bancomer, and Türkiye Garanti Bankasi A.Ş. BBVA Director of Resources and Means from 2005 to 2009. |
Tomás Alfaro Drake (2)(3) | | 1951 | | Independent Director | | March 18, 2006 | | March 14, 2014 | | Chairman of the Appointments Committee of BBVA since May 25, 2010. Director of Internal Development and Professor in the Finance department of Universidad Francisco de Vitoria. |
Ramón Bustamante y de la Mora (2)(5) | | 1948 | | Independent Director | | January 28, 2000 | | March 15, 2013 | | Was Director and General Manager and Non-Executive Vice-President of Argentaria and Chairman of Unitaria (1997). |
José Antonio Fernández Rivero (3)(5) | | 1949 | | Independent Director | | February 28, 2004 | | March 16, 2012 | | Chairman of Risk Committee since March 30, 2004; in 2001 was appointed Group General Manager until January 2003. Has been the director representing BBVA on the Boards of Telefónica, Iberdrola, and of Banco de Crédito Local, and Chairman of Adquira. |
Ignacio Ferrero Jordi (1)(4) | | 1945 | | Independent Director | | January 28, 2000 | | March 15, 2013 | | Chief Operating Officer of Nutrexpa, S.L., Chairman and Chief Operating Officer of La Piara S.A. and Chairman of Aneto Natural. |
Belén Garijo López (2) | | 1960 | | Independent Director | | March 16, 2012 | | Not applicable | | President and CEO of Merck Serono and Chair of the International Executive Committee of PhRMA, ISEC (Pharmaceutical Research and Manufacturers of America) since 2011. |
José Manuel González-Páramo Martínez-Murillo | | 1958 | | Executive Director | | May 29, 2013 | | March 14, 2014 | | Executive Director of BBVA since May 29, 2013. Member of the European Central Bank (ECB) Governing Council and Executive Committee from 2004 to 2012. Chairman of European DataWarehouse GmbH since 2013. Head of BBVA Global Economics, Regulation and Public Affairs. |
Carlos Loring Martínez de Irujo (2)(4) | | 1947 | | Independent Director | | February 28, 2004 | | March 14, 2014 | | Chairman of the Compensation Committee of BBVA since May 2010 (former Chairman of the Appointments and Compensation Committee). Was Partner of J&A Garrigues, from 1977 until 2004. |
127
| | | | | | | | | | |
Name (*) | | Birth Year | | Current Position | | Date Nominated | | Date Re-elected | | Present Principal Outside Occupation
and Employment History (**) |
Lourdes Máiz Carro | | 1959 | | Independent Director | | March 14, 2014 | | Not applicable | | Secretary of the Board of Directors and Director of the Legal Services at Iberia, Líneas Aéreas de España. Joined the Cuerpo de Abogados del Estado (Spanish State Counsel Corps) and from 1992 until 1993 she was Deputy to the Director in the Ministry of Public Administration. From 1993 to 2001 held various positions in the Public Administration. |
José Maldonado Ramos (1)(3)(4) | | 1952 | | External Director | | January 28, 2000 | | March 16, 2012 | | Was appointed Director and General Secretary of BBVA, in January 2000. Took early retirement as Bank executive in December 2009. |
José Luis Palao García-Suelto (2)(5) | | 1944 | | Independent Director | | February 1, 2011 | | March 14, 2014 | | Chairman of the Audit and Compliance Committee of BBVA since March 29, 2011. Senior Partner of the Financial Division in Spain of Arthur Andersen, from 1979 until 2002. Independent consultant from 2002 to 2010. |
Juan Pi Llorens (4)(5) | | 1950 | | Independent Director | | July 27, 2011 | | March 16, 2012 | | Had a professional career at IBM holding various senior posts at a national and international level including Vice President for Sales at IBM Europe, Vice President of Technology & Systems at IBM Europe and Vice President of the Finance department at GMU (Growth Markets Units) in China. He was executive chairman of IBM Spain. |
Susana Rodríguez Vidarte (1)(3)(4) | | 1955 | | Independent Director | | May 28, 2002 | | March 14, 2014 | | Full-time professor of Strategy at the School of Economics and Business Studies at Universidad de Deusto. Member of the Instituto de Contabilidad y Auditoría de Cuentas (Accountants and Auditors Institute) and PhD degree from Universidad de Deusto. |
| (*) | Juan Carlos Álvarez Mezquíriz ceased to be a member of the Board of Directors on March 14, 2014. |
| (**) | Where no date is provided, the position is currently held. |
| (1) | Member of the Executive Committee. |
| (2) | Member of the Audit and Compliance Committee. |
| (3) | Member of the Appointments Committee. |
| (4) | Member of the Compensation Committee. |
| (5) | Member of the Risk Committee. |
Executive Officers or Management Committee (Comité de Dirección)
Our executive officers were each appointed for an indefinite term. Their positions as of the date of this Annual Report on Form 20-F are as follows:
| | | | |
Name (*) | | Current Position | | Present Principal Outside Occupation and
Employment History (**) |
| Francisco González Rodríguez | | Chairman and Chief Executive Officer | | Chairman and CEO of BBVA, since January 2000; Director of Grupo Financiero BBVA Bancomer, S.A. de C.V. and BBVA Bancomer S.A., Institución de Banca Múltiple, Grupo Financiero BBVA Bancomer. |
| Ángel Cano Fernández | | President and Chief Operating Officer | | President and Chief Operating Officer of BBVA, since September 2009. Director of Grupo Financiero BBVA Bancomer S.A. de C.V., BBVA Bancomer, S.A. Institución de Banca Múltiple, Grupo Financiero BBVA Bancomer, and Türkiye Garanti Bankasi A.Ş. BBVA Director of Resources and Means from 2005 to 2009. |
128
| | | | |
Name (*) | | Current Position | | Present Principal Outside Occupation and
Employment History (**) |
| Juan Ignacio Apoita Gordo | | Head of Human Resources and Services | | BBVA Head of Human Resources and Services since September 2009. BBVA Head of Human Resources Director from 2006 to 2009. |
| Eduardo Arbizu Lostao | | Head of Legal, Audit and Compliance Services | | Head of Legal department of BBVA, since 2002; Managing Director of Barclays Retail Operations in Continental Europe (France, Spain, Portugal, Italy and Greece) from 2000 to 2002. |
| Juan Asúa Madariaga | | Head of Corporate and Investment Banking | | Head of Corporate and Investment Banking in BBVA. Head of Spain and Portugal in BBVA from 2007 to 2012. Head of Spain and Portugal in BBVA from 2006 to 2007. |
| Manuel Castro Aladro | | Head of Global Risk Management | | Head of BBVA Global Risk Management department since September 2009. Head of Business Development and Innovation in BBVA from 2003 to 2009. |
| Ignacio Deschamps González | | Head of Global Retail Business Lines & South America | | Head of Global LOBS & South America of BBVA since March 2014. Chairman of the Board of Directors and CEO of BBVA Bancomer from 2008 to 2012. Vice Chairman of the Board of Directors and CEO of BBVA Bancomer from 2006 to 2008. |
| Ricardo Gómez Barredo | | Head of Global Accounting and Information Management | | Head of Global Accounting and Information Management since 2011. Head of Planning, analysis and control of BBVA’s Group from 2006 to 2011. |
| Ignacio Moliner Robredo | | Global Communications and Brand Director | | Global Communications and Brand Director since 2012. Deputy Director of Communication and Brand department in BBVA from 2010 to 2012. Chief Executive Officer of Uno-e Bank and Consumer Finance from 2008 to 2010. |
| Ramón Monell Valls | | Head of Innovation & Technology | | Head of BBVA Innovation and Technology since September 2009. BBVA Director of Technology & Operations from 2006 to 2009. From 2002 to 2005, Chief Executive Officer of BBVA in Chile. |
| Cristina de Parias Halcón | | Head of Spain and Portugal | | Head of Spain and Portugal since March 2014. Head of the Central Region in Spain from 2011 to 2014. She joined BBVA in 1998 and has held positions in digital business development, payment systems, Uno-e and consumer finance from 1998 to 2011. |
| Vicente Rodero Rodero | | Head of Mexico | | Head of Mexico since 2011. General Manager for Commercial Banking at BBVA Spain from 2004 to 2007. Regional Manager at BBVA Madrid from 2002 to 2004. |
| Jaime Sáenz de Tejada Pulido | | Head of Strategy and Finance | | Head of Strategy and Finance since March 2014. Head of Spain and Portugal from 2012 to 2014. Business Development Manager of Spain and Portugal at BBVA from 2010 to 2012. Central Area Manager of Madrid and Castilla La Mancha from 2007 to 2010. |
| Manuel Sánchez Rodríguez | | Country Manager BBVA USA | | Chairman and CEO of BBVA Compass from 2008 to 2010 and Country Manager from 2010. From 2007 to 2008 Chief of Community Banking at BBVA Compass. Chairman and CEO of Laredo National Bank from 2005 to 2007. |
| Carlos Torres Vila | | Head of Digital Banking | | Head of Digital Banking since March 2014. BBVA Strategy & Corporate Development Director since January 2009 until March 2014. He entered in BBVA on September 2008. Corporate Director of Strategy and Chief Financial Officer at Endesa S.A. and Vice-Chairman of Endesa Chile from 2003 to 2008. |
| (*) | Manuel González Cid ceased to be a member of the Management Committee on March 20, 2014. |
| (**) | Where no date is provided, positions are currently held. |
129
The provisions of BBVA’s bylaws that relate to compensation of directors are in strict accordance with the relevant provisions of Spanish law.
Remuneration of non-executive directors received in 2013
The cash remuneration paid to the non-executive members of the Board of Directors during 2013 is indicated below in thousands of euros. The figures are given individually for each non-executive director and itemized:
| | | | | | | | | | | | | | | | | | | | | | | | | | | | |
| | | Board | | | Executive
Committee | | | Audit and
Compliance
Committee | | | Risk
Committee | | | Appointments
Committee | | | Compensation
Committee | | | Total | |
Tomás Alfaro Drake | | | 129 | | | | — | | | | 71 | | | | — | | | | 102 | | | | — | | | | 302 | |
Juan Carlos Álvarez Mezquíriz (1) | | | 129 | | | | 167 | | | | — | | | | — | | | | 41 | | | | — | | | | 336 | |
Ramón Bustamante y de la Mora | | | 129 | | | | — | | | | 71 | | | | 107 | | | | — | | | | — | | | | 307 | |
José Antonio Fernández Rivero (2) | | | 129 | | | | — | | | | — | | | | 214 | | | | 41 | | | | — | | | | 383 | |
Ignacio Ferrero Jordi | | | 129 | | | | 167 | | | | — | | | | — | | | | — | | | | 43 | | | | 338 | |
Belén Garijo López | | | 129 | | | | — | | | | 71 | | | | — | | | | — | | | | — | | | | 200 | |
Carlos Loring Martínez de Irujo | | | 129 | | | | — | | | | 71 | | | | — | | | | — | | | | 107 | | | | 307 | |
José Maldonado Ramos | | | 129 | | | | 167 | | | | — | | | | — | | | | 41 | | | | 43 | | | | 379 | |
José Luis Palao García-Suelto | | | 129 | | | | — | | | | 179 | | | | 107 | | | | — | | | | — | | | | 414 | |
Juan Pi Llorens | | | 129 | | | | — | | | | — | | | | 107 | | | | — | | | | 43 | | | | 278 | |
Susana Rodríguez Vidarte (3) | | | 129 | | | | 42 | | | | 54 | | | | — | | | | 41 | | | | 43 | | | | 308 | |
| | | | | | | | | | | | | | | | | | | | | | | | | | | | |
Total (4) | | | 1,416 | | | | 542 | | | | 518 | | | | 534 | | | | 265 | | | | 278 | | | | 3,553 | |
| | | | | | | | | | | | | | | | | | | | | | | | | | | | |
| (1) | Juan Carlos Álvarez Mezquíriz ceased to be a director on March 14, 2014. |
| (2) | In addition to the amounts listed in the table, José Antonio Fernández Rivero also received a total of €652 thousand in early retirement benefits as a former member of the BBVA management. |
| (3) | Susana Rodríguez Vidarte was appointed member of the Executive Committee on September 25, 2013, ceasing as a member of the Audit and Compliance Committee on that same date. |
| (4) | Enrique Medina Fernández, who ceased to be a director on May 29, 2013, received the total amount of €167 thousand as remuneration for his membership of the Board of Directors, the Executive Committee and the Risk Committee. |
Moreover, in 2013, €132 thousand were paid in insurance premiums for non-executive members of the Board of Directors.
Remuneration of executive directors received in 2013
The remuneration paid to executive directors during 2013 is indicated below in thousands of euros. The figures are given individually for each executive director and itemized:
| | | | | | | | | | | | | | | | | | | | | | | | | | | | |
| | | Fixed
Remuneration
in cash | | | 2012 Annual
Variable
Remuneration
in cash (1) | | | Deferred
Variable
Remuneration
in cash (2) | | | Total
Cash | | | 2012 Annual
Variable
Remuneration
in BBVA shares | | | Deferred
Variable
Remuneration
in BBVA
shares (3) | | | Total
Shares | |
Chairman and CEO | | | 1,966 | | | | 785 | | | | 379 | | | | 3,130 | | | | 108,489 | | | | 86,826 | | | | 195,315 | |
President and COO | | | 1,748 | | | | 478 | | | | 244 | | | | 2,470 | | | | 66,098 | | | | 62,963 | | | | 129,061 | |
| | | | | | | |
José Manuel González-Páramo Martínez-Murillo (*) | | | 469 | | | | — | | | | — | | | | 469 | | | | — | | | | — | | | | — | |
| | | | | | | | | | | | | | | | | | | | | | | | | | | | |
| | | | | | | |
Total | | | 4,183 | | | | 1,263 | | | | 623 | | | | 6,069 | | | | 174,587 | | | | 149,789 | | | | 324,376 | |
| | | | | | | | | | | | | | | | | | | | | | | | | | | | |
130
| (*) | José Manuel González-Páramo Martínez-Murillo was appointed BBVA director under a Board of Directors resolution adopted on May 29, 2013, and ratified by the General Shareholders Meeting held on March 14, 2014. |
| (1) | Amounts corresponding to 50% of the 2012 Annual Variable Remuneration in cash, received in 2013. |
| (2) | Equivalent to the sum of the first deferred third of 50% of the 2011 Annual Variable Remuneration in cash, received in 2013; and the amount of the value adjustments in cash for the first deferred third of 50% of the 2011 Annual Variable Remuneration, and the first deferred third of 50% of the shares of the LTI 2010-2011 (as defined below), received in 2013. |
| (3) | Equivalent to the sum of the first deferred third of 50% of the 2011 Annual Variable Remuneration, in shares, received in 2013 and of the first deferred third of 50% of the shares of the LTI 2010-2011, received in 2013. |
The Annual Variable Remuneration of the executive directors comprises an ordinary variable remuneration in cash and a variable remuneration in shares based on the BBVA Group Management Team Incentive.
Moreover, during 2013 executive directors have received remuneration in kind and other remuneration amounting to a total aggregate amount of €37 thousand, of which €13 thousand correspond to the Chairman and CEO, €23 thousand to the President and COO and €1 thousand to José Manuel González-Páramo Martínez-Murillo.
During 2013, the executive directors have received the amount of the fixed remuneration corresponding to 2013 and, in the case of the Chairman and CEO and the President and COO, the variable remuneration for 2012 to which they are entitled under the settlement and payment system approved by the General Shareholders Meeting (the “Settlement & Payment System”), which determines that:
| | • | | At least 50% of the total Annual Variable Remuneration shall be paid in BBVA shares. |
| | • | | The payment of 50% of the Annual Variable Remuneration shall be deferred in time, the deferred amount being paid in thirds over the three-year period following its settlement. |
| | • | | Shares vested pursuant to the rules explained above (except for shares in an amount equal to the tax accruing on the vesting of such shares) may not be disposed of by their beneficiaries during a period of one year after they have vested. |
| | • | | The payment of the deferred Annual Variable Remuneration payable may be limited or impeded in certain cases (malus clauses). |
| | • | | The deferred parts of the Annual Variable Remuneration will be adjusted in the terms established by the Board of Directors. |
During 2013 the Chairman and CEO and the President and COO have received the following variable remuneration:
Annual Variable Remuneration for year 2012
During 2013 the Chairman and CEO and the President and COO have received 50% of the Annual Variable Remuneration (received in cash and in shares) corresponding to 2012, as indicated in the table above.
The other 50% of the Annual Variable Remuneration for 2012 was deferred under the Settlement & Payment System to be paid, subject to the conditions described above, in thirds during the first quarter of each of 2014, 2015 and 2016. As a result, each of these years, the Chairman and CEO will receive €261,676 and 36,163 BBVA shares and the President and COO will receive €159,428 and 22,032 BBVA shares.
131
Deferred parts of the variable remuneration from previous years:
In addition, during 2013 the Chairman and CEO and the President and COO, have received the following variable remuneration in application of the Settlement & Payment System:
| | - | Annual Variable Remuneration for year 2011 |
During 2013 the Chairman and CEO and the President and COO, in application of the Settlement & Payment System, have received the first third of the 50% of their Annual Variable Remuneration, both in cash and in shares, corresponding to 2011, which was deferred to be paid during the first quarter of 2013. Under this item, after the corresponding adjustment, the Chairman and CEO received €364,519 and 51,826 shares and the President and COO received €231,847 and 32,963 shares.
The other two thirds of the 50% of the Annual Variable Remuneration corresponding to 2011 were deferred until the first quarter of 2014 and 2015, respectively, subject to the conditions mentioned above.
| | - | Multi-Year Variable Share Remuneration Program for 2010-2011 (“LTI 2010-2011”) |
Likewise, in application of the Settlement & Payment System for the LTI 2010-2011 approved by the General Shareholders Meeting of March 12, 2010, during 2013 the Chairman and CEO and the President and COO have received the first third of the 50% of the shares resulting from the settlement of the LTI 2010-2011 that were deferred, for which the Chairman and CEO received 35,000 shares and the President and COO received 30,000 shares; and the cash amount resulting from the adjustment for the updated value of these deferred shares, for which the Chairman and CEO received €14,595 and the President and COO received €12,510. The payments relating to the remaining two thirds resulting from the settlement of the LTI 2010-2011 were deferred until the first quarter of 2014 and 2015.
Annual Variable Remuneration of executive directors for year 2013
During the first quarter of 2014 the executive directors have received 50% of the Annual Variable Remuneration for 2013, i.e., €797,139 and 88,670 BBVA shares for the Chairman and CEO, €495,037 and 55,066 BBVA shares for the President and COO, and €47,683 and 5,304 BBVA shares for José Manuel González-Páramo Martínez-Murillo (who was appointed as a BBVA director on May 29, 2013). José Manuel González-Páramo Martínez-Murillo’s Annual Variable Remuneration for 2013 was calculated based on the number of months during which he has held his position as director.
The remaining 50% of the Annual Variable Remuneration for 2013 is deferred over a three-year period, such that during the first quarter of each of 2015, 2016 and 2017, the Chairman and CEO will receive the amount of €265,713 and 29,557 BBVA shares; the President and COO will receive €165,012 and 18,356 BBVA shares; and José Manuel González-Páramo Martínez-Murillo will receive €15,894 and 1,768 BBVA shares.
The payment of the deferred parts of the 2013 Annual Variable Remuneration will be subject to the conditions of the Settlement & Payment System, as approved by the General Shareholders Meeting.
Amounts expected to be paid on account of the Annual Variable Remuneration for 2013 have been recorded under the item “Other Liabilities—Accrued interest” of the consolidated balance sheet at December 31, 2013.
132
Remuneration of the members of the Management Committee received in 2013
During 2013, the remuneration paid to the members of the BBVA Management Committee as a whole, excluding the executive directors, amounted to €9,122 thousand corresponding to fixed remuneration plus the variable remuneration indicated below, pursuant to the Settlement & Payment System described above:
Annual Variable Remuneration for year 2012
During 2013, members of the BBVA Management Committee as a whole, excluding the executive directors, received a total amount of €2,597 thousand and 344,460 BBVA shares corresponding to them under the Settlement & Payment System, corresponding to the Annual Variable Remuneration for 2012.
The remaining part of the Annual Variable Remuneration for 2012 was deferred to be paid, subject to the conditions described above, in thirds during the first quarter of 2014, 2015 and 2016, such that under this item, this group as a whole will receive the amount of €814 thousand (according to the average exchange rate in force at December 31, 2013) and 112,437 BBVA shares each year.
Deferred parts of the variable remuneration from previous years
- Annual Variable Remuneration for 2011
During 2013, payment was made of one third of the deferred part of the Annual Variable Remuneration corresponding to 2011 to the members of the Management Committee. As a consequence, the members of the Management Committee as a whole, excluding the executive directors, after the corresponding adjustments, received the amount of €1,046 thousand and 149,850 BBVA shares.
The remaining Annual Variable Remuneration corresponding to 2011 was deferred to be paid in thirds during the first quarter of 2014 and 2015, respectively, under the conditions described above.
- LTI 2010-2011
Moreover, in application of the Settlement & Payment System, in 2013 the members of the Management Committee as a whole have received the shares resulting from the settlement of the LTI 2010-2011 that were deferred for payment during 2013. These amounted to a total of 98,665 shares for the Management Committee as a whole, excluding the executive directors. A further €41 thousand was paid corresponding to the adjustment of these deferred vested shares.
The payment of the remaining two thirds of the deferred shares resulting from the settlement of the LTI 2010-2011 corresponding to the members of the Management Committee as a whole was deferred and will be paid in the first quarters of 2014 and 2015, under the conditions described above.
Finally, in 2013 members of the BBVA Management Committee as a whole, excluding executive directors, received remuneration in kind amounting to a total of €799 thousand.
Scheme for remuneration for non-executive directors with deferred distribution of shares
BBVA has implemented a remuneration system with deferred distribution of shares for its non-executive directors, that was approved by the General Shareholders Meeting on March 18, 2006 and renewed for an additional five-year period through a resolution of the General Shareholders Meeting on March 11, 2011.
This system consists in the annual allocation of a number of “theoretical shares” to the non-executive directors equivalent to 20% of the total remuneration in cash received by each of them in the previous year. This is based on the average closing prices of the BBVA share during the sixty trading sessions prior to the Annual General Shareholders Meeting approving the corresponding financial statements for each year.
These shares, where applicable, will be delivered to each beneficiary on the date he or she leaves the position as director for any reason except a serious breach of duties.
133
The number of “theoretical shares” allocated in 2013 to the non-executive directors who were beneficiaries of the deferred share distribution system, corresponding to 20% of the total remuneration in cash received by said directors during 2012, are as follows:
| | | | | | | | |
| | | Theoretical Shares
allocated in 2013 | | | Accumulated
Theoretical Shares
as of December 31,
2013 | |
Tomás Alfaro Drake | | | 8,107 | | | | 36,466 | |
Juan Carlos Álvarez Mezquíriz (1) | | | 9,028 | | | | 66,562 | |
Ramón Bustamante y de la Mora | | | 8,245 | | | | 62,705 | |
José Antonio Fernández Rivero | | | 10,292 | | | | 60,516 | |
Ignacio Ferrero Jordi | | | 9,085 | | | | 67,202 | |
Belén Garijo López | | | 3,520 | | | | 3,520 | |
Carlos Loring Martínez de Irujo | | | 8,251 | | | | 50,496 | |
José Maldonado Ramos | | | 10,178 | | | | 27,866 | |
José Luis Palao García-Suelto | | | 11,122 | | | | 20,477 | |
Juan Pi Llorens | | | 7,479 | | | | 10,191 | |
Susana Rodríguez Vidarte | | | 7,618 | | | | 47,102 | |
| | | | | | | | |
Total (2) | | | 92,925 | | | | 453,103 | |
| | | | | | | | |
| (1) | Juan Carlos Álvarez Mezquíriz ceased to be a director on March 14, 2014. |
| (2) | Enrique Medina Fernández, who ceased to be a director on May 29, 2013, was also allocated 10,806 theoretical shares. |
Pension Commitments
The provisions recorded at December 31, 2013 to cover pension commitments for executive directors amounted to €23,611 thousand in the case of the President and COO and €98 thousand in the case of José Manuel González-Páramo Martínez-Murillo. €1,070 thousand and €131 thousand were set aside in 2013 for each of the President and COO and for José Manuel González-Páramo Martínez-Murillo, respectively, to cover the contingencies of retirement, disability and death.
There are no other pension obligations in favor of other executive directors.
The provisions recorded at December 31, 2013 for pension commitments for the members of the Management Committee, excluding executive directors, amounted to €91,129 thousand, of which, €8,697 thousand were provisioned during 2013.
Extinction of contractual relationship
The Bank does not have any commitments to pay severance indemnity to executive directors other than the commitment in respect of José Manuel González-Páramo Martínez-Murillo who is contractually entitled to receive an indemnity equivalent to twice his fixed annual remuneration should he cease to hold his position on grounds other than his own will, death, retirement, disability or dereliction of duty.
The contractual conditions of the President and COO determine that should he cease to hold his position for any reason other than his own will, retirement, disability or dereliction of duty, he will be given early retirement with a pension payable, as he chooses, through a lifelong annuity pension, or by payment of a lump sum that will be 75% of his pensionable salary should this occur before he is 55, and 85% should it occur after he has reached said age.
Committees
Our corporate governance system is based on the distribution of functions between the Board, the Executive Committee and the other specialized Board Committees, namely: the Audit and Compliance Committee; the Appointments Committee; the Compensation Committee; and the Risk Committee.
134
Executive Committee
Our Board of Directors is assisted in fulfilling its responsibilities by the Executive Committee (Comisión Delegada Permanente) of the Board of Directors. The Board of Directors delegates all management functions, except those that it must retain due to legal or statutory requirements, to the Executive Committee.
As of the date of this Annual Report, BBVA’s Executive Committee was comprised of two executive directors and three external directors being two of them independent, as follows:
| | |
Position | | Name |
| Chairman | | Mr. Francisco González Rodríguez |
| Members | | Mr. Ángel Cano Fernández Mr. Ignacio Ferrero Jordi Mr. José Maldonado Ramos Mrs. Susana Rodríguez Vidarte |
According to our bylaws, the Executive Committee’s responsibilities include the following: to formulate and propose policy guidelines, the criteria to be followed in the preparation of programs and to fix targets, to examine the proposals put to it in this regard, comparing and evaluating the actions and results of any direct or indirect activity carried out by the Group; to determine the volume of investment in each individual activity; to approve or reject operations, determining methods and conditions; to arrange inspections and internal or external audits of all operational areas of the Group; and in general to exercise the faculties delegated to it by the Board of Directors.
Specifically, the Executive Committee is entrusted with evaluation of our system of corporate governance. This shall be analyzed in the context of our development and of the results we have obtained, taking into account any regulations that may be passed and/or recommendations made regarding best market practices and adapting these to our specific circumstances.
The Executive Committee shall meet on the dates indicated in the annual calendar of meetings and when the chairman or acting chairman so decides. During 2013, the Executive Committee met twenty-one (21) times.
Audit and Compliance Committee
This committee shall perform the duties required under applicable laws, regulations and our bylaws. Essentially, it has authority from the Board to supervise the financial statements and the oversight of the Group.
The Board regulations establish that the Audit and Compliance Committee shall have a minimum of four non-executive directors appointed by the Board in light of their know-how and expertise in accounting, auditing and/or risk management. They shall all be independent directors, one of whom shall act as chairman, also appointed by the Board. See “Item 16.A. Audit Committee Financial Expert”.
As of the date of this Annual Report, the Audit and Compliance Committee members were:
| | |
Position | | Name |
| Chairman | | Mr. José Luis Palao García-Suelto |
| Members | | Mr. Tomás Alfaro Drake Mr. Ramón Bustamante y de la Mora Mr. Carlos Loring Martínez de Irujo Mrs. Belén Garijo López |
The scope of its functions is as follows (for purposes of the below, “entity” refers to BBVA):
| | • | | Report to the shareholders’ general meeting on matters that are raised at its meetings on matters within its competence. |
135
| | • | | Supervise the efficacy of the Company’s internal control and oversight, internal audit, where applicable, and the risk-management systems, and discuss with the auditors or audit firms any significant issues in the internal control system detected when the audit is conducted. |
| | • | | Supervise the process of drawing up and reporting regulatory financial information. |
| | • | | Propose the appointment of auditors or audit firms to the Board of Directors for it to submit the proposal to the shareholders’ general meeting, in accordance with applicable regulations. |
| | • | | Establish correct relations with the auditors or audit firms in order to receive information on any matters that may jeopardize their independence, for examination by the Committee, and any others that have to do with the process of auditing the accounts; as well as those other communications provided for in laws and standards of audit. It must unfailingly receive written confirmation by the auditors or audit firms each year of their independence with regard to the entity or entities directly or indirectly related to it and information on additional services of any kind provided to these entities by said auditors or audit firms, or by persons or entities linked to them as provided under Law 19/1988, July 12, on the auditing of accounts. |
| | • | | Each year, before the audit report is issued, to put out a report expressing an opinion on the independence of the auditors or audit firms. This report must, in all events, state the provision of any additional services referred to in the previous subsection. |
| | • | | Oversee compliance with applicable domestic and international regulations on matters related to money laundering, conduct on the securities markets, data protection and the scope of Group activities with respect to anti-trust regulations. Also to ensure that any requests for action or information made by official authorities in these matters are dealt with in due time and in due form. |
| | • | | Ensure that the internal codes of ethics and conduct and securities market trading, as they apply to Group personnel, comply with legislation and are appropriate for the Bank. |
| | • | | Especially to enforce compliance with provisions contained in BBVA Director’s Charter, and ensure that directors satisfy applicable standards regarding their conduct on the securities markets. |
| | • | | Any others that may have been allocated under these regulations or attributed to the committee by a Board of Directors resolution. |
| | • | | The committee shall also monitor the independence of external auditors. This entails the following two duties: |
| | • | | Ensuring that the auditors’ warnings, opinions and recommendations are followed. |
| | • | | Establishing the incompatibility between the provision of audit and the provision of consultancy services, unless there are no alternatives in the market to the auditors or companies in the auditors’ group of equal value in terms of their content, quality or efficiency. In such event, the committee must grant its approval, which can be done in advance by delegation to its chairman. |
The committee selects the external auditor for the Bank and its Group, and for all the Group companies. It must verify that the audit schedule is being carried out under the service agreement and that it satisfies the requirements of the competent authorities and the Bank’s governing bodies. The committee will also require the auditors, at least once each year, to assess the quality of the Group’s internal oversight procedures.
The Audit and Compliance Committee meets as often as necessary to comply with its tasks, although an annual meeting schedule is drawn up in accordance with its duties. During 2013, the Audit and Compliance Committee met twelve (12) times.
136
Executives responsible for control, internal audit and regulatory compliance can be invited to attend its meetings and, at the request of these executives, other staff from these departments who have particular knowledge or responsibility in the matters contained in the agenda, can also be invited when their presence at the meeting is deemed appropriate. However, only the committee members and the secretary shall be present when the results and conclusions of the meeting are evaluated.
The committee may engage external advisory services for relevant issues when it considers that these cannot be properly provided by experts or technical staff within the Group on grounds of specialization or independence.
Likewise, the committee can call on the personal cooperation and reports of any member of the Management Committee when it considers that this is necessary to carry out its functions with regard to relevant issues.
The committee has its own specific regulations, approved by the Board of Directors. These are available on our website and, amongst other things, regulate its operation.
Appointments Committee
The Appointments Committee is tasked with assisting the Board on issues related to the appointment and re-election of Board members.
This committee shall comprise a minimum of three members who shall be external directors appointed by the Board, which shall also appoint its chairman. However, the chairman and the majority of its members must be independent directors, in compliance with the Board regulations.
As of the date of this Annual Report, the members of the Appointments Committee were:
| | |
Position | | Name |
| Chairman | | Mr. Tomás Alfaro Drake |
| Members | | Mr. José Antonio Fernández Rivero Mr. José Maldonado Ramos Mrs. Susana Rodríguez Vidarte |
The duties of the Appointments Committee are as follows:
| | • | | Draw up and report proposals for appointment and re-election of directors. |
To such end, the Committee will evaluate the skills, knowledge and experience that the Board requires, as well as the conditions that candidates should display to fill the vacancies arising.
The Committee will ensure that the selection procedures are not marred by implicit biases that may hinder the selection of female directors to fill vacancies, while trying to ensure that women who possess the professional profile sought are included on the shortlists when there are no or few current female directors.
When drafting proposals for the appointment and re-election of directors, the Committee will consider applications for potential candidates submitted by current Board members when appropriate.
| | • | | Review the status of each director each year, so that this may be reflected in the annual report on corporate governance. |
| | • | | Report on the performance of the Chairman of the Board and, where applicable, the Company’s CEO, such that the Board can make its periodic assessment, under the terms established in the Board regulations. |
| | • | | Should the chairmanship of the Board or the post of CEO fall vacant, the Committee will examine or organize, in the manner it deems suitable, the succession of the Chairman and/or CEO and make corresponding proposals to the Board for an orderly, well-planned succession. |
137
| | • | | Report any appointment and separation of senior managers. |
| | • | | Any others that may have been allocated under the Board regulations or attributed to the Committee by a Board of Directors resolution. |
In the performance of its duties, the Appointments Committee will consult with the Chairman of the Board and, where applicable, the CEO via the committee chair, especially with respect to matters related to executive directors and senior managers.
In accordance with our Board regulations, the Committee may ask members of the BBVA Group to attend its meetings, when their responsibilities relate to its duties. It may also receive any advisory services it requires to inform its criteria on issues falling within the scope of its powers.
The chair of the Appointments Committee will convene it as often as necessary to comply with its functions although an annual meeting schedule will be drawn up in accordance with its duties. During 2013, the Appointments Committee met five (5) times.
Compensation Committee
The Compensation Committee’s essential function is to assist the Board on matters regarding the remuneration policy for directors and senior management. It seeks to ensure that the remuneration policy established by the Company is duly observed.
The Committee will comprise a minimum of three members who will be external directors appointed by the Board, which will also appoint its chair. The chair and the majority of its members must be independent directors, in compliance with the Board regulations.
As of the date of this Annual Report, the members of the Compensation Committee were:
| | |
Position | | Name |
| Chairman | | Mr. Carlos Loring Martínez de Irujo |
| Members | | Mr. Ignacio Ferrero Jordi Mr. José Maldonado Ramos Mr. Juan Pi Llorens Mrs. Susana Rodríguez Vidarte |
The scope of the functions of the Compensation Committee is as follows:
| | • | | Propose the remuneration system for the Board of Directors as a whole, in accordance with the principles established in the Company bylaws, their amounts and method of payment. |
| | • | | Determine the extent and amount of the remuneration, entitlements and other economic rewards for the Chairman and CEO, the President and COO and, where applicable, other executive directors of the Bank, so that these can be reflected in their contracts. The Committee’s proposals on such matters will be submitted to the Board of Directors. |
| | • | | Issue a report on the directors’ remuneration policy each year. This will be submitted to the Board of Directors, which will apprise the Company’s annual shareholders’ general meeting of this. |
| | • | | Propose the remuneration policy for senior management to the Board, and the basic terms and conditions to be contained in their contracts, directly supervising the remuneration of the senior managers responsible for risk management and with compliance functions within the Bank. |
| | • | | Propose the remuneration policy to the Board for employees whose professional activities may have a significant impact on the Bank’s risk profile. |
138
| | • | | Oversee observance of the remuneration policy established by the Company and periodically review the remuneration policy applied to executive directors, senior management and employees whose professional activities may have a significant impact on the Bank’s risk profile. |
| | • | | Any others that may have been allocated under the Board regulations or attributed to the Committee by a Board of Directors resolution. |
In the performance of its duties, the Compensation Committee will consult with the Chairman of the Board and, where applicable, the Company’s CEO via the Committee chair, especially with respect to matters related to executive directors and senior managers.
Pursuant to our Board regulations, the Committee may ask members of the BBVA Group to attend its meetings, when their responsibilities relate to its duties. It may also receive any advisory services it requires to inform its criteria on matters falling within the scope of its powers.
The chair of the Compensation Committee will convene it as often as necessary to comply with its functions although an annual meeting schedule will be drawn up in accordance with its duties. During 2013, the Compensation Committee met six (6) times.
Risk Committee
The Board’s Risk Committee is tasked with the analysis of issues related to our risk management and control policy and strategy. It assesses and approves any risk transactions that may be significant.
The Risk Committee shall have a majority of external directors, with a minimum of three members, appointed by the Board of Directors, which shall also appoint its chairman.
As of the date of this Annual Report, the members of the Risk Committee were:
| | |
Position | | Name |
| Chairman | | Mr. José Antonio Fernández Rivero |
| Members | | Mr. Ramón Bustamante y de la Mora Mr. José Luis Palao García-Suelto Mr. Juan Pi Llorens |
Under the Board regulations, it has the following duties:
| | • | | Analyze and evaluate proposals related to our risk management and oversight policies and strategy. In particular, these shall identify: |
| | b) | the setting of the level of risk considered acceptable according to the risk profile (expected loss) and capital map (risk capital) broken down by our businesses and areas of activity; |
| | c) | the internal information and oversight systems used to oversee and manage risks; and |
| | d) | the measures established to mitigate the impact of risks identified should they materialize. |
| | • | | Monitor the match between risks accepted and the profile established. |
| | • | | Assess and approve, where applicable, any risks whose size could compromise our capital adequacy or recurrent earnings, or that present significant potential operational or reputational risks. |
| | • | | Check that we possess the means, systems, structures and resources benchmarked against best practices to allow implementation of its risk management strategy. |
139
Pursuant to our Board regulations, the Committee may request the attendance at its sessions of persons with positions in the group that are related to the Committee’s functions. It may also obtain advice as necessary to establish criteria related to its functions.
The committee meets as often as necessary to best perform its duties, usually once a week. In 2013, it held forty-three (43) meetings.
As of December 31, 2013, we, through our various affiliates, had 109,305 employees. Approximately 86% of our employees in Spain held technical, managerial and executive positions, while the remainder were clerical and support staff. The table below sets forth the number of BBVA employees by geographic area.
| | | | | | | | | | | | | | | | |
Country | | BBVA | | | Banks | | | Companies | | | Total | |
| | | | |
Spain | | | 26,953 | | | | 46 | | | | 3,377 | | | | 30,376 | |
United Kingdom | | | 169 | | | | — | | | | — | | | | 169 | |
France | | | 89 | | | | — | | | | — | | | | 89 | |
Italy | | | 52 | | | | — | | | | 32 | | | | 84 | |
Germany | | | 38 | | | | — | | | | — | | | | 38 | |
Switzerland | | | — | | | | 136 | | | | — | | | | 136 | |
Portugal | | | — | | | | 831 | | | | — | | | | 831 | |
Belgium | | | 31 | | | | — | | | | — | | | | 31 | |
Russia | | | 2 | | | | — | | | | — | | | | 2 | |
Ireland | | | — | | | | 5 | | | | — | | | | 5 | |
Luxembourg | | | 3 | | | | — | | | | — | | | | 3 | |
Turkey | | | 18 | | | | — | | | | — | | | | 18 | |
| | | | | | | | | | | | | | | | |
Total Europe | | | 27,355 | | | | 1,018 | | | | 3,409 | | | | 31,782 | |
| | | | | | | | | | | | | | | | |
| | | | |
United States | | | 163 | | | | 11,129 | | | | — | | | | 11,292 | |
| | | | | | | | | | | | | | | | |
| | | | |
Panama | | | — | | | | — | | | | — | | | | — | |
Puerto Rico | | | — | | | | — | | | | — | | | | — | |
Argentina | | | — | | | | 5,426 | | | | — | | | | 5,426 | |
Brazil | | | 3 | | | | — | | | | 5 | | | | 8 | |
Colombia | | | — | | | | 6,019 | | | | — | | | | 6,019 | |
Venezuela | | | — | | | | 5,326 | | | | — | | | | 5,326 | |
Mexico | | | — | | | | 37,519 | | | | — | | | | 37,519 | |
Uruguay | | | — | | | | 587 | | | | — | | | | 587 | |
Paraguay | | | — | | | | 488 | | | | — | | | | 488 | |
Bolivia | | | — | | | | — | | | | 250 | | | | 250 | |
Chile | | | — | | | | 4,567 | | | | — | | | | 4,567 | |
Cuba | | | 1 | | | | — | | | | — | | | | 1 | |
Peru | | | — | | | | 5,819 | | | | — | | | | 5,819 | |
Ecuador | | | — | | | | — | | | | — | | | | — | |
| | | | | | | | | | | | | | | | |
Total Latin America | | | 4 | | | | 65,751 | | | | 255 | | | | 66,010 | |
| | | | | | | | | | | | | | | | |
| | | | |
Hong Kong | | | 142 | | | | — | | | | — | | | | 142 | |
Japan | | | 9 | | | | — | | | | — | | | | 9 | |
China | | | 9 | | | | — | | | | 18 | | | | 27 | |
Singapore | | | 9 | | | | — | | | | — | | | | 9 | |
India | | | 4 | | | | — | | | | — | | | | 4 | |
South Korea | | | 19 | | | | — | | | | — | | | | 19 | |
140
| | | | | | | | | | | | | | | | |
Country | | BBVA | | | Banks | | | Companies | | | Total | |
United Arab Emirates | | | 1 | | | | — | | | | — | | | | 1 | |
Taiwan | | | 7 | | | | — | | | | — | | | | 7 | |
| | | | | | | | | | | | | | | | |
Total Asia | | | 200 | | | | — | | | | 18 | | | | 218 | |
| | | | | | | | | | | | | | | | |
| | | | |
Australia | | | 3 | | | | — | | | | — | | | | 3 | |
| | | | | | | | | | | | | | | | |
Total Oceania | | | 3 | | | | — | | | | — | | | | 3 | |
| | | | | | | | | | | | | | | | |
| | | | |
Total | | | 27,725 | | | | 77,898 | | | | 3,682 | | | | 109,305 | |
| | | | | | | | | | | | | | | | |
As of December 31, 2012, we, through our various affiliates, had 115,852 employees. Approximately 85% of our employees in Spain held technical, managerial and executive positions, while the remainder were clerical and support staff. The table below sets forth the number of BBVA employees by geographic area.
| | | | | | | | | | | | | | | | |
Country | | BBVA | | | Banks | | | Companies | | | Total | |
| | | | |
Spain | | | 25,841 | | | | 2,947 | | | | 2,909 | | | | 31,697 | |
United Kingdom | | | 166 | | | | — | | | | — | | | | 166 | |
France | | | 94 | | | | — | | | | — | | | | 94 | |
Italy | | | 54 | | | | — | | | | 168 | | | | 222 | |
Germany | | | 46 | | | | — | | | | — | | | | 46 | |
Switzerland | | | — | | | | 131 | | | | — | | | | 131 | |
Portugal | | | — | | | | 855 | | | | — | | | | 855 | |
Belgium | | | 34 | | | | — | | | | — | | | | 34 | |
Russia | | | 3 | | | | — | | | | — | | | | 3 | |
Ireland | | | — | | | | 5 | | | | — | | | | 5 | |
Luxembourg | | | 3 | | | | — | | | | — | | | | 3 | |
Turkey | | | 16 | | | | — | | | | — | | | | 16 | |
| | | | | | | | | | | | | | | | |
Total Europe | | | 26,257 | | | | 3,938 | | | | 3,077 | | | | 33,272 | |
| | | | | | | | | | | | | | | | |
| | | | |
United States | | | 204 | | | | 11,384 | | | | — | | | | 11,588 | |
| | | | | | | | | | | | | | | | |
| | | | |
Panama | | | — | | | | 378 | | | | — | | | | 378 | |
Puerto Rico | | | — | | | | — | | | | — | | | | — | |
Argentina | | | — | | | | 5,371 | | | | — | | | | 5,371 | |
Brazil | | | 3 | | | | — | | | | 6 | | | | 9 | |
Colombia | | | — | | | | 6,460 | | | | — | | | | 6,460 | |
Venezuela | | | — | | | | 5,316 | | | | — | | | | 5,316 | |
Mexico | | | — | | | | 39,244 | | | | — | | | | 39,244 | |
Uruguay | | | — | | | | 585 | | | | — | | | | 585 | |
Paraguay | | | — | | | | 495 | | | | — | | | | 495 | |
Bolivia | | | — | | | | — | | | | 249 | | | | 249 | |
Chile | | | — | | | | 6,256 | | | | — | | | | 6,256 | |
Cuba | | | 1 | | | | — | | | | — | | | | 1 | |
Peru | | | — | | | | 6,162 | | | | — | | | | 6,162 | |
Ecuador | | | — | | | | — | | | | 221 | | | | 221 | |
| | | | | | | | | | | | | | | | |
Total Latin America | | | 4 | | | | 70,267 | | | | 476 | | | | 70,747 | |
| | | | | | | | | | | | | | | | |
| | | | |
Hong Kong | | | 164 | | | | — | | | | — | | | | 164 | |
Japan | | | 10 | | | | — | | | | — | | | | 10 | |
China | | | 12 | | | | — | | | | 17 | | | | 29 | |
Singapore | | | 9 | | | | — | | | | — | | | | 9 | |
India | | | 4 | | | | — | | | | — | | | | 4 | |
South Korea | | | 18 | | | | — | | | | — | | | | 18 | |
United Arab Emirates | | | 1 | | | | — | | | | — | | | | 1 | |
Taiwan | | | 8 | | | | — | | | | — | | | | 8 | |
| | | | | | | | | | | | | | | | |
Total Asia | | | 226 | | | | — | | | | 17 | | | | 243 | |
| | | | | | | | | | | | | | | | |
141
| | | | | | | | | | | | | | | | |
Country | | BBVA | | | Banks | | | Companies | | | Total | |
Australia | | | 2 | | | | — | | | | — | | | | 2 | |
| | | | | | | | | | | | | | | | |
Total Oceania | | | 2 | | | | — | | | | — | | | | 2 | |
| | | | | | | | | | | | | | | | |
| | | | |
Total | | | 26,693 | | | | 85,589 | | | | 3,570 | | | | 115,852 | |
| | | | | | | | | | | | | | | | |
As of December 31, 2011, we, through our various affiliates, had 110,645 employees. Approximately 84% of our employees in Spain held technical, managerial and executive positions, while the remainder were clerical and support staff. The table below sets forth the number of BBVA employees by geographic area.
| | | | | | | | | | | | | | | | |
Country | | BBVA | | | Banks | | | Companies | | | Total | |
| | | | |
Spain | | | 26,188 | | | | 19 | | | | 2,727 | | | | 28,934 | |
United Kingdom | | | 162 | | | | — | | | | — | | | | 162 | |
France | | | 98 | | | | — | | | | — | | | | 98 | |
Italy | | | 55 | | | | — | | | | 226 | | | | 281 | |
Germany | | | 51 | | | | — | | | | — | | | | 51 | |
Switzerland | | | — | | | | 127 | | | | — | | | | 127 | |
Portugal | | | — | | | | 877 | | | | — | | | | 877 | |
Belgium | | | 37 | | | | — | | | | — | | | | 37 | |
Russia | | | 4 | | | | — | | | | — | | | | 4 | |
Ireland | | | — | | | | 5 | | | | — | | | | 5 | |
Luxembourg | | | 3 | | | | — | | | | — | | | | 3 | |
Turkey | | | 11 | | | | — | | | | — | | | | 11 | |
| | | | | | | | | | | | | | | | |
Total Europe | | | 26,609 | | | | 1,028 | | | | 2,953 | | | | 30,590 | |
| | | | | | | | | | | | | | | | |
| | | | |
United States | | | 228 | | | | 11,947 | | | | — | | | | 12,175 | |
| | | | | | | | | | | | | | | | |
| | | | |
Panama | | | — | | | | 365 | | | | — | | | | 365 | |
Puerto Rico | | | — | | | | 906 | | | | — | | | | 906 | |
Argentina | | | — | | | | 5,896 | | | | — | | | | 5,896 | |
Brazil | | | 3 | | | | — | | | | 13 | | | | 16 | |
Colombia | | | — | | | | 6,151 | | | | — | | | | 6,151 | |
Venezuela | | | — | | | | 5,398 | | | | — | | | | 5,398 | |
Mexico | | | — | | | | 35,950 | | | | — | | | | 35,950 | |
Uruguay | | | — | | | | 542 | | | | — | | | | 542 | |
Paraguay | | | — | | | | 452 | | | | — | | | | 452 | |
Bolivia | | | — | | | | — | | | | 206 | | | | 206 | |
Chile | | | — | | | | 5,710 | | | | — | | | | 5,710 | |
Cuba | | | 1 | | | | — | | | | — | | | | 1 | |
Peru | | | — | | | | 5,769 | | | | — | | | | 5,769 | |
Ecuador | | | — | | | | — | | | | 235 | | | | 235 | |
| | | | | | | | | | | | | | | | |
Total Latin America | | | 4 | | | | 67,139 | | | | 454 | | | | 67,597 | |
| | | | | | | | | | | | | | | | |
| | | | |
Hong Kong | | | 198 | | | | — | | | | — | | | | 198 | |
Japan | | | 11 | | | | — | | | | — | | | | 11 | |
China | | | 16 | | | | — | | | | 16 | | | | 32 | |
Singapore | | | 15 | | | | — | | | | — | | | | 15 | |
India | | | 5 | | | | — | | | | — | | | | 5 | |
South Korea | | | 18 | | | | — | | | | — | | | | 18 | |
| | | | | | | | | | | | | | | | |
Total Asia | | | 263 | | | | — | | | | 16 | | | | 279 | |
| | | | | | | | | | | | | | | | |
| | | | |
Australia | | | 4 | | | | — | | | | — | | | | 4 | |
| | | | | | | | | | | | | | | | |
Total Oceania | | | 4 | | | | — | | | | — | | | | 4 | |
| | | | | | | | | | | | | | | | |
| | | | |
Total | | | 27,108 | | | | 80,114 | | | | 3,423 | | | | 110,645 | |
| | | | | | | | | | | | | | | | |
142
The terms and basic conditions of employment in private sector banks in Spain are negotiated with trade unions representing sector bank employees. Wage negotiations take place on an industry-wide basis. This process has historically produced collective bargaining agreements binding upon all Spanish banks and their employees. On March 14, 2012, the XXII collective bargain agreement was signed. This agreement became effective on January 1, 2011 and will remain in effect until December 31, 2014.
As of December 31, 2013, 2012 and 2011, we had 1,014, 1,145 and 1,689 temporary employees in our Spanish offices, respectively.
As of April 25, 2014, the members of the Board of Directors owned an aggregate of BBVA shares as shown in the table below:
| | | | | | | | | | | | | | | | |
Name | | Directly owned
shares | | | Indirectly owned
shares | | | Total shares | | | % Capital Stock | |
Francisco González Rodríguez | | | 1,785,832 | | | | 1,538,481 | | | | 3,324,313 | | | | 0.056 | |
Ángel Cano Fernández | | | 787,920 | | | | — | | | | 787,920 | | | | 0.013 | |
Tomás Alfaro Drake | | | 15,509 | | | | — | | | | 15,509 | | | | 0.000 | |
Ramón Bustamante y de la Mora | | | 13,939 | | | | 2,747 | | | | 16,686 | | | | 0.000 | |
José Antonio Fernández Rivero | | | 68,754 | | | | — | | | | 68,754 | | | | 0.001 | |
Ignacio Ferrero Jordi | | | 4,370 | | | | 82,613 | | | | 86,983 | | | | 0.001 | |
Belén Garijo López | | | — | | | | — | | | | — | | | | — | |
José Manuel González-Páramo Martínez-Murillo | | | 6,439 | | | | — | | | | 6,439 | | | | 0.000 | |
Carlos Loring Martínez de Irujo | | | 53,836 | | | | — | | | | 53,836 | | | | 0.001 | |
Lourdes Máiz Carro | | | — | | | | — | | | | — | | | | — | |
José Maldonado Ramos | | | 73,264 | | | | — | | | | 73,264 | | | | 0.001 | |
José Luis Palao García-Suelto | | | 10,091 | | | | — | | | | 10,091 | | | | 0.000 | |
Juan Pi Llorens | | | 26,690 | | | | — | | | | 26,690 | | | | 0.000 | |
Susana Rodríguez Vidarte | | | 24,352 | | | | 896 | | | | 25,248 | | | | 0.000 | |
| | | | | | | | | | | | | | | | |
TOTAL(*) | | | 2,870,996 | | | | 1,624,737 | | | | 4,495,733 | | | | 0.076 | |
| | | | | | | | | | | | | | | | |
| (*) | In addition to the amounts listed in the table, Juan Carlos Álvarez Mezquíriz, who ceased to be a director on March 14, 2014, directly owned 189,069 shares on that same date. |
BBVA has not granted options on its shares to any members of its administrative, supervisory or Management bodies. Information regarding the variable share-based remuneration system for BBVA’s executive team, including the executive director’s and the LTI 2010-2011, is provided under “Compensation”.
As of April 25, 2014, the Management Committee (excluding executive directors) and their families owned 2,086,409 shares (including in the form of ADSs). None of the members of our Management Committee held 1% or more of BBVA’s shares as of such date.
As of April 25, 2014 a total of 22,702 employees (excluding the members of the Management Committee and executive directors) owned 57,877,173 shares, which represents 0.98% of our capital stock.
| ITEM 7. | MAJOR SHAREHOLDERS AND RELATED PARTY TRANSACTIONS |
As of April 25, 2014, no person, corporation or government beneficially owned, directly or indirectly, five percent or more of BBVA’s shares. BBVA’s major shareholders do not have voting rights which are different from
143
those held by the rest of its shareholders. To the extent known to us, BBVA is not controlled, directly or indirectly, by any other corporation, government or any other natural or legal person. As of April 25, 2014, there were 970,112 registered holders of BBVA’s shares, with an aggregate of 5,887,168,710 shares, of which 455 shareholders with registered addresses in the United States held a total of 1,617,434,139 shares (including shares represented by American Depositary Receipts (“ADRs”)). Since certain of such shares and ADRs are held by nominees, the foregoing figures are not representative of the number of beneficial holders.
| B. | Related Party Transactions |
Loans to Directors, Executive Officers and Other Related Parties
As of December 31, 2013, the amount disposed of the loans granted by the Group’s entities to the members of the Board of Directors was €141 thousand. As of December 31, 2012 and 2011 there were no loans granted by the Group’s credit institutions to the members of the Bank’s Board of Directors. As of December 31, 2013, 2012 and 2011, the amount disposed of the loans granted by the Group’s entities to the members of the Management Committee (excluding the executive directors) amounted to €6,076 thousand, €7,401 thousand and €6,540 thousand, respectively.
As of December 31, 2013, 2012 and 2011 the amount disposed of the loans granted to parties related to the members of the Bank’s Board of Directors amounted to €6,939 thousand, €13,152 thousand and €20,593 thousand, respectively. As of these dates, there were no loans granted to parties linked to members of the Bank’s Management Committee.
As of December 31, 2013, 2012 and 2011 no guarantees had been granted to any member of the Board of Directors.
As of December 31, 2013 and 2012, no guarantees had been granted to any member of the Management Committee. As of December 31, 2011 guarantees totaling €9 thousand had been granted to any member of the Management Committee.
As of December 31, 2013, 2012 and 2011, the amount disposed under guarantees and commercial loan transactions arranged with parties related to the members of the Bank’s Board of Directors and Management Committee totaled €5,192 thousand, €3,327 thousand and €10,825 thousand, respectively.
Related Party Transactions in the Ordinary Course of Business
Loans extended to related parties were made in the ordinary course of business, on substantially the same terms, including interest rates and collateral, as those prevailing at the time for comparable transactions with other persons, and did not involve more than the normal risk of collectability or present other unfavorable features.
BBVA subsidiaries engage, on a regular and routine basis, in a number of customary transactions with other BBVA subsidiaries, including:
| | • | | overnight call deposits; |
| | • | | foreign exchange purchases and sales; |
| | • | | derivative transactions, such as forward purchases and sales; |
| | • | | money market fund transfers; |
| | • | | letters of credit for imports and exports; |
and other similar transactions within the scope of the ordinary course of the banking business, such as loans and other banking services to our shareholders, to employees of all levels, to the associates and family members of all the above and to other BBVA non-banking subsidiaries or affiliates. All these transactions have been made:
| | • | | in the ordinary course of business; |
144
| | • | | on substantially the same terms, including interest rates and collateral, as those prevailing at the time for comparable transactions with other persons; and |
| | • | | did not involve more than the normal risk of collectability or present other unfavorable features. |
| C. | Interests of Experts and Counsel |
Not Applicable.
| ITEM 8. | FINANCIAL INFORMATION |
| A. | Consolidated Statements and Other Financial Information |
Financial Information
See Item 18.
Dividends
The table below sets forth the amount of interim, final and total cash dividends paid by BBVA on its shares for the years 2009 to 2013. The rate used to convert euro amounts to dollars was the noon buying rate at the end of each year.
| | | | | | | | | | | | | | | | | | | | | | | | | | | | | | | | | | | | | | | | |
| | | Per Share | |
| | | First Interim | | | Second Interim | | | Third Interim | | | Final | | | Total | |
| | | € | | | $ | | | € | | | $ | | | € | | | $ | | | € | | | $ | | | € | | | $ | |
2009 | | € | 0.090 | | | $ | 0.129 | | | € | 0.090 | | | $ | 0.129 | | | € | 0.090 | | | $ | 0.129 | | | € | 0.150 | | | $ | 0.215 | | | € | 0.420 | | | $ | 0.602 | |
2010 | | € | 0.090 | | | $ | 0.119 | | | € | 0.090 | | | $ | 0.119 | | | € | 0.090 | | | $ | 0.119 | | | | | (*) | | | ( | *) | | € | 0.270 | | | $ | 0.358 | |
2011 | | € | 0.100 | | | $ | 0.130 | | | | | (*) | | | | (*) | | € | 0.100 | | | $ | 0.130 | | | | | (*) | | | ( | *) | | € | 0.200 | | | $ | 0.259 | |
2012 | | € | 0.100 | | | $ | 0.132 | | | | | (*) | | | | (*) | | € | 0.100 | | | $ | 0.132 | | | | | (*) | | | ( | *) | | € | 0.200 | | | $ | 0.264 | |
2013 | | € | 0.100 | | | $ | 0.138 | | | | | (*) | | | | (*) | | | — | | | | — | | | | | (*) | | | ( | *) | | € | 0.100 | | | $ | 0.138 | |
| (*) | In execution of the 2011, 2012, 2013 and 2014 “Dividend Option” schemes described under “Item 4. Information on the Company—Business Overview —Supervision and Regulation—Dividends” approved by the shareholders in the respective general shareholders meetings, BBVA shareholders were given the option to receive their remuneration in newly issued free-of-charge shares or in cash. |
We have paid annual dividends to our shareholders since the date we were founded. The cash dividend for a year is proposed by the Board of Directors to be approved by the general shareholders meeting following the end of the year to which it relates. The scrip dividends are proposed for approval of our shareholders in the general shareholders meeting, for being implemented during a period of one year from their approval. Interim and final dividends are payable to holders of record on the record date for the dividend payment date. Unclaimed cash dividends revert to BBVA five years after declaration. For additional information see “Item 4. Information on the Company—Business Overview—Supervision and Regulation—Dividends”.
While we expect to declare and pay dividends (in cash or scrip) on our shares in the future, the payment of dividends will depend upon our earnings, financial condition, governmental regulations and policies or possible recommendations on dividend payouts that may be adopted by the Bank of Spain or any other domestic or European regulatory body or authority and other factors.
As described under “Item 4. Information on the Company—Business Overview—Supervision and Regulation—Dividends”, the annual shareholders’ general meeting held on March 14, 2014 passed four resolutions adopting a new scrip dividend scheme called “Dividend Option” on similar terms as 2013, 2012 and 2011 “Dividend
145
Option” schemes. Accordingly, the “Dividend Option” is implemented as an alternative remuneration scheme for BBVA shareholders with the aim to provide BBVA shareholders with a flexible option to receive newly issued free-of-charge shares of the Bank, without thereby altering BBVA’s cash remuneration policy.
Subject to the terms of the deposit agreement entered into with the Bank of New York Mellon, holders of ADSs are entitled to receive dividends (in cash or scrip) attributable to the shares represented by the ADSs evidenced by American Depositary Receipts (“ADRs”) to the same extent as if they were holders of such shares.
For a description of BBVA’s access to the funds necessary to pay dividends on the shares, see “Item 4. Information on the Company—Business Overview—Supervision and Regulation—Dividends”. In addition, BBVA may not pay dividends except out of its unrestricted reserves available for the payment of dividends, after taking into account the Bank of Spain’s capital adequacy requirements and its recommendations on payment dividends, and any other required authorization. Capital adequacy requirements are applied by the Bank of Spain on both a consolidated and individual basis. See “Item 4. Information on the Company—Business Overview—Supervision and Regulation—Capital Requirements” and “Item 5. Operating and Financial Review and Prospects—Liquidity and Capital Resources—Capital”. Under Spain’s capital adequacy requirements, we estimate that as of December 31, 2013, BBVA had approximately €18 billion of reserves in excess of applicable capital and reserve requirements, which were not restricted as to the payment of dividends.
Legal Proceedings
As mentioned in “Item 3. Key Information—Risk Factors—Risks Relating to Us and Our Business—We are party to lawsuits, tax claims and other legal proceedings”, we operate in an increasingly regulated and litigious environment with a potential exposure to liability and other costs, which may not be easy to estimate. In this environment, the entities of the Group are party to legal actions, arising from the ordinary course of business, in a number of jurisdictions (including, among others, Spain, Mexico and the United States). While we cannot predict the outcome of these proceedings, according to the procedural status of these proceedings and the criteria of legal counsel, BBVA considers that currently (i) none of such actions is material, individually or in the aggregate, and none is expected to result in a material adverse effect on the Group’s financial position, results of operations or liquidity, either individually or in the aggregate and (ii) adequate provisions have been made in respect of such legal proceedings and considers that the possible contingencies that may arise from such on-going lawsuits are not significant enough to require disclosure to the markets.
No significant change has occurred since the date of the Consolidated Financial Statements other than those mentioned in our Consolidated Financial Statements.
| ITEM 9. | THE OFFER AND LISTING |
| A. | Offer and Listing Details |
BBVA’s shares are listed on the Spanish stock exchanges in Madrid, Bilbao, Barcelona and Valencia (the “Spanish Stock Exchanges”) and listed on the computerized trading system of the Spanish Stock Exchanges (the “Automated Quotation System”). BBVA’s shares are also listed on the Mexican and London stock exchanges as well as quoted on SEAQ International in London. BBVA’s shares are listed on the New York Stock Exchange as American Depositary Shares (ADSs).
ADSs are listed on the New York Stock Exchange and are also traded on the Lima (Peru) Stock Exchange, by virtue of an exchange agreement entered into between these two exchanges. Each ADS represents the right to receive one share.
146
Fluctuations in the exchange rate between the euro and the dollar will affect the dollar equivalent of the euro price of BBVA’s shares on the Spanish Stock Exchanges and the price of BBVA’s ADSs on the New York Stock Exchange. Cash dividends are paid by BBVA in euro, and exchange rate fluctuations between the euro and the dollar will affect the dollar amounts received by holders of ADRs on conversion by The Bank of New York Mellon (acting as depositary) of cash dividends on the shares underlying the ADSs evidenced by such ADRs.
The table below sets forth, for the periods indicated, the high and low sales closing prices for the shares of BBVA on the Automated Quotation System.
| | | | | | | | |
| | | Euro per Share | |
| | | High | | | Low | |
| | |
Fiscal year ended December 31, 2009 | | | | | | | | |
Annual | | | 13.17 | | | | 4.68 | |
Fiscal year ended December 31, 2010 | | | | | | | | |
Annual | | | 13.15 | | | | 7.08 | |
Fiscal year ended December 31, 2011 | | | | | | | | |
Annual | | | 9.43 | | | | 5.14 | |
Fiscal year ended December 31, 2012 | | | | | | | | |
Annual | | | 7.30 | | | | 4.43 | |
First Quarter | | | 7.30 | | | | 5.86 | |
Second Quarter | | | 5.97 | | | | 4.57 | |
Third Quarter | | | 6.68 | | | | 4.43 | |
Fourth Quarter | | | 7.04 | | | | 5.92 | |
Fiscal year ended December 31, 2013 | | | | | | | | |
Annual | | | 9.33 | | | | 6.24 | |
First Quarter | | | 7.82 | | | | 6.76 | |
Second Quarter | | | 7.56 | | | | 6.27 | |
Third Quarter | | | 8.43 | | | | 6.24 | |
Fourth Quarter | | | 9.33 | | | | 8.21 | |
Month ended October 31, 2013 | | | 9.33 | | | | 8.43 | |
Month ended November 30, 2013 | | | 8.86 | | | | 8.35 | |
Month ended December 31, 2013 | | | 8.97 | | | | 8.21 | |
Fiscal year ended December 31, 2014 | | | | | | | | |
Month ended January 31, 2014 | | | 9.93 | | | | 8.65 | |
Month ended February 28, 2014 | | | 9.17 | | | | 8.56 | |
Month ended March 31, 2014 | | | 9.20 | | | | 8.60 | |
Month ended April 30, 2014 (through April 28) | | | 9.28 | | | | 8.72 | |
From January 1, 2013 through December 31, 2013 the percentage of outstanding shares held by BBVA and its affiliates ranged between 0.000% and 0.718%, calculated on a daily basis. As of April 3, 2014, the percentage of outstanding shares held by BBVA and its affiliates was 0.176%.
147
The table below sets forth the reported high and low sales closing prices for the ADSs of BBVA on the New York Stock Exchange for the periods indicated.
| | | | | | | | |
| | | U.S. Dollars
per ADS | |
| | | High | | | Low | |
| | |
Fiscal year ended December 31, 2009 | | | | | | | | |
Annual | | | 19.69 | | | | 5.76 | |
Fiscal year ended December 31, 2010 | | | | | | | | |
Annual | | | 18.99 | | | | 8.87 | |
Fiscal year ended December 31, 2011 | | | | | | | | |
Annual | | | 12.95 | | | | 7.32 | |
Fiscal year ended December 31, 2012 | | | | | | | | |
Annual | | | 9.72 | | | | 5.34 | |
First Quarter | | | 9.72 | | | | 7.61 | |
Second Quarter | | | 7.97 | | | | 5.63 | |
Third Quarter | | | 8.67 | | | | 5.34 | |
Fourth Quarter | | | 9.42 | | | | 7.60 | |
Fiscal year ended December 31, 2013 | | | | | | | | |
Annual | | | 12.78 | | | | 8.22 | |
First Quarter | | | 10.54 | | | | 8.71 | |
Second Quarter | | | 9.96 | | | | 8.25 | |
Third Quarter | | | 11.29 | | | | 8.22 | |
Fourth Quarter | | | 12.78 | | | | 11.13 | |
Month ended October 31, 2013 | | | 12.78 | | | | 11.39 | |
Month ended November 30, 2013 | | | 11.89 | | | | 11.13 | |
Month ended December 31, 2013 | | | 12.39 | | | | 11.25 | |
Fiscal year ended December 31, 2014 | | | | | | | | |
Month ended January 31, 2014 | | | 13.48 | | | | 11.74 | |
Month ended February 28, 2014 | | | 12.51 | | | | 11.39 | |
Month ended March 31, 2014 | | | 12.76 | | | | 11.73 | |
Month ended April 30, 2014 (through April 28) | | | 12.73 | | | | 12.15 | |
Securities Trading in Spain
The Spanish securities market for equity securities consists of the Automated Quotation System and the four stock exchanges located in Madrid, Bilbao, Barcelona and Valencia. During 2013, the Automated Quotation System accounted for the majority of the total trading volume of equity securities on the Spanish Stock Exchanges.
Automated Quotation System. The Automated Quotation System (Sistema de Interconexión Bursátil) links the four local exchanges, providing those securities listed on it with a uniform continuous market that eliminates certain of the differences among the local exchanges. The principal feature of the system is the computerized matching of buy and sell orders at the time of entry of the order. Each order is executed as soon as a matching order is entered, but can be modified or canceled until executed. The activity of the market can be continuously monitored by investors and brokers. The Automated Quotation System is operated and regulated by Sociedad de Bolsas, S.A. (“Sociedad de Bolsas”), a corporation owned by the companies that manage the local exchanges. All trades on the Automated Quotation System must be placed through a bank, brokerage firm, an official stock broker or a dealer firm member of a Spanish Stock Exchange directly. Since January 1, 2000, Spanish banks have been allowed to place trades on the Automated Quotation System and have been allowed to become members of the Spanish Stock Exchanges. We are currently a member of the four Spanish Stock Exchanges and can trade through the Automated Quotation System.
In a pre-opening session held from 8:30 a.m. to 9:00 a.m. each trading day, an opening price is established for each security traded on the Automated Quotation System based on orders placed at that time. The regime concerning opening prices was changed by an internal rule issued by theSociedad de Bolsas. In this new regime all references to maximum changes in share prices are substituted by static and dynamic price ranges for each listed share, calculated on the basis of the most recent historical volatility of each share, and made publicly available and updated on a regular basis by theSociedad de Bolsas. The computerized trading hours are from 9:00 a.m. to 5:30 p.m., during which time the trading price of a security is permitted to vary by up to the stated levels. If, during the open session, the quoted price of a share exceeds these static or dynamic price ranges, Volatility Auctions are triggered, resulting in new static or dynamic price ranges being set for the share object of the same. Between 5:30 p.m. and 5:35 p.m. a closing price is established for each security through an auction system similar to the one held for the pre-opening early in the morning.
148
Trading hours for block trades (i.e., operations involving a large number of shares) are also from 9:00 a.m. to 5:30 p.m.
Between 5:30 p.m. and 8:00 p.m., special operations, whetherAuthorized orCommunicated, can take place outside the computerized matching system of theSociedad de Bolsasif they fulfill certain requirements. In such respect Communicated special operations (those that do not need the prior authorization of theSociedad de Bolsas) can be traded if all of the following requirements are met: (i) the trade price of the share must be within the range of 5% above the higher of the average price and closing price for the day and 5% below the lower of the average price and closing price for the day; (ii) the market member executing the trade must have previously covered certain positions in securities and cash before executing the trade; and (iii) the size of the trade must involve at least €300,000 and represent at least a 20% of the average daily trading volume of the shares in theAutomated Quotation System during the preceding three months. If any of the aforementioned requirements is not met, a special operation may still take place, but it will need to take the form ofAuthorized special operation (i.e., those needing the prior authorization of theSociedad de Bolsas). Such authorization will only be upheld if any of the following requirements are met:
| | • | | the trade involves more than €1.5 million and more than 40% of the average daily volume of the stock during the preceding three months; |
| | • | | the transaction derives from a merger or spin-off process or from the reorganization of a group of companies; |
| | • | | the transaction is executed for the purposes of settling a litigation or completing a complex group of contracts; or |
| | • | | theSociedad de Bolsas finds other justifiable cause. |
Information with respect to the computerized trades between 9:00 a.m. and 5:30 p.m. is made public immediately, and information with respect to trades outside the computerized matching system is reported to theSociedad de Bolsas by the end of the trading day and published in theBoletín de Cotizaciónand in the computer system by the beginning of the next trading day.
Sociedad de Bolsas is also the manager of the IBEX 35® Index. This index is made up by the 35 most liquid securities traded on the Spanish Market and, technically, it is a price index that is weighted by capitalization and adjusted according to the free float of each company comprised in the index. Apart from its quotation on the four Spanish Exchanges, BBVA is also currently included in the IBEX 35® Index.
Clearing and Settlement System.
On April 1, 2003, by virtue of Law 44/2002 and of Order ECO 689/2003 of March 27, 2003 approved by the Spanish Ministry of Economy, the integration of the two main existing book-entry settlement systems existing in Spain at the time—the equity settlement systemServicio de Compensación y Liquidación de Valores (“SCLV”) and the Public Debt settlement systemCentral de Anotaciones de Deuda del Estado (“CADE”)—took place.As a result of this integration, a single entity, known asSociedad de Gestión de los Sistemas de Registro Compensación y Liquidación de Valores (“Iberclear”) assumed the functions formerly performed by SCLV and CADE according to the legal regime stated in article 44 bis of the Spanish Securities Market Act.
Notwithstanding the above, rules concerning the book-entry settlement systems enacted before this date by SCLV and the Bank of Spain, as former manager of CADE, continue in force, but any reference to the SCLV or CADE must be substituted by Iberclear.
In addition, and according to Law 41/1999, Iberclear manages three securities settlement systems for securities in book-entry form: The system for securities listed on the four Spanish Stock Exchanges, the system for Public Debt and the system for debt securities traded in “AIAF Mercado de Renta Fija”. Cash settlement, from February 18, 2008 for all systems is managed through the TARGET2-Banco de España payment system.
149
The following four paragraphs exclusively address issues relating to the securities settlement system managed by Iberclear for securities listed on the Spanish Stock Exchanges (the “SCLV system”).
Under Law 41/1999 and Royal Decree 116/1992, transactions carried out on the Spanish Stock Exchanges are cleared and settled through Iberclear and its participants (each an “entidad participante”), through the SCLV system. Only Iberclear participants to this SCLV system are entitled to use it, with participation restricted to authorized members of the Spanish Stock Exchanges (for whom participation was compulsory until March 2007), the Bank of Spain (when an agreement, approved by the Spanish Ministry of Economy and Finance, is reached with Iberclear) and, with the approval of the CNMV, other brokers not members of the Spanish Stock Exchanges, banks, savings banks and foreign clearing and settlement systems. BBVA is currently a participant in Iberclear. Iberclear and its participants are responsible for maintaining records of purchases and sales under the book-entry system. In order to be listed, shares of Spanish companies must be held in book-entry form. Iberclear, maintains a “two-step” book-entry registry reflecting the number of shares held by each of its participants as well as the amount of such shares held on behalf of beneficial owners. Each participant, in turn, maintains a registry of the owners of such shares. Spanish law considers the legal owner of the shares to be:
| | • | | the participant appearing in the records of Iberclear as holding the relevant shares in its own name, or |
| | • | | the investor appearing in the records of the participant as holding the shares. |
Iberclear settles Stock Exchange trades in the SCLV system in the so-called “D+3 Settlement” by which the settlement of Stock Exchange trades takes place three business days after the date on which the transaction was carried out in the Stock Exchange.
Ministerial Order EHA/2054/2010, amended Iberclear’s Regulation permitting Iberclear to clear and settle trades of equity securities listed in the Spanish Stock Exchanges that are entered into outside such stock exchanges (whether over-the-counter or in multilateral trading facilities).
Ministerial Order ECC/680/2013 further amended Iberclear’s Regulation, imposing on members of the Spanish Stock Exchanges who do not want to hold Iberclear membership, the need to appoint an Iberclear participant who will be responsible for the clearing and settlement of their trades.
Obtaining legal title to shares of a company listed on a Spanish Stock Exchange requires the participation of a Spanish broker-dealer, bank or other entity authorized under Spanish law to record the transfer of shares in book-entry form in its capacity as Iberclear participant for the SCLV system. To evidence title to shares, at the owner’s request the relevant participant entity must issue a certificate of ownership. In the event the owner is a participant entity, Iberclear is in charge of the issuance of the certificate with respect to the shares held in the participant entity’s own name.
According to article 42 of the Securities Market Act brokerage commissions are not regulated. Brokers’ fees, to the extent charged, will apply upon transfer of title of our shares from the depositary to a holder of ADSs, and upon any later sale of such shares by such holder. Transfers of ADSs do not require the participation of a member of a Spanish Stock Exchange. The deposit agreement provides that holders depositing our shares with the depositary in exchange for ADSs or withdrawing our shares in exchange for ADSs will pay the fees of the official stockbroker or other person or entity authorized under Spanish law applicable both to such holder and to the depositary.
Securities Market Legislation
The Securities Markets Act was enacted in 1988 with the purpose of reforming the organization and supervision of the Spanish securities markets. This legislation and the regulation implementing it:
| | • | | established an independent regulatory authority, the CNMV, to supervise the securities markets; |
| | • | | established a framework for the regulation of trading practices, tender offers and insider trading; |
| | • | | required stock exchange members to be corporate entities; |
150
| | • | | required companies listed on a Spanish Stock Exchange to file annual audited financial statements and to make public quarterly financial information; |
| | • | | established the legal framework for the Automated Quotation System; |
| | • | | exempted the sale of securities from transfer and value added taxes; |
| | • | | deregulated brokerage commissions; and |
| | • | | provided for transfer of shares by book-entry or by delivery of evidence of title. |
On February 14, 1992, Royal Decree No. 116/92 established the clearance and settlement system and the book-entry system, and required that all companies listed on a Spanish Stock Exchange adopt the book-entry system.
On April 12, 2007, the Spanish Congress approved Law 6/2007, which amends the Securities Markets Act in order to adapt it to Directive 2004/25/EC on takeover bids, and Directive 2004/109/EC on the harmonization of transparency requirements in relation to information about issuers whose securities are admitted to trading on a regulated market (amending Directive 2001/34/EC). Regarding the transparency of listed companies, Law 6/2007 has amended the reporting requirements and the disclosure regime, and has established changes in the supervision system. On the takeover bids side, Law 6/2007 has established the cases in which a company must launch a takeover bid and the ownership thresholds at which a takeover bid must be launched. It also regulates conduct rules for the board of directors of target companies and the squeeze-out and sell-out when a 90% of the share capital is held after a takeover bid. Additionally, Law 6/2007 has been further developed by Royal Decree 1362/2007, on transparency requirements for issuers of listed securities.
On December 19, 2007, the Spanish Congress approved Law 47/2007, which amends the Securities Markets Act in order to adapt it to Directive 2004/37/EC on markets in financial instruments (MiFID), Directive 2006/49/EC on the capital adequacy of investment firms and credit institutions, and Directive 2006/73/EC implementing Directive 2004/39/EC with respect to organizational requirements and operating conditions for investment firms and defined terms for the purposes of that Directive. Further MiFID implementation has been introduced by Royal Decree 217/2008 and Ministerial Order EHA/1665/2010, which developed articles 71 and 76 of such Royal Decree 217/2008 regarding fees and types of agreements.
On October 4, 2011, the Spanish Congress approved Law 32/2011, which amends the Securities Markets Act by enhancing the clearing, settlement and book-entry system (by establishing central counterparty equity clearing).
The Regulation of the European Parliament and of the Council on short selling and certain aspects of credit default swaps (EU) No 236/2012 (Regulation) has been in force since March 25, 2012 and became directly effective in EU countries from November 1, 2012. This Regulation introduced a pan-European regulatory framework for dealing with short selling and requires persons to disclose short positions in relation to shares of EU listed companies and EU sovereign debt. For significant net short positions in shares of EU listed companies, these regulations create a two-tier reporting model: (i) when a net short position reaches 0.20% of an issuer’s share capital (and at every 0.1% thereafter), such position must be privately reported to the relevant regulator; and (ii) when such position reaches 0.50% (and at every 0.1% thereafter) of an issuer’s share capital, apart from being disclosed to the regulators, such position must be publicly reported to the market.
Law 9/2012 and Royal Decree 1698/2012 implemented European Directive 2010/73/EU, (which amended Directive 2003/71/EC, on the prospectus to be published when securities are offered to the public or admitted to trading and Directive 2004/109/EC, on the harmonization of transparency requirements in relation to information about issuers whose securities are admitted to trading on a regulated market).
Trading by the Bank and its Affiliates in the Shares
Trading by subsidiaries in their parent companies shares is restricted by the Corporate Enterprises Act.
Neither BBVA nor its affiliates may purchase BBVA’s shares unless the making of such purchases is authorized at a meeting of BBVA’s shareholders by means of a resolution establishing, among other matters, the
151
maximum number of shares to be acquired and the authorization term, which cannot exceed five years. Restricted reserves equal to the purchase price of any shares that are purchased by BBVA or its subsidiaries must be made by the purchasing entity. The total number of shares held by BBVA and its subsidiaries may not exceed ten percent of BBVA’s total capital, as per the new treasury stock limits set forth in Law 3/2009 of structural modifications of commercial companies. It is the practice of Spanish banking groups, including ours, to establish subsidiaries to trade in their parent company’s shares in order to meet imbalances of supply and demand, to provide liquidity (especially for trades by their customers) and to modulate swings in the market price of their parent company’s shares.
Reporting Requirements
Royal Decree 1362/2007 requires that any person or entity which acquires or transfers shares and as a consequence the number of voting rights held exceeds, reaches or is below the thresholds of 3%, 5%, 10%, 15%, 20%, 25%, 30%, 35%, 40%, 45%, 50%, 60%, 70%, 75%, 80% y 90% of the capital stock of a company listed on a Spanish Stock Exchange must, within four days after that acquisition or transfer, report it to such company, and to the CNMV. This duty to report the holding of a significant stake will be applicable not only to the acquisitions and transfers in the terms described above, but also to those cases in which in the absence of an acquisition or transfer of shares, the ratio of an individual’s voting rights exceeds, reaches or is below the thresholds that trigger the duty to report, as a consequence of an alteration in the total number of voting rights of an issuer.
In addition, any company listed on a Spanish Stock Exchange must report on a non-public basis to the CNMV, within 4 Stock Exchange business days, any acquisition by such company (or an affiliate) of the company’s own shares if such acquisition, together with any previous one from the date of the last communication, exceeds 1% of its capital stock, regardless of the balance retained. Members of the board of directors must report the ratio of voting rights held at the time of their appointment as members of the board, when they are ceased as members, as well as any transfer or acquisition of share capital of a company listed on the Spanish Stock Exchanges, regardless of the size of the transaction. Additionally, since we are a credit entity, any individual or company who intends to acquire a significant participation in BBVA’s share capital must obtain prior approval from the Bank of Spain in order to carry out the transaction. See “Item 10. Additional Information—Exchange Controls—Restrictions on Acquisitions of Shares”.
Royal Decree 1362/2007 also establishes reporting requirements in connection with any entity acting from a tax haven or a country where no securities regulatory commission exists, in which case the threshold of three percent is reduced to one percent.
Each Spanish bank is required to provide to the Bank of Spain a list dated the last day of each quarter of all the bank’s shareholders that are financial institutions and other non-financial institution shareholders owning at least 0.25% of a bank’s total share capital. Furthermore, the banks are required to inform the Bank of Spain, as soon as they become aware, and in any case not later than in 15 days, of each acquisition by a person or a group of at least one percent of such bank’s total share capital.
In addition, BBVA shares were included, among others, in Annex 1 of the Agreement of the Executive Committee of the CNMV on naked short selling dated September 22, 2008, which was supplemented by a further agreement of this body dated May 27, 2010. Different temporary restrictions on short selling over securities admitted to trading in Spanish regulated markets (including BBVA’s securities) have subsequently been imposed by the CNMV. Upon Regulation (EU) 236/2012’s entry into force (on November 1, 2012) the CNMV made public a new agreement extending the ban on transactions by any legal or natural person which create a short position in shares listed in the Spanish regulated markets (including BBVA’s shares), setting forth some exceptions, such as for market making transactions. This ban was in effect until January 31, 2013, when CNMV decided not to extend the same.
Ministerial Order EHA/1421/2009, implements Article 82 of Securities Market (Law 24/1988 of July 28, 1988) on the publication of significant information. The Ministerial Order specifies certain aspects relating to notice of significant information that were pending implementation in Law 24/1988. In this respect, the principles to be followed and conditions to be met by entities when they publish and report significant information are set forth, along with the content requirements, including when significant information is connected with accounting, financial or operational projections, forecasts or estimates. The reporting entity must designate at least one interlocutor whom
152
the CNMV may consult or from whom it may request information relating to dissemination of the significant information. Lastly, some of the circumstances in which it is considered that an entity is failing to comply with the duty to publish and report significant information are described. These include, among others, cases in which significant information is disseminated at meetings with investors or shareholders or at presentations to analysts or to media professionals, but is not communicated, at the same time, to the CNMV.
Ministerial Order EHA/421/2009 was modified by ministerial Order ECC/461/2013 which imposed on securities issuers the duty of publishing notices of significant information through their websites.
Circular 4/2009 of the CNMV further develops Ministerial Order EHA1421/2009. In this respect, the Circular sets forth a precise proceeding for the actual report of the significant information and draws up an illustrative list of the events that may be deemed to constitute significant information. This list includes, among others, events connected with strategic agreements and mergers and acquisitions, information relating to the reporting entity’s financial statements or those of its consolidated group, information on notices of call and official matters and information on significant changes in factors connected with the activities of the reporting entity and its group.
Tax Requirements
According to Law 19/2003 and its associated regulations, an issuer’s parent company (credit entity or listed company) is required, on an annual basis, to provide the Spanish tax authorities with the following: (i) disclosure of information regarding those investors with Spanish Tax residency obtaining income from securities and (ii) the amount of income obtained by them in each period.
Not Applicable.
Not Applicable.
Not Applicable.
Not Applicable.
Not Applicable.
| ITEM 10. | ADDITIONAL INFORMATION |
Not Applicable.
153
| B. | Memorandum and Articles of Association |
Spanish law and BBVA’s bylaws are the main sources of regulation affecting the Company. All rights and obligations of BBVA’s shareholders are contained in its bylaws and in Spanish law. Pursuant to Royal Decree 1245/1995, of July 14, on the creation of banks, cross-border activity and other matters relating to the legal regime of financial institutions, certain amendments of the bylaws of a bank are subject to the prior authorization of the Bank of Spain.
Registry and Company’s Objects and Purposes
BBVA is registered with the Commercial Registry of Vizcaya (Spain). Its registration number at the Commercial Registry of Vizcaya is volume 2,083, Company section folio 1, sheet BI-17-1, 1st entry. Its corporate objects and purposes are to: (i) directly or indirectly conduct all types of activities, transactions, acts, agreements and services relating to the banking business which are permitted or not prohibited by law and all banking ancillary activities; (ii) acquire, hold and dispose of securities and any kind of holdings in any company or enterprise, and (iii) make public offers for the acquisition and sale of securities. BBVA’s objects and purposes are contained in Article 3 of the bylaws.
Certain Powers of the Board of Directors
In general, provisions regarding directors are contained in our bylaws. Also, our Board regulations govern the internal procedures and the operation of the Board and its committees and directors’ rights and duties as described in their charter. The referred Board regulations limit a director’s right to vote on a proposal, arrangement or contract in which the director is materially interested and require retirement of directors at a certain age. In addition, the Board regulations contain a series of ethical standards. See “Item 6. Directors, Senior Management and Employees”.
Certain Provisions Regarding Privileged Shares
The bylaws authorize us to issue ordinary, non-voting, redeemable and privileged shares. As of the date of the filing of this Annual Report, we have no non-voting, redeemable or privileged shares outstanding.
The Company may issue shares that confer some privilege over ordinary shares under the legally established terms and conditions, complying with the formalities prescribed for amending our bylaws.
Redemption of shares may only occur according to the terms set forth when they are issued. Redeemable shares must be fully paid-up at the time of their subscription. If the right to redeem redeemable shares is exclusively given to BBVA, it may not be exercised until at least three years after the issue. Redemption of shares must be financed against profits, free reserves or the proceeds of new securities issued especially for financing the redemption of an issue. If financed against profits or free reserves, BBVA must create a reserve for the amount of the par value of the redeemed shares. If the redemption is not financed against profits, free reserves or a new issue, it may only be done in compliance with the requirements of a reduction in share capital by the refund of contributions.
Holders of non-voting shares, if issued, are entitled to a minimum annual dividend, fixed or variable, set out at the time of the issue. The right of non-voting shares to accumulate unpaid dividends whenever funds to pay dividends are not available, any preemptive rights associated with non-voting shares, and the ability of holders of non-voting shares to recover voting rights also must be established at the time of the issue. Non-voting shares are entitled to the dividends to which ordinary shares are entitled in addition to their minimum dividend.
Certain Provisions Regarding Shareholders Rights
As of the date of the filing of this Annual Report, our capital is comprised of one class of ordinary shares, all of which have the same rights.
Once the perquisites established by law or in our bylaws have been covered, dividends may be paid out to shareholders and charged to the year’s profit or to unrestricted reserves, in proportion to the capital they may have paid up, provided the value of the total net assets is not, or as a result of such distribution would not be, less than the share capital. Shareholders will participate in the distribution of dividends in proportion to their paid-in capital. The right to collect a dividend lapses after five years as of the date in which it was first available to the shareholders. Shareholders also have the right to participate in proportion to their paid-in capital in any distribution resulting from our liquidation. For more information regarding dividends see “Item 4. Information on the Company – Business Overview—Supervision and Regulation—Dividends”.
Each voting share will confer the right to one vote on the holder present or represented at the general meeting. However, unpaid shares with respect to which a shareholder is in default of the resolutions of the Board of Directors relating to their payment will not be entitled to vote. The bylaws contain no provisions regarding cumulative voting.
154
The bylaws do not contain any provisions relating to sinking funds or potential liability of shareholders to further capital calls by us.
The bylaws do not establish that special quorums are required to change the rights of shareholders. Under Spanish law, the rights of shareholders may only be changed by an amendment to the bylaws that complies with the requirements explained below under “—Shareholders’ Meetings”, plus the affirmative vote of the majority of the shares of the class that will be affected by the amendment.
Shareholders’ Meetings
The annual shareholders’ general meeting has its own set of regulations on issues such as how it operates and what rights shareholders enjoy regarding annual general shareholders’ meeting. These establish the possibility of exercising or delegating votes over remote communication media.
General shareholders’ meetings may be annual or extraordinary. Annual general shareholders’ meetings are held within the first six months of each financial year in order to review, among other things, the management of the company, and to approve, if applicable, annual financial statements for the previous fiscal year. Extraordinary general shareholders’ meetings are those meetings that are not ordinary. In any case, the requirements mentioned below for constitution and adoption of resolutions are applicable to both categories of general meetings.
General shareholders’ meetings must be convened by the Board of Directors, whether by their own decision or upon the request of shareholders holding at least five percent of our share capital.
Our shareholders’ general meeting regulations establish that annual and extraordinary shareholders’ general meetings must be called within the notice period required by law. This will be done by means of an announcement published by the Board of Directors or its proxy in the Official Gazette of the Companies Registry (“BORME”) or one of the daily newspapers in Spain with the highest-readership, within the notice period required by law, as well as being disseminated on the CNMV website and the Company website, except when legal provisions establish other media for disseminating the notice.
The Company’s shareholders’ general meetings may be attended by anyone owning the minimum number of shares established in our bylaws (500), provided that their holding is registered in the corresponding accounting records five days before the general meeting is scheduled and that they conserve at least this same number of shares until the time when the general meeting is held. Holders of fewer shares may group together until achieving the required number, appointing a representative.
General shareholders’ meetings will be validly constituted on first call with the presence of at least 25% of our voting capital, either in person or by proxy. No minimum quorum is required to hold a general shareholders’ meeting on second call. In either case, resolutions will be agreed by the majority of the votes. However, a general shareholders’ meeting will only be validly held with the presence of 50% of our voting capital on first call or of 25% of the voting capital on second call, in the case of resolutions concerning the following matters:
| | • | | capital increases or decreases; |
| | • | | the elimination on or limitation of the pre-emptive subscription rights over new shares; |
| | • | | transformation, merger of BBVA or break-up of the company and global assignment of assets and liabilities; |
| | • | | the off-shoring of domicile, and |
| | • | | any other amendment to the bylaws. |
In these cases, resolutions may only be approved by the vote of the majority of the shares if at least 50% of the voting capital is present at the meeting. If the voting capital present at the meeting is less than 50%, then resolutions may only be adopted by two-thirds of the shares present.
155
Additionally, our bylaws state that, in order to adopt resolutions regarding a change in corporate purpose, transformation, the total liquidation or dissolution of BBVA and the amendment of such article of our bylaws, at least two-thirds of the voting capital must be present at the meeting on first call and at least 60% of voting capital must be present on second call.
Restrictions on the Ownership of Shares
Our bylaws do not provide for any restrictions on the ownership of our ordinary shares. Spanish law, however, provides for certain restrictions which are described below under “—Exchange Controls—Restrictions on Acquisitions of Shares”.
Restrictions on Foreign Investments
The Spanish Stock Exchanges are open to foreign investors. Investments in shares of Spanish companies by foreign entities or individuals may be freely executed but require the notification to the Spanish Foreign Investment Authorities for administrative statistical and economical purposes. See “—Exchange Controls”. In addition, they are subject to certain restrictions and requirements which are also applicable to investments by domestic entities or individuals.
Current Spanish regulations provide that foreign investors may freely transfer out of Spain any amounts of invested capital, capital gains and dividends subject to applicable taxes. See “—Exchange Controls”.
Shareholders’ agreement in connection with Garanti
On November 1, 2010, we entered into share purchase agreements with GE Araştırma ve Müşavirlik Limited Şirketi and General Electric Capital Corporation and Doğuş Holding AŞ. (“Doğuş”), respectively, pursuant to which, on March 22, 2011, we acquired Garanti shares representing 18.60% and 6.29%, respectively, of the total issued share capital of Garanti. In addition, on November 1, 2010, we entered into a shareholders’ agreement with Doğuş which is in effect since March 2011 (the “SHA”). Doğuş is one of the largest Turkish conglomerates and has business interests in the financial services, construction, tourism and automotive sectors. Pursuant to the SHA, BBVA and Doğuş have agreed to manage Garanti through the appointment of board members and senior management. The SHA provides for two phases (“Phase 1” and “Phase 2”, respectively), with the rights between the two shareholders differing based on the respective phase. In addition, during the Phase 2 period, BBVA’s rights will depend on the level of Doğuş’ shareholding. The Phase 1 period commenced in March 2011 and will end upon the occurrence of certain trigger events which relate to changes in BBVA’s and Doğuş’ shareholding in Garanti. If further new shares are acquired by either BBVA or Doğuş during Phase 1, the other party will have the right to acquire 50% of the shares so acquired and, if such party chooses not to acquire them, it will nevertheless have voting usufruct rights over 50% of the shares acquired. In addition, the shareholders’ agreement provided for rights of first offer, tag-along rights and a lock-up period in respect of Garanti shares owned by BBVA and Doğuş which ended on March 22, 2014. Moreover, the parties will seek to maintain Garanti’s listing on the Istanbul Exchange and to distribute at least 25% of Garanti’s distributable profits as long as they hold a certain stake in Garanti. BBVA also has a perpetual option to purchase an additional 1% of Garanti, which will become exercisable on March 22, 2016.
In 1991, Spain adopted the EU Standards for free movement of capital and services. As a result, foreign investors may transfer invested capital, capital gains and dividends out of Spain without limitation as to amount, subject to applicable taxes. See “—Taxation”.
Pursuant to Spanish Law 18/1992 on Foreign Investments and Royal Decree 664/1999 on the Applicable rules to Foreign Investments, foreign investors may freely invest in shares of Spanish companies except in the case of certain strategic industries.
Notwithstanding this, Royal Decree 664/1999 and Law 19/2003, on exchange controls and foreign transactions, require notification of all foreign investments in Spain and liquidations of such investments upon completion of such investments to the Investments Registry of the Ministry of Economy and Competitiveness for administrative statistical and economical purposes. Shares in listed Spanish companies acquired or held by foreign investors must be reported to the Spanish Registry of Foreign Investments by the depositary bank or relevant Iberclear member. When a foreign investor acquires shares that are subject to the reporting requirements of the CNMV regarding significant stakes, notice must be given directly by the foreign investor to the relevant authorities.
Moreover, investments by foreigners domiciled in enumerated tax haven jurisdictions, under Royal Decree 1080/1991, are subject to special reporting requirements.
In certain circumstances and following a specific procedure, the Council of Ministers may agree to suspend the application of Royal Decree 664/1999, if the investments, due to their nature, form or condition, affect or may potentially affect activities relating to the exercise of public powers, national security or public health. Law 19/2003 authorizes the Spanish Government to take measures to impose specific limits or prohibitions, related to third countries, when such measures have been previously approved by the European Union or by an international organization to which Spain is member. Should such regimes be suspended, the affected investor shall obtain prior administrative authorization.
156
Restrictions on Acquisitions of Shares
The Discipline and Intervention of Credit Institutions Act (Law 26/1988), amended by Law 5/2009, of June 29, provides that any individual or corporation, acting alone or in concert with others, intending to directly or indirectly acquire a significant holding in a Spanish financial institution (as defined in article 56 of the aforementioned Law 26/1998) or to directly or indirectly increase its holding in one in such a way that either the percentage of voting rights or of capital owned were equal to or more than 20%, 30% or 50%, or by virtue of the acquisition, might take control over the financial institution, must first notify the Bank of Spain. The Bank of Spain will have 60 working days after the date on which the notification was received, to evaluate the transaction and, where applicable, challenge the proposed acquisition on the grounds established by law.
A significant participation is considered 10% of the outstanding share capital of a bank or a lower percentage if such holding allows for the exercise of a significant influence.
Any acquisition without such prior notification, or before the period established in article 58.2 has elapsed or against the objection of the Bank of Spain, will produce the following results:
| | • | | the acquired shares will have no voting rights; and |
| | • | | if considered appropriate, the target bank may be taken over or its directors replaced and a sanction imposed. |
The Bank of Spain has 60 working days after the date on which the notification was received to object to a proposed transaction. Such objection may be based on the fact that the Bank of Spain does not consider the acquiring person suitable to guarantee the sound and prudent operation of the target bank.
Regarding the transparency of listed companies, Law 6/2007 amended the Securities Markets Act on takeover bids and transparency requirements for issuers. The transparency requirements have been further developed by Royal Decree 1362/2007 developing the Securities Markets Act on transparency requirement for issuers of listed securities, specifically information on significant stakes, reducing the communication threshold to 3%, and extending the disclosure obligations to the acquisition or transfer of financial instruments that grant rights to acquire shares with voting rights. For more information see “Item 9. The Offer and Listing—Offer and Listing Details—Reporting Requirements”
Tender Offers
The Spanish legal regime concerning takeover bids was amended by Law 6/2007 in order to adapt the Spanish Securities Market Act to the Directive 2004/25/EC on takeover bids, and Directive 2004/109/EC on the harmonization of transparency requirements in relation to information about issuers.
157
Additionally, Royal Decree 1066/2007, of July 29, on takeover bids, completes the modifications introduced by Law 6/2007, further developing the takeover bids legal framework in Spain and harmonizing the Spanish legislation with Directive 2004/25/EC.
Spanish Tax Considerations
The following is a summary of the material Spanish tax consequences to U.S. Residents (as defined below) of the acquisition, ownership and disposition of BBVA’s ADSs or ordinary shares as of the date of the filing of this Annual Report. This summary does not address all tax considerations that may be relevant to all categories of potential purchasers, some of whom (such as life insurance companies, tax-exempt entities, dealers in securities or financial institutions) may be subject to special rules. In particular, the summary deals only with the U.S. Holders (as defined below) that will hold ADSs or ordinary shares as capital assets and who do not at any time own individually, and are not treated as owning, 25% or more of BBVA’s shares, including ADSs.
As used in this particular section, the following terms have the following meanings:
(1) “U.S. Holder” means a beneficial owner of BBVA’s ADSs or ordinary shares that is for U.S. federal income tax purposes:
| | • | | a citizen or an individual resident of the United States, |
| | • | | a corporation or other entity treated as a corporation, created or organized under the laws of the United States, any state therein or the District of Columbia, or |
| | • | | an estate or trust the income of which is subject to U.S. federal income tax without regard to its source. |
(2) “Treaty” means the Convention between the United States and the Kingdom of Spain for the Avoidance of Double Taxation and the Prevention of Fiscal Evasion with Respect to Taxes on Income, together with a related Protocol.
(3) “U.S. Resident” means a U.S. Holder that is a resident of the United States for the purposes of the Treaty and entitled to the benefits of the Treaty, whose holding is not effectively connected with (1) a permanent establishment in Spain through which such holder carries on or has carried on business, or (2) a fixed base in Spain from which such holder performs or has performed independent personal services.
Holders of ADSs or ordinary shares should consult their tax advisors, particularly as to the applicability of any tax treaty. The statements regarding Spanish tax laws set out below are based on interpretations of those laws in force as of the date of this Annual Report. Such statements also assume that each obligation in the Deposit Agreement and any related agreement will be performed in full accordance with the terms of those agreements.
Taxation of Dividends
Under Spanish law, cash dividends paid by BBVA to a holder of ordinary shares or ADSs who is not resident in Spain for tax purposes and does not operate through a permanent establishment in Spain, are subject to Spanish Non-Resident Income Tax, withheld at source at a 21% tax rate for 2012, 2013 and 2014 (after this period of time the tax rate is expected to be 19%). For these purposes, upon distribution of the dividend, BBVA or its paying agent will withhold an amount equal to the tax due according to the rules set forth above (i.e., applying a withholding tax rate of 21% for 2012, 2013 and 2014), transferring the resulting net amount to the depositary.
However, under the Treaty, if you are a U.S. Resident, you are entitled to a reduced withholding tax rate of 15%. To benefit from the Treaty-reduced rate of 15%, if you are a U.S. Resident, you must provide to BBVA through our paying agent depositary, before the tenth day following the end of the month in which the dividends were payable, a certificate from the U.S. Internal Revenue Service (“IRS”) stating that, to the best knowledge of the IRS, you are a resident of the United States within the meaning of the Treaty and entitled to its benefits.
If the paying agent depositary provides timely evidence (i.e., by means of the IRS certificate) of your right to apply the Treaty-reduced rate it will immediately receive the surplus amount withheld, which will be credited to you. The IRS certificate is valid for a period of one year from issuance.
158
To help shareholders obtain such certificates, BBVA has set up an online procedure to make this as easy as possible.
If the certificate referred to in the above paragraph is not provided to us through our paying agent depositary within said term, you may afterwards obtain a refund of the amount withheld in excess of the rate provided for in the Treaty.
Scrip Dividend
As described under “Item 4. Information on the Company Business—Overview—Supervision and Regulation—Scrip Dividend”, the BBVA annual shareholders’ general meeting held on March 14, 2014, passed a resolution adopting four different free-of-charge capital increases for the implementation of a new “Dividend Option” scheme for this year, the first of which relates to the dividend traditionally paid in April and which execution we expect to complete in April 2014. This dividend scheme lets the shareholders choose how they would like to receive their dividends: in cash or in new free-of-charge shares.
Pursuant to the terms of the “Dividend Option” program, upon its implementation, the shareholders will receive one free-of-charge allocation right for each share of BBVA that they hold as of a given record date. These rights will be tradable on the Spanish Stock Exchanges for a minimum period of 15 natural days. BBVA will undertake to purchase free allocation rights tendered by a shareholder to it during a certain period of time at a fixed price, subject to the conditions that may be imposed each time the “Dividend Option” program is implemented. This fixed price will be the result of dividing the Reference Price (as defined below) by the number of rights necessary to receive one new share plus one. At the end of the 15 natural days period, the free-of-charge allocation rights not validly tendered to BBVA will be converted into newly-issued shares of the Company. The number of rights necessary for the allocation of one new share and the total number of shares to be issued by BBVA will depend, amongst other factors, on the arithmetic mean of the weighted average prices of BBVA’s shares on the Spanish Stock Exchanges over the five trading sessions immediately prior to the Board of Directors’ resolution concerning the implementation of the relevant free-of-charge capital increase (the “Reference Price”).
Consequently, when each of the free-of-charge capital increases implementing the “Dividend Option” scheme is executed, the shareholders of BBVA will be able to freely choose among:
| | (a) | Not transferring their free-of-charge allocation rights. In this case, at the end of the trading period, the shareholders will receive the number of new totally paid-up shares to which they are entitled. For tax purposes the delivery of paid-up shares does not constitute income for purposes of the Spanish Non-Resident Income Tax, whether or not non-residents act through a permanent establishment in Spain. |
The acquisition value of both the new shares received and the shares from which they derive, will result from distributing the total cost among the number of securities (both existing and those issued as paid-up shares corresponding thereto). Such paid-up shares will be deemed to have been held for as long as the shares from which they derive.
| | (b) | Selling their free-of-charge allocation rights on the market. In this event, the amount obtained for the transfer of such rights on the market will be subject to the following tax treatment: |
For purposes of the Spanish Non-Resident Income Tax on non-residents without a permanent establishment, the amount obtained for the transfer of the free-of-charge allocation rights on the market is subject to the same treatment that tax regulations provide for pre-emptive rights. Accordingly, the amount obtained for the transfer of the free-of-charge allocation rights decreases the acquisition value for tax purposes of the shares from which such rights derive, pursuant to Section 37.1.a) of Law 35/2006, of November 28, on Personal Income Tax (Ley del Impuesto sobre la Renta de las Personas Físicas).
Thus, if the amount obtained for the aforementioned transfer is larger than the acquisition value of the securities from which they derive, the difference will be deemed to be a capital gain earned by the transferor in the tax period in which the transfer is effected.
| | (c) | Using the purchase commitment assumed by BBVA of free-of-charge allocation rights. The tax treatment applicable to the amount received for the transfer to the Company of the free-of-charge |
159
| | allocation rights held by them in their capacity as shareholders or acquired on the market will be equal to the treatment applicable to dividends directly distributed in cash and, consequently, such amount will be subject to the corresponding withholding tax (currently, at a 21% rate). |
It should be borne in mind that this analysis does not cover all the possible tax consequences. Therefore, shareholders are advised to consult with their tax advisors.
Spanish Refund Procedure
According to Spanish Regulations on Non-Resident Income Tax, approved by Royal Decree 1776/2004 dated July 30, 2004, as amended, a refund for the amount withheld in excess of the Treaty-reduced rate can be obtained from the relevant Spanish tax authorities. To pursue the refund claim, if you are a U.S. Resident, you are required to file:
| | • | | the corresponding Spanish tax form, |
| | • | | the certificate referred to in the preceding section, and |
| | • | | evidence of the Spanish Non-Resident Income Tax that was withheld with respect to you. |
The refund claim must be filed within four years from the date in which the withheld tax was collected by the Spanish tax authorities, but not before February 1, of the following year.
U.S. Residents are urged to consult their own tax advisors regarding refund procedures and any U.S. tax implications thereof.
Additionally, under the Spanish law, the first €1,500 of dividends received by individuals who are not resident in Spain for tax purposes, and do not operate through a permanent establishment in Spain, will be exempt from taxation in certain circumstances.
U.S. Holders should consult their tax advisors regarding the availability of, and the procedures to be followed in connection with, this exemption.
Taxation of Rights
Distribution of preemptive rights to subscribe for new shares made with respect to your shares in BBVA will not be treated as income under Spanish law and, therefore, will not be subject to Spanish Non-Resident Income Tax. The exercise of such preemptive rights is not considered a taxable event under Spanish law and thus is not subject to Spanish tax. Capital gains derived from the disposition of preemptive rights received by U.S. Residents are generally not taxed in Spain provided that certain conditions are met (see “—Taxation of Capital Gains” below).
Taxation of Capital Gains
Under Spanish law, any capital gains derived from securities issued by persons residing in Spain for tax purposes are considered to be Spanish-source income and, therefore, are taxable in Spain. For Spanish tax purposes, gain recognized by you, if you are a U.S. Resident, from the sale of BBVA’s ADSs or ordinary shares will be treated as capital gains. Spanish Non-Resident Income Tax is levied at a 21% tax rate for 2012, 2013 and 2014 (after this period of time the tax rate is expected to be 19%) on capital gains recognized by persons who are not residents of Spain for tax purposes, who are not entitled to the benefit of any applicable treaty for the avoidance of double taxation and who do not operate through a fixed base or a permanent establishment in Spain.
Notwithstanding the discussion above, capital gains derived from the transfer of shares on an official Spanish secondary stock market by any holder who is resident in a country that has entered into a treaty for the avoidance of double taxation with an “exchange of information” clause (the Treaty contains such a clause) will be exempt from taxation in Spain. Additionally, capital gains realized by non-residents of Spain who are entitled to the benefit of an applicable treaty for the avoidance of double taxation will, in the majority of cases, not be taxed in Spain (since most tax treaties provide for taxation only in the taxpayer’s country of residence). If you are a U.S. Resident, under the Treaty, capital gains arising from the disposition of ordinary shares or ADSs will not be taxed in Spain. You will be required to establish that you are entitled to this exemption by providing to the relevant Spanish tax authorities a certificate of residence in the United States from the IRS (discussed above in “—Taxation of Dividends”), together with the corresponding Spanish tax form.
160
Spanish Inheritance and Gift Taxes
Transfers of BBVA’s shares or ADSs upon death or by gift to individuals are subject to Spanish inheritance and gift taxes (Spanish Law 29/1987), if the transferee is a resident in Spain for tax purposes, or if BBVA’s shares or ADSs are located in Spain, regardless of the residence of the transferee. In this regard, the Spanish tax authorities may argue that all shares of a Spanish corporation and all ADSs representing such shares are located in Spain for Spanish tax purposes. The applicable tax rate for individuals, after applying all relevant factors, ranges between approximately 7.65% and 81.6%.
Corporations that are non-residents of Spain that receive BBVA’s shares or ADSs as a gift are subject to Spanish Non-Resident Income Tax at a 21% tax rate for 2012, 2013 and 2014 (after this period of time the tax rate is expected to be 19%) on the fair market value of such ordinary shares or ADSs as a capital gain tax. If the donee is a U.S. resident corporation, the exclusions available under the Treaty described in “—Taxation of Capital Gains” above will be applicable.
Spanish Transfer Tax
Transfers of BBVA’s ordinary shares or ADSs will be exempt from Transfer Tax (Impuesto sobre Transmisiones Patrimoniales) or Value-Added Tax. Additionally, no stamp duty will be levied on such transfers.
U.S. Tax Considerations
The following summary describes the material U.S. federal income tax consequences of the ownership and disposition of ADSs or ordinary shares, but it does not purport to be a comprehensive description of all of the tax considerations that may be relevant to a particular person’s decision to hold the securities. The summary applies only to U.S. Holders that are eligible for the benefits of the Treaty (in each case, as defined under “Spanish Tax Considerations” above) and that hold ADSs or ordinary shares as capital assets for tax purposes and does not address all of the tax consequences, including the potential application of the provisions of the Internal Revenue Code of 1986, as amended (the “Code”), known as the Medicare contribution tax, and tax consequences that may be relevant to holders subject to special rules, such as:
| | • | | certain financial institutions; |
| | • | | dealers or traders in securities who use a mark-to-market method of accounting; |
| | • | | persons holding ADSs or ordinary shares as part of a hedging transaction, straddle, wash sale, conversion transaction or integrated transaction or persons entering into a constructive sale with respect to the ADSs or ordinary shares; |
| | • | | persons whose “functional currency” for U.S. federal income tax purposes is not the U.S. dollar; |
| | • | | persons liable for the alternative minimum tax; |
| | • | | partnerships or other entities classified as partnerships for U.S. federal income tax purposes; |
| | • | | persons holding ADSs or ordinary shares in connection with a trade or business conducted outside of the United States; |
| | • | | persons who acquired our ADSs or ordinary shares pursuant to the exercise of any employee stock option or otherwise as compensation; or |
| | • | | persons who own or are deemed to own 10% or more of our voting shares. |
If an entity that is classified as a partnership for U.S. federal income tax purposes holds ADSs or ordinary shares, the U.S. federal income tax treatment of a partner will generally depend on the status of the partner and the activities of the partnership. Partnerships holding ADSs or ordinary shares and partners in such partnerships should consult their tax advisors as to the particular U.S. federal income tax consequences of holding and disposing of the ADSs or ordinary shares.
161
The summary is based upon the tax laws of the United States, including the Code, the Treaty, administrative pronouncements, judicial decisions and final, temporary and proposed Treasury regulations, all as of the date hereof. These laws are subject to change, possibly with retroactive effect. In addition, the summary is based in part on representations by the depositary and assumes that each obligation provided for in or otherwise contemplated by BBVA’s deposit agreement and any other related document will be performed in accordance with its terms. Prospective purchasers of the ADSs or ordinary shares are urged to consult their tax advisors as to the U.S., Spanish or other tax consequences of the ownership and disposition of ADSs or ordinary shares in their particular circumstances, including the effect of any U.S. state or local tax laws.
In general, for United States federal income tax purposes, a U.S. Holder who owns ADSs will be treated as the owner of the underlying ordinary shares represented by those ADSs. Accordingly, no gain or loss will be recognized if a U.S. Holder exchanges ADSs for the underlying ordinary shares represented by those ADSs.
The U.S. Treasury has expressed concerns that parties to whom American depositary shares are released before shares are delivered to the depositary, or intermediaries in the chain of ownership between holders and the issuer of the security underlying the American depositary shares, may be taking actions that are inconsistent with the claiming of foreign tax credits by U.S. holders of American depositary shares. Such actions would also be inconsistent with the claiming of the reduced rate of tax applicable to dividends received by certain non-corporate U.S. Holders, as described below. Accordingly, the analysis of the creditability of Spanish taxes described below, and the availability of the reduced tax rate for dividends received by certain non-corporate U.S. Holders, could be affected by future actions that may be taken by such parties.
This discussion assumes that BBVA is not, and will not become, a passive foreign investment company (“PFIC”) (as discussed below).
Taxation of Distributions
Distributions, before reduction for any Spanish income tax withheld by BBVA or its paying agent, made with respect to ADSs or ordinary shares (other than certain pro rata distributions of ordinary shares or rights to subscribe for ordinary shares of BBVA’s capital stock) will be includible in the income of a U.S. Holder as ordinary dividend income, to the extent paid out of BBVA’s current or accumulated earnings and profits as determined in accordance with U.S. federal income tax principles. Because we do not maintain calculations of our earnings and profits under U.S. federal income tax principles, it is expected that distributions generally will be reported to U.S. Holders as dividends. The amount of such dividends will generally be treated as foreign-source dividend income and will not be eligible for the “dividends-received deduction” generally allowed to U.S. corporations under the Code. Subject to applicable limitations and the discussion above regarding concerns expressed by the U.S. Treasury, dividends paid to certain non-corporate U.S. Holders will be taxable as “qualified dividend income” and therefore will be taxable at favorable rates applicable to long-term capital gains. U.S. Holders should consult their own tax advisors to determine the availability of these favorable rates in their particular circumstances.
The amount of dividend income will equal the U.S. dollar value of the euro received, calculated by reference to the exchange rate in effect on the date of receipt (which, for U.S. Holders of ADSs, will be the date such distribution is received by the depositary), whether or not the depositary or U.S. Holder in fact converts any euro received into U.S. dollars at that time. If the dividend is converted into U.S. dollars on the date of receipt, a U.S. Holder should not be required to recognize foreign currency gain or loss in respect of the dividend income. A U.S. Holder may have foreign currency gain or loss if the dividend is converted into U.S. dollars after the date of receipt.
A scrip dividend (such as a dividend distributed under the “Dividend Option” program, described in “Item 4. Information on the Company—Business Overview—Supervision and Regulation—Scrip Dividend”) will be treated in the same manner as a distribution of cash, regardless of whether a U.S. Holder elects to receive the dividend in shares rather than cash. If the U.S. Holder elects to receive the dividend in shares, the U.S. Holder will be treated as having received a distribution equal to the U.S. dollar fair market value of the shares on the date of distribution. The U.S. Holder’s tax basis in such shares received will be equal to the U.S. dollar fair market value of the shares on the date of distribution and the holding period for such shares will begin on the day following the distribution.
162
Subject to applicable limitations that may vary depending upon a U.S. Holder’s circumstances and subject to the discussion above regarding concerns expressed by the U.S. Treasury, a U.S. Holder will be entitled to a credit against its U.S. federal income tax liability, or a deduction in computing its U.S. federal taxable income, for Spanish income taxes withheld by BBVA or its paying agent at a rate not exceeding the rate the U.S. Holder is entitled to under the Treaty. Spanish taxes withheld in excess of the rate applicable under the Treaty will not be eligible for credit against the U.S. Holder’s U.S. federal income tax liability. See “Spanish Tax Considerations—Taxation of Dividends” for a discussion of how to obtain the Treaty rate. The rules governing foreign tax credits are complex and, therefore, U.S. Holders should consult their tax advisors regarding the availability of foreign tax credits in their particular circumstances.
Sale or Other Disposition of ADSs or Shares
For U.S. federal income tax purposes, gain or loss realized by a U.S. Holder on the sale or other disposition of ADSs or ordinary shares will be capital gain or loss in an amount equal to the difference between the U.S. Holder’s tax basis in the ADSs or ordinary shares disposed of and the amount realized on the disposition, in each case as determined in U.S. dollars. Such gain or loss will be long-term capital gain or loss if the U.S. Holder held the ordinary shares or ADSs for more than one year at the time of disposition. Gain or loss, if any, will generally be U.S. source for foreign tax credit purposes. The deductibility of capital losses is subject to limitations.
Passive Foreign Investment Company Rules
Based upon certain proposed Treasury regulations which are proposed to be effective for taxable years beginning after December 31, 1994 (“Proposed Regulations”), we believe that we were not a PFIC for U.S. federal income tax purposes for our 2013 taxable year. However, since our PFIC status depends upon the composition of our income and assets and the market value of our assets (including, among others, less than 25% owned equity investments) from time to time and since there is no guarantee that the Proposed Regulations will be adopted in their current form and because the manner of the application of the Proposed Regulations is not entirely clear, there can be no assurance that we will not be considered a PFIC for any taxable year.
If we were treated as a PFIC for any taxable year during which a U.S. Holder held ADSs or ordinary shares, gain recognized by such U.S. Holder on a sale or other disposition (including certain pledges) of an ADS or an ordinary share would be allocated ratably over the U.S. Holder’s holding period for the ADS or the ordinary share. The amounts allocated to the taxable year of the sale or other exchange and to any year before we became a PFIC would be taxed as ordinary income. The amount allocated to each other taxable year would be subject to tax at the highest rate in effect for individuals or corporations, as appropriate for that taxable year, and an interest charge would be imposed on the amount allocated to such taxable year. The same treatment would apply to any distribution received by a U.S. Holder on its ordinary shares or ADSs to the extent that such distribution exceeds 125% of the average of the annual distributions on the ordinary shares or ADSs received during the preceding three years or the U.S. Holder’s holding period, whichever is shorter. In addition, if we were a PFIC or, with respect to a particular U.S. Holder, were treated as a PFIC for the taxable year in which we paid a dividend or the prior taxable year, the favorable tax rates discussed above with respect to dividends paid to certain non-corporate U.S. Holders would not apply. Certain elections may be available (including a mark-to-market election) that may provide alternative tax treatments. U.S. Holders should consult their tax advisors regarding whether we are or were a PFIC, the potential application of the PFIC rules to determine whether any of these elections for alternative treatment would be available and, if so, what the consequences of the alternative treatments would be in their particular circumstances. If we were a PFIC for any taxable year during which a U.S. Holder owned our shares, the U.S. Holder would generally be required to file IRS Form 8621 with their annual U.S. federal income tax returns, subject to certain exceptions.
Information Reporting and Backup Withholding
Information returns may be filed with the IRS in connection with payments of dividends on, and the proceeds from a sale or other disposition of, ADSs or ordinary shares. A U.S. Holder may be subject to U.S. backup withholding on these payments if the U.S. Holder fails to provide its taxpayer identification number to the paying agent and comply with certain certification procedures or otherwise establish an exemption from backup withholding. The amount of any backup withholding from a payment to a U.S. Holder will be allowed as a credit against the U.S. Holder’s U.S. federal income tax liability and may entitle the U.S. Holder to a refund, provided that the required information is timely furnished to the IRS.
163
| F. | Dividends and Paying Agents |
Not Applicable.
Not Applicable.
We are subject to the information requirements of the Exchange Act, except that as a foreign private issuer, we are not subject to the proxy rules or the short-swing profit disclosure rules of the Exchange Act. In accordance with these statutory requirements, we file or furnish reports and other information with the SEC. Reports and other information filed or furnished by BBVA with the SEC may be inspected and copied at the public reference facilities maintained by the SEC at 100 F Street, N.E., Washington, D.C. 20549. Copies of such material may also be inspected at the offices of the New York Stock Exchange, 11 Wall Street, New York, New York 10005, on which BBVA’s ADSs are listed. In addition, the SEC maintains a web site that contains information filed or furnished electronically with the SEC, which can be accessed over the internet athttp://www.sec.gov.
Not Applicable.
| ITEM 11. | QUANTITATIVE AND QUALITATIVE DISCLOSURES ABOUT MARKET RISK |
Market Risk Management
Market Risk in Trading Portfolio in 2013
We mainly use Value at Risk (VaR) to measure and manage market risk.
The market risk factors used to measure and control risks in the trading portfolio are the basis of all calculations using the VaR.
VaR measures the maximum loss with a given probability over a given period as a result of changes in the general conditions of financial markets and their effects on market risk factors. We mainly estimate daily VaR estimates using the “historical simulation” methodology.
The types of risk factors we use to measure VaR are:
| | • | | Interest rate risk: the potential loss in value of the portfolio due to movements in interest rate curves. We use all interest rate curves in which we have positions and risks exist. We also use a wide range of vertices reflecting the different maturities within each curve. |
| | • | | Credit spread risk: the potential loss in the value of corporate bonds or any corporate bond derivatives caused by movements in credit spreads for such instruments. Credit spread VaR is estimated by moving the credit spreads used as risk factors through a range of scenarios. The risk factors used in the simulation are credit spread curves by sector and by rating, and specific spread curves for individual issuers. |
| | • | | Exchange rate risk: the potential loss caused by movements in exchange rates. Exchange rate risk VaR is estimated by analyzing present positions with observed actual changes in exchange rates. |
164
| | • | | Equity or commodity risk: the potential loss caused by movements in equity prices, stock-market indices and commodity prices. Equity or commodity risk VaR is estimated by re-measuring present positions using actual changes in equity prices, stock-market indices and commodity prices. |
| | • | | Vega risk: the potential loss caused by movements in implied volatilities affecting the value of options. Vega (equities, interest rate and exchange rate) risk VaR is estimated by analyzing implied volatility surfaces with observed changes in the implied volatilities of equity, interest rate and exchange rate options. |
| | • | | Correlation risk: the potential loss caused by a disparity between the estimated and actual correlation between two assets, currencies, derivatives, instruments or markets. |
Trading portfolio
The activity of each of the Group’s Global Markets trading units is controlled and monitored by the risk unit. Measurement procedures are established in terms of the possible impact of negative market conditions on the trading portfolio of the Group’s Global Markets units, both under ordinary circumstances and in situations of heightened risk factors.
The measurement model used to assess market risk is Value at Risk (VaR), which provides a forecast with a 99% probability of the maximum loss that can be incurred by the market positions of trading portfolios in a one-day horizon, stemming from fluctuations in equity prices, interest rates, foreign-exchange rates and commodity prices. In addition, for some positions, other risks also need to be considered, such as credit spread risk, basis risk, volatility and correlation risk.
BBVA and BBVA Bancomer have received approval from the Bank of Spain to use a model developed by the BBVA Group to calculate bank capital requirements for market risk. This model estimates VaR in accordance with the “historical simulation” methodology, which involves estimating the losses or gains that would have been produced in the current portfolio if the changes in market conditions occurring over a specific period of time were repeated. Using this information, it infers the maximum foreseeable loss in the current portfolio with a given level of confidence. This model has the advantage of precisely reflecting the historical distribution of the market variables and not requiring any assumption of specific probability distribution. The historical period used in this model is two years.
In addition, the Bank follows the guidelines set out by Spanish and European authorities regarding other metrics to meet the Bank of Spain’s regulatory requirements. The new measurements of market risk for the trading portfolio include the calculation of stressed VaR (which quantifies the level of risk in extreme historical situations) and the quantification of default risks and downgrading of credit ratings of bonds and credit portfolio derivatives.
The limits structure of the BBVA Group’s market risk determines a system of VaR and economic capital limits by market risk for each operating segment, with specific ad-hoc sub-limits by type of risk, activity and trading desk.
Validity tests are performed periodically on the risk measurement models used by the Group. They estimate the maximum loss that could have been incurred in the positions assessed with a certain level of probability (backtesting), as well as measurements of the impact of extreme market events on risk positions (stress testing). As an additional control measure, backtesting is conducted at trading desk level in order to enable more specific monitoring of the validity of the measurement models.
165
Trends in market risk
The changes in the BBVA Group’s market risk in 2013, measured as VaR without smoothing, with a 99% confidence level and a 1-day horizon, were as follows:
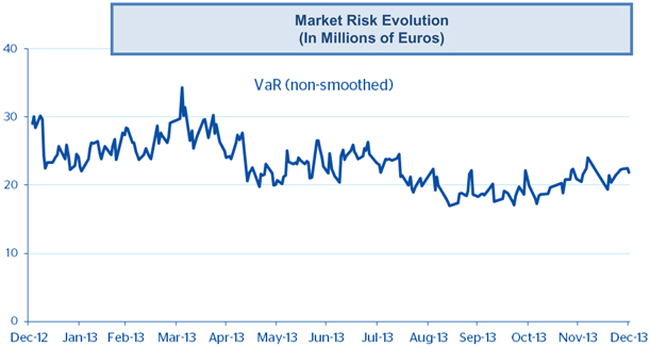
By geographical area, and as an annual average in 2013, 49.2% of the market risk corresponded to Global Markets (GM) Europe and GM Compass and 50.8% to the Group’s subsidiaries in Latin America, of which 35.0% related to GM BBVA Bancomer.

The average VaR in 2013 stood at €23 million, compared with €22 million in 2012 and €24 million in 2011. The number of risk factors currently used to measure portfolio risk is around 3,600. This number is dynamic and varies according to the possibility of doing business in other underlying assets and markets.
166
As of December 31, 2013, 2012 and 2011 VaR amounted to €22 million, €30 million and €18 million, respectively. These figures can be broken down as follows:
| | | | | | | | | | | | |
| Risk | | December 31, 2013 | | | December 31, 2012 | | | December 31, 2011 | |
| | | (In Millions of Euros) | |
Interest/Spread risk | | | 22 | | | | 35 | | | | 27 | |
Currency risk | | | 4 | | | | 3 | | | | 3 | |
Stock-market risk | | | 3 | | | | 3 | | | | 7 | |
Vega/Correlation risk | | | 11 | | | | 9 | | | | 4 | |
Diversification effect(*) | | | (18 | ) | | | (19 | ) | | | (23 | ) |
Total | | | 22 | | | | 30 | | | | 18 | |
VaR average in the period | | | 23 | | | | 22 | | | | 24 | |
VaR max in the period | | | 34 | | | | 31 | | | | 36 | |
VaR min in the period | | | 17 | | | | 15 | | | | 16 | |
| (*) | The diversification effect is the difference between the sum of the average individual risk factors and the total VaR figure (which implicitly reflects the correlation between all the individual risk factors and scenarios used in the measurement). For more information see Note 7 to the Consolidated Financial Statements. |
By type of market risk assumed by the Group’s trading portfolio, as of December 31, 2013, the main risks were interest rate and credit spread risks, which declined by €13 million since December 31, 2012. Currency risk increased by €1 million and volatility and correlation risk increased by €2 million since December 31, 2012. Equity risk remained without significant changes with respect to the close of 2012.
The change in average daily VaR in 2013 compared with 2012 is basically due to GM Bancomer and GM South America increasing their average risk by 57% and 7% respectively in 2013 (with an average daily VaR of €8 million and €4 million, respectively). GM Europe reduced its average risk by 18% year-on-year (with an average daily VaR in 2013 of €11 million).
Model validation
The internal market risk model is validated periodically by backtesting, both in BBVA and in BBVA Bancomer.
The aim of backtesting is to validate the quality and precision of the internal model used by the BBVA Group to estimate the maximum daily loss of a portfolio, at a 99% level of confidence and a 250-day time horizon, by comparing the Group’s results and the measurements of risk generated by the model. The tests performed in 2013 (which are described in greater detail below) showed that the internal market risk model used by BBVA and BBVA Bancomer was adequate and precise.
Two types of backtesting were carried out in 2013:
| | 1. | Hypothetical backtesting: the daily VaR is compared with the results obtained, not taking into account the intraday results or the changes in the portfolio positions. This validates the appropriateness of the market risk metrics for the end-of-day positions. |
| | 2. | Real backtesting: the daily VaR is compared with the total results, including intraday transactions, but discounting the possible minimum charges or fees involved. This type of backtesting includes the intraday risk in portfolios. |
In addition, each of these two types of backtesting was carried out for each risk factor or business type, thus allowing for a deeper analysis of the results with respect to risk measurements.
Backtesting in BBVA did not reveal any exception in 2013. The sovereign debt and Spanish corporate credit spreads continued to narrow during the year and the equity markets have in general evolved positively. The backtesting carried out in 2013, both at the global group level and at the level of each risk factor, did not detect any type of anomaly in the VaR calculation model.
167
In 2013, BBVA Bancomer carried out backtesting of the internal calculation model of VaR, comparing the daily results obtained with the estimated results obtained by the VaR calculation model. At the end of the year the comparison showed the model was functioning correctly, within the “green” zone (0-4 exceptions), thus validating the model. Portfolio losses only exceeded the daily VaR on one occasion, thus also validating the correct operation of the model according to Basel criteria.
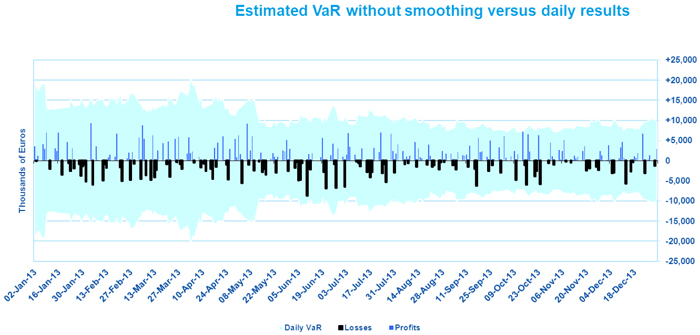
Stress test analysis
A number of stress tests are carried out on the BBVA Group’s trading portfolios. First, global and local historical scenarios are used that replicate the behavior of an extreme past event, such as for example the collapse of Lehman Brothers or the Tequila crisis. These stress tests are complemented with simulated scenarios, where the aim is to generate scenarios that have a significant impact on the different portfolios, but without being anchored to any specific historical scenario. Finally, for some portfolios or positions, fixed stress tests are also carried out that have a significant impact on the market variables affecting these positions.
Historical scenarios
The historical benchmark stress scenario for the BBVA Group is Lehman Brothers, whose sudden collapse in September 2008 led to a significant impact on the behavior of financial markets at a global level. The following are the most relevant effects of this historical scenario:
| | – | Credit shock: reflected mainly in the increase of credit spreads and downgrades in credit ratings. |
| | – | Increased volatility in most of the financial markets (giving rise to a great deal of variation in the prices of different assets (currency, equity, debt). |
| | – | Liquidity shock in the financial systems, reflected by a major movement in interbank curves, particularly in the shortest sections of the euro and dollar curves. |
168
Simulated scenarios
Unlike the historical scenarios, which are fixed and thus do not adapt to the composition of portfolio risks at any one time, the scenario used to carry out the economic stress tests are based on a resampling methodology. This methodology uses dynamic scenarios that are recalculated regularly according to the main risks in the trading portfolios at any time. A simulation exercise is carried out on a window of data that is sufficiently extensive to include different periods of stress (data are taken from January 1, 2008 through to today), using a resampling of the historical observations. This generates a distribution of losses and gains that provides an analysis of the most extreme events occurred within the selected historical window. The advantage of this methodology is that the stress period is not pre-established, but rather a function of the portfolio held at any time. As it makes a high number of simulations (10,000) it can analyze the expected shortfall with greater richness of information than that available in the scenarios included in the VaR calculation.
The main advantages of this methodology are the following:
| | – | The simulations generated in this stress test methodology maintain the market risk factor correlation structure. |
| | – | High adaptability to the inclusion of new risk factors. |
| | – | It allows a great deal of variability to be introduced into the simulations (desirable for considering extreme events). |
Market Risk in Non–Trading Portfolio in 2013
Structural risk
Structural interest rate risk
The aim of on-balance sheet interest rate risk management is to maintain the BBVA Group’s exposure to market interest rate fluctuations at levels in keeping with its risk strategy and profile. In pursuance of this, the BBVA Group undertakes active balance sheet management through operations intended to optimize the levels of risk assumed against expected earnings and respect the maximum levels of accepted risk. The Asset and Liabilities Committee (ALCO) is the body that makes the decisions to act according to the proposals of the Balance Sheet Management unit, which designs and executes the strategies to be implemented, using internal risk metrics in accordance with the corporate model.
The Corporate Risk Management (“CRM”) area acts as an independent unit responsible for monitoring and analyzing risks, standardizing risk management metrics and providing tools that can anticipate potential deviations from targets. In addition, it monitors the level of compliance with the risk limits established by the Executive Committee, reporting regularly to the Risk Management Committee (“RMC”), the Board’s Risk Committee and the Executive Committee, in particular in case of significant levels of risk assumed, in accordance with current corporate policy.
The interest rate risk metrics designed by the CRM area periodically quantify the impact that a variation of 100 basis points in market interest rates would have on the BBVA Group’s net interest income and economic value. This is complemented with metrics in probabilistic terms: “economic capital” (maximum estimated loss in economic value) and the “risk margin” (the maximum estimated loss in net interest income). In all cases, the metrics are calculated as originated by the structural interest rate risk of banking activity (excluding trading floor activity), based on simulation models of interest rate curves. With the same frequency, the Group performs stress tests and scenario analyses to complement its assessment of its interest rate risk profile.
The BBVA Group’s corporate risk model allows hypotheses to be established on the behavior of certain products, particularly those without explicit or contractual expiry. These assumptions are based on studies that calculate the relationship between the return on these products and market rates. They enable specific balances to be disaggregated into “trend-based” (long-term) and “seasonal or volatile” (short-term residual maturity) balances.
169
In 2013, the weakness of the economic recovery, together with the fiscal adjustments and risks of deflation, have maintained interest rates in Europe and the U.S. at all-time lows. At the same time, the growth of emerging markets has slowed as a result of the fall in commodity prices and tougher financing conditions, leading to more expansive policies by central banks. In this interest rate situation, the BBVA Group’s structural interest rate risk has remained under control, within the limits established by the Executive Committee. The current levels of the euro and U.S. dollar, which are exceptionally low, also constitute a barrier to the Group’s exposure, which has a favorable position with respect to rises in market rates.
Movements in interest rates lead to changes in a bank’s net interest income and book value, which constitutes a key source of asset and liability interest rate risk. The extent of impacts of this kind will depend on the bank’s exposure to changes in interest rates. This exposure is mainly the result of the time difference between the repricing and maturities of the different products on the banking book. The accompanying chart shows the difference between the interest rate sensitivity of assets on our banking book which will reprice within a specific period of time and the interest rate sensitivity of liabilities on our banking book which will reprice within such period of time, showing our exposure to changes in interest rates as of December 31, 2013.
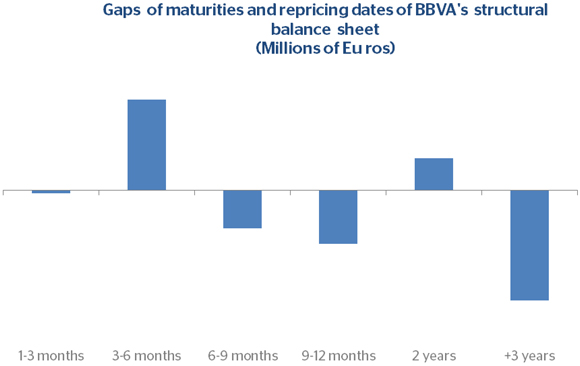
In addition, sensitivity is measured to a standard deviation of 100 basis points for all the market yield curves. The chart below shows the asset and liability interest rate profile of the main entities in the BBVA Group, according to their sensitivities, as of December 31, 2013.
170
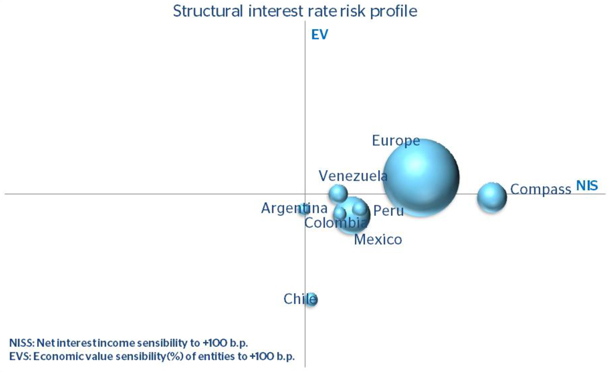
Below are the average interest rate risk exposure levels in terms of sensitivity of the main geographical areas of the BBVA Group in 2013:
| | | | | | | | | | | | | | | | |
| | | Impact on Net Interest Income (*) | | | Impact on Economic Value (**) | |
| | | 100 Basis-Point Increase | | | 100 Basis-Point Decrease | | | 100 Basis-Point Increase | | | 100 Basis-Point Decrease | |
| | | | | | | | | | | | | | | | |
Europe | | | 6.41 | % | | | (7.80 | )% | | | 1.58 | % | | | (1.92 | )% |
Mexico | | | 2.27 | % | | | (2.27 | )% | | | (1.39 | )% | | | 1.59 | % |
USA | | | 6.27 | % | | | (8.11 | )% | | | 1.60 | % | | | (6.51 | )% |
South America | | | 1.53 | % | | | (1.39 | )% | | | (2.93 | )% | | | 3.01 | % |
BBVA Group | | | 3.42 | % | | | (3.90 | )% | | | 0.80 | % | | | (1.66 | )% |
| (*) | Percentage of “1 year” net interest income forecast for each geographical area. |
| (**) | Percentage of core capital for each geographical area. |
Structural currency risk
Structural currency risk is basically caused by exposure to variations in foreign currency exchange rates that arise in the BBVA Group’s foreign subsidiaries and foreign branches financed in a different currency to that of the investment.
Structural exchange rate risk management in BBVA aims to minimize the potential negative impact from fluctuations in exchange rates on the capital ratios and on the contribution to earnings of international investments maintained on a long-term basis by the Group.
The Asset and Liabilities Committee (ALCO) is the body that makes the decisions to act according to the proposals of the Balance Sheet Management unit, which designs and executes the strategies to be implemented, using internal risk metrics in accordance with the corporate model.
171
The Corporate Risk Management (CRM) area acts as an independent unit responsible for monitoring and analyzing risks, standardizing risk management metrics and providing tools that can anticipate potential deviations from targets. In addition, it monitors the level of compliance with the risk limits established by the Executive Committee, reporting regularly to the Risk Management Committee (RMC), the Board’s Risk Committee and the Executive Committee, in particular in case of significant levels of risk assumed, in accordance with current corporate policy.
The corporate measurement model is based on the simulation of exchange rate scenarios, using their historical change and evaluating impacts in three core management areas: capital ratio, equity and the Group’s income statement. The risk mitigation measures aimed at reducing exchange rate risk exposures are considered in calculating risk estimates. The diversification resulting from investment in different geographical areas is also taken into account. In addition, in order to complement the metrics in the three core management areas, the risk measurements are complemented with analyses of scenarios, stress testing and backtesting, thus giving a more complete overview of the Group’s exposure.
In 2013, in an environment characterized by uncertainty and volatility in currency markets, the risk mitigation level of the carrying value of the BBVA Group’s holdings in foreign currency remained at 39%. The estimated exposure coverage of 2013 earnings in foreign currency has been 43%.
In 2013, the average asset exposure sensitivity to a 1% depreciation in exchange rates against the euro in the main currencies to which BBVA is exposed stood at €200 million, with 34% relating to the Mexican peso, 26% relating to South American currencies, 23% relating to Asian and Turkish currencies, and 15% relating to the US dollar.
Structural equity risk
The BBVA Group’s exposure to structural equity risk is basically derived from investments in industrial and financial companies with medium- and long-term investment horizons. This exposure is mitigated through net short positions held in derivatives of their underlying assets, used to limit portfolio sensitivity to potential falls in prices.
The Corporate Risk Management (CRM) area acts as an independent unit responsible for monitoring and analyzing risks, standardizing risk management metrics and providing tools that can anticipate potential deviations from targets. In addition, it monitors the level of compliance with the risk limits established by the Executive Committee, reporting regularly to the Risk Management Committee (RMC), the Board’s Risk Committee and the Executive Committee, in particular in case of significant levels of risk assumed, in accordance with current corporate policy.
The structural equity risk metrics designed by CRM according to the corporate model contribute to the effective monitoring of risk by estimating the sensitivity figures and the capital necessary to cover possible unexpected losses due to variations in the value of the companies making up the Group’s equity portfolio, at a confidence level that corresponds to the institution’s target rating, and taking into account the liquidity of the positions and the statistical performance of the assets under consideration. These figures are supplemented by periodic stress tests, backtesting and scenario analyses.
The aggregate sensitivity of the BBVA Group’s consolidated equity to a 1% fall in the price of shares of the companies making up the equity portfolio stood at €31 million as of December 31, 2013, and the sensitivity of pre-tax profit is estimated at €1 million. These figures are estimated taking into account the exposure in shares valued at market prices, or if not applicable, at fair value (except for the positions in the Treasury Area portfolios) and the net delta-equivalent positions in options on their underlyings.
See Note 7 of the Consolidated Financial Statements for additional information on risks faced by BBVA.
172
| ITEM 12. | DESCRIPTION OF SECURITIES OTHER THAN EQUITY SECURITIES |
Not Applicable.
Not Applicable.
Not Applicable.
| D. | American Depositary Shares |
Our ADSs are listed on the New York Stock Exchange under the symbol “BBVA”. The Bank of New York Mellon is the depositary (the “Depositary”) issuing ADSs pursuant to an amended and restated deposit agreement dated June 29, 2007 among BBVA, the Depositary and the holders from time to time of ADSs (the “Deposit Agreement”). Each ADS represents the right to receive one share. The table below sets forth the fees payable, either directly or indirectly, by a holder of ADSs as of the date of this Annual Report.
| | | | |
Category | | Depositary Actions | | Associated Fee / By Whom Paid |
| (a) Depositing or substituting the underlying shares | | Issuance of ADSs | | Up to $5.00 for each 100 ADSs (or portion thereof) evidenced by the new ADSs delivered (charged to person depositing the shares or receiving the ADSs) |
| (b) Receiving or distributing dividends | | Distribution of cash dividends or other cash distributions; distribution of share dividends or other free share distributions; distribution of securities other than ADSs or rights to purchase additional ADSs | | Not applicable |
| (c) Selling or exercising rights | | Distribution or sale of securities | | Not applicable |
| | |
| (d) Withdrawing an underlying security | | Acceptance of ADSs surrendered for withdrawal of deposited securities | | Up to $5.00 for each 100 ADSs (or portion thereof) evidenced by the ADSs surrendered (charged to person surrendering or to person to whom withdrawn securities are being delivered) |
| (e) Transferring, splitting or grouping receipts | | Transfers, combining or grouping of depositary receipts | | Not applicable |
| (f) General depositary services, particularly those charged on an annual basis | | Other services performed by the Depositary in administering the ADSs | | Not applicable |
| (g) Expenses of the Depositary | | Expenses incurred on behalf of holders in connection with • stock transfer or other taxes (including Spanish income taxes) and other governmental charges; • cable, telex and facsimile transmission and delivery charges incurred at request of holder of ADS or person depositing shares for the issuance of ADSs; • transfer, brokerage or registration fees for the registration of shares or other deposited securities on the share register and applicable to transfers of shares or other deposited securities to or from the name of the custodian; • reasonable and customary expenses of the depositary in connection with the conversion of foreign currency into U.S. dollars | | Expenses payable by holders of ADSs or persons depositing shares for the issuance of ADSs; expenses payable in connection with the conversion of foreign currency into U.S. dollars are payable out of such foreign currency |
173
The Depositary may remit to us all or a portion of the Depositary fees charged for the reimbursement of certain of the expenses we incur in respect of the ADS program established pursuant to the Deposit Agreement upon such terms and conditions as we may agree from time to time. In the year ended December 31, 2013, the Depositary reimbursed us $825 thousand with respect to certain fees and expenses. The table below sets forth the types of expenses that the Depositary has agreed to reimburse and the amounts reimbursed in 2013.
| | | | |
Category of Expenses | | Amount
Reimbursed in
the Year Ended
December 31,
2013 | |
| | | (In Thousands of
Dollars) | |
NYSE Listing Fees | | | 122 | |
Investor Relations Marketing | | | 485 | |
Professional Services | | | 149 | |
Annual Shareholders’ General Meeting Expenses | | | 64 | |
Other | | | 5 | |
174
PART II
| ITEM 13. | DEFAULTS, DIVIDEND ARREARAGES AND DELINQUENCIES |
Not Applicable.
| ITEM 14. | MATERIAL MODIFICATIONS TO THE RIGHTS OF SECURITY HOLDERS AND USE OF PROCEEDS |
Not Applicable.
| ITEM 15. | CONTROLS AND PROCEDURES |
Conclusion Regarding the Effectiveness of Disclosure Controls and Procedures
As of December 31, 2013, BBVA, under the supervision and with the participation of BBVA’s management, including our Chairman and Chief Executive Officer, President and Chief Operating Officer and Chief Global Accounting and Information Management Officer, performed an evaluation of the effectiveness of the design and operation of our disclosure controls and procedures (as defined in Rule 13a-15(e) under the Exchange Act). There are inherent limitations to the effectiveness of any control system, including disclosure controls and procedures. Accordingly, even effective disclosure controls and procedures can provide only reasonable assurance of achieving their control objectives.
Based upon their evaluation, BBVA’s Chairman and Chief Executive Officer, President and Chief Operating Officer and Chief Global Accounting and Information Management Officer concluded, that BBVA’s disclosure controls and procedures are effective at a reasonable assurance level in ensuring that information relating to BBVA, including its consolidated subsidiaries, required to be disclosed in reports that it files under the Exchange Act is (1) recorded, processed, summarized and reported within the time periods specified in the SEC’s rules and forms, and (2) accumulated and communicated to the management, including principal financial officers, as appropriate to allow timely decisions regarding required disclosure.
Management’s Report on Internal Control Over Financial Reporting
The management of BBVA is responsible for establishing and maintaining adequate internal control over financial reporting as defined in Rule 13a-15(f) under the Exchange Act. BBVA’s internal control over financial reporting is a process designed to provide reasonable assurance regarding the reliability of financial reporting and the preparation of financial statements for external purposes in accordance with generally accepted accounting principles and includes those policies and procedures that:
| | • | | Pertain to the maintenance of records that, in reasonable detail, accurately and fairly reflect the transactions and dispositions of the assets of BBVA; |
| | • | | Provide reasonable assurance that transactions are recorded as necessary to permit preparation of financial statements in accordance with generally accepted accounting principles, and that our receipts and expenditures are being made only in accordance with authorizations of BBVA’s management and directors; and |
| | • | | Provide reasonable assurance regarding prevention or timely detection of unauthorized acquisition, use or disposition of our assets that could have a material effect on the financial statements. |
175
Because of its inherent limitations, internal control over financial reporting may not prevent or detect misstatements. Also, projections of any evaluation of effectiveness to future periods are subject to the risk that controls may become inadequate because of changes in conditions, or that the degree of compliance with the policies or procedures may deteriorate.
Under the supervision and with the participation of BBVA’s management, including our Chairman and Chief Executive Officer, President and Chief Operating Officer and Chief Accounting Officer, we conducted an evaluation of the effectiveness of our internal control over financial reporting based on the criteria established inInternal Control— 1992 Integrated Framework issued by the Committee of Sponsoring Organizations of the Treadway Commission (“COSO”). Based on this assessment, our management concluded that, as of December 31, 2013, our internal control over financial reporting was effective based on those criteria.
In May 2013, COSO published an updated version of its Internal Control Integrated – Framework. This new framework provides broader guidelines and clarifies the requirements for determining what constitutes effective internal control. While BBVA is in the process of analyzing the updated version, no significant changes are expected in the current internal control model.
Our internal control over financial reporting as of December 31, 2013 has been audited by Deloitte S.L., an independent registered public accounting firm, as stated in their report which follows below.
Report of Independent Registered Public Accounting Firm
To the Board of Directors and Shareholders of Banco Bilbao Vizcaya Argentaria, S.A.:
We have audited the internal control over financial reporting of BANCO BILBAO VIZCAYA ARGENTARIA, S.A. (the “Company”) and subsidiaries composing the BANCO BILBAO VIZCAYA ARGENTARIA Group (the “Group” - Note 3) as of December 31, 2013, based on criteria established inInternal Control—Integrated Framework (1992)issued by the Committee of Sponsoring Organizations of the Treadway Commission. The Company’s management is responsible for maintaining effective internal control over financial reporting and for its assessment of the effectiveness of internal control over financial reporting, included in the accompanyingManagement’s Report on Internal Control Over Financial Reporting. Our responsibility is to express an opinion on the Group’s internal control over financial reporting based on our audit.
We conducted our audit in accordance with the standards of the Public Company Accounting Oversight Board (United States). Those standards require that we plan and perform the audit to obtain reasonable assurance about whether effective internal control over financial reporting was maintained in all material respects. Our audit included obtaining an understanding of internal control over financial reporting, assessing the risk that a material weakness exists, testing and evaluating the design and operating effectiveness of internal control based on the assessed risk, and performing such other procedures as we considered necessary in the circumstances. We believe that our audit provides a reasonable basis for our opinion.
A company’s internal control over financial reporting is a process designed by, or under the supervision of, the company’s principal executive and principal financial officers, or persons performing similar functions, and effected by the company’s board of directors, management, and other personnel to provide reasonable assurance regarding the reliability of financial reporting and the preparation of financial statements for external purposes in accordance with generally accepted accounting principles. A company’s internal control over financial reporting includes those policies and procedures that (1) pertain to the maintenance of records that, in reasonable detail, accurately and fairly reflect the transactions and dispositions of the assets of the company; (2) provide reasonable assurance that transactions are recorded as necessary to permit preparation of financial statements in accordance with generally accepted accounting principles, and that receipts and expenditures of the company are being made only in accordance with authorizations of management and directors of the company; and (3) provide reasonable assurance regarding prevention or timely detection of unauthorized acquisition, use, or disposition of the company’s assets that could have a material effect on the financial statements.
176
Because of the inherent limitations of internal control over financial reporting, including the possibility of collusion or improper management override of controls, material misstatements due to error or fraud may not be prevented or detected on a timely basis. Also, projections of any evaluation of the effectiveness of the internal control over financial reporting to future periods are subject to the risk that the controls may become inadequate because of changes in conditions, or that the degree of compliance with the policies or procedures may deteriorate.
In our opinion, the Group maintained, in all material respects, effective internal control over financial reporting as of December 31, 2013, based on the criteria established inInternal Control — Integrated Framework (1992) issued by the Committee of Sponsoring Organizations of the Treadway Commission.
We have also audited, in accordance with the standards of the Public Company Accounting Oversight Board (United States), the consolidated financial statements as of and for the year ended December 31, 2013 of the Group and our report dated April 30, 2014 expressed an unqualified opinion on those financial statements.
DELOITTE, S.L.
Madrid—Spain
April 30, 2014
Changes in Internal Control Over Financial Reporting
There has been no change in BBVA’s internal control over financial reporting (as defined in Rule 13a-15(f) under the Exchange Act) that occurred during the period covered by this Annual Report that has materially affected, or is reasonably likely to materially affect, internal control over financial reporting.
| ITEM 16A. | AUDIT COMMITTEE FINANCIAL EXPERT |
The charter for our Audit and Compliance Committee provides that the Chairman of the Audit and Compliance Committee is required to have experience in financial matters as well as knowledge of the accounting standards and principles required by the banking regulators, and we have determined that Mr. José Luis Palao García Suelto, the Chairman of the Audit and Compliance Committee, has such experience and knowledge and is an “audit committee financial expert” as such term is defined by the regulations of the Securities and Exchange Commission issued pursuant to Section 407 of the Sarbanes-Oxley Act of 2002. Mr. Palao is independent within the meaning of the New York Stock Exchange listing standards.
In addition, we believe that the remaining members of the Audit and Compliance Committee have an understanding of applicable generally accepted accounting principles, experience analyzing and evaluating financial statements that present a breadth and level of complexity of accounting issues that are generally comparable to the breadth and complexity of issues that can reasonably be expected to be raised by our Consolidated Financial Statements, an understanding of internal controls over financial reporting, and an understanding of audit committee functions. Our Audit and Compliance Committee has experience overseeing and assessing the performance of BBVA and its consolidated subsidiaries and our external auditors with respect to the preparation, auditing and evaluation of our Consolidated Financial Statements.
BBVA’s Code of Ethics and Conduct applies, among others, to its chief executive officer, chief financial officer and chief accounting officer. This code establishes the principles that guide these officers’ respective actions: ethical conduct, professional standards and confidentiality. It also establishes the limitations and defines the conflicts of interest arising from their status as senior executives. We have not waived compliance with, nor made any amendment to, the Code of Ethics and Conduct in 2013. BBVA’s Code of Ethics and Conduct can be found on its website at www.bbva.com.
177
| ITEM 16C. | PRINCIPAL ACCOUNTANT FEES AND SERVICES |
The following table provides information on the aggregate fees billed by our principal accountants, Deloitte, S.L. and its worldwide affiliates, by type of service rendered for the periods indicated.
| | | | | | | | |
| | | Year ended December 31, | |
Services Rendered | | 2013 | | | 2012 | |
| | | (In Millions of Euros) | |
Audit Fees (1) | | | 20.4 | | | | 19.3 | |
Audit-Related Fees (2) | | | 2.8 | | | | 2.6 | |
Tax Fees (3) | | | 1.7 | | | | 2.2 | |
All Other Fees (4) | | | 2.2 | | | | 2.2 | |
| | | | | | | | |
Total | | | 27.1 | | | | 26.3 | |
| (1) | Aggregate fees billed for each of the last two fiscal years for professional services rendered by Deloitte, S.L. and its worldwide affiliates for the audit of BBVA’s annual financial statements or services that are normally provided by Deloitte, S.L. and its worldwide affiliates in connection with statutory and regulatory filings or engagements for those fiscal years. |
| (2) | Aggregate fees billed in each of the last two fiscal years for assurance and related services by Deloitte, S.L. and its worldwide affiliates that are reasonably related to the performance of the audit or review of BBVA’s financial statements and are not reported under (1) above. |
| (3) | Aggregate fees billed in each of the last two fiscal years for professional services rendered by Deloitte, S.L. and its worldwide affiliates for tax compliance, tax advice, and tax planning. |
| (4) | Aggregate fees billed in each of the last two fiscal years for products and services provided by Deloitte, S.L. and its worldwide affiliates other than the services reported in (1), (2) and (3) above. Services in this category consisted primarily of consultancy and implementation of new regulation. |
The Audit and Compliance Committee’s Pre-Approval Policies and Procedures
In order to assist in ensuring the independence of our external auditor, the regulations of our Audit and Compliance Committee provides that our external auditor is generally prohibited from providing us with non-audit services, other than under the specific circumstance described below. For this reason, our Audit and Compliance Committee has developed a pre-approval policy regarding the contracting of BBVA’s external auditor, or any affiliate of the external auditor, for professional services. The professional services covered by such policy include audit and non-audit services provided to BBVA or any of its subsidiaries reflected in agreements dated on or after May 6, 2003.
The pre-approval policy is as follows:
| | 1. | The hiring of BBVA’s external auditor or any of its affiliates is prohibited, unless there is no other firm available to provide the needed services at a comparable cost and that could deliver a similar level of quality. |
| | 2. | In the event that there is no other firm available to provide needed services at a comparable cost and delivering a similar level of quality, the external auditor (or any of its affiliates) may be hired to perform such services, but only with the pre-approval of the Audit and Compliance Committee. |
| | 3. | The Chairman of the Audit and Compliance Committee has been delegated the authority to approve the hiring of BBVA’s external auditor (or any of its affiliates). In such an event, however, the Chairman would be required to inform the Audit and Compliance Committee of such decision at the Committee’s next meeting. |
| | 4. | The hiring of the external auditor for any of BBVA’s subsidiaries must also be pre-approved by the Audit and Compliance Committee. |
178
| ITEM 16D. | EXEMPTIONS FROM THE LISTING STANDARDS FOR AUDIT COMMITTEES |
Not Applicable.
| ITEM 16E. | PURCHASES OF EQUITY SECURITIES BY THE ISSUER AND AFFILIATED PURCHASERS |
| | | | | | | | | | | | | | | | |
2013 | | Total Number of Ordinary
Shares Purchased | | | Average Price
Paid per Share (or Unit) | | | Total Number of Shares
(or Units) Purchased as
Part of Publicly
Announced Plans or
Programs | | | Maximum Number (or
Approximate Dollar
Value) of Shares (or Units)
that May Yet Be
Purchased Under the
Plans or Programs | |
January 1 to January 31 | | | 53,137,273 | | | € | 7.56 | | | | — | | | | — | |
February 1 to February 28 | | | 55,280,230 | | | € | 7.34 | | | | — | | | | — | |
March 1 to March 31 | | | 104,345,907 | | | € | 7.43 | | | | — | | | | — | |
April 1 to April 30 | | | 47,240,937 | | | € | 6.81 | | | | — | | | | — | |
May 1 to May 31 | | | 26,292,714 | | | € | 7.32 | | | | — | | | | — | |
June 1 to June 30 | | | 42,419,779 | | | € | 6.73 | | | | — | | | | — | |
July 1 to July 31 | | | 43,123,802 | | | € | 6.47 | | | | — | | | | — | |
August 1 to August 31 | | | 31,369,056 | | | € | 7.21 | | | | — | | | | — | |
September 1 to September 30 | | | 10,835,087 | | | € | 7.80 | | | | — | | | | — | |
October 1 to October 31 | | | 27,216,906 | | | € | 8.78 | | | | — | | | | — | |
November 1 to November 30 | | | 16,294,748 | | | € | 8.53 | | | | — | | | | — | |
December 1 to December 31 | | | 31,429,074 | | | € | 8.40 | | | | — | | | | — | |
| | | | | | | | | | | | | | | | |
Total | | | 488,985,513 | | | € | 7.39 | | | | — | | | | — | |
| | | | | | | | | | | | | | | | |
During 2013, we sold a total of 497,571,679 shares for an average price of €7.44 per share.
| ITEM 16F. | CHANGE IN REGISTRANT’S CERTIFYING ACCOUNTANT |
During the years ended December 31, 2013, 2012 and 2011 and through the date of this Annual Report, the principal independent accountant engaged to audit our financial statements, Deloitte S.L., has not resigned, indicated that it has declined to stand for re-election after the completion of its current audit or been dismissed. For each of the years ended December 31, 2013, 2012 and 2011, Deloitte S.L. has not expressed reliance on another accountant or accounting firm in its report on our audited annual accounts for such periods.
179
| ITEM 16G. | CORPORATE GOVERNANCE |
Compliance with NYSE Listing Standards on Corporate Governance
On November 4, 2003, the SEC approved rules proposed by the New York Stock Exchange (the “NYSE”) intended to strengthen corporate governance standards for listed companies. In compliance therewith, the following is a summary of the significant differences between our corporate governance practices and those applicable to domestic issuers under the NYSE listing standards.
Independence of the Directors on the Board of Directors and Board Committees
Under the NYSE corporate governance rules, (i) a majority of a U.S. company’s board of directors must be composed of independent directors, (ii) all members of the audit committee must be independent and (iii) all U.S. companies listed on the NYSE must have a compensation committee and a nominations committee and all members of such committees must be independent. In each case, the independence of directors must be established pursuant to highly detailed rules promulgated by the NYSE and, in the case of the audit committee, the NYSE and the SEC.
Subject to certain exceptions not applicable to us and except as indicated below, Spanish law does not currently contain any requirement that members of the board of directors or the committees thereof be independent, nor does Spanish law provide a definition of what constitutes independence for the purpose of board or committee membership. Regarding the definition of what constitutes independence, the Ministerial Order ECC/461/2013, of March 20, 2013, has introduced, among other matters, a definition of what constitutes independence of a board membership for the purposes of fulfilling the Annual Corporate Governance Report. Notwithstanding this, it is likely that this same definition will be included in a near future reform of the Spanish Corporate Enterprises Act.
In addition, according to the Securities Market Act, listed companies should have an Audit Committee which should be composed of a majority of non-executive directors being at least one of its members an independent director.
With respect to board committees, pursuant to Notice 3/2008, May 22, 2008, the Bank of Spain will determine which credit entities should have a Compensation Committee, taking into account, among other things, their size, internal organization and the complexity of their activities. The Chairman and the members of the Compensation Committee, if any, will be members of the Board of Directors with no executive functions.
Moreover, pursuant to corporate governance non-binding recommendations applicable to listed companies in Spain, under the comply or explain principle, the Audit and Compliance Committee, the Compensation Committee and the Appointments Committee of such companies should be composed exclusively of non-executive directors and chaired by an independent director.
Likewise, the proposed draft law on supervision and solvency of financial institutions, approved by the Spanish Ministry of Economy and Competitiveness on February 7, 2014, which is intended to complete the transposition of CRD IV into Spanish legislation, includes, among others, rules on corporate governance as regards board committees and their membership.
Pursuant to article 1 of our Board regulations BBVA considers that independent directors are those who fulfill the requirements described below:
Independent directors are external directors appointed for their personal and professional background who can pursue their duties without being constrained by their relations with the Company, its significant shareholders or its executives.
Independent directors may not:
| | i. | Have been employees or executive directors in Group companies, unless three or five years, respectively, have passed since they ceased to be so. |
| | ii. | Receive any amount or benefit from the Company or its Group companies for any reason other than remuneration of their directorship, unless it is insignificant. |
| | iii. | Neither dividends nor supplementary pension payments that the director may receive from earlier professional or employment relationships shall be taken into account for the purposes of this section, provided they are not subject to conditions and the company paying them may not at its own discretion suspend, alter or revoke their accrual without breaching its obligations. |
180
| | iv. | Be or have been a partner in the external auditors’ firm or in charge of the auditor’s report with respect to the Company or any other Group company during the last three years. |
| | v. | Be executive director or senior manager in any other company on which a Company executive director or senior manager is external director. |
| | vi. | Maintain or have maintained during the past year an important business relationship with the Company or any of its Group companies, either on his/her own behalf or as relevant shareholder, director or senior manager of a company that maintains or has maintained such relationship. |
| | vii. | “Business relationships” shall mean relationships as provider of goods and/or services, including financial, advisory and/or consultancy services. |
| | viii. | Be significant shareholders, executive directors or senior managers of any organization that receives or has received significant donations from the Company or its Group during the last three years. |
| | ix. | Those who are merely trustees on a foundation receiving donations shall not be ineligible under this item. |
| | x. | Be married to or linked by equivalent emotional relationship, or related by up to second-degree family ties to an executive director or senior manager of the Company. |
| | xi. | Have not been proposed by the Appointments Committee for appointment or renewal. |
| | xii. | Fall within the cases described under items i), v), vi) or vii) above, with respect to any significant shareholder or shareholder represented on the Board. In cases of family relationships described under item vii), the limitation shall not only apply to the shareholder, but also to the directors it nominates for the Company’s Board. |
Directors owning shares in the Company may be independent providing they comply with the above conditions and their shareholding is not legally considered as significant.
As of the date of this Annual Report, our Board of Directors has a large number of non-executive directors and ten out of the 14 members of our Board are independent under the definition of independence described above.
In addition, our Audit and Compliance Committee is composed exclusively of independent directors and the committee chairman is required to have experience in financial management and an understanding of the standards and accounting procedures required by the governmental authorities that regulate the banking sector. Our Risk Committee is composed exclusively of independent directors, and also, in accordance with the non-binding recommendations, our Board of Directors has an Appointments Committee and a Compensation Committee which are composed exclusively of external directors, being the majority of them (including their chairman) independent directors.
Separate Meetings for Independent Directors
In accordance with the NYSE corporate governance rules, independent directors must meet periodically outside of the presence of the executive directors. Under Spanish law, this practice is not contemplated as such. We note, however, that our independent directors meet periodically outside the presence of our executive directors anytime the Audit and Compliance Committee, the Appointments Committee, the Compensation Committee and the Risk Committee meet, since these Committees are comprised solely of non- executive directors. In addition, our independent directors meet outside the presence of our executive directors as often as they deem fit, and usually prior to meetings of the Board of Directors or its Committees.
Code of Ethics
The NYSE listing standards require U.S. companies to adopt a code of business conduct and ethics for directors, officers and employees, and promptly disclose any waivers of the code for directors or executive officers. For information with respect to BBVA’s code of business conduct and ethics see “Item 16 B. Code of Ethics”.
181
| ITEM 16H. | MINE SAFETY DISCLOSURE |
Not Applicable.
PART III
| ITEM 17. | FINANCIAL STATEMENTS |
We have responded to Item 18 in lieu of responding to this Item.
| ITEM 18. | FINANCIAL STATEMENTS |
Please see pages F-1 through F-181.
| | |
Exhibit Number | | Description |
| |
| 1.1 | | Amended and Restated Bylaws (Estatutos) of the Registrant (English translation). |
| |
| 8.1 | | Consolidated Companies Composing Registrant (see Appendix I to X to our Consolidated Financial Statements included herein). |
| |
| 10.1 | | Shareholders’ Agreement entered into between the Company, Doğuş Holding A.Ş., Doğuş Nakliyat ve Ticaret, A.Ş. and Doğuş Araştırma Geliştirme ve Müşavirlik Hizmetleri A.Ş. on November 1, 2010.(*) |
| |
| 12.1 | | Section 302 Chairman and Chief Executive Officer Certification. |
| |
| 12.2 | | Section 302 President and Chief Operating Officer Certification. |
| |
| 12.3 | | Section 302 Head of Global Accounting and Information Management Certification. |
| |
| 13.1 | | Section 906 Certification. |
| |
| 15.1 | | Consent of Independent Registered Public Accounting Firm |
| (*) | Incorporated by reference to BBVA’s Annual Report on Form 20-F for the year ended December 31, 2011. Confidential treatment was requested with respect to certain portions of this agreement. Confidential portions were redacted and separately submitted to the SEC. |
We will furnish to the Commission, upon request, copies of any unfiled instruments that define the rights of holders of our long-term debt.
182
SIGNATURES
Pursuant to the requirements of Section 12 of the Securities Exchange Act of 1934, the Registrant certifies that it meets all of the requirements for filing on Form 20-F and had duly caused this Annual Report to be signed on its behalf by the undersigned, thereto duly authorized.
| | |
BANCO BILBAO VIZCAYA ARGENTARIA, S.A. |
| |
| By: | | /s/ RICARDO GOMEZ BARREDO |
| Name: | | RICARDO GOMEZ BARREDO |
| |
| Title: | | Global Head of Group Accounting and Information Management |
Date: April 30, 2014
183
Contents
REPORT OF INDEPENDENT REGISTERED PUBLIC ACCOUNTING FIRM
To the Board of Directors and Shareholders of Banco Bilbao Vizcaya Argentaria, S.A.:
We have audited the accompanying consolidated balance sheets of BANCO BILBAO VIZCAYA ARGENTARIA, S.A. (the “Company”) and subsidiaries composing the BANCO BILBAO VIZCAYA ARGENTARIA Group (the “Group” - Note 3) as of December 31, 2013, 2012 and 2011, and the related consolidated income statements, statements of recognized income and expense, statements of changes in equity and statements of cash flows for each of the three years in the period ended December 31, 2013. These financial statements are the responsibility of the controlling Company’s Directors. Our responsibility is to express an opinion on these financial statements based on our audits.
We conducted our audits in accordance with the standards of the Public Company Accounting Oversight Board (United States). Those standards require that we plan and perform the audit to obtain reasonable assurance about whether the financial statements are free of material misstatement. An audit includes examining, on a test basis, evidence supporting the amounts and disclosures in the financial statements. An audit also includes assessing the accounting principles used and significant estimates made by management, as well as evaluating the overall financial statement presentation. We believe that our audits provide a reasonable basis for our opinion.
In our opinion, such consolidated financial statements present fairly, in all material respects, the consolidated financial position of BANCO BILBAO VIZCAYA ARGENTARIA, S.A. and subsidiaries composing the BANCO BILBAO VIZCAYA ARGENTARIA Group as of December 31, 2013, 2012 and 2011, and the results of their operations and their cash flows for each of the three years in the period ended December 31, 2013, in conformity with the International Financial Reporting Standards, as issued by the International Accounting Standards Boards (“IFRS – IASB”).
We have also audited, in accordance with the standards of the Public Company Accounting Oversight Board (United States), the Group’s internal control over financial reporting as of December 31, 2013, based on the criteria established inInternal Control—Integrated Framework (1992) issued by the Committee of Sponsoring Organizations of the Treadway Commission and our report dated April 30, 2014 expressed an unqualified opinion on the Group’s internal control over financial reporting.
DELOITTE, S.L.
Madrid- Spain
April 30, 2014

Consolidated balance sheets as of December 31, 2013, 2012 and 2011.
| | | | | | | | | | | | |
| | | | | | | Millions of Euros |
| | | ASSETS | | Notes | | 2013 | | 2012 | | 2011 | | |
| | | CASH AND BALANCES WITH CENTRAL BANKS | | 9 | | 34,903 | | 35,494 | | 29,841 | | |
| | | FINANCIAL ASSETS HELD FOR TRADING | | 10 | | 72,112 | | 79,829 | | 70,471 | | |
| | | Loans and advances to credit institutions | | | | - | | - | | - | | |
| | | Loans and advances to customers | | | | 106 | | 244 | | - | | |
| | | Debt securities | | | | 29,602 | | 28,020 | | 20,946 | | |
| | | Equity instruments | | | | 4,766 | | 2,915 | | 2,192 | | |
| | | Trading derivatives | | | | 37,638 | | 48,650 | | 47,333 | | |
| | | OTHER FINANCIAL ASSETS DESIGNATED AT FAIR VALUE THROUGH PROFIT OR LOSS | | 11 | | 2,413 | | 2,530 | | 2,773 | | |
| | | Loans and advances to credit institutions | | | | - | | - | | - | | |
| | | Loans and advances to customers | | | | - | | - | | - | | |
| | | Debt securities | | | | 663 | | 753 | | 708 | | |
| | | Equity instruments | | | | 1,750 | | 1,777 | | 2,065 | | |
| | | AVAILABLE-FOR-SALE FINANCIAL ASSETS | | 12 | | 77,774 | | 67,500 | | 54,641 | | |
| | | Debt securities | | | | 71,806 | | 63,548 | | 49,416 | | |
| | | Equity instruments | | | | 5,968 | | 3,952 | | 5,225 | | |
| | | LOANS AND RECEIVABLES | | 13 | | 350,945 | | 371,347 | | 369,916 | | |
| | | Loans and advances to credit institutions | | | | 22,862 | | 25,448 | | 24,503 | | |
| | | Loans and advances to customers | | | | 323,607 | | 342,163 | | 342,543 | | |
| | | Debt securities | | | | 4,476 | | 3,736 | | 2,870 | | |
| | | HELD-TO-MATURITY INVESTMENTS | | 14 | | - | | 10,162 | | 10,955 | | |
| | | FAIR VALUE CHANGES OF THE HEDGED ITEMS IN PORTFOLIO HEDGES OF INTEREST RATE RISK | | 15 | | 98 | | 226 | | 146 | | |
| | | HEDGING DERIVATIVES | | 15 | | 2,530 | | 4,894 | | 4,538 | | |
| | | NON-CURRENT ASSETS HELD FOR SALE | | 16 | | 2,880 | | 4,229 | | 2,075 | | |
| | | INVESTMENTS IN ENTITIES ACCOUNTED FOR USING THE EQUITY METHOD | | 17 | | 4,742 | | 10,782 | | 9,299 | | |
| | | Associates | | | | 1,272 | | 6,469 | | 5,567 | | |
| | | Jointly ventures | | | | 3,470 | | 4,313 | | 3,732 | | |
| | | INSURANCE CONTRACTS LINKED TO PENSIONS | | | | - | | 7 | | - | | |
| | | REINSURANCE ASSETS | | 18 | | 619 | | 50 | | 26 | | |
| | | TANGIBLE ASSETS | | 19 | | 7,534 | | 7,572 | | 7,126 | | |
| | | Property, plants and equipment | | | | 5,841 | | 5,702 | | 5,536 | | |
| | | For own use | | | | 5,373 | | 5,177 | | 4,701 | | |
| | | Other assets leased out under an operating lease | | | | 468 | | 525 | | 835 | | |
| | | Investment properties | | | | 1,693 | | 1,870 | | 1,590 | | |
| | | INTANGIBLE ASSETS | | 20 | | 6,759 | | 7,132 | | 6,880 | | |
| | | Goodwill | | | | 5,069 | | 5,430 | | 5,536 | | |
| | | Other intangible assets | | | | 1,690 | | 1,702 | | 1,344 | | |
| | | TAX ASSETS | | 21 | | 11,582 | | 11,650 | | 7,727 | | |
| | | Current | | | | 2,502 | | 1,851 | | 1,460 | | |
| | | Deferred | | | | 9,080 | | 9,799 | | 6,267 | | |
| | | OTHER ASSETS | | 22 | | 7,684 | | 7,668 | | 6,424 | | |
| | | Inventories | | | | 4,636 | | 4,223 | | 3,994 | | |
| | | Rest | | | | 3,048 | | 3,445 | | 2,430 | | |
| | | TOTAL ASSETS | | | | 582,575 | | 621,072 | | 582,838 | | |
| | | | | | | |
| | | | | | | | | | | | | |
The accompanying Notes 1 to 59 and Appendices I to X are an integral part of the consolidated balance sheet as of December 31, 2013.
F-2
Consolidated balance sheets as of December 31, 2013, 2012 and 2011.
| | | | | | | | | | | | |
| | | | | | | Millions of Euros | | |
| | | LIABILITIES AND EQUITY | | Notes | | 2013 | | 2012 | | 2011 | | |
| | | FINANCIAL LIABILITIES HELD FOR TRADING | | 10 | | 45,648 | | 55,834 | | 51,178 | | |
| | | Deposits from central banks | | | | - | | - | | - | | |
| | | Deposits from credit institutions | | | | - | | - | | - | | |
| | | Customer deposits | | | | - | | - | | - | | |
| | | Debt certificates | | | | - | | - | | - | | |
| | | Trading derivatives | | | | 38,119 | | 49,254 | | 46,567 | | |
| | | Short positions | | | | 7,529 | | 6,580 | | 4,611 | | |
| | | Other financial liabilities | | | | - | | - | | - | | |
| | | OTHER FINANCIAL LIABILITIES DESIGNATED AT FAIR VALUE THROUGH PROFIT OR LOSS | | 11 | | 2,467 | | 2,216 | | 1,621 | | |
| | | Deposits from central banks | | | | - | | - | | - | | |
| | | Deposits from credit institutions | | | | - | | - | | - | | |
| | | Customer deposits | | | | - | | - | | - | | |
| | | Debt certificates | | | | - | | - | | - | | |
| | | Subordinated liabilities | | | | - | | - | | - | | |
| | | Other financial liabilities | | | | 2,467 | | 2,216 | | 1,621 | | |
| | | FINANCIAL LIABILITIES AT AMORTIZED COST | | 23 | | 464,141 | | 490,605 | | 465,717 | | |
| | | Deposits from central banks | | | | 30,893 | | 46,475 | | 32,877 | | |
| | | Deposits from credit institutions | | | | 52,423 | | 55,675 | | 56,601 | | |
| | | Customer deposits | | | | 300,490 | | 282,795 | | 272,402 | | |
| | | Debt certificates | | | | 64,120 | | 86,255 | | 81,124 | | |
| | | Subordinated liabilities | | | | 10,556 | | 11,815 | | 15,303 | | |
| | | Other financial liabilities | | | | 5,659 | | 7,590 | | 7,410 | | |
| | | FAIR VALUE CHANGES OF THE HEDGED ITEMS IN PORTFOLIO HEDGES OF INTEREST RATE RISK | | 15 | | - | | - | | - | | |
| | | HEDGING DERIVATIVES | | 15 | | 1,792 | | 2,968 | | 2,709 | | |
| | | LIABILITIES ASSOCIATED WITH NON-CURRENT ASSETS HELD FOR SALE | | 16 | | - | | 387 | | - | | |
| | | LIABILITIES UNDER INSURANCE CONTRACTS | | 18-24 | | 9,834 | | 9,020 | | 7,729 | | |
| | | PROVISIONS | | 25 | | 6,853 | | 7,834 | | 7,471 | | |
| | | Provisions for pensions and similar obligations | | 26 | | 5,512 | | 5,777 | | 5,577 | | |
| | | Provisions for taxes and other legal contingencies | | | | 208 | | 406 | | 349 | | |
| | | Provisions for contingent risks and commitments | | | | 346 | | 322 | | 266 | | |
| | | Other provisions | | | | 787 | | 1,329 | | 1,279 | | |
| | | TAX LIABILITIES | | 21 | | 2,530 | | 3,820 | | 2,147 | | |
| | | Current | | | | 993 | | 1,058 | | 727 | | |
| | | Deferred | | | | 1,537 | | 2,762 | | 1,420 | | |
| | | OTHER LIABILITIES | | 22 | | 4,460 | | 4,586 | | 4,208 | | |
| | | TOTAL LIABILITIES | | | | 537,725 | | 577,270 | | 542,780 | | |
| | | | | | | | | | | | | |
| | | | | | | |
| | | | | | | | | | | | | |
The accompanying Notes 1 to 59 and Appendices I to X are an integral part of the consolidated balance sheet as of December 31, 2013.
F-3
Consolidated balance sheets as of December 31, 2013, 2012 and 2011.
| | | | | | | | | | | | |
| | | | |
| | | | | | | Millions of Euros |
| | | LIABILITIES AND EQUITY (Continued) | | Notes | | 2013 | | 2012 | | 2011 | | |
| | | STOCKHOLDERS’ FUNDS | | | | 46,310 | | 43,614 | | 40,952 | | |
| | | Common Stock | | 27 | | 2,835 | | 2,670 | | 2,403 | | |
| | | Issued | | | | 2,835 | | 2,670 | | 2,403 | | |
| | | Unpaid and uncalled (-) | | | | - | | - | | - | | |
| | | Share premium | | 28 | | 22,111 | | 20,968 | | 18,970 | | |
| | | Reserves | | 29 | | 19,908 | | 19,672 | | 17,940 | | |
| | | Accumulated reserves (losses) | | | | 19,458 | | 18,721 | | 17,580 | | |
| | | Reserves (losses) of entities accounted for using the equity method | | | | 450 | | 951 | | 360 | | |
| | | Other equity instruments | | 46.1.1 | | 59 | | 62 | | 51 | | |
| | | Equity component of compound financial instruments | | | | - | | - | | - | | |
| | | Other equity instruments | | | | 59 | | 62 | | 51 | | |
| | | Less: Treasury stock | | 30 | | (66) | | (111) | | (300) | | |
| | | Income attributed to the parent company | | | | 2,228 | | 1,676 | | 3,004 | | |
| | | Less: Dividends and remuneration | | | | (765) | | (1,323) | | (1,116) | | |
| | | VALUATION ADJUSTMENTS | | 31 | | (3,831) | | (2,184) | | (2,787) | | |
| | | Available-for-sale financial assets | | | | 851 | | (238) | | (628) | | |
| | | Cash flow hedging | | | | 8 | | 36 | | 30 | | |
| | | Hedging of net investment in foreign transactions | | | | (100) | | (243) | | (159) | | |
| | | Exchange differences | | | | (3,023) | | (1,164) | | (1,623) | | |
| | | Non-current assets held-for-sale | | | | 3 | | (104) | | - | | |
| | | Entities accounted for using the equity method | | | | (1,130) | | (24) | | (179) | | |
| | | Other valuation adjustments | | | | (440) | | (447) | | (228) | | |
| | | NON-CONTROLLING INTEREST | | 32 | | 2,371 | | 2,372 | | 1,893 | | |
| | | Valuation adjustments | | | | 70 | | 188 | | 36 | | |
| | | Rest | | | | 2,301 | | 2,184 | | 1,857 | | |
| | | TOTAL EQUITY | | | | 44,850 | | 43,802 | | 40,058 | | |
| | | TOTAL LIABILITIES AND EQUITY | | | | 582,575 | | 621,072 | | 582,838 | | |
| | | | |
| | | | | | | Millions of Euros |
| | | MEMORANDUM ITEM | | Notes | | 2013 | | 2012 | | 2011 | | |
| | | CONTINGENT RISKS | | 34 | | 33,543 | | 37,019 | | 37,629 | | |
| | | CONTINGENT COMMITMENTS | | 34 | | 94,170 | | 90,142 | | 90,688 | | |
| | | | | | | | | | | | | |
| | | | | | | | | | | | | |
The accompanying Notes 1 to 59 and Appendices I to X are an integral part of the consolidated balance sheet as of December 31, 2013.
F-4
Consolidated income statements for the years ended December 31, 2013, 2012 and 2011.
| | | | | | | | | | | | | | | | | | |
| | | | | |
| | | | | | | Millions of Euros | | | |
| | | | | Notes | | 2013 | | | 2012 | | | 2011 | | | |
| | | INTEREST AND SIMILAR INCOME | | 39 | | | 23,512 | | | | 24,815 | | | | 23,229 | | | |
| | | INTEREST AND SIMILAR EXPENSES | | 39 | | | (9,612) | | | | (10,341) | | | | (10,505) | | | |
| | | NET INTEREST INCOME | | | | | 13,900 | | | | 14,474 | | | | 12,724 | | | |
| | | DIVIDEND INCOME | | 40 | | | 235 | | | | 390 | | | | 562 | | | |
| | | SHARE OF PROFIT OR LOSS OF ENTITIES ACCOUNTED FOR USING THE EQUITY METHOD | | 41 | | | 694 | | | | 1,039 | | | | 787 | | | |
| | | FEE AND COMMISSION INCOME | | 42 | | | 5,478 | | | | 5,290 | | | | 4,874 | | | |
| | | FEE AND COMMISSION EXPENSES | | 43 | | | (1,228) | | | | (1,134) | | | | (980) | | | |
| | | NET GAINS (LOSSES) ON FINANCIAL ASSETS AND LIABILITIES | | 44 | | | 1,608 | | | | 1,636 | | | | 1,070 | | | |
| | | Financial instruments held for trading | | | | | 540 | | | | 653 | | | | 1,003 | | | |
| | | Other financial instruments at fair value through profit or loss | | | | | 49 | | | | 69 | | | | 17 | | | |
| | | Other financial instruments not at fair value through profit or loss | | | | | 1,019 | | | | 914 | | | | 50 | | | |
| | | Rest | | | | | - | | | | - | | | | - | | | |
| | | EXCHANGE DIFFERENCES (NET) | | | | | 903 | | | | 69 | | | | 410 | | | |
| | | OTHER OPERATING INCOME | | 45 | | | 4,995 | | | | 4,765 | | | | 4,212 | | | |
| | | Income on insurance and reinsurance contracts | | | | | 3,761 | | | | 3,631 | | | | 3,299 | | | |
| | | Financial income from non-financial services | | | | | 851 | | | | 807 | | | | 643 | | | |
| | | Rest of other operating income | | | | | 383 | | | | 327 | | | | 270 | | | |
| | | OTHER OPERATING EXPENSES | | 45 | | | (5,627) | | | | (4,705) | | | | (4,019) | | | |
| | | Expenses on insurance and reinsurance contracts | | | | | (2,831) | | | | (2,646) | | | | (2,425) | | | |
| | | Changes in inventories | | | | | (495) | | | | (406) | | | | (298) | | | |
| | | Rest of other operating expenses | | | | | (2,301) | | | | (1,653) | | | | (1,296) | | | |
| | | GROSS INCOME | | | | | 20,958 | | | | 21,824 | | | | 19,640 | | | |
| | | ADMINISTRATION COSTS | | 46 | | | (9,701) | | | | (9,396) | | | | (8,634) | | | |
| | | Personnel expenses | | | | | (5,588) | | | | (5,467) | | | | (5,053) | | | |
| | | General and administrative expenses | | | | | (4,113) | | | | (3,929) | | | | (3,581) | | | |
| | | DEPRECIATION AND AMORTIZATION | | 47 | | | (1,095) | | | | (978) | | | | (810) | | | |
| | | PROVISIONS (NET) | | 48 | | | (609) | | | | (641) | | | | (503) | | | |
| | | IMPAIRMENT LOSSES ON FINANCIAL ASSETS (NET) | | 49 | | | (5,612) | | | | (7,859) | | | | (4,185) | | | |
| | | Loans and receivables | | | | | (5,577) | | | | (7,817) | | | | (4,163) | | | |
| | | Other financial instruments not at fair value through profit or loss | | | | | (35) | | | | (42) | | | | (22) | | | |
| | | NET OPERATING INCOME | | | | | 3,941 | | | | 2,950 | | | | 5,508 | | | |
| | | | | | | |
| | | | | | | | | | | | | | | | | | | |
The accompanying Notes 1 to 59 and Appendices I to X are an integral part of the consolidated income statement for the year ended December 31, 2013.
F-5
Consolidated income statements for the years ended 2013, 2012 and 2011.
| | | | | | | | | | | | | | | | | | |
| | | | | | | | | | | | | | | | | | | |
| | | | | | | Millions of Euros |
| | | (Continued) | | Notes | | | 2013 | | | | 2012 | | | | 2011 | | | |
| | | NET OPERATING INCOME | | | | | 3,941 | | | | 2,950 | | | | 5,508 | | | |
| | | IMPAIRMENT LOSSES ON OTHER ASSETS (NET) | | 50 | | | (467) | | | | (1,123) | | | | (1,883) | | | |
| | | Goodwill and other intangible assets | | | | | (14) | | | | (54) | | | | (1,444) | | | |
| | | Other assets | | | | | (453) | | | | (1,069) | | | | (439) | | | |
| | | GAINS (LOSSES) ON DERECOGNIZED ASSETS NOT | | | | | | | | | | | | | | | | |
| | | CLASSIFIED AS NON-CURRENT ASSETS HELD FOR SALE | | 51 | | | (1,915) | | | | 3 | | | | 44 | | | |
| | | NEGATIVE GOODWILL | | 20 | | | - | | | | 376 | | | | - | | | |
| | | GAINS (LOSSES) IN NON-CURRENT ASSETS HELD FOR SALE | | | | | | | | | | | | | | | | |
| | | NOT CLASSIFIED AS DISCONTINUED OPERATIONS | | 52 | | | (399) | | | | (624) | | | | (271) | | | |
| | | OPERATING PROFIT BEFORE TAX | | | | | 1,160 | | | | 1,582 | | | | 3,398 | | | |
| | | INCOME TAX | | 21 | | | (46) | | | | 352 | | | | (158) | | | |
| | | PROFIT FROM CONTINUING OPERATIONS | | | | | 1,114 | | | | 1,934 | | | | 3,240 | | | |
| | | PROFIT FROM DISCONTINUED OPERATIONS (NET) | | 52 | | | 1,866 | | | | 393 | | | | 245 | | | |
| | | PROFIT | | | | | 2,981 | | | | 2,327 | | | | 3,485 | | | |
| | | Profit attributable to parent company | | | | | 2,228 | | | | 1,676 | | | | 3,004 | | | |
| | | Profit attributable to non-controlling interests | | 32 | | | 753 | | | | 651 | | | | 481 | | | |
| | | | |
| | | | | | | Euros |
| | | | | Note | | | 2013 | | | | 2012 | | | | 2011 | | | |
| | | EARNINGS PER SHARE | | 5 | | | | | | | | | | | | | | |
| | | Basic earnings per share | | | | | 0.40 | | | | 0.32 | | | | 0.62 | | | |
| | | Diluted earnings per share | | | | | 0.39 | | | | 0.32 | | | | 0.62 | | | |
| | | | | | | | | | | | | | | | | | | |
| | | | | | | | | | | | | | | | | | | |
| | | | | | | | | | | | | | | | | | | |
The accompanying Notes 1 to 59 and Appendices I to X are an integral part of the consolidated income statement for the year ended December 31, 2013.
F-6
Consolidated statements of recognized income and expenses for the years ended December 31, 2013, 2012 and 2011.
| | | | | | | | | | | | |
| | | | | | | Millions of Euros | | |
| | | | | | | 2013 | | 2012 | | 2011 | | |
| | | PROFIT RECOGNIZED IN INCOME STATEMENT | | | | 2,981 | | 2,327 | | 3,485 | | |
| | | OTHER RECOGNIZED INCOME (EXPENSES) | | | | (1,765) | | 754 | | (1,894) | | |
| | | ITEMS NOT SUBJECT TO RECLASSIFICATION TO P&L | | | | 8 | | (224) | | (228) | | |
| | | Actuarial gains and losses from defined benefit pension plans | | | | 11 | | (316) | | (266) | | |
| | | Non-current assets available for sale | | | | - | | - | | - | | |
| | | Entities under the equity method of accounting | | | | 1 | | (5) | | - | | |
| | | Income tax related to items not subject to reclassification to p&l | | | | (4) | | 97 | | 38 | | |
| | | ITEMS SUBJECT TO RECLASSIFICATION TO P&L | | | | (1,773) | | 978 | | (1,666) | | |
| | | Available-for-sale financial assets | | | | 1,659 | | 679 | | (1,167) | | |
| | | Valuation gains/(losses) | | | | 1,737 | | 541 | | (1,274) | | |
| | | Amounts removed to income statement | | | | (140) | | 109 | | 85 | | |
| | | Reclassifications | | | | 62 | | 29 | | 22 | | |
| | | Cash flow hedging | | | | (32) | | 7 | | (41) | | |
| | | Valuation gains/(losses) | | | | (31) | | 7 | | (69) | | |
| | | Amounts removed to income statement | | | | - | | - | | 29 | | |
| | | Amounts removed to the initial carrying amount of the hedged items | | | | - | | - | | - | | |
| | | Reclassifications | | | | (1) | | - | | (1) | | |
| | | Hedging of net investment in foreign transactions | | | | 143 | | (84) | | (1) | | |
| | | Valuation gains/(losses) | | | | 143 | | (84) | | (1) | | |
| | | Amounts removed to income statement | | | | - | | - | | - | | |
| | | Reclassifications | | | | - | | - | | - | | |
| | | Exchange differences | | | | (2,045) | | 601 | | (411) | | |
| | | Valuation gains/(losses) | | | | (2,026) | | 601 | | (414) | | |
| | | Amounts removed to income statement | | | | (19) | | - | | 3 | | |
| | | Reclassifications | | | | - | | - | | - | | |
| | | Non-current assets held for sale | | | | 135 | | (103) | | - | | |
| | | Valuation gains/(losses) | | | | - | | (103) | | - | | |
| | | Amounts removed to income statement | | | | 135 | | - | | - | | |
| | | Reclassifications | | | | - | | - | | - | | |
| | | Entities accounted for using the equity method | | | | (1,054) | | 238 | | (148) | | |
| | | Valuation gains/(losses) | | | | (736) | | 238 | | (148) | | |
| | | Amounts removed to income statement | | | | (260) | | - | | - | | |
| | | Reclassifications | | | | (58) | | - | | - | | |
| | | Rest of recognized income and expenses | | | | - | | - | | - | | |
| | | Income tax | | | | (579) | | (360) | | 102 | | |
| | | TOTAL RECOGNIZED INCOME/EXPENSES | | | | 1,216 | | 3,081 | | 1,591 | | |
| | | Attributable to the parent company | | | | 581 | | 2,279 | | 987 | | |
| | | Attributable to non-controlling interest | | | | 635 | | 802 | | 604 | | |
| | | | | | | | | | | | | |
| | | | | | | | | | | | | |
The accompanying Notes 1 to 59 and Appendices I to X are an integral part of the consolidated statement of recognized income and expenses for the year ended December 31, 2013.
F-7
Consolidated statements of changes in equity for the years ended December 31, 2013, 2012 and 2011.
| | | | | | | | | | | | | | | | | | | | | | | | | | | | | | | | | | | | | | | | | | | | | | | | | | | | | | | | |
| | | | |
| | | | | Millions of Euros | | | |
| | | | | Total Equity Attributed to the Parent Company | | | Non-
controlling
Interests
(Note 32) | | | Total
Equity | | | |
| | | | | Stockholders’ Funds | | | Valuation
Adjust-
ments
(Note 31) | | | Total | | | | | |
| | | | | Common
Stock
(Note 27) | | | Share
Premium
(Note 28) | | | Reserves (Note 29) | | | Other Equity
Instru-
ments | | | Less:
Treasury
Stock
(Note 30) | | | Profit
Attributable
to the
Parent
Company | | | Less:
Dividends and
Remu-
nerations
(Note 4) | | | Total
Stock-
holders’
Funds | | | | | | | |
| | | 2013 | | | | Accu-
mulated
Reserves
(Losses) | | | Reserves
(Losses)
from
Entities
Accounted
for Using
the Equity
Method | | | | | | | | | | | | |
| | | Balances as of January 1, 2013 | | | 2,670 | | | | 20,968 | | | | 18,721 | | | | 951 | | | | 62 | | | | (111) | | | | 1,676 | | | | (1,323) | | | | 43,614 | | | | (2,184) | | | | 41,430 | | | | 2,372 | | | | 43,802 | | | |
| | | Effect of changes in accounting policies | | | - | | | | - | | | | - | | | | - | | | | - | | | | - | | | | - | | | | - | | | | - | | | | - | | | | - | | | | - | | | | - | | | |
| | | Effect of correction of errors | | | - | | | | - | | | | - | | | | - | | | | - | | | | - | | | | - | | | | - | | | | - | | | | - | | | | - | | | | - | | | | - | | | |
| | | Adjusted initial balance | | | 2,670 | | | | 20,968 | | | | 18,721 | | | | 951 | | | | 62 | | | | (111) | | | | 1,676 | | | | (1,323) | | | | 43,614 | | | | (2,184) | | | | 41,430 | | | | 2,372 | | | | 43,802 | | | |
| | | Total income/expense recognized | | | - | | | | - | | | | - | | | | - | | | | - | | | | - | | | | 2,228 | | | | - | | | | 2,228 | | | | (1,647) | | | | 581 | | | | 635 | | | | 1,216 | | | |
| | | Other changes in equity | | | 165 | | | | 1,143 | | | | 737 | | | | (501) | | | | (3) | | | | 45 | | | | (1,676) | | | | 558 | | | | 468 | | | | - | | | | 468 | | | | (636) | | | | (168) | | | |
| | | Common stock increase | | | 71 | | | | - | | | | (71) | | | | - | | | | - | | | | - | | | | - | | | | - | | | | - | | | | - | | | | - | | | | - | | | | - | | | |
| | | Common stock reduction | | | - | | | | - | | | | - | | | | - | | | | - | | | | - | | | | - | | | | - | | | | - | | | | - | | | | - | | | | - | | | | - | | | |
| | | Conversion of financial liabilities into capital | | | 94 | | | | 1,143 | | | | - | | | | - | | | | - | | | | - | | | | - | | | | - | | | | 1,237 | | | | - | | | | 1,237 | | | | - | | | | 1,237 | | | |
| | | Increase of other equity instruments | | | - | | | | - | | | | - | | | | - | | | | 33 | | | | - | | | | - | | | | - | | | | 33 | | | | - | | | | 33 | | | | - | | | | 33 | | | |
| | | Reclassification of financial liabilities to other equity instruments | | | - | | | | - | | | | - | | | | - | | | | - | | | | - | | | | - | | | | - | | | | - | | | | - | | | | - | | | | - | | | | - | | | |
| | | Reclassification of other equity instruments to financial liabilities | | | - | | | | - | | | | - | | | | - | | | | - | | | | - | | | | - | | | | - | | | | - | | | | - | | | | - | | | | - | | | | - | | | |
| | | Dividend distribution | | | - | | | | - | | | | - | | | | - | | | | - | | | | - | | | | - | | | | (605) | | | | (605) | | | | - | | | | (605) | | | | (482) | | | | (1,087) | | | |
| | | Transactions including treasury stock and other equity instruments (net) | | | - | | | | - | | | | 30 | | | | - | | | | - | | | | 45 | | | | - | | | | - | | | | 75 | | | | - | | | | 75 | | | | - | | | | 75 | | | |
| | | Transfers between total equity entries | | | - | | | | - | | | | 853 | | | | (501) | | | | - | | | | - | | | | (1,676) | | | | 1,324 | | | | - | | | | - | | | | - | | | | - | | | | - | | | |
| | | Increase/Reduction due to business combinations | | | - | | | | - | | | | - | | | | - | | | | - | | | | - | | | | - | | | | - | | | | - | | | | - | | | | - | | | | - | | | | - | | | |
| | | Payments with equity instruments | | | - | | | | - | | | | 22 | | | | - | | | | (36) | | | | - | | | | - | | | | - | | | | (14) | | | | - | | | | (14) | | | | - | | | | (14) | | | |
| | | Rest of increases/reductions in total equity | | | - | | | | - | | | | (97) | | | | - | | | | - | | | | - | | | | - | | | | (161) | | | | (258) | | | | - | | | | (258) | | | | (154) | | | | (412) | | | |
| | | Of which: | | | - | | | | - | | | | - | | | | - | | | | - | | | | - | | | | - | | | | - | | | | - | | | | - | | | | - | | | | - | | | | - | | | |
| | | Acquisition of the free allotment rights | | | - | | | | - | | | | - | | | | - | | | | - | | | | - | | | | - | | | | (161) | | | | (161) | | | | - | | | | (161) | | | | - | | | | (161) | | | |
| | | Balances as of December 31, 2013 | | | 2,835 | | | | 22,111 | | | | 19,458 | | | | 450 | | | | 59 | | | | (66) | | | | 2,228 | | | | (765) | | | | 46,310 | | | | (3,831) | | | | 42,479 | | | | 2,371 | | | | 44,850 | | | |
| | | | | | | | | | | | | | | | | | | | | | | | | | | | | | | | | | | | | | | | | | | | | | | | | | | | | | | | | |
The accompanying Notes 1 to 59 and Appendices I to X are an integral part of the consolidated statement of changes in equity for the year ended December 31, 2013.
F-8
Consolidated statements of changes in equity for the years ended December 31, 2013, 2012 and 2011 (continued).
| | | | | | | | | | | | | | | | | | | | | | | | | | | | | | | | | | | | | | | | | | | | | | | | | | | | | | | | |
| | | | |
| | | | | Millions of Euros | | | |
| | | | | Total Equity Attributed to the Parent Company | | | Non- controlling Interests (Note 32) | | | Total Equity | | | |
| | | | | Stockholders’ Funds | | | Valuation Adjust-
ments (Note 31) | | | Total | | | | |
| | | | | Common Stock (Note 27) | | | Share Premium (Note 28) | | | Reserves (Note 29) | | | Other Equity Instru-
ments | | | Less: Treasury Stock (Note 30) | | | Profit
Attributable
to the
Parent
Company | | | Less: Dividends and
Remu-
nerations (Note 4) | | | Total Stock-
holders’ Funds | | | | | | |
| | | 2012 | | | | Accu-
mulated
Reserves
(Losses) | | | Reserves
(Losses)
from
Entities
Accounted
for Using
the Equity
Method | | | | | | | | | | | |
| | | Balances as of January 1, 2012 | | | 2,403 | | | | 18,970 | | | | 17,580 | | | | 360 | | | | 51 | | | | (300) | | | | 3,004 | | | | (1,116) | | | | 40,952 | | | | (2,787) | | | | 38,165 | | | | 1,893 | | | | 40,058 | | | |
| | | Effect of changes in accounting policies | | | - | | | | - | | | | - | | | | - | | | | - | �� | | | - | | | | - | | | | - | | | | - | | | | - | | | | - | | | | - | | | | - | | | |
| | | Effect of correction of errors | | | - | | | | - | | | | - | | | | - | | | | - | | | | - | | | | - | | | | - | | | | - | | | | - | | | | - | | | | - | | | | - | | | |
| | | Adjusted initial balance | | | 2,403 | | | | 18,970 | | | | 17,580 | | | | 360 | | | | 51 | | | | (300) | | | | 3,004 | | | | (1,116) | | | | 40,952 | | | | (2,787) | | | | 38,165 | | | | 1,893 | | | | 40,058 | | | |
| | | Total income/expense recognized | | | - | | | | - | | | | - | | | | - | | | | - | | | | - | | | | 1,676 | | | | - | | | | 1,676 | | | | 603 | | | | 2,279 | | | | 802 | | | | 3,081 | | | |
| | | Other changes in equity | | | 267 | | | | 1,998 | | | | 1,141 | | | | 591 | | | | 11 | | | | 189 | | | | (3,004) | | | | (207) | | | | 986 | | | | - | | | | 986 | | | | (323) | | | | 663 | | | |
| | | Common stock increase | | | 73 | | | | - | | | | (73) | | | | - | | | | - | | | | - | | | | - | | | | - | | | | - | | | | - | | | | - | | | | - | | | | - | | | |
| | | Common stock reduction | | | - | | | | - | | | | - | | | | - | | | | - | | | | - | | | | - | | | | - | | | | - | | | | - | | | | - | | | | - | | | | - | | | |
| | | Conversion of financial liabilities into capital | | | 194 | | | | 1,998 | | | | - | | | | - | | | | - | | | | - | | | | - | | | | - | | | | 2,192 | | | | - | | | | 2,192 | | | | - | | | | 2,192 | | | |
| | | Increase of other equity instruments | | | - | | | | - | | | | - | | | | - | | | | 32 | | | | - | | | | - | | | | - | | | | 32 | | | | - | | | | 32 | | | | - | | | | 32 | | | |
| | | Reclassification of financial liabilities to other equity instruments | | | - | | | | - | | | | - | | | | - | | | | - | | | | - | | | | - | | | | - | | | | - | | | | - | | | | - | | | | - | | | | - | | | |
| | | Reclassification of other equity instruments to financial liabilities | | | - | | | | - | | | | - | | | | - | | | | - | | | | - | | | | - | | | | - | | | | - | | | | - | | | | - | | | | - | | | | - | | | |
| | | Dividend distribution | | | - | | | | - | | | | - | | | | - | | | | - | | | | - | | | | - | | | | (1,073) | | | | (1,073) | | | | - | | | | (1,073) | | | | (357) | | | | (1,430) | | | |
| | | Transactions including treasury stock and other equity instruments (net) | | | - | | | | - | | | | 81 | | | | - | | | | - | | | | 189 | | | | - | | | | - | | | | 270 | | | | - | | | | 270 | | | | - | | | | 270 | | | |
| | | Transfers between total equity entries | | | - | | | | - | | | | 1,291 | | | | 597 | | | | - | | | | - | | | | (3,004) | | | | 1,116 | | | | - | | | | - | | | | - | | | | - | | | | - | | | |
| | | Increase/Reduction due to business combinations | | | - | | | | - | | | | - | | | | - | | | | - | | | | - | | | | - | | | | - | | | | - | | | | - | | | | - | | | | - | | | | - | | | |
| | | Payments with equity instruments | | | - | | | | - | | | | (28) | | | | - | | | | (21) | | | | - | | | | - | | | | - | | | | (49) | | | | - | | | | (49) | | | | - | | | | (49) | | | |
| | | Rest of increases/reductions in total equity | | | - | | | | - | | | | (130) | | | | (6) | | | | - | | | | - | | | | - | | | | (250) | | | | (386) | | | | - | | | | (386) | | | | 34 | | | | (352) | | | |
| | | Of which: | | | | | | | | | | | | | | | | | | | | | | | | | | | | | | | | | | | | | | | | | | | | | | | | | | | | | | |
| | | Acquisition of the free allotment rights | | | - | | | | - | | | | - | | | | - | | | | - | | | | - | | | | - | | | | (250) | | | | (250) | | | | - | | | | (250) | | | | - | | | | (250) | | | |
| | | Balances as of December 31, 2012 | | | 2,670 | | | | 20,968 | | | | 18,721 | | | | 951 | | | | 62 | | | | (111) | | | | 1,676 | | | | (1,323) | | | | 43,614 | | | | (2,184) | | | | 41,430 | | | | 2,372 | | | | 43,802 | | | |
| | | |
The accompanying Notes 1 to 59 and Appendices I to X are an integral part of the consolidated statement of changes in equity for the year ended December 31, 2013.
F-9
Consolidated statements of changes in equity for the years ended December 31, 2013, 2012 and 2011 (continued).
| | | | | | | | | | | | | | | | | | | | | | | | | | | | | | | | | | | | | | | | | | | | | | | | | | | | | | | | |
| | | | | | | | | | | | | | | | | | | | |
| | | | | Millions of Euros | | | |
| | | | | Total Equity Attributed to the Parent Company | | | Non- controlling
Interests
(Note 32) | | | Total
Equity | | | |
| | | | | Stockholders’ Funds | | | Valuation
Adjust-
ments
(Note 31) | | | Total | | | | | |
| | | | | Common
Stock
(Note 27) | | | Share
Premium
(Note 28) | | | Reserves (Note 29) | | | Other Equity
Instru-
ments | | | Less:
Treasury
Stock
(Note 30) | | | Profit
Attributable
to the
Parent
Company | | | Less:
Dividends and
Remu-
nerations
(Note 4) | | | Total
Stock-
holders’
Funds | | | | | | | |
| | | 2011 | | | | Accu-
mulated
Reserves
(Losses) | | | Reserves
(Losses) from Entities
Accounted for Using the Equity
Method | | | | | | | | | | | | |
| | | Balances as of January 1, 2011 | | | 2,201 | | | | 17,104 | | | | 14,305 | | | | 55 | | | | 37 | | | | (552) | | | | 4,606 | | | | (1,067) | | | | 36,689 | | | | (770) | | | | 35,919 | | | | 1,556 | | | | 37,475 | | | |
| | | Effect of changes in accounting policies | | | - | | | | - | | | | - | | | | - | | | | - | | | | - | | | | - | | | | - | | | | - | | | | - | | | | - | | | | - | | | | - | | | |
| | | Effect of correction of errors | | | - | | | | - | | | | - | | | | - | | | | - | | | | - | | | | - | | | | - | | | | - | | | | - | | | | - | | | | - | | | | - | | | |
| | | Adjusted initial balance | | | 2,201 | | | | 17,104 | | | | 14,305 | | | | 55 | | | | 37 | | | | (552) | | | | 4,606 | | | | (1,067) | | | | 36,689 | | | | (770) | | | | 35,919 | | | | 1,556 | | | | 37,475 | | | |
| | | Total income/expense recognized | | | - | | | | - | | | | - | | | | - | | | | - | | | | - | | | | 3,004 | | | | - | | | | 3,004 | | | | (2,017) | | | | 987 | | | | 604 | | | | 1,591 | | | |
| | | Other changes in equity | | | 202 | | | | 1,866 | | | | 3,275 | | | | 305 | | | | 14 | | | | 252 | | | | (4,606) | | | | (49) | | | | 1,259 | | | | - | | | | 1,259 | | | | (267) | | | | 992 | | | |
| | | Common stock increase | | | 68 | | | | - | | | | (68) | | | | - | | | | - | | | | - | | | | - | | | | - | | | | - | | | | - | | | | - | | | | - | | | | - | | | |
| | | Common stock reduction | | | - | | | | - | | | | - | | | | - | | | | - | | | | - | | | | - | | | | - | | | | - | | | | - | | | | - | | | | - | | | | - | | | |
| | | Conversion of financial liabilities into capital | | | 134 | | | | 1,866 | | | | - | | | | - | | | | - | | | | - | | | | - | | | | - | | | | 2,000 | | | | - | | | | 2,000 | | | | - | | | | 2,000 | | | |
| | | Increase of other equity instruments | | | - | | | | - | | | | - | | | | - | | | | 14 | | | | - | | | | - | | | | - | | | | 14 | | | | - | | | | 14 | | | | - | | | | 14 | | | |
| | | Reclassification of financial liabilities to other equity instruments | | | - | | | | - | | | | - | | | | - | | | | - | | | | - | | | | - | | | | - | | | | - | | | | - | | | | - | | | | - | | | | - | | | |
| | | Reclassification of other equity instruments to financial liabilities | | | - | | | | - | | | | - | | | | - | | | | - | | | | - | | | | - | | | | - | | | | - | | | | - | | | | - | | | | - | | | | - | | | |
| | | Dividend distribution | | | - | | | | - | | | | - | | | | - | | | | - | | | | - | | | | - | | | | (937) | | | | (937) | | | | - | | | | (937) | | | | (273) | | | | (1,210) | | | |
| | | Transactions including treasury stock and other equity instruments (net) | | | - | | | | - | | | | (14) | | | | - | | | | - | | | | 252 | | | | - | | | | - | | | | 238 | | | | - | | | | 238 | | | | - | | | | 238 | | | |
| | | Transfers between total equity entries | | | - | | | | - | | | | 3,239 | | | | 300 | | | | - | | | | - | | | | (4,606) | | | | 1,067 | | | | - | | | | - | | | | - | | | | - | | | | - | | | |
| | | Increase/Reduction due to business combinations | | | - | | | | - | | | | - | | | | - | | | | - | | | | - | | | | - | | | | - | | | | - | | | | - | | | | - | | | | - | | | | - | | | |
| | | Payments with equity instruments | | | - | | | | - | | | | - | | | | - | | | | - | | | | - | | | | - | | | | - | | | | - | | | | - | | | | - | | | | - | | | | - | | | |
| | | Rest of increases/reductions in total equity | | | - | | | | - | | | | 118 | | | | 5 | | | | - | | | | - | | | | - | | | | (179) | | | | (56) | | | | - | | | | (56) | | | | 6 | | | | (50) | | | |
| | | Balances as of December 31, 2011 | | | 2,403 | | | | 18,970 | | | | 17,580 | | | | 360 | | | | 51 | | | | (300) | | | | 3,004 | | | | (1,116) | | | | 40,952 | | | | (2,787) | | | | 38,165 | | | | 1,893 | | | | 40,058 | | | |
| | | |
The accompanying Notes 1 to 59 and Appendices I to X are an integral part of the consolidated statement of changes in equity for the year ended December 31, 2013.
F-10
Consolidated statements of cash flows for the years ended December 31, 2013, 2012 and 2011.
| | | | | | | | | | | | |
| | | | | | | Millions of Euros | | |
| | | | | Notes | | 2013 | | 2012 | | 2011 | | |
| | | CASH FLOW FROM OPERATING ACTIVITIES (1) | | 53 | | (500) | | 9,728 | | 17,182 | | |
| | | Profit for the year | | | | 2,981 | | 2,327 | | 3,485 | | |
| | | Adjustments to obtain the cash flow from operating activities: | | | | 8,260 | | 10,400 | | 7,133 | | |
| | | Depreciation and amortization | | | | 1,099 | | 978 | | 810 | | |
| | | Other adjustments | | | | 7,161 | | 9,422 | | 6,323 | | |
| | | Net increase/decrease in operating assets | | | | 25,613 | | (38,637) | | (23,356) | | |
| | | Financial assets held for trading | | | | 7,717 | | (9,358) | | (7,188) | | |
| | | Other financial assets designated at fair value through profit or loss | | | | 117 | | 243 | | 1 | | |
| | | Available-for-sale financial assets | | | | 1,938 | | (12,463) | | (1,604) | | |
| | | Loans and receivables | | | | 12,704 | | (12,073) | | (10,898) | | |
| | | Other operating assets | | | | 3,137 | | (4,986) | | (3,667) | | |
| | | Net increase/decrease in operating liabilities | | | | (37,265) | | 35,990 | | 29,761 | | |
| | | Financial liabilities held for trading | | | | (10,186) | | 4,656 | | 13,966 | | |
| | | Other financial liabilities designated at fair value through profit or loss | | | | 251 | | 595 | | 14 | | |
| | | Financial liabilities at amortized cost | | | | (24,660) | | 28,072 | | 14,584 | | |
| | | Other operating liabilities | | | | (2,670) | | 2,666 | | 1,197 | | |
| | | Collection/Payments for income tax | | | | (89) | | (352) | | 158 | | |
| | | CASH FLOWS FROM INVESTING ACTIVITIES (2) | | 53 | | 3,021 | | (1,060) | | (5,092) | | |
| | | Investment | | | | (2,325) | | (2,522) | | (6,995) | | |
| | | Tangible assets | | | | (1,252) | | (1,685) | | (1,293) | | |
| | | Intangible assets | | | | (526) | | (777) | | (619) | | |
| | | Investments | | | | (547) | | - | | (4,838) | | |
| | | Subsidiaries and other business units | | | | - | | - | | (245) | | |
| | | Non-current assets held for sale and associated liabilities | | | | - | | - | | - | | |
| | | Held-to-maturity investments | | | | - | | (60) | | - | | |
| | | Other settlements related to investing activities | | | | - | | - | | - | | |
| | | Divestments | | | | 5,346 | | 1,462 | | 1,903 | | |
| | | Tangible assets | | | | 101 | | - | | 175 | | |
| | | Intangible assets | | | | - | | - | | 1 | | |
| | | Investments | | | | 944 | | 19 | | - | | |
| | | Subsidiaries and other business units | | | | 3,299 | | - | | 19 | | |
| | | Non-current assets held for sale and associated liabilities | | | | 571 | | 590 | | 870 | | |
| | | Held-to-maturity investments | | | | 431 | | 853 | | 838 | | |
| | | Other collections related to investing activities | | | | - | | - | | - | | |
| | | | | | | | | | | | | |
| | | | | | | |
| | | | | | | | | | | | | |
The accompanying Notes 1 to 59 and Appendices I to X are an integral part of the consolidated statement of cash flows for the year ended December 31, 2013.
F-11
Consolidated statements of cash flows for the years ended December 31, 2013, 2012 and 2011.
| | | | | | | | | | | | |
| | | | | |
| | | | | | | Millions of Euros | | |
| | | (Continued) | | Notes | | 2013 | | 2012 | | 2011 | | |
| | | CASH FLOWS FROM FINANCING ACTIVITIES (3) | | 53 | | (1,326) | | (3,492) | | (1,269) | | |
| | | Investment | | | | (6,104) | | (10,387) | | (6,282) | | |
| | | Dividends | | | | (1,275) | | (1,269) | | (1,031) | | |
| | | Subordinated liabilities | | | | (697) | | (3,930) | | (230) | | |
| | | Common stock amortization | | | | - | | - | | - | | |
| | | Treasury stock acquisition | | | | (3,614) | | (4,831) | | (4,825) | | |
| | | Other items relating to financing activities | | | | (518) | | (357) | | (196) | | |
| | | Divestments | | | | 4,778 | | 6,895 | | 5,013 | | |
| | | Subordinated liabilities | | | | 1,088 | | 1,793 | | - | | |
| | | Common stock increase | | | | 2 | | - | | - | | |
| | | Treasury stock disposal | | | | 3,688 | | 5,102 | | 5,013 | | |
| | | Other items relating to financing activities | | | | - | | - | | - | | |
| | | EFFECT OF EXCHANGE RATE CHANGES (4) | | | | (1,784) | | 471 | | (959) | | |
| | | NET INCREASE/DECREASE IN CASH OR CASH EQUIVALENTS (1+2+3+4) | | | | (589) | | 5,647 | | 9,862 | | |
| | | CASH OR CASH EQUIVALENTS AT BEGINNING OF THE YEAR | | | | 35,476 | | 29,829 | | 19,967 | | |
| | | CASH OR CASH EQUIVALENTS AT END OF THE YEAR | | | | 34,887 | | 35,476 | | 29,829 | | |
| | | | | |
| | | | | | | Millions of Euros | | |
| | | COMPONENTS OF CASH AND EQUIVALENT AT END OF THE YEAR | | Notes | | 2013 | | 2012 | | 2011 | | |
| | | Cash | | | | 5,533 | | 5,155 | | 4,496 | | |
| | | Balance of cash equivalent in central banks | | | | 29,354 | | 30,321 | | 25,333 | | |
| | | Other financial assets | | | | - | | - | | - | | |
| | | Less: Bank overdraft refundable on demand | | | | - | | - | | - | | |
| | | TOTAL CASH OR CASH EQUIVALENTS AT END OF THE YEAR | | 9 | | 34,887 | | 35,476 | | 29,829 | | |
| | | Of which: | | | | | | | | | | |
| | | Held by consolidated subsidiaries but not available for the Group | | | | - | | - | | - | | |
| | | | | | | | | | | | | |
| | | | | | | | | | | | | |
The accompanying Notes 1 to 59 and Appendices I to X are an integral part of the consolidated statement of cash flows for the year ended December 31, 2013.
F-12
| 1. | Introduction, basis for the presentation of the consolidated financial statements and internal control of financial information. |
1.1 Introduction
Banco Bilbao Vizcaya Argentaria, S.A. (hereinafter “the Bank” or “BBVA”) is a private-law entity subject to the laws and regulations governing banking entities operating in Spain. It carries out its activity through branches and agencies across the country and abroad.
The Bylaws and other public information are available for inspection at the Bank’s registered address (Plaza San Nicolás, 4 Bilbao).
In addition to the transactions it carries out directly, the Bank heads a group of subsidiaries, joint venture and associated entities which perform a wide range of activities and which together with the Bank constitute the Banco Bilbao Vizcaya Argentaria Group (hereinafter, “the Group” or “the BBVA Group”). In addition to its own separate financial statements, the Bank is therefore required to prepare the Group’s consolidated financial statements.
As of December 31, 2013, the BBVA Group was made up of 301 consolidated entities and 127 entities accounted for using the equity method (see Notes 3 and 17 Appendices I to IV).
The BBVA Group’s consolidated financial statements for the years ended December 31, 2012 and 2011 were approved by the shareholders at the Bank’s Annual General Meetings (“AGM”) held on March 15, 2013 and March 16, 2012, respectively.
The consolidated financial statements of the BBVA Group and the separate financial statements of the Bank for the year ended December 31, 2013 have been approved by the shareholders at the Annual General Meetings.
1.2 Basis for the presentation of the consolidated financial statements
The BBVA Group’s consolidated financial statements are presented in accordance with the International Financial Reporting Standards endorsed by the European Union (hereinafter, “EU-IFRS”) applicable as of December 31 2013 (see Note 1.3), considering the Bank of Spain Circular 4/2004, of 22 December (and as amended thereafter), and with any other legislation governing financial reporting applicable to the Group and in compliance with IFRS-IASB.
The BBVA Group’s accompanying consolidated financial statements for the year ended December 31, 2013 were prepared by the Group’s Directors (through the Board of Directors held January 30, 2014) by applying the principles of consolidation, accounting policies and valuation criteria described in Note 2, so that they present fairly the Group’s consolidated equity and financial position as of December 31, 2013, together with the consolidated results of its operations and cash flows generated during the year 2013.
These consolidated financial statements were prepared on the basis of the accounting records kept by the Bank and each of the other entities in the Group. Moreover, they include the adjustments and reclassifications required to harmonize the accounting policies and valuation criteria used by the Group (see Note 2.2).
All effective accounting standards and valuation criteria with a significant effect in the consolidated financial statements were applied in their preparation.
The amounts reflected in the accompanying consolidated financial statements are presented in millions of euros, unless it is more appropriate to use smaller units. Some items that appear without a total in these consolidated financial statements do so because of the size of the units used. Also, in presenting amounts in millions of euros, the accounting balances have been rounded up or down. It is therefore possible that the totals appearing in some tables are not the exact arithmetical sum of their component figures.
The percentage changes in amounts have been calculated using figures expressed in thousands of euros.
F-13
1.3 Seasonal nature of income and expenses
The nature of the most significant operations carried out by the BBVA Group’s entities is mainly related to traditional activities carried out by financial institutions, which are not significantly affected by seasonal factors.
1.4 Responsibility for the information and for the estimates made
The information contained in the BBVA Group’s consolidated financial statements is the responsibility of the Group’s Directors.
Estimates have to be made at times when preparing these consolidated financial statements in order to calculate the recorded amount of some assets, liabilities, income, expenses and commitments. These estimates relate mainly to the following:
| — | Impairment on certain financial assets (see Notes 7, 8, 12, 13, 14 and 17). |
| — | The assumptions used to quantify certain provisions (see Notes 18, 24 and 25) and for the actuarial calculation of post-employment benefit liabilities and commitments (see Note 26). |
| — | The useful life and impairment losses of tangible and intangible assets (see Notes 16, 19, 20 and 22). |
| — | The valuation of goodwill (see Note 20). |
| — | The fair value of certain unlisted financial assets and liabilities (see Notes 7, 8, 10, 11, 12 and 15). |
Although these estimates were made on the basis of the best information available as of December 31, 2013 on the events analyzed, future events may make it necessary to modify them (either up or down) over the coming years. This would be done prospectively in accordance with applicable standards, recognizing the effects of changes in the estimates in the corresponding consolidated income statement.
F-14
1.5 Control of the BBVA Group’s financial reporting
The financial information prepared by the BBVA Group is subject to a system of internal control (hereinafter the “Internal Financial Control” or “ICFR”). Its aim is to provide reasonable assurance with respect to its reliability and integrity, and to ensure that the transactions carried out and processed use the criteria established by the BBVA Group’s management and comply with applicable laws and regulations.
The ICFR was developed by the BBVA Group’s management in accordance with international standards established by the Committee of Sponsoring Organizations of the Treadway Commission (hereinafter, “COSO”). This stipulates five components that must form the basis of the effectiveness and efficiency of systems of internal control:
| — | Establishment of an appropriate control framework to monitor these activities. |
| — | Assessment of all of the risks that could arise during the preparation of financial information. |
| — | Design the necessary controls to mitigate the most critical risks. |
| — | Establishment of an appropriate system of information flows to detect and report system weaknesses or flaws. |
| — | Monitoring of the controls to ensure they perform correctly and are effective over time. |
In May 2013, COSO has released an updated version of its Integrated Internal Control Framework version. This update provides a broader framework than the previous guidance and clarifies the requirements for determining what constitutes effective internal control. Although BBVA Group is in the process of analyzing the current version, no significant changes are expected in the current internal model control.
The ICFR is a dynamic model that evolves continuously over time to reflect the reality of the BBVA Group’s business at any time, together with the risks affecting it and the controls designed to mitigate these risks. It is subject to continuous evaluation by the internal control units located in the BBVA Group’s different entities.
The internal control units comply with a common and standard methodology issued by the corporate internal control units, which also perform a supervisory role over them, as set out in the following diagram:
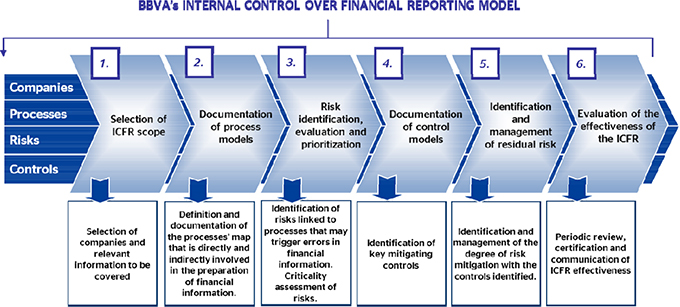
As well as the evaluation by the Internal Control Units, ICFR Model is subject to evaluations by the Group’s Internal Audit Department and external auditors. It is also supervised by the Audit and Compliance Committee of the Bank’s Board of Directors.
F-15
| 2. | Principles of consolidation, accounting policies and measurement bases applied and recent IFRS pronouncements |
The Glossary, includes the definition of some of the financial and economic terms used in Note 2 and subsequent Notes.
2.1 Principles of consolidation
In terms of its consolidation, accordance with the criteria established by the new IFRS 10 and 11 applied by the Group from January 1, 2013, the BBVA Group is made up of four types of entities: subsidiaries, joint ventures, associates and structured entities, define as follows:
Subsidiaries are entities controlled by the Group (for definition of the criterion for control, see Glossary).
The financial statements of the subsidiaries are consolidated with those of the Bank using the global integration method.
The share of non-controlling interests from subsidiaries in the Group’s consolidated equity is presented under the heading “Non-controlling interests” in the consolidated balance sheet. Their share in the profit or loss for the year is presented under the heading “Profit attributable to non-controlling interests” in the accompanying consolidated income statement (see Note 32).
Note 3 includes information related to the main subsidiaries in the Group as of December 31, 2013. Appendix I includes other significant information on these entities.
Joint ventures are those entities over which there is a joint arrangement to joint control (for definitions of joint arrangement, joint control and joint venture, refer to Glossary).
The investments in joint ventures are valued using the equity method (see Note 17). Appendix II shows the main figures for joint ventures accounted for using the equity method.
Associates are entities in which the Group is able to exercise significant influence (for definition of significant influence, see Glossary). Significant influence is deemed to exist when the Group owns 20% or more of the voting rights of an investee directly or indirectly, unless it can be clearly demonstrated that this is not the case.
However, certain entities in which the Group owns 20% or more of the voting rights are not included as Group associates, since the Group does not have the ability to exercise significant influence over these entities. Investments in these entities, which do not represent material amounts for the Group, are classified as “Available-for-sale financial assets”. Those entities are not material.
In contrast, some investments in entities in which the Group holds less than 20% of the voting rights are accounted for as Group associates, as the Group is considered to have the ability to exercise significant influence over these entities.
Appendix II shows the most significant information related to the associates (see Note 17), which are accounted for using the equity method.
A structured entity (see Glossary) is an entity that has been designed so that voting or similar rights are not the dominant factor in deciding who controls the entity, such as when the voting rights relate to administrative matters only and the relevant activities are directed by means of contractual arrangements.
F-16
In those cases where the Group sets up entities, or has a holding in such entities, in order to allow its customers access to certain investments, or for transferring risks or for other purposes, in accordance with internal criteria and procedures and with applicable regulations, the Group determines whether control over the entity in question actually exists and therefore whether it should be subject to consolidation.
Such methods and procedures determine whether there is control by the Group, considering how the decisions are made about the relevant activities, assesses whether the Group has all power over the relevant elements, exposure, or rights, to variable returns from involvement with the investee; and the ability to use power over the investee to affect the amount of the investor’s returns.
| | - | Structured entities subject to consolidation |
To determine if a structured entity controls the investee, and therefore should be consolidated into the Group, the existing contractual rights (different from the voting rights) are analyzed. For this reason, an analysis of the structure and purpose of each investee will be performed and, among others, the following factors will be considered:
| | - | | Evidence of the current ability to manage the relevant activities of the entity according to the specific business needs (including any decisions that may arise only in particular circumstances). |
| | - | | Potential existence of a special relationship with the entity. |
| | - | | Implicit or explicit Group commitments to support the entity. |
| | - | | The ability to use the Group’s power over the investee to affect the amount of the investor’s returns. |
There are cases where the Group has a high exposure to variable returns and maintains existing decision-making power over the entity, either directly or through an agent. For instance, the so-called asset securitization funds, to which the BBVA Group transferred loan portfolios, and other vehicles, which allow the Group’s customers to gain access to certain investments or to allow for the transfer of risks and other purposes (See Appendix I and V).
As of December 31, 2013 there was no significant financial agreement support, additional to contractually establish, from the parent or other subsidiaries to the consolidated structured entities.
| | - | Non-consolidated structured entities |
The Group owns other vehicles also for the purpose of allowing access to customers to certain investment, transfer risks, and other purposes, but without the control of these and which are considered non-consolidated in accordance with IFRS 10. The balance of assets and liabilities of these vehicles is not material in relation to the Group’s consolidated financial statements.
As of December 31, 2013 there was no significant financial support from the parent or subsidiaries to unconsolidated structured entities.
In all cases, results of equity method investees acquired by the BBVA Group in a particular period are included taking into account only the period from the date of acquisition to the financial statements date. Similarly, the results of entities disposed of during any year are included taking into account only the period from the start of the year to the date of disposal.
The financial statements of subsidiaries, associates and joint ventures used in the preparation of the consolidated financial statements of the Group relate to the same date of presentation than the consolidated financial statements. If financial statements at those same dates are not available, the most recent will be used, as long as these are not older than three months, and adjusting to take into account the most significant transactions. As of December 31, 2013, all of the financial statements of all Group entities were available, save for the case of the financial statements of six non-material associates for which the financial statements were as of November 30, 2013.
Our banking subsidiaries, associates and joint venture around the world, are subject to supervision and regulation from a variety of regulatory bodies in relation to, among other aspects, the satisfaction of minimum capital requirements. The obligation to satisfy such capital requirements may affect the ability of such entities to transfer funds in the form of cash dividends, loans or advances. In addition, under the laws of the various jurisdictions where such entities are incorporated, dividends may only be paid out through funds legally available for such purpose. Even when the minimum capital requirements are met and funds are legally available, the relevant regulator could discourage the transfer of funds to the Group in the form of cash, dividends, loans or advances for prudential reasons.
F-17
Separate financial statements
The separate financial statements of the parent company of the Group (Banco Bilbao Vizcaya Argentaria, S.A.) are prepared under Spanish regulations (Circular 4/2004 of the Bank of Spain, and subsequent amendments). The Bank uses the cost method to account in its financial statements for investment in subsidiaries, associates and joint venture entities, which is consistent with the requirements of IAS 27.
2.2 Accounting policies and valuation criteria applied
The accounting standards and policies and the valuation criteria applied in preparing these consolidated financial statements may differ from those used by some of the entities within the BBVA Group. For this reason, necessary adjustments and reclassifications have been introduced in the consolidation process to standardize these principles and criteria.
The accounting standards and policies and valuation criteria used in preparing the accompanying consolidated financial statements are as follows:
2.2.1 Financial instruments
Measurement of financial instruments and recognition of changes in subsequent fair value
All financial instruments are initially accounted for at fair value which, unless there is evidence to the contrary, shall be the transaction price.
All the changes in the fair value of the financial instruments, except in trading derivatives, arising from the accrual of interests and similar items are recognized under the headings “Interest and similar income” or “Interest and similar expenses”, as appropriate, in the accompanying consolidated income statement for the year in which the change occurred (see Note 39). The dividends received from other entities are recognized under the heading “Dividend income” in the accompanying consolidated income statement for the year in which the right to receive them arises (see Note 40).
The changes in fair value after the initial recognition, for reasons other than those mentioned in the preceding paragraph, are treated as described below, according to the categories of financial assets and liabilities.
“Financial assets held for trading” and “Other financial assets and liabilities designated at fair value through profit or loss”
The assets and liabilities recognized under these headings of the consolidated balance sheets are measured at fair value and changes in the fair value (gains or losses) are recognized as their net value under the heading “Net gains (losses) on financial assets and liabilities” in the accompanying consolidated income statements (see Note 44). However, changes in fair value resulting from variations in foreign exchange rates are recognized under the heading “Exchange differences (net)” in the accompanying consolidated income statements.
F-18
“Available-for-sale financial assets”
Assets recognized under this heading in the consolidated balance sheets are measured at their fair value. Subsequent changes in fair value (gains or losses) are recognized temporarily for their amount net of tax effect, under the heading “Valuation adjustments - Available-for-sale financial assets” in the consolidated balance sheets.
Changes in the value of non-monetary items resulting from changes in foreign exchange rates are recognized temporarily under the heading “Valuation adjustments - Exchange differences” in the accompanying consolidated balance sheets. Changes in foreign exchange rates resulting from monetary items are recognized under the heading “Exchange differences (net)” in the accompanying consolidated income statements.
The amounts recognized under the headings “Valuation adjustments - Available-for-sale financial assets” and “Valuation adjustments - Exchange differences” continue to form part of the Group’s consolidated equity until the corresponding asset is derecognized from the consolidated balance sheet or until an impairment loss is recognized in the corresponding financial instrument. If these assets are sold, these amounts are derecognized and included under the headings “Net gains (losses) on financial assets and liabilities” or “Exchange differences (net)”, as appropriate, in the consolidated income statement for the year in which they are derecognized.
The gains from sales of other equity instruments considered strategic investments included under “Available-for-sale financial assets” are recognized under the heading “Gains (losses) in non-current assets held-for-sale not classified as discontinued operations” in the consolidated income statement, even if they had not been classified in a previous balance sheet as non-current assets held for sale.
The net impairment losses in “Available-for-sale financial assets” over the year are recognized under the heading “Impairment losses on financial assets (net) – Other financial instruments not at fair value through profit or loss” (see Note 49) in the consolidated income statements for that period.
“Loans and receivables”, “Held-to-maturity investments” and “Financial liabilities at amortized cost”
Assets and liabilities recognized under these headings in the accompanying consolidated balance sheets are measured at “amortized cost” using the “effective interest rate” method. This is because the consolidated entities intend to hold such financial instruments to maturity.
Net impairment losses of assets recognized under these headings arising in a particular period are recognized under the heading “Impairment losses on financial assets (net) – Loans and receivables” or “Impairment losses on financial assets (net) – Other financial instruments not valued at fair value through profit or loss” (see Note 49) in the consolidated income statement for that period.
“Hedging derivatives” and “Fair value changes of the hedged items in portfolio hedges of interest-rate risk”
Assets and liabilities recognized under these headings in the accompanying consolidated balance sheets are measured at fair value.
Changes occurring subsequent to the designation of the hedging relationship in the measurement of financial instruments designated as hedged items as well as financial instruments designated as hedge accounting instruments are recognized as follows:
| — | In fair value hedges, the changes in the fair value of the derivative and the hedged item attributable to the hedged risk are recognized under the heading “Net gains (losses) on financial assets and liabilities” in the consolidated income statement, with a corresponding item under the headings where hedging items (“Hedging derivatives”) and the hedged items are recognized, as applicable. |
| — | In fair value hedges of interest rate risk of a portfolio of financial instruments (portfolio-hedges), the gains or losses that arise in the measurement of the hedging instrument are recognized in the consolidated income statement, and the gains or losses that arise from the change in the fair value of the hedged item (attributable to the hedged risk) are recognized in the consolidated income statement, using, as a balancing item, the headings “Fair value changes of the hedged items in portfolio hedges of interest rate risk” in the consolidated balance sheets, as applicable. |
| — | In cash flow hedges, the gain or loss on the hedging instruments relating to the effective portion are recognized temporarily under the heading “Valuation adjustments – Cash flow hedging” in the consolidated balance sheets. These differences are recognized in the accompanying consolidated income statement at the time when the gain or loss in the hedged instrument affects profit or loss, when the forecast transaction is executed or at the maturity date of the hedged item. Almost all of the hedges used by the Group are for interest-rate risks. Therefore, the valuation changes are recognized under the headings “Interest and similar income” or “Interest and similar expenses”, as appropriate, in the accompanying consolidated income statement (see Note 39). |
F-19
Differences in the measurement of the hedging items corresponding to the ineffective portions of cash flow hedges are recognized directly in the heading “Net gains (losses) on financial assets and liabilities” in the consolidated income statement (See Note 44).
| — | In the hedges of net investments in foreign operations, the differences attributable to the effective portions of hedging items are recognized temporarily under the heading “Valuation adjustments – Hedging of net investments in foreign transactions” in the consolidated balance sheets. These differences in valuation are recognized under the heading “Exchange differences (net)” in the consolidated income statement when the investment in a foreign operation is disposed of or derecognized. |
Other financial instruments
The following exceptions are applicable with respect to the above general criteria:
| — | Equity instruments whose fair value cannot be determined in a sufficiently objective manner and financial derivatives that have those instruments as their underlying asset and are settled by delivery of those instruments remain in the consolidated balance sheet at acquisition cost; this may be adjusted, where appropriate, for any impairment loss. (see Note 8) |
| — | Valuation adjustments arising from financial instruments classified at the consolidated balance sheet date as non-current assets held for sale are recognized with a balancing entry under the heading “Valuation adjustments - Non-current assets held for sale” in the accompanying consolidated balance sheets. |
Impairment losses on financial assets
Definition of impaired financial assets
A financial asset is considered impaired – and therefore its carrying amount is adjusted to reflect the effect of impairment – when there is objective evidence that events have occurred, which:
| — | In the case of debt instruments (loans and advances and debt securities), reduce the future cash flows that were estimated at the time the transaction was entered into. So they are considered impaired when there are reasonable doubts that the carrying amounts will be recovered in full and/or the related interest will be collected for the amounts and on the dates initially agreed. |
| — | In the case of equity instruments, it means that their carrying amount may not be fully recovered. |
As a general rule, the carrying amount of impaired financial assets is adjusted with a charge to the consolidated income statement for the period in which the impairment becomes known. The recoveries of previously recognized impairment losses are reflected, if appropriate, in the consolidated income statement for the year in which the impairment is reversed or reduced, with an exception: any recovery of previously recognized impairment losses for an investment in an equity instrument classified as financial assets available for sale is not recognized in the consolidated income statement, but under the heading “Valuation Adjustments - Available-for-sale financial assets” in the consolidated balance sheet (see Note 31).
In general, amounts collected in relation to impaired loans and receivables are used to recognize the related accrued interest and any excess amount is used to reduce the unpaid principal.
When the recovery of any recognized amount is considered remote, this amount is written-off on the consolidated balance sheet, without prejudice to any actions that may be taken in order to collect the amount until the rights extinguish in full either because it is time-barred debt, the debt is forgiven, or other reasons.
In the case of particularly significant financial assets, and assets that cannot be classified within similar groups of instruments in terms of risk, the amounts to be charged off are measured individually. In the case of financial assets for lower amounts that can be classified in homogeneous groups, this measurement is carried out as a group.
F-20
According to the Group’s established policy, the recovery of a recognized amount is considered remote and, therefore, derecognized from the consolidated balance sheet in the following cases:
| — | Any loan (except for those carrying an effective guarantee) of an entity in bankruptcy and/or in the last phases of a “concurso de acreedores” (the Spanish equivalent of a Chapter 11 bankruptcy proceeding), and |
| — | Financial assets (bonds, debentures, etc.) whose issuer’s solvency had been undergone a notable and irreversible deterioration. |
Additionally, loans and advances classified as impaired secured loans are written off in the balance sheet within a maximum period of four years of their classification as impaired, while impaired unsecured loans (such as commercial and consumer loans, credit cards, etc.) are written off within two years of their classification as impaired.
Impairment on financial assets
The impairment on financial assets is determined by type of instrument and other circumstances that could affect it, taking into account the guarantees received by the owners of the financial instruments to assure (in part or in full) the performance of the financial assets. The BBVA Group recognizes impairment charges directly against the impaired financial asset when the likelihood of recovery is deemed remote, and uses an offsetting or allowance account when it recognizes non-performing loan provisions for the estimated losses.
Impairment of debt securities measured at amortized cost
The amount of impairment losses of debt securities at amortized cost is measured depending on whether the impairment losses are determined individually or collectively.
Impairment losses on financial assets individually evaluated for impairment
The amount of the impairment losses incurred on these instruments represents the excess of their respective carrying amounts over and the present values of their expected future cash flows. These cash flows are discounted using the original effective interest rate. If a financial instrument has a variable interest rate, the discount rate for measuring any impairment loss is the current effective rate determined under the contract.
As an exception to the rule described above, the market value of listed debt instruments is deemed to be a fair estimate of the present value of their future cash flows.
The following is to be taken into consideration when estimating the future cash flows of debt instruments:
| — | All the amounts that are expected to be recovered over the remaining life of the instrument; including, where appropriate, those which may result from the collateral and other credit enhancements provided for the instrument (after deducting the costs required for foreclosure and subsequent sale). Impairment losses include an estimate for the possibility of collecting accrued, past-due and uncollected interest. |
| — | The various types of risk to which each instrument is subject. |
| — | The circumstances in which collections will foreseeably be made. |
In respect to impairment losses resulting from the materialization of insolvency risk of the obligors (credit risk), a debt instrument is impaired:
| — | When there is evidence of a reduction in the obligor’s capacity to pay, whether manifestly by default or for other reasons; and/or |
| — | For these purposes, country risk is understood to refer to risk with respect to debtors resident in a particular country and resulting from factors other than normal commercial risk: sovereign risk, transfer risk or risks derived from international financial activity. |
The BBVA Group has policies, methods and procedures for hedging its credit risk, for insolvency attributable to counterparties and country-risk. These policies, methods and procedures are applied to the arrangement, study and documentation of debt instruments, contingent risks and commitments, as well as the identification of their deterioration and in the calculation of the amounts needed to cover their credit risk.
Impairment losses on financial assets collectively evaluated for impairment
Impairment losses on financial assets collectively evaluated for impairment are calculated by using statistical procedures, and they are deemed equivalent to the portion of losses incurred on the date that the accompanying
F-21
consolidated financial statements are prepared that has yet to be allocated to specific asset. The BBVA group estimates losses through statistical processes that apply historical data and other specific parameters that, although having been generated as of closing date for these consolidated financial statements, have arisen on an individual basis following the reporting date.
The incurred loss is calculated taking into account three key factors: exposure at default, probability of default and loss given default.
| — | Exposure at default (EAD) is the amount of risk exposure at the date of default by the counterparty. |
| — | Probability of default (PD) is the probability of the counterparty failing to meet its principal and/or interest payment obligations. The PD is associated with the rating/scoring of each counterparty/transaction. In addition, the PD calculation includes the following parameters: |
| | – | | The ‘point-in-time’ parameter converts a ‘through-the-cycle’ probability of default (defined as the average probability of default over a complete economic cycle) into the probability of default at the reporting date (‘point-in-time’ probability). |
| | – | | The loss identification period (‘LIP’) parameter, which is the time lag period between the occurrence of a specific impairment or loss event and when objective evidence of impairment becomes apparent on an individual basis; in other words, the time lag period between the loss event and the date an entity identified its occurrence. The analysis of LIPs is performed on a homogenous portfolio basis. |
F-22
The LIPs BBVA uses are set forth in the table below:
| | | | |
| Portfolio | | Average of LIPs Used as
of December 31, 2013 |
Sovereign and Public Institutions | | 12 months |
Corporates | | Real estate developers Large corporates | | From 6 months to 12 months |
| | | Others corporates SMEs | | From 6 months to 12 months |
Retail | | Mortgage loans Consumer loans | | From 3 months to 9 months |
At least once a year, BBVA performs a backtesting analysis in order to assess the accuracy of the LIP estimates for the corporate portfolios. The backtesting involves assessing the evolution of the most significant impaired loans over a period of time, on a periodic basis, to identify the actual LIPs for each portfolio.
A PD of 100% is assigned when a loan is considered impaired. The definition of default used includes amounts past due by 90 days or more and cases in which there is no default but there are doubts as to the solvency of the counterparty (subjective doubtful assets).
| — | Loss given default (LGD) is the estimate of the loss arising in the event of default. It depends mainly on the characteristics of the counterparty, and the valuation of the guarantees or collateral associated with the asset. |
In order to calculate the LGD at each balance sheet date, the Group evaluates the estimated cash flows from the sale of the collateral by estimating its sale price (in the case of real estate collateral, the Group takes into account declines in property values which could affect the value of such collateral) and its estimated cost of sale. In the event of a default, the Group becomes contractually entitled to the property at the end of the foreclosure process or properties purchased from borrowers in distress, and is recognized in the financial statements. After the initial recognition of these assets classified as “Non-current assets held for sale” (see Note 2.2.4) or “Inventories” (see Note 2.2.6), they are valued at the lower of their carrying amount and their fair value less their estimated selling price.
The Bank of Spain requires that the calculation of the allowance for collective losses incurred must also be calculated based on the information provided by the Bank of Spain until the Spanish regulatory authority has verified and approved these internal models.
For the years ended December 31, 2013, 2012 and 2011, there is no material difference in the amount of allowances for loan losses calculated in accordance with EU-IFRS required to be applied under the Bank of Spain’s Circular 4/2004 and IFRS-IASB.
Impairment of other debt instruments
The impairment losses on other debt securities included in the “Available-for-sale financial asset” portfolio are equal to the excess of their acquisition cost (net of any principal repayment), after deducting any impairment loss previously recognized in the consolidated income statement over their fair value.
When there is objective evidence that the negative differences arising on measurement of these assets are due to impairment, they are no longer considered as “Valuation adjustments - Available-for-sale financial assets” and are recognized in the consolidated income statement.
If all, or part of the impairment losses are subsequently recovered, the amount is recognized in the consolidated income statement for the year in which the recovery occurred.
F-23
Impairment of equity instruments
The amount of the impairment in the equity instruments is determined by the category where they are recognized:
| — | Equity instruments measured at fair value: When there is objective evidence that the negative differences arising on measurement of these assets are due to impairment, they are no longer considered as “Valuation adjustments - Available-for-sale financial assets” and are recognized in the consolidated income statement. In general, the Group considers that there is objective evidence of impairment on equity instruments classified as available-for-sale when significant unrealized losses have existed over a sustained period of time due to a price reduction of at least 40% or over a period of more than 18 months. |
When applying this evidence of impairment, the Group takes into account the volatility in the price of each individual security to determine whether it is a percentage that can be recovered through its sale on the market; other different thresholds may exist for certain securities or specific sectors.
In addition, for individually significant investments, the Group compares the valuation of the most significant securities against valuations performed by independent experts.
Any recovery of previously recognized impairment losses for an investment in an equity instrument classified as available for sale is not recognized in the consolidated income statement, but under the heading “Valuation Adjustments - Available-for-sale financial assets” in the consolidated balance sheet (see Note 31).
| — | Equity instruments measured at cost: The impairment losses on equity instruments measured at acquisition cost are equal to the excess of their carrying amount over the present value of expected future cash flows discounted at the market rate of return for similar equity instruments. In order to determine these impairment losses, save for better evidence, an assessment of the equity of the investee is carried out (excluding valuation adjustments due to cash flow hedges) based on the last approved (consolidated) balance sheet, adjusted by the unrealized gains at measurement date. |
Impairment losses are recognized in the consolidated income statement for the year in which they arise as a direct reduction of the cost of the instrument. These losses may only be reversed subsequently in the event of the sale of these assets.
2.2.2 Transfers and derecognition of financial assets and liabilities
The accounting treatment of transfers of financial assets is determined by the form in which risks and benefits associated with the financial assets involved are transferred to third parties. Thus the financial assets are only derecognized from the consolidated balance sheet when the cash flows that they generate are extinguished, or when their implicit risks and benefits have been substantially transferred to third parties. In the latter case, the financial asset transferred is derecognized from the consolidated balance sheet, and any right or obligation retained or created as a result of the transfer is simultaneously recognized.
Similarly, financial liabilities are derecognized from the consolidated balance sheet only if their obligations are extinguished or acquired (with a view to subsequent cancellation or renewed placement).
The Group is considered to have transferred substantially all the risks and benefits if such risks and benefits account for the majority of the risks and benefits involved in ownership of the transferred financial assets. If substantially all the risks and benefits associated with the transferred financial asset are retained:
| — | The transferred financial asset is not derecognized from the consolidated balance sheet and continues to be measured using the same criteria as those used before the transfer. |
| — | A financial liability is recognized at the amount equal to the amount received, which is subsequently measured at amortized cost. |
| — | Both the income generated on the transferred (but not derecognized) financial asset and the expenses of the new financial liability continue to be recognized. |
2.2.3 Financial guarantees
Financial guarantees are considered to be those contracts that require their issuer to make specific payments to reimburse the holder of the financial guarantee for a loss incurred when a specific borrower breaches its payment obligations on the terms – whether original or subsequently modified – of a debt instrument, irrespective of the legal form it may take. Financial guarantees may take the form of a deposit, financial guarantee, insurance contract or credit derivative, among others.
F-24
In their initial recognition, financial guarantees are recognized as liabilities in the consolidated balance sheet at fair value, which is generally the present value of the fees, commissions and interest receivable from these contracts over the term thereof, and the Group simultaneously recognize a corresponding asset in the consolidated balance sheet for the amount of the fees and commissions received at the inception of the transactions and the amounts receivable at the present value of the fees, commissions and interest outstanding.
Financial guarantees, irrespective of the guarantor, instrumentation or other circumstances, are reviewed periodically so as to determine the credit risk to which they are exposed and, if appropriate, to consider whether a provision is required for them. The credit risk is determined by application of criteria similar to those established for quantifying impairment losses on debt instruments measured at amortized cost (see Note 2.2.1).
The provisions recognized for financial guarantees considered impaired are recognized under the heading “Provisions - Provisions for contingent risks and commitments” on the liability side in the consolidated balance sheets (see Note 25). These provisions are recognized and reversed with a charge or credit, respectively; to “Provisions (net)” in the consolidated income statements (see Note 48).
Income from financial guarantee contracts is recorded under the heading “Fee and commission income” in the consolidated income statement and is calculated by applying the rate established in the related contract to the nominal amount of the guarantee (see Note 42).
2.2.4 Non-current assets held for sale and liabilities associated with non-current assets held for sale
The heading “Non-current assets held-for-sale” in the consolidated balance sheets includes the carrying amount of assets that are not part of the BBVA Group’s operating activities. The recovery of this carrying amount is expected to take place through the price obtained on its disposal (see Note 16).
This heading includes individual items and groups of items (“disposal groups”) and disposal groups that form part of a major operating segment and are being held for sale as part of a disposal plan (“discontinued operations”). The individual items include the assets received by the subsidiaries from their debtors, and those consolidated under the proportionate consolidated method, in full or partial settlement of the debtors’ payment obligations (assets foreclosed or donated in repayment of debt and recovery of lease finance transactions), unless the Group has decided to make continued use of these assets. The BBVA Group has units that specialize in real estate management and the sale of this type of asset.
Symmetrically, the heading “Liabilities associated with non-current assets held for sale” in the consolidated balance sheets reflects the balances payable arising from disposal groups and discontinued operations.
Non-current assets held for sale are generally measured, at the acquisition date and at any later date deemed necessary, at either their carrying amount or the fair value of the property (less costs to sell), whichever is lower. The book value at acquisition date of the non-current assets held for sale from foreclosures or recoveries is defined as the balance pending collection on those loans/credits that originated said purchases (net of provisions). Non-current assets held for sale are not depreciated while included under this heading.
Gains and losses generated on the disposal of assets and liabilities classified as non-current held for sale, and related impairment losses and subsequent recoveries, where pertinent, are recognized in “Gains/(losses) on non-current assets held for sale not classified as discontinued operations” in the consolidated income statements (see Note 52.1). The remaining income and expense items associated with these assets and liabilities are classified within the relevant consolidated income statement headings.
Income and expenses for discontinued operations, whatever their nature, generated during the year, even if they have occurred before their classification as discontinued operations, are presented net of the tax effect as a single amount under the heading “Profit from discontinued operations” in the consolidated income statement, whether the business remains on the balance sheet or is derecognized from the balance sheet. This heading includes the earnings from their sale or other disposal (see Note 52.2).
F-25
2.2.5 Tangible assets
Property, plant and equipment for own use
This heading includes the assets under ownership or acquired under lease finance, intended for future or current use by the BBVA Group and that it expects to hold for more than one year. It also includes tangible assets received by the consolidated entities in full or partial settlement of financial assets representing receivables from third parties and those assets expected to be held for continuing use.
Property, plant and equipment for own use are presented in the consolidated balance sheets at acquisition cost, less any accumulated depreciation and, where appropriate, any estimated impairment losses resulting from comparing this net carrying amount of each item with its corresponding recoverable amount.
Depreciation is calculated using the straight-line method, on the basis of the acquisition cost of the assets less their residual value; the land on which the buildings and other structures stand is considered to have an indefinite life and is therefore not depreciated.
The tangible asset depreciation charges are recognized in the accompanying consolidated income statements under the heading “Depreciation and amortization” (see Note 47) and are based on the application of the following depreciation rates (determined on the basis of the average years of estimated useful life of the various assets):
| | | | | | | | | | | | |
| | | | | Amortization Rates for Tangible Assets | | | | | | | | |
| | | | | Type of Assets | | Annual Percentage | | | | |
| | | | | | | | | | | | | |
| | | | | | | | | | | | | |
| | | | | Buildings for own use | | | | 1% - 4% | | | | |
| | | | | Furniture | | | | 8% - 10% | | | | |
| | | | | Fixtures | | | | 6% - 12% | | | | |
| | | | | Office supplies and hardware | | | | 8% - 25% | | | | |
| | | | | | | | | | | | | |
The BBVA Group’s criteria for determining the recoverable amount of these assets, in particular buildings for own use, is based on independent appraisals that are no more than 3-5 years old at most, unless there are indications of impairment.
At each reporting date, the Group entities analyze whether there are internal or external indicators that a tangible asset may be impaired. When there is evidence of impairment, the entity analyzes whether this impairment actually exists by comparing the asset’s net carrying amount with its recoverable amount (as the higher between its recoverable amount less disposal costs and its value in use). When the carrying amount exceeds the recoverable amount, the carrying amount is written down to the recoverable amount and depreciation charges going forward are adjusted to reflect the asset’s remaining useful life.
Similarly, if there is any indication that the value of a tangible asset has been recovered, the consolidated entities will estimate the recoverable amounts of the asset and recognize it in the consolidated income statement, recording the reversal of the impairment loss registered in previous years and thus adjusting future depreciation charges. Under no circumstances may the reversal of an impairment loss on an asset raise its carrying amount above that which it would have if no impairment losses had been recognized in prior years.
Running and maintenance expenses relating to tangible assets held for own use are recognized as an expense in the year they are incurred and recognized in the consolidated income statements under the heading “Administration costs - General and administrative expenses - Property, fixtures and equipment” (see Note 46.2).
Other assets leased out under an operating lease
The criteria used to recognize the acquisition cost of assets leased out under operating leases, to calculate their depreciation and their respective estimated useful lives and to recognize the impairment losses on them, are the same as those described in relation to tangible assets for own use.
Investment properties
The heading “Tangible assets - Investment properties” in the consolidated balance sheets reflects the net values (purchase cost minus the corresponding accumulated depreciation and, if appropriate, estimated impairment losses) of the land, buildings and other structures that are held either to earn rentals or for capital appreciation through sale and that are neither expected to be sold off in the ordinary course of business nor are destined for own use (see Note 19).
F-26
The criteria used to recognize the acquisition cost of investment properties, calculate their depreciation and their respective estimated useful lives and recognize the impairment losses on them, are the same as those described in relation to tangible assets held for own use.
The BBVA Group’s criteria for determining the recoverable amount of these assets is based on independent appraisals that are no more than one year old at most, unless there are indications of impairment.
2.2.6 Inventories
The balance under the heading “Other assets - Inventories” in the consolidated balance sheets mainly includes the land and other properties that the BBVA Group’s real estate entities hold for development and sale as part of their real estate development activities (see Note 22).
The cost of inventories includes those costs incurred in during their acquisition and development, as well as other direct and indirect costs incurred in getting them to their current condition and location.
In the case of, the cost of real-estate assets accounted for as inventories is comprised of: the acquisition cost of the land, the cost of urban planning and construction, non-recoverable taxes and costs corresponding to construction supervision, coordination and management. Borrowing cost incurred during the year form part of the cost value, provided that the inventories require more than a year to be in a condition to be sold.
Properties purchased from borrowers in distress are measured, at the acquisition date and any subsequent time, at either their related carrying amount or the fair value of the property (less costs to sell), whichever is lower. The book value at acquisition date of these real-estate assets is defined as the balance pending collection on those loans/credits that originated said purchases (net of provisions).
Impairment
If the fair value less costs to sell is lower than the loan amount registered in the balance sheet, a loss is recognized under the heading “Impairment losses on other assets (net) – Other assets” in the income statement for the period (see Note 50). In the case of real-estate assets accounted for as inventories, the BBVA Group’s criterion for determining their net realizable value is mainly based on independent appraisals no more than one year old, or less if there are indications of impairment.
The amount of any subsequent adjustment due to inventory valuation for reasons such as damage, obsolescence, reduction in sale price to its net realizable value, as well as losses for other reasons and, if appropriate, subsequent recoveries of value up to the limit of the initial cost value, are registered under the heading “Impairment losses on other assets (net) – Other assets” in the accompanying consolidated income statements (see Note 50) for the year in which they are incurred.
Inventory sales
In sale transactions, the carrying amount of inventories is derecognized from the consolidated balance sheet and recognized as an expense under the heading “Other operating expenses – Changes in inventories” in the year in which the income from its sale is recognized. This income is recognized under the heading “Other operating income – Financial income from non-financial services” in the consolidated income statements (see Note 45).
2.2.7 Business combinations
The aim of a business combination is to obtain control of one or more businesses. It is accounted for by applying the acquisition method.
According to this method, the acquirer has to recognize the assets acquired and the liabilities and contingent liabilities assumed, including those that the acquired entity had not recognized in the accounts. The method involves the measurement of the consideration received for the business combination and its allocation to the assets, liabilities and contingent liabilities measured according to their fair value, at the purchase date.
In addition, the acquirer shall recognize an asset in the consolidated balance sheet under the heading “Intangible asset - Goodwill” if on the acquisition date there is a positive difference between:
F-27
| — | the sum of the consideration transferred, the amount of all the non-controlling interests and the fair value of stock previously held in the acquired business; and |
| — | the fair value of the assets acquired and liabilities assumed. |
If this difference is negative, it shall be recognized directly in the income statement under the heading “Gain on Bargain Purchase in business combinations”.
Non-controlling interests in the acquired entity may be measured in two ways: either at their fair value; or at the proportional percentage of net assets identified in the acquired entity. The method of valuing non-controlling interest may be elected in each business combination. So far, the BBVA Group has always elected for the second method.
The purchase of non-controlling interests subsequent to obtaining control of an entity is recognized as equity transactions; in other words, the difference between the consideration transferred and the carrying amount of the percentage of non-controlling interests acquired is charged directly to equity.
2.2.8 Intangible assets
Goodwill
Goodwill represents payment in advance by the acquiring entity for the future economic benefits from assets that cannot be individually identified and separately recognized. It is only recognized as goodwill when the business combinations are acquired at a price. Goodwill is never amortized. It is subject periodically to an impairment analysis, and is written off if it is clear that there has been impairment.
Goodwill is assigned to one or more cash-generating units that expect to be the beneficiaries of the synergies derived from the business combinations. The cash-generating units represent the Group’s smallest identifiable asset groups that generate cash flows for the Group and that are largely independent of the flows generated from the Group’s other assets or groups of assets. Each unit or units to which goodwill is allocated:
| — | is the lowest level at which the entity manages goodwill internally; |
| — | is not larger than a operating segment. |
The cash-generating units to which goodwill has been allocated are tested for impairment (including the allocated goodwill in their carrying amount). This analysis is performed at least annually or more frequently if there is any indication of impairment.
For the purpose of determining the impairment of a cash-generating unit to which a part of goodwill has been allocated, the carrying amount of that cash-generating unit, adjusted by the theoretical amount of the goodwill attributable to the non-controlling interests, in the event they are not valued at fair value, is compared with its recoverable amount.
The recoverable amount of a cash-generating unit is equal to the fair value less sale costs and its value in use, whichever is greater. Value in use is calculated as the discounted value of the cash flow projections that the unit’s management estimates and is based on the latest budgets approved for the coming years. The main assumptions used in its calculation are: a sustainable growth rate to extrapolate the cash flows indefinitely, and the discount rate used to discount the cash flows, which is equal to the cost of the capital assigned to each cash-generating unit, and equivalent to the sum of the risk-free rate plus a risk premium inherent to the cash-generating unit being evaluated for impairment.
If the carrying amount of the cash-generating unit exceeds the related recoverable amount, the Group recognizes an impairment loss; the resulting loss is apportioned by reducing, first, the carrying amount of the goodwill allocated to that unit and, second, if there are still impairment losses remaining to be recognized, the carrying amount of the remainder of the assets. This is done by allocating the remaining loss in proportion to the carrying amount of each of the assets in the unit. In the event the non-controlling interests are measured at fair value, the deterioration of goodwill attributable to non-controlling interests will be recognized. In any case, an impairment loss recognized for goodwill shall not be reversed in a subsequent period.
They are recognized under the heading “Impairment losses on other assets (net) – Goodwill and other intangible assets” in the consolidated income statements (see Note 50).
F-28
Other intangible assets
These assets may have an indefinite useful life if, based on an analysis of all relevant factors, it is concluded that there is no foreseeable limit to the period over which the asset is expected to generate net cash flows for the consolidated entities. In all other cases they have a finite useful life.
Intangible assets with a finite useful life are amortized according to the duration of this useful life, using methods similar to those used to depreciate tangible assets. The depreciation charge of these assets is recognized in the accompanying consolidated income statements under the heading “Depreciation and amortization” (see Note 47).
The consolidated entities recognize any impairment loss on the carrying amount of these assets with charge to the heading “Impairment losses on other assets (net)—Goodwill and other intangible assets” in the accompanying consolidated income statements (see Note 50). The criteria used to recognize the impairment losses on these assets and, where applicable, the recovery of impairment losses recognized in prior years, are similar to those used for tangible assets.
2.2.9 Insurance and reinsurance contracts
The assets of the BBVA Group’s insurance subsidiaries are recognized according to their nature under the corresponding headings of the consolidated balance sheets and the initial recognition and valuation is carried out according to the criteria set out in IFRS 4.
The heading “Reinsurance assets” in the accompanying consolidated balance sheets includes the amounts that the consolidated entities are entitled to receive under the reinsurance contracts entered into by them with third parties and, more specifically, the share of the reinsurer in the technical provisions recognized by the consolidated insurance entities (see Note 18).
The heading “Liabilities under insurance contracts” in the accompanying consolidated balance sheets includes the technical provisions for direct insurance and inward reinsurance recognized by the consolidated entities to cover claims arising from insurance contracts in force at period-end (see Note 24).
The income or expenses reported by the BBVA Group’s insurance entities on their insurance activities is recognized, attending to its nature, in the corresponding items of the consolidated income statements.
The consolidated insurance entities of the BBVA Group recognize the amounts of the premiums written to the income statement and a charge for the estimated cost of the claims that will be incurred at their final settlement to their income statements. At the close of each year the amounts collected and unpaid, as well as the costs incurred and unpaid, are accrued.
The most significant provisions registered by consolidated insurance entities with respect to insurance policies issued by them are set out by their nature in Note 24.
According to the type of product, the provisions may be as follows:
| — | Life insurance provisions: |
Represents the value of the net obligations undertaken with the life insurance policyholder. These provisions include:
| | - | | Provisions for unearned premiums. These are intended for the accrual, at the date of calculation, of the premiums written. Their balance reflects the portion of the premiums accrued until the closing date that has to be allocated to the period from the closing date to the end of the insurance policy period. |
| | - | | Mathematical reserves: Represents the value of the life insurance obligations of the insurance entities at year-end, net of the policyholder’s obligations, arising from life insurance contracted. |
| — | Non-life insurance provisions: |
| | - | | Provisions for unearned premiums. These provisions are intended for the accrual, at the date of calculation, of the premiums written. Their balance reflects the portion of the premiums accrued until year-end that has to be allocated to the period between the year-end and the end of the policy period. |
| | - | | Provisions for unexpired risks: The provision for unexpired risks supplements the provision for unearned premiums by the amount by which that provision is not sufficient to reflect the assessed risks and expenses to be covered by the insurance entities in the policy period not elapsed at year-end. |
F-29
This reflects the total amount of the outstanding obligations arising from claims incurred prior to year-end. Insurance entities calculate this provision as the difference between the total estimated or certain cost of the claims not yet reported, settled or paid, and the total amounts already paid in relation to these claims.
| — | Provision for bonuses and rebates: |
This provision includes the amount of the bonuses accruing to policyholders, insurees or beneficiaries and the premiums to be returned to policyholders or insurees, as the case may be, based on the behavior of the risk insured, to the extent that such amounts have not been individually assigned to each of them.
| — | Technical provisions for reinsurance ceded: |
Calculated by applying the criteria indicated above for direct insurance, taking account of the assignment conditions established in the reinsurance contracts in force.
| — | Other technical provisions: |
Insurance entities have recognized provisions to cover the probable mismatches in the market reinvestment interest rates with respect to those used in the valuation of the technical provisions.
The BBVA Group controls and monitors the exposure of the insurance entities to financial risk and, to this end, uses internal methods and tools that enable it to measure credit risk and market risk and to establish the limits for these risks.
2.2.10 Tax assets and liabilities
Expenses on corporate income tax applicable to the BBVA Group’s Spanish entities and on similar income taxes applicable to consolidated foreign entities are recognized in the consolidated income statement, except when they result from transactions on which the profits or losses are recognized directly in equity, in which case the related tax effect is also recognized in equity.
The total corporate income tax expense is calculated by aggregating the current tax arising from the application of the corresponding tax rate to the tax for the year (after deducting the tax credits allowable for tax purposes) and the change in deferred tax assets and liabilities recognized in the consolidated income statement.
Deferred tax assets and liabilities include temporary differences, defined as the amounts to be payable or recoverable in future years arising from the differences between the carrying amount of assets and liabilities and their tax bases (the “tax value”), and tax loss and tax credit carry forwards. These amounts are calculated by applying to each temporary difference the income tax rate that is expected to be applied when the asset is realized or the liability settled (see Note 21).
The “Tax Assets” chapter of the accompanying consolidated balance sheets includes the amount of all the assets of a tax nature, and distinguishes between: “Current” (amounts recoverable by tax in the next twelve months) and “Deferred” (covering taxes recoverable in future years, including loss carry forwards or tax credits for deductions and tax rebates pending application).
The “Tax Liabilities” line item in the accompanying consolidated balance sheets includes the amount of all the liabilities of a tax nature, except for provisions for taxes, broken down into: “Current” (income tax payable on taxable profit for the year and other taxes payable in the next twelve months) and “Deferred” (income taxes payable in subsequent years).
Deferred tax liabilities attributable to taxable temporary differences associated with investments in subsidiaries, associates or joint venture entities are recognized as such, except where the Group can control the timing of the reversal of the temporary difference and it is unlikely that it will reverse in the foreseeable future.
Deferred tax assets are recognized to the extent that it is considered probable that the consolidated entities will have sufficient taxable profits in the future against which the deferred tax assets can be utilized and are not from the initial recognition (except in the case of a business combination) of other assets or liabilities in a transaction that does not affect the fiscal outcome or the accounting result.
The deferred tax assets and liabilities recognized are reassessed by the consolidated entities at each balance sheet date in order to ascertain whether they are still current, and the appropriate adjustments are made on the basis of the findings of the analyses performed.
F-30
The income and expenses directly recognized in equity that do not increase or decrease taxable income are accounted for as temporary differences.
2.2.11 Provisions, contingent assets and contingent liabilities
The heading “Provisions” in the consolidated balance sheets includes amounts recognized to cover the BBVA Group’s current obligations arising as a result of past events. These are certain in terms of nature but uncertain in terms of amount and/or settlement date. The settlement of these obligations is deemed likely to entail an outflow of resources embodying economic benefits (see Note 25). The obligations may arise in connection with legal or contractual provisions, valid expectations formed by Group entities relative to third parties in relation to the assumption of certain responsibilities or through virtually certain developments of particular aspects of the regulations applicable to the operation of the entities; and, specifically, future legislation to which the Group will certainly be subject.
The provisions are recognized in the consolidated balance sheets when each and every one of the following requirements is met:
| — | They represent a current obligation that has arisen from a past event; |
| — | At the date referred to by the consolidated financial statements, there is more probability that the obligation will have to be met than that it will not; |
| — | It is probable that an outflow of resources embodying economic benefits will be required to settle the obligation; and |
| — | The amount of the obligation can be reasonably estimated. |
Among other items, these provisions include the commitments made to employees by some of the Group entities (mentioned in section 2.2.12), as well as provisions for tax and legal litigation.
Contingent assets are possible assets that arise from past events and whose existence is conditional on, and will be confirmed only by, the occurrence or non-occurrence of events beyond the control of the Group. Contingent assets are not recognized in the consolidated balance sheet or in the consolidated income statement; however, they are disclosed in the Notes to the financial statements, provided that it is probable that these assets will give rise to an increase in resources embodying economic benefits (see Note 36).
Contingent liabilities are possible obligations of the Group that arise from past events and whose existence is conditional on the occurrence or non-occurrence of one or more future events beyond the control of the entity. They also include the existing obligations of the entity when it is not probable that an outflow of resources embodying economic benefits will be required to settle them; or when, in extremely rare cases, their amount cannot be measured with sufficient reliability.
2.2.12 Pensions and other post-employment commitments
Below is a description of the most significant accounting criteria relating to the commitments to employees, in terms of post-employment benefits and other long-term commitments, of certain BBVA Group entities in Spain and abroad (see Note 26 ).
Commitments valuation: assumptions and actuarial gains/losses recognition
The present values of the commitments are quantified based on an individual basis. For current employees costs are calculated using the projected unit credit method, which sees each period of service as giving rise to an additional unit of benefit/commitment and measures each unit separately to build up the final obligation.
The actuarial assumptions should take into account that:
| — | They are unbiased, in that they are not unduly aggressive nor excessively conservative. |
| — | They are compatible with each other and adequately reflect the existing economic relations between factors such as inflation, foreseeable wage increases, discount rates and the expected return on plan assets, etc. The future levels of wages and benefits are based on market expectations at the consolidated balance sheet date for the period over which the obligations are to be settled. |
| — | The rate used to discount the commitments is determined by reference to market yields at the date referred to by the consolidated financial statements on high quality bonds. |
F-31
The BBVA Group recognizes actuarial differences originating in the commitments assumed with staff taking early retirement, benefits awarded for seniority and other similar items under the heading “Provisions (net)” of the consolidated income statement for the period (see Note 48) in which these differences occur. The BBVA Group recognizes the actuarial gains or losses arising on all other defined-benefit post-employment commitments directly under the heading “Valuation adjustments” of equity in the accompanying consolidated balance sheets (see Note 31).
Post-employment benefit commitments
Pensions
The BBVA Group’s post-employment benefit commitments are either defined-contribution or defined-benefit.
| — | Defined-contribution commitments: The amounts of these commitments are established as a percentage of certain remuneration items and/or as a fixed pre-established amount. The contributions made in each period by the BBVA Group’s entities for these commitments are recognized with a charge to the heading “Personnel expenses - Defined-contribution plan expense” in the consolidated income statements (see Note 46.1). |
| — | Defined-benefit commitments: Some of the BBVA Group’s entities have defined-benefit commitments for the permanent disability and death of certain current employees and early retirees, as well as defined-benefit retirement commitments applicable only to certain groups of current employees, or employees taking early retirement and retired employees. These commitments are either funded by insurance contracts or recognized as internal provisions. |
The amounts recognized under the heading “Provisions – Provisions for pensions and similar obligations” (see Note 25) are the differences, at the date of the consolidated financial statements, between the present values of the commitments for defined-benefit commitments, adjusted by the past service cost, and the fair value of plan assets.
The current contributions made by the Group’s entities for defined-benefit commitments covering current employees are charged to the heading “Administration cost - Personnel expenses” in the accompanying consolidated income statements (see Note 46.1).
Early retirement
The BBVA Group has offered certain employees in Spain the option of taking early retirement (that is earlier than the age stipulated in the collective labor agreement in force) and has recognized the corresponding provisions to cover the cost of the commitments acquired for this item. The present values of early retirement obligations are quantified based on an individual member data and are recognized under the heading “Provisions – Provisions for pensions and similar obligations” in the accompanying consolidated balance sheets (see Note 25).
The early retirement commitments in Spain include the compensation and indemnities and contributions to external pension funds payable during the period of early retirement. The commitments relating to this group of employees after they have reached normal retirement age are dealt with in the same way as pensions.
Other post-employment welfare benefits
Some of the BBVA Group’s entities have welfare benefit commitments whose effects extend beyond the retirement of the employees entitled to the benefits. These commitments relate to certain current employees and retirees, depending upon the employee group to which they belong.
The present values of post-employment welfare benefits are quantified based on an individual member data and are recognized under the heading “Provisions – Provisions for pensions and similar obligations” in the consolidated balance sheets (see Note 25).
Other long-term commitments to employees
Some of the BBVA Group’s entities are obliged to deliver goods and services to groups of employees. The most significant of these, in terms of the type of compensation and the event giving rise to the commitments, are as follows: loans to employees, life insurance, study assistance and long-service awards.
Some of these commitments are measured using actuarial studies, so that the present values of the vested obligations for commitments with personnel are quantified based on an individual member data. They are recognized under the heading “Provisions – Other provisions” in the accompanying consolidated balance sheets (see Note 25).
F-32
The cost of these benefits provided by Spanish entities in the BBVA Group to active employees are recognized under the heading “Personnel expenses - Other personnel expenses” in the consolidated income statements (see Note 46.1).
Other commitments for current employees accrue and are settled on a yearly basis, so it is not necessary to register a provision in this regard.
2.2.13 Equity-settled share-based payment transactions
Provided they constitute the delivery of such payments following the completion of a specific period of services, equity-settled share-based payment transactions are recognized as an expense for services being provided by employees, by way of a balancing entry under the heading “Stockholders’ equity – Other equity instruments” in the consolidated balance sheet. These services are measured at fair value, unless such fair value cannot be calculated reliably. In such case, they are measured by reference to the fair value of the equity instruments committed, taking into account the date on which the commitments were made and the terms and other conditions included in the commitments.
When the initial compensation agreement includes what may be considered market conditions among its terms, any changes in these conditions will not be reflected in the consolidated income statement, as these have already been accounted for in calculating the initial fair value of the equity instruments. Non-market vesting conditions are not taken into account when estimating the initial fair value of instruments, but they are taken into account when determining the number of instruments to be granted. This will be recognized on the consolidated income statement with the corresponding increase in equity.
2.2.14 Termination benefits
Termination benefits are recognized in the accounts when the BBVA Group agrees to terminate employment contracts with its employees and has established a detailed plan.
2.2.15 Treasury stock
The value of equity instruments issued by the BBVA Group’s entities and held by them - basically, shares and derivatives on the Bank’s shares held by some consolidated entities that comply with the requirements to be recognized as equity instruments - are recognized under the heading “Stockholders’ funds - Treasury stock” in the consolidated balance sheets (see Note 30).
These financial assets are recognized at acquisition cost, and the gains or losses arising on their disposal are credited or debited, as appropriate, to the heading “Stockholders’ funds - Reserves” in the consolidated balance sheets (see Note 29).
F-33
2.2.16 Foreign-currency transactions and exchange differences
The BBVA Group’s functional currency, and thus the currency in which the consolidated financial statements are presented, is the euro. All balances and transactions denominated in currencies other than the euro are deemed to be denominated in “foreign currency”.
Conversion to euros of the balances held in foreign currency is performed in two consecutive stages:
| — | Conversion of the foreign currency to the functional currency (currency of the main economic environment in which the entity operates); and |
| — | Conversion to euros of the balances held in the functional currencies of the entities whose functional currency is not the euro. |
Conversion of the foreign currency to the functional currency
Transactions denominated in foreign currencies carried out by the consolidated entities (or accounted for using the equity method) not based in European Monetary Union countries are initially accounted for in their respective currencies. Subsequently, the monetary balances in foreign currencies are converted to their respective functional currencies using the exchange rate at the close of the financial year.
In addition,
| — | Non-monetary items valued at their historical cost are converted to the functional currency at the exchange rate in force on the purchase date. |
| — | Non-monetary items valued at their fair value are converted at the exchange rate in force on the date on which such fair value was determined. |
| — | Income and expenses are converted at the period’s average exchange rates for all the operations carried out during the period. When applying this criterion the BBVA Group considers whether significant variations have taken place in exchange rates during the financial year which, owing to their impact on the statements as a whole, require the application of exchange rates as of the date of the transaction instead of such average exchange rates. |
The exchange differences produced when converting the balances in foreign currency to the functional currency of the consolidated entities and their subsidiaries are generally recognized under the heading “Exchange differences (net)” in the consolidated income statements. However, the exchange differences in non-monetary items, measured at fair value, are recognized temporarily in equity under the heading “Valuation adjustments - Exchange differences” in the consolidated balance sheets.
Conversion of functional currencies to euros
The balances in the financial statements of consolidated entities whose functional currency is not the euro are converted to euros as follows:
| — | Assets and liabilities: at the average spot exchange rates as of the date of each of the consolidated financial statements. |
| — | Income and expenses and cash flows are converted by applying the exchange rate in force on the date of the transaction, and the average exchange rate for the financial year may be used, unless it has undergone significant variations. |
| — | Equity items: at the historical exchange rates. |
The exchange differences arising from the conversion to euros of balances in the functional currencies of the consolidated entities whose functional currency is not the euro are recognized under the heading “Valuation adjustments – Exchange differences” in the consolidated balance sheets. Meanwhile, the differences arising from the conversion to euros of the financial statements of entities accounted for by the equity method are recognized under the heading “Valuation adjustments - Entities accounted for using the equity method” until the item to which they relate is derecognized, at which time they are recognized in the income statement.
The breakdown of the main consolidated balances in foreign currencies as of December 31, 2013, 2012 and 2011, with reference to the most significant foreign currencies, is set forth in Appendix VII.
F-34
2.2.17 Recognition of income and expenses
The most significant criteria used by the BBVA Group to recognize its income and expenses are as follows.
| — | Interest income and expenses and similar items: |
As a general rule, interest income and expenses and similar items are recognized on the basis of their period of accrual using the effective interest rate method. The financial fees and commissions that arise on the arrangement of loans and advances (basically origination and analysis fees) are deferred and recognized in the income statement over the expected life of the loan. The direct costs incurred in originating these loans and advances can be deducted from the amount thus recognized. These fees are part of the effective rate for loans. Also dividends received from other entities are recognized as income when the consolidated entities’ right to receive them arises.
However, when a debt instrument is deemed to be impaired individually or is included in the category of instruments that are impaired because their recovery is considered to be remote, the recognition of accrued interest in the consolidated income statement is discontinued. This interest is recognized for accounting purposes as income, as soon as it is received.
| — | Commissions, fees and similar items: |
Income and expenses relating to commissions and similar fees are recognized in the consolidated income statement using criteria that vary according to the nature of such items. The most significant items in this connection are:
| | - | | Those relating to financial assets and liabilities measured at fair value through profit or loss, which are recognized when collected/paid. |
| | - | | Those arising from transactions or services that are provided over a period of time, which are recognized over the life of these transactions or services. |
| | - | | Those relating to single acts, which are recognized when this single act is carried out. |
| — | Non-financial income and expenses: |
These are recognized for accounting purposes on an accrual basis.
| — | Deferred collections and payments: |
These are recognized for accounting purposes at the amount resulting from discounting the expected cash flows at market rates.
2.2.18 Sales and income from the provision of non-financial services
The heading “Other operating income - Financial income from non-financial services” in the consolidated income statements includes the carrying amount of the sales of assets and income from the services provided by the Group entities that are not financial institutions. In the case of the Group, these entities are mainly real estate and service entities (see Note 45).
2.2.19 Leases
Lease contracts are classified as finance leases from the inception of the transaction, if they substantially transfer all the risks and rewards incidental to ownership of the asset forming the subject-matter of the contract. Leases other than finance leases are classified as operating leases.
When the consolidated entities act as the lessor of an asset in finance leases, the aggregate present values of the lease payments receivable from the lessee plus the guaranteed residual value (normally the exercise price of the lessee’s purchase option on expiration of the lease agreement) are recognized as financing provided to third parties and, therefore, are included under the heading “Loans and receivables” in the accompanying consolidated balance sheets.
When the consolidated entities act as lessors of an asset in operating leases, the acquisition cost of the leased assets is recognized under “Tangible assets – Property, plant and equipment – Other assets leased out under an operating lease” in the consolidated balance sheets (see Note 19). These assets are depreciated in line with the criteria adopted for items of tangible assets for own use, while the income arising from the lease arrangements is recognized in the consolidated income statements on a straight-line basis within “Other operating expenses - Other of other operating expenses” (see Note 45).
F-35
If a fair value sale and leaseback results in an operating lease, the profit or loss generated by the sale is recognized in the consolidated income statement at the time of sale. If such a transaction gives rise to a finance lease, the corresponding gains or losses are amortized over the lease period.
The assets leased out under operating lease contracts to other entities in the Group are treated in the consolidated financial statements as for own use, and thus rental expense and income is eliminated and the corresponding depreciation is recognize.
2.2.20 Entities and branches located in countries with hyperinflationary economies
In order to assess whether an economy is under hyperinflation, the country’s economic environment is evaluated, analyzing whether certain circumstances exist, such as:
| — | The country’s population prefers to keep its wealth or savings in non-monetary assets or in a relatively stable foreign currency; |
| — | Prices may be quoted in that currency; |
| — | Interest rates, wages and prices are linked to a price index; |
| — | The cumulative inflation rate over three years is approaching, or exceeds, 100%. |
The fact that any of these circumstances is present will not be a decisive factor in considering an economy hyperinflationary, but it does provide some reasons to consider it as such.
Since 2009, the economy of Venezuela can be considered hyperinflationary under the above criteria. As a result, the financial statements of the BBVA Group’s entities located in Venezuela (see Note 3) have therefore been adjusted to correct for the effects of inflation.
2.3 Recent IFRS pronouncements
Changes introduced in 2013
The following modifications to the IFRS standards or their interpretations (hereinafter “IFRIC”) came into force on January 1, 2013.
IFRS 10 – “Consolidated Financial Statements”, IFRS 11 - “Joint arrangements” and IFRS 12 - “Disclosure of interests in other entities”.
IFRS 10 establishes a single consolidation model based on the principle of control, and applicable to all types of entities. Likewise, it introduces a definition of control, according to which a reporting entity controls another entity when it is exposed or has rights to variable returns from its involvement with the entity and has the ability to affect the amount of returns through its power over the entity.
IFRS 10 modifies IAS 27 - “Consolidated and separate financial statements” (which will remain in effect solely for its guidance on separate financial statements) and will replace SIC 12 - “Consolidation - Special Purpose Entities” and is effective beginning on January 1, 2013.
IFRS 11 introduces new consolidation principles applicable to all joint arrangements and replaces SIC 13 - “Jointly Controlled Entities” and IAS 31 - “Interests in Joint Ventures”. The new standard will modify IAS 28 “Investments in Associates and Joint Ventures”, which will remain effective for associate and joint venture entities.
IFRS 11 defines joint arrangements and establishes that they shall be classified as joint operations or as joint ventures based on the rights and obligations arising from the arrangement. A joint operation is defined as an operation where the parties who have joint control have rights to the assets of the arrangement and obligations to the liabilities of the arrangement. A joint venture is defined as a venture where the parties who have joint control have rights to the net assets of the arrangement.
Joint operations shall be accounted for by including in the financial statements of the controlling entities the assets, liabilities, income and expenses corresponding to them according to the contractual agreement. Joint ventures shall be accounted for in the consolidated financial statements using the equity method. They can no longer be accounted for by the proportionate consolidation method.
IFRS 12 is a new standard on the disclosure requirements for all types of holdings in other entities, including subsidiaries, joint arrangements, associates and unconsolidated structured entities.
F-36
IFRS 10, 11 and 12 will be applied beginning on January 1, 2013. The adoption of these standards by the European Union allows for its application by January 1, 2014 at the latest. However, early adoption is permitted. In this case it must be applied all together. ).
IFRS 13 - “Fair value measurement”
IFRS 13 provides guidelines for fair value measurement and disclosure requirements. Under the new definition, fair value is the price that would be received to sell an asset or paid to transfer a liability in an orderly transaction between market participants at the measurement date.
The requirements do not modify the existing criteria to recognize an asset or liability at fair value. However, they do provide a guide about how fair value should be measured when its use is required or permitted by other standards. The main impact of IFRS 13 for the BBVA Group is related to credit risk valuation of derivative positions; both asset “Credit Valuation Adjustment” (CVA) and liability “Debit Valuation Adjustment” (DVA). The impact in the Group’s Income Statement as of December 31, 2013 is not material.
Amended IAS 1 – “Presentation of financial statements”
The modifications made to IAS 1 include improvements and clarifications regarding the presentation of “Other comprehensive income” (valuation adjustments). The main change introduced is that the presentation of the items must distinguish those that can be reclassified to earnings in the future from those that cannot.
Pursuant to this standard, the consolidated statement of recognized income and expenses has been modified.
Amended IAS 19 – “Employee benefits”
The amended IAS 19 introduces modifications to the accounting of post-employment benefit liabilities and commitments.
| — | All changes in the fair value of assets from post-employment plans and obligations in the defined benefit plans shall be recognized in the period in which they occur; they shall be recognized as valuation adjustments in equity and shall not be considered as earnings in future years. |
| — | The presentation of fair value changes in assets in plans and changes in post-employment benefit obligations of defined-benefit plans has been clarified. |
| — | Greater disclosure of information is required. |
The application of IAS 19 by the BBVA Group has had no significant impact on the accompanying financial statements as of December 31, 2013. The disclosures have been adapted to the new requirements.
Fourth annual improvements project for various IFRS
Fourth IFRS Annual Improvements project introduces small modifications and clarifications to IAS 1 - Presentation of financial statements, IAS 16 – Property, plant and equipment, IAS 32 – Financial instruments: presentation and IAS 34 - Interim financial reporting.
Amended IFRS 7 – “Financial Instruments: Information to be disclosed”
The changes made to IFRS 7 introduce new disclosures of information on asset and liability offsetting. Entities must submit a breakdown of information on the gross and net amounts of those financial assets that have been or may be offset, and for all recognized financial instruments included in some type of master offset agreement, regardless of whether they have been netted or not.
Standards and interpretations issued but not yet effective as of December 31, 2013
New International Financial Reporting Standards together with their interpretations had been published at the date of preparation of the accompanying consolidated financial statements, but are not obligatory as of December 31, 2013. Although in some cases the IASB permits early adoption before they come into force, the BBVA Group has not done so as of this date, as it is still analyzing the effects that will result from them.
IFRS 9 - “Financial instruments”
IFRS 9 will replace IAS 39. At present, chapters related to classification, valuation and hedging have been issued (pending chapters of impairment), There new standard introduces significant differences with respect to the current regulation with regards to financial assets; among others, the approval of a new classification model
F-37
based on two single categories of amortized cost and fair value, the elimination of the current “Held-to-maturity-investments” and “Available-for-sale financial assets” categories, impairment analyses only for assets measured at amortized cost and non-separation of embedded derivatives in contracts of financial assets.
With regard to financial liabilities, the classification categories proposed by IFRS 9 are similar to those currently contained in IAS 39, so there should not be very significant differences save for the requirement to recognize changes in fair value related to own credit risk as a component of equity, in the case of financial liabilities designated at fair value through profit or loss. Hedge accounting requirements also differs from the current IAS 39 due to the new focus on the economic risk management.
Amended IAS 32 – “Financial Instruments: Presentation”
The changes made to IAS 32 clarify the following aspects on asset and liability offsetting:
| — | The legal right to net recognized amounts must not depend on a future event and must be legally enforceable under all circumstances, including cases of default or insolvency of either party. |
| — | Settlements in which the following conditions are met shall be accepted as equivalent to “settlements for net amount”: all, or practically all of the credit and liquidity risk is eliminated; and the settlement of the assets and liabilities is carried out in a single settlement process. |
These modifications will be applied to the accounting years starting on or after January 1, 2014, although early adoption is permitted.
Amended IFRS 10 - “Consolidated Financial Statements”, Amended IFRS 12 – “Disclosure of interests in other entities” and Amended IAS 27 – “Consolidated and separate financial statements”
The changes to IFRS 10, IFRS 12 and IAS 27 define investment entities and provide an exception to the consolidation requirements requiring investment entities to measure particular subsidiaries at fair value through profit or loss, rather than consolidate them as per IFRS 9.
However, the parent company of an investment entity must consolidate all entities under its control, including those controlled through an investment entity, unless the parent company is also an investment entity.
Furthermore, these amendments include new disclosures that will allow the users of such information to evaluate the nature and financial impact of these investments made through investment entities.
These modifications will be applied to the accounting years starting on or after January 1, 2014, although early adoption is permitted.
IFRIC 21 “Levies”
This Interpretation addresses the accounting for a liability to pay a levy if that liability is within the scope of IAS 37. It also addresses the accounting for a liability to pay a levy whose timing and amount is certain.
Consequently, the obligating event will be recognized when the obligation to pay the levy is triggered. If the obligating event is the reaching of a minimum activity threshold, such as a minimum amount of revenue or sales generated or outputs produced, the corresponding liability is recognized when that minimum activity threshold is reached.
This interpretation does not affect the treatment of those taxes ruled by other IAS standards (for example, Income Tax) nor penalties or sanctions due to other regulatory breaches.
These modifications will be applied to the accounting years starting on or after January 1, 2014, although early adoption is permitted.
Amended IAS 36 - “Impairment of Assets”
The changes made to IAS 36 remove the requirement to disclose the recoverable amount of each cash-generating unit (group of units) for which the carrying amount of goodwill or intangible assets with indefinite useful lives allocated to that unit (group of units) is significant when compared to the entity’s total carrying amount of goodwill or intangible assets with indefinite useful lives, and, on the other hand, require that entities disclose the recoverable amount of an individual asset (including goodwill) or a cash-generating unit for which the entity has recognized or reversed an impairment loss during the reporting period. Furthermore, additional disclosures of information will be required when the recoverable amount is the same as the fair value less costs of disposal.
F-38
These modifications will be applied to the accounting years starting on or after January 1, 2014, although early adoption is permitted.
Amended IAS 39 - “Financial Instruments: Recognition and measurement. Novation of Derivatives and Continuation of Hedge Accounting”
The new IAS 39 introduces an exception to the requirement to discontinue hedge accounting for those novations that, as a consequence of a change in law or regulation, replace the original counterparty of the hedging element for a central counterparty of another entity, such as the clearing house, as long as the change does not result in changes to the terms of the original derivative other than changes directly attributable to the change in counterparty.
These modifications will be applied to the accounting years starting on or after January 1, 2014, although early adoption is permitted.
Amended IAS 19 - “Employee Benefits. Defined Benefit Plans: Employee Contributions”
The new IAS 19 amends the accounting requirements for contributions to defined benefit plans to permit to recognize these contributions as a reduction in the service cost in the same period where they are paid if they meet certain requirements, without the need for calculations to attribute the contributions to the periods of service.
These modifications will be applied to the accounting years starting on or after July 1, 2014, although early adoption is permitted.
Annual Improvements to IFRSs 2010-2012 Cycle
Annual Improvements to IFRSs 2010-2012 Cycle introduces small modifications and clarifications to IFRS 2 - Share-based Payment, IFRS 3 - Business Combinations, IFRS 8 - Operating Segments, IFRS 13 - Fair Value Measurement, IAS 16 - Property, Plant and Equipment, IAS 24 – Related Party Disclosures and IAS 38 - Intangible Assets.
These modifications will be applied to the accounting years starting on or after July 1, 2014, although early adoption is permitted.
Annual Improvements to IFRSs 2011-2013 Cycle
Annual Improvements to IFRSs 2011-2013 Cycle introduces small modifications and clarifications to IFRS 1 - First-time Adoption of IFRSs, IFRS 3 - Business Combinations, IFRS 13 - Fair Value Measurement and IAS 40 - Investment Property.
These modifications will be applied to the accounting years starting on or after July 1, 2014, although early adoption is permitted.
The BBVA Group is an international diversified financial group with a significant presence in retail banking, wholesale banking, asset management and private banking. The Group also operates in other sectors such as insurance, real estate, operational leasing, etc.
Appendices I and II provide relevant information as of December 31, 2013 on the Group’s subsidiaries, consolidated structured entities, and investments and joint venture entities accounted for by the equity method. Appendix III shows the main changes in investments for the year ended December 31, 2013, and Appendix IV gives details of the subsidiaries under the full consolidation method and which, based on the information available, are more than 10% owned by non-Group shareholders as of December 31, 2013.
F-39
The following table sets forth information related to the Group’s total assets as of December 31, 2013, 2012 and 2011, broken down by the Group’s entities according to their activity:
| | | | | | | | | | | | |
| | | | | | | Millions of Euros | | |
| | | | | | | Total Assets Contributed to the Group | | |
| | | Contribution to Consolidated Group. Entities by Main Activities | | | | 2013 | | 2012 | | 2011 | | |
| | | Banks and other financial services | | | | 556,294 | | 593,824 | | 563,260 | | |
| | | Insurance and pension fund managing companie | | | | 20,023 | | 20,481 | | 17,033 | | |
| | | Other non-financial services | | | | 6,258 | | 6,766 | | 2,545 | | |
| | | Total | | | | 582,575 | | 621,072 | | 582,838 | | |
| | | | | | | | | | | | | |
The total assets and earnings as of December 31, 2013, 2012 and 2011 broken down by the geographical areas in which the BBVA Group operates, are included in Note 6.
The BBVA Group’s activities are mainly located in Spain, Mexico, South America and the United States, with an active presence in other countries, as shown below:
The Group’s activity in Spain is mainly through Banco Bilbao Vizcaya Argentaria, S.A., which is the parent company of the BBVA Group. The Group also has other entities that operate in Spain’s banking sector, insurance sector, real estate sector, services and as operational leasing entities.
The BBVA Group operates in Mexico, not only in the banking sector, but also in the insurance sector through Grupo Financiero Bancomer.
The BBVA Group’s activities in South America are mainly focused on the banking and insurance sectors, in the following countries: Argentina, Chile, Colombia, Peru, Paraguay, Uruguay and Venezuela. It has a representative office in Sao Paulo (Brazil).
The Group owns more than 50% of most of the entities based in these countries. Appendix I shows a list of the entities which, although less than 50% owned by the BBVA Group as of December 31, 2013, are fully consolidated (see Note 2.1).
The Group’s activity in the United States is mainly carried out through a group of entities with BBVA Compass Bancshares, Inc. at their head, the New York branch and a representative office in Silicon Valley (California).
In March 2011, the BBVA Group acquired 25.01% of the share capital of the Turkish bank Turkiye Garanti Bankasi, AS (hereinafter, “Garanti”, see Note 17). Garanti heads up a group of banking and financial institutions that operate in Turkey, Holland and some countries in Eastern Europe. BBVA also has a representative office in Istanbul.
The Group’s activity in Europe is carried out through banks and financial institutions in Ireland, Switzerland, Italy and Portugal, operational branches in Germany, Belgium, France, Italy and the United Kingdom, and a representative office in Moscow.
F-40
The Group’s activity in this region is carried out through operational branches (in Taipei, Seoul, Tokyo, Hong Kong and Singapore) and representative offices (in Beijing, Shanghai, Mumbai, Abu Dhabi and Sydney). In addition, the BBVA Group holds a stake in CITIC Group (hereinafter, “CITIC”) that includes investments in Citic International Financial Holdings Limited (hereinafter, “CIFH”) (see Note 17).
Changes in the Group in 2013
Purchase of Unnim Vida
On February 1, 2013, Unnim Banc, S.A. reached an agreement with Aegon Spain Holding B.V. to acquire the 50% of Unnim Vida, Inc. Insurance and Reinsurance (“Unnim Vida”) for a price of€352 million. Thus, the BBVA Group owned 100% of the stake of “Unnim Vida.
Sale of BBVA Panama
On July 20, 2013, BBVA announced that it had reached an agreement with the entity Leasing Bogotá S.A., Panamá, a subsidiary of Grupo Aval Acciones y Valores, S.A., for the sale of the direct and indirect ownership interest (98.92%) in Banco Bilbao Vizcaya Argentaria (Panamá), S.A. (“BBVA Panamá”).
On December 19, 2013, after having obtained the necessary approvals, BBVA completed the sale.
The total consideration that BBVA received pursuant to this sale amounted to approximately $645 million,€505 million as sale price and€140 million as distribution of dividends by BBVA Panamá from June 1, 2013.
BBVA received part of the consideration through the distribution of dividends from BBVA Panamá amounting to $140 million prior to closing (such amount has consequently reduced the purchase price to be paid to BBVA on closing).
After deducing such distribution of dividends the capital gain gross of taxes amounted to approximately€230 million which was recognized under the heading “Gains (losses) on non-current assets held for sale not classified as discontinued operations” in the consolidated income statement in 2013 (see Note 52.1).
Sale of pension businesses in Latin America
On May 24, 2012 BBVA announced its decision to conduct a study on strategic alternatives for its pension business in Latin America. The alternatives considered in this process include the total or partial sale of the businesses of the Pension Fund Administrators (AFP) in Chile, Colombia and Peru, and the Retirement Fund Administrator (Afore) in Mexico.
On October 2, 2013, with the sale of “AFP Provida” (Administradora de Fondos de Pensiones AFP Provida de Chile), BBVA finalized the process. Below there is a description of each of the operations that have been carried out during this process:
Sale of AFP Provida (Chile)
On February 1, 2013, BBVA reached an agreement with MetLife, Inc., for the sale of the 64.3% stake that BBVA held direct and indirectly in the Chilean Pension Fund manager Administradora de Fondos de Pensiones Provida SA (“AFP Provida”).
On October 2, 2013, BBVA completed the sale. The total amount in cash received by BBVA was approximately 1,540 million U.S. dollars (“USD”), taking into account the purchase price amounting to roughly 1,310 million USD as well as the dividends paid by AFP Provida since February 1, 2013 amounting to roughly 230 million USD. The gain on disposal, attributable to the Parent company net of taxes, amounted to approximately€500 million which was recognized under the heading “Profit from discontinued operations (Net)” in the consolidated income statement in 2013 (see Note 52.2).
F-41
Sale of BBVA AFP Horizonte S.A. (Peru)
On April 23, 2013, BBVA sold a wholly owned Peruvian subsidiary “AFP Horizonte SA” to “AFP Integra SA” and “Profuturo AFP, SA” who have each acquired 50% of said company.
The total consideration paid for the shares is approximately US$ 544 million. This consideration is composed by a price of approximately US$ 516 million and a dividend distributed prior to the closing of approximately US$ 28 million.
The gain on disposal, attributable to parent company net of taxes, amounted to approximately€206 million at the moment of the sale and such gain was recognized under the heading “Profit from discontinued operations (Net)” in the consolidated income statement in 2013 (see Note 52.2).
Sale of BBVA AFP Horizonte S.A. (Colombia)
On December 24, 2012, BBVA reached an agreement with Sociedad Administradora de Fondos de Pensiones y Cesantías Porvenir, S.A., a subsidiary of Grupo Aval Acciones y Valores, S.A., for the sale to the former of the total stake that BBVA held directly or indirectly in the Colombian company BBVA Horizonte Sociedad Administradora de Fondos de Pensiones y Cesantías S.A.
On April 18, 2013, after having obtained the necessary approvals, BBVA completed the sale. The adjusted total price was US$ 541.4 million. The gain on disposal, attributable to parent company net of taxes, amounted to approximately€255 million at the moment of the sale, and was recognized under the heading “Profit from discontinued operations (Net)” in the consolidated income statement in 2013 (see Note 52.2).
Sale of Afore Bancomer (Mexico)
On November 27, 2012, BBVA reached an agreement to sell to Afore XXI Banorte, S.A. de C.V. its entire stake directly or indirectly held in the Mexican subsidiary Administradora de Fondos para el Retiro Bancomer, S.A. de C.V.
Once the corresponding authorization had been obtained from the competent authorities, the sale was closed on January 9, 2013, at which point the BBVA Group no longer had control over the subsidiary sold.
The total sale price was USD 1,735 million (approximately€1,327 million). The gain on disposal, attributable to parent company net of taxes, was approximately€771 million. (see Note 52.2).
New agreement with Citic Group
As of October 21, 2013, BBVA reached a new agreement with the Citic Group that included among other aspects the sale of its 5.1% stake in China Citic Bank Corporation Limited (CNCB) to Citic Limited for an amount of approximately€944 million, after this sale, the stake of BBVA in CNCB was reduced to the 9.9%.
Simultaneously, BBVA and the Citic Group agreed to adapt their strategic cooperation agreement to the new situation, removing the exclusivity obligations that affected the activities of BBVA in the PRC, and agreeing to negotiate new areas of cooperation among both banks, as BBVA’s current intention is to remain a key long term investor in CNCB.
In accordance with IFRS 11, the new situation implies a change in the accounting criteria applied to the participation of BBVA in CNCB, being now a no material financial participation recognized under the heading “Available-for-sale financial assets” (see Note 12).
As a result of this change in the accounting criteria and the mentioned sale, the loss attributable to the BBVA Group at the time of the sale amounted to approximately€2,600 million which was recognized under the heading “Gains (losses) on derecognized assets not classified as non-current assets held for sale” in the consolidated income statement in 2013 (see Note 51).
F-42
Changes in the Group in 2012
Acquisition of Unnim
On March 7, 2012, the Governing Board of the Fund for Orderly Bank Restructuring (FROB) awarded BBVA Unnim Banc, S.A. (hereinafter “Unnim”).
This was done through a share sale purchase agreement between FROB, the Credit Institution Deposit Guarantee Fund (hereinafter “FGD”) and BBVA, under which BBVA was to purchase 100% of the shares of Unnim for€1.
A Protocol of Financial Support Measures was also concluded for the restructuring of Unnim. This regulates an asset protection scheme (EPA) whereby the FGD will assume 80% of the losses that may be incurred on a portfolio of predetermined Unnim assets for the next 10 years.
On July 27 2012, following the completion of the transaction, Unnim became a wholly owned subsidiary of BBVA.
Sale of the business in Puerto Rico
On June 28, 2012, BBVA reached an agreement to sell its business in Puerto Rico to Oriental Financial Group Inc.
This agreement included the sale of 100% of the common stock of BBVA Securities of Puerto Rico, Inc. and BBVA PR Holding Corporation, which in turn owned 100% of the common stock of Banco Bilbao Vizcaya Argentaria Puerto Rico and of BBVA Seguros Inc.
Once the corresponding authorization had been obtained from the competent authorities, the sale closed on December 18, 2012, at which point the BBVA Group no longer had control over the businesses.
The sale price was USD 500 million (around€385 million at the exchange rate on the transaction date). Gross losses from the sale were around€15 million (taking into account the exchange rate at the transaction date and the earnings of these entities up to December 18, 2012). These capital losses are recognized under the heading “Gains (losses) on non-current assets held for sale not classified as discontinued operations” in the consolidated income statement for 2012 (see Note 51).
Changes in the Group in 2011
Acquisition of a capital holding in the bank Garanti
On March 22, 2011, BBVA bought 24.89% of the capital stock of Turkiye Garanti Bankasi, AS (Garanti) from the Dogus Group. It subsequently bought from the open market an additional 0.12% , increasing the BBVA Group’s total stake in the common stock of Garanti to 25.01%. The total price of both acquisitions amounted to USD 5,876 million (€4,140 million, taking into account the hedging derivatives contracted to hedge the deal’s euro/dollar exchange-rate risk).The agreements with the Dogus group include an arrangement for the joint management of Garanti and the appointment of some of the members of its Board of Directors by the BBVA Group. BBVA also has a perpetual option to purchase an additional 1% of Garanti Bank five years after the initial purchase. Beginning January 1, 2013, 25,01% participation in Garanti accounted into the BBVA Group via the equity method (see Note 17), in accordance with the new IFRS 10 and IFRS 11.
F-43
| 4. | Shareholder remuneration system and allocation of earnings |
Shareholder remuneration system
A shareholder remuneration system called the “Dividend Option” was implemented in 2011 and 2012. The Bank’s Shareholders’ Annual General Meeting held on March 15, 2013 once more approved the establishment of the “Dividend Option” program for 2013, through two share capital increases charged to voluntary reserves, under similar conditions to those established in 2011 and 2012. Under this remuneration scheme, BBVA offers its shareholders the chance to receive part of their remuneration in the form of free shares; however, they can still choose to receive it in cash by selling the rights assigned to them in each capital increase either to BBVA (by the Bank exercising its commitment to purchase the free assignment rights) or on the market.
In April 2013, the Executive Committee approved the execution of the first of the capital increases charged to reserves as agreed by the AGM held on March 15, 2013 to implement the Dividend Option. As a result of this increase, the Bank’s common stock increased by€40,862,919.86, (83,393,714 shares at a€0.49 par value each). 85.71% of shareholders opted to receive their remuneration in the form of shares (see Note 27). The other 14.29% of the right owners opted to sell the rights assigned to them to BBVA, and as a result, BBVA acquired 778,801,510 rights for a total amount of€94,234,982.71; said shareholders were rewarded in cash form.
In October 2013, the Executive Committee approved the execution of the second of the capital increases charged to reserves as approved during the AGM held on March 15, 2013 to implement the Dividend Option. As a result of this increase, the Bank’s common stock increased by€30,197,696.48, (61,627,952 shares at a€0.49 par value each). 88.28% of shareholders opted to receive their remuneration in the form of shares (see Note 27). The other 11.72% of the right owners opted to sell the rights assigned to them to BBVA, and as a result, BBVA acquired 670,834,333 rights for a total amount of€66,412,598.97; said shareholders were rewarded in cash form.
Dividends
At its meeting of June 24, 2013, the Board of Directors of BBVA approved the payment of an interim dividend against 2013 earnings of€0.10 gross (€0.079 net) per outstanding share to be paid on July 10, 2013.
The expected financial statements prepared in accordance with legal requirements evidenced the existence of sufficient liquidity for the distribution of the amounts to the interim dividend, as follows:
| | | | | | | | |
| | | | | Millions of Euros | | |
| | | Available amount for interim dividend payments | | May 31, 2013 | | | | |
| | | Profit of BBVA, S.A. at each of the dates indicated, after the provision for income tax | | 1,639 | | | | |
| | | Less - | | | | | | |
| | | Estimated provision for Legal Reserve | | (8) | | | | |
| | | Acquisition by the bank of the free allotment rights in 2013 capital increase | | (94) | | | | |
| | | Maximum amount distributable | | 1,537 | | | | |
| | | Amount of proposed interim dividend | | 553 | | | | |
| | | | | | | | | |
| | | BBVA cash balance available to the date | | 1,129 | | | | |
| | | | | | | | | |
The first amount interim dividend which was paid to the shareholders on January 10, 2013, including the new shares issued on July 3 through the capital increase described in Note 27 and after deducting the treasury shares held by the Group’s entities, amounted to€570 million
F-44
The allocation of earnings for 2013 subject to the approval of the Board of Directors at the Annual Shareholders Meeting is presented below:
| | | | | | |
| | | | | | | |
| | | | | Millions of Euros | | |
| | | Allocation of Earnings | | 2013 | | |
| | | Profit for year (*) | | 1,406 | | |
| | | Distribution: | | | | |
| | | Interim dividends | | 572 | | |
| | | Acquisition by the bank of the free allotment rights(**) | | 161 | | |
| | | Additional Tier 1 securities | | 35 | | |
| | | Legal reserve | | 33 | | |
| | | Voluntary reserves | | 605 | | |
| | | | | | | |
| | (*) | Net Income of BBVA S.A. (Appendix X). |
| | (**) | Concerning to the remuneration to shareholders who choose to be paid in cash through the “Dividend Option” |
In accordance with the criteria established by IAS 33:
| — | | Basic earnings per share are determined by dividing the “Profit attributable to Parent Company” by the weighted average number of shares outstanding throughout the year (i.e., excluding the average number of treasury shares held over the year). |
| — | | Diluted earnings per share are calculated by using a method similar to that used to calculate basic earnings per share; the weighted average number of shares outstanding, and the profit attributable to the parent company, if appropriate, is adjusted to take into account the potential dilutive effect of certain financial instruments that could generate the issue of new Bank shares (share option commitments with employees, warrants on parent company shares, convertible debt instruments, etc.). |
The following transactions were carried out in 2013 with an impact on the calculation of basic and diluted earnings per share:
| — | | The Bank issued additional share capital in 2013 (see Note 27). In accordance with IAS 33, when calculating the basic and diluted earnings per share, all years prior to the exercise of the rights must be taken into account, and a corrective factor applied to the denominator (the weighted average number of shares outstanding) only in the case of capital increases other than those for the conversion of securities into shares. This corrective factor is the result of dividing the fair value per share immediately before the exercise of rights by the theoretical ex-rights fair value per share. The basic and diluted earnings per share for 2012 and 2011 were recalculated on this basis. |
| — | | In 2013, the Bank agreed issued contingently convertible perpetual securities into ordinary shares of BBVA, without pre-emption rights, for a total amount of USD1.5 billion. Since the conversion of these perpetual securities will occur only if certain conditions are met, these shares are considered outstanding for purposes of basic earnings per share calculations only after all applicable conditions have been met. Until that point, they will be considered only for purposes of diluted earnings per share calculations. |
F-45
The calculation of earnings per share is as follows:
| | | | | | | | | | | | | | | | | | |
| | | | | | | | | | | | | | | | | | | |
| | | Basic and Diluted Earnings per Share | | | | 2013 | | | 2012 (*) | | | 2011 (*) | | | |
| | | | | | | | | | | | | | | | | | | |
| | | Numerator for basic and diluted earnings per share (millions of euros) | | | | | | | | | | | | | | | | |
| | | Profit attributable to parent company | | | | | 2,228 | | | | 1,676 | | | | 3,004 | | | |
| | | Adjustment: Mandatory convertible bonds interest expenses (1) | | | | | - | | | | 95 | | | | 38 | | | |
| | | Profit adjusted (millions of euros) (A) | | | | | 2,228 | | | | 1,771 | | | | 3,042 | | | |
| | | Profit from discontinued operations (net of non-controlling interest) (B) | | | | | 1,819 | | | | 319 | | | | 197 | | | |
| | | Denominator for basic earnings per share (number of shares outstanding) | | | | | | | | | | | | | | | | |
| | | Weighted average number of shares outstanding (2) | | | | | 5,597 | | | | 5,148 | | | | 4,635 | | | |
| | | Weighted average number of shares outstanding x corrective factor (3) | | | | | 5,597 | | | | 5,307 | | | | 4,959 | | | |
| | | Adjustment: Average number of estimated shares to be converted | | | | | - | | | | 315 | | | | 134 | | | |
| | | Adjusted number of shares - Basic earning per share (C) | | | | | 5,597 | | | | 5,622 | | | | 5,093 | | | |
| | | Adjustment: Average number of estimated shares to be converted due to perpetual securities | | | | | 95 | | | | - | | | | - | | | |
| | | Adjusted number of shares - diluted earning per share (D) | | | | | 5,692 | | | | 5,622 | | | | 5,093 | | | |
| | | Basic earnings per share from continued operations (Euros pershare)A-B/C | | | | | 0.07 | | | | 0.27 | | | | 0.58 | | | |
| | | Diluted earnings per share from continued operations (Euros pershare)A-B/D | | | | | 0.07 | | | | 0.27 | | | | 0.58 | | | |
| | | Basic earnings per share from discontinued operations (Euros per share)B/C | | | | | 0.33 | | | | 0.06 | | | | 0.04 | | | |
| | | Diluted earnings per share from discontinued operations (Euros per share)B/D | | | | | 0.32 | | | | 0.06 | | | | 0.04 | | | |
| | | | | | | | | | | | | | | | | | | |
| | (1) | Financial costs of convertible bonds that have been converted in June 2013. |
| | (2) | Weighted average number of shares outstanding (millions of euros), excluded weighted average of treasury shares during the period. |
| | (3) | Corrective factor, due to the capital increase with pre-emptive subscription right, applied for the previous years. |
| | (*) | Data recalculated due to the mentioned corrective factor. |
As of December 31, 2013, 2012 and 2011, except for the aforementioned contingently convertible perpetual securities, there were no other financial instruments or share option commitments with employees that could potentially affect the calculation of the diluted earnings per share for the years presented.
| 6. | Operating segment reporting |
Operating segment reporting represents a basic tool in the oversight and management of the BBVA Group’s various activities. The BBVA Group compiles reporting information on as disaggregated level as possible, and all data relating to the businesses these units manage is recognized in full. These minimum level units are then aggregated in accordance with the organizational structure determined by the BBVA Group management into higher level units and, ultimately, the reporting segments themselves.
Once the composition of each of the operating segments in the BBVA Group has been defined, certain management criteria are applied, noteworthy among which are the following:
| | - | Internal transfer prices: The calculation of the net interest income of each business is performed by applying the internal transfer rates to both the asset and liability entries. These rates are composed of a market rate that depends on the revision period of the operation, and a liquidity premium that aims to reflect the conditions and outlook of the financial markets. Earnings are distributed across revenue-generating and distribution units (e.g., in asset management products) at market prices. |
| | - | Allocation of operating expenses: Both direct and indirect expenses are allocated to the operating segments, except for those items for which there is no clearly defined or close link with the businesses, as they represent corporate or institutional expenses incurred on behalf of the Group as a whole. |
| | - | Cross-selling: On certain occasions, adjustments are made to eliminate overlap accounted for in the results of two or more units as a result of encouraging cross-selling between businesses. |
During 2013, progress was made in the structure of reporting by geography within the different business segments of the BBVA Group. In particular, Spain includes those portfolios, funding and structural positions of the Euro balance sheet that are managed by COAP, which were previously included in Corporate Activities. Additionally, given the peculiarity of its management, assets and income statement information related to the Spanish real estate business are presented separately, both in the case of real estate developers and foreclosed assets, previously included in Corporate Activities. As a result, the composition of the operating segments in 2013 is different from that presented in 2012 and 2011, and is now as follows:
F-46
| — | | Banking activity in Spain (from now on, Spain) which as in previous years includes). |
| | - | The Retail network, with the segments of individual customers, private banking, and small businesses |
| | - | Corporate and Business Banking (CBB), which handles the SMEs, corporations and public sector in the country. |
| | - | Corporate & Investment Banking (CIB), which includes business with large corporations and multinational groups and the trading floor and distribution business in the same geographical area |
| | - | Other units, among them BBVA Seguros and Asset Management (management of mutual and pension funds in Spain |
| | - | In addition, starting in 2013 it also includes the portfolios, finance and structural interest-rate positions of the euro balance sheet. |
| — | | Real estate activity in Spain |
This new operating segment has been set up with the aim of providing specialized and structured management of the assets of the real-estate area accumulated by the Group as a result of the crisis in Spain. It therefore mainly combines loans to real-estate developers (previously reported in Spain) and foreclosed real estate assets (previously reported in Corporate Activities).
As in 2012 includes the business carried out in the rest of Europe and Asia, i.e. the retail and wholesale businesses of the BBVA Group in the area. It also includes BBVA’s stakes in the Turkish bank Garanti and the Chinese banks CNCB and CIFH.
Comprising of the banking and insurance businesses. The banking business includes retail business through its Commercial Banking, Consumer Finance and Corporate and Institutional Banking units; and wholesale banking through CIB.
Encompasses the Group’s businesses in the United States. Historical data in this area has been reconstructed to exclude the business in Puerto Rico, which was sold in December 2012, and include it in the Corporate Center.
Includes the banking and insurance businesses that BBVA carries out in the region.
Finally, Corporate Center is an aggregate that contains the remainder of the items that have not been allocated to the operating segments, as it basically corresponds to the Group’s holding function. It groups together the costs of the headquarters that have a corporate function; management of structural exchange-rate positions, carried out by the Financial Planning unit; specific issues of capital instruments to ensure adequate management of the Group’s global solvency; portfolios and their corresponding results, whose management is not linked to customer relations, such as industrial holdings; certain tax assets and liabilities; funds due to commitments with pensioners; goodwill and other intangibles. Additionally includes the result of certain corporate transactions:
| | - | The sale of pension business of Mexico, Colombia, Peru and Chile. |
| | - | The sale of BBVA Panama. |
| | - | The signing of a new agreement with the CITIC Group, which includes the sale of 5.1% of CNBC. |
| | - | And BBVA Puerto Rico until its sale in December 2012. |
The figures corresponding to 2012 and 2011 have been restated in accordance with the same criteria and the same structure of operating segments as explained above and also in Note 3 (sale of pensions business in Latin America). This will allow for homogeneous year-on-year comparisons.
F-47
The breakdown of the BBVA Group’s total assets by operating segments as of December 31, 2013, 2012 and 2011, is as follows:
| | | | | | | | | | | | |
| | | | | | | | | | | | | |
| | | | | | | Millions of Euros |
| | | Total Assets by Operating Segments | | | | 2013 | | 2012 | | 2011 | | |
| | | Spain | | | | 315,561 | | 345,362 | | 323,249 | | |
| | | Real Estate | | | | 20,563 | | 21,923 | | 22,558 | | |
| | | Eurasia | | | | 41,223 | | 48,324 | | 53,439 | | |
| | | Mexico | | | | 82,171 | | 81,723 | | 72,156 | | |
| | | South America | | | | 78,141 | | 77,474 | | 62,651 | | |
| | | United States | | | | 53,042 | | 53,892 | | 53,090 | | |
| | | Subtotal Assets by Operating Segments | | | | 590,700 | | 628,698 | | 587,143 | | |
| | | Corporate Center and other adjustments (*) | | | | (8,125) | | (7,625) | | (4,305) | | |
| | | Total Assets BBVA Group | | | | 582,575 | | 621,072 | | 582,838 | | |
| | | | | | | | | | | | | |
| | (*) | Includes adjustments due to Garanti Group accounted for using the equity method (See Note 2) and other inter-areas adjustments. For more information see Appendix X. | |
The profit and main earning figures in the consolidated income statements for the year ended December 31, 2013, 2012 and 2011 by operating segments are as follows:
| | | | | | | | | | | | | | | | | | | | | | | | | | | | | | | | | | | | | | | | | | |
| | | | | | | | | | | | | | | | | | | | | | | | | | | | | | | | | | | | | | | | | | | |
| | | | | | | Millions of Euros | | | |
| | | | | | | | | | | | Operating Segments | | | | | | | | | | | |
| | | Main Margins and Profits by Operating Segments | | | |
| BBVA
Group |
| | | Spain | | | | Real Estate | | | | Eurasia | | | | Mexico | | |
| South
America |
| |
| United
States |
| |
| Corporate
Center |
| |
| Adjusments
(**) |
| | |
| | | 2013 | | | | | | | | | | | | | | | | | | | | | | | | | | | | | | | | | | | | | | | | |
| | | Net interest income | | | | | 13,900 | | | | 3,830 | | | | (3) | | | | 911 | | | | 4,484 | | | | 4,703 | | | | 1,407 | | | | (719) | | | | (713) | | | |
| | | Gross income | | | | | 20,958 | | | | 6,095 | | | | (38) | | | | 1,721 | | | | 6,201 | | | | 5,630 | | | | 2,101 | | | | (314) | | | | (439) | | | |
| | | Net operating income (*) | | | | | 10,162 | | | | 3,081 | | | | (190) | | | | 987 | | | | 3,865 | | | | 3,244 | | | | 627 | | | | (1,419) | | | | (34) | | | |
| | | Operating profit /(loss) before tax | | | | | 1,160 | | | | 222 | | | | (1,840) | | | | 593 | | | | 2,362 | | | | 2,387 | | | | 534 | | | | (1,507) | | | | (1,590) | | | |
| | | Profit | | | | | 2,228 | | | | 583 | | | | (1,254) | | | | 454 | | | | 1,805 | | | | 1,249 | | | | 390 | | | | (999) | | | | | | | |
| | | 2012 | | | | | | | | | | | | | | | | | | | | | | | | | | | | | | | | | | | | | | | | |
| | | Net interest income | | | | | 14,474 | | | | 4,748 | | | | (20) | | | | 851 | | | | 4,178 | | | | 4,288 | | | | 1,551 | | | | (473) | | | | (648) | | | |
| | | Gross income | | | | | 21,824 | | | | 6,665 | | | | (84) | | | | 1,665 | | | | 5,756 | | | | 5,360 | | | | 2,243 | | | | 288 | | | | (68) | | | |
| | | Net operating income (*) | | | | | 11,450 | | | | 3,778 | | | | (211) | | | | 886 | | | | 3,590 | | | | 3,066 | | | | 737 | | | | (741) | | | | 344 | | | |
| | | Operating profit /(loss) before tax | | | | | 1,582 | | | | 1,652 | | | | (5,705) | | | | 508 | | | | 2,229 | | | | 2,271 | | | | 619 | | | | (826) | | | | 833 | | | |
| | | Profit | | | | | 1,676 | | | | 1,162 | | | | (4,044) | | | | 404 | | | | 1,689 | | | | 1,199 | | | | 443 | | | | 823 | | | | | | | |
| | | 2011 | | | | | | | | | | | | | | | | | | | | | | | | | | | | | | | | | | | | | | | | |
| | | Net interest income | | | | | 12,724 | | | | 4,248 | | | | 104 | | | | 806 | | | | 3,782 | | | | 3,159 | | | | 1,518 | | | | (465) | | | | (428) | | | |
| | | Gross income | | | | | 19,640 | | | | 6,246 | | | | 124 | | | | 1,467 | | | | 5,323 | | | | 4,099 | | | | 2,182 | | | | 88 | | | | 112 | | | |
| | | Net operating income (*) | | | | | 10,196 | | | | 3,408 | | | | 23 | | | | 821 | | | | 3,392 | | | | 2,215 | | | | 762 | | | | (830) | | | | 405 | | | |
| | | Operating profit /(loss) before tax | | | | | 3,398 | | | | 1,515 | | | | (1,216) | | | | 722 | | | | 2,153 | | | | 1,677 | | | | (1,053) | | | | (852) | | | | 452 | | | |
| | | Profit | | | | | 3,004 | | | | 1,075 | | | | (809) | | | | 563 | | | | 1,638 | | | | 898 | | | | (713) | | | | 351 | | | | | | | |
| | | | | | | | | | | | | | | | | | | | | | | | | | | | | | | | | | | | | | | | | | | |
| | (*) | Gross Income less Administrative Cost and Amortization |
| | (**) | Includes adjustments due to Garanti Group accounted for using the equity method and other inter-areas adjustments. For more information see Appendix X. | |
The BBVA Group understands the risk management function as one of the essential and differentiating elements of its competitive strategy. In this context, the aim of the Global Risk Management (GRM) Corporate Area is to preserve the BBVA Group’s solvency, help define its strategy with respect to risk and assume and facilitate the development of its businesses. Its activity is governed by the following principles:
| — | | The risk management function is single, independent and global. |
| — | | The risks assumed by the BBVA Group must be compatible with the capital adequacy target and must be identified, measured and assessed. Risk monitoring and management procedures and sound mechanisms of control and mitigation systems must likewise be in place. |
| — | | All risks must be managed integrally during their life cycle, and be treated differently depending on their nature and with active portfolio management based on a common measure (economic capital). |
F-48
| — | | It is each operating segment’s responsibility to propose and maintain its own risk profile, within its autonomy in the corporate action framework (defined as the set of risk control policies and procedures defined by the BBVA Group), using an appropriate risk infrastructure to control their risks. |
| — | | The infrastructures created for risk control must be equipped with means (in terms of people, tools, databases, information systems and procedures) that are sufficient for their purpose, so that there is a clear definition of roles and responsibilities, thus ensuring efficient allocation of resources among the corporate area and the risk units in operating segments. |
In light of these principles, integrated risk management is structured around five main components:
| — | | A governance and organizational system for the risk function, which considers: |
| | - | Definition of roles and responsibilities for different functions and areas |
| | - | Organizational structure of the GRM Corporate Area and Risk Units of the operating segments, including relationship and codependency mechanisms |
| | - | Committee Schemes at a Corporate and operating segment levels |
| | - | Structure delegation of functions and risks |
| | - | Internal control system in line with the nature and volume of risk exposure |
| — | | A general risk framework, where the Group’s risk profile objective is defined and where the tolerance levels that the Group is willing to assume is clearly defined in order to carry out its strategic plan without relevant deviations, even in stress situations. |
| — | | A risk management corporate governance scheme which includes: |
| | - | a regulatory body of policies and procedures, tolerances and corrective actions |
| | - | Annual risk planning scheme whereby Risk Appetite is incorporated into the Group’s business decision making process |
| | - | ongoing management of financial and non-financial risks |
| — | | A Framework for Identification, Assessment, Monitoring and Reporting of risks assumed in base and stress scenarios, allowing prospective and dynamic risk assessment |
| — | | An infrastructure that encompasses the set of tools, methodologies and risk culture that is the basis on which the differentiated risk management scheme is founded. |
Corporate governance system
The BBVA Group has developed a corporate governance system in line with the best international practices, which adapts to the regulatory requirements of the countries where its operating segments carry out their business.
The Board of Directors is, in accordance with the Regulations of the Board, the body responsible for approving the policy control and risk management, as well as performing the periodic monitoring of internal information and control systems. Based on the general policies established by the Board of Directors, the Executive Committee (EC) sets corporate policies that previously been approved by the Board of Directors and the Group’s risk limits by geographies, sectors and portfolios composing all the corporate action framework on risk. In this context, and for the adequate performance of its functions, the EC has a key role in developing the Risk Committee of the Board which, among other functions, analyzes and evaluates proposals on these issues that are risen to the EC for approval, performing a continuous monitoring of risk evolution and approving transactions that are considered relevant for qualitative or quantitative reasons.
Risk management in the BBVA Group from a corporate action framework set by the governing bodies of the Bank is carried out by corporate risk management units and the operating segments themselves. Thus, the risk function in the Group (Global Risk Management, hereinafter GRM), is distributed among the risk units of the operating segments and the GRM corporate area, the latter being responsible for ensuring compliance with policies and global strategies. The risk units of the operating segments advise and manage risk profiles within their autonomy, though they always respect the corporate framework for action.
F-49
The Corporate GRM Area combines a vision by risk type with a global vision. It is divided into six units, as follows:
| — | | Corporate Risk Management and Risk Portfolio Management: Responsible for management and control of the BBVA Group’s financial risks. In addition, this area focuses on fiduciary risk management, insurance, Asset Management and monitors the retail banking business from a cross functional point of view. |
| — | | Operational and Control Risk: Manages operational risk, internal risk area control and the internal validation of the measurement models and the acceptance of new risks. |
| — | | Technology & Methodologies: Responsible for the management of the technological and methodological developments required for risk management in the Group. |
| — | | Technical Secretariat: Undertakes the contrast of the proposals made to the Risk Management Committee and the Risk Committee. |
| — | | Planning, Monitoring & Reporting: Responsible for the development of the ERM framework and the definition and monitoring of risk appetite. It also prepares reporting requirements, both internal and regulatory, for those risks the Group is exposed to. |
| — | | GRM South America: Responsible for credit risk management and monitoring in South America. |
The head of the GRM Department is the Chief Risk Officer, and, among his responsibilities, ensures that the Group’s risks are managed according to the defined policy, relying on the GRM corporate area units and the risk units of the operating segments. In turn, the risk managers of the operating segments maintain a hierarchical reporting line with the head of their operating segment and a functional reporting to the Group Chief Risk Officer. This structure ensures the independence of the role of local risk and alignment with the policies and objectives of the Group. This structure gives the Corporate GRM Area reasonable comfort with respect to:
| — | | integration, control and management of all the Group’s risks; |
| — | | the application throughout the Group of standard principles, policies and metrics; and |
| — | | the necessary knowledge of each geographical area and each business. |
This organizational scheme is complemented by various committees, which include the following:
| — | | The Global Risk Management Committee: This committee is made up of the risk managers from the risk units located in the operating segments and the managers of the GRM Corporate Area units. This committee meets on a monthly basis and among its responsibilities are the following: |
| | - | establishing the Group’s risk strategy and presenting its proposal to the appropriate governing bodies, and in particular to the Board of Directors, for their approval, |
| | - | monitoring the management and control of risks in the Group, and |
| | - | adopting any necessary actions. |
| — | | The Risk Management Committee: Its permanent members are the Global Risk Management director, the Corporate Risk Management director and the Technical Secretariat. The other committee members propose the operations that are analyzed in its working sessions. The committee analyzes and, if appropriate, authorizes financial programs and operations within its scope and submits the proposals whose amounts exceed the set limits to the Risks Committee, when its opinion on them is favorable. |
| — | | The Assets and Liabilities Committee (ALCO): The committee is responsible for actively managing structural interest rate and foreign exchange risk positions, global liquidity and the Group’s capital base. |
| — | | The Technology and Methodologies Committee: The committee decides on the effectiveness of the models and infrastructures developed to manage and control risks that are integrated in the operating segments, within the framework of the operational model of Global Risk Management. |
| — | | The New Businesses and Products Committees: Their functions are to analyze and, where appropriate, give technical approval to and implement new businesses, products and services prior to their marketing: to undertake subsequent control and monitoring of new authorized products; and to foster orderly business operations to ensure they develop in a controlled environment. |
| — | | The Global Corporate Assurance Committee: Its task is to undertake a review at both Group and operating segment level of the control environment and the effectiveness of the operational risk internal control and management systems, as well as to monitor and analyze the main operational risks the Group is subject to, including those that are cross-cutting in nature. |
F-50
Internal control system
The BBVA Group’s internal control system is based on the best practices developed in “Enterprise Risk Management – Integrated Framework” by the Committee of Sponsoring Organizations of the Treadway Commission (COSO) as well as in “Framework for Internal Control Systems in Banking Organizations” by the Bank for International Settlements (BIS). The Group’s system for internal control is therefore part of the Integral Risk Management Framework.
The system of internal control of the Group reaches all areas of the organization and is designed to identify and manage the risks that the Group companies are facing and ensuring that the corporate objectives are met.
The control model has a three-line defense system:
| — | | The first line is formed by the Group’s operating segments, which are responsible for the control within their scope and implementation of the measures set by higher authorities. |
| — | | The second line are the specialists control units (Compliance, Global Accounting & Informational Management / Financial Internal Control, Risk Internal Control, IT Risk, Fraud & Security, Operational Control and production director support units, such as Human Resources, Legal, etc. …). This line supervises the control of the different units from a horizontal hierarchy stand point. Also, reporting to this line is the operational risk corporate management unit, which provides a common methodology and management tools. |
| — | | The third line is the Internal Audit unit, which conducts an independent review of the model, verifying compliance and effectiveness of corporate policies and providing independent information on the control model. |
Find following list shows the main principles that support the internal control system:
| | - | Its core element is the “process.” |
| | - | The form in which the risks are identified, assessed and mitigated must be unique for each process; and the systems, tools and information flows that support the internal control and operational risk activities must be unique, or at least be administered fully by a single unit. |
| | - | The responsibility for internal control lies with the BBVA Group’s operating segments. These units, along with the specialized units mentioned above, are responsible for the implementation of the system of control within its scope of responsibility and managing the existing risk by proposing any improvements to processes it considers appropriate. |
| | - | Given that some operating segments have a global scope of responsibility, there are cross-cutting control functions which supplement the control mechanisms mentioned earlier. |
| | - | The Operational Risk Management Committee in each operating segment is responsible for approving suitable mitigation plans for each existing risk or weakness. This committee structure culminates at the Group’s Global Corporate Assurance Committee. |
Within the GRM area, the Group has set up a unit of Internal Risk Control and Risk Validation that is independent from the units that develop models, manage processes and execute controls, and provide expert resources for the management of the different types of risks. Its objectives are:
| — | | Ensure that there is a policy, process and measures identified for each risk relevant to the group. |
| — | | Ensure that these are implemented and applied in the manner in which they were defined. |
| — | | Control and communication any identified deficiencies and setting goals for improvement. |
| — | | Internal validation of models, independent from the model development process. |
Both units report their activities and report their working plans to the Risk Committee of the Board.
The Internal Risk Control is built into the second line of defense. It has a global scope, both geographically and in terms of type of risk, reaching to all those risk types managed by the Corporate Risk Area. For the development of its function, the unit has a team structure at the corporate level and at the geography level in the case of the most important geographies in which the Group operates. As in the Corporate Area, the local units are maintained independent from the operating segment processes and from those units that execute controls. It maintains however a functional dependency to the Internal Risk control unit. The lines of action of this unit are set at a Group level, adapting and executing at a local level as well as reporting the most relevant aspects.
F-51
Risk Appetite Framework
The Group Risk policy is aimed towards a moderate risk profile through conservative management and a global banking business model diversified by geographical area, type of assets, portfolios and customers. The Group has a large international presence, both in emerging and developed countries, maintaining a medium/low risk profile in each geography while seeking sustainable growth over time.
In order to achieve the above, a number of key metrics have been established that characterize the objective of the entity behavior and are enforced across the organization. These metrics are related to the solvency, liquidity and recurrence of results; and depending on the circumstances prevailing in each case, determine the risk in the Group and allow to reach the desired objectives.
Tolerance levels for key metrics are proposed by the GRM and approved by the Executive Committee. These metrics define the risks that the group is willing to assume. They defined the Group’s Risk Appetite and therefore are considered permanent save for exceptions.
Also, on an annual basis, the Executive Committee establishes, after a proposal from GRM and favorable report of the Risk Committee, limits for the main types of risks present in the Group, such as credit, liquidity, funding and market. The compliance with these limits is monitored periodically through Risk committees. For credit risk, limits are defined at portfolio and/or sector level for each operating segment. In credit risk limits defined portfolio level and / or sector and for each operating segment. These thresholds are the maximum exposure to lending for the BBVA Group for a time horizon of one year.
The Group’s objective is not to eliminate all risks, but to take a prudent level of risk that will generate results while maintaining adequate levels of capital and funding in order to generate recurring profits.
Corporate Scheme of Risk Management
Corporate Scheme of Risk Management includes macro processes as detailed below:
| — | | Regulatory enhancement process for the Risk area. GRM has established a set of principles, policies and procedures that serve as foundation to the regulatory structure of the risk function. The objectives are: |
| | - | Consistency of all policies of the Group, Holding and local level, with the guiding principles of risk appetite and within themselves. |
| | - | Uniformity between the operating segments in the implementation of risk policies, avoiding disparities in the risks taken based on the operating segment. |
| | - | Framework of action, establishing the general lines of action for the operating segments, respecting the autonomy of these units. |
| — | | Annual Planning Process: Planning is done taking into account the risk appetite and establishes a series of limits by type of asset that ensure consistency with the global objective profile of the Group’s risk. |
| — | | Management of the main risks which are faced by the Group are the following: |
This arises from the probability that one party to a financial instrument will fail to meet its contractual obligations for reasons of insolvency or inability to pay and cause a financial loss for the other party. This includes management of counterparty risk, issuer credit risk, liquidation risk and country risk.
Management of credit risk covers the analytic process before decisions have been taken, decision making, instrumentation, monitoring formalized and recovery operations, as well as the entire process of control and reporting at customer level, segment, industry, operating segment or subsidiary. The main principles on which decision-making should be supported within credit risk are: a sufficient customer generation of resources and capital solvency and the existence of adequate and effective collateral. The management of credit risk in the Group has a comprehensive structure that allows all functions making decisions objectively and independently throughout the life cycle risk.
This is originated by the likelihood of losses in the value of the positions held as a result of changes in the market prices of financial instruments. The BBVA Group manages this risk in terms of probability of VaR (Value at Risk). It includes three types of risks:
| | - | Interest-rate risk: This arises from variations in market interest rates. |
F-52
| | - | Exchange Rate risk: This is the risk resulting from variations in foreign-currency exchange rates. |
| | - | Price risk: This is the risk resulting from variations in market prices, either due to factors specific to the instrument itself, or alternatively to factors which affect all the instruments traded on a specific market. |
Control, monitoring and management of liquidity risk and funding aims in the short term, ensuring compliance with payment obligations of the BBVA Group in the time and manner provided, without the need to obtain funds under unfavorable conditions. In the mid-term it aims to ensure the adequacy of the Group’s financial structure and its evolution in the context of the economic, market and regulatory changes.
| | - | Structural risk, includes the following: |
| | - | Interest rate structural risk: The management of this kind of risk seeks to maintain exposure levels for the BBVA Group in line with its strategy and risk profile to address changes in market interest rates. For this aim, ALCO carries out an active balance sheet management through operations intended to optimize the level of risk in relation to the expected results and with respect to the maximum tolerable risk levels. The activity of the ALCO uses the interest rate risk measurements performed by the Corporate Area GRM. |
| | - | Exchange rate structural risk: This risk arises primarily from exposure to changes in exchange rates arising from foreign companies to the BBVA Group and endowment funds to branches abroad financed in a different currency the investment. Managing this risk is based on a simulation model of scenarios to quantify the changes in value that can be produced with a given confidence level and a horizon predetermined, and ALCO is the responsible for arranging hedging transactions, to restrict the equity impact due to the changes in exchange rates according to their projected trend. |
| | - | Structural equity risk: This risk arises due to the possible negative impact due to the impairment value of its investments in Industrial and Financial entities with medium and long horizons. The Corporate area GRM is responsible for measurement and effective monitoring of the structural risk of equity, estimating for this reason the sensitivity and the capital required to cover any unexpected losses arising from changes in value of the companies comprising the investment portfolio of the Group, with a confidence level in accordance with the target entity rating, taking into account liquidity positions and the statistical behavior of the assets under consideration. |
This arises from the possibility of human error, inadequate or faulty internal processes, system failures or external events. This definition includes the legal risk and excludes strategic and/or business risk and reputational risk The operational risk management in the Group is based on the levers of value that generates advanced AMA (advanced measurement approach): knowledge, identification, prioritization and management of potential and actual risks, supported by indicators to analyze the evolution, define alerts and check the controls.
Framework for identifying, analyzing and monitoring risk
The process of identification, assessment and monitoring / reporting have the following objectives:
| — | | Evaluate the performance of risk appetite in the present moment. |
| — | | Identified and evaluate risk situation that may compromise the performance of the risk appetite. |
| — | | Evaluate the performance of risk appetite to future under basis and stress scenario. |
Infrastructure: Technology, Culture and Risk Methodologies
| — | | Technology: assessing the adequacy of information systems and technology necessary for the performance of the functions within the framework of integrated risk management of the Group. |
| — | | The BBVA Group’s main activities with respect to the management and control of its risks are as follows: |
| | - | Calculation of exposure to risks of the different portfolios, taking into account any possible mitigating factors (guarantees, balance netting, collaterals, etc.). |
| | - | Calculation of the probabilities of default (hereinafter, “PD”). |
F-53
| | - | Estimation of the foreseeable losses in each portfolio, assigning a PD to new operations (rating and scoring). |
| | - | Measurement of the risk values of the portfolios in different scenarios through historical simulations. |
| | - | Establishment of limits to potential losses according to the different risks incurred. |
| | - | Determination of the possible impacts of structural risks on the BBVA Group’s consolidated income statement. |
| | - | Identification and quantification of operational risks, by operating segments, to facilitate mitigation through appropriate corrective actions. |
In accordance with best practice and in line with recent regulatory recommendations, BBVA has implemented a robust risk culture that spreads all levels of the organization so that principles of risk management could be unique, and known throughout the group.
Global Risk Management Risk Culture diffuses as a value and as a fundamental part of its management model, with the aim to strengthening the direction of the risk management, emphasizing that this culture could be communicated, understood, accepted and controlled throughout the organization.
Risk Culture has opted for three different areas:
| | - | Communication, which aims to spread understanding of the Risk Management Framework of the Group consistently and integrated throughout the organization through the most appropriate channels of communication. |
| | - | Training, in which specific formats have been developed to raise awareness of risks in the organization and ensure certain standards in skills and knowledge of Risk Management |
| | - | Compensation, area where it is intended that the financial and non-financial incentives could support the values and culture of risk at all levels and for which they have been established mechanisms based on the risk management, in accordance with the objectives established by the Group. |
It has been established continuously monitored to verify proper implementation of these areas and their development.
F-54
7.1.1 Credit risk exposure
In accordance with IFRS 7, the BBVA Group’s maximum credit risk exposure (see definition below) by headings in the balance sheet as of December 31, 2013, 2012 and 2011 is provided below. It does not consider the availability of collateral or other credit enhancements to guarantee compliance with payment obligations. The details are broken down by financial instruments and counterparties.
| | | | | | | | | | | | |
| | | | | | | | | | | | | |
| | | | | | | Millions of Euros | | |
| | | Maximum Credit Risk Exposure | | Notes | | 2013 | | 2012 | | 2011 | | |
| | | Financial assets held for trading | | | | 29,708 | | 28,265 | | 20,946 | | |
| | | Debt securities | | 10 | | 29,602 | | 28,020 | | 20,946 | | |
| | | Government | | | | 24,696 | | 23,370 | | 17,955 | | |
| | | Credit institutions | | | | 2,734 | | 2,545 | | 1,889 | | |
| | | Other sectors | | | | 2,172 | | 2,106 | | 1,102 | | |
| | | Customer lending | | | | 106 | | 244 | | - | | |
| | | Other financial assets designated at fair value through profit or loss | | | | 664 | | 753 | | 708 | | |
| | | Debt securities | | 11 | | 664 | | 753 | | 708 | | |
| | | Government | | | | 142 | | 174 | | 129 | | |
| | | Credit institutions | | | | 16 | | 45 | | 44 | | |
| | | Other sectors | | | | 506 | | 534 | | 535 | | |
| | | Available-for-sale financial assets | | | | 71,439 | | 62,615 | | 48,507 | | |
| | | Debt securities | | 12 | | 71,439 | | 62,615 | | 48,507 | | |
| | | Government | | | | 48,728 | | 38,926 | | 32,476 | | |
| | | Credit institutions | | | | 10,431 | | 13,157 | | 7,067 | | |
| | | Other sectors | | | | 12,280 | | 10,532 | | 8,964 | | |
| | | Loans and receivables | | | | 364,030 | | 384,097 | | 377,519 | | |
| | | Loans and advances to credit institutions | | 13.1 | | 22,792 | | 25,372 | | 24,400 | | |
| | | Loans and advances to customers | | 13.2 | | 336,759 | | 354,973 | | 350,239 | | |
| | | Government | | | | 32,400 | | 34,917 | | 34,941 | | |
| | | Agriculture | | | | 4,982 | | 4,738 | | 4,697 | | |
| | | Industry | | | | 28,679 | | 30,731 | | 34,834 | | |
| | | Real estate and construction | | | | 40,486 | | 47,223 | | 49,418 | | |
| | | Trade and finance | | | | 47,169 | | 51,912 | | 54,736 | | |
| | | Loans to individuals | | | | 149,891 | | 151,244 | | 137,437 | | |
| | | Other | | | | 33,151 | | 34,208 | | 34,176 | | |
| | | Debt securities | | 13.3 | | 4,481 | | 3,751 | | 2,880 | | |
| | | Government | | | | 3,175 | | 2,375 | | 2,128 | | |
| | | Credit institutions | | | | 297 | | 453 | | 461 | | |
| | | Other sectors | | | | 1,009 | | 923 | | 291 | | |
| | | Held-to-maturity investments | | 14 | | - | | 10,163 | | 10,955 | | |
| | | Government | | | | - | | 9,210 | | 9,896 | | |
| | | Credit institutions | | | | - | | 393 | | 451 | | |
| | | Other sectors | | | | - | | 560 | | 608 | | |
| | | Derivatives (trading and hedging) | | | | 41,294 | | 49,208 | | 53,561 | | |
| | | Subtotal | | | | 507,135 | | 535,101 | | 512,196 | | |
| | | Valuation adjustments | | | | 1,068 | | 338 | | 530 | | |
| | | Total Financial Assets Risk | | | | 508,203 | | 535,439 | | 512,726 | | |
| | | | | | | | | | | | | |
| | | Financial guarantees (Bank guarantees, letter of credits,) | | | | 33,543 | | 37,019 | | 37,629 | | |
| | | Drawable by third parties | | | | 87,542 | | 83,519 | | 86,375 | | |
| | | Government | | | | 4,354 | | 1,360 | | 3,143 | | |
| | | Credit institutions | | | | 1,583 | | 1,946 | | 2,417 | | |
| | | Other sectors | | | | 81,605 | | 80,213 | | 80,815 | | |
| | | Other contingent commitments | | | | 6,628 | | 6,624 | | 4,313 | | |
| | | Total Contingent Risks and Commitments | | 34 | | 127,713 | | 127,161 | | 128,317 | | |
| | | | | | | | | | | | | |
| | | Total Maximum Credit Exposure | | | | 635,916 | | 662,601 | | 641,043 | | |
| | | | | | | | | | | | | |
F-55
The maximum credit exposure of the table above is determined by type of financial asset as explained below:
| — | | In the case of financial assets recognized in the consolidated balance sheets, exposure to credit risk is considered equal to its gross accounting value, not including certain valuation adjustments (impairment losses, derivatives and others), with the sole exception of trading and hedging derivatives. |
| — | | The maximum credit risk exposure on financial guarantees granted is the maximum that the Group would be liable for if these guarantees were called in, and that is their carrying amount. |
| — | | Our calculation of risk exposure for derivatives is based on the sum of two factors: the derivatives market value and their potential risk (or “add-on”). |
The first factor, market value, reflects the difference between original commitments and market values on the reporting date (mark-to-market). As indicated in Note 2.2.1 to the consolidated financial statements, derivatives are accounted for as of each reporting date at fair value in accordance with IAS 39.
The second factor, potential risk (‘add-on’), is an estimate (using internal models) of the maximum increase to be expected on risk exposure over a derivative market value (at a given statistical confidence level) as a result of future changes in the fair value over the remaining term of the derivatives.
The consideration of the potential risk (“add-on”) relates the risk exposure to the exposure level at the time of a customer’s default. The exposure level will depend on the customer’s credit quality and the type of transaction with such customer. Given the fact that default is an uncertain event which might occur any time during the life of a contract, the BBVA Group has to consider not only the credit exposure of the derivatives on the reporting date, but also the potential changes in exposure during the life of the contract. This is especially important for derivatives, whose valuation changes substantially throughout their terms, depending on the fluctuation of market prices.
7.1.2 Mitigation of credit risk, collateralized credit risk and other credit enhancements
In most cases, maximum credit risk exposure is reduced by collateral, credit enhancements and other actions which mitigate the Group’s exposure. The BBVA Group applies a credit risk hedging and mitigation policy deriving from a banking approach focused on relationship banking. The existence of guarantees could be a necessary but not sufficient instrument for accepting risks, as the assumption of risks by the Group requires prior evaluation of the debtor’s capacity for repayment, or that the debtor can generate sufficient resources to allow the amortization of the risk incurred under the agreed terms.
The policy of accepting risks is therefore organized into three different levels in the BBVA Group:
| — | | Analysis of the financial risk of the operation, based on the debtor’s capacity for repayment or generation of funds; |
| — | | The constitution of guarantees that are adequate, or at any rate generally accepted, for the risk assumed, in any of the generally accepted forms: monetary, secured, personal or hedge guarantees; and finally, |
| — | | Assessment of the repayment risk (asset liquidity) of the guarantees received. |
The procedures for the management and valuation of collaterals are set out in the Internal Manuals on Credit Risk Management Policies and Procedures (retail and wholesale), which establish the basic principles for credit risk management, including the management of collaterals assigned in transactions with customers.
The methods used to value the collateral are in line with the best market practices and imply the use of appraisal of real-estate collateral, the market price in market securities, the trading price of shares in mutual funds, etc. All the collaterals assigned must be properly drawn up and entered in the corresponding register. They must also have the approval of the Group’s legal units.
The following is a description of the main types of collateral for each financial instrument class:
| — | | Financial instruments held for trading: The guarantees or credit enhancements obtained directly from the issuer or counterparty are implicit in the clauses of the instrument. |
| — | | Trading and hedging derivatives: In derivatives, credit risk is minimized through contractual netting agreements, where positive- and negative-value derivatives with the same counterparty are offset for their net balance. There may likewise be other kinds of guarantees, depending on counterparty solvency and the nature of the transaction. |
F-56
The Group uses credit derivatives to mitigate credit risk in its loan portfolio and other cash positions and to hedge risks assumed in market transactions with other clients and counterparties. Credit risk originating from the derivatives in which the Group operates is mitigated through the contractual rights existing for offsetting accounts at the time of their settlement. This has reduced the Group’s exposure to credit risk to€25,475 million as of December 31, 2013,€32,586 million as of December 31, 2012 and€34,770 million as of December 31, 2011.
Derivatives may follow different settlement and netting agreements, under the rules of the International Swaps and Derivatives Association (ISDA). The most common types of settlement triggers include bankruptcy of the reference credit institution, acceleration of indebtedness, failure to pay, restructuring, repudiation and dissolution of the entity. Since the Group typically confirms over 99% of the credit derivative transactions in the Depository Trust & Clearing Corporation (DTCC), substantially the entire credit derivatives portfolio is registered and matched against BBVA’s counterparties.
| — | | Other financial assets designated at fair value through profit or loss and Available-for-sale financial assets: The guarantees or credit enhancements obtained directly from the issuer or counterparty are inherent to the structure of the instrument. |
| | - | Loans and advances to credit institutions: These usually only have the counterparty’s personal guarantee. |
| | - | Loans and advances to customers: Most of these operations are backed by personal guarantees extended by the counterparty. There may also be collateral to secure loans and advances to customers (such as mortgages, cash guarantees, pledged securities and other collateral), or to obtain other credit enhancements (bonds, hedging, etc.). |
| | - | Debt securities: The guarantees or credit enhancements obtained directly from the issuer or counterparty are inherent to the structure of the instrument. |
Collateralized loans granted by the Group as of December 31, 2013, 2012 and 2011, excluding balances deemed impaired, is broken down in the table below:
| | | | | | | | | | | | |
| | | | | | | | | | | | | |
| | | | | | | Millions of Euros | | |
| | Collateralized Credit Risk | | | | 2013 | | 2012 | | 2011 | |
| | Mortgage loans | | | | 125,564 | | 137,870 | | 129,536 | |
| | Operating assets mortgage loans | | | | 3,778 | | 3,897 | | 3,574 | |
| | Home mortgages | | | | 108,745 | | 119,235 | | 108,190 | |
| | Rest of mortgages (1) | | | | 13,041 | | 14,739 | | 17,772 | |
| | Secured loans, except mortgage | | | | 23,660 | | 23,125 | | 23,915 | |
| | Cash guarantees | | | | 300 | | 377 | | 286 | |
| | Secured loan (pledged securities) | | | | 570 | | 997 | | 589 | |
| | Rest of secured loans (2) | | | | 22,790 | | 21,751 | | 23,041 | |
| | Total | | | | 149,224 | | 160,995 | | 153,451 | |
| | | | | | | | | | | | | |
| | | | | | | | | | | | | |
| | (1) | Loans with mortgage collateral (other than residential mortgage) for property purchase or construction. |
| | (2) | Includes loans with cash collateral, other financial assets with partial collateral. |
| — | | Financial guarantees, other contingent risks and drawable by third parties: These have the counterparty’s personal guarantee. |
F-57
7.1.3 Policies for preventing excessive risk concentration
In order to prevent the build-up of excessive concentrations of credit risk at the individual, country and sector levels, the BBVA Group maintains maximum permitted risk concentration indices updated at individual and portfolio sector levels tied to the various observable variables within the field of credit risk management. The limit on the Group’s exposure or financial commitment to a specific customer therefore depends on the customer’s credit rating, the nature of the risks involved, and the Group’s presence in a given market, based on the following guidelines:
| | – | The aim is, as far as possible, to combine the customer’s credit needs (commercial/financial, short-term/long-term, etc.) with the interests of the Group. |
| | – | Any legal limits that may exist concerning risk concentration are taken into account (relationship between risks with a customer and the capital of the entity that assumes them), the markets, the macroeconomic situation, etc. |
| | – | To properly management risk exposures of transactions over 2.5% of the Group’s Net Equity any transactions over this threshold will be authorized by the Risk Committee of the Bank’s Board of Directors. |
Risk concentrations by geography
Below is a breakdown of the balances of financial instruments registered in the accompanying consolidated balance sheets by their concentration in geographical areas and according to the residence of the customer or counterparty. It does not take into account valuation adjustments, impairment losses or loan-loss provisions:
| | | | | | | | | | | | | | | | | | | | |
| | | | | | | | | | | | | | | | | | | | | |
| | | | | | | Millions of Euros | | |
| | Risks by Geographical Areas 2013 | | | | Spain | | Europe,
Excluding
Spain | | Mexico | | USA | | South
America | | Rest | | Total | |
| | Financial assets - | | | | | | | | | | | | | | | | | |
| | Financial assets held for trading | | | | 14,882 | | 33,091 | | 15,707 | | 2,677 | | 3,412 | | 2,345 | | 72,114 | |
| | Loans and advances to customers | | | | - | | - | | - | | 107 | | - | | - | | 107 | |
| | Debt securities | | | | 6,320 | | 5,838 | | 13,410 | | 424 | | 2,608 | | 1,002 | | 29,602 | |
| | Equity instruments | | | | 2,752 | | 953 | | 632 | | 118 | | 148 | | 163 | | 4,766 | |
| | Derivatives | | | | 5,810 | | 26,300 | | 1,665 | | 2,028 | | 656 | | 1,180 | | 37,639 | |
| | Other financial assets designated at fair value through profit or loss | | | | 211 | | 106 | | 1,591 | | 503 | | 2 | | - | | 2,413 | |
| | Loans and advances to credit institutions | | | | - | | - | | - | | - | | - | | - | | - | |
| | Debt securities | | | | 107 | | 54 | | 5 | | 497 | | - | | - | | 663 | |
| | Equity instruments | | | | 104 | | 52 | | 1,586 | | 6 | | 2 | | - | | 1,750 | |
| | Available-for-sale portfolio | | | | 42,074 | | 8,587 | | 10,380 | | 7,729 | | 5,626 | | 3,011 | | 77,407 | |
| | Debt securities | | | | 38,732 | | 8,453 | | 10,329 | | 7,247 | | 5,535 | | 1,143 | | 71,439 | |
| | Equity instruments | | | | 3,342 | | 134 | | 51 | | 482 | | 91 | | 1,868 | | 5,968 | |
| | Loans and receivables | | | | 194,383 | | 26,712 | | 44,414 | | 39,650 | | 53,886 | | 4,984 | | 364,031 | |
| | Loans and advances to credit institutions | | | | 5,224 | | 9,171 | | 2,366 | | 2,707 | | 1,909 | | 1,415 | | 22,792 | |
| | Loans and advances to customers | | | | 187,400 | | 17,519 | | 42,048 | | 36,047 | | 50,173 | | 3,569 | | 336,759 | |
| | Debt securities | | | | 1,759 | | 22 | | - | | 896 | | 1,804 | | - | | 4,481 | |
| | Held-to-maturity investments | | | | - | | - | | - | | - | | - | | - | | - | |
| | Hedging derivatives | | | | 434 | | 2,113 | | 8 | | 60 | | 10 | | 4 | | 2,629 | |
| | Total Risk in Financial Assets | | | | 251,984 | | 70,609 | | 72,100 | | 50,618 | | 62,935 | | 10,344 | | 518,591 | |
| | Contingent risks and liabilities | | | | | | | | | | | | | | | | | |
| | Contingent risks | | | | 15,172 | | 9,038 | | 767 | | 2,344 | | 5,292 | | 929 | | 33,542 | |
| | Contingent liabilities | | | | 28,096 | | 17,675 | | 16,109 | | 24,485 | | 7,002 | | 803 | | 94,170 | |
| | Total Contingent Risk | | | | 43,268 | | 26,713 | | 16,876 | | 26,829 | | 12,294 | | 1,732 | | 127,712 | |
| | | | | | | | | | | | | | | | | | | |
| | Total Risks in Financial Instruments | | | | 295,252 | | 97,322 | | 88,976 | | 77,447 | | 75,229 | | 12,076 | | 646,303 | |
| | | | | | | | | | | | | | | | | | | |
F-58
| | | | | | | | | | | | | | | | | | | | |
| | | | | | | | | | | | | | | | | | | | | |
| | | | | | | Millions of Euros | |
| | Risks by Geographical Areas 2012 | | | | Spain | | Europe, Excluding Spain | | Mexico | | USA | | South America | | Rest | | Total | |
| | Financial assets - | | | | | | | | | | | | | | | | | |
| | Financial assets held for trading | | | | 13,768 | | 39,360 | | 15,035 | | 4,751 | | 3,643 | | 3,272 | | 79,830 | |
| | Loans and advances to customers | | | | - | | - | | - | | 244 | | - | | - | | 244 | |
| | Debt securities | | | | 5,726 | | 5,155 | | 12,960 | | 577 | | 2,805 | | 796 | | 28,020 | |
| | Equity instruments | | | | 1,270 | | 519 | | 101 | | 543 | | 239 | | 243 | | 2,915 | |
| | Derivatives | | | | 6,772 | | 33,686 | | 1,973 | | 3,387 | | 599 | | 2,233 | | 48,651 | |
| | Other financial assets designated at fair value through profit or loss | | | | 296 | | 87 | | 13 | | 2,134 | | - | | - | | 2,531 | |
| | Loans and advances to credit institutions | | | | - | | - | | - | | - | | - | | - | | - | |
| | Debt securities | | | | 190 | | 42 | �� | 9 | | 512 | | - | | - | | 753 | |
| | Equity instruments | | | | 106 | | 45 | | 4 | | 1,622 | | - | | - | | 1,777 | |
| | Available-for-sale portfolio | | | | 36,109 | | 6,480 | | 9,601 | | 7,163 | | 6,128 | | 1,085 | | 66,567 | |
| | Debt securities | | | | 33,107 | | 6,267 | | 9,035 | | 7,112 | | 6,053 | | 1,040 | | 62,615 | |
| | Equity instruments | | | | 3,002 | | 213 | | 566 | | 51 | | 75 | | 45 | | 3,952 | |
| | Loans and receivables | | | | 209,786 | | 31,375 | | 46,384 | | 40,259 | | 51,978 | | 4,314 | | 384,096 | |
| | Loans and advances to credit institutions | | | | 3,220 | | 11,042 | | 4,549 | | 3,338 | | 2,065 | | 1,157 | | 25,372 | |
| | Loans and advances to customers | | | | 205,216 | | 19,979 | | 41,835 | | 36,040 | | 48,753 | | 3,151 | | 354,973 | |
| | Debt securities | | | | 1,350 | | 354 | | - | | 880 | | 1,160 | | 6 | | 3,751 | |
| | Held-to-maturity investments | | | | 7,279 | | 2,884 | | - | | - | | - | | - | | 10,162 | |
| | Hedging derivatives | | | | 914 | | 3,798 | | 159 | | 226 | | 5 | | 18 | | 5,120 | |
| | Total Risk in Financial Assets | | | | 268,151 | | 83,984 | | 71,192 | | 54,532 | | 61,754 | | 8,691 | | 548,305 | |
| | Contingent risks and liabilities | | | | | | | | | | | | | | | | | |
| | Contingent risks | | | | 16,164 | | 10,074 | | 872 | | 3,159 | | 5,858 | | 891 | | 37,019 | |
| | Contingent liabilities | | | | 26,514 | | 19,678 | | 13,564 | | 22,027 | | 7,097 | | 1,264 | | 90,142 | |
| | Total Contingent Risk | | | | 42,678 | | 29,752 | | 14,435 | | 25,186 | | 12,955 | | 2,155 | | 127,161 | |
| | | | | | | | | | | | | | | | | | | |
| | Total Risks in Financial Instruments | | | | 310,829 | | 113,736 | | 85,627 | | 79,718 | | 74,709 | | 10,846 | | 675,466 | |
| | | | | | | | | | | | | | | | | | | |
| | | | | | | | | | | | | | | | | | | | | |
| | | | | | | | | | | | | | | | | | | | |
| | | | | | | | | | | | | | | | | | | | | |
| | | | | | | | | | | | | | | | | | | | | |
| | | | | | Millions of Euros | |
| | Risks by Geographical Areas 2011 | | | | Spain | | Europe, Excluding Spain | | Mexico | | EE.UU. | | South America | | Rest | | Total | |
| | Financial assets - | | | | | | | | | | | | | | | | | |
| | Financial assets held for trading | | | | 12,955 | | 33,187 | | 11,676 | | 4,664 | | 5,452 | | 2,538 | | 70,472 | |
| | Debt securities | | | | 5,075 | | 2,039 | | 10,933 | | 565 | | 2,030 | | 304 | | 20,946 | |
| | Equity instruments | | | | 662 | | 357 | | 741 | | 69 | | 125 | | 238 | | 2,192 | |
| | Derivatives | | | | 7,218 | | 30,791 | | 2 | | 4,030 | | 3,297 | | 1,996 | | 47,334 | |
| | Other financial assets designated at fair value through profit or loss | | | | 234 | | 107 | | 1,470 | | 509 | | 454 | | - | | 2,774 | |
| | Debt securities | | | | 117 | | 77 | | 6 | | 508 | | 1 | | - | | 709 | |
| | Equity instruments | | | | 117 | | 30 | | 1,464 | | 1 | | 453 | | - | | 2,065 | |
| | Available-for-sale portfolio | | | | 26,546 | | 5,390 | | 7,825 | | 8,151 | | 5,164 | | 654 | | 53,730 | |
| | Debt securities | | | | 22,371 | | 5,184 | | 7,764 | | 7,518 | | 5,068 | | 601 | | 48,506 | |
| | Equity instruments | | | | 4,175 | | 206 | | 61 | | 633 | | 96 | | 53 | | 5,224 | |
| | Loans and receivables | | | | 207,858 | | 32,598 | | 42,489 | | 42,646 | | 44,535 | | 7,397 | | 377,523 | |
| | Loans and advances to credit institutions | | | | 3,034 | | 10,079 | | 4,877 | | 2,570 | | 2,195 | | 1,647 | | 24,402 | |
| | Loans and advances to customers | | | | 203,459 | | 22,392 | | 37,612 | | 39,384 | | 41,650 | | 5,744 | | 350,241 | |
| | Debt securities | | | | 1,365 | | 127 | | - | | 692 | | 690 | | 6 | | 2,880 | |
| | Held-to-maturity investments | | | | 7,374 | | 3,582 | | - | | - | | - | | - | | 10,956 | |
| | Debt securities | | | | 395 | | 3,489 | | 485 | | 244 | | 16 | | 56 | | 4,685 | |
| | Total Risk in Financial Assets | | | | 255,362 | | 78,353 | | 63,945 | | 56,214 | | 55,621 | | 10,645 | | 520,140 | |
| | Contingent risks and liabilities | | | | | | | | | | | | | | | | | |
| | Contingent risks | | | | 16,149 | | 10,169 | | 1,098 | | 3,986 | | 4,733 | | 1,494 | | 37,629 | |
| | Contingent liabilities | | | | 30,848 | | 18,429 | | 11,929 | | 22,002 | | 6,192 | | 1,288 | | 90,688 | |
| | Total Contingent Risk | | | | 46,997 | | 28,598 | | 13,027 | | 25,988 | | 10,925 | | 2,782 | | 128,317 | |
| | | | | | | | | | | | | | | | | | | |
| | Total Risks in Financial Instruments | | | | 302,359 | | 106,951 | | 76,972 | | 82,202 | | 66,546 | | 13,427 | | 648,457 | |
| | | | | | | | | | | | | | | | | | | | | |
The breakdown of the main figures in the most significant foreign currencies in the accompanying consolidated balance sheets is set forth in Appendix VII.
F-59
Sovereign risk concentration
Sovereign risk management
The risk associated with the transactions involving sovereign risk is identified, measured, controlled and tracked by a centralized unit integrated in the BBVA Group’s Risk Area. Its basic functions involve the preparation of reports in the countries where sovereign risk exists (called “financial programs”), tracking such risks, assigning ratings to these countries and, in general, supporting the Group in terms of reporting requirements for any transactions involving sovereign risk. The risk policies established in the financial programs are approved by the relevant risk committees.
The country risk unit tracks the evolution of the risks associated with the various countries to which the Group are exposed (including sovereign risk) on an ongoing basis in order to adapt its risk and mitigation policies to any macroeconomic and political changes that may occur. Moreover, it regularly updates its internal ratings and forecasts for these countries. The internal rating assignment methodology is based on the assessment of quantitative and qualitative parameters which are in line with those used by certain multilateral organizations such as the International Monetary Fund (IMF) and the World Bank (WB), rating agencies and export credit organizations.
Sovereign risk exposure
The table below provides a breakdown of exposure to financial instruments, as of December 31, 2013, 2012 and 2011, by type of counterparty and the country of residence of such counterparty. The below figures do not take into account valuation adjustments, impairment losses or loan-loss provisions:
| | | | | | | | | | | | | | | | |
| | | | | | | | | | | | | | | | | |
| | | | | | | Millions of Euros |
| | | | | | | 2013 | | |
| | | Risk Exposure by countries | | | | Sovereign
Risk (*) | | Financial
Institutions | | Other
Sectors | | Total | | % | | |
| | | Spain | | | | 59,114 | | 11,870 | | 166,677 | | 237,661 | | 51.1% | | |
| | | United Kingdom | | | | 3 | | 5,405 | | 4,377 | | 9,785 | | 2.1% | | |
| | | Italy | | | | 3,888 | | 422 | | 2,617 | | 6,927 | | 1.5% | | |
| | | France | | | | 942 | | 2,640 | | 2,316 | | 5,898 | | 1.3% | | |
| | | Portugal | | | | 385 | | 238 | | 5,179 | | 5,802 | | 1.2% | | |
| | | Germany | | | | 1,081 | | 1,338 | | 1,206 | | 3,625 | | 0.8% | | |
| | | Ireland | | | | - | | 221 | | 487 | | 708 | | 0.2% | | |
| | | Turkey | | | | 10 | | 65 | | 163 | | 238 | | 0.1% | | |
| | | Greece | | | | - | | - | | 72 | | 72 | | 0.0% | | |
| | | Rest of Europe | | | | 2,608 | | 2,552 | | 4,239 | | 9,399 | | 2.0% | | |
| | | Europe | | | | 68,031 | | 24,751 | | 187,333 | | 280,115 | | 60.2% | | |
| | | Mexico | | | | 26,629 | | 2,810 | | 38,312 | | 67,751 | | 14.6% | | |
| | | The United States | | | | 5,224 | | 3,203 | | 41,872 | | 50,299 | | 10.8% | | |
| | | Rest of countries | | | | 7,790 | | 5,480 | | 53,649 | | 66,919 | | 14.4% | | |
| | | Total Rest of Countries | | | | 39,643 | | 11,493 | | 133,833 | | 184,969 | | 39.8% | | |
| | | Total Exposure to Financial Instruments | | | | 107,674 | | 36,244 | | 321,166 | | 465,084 | | 100.0% | | |
| | | | | | | | | | | | | | | | | |
F-60
| | | | | | | | | | | | | | | | |
| | | | | | | Millions of Euros | | |
| | | | | | | 2012 | | |
| | | Risk Exposure by countries | | | | Sovereign
Risk (*) | | Financial
Institutions | | Other
Sectors | | Total | | % | | |
| | | Spain | | | | 62,558 | | 11,839 | | 182,785 | | 257,182 | | 52.9% | | |
| | | Turkey | | | | 13 | | 159 | | 400 | | 572 | | 0.1% | | |
| | | United Kingdom | | | | 2 | | 7,095 | | 2,336 | | 9,433 | | 1.9% | | |
| | | Italy | | | | 4,203 | | 405 | | 3,288 | | 7,896 | | 1.6% | | |
| | | Portugal | | | | 443 | | 590 | | 5,763 | | 6,796 | | 1.4% | | |
| | | France | | | | 1,739 | | 3,291 | | 2,631 | | 7,661 | | 1.6% | | |
| | | Germany | | | | 1,298 | | 1,025 | | 734 | | 3,057 | | 0.6% | | |
| | | Ireland | | | | - | | 280 | | 456 | | 736 | | 0.2% | | |
| | | Greece | | | | - | | - | | 99 | | 99 | | 0.0% | | |
| | | Rest of Europe | | | | 1,664 | | 2,484 | | 5,256 | | 9,404 | | 1.9% | | |
| | | Europe | | | | 71,920 | | 27,168 | | 203,748 | | 302,836 | | 62.3% | | |
| | | Mexico | | | | 25,059 | | 5,492 | | 36,133 | | 66,684 | | 13.7% | | |
| | | The United States | | | | 3,942 | | 3,768 | | 42,157 | | 49,867 | | 10.3% | | |
| | | Rest of countries | | | | 7,521 | | 5,484 | | 53,481 | | 66,486 | | 13.7% | | |
| | | Total Rest of Countries | | | | 36,523 | | 14,744 | | 131,771 | | 183,037 | | 37.7% | | |
| | | Total Exposure to Financial Instruments | | | | 108,443 | | 41,912 | | 335,519 | | 485,873 | | 100.0% | | |
| | | | | | | | | | | | | | | | | |
| | | | | | | | | | | | | | | | | |
| | | | | | | Millions of Euros | | |
| | | | | | | 2011 | | |
| | | Risk Exposure by countries | | | | Sovereign
Risk (*) | | Financial
Institutions | | Other
Sectors | | Total | | % | | |
| | | Spain | | | | 56,473 | | 6,883 | | 178,065 | | 241,420 | | 52.7% | | |
| | | United Kingdom | | | | 120 | | 6,547 | | 3,498 | | 10,164 | | 2.2% | | |
| | | Italy | | | | 4,301 | | 487 | | 4,704 | | 9,493 | | 2.1% | | |
| | | Portugal | | | | 279 | | 829 | | 6,715 | | 7,824 | | 1.7% | | |
| | | France | | | | 619 | | 1,653 | | 3,038 | | 5,310 | | 1.2% | | |
| | | Germany | | | | 582 | | 902 | | 908 | | 2,392 | | 0.5% | | |
| | | Ireland | | | | 0 | | 182 | | 212 | | 394 | | 0.1% | | |
| | | Turkey | | | | 17 | | 42 | | 291 | | 350 | | 0.1% | | |
| | | Greece | | | | 109 | | 0 | | 32 | | 141 | | 0.0% | | |
| | | Rest of Europe | | | | 647 | | 4,319 | | 5,549 | | 10,515 | | 2.3% | | |
| | | Europe | | | | 63,147 | | 21,844 | | 203,011 | | 288,002 | | 62.8% | | |
| | | Mexico | | | | 22,875 | | 5,508 | | 31,110 | | 59,493 | | 13.0% | | |
| | | The United States | | | | 3,501 | | 3,254 | | 42,550 | | 49,305 | | 10.8% | | |
| | | Rest of countries | | | | 7,281 | | 3,800 | | 50,386 | | 61,467 | | 13.4% | | |
| | | Total Rest of Countries | | | | 33,657 | | 12,562 | | 124,046 | | 170,266 | | 37.2% | | |
| | | Total Exposure to Financial Instruments | | | | 96,805 | | 34,405 | | 327,058 | | 458,268 | | 100.0% | | |
| | | | | | | | | | | | | | | | | |
| | (*) | In addition, as of December 31, 2013, 2012 and 2011, undrawn lines of credit, granted mainly to the Spanish government or government agencies and amounted to€1,942 million,€1,613 million and€3,525 million, respectively. | |
The exposure to sovereign risk set out in the above table includes positions held in government debt securities in countries where the Group operates. They are used for ALCO’s management of the interest-rate risk on the balance sheets of the Group’s entities in these countries, as well as for hedging of pension and insurance commitments by insurance entities within the BBVA Group.
Sovereign risk exposure in Europe
In December 2013, sovereign risk exposure in Europe data was published by Group’s credit entities as of June 30, 2013 and December 31, 2012. This publication was made under the European Banking Authority (hereinafter “EBA” acronym for “European Banking Authority”) scheme.
F-61
The table below provides a breakdown of the exposure of the Group’s credit institutions to European sovereign risk as of December 31, 2013, 2012 and 2011, by type of financial instrument and the country of residence of the counterparty, under EBA requirements:
| | | | | | | | | | | | | | | | | | | | | | | | | | | | | | | | | | | | | | | | |
| | | | | | | Millions of Euros | | |
| | | | | | | 2013 | | |
| | | | | | | Debt securities | | | Loans and
Receivables | | | Derivatives (2) | | | Total
(2) | | | Contingent
risks and
commitments | | | % | | |
| | | Exposure to
Sovereign Risk
by European
Union
Countries (1) | | | | Financial Assets Held-
for-Trading | | | Available-
for-Sale
Financial
Assets | | | Held-to-
Maturity
Investments | | | | Direct
Exposure | | | Indirect
Exposure | | | | | | |
| | | Spain | | | | | 5,251 | | | | 24,339 | | | | - | | | | 23,430 | | | | 258 | | | | (25) | | | | 53,253 | | | | 1,924 | | | 82.8% | | |
| | | Italy | | | | | 733 | | | | 2,691 | | | | - | | | | 90 | | | | - | | | | (6) | | | | 3,508 | | | | - | | | 5.5% | | |
| | | France | | | | | 874 | | | | - | | | | - | | | | - | | | | - | | | | (1) | | | | 873 | | | | - | | | 1.4% | | |
| | | Germany | | | | | 1,064 | | | | - | | | | - | | | | - | | | | - | | | | (1) | | | | 1,063 | | | | - | | | 1.7% | | |
| | | Portugal | | | | | 64 | | | | 19 | | | | - | | | | 302 | | | | - | | | | - | | | | 385 | | | | 17 | | | 0.6% | | |
| | | United Kingdom | | | | | - | | | | - | | | | - | | | | - | | | | (13) | | | | 3 | | | | (10) | | | | 1 | | | - | | |
| | | Greece | | | | | - | | | | - | | | | - | | | | - | | | | - | | | | - | | | | - | | | | - | | | - | | |
| | | Hungary | | | | | - | | | | 65 | | | | - | | | | - | | | | - | | | | - | | | | 65 | | | | - | | | 0.1% | | |
| | | Ireland | | | | | - | | | | - | | | | - | | | | - | | | | - | | | | - | | | | - | | | | - | | | - | | |
| | | Rest of European Union | | | | | 2,100 | | | | 3,038 | | | | - | | | | 38 | | | | - | | | | 10 | | | | 5,186 | | | | - | | | 8.1% | | |
| | | Total Exposure to Sovereign Counterparties (European Union) | | | | | 10,086 | | | | 30,152 | | | | - | | | | 23,860 | | | | 245 | | | | (20) | | | | 64,323 | | | | 1,942 | | | 100.0% | | |
| | | | | | | | | | | | | | | | | | | | | | | | | | | | | | | | | | | | | | | | | |
| | (1) | This table shows sovereign risk balances with EBA criteria. Therefore, sovereign risk of the Group’s insurance companies (€11.093 million as of December 31, 2013) is not included. | |
| | (2) | Includes credit derivatives CDS (Credit Default Swaps) shown at fair value. |
| | | | | | | | | | | | | | | | | | | | | | | | | | | | | | | | | | | | | | | | | | |
| | | | | | | Millions of Euros | | | |
| | | | | | | 2012 | | | |
| | | | | | | Debt securities | | | Loans and
Receivables | | | Derivatives (2) | | | Total | | | Contingent
risks and
commitments | | | % | | | |
| | | Exposure to
Sovereign Risk
by European
Union
Countries (1) | | | | Financial
Assets Held-
for-Trading | | | Available-
for-Sale
Financial
Assets | | | Held-to-
Maturity
Investments | | | | Direct
Exposure | | | Indirect
Exposure | | | | | | |
| | | Spain | | | | | 5,022 | | | | 19,751 | | | | 6,469 | | | | 26,624 | | | | 285 | | | | 5 | | | | 58,156 | | | | 1,595 | | | | 86.6% | | | |
| | | Italy | | | | | 610 | | | | 811 | | | | 2,448 | | | | 97 | | | | - | | | | (3) | | | | 3,963 | | | | - | | | | 5.9% | | | |
| | | France | | | | | 1,445 | | | | - | | | | 254 | | | | - | | | | - | | | | (2) | | | | 1,697 | | | | - | | | | 2.5% | | | |
| | | Germany | | | | | 1,291 | | | | - | | | | - | | | | - | | | | (4) | | | | (1) | | | | 1,286 | | | | - | | | | 1.9% | | | |
| | | Portugal | | | | | 51 | | | | 18 | | | | 15 | | | | 359 | | | | - | | | | - | | | | 443 | | | | 17 | | | | 0.7% | | | |
| | | United Kingdom | | | | | - | | | | - | | | | - | | | | - | | | | (19) | | | | - | | | | (19) | | | | 1 | | | | 0.0% | | | |
| | | Greece | | | | | - | | | | - | | | | - | | | | - | | | | - | | | | - | | | | - | | | | - | | | | 0.0% | | | |
| | | Hungary | | | | | - | | | | 66 | | | | - | | | | - | | | | - | | | | - | | | | 66 | | | | - | | | | 0.1% | | | |
| | | Ireland | | | | | - | | | | - | | | | - | | | | - | | | | - | | | | - | | | | - | | | | - | | | | 0.0% | | | |
| | | Rest of European Union | | | | | 1,066 | | | | 379 | | | | 24 | | | | 78 | | | | - | | | | 1 | | | | 1,548 | | | | - | | | | 2.3% | | | |
| | | Total Exposure to Sovereign Counterparties (European Union) | | | | | 9,485 | | | | 21,025 | | | | 9,210 | | | | 27,158 | | | | 262 | | | | - | | | | 67,140 | | | | 1,613 | | | | 100.0% | | | |
| | | | | | | | | | | | | | | | | | | | | | | | | | | | | | | | | | | | | | | | | | | |
| | (1) | This table shows sovereign risk balances with EBA criteria. Therefore, sovereign risk of the Group’s insurance companies (€5,093 million as of December 31, 2012) is not included. | |
| | (2) | Includes credit derivatives CDS (Credit Default Swaps) shown at fair value. |
| | | | | | | | | | | | | | | | | | | | | | | | | | | | | | | | | | | | | | | | | | |
| | | | | | | Millions of Euros | | | |
| | | | | | | 2011 | | | |
| | | | | | | Debt securities | | | Loans and
Receivables | | | Derivatives (2) | | | Total | | | Contingent
risks and
commitments | | | % | | | |
| | | Exposure to
Sovereign Risk
by European
Union
Countries (1) | | | | Financial
Assets Held-
for Trading | | | Available-
for-Sale
Financial
Assets | | | Held-to-
Maturity
Investments | | | | Direct
Exposure | | | Indirect
Exposure | | | | | | |
| | | Spain | | | | | 4,366 | | | | 15,225 | | | | 6,520 | | | | 26,637 | | | | 96 | | | | - | | | | 52,844 | | | | 3,455 | | | | 89.1% | | | |
| | | Italy | | | | | 350 | | | | 634 | | | | 2,956 | | | | 184 | | | | - | | | | (23) | | | | 4,101 | | | | - | | | | 6.9% | | | |
| | | Germany | | | | | 513 | | | | 6 | | | | 69 | | | | - | | | | (3) | | | | (2) | | | | 583 | | | | - | | | | 1.0% | | | |
| | | France | | | | | 338 | | | | 12 | | | | 254 | | | | - | | | | - | | | | (3) | | | | 601 | | | | - | | | | 1.0% | | | |
| | | Portugal | | | | | 39 | | | | 11 | | | | 13 | | | | 216 | | | | - | | | | (1) | | | | 278 | | | | 65 | | | | 0.5% | | | |
| | | United Kingdom | | | | | - | | | | 120 | | | | - | | | | - | | | | (3) | | | | - | | | | 117 | | | | 1 | | | | 0.2% | | | |
| | | Greece | | | | | - | | | | 10 | | | | 84 | | | | 15 | | | | - | | | | (8) | | | | 101 | | | | - | | | | 0.2% | | | |
| | | Hungary | | | | | - | | | | 53 | | | | - | | | | - | | | | - | | | | - | | | | 53 | | | | - | | | | 0.1% | | | |
| | | Ireland | | | | | - | | | | 7 | | | | - | | | | - | | | | - | | | | 1 | | | | 8 | | | | - | | | | 0.0% | | | |
| | | Rest of European Union | | | | | 155 | | | | 351 | | | | - | | | | 130 | | | | - | | | | 2 | | | | 638 | | | | 4 | | | | 1.1% | | | |
| | | Total Exposure to Sovereign Counterparties (European Union) | | | | | 5,761 | | | | 16,429 | | | | 9,896 | | | | 27,182 | | | | 89 | | | | (34) | | | | 59,323 | | | | 3,525 | | | | 100.0% | | | |
| | | | | | | | | | | | | | | | | | | | | | | | | | | | | | | | | | | | | | | | | | | |
| | (1) | This table shows sovereign risk balances with EBA criteria. Therefore, sovereign risk of the Group’s insurance companies (€3,972 million as of December 31, 2013) is not included. | |
| | (2) | Includes credit derivatives CDS (Credit Default Swaps) shown at fair value. |
F-62
The following table provides a breakdown of the notional value of the CDS in which the Group’s credit institutions act as sellers or buyers of protection against the sovereign risk of European countries:
| | | | | | | | | | | | | | |
| | | | | | | Millions of Euros | | |
| | | | | | | 2013 | | |
| | | | | | | Credit derivatives (CDS) and other contracts in which the Group act as a protection seller | | Credit derivatives (CDS) and other contracts in which the Group act as a protection buyer | | |
| | | Exposure to Sovereign Risk by European
Countries | | | | Notional value | | Fair value | | Notional value | | Fair value | | |
| | | Spain | | | | 14 | | - | | 62 | | (25) | | |
| | | Italy | | | | 622 | | (15) | | 595 | | 9 | | |
| | | Germany | | | | 205 | | - | | 200 | | (1) | | |
| | | France | | | | 204 | | - | | 149 | | (1) | | |
| | | Portugal | | | | 75 | | (3) | | 75 | | 3 | | |
| | | Poland | | | | - | | - | | - | | - | | |
| | | Belgium | | | | - | | - | | - | | - | | |
| | | United Kingdom | | | | 135 | | 3 | | 126 | | - | | |
| | | Greece | | | | 14 | | - | | 14 | | - | | |
| | | Hungary | | | | 1 | | - | | - | | - | | |
| | | Ireland | | | | 21 | | - | | 21 | | - | | |
| | | Rest of European Union | | | | 591 | | 12 | | 478 | | (2) | | |
| | | Total exposure to Sovereign Counterparties | | | | 1,882 | | (3) | | 1,720 | | (17) | | |
| | | | | | | | | | | | | | | |
| | | | | | | | | | | | | | |
| | | | | | | Millions of Euros | | |
| | | | | | | 2012 | | |
| | | | | | | Credit derivatives (CDS) and other contracts in which the Group act as a protection seller | | Credit derivatives (CDS) and other contracts in which the Group act as a protection buyer | | |
| | | Exposure to Sovereign Risk by European
Countries | | | | Notional value | | Fair value | | Notional value | | Fair value | | |
| | | Spain | | | | 68 | | 14 | | 97 | | (9) | | |
| | | Italy | | | | 518 | | (22) | | 444 | | 19 | | |
| | | Germany | | | | 216 | | (1) | | 219 | | - | | |
| | | France | | | | 196 | | (1) | | 134 | | (1) | | |
| | | Portugal | | | | 91 | | (6) | | 89 | | 6 | | |
| | | Poland | | | | - | | - | | - | | - | | |
| | | Belgium | | | | 281 | | (4) | | 232 | | 5 | | |
| | | United Kingdom | | | | 56 | | 1 | | 64 | | (1) | | |
| | | Greece | | | | 18 | | - | | 18 | | - | | |
| | | Hungary | | | | 2 | | - | | - | | - | | |
| | | Ireland | | | | 82 | | - | | 82 | | - | | |
| | | Rest of European Union | | | | 149 | | 2 | | 155 | | (2) | | |
| | | Total exposure to Sovereign Counterparties | | | | 1,677 | | (17) | | 1,534 | | 17 | | |
| | | | | | | | | | | | | | | |
F-63
| | | | | | | | | | | | | | |
| | | | | | | | | | | | | | | |
| | | | | | | | | | | | | | | |
| | | | | | | Millions of Euros | | |
| | | | | | | 2011 | | |
| | | | | | | Credit derivatives (CDS) and other contracts in which the Group act as a protection seller | | Credit derivatives (CDS) and other contracts in which the Group act as a protection buyer | | |
| | | Exposure to Sovereign Risk by
European Countries | | | | Notional value | | Fair value | | Notional value | | Fair value | | |
| | | Spain | | | | 20 | | 2 | | 20 | | (2) | | |
| | | Italy | | | | 283 | | 38 | | 465 | | (61) | | |
| | | Germany | | | | 182 | | 4 | | 184 | | (6) | | |
| | | France | | | | 102 | | 3 | | 123 | | (6) | | |
| | | Portugal | | | | 85 | | 21 | | 93 | | (22) | | |
| | | Poland | | | | - | | - | | - | | - | | |
| | | Belgium | | | | - | | - | | - | | - | | |
| | | United Kingdom | | | | 20 | | 2 | | 20 | | (2) | | |
| | | Greece | | | | 53 | | 25 | | 66 | | (33) | | |
| | | Hungary | | | | - | | - | | 2 | | - | | |
| | | Ireland | | | | 82 | | 10 | | 82 | | (9) | | |
| | | Rest of European Union | | | | 294 | | 31 | | 329 | | (29) | | |
| | | Total exposure to Sovereign Counterparties | | | | 1,119 | | 136 | | 1,382 | | (170) | | |
| | | | | | | | | | | | | | | |
The main counterparties of these CDS are credit institutions with a high credit quality. The CDS contracts are standard in the market, with the usual clauses covering the events that would trigger payouts.
As it can be seen in the above tables, exposure to sovereign risk in Europe is concentrated in Spain. As of December 31, 2013, 2012 and 2011, the breakdown of total exposure faced by the Group’s credit institutions to Spain and other countries, by maturity of the financial instruments, is as follows:
| | | | | | | | | | | | | | | | | | | | | | | | | | | | | | | | | | | | |
| | | | | | | Millions of Euros | | |
| | | | | | | 2013 | | |
| | | | | | | Debt securities | | | Loans and
Receivables | | | Derivatives (2) | | | Total | | | % | | |
| | | Maturities of sovereign
risks European Union | | | | Financial Assets Held-
for-Trading | | | Available-
for-Sale
Financial
Assets | | | Held-to-
Maturity
Investments | | | | Direct
Exposure | | | Indirect
Exposure | | | | | |
| | | Spain | | | | | | | | | | | | | | | | | | | | | | | | | | | | | | | | | | |
| | | Up to 1 Year | | | | | 1,935 | | | | 846 | | | | - | | | | 5,627 | | | | 8 | | | | - | | | | 8,416 | | | 13.1% | | |
| | | 1 to 5 Years | | | | | 1,531 | | | | 15,523 | | | | - | | | | 5,574 | | | | 41 | | | | - | | | | 22,669 | | | 35.2% | | |
| | | Over 5 Years | | | | | 1,784 | | | | 7,969 | | | | - | | | | 12,229 | | | | 209 | | | | (25) | | | | 22,166 | | | 34.5% | | |
| | | Rest of Europe | | | | | | | | | | | | | | | | | | | | | | | | | | | | | | | | | | |
| | | Up to 1 Year | | | | | 3,198 | | | | 645 | | | | - | | | | 311 | | | | (13) | | | | - | | | | 4,141 | | | 6.4% | | |
| | | 1 to 5 Years | | | | | 847 | | | | 3,016 | | | | - | | | | 8 | | | | - | | | | 4 | | | | 3,875 | | | 6.0% | | |
| | | Over 5 Years | | | | | 791 | | | | 2,153 | | | | - | | | | 111 | | | | - | | | | 1 | | | | 3,056 | | | 4.8% | | |
| | | Total Exposure to European Union Sovereign Counterparties | | | | | 10,086 | | | | 30,152 | | | | - | | | | 23,860 | | | | 245 | | | | (20) | | | | 64,323 | | | 100.0% | | |
| | | | | | | | | | | | | | | | | | | | | | | | | | | | | | | | | | | | | |
F-64
| | | | | | | | | | | | | | | | | | | | | | |
| | | | | | | Millions of Euros | | |
| | | | | | | 2012 | | |
| | | | | | | Debt securities | | Loans and
Receivables | | Derivatives | | | | % | | |
| | | Maturities of sovereign
risks European Union | | | | Financial
Assets Held-
for-Trading | | Available-
for-Sale
Financial
Assets | | Held-to-
Maturity
Investments | | | Direct
Exposure | | Indirect
Exposure | | Total (*) | | | |
| | | | | | | | | | | | | | | | | | | | | | | |
| | | Spain | | | | | | | | | | | | | | | | | | | | |
| | | Up to 1 Year | | | | 2,183 | | 1,944 | | 2 | | 10,267 | | 35 | | - | | 14,431 | | 21.5% | | |
| | | 1 to 5 Years | | | | 1,832 | | 12,304 | | 1,239 | | 4,409 | | 26 | | - | | 19,810 | | 29.5% | | |
| | | Over 5 Years | | | | 1,007 | | 5,503 | | 5,228 | | 11,948 | | 224 | | 5 | | 23,915 | | 35.6% | | |
| | | Rest of Europe | | | | | | | | | | | | | | | | | | | | |
| | | Up to 1 Year | | | | 2,564 | | 46 | | 33 | | 369 | | 7 | | - | | 3,019 | | 4.5% | | |
| | | 1 to 5 Years | | | | 952 | | 190 | | 1,927 | | 34 | | (19) | | (5) | | 3,079 | | 4.6% | | |
| | | Over 5 Years | | | | 947 | | 1,038 | | 781 | | 131 | | (11) | | - | | 2,886 | | 4.3% | | |
| | | Total Exposure to European Union Sovereign Counterparties | | | | 9,485 | | 21,025 | | 9,210 | | 27,158 | | 262 | | - | | 67,140 | | 100.0% | | |
| | | | | | | | | |
| | | | | | | | | |
| | | | | | | Millions of Euros | | |
| | | | | | | 2011 | | |
| | | | | | | Debt securities | | Loans and
Receivables | | Derivatives | | | | % | | |
| | | Maturities of sovereign
risks European Union | | | | Financial
Assets Held-
for-Trading | | Available-
for-Sale
Financial
Assets | | Held-to-
Maturity
Investments | | | Direct
Exposure | | Indirect
Exposure | | Total (*) | | | |
| | | | | | | | | | | | | | | | | | | | | | | |
| | | Spain | | | | | | | | | | | | | | | | | | | | |
| | | Up to 1 Year | | | | 2,737 | | 779 | | 36 | | 9,168 | | 1 | | - | | 12,721 | | 21.4% | | |
| | | 1 to 5 Years | | | | 1,025 | | 11,630 | | 1,078 | | 4,265 | | 67 | | - | | 18,065 | | 30.5% | | |
| | | Over 5 Years | | | | 604 | | 2,816 | | 5,406 | | 13,204 | | 27 | | - | | 22,057 | | 37.2% | | |
| | | Rest of Europe | | | | | | | | | | | | | | | | | | | | |
| | | Up to 1 Year | | | | 684 | | 219 | | 72 | | 370 | | 3 | | (1) | | 1,347 | | 2.3% | | |
| | | 1 to 5 Years | | | | 297 | | 267 | | 2,439 | | 38 | | (1) | | (17) | | 3,023 | | 5.1% | | |
| | | Over 5 Years | | | | 414 | | 718 | | 865 | | 137 | | (8) | | (15) | | 2,111 | | 3.6% | | |
| | | Total Exposure to European Union Sovereign Counterparties | | | | 5,761 | | 16,429 | | 9,896 | | 27,182 | | 89 | | (33) | | 59,324 | | 100.0% | | |
| | | | | | | | | |
| | (*) | Additionally, as of December 31, 2013, 2012 and 2011, there were undrawn lines of credit mainly with Spanish government, amounting to 1,942, 1,613 and 3,525 million euros, respectively. | |
Valuation and impairment methods
The valuation methods used to assess the instruments that are subject to sovereign risks are the same ones used for other instruments included in the relevant portfolios and are detailed in Note 8 to these consolidated financial statements. They take into account the exceptional circumstances that have taken place over the last two years in connection with the sovereign debt crisis in Europe.
Specifically, the fair value of sovereign debt securities of European countries has been considered equivalent to their listed price in active markets (Level 1 as defined in Note 8).
Risks related to the developer and real-estate sector in Spain
One of the main Group activities of the Group in Spain is focused on developer and mortgage loans. The policies and strategies established by the Group to deal with risks related to the developer and real-estate sector are explained below:
F-65
Policies and strategies established by the Group to deal with risks related to the developer and real-estate sector
BBVA has teams specializing in the management of the Real-Estate Sector risk, given its economic importance and specific technical component. This specialization is not only in the Risk-Acceptance teams, but throughout the handling, commercial, problem risks and legal, etc. It also includes the research department (BBVA Research), which helps determine the medium/long-term vision needed to manage this portfolio. Specialization has been increased and the management teams in the areas of recovery and the Real Estate Unit itself have been reinforced.
The policies established to address the risks related to the developer and real-estate sector, aim to accomplish, among others, the following objectives: to avoid concentration in terms of customers, products and regions; to estimate the risk profile for the portfolio; and to anticipate possible worsening of the portfolio.
Specific policies for analysis and admission of new developer risk transactions
In the analysis of new operations, the assessment of the commercial operation in terms of the economic and financial viability of the project has been one of the constant points that have helped ensure the success and transformation of construction land operations for customers’ developments.
As regards the participation of the Risk Acceptance teams, they have a direct link and participate in the committees of areas such as Recoveries and the Real Estate Unit. This guarantees coordination and exchange of information in all the processes.
The following strategies have been implemented with customers in the developer sector: avoidance of large corporate transactions, which had already reduced their share in the years of greatest market growth; non active participation in the second-home market; commitment to public housing financing; and participation in land operations with a high level of urban development security, giving priority to land open to urban development.
Risk monitoring policies
The base information for analyzing the real estate portfolios is updated monthly. The tools used include the so-called “watch-list”, which is updated monthly with the progress of each client under watch, and the different strategic plans for management of special groups. There are plans that involve an intensification of the review of the portfolio for financing land, while, in the case of ongoing promotions, they are classified based on the rate of progress of the projects.
These actions have enabled BBVA to identify possible impairment situations, by always keeping an eye on BBVA’s position with each customer (whether or not as first creditor). In this regard, key aspects include management of the risk policy to be followed with each customer, contract review, deadline extension, improved collateral, rate review (repricing) and asset purchase.
Proper management of the relationship with each customer requires knowledge of various aspects such as the identification of the source of payment difficulties, an analysis of the company’s future viability, the updating of the information on the debtor and the guarantors (their current situation and business course, economic-financial information, debt analysis and generation of funds), and the updating of the appraisal of the assets offered as collateral.
BBVA has a classification of debtors in accordance with legislation in force in each country, usually categorizing each one’s level of difficulty for each risk.
Based on the information above, a decision is made whether to use the refinancing tool, whose objective is to adjust the structure of the maturity of the debt to the generation of funds and the customer’s payment capacity.
As for the policies relating to risk refinancing with the developer and real-estate sector, they are the same as the general policies used for all of the Group’s risks (see Note7.1.8). In the developer and real estate sector, they are based on clear solvency and viability criteria for projects, with demanding terms for additional guarantees and legal compliance, given a refinancing tool that standardizes criteria and variables when considering any refinancing operation.
In the case of refinancing, the tools used for enhancing the Bank’s position are: the search for new intervening parties with proven solvency and initial payment to reduce the principal debt or outstanding interest; the improvement of the debt bond in order to facilitate the procedure in the event of default; the provision of new or additional collateral; and making refinancing viable with new conditions (period, rate and repayments), adapted to a credible and sufficiently verified business plan.
F-66
Policies applied in the management of real estate assets in Spain
The policy applied for managing these assets depends on the type of real-estate asset, as detailed below.
In the case of completed homes, the final aim is the sale of these homes to private individuals, thus diluting the risk and beginning a new business cycle. Here, the strategy has been to help subrogation (the default rate in this channel of business is notably lower than in any other channel of residential mortgages) and to support customers’ sales directly, using BBVA’s own channel (BBVA Services and our branches), creating incentives for sale and including sale orders for BBVA. In exceptional case we have even accepted partial haircuts, with the aim of making the sale easier.
In the case of ongoing construction work, the strategy has been to help and promote the completion of the works in order to transfer the investment to completed homes. The whole developer Works in Progress portfolio has been reviewed and classified into different stages with the aim of using different tools to support the strategy. This includes the use of developer accounts-payable financing as a form of payment control, the use of project monitoring supported by the Real Estate Unit itself, and the management of direct suppliers for the works as a complement to the developer’s own management.
With respect to land, the fact that the vast majority of the risk is urban land simplifies the management. Urban management and liquidity control to tackle urban planning costs are also subject to special monitoring.
Quantitative information on activities in the real-estate market in Spain
The following quantitative information on real-estate activities in Spain has been prepared using the reporting models required by Bank of Spain Circular 5/2011, of November 30.
As of December 31, 2013, 2012 and 2011, exposure to the construction sector and real-estate activities in Spain stood at€22,760,€23,656 and€28,287 million, respectively. Of that amount, risk from loans to construction and real-estate development activities accounted for€13,505,€15,358 and€14,158 million, representing 8.8%, 8.7% and 8.1% of loans and advances to customers of the balance of business in Spain (excluding the government and other government agencies) and 2.3%, 2.4% and 2.4% of the total assets of the Consolidated Group.
Lending for real estate development according to the purpose of the loans as of December 31, 2013, 2012 and 2011 is shown below:
| | | | | | | | | | |
| | | | | Millions of Euros | | |
| | December 2013 Financing allocated to construction and real estate development and its coverage | | Gross
Amount | | Drawn Over
the Guarantee
Value | | Specific
coverage | | |
| | Loans recorded by the Group’s credit institutions (Business in Spain) | | 13,505 | | 5,723 | | 5,237 | | |
| | Of which: Impaired assets | | 8,838 | | 4,152 | | 4,735 | | |
| | Of which: Potential problem assets | | 1,445 | | 501 | | 502 | | |
| | Memorandum item: | | | | | | | | |
| | Write-offs | | 692 | | | | | | |
| | | | | | | | | | |
F-67
| | | | | | | | | | | | |
| | | | | | | | | | | | | |
| | | | | | | Millions of Euros | | |
| | | December 2012 Financing allocated to construction and real estate development and its coverage | | | | Gross
Amount | | Drawn Over
the
Guarantee
Value | | Specific
Provision | | |
| | | Loans recorded by the Group’s credit institutions (Business in Spain) | | | | 15,358 | | 6,164 | | 5,642 | | |
| | | Of which: Impaired assets | | | | 6,814 | | 3,193 | | 3,123 | | |
| | | Of which: Potential problem assets | | | | 2,092 | | 911 | | 731 | | |
| | | Memorandum item: | | | | | | | | | | |
| | | Write-offs | | | | 347 | | | | | | |
| | | | | | | | | | | | | |
| | | | | | | | | | | | | |
| | | | | | | | | | | | |
| | | | | | | | | | | | | |
| | | | | | | Millions of Euros | | |
| | | December 2011 Financing allocated to construction and real estate development and its coverage | | | | Gross
amount | | Drawn over
the
guarantee
value | | Specific
Provision | | |
| | | Loans recorded by the Group’s credit institutions (Business in Spain) | | | | 14,158 | | 4,846 | | 1,441 | | |
| | | Of which: Impaired assets | | | | 3,743 | | 1,725 | | 1,123 | | |
| | | Of which: Potential problem assets | | | | 2,052 | | 911 | | 318 | | |
| | | Memorandum item: | | | | | | | | | | |
| | | Write-offs | | | | 182 | | | | | | |
| | | | | | | | | | | | | |
| | | | | | | | | | | | | |
| | | | | | | | | | | | |
| | | | | | | | | | | | | |
| | | | | | | Millions of Euros | | | | |
| | | Memorandum item: Consolidated Group Data (carrying amount) | | | | December
2013 | | December
2012 | | December
2011 | | |
| | | Total loans and advances to customers, excluding the Public Sector (Business in Spain) | | | | 152,836 | | 176,123 | | 174,467 | | |
| | | Total consolidated assets (total business) | | | | 582,575 | | 621,072 | | 582,838 | | |
| | | Impairment losses determined collectively (total business) | | | | 2,698 | | 3,279 | | 3,027 | | |
| | | | | | | | | | | | | |
| | | | | | | | | | | | | |
The following is a description of the real estate credit risk based on the types of associated guarantees:
| | | | | | | | | | | | |
| | | | | | | | | | | | | |
| | | | | | | Millions of Euros | | | | |
| | | Credit: Gross amount (Business in Spain) | | | | December
2013 | | December
2012 | | December
2011 | | |
| | | Without secured loan | | | | 1,303 | | 1,441 | | 1,105 | | |
| | | With secured loan | | | | 12,202 | | 13,917 | | 13,053 | | |
| | | Terminated buildings | | | | 7,270 | | 8,167 | | 6,930 | | |
| | | Homes | | | | 6,468 | | 7,148 | | 6,431 | | |
| | | Other | | | | 802 | | 1,019 | | 499 | | |
| | | Buildings under construction | | | | 1,238 | | 1,716 | | 2,448 | | |
| | | Homes | | | | 1,202 | | 1,663 | | 2,374 | | |
| | | Other | | | | 36 | | 53 | | 74 | | |
| | | Land | | | | 3,694 | | 4,034 | | 3,675 | | |
| | | Urbanized land | | | | 2,120 | | 2,449 | | 2,404 | | |
| | | Rest of land | | | | 1,574 | | 1,585 | | 1,271 | | |
| | | Total | | | | 13,505 | | 15,358 | | 14,158 | | |
| | | | | | | | | | | | | |
| | | | | | | | | | | | | |
As of December 31, 2013, 2012 and 2011, 63%, 64.3% and 66% of loans to developers were guaranteed with buildings (90.1%, 89.1% and 94% are homes), and only 27.4%, 26.3% and 26% by land, of which 57.4%, 60.7% and 65% is urbanized, respectively.
F-68
The information on the retail mortgage portfolio risk (housing mortgage) as of December 31, 2013, 2012 and 2011, is as follows:
| | | | | | | | | | | | |
| | | | | | | Millions of Euros | | | | |
| | | Housing-acquisition loans to households (Business in Spain) | | | | December
2013 | | December
2012 | | December
2011 | | |
| | | With secured loan (gross amount) | | | | 82,680 | | 87,224 | | 79,043 | | |
| | | of which: Impaired loans | | | | 5,088 | | 3,163 | | 2,371 | | |
| | | Total | | | | 82,680 | | 87,224 | | 79,043 | | |
| | | | | | | | | | | | | |
The loan to value (LTV) ratio of the above portfolio is as follows:
| | | | | | | | | | | | | | | | | | |
| | | | | | | Millions of Euros | | |
| | | | | | | Total risk over the amount of the last valuation available(Loan To Value-LTV) | | |
| | | December 2013 LTV Breakdown of secured loans to households for the purchase of a home (Business in Spain) | | | | Less than or equal to 40% | | Over 40% but less than or equal to 60% | | Over 60% but less than or equal to 80% | | Over 80% but less than or equal to 100% | | Over 100% | | Total | | |
| | | Gross amount | | | | 14,481 | | 22,558 | | 31,767 | | 8,975 | | 4,899 | | 82,680 | | |
| | | of which: Impaired loans | | | | 262 | | 339 | | 618 | | 1,011 | | 2,858 | | 5,088 | | |
| | | | | | | | | | | | | | | | | | |
| | | | | | | | | | | | | | | | | | |
| | | | | | | Millions of Euros | | |
| | | | | | | Total risk over the amount of the last valuation available(Loan To Value-LTV) | | |
| | | December 2012 LTV Breakdown of secured loans to households for the purchase of a home (Business in Spain)(*) | | | | Less than or equal to 40% | | Over 40% but less than or equal to 60% | | Over 60% but less than or equal to 80% | | Over 80% but less than or equal to 100% | | Over 100% | | Total | | |
| | | Gross amount | | | | 14,942 | | 22,967 | | 35,722 | | 11,704 | | 1,889 | | 87,224 | | |
| | | of which: Impaired loans | | | | 312 | | 386 | | 1,089 | | 1,005 | | 371 | | 3,163 | | |
| | | | | | | | | | | | | | | | | | | |
| | | | | | | | | | | | | | | | | | |
| | | | | | | Millions of Euros | | |
| | | | | | | Total risk over the amount of the last valuation available(Loan To Value-LTV) | | |
| | | December 2011 LTV Breakdown of secured loans to households for the purchase of a home (Business in Spain) | | | | Less than or equal to 40% | | Over 40% but less than or equal to 60% | | Over 60% but less than or equal to 80% | | Over 80% but less than or equal to 100% | | Over 100% | | Total | | |
| | | Gross amount | | | | 12,408 | | 19,654 | | 32,887 | | 12,870 | | 1,224 | | 79,043 | | |
| | | of which: Impaired loans | | | | 276 | | 218 | | 695 | | 922 | | 260 | | 2,371 | | |
| | | | | | | | | | | | | | | | | | | |
Outstanding home mortgage loans as of December 31, 2013, 2012 and 2011 had an average LTV of 50%, 51% and 50% respectively.
As of December 31, 2013, the Group also had a balance of€853 million in non-mortgage loans for the purchase of housing (of which€36 million, respectively, were NPA).
F-69
The breakdown of foreclosed, acquired, purchased or exchanged assets from debt from loans relating to business in Spain, as well as the holdings and financing to non-consolidated entities holding such assets is as follows:
| | | | | | | | | | | | |
| | | | | | | Millions of Euros | | |
| | | | | | | December 2013 | | |
| | | Information about assets received in payment of debts (Business in Spain) | | | | Gross
Value | | Provisions | | Carrying
Amount | | |
| | | Real estate assets from loans to the construction and real estate development sectors in Spain. | | | | 9,173 | | 5,088 | | 4,085 | | |
| | | Terminated buildings | | | | 3,038 | | 1,379 | | 1,659 | | |
| | | Homes | | | | 2,059 | | 925 | | 1,134 | | |
| | | Other | | | | 979 | | 454 | | 525 | | |
| | | Buildings under construction | | | | 845 | | 439 | | 406 | | |
| | | Homes | | | | 819 | | 423 | | 396 | | |
| | | Other | | | | 26 | | 16 | | 10 | | |
| | | Land | | | | 5,290 | | 3,270 | | 2,020 | | |
| | | Urbanized land | | | | 3,517 | | 2,198 | | 1,319 | | |
| | | Rest of land | | | | 1,773 | | 1,072 | | 701 | | |
| | | Real estate assets from mortgage financing for households for the purchase of a home | | | | 2,874 | | 1,164 | | 1,710 | | |
| | | Rest of foreclosed real estate assets | | | | 918 | | 411 | | 507 | | |
| | | Equity instruments, investments and financing to non-consolidated companies holding said assets | | | | 730 | | 408 | | 322 | | |
| | | Total | | | | 13,695 | | 7,071 | | 6,624 | | |
| | | | | | | | | | | | | |
| | | | | | | | | | | | | |
| | | | | | | | | | | | |
| | | | | | | Millions of Euros | | |
| | | | | | | December 2012 | | |
| | | Information about assets received in payment of debts (Business in Spain) | | | | Gross
Value | | Provisions | | Carrying
Amount | | |
| | | Real estate assets from loans to the construction and real estate development sectors in Spain. | | | | 8,894 | | 4,893 | | 4,001 | | |
| | | Terminated buildings | | | | 3,021 | | 1,273 | | 1,748 | | |
| | | Homes | | | | 2,146 | | 877 | | 1,269 | | |
| | | Other | | | | 875 | | 396 | | 479 | | |
| | | Buildings under construction | | | | 908 | | 528 | | 380 | | |
| | | Homes | | | | 881 | | 512 | | 369 | | |
| | | Other | | | | 27 | | 16 | | 11 | | |
| | | Land | | | | 4,965 | | 3,092 | | 1,873 | | |
| | | Urbanized land | | | | 3,247 | | 2,048 | | 1,199 | | |
| | | Rest of land | | | | 1,718 | | 1,044 | | 674 | | |
| | | Real estate assets from mortgage financing for households for the purchase of a home | | | | 2,512 | | 1,020 | | 1,492 | | |
| | | Rest of foreclosed real estate assets | | | | 653 | | 273 | | 380 | | |
| | | Equity instruments, investments and financing to non-consolidated companies holding said assets | | | | 702 | | 383 | | 319 | | |
| | | Total | | | | 12,761 | | 6,569 | | 6,192 | | |
| | | | | | | | | | | | | |
| | | | | | | | | | | | | |
F-70
| | | | | | | | | | | | |
| | | | | | | Millions of Euros | | |
| | | | | | | December 2011 | | |
| | | Information about assets received in payment of debts (Business in Spain) | | | | Gross
Value | | Provisions | | Carrying
Amount | | |
| | | | | | | |
| | | Real estate assets from loans to the construction and real estate development sectors in Spain. | | | | 5,101 | | 1,740 | | 3,361 | | |
| | | Terminated buildings | | | | 1,709 | | 487 | | 1,222 | | |
| | | Homes | | | | 1,227 | | 333 | | 894 | | |
| | | Other | | | | 482 | | 154 | | 328 | | |
| | | Buildings under construction | | | | 360 | | 115 | | 245 | | |
| | | Homes | | | | 357 | | 114 | | 243 | | |
| | | Other | | | | 3 | | 1 | | 2 | | |
| | | Land | | | | 3,032 | | 1,138 | | 1,894 | | |
| | | Urbanized land | | | | 1,561 | | 570 | | 991 | | |
| | | Rest of land | | | | 1,471 | | 568 | | 903 | | |
| | | Real estate assets from mortgage financing for households for the purchase of a home | | | | 1,509 | | 401 | | 1,108 | | |
| | | Rest of foreclosed real estate assets | | | | 403 | | 167 | | 236 | | |
| | | Equity instruments, investments and financing to non-consolidated companies holding said assets | | | | 701 | | 287 | | 414 | | |
| | | Total | | | | 7,714 | | 2,595 | | 5,119 | | |
| | | | | | | | | | | | |
As of December 31, 2013, 2012 and 2011, the gross book value of the Group’s real-estate assets from corporate financing of real-estate construction and development was€9,173 million,€8,894 million and€5,101 million, respectively, with an average coverage ratio of 55.4%, 55% and 34.1%, respectively.
The gross book value of real-estate assets from mortgage lending to households for home purchase as of December 31, 2013, 2012 and 2011, amounted to€2,874 million,€2,512 million and€1,509 million, respectively, with an average coverage ratio of 40.5%, 40.6% and 26.6% respectively.
As of December 31, 2013, 2012 and 2011, the gross book value of the BBVA Group’s total real-estate assets (business in Spain), including other real-estate assets received as debt payment, was€12,965 million,€12,059 million and€7,013 million, respectively. The coverage ratio was 51.4%, 51.3% and 32,9% respectively.
7.1.4 Credit quality of financial assets that are neither past due nor impaired
The BBVA Group has tools (“scoring” and “rating”) that enable it to rank the credit quality of its operations and customers based on an assessment and its correspondence with the probability of default (“PD”) scales. To analyze the performance of PD, the Group has a series of tracking tools and historical databases that collect the pertinent internally generated information, which can basically be grouped together into scoring and rating models.
Scoring
Scoring is a decision-making model that contributes to both the arrangement and management of retail loans: consumer loans, mortgages, credit cards for individuals, etc. Scoring is the tool used to decide to originate a loan, what amount should be originated and what strategies can help establish the price, because it is an algorithm that sorts transactions by their credit quality. This algorithm enables the BBVA Group to assign a score to each transaction requested by a customer, on the basis of a series of objective characteristics that have statistically been shown to discriminate between the quality and risk of this type of transactions. The advantage of scoring lies in its simplicity and homogeneity: all that is needed is a series of objective data for each customer, and this data is analyzed automatically using an algorithm.
F-71
There are three types of scoring, based on the information used and on its purpose:
| — | | Reactive scoring: measures the risk of a transaction requested by an individual using variables relating to the requested transaction and to the customer’s socio-economic data available at the time of the request. The new transaction is approved or rejected depending on the score. |
| — | | Behavioral scoring: scores transactions for a given product in an outstanding risk portfolio of the entity, enabling the credit rating to be tracked and the customer’s needs to be anticipated. It uses transaction and customer variables available internally. Specifically, variables that refer to the behavior of both the product and the customer. |
| — | | Proactive scoring: gives a score at customer level using variables related to the individual’s general behavior with the entity, and to his/her payment behavior in all the contracted products. The purpose is to track the customer’s credit quality and it is used to pre-grant new transactions. |
Rating
Rating tools, as opposed to scoring tools, do not assess transactions but focus on the rating of customers instead: companies, corporations, SMEs, public authorities, etc. A rating tool is an instrument that, based on a detailed financial study, helps determine a customer’s ability to meet his/her financial obligations. The final rating is usually a combination of various factors: on one hand, quantitative factors, and on the other hand, qualitative factors. It is a middle road between an individual analysis and a statistical analysis.
The main difference between ratings and scorings is that the latter are used to assess retail products, while ratings use a wholesale banking customer approach. Moreover, scorings only include objective variables, while ratings add qualitative information. And although both are based on statistical studies, adding a business view, rating tools give more weight to the business criterion compared to scoring tools.
For portfolios where the number of defaults is very low (sovereign risk, corporates, financial entities, etc.) the internal information is supplemented by “benchmarking” of the external rating agencies (Moody’s, Standard & Poor’s and Fitch). To this end, each year the PDs compiled by the rating agencies at each level of risk rating are compared, and the measurements compiled by the various agencies are mapped against those of the BBVA master rating scale.
Once the probability of default of a transaction or customer has been calculated, a “business cycle adjustment” is carried out. This is a means of establishing a measure of risk that goes beyond the time of its calculation. The aim is to capture representative information of the behavior of portfolios over a complete economic cycle. This probability is linked to the Master Rating Scale prepared by the BBVA Group to enable uniform classification of the Group’s various asset risk portfolios.
F-72
The table below shows the abridged scale used to classify the BBVA Group’s outstanding risk as of December 31, 2013:
| | | | | | | | | | | | | | |
| | | | | | | | | | | | | | | |
| | | External rating | | Internal rating | | | | Probability of default (basic points) | | |
| | | Standard&Poor’s List | | Reduced List (22 groups) | | | | Average | | Minimum
from >= | | Maximum | | |
| | | AAA | | AAA | | | | 1 | | - | | 2 | | |
| | | AA+ | | AA+ | | | | 2 | | 2 | | 3 | | |
| | | AA | | AA | | | | 3 | | 3 | | 4 | | |
| | | AA- | | AA- | | | | 4 | | 4 | | 5 | | |
| | | A+ | | A+ | | | | 5 | | 5 | | 6 | | |
| | | A | | A | | | | 8 | | 6 | | 9 | | |
| | | A- | | A- | | | | 10 | | 9 | | 11 | | |
| | | BBB+ | | BBB+ | | | | 14 | | 11 | | 17 | | |
| | | BBB | | BBB | | | | 20 | | 17 | | 24 | | |
| | | BBB- | | BBB- | | | | 31 | | 24 | | 39 | | |
| | | BB+ | | BB+ | | | | 51 | | 39 | | 67 | | |
| | | BB | | BB | | | | 88 | | 67 | | 116 | | |
| | | BB- | | BB- | | | | 150 | | 116 | | 194 | | |
| | | B+ | | B+ | | | | 255 | | 194 | | 335 | | |
| | | B | | B | | | | 441 | | 335 | | 581 | | |
| | | B- | | B- | | | | 785 | | 581 | | 1,061 | | |
| | | CCC+ | | CCC | | | | 1,191 | | 1,061 | | 1,336 | | |
| | | CCC | | CCC | | | | 1,500 | | 1,336 | | 1,684 | | |
| | | CCC- | | CCC | | | | 1,890 | | 1,684 | | 2,121 | | |
| | | CC+ | | CCC | | | | 2,381 | | 2,121 | | 2,673 | | |
| | | CC | | CCC | | | | 3,000 | | 2,673 | | 3,367 | | |
| | | CC- | | CCC | | | | 3,780 | | 3,367 | | 4,243 | | |
| | | | | | | | | | | | | | |
The table below outlines the distribution of exposure, including derivatives, by internal ratings, to corporates, financial entities and institutions (excluding sovereign risk), of the main BBVA Group entities as of December 31, 2013 and 2012:
| | | | | | | | | | | | | | |
| | | | | | | | | | | | | | |
| | | | | | | 2013 | | 2012 | | |
| | | Credit Risk Distribution by Internal Rating | | | | Amount
(Millions of Euros) | | % | | Amount
(Millions of Euros) | | % | | |
| | | AAA/AA+/AA/AA- | | | | 23,541 | | 10.34% | | 24,091 | | 9.95% | | |
| | | A+/A/A- | | | | 65,834 | | 28.92% | | 73,526 | | 30.37% | | |
| | | BBB+ | | | | 24,875 | | 10.93% | | 31,951 | | 13.20% | | |
| | | BBB | | | | 23,953 | | 10.52% | | 23,410 | | 9.67% | | |
| | | BBB- | | | | 29,692 | | 13.04% | | 26,788 | | 11.07% | | |
| | | BB+ | | | | 19,695 | | 8.65% | | 15,185 | | 6.27% | | |
| | | BB | | | | 10,273 | | 4.51% | | 10,138 | | 4.19% | | |
| | | BB- | | | | 6,198 | | 2.72% | | 8,493 | | 3.51% | | |
| | | B+ | | | | 6,792 | | 2.98% | | 8,504 | | 3.51% | | |
| | | B | | | | 6,111 | | 2.68% | | 8,246 | | 3.41% | | |
| | | B- | | | | 4,804 | | 2.11% | | 5,229 | | 2.16% | | |
| | | CCC/CC | | | | 5,875 | | 2.58% | | 6,501 | | 2.69% | | |
| | | Total | | | | 227,643 | | 100.00% | | 242,064 | | 100.00% | | |
| | | | | | | | | | | | | | |
These different levels and their probability of default were calculated by using as a reference the rating scales and default rates provided by the external agencies Standard & Poor’s and Moody’s. These calculations establish the levels of probability of default for the BBVA Group’s Master Rating Scale. Although this scale is common to the entire Group, the calibrations (mapping scores to PD sections/Master Rating Scale levels) are carried out at tool level for each country in which the Group has tools available.
F-73
7.1.5 Financial assets past due but not impaired
The table below provides details of financial assets past due as of December 31, 2013, 2012 and 2011, but not considered to be impaired, listed by their first past-due date:
| | | | | | | | | | | | |
| | | | | | | Millions of Euros | | |
| | | Financial Assets Past Due but Not Impaired 2013 | | | | Less than 1
Month
Past-Due | | 1 to 2
Months
Past-Due | | 2 to 3 Months Past-Due | | |
| | | Loans and advances to credit institutions | | | | - | | - | | - | | |
| | | Loans and advances to customers | | | | 659 | | 46 | | 161 | | |
| | | Government | | | | 56 | | 3 | | 6 | | |
| | | Other sectors | | | | 603 | | 43 | | 155 | | |
| | | Debt securities | | | | - | | - | | - | | |
| | | Total | | | | 659 | | 46 | | 161 | | |
| | | | | | | | | | | | |
| | | | | | | | | | | | |
| | | | | | | Millions of Euros | | |
| | | Financial Assets Past Due but Not Impaired 2012 | | | | Less than 1
Month
Past-Due | | 1 to 2 Months
Past-Due | | 2 to 3 Months Past-Due | | |
| | | Loans and advances to credit institutions | | | | 21 | | - | | - | | |
| | | Loans and advances to customers | | | | 1,067 | | 620 | | 310 | | |
| | | Government | | | | 90 | | 213 | | 6 | | |
| | | Other sectors | | | | 977 | | 407 | | 304 | | |
| | | Debt securities | | | | - | | - | | - | | |
| | | Total | | | | 1,088 | | 620 | | 310 | | |
| | | | | | | | | |
| | | | | | | | |
| | | | | | | | | |
| | | | | | | Millions of Euros | | |
| | | Financial Assets Past Due but Not Impaired 2011 | | | | Less than 1
Month
Past-Due | | 1 to 2 Months
Past-Due | | 2 to 3 Months
Past-Due | | |
| | | Loans and advances to credit institutions | | | | - | | - | | - | | |
| | | Loans and advances to customers | | | | 1,973 | | 386 | | 361 | | |
| | | Government | | | | 186 | | 47 | | 23 | | |
| | | Other sectors | | | | 1,787 | | 339 | | 338 | | |
| | | Debt securities | | | | - | | - | | - | | |
| | | Total | | | | 1,973 | | 386 | | 361 | | |
| | | | | | | | | | | | |
F-74
7.1.6 Impaired assets and impairment losses
The table below shows the composition of the impaired financial assets and risks as of December 31, 2013, 2012 and 2011, broken down by heading in the accompanying consolidated balance sheet:
| | | | | | | | | | | | | | | | | | |
| | | | | | | | | | | | | | | | | | | |
| | | | | | | Millions of Euros | | | |
| | | Impaired Risks. Breakdown by Type of Asset and by Sector | | | | 2013 | | | 2012 | | | 2011 | | | |
| | | Asset Instruments Impaired | | | | | | | | | | | | | | | | |
| | | Available-for-sale financial assets | | | | | 90 | | | | 96 | | | | 125 | | | |
| | | Debt securities | | | | | 90 | | | | 96 | | | | 125 | | | |
| | | Loans and receivables | | | | | 25,477 | | | | 20,001 | | | | 15,452 | | | |
| | | Loans and advances to credit institutions | | | | | 29 | | | | 26 | | | | 26 | | | |
| | | Loans and advances to customers | | | | | 25,445 | | | | 19,960 | | | | 15,416 | | | |
| | | Debt securities | | | | | 4 | | | | 15 | | | | 10 | | | |
| | | Total Asset Instruments Impaired (1) | | | | | 25,568 | | | | 20,097 | | | | 15,577 | | | |
| | | Contingent Risks Impaired | | | | | | | | | | | | | | | | |
| | | Contingent Risks Impaired (2) | | | | | 410 | | | | 312 | | | | 217 | | | |
| | | Total impaired risks (1) + (2) | | | | | 25,978 | | | | 20,409 | | | | 15,793 | | | |
| | | Of which: | | | | | | | | | | | | | | | | |
| | | Government | | | | | 170 | | | | 165 | | | | 135 | | | |
| | | Credit institutions | | | | | 48 | | | | 71 | | | | 81 | | | |
| | | Other sectors | | | | | 25,350 | | | | 19,861 | | | | 15,359 | | | |
| | | Mortgage | | | | | 18,327 | | | | 13,761 | | | | 9,615 | | | |
| | | With partial secured loans | | | | | 49 | | | | 48 | | | | 52 | | | |
| | | Rest | | | | | 6,974 | | | | 6,052 | | | | 5,693 | | | |
| | | Contingent Risks Impaired | | | | | 410 | | | | 312 | | | | 217 | | | |
| | | Total impaired risks (1) + (2) | | | | | 25,978 | | | | 20,409 | | | | 15,793 | | | |
| | | | | | | | | | | | | | | | | | | |
All impaired risks fall into this category individually, either by default, or for reasons other than its default. The BBVA group classification as impaired financial assets is as follows:
| — | | The classification of financial assets impaired due to customer default is objective and individualized to the following criteria: |
| | - | The total amount of debt instruments, whoever the holder and collateral, which have principal, interest or fees amounts past due for more than 90 days as contractually agreed following objective criteria through aging calculation systems, unless directly classified as charged off. |
| | - | Contingent risks where the third party collateral individual becomes impaired. |
| — | | The classification of financial assets impaired by reasons other than customer default is performed individually for all risks whose individual amount is material where there is reasonable doubt about their full repayment on contractually agreed terms as they show objective evidence of impairment adversely affected by the expected cash flows of the financial instrument. Objective evidence of impairment of an asset or group of financial assets includes observable data about the following: |
| | - | Debtor’s material financial difficulties. |
| | - | Continuous delay in interest of principal payments. |
| | - | Refinancing of credit conditions by the counterparty. |
| | - | Probable bankruptcy or other reorganization / liquidation. |
| | - | - Lack of an active market for a financial asset because of financial difficulties. |
| | - | Observable data indicating a reduction in future cash flows from the initial recognition such as: a. Adverse changes in the payment status of the counterparty (delays in payments, provisions for credit cards to the limit, etc.). |
| | - | National or local economic conditions that are correlated with “defaults” (unemployment, falling property prices, etc.). |
F-75
The breakdown of impaired loans for default or reasons other than delinquency as of December 31, 2013
| | | | | | | | | | |
| | | | | | | Millions of Euros | | |
| | | December 2013 | | | | Impaired | | Allowance for
impaired
portfolio | | |
| | | Balance of impaired loans - Past due | | | | 16,558 | | 8,503 | | |
| | | Balance of impaired loans - Other than past due | | | | 9,010 | | 2,760 | | |
| | | TOTAL | | | | 25,568 | | 11,263 | | |
| | | Of which (*): | | | | | | | | |
| | | No risk | | | | 235 | | 122 | | |
| | | Mortgage loans | | | | 18,327 | | 6,688 | | |
| | | Secured loans, except mortgage | | | | 49 | | 20 | | |
| | | Other | | | | 6,957 | | 4,433 | | |
| | | | | | | | | | |
Provisions related to impaired loans secured by mortgage basically correspond to the difference between the fair value of the collateral and the carrying value.
Below are the details of the impaired financial assets as of December 31, 2013, 2012 and 2011, classified by geographical area and by the time since their oldest past-due amount or the period since they were deemed impaired:
| | | | | | | | | | | | | | | | | | | | | | | | | | |
| | | | | | | Millions of Euros | | | |
| | | Impaired Assets by Geographic Area and Time Since Oldest Past-Due Amount 2013 | | | | Less than 6
Months
Past-Due | | | 6 to 9
Months
Past-Due | | | 9 to 12
Months
Past-Due | | | More than
12 Months
Past-Due | | | Total | | | |
| | | Spain | | | | | 9,930 | | | | 1,873 | | | | 1,375 | | | | 8,599 | | | | 21,777 | | | |
| | | Rest of Europe | | | | | 383 | | | | 25 | | | | 38 | | | | 239 | | | | 685 | | | |
| | | Mexico | | | | | 795 | | | | 148 | | | | 114 | | | | 410 | | | | 1,467 | | | |
| | | South America | | | | | 854 | | | | 68 | | | | 58 | | | | 116 | | | | 1,096 | | | |
| | | The United States | | | | | 481 | | | | 16 | | | | 8 | | | | 38 | | | | 543 | | | |
| | | Total | | | | | 12,443 | | | | 2,130 | | | | 1,593 | | | | 9,402 | | | | 25,568 | | | |
| | | | | | | | | | | | | | | | | | | | | | | | | | |
| | | | | | | | | | | | | | | | | | | | | | | | | | |
| | | | | | | | | | | | | Millions of Euros | | | | | | |
| | | Impaired Assets by Geographic Area and Time Since Oldest Past-Due Amount 2012 | | | | Less than 6
Months
Past-Due | | | 6 to 9
Months
Past-Due | | | 9 to 12
Months
Past-Due | | | More than
12 Months
Past-Due | | | Total | | | |
| | | | | | | | | | | | | | | | | | | | | | | | | | | |
| | | Spain | | | | | 6,476 | | | | 1,703 | | | | 1,534 | | | | 6,399 | | | | 16,112 | | | |
| | | Rest of Europe | | | | | 380 | | | | 47 | | | | 28 | | | | 168 | | | | 623 | | | |
| | | Mexico | | | | | 941 | | | | 112 | | | | 153 | | | | 289 | | | | 1,495 | | | |
| | | South America | | | | | 837 | | | | 115 | | | | 41 | | | | 116 | | | | 1,109 | | | |
| | | The United States | | | | | 639 | | | | 26 | | | | 13 | | | | 80 | | | | 758 | | | |
| | | Total | | | | | 9,273 | | | | 2,003 | | | | 1,770 | | | | 7,052 | | | | 20,097 | | | |
| | | | | | | | | | | | | | | | | | | | | | | | | | |
F-76
| | | | | | | | | | | | | | |
| | | | | | | | | Millions of Euros | | | | |
| | | Impaired Assets by Geographic Area and Time Since Oldest Past-Due Amount 2011 | | Less than 6 Months Past-Due | | 6 to 9 Months Past-Due | | 9 to 12 Months Past-Due | | More than 12 Months Past-Due | | Total | | |
| | | | | | | | | | | | | | | |
| | | Spain | | 4,640 | | 1,198 | | 1,187 | | 4,482 | | 11,507 | | |
| | | Rest of Europe | | 149 | | 26 | | 33 | | 91 | | 299 | | |
| | | Mexico | | 809 | | 141 | | 130 | | 199 | | 1,280 | | |
| | | South America | | 767 | | 66 | | 38 | | 109 | | 980 | | |
| | | The United States | | 634 | | 211 | | 117 | | 549 | | 1,511 | | |
| | | Total | | 7,000 | | 1,642 | | 1,505 | | 5,429 | | 15,577 | | |
| | | | | | | | | | | | | | | |
Below are the details of the impaired financial assets as of December 31, 2013, 2012 and 2011, classified by type of loan according to its associated guarantee, and by the time since their oldest past-due amount or the period since they were deemed impaired:
| | | | | | | | | | | | | | | | |
| | | | | | | Millions of Euros | | |
| | | Impaired Assets by Type of Guarantees and Time
Since Oldest Past-Due Amount 2013 | | | | Less than 6
Months
Past-Due | | 6 to 9
Months
Past-Due | | 9 to 12
Months
Past-Due | | More than
12 Months
Past-Due | | Total | | |
| | | Unsecured loans | | | | 4,689 | | 529 | | 375 | | 1,364 | | 6,957 | | |
| | | Mortgage | | | | 7,470 | | 1,601 | | 1,218 | | 8,038 | | 18,327 | | |
| | | Residential mortgage | | | | 3,250 | | 406 | | 432 | | 2,390 | | 6,478 | | |
| | | Commercial mortgage (rural properties in operation and offices, and industrial buildings) | | | | 1,194 | | 248 | | 163 | | 1,352 | | 2,957 | | |
| | | Other than those currently use as a family residential property of the borrower | | | | 938 | | 225 | | 323 | | 2,029 | | 3,515 | | |
| | | Plots and other real estate assets | | | | 2,088 | | 722 | | 300 | | 2,267 | | 5,377 | | |
| | | Other partially secured loans | | | | 49 | | - | | - | | - | | 49 | | |
| | | Others | | | | 235 | | - | | - | | - | | 235 | | |
| | | Total | | | | 12,443 | | 2,130 | | 1,593 | | 9,402 | | 25,568 | | |
| | | | | | | | | | | | | | | | |
| | | | | | | | | | | | | | | | |
| | | | | | | Millions of Euros | | |
| | | Impaired Assets by Type of Guarantees and Time
Since Oldest Past-Due Amount 2012 | | | | Less than 6
Months
Past-Due | | 6 to 9
Months
Past-Due | | 9 to 12
Months
Past-Due | | More than 12 Months
Past-Due | | Total | | |
| | | | | | | | | | | | | | | | | |
| | | Unsecured loans | | | | 4,145 | | 539 | | 409 | | 1,195 | | 6,288 | | |
| | | Mortgage | | | | 5,080 | | 1,464 | | 1,360 | | 5,857 | | 13,761 | | |
| | | Residential mortgage | | | | 1,570 | | 516 | | 457 | | 1,796 | | 4,339 | | |
| | | Commercial mortgage (rural properties in operation and offices, and industrial buildings) | | | | 715 | | 251 | | 190 | | 1,111 | | 2,267 | | |
| | | Rest of residential mortgage | | | | 732 | | 330 | | 318 | | 1,162 | | 2,542 | | |
| | | Plots and other real estate assets | | | | 2,063 | | 367 | | 395 | | 1,788 | | 4,613 | | |
| | | Other partially secured loans | | | | 48 | | - | | - | | - | | 48 | | |
| | | Others | | | | - | | - | | - | | - | | - | | |
| | | Total | | | | 9,273 | | 2,003 | | 1,770 | | 7,052 | | 20,097 | | |
| | | | | | | | | | | | | | | | | |
| | | | | | | | | | | | | | | | |
| | | | | | | Millions of Euros | | |
| | | Impaired Assets by Type of Guarantees and Time
Since Oldest Past-Due Amount 2011 | | | | Less than 6
Months
Past-Due | | 6 to 9
Months
Past-Due | | 9 to 12
Months
Past-Due | | More than 12 Months
Past-Due | | Total | | |
| | | | | | | | | | | | | | | | | |
| | | Unsecured loans | | | | 3,382 | | 588 | | 528 | | 1,411 | | 5,910 | | |
| | | Mortgage | | | | 3,567 | | 1,054 | | 977 | | 4,016 | | 9,615 | | |
| | | Residential mortgage | | | | 1,081 | | 390 | | 357 | | 1,373 | | 3,202 | | |
| | | Commercial mortgage (rural properties in operation and offices, and industrial buildings) | | | | 629 | | 210 | | 160 | | 795 | | 1,794 | | |
| | | Rest of residential mortgage | | | | 489 | | 137 | | 166 | | 653 | | 1,445 | | |
| | | Plots and other real estate assets | | | | 1,369 | | 316 | | 294 | | 1,194 | | 3,174 | | |
| | | Other partially secured loans | | | | 52 | | - | | - | | - | | 52 | | |
| | | Others | | | | - | | - | | - | | - | | - | | |
| | | Total | | | | 7,000 | | 1,642 | | 1,505 | | 5,429 | | 15,577 | | |
| | | | | | | | | | | | | | | | | |
F-77
The breakdown of impaired loans by sector as of December 31, 2012 and 2013 is shown below:
| | | | | | | | | | | | | | | | | | | | | | | | | | |
| | | | | Millions of Euros | | |
| | | | | 2013 | | | 2012 | | |
| | | Impaired loans by sector | | Impaired
Loans | | | Loan Loss
Reserve | | | Impaired
Loans as a
% of Loans
by Type | | | Impaired
Loans | | | Loan Loss
Reserve | | | Impaired
Loans as a
% of Loans
by Type | | |
| | | Domestic: | | | | | | | | | | | | | | | | | | | | | | | | |
| | | Government | | | 158 | | | | (11) | | | | 0.71 | % | | | 145 | | | | (10) | | | 0.57% | | |
| | | Credit institutions | | | - | | | | - | | | | 0.00 | % | | | 6 | | | | - | | | - | | |
| | | Other sectors: | | | 20,826 | | | | (10,268) | | | | 12.60 | % | | | 15,013 | | | | (7,120) | | | 8.25% | | |
| | | Agriculture | | | 142 | | | | (70) | | | | 11.18 | % | | | 123 | | | | (44) | | | 8.65% | | |
| | | Industrial | | | 1,804 | | | | (886) | | | | 13.10 | % | | | 914 | | | | (387) | | | 5.56% | | |
| | | Real estate and construction | | | 10,387 | | | | (6,084) | | | | 41.02 | % | | | 8,032 | | | | (4,660) | | | 26.19% | | |
| | | Commercial and other financial | | | 1,103 | | | | (579) | | | | 7.10 | % | | | 989 | | | | (350) | | | 5.74% | | |
| | | Loans to individuals | | | 5,745 | | | | (1,660) | | | | 6.36 | % | | | 3,733 | | | | (1,171) | | | 3.88% | | |
| | | Other | | | 1,645 | | | | (988) | | | | 8.67 | % | | | 1,222 | | | | (508) | | | 6.09% | | |
| | | Total Domestic | | | 20,985 | | | | (10,279) | | | | 10.89 | % | | | 15,164 | | | | (7,130) | | | 7.20% | | |
| | | | | | | | | | | | | | | | | | | | | | | | | | | |
| | | Foreign: | | | | | | | | | | | | | | | | | | | | | | | | |
| | | Government | | | 11 | | | | (4) | | | | 0.11 | % | | | 20 | | | | (1) | | | 0.21% | | |
| | | Credit institutions | | | 33 | | | | (26) | | | | 0.19 | % | | | 29 | | | | (22) | | | 0.13% | | |
| | | Other sectors: | | | 4,449 | | | | (2,290) | | | | 3.20 | % | | | 4,787 | | | | (2,242) | | | 3.47% | | |
| | | Agriculture | | | 170 | | | | (137) | | | | 4.59 | % | | | 178 | | | | (92) | | | 5.43% | | |
| | | Industrial | | | 288 | | | | (159) | | | | 1.93 | % | | | 146 | | | | (109) | | | 1.02% | | |
| | | Real estate and construction | | | 1,734 | | | | (715) | | | | 11.44 | % | | | 1,661 | | | | (469) | | | 9.98% | | |
| | | Commercial and other financial | | | 269 | | | | (166) | | | | 0.85 | % | | | 703 | | | | (471) | | | 2.05% | | |
| | | Loans to individuals | | | 1,202 | | | | (646) | | | | 2.02 | % | | | 1,937 | | | | (961) | | | 3.50% | | |
| | | Other | | | 785 | | | | (467) | | | | 5.54 | % | | | 162 | | | | (140) | | | 1.14% | | |
| | | Total Foreign | | | 4,493 | | | | (2,320) | | | | 2.69 | % | | | 4,836 | | | | (2,265) | | | 2.85% | | |
| | | | | | | | | |
| | | General reserve | | | - | | | | (2,396) | | | | | | | | - | | | | (4,764) | | | | | |
| | | Total impaired loans | | | 25,478 | | | | (14,995) | | | | | | | | 20,000 | | | | (14,159) | | | | | |
| | | | | | | | | | | | | | | | | | | | | | | | | | | |
The changes in the year ended December 31, 2013, 2012 and 2011 in the impaired financial assets and contingent risks are as follows:
| | | | | | | | | | | | |
| | | | | | | Millions of Euros | | |
| | | Changes in Impaired Financial Assets and Contingent Risks | | | | 2013 | | 2012 | | 2011 | | |
| | | Balance at the beginning | | | | 20,409 | | 15,793 | | 15,936 | | |
| | | Additions (A) | | | | 17,708 | | 14,318 | | 13,001 | | |
| | | Decreases (B) | | | | (7,692) | | (8,236) | | (8,953) | | |
| | | Cash collections and return to performing | | | | (6,605) | | (5,968) | | (5,726) | | |
| | | Foreclosed assets (1) | | | | (1,013) | | (1,098) | | (1,404) | | |
| | | Real estate assets received in lieu of payment (2) | | | | (74) | | (1,170) | | (1,823) | | |
| | | Net additions (A)+(B) | | | | 10,016 | | 6,081 | | 4,048 | | |
| | | Amounts written-off | | | | (3,825) | | (4,372) | | (4,093) | | |
| | | Exchange differences and other (including Unnim) | | | | (622) | | 2,906 | | (98) | | |
| | | Balance at the end | | | | 25,978 | | 20,409 | | 15,793 | | |
| | | | | | | | | | | | | |
| | (1) | Reflects the total amount of impaired loans derecognized from the balance sheet throughout the period as a result of mortgage foreclosures. This is equivalent to the “Foreclosed assets auctioned” derecognized from inflows (€928,€1,037 and€1,313 million in 2013, 2012 and 2011, respectively) and the inflows corresponding to “Foreclosed assets from finance leases” (€84,€61 and€91 million in 2013, 2012 and 2011, respectively). See Note 16 to the consolidated financial statements for additional information. | |
| | (2) | Reflects the total amount of impaired loans derecognized from the balance sheet throughout the period as a result of real estate assets received in lieu of payment. Does not reflect the acquisitions of real estate assets from customers with loans not yet impaired. | |
F-78
The changes in the year ended December 31, 2013, 2012 and 2011 in financial assets derecognized from the accompanying consolidated balance sheet as their recovery is considered unlikely (hereinafter “write-offs”) is shown below:
| | | | | | | | | | | | |
| | | | | | | | | Millions of Euros | | |
| | | Changes in Impaired Financial Assets Written-Off from the Balance Sheet | | | | 2013 | | 2012 | | 2011 | | |
| | | Balance at the beginning | | | | 19,265 | | 15,870 | | 13,367 | | |
| | | Increase: | | | | 4,450 | | 4,363 | | 4,251 | | |
| | | Decrease: | | | | (2,319) | | (1,753) | | (1,863) | | |
| | | Re-financing or restructuring | | | | (1) | | (9) | | (4) | | |
| | | Cash recovery | | | | (362) | | (337) | | (326) | | |
| | | Foreclosed assets | | | | (96) | | (133) | | (29) | | |
| | | Sales of written-off | | | | (1,000) | | (283) | | (809) | | |
| | | Debt forgiveness | | | | (685) | | (541) | | (604) | | |
| | | Time-barred debt and other causes | | | | (175) | | (450) | | (91) | | |
| | | Net exchange differences | | | | (645) | | 785 | | 114 | | |
| | | Balance at the end | | | | 20,752 | | 19,265 | | 15,870 | | |
| | | | | | | | | | | | | |
As indicated in Note 2.2.1, although they have been derecognized from the balance sheet, the BBVA Group continues to attempt to collect on these write-offs, until the rights to receive them are fully extinguished, either because it is time-barred debt, the debt is forgiven, or other reasons.
7.1.7 Impairment losses
Below is a breakdown of the provisions recognized on the accompanying consolidated balance sheets to cover estimated impairment losses as of December 31, 2013, 2012 and 2011 in financial assets and contingent risks, according to the different headings under which they are classified in the accompanying consolidated balance sheet:
| | | | | | | | | | | | | | |
| | | | | | | | | | Millions of Euros | | |
| | | Impairment losses and provisions for contingent risks | | Notes | | | 2013 | | 2012 | | 2011 | | |
| | | Available-for-sale portfolio | | | 12 | | | 198 | | 339 | | 566 | | |
| | | Loans and receivables | | | 13 | | | 14,995 | | 14,159 | | 9,139 | | |
| | | Loans and advances to customers | | | 13.2 | | | 14,950 | | 14,115 | | 9,091 | | |
| | | Loans and advances to credit institutions | | | 13.1 | | | 40 | | 29 | | 38 | | |
| | | Debt securities | | | 13.3 | | | 5 | | 15 | | 11 | | |
| | | Held to maturity investment | | | 14 | | | - | | - | | 1 | | |
| | | Impairment losses | | | | | | 15,192 | | 14,498 | | 9,705 | | |
| | | Provisions to Contingent Risks and Commitments | | | 25 | | | 346 | | 322 | | 266 | | |
| | | Total | | | | | | 15,538 | | 14,820 | | 9,971 | | |
| | | Of which: | | | | | | | | | | | | |
| | | For impaired portfolio | | | | | | 12,969 | | 9,861 | | 6,883 | | |
| | | For currently non-impaired portfolio | | | | | | 2,569 | | 4,959 | | 3,088 | | |
| | | | | | | | | | | | | | | |
F-79
Below are the changes in the years ended December 31, 2013, 2012 and 2011 in the estimated impairment losses, broken down by the headings in the accompanying consolidated balance sheet:
| | | | | | | | | | | | | | |
| | | | | Millions of Euros |
| | | 2013 | | Notes | | Available-for-
sale portfolio | | Loans and
receivables | | Contingent Risks and
Commitments | | Total | | |
| | | Balance at the beginning | | | | 339 | | 14,159 | | 322 | | 14,820 | | |
| | | Increase in impairment losses charged to income | | | | 55 | | 10,816 | | 85 | | 10,955 | | |
| | | Decrease in impairment losses credited to income | | | | (19) | | (4,878) | | (46) | | (4,944) | | |
| | | Impairment losses (net)(*) | | 48-49 | | 36 | | 5,938 | | 38 | | 6,011 | | |
| | | Entities incorporated/disposed in the year | | | | - | | (30) | | (1) | | (31) | | |
| | | Transfers to written-off loans | | | | (164) | | (3,673) | | - | | (3,838) | | |
| | | Exchange differences and other | | | | (12) | | (1,398) | | (13) | | (1,424) | | |
| | | Balance at the end | | | | 198 | | 14,995 | | 346 | | 15,538 | | |
| | | | | | | | | | | | | | | |
| | | | | | | | | | | | | | |
| | | | | Millions of Euros | | |
| | | 2012 | | Notes | | Available-for-
sale portfolio | | Loans and
receivables | | Contingent
Risks and
Commitments | | Total | | |
| | | Balance at the beginning | | | | 566 | | 9,138 | | 266 | | 9,970 | | |
| | | Increase in impairment losses charged to income | | | | 71 | | 10,419 | | 91 | | 10,581 | | |
| | | Decrease in impairment losses credited to income | | | | (30) | | (2,266) | | (36) | | (2,331) | | |
| | | Impairment losses (net) | | 48-49 | | 41 | | 8,153 | | 55 | | 8,250 | | |
| | | Entities incorporated in the year | | | | 1 | | 2,066 | | 5 | | 2,073 | | |
| | | Transfers to written-off loans | | | | (18) | | (4,107) | | - | | (4,125) | | |
| | | Exchange differences and other | | | | (251) | | (1,092) | | (4) | | (1,348) | | |
| | | Balance at the end | | | | 339 | | 14,159 | | 322 | | 14,821 | | |
| | | | | | | | | | | | | | | |
| | | | | | | | | | | | | | |
| | | | | Millions of Euros | | |
| | | 2011 | | Notes | | Available-for-
sale portfolio | | Loans and
receivables | | Contingent
Risks and
Commitments | | Total | | |
| | | Balance at the beginning | | | | 619 | | 9,473 | | 264 | | 10,356 | | |
| | | Increase in impairment losses charged to income | | | | 60 | | 5,963 | | 16 | | 6,038 | | |
| | | Decrease in impairment losses credited to income | | | | (37) | | (1,473) | | (24) | | (1,534) | | |
| | | Impairment losses (net)(*) | | 48-49 | | 23 | | 4,490 | | (8) | | 4,504 | | |
| | | Entities incorporated in the year | | | | - | | 32 | | - | | 32 | | |
| | | Transfers to written-off loans | | | | (75) | | (4,039) | | - | | (4,114) | | |
| | | Exchange differences and other | | | | (1) | | (818) | | 11 | | (808) | | |
| | | Balance at the end | | | | 566 | | 9,138 | | 266 | | 9,972 | | |
| | | | | | | | | | | | | | | |
| | (*) | Includes impairment losses on financial assets (Note 49) and the provisions for contingent risks (Note 48). |
7.1.8 Refinancing and restructuring operations
Group policies and principles with respect to refinancing or restructuring operations
Refinancing/restructuring operations (see definition in the Glossary) are carried out with customers who have requested such an operation in order to meet their current debt payments if they are expected, or may be expected, to experience financial difficulty in making the payments in the future.
The basic aim of a refinanced/restructured operation is to provide the customer with a situation of financial viability over time by adapting repayment of the debt incurred with the Group to the customer’s new situation of fund generation. The use of refinancing or restructuring with for other purposes, such as for delaying loss recognition, is contrary to BBVA Group policies.
The BBVA Group’s refinancing/restructuring policies are based on the following general principles:
| — | | Refinancing and restructuring is authorized according to the capacity of customers to pay the new installments. This is done by first identifying the origin of the payment difficulties and then carrying out an analysis of the customers’ viability, including an updated analysis of their economic and financial situation and capacity to pay and generate funds. If the customer is a company, the analysis also covers the situation of the sector in which it operates. |
F-80
| — | | With the aim of increasing the solvency of the operation, new guarantees and/or guarantors of demonstrable solvency are obtained where possible. An essential part of this process is an analysis of the effectiveness of both the new and original guarantees submitted. |
| — | | This analysis is carried out from the overall customer or group perspective, and not only from the perspective of a specific operation. |
| — | | Refinancing and restructuring operations do not in general increase the amount of the customer’s debt, except for the expenses inherent to the operation itself. |
| — | | The capacity to refinance and restructure debt is not delegated to the branches, but decided on by the risk units. |
| — | | The decisions adopted are reviewed from time to time with the aim of checking full compliance with refinancing and restructuring policies. |
These general principles are adapted in each case according to the conditions and circumstances of each geographical area in which the Group operates, and to the different types of customers involved.
In the case of retail customers (private individuals), the main aim of the BBVA Group’s policy on refinancing/restructuring debt is to avoid default arising from a customer’s temporary liquidity problems by implementing structural solutions that do not increase the customer’s debt. The solution required is adapted to each case and the debt repayment is made easier, in accordance with the following principles:
| — | | Analysis of the viability of operations based on the customer’s willingness and ability to pay, which may be reduced, but should nevertheless be present. The customer must therefore repay at least the interest on the operation in all cases. No arrangements may be concluded that involve a grace period for both capital and interest. |
| — | | No refinancing/restructuring operations may be concluded on debt that is not incurred with the BBVA Group. |
| — | | Customers subject to refinancing or restructuring operations are excluded from commercial campaigns of any kind. |
In the case of wholesale customers (basically businesses and corporations), refinancing/restructuring is authorized according to an economic and financial viability plan based on:
| — | | Forecast future income, margins and cash flows over a sufficiently long period (around five years) to allow entities to implement cost adjustment measures (industrial restructuring) and a business development plan that can help reduce the level of leverage to sustainable levels (capacity to access the financial markets). |
| — | | Where appropriate, the existence of a divestment plan for assets and/or business segments that can generate cash to assist the deleveraging process. |
| — | | The capacity of shareholders to contribute capital and/or guarantees that can support the viability plan. |
In accordance with the Group’s policy, the conclusion of a debt refinancing/restructuring operation does not imply the debt is reclassified from “impaired” or “potential problem” to outstanding risk; such a reclassification must be based on the analysis mentioned earlier of the viability and effectiveness of the new guarantees submitted.
The Group maintains the policy of including risks related to refinanced/restructured assets as either:
| — | | “Impaired assets”, as although the customer is up to date with payments, they are classified as impaired for reasons other than their default when there are significant doubts that the terms of their refinancing may not be met;. |
| — | | “Potential problem assets”, because there is some material doubt as to possible non-compliance with the refinanced operation; or. |
| — | | “Normal-risk assets” (although as mentioned in the table in the following section, they continue to be classified as “normal-risk assets with special monitoring” until the conditions established for their consideration as outstanding risk are met). |
The conditions established for “normal-risk assets with special monitoring” to be reclassified out of this special monitoring category are as follows:
| — | | The customer must have paid past-due amounts (principal and interest) since the date of the renegotiation or restructuring of the operation; |
F-81
| — | | At least two years must have elapsed since the renegotiation or restructuring of the operation; |
| — | | The customer must have paid at least 20% of the outstanding principal amount of the loan as well as all the past-due amounts (principal and interest) that were outstanding as of the date of the renegotiation or restructuring of the operation; and |
| — | | It is unlikely that the borrower will have financial difficulties and, therefore, it is expected that the borrower will be able to meet its debt payment obligations (principal and interest) in a timely manner. |
The BBVA Group’s refinancing/restructuring policy provides for the possibility of multiple modifications, which shall be approved on an individual basis based on the risk profile of the relevant customer and its degree of compliance with the prior payment calendar.
The internal models used to determine allowances for loan losses consider the restructuring or renegotiation of a loan, as well as re-defaults on a loan, by assigning a lower internal rating to restructured/renegotiated loans than the average internal rating assigned to non-restructured/renegotiated loans. This downgrade results in an increase in the probability of default (PD) assigned to restructured/renegotiated loans (with the resulting PD being higher than the average PD of the non-renegotiated loans in the same portfolios).”
F-82
Quantitative information on refinancing and restructuring operations:
| | | | | | | | | | | | | | | | | | |
| | | | | | | | | | |
| | | | | | | | | | | | | | | | | | | |
| | | | | BBVA GROUP DECEMBER 2013 BALANCE OF FORBEARANCE (Millions of Euros) | | | | | | | | |
| | | | | | | | | | | | | | | | | | | |
| | | | | NORMAL | | | | |
| | | | | Real estate mortgage
secured | | Rest of secured loans (a) | | Unsecured loans | | | | |
| | | | | Number of
operations | | Gross amount | | Number of operations | | Gross amount | | Number of operations | | Gross amount | | | | |
| | | 1 Government agencies | | 4 | | 466 | | 13 | | 45 | | 29 | | 811 | | | | |
| | | 2 Other legal entities and individual entrepreneurs | | 7,289 | | 2,108 | | 1,121 | | 204 | | 22,531 | | 2,380 | | | | |
| | | Of which: Financing the construction and property development | | 1,131 | | 635 | | 72 | | 20 | | 306 | | 199 | | | | |
| | | 3 Other individuals | | 60,366 | | 2,587 | | 5,506 | | 643 | | 87,169 | | 414 | | | | |
| | | 4 Total | | 67,659 | | 5,161 | | 6,640 | | 892 | | 109,729 | | 3,605 | | | | |
| | | | | | | | | | | | | | | | | | | |
| | | | | | | | | | | | | | | | | | | |
| | | | | | | | | | | | | | | | | | | |
| | | | | POTENTIAL PROBLEM LOANS | | |
| | | | | Real estate mortgage
secured | | Rest of secured loans (a) | | Unsecured loans | | Specific coverage | | |
| | | | | Number of operations | | Gross amount | | Number of operations | | Gross amount | | Number of operations | | Gross amount | | | |
| | | 1 Government agencies | | 1 | | 1 | | - | | - | | 2 | | 25 | | 1 | | |
| | | 2 Other legal entities and individual entrepreneurs | | 3,014 | | 1,381 | | 867 | | 468 | | 8,158 | | 1,497 | | 641 | | |
| | | Of which: Financing the construction and property development | | 640 | | 623 | | 131 | | 178 | | 142 | | 123 | | 322 | | |
| | | 3 Other individuals | | 31,883 | | 1,987 | | 5,681 | | 837 | | 22,496 | | 231 | | 218 | | |
| | | 4 Total | | 34,898 | | 3,369 | | 6,548 | | 1,304 | | 30,656 | | 1,753 | | 860 | | |
| | | | | | | | | | | | | | | | | | | |
| | | | | | | | | | | | | | | | | | | |
| | | | | | | | | | | | | | | | | | | |
| | | | | IMPAIRED | | |
| | | | | Real estate mortgage
secured | | Rest of secured loans (a) | | Unsecured loans | | Specific coverage | | |
| | | | | Number of
operations | | Gross
amount | | Number of
operations | | Gross amount | | Number of
operations | | Gross
amount | | | |
| | | 1 Government agencies | | 1 | | 1 | | 4 | | 13 | | 13 | | 2 | | 0 | | |
| | | 2 Other legal entities and individual entrepreneurs | | 8,446 | | 4,998 | | 4,529 | | 3,066 | | 16,761 | | 2,001 | | 4,821 | | |
| | | Of which: Financing the construction and property development | | 3,264 | | 3,370 | | 2,508 | | 2,441 | | 1,146 | | 580 | | 3,435 | | |
| | | 3 Other individuals | | 34,248 | | 2,094 | | 13,111 | | 2,314 | | 59,463 | | 347 | | 1,243 | | |
| | | 4 Total | | 42,695 | | 7,093 | | 17,644 | | 5,392 | | 76,237 | | 2,349 | | 6,065 | | |
| | | | | | | | | | | | | | | | | | | |
| | | | | | | | | | | | | | | | | | | |
| | | | | | | | | | | | | | | | | | | |
| | | | | TOTAL | | |
| | | | | Real estate mortgage
secured | | Rest of secured loans (a) | | Unsecured loans | | Specific coverage | | |
| | | | | Number of
operations | | Gross
amount | | Number of
operations | | Gross amount | | Number of
operations | | Gross
amount | | | |
| | | 1 Government agencies | | 6 | | 468 | | 17 | | 58 | | 44 | | 838 | | 1 | | |
| | | 2 Other legal entities and individual entrepreneurs | | 18,749 | | 8,488 | | 6,517 | | 3,737 | | 47,450 | | 5,878 | | 5,463 | | |
| | | Of which: Financing the construction and property development | | 5,035 | | 4,629 | | 2,711 | | 2,640 | | 1,594 | | 901 | | 3,757 | | |
| | | 3 Other individuals | | 126,497 | | 6,667 | | 24,298 | | 3,793 | | 169,128 | | 991 | | 1,462 | | |
| | | 4 Total | | 145,252 | | 15,623 | | 30,832 | | 7,588 | | 216,622 | | 7,707 | | 6,925 | | |
| | | | | | | | | | | | | | | | | | | |
| | | | | | | | | | | | | | | | | | | |
| | (a) | Includes mortgage-backed real estate operations with loan to values greater than 1, and secured operations, other than transactions secured by real estate mortgage whatever their loan to value. | |
In addition to these restructuring and refinancing transactions mentioned in this section, loans that were not considered impaired or renegotiated have been modified based on the criteria set out in paragraph 59 (c) of IAS 39. These loans have not been classified as renegotiated or impaired, since they were modified for commercial or competitive reasons (for instance, to improve our relationship with the client) rather than for economic or legal reasons relating to the borrower’s financial situation.
F-83
NPL Ratio by type of renegotiated loan
The non performing ratio of the renegotiated portfolio is defined as the impaired balance of renegotiated loans that shows signs of difficulties as of the closing of the reporting period, divided by the total payment outstanding in that portfolio.
As of December 31, 2013, the non performing ratio for each of the portfolios of renegotiated loans is as follows:
| | | | | | |
| | | | | | | |
| | December 2013 NPL ratio renegotiated loan portfolio | | | |
| | Government agencies | | 1% | |
| | Commercial | | 56% | |
| | Of which: Construction and developer | | 78% | |
| | Other consumer | | 42% | |
| | | | | |
45% of the renegotiated loans classified as impaired was for reasons other than default (delinquency).
7.2 Market risk
Most of the headings on the Group’s balance sheet that are subject to market risk are positions whose main metric for measuring their market risk is VaR.
Trading portfolio activities
The activity of each of the Group’s trading floors is controlled and monitored by the risk unit. Measurement procedures are established in terms of the possible impact of negative market conditions on the trading portfolio of the Group’s Global Markets units, both under ordinary circumstances and in situations of heightened risk factors.
The measurement model used to assess market risk is Value at Risk (VaR), which provides a forecast with a 99% probability of the maximum loss that can be incurred by the market positions of trading portfolios in a one-day horizon, stemming from fluctuations in equity prices, interest rates, foreign-exchange rates and commodity prices. In addition, for some positions, other risks also need to be considered, such as credit spread risk, basis risk, volatility and correlation risk.
BBVA and BBVA Bancomer have received approval from the Bank of Spain to use a model developed by the BBVA Group to calculate bank capital requirements for market risk. This model estimates VaR in accordance with the “historical simulation” methodology, which involves estimating the losses or gains that would have been produced in the current portfolio if the changes in market conditions occurring over a specific period of time were repeated. Using this information, it infers the maximum foreseeable loss in the current portfolio with a given level of confidence. It has the advantage of precisely reflecting the historical distribution of the market variables and not requiring any assumption of specific probability distribution. The historical period used in this model is two years.
In addition, the Bank follows the guidelines set out by Spanish and European authorities regarding other metrics to meet the Bank of Spain’s regulatory requirements. The new measurements of market risk for the trading portfolio include the calculation of stressed VaR (which quantifies the level of risk in extreme historical situations) and the quantification of default risks and downgrading of credit ratings of bonds and credit portfolio derivatives.
The limits structure of the BBVA Group’s market risk determines a system of VaR and economic capital limits by market risk for each operating segment, with specific ad-hoc sub-limits by type of risk, activity and trading desk.
Validity tests are performed periodically on the risk measurement models used by the Group. They estimate the maximum loss that could have been incurred in the positions assessed with a certain level of probability (backtesting), as well as measurements of the impact of extreme market events on risk positions (stress testing). As an additional control measure, backtesting is conducted at trading desk level in order to enable more specific monitoring of the validity of the measurement models.
F-84
Trends in market risk
The changes in the BBVA Group’s market risk in 2013, measured as VaR without smoothing, with a 99% confidence level and a 1-day horizon, are as follows:
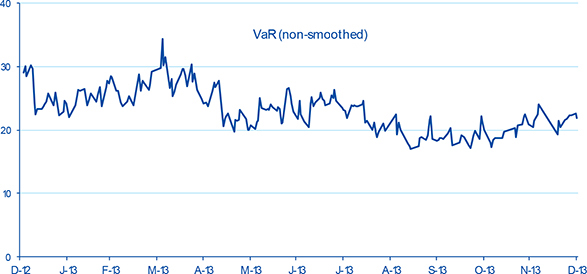
By geographical area, and as an annual average in 2013, 49.2% of the market risk corresponds to Global Markets (GM) Europe and GM Compass and 50.8% to the Group’s banks in Latin America, of which 35.0% is in GM Bancomer.
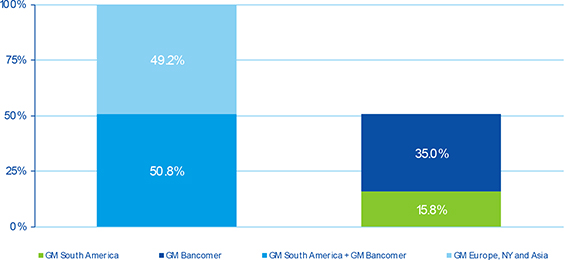
The average VaR in 2013 stood at€23 million, compared with€22 million in 2012 and€24 million in 2011. The number of risk factors currently used to measure portfolio risk is around 3,600. This number is dynamic and varies according to the possibility of doing business in other underlying assets and markets.
F-85
As of December 30, 2013, 2012 and 2011 VaR amounted to€22 million,€30 million and€18 million, respectively. These figures can be broken down as follows:
| | | | | | | | | | | | | | | | | | |
| | | | | | | | | | | | | | | | | | | |
| | | | | | | Millions of Euros |
| | | VaR by Risk Factor | | | | Interest/Spread
risk | | Currency risk | | Stock-market
risk | | Vega/Correlation
risk | | Diversification
effect(*) | | Total | | |
| | | 2012 | | | | | | | | | | | | | | | | |
| | | VaR average in the period | | | | - | | - | | - | | - | | - | | 23 | | |
| | | VaR max in the period | | | | 39 | | 4 | | 2 | | 13 | | (24) | | 34 | | |
| | | VaR min in the period | | | | 19 | | 3 | | 2 | | 11 | | (18) | | 17 | | |
| | | End of period VaR | | | | 22 | | 4 | | 3 | | 11 | | (18) | | 22 | | |
| | | | | | | | | | | | | | | | | | | |
| | | 2011 | | | | | | | | | | | | | | | | |
| | | VaR average in the period | | | | - | | - | | - | | - | | - | | 22 | | |
| | | VaR max in the period | | | | 35 | | 2 | | 3 | | 11 | | (21) | | 31 | | |
| | | VaR min in the period | | | | 21 | | 3 | | 1 | | 11 | | (21) | | 15 | | |
| | | End of period VaR | | | | 35 | | 3 | | 3 | | 9 | | (19) | | 30 | | |
| | | | | | | | | | | | | | | | | | | |
| | | 2010 | | | | | | | | | | | | | | | | |
| | | VaR average in the period | | | | - | | - | | - | | - | | - | | 24 | | |
| | | VaR max in the period | | | | - | | - | | - | | - | | - | | 36 | | |
| | | VaR min in the period | | | | - | | - | | - | | - | | - | | 16 | | |
| | | End of period VaR | | | | 27 | | 3 | | 7 | | 4 | | (23) | | 18 | | |
| | | | | | | | | | | | | | | | | | | |
| | (*) | The diversification effect is the difference between the sum of the average individual risk factors and the total VaR figure that includes the implied correlation between all the variables and scenarios used in the measurement. | |
By type of market risk assumed by the Group’s trading portfolio, as of December 31, 2013, the main risks were interest-rate and credit spread risks, which declined by€13 million on the figure for December 31, 2012. Currency risk increased by€1 million and volatility and correlation risk increased by€2 million. Equity risk remained without significant changes with respect to the close of 2012.
The average daily change in VaR in 2013 on 2012 is basically due to Global Market Bancomer and Global Market South America increasing their average risk by 57% and 7% respectively in 2013 (with an average daily VaR of€8 million and€4 million, respectively). Global Market Europe reduced its average risk by 18% (with an average daily VaR in 2013 of€11 million).
Model validation
The internal market risk model is validated periodically by backtesting, both in BBVA, S.A. and in Bancomer.
The aim of backtesting is to validate the quality and precision of the internal model used by the BBVA Group to estimate the maximum daily loss of a portfolio, at a 99% level of confidence and a 250-day time horizon, by comparing the Group’s results and the measurements of risk generated by the model. These tests showed that the internal market risk model of both BBVA, S.A. and Bancomer is adequate and precise.
Two types of backtesting were carried out in 2013:
| | 1. | “Hypothetical” backtesting: the daily VaR is compared with the results obtained, not taking into account the intraday results or the changes in the portfolio positions. This validates the appropriateness of the market risk metrics for the end-of-day position. |
| | 2. | “Real” backtesting: the daily VaR is compared with the total results, including intraday transactions, but discounting the possible minimum charges or fees involved. This type of backtesting includes the intraday risk in portfolios. |
In addition, each of these two types of backtesting was carried out at the level of risk factor or business type, thus making a deeper comparison of the results with respect to risk measurements.
In 2013, Bancomer carried out backtesting of the internal calculation model of VaR, comparing the daily results obtained with the estimated risk level estimated by the VaR calculation model. At the end of the year the comparison showed the model was functioning correctly, within the “green” zone (0-4 exceptions), thus validating the model, as has occurred each year since the internal market risk model was approved for the Group.
Backtesting in BBVA, S.A. did not reveal any exception in the year 2013. The sovereign debt and Spanish corporate credit spreads continued to narrow during the year and the equity markets have in general moved upward. To sum up, the backtesting carried out in 2013, both at the global group level and at the level of risk factor, did not detect any type of anomaly in the VaR calculation model.
F-86
In the case of Bancomer, portfolio losses only exceeded the daily VaR on one occasion, thus also validating the correct operation of the model according to Basel criteria.
| | |
| Backtesting of the market risk model for BBVA SA | | Backtesting of the market risk model for BBVA Bancomer |
| |
 | |  |
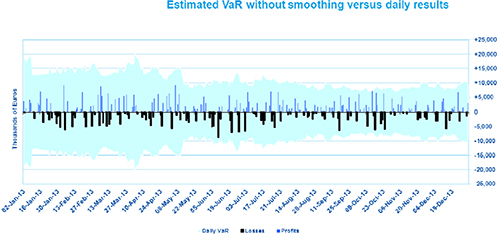
Stress test analysis
A number of stress tests are carried out on the BBVA Group’s trading portfolios. First, global and local historical scenarios are used that replicate the behavior of an extreme past event, such as for example the collapse of Lehman Brothers or the “Tequilazo” crisis. These stress tests are complemented with simulated scenarios, where the aim is to generate scenarios that have a significant impact on the different portfolios, but without being anchored to any specific historical scenario. Finally, for some portfolios or positions, fixed stress tests are also carried out that have a significant impact on the market variables affecting these positions.
Historical scenarios
The historical benchmark stress scenario for the BBVA Group is Lehman Brothers, whose sudden collapse in September 2008 led to a significant impact on the behavior of financial markets at a global level. The following are the most relevant effects of this historical scenario:
| — | | Credit shock: reflected mainly in the increase of credit spreads and downgrades in credit ratings. |
| — | | Increased volatility in most of the financial markets (giving rise to a great deal of variation in the prices of different assets (currency, equity, debt). |
| — | | Liquidity shock in the financial systems, reflected by a major movement in interbank curves, particularly in the shortest sections of the euro and dollar curves. |
Simulated scenarios
Unlike the historical scenarios, which are fixed and thus do not adapt to the composition of portfolio risks at any one time, the scenario used to carry out the economic stress tests are based on a resampling methodology. This methodology uses dynamic scenarios that are recalculated regularly according to the main risks in the trading portfolios at any time. A simulation exercise is carried out on a window of data that is sufficiently extensive to include different periods of stress (data are taken from January 1, 2008 through to today), using a resampling of
F-87
the historical observations. This generates a distribution of losses and gains that provides an analysis of the most extreme events occurred within the selected historical window. The advantage of this methodology is that the stress period is not pre-established, but rather a function of the portfolio held at any time. As it makes a high number of simulations (10,000) it can analyze the expected shortfall with greater richness of information than that available in the scenarios included in the VaR calculation.
The main characteristics of this methodology are the following:
| — | | The simulations generated respect the data correlation structure. |
| — | | There is flexibility in terms of inclusion of new risk factors. |
| — | | It allows a great deal of variability to be introduced into the simulations (desirable for considering extreme events). |
Structural risk
Structural interest-rate risk
The aim of on-balance-sheet interest-rate risk management is to maintain the BBVA Group’s exposure to market interest-rate fluctuations at levels in keeping with its risk strategy and profile. In pursuance of this, the BBVA Group undertakes active balance-sheet management through operations intended to optimize the levels of risk assumed against expected earnings and respect the maximum levels of accepted risk. The Asset and Liabilities Committee (ALCO) is the body that makes the decisions to act according to the proposals of the Balance-Sheet Management unit, which designs and executes the strategies to be implemented, using internal risk metrics in accordance with the corporate model.
The Corporate Risk Management (CRM) area acts as an independent unit responsible for monitoring and analyzing risks, standardizing risk management metrics and providing tools that can anticipate potential deviations from targets. In addition, it monitors the level of compliance with the risk limits established by the Executive Committee, reporting regularly to the Risk Management Committee (RMC), the Board’s Risk Committee and the Executive Committee, in particular in case of significant levels of risk assumed, in accordance with current corporate policy.
The interest-rate risk metrics designed by the CRM area periodically quantify the impact that a variation of 100 basis points in market interest rates would have on the BBVA Group’s net interest income and economic value (see Glossary). This is complemented with metrics in probabilistic terms; “economic capital” (maximum estimated loss in economic value) and the “risk margin” (the maximum estimated loss in net interest income). In all cases, the metrics are calculated as originated by the structural interest-rate risk of banking activity (excluding trading floor activity), based on simulation models of interest-rate curves. With the same frequency, the Group performs stress tests and scenario analyses to complement its assessment of its interest-rate risk profile.
The BBVA Group’s corporate risk model allows hypotheses to be established on the behavior of certain products, particularly those without explicit or contractual expiry. These assumptions are based on studies that calculate the relationship between the return on these products and market rates. They enable specific balances to be disaggregated into “trend-based” (long-term) and “seasonal or volatile” (short-term residual maturity) balances.
In 2013, the weakness of the economic recovery, together with the fiscal adjustments and risks of deflation, have maintained interest rates in Europe and the U.S. at all-time lows. At the same time, the growth of emerging markets has slowed as a result of the fall in commodity prices and tougher financing conditions, leading to more expansive policies by central banks. In this interest-rate situation, the BBVA Group’s structural interest-rate risk has remained under control, within the limits established by the Executive Committee. The current levels of the euro and US dollar, which are exceptionally low, also constitute a barrier to the Group’s exposure, which has a favorable position with respect to rises in market rates.
F-88
Below are the average interest-rate risk exposure levels in terms of sensitivity of the main geographical areas of the BBVA Group in 2013:
| | | | | | | | | | | | | | |
| | | | | | | | | | | | | | | |
| | | | | | | Impact on Net Interest Income
(*) | | Impact on Economic Value (**) | | |
| | | Sensitivity to interest-rate analysis - December 2013 | | | | 100 Basis-
Point Increase | | 100 Basis-
Point Decrease | | 100 Basis-
Point Increase | | 100 Basis-
Point Decrease | | |
| | | Europe | | | | 6.41% | | (7.80)% | | 1.58% | | (1.92)% | | |
| | | Mexico | | | | 2.27% | | (2.27)% | | (1.39)% | | 1.59% | | |
| | | USA | | | | 6.27% | | (8.11)% | | 1.60% | | (6.51)% | | |
| | | South America | | | | 1.53% | | (1.39)% | | (2.93)% | | 3.01% | | |
| | | BBVA Group | | | | 3.42% | | (3.90)% | | 0.80% | | (1.66)% | | |
| | | | | | | | | | | | | | | |
| | (*) | Percentage of “1 year” net interest income forecast for each unit. |
| | (**) | Percentage of core capital for each unit. |
Structural currency risk
Structural currency risk is basically caused by exposure to variations in foreign-currency exchange rates that arise in the BBVA Group’s foreign subsidiaries and foreign branches financed in a different currency to that of the investment.
Structural exchange-rate risk management in BBVA aims to minimize the potential negative impact from fluctuations in exchange rates on the capital ratios and on the contribution to earnings of international investments maintained on a long-term basis by the Group.
The Asset and Liabilities Committee (ALCO) is the body that makes the decisions to act according to the proposals of the Balance-Sheet Management unit, which designs and executes the strategies to be implemented, using internal risk metrics in accordance with the corporate model.
The Corporate Risk Management (CRM) area acts as an independent unit responsible for monitoring and analyzing risks, standardizing risk management metrics and providing tools that can anticipate potential deviations from targets. In addition, it monitors the level of compliance with the risk limits established by the Executive Committee, reporting regularly to the Risk Management Committee (RMC), the Board’s Risk Committee and the Executive Committee, in particular in case of significant levels of risk assumed, in accordance with current corporate policy.
The corporate measurement model is based on the simulation of exchange-rate scenarios, using their historical change and evaluating impacts in three core management areas: capital ratio, equity and the Group’s income statement. The risk mitigation measures aimed at reducing exchange-rate risk exposures are considered in calculating risk estimates. The diversification resulting from investment in different geographical areas is also taken into account. In addition, in order to complement the metrics in the three core management areas, the risk measurements are complemented with analyses of scenarios, stress testing and backtesting, thus giving a more complete overview of the Group’s exposure.
In 2013, in an environment characterized by uncertainty and volatility in currency markets, the risk mitigation level of the carrying value of the BBVA Group’s holdings in foreign currency remained at 39%. The estimated exposure coverage of 2013 earnings in foreign currency has been 43%.
In 2013, the average asset exposure sensitivity to a 1% depreciation in exchange rates against the euro in the main currencies to which BBVA is exposed stood at€200 million, with 34% in the Mexican peso, 26% in South American currencies, 23% in Asian and Turkish currencies, and 15% in the US dollar.
Structural equity risk
The BBVA Group’s exposure to structural equity risk is basically derived from investments in industrial and financial companies with medium- and long-term investment horizons. This exposure is mitigated through net short positions held in derivatives of their underlying assets, used to limit portfolio sensitivity to potential falls in prices.
F-89
The Corporate Risk Management (CRM) area acts as an independent unit responsible for monitoring and analyzing risks, standardizing risk management metrics and providing tools that can anticipate potential deviations from targets. In addition, it monitors the level of compliance with the risk limits established by the Executive Committee, reporting regularly to the Risk Management Committee (RMC), the Board’s Risk Committee and the Executive Committee, in particular in case of significant levels of risk assumed, in accordance with current corporate policy.
The structural equity risk metrics designed by CRM according to the corporate model contribute to the effective monitoring of risk by estimating the sensitivity figures and the capital necessary to cover possible unexpected losses due to variations in the value of the companies making up the Group’s equity portfolio, at a confidence level that corresponds to the institution’s target rating, and taking into account the liquidity of the positions and the statistical performance of the assets under consideration. These figures are supplemented by periodic stress tests, backtesting and scenario analyses.
The aggregate sensitivity of the BBVA Group’s consolidated equity to a 1% fall in the price of shares stood at€31 million as of December 31, 2013, and the sensitivity of pre-tax profit is estimated at€1 million. These figures are estimated taking into account the exposure in shares valued at market prices, or if not applicable, at fair value (except for the positions in the Treasury Area portfolios) and the net delta-equivalent positions in options on their underlyings.
7.3 Liquidity risk
The aim of liquidity risk management, tracking and control is to ensure, in the short term, that the payment commitments of the BBVA Group entities can be duly met without having to resort to borrowing funds under burdensome terms, or damaging the image and reputation of the entities. In the medium term the aim is to ensure that the Group’s financing structure is ideal and that it is moving in the right direction with respect to the economic situation, the markets and regulatory changes.
Management of liquidity and structural finance within the BBVA Group is based on the principle of the financial autonomy of the entities that make it up. This approach helps prevent and limit liquidity risk by reducing the Group’s vulnerability in periods of high risk. This decentralized management avoids possible contagion due to a crisis that could affect only one or various BBVA Group entities, which must cover their liquidity needs independently in the markets where they operate. Liquidity Management Units have been set up for this reason in the geographical areas where the main foreign subsidiaries operate, and also for the parent BBVA S.A.
Thus a core principle of the BBVA Group’s liquidity management is the financial independence of its banking subsidiaries. This aims to ensure that the cost of liquidity is correctly reflected in price formation. Accordingly, a liquidity pool is maintained at an individual entity level, both in Banco Bilbao Vizcaya Argentaria, S.A. and in the banking subsidiaries, including BBVA Compass, BBVA Bancomer and the Latin American subsidiaries. The only exception to this principle is Banco Bilbao Vizcaya Argentaria (Portugal), S.A., which is funded by Banco Bilbao Vizcaya Argentaria, S.A. Banco Bilbao Vizcaya Argentaria (Portugal), S.A. accounted for 0.91% of total consolidated assets and 0.56% of total consolidated liabilities as of December 31, 2013.
The Group’s main source of funds is the customer deposit base, which consists primarily of demand, savings and time deposit accounts. In addition to relying on customer deposits, the Group also accesses the interbank market (overnight and time deposits) and domestic and international capital markets for our additional liquidity requirements. To access the capital markets, a series of domestic and international programs are in place for the issuance of commercial paper and medium- and long-term debt. A diversified liquidity pool of liquid assets and securitized assets are also generally maintained an individual entity level. Another source of liquidity is generation of cash flow from operations. Finally, funding requirements are supplemented with borrowings from the Bank of Spain and the European Central Bank (ECB) or the respective central banks of the countries where the subsidiaries are located.
F-90
The table below shows the types and amounts of instruments included in the liquidity pool of the most significant units:
| | | | | | | | | | | | |
| | | | | Millions of Euros | | | | |
| | | 2013 | | BBVA Eurozone (1) | | BBVA Bancomer | | BBVA
Compass | | Others | | |
| | | | | | | |
| | | Cash and balances with central banks | | 10,826 | | 6,159 | | 1,952 | | 6,843 | | |
| | | Assets for credit operations with central banks | | 32,261 | | 3,058 | | 9,810 | | 7,688 | | |
| | | Central governments issues | | 16,500 | | 229 | | 904 | | 7,199 | | |
| | | Of Which: Spanish government securities | | 14,341 | | - | | - | | - | | |
| | | Other issues | | 15,761 | | 2,829 | | 2,224 | | 489 | | |
| | | Loans | | - | | - | | 6,682 | | - | | |
| | | Other non-eligible liquid assets | | 4,735 | | 425 | | 278 | | 396 | | |
| | | ACCUMULATED AVAILABLE BALANCE | | 47,822 | | 9,642 | | 12,040 | | 14,927 | | |
| | | | | | | | | | | | |
| | (1) | Included Banco Bilbao Vizcaya Argentaria, S.A. y Banco Bilbao Vizcaya Argentaria (Portugal), S.A. |
The Asset and Liabilities Committee (ALCO) is the body that makes the decisions to act according to the proposals of the Balance-Sheet Management unit, which designs and executes the strategies to be implemented, using internal risk metrics in accordance with the corporate model. Both the evaluation and execution of actions in each of the Liquidity Management Units are carried out by ALCO and the management unit corresponding to these Liquidity Management Units.
The Corporate Risk Management (CRM) area acts as an independent unit responsible for monitoring and analyzing risks, standardizing risk management metrics and providing tools that can anticipate potential deviations from targets. In addition, it monitors the level of compliance with the risk limits established by the Executive Committee, reporting regularly to the Risk Management Committee (RMC), the Board’s Risk Committee and the Executive Committee, in particular in case of significant levels of risk assumed, in accordance with current corporate policy.
The liquidity and funding risk metrics designed by CRM maintain an adequate risk profile for the BBVA Group’s Liquidity and Funding Risk Appetite Framework, in accordance with the retail model on which its business activity is based. The objectives included in the decision-making process for managing liquidity and funding risk are specified for this purpose. Among the metrics, the loan-to-stable-customer-deposit ratio is one of the core management tools. It ensures that there are adequate levels of self-funding for lending on the balance sheet at all times. Once the levels of self-funding of the balance sheet have been established, the second core element is the correct diversification of the structure of wholesale funding, to avoid the excessive dependence on short-term funding. In addition, the internal metrics promote the short-term resistance of the liquidity risk profile, guaranteeing that each Liquidity Management Unit has sufficient collateral to face the risk of an unexpected change in the behavior of markets or wholesale counterparties that prevents access to funding or forces access at unreasonable prices.
In addition, the stress analyses are a fundamental element in the scheme of tracking liquidity risk and funding, as they anticipate deviations from the liquidity targets and limits established by the Risk Appetite Framework. They also play a key role in the design of the Liquidity Contingency Plan and in defining the measures for action that would be adopted to realign the risk profile should this be necessary. The stress scenarios cover a whole range of events and levels of severity, with the aim of revealing the vulnerability of the funding structure in the event of a comprehensive test on the whole of the balance sheet.
These stress results carried out regularly by CRM reveal that BBVA has a sufficient buffer of liquid assets to face the estimated liquidity shocks in a scenario such as a combination of a systemic crisis and an internal crisis with a major downgrade in the entity’s rating (up to three notches).
In 2013, one of the most significant aspects has been a steady improvement in the stability of the wholesale funding markets in Europe as a result of the positive trend in sovereign risk premiums, in an environment of improving growth expectations for the Eurozone and high market liquidity. In this context, BBVA has managed to strengthen its liquidity position and improve its funding structure based on the growth of self-funding from stable customer funds.
F-91
With respect to the new regulatory framework, the BBVA Group has continued to develop an orderly plan to adapt to the regulatory ratios so as to allow it to adopt best practices and the most effective and strict criteria for their implementation sufficiently in advance. In January 2013 some of the aspects of the document published by the Banking Supervisory Committee published in December 2010 on the Liquidity Coverage Ratio (LCR) were updated and made more flexible. They include incorporating the ratio as a regulatory requirement on January 1, 2015, with a 60% demand for compliance, to be increased to 100% by January 2019.
In addition, the Bank Supervisory Committee has initiated once more the review of the “Net Stable Funding Ratio” (NSFR), which aims to increase the weight of medium- and long-term funding on the banks’ balance sheets. It will be under review until mid-2016 and become a regulatory requirement starting on January 1, 2018.
The BBVA Group has continued to develop a plan to adapt to the regulatory ratios so as to allow it to adopt best practices and the most effective and strict criteria for their implementation sufficiently in advance.
7.4 Residual maturity
Below is a breakdown by contractual maturity of the balances of certain headings in the accompanying consolidated balance sheets, excluding any valuation adjustments or impairment losses:
| | | | | | | | | | | | | | | | | | | | |
| | | | | | | | | | | | | | | | | | | | | |
| | | | | | | | | | | Millions of Euros | | | | | | |
| | | Contractual Maturities 2013 | | | | Demand | | Up to 1
Month | | 1 to 3
Months | | 3 to 12
Months | | 1 to 5 Years | | Over 5
years | | Total | | |
| | | Asset - | | | | | | | | | | | | | | | | | | |
| | | Cash and balances with central banks | | | | 30,851 | | 2,200 | | 706 | | 734 | | 396 | | - | | 34,887 | | |
| | | Loans and advances to credit institutions | | | | 3,641 | | 11,474 | | 2,637 | | 1,552 | | 2,389 | | 1,098 | | 22,791 | | |
| | | Loans and advances to customers | | | | 27,428 | | 26,551 | | 19,930 | | 43,295 | | 87,828 | | 131,833 | | 336,865 | | |
| | | Debt securities | | | | 146 | | 2,991 | | 1,944 | | 14,793 | | 45,846 | | 40,463 | | 106,183 | | |
| | | Derivatives (trading and hedging) | | | | - | | 1,081 | | 1,435 | | 3,589 | | 12,705 | | 21,359 | | 40,169 | | |
| | | Total | | | | 62,066 | | 44,297 | | 26,652 | | 63,963 | | 149,164 | | 194,753 | | 540,895 | | |
| | | | | | | | | | | | | | | | | | | | | |
| | | Liabilities - | | | | | | | | | | | | | | | | | | |
| | | Deposits from central banks | | | | 82 | | 13,722 | | 1,350 | | 1,015 | | 14,525 | | - | | 30,694 | | |
| | | Deposits from credit institutions | | | | 3,314 | | 22,796 | | 8,911 | | 5,570 | | 8,897 | | 2,766 | | 52,254 | | |
| | | Deposits from customers | | | | 140,846 | | 55,418 | | 14,692 | | 44,575 | | 33,080 | | 10,994 | | 299,605 | | |
| | | Debt certificates (including bonds) | | | | - | | 4,039 | | 383 | | 9,901 | | 35,581 | | 12,640 | | 62,544 | | |
| | | Subordinated liabilities | | | | - | | 38 | | 1 | | 993 | | 1,389 | | 7,847 | | 10,268 | | |
| | | Other financial liabilities | | | | 316 | | 4,253 | | 404 | | 297 | | 367 | | 21 | | 5,658 | | |
| | | Short positions | | | | 7,528 | | - | | - | | - | | - | | - | | 7,528 | | |
| | | Derivatives (trading and hedging) | | | | - | | 904 | | 1,448 | | 3,749 | | 12,778 | | 21,032 | | 39,912 | | |
| | | Total | | | | 152,086 | | 101,170 | | 27,189 | | 66,100 | | 106,617 | | 55,300 | | 508,463 | | |
| | | | | | | | | | | | | | | | | | | | | |
| | | Contingent Liabilities | | | | - | | - | | - | | - | | - | | - | | - | | |
| | | Financial guarantees | | | | 751 | | 1,455 | | 212 | | 1,561 | | 3,059 | | 432 | | 7,471 | | |
| | | | | | | | | | | | | | | | | | | | | |
| | | | | | | | | | | | | | | | | | | | |
| | | | | | | | | |
| | | | | | | | | | | Millions of Euros | | | | | | |
| | | Contractual Maturities 2012 | | | | Demand | | Up to 1
Month | | 1 to 3
Months | | 3 to 12
Months | | 1 to 5 Years | | Over 5
years | | Total | | |
| | | Asset - | | | | | | | | | | | | | | | | | | |
| | | Cash and balances with central banks | | | | 31,488 | | 2,514 | | 605 | | 364 | | 505 | | - | | 35,477 | | |
| | | Loans and advances to credit institutions | | | | 3,351 | | 14,459 | | 1,479 | | 1,732 | | 3,367 | | 984 | | 25,372 | | |
| | | Loans and advances to customers | | | | 23,005 | | 33,029 | | 22,157 | | 41,892 | | 92,784 | | 142,352 | | 355,218 | | |
| | | Debt securities | | | | 198 | | 3,243 | | 4,464 | | 11,156 | | 46,217 | | 40,024 | | 105,301 | | |
| | | Derivatives (trading and hedging) | | | | - | | 1,318 | | 1,361 | | 3,765 | | 15,655 | | 31,444 | | 53,544 | | |
| | | Total | | | | 58,041 | | 54,563 | | 30,066 | | 58,910 | | 158,529 | | 214,804 | | 574,912 | | |
| | | | | | | | | | | | | | | | | | | | | |
| | | Liabilities - | | | | | | | | | | | | | | | | | | |
| | | Deposits from central banks | | | | 18 | | 8,095 | | 3,232 | | - | | 34,495 | | 350 | | 46,190 | | |
| | | Deposits from credit institutions | | | | 3,839 | | 29,488 | | 2,136 | | 7,137 | | 8,937 | | 3,909 | | 55,446 | | |
| | | Deposits from customers | | | | 136,039 | | 45,859 | | 14,758 | | 50,202 | | 26,578 | | 8,251 | | 281,687 | | |
| | | Debt certificates (including bonds) | | | | - | | 6,065 | | 4,115 | | 17,991 | | 38,966 | | 14,787 | | 81,924 | | |
| | | Subordinated liabilities | | | | - | | 50 | | - | | 724 | | 3,242 | | 7,090 | | 11,106 | | |
| | | Other financial liabilities | | | | 4,263 | | 1,813 | | 383 | | 253 | | 844 | | 34 | | 7,590 | | |
| | | Short positions | | | | 6,580 | | - | | - | | - | | - | | - | | 6,580 | | |
| | | Derivatives (trading and hedging) | | | | - | | 1,085 | | 1,260 | | 3,804 | | 15,314 | | 30,759 | | 52,222 | | |
| | | Total | | | | 150,739 | | 92,455 | | 25,884 | | 80,111 | | 128,377 | | 65,179 | | 542,744 | | |
| | | | | | | | | | | | | | | | | | | | | |
F-92
| | | | | | | | | | | | | | | | | | | | |
| | | | | | | Millions of Euros | | |
| | | Contractual Maturities 2011 | | | | Demand | | Up to 1
Month | | 1 to 3
Months | | 3 to 12
Months | | 1 to 5 Years | | Over 5
Years | | Total | | |
| | | Asset - | | | | | | | | | | | | | | | | | | |
| | | Cash and balances with central banks | | | | 27,070 | | 1,393 | | 636 | | 319 | | 411 | | - | | 29,829 | | |
| | | Loans and advances to credit institutions | | | | 2,599 | | 7,083 | | 1,307 | | 3,492 | | 7,137 | | 2,783 | | 24,401 | | |
| | | Loans and advances to customers | | | | 17,539 | | 37,705 | | 22,276 | | 44,594 | | 90,649 | | 137,476 | | 350,239 | | |
| | | Debt securities | | | | 806 | | 2,199 | | 2,643 | | 7,684 | | 37,919 | | 32,744 | | 83,995 | | |
| | | Derivatives (trading and hedging) | | | | - | | 1,795 | | 1,873 | | 4,694 | | 16,200 | | 27,310 | | 51,872 | | |
| | | Total | | | | 48,014 | | 50,175 | | 28,735 | | 60,783 | | 152,316 | | 200,313 | | 540,336 | | |
| | | | | | | | | | | | | | | | | | | | | |
| | | Liabilities - | | | | | | | | | | | | | | | | | | |
| | | Deposits from central banks | | | | 3 | | 19,305 | | 2,609 | | - | | 10,950 | | 1 | | 32,868 | | |
| | | Deposits from credit institutions | | | | 2,101 | | 26,009 | | 4,173 | | 5,315 | | 15,228 | | 3,500 | | 56,326 | | |
| | | Deposits from customers | | | | 112,877 | | 67,324 | | 16,521 | | 39,964 | | 27,957 | | 6,624 | | 271,267 | | |
| | | Debt certificates (including bonds) | | | | - | | 2,012 | | 1,861 | | 11,246 | | 45,440 | | 16,971 | | 77,530 | | |
| | | Subordinated liabilities | | | | - | | - | | 109 | | 37 | | 4,856 | | 9,427 | | 14,429 | | |
| | | Other financial liabilities | | | | 4,667 | | 1,194 | | 330 | | 456 | | 1,167 | | 1,217 | | 9,031 | | |
| | | Short positions | | | | 4,611 | | - | | - | | - | | - | | - | | 4,611 | | |
| | | Derivatives (trading and hedging) | | | | - | | 1,683 | | 1,632 | | 5,219 | | 15,494 | | 25,249 | | 49,277 | | |
| | | Total | | | | 124,259 | | 117,527 | | 27,235 | | 62,237 | | 121,092 | | 62,989 | | 515,339 | | |
| | | | | | | | | | | | | | | | | | | | | |
8. Fair value of financial instruments
Fair value is defined as the price that would be received to sell an asset or paid to transfer a liability in an orderly transaction between market participants at the measurement date. It is therefore a market-based measurement and not specific to each entity.
If there is no market price for a given financial asset or liability, its fair value is estimated on the basis of the price established in recent transactions involving similar instruments or, in the absence thereof, by using mathematical measurement models that are sufficiently tried and trusted by the international financial community. The estimates used in such models take into consideration the specific features of the asset or liability to be measured and, in particular, the various types of risk associated with the asset or liability. However, the limitations inherent in the measurement models and possible inaccuracies in the assumptions and parameters required by these models may mean that the estimated fair value of an asset or liability does not exactly match the price for which the asset or liability could be exchanged or settled on the date of its measurement.
The fair value of the financial derivatives included in the held-for-trading portfolios is based on daily quoted price if there is an active market for these financial derivatives. If for any reason their quoted price is not available on a given date, these financial derivatives are measured using methods similar to those used in over-the-counter (OTC) markets.
The fair value of OTC derivatives (“present value” or “theoretical price”) is equal to the sum of future cash flows arising from the instrument, discounted at the measurement date; these derivatives are valued using methods recognized by international financial markets: the “net present value” (NPV) method, option price calculation models, etc.
F-93
Below is a comparison of the carrying amount of the Group’s financial instruments in the accompanying consolidated balance sheets and their respective fair values. Not all assets and liabilities are registered at fair value. The following items are registered at their amortized cost: “Cash and balances with central banks”, “Loans and receivables”, “Held to maturity investments” and financial liabilities at amortized cost:
| | | | | | | | | | | | | | | | | | |
| | | | | Millions of Euros | | |
| | | | | | | 2013 | | 2012 | | 2011 | | |
| | | Fair Value and Carrying Amount | | Notes | | Carrying Amount | | Fair Value | | Carrying Amount | | Fair Value | | Carrying Amount | | Fair Value | | |
| | | ASSETS- | | | | | | | | | | | | | | | | |
| | | Cash and balances with central banks | | 9 | | 34,903 | | 34,903 | | 35,494 | | 35,494 | | 29,841 | | 29,841 | | |
| | | Financial assets held for trading | | 10 | | 72,112 | | 72,112 | | 79,829 | | 79,829 | | 70,471 | | 70,471 | | |
| | | Other financial assets designated at fair value through profit or loss | | 11 | | 2,413 | | 2,413 | | 2,530 | | 2,530 | | 2,773 | | 2,773 | | |
| | | Available-for-sale financial assets | | 12 | | 77,774 | | 77,774 | | 67,500 | | 67,500 | | 54,641 | | 54,641 | | |
| | | Loans and receivables | | 13 | | 350,945 | | 364,120 | | 371,347 | | 391,594 | | 369,916 | | 377,722 | | |
| | | Held-to-maturity investments | | 14 | | - | | - | | 10,162 | | 9,805 | | 10,955 | | 10,190 | | |
| | | Fair value changes of the hedges items in portfolio hedges of interest rate risk | | 15 | | 98 | | 98 | | 226 | | 226 | | 146 | | 146 | | |
| | | Hedging derivatives | | 15 | | 2,530 | | 2,530 | | 4,894 | | 4,894 | | 4,538 | | 4,538 | | |
| | | LIABILITIES- | | | | | | | | | | | | | | | | |
| | | Financial assets held for trading | | 10 | | 45,648 | | 45,648 | | 55,834 | | 55,834 | | 51,178 | | 51,178 | | |
| | | Other financial liabilities designated at fair value through profit or loss | | 11 | | 2,467 | | 2,467 | | 2,216 | | 2,216 | | 1,621 | | 1,621 | | |
| | | Financial liabilities at amortized cost | | 23 | | 464,141 | | 466,240 | | 490,605 | | 488,163 | | 465,717 | | 459,698 | | |
| | | Fair value changes of the hedged items in portfolio hedges of interest rate risk. | | 15 | | - | | - | | - | | - | | - | | - | | |
| | | Hedging derivatives | | 15 | | 1,792 | | 1,792 | | 2,968 | | 2,968 | | 2,709 | | 2,709 | | |
| | | | | | | | | | | | | | | | | | | |
For financial instruments whose carrying amount is equivalent to their fair value, the measurement processes used are set forth below:
| — | | Level 1: Measurement using market observable quoted prices for the financial instrument in question, secured from independent sources and referred to active markets. This level includes listed debt securities, listed equity instruments, some derivatives and mutual funds. |
| — | | Level 2: Measurement that applies techniques using inputs drawn from observable market data. |
| — | | Level 3: Measurement using techniques where some of the inputs are not taken from market observable data. As of December 31, 2013, the affected instruments accounted for approximately 0.16% of financial assets and 0.01% of the Group’s financial liabilities. Model selection and validation is undertaken by control areas outside the market units. |
F-94
| 8.1 | Fair value of certain financial instruments registered at fair value using valuation criteria |
The following table shows the main financial instruments carried at fair value in the accompanying consolidated balance sheets, broken down by the measurement technique used to determine their fair value:
| | | | | | | | | | | | | | | | | | | | | | | | |
| | | | | | | Millions of Euros | | |
| | | | | | | 2013 | | 2012 | | 2011 | | |
| | | Fair Value by Levels | | Notes | | Level 1 | | Level 2 | | Level 3 | | Level 1 | | Level 2 | | Level 3 | | Level 1 | | Level 2 | | Level 3 | | |
| | | ASSETS- | | | | | | | | | | | | | | | | | | | | | | |
| | | Financial assets held for trading | | 10 | | 34,394 | | 37,427 | | 290 | | 30,890 | | 48,530 | | 412 | | 22,952 | | 46,819 | | 700 | | |
| | | Loans and advances to customers | | | | - | | 106 | | - | | 244 | | - | | - | | - | | - | | - | | |
| | | Debt securities | | | | 28,573 | | 852 | | 176 | | 27,007 | | 718 | | 295 | | 19,703 | | 792 | | 450 | | |
| | | Equity instruments | | | | 4,596 | | 111 | | 58 | | 2,705 | | 140 | | 70 | | 2,027 | | 97 | | 68 | | |
| | | Trading derivatives | | | | 1,225 | | 36,358 | | 56 | | 934 | | 47,672 | | 47 | | 1,221 | | 45,930 | | 182 | | |
| | | Other financial assets designated at fair value through profit or loss | | 11 | | 2,352 | | 61 | | - | | 2,468 | | 62 | | - | | 2,358 | | 415 | | - | | |
| | | Loans and advances to credit institutions | | | | - | | - | | - | | - | | - | | - | | - | | - | | - | | |
| | | Debt securities | | | | 603 | | 61 | | - | | 691 | | 62 | | - | | 647 | | 61 | | - | | |
| | | Equity instruments | | | | 1,749 | | - | | - | | 1,777 | | - | | - | | 1,711 | | 354 | | - | | |
| | | Available-for-sale financial assets | | 12 | | 57,957 | | 18,710 | | 591 | | 47,692 | | 18,545 | | 753 | | 38,193 | | 14,844 | | 1,064 | | |
| | | Debt securities | | | | 52,726 | | 18,515 | | 566 | | 44,496 | | 18,353 | | 699 | | 34,195 | | 14,620 | | 602 | | |
| | | Equity instruments | | | | 5,231 | | 195 | | 25 | | 3,196 | | 192 | | 54 | | 3,998 | | 224 | | 462 | | |
| | | Hedging derivatives | | 15 | | 52 | | 2,478 | | - | | 111 | | 4,783 | | - | | 289 | | 4,249 | | - | | |
| | | LIABILITIES- | | | | | | | | | | | | | | | | | | | | | | |
| | | Financial liabilities held for trading | | 10 | | 8,459 | | 37,172 | | 17 | | 7,371 | | 48,425 | | 38 | | 5,813 | | 45,342 | | 23 | | |
| | | Trading derivatives | | | | 931 | | 37,172 | | 17 | | 791 | | 48,425 | | 38 | | 1,202 | | 45,342 | | 23 | | |
| | | Short positions | | | | 7,528 | | - | | - | | 6,580 | | - | | - | | 4,611 | | - | | - | | |
| | | Other financial liabilities designated at fair value through profit or loss | | 11 | | - | | 2,467 | | - | | - | | 2,216 | | - | | - | | 1,621 | | - | | |
| | | Hedging derivatives | | 15 | | - | | 1,757 | | 35 | | - | | 2,951 | | 17 | | - | | 2,709 | | - | | |
| | | | | | | | | | | | | | | | | | | | | | | | | |
The heading “Available-for-sale financial assets” in the accompanying consolidated balance sheets as of December 31, 2013, 2012 and 2011 additionally includes€516,€510 million and€541 million, respectively, accounted for at cost, as indicated in the section of this Note entitled “Financial instruments at cost”.
Process for determining the fair value established in the entity
To ensure that trading portfolio assets are properly valued, BBVA has established, at a geographic level, a structure of New Product Committees responsible for validating and approving new products or types of assets and liabilities before being contracted. The members of these Committees, responsible for valuation, are independent from the business.
These areas are required to ensure, prior to the approval stage, the existence of not only technical and human resources, but also adequate informational sources to measure these assets and liabilities, in accordance with the rules established by the Global Valuation Area and using models that have been validated and approved by the Department of Technology and Methodologies that reports to GRM (see Note 7).
Additionally, for assets that show significant uncertainty in inputs or model parameters used for assessment, criteria is established to measure said uncertainty and activity limits are set based on these.
Finally, these measurements are compared, as much as possible, against other sources such as the measurements obtained by the business teams or those obtained by other market participants.
F-95
The following table sets forth the main measurement techniques, hypothesis and inputs used in the estimation of fair value of the financial instruments classified under Levels 2 and 3, based on the type of financial asset and liability and the corresponding balances as of December 31, 2013:
| | | | | | |
Financial Instruments Level 2 | | Fair Value (Millons of euros) | | Main Measurement techniques | | Main inputs used |
| Loans and advances to customers | | | | Present value Method Determining the present-value of financial instruments as the current value of future cash flows (discounted at market interest rates), taking into account: -the estimate of prepayment rates; - the issuer credit risk; and - current market interest rates. - Net Asset Value (NAV) published recurrently, but not more frequently than every quarter | | - Risk premiums. - Observable market interest rates |
Available-for-sale financial assets | | 106 | | |
| Debt securities | | | | |
Trading portfolio | | 852 | | |
Other financial assets at fair value through profit and loss | | 61 | | |
Available-for-sale financial assets | | 18,515 | | |
| Equity Instruments | | | | |
Trading portfolio | | 111 | | |
Available-for-sale financial assets | | 195 | | |
| Other financial liabilities | | | | |
Other financial liabilities designated at fair value through profit or loss | | 2,467 | | |
| | | | | | |
| Trading derivatives | | | | • Commodities:Discounted cash flows and moment adjustment • Credit products: Default model, Gaussian copula and Black DermanToy • Exchange rate products:Discounted cash flows and Black Scholes • Fixed income products: Discounted cash flows • Equity instruments:Local-Vol,Black and Discounted cash flows • Interest rate products: - Interest rate swaps, Call money Swaps y FRA:Discounted cash flows - Caps/Floors , bond options y Swaptions:Black - Interest rate options:Hull-White y SABR | | Observable market data |
Trading asset portfolio | | 36,358 | | |
Trading liability portfolio | | 37,172 | | |
| Hedging derivatives | | | | |
Asset | | 2,478 | | |
Liability | | 1,757 | | |
| | | | | | |
Financial Instruments Level 3 | | Fair Value (Millons of euros) | | Main Measurement techniques | | Main inputs used |
| Debt securities | | | | • CDO:Time Default Model (Probability of default measure) | | -Correlation of defaults extrapolated from several index tranches (ITRA00 nad CDX) with the underlying portfolio of our CDOs |
Trading portfolio | | 176 | | |
Available-for-sale financial assets | | 566 | | |
| Equity Instruments | | | | Present-value method (Discounted future cash flows) | | -Prepayment Rates - Default Correlation - Credit Spread - NAV supplied by the fund administrator or issuer of the securities |
Trading portfolio | | 58 | | |
Available-for-sale financial assets | | 25 | | |
| | | | | | |
| Trading derivatives | | | | • Credit Option: Gaussian Copula and Libor Market Model • Equity OTC Options: Heston • Interest rate options:Libor Market Model | | - Non directly observable market data - Historical Series |
Trading asset portfolio | | 57 | | |
Trading liability portfolio | | 17 | | |
| Hedging derivatives | | | | |
Liability | | 35 | | |
Adjustments to the valuation for risk of default
The credit valuation adjustments (“CVA”) and debit valuation adjustments (“DVA”) are a part of derivative valuations, both assets and liabilities, to reflect the impact in the fair value of the credit risk of the counterparty and its own, respectively.
These adjustments are calculated by estimating Exposure At Default, Probability of Default and Loss Given Default, for all derivative products on any instrument at the legal entity level (all counterparties under a same ISDA / CMOF) in which BBVA has exposure.
As a general rule, the calculation of CVA is done through simulations of market and credit variables to calculate the expected positive exposure, given the Exposure at Default and multiplying the result by the Loss Given Default of the counterparty. Consequently, the DVA is calculated as the result of the expected negative exposure given the Exposure at Default and multiplying the result by the Loss Given Default of the counterparty. Both calculations are performed throughout the entire period of potential exposure.
The information needed to calculate the exposure at default and the loss given default come from the credit markets (Credit Default Swaps or iTraxx Indexes), save for cases where an internal rating is available. For those cases where the information is not available, BBVA implements a mapping process based on the sector, rating and geography to assign probabilities of both probability of default and loss given default, calibrated directly to market or with an adjustment market factor for the probability of default and the historical expected loss.
F-96
The impact recorded under “Net gains (losses) on financial asset and liabilities” in the consolidated income statement for the year ended December 31, 2013 corresponding to the credit risk assessment of the asset derivative positions as “Credit Valuation Adjustment” (CVA) and liabilities derivative position as “Debit Valuation Adjustment” (DVA), was not material.
Financial assets and liabilities classified as Level 3
The changes in the balance of Level 3 financial assets and liabilities included in the accompanying consolidated balance sheets are as follows:
| | | | | | | | | | | | | | | | | | | | | | | | | | | | | | |
| | | | | | | Millions of Euros | | | |
| | | | | | | 2013 | | | 2012 | | | 2011 | | | |
| | | Financial Assets Level 3 Changes in the Period | | | | Assets | | | Liabilities | | | Assets | | | Liabilities | | | Assets | | | Liabilities | | | |
| | | Balance at the beginning | | | | | 1,165 | | | | 55 | | | | 1,764 | | | | 23 | | | | 1,469 | | | | 25 | | | |
| | | Valuation adjustments recognized in the income statement (*) | | | | | 7 | | | | 15 | | | | 51 | | | | 2 | | | | (1) | | | | (12) | | | |
| | | Valuation adjustments not recognized in the income statement | | | | | - | | | | - | | | | (3) | | | | - | | | | - | | | | - | | | |
| | | Acquisitions, disposals and liquidations | | | | | (374) | | | | (18) | | | | (279) | | | | 29 | | | | 266 | | | | 9 | | | |
| | | Net transfers to Level 3 | | | | | 180 | | | | - | | | | (134) | | | | - | | | | 33 | | | | - | | | |
| | | Exchange differences and others | | | | | (95) | | | | (1) | | | | (233) | | | | 1 | | | | (3) | | | | 1 | | | |
| | | Exchange differences and others | | | | | 881 | | | | 52 | | | | 1,165 | | | | 55 | | | | 1,764 | | | | 23 | | | |
| | | | | | | | | | | | | | | | | | | | | | | | | | | | | | | |
| | (*) | Profit or loss that is attributable to gains or losses relating to those assets and liabilities held at the end of the reporting period |
As of December 31, 2013, the profit/loss on sales of financial instruments classified as level 3 recognized in the accompanying income statement was not material.
Transfers between levels
The Global Valuation Area, in collaboration with the Technology and Methodology Area, has established the rules for a proper trading portfolio asset classification according to the fair value hierarchy defined by international accounting standards.
On a monthly basis, any new assets registered in the portfolio are classified, according to this criterion, by the generating subsidiary. Then, there is a quarterly review of the portfolio in order to analyze the need for a change in classification of any of these assets.
The financial instruments transferred between the different levels of measurement in 2013 are at the following amounts in the accompanying consolidated balance sheets as of December 31, 2013:
| | | | | | | | | | | | | | | | | | | | | | | | | | | | | | |
| | | | | | | Millions of Euros | | | |
| | | | | From | | Level 1 | | | Level 2 | | | Level 3 | | | |
| | | Transfer between levels | | To: | | Level 2 | | | Level 3 | | | Level 1 | | | Level 3 | | | Level 1 | | | Level 2 | | | |
| | | ASSETS | | | | | | | | | | | | | | | | | | | | | | | | | | | | |
| | | Financial assets held for trading | | | | | - | | | | 5 | | | | 18 | | | | 2 | | | | - | | | | 3 | | | |
| | | Available-for-sale financial assets | | | | | 7 | | | | 190 | | | | 172 | | | | - | | | | 5 | | | | 9 | | | |
| | | LIABILITIES- | | | | | | | | | | | | | | | | | | | | | | | | | | | | |
| | | | | | | | | | | | | | | | | | | | | | | | | | | | | | | |
Sensitivity Analysis
Sensitivity analysis is performed on products with significant unobservable inputs (products included in level 3), in order to obtain a reasonable range of possible alternative valuations. This analysis is carried out on a monthly basis, based on the criteria defined by the Global Valuation Area taking into account the nature of the methods used for the assessment and the reliability and availability of inputs and proxies used. In order to establish, with a sufficient degree of certainty, the valuating risk that is incurred in such assets without applying diversification criteria between them.
F-97
As of December 31, 2013, the effect on the consolidated income and consolidated equity of changing the main hypotheses used for the measurement of Level 3 financial instruments for other reasonably possible models, taking the highest (most favorable hypotheses) or lowest (least favorable hypotheses) value of the range deemed probable, would be as follows:
| | | | | | | | | | | | | | | | | | | | | | |
| | | | | | | Millions of Euros | | | |
| | | | | | | Potential Impact on
Consolidated Income
Statement | | | Potential Impact on Total
Equity | | | |
| | | Financial Assets Level 3 Sensitivity Analysis | | | | Most
Favorable
Hypotheses | | | Least
Favorable
Hypotheses | | | Most
Favorable
Hypotheses | | | Least
Favorable
Hypotheses | | | |
| | | ASSETS | | | | | | | | | | | | | | | | | | | | |
| | | Financial assets held for trading | | | | | 16 | | | | (13) | | | | - | | | | - | | | |
| | | Available-for-sale financial assets | | | | | - | | | | - | | | | 11 | | | | (11) | | | |
| | | LIABILITIES- | | | | | | | | | | | | | | | | | | | | |
| | | Financial liabilities held for trading | | | | | 1 | | | | (1) | | | | - | | | | - | | | |
| | | Total | | | | | 17 | | | | (14) | | | | 11 | | | | (11) | | | |
| | | | | | | | | | | | | | | | | | | | | | | |
8.2 Fair value of financial instruments carried at cost using valuation criteria
The valuation methods used to calculate the fair value of financial assets and liabilities carried at cost are presented below:
| — | | The fair value of “Cash and balances with central banks” has been assimilated to their book value, as it is mainly short-term balances. |
| — | | The fair value of the “Loans and advances to customers” and “financial liabilities at amortized cost” was estimated using the method of discounted expected future cash flows using market interest rates at the end of each year. Additionally, factors such as prepayment rates and correlations of default are taken into account. |
The following table presents key financial instruments carried at amortized cost in the accompanying consolidated balance sheets, broken down according to the method of valuation used to estimate their fair value:
| | | | | | | | | | | | | | | | | | | | | | | | | | | | | | | | | | | | | | | | | | |
| | | | | | | Millions of Euros | | | |
| | | | | | | 2013 | | | 2012 | | | 2011 | | | |
| | | Fair Value by Levels | | Notes | | | Level 1 | | | | Level 2 | | | | Level 3 | | | | Level 1 | | | | Level 2 | | | | Level 3 | | | | Level 1 | | | | Level 2 | | | | Level 3 | | | |
| | | ASSETS- | | | | | | | | | | | | | | | | | | | | | | | | | | | | | | | | | | | | | | | | |
| | | Cash and balances with central banks | | 9 | | | 34,903 | | | | - | | | | - | | | | 35,494 | | | | - | | | | - | | | | 29,841 | | | | - | | | | - | | | |
| | | Loans and receivables | | 13 | | | | | | | 1,351 | | | | 362,769 | | | | - | | | | - | | | | 391,594 | | | | - | | | | - | | | | 377,722 | | | |
| | | LIABILITIES- | | | | | | | | | | | | | | | | | | | | | | | | | | | | | | | | | | | | | | | | |
| | | Financial liabilities at amortized cost | | 23 | | | - | | | | - | | | | 466,240 | | | | - | | | | - | | | | 488,163 | | | | - | | | | - | | | | 459,698 | | | |
| | | | | | | | | | | | | | | | | | | | | | | | | | | | | | | | | | | | | | | | | | | |
The main valuation methods, hypotheses and inputs used to estimate the fair value of financial instruments accounted for at cost and classified in levels 2 and 3 is shown below. These are broken down by type of financial instrument and the balances correspond to those as of December 31, 2013:
| | | | | | | | |
Financial Instruments Level 2 | | Fair Value
(Millons of
euros) | | | Main Measurement techniques | | Main inputs used |
| Loans and receivables | | | | | | Present-value method | | - Default correlation |
Debt securities | | | 1,351 | | | (Discounted future cash flows) | | - Credit spread |
F-98
| | | | | | |
| Financial InstrumentsLevel 3 | | Fair Value
(Millions of euros) | | Main Measurement techniques | | Main inputs used |
| Loans and receivables | | | | | | |
Loans and advances to credit institutions | | 22,147 | | | | |
Loans and advances to customers | | 337,742 | | | | |
Debt securities | | 2,881 | | | | |
| | | | | | | |
| | | | | | | |
| Financial liabilities at amortized cost | | | | Present-value method | | -Prepayment rates |
Deposits from central banks | | 31,018 | | (Discounted future cash flows) | | -Default correlation |
Deposits from credit institutions | | 51,859 | | | | - Credit spread |
Customer deposits | | 301,187 | | | | - Market interest rates |
Debt certificates | | 64,984 | | | | |
Sobordinated liabilities | | 11,206 | | | | |
Other financial liabilities | | 5,985 | | | | |
Financial instruments at cost
As of December 31, 2013, 2012 and 2011, there were equity instruments and certain discretionary profit-sharing arrangements in some entities which were recognized at cost in the Group’s consolidated balance sheets because their fair value could not be reliably determined, as they were not traded in organized markets and, thus, their unobservable inputs are significant. On the above dates, the balances of these financial instruments recognized in the portfolio of available-for-sale financial assets amounted to€516,€510 million and€541 million, respectively.
The table below outlines the financial assets and liabilities carried at cost that were sold in the year ended December 31, 2013, 2012 and 2011:
| | | | | | | | | | | | | | | | |
| | | | | | | Millions of Euros | | | |
| | | Sales of financial instruments at cost | | | | 2013 | | 2012 | | | 2011 | | | |
| | | Amount of Sale | | | | 76 | | | 29 | | | | 19 | | | |
| | | Carrying Amount at Sale Date | | | | 62 | | | 5 | | | | 8 | | | |
| | | Gains/Losses | | | | 13 | | | 24 | | | | 11 | | | |
| | | | | | | | | | | | | | | | | |
9. Cash and balances with central banks
The breakdown of the balance under the headings “Cash and balances with central banks” and “Financial liabilities at amortized cost – Deposits from central banks” in the accompanying consolidated balance sheets is as follows:
| | | | | | | | | | | | |
| | | | | | | Millions of Euros | | |
| | | Cash and Balances with Central Banks | | Notes | | 2013 | | 2012 | | 2011 | | |
| | | Cash | | | | 5,533 | | 5,155 | | 4,496 | | |
| | | Balances at the Central Banks | | | | 29,234 | | 29,845 | | 24,838 | | |
| | | Reverse repurchase agreements | | 37 | | 120 | | 476 | | 495 | | |
| | | Accrued interests | | | | 16 | | 17 | | 12 | | |
| | | Total | | | | 34,903 | | 35,494 | | 29,841 | | |
| | | | | | | | | | | | | |
| | | | | | | | | | | | |
| | | | | | | Millions of Euros | | |
| | | Deposits from Central Banks | | Notes | | 2013 | | 2012 | | 2011 | | |
| | | Deposits from Central Banks | | | | 25,059 | | 40,576 | | 23,905 | | |
| | | Repurchase agreements | | 37 | | 5,636 | | 5,614 | | 8,961 | | |
| | | Accrued interest until expiration | | | | 198 | | 285 | | 11 | | |
| | | Total | | 23 | | 30,893 | | 46,475 | | 32,877 | | |
| | | | | | | | | | | | | |
F-99
During the 2013, the changes in this item are mainly a result of to the decrease in the balance of deposits with the European Central Bank.
10. Financial assets and liabilities held for trading
10.1 Breakdown of the balance
The breakdown of the balance under these headings in the accompanying consolidated balance sheets is as follows:
| | | | | | | | | | | | | | | | | | |
| | | | | | | Millions of Euros | | | |
| | | Financial Assets and Liabilities Held-for-Trading | | | | 2013 | | | 2012 | | | 2011 | | | |
| | | ASSETS- | | | | | | | | | | | | | | | | |
| | | Loans and advances to credit institutions | | | | | - | | | | - | | | | - | | | |
| | | Loans and advances to customers | | | | | 106 | | | | 244 | | | | - | | | |
| | | Debt securities | | | | | 29,602 | | | | 28,020 | | | | 20,946 | | | |
| | | Equity instruments | | | | | 4,766 | | | | 2,915 | | | | 2,192 | | | |
| | | Trading derivatives | | | | | 37,638 | | | | 48,650 | | | | 47,333 | | | |
| | | Total | | | | | 72,112 | | | | 79,829 | | | | 70,471 | | | |
| | | LIABILITIES- | | | | | | | | | | | | | | | | |
| | | Trading derivatives | | | | | 38,119 | | | | 49,254 | | | | 46,567 | | | |
| | | Short positions | | | | | 7,529 | | | | 6,580 | | | | 4,611 | | | |
| | | Total | | | | | 45,648 | | | | 55,834 | | | | 51,178 | | | |
| | | | | | | | | | | | | | | | | | | |
10.2 Debt securities
The breakdown by type of instrument of the balance under this heading in the accompanying consolidated balance sheets is as follows:
| | | | | | | | | | | | | | | | | | |
| | | | | | | Millions of Euros | | | |
| | | Debt Securities Held-for-Trading Breakdown by type of instrument | | | | 2013 | | | 2012 | | | 2011 | | | |
| | | Issued by Central Banks | | | | | 291 | | | | 334 | | | | 402 | | | |
| | | Spanish government bonds | | | | | 5,251 | | | | 4,968 | | | | 4,324 | | | |
| | | Foreign government bonds | | | | | 19,154 | | | | 18,068 | | | | 13,229 | | | |
| | | Issued by Spanish financial institutions | | | | | 596 | | | | 456 | | | | 566 | | | |
| | | Issued by foreign financial institutions | | | | | 2,138 | | | | 2,089 | | | | 1,323 | | | |
| | | Other debt securities | | | | | 2,172 | | | | 2,106 | | | | 1,102 | | | |
| | | Total | | | | | 29,602 | | | | 28,020 | | | | 20,946 | | | |
| | | | | | | | | | | | | | | | | | | |
F-100
10.3 Equity instruments
The breakdown of the balance under this heading in the accompanying consolidated balance sheets is as follows:
| | | | | | | | | | | | | | | | | | |
| | | | | | | Millions of Euros | | | |
| | | Equity Instruments Held-for-Trading Breakdown by Issuer | | | | 2013 | | | 2012 | | | 2011 | | | |
| | | Shares of Spanish companies | | | | | | | | | | | | | | | | |
| | | Credit institutions | | | | | 497 | | | | 162 | | | | 62 | | | |
| | | Other sectors | | | | | 2,255 | | | | 1,108 | | | | 600 | | | |
| | | Subtotal | | | | | 2,752 | | | | 1,270 | | | | 662 | | | |
| | | Shares of foreign companies | | | | | | | | | | | | | | | | |
| | | Credit institutions | | | | | 80 | | | | 75 | | | | 128 | | | |
| | | Other sectors | | | | | 1,934 | | | | 1,570 | | | | 1,402 | | | |
| | | Subtotal | | | | | 2,015 | | | | 1,645 | | | | 1,530 | | | |
| | | Total | | | | | 4,766 | | | | 2,915 | | | | 2,192 | | | |
| | | | | | | | | | | | | | | | | | | |
10.4 Trading derivatives
The trading derivatives portfolio arises from the Group’s need to manage the risks it is exposed to in the normal course of business and also to market certain products amongst the Group’s customers. As of December 31, 2013, 2012 and 2011, trading derivatives were mainly contracted in over-the-counter (OTC) markets, with counterparties which are mainly foreign credit institutions, and related to foreign-exchange, interest-rate and equity risk. Below is a breakdown of the net positions by transaction type of the fair value of trading derivatives recognized in the accompanying consolidated balance sheets, divided into organized and OTC markets:
| | | | | | | | | | | | | | | | | | | | | | | | | | | | | | | | | | | | |
| | | | | Millions of Euros | | | |
| | | Outstanding Financial Trading Derivatives 2013 | | Currency
Risk | | | Interest
Rate Risk | | | Equity
Price Risk | | | Precious
Metals
Risk | | | Commodities
Risk | | | Credit Risk | | | Other
Risks | | | Total | | | |
| | | Organized markets | | | | | | | | | | | | | | | | | | | | | | | | | | | | | | | | | | |
| | | Financial futures | | | - | | | | - | | | | 1 | | | | - | | | | - | | | | - | | | | - | | | | 1 | | | |
| | | Options | | | 1 | | | | - | | | | 72 | | | | - | | | | - | | | | - | | | | 1 | | | | 74 | | | |
| | | Other products | | | - | | | | - | | | | - | | | | - | | | | - | | | | - | | | | - | | | | - | | | |
| | | Subtotal | | | 1 | | | | - | | | | 73 | | | | - | | | | - | | | | - | | | | 1 | | | | 75 | | | |
| | | OTC markets | | | | | | | | | | | | | | | | | | | | | | | | | | | | | | | | | | |
| | | Credit institutions | | | | | | | | | | | | | | | | | | | | | | | | | | | | | | | | | | |
| | | Forward transactions | | | (554) | | | | 40 | | | | - | | | | - | | | | - | | | | - | | | | - | | | | (514) | | | |
| | | Future rate agreements (FRAs) | | | - | | | | (63) | | | | - | | | | - | | | | - | | | | - | | | | - | | | | (63) | | | |
| | | Swaps | | | 83 | | | | (1,394) | | | | 9 | | | | - | | | | 5 | | | | | | | | - | | | | (1,297) | | | |
| | | Options | | | 179 | | | | (100) | | | | (457) | | | | (1) | | | | (2) | | | | - | | | | - | | | | (381) | | | |
| | | Other products | | | - | | | | (10) | | | | - | | | | - | | | | - | | | | (45) | | | | - | | | | (55) | | | |
| | | Subtotal | | | (292) | | | | (1,527) | | | | (448) | | | | (1) | | | | 3 | | | | (45) | | | | - | | | | (2,310) | | | |
| | | Other financial institutions | | | | | | | | | | | | | | | | | | | | | | | | | | | | | | | | | | |
| | | Forward transactions | | | (137) | | | | - | | | | - | | | | - | | | | - | | | | - | | | | 1 | | | | (136) | | | |
| | | Future rate agreements (FRAs) | | | - | | | | (10) | | | | - | | | | - | | | | - | | | | - | | | | - | | | | (10) | | | |
| | | Swaps | | | - | | | | 25 | | | | 12 | | | | - | | | | - | | | | - | | | | - | | | | 37 | | | |
| | | Options | | | 29 | | | | (108) | | | | (320) | | | | - | | | | - | | | | - | | | | - | | | | (399) | | | |
| | | Other products | | | - | | | | - | | | | - | | | | - | | | | - | | | | 39 | | | | - | | | | 39 | | | |
| | | Subtotal | | | (108) | | | | (93) | | | | (308) | | | | - | | | | - | | | | 39 | | | | 1 | | | | (469) | | | |
| | | Other sectors | | | | | | | | | | | | | | | | | | | | | | | | | | | | | | | | | | |
| | | Forward transactions | | | 176 | | | | - | | | | - | | | | - | | | | - | | | | - | | | | - | | | | 176 | | | |
| | | Future rate agreements (FRAs) | | | - | | | | 136 | | | | - | | | | - | | | | - | | | | - | | | | - | | | | 136 | | | |
| | | Swaps | | | 48 | | | | 1,357 | | | | 28 | | | | - | | | | 3 | | | | - | | | | - | | | | 1,436 | | | |
| | | Options | | | (24) | | | | (7) | | | | 449 | | | | (2) | | | | (3) | | | | - | | | | - | | | | 413 | | | |
| | | Other products | | | 3 | | | | 57 | | | | - | | | | - | | | | - | | | | - | | | | - | | | | 60 | | | |
| | | Subtotal | | | 203 | | | | 1,543 | | | | 477 | | | | (2) | | | | - | | | | - | | | | - | | | | 2,221 | | | |
| | | Subtotal | | | (197) | | | | (77) | | | | (279) | | | | (3) | | | | 3 | | | | (6) | | | | 1 | | | | (556) | | | |
| | | Total | | | (196) | | | | (77) | | | | (206) | | | | (3) | | | | 3 | | | | (6) | | | | 2 | | | | (481) | | | |
| | | Of which: | | | | | | | | | | | | | | | | | | | | | | | | | | | | | | | | | | |
| | | Asset Trading Derivatives | | | 6,389 | | | | 27,719 | | | | 3,073 | | | | 1 | | | | 20 | | | | 430 | | | | 6 | | | | 37,638 | | | |
| | | Liability Trading Derivatives | | | (6,585) | | | | (27,797) | | | | (3,279) | | | | (4) | | | | (15) | | | | (436) | | | | (3) | | | | (38,119) | | | |
| | | | | | | | | | | | | | | | | | | | | | | | | | | | | | | | | | | | |
F-101
| | | | | | | | | | | | | | | | | | | | | | | | | | | | | | | | | | | | | | |
| | | | | | | Millions of Euros | | | |
| | | Outstanding Financial Trading Derivatives 2012 | | | | Currency
Risk | | | Interest
Rate Risk | | | Equity Price
Risk | | | Precious
Metals Risk | | | Commodities
Risk | | | Credit Risk | | | Other Risks | | | Total | | | |
| | | Organized markets | | | | | | | | | | | | | | | | | | | | | | | | | | | | | | | | | | | | |
| | | Financial futures | | | | | - | | | | - | | | | 1 | | | | - | | | | - | | | | - | | | | - | | | | 1 | | | |
| | | Options | | | | | (4) | | | | - | | | | (111) | | | | 1 | | | | 2 | | | | - | | | | - | | | | (112) | | | |
| | | Other products | | | | | - | | | | - | | | | - | | | | - | | | | - | | | | - | | | | - | | | | - | | | |
| | | Subtotal | | | | | (4) | | | | - | | | | (110) | | | | 1 | | | | 2 | | | | - | | | | - | | | | (111) | | | |
| | | OTC markets | | | | | | | | | | | | | | | | | | | | | | | | | | | | | | | | | | | | |
| | | Credit institutions | | | | | | | | | | | | | | | | | | | | | | | | | | | | | | | | | | | | |
| | | Forward transactions | | | | | (1,108) | | | | 109 | | | | - | | | | - | | | | - | | | | - | | | | - | | | | (999) | | | |
| | | Future rate agreements (FRAs) | | | | | - | | | | (203) | | | | - | | | | - | | | | - | | | | - | | | | - | | | | (203) | | | |
| | | Swaps | | | | | 70 | | | | (2,848) | | | | 83 | | | | - | | | | 12 | | | | - | | | | - | | | | (2,683) | | | |
| | | Options | | | | | 8 | | | | 212 | | | | 109 | | | | - | | | | (4) | | | | - | | | | 1 | | | | 326 | | | |
| | | Other products | | | | | - | | | | (3) | | | | - | | | | - | | | | - | | | | (92) | | | | - | | | | (95) | | | |
| | | Subtotal | | | | | (1,030) | | | | (2,733) | | | | 192 | | | | - | | | | 8 | | | | (92) | | | | 1 | | | | (3,654) | | | |
| | | Other financial institutions | | | | | | | | | | | | | | | | | | | | | | | | | | | | | | | | | | | | |
| | | Forward transactions | | | | | (22) | | | | - | | | | - | | | | - | | | | - | | | | - | | | | - | | | | (22) | | | |
| | | Future rate agreements (FRAs) | | | | | - | | | | (28) | | | | - | | | | - | | | | - | | | | - | | | | - | | | | (28) | | | |
| | | Swaps | | | | | - | | | | 842 | | | | (21) | | | | - | | | | - | | | | - | | | | - | | | | 821 | | | |
| | | Options | | | | | - | | | | (4) | | | | (366) | | | | - | | | | - | | | | - | | | | - | | | | (370) | | | |
| | | Other products | | | | | - | | | | (5) | | | | - | | | | - | | | | - | | | | 108 | | | | - | | | | 103 | | | |
| | | Subtotal | | | | | (22) | | | | 805 | | | | (387) | | | | - | | | | - | | | | 108 | | | | - | | | | 504 | | | |
| | | Other sectors | | | | | | | | | | | | | | | | | | | | | | | | | | | | | | | | | | | | |
| | | Forward transactions | | | | | 235 | | | | 1 | | | | - | | | | - | | | | - | | | | - | | | | - | | | | 236 | | | |
| | | Future rate agreements (FRAs) | | | | | - | | | | 302 | | | | - | | | | - | | | | - | | | | - | | | | - | | | | 302 | | | |
| | | Swaps | | | | | (16) | | | | 1,639 | | | | 153 | | | | - | | | | (1) | | | | - | | | | - | | | | 1,775 | | | |
| | | Options | | | | | (60) | | | | 84 | | | | 250 | | | | (3) | | | | - | | | | - | | | | (4) | | | | 267 | | | |
| | | Other products | | | | | (3) | | | | 80 | | | | - | | | | - | | | | - | | | | - | | | | - | | | | 77 | | | |
| | | Subtotal | | | | | 156 | | | | 2,106 | | | | 403 | | | | (3) | | | | (1) | | | | - | | | | (4) | | | | 2,657 | | | |
| | | Subtotal | | | | | (896) | | | | 178 | | | | 209 | | | | (3) | | | | 6 | | | | 16 | | | | (3) | | | | (493) | | | |
| | | Total | | | | | (900) | | | | 178 | | | | 99 | | | | (3) | | | | 8 | | | | 16 | | | | (3) | | | | (604) | | | |
| | | Of which: | | | | | | | | | | | | | | | | | | | | | | | | | | | | | | | | | | | | |
| | | Asset Trading Derivatives | | | | | 5,722 | | | | 38,974 | | | | 3,314 | | | | 8 | | | | 76 | | | | 531 | | | | 26 | | | | 48,650 | | | |
| | | Liability Trading Derivatives | | | | | (6,622) | | | | (38,795) | | | | (3,215) | | | | (10) | | | | (68) | | | | (515) | | | | (29) | | | | (49,254) | | | |
| | | | | | | | | | | | | | | | | | | | | | | | | | | | | | | | | | | | | | |
| | | | | | | | | | | | | | | | | | | | | | | | | | | | | | | | | | | | | | |
| | | | | | | Millions of Euros | | | |
| | | Outstanding Financial Trading Derivatives 2012 | | | | Currency
Risk | | | Interest
Rate Risk | | | Equity
Price Risk | | | Precious Metals Risk | | | Commodities
Risk | | | Credit Risk | | | Other Risks | | | Total | | | |
| | | Organized markets | | | | | | | | | | | | | | | | | | | | | | | | | | | | | | | | | | | | |
| | | Financial futures | | | | | - | | | | 2 | | | | 7 | | | | - | | | | - | | | | - | | | | - | | | | 9 | | | |
| | | Options | | | | | (11) | | | | - | | | | (147) | | | | 5 | | | | (9) | | | | - | | | | - | | | | (162) | | | |
| | | Other products | | | | | - | | | | - | | | | - | | | | - | | | | - | | | | - | | | | - | | | | - | | | |
| | | Subtotal | | | | | (11) | | | | 2 | | | | (140) | | | | 5 | | | | (9) | | | | - | | | | - | | | | (153) | | | |
| | | OTC markets | | | | | | | | | | | | | | | | | | | | | | | | | | | | | | | | | | | | |
| | | Credit institutions | | | | | | | | | | | | | | | | | | | | | | | | | | | | | | | | | | | | |
| | | Forward transactions | | | | | (178) | | | | - | | | | - | | | | - | | | | - | | | | - | | | | - | | | | (178) | | | |
| | | Future rate agreements (FRAs) | | | | | - | | | | (220) | | | | - | | | | - | | | | - | | | | - | | | | - | | | | (220) | | | |
| | | Swaps | | | | | (299) | | | | (3,960) | | | | 67 | | | | 1 | | | | 40 | | | | - | | | | - | | | | (4,150) | | | |
| | | Options | | | | | 110 | | | | 605 | | | | (747) | | | | - | | | | - | | | | - | | | | 1 | | | | (31) | | | |
| | | Other products | | | | | - | | | | 11 | | | | - | | | | - | | | | - | | | | (432) | | | | - | | | | (421) | | | |
| | | Subtotal | | | | | (367) | | | | (3,565) | | | | (679) | | | | 1 | | | | 40 | | | | (432) | | | | 1 | | | | (5,001) | | | |
| | | Other financial institutions | | | | | | | | | | | | | | | | | | | | | | | | | | | | | | | | | | | | |
| | | Forward transactions | | | | | (7) | | | | - | | | | - | | | | - | | | | - | | | | - | | | | - | | | | (7) | | | |
| | | Future rate agreements (FRAs) | | | | | - | | | | (21) | | | | - | | | | - | | | | - | | | | - | | | | - | | | | (21) | | | |
| | | Swaps | | | | | - | | | | 1,460 | | | | 12 | | | | - | | | | (2) | | | | - | | | | - | | | | 1,470 | | | |
| | | Options | | | | | 9 | | | | (177) | | | | (64) | | | | - | | | | - | | | | - | | | | - | | | | (232) | | | |
| | | Other products | | | | | - | | | | - | | | | - | | | | - | | | | - | | | | 577 | | | | - | | | | 577 | | | |
| | | Subtotal | | | | | 2 | | | | 1,262 | | | | (52) | | | | - | | | | (2) | | | | 577 | | | | - | | | | 1,787 | | | |
| | | Other sectors | | | | | | | | | | | | | | | | | | | | | | | | | | | | | | | | | | | | |
| | | Forward transactions | | | | | 392 | | | | - | | | | - | | | | - | | | | - | | | | - | | | | - | | | | 392 | | | |
| | | Future rate agreements (FRAs) | | | | | - | | | | 311 | | | | - | | | | - | | | | - | | | | - | | | | - | | | | 311 | | | |
| | | Swaps | | | | | 31 | | | | 2,536 | | | | 409 | | | | - | | | | 40 | | | | - | | | | - | | | | 3,016 | | | |
| | | Options | | | | | (79) | | | | 164 | | | | 330 | | | | - | | | | - | | | | - | | | | 9 | | | | 424 | | | |
| | | Other products | | | | | - | | | | 8 | | | | - | | | | - | | | | - | | | | (18) | | | | - | | | | (10) | | | |
| | | Subtotal | | | | | 343 | | | | 3,020 | | | | 739 | | | | - | | | | 40 | | | | (18) | | | | 9 | | | | 4,133 | | | |
| | | Subtotal | | | | | (21) | | | | 717 | | | | 7 | | | | 1 | | | | 78 | | | | 127 | | | | 10 | | | | 919 | | | |
| | | Total | | | | | (32) | | | | 719 | | | | (133) | | | | 6 | | | | 69 | | | | 127 | | | | 10 | | | | 766 | | | |
| | | Of which: | | | | | | | | | | | | | | | | | | | | | | | | | | | | | | | | | | | | |
| | | Asset Trading Derivatives | | | | | 8,892 | | | | 32,837 | | | | 3,178 | | | | 45 | | | | 284 | | | | 2,064 | | | | 33 | | | | 47,333 | | | |
| | | Liability Trading Derivatives | | | | | (8,923) | | | | (32,118) | | | | (3,311) | | | | (39) | | | | (215) | | | | (1,937) | | | | (24) | | | | (46,567) | | | |
| | | | | | | | | | | | | | | | | | | | | | | | | | | | | | | | | | | | | | |
F-102
11. Other financial assets and liabilities at fair value through profit or loss
The breakdown of the balance under these headings in the accompanying consolidated balance sheets is as follows:
| | | | | | | | | | | | | | | | | | |
| | | | | | | Millions of Euros | | | |
| | | Other Financial Assets Designated at Fair Value through Profit or Loss. Breakdown by Type of Instruments | | | | 2013 | | | 2012 | | | 2011 | | | |
| | | ASSETS- | | | | | | | | | | | | | | | | |
| | | Loans and advances to credit institutions | | | | | - | | | | - | | | | - | | | |
| | | Debt securities | | | | | 663 | | | | 753 | | | | 708 | | | |
| | | Unit-linked products | | | | | 161 | | | | 145 | | | | 113 | | | |
| | | Other securities | | | | | 503 | | | | 608 | | | | 595 | | | |
| | | Equity instruments | | | | | 1,750 | | | | 1,777 | | | | 2,065 | | | |
| | | Unit-linked products | | | | | 1,689 | | | | 1,727 | | | | 1,473 | | | |
| | | Other securities | | | | | 60 | | | | 50 | | | | 592 | | | |
| | | Total | | | | | 2,413 | | | | 2,530 | | | | 2,773 | | | |
| | | LIABILITIES- | | | | | | | | | | | | | | | | |
| | | Other financial liabilities | | | | | 2,467 | | | | 2,216 | | | | 1,621 | | | |
| | | Unit-linked products | | | | | 2,467 | | | | 2,216 | | | | 1,621 | | | |
| | | Total | | | | | 2,467 | | | | 2,216 | | | | 1,621 | | | |
| | | | | | | | | | | | | | | | | | | |
As of December 31, 2013, 2012 and 2011 the most representative balance within other financial assets and liabilities at fair value through profit and loss related to assets and liabilities linked to insurance products where the policyholder bears the risk (“Unit -Link”). This type of product is sold only in Spain, through BBVA Seguros SA, insurance and reinsurance and Unnim Vida SA, insurance and reinsurance, and in Mexico through Seguros Bancomer SA de CV.
Since the liabilities linked to insurance products in which the policyholder assumes the risk are valued the same way as the assets associated to these insurance products, there is no credit risk component bore by the Group in relation to these liabilities.
12. Available-for-sale financial assets
12.1 Balance details
The breakdown of the balance by the main financial instruments in the accompanying consolidated balance sheets is as follows:
| | | | | | | | | | | | | | | | | | |
| | | | | | | Millions of Euros | | | |
| | | Available-for-Sale Financial Assets | | | | 2013 | | | 2012 | | | 2011 | | | |
| | | Debt securities | | | | | 71,861 | | | | 63,651 | | | | 49,549 | | | |
| | | Impairment losses | | | | | (55) | | | | (103) | | | | (133) | | | |
| | | Subtotal | | | | | 71,806 | | | | 63,548 | | | | 49,416 | | | |
| | | Equity instruments | | | | | 6,111 | | | | 4,188 | | | | 5,658 | | | |
| | | Impairment losses | | | | | (143) | | | | (236) | | | | (433) | | | |
| | | Subtotal | | | | | 5,968 | | | | 3,952 | | | | 5,225 | | | |
| | | Total | | | | | 77,774 | | | | 67,500 | | | | 54,641 | | | |
| | | | | | | | | | | | | | | | | | |
The increase in this line item is mainly due to:
| — | | On September 4, 2013 “Held to maturity investments” portfolio was reclassified to “Available for sale financial assets”. This reclassification is a result of a change in the business model used to manage these portfolios, which will not be considered a permanent investment and may be subject of sale. |
F-103
| | The reclassified balance was€9,722 million with an unrealized gain due to the change in classification of approximately€25 million, registered in the equity line “Valuation adjustments – Financial assets available for sale”. The impact in interest margin during 2013 is not material. |
| — | | As mentioned in Note 3, under the new agreement with the CITIC Group, BBVA’s stake in CNBC (Note 17), which was reduced to 9.9%, has been reclassified during the year 2013 to “Available for sale financial assets”. |
12.2 Debt securities
The breakdown of the balance under the heading “Debt securities”, broken down by the nature of the financial instruments, is as follows:
| | | | | | | | | | | | | | |
| | | | | | | Millions of Euros | | |
| | | Debt Securities Available-for-Sale 2013 | | | | Amortized Cost (*) | | Unrealized Gains | | Unrealized Losses | | Fair Value | | |
| | | Domestic Debt Securities | | | | | | | | | | | | |
| | | Spanish Government and other government agency debt securities | | | | 30,688 | | 781 | | (90) | | 31,379 | | |
| | | Other debt securities | | | | 8,536 | | 227 | | (25) | | 8,738 | | |
| | | Issued by Central Banks | | | | - | | - | | - | | - | | |
| | | Issued by credit institutions | | | | 5,907 | | 124 | | (4) | | 6,027 | | |
| | | Issued by other institutions | | | | 2,629 | | 103 | | (21) | | 2,711 | | |
| | | Subtotal | | | | 39,224 | | 1,008 | | (115) | | 40,116 | | |
| | | Foreign Debt Securities | | | | | | | | | | | | |
| | | Mexico | | | | 10,433 | | 328 | | (178) | | 10,583 | | |
| | | Mexican Government and other government agency debt securities | | | | 9,028 | | 281 | | (160) | | 9,150 | | |
| | | Other debt securities | | | | 1,404 | | 47 | | (19) | | 1,433 | | |
| | | Issued by Central Banks | | | | - | | - | | - | | - | | |
| | | Issued by credit institutions | | | | 84 | | 11 | | (2) | | 93 | | |
| | | Issued by other institutions | | | | 1,320 | | 36 | | (16) | | 1,340 | | |
| | | The United States | | | | 5,962 | | 58 | | (82) | | 5,937 | | |
| | | Government securities | | | | 1,055 | | 11 | | (11) | | 1,056 | | |
| | | US Treasury and other US Government agencies | | | | 171 | | 3 | | (4) | | 170 | | |
| | | States and political subdivisions | | | | 884 | | 8 | | (7) | | 885 | | |
| | | Other debt securities | | | | 4,907 | | 46 | | (72) | | 4,881 | | |
| | | Issued by Central Banks | | | | - | | - | | - | | - | | |
| | | Issued by credit institutions | | | | 234 | | 2 | | (2) | | 233 | | |
| | | Issued by other institutions | | | | 4,674 | | 44 | | (70) | | 4,648 | | |
| | | Other countries | | | | 14,928 | | 570 | | (329) | | 15,170 | | |
| | | Other foreign governments and other government agency debt securities | | | | 7,128 | | 333 | | (261) | | 7,199 | | |
| | | Other debt securities | | | | 7,801 | | 237 | | (67) | | 7,971 | | |
| | | Issued by Central Banks | | | | 1,209 | | 9 | | (10) | | 1,208 | | |
| | | Issued by credit institutions | | | | 4,042 | | 175 | | (51) | | 4,166 | | |
| | | Issued by other institutions | | | | 2,550 | | 54 | | (6) | | 2,597 | | |
| | | Subtotal | | | | 31,323 | | 956 | | (589) | | 31,690 | | |
| | | Total | | | | 70,547 | | 1,964 | | (704) | | 71,806 | | |
| | | | | | | | | | | | | | | |
| | (*) | The amortized cost includes portfolio gains/losses linked to insurance contracts in which the policyholder assumes the risk in case of redemption. | |
F-104
| | | | | | | | | | | | | | | | | | | | | | |
| | | | | | | Millions of Euros | | | |
| | | Debt Securities Available-for-Sale 2012 | | | | Amortized Cost (*) | | | Unrealized Gains | | | Unrealized Losses | | | Fair Value | | | |
| | | Domestic Debt Securities | | | | | | | | | | | | | | | | | | | | |
| | | Spanish Government and other government agency debt securities | | | | | 25,375 | | | | 243 | | | | (857) | | | | 24,761 | | | |
| | | Other debt securities | | | | | 9,580 | | | | 145 | | | | (120) | | | | 9,605 | | | |
| | | Issued by Central Banks | | | | | - | | | | - | | | | - | | | | - | | | |
| | | Issued by credit institutions | | | | | 7,868 | | | | 71 | | | | (59) | | | | 7,880 | | | |
| | | Issued by other issuedrs | | | | | 1,712 | | | | 74 | | | | (61) | | | | 1,725 | | | |
| | | Subtotal | | | | | 34,955 | | | | 388 | | | | (977) | | | | 34,366 | | | |
| | | Foreign Debt Securities | | | | | | | | | | | | | | | | | | | | |
| | | Mexico | | | | | 8,230 | | | | 962 | | | | (1) | | | | 9,191 | | | |
| | | Mexican Government and other government agency debt securities | | | | | 7,233 | | | | 833 | | | | - | | | | 8,066 | | | |
| | | Other debt securities | | | | | 997 | | | | 129 | | | | (1) | | | | 1,125 | | | |
| | | Issued by Central Banks | | | | | - | | | | - | | | | - | | | | - | | | |
| | | Issued by credit institutions | | | | | 333 | | | | 56 | | | | (1) | | | | 388 | | | |
| | | Issued by other issuedrs | | | | | 664 | | | | 73 | | | | - | | | | 737 | | | |
| | | The United States | | | | | 6,927 | | | | 189 | | | | (88) | | | | 7,028 | | | |
| | | Government securities | | | | | 713 | | | | 21 | | | | (10) | | | | 724 | | | |
| | | US Treasury and other US Government agencies | | | | | 228 | | | | 1 | | | | (1) | | | | 228 | | | |
| | | States and political subdivisions | | | | | 485 | | | | 20 | | | | (9) | | | | 496 | | | |
| | | Other debt securities | | | | | 6,214 | | | | 168 | | | | (78) | | | | 6,304 | | | |
| | | Issued by Central Banks | | | | | - | | | | - | | | | - | | | | - | | | |
| | | Issued by credit institutions | | | | | 150 | | | | 11 | | | | (7) | | | | 154 | | | |
| | | Issued by other issuedrs | | | | | 6,064 | | | | 157 | | | | (71) | | | | 6,150 | | | |
| | | Other countries | | | | | 13,054 | | | | 469 | | | | (560) | | | | 12,963 | | | |
| | | Other foreign governments and other government agency debt securities | | | | | 5,557 | | | | 212 | | | | (374) | | | | 5,395 | | | |
| | | Other debt securities | | | | | 7,497 | | | | 257 | | | | (186) | | | | 7,568 | | | |
| | | Issued by Central Banks | | | | | 1,158 | | | | 2 | | | | (1) | | | | 1,159 | | | |
| | | Issued by credit institutions | | | | | 4,642 | | | | 209 | | | | (101) | | | | 4,750 | | | |
| | | Issued by other issuedrs | | | | | 1,697 | | | | 46 | | | | (84) | | | | 1,659 | | | |
| | | Subtotal | | | | | 28,211 | | | | 1,620 | | | | (649) | | | | 29,182 | | | |
| | | Total | | | | | 63,166 | | | | 2,008 | | | | (1,626) | | | | 63,548 | | | |
| | | | | | | | | | | | | | | | | | | | | | | |
| | (*) | The amortized cost includes portfolio gains/losses linked to insurance contracts in which the policyholder assumes the risk in case of redemption. | |
F-105
| | | | | | | | | | | | | | | | | | | | |
| | | | | | | Millions of Euros | | |
| | | Debt Securities Available-for-Sale 2011 | | Amortized
Cost (*) | | | Unrealized
Gains | | | Unrealized
Losses | | | Fair
Value | | |
| | | Domestic Debt Securities | | | | | | | | | | | | | | | | | | |
| | | Spanish Government and other government agency debt securities | | | | | 20,531 | | | | 58 | | | | (1,380) | | | 19,209 | | |
| | | Other debt securities | | | | | 4,412 | | | | 125 | | | | (299) | | | 4,238 | | |
| | | Issued by Central Banks | | | | | - | | | | - | | | | - | | | - | | |
| | | Issued by credit institutions | | | | | 3,297 | | | | 80 | | | | (247) | | | 3,130 | | |
| | | Issued by other issuedrs | | | | | 1,115 | | | | 45 | | | | (52) | | | 1,108 | | |
| | | Subtotal | | | | | 24,943 | | | | 183 | | | | (1,679) | | | 23,447 | | |
| | | Foreign Debt Securities | | | | | | | | | | | | | | | | | | |
| | | Mexico | | | | | 4,799 | | | | 175 | | | | - | | | 4,974 | | |
| | | Mexican Government and other government agency debt securities | | | | | 4,727 | | | | 163 | | | | - | | | 4,890 | | |
| | | Other debt securities | | | | | 72 | | | | 12 | | | | - | | | 84 | | |
| | | Issued by Central Banks | | | | | - | | | | - | | | | - | | | - | | |
| | | Issued by credit institutions | | | | | 59 | | | | 11 | | | | - | | | 70 | | |
| | | Issued by other issuedrs | | | | | 14 | | | | 1 | | | | - | | | 15 | | |
| | | The United States | | | | | 7,332 | | | | 242 | | | | (235) | | | 7,339 | | |
| | | Government securities | | | | | 993 | | | | 36 | | | | (12) | | | 1,017 | | |
| | | US Treasury and other US Government agencies | | | | | 486 | | | | 8 | | | | (12) | | | 482 | | |
| | | States and political subdivisions | | | | | 507 | | | | 28 | | | | - | | | 535 | | |
| | | Other debt securities | | | | | 6,339 | | | | 206 | | | | (223) | | | 6,322 | | |
| | | Issued by Central Banks | | | | | - | | | | - | | | | - | | | - | | |
| | | Issued by credit institutions | | | | | 629 | | | | 22 | | | | (36) | | | 615 | | |
| | | Issued by other issuedrs | | | | | 5,710 | | | | 184 | | | | (186) | | | 5,708 | | |
| | | Other countries | | | | | 13,953 | | | | 622 | | | | (919) | | | 13,656 | | |
| | | Other foreign governments and other government agency debt securities | | | | | 8,235 | | | | 344 | | | | (602) | | | 7,977 | | |
| | | Other debt securities | | | | | 5,718 | | | | 278 | | | | (317) | | | 5,679 | | |
| | | Issued by Central Banks | | | | | 843 | | | | 10 | | | | (0) | | | 852 | | |
| | | Issued by credit institutions | | | | | 3,067 | | | | 184 | | | | (265) | | | 2,986 | | |
| | | Issued by other issuedrs | | | | | 1,808 | | | | 84 | | | | (51) | | | 1,841 | | |
| | | Subtotal | | | | | 26,084 | | | | 1,039 | | | | (1,154) | | | 25,969 | | |
| | | Total | | | | | 51,027 | | | | 1,222 | | | | (2,833) | | | 49,416 | | |
| | | | | | | | | | | | | | | | | | | | �� | |
| | (*) | The amortized cost includes portfolio gains/losses linked to insurance contracts in which the policyholder assumes the risk in case of redemption. | |
The credit ratings of the issuers of debt securities in the available-for-sale portfolio as of December 31, 2013, 2012 and 2011 are as follows:
| | | | | | | | | | | | | | | | | | |
| | | | | | | | | | | | | | | | | | | |
| | | | | | | December 2013 | | December 2012 | | December 2011 | | |
| | | Available for Sale financial assets
Debt Securities by Rating | | | | Fair Value
(Millions of Euros) | | % | | Fair Value
(Millions of Euros) | | % | | Fair Value
(Millions of Euros) | | % | | |
| | | AAA | | | | 847 | | 1.2% | | 1,436 | | 2.3% | | 3,022 | | 6.1% | | |
| | | AA+ | | | | 4,927 | | 6.9% | | 5,873 | | 9.2% | | 5,742 | | 11.6% | | |
| | | AA | | | | 198 | | 0.3% | | 214 | | 0.3% | | 1,242 | | 2.5% | | |
| | | AA- | | | | 748 | | 1.0% | | 1,690 | | 2.7% | | 18,711 | | 37.9% | | |
| | | A+ | | | | 554 | | 0.8% | | 741 | | 1.2% | | 735 | | 1.5% | | |
| | | A | | | | 8,463 | | 11.8% | | 1,125 | | 1.8% | | 2,320 | | 4.7% | | |
| | | A- | | | | 4,588 | | 6.4% | | 6,521 | | 10.3% | | 948 | | 1.9% | | |
| | | BBB+ | | | | 7,203 | | 10.0% | | 890 | | 1.4% | | 7,631 | | 15.4% | | |
| | | BBB | | | | 29,660 | | 41.3% | | 3,314 | | 5.2% | | 883 | | 1.8% | | |
| | | BBB- | | | | 9,152 | | 12.7% | | 28,466 | | 44.8% | | 238 | | 0.5% | | |
| | | BB+ or below | | | | 3,548 | | 4.9% | | 7,706 | | 12.1% | | 2,300 | | 4.7% | | |
| | | Without rating | | | | 1,918 | | 2.7% | | 5,572 | | 8.8% | | 5,645 | | 11.4% | | |
| | | Total | | | | 71,806 | | 100.0% | | 63,548 | | 100.0% | | 49,416 | | 100.0% | | |
| | | | | | | | | | | | | | | | | | | |
F-106
12.3 Equity instruments
The breakdown of the balance under the heading “Equity instruments” as of December 31, 2013, 2012 and 2011, is as follows:
| | | | | | | | | | | | | | | | | | | | | | |
| | | | | | | Millions of Euros | | | |
| | | Equity Instruments Available-for-Sale
2013 | | | | Amortized
Cost | | | Unrealized
Gains | | | Unrealized
Losses | | | Fair
Value | | | |
| | | Equity instruments listed | | | | | | | | | | | | | | | | | | | | |
| | | Listed Spanish company shares | | | | | 3,270 | | | | 54 | | | | (46) | | | | 3,277 | | | |
| | | Credit institutions | | | | | 3 | | | | - | | | | - | | | | 3 | | | |
| | | Other entities | | | | | 3,267 | | | | 54 | | | | (46) | | | | 3,275 | | | |
| | | Listed foreign company shares | | | | | 2,030 | | | | 46 | | | | (9) | | | | 2,066 | | | |
| | | United States | | | | | 16 | | | | - | | | | - | | | | 16 | | | |
| | | Mexico | | | | | 837 | | | | - | | | | - | | | | 45 | | | |
| | | Other countries | | | | | 2,006 | | | | 9 | | | | (9) | | | | 2,006 | | | |
| | | Subtotal | | | | | 5,300 | | | | 100 | | | | (55) | | | | 5,343 | | | |
| | | Unlisted equity instruments | | | | | - | | | | - | | | | - | | | | - | | | |
| | | Unlisted Spanish company shares | | | | | 61 | | | | - | | | | (1) | | | | 60 | | | |
| | | Credit institutions | | | | | 3 | | | | - | | | | - | | | | 3 | | | |
| | | Other entities | | | | | 58 | | | | - | | | | (1) | | | | 57 | | | |
| | | Unlisted foreign companies shares | | | | | 554 | | | | 9 | | | | (1) | | | | 563 | | | |
| | | United States | | | | | 455 | | | | - | | | | - | | | | 455 | | | |
| | | Mexico | | | | | - | | | | - | | | | - | | | | - | | | |
| | | Other countries | | | | | 99 | | | | 9 | | | | (1) | | | | 107 | | | |
| | | Subtotal | | | | | 616 | | | | 9 | | | | (2) | | | | 623 | | | |
| | | Total | | | | | 5,916 | | | | 109 | | | | (57) | | | | 5,968 | | | |
| | | | | | | | | | | | | | | | | | | | | | | |
| | | | | | | | | | | | | | | | | | | | | | |
| | | | | | | Millions of Euros | | | |
| | | Equity Instruments Available-for-Sale
2012 | | | | Amortized
Cost | | | Unrealized
Gains | | | Unrealized
Losses | | | Fair Value | | | |
| | | Equity instruments listed | | | | | | | | | | | | | | | | | | | | |
| | | Listed Spanish company shares | | | | | 3,301 | | | | 122 | | | | (380) | | | | 3,043 | | | |
| | | Credit institutions | | | | | 2 | | | | - | | | | - | | | | 2 | | | |
| | | Other entities | | | | | 3,299 | | | | 122 | | | | (380) | | | | 3,041 | | | |
| | | Listed foreign company shares | | | | | 294 | | | | 9 | | | | (44) | | | | 259 | | | |
| | | United States | | | | | 32 | | | | 1 | | | | (4) | | | | 29 | | | |
| | | Mexico | | | | | - | | | | - | | | | - | | | | - | | | |
| | | Other countries | | | | | 262 | | | | 8 | | | | (40) | | | | 230 | | | |
| | | Subtotal | | | | | 3,595 | | | | 131 | | | | (424) | | | | 3,302 | | | |
| | | Unlisted equity instruments | | | | | | | | | | | | | | | | | | | | |
| | | Unlisted Spanish company shares | | | | | 77 | | | | 2 | | | | (4) | | | | 75 | | | |
| | | Credit institutions | | | | | 4 | | | | - | | | | - | | | | 4 | | | |
| | | Other entities | | | | | 73 | | | | 2 | | | | (4) | | | | 71 | | | |
| | | Unlisted foreign companies shares | | | | | 568 | | | | 7 | | | | - | | | | 575 | | | |
| | | United States | | | | | 474 | | | | - | | | | - | | | | 474 | | | |
| | | Mexico | | | | | - | | | | - | | | | - | | | | - | | | |
| | | Other countries | | | | | 94 | | | | 7 | | | | - | | | | 101 | | | |
| | | Subtotal | | | | | 645 | | | | 9 | | | | (4) | | | | 650 | | | |
| | | Total | | | | | 4,240 | | | | 140 | | | | (428) | | | | 3,952 | | | |
| | | | | | | | | | | | | | | | | | | | | | | |
F-107
| | | | | | | | | | | | | | |
| | | | | | | Millions of Euros | | |
| | | Equity Instruments Available-for-Sale 2011 | | | | Amortized Cost | | Unrealized Gains | | Unrealized Losses | | Fair Value | | |
| | | Equity instruments listed | | | | | | | | | | | | |
| | | Listed Spanish company shares | | | | 3,803 | | 468 | | (2) | | 4,269 | | |
| | | Credit institutions | | | | 2 | | - | | - | | 2 | | |
| | | Other entities | | | | 3,801 | | 468 | | (2) | | 4,267 | | |
| | | Listed foreign company shares | | | | 359 | | 5 | | (91) | | 273 | | |
| | | United States | | | | 41 | | - | | (12) | | 29 | | |
| | | Mexico | | | | - | | - | | - | | - | | |
| | | Other countries | | | | 318 | | 5 | | (79) | | 244 | | |
| | | Subtotal | | | | 4,162 | | 473 | | (93) | | 4,542 | | |
| | | Unlisted equity instruments | | | | | | | | | | | | |
| | | Unlisted Spanish company shares | | | | 35 | | - | | - | | 35 | | |
| | | Credit institutions | | | | 1 | | - | | - | | 1 | | |
| | | Other entities | | | | 35 | | - | | - | | 35 | | |
| | | Unlisted foreign companies shares | | | | 635 | | 13 | | - | | 648 | | |
| | | United States | | | | 559 | | 2 | | - | | 561 | | |
| | | Mexico | | | | 1 | | - | | - | | 1 | | |
| | | Other countries | | | | 75 | | 11 | | - | | 86 | | |
| | | Subtotal | | | | 670 | | 13 | | - | | 683 | | |
| | | Total | | | | 4,832 | | 486 | | (93) | | 5,225 | | |
| | | | | | | | | | | | | | | |
12.4 Gains/losses
The changes in the gains/losses, net of taxes, recognized under the equity heading “Valuation adjustments – Available-for-sale financial assets” in the accompanying consolidated balance sheets are as follows:
| | | | | | | | | | | | |
| | | | | | | Millions of Euros | | |
| | | Changes in Valuation Adjustments - Available-for-Sale
Financial Assets | | | | 2013 | | 2012 | | 2011 | | |
| | | Balance at the beginning | | | | (238) | | (628) | | 333 | | |
| | | Valuation gains and losses | | | | 1,653 | | 464 | | (1,281) | | |
| | | Income tax | | | | (489) | | (192) | | 231 | | |
| | | Amounts transferred to income | | | | (136) | | 118 | | 89 | | |
| | | Other reclasifications | | | | 61 | | - | | - | | |
| | | Balance at the end | | | | 851 | | (238) | | (628) | | |
| | | Of which: | | | | | | | | | | |
| | | Debt securities | | | | 780 | | (80) | | (974) | | |
| | | Equity instruments | | | | 71 | | (158) | | 346 | | |
| | | | | | | | | | | | | |
The losses recognized under the heading “Valuation adjustments – Available-for-sale financial assets” in the consolidated balance sheet for the year 2013 correspond mainly to debt securities from government agencies.
| — | | As of December 31, 2013, 46.7% of the unrealized losses recognized under the heading “Valuation adjustments – Available-for-sale financial assets” and originating in debt securities were generated over more than twelve months. However, no impairment has been considered, as following an analysis of these unrealized losses it can be concluded that they were temporary due to the following reasons: the interest payment dates of all the fixed-income securities have been satisfied; and because there is no evidence that the issuer will not continue to meet its payment obligations, nor that future payments of both principal and interest will not be sufficient to recover the cost of the debt securities. |
| — | | As of December 31, 2013, the Group has analyzed the unrealized losses recognized under the heading “Valuation adjustments – Available-for-sale financial assets” resulting from equity instruments generated over a period of more than 12 months and with a fall of more 20% in their price, as a first approximation to the existence of possible impairment. As of 31 December, 2013, the unrealized losses recognized under the heading “Valuation adjustments – Available-for-sale financial assets” resulting from equity instruments generated over a period of more than 18 months or with a fall of more 40% in their price are not significant. |
F-108
The losses recognized under the heading “Impairment losses on financial assets (net) – Available-for-sale financial assets” in the accompanying consolidated income statement amounted to€36,€41 million and€22 million for the year ended December 31, 2013, 2012 and 2011, respectively (see Note 49).
13. Loans and receivables
The breakdown of the balance under this heading in the accompanying consolidated balance sheets, according to the nature of the financial instrument, is as follows:
| | | | | | | | | | | | | | | | | | |
| | | | | | | | | | Millions of Euros | | | |
| | | Loans and Receivables | | Notes | | 2013 | | | 2012 | | | 2011 | | | |
| | | Loans and advances to credit institutions | | 13.1 | | | 22,862 | | | | 25,448 | | | | 24,503 | | | |
| | | Loans and advances to customers | | 13.2 | | | 323,607 | | | | 342,163 | | | | 342,543 | | | |
| | | Debt securities | | 13.3 | | | 4,476 | | | | 3,736 | | | | 2,870 | | | |
| | | Total | | | | | 350,945 | | | | 371,347 | | | | 369,916 | | | |
| | | | | | | | | | | | | | | | | | | |
13.1 Loans and advances to credit institutions
The breakdown of the balance under this heading in the accompanying consolidated balance sheets, according to the nature of the financial instrument, is as follows:
| | | | | | | | | | | | | | | | | | |
| | | | | | | | | | Millions of Euros | | | |
| | | Loans and Advances to Credit Institutions �� | | Notes | | 2013 | | | 2012 | | | 2011 | | | |
| | | Reciprocal accounts | | | | | 132 | | | | 265 | | | | 78 | | | |
| | | Deposits with agreed maturity | | | | | 5,901 | | | | 5,987 | | | | 7,102 | | | |
| | | Demand deposits | | | | | 1,421 | | | | 1,794 | | | | 2,489 | | | |
| | | Other accounts | | | | | 8,510 | | | | 10,543 | | | | 8,943 | | | |
| | | Reverse repurchase agreements | | 37 | | | 6,828 | | | | 6,783 | | | | 5,788 | | | |
| | | Total gross | | 7.1.1 | | | 22,792 | | | | 25,372 | | | | 24,400 | | | |
| | | Valuation adjustments | | | | | 70 | | | | 76 | | | | 102 | | | |
| | | Impairment losses | | 7.1.7 | | | (40) | | | | (29) | | | | (38) | | | |
| | | Accrued interests and fees | | | | | 110 | | | | 106 | | | | 140 | | | |
| | | Hedging derivatives and others | | | | | - | | | | (1) | | | | (1) | | | |
| | | Total net | | | | | 22,862 | | | | 25,448 | | | | 24,503 | | | |
| | | | | | | | | | | | | | | | | | | |
F-109
13.2 Loans and advances to customers
The breakdown of the balance under this heading in the accompanying consolidated balance sheets, according to the nature of the financial instrument, is as follows:
| | | | | | | | | | | | |
| | | | | | | Millions of Euros |
| | | Loans and Advances to Customers | | Notes | | 2013 | | 2012 | | 2011 | | |
| | | Mortgage secured loans | | 7.1.2 | | 125,564 | | 137,870 | | 129,536 | | |
| | | Other secured loans | | 7.1.2 | | 23,660 | | 23,125 | | 23,915 | | |
| | | Other loans | | | | 109,600 | | 115,667 | | 117,353 | | |
| | | Credit lines | | | | 11,166 | | 13,854 | | 14,924 | | |
| | | Commercial credit | | | | 9,711 | | 11,165 | | 13,037 | | |
| | | Receivable on demand and other | | | | 8,210 | | 10,731 | | 13,029 | | |
| | | Credit cards | | | | 11,070 | | 10,934 | | 9,167 | | |
| | | Finance leases | | | | 6,954 | | 7,546 | | 7,885 | | |
| | | Reverse repurchase agreements | | 37 | | 4,449 | | 3,118 | | 4,827 | | |
| | | Financial paper | | | | 930 | | 1,003 | | 1,150 | | |
| | | Impaired assets | | 7.1.6 | | 25,445 | | 19,960 | | 15,416 | | |
| | | Total gross | | 7.1. | | 336,759 | | 354,973 | | 350,239 | | |
| | | Valuation adjustments | | | | (13,151) | | (12,810) | | (7,696) | | |
| | | Impairment losses | | 7.1.7 | | (14,950) | | (14,115) | | (9,091) | | |
| | | Accrued interests and fees | | | | 953 | | 227 | | 392 | | |
| | | Hedging derivatives and others | | | | 846 | | 1,077 | | 1,003 | | |
| | | Total net | | | | 323,607 | | 342,163 | | 342,543 | | |
| | | | | | | | | | | | | |
As of December 31, 2013, 28% of “Loans and advances to customers” with maturity greater than one year have with fixed-interest rates and 72% with variable interest rates.
The heading “Loans and advances to customers” includes those financial lease arrangements that any Group company has registered to assist customers in funding the acquisition of movable property or real estate. The breakdown of financial lease arrangements as of December 31, 2013, 2012 and 2011 is as follows:
| | | | | | | | | | | | | | | | |
| | | | | | | Millions of Euros | | | |
| | | Financial Lease Arrangements | | | | 2013 | | 2012 | | | 2011 | | | |
| | | Movable property | | | | 4,095 | | | 4,273 | | | | 4,634 | | | |
| | | Real Estate | | | | 2,859 | | | 3,273 | | | | 3,251 | | | |
| | | Fixed rate | | | | 69% | | | 64% | | | | 58% | | | |
| | | Floating rate | | | | 31% | | | 36% | | | | 42% | | | |
| | | | | | | | | | | | | | | | | |
F-110
The heading “Loans and receivables – Loans and advances to customers” in the accompanying consolidated balance sheets also includes certain mortgage loans that, as mentioned in Note 35 and pursuant to the Mortgage Market Act, are linked to long-term mortgage-covered bonds. This heading also includes some loans that have been securitized. The balances recognized in the accompanying consolidated balance sheets corresponding to these securitized loans are as follows:
| | | | | | | | | | |
| | | | | Millions of Euros | | |
| | | Securitized Loans | | 2013 | | 2012 | | 2011 | | |
| | | Securitized mortgage assets | | 22,407 | | 20,077 | | 33,247 | | |
| | | Other securitized assets | | 4,224 | | 5,647 | | 6,921 | | |
| | | Commercial and industrial loans | | 2,330 | | 3,241 | | 3,303 | | |
| | | Finance leases | | 301 | | 433 | | 594 | | |
| | | Loans to individuals | | 1,518 | | 1,877 | | 2,942 | | |
| | | Rest | | 75 | | 96 | | 82 | | |
| | | Total | | 26,631 | | 25,724 | | 40,168 | | |
| | | Of which: | | | | | | | | |
| | | Liabilities associated to assets retained on the balance sheet (*) | | 6,348 | | 6,180 | | 7,088 | | |
| | | | | | | | | | | |
| | (*) | These liabilities are recognized under “Financial liabilities at amortized cost - Debt securities” in the accompanying consolidated balance sheets (Note 23.3). | |
13.3 Debt securities
The breakdown of the balance under this heading in the accompanying consolidated balance sheets, according to the issuer of the debt security, is as follows:
| | | | | | | | | | | | |
| | | | | | | Millions of Euros | | |
| | | Debt securities | | Notes | | 2013 | | 2012 | | 2011 | | |
| | | Government | | | | 3,175 | | 2,375 | | 2,128 | | |
| | | Credit institutions | | | | 297 | | 453 | | 461 | | |
| | | Other sectors | | | | 1,009 | | 923 | | 291 | | |
| | | Total gross | | 7.1 | | 4,481 | | 3,751 | | 2,880 | | |
| | | Valuation adjustments | | 7.1.7 | | (5) | | (15) | | (11) | | |
| | | Total net | | | | 4,476 | | 3,736 | | 2,870 | | |
| | | | | | | | | | | | | |
F-111
14. Held-to-maturity investments
As mentioned in Note 12, there has been a reclassification of the entire investments held to maturity portfolio to “available for sale financial assets” during 2013. Therefore, in this note, the breakdown of the consolidated balance sheets is only provided as of December 31, 2012 and 2011.
| | | | | | | | | | | | | | |
| | | | | | | Millions of Euros | | |
| | | Held-to-Maturity Investments 2012 | | | | Amortized
Cost | | Unrealized
Gains | | Unrealized
Losses | | Fair Value | | |
| | | Domestic Debt Securities | | | | | | | | | | | | |
| | | Spanish Government and other government agency debt securities | | | | 6,469 | | 2 | | (406) | | 6,065 | | |
| | | Other domestic debt securities | | | | 809 | | 2 | | (27) | | 784 | | |
| | | Issued by credit institutions | | | | 250 | | 2 | | (3) | | 249 | | |
| | | Issued by other issuedrs | | | | 559 | | - | | (24) | | 535 | | |
| | | Subtotal | | | | 7,278 | | 4 | | (433) | | 6,849 | | |
| | | Foreign Debt Securities | | | | | | | | | | | | |
| | | Government and other government agency debt securities | | | | 2,741 | | 121 | | - | | 2,862 | | |
| | | Other debt securities | | | | 143 | | 6 | | - | | 149 | | |
| | | Subtotal | | | | 2,884 | | 127 | | - | | 3,011 | | |
| | | Total | | | | 10,162 | | 131 | | (433) | | 9,860 | | |
| | | | | | | | | | | | | | | |
| | | | | | | | | | | | | | |
| | | | | | | Millions of Euros | | |
| | | Held-to-Maturity Investments 2011 | | | | Amortized
Cost | | Unrealized
Gains | | Unrealized
Losses | | Fair Value | | |
| | | Domestic Debt Securities | | | | | | | | | | | | |
| | | Spanish Government and other government agency debt securities | | | | 6,520 | | 1 | | (461) | | 6,060 | | |
| | | Other domestic debt securities | | | | 853 | | - | | (65) | | 788 | | |
| | | Subtotal | | | | 7,373 | | 1 | | (526) | | 6,848 | | |
| | | Foreign Debt Securities | | | | | | | | | | | | |
| | | Government and other government agency debt securities | | | | 3,376 | | 9 | | (236) | | 3,149 | | |
| | | Other debt securities | | | | 206 | | 3 | | (16) | | 193 | | |
| | | Subtotal | | | | 3,582 | | 12 | | (252) | | 3,342 | | |
| | | Total | | | | 10,955 | | 13 | | (778) | | 10,190 | | |
| | | | | | | | | | | | | | | |
The foreign debt securities held by the Group as of December 31, 2012 and 2011 in the held-to-maturity investments portfolio are basically from European issuers.
15. Hedging derivatives (receivable and payable) and Fair-value changes of the hedged items in portfolio hedges of interest-rate risk
The balance of these headings in the accompanying consolidated balance sheets is as follows:
| | | | | | | | | | | | | | | | |
| | | | | | | Millions of Euros | | | |
| | | Hedging derivatives and Fair value changes of the
hedged items in portfolio hedges of interest rate risk | | | | 2013 | | 2012 | | | 2011 | | | |
| | | ASSETS- | | | | | | | | | | | | | | |
| | | Fair value changes of the hedged items in portfolio hedges of interest rate risk | | | | 98 | | | 226 | | | | 146 | | | |
| | | Hedging derivatives | | | | 2,530 | | | 4,894 | | | | 4,538 | | | |
| | | LIABILITIES- | | | | | | | | | | | | | | |
| | | Fair value changes of the hedged items in portfolio hedges of interest rate risk | | | | - | | | - | | | | - | | | |
| | | Hedging derivatives | | | | 1,792 | | | 2,968 | | | | 2,709 | | | |
| | | | | | | | | | | | | | | | | |
F-112
As of December 31, 2013, 2012 and 2011, the main positions hedged by the Group and the derivatives designated to hedge those positions were:
| | - | | Available-for-sale fixed-interest debt securities: This risk is hedged using interest rate derivatives (fixed-variable swaps). |
| | - | | Long-term fixed-interest debt securities issued by the Group: This risk is hedged using interest rate derivatives (fixed-variable swaps). |
| | - | | Available-for-sale equity instruments: This risk is hedged using equity swaps and OTC (“Over The counter”) options. |
| | - | | Fixed-interest loans: This risk is hedged using interest rate derivatives (fixed-variable swaps). |
| | - | | Fixed-interest deposit portfolio hedges: This risk is hedged using fixed-variable swaps and interest-rate options. The valuation of the deposit hedges corresponding to interest-rate risk is recognized under the heading “Fair value changes of the hedged items in portfolio hedges of interest-rate risk.” |
| | - | | Most of the hedged items are floating interest-rate loans. This risk is hedged using foreign-exchange, interest-rate swaps and FRAs (“Forward Rate Agreement”). |
| — | | Net foreign-currency investment hedges: |
| | - | | The risks hedged are foreign-currency investments in the Group’s foreign subsidiaries. This risk is hedged mainly with foreign-exchange options. |
Note 7 analyze the Group’s main risks that are hedged using these derivatives.
F-113
The details of the net positions by hedged risk of the fair value of the hedging derivatives recognized in the accompanying consolidated balance sheets are as follows:
| | | | | | | | | | | | | | | | | | | | | | | | |
| | | | | | | Millions of Euros |
| | | Hedging Derivatives by Markets and Transaction Type 2013 | | Currency
Risk | | | Interest
Rate Risk | | | Equity Price Risk | | | Other Risks | | | Total | | |
| | | Organized markets | | | | | | | | | | | | | | | | | | | | | | |
| | | Fair value hedge | | | | | - | | | | - | | | | - | | | | - | | | - | | |
| | | Subtotal | | | | | - | | | | - | | | | - | | | | - | | | - | | |
| | | OTC markets | | | | | | | | | | | | | | | | | | | | | | |
| | | Credit institutions | | | | | | | | | | | | | | | | | | | | | | |
| | | Fair value hedge | | | | | (1) | | | | 675 | | | | (22) | | | | (10) | | | 642 | | |
| | | Of which: Macro hedge | | | | | - | | | | (253) | | | | - | | | | | | | (253) | | |
| | | Cash flow hedge | | | | | - | | | | 12 | | | | - | | | | | | | 12 | | |
| | | | | | | | | |
| | | Net investment in a foreign operation hedge | | | | | - | | | | - | | | | - | | | | - | | | - | | |
| | | Subtotal | | | | | (1) | | | | 687 | | | | (22) | | | | (10) | | | 654 | | |
| | | Other financial Institutions | | | | | | | | | | | | | | | | | | | | | | |
| | | Fair value hedge | | | | | - | | | | 137 | | | | - | | | | - | | | 137 | | |
| | | Of which: Macro hedge | | | | | - | | | | (71) | | | | - | | | | - | | | (71) | | |
| | | Cash flow hedge | | | | | - | | | | (7) | | | | - | | | | - | | | (7) | | |
| | | | | | | | | |
| | | Net investment in a foreign operation hedge | | | | | - | | | | - | | | | - | | | | - | | | - | | |
| | | Subtotal | | | | | - | | | | 130 | | | | - | | | | - | | | 130 | | |
| | | Other sectors | | | | | | | | | | | | | | | | | | | | | | |
| | | Fair value hedge | | | | | - | | | | (44) | | | | (2) | | | | - | | | (46) | | |
| | | Of which: Macro hedge | | | | | - | | | | (6) | | | | - | | | | - | | | (6) | | |
| | | Cash flow hedge | | | | | - | | | | - | | | | - | | | | - | | | - | | |
| | | | | | | | | |
| | | Net investment in a foreign operation hedge | | | | | - | | | | - | | | | - | | | | - | | | - | | |
| | | Subtotal | | | | | - | | | | (44) | | | | (2) | | | | - | | | (46) | | |
| | | Total | | | | | (1) | | | | 773 | | | | (24) | | | | (10) | | | 738 | | |
| | | Of which: | | | | | | | | | | | | | | | | | | | | | | |
| | | Asset Hedging Derivatives | | | | | 7 | | | | 2,511 | | | | 11 | | | | - | | | 2,530 | | |
| | | Liability Hedging Derivatives | | | | | (9) | | | | (1,738) | | | | (34) | | | | (11) | | | (1,792) | | |
| | | | | | | | | | | | | | | | | | | | | | | | | |
F-114
| | | | | | | | | | | | | | | | | | | | | | | | | | |
| | | | | | | Millions of Euros | | | |
| | | Hedging Derivatives by Markets and
Transaction Type 2012 | | | | Currency Risk | | | Interest Rate Risk | | | Equity Price Risk | | | Other Risks | | | Total | | | |
| | | Organized markets | | | | | | | | | | | | | | | | | | | | | | | | |
| | | Fair value hedge | | | | | - | | | | - | | | | (52) | | | | - | | | | (52) | | | |
| | | Subtotal | | | | | - | | | | - | | | | (52) | | | | - | | | | (52) | | | |
| | | OTC markets | | | | | - | | | | - | | | | - | | | | - | | | | - | | | |
| | | Credit institutions | | | | | - | | | | - | | | | - | | | | - | | | | - | | | |
| | | Fair value hedge | | | | | 11 | | | | 1,773 | | | | (50) | | | | (1) | | | | 1,733 | | | |
| | | Of which: Macro hedge | | | | | - | | | | (365) | | | | - | | | | - | | | | (365) | | | |
| | | Cash flow hedge | | | | | 21 | | | | 35 | | | | - | | | | - | | | | 56 | | | |
| | | Net investment in a foreign operation hedge | | | | | 2 | | | | - | | | | - | | | | - | | | | 2 | | | |
| | | Subtotal | | | | | 34 | | | | 1,808 | | | | (50) | | | | (1) | | | | 1,791 | | | |
| | | Other financial Institutions | | | | | - | | | | - | | | | - | | | | - | | | | - | | | |
| | | Fair value hedge | | | | | - | | | | 227 | | | | - | | | | - | | | | 227 | | | |
| | | Of which: Macro hedge | | | | | - | | | | (117) | | | | - | | | | - | | | | (117) | | | |
| | | Cash flow hedge | | | | | 6 | | | | (13) | | | | - | | | | - | | | | (7) | | | |
| | | Net investment in a foreign operation hedge | | | | | - | | | | - | | | | - | | | | - | | | | - | | | |
| | | Subtotal | | | | | 6 | | | | 214 | | | | - | | | | - | | | | 220 | | | |
| | | Other sectors | | | | | - | | | | - | | | | - | | | | - | | | | - | | | |
| | | Fair value hedge | | | | | (6) | | | | (16) | | | | (3) | | | | - | | | | (25) | | | |
| | | Of which: Macro hedge | | | | | - | | | | (14) | | | | - | | | | - | | | | (14) | | | |
| | | Cash flow hedge | | | | | - | | | | (8) | | | | - | | | | - | | | | (8) | | | |
| | | Net investment in a foreign operation hedge | | | | | - | | | | - | | | | - | | | | - | | | | - | | | |
| | | Subtotal | | | | | (6) | | | | (24) | | | | (3) | | | | - | | | | (33) | | | |
| | | Total | | | | | 34 | | | | 1,998 | | | | (105) | | | | (1) | | | | 1,926 | | | |
| | | Of which: | | | | | | | | | | | | | | | | | | | | | | | | |
| | | Asset Hedging Derivatives | | | | | 49 | | | | 4,818 | | | | 27 | | | | - | | | | 4,894 | | | |
| | | Liability Hedging Derivatives | | | | | (16) | | | | (2,820) | | | | (131) | | | | (1) | | | | (2,968) | | | |
| | | | | | | | | | | | | | | | | | | | | | | | | | | |
| | | | | | | | | | | | | | | | | | | | | | | | | | |
| | | | | | | Millions of Euros | | | |
| | | Hedging Derivatives by Markets and
Transaction Type 2011 | | | | Currency Risk | | | Interest Rate Risk | | | Equity Price Risk | | | Other Risks | | | Total | | | |
| | | OTC markets | | | | | | | | | | | | | | | | | | | | | | | | |
| | | Credit institutions | | | | | | | | | | | | | | | | | | | | | | | | |
| | | Fair value hedge | | | | | - | | | | 1,679 | | | | 27 | | | | 3 | | | | 1,709 | | | |
| | | Of which: Macro hedge | | | | | - | | | | (331) | | | | - | | | | - | | | | (331) | | | |
| | | Cash flow hedge | | | | | (45) | | | | 89 | | | | - | | | | - | | | | 44 | | | |
| | | | | | | | | |
| | | Net investment in a foreign operation hedge | | | | | (2) | | | | - | | | | - | | | | - | | | | (2) | | | |
| | | Subtotal | | | | | (47) | | | | 1,767 | | | | 27 | | | | 3 | | | | 1,751 | | | |
| | | Other financial Institutions | | | | | | | | | | | | | | | | | | | | | | | | |
| | | Fair value hedge | | | | | - | | | | 93 | | | | - | | | | - | | | | 93 | | | |
| | | Of which: Macro hedge | | | | | - | | | | (41) | | | | - | | | | - | | | | (41) | | | |
| | | Cash flow hedge | | | | | (2) | | | | - | | | | - | | | | - | | | | (2) | | | |
| | | | | | | | | |
| | | Net investment in a foreign operation hedge | | | | | - | | | | - | | | | - | | | | - | | | | - | | | |
| | | Subtotal | | | | | (2) | | | | 93 | | | | - | | | | - | | | | 91 | | | |
| | | Other sectors | | | | | | | | | | | | | | | | | | | | | | | | |
| | | Fair value hedge | | | | | - | | | | 4 | | | | (1) | | | | - | | | | 3 | | | |
| | | Of which: Macro hedge | | | | | - | | | | (6) | | | | - | | | | - | | | | (6) | | | |
| | | Cash flow hedge | | | | | - | | | | (16) | | | | - | | | | - | | | | (16) | | | |
| | | | | | | | | |
| | | Net investment in a foreign operation hedge | | | | | - | | | | - | | | | - | | | | - | | | | - | | | |
| | | Subtotal | | | | | - | | | | (12) | | | | (1) | | | | - | | | | (13) | | | |
| | | Total | | | | | (49) | | | | 1,848 | | | | 26 | | | | 3 | | | | 1,829 | | | |
| | | Of which: | | | | | | | | | | | | | | | | | | | | | | | | |
| | | Asset Hedging Derivatives | | | | | 34 | | | | 4,460 | | | | 41 | | | | 3 | | | | 4,538 | | | |
| | | Liability Hedging Derivatives | | | | | (83) | | | | (2,611) | | | | (15) | | | | - | | | | (2,709) | | | |
| | | | | | | | | | | | | | | | | | | | | | | | | | | |
F-115
The cash flows forecasts for the coming years for cash flow hedging recognized on the accompanying consolidated balance sheet as of December 31, 2013 are:
| | | | | | | | | | | | | | | | | | |
| | | | | | | | | | | Millions of Euros | | |
| | | | | Cash Flows of Hedging Instruments | | | | 3 Months or Less | | From 3 Months to 1 Year | | From 1 to 5 Years | | More than 5 Years | | Total | | |
| | | | | Receivable cash inflows | | | | 53 | | 223 | | 699 | | 1,069 | | 2,044 | | |
| | | | | Payable cash outflows | | | | 29 | | 230 | | 620 | | 993 | | 1,872 | | |
| | | | | | | | | | | | | | | | | | | |
The above cash flows will have an impact on the consolidated income statements until 2050.
In 2013 and 2012, there was no reclassification in the accompanying consolidated income statements of any amount corresponding to cash flow hedges that was previously recognized as equity. The amounts recognized previously in equity from cash flow hedges that were reclassified and included in the consolidated income statement, either under the heading “Gains or losses of financial assets and liabilities (net)” or under the heading “Exchange differences (net)” totaled€29 million in 2011.
The amount for derivatives designated as accounting hedges that did not pass the effectiveness test during 2013 was not material.
16. Non-current assets held for sale and liabilities associated with non-current assets held for sale
The composition of the balance under the heading “Non-current assets held for sale” and “liabilities associated with non-current assets held for sale” in the accompanying consolidated balance sheets, broken down by the origin of the assets, is as follows:
| | | | | | | | | | | | | | |
| | | | | | | | | Millions of Euros |
| | | | | Non-Current Assets Held-for-Sale and Liabilities Associated [Breakdown by type of Asset] | | 2013 | | 2012 | | 2011 | | |
| | | | | Business sale - Assets (*) | | | | 92 | | 1,536 | | - | | |
| | | | | Of which: discontinued operations | | | | - | | 1,150 | | - | | |
| | | | | Other assets from: | | | | | | | | | | |
| | | | | Property, plants and equipment | | | | 302 | | 168 | | 195 | | |
| | | | | Buildings for own use | | | | 270 | | 125 | | 130 | | |
| | | | | Operating leases | | | | 32 | | 43 | | 65 | | |
| | | | | Foreclosures and recoveries | | | | 3,099 | | 3,044 | | 2,174 | | |
| | | | | Foreclosures | | | | 2,914 | | 2,877 | | 2,032 | | |
| | | | | Recoveries from financial leases | | | | 185 | | 167 | | 142 | | |
| | | | | Accrued amortization (**) | | | | (49) | | (47) | | (59) | | |
| | | | | Impairment losses | | | | (565) | | (472) | | (235) | | |
| | | | | Total Non-Current Assets Held-for-Sale | | | | 2,880 | | 4,229 | | 2,075 | | |
| | | | | | | | | | | | | | | |
| | | | | Business sale agreement - Liabilities | | | | - | | 387 | | - | | |
| | | | | Of which: discontinued operations | | | | - | | 318 | | - | | |
| | | | | Liabilities associated with non-current assets held for sale | | | | - | | 387 | | - | | |
| | | | | | | | | | | | | | | |
| | (*) | As of December 31, 2013 this item included the investment in “Corporación IBV Participaciones Empresariales S.A.”. As of December 31, 2012 this item included the assets of the business sale agreement related to pension business in Latin America as it is describe in Note 3. | |
| | (**) | Net of accumulated amortization until reclassified as non-current assets held for sale. | |
F-116
The changes in the balances of “Non-current assets available for sale” in 2013, 2012 and 2011 are as follows:
| | | | | | | | | | | | | | | | |
| | | | | | | Millions of Euros | | |
| | | | Real Estate | | | | | | |
| | | | Foreclosed Assets | | | | | | | | |
| | | Non-Current Assets Held-for-Sale
Changes in the year 2013 | | | | Foreclosed Assets through Auction Proceeding | | Recovered Assets from Finance Leases | | From Own Use Assets (*) | | Other assets (**) | | Total | | |
| | | | | | | | | | | | | | | | | |
| | | Cost (1) | | | | | | | | | | | | | | |
| | | Balance at the beginning | | | | 2,877 | | 167 | | 121 | | 1,536 | | 4,702 | | |
| | | Additions | | | | 940 | | 84 | | 69 | | - | | 1,093 | | |
| | | | | | | | | |
| | | Contributions from merger transactions | | | | - | | 1 | | - | | - | | 1 | | |
| | | Retirements (sales and other decreases) | | | | (569) | | (58) | | (117) | | (1,536) | | (2,280) | | |
| | | Transfers, other movements and exchange differences | | | | (334) | | (9) | | 180 | | 92 | | (72) | | |
| | | Balance at the end | | | | 2,914 | | 186 | | 253 | | 92 | | 3,445 | | |
| | | | | | | | | | | | | | | | | |
| | | Impairment (2) | | | | | | | | | | | | | | |
| | | Balance at the beginning | | | | 415 | | 42 | | 15 | | - | | 472 | | |
| | | Additions | | | | 569 | | 29 | | 3 | | - | | 602 | | |
| | | | | | | | | |
| | | Contributions from merger transactions | | | | - | | - | | - | | - | | - | | |
| | | Retirements (sales and other decreases) | | | | (118) | | (15) | | (15) | | - | | (147) | | |
| | | | | | | | | |
| | | Other movements and exchange differences | | | | (447) | | (12) | | 96 | | - | | (363) | | |
| | | Balance at the end | | | | 420 | | 45 | | 99 | | - | | 565 | | |
| | | Balance at the end of Net carrying value(1)-(2) | | | | 2,494 | | 141 | | 154 | | 92 | | 2,880 | | |
| | | | | | | | | | | | | | | | | |
| | (*) | Net of accumulated amortization until reclassified as non-current assets held for sale |
| | (**) | Business sale agreement (Note 3) |
| | | | | | | | | | | | | | | | |
| | | | | | | Millions of Euros | | |
| | | | Real Estate | | | | | | |
| | | | Foreclosed Assets | | | | | | | | |
| | | Non-Current Assets Held-for-Sale Changes in the year 2012 | | | | Foreclosed Assets through Auction Proceeding | | Recovered Assets from Finance Leases | | From Own Use Assets (*) | | Other assets (**) | | Total | | |
| | | | | | | | | | | | | | | | | |
| | | Cost (1) | | | | | | | | | | | | | | |
| | | Balance at the beginning | | | | 2,032 | | 177 | | 100 | | - | | 2,309 | | |
| | | Additions | | | | 1,037 | | 61 | | 99 | | - | | 1,196 | | |
| | | Contributions from merger transactions | | | | 451 | | 29 | | - | | - | | 480 | | |
| | | Retirements (sales and other decreases) | | | | (608) | | (66) | | (107) | | - | | (781) | | |
| | | | | | | | | |
| | | Transfers, other movements and exchange differences | | | | (36) | | (33) | | 30 | | 1,536 | | 1,497 | | |
| | | Balance at the end | | | | 2,877 | | 167 | | 121 | | 1,536 | | 4,701 | | |
| | | | | | | | | |
| | | Impairment (2) | | | | | | | | | | | | | | |
| | | Balance at the beginning | | | | 186 | | 32 | | 17 | | - | | 234 | | |
| | | Additions | | | | 500 | | 19 | | 5 | | - | | 524 | | |
| | | | | | | | | |
| | | Contributions from merger transactions | | | | 124 | | - | | - | | - | | 124 | | |
| | | Retirements (sales and other decreases) | | | | (98) | | (14) | | (2) | | - | | (114) | | |
| | | | | | | | | |
| | | Transfers, other movements and exchange differences | | | | (296) | | 5 | | (5) | | - | | (296) | | |
| | | Balance at the end | | | | 415 | | 42 | | 15 | | - | | 472 | | |
| | | Balance at the end of Net carryingvalue (1)-(2) | | | | 2,462 | | 125 | | 106 | | 1,536 | | 4,229 | | |
| | | | | | | | | | | | | | | | | |
| | (*) | Net of accumulated amortization until reclassified as non-current assets held for sale |
| | (**) | Business sale agreement (Note 3) |
F-117
| | | | | | | | | | | | | | | | | | | | | | |
| | | | | | | Millions of Euros | | | |
| | | | | | | Foreclosed Assets | | | | | | | | | |
| | | Non-Current Assets Held-for-Sale Changes in the year 2011 | | | | Assets through Auction Proceeding | | | Recovered Assets from Finance Leases | | | From Own Use Assets (*) | | | Total | | | |
| | | Cost (1) | | | | | | | | | | | | | | | | | | | | |
| | | Balance at the beginning | | | | | 1,427 | | | | 86 | | | | 173 | | | | 1,686 | | | |
| | | Additions | | | | | 1,313 | | | | 91 | | | | 99 | | | | 1,503 | | | |
| | | Contributions from merger transactions | | | | | 8 | | | | - | | | | - | | | | 8 | | | |
| | | Retirements (sales and other decreases) | | | | | (662) | | | | (31) | | | | (140) | | | | (833) | | | |
| | | Transfers, other movements and exchange differences | | | | | (54) | | | | 31 | | | | (32) | | | | (54) | | | |
| | | Balance at the end | | | | | 2,032 | | | | 177 | | | | 100 | | | | 2,309 | | | |
| | | | | | | | |
| | | Impairment (2) | | | | | | | | | | | | | | | | | | | | |
| | | Balance at the beginning | | | | | 122 | | | | 16 | | | | 20 | | | | 157 | | | |
| | | Additions | | | | | 373 | | | | 21 | | | | 4 | | | | 397 | | | |
| | | Retirements (sales and other decreases) | | | | | (89) | | | | (5) | | | | (1) | | | | (95) | | | |
| | | Other movements and exchange differences | | | | | (220) | | | | (0) | | | | (5) | | | | (225) | | | |
| | | Balance at the end | | | | | 186 | | | | 32 | | | | 17 | | | | 235 | | | |
| | | Balance at the end of Net carrying value(1)-(2) | | | | | 1,847 | | | | 145 | | | | 83 | | | | 2,075 | | | |
| | | | | | | | | | | | | | | | | | | | | | | |
| | (*) | Net of accumulated amortization until reclassified as non-current assets held for sale |
Non-current assets from foreclosures or recoveries
As of December 31, 2013, 2012 and 2011, the balance under the heading “Non-current assets held for sale - Foreclosures or recoveries” was made up of€2,279€2,247 and€1,695 million of assets for residential use,€326,€317 and€283 million of assets for tertiary use (industrial, commercial or offices) and€29 million,€23 million and€14 million of assets for agricultural use, respectively.
As of December 31, 2013, 2012 and 2011, the average time to sell of the assets through foreclosures or recoveries was 2 to 3 years.
In 2013, 2012 and 2011, some of the sales of these assets were financed by Group entities. The loans and advances originated to the buyers of these assets in those years was€118 million,€168 million and€163 million, respectively, with an average percentage of financing at 93% of the sales price. As of December 31, 2013, 2012 and 2011, the gains from the sale of assets financed by Group entities (and, therefore, not recognized in the consolidated income statements) were€24 million,€28 million and€30 million, respectively.
17. Investments in entities accounted for using the equity method
The breakdown of the balances of “Investments in entities accounted for using the equity method” in the accompanying consolidated balance sheets is as follows:
| | | | | | | | | | | | | | | | | | |
| | | | | | | Millions of Euros | | | |
| | | Investments in Entities Accounted for Using the Equity Method | | | | | 2013 | | | | 2012 | | | | 2011 | | | |
| | | Associates entities | | | | | 1,272 | | | | 6,469 | | | | 5,567 | | | |
| | | Joint ventures | | | | | 3,470 | | | | 4,313 | | | | 3,732 | | | |
| | | Total | | | | | 4,742 | | | | 10,782 | | | | 9,299 | | | |
| | | | | | | | | | | | | | | | | | | |
F-118
17.1 Associates
The following table shows the carrying amount of the most significant of the Group’s investments in associates:
| | | | | | | | | | | | |
| | | | | | | Millions of Euros | | |
| | | Associates Entities | | | | 2013 | | 2012 | | 2011 | | |
| | | Citic Group | | | | - | | 5,372 | | 4,840 | | |
| | | Citic International Financial Holdings Ltd (CIFH) | | | | 631 | | 593 | | 547 | | |
| | | Metrovacesa (*) | | | | 315 | | 317 | | - | | |
| | | Occidental Hoteles Management, S.L. (**) | | | | 98 | | - | | - | | |
| | | Tubos Reunidos, S.A. | | | | 53 | | 54 | | 51 | | |
| | | Brunara SICAV, S.A. (***) | | | | 48 | | - | | - | | |
| | | Rest of associates | | | | 127 | | 133 | | 129 | | |
| | | Total | | | | 1,272 | | 6,469 | | 5,567 | | |
| | | | | | | | | | | | | |
| | (*) | As of December 31, 2011 this stake was recorded in the line item “available for sale financial assets equity instruments” |
| | (**) | As of December 31, 2012 and 2011 this stake was recorded in the line “Investments in joint venture entities” |
| | (***) | As of December 31, 2012 and 2011 this stake was recorded in the line item “available for sale financial assets equity instruments” |
Appendix II shows the details of the associates as of December 31, 2013.
The following is a summary of the changes in 2013, 2012 and in 2011 under this heading in the accompanying consolidated balance sheets:
| | | | | | | | | | | | |
| | | | | | | Millions of Euros |
| | | Associates Entities. Changes in the Year | | | | 2013 | | 2012 | | 2011 | | |
| | | Balance at the beginning | | | | 6,469 | | 5,567 | | 4,247 | | |
| | | Acquisitions and capital increases | | | | 65 | | 10 | | 425 | | |
| | | Disposals and capital reductions | | | | (4) | | (16) | | (20) | | |
| | | Transfers and changes in the consolidation method | | | | (5,453) | | 353 | | (6) | | |
| | | Earnings | | | | 425 | | 721 | | 611 | | |
| | | Exchange differences | | | | (71) | | (53) | | 411 | | |
| | | Others | | | | (159) | | (113) | | (102) | | |
| | | Balance at the end | | | | 1,272 | | 6,469 | | 5,567 | | |
| | | | | | | | | | | | | |
The changes in 2013 correspond mainly to the sale and reclassification of the remaining stake in CNCB as of December 31, 2013 to the heading “Available-for-sale financial assets” as it is mentioned in the Notes 3 and 12.
F-119
17.2 Investments in joint venture entities
The breakdown of the balance under this heading in the accompanying consolidated balance sheets is as follows:
| | | | | | | | | | | | |
| | | | | | | Millions of Euros |
| | | Joint ventures | | 2013 | | 2012 | | 2011 | | |
| | | Garanti Group (Note 3) | | | | 3,245 | | 3,991 | | 3,456 | | |
| | | Corporación IBV Participaciones Empresariales S.A. (*) | | | | - | | 135 | | 78 | | |
| | | Occidental Hoteles Management, S.L. (**) | | | | - | | 67 | | 68 | | |
| | | Rest | | | | 225 | | 120 | | 130 | | |
| | | Total | | | | 3,470 | | 4,313 | | 3,732 | | |
| | | | | | | | | | | | | |
| | | | | | | | | | | | | |
| | (*) As of December 31, 2013, this stake was recorded as “Non-current assets held for sale”. (**) As of December 31, 2013, this stake was recorded as “Associates” | | |
Details of the joint ventures accounted for using the equity method as of 31 December, 2013 are shown in Appendix II.
The following is a summary of the changes in 2013, 2012 and in 2011 under this heading in the accompanying consolidated balance sheets:
| | | | | | | | | | | | |
| | | | | | | Millions of Euros |
| | | Joint ventures. Changes in the Year | | | | 2013 | | 2012 | | 2011 | | |
| | | Balance at the beginning | | | | 4,313 | | 3,732 | | 300 | | |
| | | Acquisitions and capital increases | | | | 70 | | 4 | | 3,655 | | |
| | | Disposals | | | | (11) | | (1) | | (5) | | |
| | | Transfers | | | | (155) | | (7) | | 5 | | |
| | | Earnings | | | | 269 | | 318 | | 176 | | |
| | | Exchange differences | | | | (818) | | 134 | | (336) | | |
| | | Others | | | | (198) | | 133 | | (63) | | |
| | | Balance at the end | | | | 3,470 | | 4,313 | | 3,732 | | |
| | | | | | | | | | | | | |
F-120
17.3 Other information about associates and joint ventures
The following table provides relevant information of the balance sheets and income statements of Garanti Group as of December 31, 2013, 2012 and 2011, respectively.
| | | | | | | | | | | | | | |
| | | | | | | | | Millions of Euros |
| | | | | Garanti: Financial Main figures (*) | | | | 2013 (*) | | 2012 (*) | | 2011 (*) | | |
| | | | | Total assets | | | | 17,575 | | 18,850 | | 16,522 | | |
| | | | | Of which: | | | | | | | | | | |
| | | | | Loans and advances to customers | | | | 10,483 | | 10,860 | | 9,485 | | |
| | | | | Total liabilities | | | | 15,634 | | 16,520 | | 14,664 | | |
| | | | | Of which: | | | | | | | | | | |
| | | | | Customer deposits | | | | 9,573 | | 9,790 | | 9,227 | | |
| | | | | Net interest margin | | | | 534 | | 693 | | 560 | | |
| | | | | Gross income | | | | 819 | | 1,041 | | 934 | | |
| | | | | Net operating income | | | | 375 | | 463 | | 437 | | |
| | | | | Net income attributes to Garanti Group | | | | 295 | | 364 | | 361 | | |
| | | | | | | | | | | | | | | |
| | (*) | Financial statements of Garanti Group under IFRS and without consolidation adjustments, and multiplied by the voting rights controlled by the bank. | |
The main adjustments made to the financial statements of Garanti to properly register it under the equity method are related to the purchase price allocation (PPA) and the accounting consolidation process. None of these adjustments is material.
The following table provides relevant information of the balance sheets and income statements of associates and joint ventures, excluding Garanti, as of December 31, 2013, 2012 and 2011, respectively.
| | | | | | | | | | | | | | | | | | |
| | | | | | | Millions of Euros | | |
| | | Associates and Joint ventures | | | | 2013 (*) | | 2012 (*) | | 2011 (*) | | |
| | Financial Main figures (*) | | | | Associates | | Joint- ventures | | Associates | | Joint- ventures | | Associates | | Joint- ventures | | |
| | | Interest Margin | | | | 73 | | 26 | | 1,424 | | 14 | | 1,230 | | 17 | | |
| | | Gross income | | | | 305 | | 78 | | 1,940 | | 48 | | 2,189 | | 65 | | |
| | | Profit from continuing operations | | | | 82 | | (23) | | 783 | | (46) | | 737 | | 23 | | |
| | | Profit from discontinued operations (net) | | | | - | | - | | - | | - | | (1) | | - | | |
| | | Total | | | | 77 | | (23) | | 596 | | (46) | | 552 | | 23 | | |
| | | | | | | | | | | | | | | | | | | |
| | (*) | Dates of the company’s financial statements updated at the most recent available information. Information applying the corresponding ownership and without the corresponding standardization and consolidation adjustments. | |
The following table provides relevant information of the balance sheets and income statements of CNCB as of September 30, 2013 and December 31, 2012 and 2011, respectively.
| | | | | | | | | | | | |
| | | | | | | Millions of Euros |
| | | CNCB Financial Main figures | | September
2013 (1) | | December
2012 (2) | | December
2011 (2) | | |
| | | Total Assets | | | | 411,567 | | 360,059 | | 339,006 | | |
| | | Total loans and advances to customers | | | | 227,837 | | 202,282 | | 175,766 | | |
| | | Total liabilities | | | | 384,365 | | 335,355 | | 317,093 | | |
| | | Total deposits from customers | | | | 318,527 | | 274,324 | | 241,218 | | |
| | | Non-controlling interests | | | | 603 | | 575 | | 525 | | |
| | | | | | | | | | | | | |
| | | Net interest income | | | | 7,733 | | 9,312 | | 7,239 | | |
| | | Operating income | | | | 9,458 | | 11,067 | | 8,572 | | |
| | | Profit before taxation | | | | 5,071 | | 5,133 | | 4,625 | | |
| | | Net profit | | | | 3,846 | | 3,872 | | 3,430 | | |
| | | Other comprehensive income (loss) | | | | (307) | | (37) | | 23 | | |
| | | Total comprehensive income | | | | 3,539 | | 3,835 | | 3,453 | | |
| | | Net profit attributable to shareholders of the Bank | | | | 3,800 | | 3,828 | | 3,427 | | |
| | | |
| | (1) | CNCB 3rd Quarter Report presented in accordance with IFRS as issued by the IASB | |
| | (2) | CNCB Annual Report presented in accordance with IFRS as issued by the IASB | |
F-121
As of December 31 2013 there was no financial support agreement or other contractual commitment to associated entities and joint ventures entities from the holding or the subsidiaries that are not recognized in the financial statements (see Note 55.2).
As of December 31, 2013 there was no contingent liability in connection with the investments in joint ventures and associated entities (See note 55.2).
17.4 Notifications about acquisition of holdings
Appendix III provides notifications on acquisitions and disposals of holdings in associates or joint ventures, in compliance with Article 155 of the Corporations Act and Article 53 of the Securities Market Act 24/1988.
17.5 Impairment
As described in IAS 36 the book value of the associate entities and joint venture entities has been compared with their recoverable amount, being the latter calculated as the largest between the value in use and the fair value minus the cost of sale. For the year ended December 31, 2013,€5 million have been recording due to impairment. The valuations of the most relevant investments are reviewed by independent experts.
18. Insurance and reinsurance contracts
The Group has insurance subsidiaries mainly in Spain and Latin America (mostly in Mexico). The main product offered by the insurance subsidiaries is life insurance to cover the risk of death (risk insurance) and life-savings insurance. Within life and accident insurance, a distinction is made between freely sold products and those offered to customers who have taken mortgage or consumer loans, which cover the principal of those loans in the event of the customer’s death.
There are two types of saving products: individual insurance, which seeks to provide the customer with savings for retirement or other events, and group insurance, which is taken out by entities to cover their commitments to employees.
The most significant provisions recognized by consolidated insurance entities with respect to insurance policies issued by them are set out by their nature in Note 24.
The modeling methods and techniques used to calculate the mathematical reserves for the insurance products are actuarial and financial methods and modeling techniques approved by the respective country’s insurance regulator or supervisor. The most important insurance entities are located in Spain and Mexico (which together account for approximately 95% of the insurance revenues), where the modeling methods and techniques are reviewed by the insurance regulator in Spain (General Directorate of Insurance) and Mexico (National Insurance and Bonding Commission), respectively. The modeling methods and techniques used to calculate the mathematical reserves for the insurance products are based on IFRS and primarily involve the valuation of the estimated future cash flows, discounted at the technical interest rate for each policy. To ensure this technical interest rate, asset-liability management is carried out, acquiring a portfolio of securities that generate the cash flows needed to cover the payment commitments assumed with the customers.
The table below shows the key assumptions used in the calculation of the mathematical reserves for insurance in Spain and Mexico, respectively:
| | | | | | | | | | | | | | |
| | | | | | | | | | | | | | | |
| | | | | | | Mortality table | | Average technical interest type | | |
| | | MATHEMATICAL RESERVES | | | | Spain | | Mexico | | Spain | | Mexico | | |
| | | Individual life insurance(1) | | | | GKM80/GKM95/ Own tables | | Tables of the
Comision Nacional De
Seguros y Fianzas2000-individual | | 2 - 3.8% | | 2.5% | | |
| | | Group insurance(2) | | | | PERM/F2000NP | | Tables of the
Comision Nacional De
Seguros y Fianzas2000-group | | 1.7 - 5.1% | | 5.5% | | |
| | | | | | | | | | | | | | | |
| | (1) | Provides coverage in the case of one or more of the following: death and disability |
| | (2) | Insurance policies purchased by companies (other than Group BBVA entities) on behalf of their employees |
F-122
The table below shows the mathematical reserves (see Note 24) by type of product as of December 31, 2013, 2012 and 2011:
| | | | | | | | | | |
| | | | | | | Millions of Euros | | |
| | | Technical Reserves by type of insurance product | | | | 2013 | | 2012 | | |
| | | Mathematical reserves | | | | 8,816 | | 7,951 | | |
| | | Individual life insurance (1) | | | | 5,695 | | 4,777 | | |
| | | Savings | | | | 4,907 | | 3,996 | | |
| | | Risk | | | | 788 | | 781 | | |
| | | Group insurance (2) | | | | 3,121 | | 3,174 | | |
| | | Savings | | | | 3,000 | | 3,083 | | |
| | | Risk | | | | 121 | | 91 | | |
| | | Provision for unpaid claims reported | | | | 496 | | 550 | | |
| | | Provisions for unexpired risks and other provisions | | | | 522 | | 519 | | |
| | | Total | | | | 9,834 | | 9,020 | | |
| | | | | | | | | | | |
| | (1) | Provides coverage in the event of death or disability |
| | (2) | The insurance policies purchased by companies (other than BBVA Group) on behalf of its employees |
The table below shows the contribution of each insurance product to the Group’s income (see Note 45) in 2013:
| | | | | | | | | | |
| | | | | | | | | |
| | | Revenues by type of insurance product | | | | 2013 | | 2012 | | |
| | | Life insurance | | | | 549 | | 610 | | |
| | | Individual | | | | 303 | | 434 | | |
| | | Savings | | | | 52 | | 41 | | |
| | | Risk | | | | 251 | | 392 | | |
| | | Group insurance | | | | 247 | | 175 | | |
| | | Savings | | | | 62 | | 11 | | |
| | | Risk | | | | 185 | | 164 | | |
| | | Non-Life insurance | | | | 381 | | 375 | | |
| | | Home insurance | | | | 120 | | 147 | | |
| | | Other non-life insurance products | | | | 261 | | 228 | | |
| | | Total | | | | 930 | | 985 | | |
| | | | | | |
| | | | | | | | | | | |
The heading “Reinsurance assets” in the accompanying consolidated balance sheets includes the amounts that the consolidated insurance entities are entitled to receive under the reinsurance contracts entered into by them with third parties and, more specifically, the share of the reinsurer in the technical provisions recognized by the consolidated insurance entities. As of December 30, 2013, 2012 and 2011, the balance is€619,€50 million and€26 million, respectively.
F-123
19. Tangible assets
The breakdown of the balance and changes of this heading in the accompanying consolidated balance sheets, according to the nature of the related items, is as follows:
| | | | | | | | | | | | | | | | | | | | | | | | | | | | | | | | |
| | | | | | | Millions of Euros |
| | | | | | | For Own Use | | | Total tangible asset of Own Use | | | Investment Properties | | | Assets Leased out under an Operating Lease | | | Total | | |
| | | Tangible Assets. Breakdown by Type of
Assets and Changes in the year 2013 | | | | Land and Buildings | | | Work in Progress | | | Furniture, Fixtures and Vehicles | | | | | | |
| | | Cost - | | | | | | | | | | | | | | | | | | | | | | | | | | | | | | |
| | | Balance at the beginning | | | | | 4,071 | | | | 505 | | | | 6,746 | | | | 11,322 | | | | 2,609 | | | | 768 | | | 14,700 | | |
| | | Additions | | | | | 108 | | | | 406 | | | | 507 | | | | 1,021 | | | | 87 | | | | 144 | | | 1,252 | | |
| | | Retirements | | | | | (12) | | | | (11) | | | | (378) | | | | (402) | | | | (52) | | | | (1) | | | (455) | | |
| | | Acquisition of subsidiaries in the year | | | | | - | | | | - | | | | - | | | | - | | | | - | | | | - | | | - | | |
| | | Disposal of entities in the year | | | | | - | | | | - | | | | - | | | | - | | | | - | | | | - | | | - | | |
| | | Transfers | | | | | 45 | | | | (150) | | | | 109 | | | | 4 | | | | (122) | | | | (155) | | | (272) | | |
| | | Exchange difference and other | | | | | (232) | | | | (35) | | | | (156) | | | | (423) | | | | (3) | | | | (52) | | | (478) | | |
| | | Balance at the end | | | | | 3,980 | | | | 715 | | | | 6,827 | | | | 11,522 | | | | 2,519 | | | | 705 | | | 14,747 | | |
| | | | | | | | | | | |
| | | Accrued depreciation - | | | | | | | | | | | | | | | | | | | | | | | | | | | | | | |
| | | Balance at the beginning | | | | | 1,144 | | | | - | | | | 4,811 | | | | 5,956 | | | | 95 | | | | 237 | | | 6,287 | | |
| | | Additions (Note 47) | | | | | 101 | | | | - | | | | 459 | | | | 560 | | | | 21 | | | | - | | | 581 | | |
| | | Retirements | | | | | (6) | | | | - | | | | (342) | | | | (347) | | | | (2) | | | | - | | | (350) | | |
| | | Acquisition of subsidiaries in the year | | | | | - | | | | - | | | | - | | | | - | | | | - | | | | - | | | - | | |
| | | Disposal of entities in the year | | | | | - | | | | - | | | | - | | | | - | | | | - | | | | - | | | - | | |
| | | Transfers | | | | | (2) | | | | - | | | | (16) | | | | (18) | | | | (2) | | | | (7) | | | (26) | | |
| | | Exchange difference and other | | | | | (58) | | | | - | | | | (112) | | | | (169) | | | | (11) | | | | 2 | | | (178) | | |
| | | Balance at the end | | | | | 1,179 | | | | - | | | | 4,801 | | | | 5,980 | | | | 102 | | | | 233 | | | 6,314 | | |
| | | | | | | | | | | |
| | | Impairment - | | | | | | | | | | | | | | | | | | | | | | | | | | | | | | |
| | | Balance at the beginning | | | | | 177 | | | | - | | | | 13 | | | | 189 | | | | 646 | | | | 6 | | | 841 | | |
| | | Additions | | | | | 17 | | | | - | | | | 15 | | | | 32 | | | | 127 | | | | - | | | 160 | | |
| | | Retirements | | | | | (4) | | | | - | | | | - | | | | (4) | | | | - | | | | - | | | (4) | | |
| | | Acquisition of subsidiaries in the year | | | | | - | | | | - | | | | - | | | | - | | | | - | | | | - | | | - | | |
| | | Disposal of entities in the year | | | | | - | | | | - | | | | - | | | | - | | | | - | | | | - | | | - | | |
| | | Exchange difference and other | | | | | (37) | | | | - | | | | (13) | | | | (50) | | | | (46) | | | | - | | | (96) | | |
| | | Balance at the end | | | | | 153 | | | | - | | | | 15 | | | | 168 | | | | 727 | | | | 6 | | | 900 | | |
| | | | | | | | | | | |
| | | Net tangible assets - | | | | | | | | | | | | | | | | | | | | | | | | | | | | | | |
| | | | | | | | | | | | | | | | | | | | | | | | | | | | | | | | | |
| | | Balance at the beginning | | | | | 2,750 | | | | 505 | | | | 1,922 | | | | 5,177 | | | | 1,870 | | | | 525 | | | 7,572 | | |
| | | Balance at the end | | | | | 2,647 | | | | 715 | | | | 2,011 | | | | 5,373 | | | | 1,693 | | | | 468 | | | 7,534 | | |
| | | | | | | | | | | | | | | | | | | | | | | | | | | | | | | | | |
| | | | | | | | | | | | | | | | | | | | | | | | | | | | | | | | | | |
| | | | | | | Millions of Euros | | | |
| | | | | | | For Own Use | | | Total Tangible Asset of Own Use | | | Investment Properties | | | Assets Leased out under an Operating Lease | | | Total | | | |
| | | Tangible Assets. Breakdown by Type of
Assets and Changes in the year 2012 | | | | Land and Buildings | | | Work in Progress | | | Furniture, Fixtures and Vehicles | | | | | | |
| | | Cost - | | | | | | | | | | | | | | | | | | | | | | | | | | | | | | | | |
| | | Balance at the beginning | | | | | 3,552 | | | | 349 | | | | 5,993 | | | | 9,894 | | | | 1,911 | | | | 1,200 | | | | 13,005 | | | |
| | | Additions | | | | | 86 | | | | 262 | | | | 442 | | | | 789 | | | | 48 | | | | 226 | | | | 1,063 | | | |
| | | Retirements | | | | | (42 | ) | | | (19 | ) | | | (109 | ) | | | (170 | ) | | | (41 | ) | | | (31 | ) | | | (243 | ) | | |
| | | Acquisition of subsidiaries in the year | | | | | 442 | | | | 1 | | | | 257 | | | | 699 | | | | 752 | | | | - | | | | 1,451 | | | |
| | | Disposal of entities in the year | | | | | - | | | | - | | | | - | | | | - | | | | - | | | | - | | | | - | | | |
| | | Transfers | | | | | 14 | | | | (93 | ) | | | 19 | | | | (61 | ) | | | (56 | ) | | | (192 | ) | | | (308 | ) | | |
| | | Exchange difference and other | | | | | 20 | | | | 7 | | | | 145 | | | | 171 | | | | (4 | ) | | | (435 | ) | | | (267 | ) | | |
| | | Balance at the end | | | | | 4,071 | | | | 505 | | | | 6,746 | | | | 11,322 | | | | 2,609 | | | | 768 | | | | 14,700 | | | |
| | | | | | | | | | | |
| | | Accrued depreciation - | | | | | | | | | | | | | | | | | | | | | | | | | | | | | | | | |
| | | Balance at the beginning | | | | | 1,005 | | | | - | | | | 4,139 | | | | 5,144 | | | | 50 | | | | 352 | | | | 5,546 | | | |
| | | Additions (Note 47) | | | | | 98 | | | | - | | | | 446 | | | | 544 | | | | 22 | | | | - | | | | 565 | | | |
| | | Retirements | | | | | (10 | ) | | | - | | | | (90 | ) | | | (100 | ) | | | (3 | ) | | | (31 | ) | | | (134 | ) | | |
| | | Acquisition of subsidiaries in the year | | | | | 37 | | | | - | | | | 210 | | | | 248 | | | | 29 | | | | - | | | | 277 | | | |
| | | Disposal of entities in the year | | | | | - | | | | - | | | | - | | | | - | | | | - | | | | - | | | | - | | | |
| | | Transfers | | | | | - | | | | - | | | | 1 | | | | 1 | | | | (0 | ) | | | (97 | ) | | | (97 | ) | | |
| | | Exchange difference and other | | | | | 15 | | | | - | | | | 104 | | | | 119 | | | | (2 | ) | | | 12 | | | | 129 | | | |
| | | Balance at the end | | | | | 1,144 | | | | - | | | | 4,811 | | | | 5,956 | | | | 95 | | | | 237 | | | | 6,287 | | | |
| | | | | | | | | | | |
| | | Impairment - | | | | | | | | | | | | | | | | | | | | | | | | | | | | | | | | |
| | | Balance at the beginning | | | | | 37 | | | | - | | | | 11 | | | | 47 | | | | 273 | | | | 12 | | | | 332 | | | |
| | | Additions | | | | | - | | | | - | | | | - | | | | 1 | | | | 89 | | | | - | | | | 90 | | | |
| | | Retirements | | | | | (1 | ) | | | - | | | | - | | | | (1 | ) | | | (108 | ) | | | (1 | ) | | | (110 | ) | | |
| | | Acquisition of subsidiaries in the year | | | | | 135 | | | | - | | | | - | | | | 135 | | | | 417 | | | | - | | | | 552 | | | |
| | | Exchange difference and other | | | | | 6 | | | | - | | | | 2 | | | | 7 | | | | (25 | ) | | | (4 | ) | | | (22 | ) | | |
| | | Balance at the end | | | | | 177 | | | | - | | | | 13 | | | | 189 | | | | 646 | | | | 6 | | | | 841 | | | |
| | | Net tangible assets - | | | | | | | | | | | | | | | | | | | | | | | | | | | | | | | | |
| | | Balance at the beginning | | | | | 2,510 | | | | 349 | | | | 1,842 | | | | 4,702 | | | | 1,589 | | | | 836 | | | | 7,126 | | | |
| | | Balance at the end | | | | | 2,750 | | | | 505 | | | | 1,922 | | | | 5,177 | | | | 1,870 | | | | 525 | | | | 7,572 | | | |
| | | | | | | | | | | | | | | | | | | | | | | | | | | | | | | | | | | |
F-124
| | | | | | | | | | | | | | | | | | | | | | | | | | | | | | | | | | |
| | | | | | | Millions of Euros | | | |
| | | | | | | For Own Use | | | Total Tangible Asset of Own Use | | | Investment Properties | | | Assets Leased out under an Operating Lease | | | Total | | | |
| | | Tangible Assets. Breakdown by
Type of Assets and Changes in
the year 2011 | | | | Land and Buildings | | | Work in Progress | | | Furniture, Fixtures and Vehicles | | | | | | | |
| | | Cost - | | | | | | | | | | | | | | | | | | | | | | | | | | | | | | | | |
| | | Balance at the beginning | | | | | 3,406 | | | | 215 | | | | 5,455 | | | | 9,075 | | | | 1,841 | | | | 1,015 | | | | 11,931 | | | |
| | | Additions | | | | | 131 | | | | 246 | | | | 517 | | | | 893 | | | | 98 | | | | 301 | | | | 1,293 | | | |
| | | Retirements | | | | | (38) | | | | (36) | | | | (150) | | | | (224) | | | | (15) | | | | (72) | | | | (311) | | | |
| | | Acquisition of subsidiaries in the year | | | | | 1 | | | | - | | | | 22 | | | | 24 | | | | 14 | | | | 97 | | | | 134 | | | |
| | | Disposal of entities in the year | | | | | - | | | | - | | | | - | | | | - | | | | - | | | | - | | | | - | | | |
| | | Transfers | | | | | 59 | | | | (73) | | | | (16) | | | | (30) | | | | (0) | | | | (206) | | | | (236) | | | |
| | | Exchange difference and other | | | | | (6) | | | | (3) | | | | 164 | | | | 155 | | | | (26) | | | | 64 | | | | 193 | | | |
| | | Balance at the end | | | | | 3,552 | | | | 349 | | | | 5,993 | | | | 9,893 | | | | 1,911 | | | | 1,200 | | | | 13,004 | | | |
| | | | | | | | | | | | | | | | | | | | | | | | | | | | | | | | | | | |
| | | Accrued depreciation - | | | | | | | | | | | | | | | | | | | | | | | | | | | | | | | | |
| | | Balance at the beginning | | | | | 889 | | | | - | | | | 3,747 | | | | 4,636 | | | | 66 | | | | 272 | | | | 4,974 | | | |
| | | Additions (Note 47) | | | | | 90 | | | | - | | | | 383 | | | | 473 | | | | 10 | | | | 8 | | | | 491 | | | |
| | | Retirements | | | | | (13) | | | | - | | | | (120) | | | | (132) | | | | (1) | | | | (40) | | | | (173) | | | |
| | | Acquisition of subsidiaries in the year | | | | | 1 | | | | - | | | | 18 | | | | 19 | | | | - | | | | 13 | | | | 32 | | | |
| | | Disposal of entities in the year | | | | | - | | | | - | | | | - | | | | - | | | | - | | | | - | | | | - | | | |
| | | Transfers | | | | | 3 | | | | - | | | | (18) | | | | (15) | | | | (0) | | | | (105) | | | | (121) | | | |
| | | Exchange difference and other | | | | | 35 | | | | - | | | | 129 | | | | 164 | | | | (26) | | | | 205 | | | | 344 | | | |
| | | Balance at the end | | | | | 1,005 | | | | - | | | | 4,139 | | | | 5,144 | | | | 50 | | | | 352 | | | | 5,546 | | | |
| | | | | | | | | | | | | | | | | | | | | | | | | | | | | | | | | | | |
| | | Impairment - | | | | | | | | | | | | | | | | | | | | | | | | | | | | | | | | |
| | | Balance at the beginning | | | | | 32 | | | | - | | | | - | | | | 31 | | | | 207 | | | | 19 | | | | 257 | | | |
| | | Additions | | | | | 5 | | | | - | | | | 3 | | | | 8 | | | | 73 | | | | - | | | | 81 | | | |
| | | Retirements | | | | | (1) | | | | - | | | | (4) | | | | (4) | | | | (1) | | | | (8) | | | | (13) | | | |
| | | Acquisition of subsidiaries in the year | | | | | - | | | | - | | | | - | | | | - | | | | - | | | | - | | | | - | | | |
| | | Exchange difference and other | | | | | 1 | | | | - | | | | 12 | | | | 13 | | | | (7) | | | | - | | | | 7 | | | |
| | | Balance at the end | | | | | 37 | | | | - | | | | 11 | | | | 47 | | | | 273 | | | | 12 | | | | 332 | | | |
| | | Net tangible assets - | | | | | | | | | | | | | | | | | | | | | | | | | | | | | | | | |
| | | Balance at the beginning | | | | | 2,485 | | | | 215 | | | | 1,708 | | | | 4,408 | | | | 1,568 | | | | 724 | | | | 6,701 | | | |
| | | Balance at the end | | | | | 2,510 | | | | 348 | | | | 1,842 | | | | 4,701 | | | | 1,590 | | | | 835 | | | | 7,126 | | | |
| | | | | | | | | | | | | | | | | | | | | | | | | | | | | | | | | | | |
The amortization balances for this item as of December 31, 2013, 2012 and 2011 are presented in Note 47.
The amount of tangible assets under financial lease schemes on which it is expected to exercise the purchase option was insignificant as of December 2013, 2012 and 2011.
The main activity of the Group is carried out through a network of bank branches located geographically as shown in the following table:
| | | | | | | | | | | | | | | | | | |
| | | | | | | | | | | | | | | | | | | |
| | | | | | | Number of Branches | | | |
| | | Branches by Geographical Location | | | | 2013 | | | 2012 | | | 2011 | | | |
| | | Spain | | | | | 3,230 | | | | 3,518 | | | | 3,016 | | | |
| | | Mexico | | | | | 1,886 | | | | 1,988 | | | | 1,999 | | | |
| | | South America | | | | | 1,590 | | | | 1,644 | | | | 1,567 | | | |
| | | The United States | | | | | 685 | | | | 707 | | | | 746 | | | |
| | | Rest of the world | | | | | 121 | | | | 121 | | | | 129 | | | |
| | | Total | | | | | 7,512 | | | | 7,978 | | | | 7,457 | | | |
| | | | | | | | | | | | | | | | | | | |
The following table shows the detail of the net carrying amount of the tangible assets corresponding to Spanish and foreign subsidiaries as of December 31, 2013, 2012 and 2011:
| | | | | | | | | | | | | | | | | | |
| | | | | | | | | | | | | | | | | | | |
| | | | | | | Millions of Euros | | | |
| | | Tangible Assets by Spanish and Foreign Subsidiaries
Net Assets Values | | | | 2013 | | | 2012 | | | 2011 | | | |
| | | Foreign subsidiaries | | | | | 3,157 | | | | 3,006 | | | | 3,098 | | | |
| | | BBVA and Spanish subsidiaries | | | | | 4,377 | | | | 4,567 | | | | 4,029 | | | |
| | | Total | | | | | 7,534 | | | | 7,572 | | | | 7,126 | | | |
| | | | | | | | | | | | | | | | | | | |
F-125
20. Intangible assets
20.1 Goodwill
The breakdown of the balance under this heading in the accompanying consolidated balance sheets, according to the cash-generating units (CGU), to which the Goodwill are allocated for purposes of impairment testing, is as follows:
| | | | | | | | | | | | | | | | | | | | | | | | | | | | |
| | | | | | | Millions of Euros |
| | | Goodwill. Breakdown by CGU and
Changes of the year 2013 | | | | Balance at the Beginning | | | | Additions | | | | Exchange Difference | | | | Impairment | | | | Rest (*) | | | | Balance at the End | | |
| | | The United States | | | | 4,320 | | | | | | (187) | | | | | | | | | | | | 4,133 | | |
| | | Mexico | | | | 663 | | | | | | (33) | | | | | | | | | | | | 630 | | |
| | | Colombia | | | | 259 | | | | | | (32) | | | | | | | | | | | | 227 | | |
| | | Chile | | | | 175 | | | | | | (9) | | | | | | | | (100) | | | | 65 | | |
| | | Rest | | | | 13 | | | | | | (1) | | | | | | | | | | | | 12 | | |
| | | Total | | | | 5,430 | | | | | | (262) | | | | | | | | (100) | | | | 5,069 | | |
| | | | | | | | | | | | | | | | | | | | | | | | | | | |
| | (*) | Due to the sale of AFP Provida (See Note 3). |
| | | | | | | | | | | | | | | | | | | | | | | | | | | | |
| | | | | | | Millions of Euros |
| | | Goodwill. Breakdown by
CGU and Changes of the year 2012 | | | | Balance at the Beginning | | | | Additions | | | | Exchange Difference | | | | Impairment | | | | Rest | | | | Balance at the End | | |
| | | The United States | | | | 4,409 | | | | - | | | | (85) | | | | - | | | | (4) | | | | 4,320 | | |
| | | Mexico | | | | 632 | | | | - | | | | 32 | | | | - | | | | (1) | | | | 663 | | |
| | | Colombia | | | | 240 | | | | - | | | | 19 | | | | - | | | | - | | | | 259 | | |
| | | Chile | | | | 188 | | | | - | | | | 11 | | | | - | | | | (24) | | | | 175 | | |
| | | Rest | | | | 66 | | | | - | | | | - | | | | (54) | | | | - | | | | 13 | | |
| | | Total | | | | 5,535 | | | | - | | | | (23) | | | | (54) | | | | (29) | | | | 5,430 | | |
| | | | | | | | | | | | | | | | | | | | | | | | | | | | | |
| | | | | | | | | | | | | | | | | | | | | | | | | | | | |
| | | | | | | Millions of Euros |
| | | Goodwill. Breakdown by
CGU and Changes of the year 2011 | | | | Balance at the Beginning | | | | Additions | | | | Exchange Difference | | | | Impairment | | | | Rest | | | | Balance at the End | | |
| | | The United States | | | | 5,773 | | | | - | | | | 79 | | | | (1,444) | | | | 1 | | | | 4,409 | | |
| | | Mexico | | | | 678 | | | | 11 | | | | (57) | | | | - | | | | - | | | | 632 | | |
| | | Colombia | | | | 236 | | | | - | | | | 4 | | | | - | | | | - | | | | 240 | | |
| | | Chile | | | | 202 | | | | - | | | | (14) | | | | - | | | | - | | | | 188 | | |
| | | Rest | | | | 60 | | | | 7 | | | | - | | | | - | | | | - | | | | 67 | | |
| | | Total | | | | 6,949 | | | | 18 | | | | 12 | | | | (1,444) | | | | 1 | | | | 5,536 | | |
| | | | | | | | | | | | | | | | | | | | | | | | | | | | | |
As described in Note 2.2.8, the cash-generating units (CGU) to which goodwill has been allocated are periodically tested for impairment by including the allocated goodwill in their carrying amount. This analysis is performed at least annually and whenever there is any indication of impairment. As of December 31, 2013, no indicators of impairment have been identified in any of the main cash-generating units.
The Group’s most significant goodwill corresponds to the CGU in the United States. The calculation of the impairment loss uses the cash flow projections estimated by the Group’s Management, based on the latest budgets available for the next 5 years. As of December 31, 2013, the Group used a sustainable growth rate of 4.0% (4.0% and 4.0% as of December 31, 2012 and 2011, respectively) to extrapolate the cash flows in perpetuity starting on the fifth year (2018), based on the real GDP growth rate of the United States and the income recurrence. The rate used to discount the cash flows is the cost of capital assigned to the CGU, and stood at 10.8% as of December 31, 2013 (11.2% and 11.4% as of December 31, 2012 and 2011, respectively), which consists of the free risk rate plus a risk premium.
If the discount rate had increased or decreased by 50 basis points, the recoverable amount would have decreased or increased by€691 million and€801 million respectively. If the growth rate had increased or decreased by 50 basis points, the recoverable amount would have increased or decreased by€648 million and€560 million respectively.
F-126
In previous years, the Group performed the necessary goodwill impairment tests with the following results:
| — | | As of December 31, 2012, no impairment was detected in any of the main cash-generating units, except for the immaterial impairment loss of€49 million in the retail business in Europe and€4 million in wholesale business in. This amount was recognized under the heading “Impairment losses on other assets (net) – Goodwill and other intangible assets” in the consolidated income statement for 2012 (see Note 50). |
| — | | As of December 31, 2011, impairment losses of€1,444 million have been estimated in the United States cash-generating unit which have been recognized under the heading “Impairment losses on other assets (net) - Goodwill and other intangible assets” in the accompanying consolidated income statement for 2011 (see Note 50). |
Both the CGU’s fair values in the United States and the fair values assigned to its assets and liabilities had been based on the estimates and assumptions that the Group’s Management has deemed most likely given the circumstances. However, some changes to the valuation assumptions used could result in differences in the impairment test result.
In general, goodwill valuations are reviewed by applying different valuation methods on the basis of each asset and liability. The valuation methods used are: The method for calculating the discounted value of future cash flows, the market transaction method and the cost method.
Unnim Acquisition
As stated in Note 3, in 2012 the Group acquired 100% of the share capital of the Unnim Bank (“Unnim”).
Shown below are details of the carrying amount of the consolidated assets and liabilities of Unnim prior to its acquisition and the corresponding fair values, gross of tax, which have been estimated in accordance with the IFRS-3 acquisition method to calculate the goodwill recognized as a result of this acquisition.
| | | | | | | | | | |
| | | | | | | Millions of Euros |
| | | Valuation and calculation of badwill for the acquisition of 100% stake in
Unnim | | | | Carrying Amount | | Fair Value | | |
| | | Acquisition cost (A) | | | | | | | | |
| | | Cash | | | | 184 | | 184 | | |
| | | Loans and receivables | | | | 18,747 | | 18,974 | | |
| | | Of which: Asset Protection Schemes (APS) | | | | - | | 1,744 | | |
| | | Financial assets | | | | 4,801 | | 4,569 | | |
| | | Hedging derivates | | | | 571 | | 571 | | |
| | | Non-current assets held for sale | | | | 707 | | 457 | | |
| | | Investments in entities accounted for using the equity method | | | | 206 | | 89 | | |
| | | Tangible assets | | | | 1,090 | | 752 | | |
| | | Of which: Real Estate | | | | 1,045 | | 708 | | |
| | | Intangibles assets obtained from previous business combinations | | | | 7 | | - | | |
| | | Intangible assets identify at the date of the business combination | | | | - | | 187 | | |
| | | Other assets (including inventories) | | | | 1,200 | | 658 | | |
| | | Financial liabilities | | | | (27,558) | | (26,102) | | |
| | | Provisions | | | | (237) | | (687) | | |
| | | Other liabilities | | | | (91) | | (91) | | |
| | | Deferred tax | | | | 932 | | 794 | | |
| | | Total fair value of assets and liabilities acquiered (B) | | | | 559 | | 355 | | |
| | | Non controlling Interest Unnim Group* (C) | | | | (34) | | (34) | | |
| | | Badwill (A)-(B)-(C ) | | | | | | (321) | | |
| | | | | | | | | | | |
| | (*) | Non-controlling interests that Unnim Group maintained at July 27, 2012 previous to the integration. |
Because the resulting goodwill was negative, a gain was recognized in the accompanying consolidated income statement for 2012 under the heading “Negative goodwill” (see Note 2.2.7).
The calculation of this amount is final, once the estimate of all the fair values has been reviewed and, in accordance with IFRS-3, they may be modified during a period of one year from the acquisition date. However, there have been no significant changes in that amount.
F-127
The valuations were reviewed by independent experts (other than the Group’s accounts auditor) by applying different valuation methods on the basis of each asset and liability. The valuation methods used are: The method for calculating the discounted value of future cash flows, the market transaction method and the cost method.
20.2 Other intangible assets
The breakdown of the balance and changes of this heading in the accompanying consolidated balance sheets, according to the nature of the related items, is as follows:
| | | | | | | | | | | | |
| | | | | | | Millions of Euros | | |
| | | Other Intangible Assets | | | | 2013 | | 2012 | | 2011 | | |
| | | Computer software acquisition expenses | | | | 1,480 | | 1,370 | | 1,077 | | |
| | | Other deferred charges | | | | 20 | | 34 | | 34 | | |
| | | Other intangible assets | | | | 199 | | 303 | | 234 | | |
| | | Impairment | | | | (9) | | (5) | | (1) | | |
| | | Total | | | | 1,690 | | 1,702 | | 1,344 | | |
| | | | | | | | | | | | | |
| | | | | | | | | | | | |
| | | | | | | Millions of Euros | | |
| | | Other Intangible Assets. Changes Over the Period | | Notes | | 2013 | | 2012 | | 2011 | | |
| | | Balance at the beginning | | | | 1,702 | | 1,344 | | 1,058 | | |
| | | Additions | | | | 543 | | 789 | | 619 | | |
| | | Amortization in the year | | 47 | | (514) | | (413) | | (319) | | |
| | | Exchange differences and other | | | | (33) | | (18) | | (14) | | |
| | | Impairment | | 50 | | (9) | | - | | - | | |
| | | Balance at the end | | | | 1,690 | | 1,702 | | 1,344 | | |
| | | | | | | | | | | | | |
21. Tax assets and liabilities
21.1 Consolidated tax group
Pursuant to current legislation, the BBVA Consolidated Tax Group includes the Bank (as the parent company) and its Spanish subsidiaries that meet the requirements provided for under Spanish legislation regulating the taxation regime for the consolidated profit of corporate groups.
The Group’s non-Spanish other banks and subsidiaries file tax returns in accordance with the tax legislation in force in each country.
21.2 Years open for review by the tax authorities
The years open to review in the BBVA Consolidated Tax Group as of 31 December, 2013 are 2007 and subsequent year for the main taxes applicable.
The remainder of the Spanish consolidated entities in general have the last four years open for inspection by the tax authorities for the main taxes applicable, except for those in which there has been an interruption of the limitation period due to the start of an inspection.
In 2011, as a result of actions by the tax authorities, tax inspections proceedings were instituted for the years beginning (and including) 2006, some of which were contested. After considering the temporary nature of some of the items assessed in the proceedings, provisions were recognized for probable tax liabilities, if any, that might arise from these assessments according to Group’s best estimates.
In view of the varying interpretations that can be made of some applicable tax legislation, the outcome of the tax inspections of the open years that could be conducted by the tax authorities in the future could give rise to contingent tax liabilities which cannot be reasonably estimated at the present time. However, the Group
F-128
considers that the possibility of these contingent liabilities becoming actual liabilities is remote and, in any case, the tax charge which might arise therefore would not materially affect the Group’s accompanying consolidated financial statements.
21.3 Reconciliation
The reconciliation of the Group’s corporate income tax expense resulting from the application of the standard income tax rate and the income tax expense recognized in the accompanying consolidated income statements is as follows:
| | | | | | | | | | | | | | | | | | |
| | | | | | | Millions of Euros | | |
| | | | | | | 2013 | | 2012 | | 2011 | | |
| | | Reconciliation of Taxation at the
Spanish Corporation Tax Rate to the
Tax Expense Recorded for the Period | | | | Amount | | Effective Tax % | | Amount | | Effective Tax % | | Amount | | Effective Tax % | | |
| | | Consolidated profit before tax | | | | 3,070 | | | | 2,111 | | | | 3,722 | | | | |
| | | From continuing operations | | | | 1,160 | | | | 1,582 | | | | 3,398 | | | | |
| | | From discontinued operations | | | | 1,910 | | | | 529 | | | | 324 | | | | |
| | | | | | | | | | |
| | | Taxation at Spanish corporation tax rate 30% | | | | 921 | | | | 633 | | | | 1,117 | | | | |
| | | | | | | | | | |
| | | Lower effective tax rate from our foreign entities (*) | | | | (498) | | | | (273) | | | | (287) | | | | |
| | | México | | | | (301) | | 19.53% | | (133) | | 24.60% | | (132) | | 24.76% | | |
| | | Chile | | | | (23) | | 23.00% | | (54) | | 17.77% | | (50) | | 10.90% | | |
| | | Venezuela | | | | (128) | | 13.16% | | (109) | | 13.23% | | (71) | | 20.59% | | |
| | | Colombia | | | | (20) | | 25.06% | | (16) | | 26.60% | | (16) | | 23.77% | | |
| | | Peru | | | | (59) | | 20.74% | | (18) | | 26.64% | | (16) | | 29.01% | | |
| | | Others | | | | 33 | | - | | 57 | | - | | (2) | | - | | |
| | | Decrease of tax expense (Amortization of certain goodwill) | | | | (20) | | | | (146) | | | | (188) | | | | |
| | | Revenues with lower tax rate (dividends) | | | | (50) | | | | (85) | | | | (151) | | | | |
| | | Equity accounted earnings | | | | (211) | | | | (316) | | | | (238) | | | | |
| | | Other effects | | | | (53) | | | | (30) | | | | (16) | | | | |
| | | Current income tax | | | | 89 | | | | (217) | | | | 237 | | | | |
| | | Of which: | | | | | | | | | | | | | | | | |
| | | Continuing operations | | | | 46 | | | | (352) | | | | 158 | | | | |
| | | Discontinued operations | | | | 43 | | | | 135 | | | | 79 | | | | |
| | | | | | | | | | | | | | | | | | | |
| | | | | | | | | | | | | | | | | | | |
| | (*) Calculated by applying the difference between the tax rate in force in Spain and the one applied to the Group’s earnings in each jurisdiction. | | |
The item “Other effects” of the above table includes the effect of income derived from the estimates, at closing of the year 2013, of tax liabilities generated from the integration of Unnim. Additionally, it includes the effect of the losses associated to the CNCB transaction (Note 3) that are not deductible.
The effective income tax rate for the Group in 2013, 2012 and 2011 is as follows:
| | | | | | | | | | | | |
| | | | | | | Millions of Euros | | |
| | | Effective Tax Rate | | | | 2013 | | 2012 | | 2011 | | |
| | | Income from: | | | | | | | | | | |
| | | Consolidated Tax Group (*) | | | | (2,909) | | (3,972) | | 679 | | |
| | | Other Spanish Entities | | | | (13) | | 589 | | 2 | | |
| | | Foreign Entities | | | | 5,992 | | 5,494 | | 3,040 | | |
| | | Total (**) | | | | 3,070 | | 2,111 | | 3,722 | | |
| | | Income tax and other taxes | | | | 89 | | (217) | | 237 | | |
| | | Effective Tax Rate | | | | 2.90% | | (10.28)% | | 6.37% | | |
| | | | | | | | | | | | | |
| | (*) Income from consolidated tax Group include income from entities accounted for equity method assigned to BBVA, S.A. (**) Includes income before taxes from continuing and discontinued transactions | | |
F-129
21.4 Income tax recognized in equity
In addition to the income tax expense recognized in the accompanying consolidated income statements, the Group has recognized the following income tax charges for these items in the consolidated equity:
| | | | | | | | | | | | | | | | | | |
| | | | | |
| | | | | | | Millions of Euros | | | |
| | | Tax Recognized in Total Equity | | | | 2013 | | | 2012 | | | 2011 | | | |
| | | Charges to total equity | | | | | | | | | | | | | | | | |
| | | Debt securities | | | | | (223) | | | | - | | | | - | | | |
| | | Equity instruments | | | | | (9) | | | | (19) | | | | (74) | | | |
| | | Subtotal | | | | | (232) | | | | (19) | | | | (74) | | | |
| | | Credits to total equity (*) | | | | | | | | | | | | | | | | |
| | | Equity instruments | | | | | - | | | | - | | | | - | | | |
| | | Debt securities and others | | | | | - | | | | 196 | | | | 231 | | | |
| | | Subtotal | | | | | - | | | | 196 | | | | 231 | | | |
| | | Total | | | | | (232) | | | | 177 | | | | 157 | | | |
| | | | | | | | | | | | | | | | | | | |
|
(*) Tax asset credit to total equity due primarily to financial instruments losses. |
21.5 Deferred taxes
The balance under the heading “Tax assets” in the accompanying consolidated balance sheets includes deferred tax assets. The balance under the “Tax liabilities” heading includes to the Group’s various deferred tax liabilities. The details of the most important tax assets and liabilities are as follows:
| | | | | | | | | | | | | | | | | | |
| | | | | |
| | | | | | | Millions of Euros | | | |
| | | Tax Assets and Liabilities | | | | 2013 | | | 2012 | | | 2011 | | | |
| | | Tax assets- | | | | | | | | | | | | | | | | |
| | | Current | | | | | 2,502 | | | | 1,851 | | | | 1,460 | | | |
| | | Deferred | | | | | 9,080 | | | | 9,799 | | | | 6,267 | | | |
| | | Pensions | | | | | 1,703 | | | | 1,220 | | | | 1,312 | | | |
| | | Portfolio | | | | | 1,138 | | | | 1,839 | | | | 2,128 | | | |
| | | Other assets | | | | | 456 | | | | 277 | | | | 257 | | | |
| | | Impairment losses | | | | | 1,517 | | | | 2,862 | | | | 1,637 | | | |
| | | Other | | | | | 512 | | | | 1,195 | | | | 627 | | | |
| | | Tax losses | | | | | 3,754 | | | | 2,406 | | | | 306 | | | |
| | | Total | | | | | 11,582 | | | | 11,650 | | | | 7,727 | | | |
| | | Tax Liabilities- | | | | | | | | | | | | | | | | |
| | | Current | | | | | 993 | | | | 1,058 | | | | 727 | | | |
| | | Deferred | | | | | 1,537 | | | | 2,762 | | | | 1,420 | | | |
| | | Portfolio | | | | | 925 | | | | 1,100 | | | | 993 | | | |
| | | Charge for income tax and other taxes | | | | | 612 | | | | 1,662 | | | | 427 | | | |
| | | Total | �� | | | | 2,530 | | | | 3,820 | | | | 2,147 | | | |
| | | | | | | | | | | | | | | | | | | |
The BBVA Group has performed an estimation of the balance of tax assets that are considered guaranteed for the BBVA Tax Group in accordance with the Royal Decree-Law 14/2013, of November 29, dealing with urgent measures to adapt Spanish Law to the European Union regulation on financial entity supervision and solvency. This totaled performed at the year 2013 closing amounted to€4,373 million.
As of December 31, 2013, 2012 and 2011, the aggregate amount of temporary differences associated with investments in foreign subsidiaries, branches and associates and investments in joint venture entities, for which no deferred tax liabilities have been recognized in the accompanying consolidated balance sheets, were€297,€267 million and€527 million, respectively.
F-130
22. Other assets and liabilities
The breakdown of the balance under these headings in the accompanying consolidated balance sheets is as follows:
| | | | | | | | | | | | | | | | | | |
| | | | | | | |
| | | | | | | | | | | | | | | | | | | |
| | | | | | | | | | Millions of Euros | | | |
| | | Other Assets and Liabilities. Breakdown by Nature | | | | 2013 | | | 2012 | | | 2011 | | | |
| | | ASSETS- | | | | | | | | | | | | | | | | |
| | | Inventories | | | | | 4,636 | | | | 4,223 | | | | 3,994 | | | |
| | | Real estate companies | | | | | 4,556 | | | | 4,059 | | | | 3,813 | | | |
| | | Others | | | | | 79 | | | | 164 | | | | 181 | | | |
| | | Transactions in transit | | | | | 223 | | | | 886 | | | | 86 | | | |
| | | Accruals | | | | | 643 | | | | 660 | | | | 568 | | | |
| | | Unaccrued prepaid expenses | | | | | 452 | | | | 475 | | | | 408 | | | |
| | | Other prepayments and accrued income | | | | | 190 | | | | 185 | | | | 160 | | | |
| | | Other items | | | | | 2,183 | | | | 1,899 | | | | 1,776 | | | |
| | | Total | | | | | 7,684 | | | | 7,668 | | | | 6,424 | | | |
| | | LIABILITIES- | | | | | | | | | | | | | | | | |
| | | Transactions in transit | | | | | 58 | | | | 440 | | | | 44 | | | |
| | | Accruals | | | | | 2,199 | | | | 2,303 | | | | 2,210 | | | |
| | | Unpaid accrued expenses | | | | | 1,592 | | | | 1,648 | | | | 1,505 | | | |
| | | Other accrued expenses and deferred income | | | | | 608 | | | | 655 | | | | 705 | | | |
| | | Other items | | | | | 2,204 | | | | 1,843 | | | | 1,954 | | | |
| | | Total | | | | | 4,460 | | | | 4,586 | | | | 4,208 | | | |
| | | | | | | |
| | | | | | | | | | | | | | | | | | | |
23. Financial liabilities at amortized cost
The breakdown of the balance under these headings in the accompanying consolidated balance sheets is as follows:
| | | | | | | | | | | | | | | | | | |
| | | | | |
| | | | | | | Millions of Euros | | | |
| | | Financial Liabilities at Amortized Cost | | Notes | | 2013 | | | 2012 | | | 2011 | | | |
| | | Deposits from Central Banks | | 9 | | | 30,893 | | | | 46,475 | | | | 32,877 | | | |
| | | Deposits from Credit Institutions | | 23.1 | | | 52,423 | | | | 55,675 | | | | 56,601 | | | |
| | | Customer deposits | | 23.2 | | | 300,490 | | | | 282,795 | | | | 272,402 | | | |
| | | Debt certificates | | 23.3 | | | 64,120 | | | | 86,255 | | | | 81,124 | | | |
| | | Subordinated liabilities | | 23.4 | | | 10,556 | | | | 11,815 | | | | 15,303 | | | |
| | | Other financial liabilities | | 23.5 | | | 5,659 | | | | 7,590 | | | | 7,410 | | | |
| | | Total | | | | | 464,141 | | | | 490,605 | | | | 465,717 | | | |
| | | | | | | | | | | | | | | | | | | |
| | | | | | | | | | | | | | | | | | | |
F-131
23.1 Deposits from credit institutions
The breakdown of the balance under this heading in the consolidated balance sheets, according to the nature of the financial instruments, is as follows:
| | | | | | | | | | | | | | | | | | |
| | | | | | | |
| | | | | | | | | | | | | | | | | | | |
| | | | | | | Millions of Euros | | | |
| | | Deposits from Credit Institutions | | Notes | | 2013 | | | 2012 | | | 2011 | | | |
| | | Reciprocal accounts | | | | | 333 | | | | 280 | | | | 298 | | | |
| | | Deposits with agreed maturity | | | | | 27,088 | | | | 30,022 | | | | 30,719 | | | |
| | | Demand deposits | | | | | 2,485 | | | | 3,404 | | | | 2,008 | | | |
| | | Other accounts | | | | | 341 | | | | 206 | | | | 343 | | | |
| | | Repurchase agreements | | 37 | | | 22,007 | | | | 21,533 | | | | 22,957 | | | |
| | | Subtotal | | | | | 52,254 | | | | 55,445 | | | | 56,326 | | | |
| | | Accrued interest until expiration | | | | | 168 | | | | 230 | | | | 276 | | | |
| | | Total | | | | | 52,423 | | | | 55,675 | | | | 56,601 | | | |
| | | | | | | |
| | | | | | | | | | | | | | | | | | | |
The breakdown by geographical area and the nature of the related instruments of this heading in the accompanying consolidated balance sheets, disregarding interest accrued pending maturity, is as follows:
| | | | | | | | | | | | | | | | | | | | | | |
| | | | | | | | |
| | | | | | | | | | | | | | | | | | | | | | | |
| | | | | | | Millions of Euros |
| | | Deposits from Credit Institutions 2013 | | | | Demand Deposits | | | Deposits with Agreed Maturity | | | Repurchase Agreements | | | Total | | | |
| | | Spain | | | | | 806 | | | | 7,781 | | | | 562 | | | | 9,149 | | | |
| | | Rest of Europe | | | | | 291 | | | | 9,222 | | | | 17,313 | | | | 26,826 | | | |
| | | Mexico | | | | | 166 | | | | 2,071 | | | | 3,594 | | | | 5,831 | | | |
| | | South America | | | | | 546 | | | | 2,816 | | | | 388 | | | | 3,750 | | | |
| | | The United States | | | | | 990 | | | | 4,726 | | | | - | | | | 5,716 | | | |
| | | Rest of the world | | | | | 19 | | | | 813 | | | | 150 | | | | 982 | | | |
| | | Total | | | | | 2,818 | | | | 27,429 | | | | 22,007 | | | | 52,254 | | | |
| | | |
| | | | | | |
| | | | | | | | | | | | | | | | | | | | | | |
| | | | | | | |
| | | | | | | | | | Millions of Euros | | | | | | |
| | | Deposits from Credit Institutions 2012 | | | | Demand Deposits | | | Deposits with Agreed Maturity | | | Repurchase Agreements | | | Total | | | |
| | | Spain | | | | | 2,078 | | | | 8,407 | | | | 1,157 | | | | 11,642 | | | |
| | | Rest of Europe | | | | | 260 | | | | 11,584 | | | | 6,817 | | | | 18,661 | | | |
| | | Mexico | | | | | 220 | | | | 1,674 | | | | 12,967 | | | | 14,861 | | | |
| | | South America | | | | | 477 | | | | 3,455 | | | | 376 | | | | 4,308 | | | |
| | | The United States | | | | | 619 | | | | 4,759 | | | | 216 | | | | 5,594 | | | |
| | | Rest of the world | | | | | 31 | | | | 349 | | | | - | | | | 380 | | | |
| | | Total | | | | | 3,685 | | | | 30,228 | | | | 21,533 | | | | 55,446 | | | |
| | | | | | | | | | | | | | | | | | | | | | | |
| | | | | | | | | | | | | | | | | | | | | | | |
| | | | | | | | | | | | | | | | | | | | | | |
| | | | |
| | | | | | | Millions of Euros |
| | | Deposits from Credit Institutions 2011 | | | | Demand Deposits | | | Deposits with Agreed Maturity | | | Repurchase Agreements | | | Total | | | |
| | | Spain | | | | | 472 | | | | 8,354 | | | | 394 | | | | 9,220 | | | |
| | | Rest of Europe | | | | | 315 | | | | 12,641 | | | | 12,025 | | | | 24,981 | | | |
| | | Mexico | | | | | 359 | | | | 1,430 | | | | 9,531 | | | | 11,320 | | | |
| | | South Amércia | | | | | 251 | | | | 2,863 | | | | 478 | | | | 3,593 | | | |
| | | The United States | | | | | 799 | | | | 4,925 | | | | 529 | | | | 6,253 | | | |
| | | Rest of the world | | | | | 111 | | | | 849 | | | | - | | | | 960 | | | |
| | | Total | | | | | 2,307 | | | | 31,062 | | | | 22,957 | | | | 56,326 | | | |
| | | | | | | | | | | | | | | | | | | | | | | |
| | | | | | | | | | | | | | | | | | | | | | | |
F-132
23.2 Customer deposits
The breakdown of this heading in the accompanying consolidated balance sheets, by type of financial instrument, is as follows:
| | | | | | | | | | | | | | | | | | |
| | | | | |
| | | | | | | Millions of Euros | | | |
| | | Customer Deposits | | Notes | | 2013 | | | 2012 | | | 2011 | | | |
| | | Government and other government agencies | | | | | 25,058 | | | | 32,439 | | | | 40,566 | | | |
| | | Spanish | | | | | 5,913 | | | | 5,185 | | | | 4,269 | | | |
| | | Foreign | | | | | 10,618 | | | | 10,611 | | | | 12,253 | | | |
| | | Repurchase agreements | | 37 | | | 8,512 | | | | 16,607 | | | | 24,016 | | | |
| | | Accrued interests | | | | | 15 | | | | 36 | | | | 28 | | | |
| | | Other resident sectors | | | | | 136,634 | | | | 119,360 | | | | 108,216 | | | |
| | | Current accounts | | | | | 32,430 | | | | 28,653 | | | | 28,211 | | | |
| | | Savings accounts | | | | | 21,128 | | | | 19,554 | | | | 16,003 | | | |
| | | Fixed-term deposits | | | | | 69,976 | | | | 61,972 | | | | 49,105 | | | |
| | | Repurchase agreements | | 37 | | | 11,608 | | | | 8,443 | | | | 14,154 | | | |
| | | Other accounts | | | | | 950 | | | | 53 | | | | 35 | | | |
| | | Accrued interests | | | | | 542 | | | | 685 | | | | 708 | | | |
| | | Non-resident sectors | | | | | 138,799 | | | | 130,998 | | | | 123,621 | | | |
| | | Current accounts | | | | | 57,502 | | | | 53,088 | | | | 44,804 | | | |
| | | Savings accounts | | | | | 33,245 | | | | 34,797 | | | | 29,833 | | | |
| | | Fixed-term deposits | | | | | 39,781 | | | | 38,490 | | | | 42,554 | | | |
| | | Repurchase agreements | | 37 | | | 7,740 | | | | 3,999 | | | | 5,809 | | | |
| | | Other accounts | | | | | 201 | | | | 236 | | | | 210 | | | |
| | | Accrued interests | | | | | 330 | | | | 388 | | | | 411 | | | |
| | | Total | | | | | 300,490 | | | | 282,795 | | | | 272,402 | | | |
| | | Of which: | | | | | | | | | | | | | | | | |
| | | In euros | | | | | 160,172 | | | | 150,093 | | | | 152,375 | | | |
| | | In foreign currency | | | | | 140,318 | | | | 132,702 | | | | 120,027 | | | |
| | | Of which: | | | | | | | | | | | | | | | | |
| | | Deposits from other creditors without valuation adjustment | | | | | 299,660 | | | | 281,984 | | | | 271,637 | | | |
| | | Accrued interests | | | | | 830 | | | | 811 | | | | 765 | | | |
| | | |
The breakdown by geographical area of this heading in the accompanying consolidated balance sheets, by type of instrument and geographical area, disregarding valuation adjustments, is as follows:
| | | | | | | | | | | | | | | | | | | | | | | | | | |
| | | | | |
| | | | | | | Millions of Euros | | | |
| | | Customer Deposits
2013 | | Demand
Deposits | | | Savings
Deposits | | | Deposits with
Agreed
Maturity | | | Repurchase
Agreements | | | Total | | | |
| | | Spain | | | | | 37,540 | | | | 21,147 | | | | 71,710 | | | | 12,433 | | | | 142,829 | | | |
| | | Rest of Europe | | | | | 2,192 | | | | 269 | | | | 7,881 | | | | 8,902 | | | | 19,244 | | | |
| | | Mexico | | | | | 19,902 | | | | 8,583 | | | | 6,670 | | | | 5,758 | | | | 40,913 | | | |
| | | South America | | | | | 24,257 | | | | 14,057 | | | | 17,245 | | | | 659 | | | | 56,218 | | | |
| | | The United States | | | | | 17,532 | | | | 12,348 | | | | 9,141 | | | | 108 | | | | 39,128 | | | |
| | | Rest of the world | | | | | 305 | | | | 70 | | | | 897 | | | | - | | | | 1,272 | | | |
| | | Total | | | | | 101,727 | | | | 56,473 | | | | 113,544 | | | | 27,860 | | | | 299,604 | | | |
| | | | | | | | | | | | | | | | | | | | | | | | | | | |
F-133
| | | | | | | | | | | | | | | | | | | | | | | | | | |
| | | | | |
| | | | | | | Millions of Euros | | | |
| | | Customer Deposits 2012 | | Demand Deposits | | | Savings Deposits | | | Deposits with Agreed Maturity | | | Repurchase Agreements | | | Total | | | |
| | | Spain | | | | | 32,663 | | | | 19,729 | | | | 63,025 | | | | 21,594 | | | | 137,011 | | | |
| | | Rest of Europe | | | | | 2,494 | | | | 278 | | | | 5,796 | | | | 4,635 | | | | 13,203 | | | |
| | | Mexico | | | | | 19,029 | | | | 7,990 | | | | 8,187 | | | | 2,061 | | | | 37,267 | | | |
| | | South Amercia | | | | | 22,381 | | | | 14,423 | | | | 17,186 | | | | 759 | | | | 54,749 | | | |
| | | The United States | | | | | 15,415 | | | | 13,946 | | | | 9,473 | | | | - | | | | 38,834 | | | |
| | | Rest of the world | | | | | 209 | | | | 53 | | | | 362 | | | | - | | | | 624 | | | |
| | | Total | | | | | 92,191 | | | | 56,419 | | | | 104,029 | | | | 29,049 | | | | 281,687 | | | |
| | | | | | | | | | | | | | | | | | | | | | | | | | | |
| | | | | | | | | | | | | | | | | | | | | | | | | | |
| | | | | |
| | | | | | | Millions of Euros | | | |
| | | Customer Deposits 2011 | | | | Demand Deposits | | | Savings Deposits | | | Deposits with Agreed Maturity | | | Repurchase Agreements | | | Total | | | |
| | | Spain | | | | | 31,263 | | | | 16,160 | | | | 39,333 | | | | 38,170 | | | | 124,927 | | | |
| | | Rest of Europe | | | | | 3,636 | | | | 294 | | | | 22,511 | | | | 1,148 | | | | 27,588 | | | |
| | | Mexico | | | | | 16,986 | | | | 6,803 | | | | 8,023 | | | | 4,479 | | | | 36,292 | | | |
| | | South America | | | | | 16,247 | | | | 11,428 | | | | 15,538 | | | | 182 | | | | 43,396 | | | |
| | | The United States | | | | | 14,845 | | | | 12,768 | | | | 9,586 | | | | - | | | | 37,199 | | | |
| | | Rest of the world | | | | | 243 | | | | 224 | | | | 1,386 | | | | - | | | | 1,852 | | | |
| | | Total | | | | | 83,221 | | | | 47,677 | | | | 96,378 | | | | 43,979 | | | | 271,255 | | | |
| | | | | | | | | | | | | | | | | | | | | | | | | | | |
23.3 Debt certificates (including bonds)
The breakdown of the balance under this heading in the accompanying consolidated balance sheets is as follows:
| | | | | | | | | | | | | | | | | | |
| | | | | |
| | | | | | | Millions of Euros | | | |
| | | Debt Certificates | | | | 2013 | | | 2012 | | | 2011 | | | |
| | | Promissory notes and bills | | | | | 1,318 | | | | 11,156 | | | | 7,491 | | | |
| | | Bonds and debentures | | | | | 62,802 | | | | 75,099 | | | | 73,633 | | | |
| | | Total | | | | | 64,120 | | | | 86,255 | | | | 81,124 | | | |
| | | | | | | | | | | | | | | | | | | |
The breakdown of the most significant outstanding issuances of debt instruments issued by the consolidated entities as of December 31, 2013, 2012 and 2011 is shown in Appendix VI.
The changes in the balances under this heading, together with the “Subordinated Liabilities” for 2013, 2012 and 2011 are included in Note 58.4.
23.3.1 Promissory notes and bills
The breakdown of the balance under this heading, by currency, is as follows:
| | | | | | | | | | | | | | | | | | |
| | | | | |
| | | | | | | Millions of Euros | | | |
| | | Promissory notes and bills | | | | 2013 | | | 2012 | | | 2011 | | | |
| | | In euros | | | | | 1,231 | | | | 10,346 | | | | 6,672 | | | |
| | | In other currencies | | | | | 88 | | | | 810 | | | | 819 | | | |
| | | Total | | | | | 1,318 | | | | 11,156 | | | | 7,491 | | | |
| | | | | | | | | | | | | | | | | | | |
F-134
These promissory notes were issued mainly by Banco Bilbao Vizcaya Argentaria, S.A., BBVA Banco de Financiación, S.A., BBVA Senior Finance, S.A. Unipersonal and BBVA US Senior, S.A. Unipersonal. The issues of promissory notes by BBVA Banco de Financiación, S.A., BBVA Senior Finance, S.A. Unipersonal and BBVA US Senior, S.A. Unipersonal, are guaranteed jointly, severally and irrevocably by the Bank.
23.3.2 Bonds and debentures issued
The breakdown of the balance under this heading, by financial instrument and currency, is as follows:
| | | | | | | | | | | | | | | | | | |
| | | | | | | Millions of Euros |
| | | Bonds and debentures issued | | | | 2013 | | | 2012 | | | 2011 | | | |
| | | In Euros - | | | | | 51,373 | | | | 63,355 | | | | 64,063 | | | |
| | | Non-convertible bonds and debentures at floating interest rates | | | | | 177 | | | | 3,141 | | | | 4,648 | | | |
| | | Non-convertible bonds and debentures at fixed interest rates | | | | | 11,818 | | | | 14,429 | | | | 9,381 | | | |
| | | Mortgage Covered bonds | | | | | 31,715 | | | | 35,765 | | | | 33,842 | | | |
| | | Hybrid financial instruments | | | | | 318 | | | | 248 | | | | 288 | | | |
| | | Securitization bonds made by the Group | | | | | 5,830 | | | | 5,484 | | | | 6,638 | | | |
| | | Other securities | | | | | - | | | | - | | | | 5,709 | | | |
| | | Accrued interest and others (*) | | | | | 1,515 | | | | 4,288 | | | | 3,557 | | | |
| | | In Foreign Currency - | | | | | 11,429 | | | | 11,745 | | | | 9,570 | | | |
| | | Non-convertible bonds and debentures at floating interest rates | | | | | 1,387 | | | | 2,163 | | | | 2,256 | | | |
| | | Non-convertible bonds and debentures at fixed interest rates | | | | | 7,763 | | | | 7,066 | | | | 4,668 | | | |
| | | Mortgage Covered bonds | | | | | 185 | | | | 225 | | | | 289 | | | |
| | | Hybrid financial instruments | | | | | 1,514 | | | | 1,550 | | | | 1,397 | | | |
| | | Other securities associated to financial activities | | | | | - | | | | - | | | | - | | | |
| | | Securitization bonds made by the Group | | | | | 518 | | | | 697 | | | | 450 | | | |
| | | Other securities | | | | | - | | | | - | | | | 473 | | | |
| | | Accrued interest and others (*) | | | | | 62 | | | | 44 | | | | 37 | | | |
| | | Total | | | | | 62,802 | | | | 75,099 | | | | 73,633 | | | |
| | | | | | | |
| | | | | | | | | | | | | | | | | | | |
| | (*) Hedging operations and issuance costs. |
Most of the foreign-currency issuances are denominated in US dollars.
The issues of senior debt by BBVA Senior Finance, S.A.U., BBVA U.S. Senior, S.A.U. and BBVA Global Finance, Ltd. are guaranteed jointly, severally and irrevocably by the Bank.
The following table shows the weighted average interest rates of fixed and floating rate bonds and debentures issued in euros and foreign currencies in effect in 2013, 2012 and 2011:
| | | | | | | | | | | | | | | | | | | | | | | | | | | | |
| | | | | | | | | | | | | | | | | | | | | | | | | | | | | |
| | | | | 2013 | | | 2012 | | | 2011 | | | |
| | | Interests Rates of Promissory Notes and Bills Issued | | Euros | | | Foreign Currency | | | Euros | | | Foreign Currency | | | Euros | | | Foreign Currency | | | |
| | | Fixed rate | | | 3.86 | % | | | 4.46 | % | | | 3.89 | % | | | 5.87 | % | | | 3.81 | % | | | 5.55 | % | | |
| | | Floating rate | | | 3.34 | % | | | 3.49 | % | | | 3.78 | % | | | 4.29 | % | | | 2.38 | % | | | 4.88 | % | | |
| | | | | | | | | |
| | | | | | | | | | | | | | | | | | | | | | | | | | | | | |
F-135
23.4 Subordinated liabilities
The breakdown of this heading in the accompanying consolidated balance sheets, by type of financial instrument, is as follows:
| | | | | | | | | | | | | | | | | | |
| | | | | | | Millions of Euros | | | |
| | | Subordinated Liabilities | | Notes | | 2013 | | | 2012 | | | 2011 | | | |
| | | Subordinated debt | | | | | 8,432 | | | | 9,259 | | | | 12,668 | | | |
| | | Preferred Stock | | | | | 1,827 | | | | 1,847 | | | | 1,760 | | | |
| | | Subtotal | | | | | 10,259 | | | | 11,106 | | | | 14,428 | | | |
| | | Valuation adjustments and other concepts (*) | | | | | 297 | | | | 709 | | | | 874 | | | |
| | | Total | | 23 | | | 10,556 | | | | 11,815 | | | | 15,303 | | | |
| | | | | | | | | | | | | | | | | | | |
| | | | | | | | | | | | | | | | | | | |
| | (*) Includes accrued interest payable and valuation adjustment of hedging derivatives |
Of the above, the issuances of BBVA International, Ltd., BBVA Capital Finance, S.A.U., BBVA International Preferred, S.A.U., BBVA Subordinated Capital, S.A.U. and BBVA Global Finance, Ltd. are jointly, severally and irrevocably guaranteed by the Bank.
Subordinated debt
These issuances are non-convertible subordinated debt and accordingly, for debt seniority purposes, they rank behind ordinary debt, but ahead of the Bank’s shareholders, without prejudice to any different seniority that may exist between the different types of subordinated debt instruments according to the terms and conditions of each issue. The breakdown of this heading in the accompanying consolidated balance sheets, disregarding valuation adjustments, by currency of issuance and interest rate is shown in Appendix VI. The balance variances are mainly due to the following transactions:
Contingent convertible securities
During 2013, BBVA issued perpetual securities eventually convertible (Contingent Convertible) into ordinary shares of BBVA, without pre-emption rights, for a total amount of 1.5 billion US dollars (€1,088 million as of 31 December, 2013). The issue allowed for discretionary distribution of coupons recognized in equity (See Note 4). The issuance was targeted only towards qualified and sophisticated foreign investors and in any case would not be made or subscribed in Spain or among Spanish-resident investors. These securities are listed in the Singapore Exchange Securities Trading Limited.
Conversion of subordinated bond issues
At its meeting on November 22, 2011, in virtue of the authorization conferred under Point Six of the Agenda of the Bank’s Annual General Meeting of Shareholders held on March 14, 2008, the Board of Directors of BBVA agreed to issue convertible bonds in December 2011 (the “Issue” or “Convertible Bonds-December 2011”, “the convertible bonds” or the “Bonds”) for a maximum amount of€3,475 million, excluding a preemptive subscription right.
This issue was aimed exclusively at holders of preferred securities issued by BBVA Capital Finance, S.A. Unipersonal (series A, B, C and D) or BBVA International Limited (series F), all guaranteed by BBVA.
Thus, those who accepted the purchase offer made by BBVA made an unconditional and irrevocable undertaking to subscribe a nominal amount of Convertible Bonds-December 2011 equivalent to 100% of the total nominal or cash amount for the preferred securities they owned and that would be acquired by BBVA.
On December 30, 2011, after the period envisaged in this respect, orders were received for the subscription of 34,300,002 Convertible Bonds with a nominal value of€100 each, giving a total of€3,430 million, compared with the initially planned€3,475 million. This means that holders of 98.71% of the preferred securities to be repurchased accepted the repurchase offer made by BBVA. The Convertible Bonds were recognized as financial liabilities since the number of Bank shares to be delivered can vary.
F-136
The terms and conditions of the Convertible Bonds established a voluntary conversion at the option of the holders on March 30, 2012. Following this date, orders were received for the voluntary conversion of a total of€955 million, corresponding to 9,547,559 Convertible Bonds, or 27.84% of the original amount of the issue of Convertible Bonds-December 2011. To meet the bond conversion, 157,875,375 new ordinary BBVA shares were issued at a par value of€0.49 each (see Note 27).
Also, in accordance with the terms and conditions of the Convertible Bonds, on December 31, 2012 a mandatory conversion of the 50% of the nominal value of the issue took place through the reduction of the nominal value of each and every one of the Convertible Bonds outstanding on that date, whose value then fell from a nominal€100 to€50. A total of 238,682,213 new ordinary BBVA shares were issued at a par value of€0.49 each to satisfy this conversion (see Note 27).
As of December 31, 2013, 2012 and 2011, the nominal amount of outstanding convertible bonds was€1,238 million.
Lastly, as of June 30, 2013, maturity date of the issue, the convertible bonds outstanding on that date were subject to mandatory conversion. An increase in the Bank’s common stock was carried out to satisfy the requirement of this conversion by the issue and distribution of 192,083,232 ordinary shares at a par value of 0,49€ each, amounting to a total of€94,120,783,68, with the share premium being€1,143,279,396.8640.
Preferred securities
The breakdown by issuer of the balance under this heading in the accompanying consolidated balance sheets is as follows:
| | | | | | | | | | | | | | | | |
| | | | |
| | | | | Millions of Euros | | | |
| | | Preferred Securities by Issuer | | 2013 | | | 2012 | | | 2011 | | | |
| | | BBVA International Preferred, S.A.U. (*) | | | 1,666 | | | | 1,695 | | | | 1,696 | | | |
| | | Unnim Group (**) | | | 109 | | | | 95 | | | | - | | | |
| | | BBVA Capital Finance, S.A.U. (***) | | | 29 | | | | 32 | | | | 36 | | | |
| | | Phoenix Loan Holdings, Inc. | | | 15 | | | | 16 | | | | 19 | | | |
| | | BBVA International, Ltd. (***) | | | 8 | | | | 9 | | | | 9 | | | |
| | | Total | | | 1,827 | | | | 1,847 | | | | 1,760 | | | |
| | | | | | |
| | | | | | | | | | | | | | | | | |
| | (*) | Listed on the London and New York stock markets. |
| | (**) | Unnim Group: Issues prior to the acquisition by BBVA. The outstanding balance of these issues after the exchange of certain issues of preferred securities for BBVA shares is shown as of December 31, 2012. | |
| | (***) | Issues traded on the AIAF market in Spain. As of December 31, 2012, the outstanding balances of these issues correspond to the holders of preferred securities who in December 2011 did not take part in the exchange of those preferred security issues for subordinated bonds. | |
These issues were fully subscribed by third parties outside the Group and are wholly or partially redeemable at the issuer company’s option after five or ten years from the issue date, depending on the terms of each issue and with prior consent from the Bank of Spain.
The breakdown of the issues of preferred securities in the accompanying consolidated balance sheets, excluding valuation adjustments, by currency of issuance and interest rate of the issues, is disclosed in Appendix VI.
F-137
23.5 Other financial liabilities
The breakdown of the balance under this heading in the accompanying consolidated balance sheets is as follows:
| | | | | | | | | | | | |
| | | | | | | | | | | | | |
| | | | | | | Millions of Euros |
| | | Other financial liabilities | | | | 2013 | | 2012 | | 2011 | | |
| | | Creditors for other financial liabilities | | | | 1,349 | | 2,128 | | 2,144 | | |
| | | Collection accounts | | | | 2,342 | | 2,311 | | 2,212 | | |
| | | Creditors for other payment obligations (*) | | | | 1,968 | | 3,151 | | 3,054 | | |
| | | Total | | | | 5,659 | | 7,590 | | 7,410 | | |
| | | |
| | (*) Includes dividends payable but pending payment as of December 31, 2012 and 2011. | | |
As of December 31, 2012 and 2011, the “Interim dividend pending payment” from the table above corresponds to the first interim dividend against 2012 and 2011 earnings, paid in January of the following years.
24. Liabilities under insurance contracts
The breakdown of the balance under this heading in the accompanying consolidated balance sheets is as follows:
| | | | | | | | | | | | |
| | | | | | | | | | | | | |
| | | | | | | Millions of Euros |
| | | Liabilities under Insurance Contracts Technical Reserve and Provisions | | | | 2013 | | 2012 | | 2011 | | |
| | | Mathematical reserves | | | | 8,816 | | 7,951 | | 6,513 | | |
| | | Provision for unpaid claims reported | | | | 496 | | 550 | | 739 | | |
| | | Provisions for unexpired risks and other provisions | | | | 522 | | 519 | | 476 | | |
| | | Total | | | | 9,834 | | 9,020 | | 7,729 | | |
| | | | | | | | | | | | | |
The cash flows of those liabilities under insurance contracts are shown below:
| | | | | | | | | | | | | | | | |
| | | | | | | | | | | | | | | | |
| | | | | | | Millions of Euros | | |
| | | Maturity | | | | Up to 1 Year | | 1 to 3 Years | | 3 to 5 Years | | Over 5 Years | | Total | | |
| | | Liabilities under insurance contracts | | | | 1.440 | | 1.613 | | 878 | | 5.903 | | 9.834 | | |
| | | | | | | | | | | | | | | | |
25. Provisions
The breakdown of the balance under this heading in the accompanying consolidated balance sheets, based on type of provisions, is as follows:
| | | | | | | | | | | | |
| | | | | | | Millions of Euros |
| | | Provisions. Breakdown by concepts | | | | 2013 | | 2012 | | 2011 | | |
| | | Provisions for pensions and similar obligations | | | | 5,512 | | 5,777 | | 5,577 | | |
| | | Provisions for taxes and other legal contingencies | | | | 208 | | 406 | | 349 | | |
| | | Provisions for contingent risks and commitments | | | | 346 | | 322 | | 266 | | |
| | | Other provisions (*) | | | | 787 | | 1,329 | | 1,279 | | |
| | | Total | | | | 6,853 | | 7,834 | | 7,471 | | |
| | | | | | | | | | | | | |
| | | | | | |
| | (*) Provisions or contingencies that, individually, are not significant. | | | | | | | | | | |
F-138
The changes in the heading “Provisions for contingent risks and commitments” in the accompanying consolidated balance sheets are presented in Note 7.1.7. together with the changes in impairment losses of other financial instruments.
The change in provisions for pensions and similar obligations for the years ended December 31, 2013, 2012 and 2011 is as follows:
| | | | | | | | | | | | | | | | | | |
| | | | | |
| | | | | | | Millions of Euros | | | |
| | | Provisions for Pensions and Similar Obligations. Changes Over the Period | | Notes | | 2013 | | | 2012 | | | 2011 | | | |
| | | Balance at the beginning | | | | | 5,777 | | | | 5,577 | | | | 5,980 | | | |
| | | Add - | | | | | | | | | | | | | | | | |
| | | Charges to income for the year | | | | | 605 | | | | 683 | | | | 613 | | | |
| | | Interest expenses and similar charges | | 39.2 | | | 199 | | | | 257 | | | | 259 | | | |
| | | Personnel expenses | | 46.1 | | | 70 | | | | 54 | | | | 51 | | | |
| | | Provision expenses | | | | | 336 | | | | 373 | | | | 303 | | | |
| | | Charges to equity (*) | | 26.2 | | | 12 | | | | 316 | | | | 9 | | | |
| | | Transfers and other changes | | | | | (65) | | | | 19 | | | | (8) | | | |
| | | Less - | | | | | | | | | | | | | | | | |
| | | Payments | | | | | (817) | | | | (813) | | | | (794) | | | |
| | | Amount used and other changes | | | | | - | | | | (5) | | | | (223) | | | |
| | | Balance at the end | | | | | 5,512 | | | | 5,777 | | | | 5,577 | | | |
| | | | | | | | | | | | | | | | | | | |
| | (*) Correspond to actuarial losses (gains) arising from certain defined-benefit post-employment pension commitments and other similar benefits recognized in “Equity” (see Note 2.2.12). |
| | | | | | | | | | | | | | | | | | |
| | | | | |
| | | | | | | Millions of Euros | | | |
| | | Provisions for Taxes, Legal Contingents and Other Provisions. Changes Over the Period | | | | 2013 | | | 2012 | | | 2011 | | | |
| | | Balance at beginning | | | | | 1,735 | | | | 1,628 | | | | 2,078 | | | |
| | | Add - | | | | | | | | | | | | | | | | |
| | | Charge to income for the year | | | | | 344 | | | | 245 | | | | 230 | | | |
| | | Acquisition of subsidiaries | | | | | - | | | | 678 | | | | 61 | | | |
| | | Transfers and other changes | | | | | - | | | | - | | | | - | | | |
| | | Less - | | | | | | | | | | | | | | | | |
| | | Available funds | | | | | (148) | | | | (90) | | | | (79) | | | |
| | | Amount used and other variations | | | | | (880) | | | | (720) | | | | (661) | | | |
| | | Disposal of subsidiaries | | | | | (56) | | | | (6) | | | | - | | | |
| | | Balance at the end | | | | | 995 | | | | 1,735 | | | | 1,628 | | | |
| | | | | | | | | | | | | | | | | | | |
Ongoing legal proceedings and litigation
Several entities of the Group are party to legal actions in a number of jurisdictions (including, among others, Spain, Mexico and the United States) arising in the ordinary course of business. According to the procedural status of these proceedings and the criteria of the legal counsel, BBVA considers that none of such actions is material, individually or in the aggregate, and none is expected to result in a material adverse effect on the Group’s financial position, results of operations or liquidity, either individually or in the aggregate. The Group’s Management believes that adequate provisions have been made in respect of such legal proceedings and considers that the possible contingencies that may arise from such on-going lawsuits are not significant enough to require disclosure to the markets.
F-139
26. Pensions and other post-employment commitments
As stated in Note 2.2.12, the Group has assumed commitments with employees including defined contribution plans, defined benefit plans (see Glossary) and medical benefits.
Employees are covered by defined contribution plans in practically all of the countries in which the Group operates, with the plans in Spain and Mexico being the most significant. Most defined benefit plans are closed to new employees and with liabilities relating largely inactive employees, the most significant being those in Spain, Mexico and the United States. In Mexico, the Group provides post-retirement medical benefits to a closed group of employees and their family members.
The breakdown of the balance sheet net defined benefit liability for financial years 2013, 2012 and 2011 is provided below:
| | | | | | | | | | | | | | | | | | |
| | | | | |
| | | | | | | Millions of Euros | | | |
| | | Net defined benefit liability (asset) on the Balance Sheet | | | | 2013 | | | 2012 | | | 2011 | | | |
| | | Pension commitments | | | | | 4,266 | | | | 4,463 | | | | 4,004 | | | |
| | | Early retirement commitments | | | | | 2,634 | | | | 2,758 | | | | 2,904 | | | |
| | | Medical benefits commitments | | | | | 811 | | | | 985 | | | | 772 | | | |
| | | Total commitments | | | | | 7,711 | | | | 8,205 | | | | 7,680 | | | |
| | | Pension plan assets | | | | | 1,436 | | | | 1,535 | | | | 1,389 | | | |
| | | Medical benefit plan assets | | | | | 938 | | | | 895 | | | | 733 | | | |
| | | Total plan assets | | | | | 2,374 | | | | 2,430 | | | | 2,122 | | | |
| | | Total net liability / asset on the balance sheet | | | | | 5,337 | | | | 5,775 | | | | 5,558 | | | |
| | | Of which: | | | | | | | | | | | | | | | | |
| | | Net asset on the balance sheet (1) | | | | | (175) | | | | (2) | | | | (19) | | | |
| | | Net liability on the balance sheet (2) | | | | | 5,512 | | | | 5,777 | | | | 5,577 | | | |
| | | | | | | | | | | | | | | | | | | |
| | (1) | Recorded under the heading “Other Assets - Other” of the consolidated balance sheet (See note 22) |
| | (2) | Recorded under the heading “Provisions - Provisions for pensions and similar obligations” of the consolidated balance sheet (See note 25) |
The amounts relating to post-employment benefits charged to the profit and loss account and other comprehensive income for financial years 2013, 2012 and 2011 are as follows:
| | | | | | | | | | | | | | | | | | |
| | | | | |
| | | | | | | Millions of Euros | | | |
| | | Consolidated income statement impact | | Notes | | 2013 | | | 2012 | | | 2011 | | | |
| | | Interest and similar expenses (*) | | 39.2 | | | 199 | | | | 256 | | | | 259 | | | |
| | | Interest expense | | | | | 342 | | | | 367 | | | | 376 | | | |
| | | Interest income | | | | | (143) | | | | (110) | | | | (118) | | | |
| | | Personnel expenses | | | | | 150 | | | | 138 | | | | 131 | | | |
| | | Defined contribution plan expense | | 46.1 | | | 80 | | | | 84 | | | | 80 | | | |
| | | Defined benefit plan expense | | 46.1 | | | 70 | | | | 54 | | | | 51 | | | |
| | | Provisions (net) | | 48 | | | 373 | | | | 433 | | | | 360 | | | |
| | | Early retirement expense | | | | | 336 | | | | 276 | | | | 297 | | | |
| | | Past service cost expense | | | | | 6 | | | | 17 | | | | 13 | | | |
| | | Remeasurements (**) | | | | | - | | | | 97 | | | | (7) | | | |
| | | Other provision expenses | | | | | 31 | | | | 43 | | | | 57 | | | |
| | | Total impact on Income Statement: Debit (Credit) | | | | | 722 | | | | 827 | | | | 751 | | | |
| | | | | | | | | | | | | | | | | | | |
| | (*) | Interest and similar charges includes interest charges/credits, and for 2012 and 2011 the “Return on assets”. |
| | (**) | Actuarial losses (gains) on remeasurement of the net defined benefit liability relating to early retirements in Spain and other similar benefits (see Note 2.2.12). |
F-140
| | | | | | | | | | | | | | | | | | |
| | | | | | | Millions of Euros | | | |
| | | Equity impact | | Notes | | 2013 | | | 2012 | | | 2011 | | | |
| | | Defined benefit plans | | | | | 70 | | | | 436 | | | | 73 | | | |
| | | Post-employment medical benefits | | | | | (58) | | | | 26 | | | | (7) | | | |
| | | Total impact on equity: Debit (Credit) (*) | | 25 | | | 12 | | | | 462 | | | | 67 | | | |
| | | | | | | | | | | | | | | | | | | |
| | | | | | | | | | | | | | | | | | | |
| | (*) Actuarial gains (losses) on remeasurement of the net defined benefit liability relating to pension commitments . |
26.1 Defined contribution commitments
Certain Group employees participate in defined contribution plans. These commitments are settled through contributions made by the employer into a separate entity responsible for the eventual payment of benefits. Some of these plans are contributory, allowing employees to make contributions which are then matched by the employer.
Employer contributions are paid and recognized in the consolidated income statement in the corresponding financial year (see Note 46.1), and no liability is therefore recognized in the accompanying consolidated balance sheet for this purpose.
26.2 Defined benefit plans
Defined benefit pension commitments relate mainly to employees who have already retired or taken early retirement from the Group, certain closed groups of active employees still accruing defined benefit pensions, and in-service death and disability benefits provided to most active employees. For the latter the Group pays the required premiums to fully insure the related liability.
| | | | | | | | | | | | | | | | | | | | | | | | | | | | | | | | | | | | | | | | | | |
| | | | | | | Millions of Euros |
| | | | | | | 2013 | | | 2012 | | | 2011 | | | |
| | | Pension commitments | | | | Defined benefit obligation | | | Plan assets | | | Net
liability
(asset) | | | Defined benefit obligation | | | Plan assets | | | Net
liability (asset) | | | Defined benefit obligation | | | Plan assets | | | Net
liability (asset) | | | |
| | | Balance at the begining | | | | | 7,817 | | | | 2,042 | | | | 5,775 | | | | 7,301 | | | | 1,743 | | | | 5,558 | | | | 7,652 | | | | 1,671 | | | | 5,980 | | | |
| | | Current service cost | | | | | 70 | | | | - | | | | 70 | | | | 54 | | | | 1 | | | | 53 | | | | 51 | | | | - | | | | 51 | | | |
| | | Interest income or expense | | | | | 342 | | | | 143 | | | | 199 | | | | 354 | | | | 124 | | | | 229 | | | | 371 | | | | 112 | | | | 259 | | | |
| | | Contributions by plan participants | | | | | 1 | | | | 1 | | | | - | | | | - | | | | - | | | | - | | | | - | | | | - | | | | - | | | |
| | | Employer contributions | | | | | - | | | | 256 | �� | | | (256) | | | | 0 | | | | 6 | | | | (5) | | | | (1) | | | | 222 | | | | (223) | | | |
| | | Past service costs (1) | | | | | 342 | | | | - | | | | 342 | | | | 276 | | | | - | | | | 276 | | | | 310 | | | | - | | | | 310 | | | |
| | | Return on plan assets (2) | | | | | - | | | | (286) | | | | 286 | | | | - | | | | 136 | | | | (136) | | | | - | | | | 58 | | | | (58) | | | |
| | | Remeasurements arising from changes in demographic assumptions | | | | | 3 | | | | - | | | | 3 | | | | - | | | | - | | | | - | | | | - | | | | - | | | | - | | | |
| | | Remeasurements arising from changes in financial assumptions | | | | | (289) | | | | - | | | | (289) | | | | 533 | | | | 25 | | | | 508 | | | | 58 | | | | 3 | | | | 56 | | | |
| | | Other actuarial gain and losses | | | | | 4 | | | | - | | | | 4 | | | | 48 | | | | - | | | | 48 | | | | 8 | | | | 4 | | | | 4 | | | |
| | | Benefit payments | | | | | (888) | | | | (70) | | | | (817) | | | | (881) | | | | (68) | | | | (813) | | | | (1,045) | | | | (251) | | | | (794) | | | |
| | | Settlement payments | | | | | (1) | | | | (1) | | | | - | | | | - | | | | - | | | | - | | | | (13) | | | | - | | | | (13) | | | |
| | | Business combinations and disposals | | | | | - | | | | - | | | | - | | | | 65 | | | | - | | | | 65 | | | | (9) | | | | (9) | | | | - | | | |
| | | Effect on changes in foreign exchange rates | | | | | (121) | | | | (93) | | | | (29) | | | | 55 | | | | 57 | | | | (2) | | | | (100) | | | | (89) | | | | (11) | | | |
| | | Other effects | | | | | 48 | | | | - | | | | 48 | | | | 11 | | | | 18 | | | | (7) | | | | 19 | | | | 23 | | | | (3) | | | |
| | | Balance at the end | | | | | 7,327 | | | | 1,990 | | | | 5,337 | | | | 7,817 | | | | 2,042 | | | | 5,775 | | | | 7,301 | | | | 1,743 | | | | 5,558 | | | |
| | | Of which | | | | | | | | | | | | | | | | | | | | | | | | | | | | | | | | | | | | | | | | |
| | | Spain | | | | | 5,393 | | | | - | | | | 5,393 | | | | 5,620 | | | | - | | | | 5,620 | | | | 5,502 | | | | - | | | | 5,502 | | | |
| | | Mexico | | | | | 1,313 | | | | 1,490 | | | | (177) | | | | 1,543 | | | | 1,502 | | | | 41 | | | | 1,252 | | | | 1,252 | | | | - | | | |
| | | The United States | | | | | 276 | | | | 244 | | | | 32 | | | | 313 | | | | 293 | | | | 20 | | | | 285 | | | | 283 | | | | 2 | | | |
| | | | | | | | | | | | | | | | | | | | | | | | | | | | | | | | | | | | | | | | | | | |
| | (1) Including gains and losses arising from settlements. (2) Excluding interest, which is recorded under “Interest income or expense”. |
The balance under the heading “Provisions - Provisions for pensions and similar obligations” of the accompanying consolidated balance sheet as of December 31, 2013 includes€241 million relating to post-employment benefit commitments of former members of the Board of Directors and the Bank’s Management Committee.
The most significant commitments are those in Spain and Mexico and, to a lesser extent, in the United States. The remaining commitments are located mostly in Portugal and South America. We include a detailed breakdown for Spain, México and the United States which, in aggregate, account for more than 90% of the total commitments. Both the costs and the present value of the commitments are determined by independent qualified actuaries using the “projected unit credit” method.
F-141
The following table sets out the key actuarial assumptions used in the valuation of these commitments:
| | | | | | | | | | | | | | | | | | | | | | | | |
| | | | | | | | | | | | | | | | | | | | | | | | | |
| | | | | | | 2013 | | 2012 | | 2011 | | |
| | | Actuarial
Assumptions | | | | Spain | | Mexico | | USA | | Spain | | Mexico | | USA | | Spain | | Mexico | | USA | | |
| | | Discount rate | | | | 3.50% | | 9.49% | | 4.86% | | 3.50% | | 8.20% | | 4.03% | | 4.50% | | 8.75% | | 4.28% | | |
| | | Rate of salary increase (*) | | | | 3.00% | | 4.75% | | 3.25% | | 3.00% | | 4.75% | | 3.50% | | 3.00% | | 4.75% | | 3.50% | | |
| | | Rate of pension increase | | | | | | 2.13% | | | | | | 2.13% | | | | | | 2.13% | | | | |
| | | Medical cost trend rate | | | | | | 6.75% | | | | | | 6.75% | | | | | | 6.75% | | | | |
| | | | | | | | | | | | | |
| | | Mortality tables | | | | PERM/F
2000P | | EMSSA
97 | | RP 2000
Projected & adjusted | | PERM/F
2000P | | EMSSA
97 | | RP 2000
Projected & adjusted | | PERM/F
2000P | | EMSSA
97 | | RP 2000
Projected & adjusted | | |
| | | | | | | | | | | | | | | | | | | | | | | | | |
| | (*) In Spain, different salary increase assumptions are used with the minimum being 3% |
Discount rates have been determined by reference to high quality corporate bonds (Note 2.2.12) of the appropriate currency (Euro in the case of Spain, Mexican peso for Mexico and USD for the United States).
Assumed retirement ages have been set by reference to the earliest age at which employees are entitled to retire, the contractually agreed age in the case of early retirements in Spain or by using retirement rates.
Changes in the main actuarial assumptions may affect the valuation of the commitments. The table below shows the sensitivity of the benefit obligations to changes in the key assumptions:
| | | | | | | | | | | | | | | | | | |
| | | | | | | | | | | | | | | | | | | |
| | | | | | | | | | Millions of Euros | | | |
| | | | | | | | | | 2013 | | | |
| | | Sensitivity analysis | | | | Basis points change | | | Increase | | | Decrease | | | |
| | | Discount rate | | | | | 50 | | | | (275) | | | | 301 | | | |
| | | Rate of salary increase | | | | | 50 | | | | 17 | | | | (17) | | | |
| | | Rate of pension increase | | | | | 50 | | | | 16 | | | | (15) | | | |
| | | Medical cost trend rate | | | | | 100 | | | | 148 | | | | (118) | | | |
| | | Change in obligation from each additional year of longevity | | | | | | | | | 87 | | | | | | | |
| | | | | | | | | | | | | | | | | | | |
The sensitivities provided above have been determined at the date of these consolidated financial statements, and reflect solely the impact of changing one individual assumption at a time, keeping the rest of the assumptions unchanged, thereby excluding the effects which may result from combined assumption changes.
In addition to the commitments to employees shown above, the Group has other less material commitments. These include long-service awards granted to certain groups of employees when they complete a given number of years of service.
As of December 31, 2013, 2012 and 2011, the actuarial liabilities for the outstanding awards amounted to€47,€50 and€43 million, respectively. These commitments are recorded under the heading “Other provisions” of the accompanying consolidated balance sheet (see Note 25).
Pension commitments
The majority of the defined benefit plans are fully funded, with plan assets held in funds legally separate from the Group sponsoring entity.
The plan assets related to these commitments are shown in the table below. These assets will be used directly to settle the vested obligations and meet the following conditions: they are not part of the Group sponsoring entity’s assets, they are available only to pay post-employment benefits, and they cannot be returned to the Group sponsoring entity.
The risks associated with these commitments are those which give rise to a deficit in the defined benefit plan. A deficit could arise from factors such as a decrease in the market value of equities, an increase in long-term interest rates leading to a decrease in the value of fixed income securities, or a deterioration of the economy resulting in more write-downs and credit rating downgrades.
F-142
The change in defined benefit plan obligations and plan assets during financial year 2013 was as follows:
| | | | | | | | | | | | | | | | | | | | | | | | | | | | | | | | | | | | | | | | | | |
| | | | | | | |
| | | | | | | | | | | | | | | | Millions of Euros |
| | | | | | | Defined benefit obligation | | | Plan assets | | | Net liability (asset) | | | |
| | | 2013 | | | | Spain | | | Mexico | | | USA | | | Spain | | | Mexico | | | USA | | | Spain | | | Mexico | | | USA | | | |
| | | Balance at the begining | | | | | 5,620 | | | | 573 | | | | 313 | | | | - | | | | 606 | | | | 293 | | | | 5,620 | | | | (33) | | | | 20 | | | |
| | | Current service cost | | | | | 20 | | | | 9 | | | | 5 | | | | - | | | | - | | | | - | | | | 20 | | | | 9 | | | | 5 | | | |
| | | Interest income or expense | | | | | 178 | | | | 46 | | | | 12 | | | | - | | | | 49 | | | | 11 | | | | 178 | | | | (3) | | | | 1 | | | |
| | | Contributions by plan participants | | | | | - | | | | - | | | | - | | | | - | | | | - | | | | - | | | | - | | | | - | | | | - | | | |
| | | Employer contributions | | | | | - | | | | - | | | | - | | | | - | | | | 64 | | | | - | | | | - | | | | (64) | | | | - | | | |
| | | Past service costs (1) | | | | | 337 | | | | - | | | | - | | | | - | | | | - | | | | - | | | | 337 | | | | - | | | | - | | | |
| | | Return on plan assets (2) | | | | | - | | | | - | | | | - | | | | - | | | | (98) | | | | (43) | | | | - | | | | 98 | | | | 43 | | | |
| | | Remeasurements arising from changes in demographic assumptions | | | | | - | | | | - | | | | 3 | | | | - | | | | - | | | | - | | | | - | | | | - | | | | 3 | | | |
| | | Remeasurements arising from changes in financial assumptions | | | | | - | | | | (59) | | | | (34) | | | | - | | | | - | | | | - | | | | - | | | | (59) | | | | (34) | | | |
| | | Other actuarial gain and losses | | | | | (4) | | | | 14 | | | | (2) | | | | - | | | | - | | | | - | | | | (4) | | | | 14 | | | | (2) | | | |
| | | Benefit payments | | | | | (807) | | | | (37) | | | | (8) | | | | - | | | | (36) | | | | (6) | | | | (807) | | | | (1) | | | | (2) | | | |
| | | Settlement payments | | | | | - | | | | - | | | | - | | | | - | | | | - | | | | - | | | | - | | | | - | | | | - | | | |
| | | Business combinations and disposals | | | | | - | | | | - | | | | - | | | | - | | | | - | | | | - | | | | - | | | | - | | | | - | | | |
| | | Effect on changes in foreign exchange rates | | | | | - | | | | (32) | | | | (13) | | | | - | | | | (33) | | | | (12) | | | | - | | | | 1 | | | | (1) | | | |
| | | Other effects | | | | | 49 | | | | - | | | | (1) | | | | - | | | | - | | | | 1 | | | | 49 | | | | - | | | | (2) | | | |
| | | Balance at the end | | | | | 5,393 | | | | 514 | | | | 276 | | | | - | | | | 552 | | | | 244 | | | | 5,393 | | | | (38) | | | | 32 | | | |
| | | Of which | | | | | | | | | | | | | | | | | | | | | | | | | | | | | | | | | | | | | | | | |
| | | Vested benefit obligation relating to current employees | | | | | 213 | | | | | | | | | | | | | | | | | | | | | | | | 213 | | | | | | | | | | | |
| | | Vested benefit obligation relating to retired employees | | | | | 5,180 | | | | | | | | | | | | | | | | | | | | | | | | 5,180 | | | | | | | | | | | |
| | | | | | | | | | | | | | | | | | | | | | | | | | | | | | | | | | | | | | | | | | | |
The change in net defined benefit plan liabilities (assets) during financial years 2012 and 2011 was as follows:
| | | | | | | | | | | | | | | | | | | | | | | | | | | | | | |
| | | | | | | |
| | | | | | | Millions of Euros |
| | | | | | | 2012: Net liability (asset) | | | 2011: Net liability (asset) | | | |
| | | | | | | Spain | | | Mexico | | | USA | | | Spain | | | Mexico | | | USA | | | |
| | | Balance at the begining | | | | | 5,502 | | | | (29) | | | | 2 | | | | 5,753 | | | | (11) | | | | 45 | | | |
| | | Current service cost | | | | | 12 | | | | 8 | | | | 6 | | | | 12 | | | | 7 | | | | 4 | | | |
| | | Interest income or expense | | | | | 224 | | | | (3) | | | | - | | | | 237 | | | | (1) | | | | 0 | | | |
| | | Contributions by plan participants | | | | | - | | | | - | | | | - | | | | - | | | | - | | | | - | | | |
| | | Employer contributions | | | | | - | | | | (1) | | | | - | | | | - | | | | (30) | | | | (33) | | | |
| | | Past service costs (1) | | | | | 256 | | | | (11) | | | | - | | | | 297 | | | | - | | | | - | | | |
| | | Return on plan assets (2) | | | | | - | | | | (49) | | | | (5) | | | | - | | | | (3) | | | | (55) | | | |
| | | Remeasurements arising from changes in demographic assumptions | | | | | - | | | | - | | | | - | | | | - | | | | - | | | | - | | | |
| | | Remeasurements arising from changes in financial assumptions | | | | | 362 | | | | 29 | | | | 13 | | | | 3 | | | | (1) | | | | 49 | | | |
| | | Other actuarial gain and losses | | | | | - | | | | 24 | | | | 8 | | | | - | | | | 8 | | | | (4) | | | |
| | | Benefit payments | | | | | (801) | | | | - | | | | (3) | | | | (790) | | | | - | | | | (1) | | | |
| | | Settlement payments | | | | | - | | | | - | | | | - | | | | - | | | | - | | | | (3) | | | |
| | | Business combinations and disposals | | | | | 65 | | | | - | | | | - | | | | - | | | | - | | | | - | | | |
| | | Effect on changes in foreign exchange rates | | | | | - | | | | (1) | | | | 0 | | | | - | | | | 1 | | | | 1 | | | |
| | | Other effects | | | | | - | | | | - | | | | (1) | | | | (10) | | | | 1 | | | | (2) | | | |
| | | Balance at the end | | | | | 5,620 | | | | (33) | | | | 20 | | | | 5,502 | | | | (29) | | | | 2 | | | |
| | | Of which | | | | | | | | | | | | | | | | | | | | | | | | | | | | |
| | | Vested benefit obligation relating to current employees | | | | | 216 | | | | - | | | | - | | | | 146 | | | | - | | | | - | | | |
| | | Vested benefit obligation relating to retired employees | | | | | 5,403 | | | | - | | | | - | | | | 5,356 | | | | - | | | | - | | | |
| | | | | | | | | | | | | | | | | | | | | | | | | | | | | | | |
InSpain, local regulation requires that pension and death benefit commitments must be funded, either through a qualified pension plan or an insurance contract.
Current pensions of BBVA employees are paid by the insurance companies with whom BBVA insures the benefits and to whom all premiums have been paid. These premiums are determined by the insurance companies using cash flow matching techniques, which ensure that payment of benefits will be made when required, guaranteeing both the actuarial and interest rate risks. These insurance policies meet the requirements of the accounting standard regarding the non-recoverability of contributions.
However, a significant part of the insurance contracts are held with BBVA Seguros, S.A., a related party consolidated within the BBVA Group financial statements. Consequently these policies cannot be considered plan assets under IAS 19 and are presented in the accompanying consolidated balance sheet under different headings of “assets”, depending on the classification of their corresponding financial instruments. In this case the full value of the obligations associated with these policies has been recognized under the heading “Provisions – Provisions for pensions and similar obligations” of the accompanying consolidated balance sheet (see Note 25).
On the other hand, some pension commitments have been funded through insurance contracts held with insurance companies not related to the Group, and can therefore be considered qualifying insurance policies and plan assets under IAS 19. In this case the accompanying consolidated balance sheet reflects the value of the obligations net of the value of the qualifying insurance policies. As of December 31, 2013, 2012 and 2011, the
F-143
valuation of the aforementioned insurance contracts (€385,€389 and€379 million, respectively) exactly match the value of the corresponding obligations and therefore no amount for this item has been recorded in the accompanying consolidated balance sheet.
In relation to the early retirement commitments, in 2013, Group entities in Spain offered certain employees the option to take early retirement (that is, earlier than the age stipulated in the collective labor agreement in force). This offer was accepted by 1,055 employees (633 and 669 in 2012 and 2011, respectively).
InMexico, there is a defined benefit plan for employees hired prior to 2001. Other employees participate in a defined contribution plan.
InThe United States there are mainly two defined benefit plans. The bigger one closed to new employees, who instead of participating in a defined benefit plan participate in a defined contribution plan. External funds/trusts have been constituted locally to fund the plans
Medical benefit commitments
InMexico there is a medical benefit plan for employees hired prior to 2007. New employees from 2007 are covered by medical insurance policy. An external trust has been constituted locally to fund the plan, the trust is managed in accordance with local legislation.
| | | | | | | | | | | | | | | | | | | | | | | | | | | | | | | | | | | | | | | | | | |
| | | | | | | | | | | | | | | | | | | | | | | | | | | | | | | | | | | | | | | | | | | |
| | | | | | | Millions of Euros |
| | | | | | | 2013 | | | 2012 | | | 2011 | | | |
| | | Medical benefits
commitments | | | | Defined benefit obligation | | | Plan assets | | | Net liability (asset) | | | Defined benefit obligation | | | Plan assets | | | Net liability (asset) | | | Defined benefit obligation | | | Plan assets | | | Net liability (asset) | | | |
| | | Balance at the begining | | | | | 970 | | | | 895 | | | | 75 | | | | 761 | | | | 732 | | | | 29 | | | | 766 | | | | 620 | | | | 146 | | | |
| | | Current service cost | | | | | 30 | | | | - | | | | 30 | | | | 26 | | | | - | | | | 26 | | | | 24 | | | | - | | | | 24 | | | |
| | | Interest income or expense | | | | | 79 | | | | 75 | | | | 4 | | | | 70 | | | | 69 | | | | 1 | | | | 63 | | | | 50 | | | | 13 | | | |
| | | Contributions by plan participants | | | | | - | | | | - | | | | - | | | | - | | | | - | | | | - | | | | - | | | | - | | | | - | | | |
| | | Employer contributions | | | | | - | | | | 186 | | | | (186) | | | | - | | | | 2 | | | | (2) | | | | - | | | | 124 | | | | (124) | | | |
| | | Past service costs (1) | | | | | - | | | | - | | | | - | | | | (7) | | | | - | | | | (7) | | | | - | | | | - | | | | - | | | |
| | | Return on plan assets (2) | | | | | - | | | | (140) | | | | 140 | | | | - | | | | 82 | | | | (82) | | | | - | | | | - | | | | - | | | |
| | | Remeasurements arising from changes in demographic assumptions | | | | | - | | | | - | | | | - | | | | - | | | | - | | | | - | | | | - | | | | - | | | | - | | | |
| | | Remeasurements arising from changes in financial assumptions | | | | | (195) | | | | - | | | | (195) | | | | 92 | | | | - | | | | 92 | | | | 8 | | | | 15 | | | | (7) | | | |
| | | Other actuarial gain and losses | | | | | (2) | | | | - | | | | (2) | | | | 16 | | | | - | | | | 16 | | | | - | | | | - | | | | - | | | |
| | | Benefit payments | | | | | (28) | | | | (28) | | | | - | | | | (26) | | | | (26) | | | | - | | | | (23) | | | | (23) | | | | - | | | |
| | | Settlement payments | | | | | - | | | | - | | | | - | | | | - | | | | - | | | | - | | | | (10) | | | | - | | | | (10) | | | |
| | | Business combinations and disposals | | | | | - | | | | - | | | | - | | | | - | | | | - | | | | - | | | | - | | | | - | | | | - | | | |
| | | Effect on changes in foreign exchange rates | | | | | (54) | | | | (49) | | | | (6) | | | | 38 | | | | 37 | | | | 1 | | | | (67) | | | | (54) | | | | (13) | | | |
| | | Other effects | | | | | (1) | | | | (1) | | | | - | | | | - | | | | - | | | | - | | | | - | | | | - | | | | - | | | |
| | | Balance at the end | | | | | 799 | | | | 938 | | | | (140) | | | | 970 | | | | 895 | | | | 75 | | | | 761 | | | | 732 | | | | 29 | | | |
| | | | | | | | | | | | | | | | | | | | | | | | | | | | | | | | | | | | | | | | | | | |
The valuation of these benefits and their accounting treatment in the accompanying consolidated financial statements follow the same methodology as that employed in the valuation of pension commitments.
Plan assets
To manage the assets associated with defined benefit plans, the companies of the BBVA Group have established investment policies designed according to criteria of prudence and minimizing the financial risks associated with plan assets.
The investment policy consists of investing in a low risk and diversified portfolio of assets with maturities consistent with the term of the benefit obligation and which, together with contributions made to the plan, will be sufficient to meet benefit payments when due, thus mitigating the plans‘ risks.
In those countries where plan assets are held in pension funds or trusts, the investment policy is developed consistently with local regulation. When selecting specific assets, current market conditions, the risk profile of the assets and their future market outlook are all taken into consideration. In all the cases, the selection of assets takes into consideration the term of the benefit obligations as well as short-term liquidity requirements.
F-144
As of December 31, 2013 the plan assets covering these commitments were almost entirely made up of fixed-income securities. The table below shows their allocation at the end of 2013:
| | | | | | | | | | |
| | | | | | | | | | | |
| | | | | | | Millions of Euros | | | |
| | | Plan assets breakdown | | | | 2013 | | | |
| | | Cash or cash equivalents | | | | | 35 | | | |
| | | Other debt securities (Goverment bonds) | | | | | 1,591 | | | |
| | | Asset-backed securities | | | | | 101 | | | |
| | | Insurance contracts | | | | | 385 | | | |
| | | Total | | | | | 2,113 | | | |
| | | Of which: | | | | | | | | |
| | | Debt securities issued by BBVA | | | | | 15 | | | |
| | | | | | | | | | | |
All of the debt securities in the table above have quoted market prices in active markets.
The estimated benefit payments over the next ten years for all the entities in Spain, Mexico and the United States are as follows:
| | | | | | | | | | | | | | | | | | | | | | | | | | | | | | | | | | | | | | | | |
| | | | | | | | | | | | | | | | | | | | | | | | | | | | | | | | | | | | | | | | | |
| | | | | | | Millions of Euros |
| | | Estimated benefit payments | | | | 2014 | | | | | 2015 | | | | | 2016 | | | | | 2017 | | | | | 2018 | | | | | 2019-2023 | | | |
| | | Commitments in Spain | | | | | 782 | | | | | | 713 | | | | | | 645 | | | | | | 572 | | | | | | 491 | | | | | | 1,496 | | | |
| | | Commitments in Mexico | | | | | 67 | | | | | | 69 | | | | | | 75 | | | | | | 81 | | | | | | 87 | | | | | | 511 | | | |
| | | Commitments in The United States | | | | | 11 | | | | | | 11 | | | | | | 12 | | | | | | 12 | | | | | | 13 | | | | | | 78 | | | |
| | | Total | | | | | 859 | | | | | | 794 | | | | | | 732 | | | | | | 665 | | | | | | 591 | | | | | | 2,084 | | | |
| | | | | | | | | | | | | | | | | | | | | | | | | | | | | | | | | | | | | | | | | |
27. Common stock
As of December 31, 2013, BBVA’s share capital amounted to€2,835,117,677 divided into 5,785,954,443 fully subscribed and paid-up registered shares, all of the same class and series, at€0.49 par value each, represented through book-entry accounts. All of the Bank shares carry the same voting and dividend rights, and no single stockholder enjoys special voting rights. Each and every share is part of the Bank’s common stock.
The Bank’s shares are traded on the Spanish stock market, as well as on the London and Mexico stock markets. BBVA American Depositary Shares (ADSs) traded on the New York Stock Exchange are also traded on the Lima Stock Exchange (Peru), under an exchange agreement between these two markets.
Also, as of December 31, 2013, the shares of BBVA Banco Continental, S.A., Banco Provincial S.A., BBVA Colombia, S.A., BBVA Chile, S.A., and BBVA Banco Frances, S.A. were listed on their respective local stock markets. BBVA Banco Frances, S.A. is also listed on the Latin American market of the Madrid Stock Exchange and on the New York Stock Exchange.
As of December 31, 2013, State Street Bank and Trust Co., Chase Nominees Ltd., The Bank of New York Mellon, SA NV, and the Caceis Bank in their capacity as international custodian/depositary banks, held 10.875%, 6.561%, 5.028% and 3.074% of BBVA common stock, respectively. Of said positions held by the custodian banks, BBVA is not aware of any individual shareholders with direct or indirect holdings greater than or equal to 3% of BBVA common stock outstanding.
On February 4, 2010, the Blackrock, Inc. reported to the Spanish Securities and Exchange Commission (CNMV) that, as a result of the acquisition (on December 1, 2009) of the Barclays Global Investors (BGI) company, it now has an indirect holding of BBVA common stock totaling 4.453% through the Blackrock Investment Management Company.
BBVA is not aware of any direct or indirect interests through which control of the Bank may be exercised. BBVA has not received any information on stockholder agreements including the regulation of the exercise of voting rights at its annual general meetings or restricting or placing conditions on the free transferability of BBVA shares. No agreement is known that could give rise to changes in the control of the Bank.
F-145
The changes in the heading “Common Stock” of the accompanying consolidated balance sheets are due to the following common stock increases:
| | | | | | | | | | | | | | |
| | | | | | | | | | | | | | | |
| | | Capital Increase | | | | Number of Shares | | | Common Stock (Millions of Euros) | | | |
| | | As of December 31, 2011 | | | | | 4,903,207,003 | | | | 2,403 | | | |
| | | Convertible bonds conversion - April 2012 | | | | | 157,875,375 | | | | 77 | | | |
| | | Dividend option - April 2012 | | | | | 82,343,549 | | | | 40 | | | |
| | | Convertible bonds conversion - July 2012 | | | | | 238,682,213 | | | | 117 | | | |
| | | Dividend option - October 2012 | | | | | 66,741,405 | | | | 33 | | | |
| | | As of December 31, 2012 | | | | | 5,448,849,545 | | | | 2,670 | | | |
| | | Dividend option - April 2013 | | | | | 83,393,714 | | | | 41 | | | |
| | | Convertible bonds conversion - July 2013 | | | | | 192,083,232 | | | | 94 | | | |
| | | Dividend option - October 2013 | | | | | 61,627,952 | | | | 30 | | | |
| | | As of December 31, 2013 | | | | | 5,785,954,443 | | | | 2,835 | | | |
| | | | | | | | | | | | | | | |
2013
“Dividend Option” Program:
The AGM held on March 15, 2013 under Point Four of the Agenda, resolved to perform two common stock increases, charged to voluntary reserves, to once again implement the program called the “Dividend Option” (see Note 4). This confers authority on the Board of Directors, pursuant to article 297.1 a) of the Corporations Act, to indicate the date on which said common stock increases should be carried out, within one year of the date on which the agreements are made.
On April 3, 2013, the Executive Committee approved the execution of the first of the capital increases charged to reserves agreed by the aforementioned AGM. As a result of this increase, the Bank’s common stock increased by€40,862,919.86 through the issue and circulation of 83,393,714 shares with a€0.49 par value each. Likewise, on September 25, 2013, the Executive Committee approved the execution of the second of the capital increases charged to reserves agreed by the aforementioned AGM on March 15, 2013. As a result of this increase, the Bank’s common stock increased by€30,197,696.48 through the issue and circulation of 61,627,952 shares with a€0.49 par value each.
Convertible Bonds-December 2011:
On June 30, 2013, the maturity date of the issue, there was a mandatory conversion of the outstanding Convertible Bonds as of that date. An increase in the Bank’s common stock was carried out to satisfy the shares to be issued upon conversion by the issue and distribution of 192,083,232 ordinary shares at a par value of€0.49 each, amounting to a total of€94,120,783.68, with the share premium being€1,143,279,396.8640 (see Note 28).
2012
“Dividend Option” Program:
The AGM held on March 16, 2012, under Point Four of the Agenda, resolved to perform two common stock increases, charged to voluntary reserves, to once again implement the program called the “Dividend Option” (see Note 4). This confers authority on the Board of Directors, pursuant to article 297.1 a) of the Corporations Act, to indicate the date on which said common stock increases should be carried out, within one year of the date on which the agreements are made.
On April 11, 2012, the Executive Committee, acting on the resolution of the Board of Directors of March 28, 2012, approved the execution of the first of the capital increases charged to reserves agreed by the Annual General Meeting of shareholders on March 16, 2012, in order to execute the “Dividend Option.” As a result of this increase, the Bank’s common stock increased by€40,348,339.01, through the issue and circulation of 82,343,549 shares with a€0.49 par value each.
F-146
Likewise, BBVA’s Board of Directors, at its meeting on September 26, 2012, agreed to carry out the second common stock increase under the heading of reserves, in accordance with the terms and conditions agreed upon by the AGM of March 16, 2012. As a result of this increase, the Bank’s common stock increased by€32,703,288.45 through the issue and circulation of 66,741,405 shares with a€0.49 par value each.
Convertible Bonds-December 2011:
On March 30, 2012 there was a voluntary conversion by holders of Convertible Bonds for a total of€955 million.
An increase in the Bank’s common stock was carried out to pay for this conversion by the issue and distribution of 157,875,375 ordinary shares at a par value of€0.49 each, amounting to a total of€77,358,933.75, with the share premium being€877,313,458.8750 (see Note 28).
In addition, on June 30, 2012 there was a partial mandatory conversion of the outstanding Convertible Bonds as of that date, through a reduction of 50% in their nominal value. Following the execution of these conversions (see Note 23.4) the nominal amount of outstanding Convertible Bonds is€1,238 million.
An increase in the Bank’s common stock was carried out to pay for this conversion by the issue and distribution of 238,682,213 ordinary shares at a par value of€0.49 each, amounting to a total of€116,954,284.37, with the share premium being€1,120,469,780.7072 (see Note 28).
Other resolutions of the General Shareholders Meeting on the issue of shares and other securities
Common stock increases:
The Bank’s AGM held on March 16, 2012 agreed, in Point Three of the Agenda, to confer authority on the Board of Directors to increase common stock in accordance with Article 297.1.b) of the Corporations Act, on one or several occasions, within the legal deadline of five years from the date the resolution takes effect, up to the maximum nominal amount of 50% of the subscribed and paid-up common stock on the date on which the resolution is adopted. Likewise, an agreement was made to enable the Board of Directors to exclude the preemptive subscription right on those common stock increases in line with the terms of Article 506 of the Corporations Act. This authority is limited to 20% of the common stock of the Bank on the date the agreement is adopted.
Convertible and/or exchangeable securities:
At the AGM held on March 16, 2012 the shareholders resolved, in Point Five of the Agenda, to delegate to the Board of Directors for a five-year period the right to issue bonds, convertible and/or exchangeable into BBVA shares, for a maximum total of€12 billion. The powers include the right to establish the different aspects and conditions of each issue; to exclude the pre-emptive subscription right of shareholders in accordance with the Corporations Act; to determine the basis and methods of conversion and/or exchange; and to increase the Banks common stock as required to address the conversion commitments.
Other securities:
The Bank’s AGM held on March 11, 2011, in Point Six of the agenda, agreed to delegate to the Board of Directors, the authority to issue, within the five-year maximum period stipulated by law, on one or several occasions, directly or through subsidiaries, with the full guarantee of the Bank, any type of debt instruments, documented in obligations, bonds of any kind, promissory notes, all type of covered bonds, warrants, mortgage participation, mortgage transfers certificates and preferred securities (that are totally or partially exchangeable for shares already issued by the company itself or by another company, in the market or which can be settled in cash), or any other fixed-income securities, in euros or any other currency, that can be subscribed in cash or in kind, registered or bearer, unsecured or secured by any kind of collateral, including a mortgage guarantee, with or without incorporation of rights to the securities (warrants), subordinate or otherwise, for a limited or indefinite period of time, up to a maximum nominal amount of€250 billion.
F-147
28. Share premium
The changes in the balances under this heading in the accompanying consolidated balance sheets are due to the common stock increases carried out in 2013 and 2012 (see Note 27), as set out below:
| | | | | | | | | | |
| | | | | | | | | | |
| | | | | | | Millions of Euros | | | |
| | | Capital Increase | | | | Share premium | | | |
| | | As of December 31, 2011 | | | | | 18,970 | | | |
| | | Convertible bonds conversion - April 2012 | | | | | 878 | | | |
| | | Convertible bonds conversion - July 2012 | | | | | 1,120 | | | |
| | | As of December 31, 2012 | | | | | 20,968 | | | |
| | | Convertible bonds conversion - July 2013 | | | | | 1,143 | | | |
| | | As of December 31, 2013 | | | | | 22,111 | | | |
| | | | | | | | | | | |
The amended Spanish Corporation Act expressly permits the use of the share premium balance to increase capital and establishes no specific restrictions as to its use.
29. Reserves
The breakdown of the balance under this heading in the accompanying consolidated balance sheets is as follows:
| | | | | | | | | | | | | | | | | | |
| | | | | | | | | | |
| | | | | | | Millions of Euros | | | |
| | | Reserves. Breakdown by concepts | | Notes | | 2013 | | | 2012 | | | 2011 | | | |
| | | Legal reserve | | 29.1 | | | 534 | | | | 481 | | | | 440 | | | |
| | | Restricted reserve for retired capital | | 29.2 | | | 296 | | | | 387 | | | | 495 | | | |
| | | Reserves for balance revaluations | | | | | 26 | | | | 27 | | | | 28 | | | |
| | | Voluntary reserves | | | | | 6,528 | | | | 6,154 | | | | 5,854 | | | |
| | | Total reserves holding company (*) | | | | | 7,384 | | | | 7,049 | | | | 6,817 | | | |
| | | Consolidation reserves attributed to the Bank and dependents consolidated companies | | | | | 12,524 | | | | 12,623 | | | | 11,123 | | | |
| | | Total Reserves | | | | | 19,908 | | | | 19,672 | | | | 17,940 | | | |
| | | | | | | | | | | | | | | | | | | |
| | (*) Total reserves of BBVA, S.A. | | | | | | | | | | | | | | | | |
29.1 Legal reserve
Under the amended Corporations Act, 10% of any profit made each year must be transferred to the legal reserve. These provisions must be made until the legal reserve reaches 20% of the share capital; limit that will be reached by the bank once the proposal of allocation of 2013 earnings is approved (see Note 4).
The legal reserve can be used to increase the common stock provided that the remaining reserve balance does not fall below 10% of the increased capital. While it does not exceed 20% of the common stock, it can only be allocated to offset losses exclusively in the case that there are not sufficient reserves available.
F-148
29.2 Restricted reserves
As of December 31, 2013, 2012 and 2011, the Bank’s restricted reserves are as follows:
| | | | | | | | | | | | | | | | | | |
| | | | | | | | | | | | | | | | | | | |
| | | | | | | Millions of Euros | | | |
| | | Restricted Reserves | | | | 2013 | | | 2012 | | | 2011 | | | |
| | | Restricted reserve for retired capital | | | | | 88 | | | | 88 | | | | 88 | | | |
| | | Restricted reserve for Parent Company shares and loans for those shares | | | | | 206 | | | | 297 | | | | 405 | | | |
| | | Restricted reserve for redenomination of capital in euros | | | | | 2 | | | | 2 | | | | 2 | | | |
| | | Total | | | | | 296 | | | | 387 | | | | 495 | | | |
| | | | | | | | | | | | | | | | | | | |
The restricted reserve for retired capital originated in the reduction of the nominal par value of the BBVA shares made in April 2000.
The most significant heading corresponds to restricted reserves related to the amount of shares issued by the Bank in its possession at each date, as well as the amount of customer loans outstanding at those dates that were granted for the purchase of, or are secured by, the Bank’s shares.
Finally, pursuant to Law 46/1998 on the Introduction of the Euro, a restricted reserve is recognized as a result of the rounding effect of the redenomination of the Bank’s common stock in euros.
Furthermore, in the individual financial statements for subsidiaries as of December 31, 2013, 2012 and 2011, restricted reserves for a total of€3,132 million,€3,149 million and€2,940 million, respectively, are taken into consideration.
F-149
29.3 Reserves (losses) by entity
The breakdown, by company or corporate group, under the heading “Reserves” in the accompanying consolidated balance sheets is as follows:
| | | | | | | | | | | | | | | | | | |
| | | | | | | |
| | | | | | | Millions of Euros |
| | | Reserves Assigned to the Consolidation Process | | | | 2013 | | | 2012 | | | 2011 | | | |
| | | Accumulated reserves (losses) | | | | | | | | | | | | | | | | |
| | | Holding Company (*) | | | | | 12,112 | | | | 10,110 | | | | 7,711 | | | |
| | | BBVA Bancomer Group | | | | | 6,275 | | | | 5,589 | | | | 5,070 | | | |
| | | BBVA Seguros, S.A. | | | | | 1,561 | | | | 1,447 | | | | 1,422 | | | |
| | | BBVA Banco Provincial Group | | | | | 1,231 | | | | 906 | | | | 711 | | | |
| | | BBVA Chile Group | | | | | 959 | | | | 873 | | | | 670 | | | |
| | | Corporacion General Financiera, S.A. | | | | | 605 | | | | 1,118 | | | | 677 | | | |
| | | Anida Grupo Inmobiliario, S.L. | | | | | 381 | | | | 375 | | | | 369 | | | |
| | | BBVA Continental Group | | | | | 335 | | | | 256 | | | | 217 | | | |
| | | BBVA Colombia Group | | | | | 315 | | | | 79 | | | | (38) | | | |
| | | BBVA Suiza, S.A. | | | | | 313 | | | | 294 | | | | 269 | | | |
| | | BBVA Luxinvest, S.A. | | | | | 263 | | | | 230 | | | | 1,231 | | | |
| | | BBVA Banco Francés Group | | | | | 242 | | | | 65 | | | | (92) | | | |
| | | Bilbao Vizcaya Holding, S.A. | | | | | 63 | | | | 51 | | | | 157 | | | |
| | | Cidessa Uno S.L | | | | | 15 | | | | 30 | | | | 432 | | | |
| | | Banco Industrial De Bilbao, S.A. | | | | | (4) | | | | 35 | | | | 122 | | | |
| | | BBVA Ireland Public Limited Company | | | | | (4) | | | | (22) | | | | 173 | | | |
| | | Compañía de Cartera e Inversiones, S.A. | | | | | (28) | | | | 438 | | | | 540 | | | |
| | | Compañía Chilena de Inversiones, S.L. | | | | | (121) | | | | (164) | | | | (84) | | | |
| | | Participaciones Arenal, S.L. | | | | | (180) | | | | (180) | | | | (181) | | | |
| | | BBVA Propiedad S.A. | | | | | (267) | | | | (233) | | | | (194) | | | |
| | | BBVA Portugal | | | | | (357) | | | | (177) | | | | (188) | | | |
| | | Anida Operaciones Singulares, S.L. | | | | | (1,224) | | | | (850) | | | | (816) | | | |
| | | BBVA USA Bancshares Group | | | | | (1,305) | | | | (1,652) | | | | (852) | | | |
| | | Real Estate Unnim + Unnim Banc (**) | | | | | (1,675) | | | | 15 | | | | - | | | |
| | | Other | | | | | (47) | | | | 87 | | | | 254 | | | |
| | | Subtotal | | | | | 19,458 | | | | 18,721 | | | | 17,580 | | | |
| | | Reserves (losses) of entities accounted for using the equity method: | | | | | | | | | | | | | | | | |
| | | Garanti Turkiye Bankasi Group | | | | | 379 | | | | 127 | | | | - | | | |
| | | Citic Group (see Note 3) | | | | | 124 | | | | 859 | | | | 431 | | | |
| | | Tubos Reunidos, S.A. | | | | | 53 | | | | 50 | | | | 51 | | | |
| | | Occidental Hoteles Management, S.L. | | | | | (93) | | | | (91) | | | | (72) | | | |
| | | Other | | | | | (13) | | | | 6 | | | | (50) | | | |
| | | Subtotal | | | | | 450 | | | | 951 | | | | 360 | | | |
| | | Total Reserves | | | | | 19,908 | | | | 19,672 | | | | 17,940 | | | |
| | | | | | | | | | | | | | | | | | | |
| | |
(*) | | Corresponds to the reserve of the Bank after adjustments made through the consolidation process. |
(**) | | Due to the acquisition of Unnim Banc S.A. by BBVA, S.A. in 2012, a positive impact was generated in 2013 from the “Asset Protection Scheme” (EPA) which was recorded in reserves of BBVA, S.A. |
For the purpose of allocating the reserves and accumulated losses to the consolidated entities and to the parent company, the transfers of reserves arising from the dividends paid and transactions between these entities are taken into account in the period in which they took place.
F-150
30. Treasury stock
In the year ended December 31, 2013, 2012 and 2011 the Group entities performed the following transactions with shares issued by the Bank:
| | | | | | | | | | | | | | | | | | |
| | | | | | | | | | | | | | | | | | | |
| | | | | | | 2013 | | 2012 | | 2011 | | |
| | | Treasury Stock | | | | Number of
Shares | | Millions of
Euros | | Number of
Shares | | Millions of
Euros | | Number of
Shares | | Millions of
Euros | | |
| | | Balance at beginning | | | | 15,462,936 | | 111 | | 46,398,183 | | 300 | | 58,046,967 | | 552 | | |
| | | + Purchases | | | | 488,985,513 | | 3,614 | | 819,289,736 | | 4,831 | | 652,994,773 | | 4,825 | | |
| | | - Sales and other changes | | | | (497,571,679) | | (3,658) | | (850,224,983) | | (5,021) | | (664,643,557) | | (5,027) | | |
| | | +/- Derivatives on BBVA shares | | | | - | | - | | - | | 1 | | - | | (50) | | |
| | | +/- Other changes | | | | - | | (1) | | - | | - | | - | | - | | |
| | | Balance at the end | | | | 6,876,770 | | 66 | | 15,462,936 | | 111 | | 46,398,183 | | 300 | | |
| | | Of which: | | | | | | | | | | | | | | | | |
| | | Held by BBVA, S.A. | | | | 1,357,669 | | 20 | | 4,508,380 | | 41 | | 1,431,838 | | 19 | | |
| | | Held by Corporación General Financiera, S.A. | | | | 5,491,697 | | 46 | | 10,870,987 | | 70 | | 44,938,538 | | 281 | | |
| | | Held by other subsidiaries | | | | 27,404 | | | | 83,569 | | | | 27,807 | | | | |
| | | Average purchase price in Euros | | | | 7.39 | | | | 5.90 | | | | 7.39 | | | | |
| | | Average selling price in Euros | | | | 7.44 | | | | 6.04 | | | | 7.53 | | | | |
| | | Net gain or losses on transactions (Stockholders’ funds-Reserves) | | | | | | 30 | | | | 81 | | | | (14) | | |
| | | | | | | | | | | | | | | | | | | |
The percentages of treasury stock held by the Group in the year ended December 31, 2013, 2012 and 2011 are as follows:
| | | | | | | | | | | | | | | | | | |
| | | | | | | | | | | | | | | | | | | |
| | | | | | | 2013 | | 2012 | | 2011 | | |
| | | Treasury Stock | | | | Min | | Max | | Min | | Max | | Min | | Max | | |
| | | | | | | | | | | | |
| | | % treasury stock | | | | - | | 0.718% | | 0.240% | | 1.886% | | 0.649% | | 1.855% | | |
| | | | | | | | | | | | | | | | | | | |
The number of BBVA shares accepted by the Group in pledge of loans as of December 31, 2013, 2012 and 2011 is as follows:
| | | | | | | | | | | | |
| | | | | | | | | | | | | |
| | | Shares of BBVA Accepted in Pledge | | | | 2013 | | 2012 | | 2011 | | |
| | | | | | | | | |
| | | Number of shares in pledge | | | | 111,627,466 | | 132,675,070 | | 119,003,592 | | |
| | | Nominal value | | | | 0.49 | | 0.49 | | 0.49 | | |
| | | % of share capital | | | | 1.93% | | 2.43% | | 2.43% | | |
| | | | | | | | | | | | | |
The number of BBVA shares owned by third parties but under management of a company within the Group as of December 31, 2013, 2012 and 2011 is as follows:
| | | | | | | | | | | | |
| | | | | | | | | | | | | |
| | | Shares of BBVA Owned by Third Parties but
Managed by the Group | | | | 2013 | | 2012 | | 2011 | | |
| | | Number of shares owned by third parties | | | | 101,184,985 | | 109,348,019 | | 104,069,727 | | |
| | | Nominal value | | | | 0.49 | | 0.49 | | 0.49 | | |
| | | % of share capital | | | | 1.75% | | 2.01% | | 2.12% | | |
| | | | | | | | | | | | | |
F-151
31. Valuation adjustments
The breakdown of the balance under this heading in the accompanying consolidated balance sheets is as follows:
| | | | | | | | | | | | |
| | | | | | | | | | | | | |
| | | | | | | Millions of Euros | | |
| | | Valuation Adjustments | | Notes | | 2013 | | 2012 | | 2011 | | |
| | | | | | | | |
| | | Available-for-sale financial assets | | 12.4 | | 851 | | (238) | | (628) | | |
| | | Cash flow hedging | | | | 8 | | 36 | | 30 | | |
| | | Hedging of net investments in foreign transactions | | | | (100) | | (243) | | (159) | | |
| | | Exchange differences | | | | (3,023) | | (1,164) | | (1,623) | | |
| | | Non-current assets held for sale | | | | 3 | | (104) | | - | | |
| | | Entities accounted for using the equity method | | | | (1,130) | | (24) | | (179) | | |
| | | Other valuation adjustments (Remeasurements) | | | | (440) | | (447) | | (228) | | |
| | | Total | | | | (3,831) | | (2,184) | | (2,787) | | |
| | | | | | | | | | | | | |
The balances recognized under these headings are presented net of tax.
Changes in 2013 in “Exchange differences” in the table above are due to the depreciation of currencies against the Euro and, in particular, the devaluation of the Venezuelan Bolivar Fuerte.
Changes in 2013 in “Entities accounted for the using equity method” in the table above are mainly due to the depreciation of the Turkish Lira.
32. Non-controlling interests
The breakdown by groups of consolidated entities of the balance under the heading “Non-controlling interests” of total equity in the accompanying consolidated balance sheets is as follows:
| | | | | | | | | | | | |
| | | | | | | | | | | | | |
| | | | | | | Millions of Euros | | |
| | | Non-Controlling Interest | | | | 2013 | | 2012 | | 2011 | | |
| | | | | | | | | |
| | | BBVA Colombia Group | | | | 54 | | 51 | | 42 | | |
| | | BBVA Chile Group | | | | 307 | | 495 | | 409 | | |
| | | BBVA Banco Continental Group | | | | 691 | | 697 | | 580 | | |
| | | BBVA Banco Provincial Group | | | | 1,041 | | 883 | | 655 | | |
| | | BBVA Banco Francés Group | | | | 188 | | 190 | | 162 | | |
| | | Other companies | | | | 90 | | 56 | | 45 | | |
| | | Total | | | | 2,371 | | 2,372 | | 1,893 | | |
| | | | | | | | | | | | | |
These amounts are broken down by groups of consolidated entities under the heading “Profit attributable to non-controlling interests” in the accompanying consolidated income statements:
| | | | | | | | | | | | |
| | | | | | | | | | | | | |
| | | | | | | Millions of Euros | | |
| | | Profit attributable to Non-Controlling Interests | | | | 2013 | | 2012 | | 2011 | | |
| | | | | | | | | |
| | | BBVA Colombia Group | | | | 13 | | 13 | | 9 | | |
| | | BBVA Chile Group | | | | 83 | | 100 | | 95 | | |
| | | BBVA Banco Continental Group | | | | 268 | | 209 | | 165 | | |
| | | BBVA Banco Provincial Group | | | | 295 | | 265 | | 163 | | |
| | | BBVA Banco Francés Group | | | | 64 | | 58 | | 44 | | |
| | | Other companies | | | | 30 | | 6 | | 5 | | |
| | | Total | | | | 753 | | 651 | | 481 | | |
| | | | | | | | | | | | | |
Dividends distributed to non-controlling interests of the Group during 2013 are: BBVA Chile€123 million, BBVA Banco Continental€182 million, and BBVA Banco Provincial€157 million.
F-152
33. Capital base and capital management
Capital base
Bank of Spain Circular 3/2008, of May 22, 2008, and its subsequent amendments on the calculation and control of minimum capital base requirements (“Circular 3/2008”), regulate the minimum capital base requirements for Spanish credit institutions –both as individual entities and as consolidated groups– and how to calculate them, as well as the various internal capital adequacy assessment processes they should have in place and the information they should disclose to the market.
The minimum capital base requirements established by Circular 3/2008 are calculated according to the Group’s exposure to credit and dilution risk, counterparty and liquidity risk relating to the trading portfolio, exchange-rate risk and operational risk. In addition, the Group must fulfill the risk concentration limits established in said Circular and the internal Corporate Governance obligations.
Circular 3/2008 implements Spanish regulations on capital base and consolidated supervision of financial institutions, as well as adapting Spanish law to the relevant European Union Capital Requirements Directives (CRD), in compliance with the accords by the Committee on Banking Supervision of the Bank for International Settlements in Basel.
Within the framework of recommendations, in December 2010 the Committee on Banking Supervision published “Basel III: A global regulatory framework for more resilient banks and banking systems”, to assist the financial sector when coping with the effects of financial or economic crises. The European Union worked from this point forward to incorporate the Basel recommendations to a new capital regulation, and after two years of negotiations, “CRD4” was published in the European Union Official Bulletin on June 27, 2013, This regulation replaces 2006/48 and 2006/49 (CRD2 and CRD3) Capital and common regulation (575/2013). This regulation came into effect on January 1, 2014. From this date onwards, any regulation that rules against the European directive will not be effective. To this extent, the Royal Decree-Law 14/2013 was published to adapt Spanish Law to European Union regulation on supervision and solvency of financial institutions.
The BBVA Group is ready to comply with the significant modifications in the capital regulatory framework for financial entities (BIS III according to CRD4), such as those envisioned to affect insurance entities (“Solvency II”), therefore meeting the new and more demanding requirements, showing greater solvency and stability.
As of December 31, 2013, nevertheless, Circular 3/2008 was still the current regulation in place and the Bank’s capital exceeded by more than 68% the minimum capital base level required by said regulation.
F-153
The Group’s bank capital in accordance with the aforementioned Circular 3/2008, considering entities scope required by the above regulation, as of December 31, 2013, 2012 and 2011 is shown below:
| | | | | | | | | | | | |
| | | | | | | | | | | | | |
| | | | | | | Millions of Euros | | |
| | | Capital Base | | | | 2013 (*) | | 2012 | | 2011 | | |
| | | | | | | | |
| | Basic equity | | | | 38,730 | | 36,393 | | 35,508 | |
| | | Common Stock | | | | 2,835 | | 2,670 | | 2,403 | | |
| | | Parent company reserves | | | | 41,371 | | 38,149 | | 33,656 | | |
| | | Reserves in consolidated companies | | | | (3,380) | | 1,042 | | 1,552 | | |
| | | Non-controlling interests | | | | 2,069 | | 2,025 | | 1,669 | | |
| | | Other equity instruments | | | | 2,905 | | 3,074 | | 5,189 | | |
| | | Deductions (Goodwill and others) | | | | (8,534) | | (10,903) | | (10,837) | | |
| | | Attributed net income (less dividends) | | | | 1,464 | | 335 | | 1,876 | | |
| | | Additional equity | | | | 4,515 | | 4,461 | | 5,944 | | |
| | | Other deductions | | | | (1,573) | | (5,272) | | (5,303) | | |
| | | Additional equity due to mixed group (**) | | | | 1,857 | | 1,275 | | 1,070 | | |
| | | Total Equity | | | | 43,529 | | 36,858 | | 37,218 | | |
| | | | | | | | | | | | | |
| | | Minimum equity required | | | | 25,888 | | 26,353 | | 26,563 | | |
| | | | | | | | | | | | | |
(*) Provisional data. | | |
(**) Mainly insurance companies in the Group. | | |
The changes in 2013 in basic capital balances shown in the above table are a result of the earnings for the period and the decrease in deductions (mainly CNCB Goodwill), partially offset by the negative impact of exchange rate differences. The decrease in “Other deductions” is mainly driven by the decrease in value of participations that are deducted (also affected by the sale of the CNCB participation).
In addition to that established in Circular 3/2008, Spanish financial groups and entities must comply with the capital requirements set forth by Royal Decree-Law 24/2012 of August 31 to reinforce the Spanish financial system. This standard was issued for the purpose of reinforcing the solvency of the Spanish financial entities. It thus established a new minimum requirement in terms of core capital on risk-weighted assets which is more restrictive than the one set out in the aforementioned Circular, and that must be greater than 9%. As of December 31, 2013, the BBVA Group’s ratio exceeded the corresponding minimum requirement by approximately€7,000 million and stood at 11,16% (provisional figure).
As of December 31, 2013 the BBVA Group also complied with the recommendations made by the EBA about minimum capital levels calculated based on June 2012 requirements, keeping an excess of€2,886 million over the required limit.
Capital management
Capital management in the BBVA Group has a twofold aim:
| — | | Maintain a level of capitalization according to the business objectives in all countries in which it operates and, simultaneously, |
| — | | Maximize the return on shareholders’ funds through the efficient allocation of capital to the different units, a good management of the balance sheet and appropriate use of the various instruments forming the basis of the Group’s equity: shares, preferred securities and subordinate debt; |
this capital management is carried out in accordance with the criteria of the Bank of Spain Circular 3/2008 and subsequent amendments both in terms of determining the capital base and the solvency ratios. Prudential and minimum capital requirements also have to be met for the subsidiaries subject to prudential supervision in other countries.
The current regulation allows each entity to apply its own internal ratings-based (IRB) approach to risk assessment and capital management, subject to Bank of Spain approval. The BBVA Group carries out an integrated management of these risks in accordance with its internal policies (see Note 7) and its internal capital estimation model has received the Bank of Spain’s approval for certain portfolios.
F-154
34. Contingent risks and commitments
The breakdown of the balance under these headings in the accompanying consolidated balance sheets is as follows:
| | | | | | | | | | | | |
| | | | | | | | | | | | | |
| | | | | | | Millions of Euros | | |
| | | Contingent Risks and Commitments | | | | 2013 | | 2012 | | 2011 | | |
| | | | | | | | |
| | | Contingent Risks | | | | | | | | | | |
| | | Collateral, bank guarantees and indemnities | | | | 28,082 | | 29,976 | | 29,532 | | |
| | | Rediscounts, endorsements and acceptances | | | | 39 | | 36 | | 35 | | |
| | | Letter of credit and others | | | | 5,422 | | 7,007 | | 8,062 | | |
| | | Total Contingent Risks | | | | 33,543 | | 37,019 | | 37,629 | | |
| | | Contingent Liabilities | | | | | | | | | | |
| | | Balances drawable by third parties: | | | | 87,542 | | 83,519 | | 86,375 | | |
| | | Credit Institutions | | | | 1,583 | | 1,946 | | 2,417 | | |
| | | Government and other government agency | | | | 4,354 | | 1,360 | | 3,143 | | |
| | | Other resident sectors | | | | 20,713 | | 21,982 | | 24,119 | | |
| | | Non-resident sector | | | | 60,892 | | 58,231 | | 56,696 | | |
| | | Other contingent liabilities | | | | 6,628 | | 6,623 | | 4,313 | | |
| | | Total Contingent liabilities | | | | 94,170 | | 90,142 | | 90,688 | | |
| | | | | | | | | | | | | |
| | | Total contingent risks and contingent liabilities | | | | 127,713 | | 127,161 | | 128,317 | | |
| | | | | | | | | | | | | |
Since a significant portion of the amounts above will expire without any payment obligation materializing for the consolidated entities, the aggregate balance of these commitments cannot be considered as an actual future requirement for financing or liquidity to be provided by the BBVA Group to third parties.
In 2013, 2012 and 2011 no issuance of debt securities carried out by associate entities of the BBVA Group, joint venture entities or non-Group entities have been guaranteed.
35. Assets assigned to other own and third-party obligations
As of December 31, 2013, 2012 and 2011, in addition to the information disclosed in Notes 13 and 26, there were certain material assets of consolidated entities that guaranteed their own obligations amounting to€86,058 million,€125,174 million and€101,108 million, respectively. These amounts mainly correspond to loans linked to the issue of long-term covered bonds (see Note 23.3) which, pursuant to the Mortgage Market Act, are admitted as collateral for the issue of covered bonds and to assets allocated as collateral for certain lines of short-term finance assigned to the BBVA Group by central banks.
As of December 31, 2013, 2012 and 2011, there were no other BBVA Group material assets linked to any third-party obligations.
36. Other contingent assets and liabilities
As of December 31, 2013, 2012 and 2011, there were no material contingent assets or liabilities other than those disclosed in the accompanying notes to the financial statements.
F-155
37. Purchase and sale commitments and future payment obligations
The breakdown of purchase and sale commitments of the BBVA Group as of December 31, 2013, 2012 and 2011 is as follows:
| | | | | | | | | | | | |
| | | | | | | | | | | | | |
| | | | | | | | | Millions of Euros | | |
| | | Purchase and Sale Commitments | | Notes | | 2013 | | 2012 | | 2011 | | |
| | | | | | | | |
| | | | | | | |
| | | Financial instruments sold with repurchase commitments | | | | 55,503 | | 56,196 | | 75,897 | | |
| | | Central Banks | | 9 | | 5,636 | | 5,614 | | 8,961 | | |
| | | Credit Institutions | | 23.1 | | 22,007 | | 21,533 | | 22,957 | | |
| | | Government and other government agencies | | 23.2 | | 8,512 | | 16,607 | | 24,016 | | |
| | | Other resident sectors | | 23.2 | | 11,608 | | 8,443 | | 14,154 | | |
| | | Non-resident sectors | | 23.2 | | 7,740 | | 3,999 | | 5,809 | | |
| | | | | | | |
| | | Financial instruments purchased with resale commitments | | | | 11,397 | | 10,378 | | 11,110 | | |
| | | Central Banks | | 9 | | 120 | | 476 | | 495 | | |
| | | Credit Institutions | | 13.1 | | 6,828 | | 6,783 | | 5,788 | | |
| | | Government and other government agencies | | 13.2 | | - | | - | | - | | |
| | | Other resident sectors | | 13.2 | | 4,039 | | 2,516 | | 4,621 | | |
| | | Non-resident sectors | | 13.2 | | 410 | | 602 | | 206 | | |
| | | | | | | | | | | | | |
A breakdown of the maturity of other payment obligations, not registered in previous notes, due later than December 31, 2013 is provided below:
| | | | | | | | | | | | | | |
| | | | | | | | | | | | | | | |
| | | | | Millions of Euros | | |
| | | Maturity of Future Payment Obligations | | Up to 1 Year | | 1 to 3 Years | | 3 to 5 Years | | Over 5 Years | | Total | | |
| | | Finance leases | | - | | - | | - | | - | | - | | |
| | | Operating leases | | 264 | | 397 | | 270 | | 2,530 | | 3,462 | | |
| | | Purchase commitments | | 39 | | - | | - | | - | | 39 | | |
| | | Technology and systems projects | | 24 | | - | | - | | - | | 24 | | |
| | | Other projects | | 15 | | | | | | | | 15 | | |
| | | Total | | 303 | | 397 | | 270 | | 2,530 | | 3,501 | | |
| | | | | | | | | | | | | | | |
38. Transactions on behalf of third parties
As of December 31, 2013, 2012 and 2011 the details of the most significant items under this heading are as follows:
| | | | | | | | | | | | |
| | | | | | | | | | | | | |
| | | | | | | Millions of Euros | | |
| | | Transactions on Behalf of Third Parties | | | | 2013 | | 2012 | | 2011 | | |
| | | | | | | | | |
| | | Financial instruments entrusted by third parties | | | | 560,640 | | 502,047 | | 537,404 | | |
| | | Conditional bills and other securities received for collection | | | | 3,505 | | 3,951 | | 4,285 | | |
| | | Securities received in credit | | | | 3,844 | | 5,915 | | 2,231 | | |
| | | | | | | | | | | | | |
F-156
As of December 31, 2013, 2012 and 2011 the off-balance sheet customer funds managed by the BBVA Group are as follows:
| | | | | | | | | | | | |
| | | | | | | Millions of Euros |
| | | Off-Balance Sheet Customer Funds by Type | | | | 2013 | | 2012 | | 2011 | | |
| | | | | | | | |
| | | Commercialized by the Group | | | | | | | | | | |
| | | Investment companies and mutual funds | | | | 43,600 | | 40,118 | | 43,134 | | |
| | | Pension funds | | | | 21,074 | | 84,500 | | 73,783 | | |
| | | Customer portfolios managed on a discretionary basis | | | | 31,073 | | 28,138 | | 26,349 | | |
| | | Of which: | | | | | | | | | | |
| | | Portfolios managed on a discretionary | | | | 7,038 | | 11,998 | | 11,179 | | |
| | | Commercialized by the Group managed by third parties outside the Group | | | | | | | | | | |
| | | Investment companies and mutual funds | | | | 127 | | 70 | | 50 | | |
| | | Pension funds | | | | 30 | | 29 | | 17 | | |
| | | Saving insurance contracts | | | | - | | - | | - | | |
| | | Total | | | | 95,904 | | 152,855 | | 143,333 | | |
| | | | | | | | | | | | | |
39. Interest income and expense and similar items
39.1 Interest and similar income
The breakdown of the interest and similar income recognized in the accompanying consolidated income statement is as follows:
| | | | | | | | | | | | |
| | | | | | | Millions of Euros |
| | | Interest and Similar Income. Breakdown by Origin. | | | | 2013 | | 2012 | | 2011 | | |
| | | | | | | | |
| | | Central Banks | | | | 262 | | 259 | | 250 | | |
| | | Loans and advances to credit institutions | | | | 356 | | 382 | | 501 | | |
| | | Loans and advances to customers | | | | 18,092 | | 19,247 | | 18,001 | | |
| | | Government and other government agency | | | | 842 | | 901 | | 767 | | |
| | | Resident sector | | | | 4,491 | | 5,784 | | 6,069 | | |
| | | Non resident sector | | | | 12,758 | | 12,562 | | 11,165 | | |
| | | Debt securities | | | | 3,465 | | 3,651 | | 3,144 | | |
| | | Held for trading | | | | 980 | | 1,225 | | 1,087 | | |
| | | Available-for-sale financial assets and held-to-maturity investments | | | | 2,484 | | 2,426 | | 2,057 | | |
| | | Rectification of income as a result of hedging transactions | | | | (292) | | (369) | | (198) | | |
| | | Insurance activity | | | | 1,137 | | 1,049 | | 991 | | |
| | | Other income | | | | 492 | | 596 | | 540 | | |
| | | Total | | | | 23,512 | | 24,815 | | 23,229 | | |
| | | | | | | | | | | | | |
The amounts recognized in consolidated equity in connection with hedging derivatives and the amounts derecognized from consolidated equity and taken to the consolidated income statement during these periods are given in the accompanying “Consolidated statements of recognized income and expenses.
F-157
The following table shows the adjustments in income resulting from hedge accounting, broken down by type of hedge:
| | | | | | | | | | | | |
| | | | | | | Millions of Euros | | |
| | | Adjustments in Income Resulting from Hedge Accounting | | | | 2013 | | 2012 | | 2011 | | |
| | | | | | | | | |
| | | Cash flow hedging | | | | 51 | | 52 | | 62 | | |
| | | Fair value hedging | | | | (343) | | (421) | | (260) | | |
| | | Total | | | | (292) | | (369) | | (198) | | |
| | | | | | | | | | | | | |
39.2 Interest and similar expenses
The breakdown of the balance under this heading in the accompanying consolidated income statements is as follows:
| | | | | | | | | | | | |
| | | | | | | Millions of Euros |
| | | Interest and Similar Expenses. Breakdown by Origin | | | | 2013 | | 2012 | | 2011 | | |
| | | | | | | | |
| | | Bank of Spain and other central banks | | | | 161 | | 350 | | 164 | | |
| | | Deposits from credit institutions | | | | 1,165 | | 1,499 | | 1,357 | | |
| | | Customers deposits | | | | 4,516 | | 4,644 | | 5,127 | | |
| | | Debt certificates | | | | 3,067 | | 3,008 | | 2,836 | | |
| | | Subordinated liabilities | | | | 516 | | 668 | | 689 | | |
| | | Rectification of expenses as a result of hedging transactions | | | | (1,182) | | (1,180) | | (1,025) | | |
| | | Cost attributable to pension funds (Note 26) | | | | 199 | | 256 | | 259 | | |
| | | Insurance activity | | | | 855 | | 742 | | 694 | | |
| | | Other charges | | | | 315 | | 354 | | 404 | | |
| | | Total | | | | 9,612 | | 10,341 | | 10,505 | | |
| | | | | | | | | | | | | |
The following table shows the adjustments in expenses resulting from hedge accounting, broken down by type of hedge:
| | | | | | | | | | | | |
| | | | | | | Millions of Euros | | |
| | | Adjustments in Expenses Resulting from Hedge Accounting | | | | 2013 | | 2012 | | 2011 | | |
| | | | | | | | |
| | | Cash flow hedging | | | | 1 | | 9 | | - | | |
| | | Fair value hedging | | | | (1,183) | | (1,189) | | (1,025) | | |
| | | Total | | | | (1,182) | | (1,180) | | (1,025) | | |
| | | | | | | | | | | | | |
39.3 Average return on investments and average borrowing cost
The detail of the average return on investments in the year ended December 31, 2013, 2012 and 2011 is as follows:
| | | | | | | | | | | | | | | | | | | | | | | | |
| | | | | | | Millions of Euros | | |
| | | | | | | 2013 | | 2012 | | 2011 | | |
| | | Asset | | | | Average
Balances | | Interest and
Similar
Income | | Average
Interest
Rates (%) | | Average
Balances | | Interest and
Similar
Income | | Average
Interest
Rates (%) | | Average
Balances | | Interest and
Similar
Income | | Average
Interest
Rates��(%) | | |
| | | Cash and balances with central banks | | | | 26,463 | | 262 | | 0.99 | | 24,574 | | 259 | | 1.05 | | 19,991 | | 250 | | 1.25 | | |
| | | Securities portfolio and derivatives | | | | 166,013 | | 4,385 | | 2.64 | | 164,435 | | 4,414 | | 2.68 | | 139,644 | | 3,969 | | 2.84 | | |
| | | Loans and advances to credit institutions | | | | 25,998 | | 411 | | 1.58 | | 25,122 | | 442 | | 1.76 | | 25,209 | | 606 | | 2.40 | | |
| | | Loans and advances to customers | | | | 335,248 | | 18,325 | | 5.47 | | 347,336 | | 19,497 | | 5.61 | | 334,898 | | 18,190 | | 5.43 | | |
| | | Euros | | | | 204,124 | | 5,835 | | 2.86 | | 217,533 | | 7,267 | | 3.34 | | 219,864 | | 7,479 | | 3.40 | | |
| | | Foreign currency | | | | 131,125 | | 12,489 | | 9.52 | | 129,802 | | 12,230 | | 9.42 | | 115,034 | | 10,712 | | 9.31 | | |
| | | Other assets | | | | 45,982 | | 128 | | 0.28 | | 46,613 | | 203 | | 0.44 | | 37,074 | | 214 | | 0.58 | | |
| | | Totals | | | | 599,705 | | 23,512 | | 3.92 | | 608,081 | | 24,815 | | 4.08 | | 556,816 | | 23,229 | | 4.17 | | |
| | | | | | | | | | | | | | | | | | | | | | | | | |
F-158
The average borrowing cost in the year ended December 31, 2013, 2012 and 2011 is as follows:
| | | | | | | | | | | | | | | | | | | | | | | | |
| | | | | | | Millions of Euros | | |
| | | | | | | 2013 | | 2012 | | 2011 | | |
| | | Liabilities | | | | Average Balances | | Interest and Similar Expenses | | Average Interest Rates (%) | | Average Balances | | Interest and Similar Expenses | | Average Interest Rates (%) | | Average Balances | | Interest and Similar Expenses | | Average Interest Rates (%) | | |
| | | Deposits from central banks and credit institutions | | | | 86,600 | | 1,551 | | 1.79 | | 104,231 | | 2,089 | | 2.00 | | 74,027 | | 1,881 | | 2.54 | | |
| | | Customer deposits | | | | 290,105 | | 4,366 | | 1.51 | | 271,828 | | 4,531 | | 1.67 | | 269,842 | | 5,176 | | 1.92 | | |
| | | Euros | | | | 153,634 | | 1,734 | | 1.13 | | 146,996 | | 1,828 | | 1.24 | | 153,773 | | 2,295 | | 1.49 | | |
| | | Foreign currency | | | | 136,470 | | 2,632 | | 1.93 | | 124,832 | | 2,703 | | 2.16 | | 116,069 | | 2,881 | | 2.48 | | |
| | | Debt certificates and subordinated liabilities | | | | 94,130 | | 2,812 | | 2.99 | | 102,563 | | 2,783 | | 2.71 | | 108,735 | | 2,590 | | 2.38 | | |
| | | Other finance expenses | | | | - | | - | | - | | - | | - | | - | | - | | - | | - | | |
| | | Other liabilities | | | | 82,257 | | 883 | | 1.07 | | 86,627 | | 938 | | 1.08 | | 65,515 | | 858 | | 1.31 | | |
| | | Equity | | | | 46,614 | | - | | - | | 42,832 | | - | | - | | 38,696 | | - | | - | | |
| | | Totals | | | | 599,705 | | 9,612 | | 1.60 | | 608,081 | | 10,341 | | 1.70 | | 556,816 | | 10,505 | | 1.89 | | |
| | | | | | | | | | | | | | | | | | | | | | | | | |
The change in the balance under the headings “Interest and similar income” and “Interest and similar expenses” in the accompanying consolidated income statements is the result of changing prices (price effect) and changing volume of activity (volume effect), as can be seen below:
| | | | | | | | | | | | | | | | | | |
| | | | | | | Millions of Euros | | |
| | | | | | | 2013 / 2012 | | 2012/ 2011 | | |
| | | Interest Income and Expense and Similar
Items. Change in the Balance | | | | Volume Effect
(1) | | Price Effect
(2) | | Total
Effect | | Volume Effect
(1) | | Price Effect
(2) | | Total
Effect | | |
| | | Cash and balances with central banks | | | | 20 | | (16) | | 4 | | 57 | | (48) | | 9 | | |
| | | Securities portfolio and derivatives | | | | 42 | | (71) | | (29) | | 705 | | (260) | | 445 | | |
| | | Loans and advances to credit institutions | | | | 15 | | (46) | | (31) | | (2) | | (162) | | (164) | | |
| | | Loans and advances to customers | | | | (679) | | (494) | | (1,173) | | 676 | | 631 | | 1,307 | | |
| | | In Euros | | | | (448) | | (984) | | (1,432) | | (79) | | (133) | | (212) | | |
| | | In other currencies | | | | 125 | | 135 | | 259 | | 1,375 | | 143 | | 1,519 | | |
| | | Other assets | | | | (3) | | (72) | | (75) | | 55 | | (66) | | (11) | | |
| | | Interest and similar incomes | | | | (342) | | (961) | | (1,303) | | 2,139 | | (552) | | 1,586 | | |
| | | Deposits from central banks and credit institutions | | | | (353) | | (185) | | (538) | | 768 | | (560) | | 208 | | |
| | | Customer deposits | | | | 305 | | (469) | | (164) | | 38 | | (683) | | (645) | | |
| | | In Euros | | | | 83 | | (176) | | (94) | | (101) | | (366) | | (467) | | |
| | | In other currencies | | | | 252 | | (323) | | (71) | | 217 | | (396) | | (178) | | |
| | | Debt certificates and subordinated liabilities | | | | (229) | | 257 | | 28 | | (147) | | 341 | | 194 | | |
| | | Other liabilities | | | | (47) | | (7) | | (55) | | 277 | | (197) | | 79 | | |
| | | Interest and similar expenses | | | | (142) | | (586) | | (729) | | 967 | | (1,131) | | (164) | | |
| | | Net Interest Income | | | | | | | | (575) | | | | | | 1,750 | | |
| | | | | | | | | | | | | | | | | | | |
| | |
(1) | | The volume effect is calculated as the result of the interest rate of the initial period multiplied by the difference between the average balances of both periods. |
(2) | | The price effect is calculated as the result of the average balance of the last period multiplied by the difference between the interest rates of both periods. |
40. Income from equity instruments
The balances for this heading in the accompanying consolidated income statements correspond to dividends on shares and equity instruments other than those from shares in entities accounted for using the equity method (see Note 41), as can be seen in the breakdown below:
| | | | | | | | | | | | |
| | | | | | | Millions of Euros | | |
| | | Dividend Income | | | | 2013 | | 2012 | | 2011 | | |
| | | | | | | | |
| | | Dividends from: | | | | | | | | | | |
| | | Financial assets held for trading | | | | 72 | | 106 | | 119 | | |
| | | Available-for-sale financial assets | | | | 163 | | 284 | | 443 | | |
| | | Total | | | | 235 | | 390 | | 562 | | |
| | | | | | | | | | | | | |
F-159
41. Share of profit or loss of entities accounted for using the equity method
The breakdown of the share of profit or loss of entities accounted for using the equity method in the accompanying consolidated income statements is as follows:
| | | | | | | | | | | | |
| | | | | | | Millions of Euros | | |
| | | Investments in Entities Accounted for Using the Equity Method | | | | 2013 | | 2012 | | 2011 | | |
| | | | | | | | |
| | | CITIC Group (*) | | | | 430 | | 726 | | 602 | | |
| | | Garanti Group | | | | 265 | | 312 | | 192 | | |
| | | Metrovacesa, S.A. | | | | (32) | | (31) | | - | | |
| | | Corporación IBV Participaciones Empresariales, S.A. (**) | | | | - | | 5 | | 6 | | |
| | | Las Pedrazas Golf, S.L | | | | (8) | | (5) | | (3) | | |
| | | Rest | | | | 39 | | 32 | | (10) | | |
| | | Total | | | | 694 | | 1,039 | | 787 | | |
| | | | | | | | | | | | | |
| | |
(*) | | As of December 31, 2013 this investment includes profit and loss of CIFH and CNCB up to the moment of sale and reclassification. For the years ended December 31, 2012 and 2011, it includes the profit and loss of CIFH and CNCB. |
(**) | | As of December 31, 2013, the investment is recorded as non-current assets held for sale and liabilities associated with non-current assets held for sale. |
F-160
42. Fee and commission income
The breakdown of the balance under this heading in the accompanying consolidated income statements is as follows:
| | | | | | | | | | | | |
| | | | | | | Millions of Euros | | |
| | | Fee and Commission Income | | | | 2013 | | 2012 | | 2011 | | |
| | | | | | | | |
| | | Commitment fees | | | | 190 | | 186 | | 157 | | |
| | | Contingent risks | | | | 316 | | 334 | | 302 | | |
| | | Letters of credit | | | | 50 | | 56 | | 51 | | |
| | | Bank and other guarantees | | | | 266 | | 278 | | 251 | | |
| | | Arising from exchange of foreign currencies and banknotes | | | | 23 | | 24 | | 25 | | |
| | | Collection and payment services income | | | | 3,095 | | 2,881 | | 2,560 | | |
| | | Bills receivables | | | | 68 | | 77 | | 66 | | |
| | | Current accounts | | | | 349 | | 381 | | 348 | | |
| | | Credit and debit cards | | | | 1,989 | | 1,756 | | 1,518 | | |
| | | Checks | | | | 237 | | 222 | | 228 | | |
| | | Transfers and others payment orders | | | | 329 | | 313 | | 276 | | |
| | | Rest | | | | 123 | | 132 | | 124 | | |
| | | Securities services income | | | | 1,142 | | 1,120 | | 1,079 | | |
| | | Securities underwriting | | | | 74 | | 100 | | 70 | | |
| | | Securities dealing | | | | 205 | | 194 | | 192 | | |
| | | Custody securities | | | | 323 | | 328 | | 329 | | |
| | | Investment and pension funds | | | | 413 | | 375 | | 372 | | |
| | | Rest assets management | | | | 127 | | 123 | | 116 | | |
| | | Counseling on and management of one-off transactions | | | | 14 | | 7 | | 12 | | |
| | | Financial and similar counseling services | | | | 45 | | 41 | | 56 | | |
| | | Factoring transactions | | | | 37 | | 38 | | 33 | | |
| | | Non-banking financial products sales | | | | 109 | | 97 | | 90 | | |
| | | Other fees and commissions | | | | 507 | | 562 | | 560 | | |
| | | Total | | | | 5,478 | | 5,290 | | 4,874 | | |
| | | | | | | | | | | | | |
43. Fee and commission expenses
The breakdown of the balance under this heading in the accompanying consolidated income statements is as follows:
| | | | | | | | | | | | |
| | | | | | | Millions of Euros |
| | | Fee and Commission Expenses | | | | 2013 | | 2012 | | 2011 | | |
| | | | | | | | |
| | | Brokerage fees on lending and deposit transactions | | | | 1 | | 3 | | 4 | | |
| | | Fees and commissions assigned to third parties | | | | 894 | | 817 | | 682 | | |
| | | Credit and debit cards | | | | 762 | | 685 | | 554 | | |
| | | Transfers and others payment orders | | | | 49 | | 42 | | 31 | | |
| | | Securities dealing | | | | 5 | | 11 | | 14 | | |
| | | Rest | | | | 78 | | 79 | | 83 | | |
| | | Other fees and commissions | | | | 333 | | 314 | | 294 | | |
| | | Total | | | | 1,228 | | 1,134 | | 980 | | |
| | | | | | | | | | | | | |
F-161
44. Net gains (losses) on financial assets and liabilities (net)
The breakdown of the balance under this heading, by source of the related items, in the accompanying consolidated income statements is as follows:
| | | | | | | | | | | | |
| | | | | | | Millions of Euros | | |
| | | Gains (Losses) on Financial Assets and Liabilities Breakdown by Heading of the Balance Sheet | | | | 2013 | | 2012 | | 2011 | | |
| | | Financial assets held for trading | | | | 540 | | 653 | | 1,004 | | |
| | | Other financial assets designated at fair value through profit or loss | | | | 49 | | 69 | | 17 | | |
| | | Other financial instruments not designated at fair value through profit or loss | | | | 1,019 | | 914 | | 50 | | |
| | | Available-for-sale financial assets | | | | 1,046 | | 801 | | 80 | | |
| | | Loans and receivables | | | | 126 | | 51 | | 27 | | |
| | | Rest | | | | (153) | | 62 | | (57) | | |
| | | Total | | | | 1,608 | | 1,636 | | 1,070 | | |
| | | | | | | | | | | | | |
The breakdown of the balance under this heading in the accompanying income statements by the nature of financial instruments is as follows:
| | | | | | | | | | | | |
| | | | | | | Millions of Euros | | |
| | | Gains (Losses) on Financial Assets and Liabilities Breakdown by Nature of the Financial Instrument | | | | 2013 | | 2012 | | 2011 | | |
| | | Debt instruments | | | | 1,167 | | 1,101 | | 452 | | |
| | | Equity instruments | | | | 883 | | (51) | | (326) | | |
| | | Loans and advances to customers | | | | 46 | | 38 | | 31 | | |
| | | Derivatives | | | | (444) | | 591 | | 839 | | |
| | | Customer deposits | | | | 13 | | 30 | | 4 | | |
| | | Rest | | | | (56) | | (73) | | 70 | | |
| | | Total | | | | 1,608 | | 1,636 | | 1,070 | | |
| | | | | | | | | | | | | |
The breakdown of the balance of the impact of the derivatives (trading and hedging) under this heading in the accompanying consolidated income statements is as follows:
| | | | | | | | | | | | |
| | | | | | | Millions of Euros | | |
| | | Derivatives Trading and Hedging | | | | 2013 | | 2012 | | 2011 | | |
| | | | | | | | |
| | | Trading derivatives | | | | | | | | | | |
| | | Interest rate agreements | | | | 139 | | 473 | | (195) | | |
| | | Security agreements | | | | (596) | | (63) | | 827 | | |
| | | Commodity agreements | | | | (1) | | (12) | | 42 | | |
| | | Credit derivative agreements | | | | (59) | | (47) | | (15) | | |
| | | Foreign-exchange agreements | | | | 122 | | 66 | | 256 | | |
| | | Other agreements | | | | 31 | | 7 | | 4 | | |
| | | Subtotal | | | | (364) | | 424 | | 919 | | |
| | | Hedging Derivatives Ineffectiveness | | | | | | | | | | |
| | | Fair value hedging | | | | (98) | | 167 | | (31) | | |
| | | Hedging derivative | | | | (877) | | (464) | | (111) | | |
| | | Hedged item | | | | 779 | | 631 | | 80 | | |
| | | Cash flow hedging | | | | 18 | | - | | (49) | | |
| | | Subtotal | | | | (80) | | 167 | | (80) | | |
| | | Total | | | | (444) | | 591 | | 839 | | |
| | | | | | | | | | | | | |
F-162
In addition, in 2013, 2012 and 2011, under the heading “Exchange differences (net)” of the income statement, net amounts of positive€137 million, positive€373 million and positive€5 million, respectively, were recognized for transactions with foreign exchange trading derivatives.
45. Other operating income and expenses
The breakdown of the balance under the heading “Other operating income” in the accompanying consolidated income statements is as follows:
| | | | | | | | | | | | |
| | | | | | | | | |
| | | | | | Millions of Euros | |
| | Other Operating Income | | 2013 | | 2012 | | 2011 | |
| | Income on insurance and reinsurance contracts | | | | 3,761 | | 3,631 | | 3,299 | |
| | Financial income from non-financial services | | | | 851 | | 807 | | 643 | |
| | Of Which: Real estate companies | | | | 445 | | 278 | | 177 | |
| | Rest of other operating income | | | | 383 | | 327 | | 270 | |
| | Of Which: from rented buildings | | | | 73 | | 57 | | 52 | |
| | Total | | | | 4,995 | | 4,765 | | 4,212 | |
| | | | | | | | | | | | | |
The breakdown of the balance under the heading “Other operating expenses” in the accompanying consolidated income statements is as follows:
| | | | | | | | | | | | |
| | | | | | | | | |
| | | | | | Millions of Euros | |
| | Other Operating Expenses | | 2013 | | 2012 | | 2011 | |
| | Expenses on insurance and reinsurance contracts | | | | 2,831 | | 2,646 | | 2,425 | |
| | Change in inventories | | | | 495 | | 406 | | 298 | |
| | Of Which: Real estate companies | | | | 428 | | 267 | | 161 | |
| | Rest of other operating expenses | | | | 2,301 | | 1,653 | | 1,296 | |
| | Of Which: Contributions to guaranteed banks deposits funds | | | | 815 | | 668 | | 460 | |
| | Total | | | | 5,627 | | 4,705 | | 4,019 | |
| | | | | | | | | | | | | |
| | |
(*) Includes for 2013 a special contribution to the Deposit Guarantee Fund established by Royal Decree-Law 6/2013. |
46. Administration costs
46.1 Personnel expenses
The breakdown of the balance under this heading in the accompanying consolidated income statements is as follows:
| | | | | | | | | | | | |
| | | | | | | | | | | | | |
| | | | | | Millions of Euros | |
| | Personnel Expenses | | Notes | | 2013 | | 2012 | | 2011 | |
| | Wages and salaries | | | | 4,232 | | 4,192 | | 3,911 | |
| | Social security costs | | | | 693 | | 657 | | 600 | |
| | Transfers to internal pension provisions | | 26.2 | | 70 | | 54 | | 51 | |
| | Contributions to external pension funds | | 26.1 | | 80 | | 84 | | 80 | |
| | Other personnel expenses | | | | 513 | | 480 | | 411 | |
| | Total | | | | 5,588 | | 5,467 | | 5,053 | |
| | | | | | | | | | | | |
F-163
The breakdown of the average number of employees in the BBVA Group in the year ended December 31, 2013, 2012 and 2011, by professional categories and geographical areas, is as follows:
| | | | | | | | | | | | |
| | | | | | | | | | | | | |
| | | | | | Average number of employees | | |
| | Average Number of Employees by Geographical Areas | | 2013 | | 2012 | | 2011 | | |
| | Spanish banks | | | | | | | | | | |
| | Executive managers | | | | 1,127 | | 1,129 | | 1,115 | | |
| | Other line personnel | | | | 22,375 | | 21,970 | | 21,103 | | |
| | Clerical staff | | | | 4,474 | | 4,267 | | 4,364 | | |
| | Branches abroad | | | | 794 | | 886 | | 846 | | |
| | Subtotal | | | | 28,770 | | 28,252 | | 27,428 | | |
| | Companies abroad | | | | | | | | | | |
| | Mexico | | | | 28,309 | | 28,187 | | 27,108 | | |
| | United States | | | | 10,689 | | 11,070 | | 11,361 | | |
| | Venezuela | | | | 5,292 | | 5,384 | | 5,418 | | |
| | Argentina | | | | 5,229 | | 5,147 | | 4,844 | | |
| | Colombia | | | | 5,033 | | 4,679 | | 4,439 | | |
| | Peru | | | | 5,171 | | 4,851 | | 4,675 | | |
| | Other | | | | 5,056 | | 5,777 | | 5,620 | | |
| | Subtotal | | | | 64,779 | | 65,095 | | 63,465 | | |
| | Pension fund managers | | | | 2,181 | | 5,505 | | 5,255 | | |
| | Other non-banking companies | | | | 16,859 | | 15,072 | | 13,546 | | |
| | Total | | | | 112,589 | | 113,924 | | 109,694 | | |
| | | | | | | | | | | | | |
The breakdown of the number of employees in the BBVA Group as of December 31, 2013, 2012 and 2011, by category and gender, is as follows:
| | | | | | | | | | | | | | | | |
| | | | | | | | | | | | | | | | | |
| | Number of Employees at the period end
Professional Category and Gender | | 2013 | | | | 2012 | | | | 2011 | | �� | | |
| | | Male | | Female | | Male | | Female | | Male | | Female | | |
| | Executive managers | | 1,675 | | 363 | | 1,708 | | 355 | | 1,723 | | 361 | | |
| | Other line personnel | | 24,375 | | 21,828 | | 25,733 | | 23,218 | | 24,891 | | 21,920 | | |
| | Clerical staff | | 25,812 | | 35,252 | | 27,311 | | 37,527 | | 26,346 | | 35,404 | | |
| | Total | | 51,862 | | 57,443 | | 54,752 | | 61,100 | | 52,960 | | 57,685 | | |
| | | | | | | | | | | | | | | | | |
The breakdown of the average number of employees in the BBVA Group in the year ended December 31, 2013, 2012 and 2011 is as follows:
| | | | | | | | | | | | | | | | |
| | | | | | | | | | | | | | | | | |
| | Average Number of Employees Breakdown by Gender | | 2013 | | | | 2012 | | | | 2011 | | | |
| | | Male | | Female | | Male | | Female | | Male | | Female | |
| | Average Number of Employees BBVA Group | | 53,325 | | 59,263 | | 53,815 | | 60,109 | | 52,664 | | 57,030 | |
| | Of which: | | | | | | | | | | | | | |
| | BBVA, S.A. | | 15,522 | | 12,339 | | 15,440 | | 11,557 | | 15,687 | | 11,531 | |
| | | | | | | | | | | | | | | | | |
F-164
46.1.1 Share-based employee remuneration
The amounts recognized under the heading “Personnel expenses - Other personnel expenses” in the consolidated income statements for the year ended December 31, 2013, 2012 and 2011, corresponding to the plans for remuneration based on equity instruments in force in each year, amounted to€60,€60 and€51 million, respectively. These amounts have been recognized with a balancing entry under the heading “Stockholders’ funds – Other equity instruments” in the accompanying consolidated balance sheets, net of tax effect.
The characteristics of the Group’s plans for remuneration based on equity instruments are described below.
System of Variable Remuneration in Shares
The BBVA General Meeting, 11th March 2011, approved a system of variable remuneration in shares for the BBVA Management Team, including the executive directors and members of the Management Committee (the “System of Variable Remuneration in Shares for the Management Team” or the “System”), whose conditions for 2013 were approved by the BBVA General Meeting, 15th March 2013.
This system is based on a specific incentive for members of the Management Team (the “Incentive”) comprising the annual allocation to each beneficiary of a number of units that provide the basis for determining the number of shares to which, where applicable, they will be entitled when the Incentive is settled. These depend on the level of delivery against indicators established each year by the General Meeting, taking into account the performance of Total Shareholder Return (TSR); the Group Economic Profit without one-offs; and the Group Attributable Profit without one-offs.
This incentive, plus the ordinary variable remuneration in cash to which each manager is entitled, comprises their annual variable remuneration (the “Annual Variable Remuneration”).
After each financial year-end, the number of units allocated is divided into three parts indexed to each one of the indicators as a function of the weightings established at any time and each one of these parts is multiplied by a coefficient of between 0 and 2 as a function of the scale defined for each indicator every year.
The shares resulting from this calculation are subject to the following withholding criteria:
| — | | 40% of the shares received will be freely transferrable by the beneficiaries from the time of their vesting; |
| — | | 30% of the shares received will become transferrable after one year has elapsed from the incentive settlement date; and |
| — | | The remaining 30% will become transferrable after two years have elapsed from the incentive settlement date. |
Apart from this, the Bank also has a specific system for settlement and payment of the variable remuneration applicable to employees and managers, including the executive directors and members of the Management Committee, performing professional activities that may have a significant impact on the risk profile of the entity or perform control duties (hereinafter, the “Identified staff”).
The specific rules for settlement and payment of the Annual Variable Remuneration of executive directors and members of the Management Committee are described in Note 56, while the rules listed below are applicable to the rest of the Identified staff:
| — | | At least 50% of the total Annual Variable Remuneration of the members of the management team in the Identified staff will be paid in BBVA shares. |
| — | | Those in the Identified staff who are not members of the management team will receive 50% of their ordinary variable remuneration in BBVA shares. |
| — | | The payment of 40% of their variable remuneration, both in cash and in shares, will be deferred in time. The deferred amount will be paid one third a year over the following three years. |
| — | | All the shares delivered to these beneficiaries pursuant to the rules explained in the previous paragraph will be unavailable during one year after they have vested. This withholding will be applied against the net amount of the shares, after discounting the part needed to pay the tax accruing on the shares received. A prohibition has also been established against hedging with unavailable vested shares and shares pending reception. |
F-165
| — | | Moreover, circumstances have been defined in which the payment of the deferred Annual Variable Remuneration payable may be capped or impeded (malus clauses), and the adjustment to update these deferred parts has also been determined. |
When the term of the Incentive ended on 31st December 2013, the multiplier applicable to the units allocated to each beneficiary was 0.4675. This resulted in a total number of 3,145,763 shares for the Management Team as a whole. This figure may vary in application of the settlement and payment system described above for the members of the Identified staff, which requires that at least 50% of their Annual Variable Remuneration should be paid in BBVA shares and that the necessary part of their ordinary variable remuneration be turned into shares in order to reach this percentage.
2010-2011 Multi-Year Variable Share Remuneration Programme
When the term of the Multi-Year Variable Share Remuneration Programme for 2010-2011 (hereinafter the “Programme” or the “LTI 2010-2011”) approved by the General Meeting, 12th March 2010, ended on 31st December 2011, it was settled in application of the conditions established when it began.
However, with respect to those Programme beneficiaries who are members of the Identified staff described above, the Bank’s General Meeting, 16th March 2012, approved the modification of the settlement and payment system for the LTI 2010-2011 in order to align it with the special rules applicable to employees performing professional activities that may have a significant impact on the risk profile of the entity or perform control duties, including executive directors and members of the Management Committee, such that:
| — | | The payment of 40% of the shares resulting from settlement of the Programme (50% in the case of executive directors and other members of the Management Committee) was deferred to vest in thirds in 2013, 2014 and 2015. |
| — | | The shares paid will not be availed during a period of one year as of their vesting date. This withholding is applicable to the net amount of the shares, after discounting the part needed to pay taxes on the shares received. |
| — | | The vesting of the deferred shares will be subject to the application of the circumstances limiting or impeding payment of the variable remuneration (malus clauses) established by the Board of Directors; and |
| — | | The deferred shares will be adjusted to reflect their updated value. |
Thus, under the conditions established in the Programme, in the first quarter of 2013 the Identified staff vested a total of 351,905 shares, equivalent to the first third of the deferred part of the shares resulting from settlement of the Programme, plus€146,744 as an adjustment for the updated value of the shares vested.The payment of the remaining two thirds of the deferred shares resulting from the settlement of the Programme was deferred until the first quarter of 2014 and 2015.
The settlement and payment of the shares arising from this Programme for the executive directors and members of the Management Committee was carried out according to the scheme defined for such purpose, as described in Note 56.
BBVA Long-Term Incentive in BBVA Compass
When the term of the Long-Term Incentive 2010-2012 for the BBVA Compass Management Team ended on 31st December 2012, it was settled in application of the conditions established when it began.
During 2013, 106,268 shares have vested, those corresponding to BBVA Compass beneficiaries performing professional duties with a significant impact on the risk profile or performing control functions having been deferred to vest over a three-year period.
Additionally, the BBVA Compass remuneration structure includes long-term incentive programs in shares for employees in certain key positions that do not belong to the Management Team. These plans run over a three-year term. At 31st December 2013, there are three such programs in force (2011-2013, 2012-2014 and 2013-2015), and the maximum number of shares vesting under these programs as a whole is 656,325.
F-166
46.2 General and administrative expenses
The breakdown of the balance under this heading in the accompanying consolidated income statements is as follows:
| | | | | | | | | | | | |
| | | | | | | | | | | | | |
| | | | | | Millions of Euros | | |
| | General and Administrative Expenses | | 2013 | | 2012 | | 2011 | | |
| | Technology and systems | | | | 791 | | 735 | | 639 | | |
| | Communications | | | | 294 | | 311 | | 275 | | |
| | Advertising | | | | 336 | | 359 | | 355 | | |
| | Property, fixtures and materials | | | | 920 | | 873 | | 808 | | |
| | Of which: Rent expenses (*) | | | | 470 | | 490 | | 455 | | |
| | Taxes other than income tax | | | | 421 | | 417 | | 345 | | |
| | Other expenses | | | | 1,351 | | 1,234 | | 1,159 | | |
| | Total | | | | 4,113 | | 3,929 | | 3,581 | | |
| | | | | | | | | | | | |
|
(*) The consolidated companies do not expect to terminate the lease contracts early. |
47. Depreciation and amortization
The breakdown of the balance under this heading in the accompanying consolidated income statements is as follows:
| | | | | | | | | | | | |
| | | | | | | | | | | | | |
| | | | | | | Millions of Euros | | |
| | | Depreciation and Amortization | | Notes | | 2013 | | 2012 | | 2011 | | |
| | | Tangible assets | | 19 | | 581 | | 565 | | 491 | | |
| | | For own use | | | | 560 | | 543 | | 473 | | |
| | | Investment properties | | | | 21 | | 22 | | 10 | | |
| | | Others | | | | - | | - | | 8 | | |
| | | Other Intangible assets | | 20.2 | | 514 | | 413 | | 319 | | |
| | | Total | | | | 1,095 | | 978 | | 810 | | |
| | | | | | | | | | | | | |
48. Provisions (net)
In the year ended December 31, 2013, 2012 and 2011, the net allowances charged to the income statement under the headings “Provisions for pensions and similar obligations”, “Provisions for contingent risks and commitments”, “Provisions for taxes and other legal contingencies” and “Other provisions” in the accompanying consolidated income statements are as follows:
| | | | | | | | | | | | |
| | | | | | | | | | | | | |
| | | | | | | Millions of Euros | | |
| | | Provisions (Net) | | Notes | | 2013 | | 2012 | | 2011 | | |
| | | Provisions for pensions and similar obligations | | 26 | | 373 | | 433 | | 360 | | |
| | | Provisions for contingent risks and commitments | | 7.1.7 | | 38 | | 55 | | (8) | | |
| | | Provisions for taxes and other legal contingencies | | | | 14 | | 10 | | 39 | | |
| | | Other Provisions | | | | 184 | | 143 | | 112 | | |
| | | Total | | | | 609 | | 641 | | 503 | | |
| |
F-167
49. Impairment losses on financial assets (net)
The breakdown of impairment losses on financial assets by the nature of those assets in the accompanying consolidated income statements is as follows:
| | | | | | | | | | | | |
| | | | | | | | | |
| | | | | | Millions of Euros | |
| | Impairment Losses on Financial Assets (Net) | | Notes | | 2013 | | 2012 | | 2011 | |
| | Available-for-sale financial assets | | 12 | | 36 | | 41 | | 22 | |
| | Debt securities | | | | 5 | | (5) | | 8 | |
| | Other equity instruments | | | | 31 | | 46 | | 15 | |
| | Held-to-maturity investments | | 14 | | - | | 1 | | - | |
| | Loans and receivables | | 7.1.7 | | 5,577 | | 7,817 | | 4,163 | |
| | Of which: | | | | | | | | | |
| | Recovery of written-off assets | | | | 362 | | 337 | | 326 | |
| | Total | | | | 5,612 | | 7,859 | | 4,185 | |
| | | | | | | |
| | | | | | | | | | | | | |
50. Impairment losses on other assets (net)
The impairment losses on non-financial assets broken down by the nature of those assets in the accompanying consolidated income statements are as follows:
| | | | | | | | | | | | |
| | | | | | | | | | | | | |
| | | | | | Millions of Euros | |
| | Impairment Losses on Other Assets (Net) | | Notes | | 2013 | | 2012 | | 2011 | |
| | Goodwill | | 20.1 - 17 | | 5 | | 54 | | 1,444 | |
| | Other intangible assets | | 20.2 | | 9 | | - | | - | |
| | Tangible assets | | 19 | | 160 | | 90 | | 81 | |
| | For own use | | | | 32 | | 1 | | 8 | |
| | Investment properties | | | | 127 | | 89 | | 73 | |
| | Inventories | | 22 | | 270 | | 956 | | 358 | |
| | Rest | | | | 24 | | 24 | | - | |
| | | Total | | | | 467 | | 1,123 | | 1,883 | | |
| | | | | | | |
| | | | | | | | | | | | | |
F-168
51. Gains (losses) on derecognized assets not classified as non-current assets held for sale
The breakdown of the balance under this heading in the accompanying consolidated income statements is as follows:
| | | | | | | | | | | | | | | | |
| | | | | | | Millions of Euros | | | |
| | Gains and Losses on Derecognized Assets Not Classified as Non-current Assets Held for Sale | | 2013 | | | 2012 | | | | 2011 | | |
| | Gains | | | | | | | | | | | | | |
| | Disposal of investments in subsidiaries | | | | 67 | | | 31 | | | | 56 | | |
| | Disposal of tangible assets and other | | | | 637 | | | 22 | | | | 32 | | |
| | Losses: | | | | | | | | | | | | | |
| | Disposal of investments in subsidiaries | | | | (2,601) | | | (25) | | | | (38) | | |
| | Disposal of tangible assets and other | | | | (18) | | | (25) | | | | (6) | | |
| | Total | | | | (1,915) | | | 3 | | | | 44 | | |
| | | | | | | | | | | | | | | |
During 2013, the heading “Losses - Disposal of investments in subsidiaries” includes, mainly, the realized losses for the sale of the stake in CNCB (see Notes 3 and 17). The heading “Gains - Disposal of tangible assets and other” includes the realized gains of the reinsurance agreement that has been registered with the reinsurance entity Scor Global Life (see Note 18).
52. Gains (losses) on non-current assets held for sale
| 52.1 | Gains (losses) on non-current assets held for sale not classified as discontinued operations |
The main items included in the balance under this heading in the accompanying consolidated income statements are as follows:
| | | | | | | | | | | | | | | | |
| | | | | | | Millions of Euros | | | |
| | Gains (Losses) in Non-current Assets Held for Sale not classified as discontinued operations | | Notes | | 2013 | | | 2012 | | | | 2011 | | |
| | Gains (losses) on sale of real estate | | | | (25) | | | (85) | | | | 126 | | |
| | Impairment of non-current assets held for sale | | 16 | | (602) | | | (524) | | | | (397) | | |
| | Gains (losses) on sale of investments classified as assets held for sale (*) | | | | 228 | | | (15) | | | | - | | |
| | Total | | | | (399) | | | (624) | | | | (271) | | |
| | | | | | | | | | | | | | | |
|
(*) Includes the sale of BBVA Panamá (see Note 3). |
F-169
| 52.2 | Gains (losses) on non-current assets held for sale classified as discontinued operations |
The earnings generated by discontinued operations (Note 3) are shown below. The comparative figures have been recalculated to include the operations classified as discontinued.
| | | | | | | | | | | | |
| | | | | | | Millions of Euros | | |
| | Gains (Losses) in Non-current Assets Held for Sale classified as discontinued operations | | | | 2013 | | 2012 | | 2011 | | |
| | Interest income/(charges) | | | | 3 | | 11 | | 8 | | |
| | Income for companies accounted for using the equity method | | | | 8 | | 9 | | 5 | | |
| | Net fee and commission income | | | | 210 | | 686 | | 529 | | |
| | Gains/losses on financial assets and liabilities | | | | 8 | | 65 | | (3) | | |
| | Exchange differences | | | | - | | - | | - | | |
| | Other operating income (net) | | | | (8) | | (2) | | (1) | | |
| | Total income | | | | 222 | | 769 | | 538 | | |
| | Personnel expenses | | | | (51) | | (139) | | (120) | | |
| | Other general administrative expenses | | | | (29) | | (89) | | (86) | | |
| | Depreciation and amortization | | | | (5) | | (10) | | (8) | | |
| | Provisions | | | | (1) | | (6) | | (2) | | |
| | Impairment losses on financial assets | | | | - | | - | | - | | |
| | Profit (loss) from operations | | | | 136 | | 525 | | 323 | | |
| | Gains (losses) on disposal of assets not classified as non-current assets held for sale | | | | 2 | | 3 | | 1 | | |
| | Profit (loss) before tax | | | | 137 | | 528 | | 324 | | |
| | Income tax | | | | (43) | | (136) | | (78) | | |
| | Profit (loss) from discontinued operations (*) | | | | 94 | | 393 | | 245 | | |
| | Profit from business sale agreements (**) | | | | 1,772 | | | | | | |
| | Total | | | | 1,866 | | 393 | | 245 | | |
| | | | | | | | | | | | |
|
(*) Originated until the date of the sale agreement (**) Includes the net profit and profit attributable to non-controlling interests and the impact of exchange/translation differences. |
53. Consolidated statements of cash flows
Cash flows from operating activities decreased in 2013 by€500 million (compared with a decrease of€9,728 million in the same period in 2012). The most significant reasons for the change occurred under the headings “Financial liabilities at amortized cost” and “Financial instruments held for trading”.
The most significant variances in cash flows from investment activities between in 2013 corresponded to “Tangible Assets” and “Investment in entities” (see Notes 3 and 17).
Cash flows from financing activities increased in 2013 by€1,326 million (compared to€3,492 million decrease in the same period of 2012), with the most significant changes corresponding to the acquisition and amortization of own equity instruments, “Subordinated liabilities”, and dividend payments.
F-170
The table below shows the breakdown of the main cash flows related to investing activities as of December 31, 2013, 2012 and 2011:
| | | | | | | | | | | | | | |
| | | | | | | Millions of Euros |
| | | Main Cash Flows in Investing Activities | | | | Cash Flows in Investment Activities | | | |
| | | 2013 | | | | | Investments (-) | | | | Divestments (+) | | | |
| | | Tangible assets | | | | | (1,252) | | | | 101 | | | |
| | | Intangible assets | | | | | (526) | | | | - | | | |
| | | Investments | | | | | (547) | | | | 944 | | | |
| | | Subsidiaries and other business units | | | | | - | | | | 3,299 | | | |
| | | Non-current assets held for sale and associated liabilities | | | | | - | | | | 571 | | | |
| | | Held-to-maturity investments | | | | | - | | | | 431 | | | |
| | | Other settlements related to investment activities | | | | | - | | | | - | | | |
| | | | | | | | | | | | | | | |
| | | | | | | | | | | | | | |
| | | | | | | Millions of Euros |
| | | Main Cash Flows in Investing Activities | | | | Cash Flows in Investment Activities | | | |
| | | 2012 | | | | | Investments (-) | | | | Divestments (+) | | | |
| | | Tangible assets | | | | | 1,685 | | | | - | | | |
| | | Intangible assets | | | | | 777 | | | | - | | | |
| | | Investments | | | | | - | | | | 19 | | | |
| | | Subsidiaries and other business units | | | | | - | | | | - | | | |
| | | Non-current assets held for sale and associated liabilities | | | | | - | | | | 590 | | | |
| | | Held-to-maturity investments | | | | | 60 | | | | 853 | | | |
| | | Other settlements related to investment activities | | | | | - | | | | - | | | |
| | | | | | | | | | | | | | | |
| | | | | | | | | | | | | | |
| | | | | | | Millions of Euros | | | |
| | | Main Cash Flows in Investing Activities | | | | Cash Flows in Investment Activities | | | |
| | | 2011 | | | | | Investments (-) | | | | Divestments (+) | | | |
| | | Tangible assets | | | | | 1,293 | | | | 175 | | | |
| | | Intangible assets | | | | | 619 | | | | 1 | | | |
| | | Investments | | | | | 4,838 | | | | - | | | |
| | | Subsidiaries and other business units | | | | | 245 | | | | 19 | | | |
| | | Non-current assets held for sale and associated liabilities | | | | | - | | | | 870 | | | |
| | | Held-to-maturity investments | | | | | - | | | | - | | | |
| | | Other settlements related to investment activities | | | | | - | | | | - | | | |
| | | | | | | | | | | | | | | |
The net cash flows attributable to the operating, investment and finance activities for discontinued operations are not significant.
F-171
54. Accountant fees and services
The details of the fees for the services contracted by entities of the BBVA Group in 2013 with their respective auditors and other audit entities are as follows:
| | | | | | | | | | |
| | | | | | | Millions of Euros | | | |
| | | Fees for Audits Conducted | | | | | 2013 | | | |
| | | Audits of the companies audited by firms belonging to the Deloitte worldwide organization and other reports related with the audit (*) | | | | | 20.4 | | | |
| | | Other reports required pursuant to applicable legislation and tax regulations issued by the national supervisory bodies of the countries in which the Group operates, reviewed by firms belonging to the Deloitte worldwide organization | | | | | 3.5 | | | |
| | | Fees for audits conducted by other firms | | | | | - | | | |
| | | | | | | | | | | |
|
(*) Including fees belonging to annual statutory audits (€17 million) |
In 2013, other entities in the BBVA Group contracted other services (other than audits) as follows:
| | | | | | | | | | |
| | | | | | | Millions of Euros | | | |
| | | Other Services Contracted | | | 2013 | | | |
| | | Firms belonging to the Deloitte worldwide organization(*) | | | | | 3.3 | | | |
| | | Other firms | | | | | 33.1 | | | |
| | | | | | | | | | | |
|
(*) Including€1.09 million related to fees for tax services. |
The services provided by the auditors meet the independence requirements established under Law 44/2002, of 22 November 2002, on Measures Reforming the Financial System and under the Sarbanes-Oxley Act of 2002 adopted by the Securities and Exchange Commission (SEC); accordingly they do not include the performance of any work that is incompatible with the auditing function.
55. Related-party transactions
As financial institutions, BBVA and other entities in the Group engage in transactions with related parties in the normal course of their business. All of these transactions are of little relevance and are carried out under normal market conditions.
| 55.1 | Transactions with significant shareholders |
As of December 31, 2013 there were no shareholders considered significant (see Note 27).
F-172
| 55.2 | Transactions with BBVA Group entities |
The balances of the main aggregates in the accompanying consolidated balance sheets arising from the transactions carried out by the BBVA Group with associates and joint venture entities accounted for using the equity method are as follows:
| | | | | | | | | | | | | | | | |
| | | | | | | Millions of euros |
| | | Balances arising from transactions with Entities of the Group | | | | 2013 | | | 2012 | | | | 2011 | | | |
| | | Assets: | | | | | | | | | | | | | | |
| | | Loans and advances to credit institutions | | | | 318 | | | 212 | | | | 523 | | | |
| | | Loans and advances to customers | | | | 792 | | | 820 | | | | 372 | | | |
| | | Liabilities: | | | | | | | | | | | | | | |
| | | Deposits from credit institutions | | | | 5 | | | 28 | | | | 24 | | | |
| | | Customer deposits | | | | 504 | | | 180 | | | | 94 | | | |
| | | Debt certificates | | | | - | | | - | | | | - | | | |
| | | Memorandum accounts: | | | | | | | | | | | | | | |
| | | Contingent risks | | | | 691 | | | 102 | | | | 68 | | | |
| | | Contingent commitments | | | | 46 | | | 114 | | | | 236 | | | |
| | | | | | | | | | | | | | | | | |
The balances of the main aggregates in the accompanying consolidated income statements resulting from transactions with associated and joint venture entities that are consolidated by the equity method are as follows:
| | | | | | | | | | | | | | | | | | |
| | | | | | | Millions of euros | | | |
| | | Balances of Income Statement arising from transactions with Entities of the Group | | | | | 2013 | | | | 2012 | | | | 2011 | | | |
| | | Income statement: | | | | | | | | | | | | | | | | |
| | | Financial incomes | | | | | 53 | | | | 26 | | | | 14 | | | |
| | | Financial costs | | | | | 4 | | | | 1 | | | | 2 | | | |
| | | | | | | | | | | | | | | | | | | |
There were no other material effects in the consolidated financial statements arising from dealings with these entities, other than the effects from using the equity method (see Note 2.1) and from the insurance policies to cover pension or similar commitments, as described in Note 26. As of December 31, 2013, the notional amount of the derivatives entered into by the BBVA Group with those entities amounted to€1,424 million (of which€989 million corresponded to futures transactions with the Garanti Group).
In addition, as part of its normal activity, the BBVA Group has entered into agreements and commitments of various types with shareholders of subsidiaries and associates, which have no material effects on the accompanying consolidated financial statements.
| 55.3 | Transactions with members of the Board of Directors and the Management Committee |
The information on the remuneration of the members of the BBVA Board of Directors and the Management Committee is included in Note 56.
As of December 31, 2013, the amount disposed of the loans granted by the Group’s entities to the members of the Board of Directors was€141 thousand. As of December 31, 2013, 2012 and 2011 there were no loans granted by the Group’s credit institutions to the members of the Bank’s Board of Directors. As of December 31, 2013, 2012 and 2011, the amount disposed of the loans granted by the Group’s entities to the members of the Management Committee (excluding the executive directors) amounted to€6,076 thousand,€7,401 thousand and€6,540 thousand, respectively.
F-173
As of December 31, 2013, 2012 and 2011 the amount disposed of the loans granted to parties related to the members of the Bank’s Board of Directors amounted to€6,939 thousand,€13,152 thousand and€20,593 thousand, respectively. As of these dates, there were no loans granted to parties linked to members of the Bank’s Management Committee.
As of December 31, 2013, 2012 and 2011 no guarantees had been granted to any member of the Board of Directors.
As of December 31, 2013 and 2012, no guarantees had been granted to any member of the Management Committee. Said balance as of December 31, 2011 was€9 thousand.
As of December 31, 2013, 2012 and 2011, the amount disposed for guarantee and commercial loan transactions arranged with parties related to the members of the Bank’s Board of Directors and Management Committee totaled€5,192 thousand,€3,327 thousand and€10,825 thousand, respectively.
| 55.4 | Transactions with other related parties |
In the year ended December 31, 2013, 2012 and 2011, the Group did not perform any transactions with other related parties that did not belong to the normal course of their business, that were not under market conditions or that were relevant for the consolidated equity, financial situation or earnings of the BBVA Group.
56. Remuneration and other benefits of the Board of Directors and Members of the Bank’s Management Committee
| — | | Remuneration of non-executive directors received in 2013 |
The cash remuneration paid to the non-executive members of the Board of Directors during 2013 is indicated below. The figures are given individually for each non-executive director and itemised:
| | | | | | | | | | | | | | | | | | | | | | | | | | | | | | | | |
| | | | | Thousands of Euros |
| | | Non-Executive Director remuneration | |
| Board of
Directors |
| |
| Executive
Committee |
| |
| Audit &
Compliance
Committee |
| |
| Risks
Committee |
| |
| Appointments
Committee |
| |
| Remuneration
Committee |
| | | Total | | | |
| | | Tomás Alfaro Drake | | | 129 | | | | - | | | | 71 | | | | - | | | | 102 | | | | - | | | | 302 | | | |
| | | Juan Carlos Álvarez Mezquíriz | | | 129 | | | | 167 | | | | - | | | | - | | | | 41 | | | | - | | | | 336 | | | |
| | | Ramón Bustamante y de la Mora | | | 129 | | | | - | | | | 71 | | | | 107 | | | | - | | | | - | | | | 307 | | | |
| | | José Antonio Fernández Rivero (1) | | | 129 | | | | - | | | | - | | | | 214 | | | | 41 | | | | - | | | | 383 | | | |
| | | Ignacio Ferrero Jordi | | | 129 | | | | 167 | | | | - | | | | - | | | | - | | | | 43 | | | | 338 | | | |
| | | Belén Garijo López | | | 129 | | | | - | | | | 71 | | | | - | | | | - | | | | - | | | | 200 | | | |
| | | Carlos Loring Martínez de Irujo | | | 129 | | | | - | | | | 71 | | | | - | | | | - | | | | 107 | | | | 307 | | | |
| | | José Maldonado Ramos | | | 129 | | | | 167 | | | | - | | | | - | | | | 41 | | | | 43 | | | | 379 | | | |
| | | José Luis Palao García-Suelto | | | 129 | | | | - | | | | 179 | | | | 107 | | | | - | | | | - | | | | 414 | | | |
| | | Juan Pi Llorens | | | 129 | | | | - | | | | - | | | | 107 | | | | - | | | | 43 | | | | 278 | | | |
| | | Susana Rodríguez Vidarte (2) | | | 129 | | | | 42 | | | | 54 | | | | - | | | | 41 | | | | 43 | | | | 308 | | | |
| | | Total (3) | | | 1,416 | | | | 542 | | | | 518 | | | | 534 | | | | 265 | | | | 278 | | | | 3,553 | | | |
| | | | | | | | | | | | | | | | | | | | | | | | | | | | | | | | | |
| | (1) | José Antonio Fernández Rivero, in addition to the amounts listed in the previous chart, also received a total of€652 thousand in early retirement payments as a former member of the BBVA management. | |
| | (2) | Susana Rodríguez Vidarte was appointed member of the Executive Committee on 25th September 2013, ceasing as a member of the Audit & Compliance Committee on that same date. | |
| | (3) | Enrique Medina Fernández, who ceased as director on 29th May 2013, received the total amount of€167 thousand as remuneration for his membership of the Board of Directors, the Executive Committee and the Risks Committee. | |
Moreover, in 2013,€132 thousand were paid in insurance premiums for non-executive members of the Board of Directors.
| | — | | Remuneration of executive directors received in 2013 |
The remuneration paid to the executive directors during 2013 is indicated below. The figures are given individually for each executive director and itemised:
F-174
| | | | | | | | | | | | | | | | | | | | | | | | | | | | | | | | | | |
| | | | | | | | Thousands of Euros | | | | | | | | | | | | | | |
| | | Executive Director remuneration | | | | | | | 2012 Annual | | | | Deferred | | | | Total Cash | | | | | | 2012 Annual | | |
| Deferred Variable
Remuneration in BBVA Shares (3) |
| | | Total Shares | | | |
| | | | | Fixed | | | | Variable | | | | Variable | | | | | | | Variable | | | | | |
| | | | | Remuneration | | | | Remuneration | | | | Remuneration | | | | | | | Remuneration in | | | | | |
| | | | | | | | | in cash (1) | | | | in cash (2) | | | | | | | BBVA Shares | | | | | |
| | Chairman and CEO | | | 1,966 | | | | 785 | | | | 379 | | | | 3,130 | | | | | | 108,489 | | | | 86,826 | | | | 195,315 | | | |
| | | President and COO | | | 1,748 | | | | 478 | | | | 244 | | | | 2,470 | | | | | | 66,098 | | | | 62,963 | | | | 129,061 | | | |
| | | José Manuel González-Páramo Martínez-Murillo (*) | | | 469 | | | | - | | | | - | | | | 469 | | | | | | - | | | | - | | | | - | | | |
| | | Total | | | 4,183 | | | | 1,263 | | | | 623 | | | | 6,069 | | | | | | 174,587 | | | | 149,789 | | | | 324,376 | | | |
| | | | | | | | | | | | | | | | | | | | | | | | | | | | | | | | | | |
| | (*) | José Manuel González-Páramo Martínez-Murillo was appointed BBVA director under a Board of Directors resolution, 29th May 2013. | |
| | (1) | Amounts corresponding to 50% of the 2012 Annual Variable Remuneration in cash, received in 2013. | |
| | (2) | Equivalent to the sum of the first deferred third of 50% of the 2011 Annual Variable Remuneration in cash, received in 2013; and the amount of the value adjustments in cash for the first deferred third of 50% of the 2011 Annual Variable Remuneration, and the first deferred third of 50% of the shares of the LTI 2010-2011, received in 2013. | |
| | (3) | Equivalent to the sum of the first deferred third of 50% of the 2011 Annual Variable Remuneration, in shares, received in 2013 and of the first deferred third of 50% of the shares of the LTI 2010-2011, received in 2013. | |
The Annual Variable Remuneration of the executive directors comprises an ordinary variable remuneration in cash and a variable remuneration in shares based on the BBVA Group Management Team Incentive.
Moreover, during 2013 executive directors have received remuneration in kind and other remuneration amounting to a total joint sum of€37 thousand, of which€13 thousand correspond to the Chairman & CEO,€23 thousand to the President & COO and€1 thousand to José Manuel González-Páramo Martínez-Murillo.
During 2013, the executive directors have received the amount of the fixed remuneration corresponding to the year and, in the case of the Chairman & CEO and the President & COO, the variable remuneration for 2012 to which they are entitled under the settlement and payment system resolved by the General Meeting (the “Settlement & Payment System”), which determines that:
| — | | At least 50% of the total Annual Variable Remuneration shall be paid in BBVA shares. |
| — | | The payment of 50% of the Annual Variable Remuneration shall be deferred in time, the deferred amount being paid in thirds over the three-year period following its settlement. |
| — | | All the shares vesting to these beneficiaries pursuant to the rules explained in the previous paragraph may not be availed during a period of one year after they have vested. This withholding will be applied against the net amount of the shares, after discounting the necessary part to pay the tax accruing on the shares received. |
| — | | Moreover, cases have been established in which the payment of the deferred Annual Variable Remuneration payable may be limited or impeded (malus clauses), and |
| — | | The deferred parts of the Annual Variable Remuneration will be adjusted to update them in the terms established by the Board of Directors. |
Thus, during 2013 the Chairman & CEO and the President & COO have received the following variable remuneration:
– Annual Variable Remuneration for year 2012
During 2013 the Chairman & CEO and the President & COO have received 50% of the Annual Variable Remuneration (in cash and in shares) corresponding to 2012, as indicated in the chart above.
The other 50% of the Annual Variable Remuneration for 2012 that has been deferred under the Settlement & Payment System will be paid, subject to the conditions described above, in thirds during the first quarter of 2014, 2015 and 2016, such that under this item the Chairman & CEO will receive€261,676 and 36,163 BBVA shares and the President & COO will receive€159,428 and 22,032 BBVA shares.
– Deferred parts of the Variable Remuneration from previous years:
During 2013 the Chairman & CEO and the President & COO, in application of the Settlement & Payment System, have received the following variable remuneration:
– Annual Variable Remuneration for year 2011
During 2013 the Chairman & CEO and the President & COO, in application of the Settlement & Payment System, have received the first third of the 50% of their Annual Variable Remuneration, both in cash and in shares, corresponding to 2011, which was deferred to be paid during the first quarter of 2013. Under this item, after the corresponding adjustment, the Chairman & CEO received€364,519 and 51,826 shares and the President & COO received€231,847 and 32,963 shares.
F-175
The other two thirds of the 50% of the Annual Variable Remuneration corresponding to 2011 will be paid, respectively, during the first quarter of 2014 and 2015, subject to the conditions mentioned above.
| | – | Multi-Year Variable Share Remuneration Programme for 2010-2011 (“LTI 2010-2011”) |
Likewise, in application of the Settlement & Payment System for the LTI 2010-2011 approved by the General Meeting, 12th March 2010, during 2013 the Chairman & CEO and the President & COO have received under this item the first third of the 50% of the shares resulting from the settlement of the LTI 2010-2011 that were deferred, for which the Chairman & CEO received 35,000 shares and the President & COO 30,000 shares; and the cash amount resulting from the adjustment for the updated value of these deferred shares, for which the Chairman & CEO received€14,595 and the President & COO€12,510. The payments, under the aforementioned conditions, of the remaining two thirds resulting from the settlement of the Programme are deferred until the first quarter of 2014 and 2015.
| | — | | Annual Variable Remuneration of executive directors for year 2013 |
Following year-end 2013, the Annual Variable Remuneration for the executive directors corresponding to that year has been determined, applying the conditions established for that purpose by the General Meeting. Consequently, during the first quarter of 2014 the executive directors will receive 50% of this remuneration, ie,€797,139 and 88,670 BBVA shares for the Chairman & CEO;€495,037 and 55,066 BBVA shares for the President & COO; and€47,683 and 5,304 BBVA shares for José Manuel González-Páramo Martínez-Murillo (*). The remaining 50% of the Annual Variable Remuneration will be deferred over a three-year period, such that during the first quarter of each year (2015, 2016 and 2017) the Chairman & CEO will receive the amount of€265,713 and 29,557 BBVA shares; the President & COO will receive€165,012 and 18,356 BBVA shares; and José Manuel González-Páramo Martínez-Murillo will receive€15,894 and 1,768 BBVA shares.
| | (*) | José Manuel González-Páramo Martínez-Murillo was appointed as a BBVA director under a Board of Directors resolution, 29th May 2013. His Annual Variable Remuneration for 2013 is proportional to the number of months during which he has held this position. | |
The payment of the deferred parts of the 2013 Annual Variable Remuneration will be subject to the conditions of the Settlement & Payment System established pursuant to the resolutions adopted by the General Meeting.
These amounts are recorded under the item “Other Liabilities - Accrued interest” of the consolidated balance sheet at 31st December 2013.
| | — | | Remuneration of the members of the Management Committee received in 2013 |
During 2013, the remuneration paid to the members of the BBVA Management Committee as a whole, excluding the executive directors, amounted to€9,122 thousand corresponding to fixed remuneration plus the variable remuneration indicated below, pursuant to the Settlement & Payment System described above:
– Annual Variable Remuneration for year 2012
During 2013, members of the BBVA Management Committee as a whole, excluding the executive directors, received a total amount of€2,597 thousand and 344,460 BBVA shares corresponding to them under the Settlement & Payment System, corresponding to the Annual Variable Remuneration for 2012.
The deferred part of the Annual Variable Remuneration for 2012 will be paid, subject to the conditions described above, in thirds during the first quarter of 2014, 2015 and 2016, such that under this item, this group as a whole will receive the amount of€814 thousand (*) and 112,437 BBVA shares each year.
| | (*) | According to the average exchange rate in force at 31st December 2013. | |
– Deferred parts of the Variable Remuneration from previous years
| | ¡ | | Annual Variable Remuneration for 2011 |
During 2013, payment was made of the deferred part of the Annual Variable Remuneration corresponding to 2011 to the members of the Management Committee. As a consequence, under this item in 2013, the members of the Management Committee as a whole, after its corresponding adjustment, received the amount of€1,046 thousand and 149,850 BBVA shares.
F-176
The remaining Annual Variable Remuneration corresponding to 2011 for this group has been deferred and will be payable in thirds during the first quarter of 2014 and 2015, under the conditions described above.
| | ¡ | | Multi-Year Variable Share Remuneration Programme for 2010-2011 (“LTI 2010-2011”). |
Moreover, in application of the Settlement & Payment System, in 2013 the members of the Management Committee as a whole have received the shares resulting from the settlement of the LTI 2010-2011 that were deferred for payment during said year. These amounted to a total of 98,665 shares for the Management Committee as a whole. A further€41 thousand was paid corresponding to the adjustment of these deferred vested shares.
The payment of the remaining two thirds of the deferred shares resulting from the settlement of the Programme corresponding to the members of the Management Committee as a whole has been deferred and will vest in the first quarters of 2014 and 2015, under the conditions described above.
Finally, in 2013 members of the BBVA Management Committee as a whole, excluding executive directors, received remuneration in kind amounting to a total of€799 thousand.
| | — | | System of Remuneration in Shares with Deferred Delivery for non-executive directors |
BBVA has a remuneration system in shares with deferred delivery for its non-executive directors, which was approved by the General Meeting, 18th March 2006 and extended for an additional 5-year period under a resolution of the General Meeting, 11th March 2011.
This System is based on the annual allocation to non-executive directors of a number of “theoretical shares”, equivalent to 20% of the total remuneration in cash received by each of them in the previous year, according to the average closing prices of the BBVA share during the sixty trading sessions prior to the Annual General Meeting approving the corresponding financial statements for each year.
These shares, where applicable, will be delivered to each beneficiary on the date they leave the position as director for any reason other than dereliction of duty.
The number of “theoretical shares” allocated to the non-executive directors in 2013 who are beneficiaries of the system of deferred delivery of shares, corresponding to 20% of the total remuneration in cash received by said directors during 2012, are as follows:
| | | | | | | | | | | | |
| | | | | | | | | | | | | |
| | | | |
| Theoretical
shares allocated
in 2013 |
| |
| Theoretical shares
accumulated at
December 31, 2013 |
| | |
| | | Tomás Alfaro Drake | | | 8,107 | | | | 36,466 | | | |
| | | Juan Carlos Álvarez Mezquíriz | | | 9,028 | | | | 66,562 | | | |
| | | Ramón Bustamante y de la Mora | | | 8,245 | | | | 62,705 | | | |
| | | José Antonio Fernández Rivero | | | 10,292 | | | | 60,516 | | | |
| | | Ignacio Ferrero Jordi | | | 9,085 | | | | 67,202 | | | |
| | | Belén Garijo López | | | 3,520 | | | | 3,520 | | | |
| | | Carlos Loring Martínez de Irujo | | | 8,251 | | | | 50,496 | | | |
| | | José Maldonado Ramos | | | 10,178 | | | | 27,866 | | | |
| | | Jose Luis Palao García-Suelto | | | 11,122 | | | | 20,477 | | | |
| | | Juan Pi Llorens | | | 7,479 | | | | 10,191 | | | |
| | | Susana Rodríguez Vidarte | | | 7,618 | | | | 47,102 | | | |
| | | Total (1) | | | 92,925 | | | | 453,103 | | | |
| | | | | | | | | | | | | |
| | (1) | Enrique Medina Fernández, who ceased as director on 29th May 2013, was also allocated 10,806 theroretical shares. |
F-177
The provisions recorded at 31st December 2013 to cover pension commitments for executive directors amount to€23,611 thousand in the case of the President & COO and€98 thousand in the case of José Manuel González-Páramo Martínez-Murillo.€1,070 thousand and€131 thousand were set aside in 2013 for the President & COO and for José Manuel González-Páramo Martínez-Murillo, respectively, to cover the contingencies of retirement, disability and death.
There are no other pension obligations in favour of other executive directors.
The provisions charged to 31st December 2013 for pension commitments for the members of the Management Committee, excluding executive directors, amounted to€91,129 thousand, of which,€8,697 thousand were provisioned during 2013.
| — | | Extinction of contractual relationship. |
The Bank does not have any commitments to pay severance indemnity to executive directors other than the commitment in respect of José Manuel González-Páramo Martinez-Murillo who is contractually entitled to receive an indemnity equivalent to twice his fixed remuneration should he cease to hold his position on grounds other than his own will, death, retirement, disability or dereliction of duty.
The contractual conditions of the President & COO determine that should he cease to hold his position for any reason other than his own will, retirement, disability or dereliction of duty, he will be given early retirement with a pension payable, as he chooses, through a lifelong annuity pension, or by payment of a lump sum that will be 75% of his pensionable salary should this occur before he is 55, and 85% should it occur after he has reached said age.
57. Detail of the Directors’ holdings in companies with similar business activities
Pursuant to article 229.2 of the Spanish Corporations Act, as of December 31, 2013 no member of BBVA’s Board of Directors had a direct or indirect ownership interest in companies engaging in an activity that is identical, similar or complementary to the corporate purpose of BBVA, except for Ms. Belén Garijo López, who on that date held a direct holding of 3,350 shares in Bankia, S.A., Mr. José Luis Palao García-Suelto, who on that date held a direct holding of 4,982 shares in Banco Santander, S.A. and 5,877 shares in Caixabank, S.A., Mr. Ignacio Ferrero Jordi, who on that date held a direct holding of 6,750 shares of UBS, AG. In addition, no member of the Bank’s Board of Directors holds positions or functions in those companies.
Furthermore, as of December 31, 2013, individuals associated with the members of the Bank’s Board of Directors were holders of 59,966 shares of Banco Santander, S.A., 4,500 shares of Bank of America Corporation, 2,000 shares of Banco Popular S.A. and 3 shares of Bankinter, S.A.
58. Other information
58.1 Environmental impact
Given the activities BBVA Group entities engage in, the Group has no environmental liabilities, expenses, assets, provisions or contingencies that could have a significant effect on its consolidated equity, financial situation and profits. Consequently, as of 31 December, 2013, there is no item in the Group’s accompanying consolidated financial statements that requires disclosure in an environmental information report pursuant to Ministry of Economy Order JUS/206/2009 dated January 28, implementing new forms for the use of entities obliged to publish such information, and no specific disclosure of information on environmental matters is included in these statements.
58.2 List of agents of credit institutions
The list of agents of BBVA as set out in Article 22 of Royal Decree 1245/1995 of 14 July, of the Ministry of Finance is detailed in the individual financial statements of the Bank for the year 2013.
58.3 Activity Report of the customer service department
The activity report of the customer service department required under Article 17 of the ECO/734/2004 of 11 March, of the Ministry of Economy, is included in the consolidated Management Report attached to the financial year 2013 consolidated financial statements.
F-178
58.4. Reporting requirements of the Spanish National Securities Market Commission (CNMV)
Dividends paid in the year
The table below presents the dividends per share paid in cash in 2013, 2012, and 2011 (cash basis accounting, regardless of the year in which they were accrued), but without including other shareholder remuneration, such as the “Dividend Option”. See Note 4 for a complete analysis of all remuneration awarded to shareholders during the year ended December 31, 2013, 2012 and 2011.
| | | | | | | | | | | | | | | | | | | | | | | | | | | | | | | | | | | | | | | | |
| | | | | | | | | | | | | | | | | | | | | | | | | | | | | | | | | | | | | | | | |
| | | | | 2013 | | | 2012 | | | 2011 | | | |
| | | Dividends Paid (“Dividend Option” not included) | |
| % Over
Nominal |
| |
| Euros per
Share |
| |
| Amount
(Millions of
Euros) |
| |
| % Over
Nominal |
| |
| Euros per
Share |
| |
| Amount
(Millions of
Euros) |
| |
| % Over
Nominal |
| |
| Euros per
Share |
| |
| Amount
(Millions of
Euros) |
| | |
| | | Ordinary shares | | | 41% | | | | 0.20 | | | | 1,117 | | | | 41% | | | | 0.20 | | | | 1,029 | | | | 39% | | | | 0.19 | | | | 859 | | | |
| | | Rest of shares | | | - | | | | - | | | | - | | | | - | | | | - | | | | - | | | | - | | | | 0.00 | | | | - | | | |
| | | Total dividends paid in cash | | | 41% | | | | 0.20 | | | | 1,117 | | | | 41% | | | | 0.20 | | | | 1,029 | | | | 39% | | | | 0.19 | | | | 859 | | | |
| | | Dividends with charge to income | | | 41% | | | | 0.20 | | | | 1,117 | | | | 41% | | | | 0.20 | | | | 1,029 | | | | 39% | | | | 0.19 | | | | 859 | | | |
| | | Dividends with charge to reserve or share premium | | | - | | | | - | | | | - | | | | - | | | | - | | | | - | | | | - | | | | - | | | | - | | | |
| | | Dividends in kind | | | - | | | | - | | | | - | | | | - | | | | - | | | | - | | | | - | | | | - | | | | - | | | |
| | | | | | | | | | | | | | | | | | | | | | | | | | | | | | | | | | | | | | | | |
Earnings and ordinary income by business segment
The detail of the consolidated profit for the year ended December 31, 2013, 2012 and 2011 for each operating segment is as follows:
| | | | | | | | | | | | | | | | | | |
| | | | | | | | | | Millions of Euros | | | |
| | Profit attributable by Operating Segments | | | | 2013 | | | 2012 | | | 2011 | | | |
| | | Spain | | | | | 583 | | | | 1,162 | | | | 1,075 | | | |
| | | Real Estate | | | | | (1,254) | | | | (4,044) | | | | (809) | | | |
| | | Eurasia | | | | | 454 | | | | 404 | | | | 563 | | | |
| | | Mexico | | | | | 1,805 | | | | 1,689 | | | | 1,638 | | | |
| | | South America | | | | | 1,249 | | | | 1,199 | | | | 898 | | | |
| | | United States | | | | | 390 | | | | 443 | | | | (713) | | | |
| | | Subtotal operating segments | | | | | 3,227 | | | | 853 | | | | 2,654 | | | |
| | | Corporate Center | | | | | (999) | | | | 823 | | | | 351 | | | |
| | | Profit attributable to parent company | | | | | 2,228 | | | | 1,676 | | | | 3,005 | | | |
| | | Non-assigned income | | | | | - | | | | - | | | | - | | | |
| | | Elimination of interim income (between segments) | | | | | - | | | | - | | | | - | | | |
| | | Other gains (losses) (*) | | | | | 753 | | | | 651 | | | | 481 | | | |
| | | Income tax and/or profit from discontinued operations | | | | | (1,820) | | | | (745) | | | | (87) | | | |
| | | Operating profit before tax | | | | | 1,160 | | | | 1,583 | | | | 3,399 | | | |
| | | | | | | | | | | | | | | | | | |
| | (*) | Profit attributable to non-controlling interests. |
F-179
For the year ended December 31, 2013, 2012 and 2011 the detail of the BBVA Group’s ordinary income for each operating segment, which is made up of the “Interest and similar income”, “Dividend income”, “Fee and commission income”, “Net gains (losses) on financial assets and liabilities” and “Other operating income”, is as follows:
| | | | | | | | | | | | | | | | | | |
| | | | | | | | | | Millions of Euros | | | |
| | Ordinary Profit by Operating Segments | | | | 2013 | | | 2012 | | | 2011 | | | |
| | | Spain | | | | | 6,095 | | | | 6,665 | | | | 6,246 | | | |
| | | Real Estate | | | | | (38) | | | | (84) | | | | 124 | | | |
| | | Eurasia | | | | | 1,721 | | | | 1,665 | | | | 1,467 | | | |
| | | Mexico | | | | | 6,201 | | | | 5,756 | | | | 5,323 | | | |
| | | South America | | | | | 5,630 | | | | 5,360 | | | | 4,099 | | | |
| | | United States | | | | | 2,101 | | | | 2,243 | | | | 2,182 | | | |
| | | Corporate Center and other adjustments (*) | | | | | (314) | | | | 288 | | | | 88 | | | |
| | | Adjustments and eliminations of ordinary profit between segments | | | | | (439) | | | | (68) | | | | 112 | | | |
| | | Total Ordinary Profit BBVA Group | | | | | 20,958 | | | | 21,824 | | | | 19,640 | | | |
| | | | | | | | | | | | | | | | | | |
Issuances by market type
Changes in debt certificates (including bonds) and subordinated liabilities (see Note 23.3) in the year ended December 31, 2013, 2012 and 2011 by the type of market in which they were issued are as follows:
| | | | | | | | | | | | | | | | | | | | | | | | | | |
| | | | | | | Millions of Euros | | | |
| | | Debt Certificates and Subordinated Liabilities 2013 | | | |
| Balance at the
Beginning |
| | | Issuances | | |
| Repurchase or
Redemption |
| |
| Exchange
Differences and Other(*) |
| |
| Balance at the
End |
| | |
| | | Debt certificates issued in the European Union | | | | | 85,022 | | | | 13,609 | | | | (37,011) | | | | (140) | | | | 61,479 | | | |
| | | With information brochure | | | | | 84,853 | | | | 13,609 | | | | (37,011) | | | | (140) | | | | 61,311 | | | |
| | | Without information brochure | | | | | 169 | | | | - | | | | - | | | | - | | | | 169 | | | |
| | | Other debt certificates issued outside the European Union | | | | | 13,049 | | | | 2,324 | | | | (1,675) | | | | (499) | | | | 13,199 | | | |
| | | Total | | | | | 98,070 | | | | 15,933 | | | | (38,686) | | | | (639) | | | | 74,679 | | | |
| | | | | | | | | | | | | | | | | | | | | | | | | | |
| | | | | | | | | | | | | | | | | | | | | | | | | | |
| | | | | | | Millions of Euros | | | |
| | | Debt Certificates and Subordinated Liabilities 2012 | | | |
| Balance at the
Beginning |
| | | Issuances | | |
| Repurchase or
Redemption |
| |
| Exchange
Differences
and Other |
| |
| Balance at the
End |
| | |
| | | Debt certificates issued in the European Union | | | | | 85,924 | | | | 58,702 | | | | (71,644) | | | | 12,040 | | | | 85,022 | | | |
| | | With information brochure | | | | | 85,855 | | | | 58,602 | | | | (71,644) | | | | 12,040 | | | | 84,853 | | | |
| | | Without information brochure | | | | | 69 | | | | 100 | | | | - | | | | - | | | | 169 | | | |
| | | Other debt certificates issued outside the European Union | | | | | 11,425 | | | | 3,538 | | | | (2,524) | | | | 610 | | | | 13,049 | | | |
| | | Total | | | | | 97,349 | | | | 62,239 | | | | (74,167) | | | | 12,650 | | | | 98,070 | | | |
| | | | | | | | | | | | | | | | | | | | | | | | | | | |
| | | | | | | | | | | | | | | | | | | | | | | | | | |
| | | | | | | | | | | | | | | | | | | | | | | | | | |
| | | | | | | Millions of Euros | | | |
| | | Debt Certificates and Subordinated Liabilities 2011 | | | |
| Balance at the
Beginning |
| | | Issuances | | |
| Repurchase or
Redemption |
| |
| Exchange
Differences
and Other |
| |
| Balance at the
End |
| | |
| | | Debt certificates issued in the European Union | | | | | 93,166 | | | | 104,721 | | | | (97,115) | | | | (14,884) | | | | 85,888 | | | |
| | | With information brochure | | | | | 93,110 | | | | 104,721 | | | | (97,115) | | | | (14,884) | | | | 85,832 | | | |
| | | Without information brochure | | | | | 56 | | | | - | | | | - | | | | - | | | | 56 | | | |
| | | Other debt certificates issued outside the European Union | | | | | 9,433 | | | | 2,277 | | | | (527) | | | | (644) | | | | 10,539 | | | |
| | | Total | | | | | 102,599 | | | | 106,998 | | | | (97,642) | | | | (15,528) | | | | 96,427 | | | |
| | | | | | | | | | | | | | | | | | | | | | | | | | | |
| | | | | | | | | | | | | | | | | | | | | | | | | | |
F-180
Interest and income by geographical area
The breakdown of the balance of “Interest and Similar Income” in the accompanying consolidated income statements by geographical area is as follows:
| | | | | | | | | | | | | | | | | | |
| | | | | | | | | | Millions of Euros | | | |
| | Interest and Similar Income. Breakdown by Geographical Area | | | | 2013 | | | 2012 | | | 2011 | | | |
| | | Domestic market | | | | | 7,965 | | | | 9,299 | | | | 9,584 | | | |
| | | Foreign | | | | | 15,547 | | | | 15,516 | | | | 13,645 | | | |
| | | European Union | | | | | 523 | | | | 757 | | | | 812 | | | |
| | | Rest of OECD | | | | | 7,999 | | | | 8,193 | | | | 7,480 | | | |
| | | Rest of countries | | | | | 7,025 | | | | 6,566 | | | | 5,353 | | | |
| | | Total | | | | | 23,512 | | | | 24,815 | | | | 23,229 | | | |
| | | | | | | | | | | | | | | | | | |
59. Subsequent events
After the year ended December 31, 2013, it is expected that on January 30, 2014, under the powers delegated by the Company’s AGM held on March 16, 2012, the same Board of Directors meeting on January 31, 2013 also submit for approval under point five of the agenda, an agreement for the issue of debentures convertible into ordinary BBVA shares, excluding the preemptive subscription right.
Because of the agreement was approved, and for the purposes set out in articles 414, 417 and 511 of the Spanish Corporations Act, the mandatory Directors report explaining the conversion conditions and types will be issued, justifying the proposal for the abolition of the pre-emptive subscription right, to be accompanied, as appropriate, by another report drafted by an auditor other than the company’s auditor, appointed for this purpose by the Companies Register.
On April 14, 2014, BBVA announced that the trading period for the free allocation rights of the free-of-charge capital increase adopted under Agenda item four section 4.1 by the AGM of BBVA held on March 14, 2014 and corresponding to the “Dividend Option” program had ended that day. As a result of that trading period, the definitive number of BBVA ordinary shares of €0.49 of par value issued in the free-of-charge capital increase is 101,214,267 and the amount of the capital increase is €49,594,990.83.
From January 1, 2014 to the date of preparation of these consolidated financial statements, no other subsequent events not mentioned above in these financial statements have taken place that significantly affect the Group’s earnings or its equity position.
F-181

Appendices
A-1
| APPENDIX I | Additional information on consolidated subsidiaries and consolidated structured entities composing the BBVA Group |
| | | | | | | | | | | | | | | | | | | | | | | | | | | | | | | | | | | | | | | | | | | | | | | | | | | | | | | | | | | | |
| | | | | | | | | | | | | | | | | | | | | | | | | | | | | | | | | | | | | | | | | | | | | | | | | | | | | |
| | | | | | | | | | | | | | | % of Voting Rights | | | | | | | | | | Millions of Euros (*) | | | | | |
| | | | | | | | | | | | | | | | | | | | | | | | | | | | | | | | | |
| | | | | | | | | | | | | | | Controlled by the Bank | | | | | | | | | | Affiliate Entity Data | | | | | |
| | | | | | | | | | | | | | | | | | | | | | | | | | | | | | |
| | | Company | | | | Location | | | | Activity | | | | Direct | | | | | Indirect | | | | | Total | | | | | Net Carrying
Amount | | | | | Assets
12.31.13 | | | | | Liabilities
12.31.13 | | | | | Equity
12.31.13 | | | | | Profit (Loss)
12.31.13 | | | |
| | | AMERICAN FINANCE GROUP, INC. | | | | UNITED STATES | | | | INACTIVE | | | | | - | | | | | | 100.00 | | | | | | 100.00 | | | | | | 15 | | | | | | 15 | | | | | | - | | | | | | 15 | | | | | | - | | | |
| | | ANIDA DESARROLLOS INMOBILIARIOS, S.L. | | | | SPAIN | | | | REAL ESTATE | | | | | - | | | | | | 100.00 | | | | | | 100.00 | | | | | | 93 | | | | | | 511 | | | | | | 423 | | | | | | 122 | | | | | | (34 | ) | | |
| | | ANIDA GERMANIA IMMOBILIEN ONE, GMBH | | | | GERMANY | | | | REAL ESTATE | | | | | - | | | | | | 100.00 | | | | | | 100.00 | | | | | | 4 | | | | | | 7 | | | | | | 1 | | | | | | 5 | | | | | | 2 | | | |
| | | ANIDA GRUPO INMOBILIARIO, S.L. | | | | SPAIN | | | | INVESTMENT COMPANY | | | | | 100.00 | | | | | | - | | | | | | 100.00 | | | | | | 422 | | | | | | 2,087 | | | | | | 1,665 | | | | | | 1,157 | | | | | | (735 | ) | | |
| | | ANIDA INMOBILIARIA, S.A. DE C.V. | | | | MEXICO | | | | INVESTMENT COMPANY | | | | | - | | | | | | 100.00 | | | | | | 100.00 | | | | | | 172 | | | | | | 121 | | | | | | - | | | | | | 155 | | | | | | (34 | ) | | |
| | | ANIDA OPERACIONES SINGULARES, S.A. | | | | SPAIN | | | �� | REAL ESTATE | | | | | - | | | | | | 100.00 | | | | | | 100.00 | | | | | | 220 | | | | | | 4,802 | | | | | | 4,559 | | | | | | 846 | | | | | | (602 | ) | | |
| | | ANIDA PROYECTOS INMOBILIARIOS, S.A. DE C.V. | | | | MEXICO | | | | REAL ESTATE | | | | | - | | | | | | 100.00 | | | | | | 100.00 | | | | | | 85 | | | | | | 136 | | | | | | 50 | | | | | | 88 | | | | | | (2 | ) | | |
| | | ANIDA SERVICIOS INMOBILIARIOS, S.A. DE C.V. | | | | MEXICO | | | | SERVICES | | | | | - | | | | | | 100.00 | | | | | | 100.00 | | | | | | 1 | | | | | | 3 | | | | | | 1 | | | | | | 1 | | | | | | - | | | |
| | | ANIDAPORT INVESTIMENTOS IMOBILIARIOS, UNIPESSOAL, LTDA(**) | | | | PORTUGAL | | | | REAL ESTATE | | | | | - | | | | | | 100.00 | | | | | | 100.00 | | | | | | 32 | | | | | | 103 | | | | | | 80 | | | | | | 25 | | | | | | (3 | ) | | |
| | | APLICA SOLUCIONES TECNOLOGICAS CHILE LIMITADA | | | | CHILE | | | | SERVICES | | | | | - | | | | | | 100.00 | | | | | | 100.00 | | | | | | - | | | | | | 1 | | | | | | - | | | | | | - | | | | | | - | | | |
| | | APLICA TECNOLOGIA AVANZADA OPERADORA, S.A. DE C.V. | | | | MEXICO | | | | SERVICES | | | | | - | | | | | | 100.00 | | | | | | 100.00 | | | | | | 4 | | | | | | 14 | | | | | | 10 | | | | | | 1 | | | | | | 4 | | | |
| | | APLICA TECNOLOGIA AVANZADA SERVICIOS, S.A. DE C.V. | | | | MEXICO | | | | SERVICES | | | | | - | | | | | | 100.00 | | | | | | 100.00 | | | | | | - | | | | | | 2 | | | | | | 2 | | | | | | - | | | | | | - | | | |
| | | APLICA TECNOLOGIA AVANZADA, S.A. DE C.V.- ATA | | | | MEXICO | | | | SERVICES | | | | | 100.00 | | | | | | - | | | | | | 100.00 | | | | | | 105 | | | | | | 248 | | | | | | 114 | | | | | | 127 | | | | | | 7 | | | |
| | | ARIZONA FINANCIAL PRODUCTS, INC | | | | UNITED STATES | | | | FINANCIAL SERVICES | | | | | - | | | | | | 100.00 | | | | | | 100.00 | | | | | | 707 | | | | | | 709 | | | | | | 2 | | | | | | 704 | | | | | | 3 | | | |
| | | ARRAHONA AMBIT, S.L. | | | | SPAIN | | | | REAL ESTATE | | | | | - | | | | | | 100.00 | | | | | | 100.00 | | | | | | 1 | | | | | | 90 | | | | | | 110 | | | | | | (4 | ) | | | | | (16 | ) | | |
| | | ARRAHONA IMMO, S.L. | | | | SPAIN | | | | REAL ESTATE | | | | | - | | | | | | 100.00 | | | | | | 100.00 | | | | | | 30 | | | | | | 325 | | | | | | 251 | | | | | | 94 | | | | | | (20 | ) | | |
| | | ARRAHONA NEXUS, S.L. | | | | SPAIN | | | | REAL ESTATE | | | | | - | | | | | | 100.00 | | | | | | 100.00 | | | | | | - | | | | | | 246 | | | | | | 318 | | | | | | (23 | ) | | | | | (49 | ) | | |
| | | ARRAHONA RENT, S.L.U. | | | | SPAIN | | | | REAL ESTATE | | | | | - | | | | | | 100.00 | | | | | | 100.00 | | | | | | 8 | | | | | | 11 | | | | | | - | | | | | | 11 | | | | | | - | | | |
| | | ARRELS CT FINSOL, S.A. | | | | SPAIN | | | | REAL ESTATE | | | | | - | | | | | | 100.00 | | | | | | 100.00 | | | | | | - | | | | | | 317 | | | | | | 338 | | | | | | 43 | | | | | | (64 | ) | | |
| | | ARRELS CT LLOGUER, S.A. | | | | SPAIN | | | | REAL ESTATE | | | | | - | | | | | | 100.00 | | | | | | 100.00 | | | | | | - | | | | | | 41 | | | | | | 44 | | | | | | (1 | ) | | | | | (2 | ) | | |
| | | ARRELS CT PATRIMONI I PROJECTES, S.A. | | | | SPAIN | | | | REAL ESTATE | | | | | - | | | | | | 100.00 | | | | | | 100.00 | | | | | | - | | | | | | 155 | | | | | | 180 | | | | | | (11 | ) | | | | | (13 | ) | | |
| | | ARRELS CT PROMOU, S.A. | | | | SPAIN | | | | INVESTMENT COMPANY | | | | | - | | | | | | 100.00 | | | | | | 100.00 | | | | | | - | | | | | | 22 | | | | | | 33 | | | | | | (12 | ) | | | | | 1 | | | |
| | | AUMERAVILLA, S.L. | | | | SPAIN | | | | REAL ESTATE | | | | | - | | | | | | 100.00 | | | | | | 100.00 | | | | | | 2 | | | | | | 2 | | | | | | - | | | | | | 2 | | | | | | - | | | |
| | | BAHIA SUR RESORT, S.C. | | | | SPAIN | | | | INACTIVE | | | | | 99.95 | | | | | | - | | | | | | 99.95 | | | | | | 1 | | | | | | 1 | | | | | | - | | | | | | 1 | | | | | | - | | | |
| | | BANCO BILBAO VIZCAYA ARGENTARIA (PORTUGAL), S.A. | | | | PORTUGAL | | | | BANKING | | | | | 52.20 | | | | | | 47.80 | | | | | | 100.00 | | | | | | 207 | | | | | | 5,471 | | | | | | 5,192 | | | | | | 381 | | | | | | (102 | ) | | |
| | | BANCO BILBAO VIZCAYA ARGENTARIA CHILE, S.A. | | | | CHILE | | | | BANKING | | | | | - | | | | | | 68.18 | | | | | | 68.18 | | | | | | 643 | | | | | | 13,903 | | | | | | 12,960 | | | | | | 867 | | | | | | 77 | | | |
| | | BANCO BILBAO VIZCAYA ARGENTARIA URUGUAY, S.A. | | | | URUGUAY | | | | BANKING | | | | | 100.00 | | | | | | - | | | | | | 100.00 | | | | | | 110 | | | | | | 2,133 | | | | | | 1,989 | | | | | | 122 | | | | | | 22 | | | |
| | | BANCO CONTINENTAL, S.A. (1) | | | | PERU | | | | BANKING | | | | | - | | | | | | 46.12 | | | | | | 46.12 | | | | | | 1,171 | | | | | | 14,804 | | | | | | 13,535 | | | | | | 906 | | | | | | 363 | | | |
| | | BANCO DE PROMOCION DE NEGOCIOS, S.A. | | | | SPAIN | | | | BANKING | | | | | - | | | | | | 99.86 | | | | | | 99.86 | | | | | | 15 | | | | | | 19 | | | | | | - | | | | | | 19 | | | | | | - | | | |
| | | BANCO DEPOSITARIO BBVA, S.A. | | | | SPAIN | | | | BANKING | | | | | - | | | | | | 100.00 | | | | | | 100.00 | | | | | | 2 | | | | | | 1,805 | | | | | | 1,767 | | | | | | 21 | | | | | | 17 | | | |
| | | BANCO INDUSTRIAL DE BILBAO, S.A. | | | | SPAIN | | | | BANKING | | | | | - | | | | | | 99.93 | | | | | | 99.93 | | | | | | 95 | | | | | | 95 | | | | | | 1 | | | | | | 93 | | | | | | 2 | | | |
| | | BANCO OCCIDENTAL, S.A. | | | | SPAIN | | | | BANKING | | | | | 49.43 | | | | | | 50.57 | | | | | | 100.00 | | | | | | 17 | | | | | | 18 | | | | | | - | | | | | | 18 | | | | | | - | | | |
| | | BANCO PROVINCIAL OVERSEAS N.V. | | | | CURAÇAO | | | | BANKING | | | | | - | | | | | | 48.00 | | | | | | 48.00 | | | | | | 57 | | | | | | 344 | | | | | | 286 | | | | | | 56 | | | | | | 2 | | | |
| | | BANCO PROVINCIAL S.A.—BANCO UNIVERSAL | | | | VENEZUELA | | | | BANKING | | | | | 1.46 | | | | | | 53.75 | | | | | | 55.21 | | | | | | 493 | | | | | | 22,932 | | | | | | 20,721 | | | | | | 1,566 | | | | | | 645 | | | |
| | | BANCOMER FINANCIAL SERVICES INC. | | | | UNITED STATES | | | | FINANCIAL SERVICES | | | | | - | | | | | | 100.00 | | | | | | 100.00 | | | | | | 2 | | | | | | 2 | | | | | | - | | | | | | 2 | | | | | | - | | | |
| | | BANCOMER FOREIGN EXCHANGE INC. | | | | UNITED STATES | | | | FINANCIAL SERVICES | | | | | - | | | | | | 100.00 | | | | | | 100.00 | | | | | | 8 | | | | | | 27 | | | | | | 19 | | | | | | 5 | | | | | | 3 | | | |
| | | BANCOMER PAYMENT SERVICES INC. | | | | UNITED STATES | | | | FINANCIAL SERVICES | | | | | - | | | | | | 100.00 | | | | | | 100.00 | | | | | | - | | | | | | - | | | | | | - | | | | | | - | | | | | | - | | | |
| | | BANCOMER TRANSFER SERVICES, INC. | | | | UNITED STATES | | | | FINANCIAL SERVICES | | | | | - | | | | | | 100.00 | | | | | | 100.00 | | | | | | 33 | | | | | | 62 | | | | | | 29 | | | | | | 24 | | | | | | 9 | | | |
| | | BBV AMERICA, S.L. | | | | SPAIN | | | | INVESTMENT COMPANY | | | | | 100.00 | | | | | | - | | | | | | 100.00 | | | | | | 479 | | | | | | 1,784 | | | | | | 1 | | | | | | 1,736 | | | | | | 47 | | | |
| | | BBVA ASESORIAS FINANCIERAS, S.A. | | | | CHILE | | | | FINANCIAL SERVICES | | | | | - | | | | | | 100.00 | | | | | | 100.00 | | | | | | 2 | | | | | | 2 | | | | | | - | | | | | | 1 | | | | | | 1 | | | |
| | | Impairment losses due to property, real estate and stocks, of Spanish Real Estate companies, according to Royal Decree-Law 10/2008 and successive, are not counted for purposes of Article 363 of the Companies Act Capital. | | | |
| | | (*) Information on foreign companies at exchange rate on December 31, 2013 | | | |
| | | (**) This company has an equity loan from ANIDA OPERACIONES SINGULARES, S.A. | | | |
| | | (1) Full consolidation method is used according to accounting rules (see Glossary) | | | |
| | | | | | |
A-2
Additional Information on Consolidated Subsidiaries composing the BBVA Group(Continued)
| | | | | | | | | | | | | | | | | | | | | | | | | | | | | | | | | | | | | | | | | | | | |
| | | | | | | | | | | | | % of Voting Rights | | | | | | Millions of Euros (*) | | | | | | |
| | | | | | | | | | | | | Controlled by the Bank | | | | | | Affiliate Entity Data | | | | | | |
| | | | | | | | | | | | | | | | | | | | | | Net | | | | | | | | | | | | Profit | | | |
| | | Company | | | | Location | | Activity | | | | Direct | | | Indirect | | | Total | | | Carrying
Amount | | | Assets
12.31.13 | | | Liabilities
12.31.13 | | | Equity
12.31.13 | | | (Loss)
12.31.13 | | | |
| | | | | | | | | | | | | | |
| | | BBVA ASSET MANAGEMENT ADMINISTRADORA GENERAL DE FONDOS S.A. | | | | CHILE | | FINANCIAL SERVICES | | | | | - | | | | 100.00 | | | | 100.00 | | | | 12 | | | | 14 | | | | 2 | | | | 8 | | | | 4 | | | |
| | | BBVA ASSET MANAGEMENT CONTINENTAL S.A. SAF (1) | | | | PERU | | FINANCIAL SERVICES | | | | | - | | | | 46.12 | | | | 46.12 | | | | 13 | | | | 17 | | | | 4 | | | | 9 | | | | 4 | | | |
| | | BBVA ASSET MANAGEMENT, S.A. SOCIEDAD FIDUCIARIA (BBVA FIDUCIARIA) | | | | COLOMBIA | | FINANCIAL SERVICES | | | | | - | | | | 100.00 | | | | 100.00 | | | | 32 | | | | 35 | | | | 3 | | | | 27 | | | | 6 | | | |
| | | BBVA ASSET MANAGEMENT, S.A., SGIIC | | | | SPAIN | | OTHER INVESTMENT COMPANIES | | | | | 17.00 | | | | 83.00 | | | | 100.00 | | | | 11 | | | | 120 | | | | 72 | | | | 27 | | | | 22 | | | |
| | | BBVA AUTO ENTIDAD DE DESARROLLO A LA PEQUEÑA Y MICRO EMPRESA, EDPYME, S.A. (BBVA AUTO—EDPYME) | | | | PERU | | FINANCIAL SERVICES | | | | | - | | | | 84.32 | | | | 84.32 | | | | - | | | | - | | | | - | | | | - | | | | - | | | |
| | | BBVA AUTOMERCANTIL, COMERCIO E ALUGER DE VEICULOS AUTOMOVEIS,LDA. | | | | PORTUGAL | | FINANCIAL SERVICES | | | | | 100.00 | | | | - | | | | 100.00 | | | | 5 | | | | 26 | | | | 20 | | | | 6 | | | | (1 | ) | | |
| | | BBVA AUTORENTING, S.A. | | | | SPAIN | | SERVICES | | | | | 100.00 | | | | - | | | | 100.00 | | | | 69 | | | | 410 | | | | 370 | | | | 34 | | | | 6 | | | |
| | | BBVA BANCO DE FINANCIACION S.A. | | | | SPAIN | | BANKING | | | | | - | | | | 100.00 | | | | 100.00 | | | | 64 | | | | 3,347 | | | | 3,273 | | | | 74 | | | | - | | | |
| | | BBVA BANCO FRANCES, S.A. | | | | ARGENTINA | | BANKING | | | | | 45.61 | | | | 30.35 | | | | 75.96 | | | | 157 | | | | 6,349 | | | | 5,553 | | | | 518 | | | | 278 | | | |
| | | BBVA BANCOMER GESTION, S.A. DE C.V. | | | | MEXICO | | FINANCIAL SERVICES | | | | | - | | | | 100.00 | | | | 100.00 | | | | 28 | | | | 44 | | | | 16 | | | | 10 | | | | 18 | | | |
| | | BBVA BANCOMER OPERADORA, S.A. DE C.V. | | | | MEXICO | | SERVICES | | | | | - | | | | 100.00 | | | | 100.00 | | | | 108 | | | | 403 | | | | 296 | | | | 62 | | | | 45 | | | |
| | | BBVA BANCOMER SEGUROS SALUD, S.A. DE C.V. | | | | MEXICO | | INSURANCES SERVICES | | | | | - | | | | 100.00 | | | | 100.00 | | | | 18 | | | | 28 | | | | 11 | | | | 16 | | | | 2 | | | |
| | | BBVA BANCOMER SERVICIOS ADMINISTRATIVOS, S.A. DE C.V. | | | | MEXICO | | SERVICES | | | | | - | | | | 100.00 | | | | 100.00 | | | | 11 | | | | 71 | | | | 60 | | | | 6 | | | | 5 | | | |
| | | BBVA BANCOMER USA, INC. | | | | UNITED STATES | | INVESTMENT COMPANY | | | | | - | | | | 100.00 | | | | 100.00 | | | | 47 | | | | 45 | | | | (2 | ) | | | 36 | | | | 11 | | | |
| | | BBVA BANCOMER, S.A.,INSTITUCION DE BANCA MÚLTIPLE, GRUPO FINANCIERO BBVA BANCOMER | | | | MEXICO | | BANKING | | | | | - | | | | 100.00 | | | | 100.00 | | | | 6,966 | | | | 75,330 | | | | 68,386 | | | | 5,117 | | | | 1,827 | | | |
| | | BBVA BRASIL BANCO DE INVESTIMENTO, S.A. | | | | BRASIL | | BANKING | | | | | 100.00 | | | | - | | | | 100.00 | | | | 16 | | | | 35 | | | | 4 | | | | 31 | | | | - | | | |
| | | BBVA BROKER, CORREDURIA DE SEGUROS Y REASEGUROS, S.A. | | | | SPAIN | | FINANCIAL SERVICES | | | | | 99.94 | | | | 0.06 | | | | 100.00 | | | | - | | | | 26 | | | | 7 | | | | 13 | | | | 6 | | | |
| | | BBVA CAPITAL FINANCE, S.A. | | | | SPAIN | | FINANCIAL SERVICES | | | | | 100.00 | | | | - | | | | 100.00 | | | | - | | | | 37 | | | | 37 | | | | - | | | | - | | | |
| | | BBVA CARTERA DE INVERSIONES,SICAV,S.A. | | | | SPAIN | | VARIABLE CAPITAL | | | | | 10.10 | | | | 89.89 | | | | 99.99 | | | | 37 | | | | 13 | | | | 9 | | | | 2 | | | | 1 | | | |
| | | BBVA COLOMBIA, S.A. | | | | COLOMBIA | | BANKING | | | | | 76.20 | | | | 19.23 | | | | 95.43 | | | | 377 | | | | 13,114 | | | | 11,895 | | | | 1,007 | | | | 212 | | | |
| | | BBVA COMERCIALIZADORA LTDA. | | | | CHILE | | FINANCIAL SERVICES | | | | | - | | | | 100.00 | | | | 100.00 | | | | 3 | | | | 6 | | | | 2 | | | | 2 | | | | 2 | | | |
| | | BBVA COMPASS BANCSHARES, INC | | | | UNITED STATES | | INVESTMENT COMPANY | | | | | 100.00 | | | | - | | | | 100.00 | | | | 8,984 | | | | 8,397 | | | | 88 | | | | 7,994 | | | | 315 | | | |
| | | BBVA COMPASS FINANCIAL CORPORATION | | | | UNITED STATES | | FINANCIAL SERVICES | | | | | - | | | | 100.00 | | | | 100.00 | | | | 189 | | | | 237 | | | | 48 | | | | 190 | | | | (1 | ) | | |
| | | BBVA COMPASS INSURANCE AGENCY, INC | | | | UNITED STATES | | FINANCIAL SERVICES | | | | | - | | | | 100.00 | | | | 100.00 | | | | 110 | | | | 112 | | | | 2 | | | | 105 | | | | 6 | | | |
| | | BBVA CONSOLIDAR SEGUROS, S.A. | | | | ARGENTINA | | INSURANCES SERVICES | | | | | 87.78 | | | | 12.22 | | | | 100.00 | | | | 8 | | | | 90 | | | | 63 | | | | 16 | | | | 10 | | | |
| | | BBVA CONSULTING ( BEIJING) LIMITED | | | | CHINA | | FINANCIAL SERVICES | | | | | - | | | | 100.00 | | | | 100.00 | | | | - | | | | 1 | | | | - | | | | 1 | | | | - | | | |
| | | BBVA CONSULTORIA, S.A. | | | | SPAIN | | SERVICES | | | | | - | | | | 100.00 | | | | 100.00 | | | | 4 | | | | 6 | | | | 1 | | | | 4 | | | | - | | | |
| | | BBVA CORREDORA TECNICA DE SEGUROS LIMITADA | | | | CHILE | | FINANCIAL SERVICES | | | | | - | | | | 100.00 | | | | 100.00 | | | | 8 | | | | 12 | | | | 4 | | | | (1 | ) | | | 9 | | | |
| | | BBVA CORREDORES DE BOLSA LIMITADA | | | | CHILE | | #N/A | | | | | - | | | | 100.00 | | | | 100.00 | | | | 45 | | | | 472 | | | | 426 | | | | 40 | | | | 5 | | | |
| | | BBVA DINERO EXPRESS, S.A.U | | | | SPAIN | | FINANCIAL SERVICES | | | | | 100.00 | | | | - | | | | 100.00 | | | | 2 | | | | 5 | | | | 1 | | | | 4 | | | | - | | | |
| | | BBVA DISTRIBUIDORA DE SEGUROS S.R.L. | | | | URUGUAY | | FINANCIAL SERVICES | | | | | - | | | | 100.00 | | | | 100.00 | | | | 1 | | | | 2 | | | | - | | | | - | | | | 1 | | | |
| | | BBVA ELCANO EMPRESARIAL II, S.C.R., S.A. | | | | SPAIN | | VENTURE CAPITAL | | | | | 45.00 | | | | - | | | | 45.00 | | | | 17 | | | | 53 | | | | 9 | | | | 32 | | | | 12 | | | |
| | | BBVA ELCANO EMPRESARIAL, S.C.R., S.A. | | | | SPAIN | | VENTURE CAPITAL | | | | | 45.00 | | | | - | | | | 45.00 | | | | 17 | | | | 53 | | | | 9 | | | | 32 | | | | 12 | | | |
| | | BBVA FACTORING LIMITADA (CHILE) | | | | CHILE | | FINANCIAL SERVICES | | | | | - | | | | 100.00 | | | | 100.00 | | | | 8 | | | | 58 | | | | 50 | | | | 6 | | | | 2 | | | |
| | | BBVA FINANCE (UK), LTD. | | | | UNITED KINGDOM | | FINANCIAL SERVICES | | | | | - | | | | 100.00 | | | | 100.00 | | | | 3 | | | | 12 | | | | - | | | | 12 | | | | - | | | |
| | | BBVA FINANZIA, S.p.A | | | | ITALY | | FINANCIAL SERVICES | | | | | 100.00 | | | | - | | | | 100.00 | | | | 31 | | | | 579 | | | | 556 | | | | 26 | | | | (4 | ) | | |
| | | BBVA FRANCES ASSET MANAGMENT S.A. SOCIEDAD GERENTE DE FONDOS COMUNES DE INVERSIÓN. | | | | ARGENTINA | | FINANCIAL SERVICES | | | | | - | | | | 100.00 | | | | 100.00 | | | | 8 | | | | 12 | | | | 4 | | | | 7 | | | | 1 | | | |
| | | BBVA FRANCES VALORES SOCIEDAD DE BOLSA, S.A. | | | | ARGENTINA | | FINANCIAL SERVICES | | | | | - | | | | 100.00 | | | | 100.00 | | | | 2 | | | | 3 | | | | 1 | | | | 2 | | | | - | | | |
| | | BBVA FUNDOS, S.Gestora Fundos Pensoes,S.A. | | | | PORTUGAL | | PENSION FUNDS MANAGEMENT | | | | | - | | | | 100.00 | | | | 100.00 | | | | 1 | | | | 13 | | | | 1 | | | | 11 | | | | 1 | | | |
| | | BBVA GEST, S.G.DE FUNDOS DE INVESTIMENTO MOBILIARIO, S.A. | | | | PORTUGAL | | #N/A | | | | | - | | | | 100.00 | | | | 100.00 | | | | 1 | | | | 8 | | | | - | | | | 7 | | | | - | | | |
| | Impairment losses due to property, real estate and stocks, of Spanish Real Estate companies, according to Royal Decree-Law 10/2008 and successive, are not counted for purposes of Article 363 of the Companies Act Capital. (*) Information on foreign companies at exchange rate on December 31, 2013 (1) Full consolidation method is used according to accounting rules (see Glossary) | | | | | | | | | | | | | | | | | | | | | | | | | | | | | | | | | | | | | | | | | | |
A-3
Additional Information on Consolidated Subsidiaries composing the BBVA Group (Continued)
| | | | | | | | | | | | | | | | | | | | | | | | | | | | | | | | | | | | |
| | | | | | | % of Voting Rights | | | | | | Millions of Euros (*) | | | | |
| | | | | | | Controlled by the Bank | | | | | | Affiliate Entity Data | | | | |
| | | | | | | | | | | | | | | | Net | | | | | | | | | | | | Profit | |
Company | | Location | | Activity | | Direct | | | Indirect | | | Total | | | Carrying
Amount | | | Assets
12.31.13 | | | Liabilities
12.31.13 | | | Equity
12.31.13 | | | (Loss)
12.31.13 | |
BBVA GLOBAL FINANCE LTD. | | CAYMAN ISLANDS | | FINANCIAL SERVICES | | | 100.00 | | | | - | | | | 100.00 | | | | - | | | | 375 | | | | 371 | | | | 4 | | | | - | |
BBVA GLOBAL MARKETS B.V. | | NETHERLANDS | | FINANCIAL SERVICES | | | 100.00 | | | | - | | | | 100.00 | | | | - | | | | 456 | | | | 456 | | | | - | | | | - | |
BBVA INMOBILIARIA E INVERSIONES, S.A. | | CHILE | | REAL ESTATE | | | - | | | | 68.11 | | | | 68.11 | | | | 4 | | | | 38 | | | | 32 | | | | 7 | | | | - | |
BBVA INSTITUIÇAO FINANCEIRA DE CREDITO, S.A. | | PORTUGAL | | FINANCIAL SERVICES | | | 49.90 | | | | 50.10 | | | | 100.00 | | | | 39 | | | | 300 | | | | 255 | | | | 44 | | | | 2 | |
BBVA INTERNATIONAL LIMITED | | CAYMAN ISLANDS | | FINANCIAL SERVICES | | | 100.00 | | | | - | | | | 100.00 | | | | - | | | | 12 | | | | 9 | | | | 2 | | | | - | |
BBVA INTERNATIONAL PREFERRED, S.A.U. | | SPAIN | | FINANCIAL SERVICES | | | 100.00 | | | | - | | | | 100.00 | | | | - | | | | 1,694 | | | | 1,694 | | | | 1 | | | | - | |
BBVA INVERSIONES CHILE, S.A. | | CHILE | | INVESTMENT COMPANY | | | 61.22 | | | | 38.78 | | | | 100.00 | | | | 483 | | | | 1,263 | | | | 4 | | | | 1,134 | | | | 125 | |
BBVA IRELAND PLC | | IRELAND | | FINANCIAL SERVICES | | | 100.00 | | | | - | | | | 100.00 | | | | 180 | | | | 391 | | | | 193 | | | | 191 | | | | 7 | |
BBVA LEASIMO—SOCIEDADE DE LOCAÇAO FINANCEIRA, S.A. | | PORTUGAL | | FINANCIAL SERVICES | | | - | | | | 100.00 | | | | 100.00 | | | | 9 | | | | 17 | | | | 8 | | | | 9 | | | | - | |
BBVA LUXINVEST, S.A. | | LUXEMBOURG | | INVESTMENT COMPANY | | | 36.00 | | | | 64.00 | | | | 100.00 | | | | 256 | | | | 431 | | | | 6 | | | | 263 | | | | 163 | |
BBVA MEDIACION OPERADOR DE BANCA-SEGUROS VINCULADO, S.A. | | SPAIN | | FINANCIAL SERVICES | | | - | | | | 100.00 | | | | 100.00 | | | | 3 | | | | 145 | | | | 130 | | | | 9 | | | | 5 | |
BBVA NOMINEES LIMITED | | UNITED KINGDOM | | SERVICES | | | 95.00 | | | | - | | | | 95.00 | | | | - | | | | - | | | | - | | | | - | | | | - | |
BBVA PARAGUAY, S.A. | | PARAGUAY | | BANKING | | | 100.00 | | | | - | | | | 100.00 | | | | 23 | | | | 1,322 | | | | 1,199 | | | | 101 | | | | 23 | |
BBVA PARTICIPACIONES MEJICANAS, S.L. | | SPAIN | | INVESTMENT COMPANY | | | 99.00 | | | | 1.00 | | | | 100.00 | | | | - | | | | - | | | | - | | | | - | | | | - | |
BBVA PENSIONES, SA, ENTIDAD GESTORA DE FONDOS DE PENSIONES | | SPAIN | | PENSION FUNDS MANAGEMENT | | | 100.00 | | | | - | | | | 100.00 | | | | 13 | | | | 74 | | | | 42 | | | | 16 | | | | 16 | |
BBVA PLANIFICACION PATRIMONIAL, S.L. | | SPAIN | | FINANCIAL SERVICES | | | 80.00 | | | | 20.00 | | | | 100.00 | | | | - | | | | 1 | | | | - | | | | 1 | | | | - | |
BBVA PREVISIÓN AFP S.A. ADM.DE FONDOS DE PENSIONES | | BOLIVIA | | PENSION FUNDS MANAGEMENT | | | 75.00 | | | | 5.00 | | | | 80.00 | | | | 2 | | | | 12 | | | | 5 | | | | 4 | | | | 3 | |
BBVA PROPIEDAD, S.A. | | SPAIN | | REAL ESTATE INVESTMENT COMPANY | | | - | | | | 100.00 | | | | 100.00 | | | | 1,236 | | | | 1,262 | | | | 14 | | | | 1,320 | | | | (73 | ) |
BBVA RE LIMITED | | IRELAND | | INSURANCES SERVICES | | | - | | | | 100.00 | | | | 100.00 | | | | 1 | | | | 76 | | | | 42 | | | | 25 | | | | 9 | |
BBVA REAL ESTATE MEXICO, S.A. DE C.V. | | MEXICO | | FINANCIAL SERVICES | | | - | | | | 100.00 | | | | 100.00 | | | | - | | | | - | | | | 2 | | | | - | | | | (1 | ) |
BBVA RENTAS E INVERSIONES LIMITADA | | CHILE | | INVESTMENT COMPANY | | | - | | | | 100.00 | | | | 100.00 | | | | 178 | | | | 178 | | | | - | | | | 139 | | | | 39 | |
BBVA RENTING, S.A. | | SPAIN | | FINANCIAL SERVICES | | | 5.94 | | | | 94.06 | | | | 100.00 | | | | 21 | | | | 726 | | | | 654 | | | | 65 | | | | 6 | |
BBVA SECURITIES INC. | | UNITED STATES | | FINANCIAL SERVICES | | | - | | | | 100.00 | | | | 100.00 | | | | 106 | | | | 149 | | | | 43 | | | | 111 | | | | (5 | ) |
BBVA SEGUROS COLOMBIA, S.A. | | COLOMBIA | | INSURANCES SERVICES | | | 94.00 | | | | 6.00 | | | | 100.00 | | | | 10 | | | | 59 | | | | 43 | | | | 13 | | | | 2 | |
BBVA SEGUROS DE VIDA COLOMBIA, S.A. | | COLOMBIA | | INSURANCES SERVICES | | | 94.00 | | | | 6.00 | | | | 100.00 | | | | 14 | | | | 425 | | | | 334 | | | | 65 | | | | 26 | |
BBVA SEGUROS DE VIDA, S.A. | | CHILE | | INSURANCES SERVICES | | | - | | | | 100.00 | | | | 100.00 | | | | 64 | | | | 226 | | | | 161 | | | | 49 | | | | 15 | |
BBVA SEGUROS, S.A., DE SEGUROS Y REASEGUROS | | SPAIN | | INSURANCES SERVICES | | | 94.35 | | | | 5.60 | | | | 99.95 | | | | 431 | | | | 16,243 | | | | 14,932 | | | | 655 | | | | 656 | |
BBVA SENIOR FINANCE, S.A.U. | | SPAIN | | FINANCIAL SERVICES | | | 100.00 | | | | - | | | | 100.00 | | | | - | | | | 11,168 | | | | 11,167 | | | | 1 | | | | - | |
BBVA SERVICIOS CORPORATIVOS LIMITADA | | CHILE | | SERVICES | | | - | | | | 100.00 | | | | 100.00 | | | | 7 | | | | 13 | | | | 6 | | | | 5 | | | | 2 | |
BBVA SERVICIOS, S.A. | | SPAIN | | COMERCIAL | | | - | | | | 100.00 | | | | 100.00 | | | | - | | | | 11 | | | | 2 | | | | 7 | | | | 2 | |
BBVA SOCIEDAD DE LEASING INMOBILIARIO, S.A. | | CHILE | | FINANCIAL SERVICES | | | - | | | | 97.49 | | | | 97.49 | | | | 20 | | | | 62 | | | | 41 | | | | 18 | | | | 3 | |
| | | | | | | | | | |
BBVA SOLUCIONES AVANZADAS DE ASESORAMIENTO Y GESTION, S.L.(**) | | SPAIN | | SERVICES | | | - | | | | 100.00 | | | | 100.00 | | | | 2 | | | | 4 | | | | 1 | | | | 4 | | | | (1 | ) |
BBVA SUBORDINATED CAPITAL S.A.U. | | SPAIN | | FINANCIAL SERVICES | | | 100.00 | | | | - | | | | 100.00 | | | | - | | | | 287 | | | | 286 | | | | 1 | | | | - | |
BBVA SUIZA, S.A. (BBVA SWITZERLAND) | | SWITZERLAND | | BANKING | | | 39.72 | | | | 60.28 | | | | 100.00 | | | | 67 | | | | 1,356 | | | | 890 | | | | 449 | | | | 17 | |
BBVA TRADE, S.A. | | SPAIN | | INVESTMENT COMPANY | | | - | | | | 100.00 | | | | 100.00 | | | | 6 | | | | 24 | | | | 11 | | | | 13 | | | | - | |
BBVA U.S. SENIOR S.A.U. | | SPAIN | | FINANCIAL SERVICES | | | 100.00 | | | | - | | | | 100.00 | | | | - | | | | 2,642 | | | | 2,642 | | | | - | | | | - | |
| | | | | | | | | | |
BBVA VALORES COLOMBIA, S.A. COMISIONISTA DE BOLSA | | COLOMBIA | | SECURITIES DEALER (REAL ESTATE) | | | - | | | | 100.00 | | | | 100.00 | | | | 4 | | | | 5 | | | | 1 | | | | 4 | | | | 1 | |
BBVA WEALTH SOLUTIONS, INC. | | UNITED STATES | | FINANCIAL SERVICES | | | - | | | | 100.00 | | | | 100.00 | | | | 5 | | | | 6 | | | | - | | | | 6 | | | | - | |
BILBAO VIZCAYA HOLDING, S.A. | | SPAIN | | INVESTMENT COMPANY | | | 89.00 | | | | 11.00 | | | | 100.00 | | | | 35 | | | | 156 | | | | 35 | | | | 110 | | | | 11 | |
BLUE INDICO INVESTMENTS, S.L. | | SPAIN | | INVESTMENT COMPANY | | | 100.00 | | | | - | | | | 100.00 | | | | 3 | | | | 17 | | | | 17 | | | | 3 | | | | (3 | ) |
|
| Impairment losses due to property, real estate and stocks, of Spanish Real Estate companies, according to Royal Decree-Law 10/2008 and successive, are not counted for purposes of Article 363 of the Companies Act Capital. |
(*) Information on foreign companies at exchange rate on December 31, 2013
(**) This company has an equity loan from Blue Indico Investments, S.L.
A-4
Additional Information on Consolidated Subsidiaries composing the BBVA Group (Continued)
| | | | | | | | | | | | | | | | | | | | | | | | | | | | | | | | | | | | | | | | |
| | | | | | | | | | | % of Voting Rights
Controlled by the Bank | | | Millions of Euros(*) | |
| | | | | | | | | | | | Affiliate Entity Data | |
| Company | | Location | | | | Activity | | | | Direct | | | Indirect | | | Total | | | Net
Carrying
Amount | | | Assets
12.31.13 | | | Liabilities
12.31.13 | | | Equity
12.31.13 | | | Profit
(Loss)
12.31.13 | |
C B TRANSPORT ,INC. | | UNITED STATES | | | | SERVICES | | | | | - | | | | 100.00 | | | | 100.00 | | | | 13 | | | | 14 | | | | 1 | | | | 12 | | | | 1 | |
CAIXA DE MANLLEU PREFERENTS, S.A. | | SPAIN | | | | FINANCIAL SERVICES | | | | | 100.00 | | | | - | | | | 100.00 | | | | - | | | | - | | | | - | | | | - | | | | - | |
CAIXA TERRASSA SOCIETAT DE PARTICIPACIONS PREFERENTS, S.A.U. | | SPAIN | | | | FINANCIAL SERVICES | | | | | 100.00 | | | | - | | | | 100.00 | | | | 1 | | | | 76 | | | | 75 | | | | 2 | | | | - | |
CAIXASABADELL PREFERENTS, S.A. | | SPAIN | | | | FINANCIAL SERVICES | | | | | 100.00 | | | | - | | | | 100.00 | | | | - | | | | 92 | | | | 91 | | | | 1 | | | | - | |
CAIXASABADELL TINELIA, S.L. | | SPAIN | | | | INVESTMENT COMPANY | | | | | 100.00 | | | | - | | | | 100.00 | | | | 41 | | | | 41 | | | | - | | | | 41 | | | | - | |
CAPITAL INVESTMENT COUNSEL, INC. | | UNITED STATES | | | | FINANCIAL SERVICES | | | | | - | | | | 100.00 | | | | 100.00 | | | | 9 | | | | 11 | | | | 2 | | | | 7 | | | | 2 | |
CARTERA E INVERSIONES S.A., CIA DE | | SPAIN | | | | INVESTMENT COMPANY | | | | | 100.00 | | | | - | | | | 100.00 | | | | 92 | | | | 90 | | | | 56 | | | | 36 | | | | (2 | ) |
CASA DE BOLSA BBVA BANCOMER, S.A. DE C.V. | | MEXICO | | | | FINANCIAL SERVICES | | | | | - | | | | 100.00 | | | | 100.00 | | | | 89 | | | | 130 | | | | 41 | | | | 27 | | | | 61 | |
CATALONIA GEBIRA, S.L,(**) | | SPAIN | | | | REAL ESTATE | | | | | - | | | | 81.66 | | | | 81.66 | | | | - | | | | 45 | | | | 51 | | | | - | | | | (7 | ) |
CATALONIA PROMODIS 4, S.A. | | SPAIN | | | | REAL ESTATE | | | | | - | | | | 100.00 | | | | 100.00 | | | | 2 | | | | 36 | | | | 30 | | | | 9 | | | | (4 | ) |
CDD GESTIONI, S.R.L. | | ITALY | | | | REAL ESTATE | | | | | 100.00 | | | | - | | | | 100.00 | | | | 5 | | | | 6 | | | | - | | | | 6 | | | | - | |
CIA. GLOBAL DE MANDATOS Y REPRESENTACIONES, S.A. | | URUGUAY | | | | IN LIQUIDATION | | | | | - | | | | 100.00 | | | | 100.00 | | | | - | | | | - | | | | - | | | | - | | | | - | |
CIDESSA DOS, S.L. | | SPAIN | | | | INVESTMENT COMPANY | | | | | - | | | | 100.00 | | | | 100.00 | | | | 15 | | | | 15 | | | | - | | | | 15 | | | | - | |
CIDESSA UNO, S.L. | | SPAIN | | | | INVESTMENT COMPANY | | | | | - | | | | 100.00 | | | | 100.00 | | | | 5 | | | | 229 | | | | 172 | | | | 19 | | | | 39 | |
CIERVANA, S.L. | | SPAIN | | | | INVESTMENT COMPANY | | | | | 100.00 | | | | - | | | | 100.00 | | | | 53 | | | | 56 | | | | 3 | | | | 50 | | | | 3 | |
COMERCIALIZADORA CORPORATIVA SAC (1) | | PERU | | | | FINANCIAL SERVICES | | | | | - | | | | 49.99 | | | | 49.99 | | | | - | | | | 1 | | | | 1 | | | | - | | | | - | |
COMERCIALIZADORA DE SERVICIOS FINANCIEROS, S.A. | | COLOMBIA | | | | SERVICES | | | | | - | | | | 100.00 | | | | 100.00 | | | | 1 | | | | 3 | | | | 2 | | | | 1 | | | | - | |
COMPAÑIA CHILENA DE INVERSIONES, S.L. | | SPAIN | | | | INVESTMENT COMPANY | | | | | 100.00 | | | | - | | | | 100.00 | | | | 580 | | | | 883 | | | | 25 | | | | 546 | | | | 312 | |
COMPASS ASSET ACCEPTANCE COMPANY, LLC | | UNITED STATES | | | | FINANCIAL SERVICES | | | | | - | | | | 100.00 | | | | 100.00 | | | | 354 | | | | 354 | | | | - | | | | 354 | | | | - | |
COMPASS AUTO RECEIVABLES CORPORATION | | UNITED STATES | | | | INACTIVE | | | | | - | | | | 100.00 | | | | 100.00 | | | | 3 | | | | 3 | | | | - | | | | 3 | | | | - | |
COMPASS BANK | | UNITED STATES | | | | BANKING | | | | | - | | | | 100.00 | | | | 100.00 | | | | 8,161 | | | | 56,106 | | | | 47,945 | | | | 7,835 | | | | 325 | |
COMPASS CAPITAL MARKETS, INC. | | UNITED STATES | | | | INVESTMENT COMPANY | | | | | - | | | | 100.00 | | | | 100.00 | | | | 5,660 | | | | 5,660 | | | | - | | | | 5,607 | | | | 54 | |
COMPASS CUSTODIAL SERVICES, INC. | | UNITED STATES | | | | INACTIVE | | | | | - | | | | 100.00 | | | | 100.00 | | | | - | | | | - | | | | - | | | | - | | | | - | |
COMPASS GP, INC. | | UNITED STATES | | | | INVESTMENT COMPANY | | | | | - | | | | 100.00 | | | | 100.00 | | | | 35 | | | | 43 | | | | 9 | | | | 35 | | | | - | |
COMPASS INVESTMENTS, INC. | | UNITED STATES | | | | INACTIVE | | | | | - | | | | 100.00 | | | | 100.00 | | | | - | | | | - | | | | - | | | | - | | | | - | |
COMPASS LIMITED PARTNER, INC. | | UNITED STATES | | | | INVESTMENT COMPANY | | | | | - | | | | 100.00 | | | | 100.00 | | | | 4,919 | | | | 4,920 | | | | 1 | | | | 4,868 | | | | 51 | |
COMPASS LOAN HOLDINGS TRS, INC. | | UNITED STATES | | | | FINANCIAL SERVICES | | | | | - | | | | 100.00 | | | | 100.00 | | | | 58 | | | | 58 | | | | - | | | | 58 | | | | - | |
COMPASS MORTGAGE CORPORATION | | UNITED STATES | | | | FINANCIAL SERVICES | | | | | - | | | | 100.00 | | | | 100.00 | | | | 2,159 | | | | 2,179 | | | | 19 | | | | 2,131 | | | | 28 | |
COMPASS MORTGAGE FINANCING, INC. | | UNITED STATES | | | | FINANCIAL SERVICES | | | | | - | | | | 100.00 | | | | 100.00 | | | | - | | | | - | | | | - | | | | - | | | | - | |
COMPASS MULTISTATE SERVICES CORPORATION | | UNITED STATES | | | | INACTIVE | | | | | - | | | | 100.00 | | | | 100.00 | | | | 3 | | | | 4 | | | | 1 | | | | 3 | | | | - | |
COMPASS SOUTHWEST, LP | | UNITED STATES | | | | FINANCIAL SERVICES | | | | | - | | | | 100.00 | | | | 100.00 | | | | 4,048 | | | | 4,060 | | | | 12 | | | | 4,002 | | | | 45 | |
COMPASS TEXAS ACQUISITION CORPORATION | | UNITED STATES | | | | INACTIVE | | | | | - | | | | 100.00 | | | | 100.00 | | | | 2 | | | | 2 | | | | - | | | | 2 | | | | - | |
COMPASS TEXAS MORTGAGE FINANCING, INC | | UNITED STATES | | | | FINANCIAL SERVICES | | | | | - | | | | 100.00 | | | | 100.00 | | | | - | | | | - | | | | - | | | | - | | | | - | |
COMPASS TRUST II | | UNITED STATES | | | | INACTIVE | | | | | - | | | | 100.00 | | | | 100.00 | | | | - | | | | - | | | | - | | | | - | | | | - | |
COMPLEMENTOS INNOVACIÓN Y MODA, S.L.(***) | | SPAIN | | | | IN LIQUIDATION | | | | | - | | | | 100.00 | | | | 100.00 | | | | - | | | | - | | | | - | | | | - | | | | - | |
CONSOLIDAR A.F.J.P., S.A. | | ARGENTINA | | | | IN LIQUIDATION | | | | | 46.11 | | | | 53.89 | | | | 100.00 | | | | 1 | | | | 11 | | | | 9 | | | | 2 | | | | - | |
CONSORCIO DE CASAS MEXICANAS, S.A.P.I. DE C.V. | | MEXICO | | | | REAL ESTATE | | | | | - | | | | 99.81 | | | | 99.81 | | | | - | | | | 26 | | | | 13 | | | | 13 | | | | - | |
CONTENTS AREA, S.L. | | SPAIN | | | | SERVICES | | | | | - | | | | 100.00 | | | | 100.00 | | | | 6 | | | | 7 | | | | 1 | | | | 5 | | | | - | |
| | | | | | | | | | | | |
Impairment losses due to property, real estate and stocks, of Spanish Real Estate companies, according to Royal Decree-Law 10/2008 and successive, are not counted for purposes of Article 363 of the Companies Act Capital. (*) Information on foreign companies at exchange rate on December 31, 2013 (**) This company has an equity loan from ARRELS CT PATRIMONI I PROYECTES, S.A. (***) This company has an equity loan from BBVA ELCANO EMPRESARIAL, S.C.R.S.A. and BBVA ELCANO EMPRESARIAL II, S.C.R.S.A. (1) Full consolidation method is used according to accounting rules (see Glossary) | | | | |
A-5
Additional Information on Consolidated Subsidiaries composing the BBVA Group (Continued)
| | | | | | | | | | | | | | | | | | | | | | | | | | | | | | | | | | | | | | | | |
| | | | | | | | | | | % of Voting Rights | | | Millions of Euros (*) | |
| | | | | | | | | | | Controlled by the Bank | | | Affiliate Entity Data | |
| Company | | | | Location | | Activity | | | | Direct | | | Indirect | | | Total | | | Net Carrying
Amount | | | Assets
12.31.13 | | | Liabilities
12.31.13 | | | Equity
12.31.13 | | | Profit (Loss)
12.31.13 | |
CONTINENTAL BOLSA, SDAD. AGENTE DE
BOLSA, S.A. (1) | | | | PERU | | SECURITIES DEALER (REAL ESTATE) | | | | | - | | | | 46.12 | | | | 46.12 | | | | 7 | | | | 18 | | | | 10 | | | | 5 | | | | 3 | |
CONTINENTAL DPR FINANCE COMPANY | | | | CAYMAN ISLANDS | | FINANCIAL SERVICES | | | | | - | | | | 46.12 | | | | 46.12 | | | | - | | | | 358 | | | | 358 | | | | - | | | | - | |
CONTINENTAL SOCIEDAD TITULIZADORA, S.A. (1) | | | | PERU | | FINANCIAL SERVICES | | | | | - | | | | 46.12 | | | | 46.12 | | | | - | | | | 1 | | | | - | | | | - | | | | - | |
CONTRATACION DE PERSONAL, S.A. DE C.V. | | | | MEXICO | | SERVICES | | | | | - | | | | 100.00 | | | | 100.00 | | | | 4 | | | | 6 | | | | 2 | | | | 4 | | | | 1 | |
COPROMED S.A. DE C.V. | | | | MEXICO | | SERVICES | | | | | - | | | | 100.00 | | | | 100.00 | | | | - | | | | - | | | | - | | | | - | | | | - | |
CORPORACION GENERAL FINANCIERA, S.A. | | | | SPAIN | | INVESTMENT COMPANY | | | | | 100.00 | | | | - | | | | 100.00 | | | | 510 | | | | 959 | | | | 2 | | | | 878 | | | | 79 | |
DESARROLLO URBANISTICO DE CHAMARTIN, S.A. | | | | SPAIN | | REAL ESTATE | | | | | - | | | | 72.50 | | | | 72.50 | | | | 59 | | | | 102 | | | | 21 | | | | 83 | | | | (1) | |
DESITEL TECNOLOGIA Y SISTEMAS, S.A. DE C.V. | | | | MEXICO | | SERVICES | | | | | - | | | | 100.00 | | | | 100.00 | | | | 2 | | | | 2 | | | | - | | | | 2 | | | | - | |
ECASA, S.A. | | | | CHILE | | FINANCIAL SERVICES | | | | | - | | | | 100.00 | | | | 100.00 | | | | 10 | | | | 12 | | | | 2 | | | | 2 | | | | 8 | |
ECOARENYS, S.L.(**) | | | | SPAIN | | REAL ESTATE | | | | | - | | | | 50.00 | | | | 50.00 | | | | - | | | | 19 | | | | 53 | | | | (26 | ) | | | (9) | |
EL ENCINAR METROPOLITANO, S.A. | | | | SPAIN | | REAL ESTATE | | | | | - | | | | 99.05 | | | | 99.05 | | | | 6 | | | | 8 | | | | 2 | | | | 6 | | | | - | |
EL MILANILLO, S.A. | | | | SPAIN | | REAL ESTATE | | | | | - | | | | 100.00 | | | | 100.00 | | | | 12 | | | | 8 | | | | - | | | | 7 | | | | - | |
EL OASIS DE LAS RAMBLAS, S.L. | | | | SPAIN | | REAL ESTATE | | | | | - | | | | 70.00 | | | | 70.00 | | | | - | | | | - | | | | - | | | | - | | | | - | |
EMPRENDIMIENTOS DE VALOR S.A. | | | | URUGUAY | | FINANCIAL SERVICES | | | | | - | | | | 100.00 | | | | 100.00 | | | | 3 | | | | 10 | | | | 7 | | | | 2 | | | | 1 | |
ENTRE2 SERVICIOS FINANCIEROS, E.F.C., S.A. | | | | SPAIN | | FINANCIAL SERVICES | | | | | - | | | | 100.00 | | | | 100.00 | | | | 9 | | | | 9 | | | | 0 | | | | 9 | | | | - | |
ESPAIS SABADELL PROMOCIONS INMOBILIARIES, S.A. | | | | SPAIN | | REAL ESTATE | | | | | - | | | | 100.00 | | | | 100.00 | | | | 5 | | | | 12 | | | | 6 | | | | 6 | | | | - | |
ESPANHOLA COMERCIAL E SERVIÇOS, LTDA. | | | | BRASIL | | FINANCIAL SERVICES | | | | | 100.00 | | | | - | | | | 100.00 | | | | - | | | | - | | | | - | | | | 1 | | | | (1) | |
ESTACION DE AUTOBUSES CHAMARTIN, S.A. | | | | SPAIN | | SERVICES | | | | | - | | | | 51.00 | | | | 51.00 | | | | - | | | | - | | | | - | | | | - | | | | - | |
EUROPEA DE TITULIZACION, S.A., S.G.F.T. | | | | SPAIN | | FINANCIAL SERVICES | | | | | 87.50 | | | | - | | | | 87.50 | | | | 2 | | | | 46 | | | | 13 | | | | 29 | | | | 4 | |
F/11032604 FRACCIONAMIENTO LOARCA TERCERA SECCION | | | | MEXICO | | REAL ESTATE | | | | | - | | | | 60.05 | | | | 60.05 | | | | 1 | | | | 2 | | | | - | | | | 2 | | | | - | |
F/253863 EL DESEO RESIDENCIAL | | | | MEXICO | | REAL ESTATE | | | | | - | | | | 65.00 | | | | 65.00 | | | | - | | | | 1 | | | | - | | | | 1 | | | | - | |
F/403035-9 BBVA HORIZONTES RESIDENCIAL | | | | MEXICO | | REAL ESTATE | | | | | - | | | | 65.00 | | | | 65.00 | | | | 2 | | | | 3 | | | | - | | | | 3 | | | | - | |
FACILEASING EQUIPMENT, S.A. DE C.V. | | | | MEXICO | | FINANCIAL SERVICES | | | | | - | | | | 100.00 | | | | 100.00 | | | | 51 | | | | 518 | | | | 453 | | | | 54 | | | | 10 | |
FACILEASING S.A. DE C.V. | | | | MEXICO | | SERVICES | | | | | - | | | | 100.00 | | | | 100.00 | | | | 60 | | | | 482 | | | | 431 | | | | 44 | | | | 7 | |
FIDEICOMISO 28991-8 TRADING EN LOS MCADOS FINANCIEROS | | | | MEXICO | | FINANCIAL SERVICES | | | | | - | | | | 100.00 | | | | 100.00 | | | | 3 | | | | 3 | | | | - | | | | 2 | | | | - | |
FINANCIERAS DERIVADAS | | | | MEXICO | | FINANCIAL SERVICES | | | | | - | | | | 100.00 | | | | 100.00 | | | | 49 | | | | 50 | | | | 1 | | | | 47 | | | | 2 | |
FIDEICOMISO HARES BBVA BANCOMER F/ 47997-2 | | | | MEXICO | | REAL ESTATE | | | | | - | | | | 100.00 | | | | 100.00 | | | | 36 | | | | 35 | | | | 3 | | | | 32 | | | | - | |
INSTITUCION DE BANCA MULTIPLE, FIDUCIARIO (FIDEIC.00989 6 | | | | MEXICO | | FINANCIAL SERVICES | | | | | - | | | | 100.00 | | | | 100.00 | | | | 4 | | | | 235 | | | | 231 | | | | - | | | | 4 | |
MULTIPLE, INVEX GRUPO FINANCIERO, FIDUCIARIO (FIDEIC. INVEX 1ª | | | | MEXICO | | FINANCIAL SERVICES | | | | | - | | | | 100.00 | | | | 100.00 | | | | - | | | | 60 | | | | 59 | | | | 2 | | | | (1) | |
MULTIPLE, INVEX GRUPO FINANCIERO, FIDUCIARIO (FIDEIC. INVEX 2ª | | | | MEXICO | | FINANCIAL SERVICES | | | | | - | | | | 100.00 | | | | 100.00 | | | | - | | | | 30 | | | | 29 | | | | - | | | | - | |
FIDEICOMISO Nº 781, EN BANCO INVEX, S.A.,INSTITUCION DE BANCA MULTIPLE, INVEX GRUPO FINANCIERO, FIDUCIARIO (FIDEIC. INVEX 3ª EMISION) | | | | MEXICO | | FINANCIAL SERVICES | | | | | - | | | | 100.00 | | | | 100.00 | | | | - | | | | 188 | | | | 139 | | | | 35 | | | | 14 | |
MULTIPLE, INVEX GRUPO FINANCIERO, FIDUCIARIO (FIDEIC. INVEX 4ª | | | | MEXICO | | FINANCIAL SERVICES | | | | | - | | | | 100.00 | | | | 100.00 | | | | - | | | | 152 | | | | 153 | | | | - | | | | - | |
FIDEICOMISO Nº.402900-5 ADMINISTRACION DE INMUEBLES | | | | MEXICO | | FINANCIAL SERVICES | | | | | - | | | | 100.00 | | | | 100.00 | | | | 2 | | | | 3 | | | | - | | | | 2 | | | | - | |
FINANCEIRA DO COMERCIO EXTERIOR S.A.R. | | | | PORTUGAL | | INACTIVE | | | | | 100.00 | | | | - | | | | 100.00 | | | | - | | | | - | | | | - | | | | - | | | | - | |
FINANCIERA AYUDAMOS S.A. DE C.V., SOFOMER | | | | MEXICO | | FINANCIAL SERVICES | | | | | - | | | | 100.00 | | | | 100.00 | | | | 7 | | | | 24 | | | | 17 | | | | 8 | | | | (1) | |
FORUM COMERCIALIZADORA DEL PERU, S.A. | | | | PERU | | SERVICES | | | | | - | | | | 84.32 | | | | 84.32 | | | | 20 | | | | 40 | | | | 20 | | | | 20 | | | | - | |
FORUM DISTRIBUIDORA DEL PERU, S.A. | | | | PERU | | FINANCIAL SERVICES | | | | | - | | | | 84.32 | | | | 84.32 | | | | 5 | | | | 7 | | | | 1 | | | | 6 | | | | - | |
FORUM DISTRIBUIDORA, S.A. | | | | CHILE | | FINANCIAL SERVICES | | | | | - | | | | 75.52 | | | | 75.52 | | | | 15 | | | | 113 | | | | 96 | | | | 14 | | | | 3 | |
FORUM SERVICIOS FINANCIEROS, S.A. | | | | CHILE | | FINANCIAL SERVICES | | | | | - | | | | 75.50 | | | | 75.50 | | | | 122 | | | | 962 | | | | 819 | | | | 94 | | | | 50 | |
FUTURO FAMILIAR, S.A. DE C.V. | | | | MEXICO | | SERVICES | | | | | - | | | | 100.00 | | | | 100 | | | | 1 | | | | 2 | | | | 1 | | | | 1 | | | | - | |
Impairment losses due to property, real estate and stocks, of Spanish Real Estate companies, according to Royal Decree-Law 10/2008 and successive, are not counted for purposes of Article 363 of the Companies Act Capital.
(*) Information on foreign companies at exchange rate on December 31, 2013
(**) This company has an equity loan from PROMOTORA DEL VALLES, S.L.
(1) Full consolidation method is used according to accounting rules (see Glossary)
A-6
Additional Information on Consolidated Subsidiaries composing the BBVA Group (Continued)
| | | | | | | | | | | | | | | | | | | | | | | | | | | | | | | | | | | | |
| | | | | | | % of Voting Rights | | | Millions of Euros(*) | |
| | | | | | | Controlled by the Bank | | | Affiliate Entity Data | |
| Company | | Location | | Activity | | Direct | | | Indirect | | | Total | | | Net Carrying
Amount | | | Assets
12.31.13 | | | Liabilities
12.31.13 | | | Equity
12.31.13 | | | Profit (Loss)
12.31.13 | |
GESTION DE PREVISION Y PENSIONES, S.A. | | SPAIN | | PENSION FUNDS MANAGEMENT | | | 60.00 | | | | - | | | | 60.00 | | | | 9 | | | | 30 | | | | 3 | | | | 21 | | | | 6 | |
GESTION Y ADMINISTRACION DE RECIBOS, S.A. -GARSA | | SPAIN | | SERVICES | | | - | | | | 100.00 | | | | 100.00 | | | | 1 | | | | 1 | | | | - | | | | 1 | | | | - | |
GOBERNALIA GLOBAL NET, S.A. | | SPAIN | | SERVICES | | | - | | | | 100.00 | | | | 100.00 | | | | 1 | | | | 7 | | | | 3 | | | | 3 | | | | 1 | |
GRAN JORGE JUAN, S.A.(**) | | SPAIN | | REAL ESTATE | | | 100.00 | | | | - | | | | 100.00 | | | | 294 | | | | 840 | | | | 588 | | | | 257 | | | | (4) | |
GRANFIDUCIARIA | | COLOMBIA | | IN LIQUIDATION | | | - | | | | 90.00 | | | | 90.00 | | | | - | | | | - | | | | - | | | | - | | | | - | |
GRUPO FINANCIERO BBVA BANCOMER, S.A. DE C.V. | | MEXICO | | FINANCIAL SERVICES | | | 99.97 | | | | - | | | | 99.97 | | | | 6,677 | | | | 8,694 | | | | 1 | | | | 6,438 | | | | 2,254 | |
GRUPO PROFESIONAL PLANEACION Y PROYECTOS, S.A. DE C.V. | | MEXICO | | SERVICES | | | - | | | | 72.06 | | | | 72.06 | | | | 5 | | | | 16 | | | | 11 | | | | 4 | | | | - | |
GUARANTY BUSINESS CREDIT CORPORATION | | UNITED STATES | | FINANCIAL SERVICES | | | - | | | | 100.00 | | | | 100.00 | | | | 27 | | | | 26 | | | | - | | | | 27 | | | | - | |
GUARANTY PLUS HOLDING COMPANY | | UNITED STATES | | COMERCIAL | | | - | | | | 100.00 | | | | 100.00 | | | | (28) | | | | 46 | | | | 74 | | | | (26) | | | | (1) | |
GUARANTY PLUS PROPERTIES LLC-2 | | UNITED STATES | | FINANCIAL SERVICES | | | - | | | | 100.00 | | | | 100.00 | | | | 34 | | | | 34 | | | | - | | | | 34 | | | | - | |
GUARANTY PLUS PROPERTIES, INC-1 | | UNITED STATES | | FINANCIAL SERVICES | | | - | | | | 100.00 | | | | 100.00 | | | | 9 | | | | 9 | | | | - | | | | 9 | | | | - | |
HABITATGES INVERCAP, S.L.(***) | | SPAIN | | REAL ESTATE | | | - | | | | 100.00 | | | | 100.00 | | | | - | | | | - | | | | 1 | | | | (1) | | | | - | |
HABITATGES INVERVIC, S.L.(***) | | SPAIN | | REAL ESTATE | | | - | | | | 35.00 | | | | 35.00 | | | | - | | | | 1 | | | | 10 | | | | (7) | | | | (2) | |
HIPOTECARIA NACIONAL MEXICANA INCORPORATED | | UNITED STATES | | REAL ESTATE | | | - | | | | 100.00 | | | | 100.00 | | | | - | | | | - | | | | - | | | | 0 | | | | - | |
HIPOTECARIA NACIONAL, S.A. DE C.V. | | MEXICO | | FINANCIAL SERVICES | | | - | | | | 100.00 | | | | 100.00 | | | | 11 | | | | 18 | | | | 7 | | | | 8 | | | | 3 | |
HOLDING CONTINENTAL, S.A. | | PERU | | INVESTMENT COMPANY | | | 50.00 | | | | - | | | | 50.00 | | | | 124 | | | | 1,219 | | | | 22 | | | | 722 | | | | 476 | |
HOMEOWNERS LOAN CORPORATION | | UNITED STATES | | INACTIVE | | | - | | | | 100.00 | | | | 100.00 | | | | 7 | | | | 7 | | | | - | | | | 7 | | | | - | |
HUMAN RESOURCES PROVIDER, INC | | UNITED STATES | | SERVICES | | | - | | | | 100.00 | | | | 100.00 | | | | 581 | | | | 583 | | | | 2 | | | | 574 | | | | 7 | |
HUMAN RESOURCES SUPPORT, INC | | UNITED STATES | | SERVICES | | | - | | | | 100.00 | | | | 100.00 | | | | 578 | | | | 578 | | | | - | | | | 572 | | | | 6 | |
IBERNEGOCIO DE TRADE, S.L. | | SPAIN | | COMERCIAL | | | - | | | | 100.00 | | | | 100.00 | | | | 5 | | | | 17 | | | | - | | | | 15 | | | | 2 | |
IMOBILIARIA DUQUE DE AVILA, S.A. | | PORTUGAL | | REAL ESTATE | | | - | | | | 100.00 | | | | 100.00 | | | | 7 | | | | 20 | | | | 14 | | | | 9 | | | | (3) | |
INMESP DESARROLLADORA, S.A. DE C.V. | | MEXICO | | REAL ESTATE | | | - | | | | 100.00 | | | | 100.00 | | | | 35 | | | | 41 | | | | 6 | | | | 35 | | | | - | |
INMUEBLES Y RECUPERACIONES CONTINENTAL
S.A (1) | | PERU | | REAL ESTATE | | | - | | | | 46.12 | | | | 46.12 | | | | 2 | | | | 7 | | | | 5 | | | | - | | | | 2 | |
INNOVATION 4 SECURITY, S.L. | | SPAIN | | SERVICES | | | - | | | | 100.00 | | | | 100.00 | | | | - | | | | 3 | | | | 2 | | | | - | | | | - | |
INVERAHORRO, S.L.(**) | | SPAIN | | INVESTMENT COMPANY | | | 100.00 | | | | - | | | | 100.00 | | | | - | | | | 65 | | | | 69 | | | | (2) | | | | (1) | |
INVERPRO DESENVOLUPAMENT, S.L. | | SPAIN | | INVESTMENT COMPANY | | | - | | | | 100.00 | | | | 100.00 | | | | - | | | | 28 | | | | 25 | | | | 6 | | | | (3) | |
INVERSIONES ALDAMA, C.A. | | VENEZUELA | | IN LIQUIDATION | | | - | | | | 100.00 | | | | 100.00 | | | | - | | | | - | | | | - | | | | - | | | | - | |
INVERSIONES BANPRO INTERNATIONAL INC. N.V. | | CURAÇAO | | IN LIQUIDATION | | | 48.00 | | | | - | | | | 48.00 | | | | 11 | | | | 60 | | | | 2 | | | | 57 | | | | 2 | |
INVERSIONES BAPROBA, C.A. | | VENEZUELA | | FINANCIAL SERVICES | | | 100.00 | | | | - | | | | 100.00 | | | | 1 | | | | 1 | | | | - | | | | 1 | | | | - | |
INVERSIONES DE INNOVACION EN SERVICIOS FINANCIEROS, S.L.(****) | | SPAIN | | INVESTMENT COMPANY | | | - | | | | 100.00 | | | | 100.00 | | | | - | | | | 14 | | | | 14 | | | | - | | | | - | |
INVERSIONES P.H.R.4, C.A. | | VENEZUELA | | INACTIVE | | | - | | | | 60.46 | | | | 60.46 | | | | - | | | | - | | | | - | | | | - | | | | - | |
INVESCO MANAGEMENT Nº 1, S.A. | | LUXEMBOURG | | FINANCIAL SERVICES | | | - | | | | 100.00 | | | | 100.00 | | | | 8 | | | | 8 | | | | - | | | | 9 | | | | - | |
INVESCO MANAGEMENT Nº 2, S.A. | | LUXEMBOURG | | FINANCIAL SERVICES | | | - | | | | 100.00 | | | | 100.00 | | | | - | | | | 6 | | | | 18 | | | | (12) | | | | (1) | |
L’EIX IMMOBLES, S.L.(*****) | | SPAIN | | REAL ESTATE | | | - | | | | 90.00 | | | | 90.00 | | | | - | | | | 21 | | | | 25 | | | | (2) | | | | (1) | |
LIQUIDITY ADVISORS, L.P | | UNITED STATES | | FINANCIAL SERVICES | | | - | | | | 100.00 | | | | 100.00 | | | | 901 | | | | 901 | | | | - | | | | 897 | | | | 4 | |
MISAPRE, S.A. DE C.V. | | MEXICO | | FINANCIAL SERVICES | | | - | | | | 100.00 | | | | 100.00 | | | | 7 | | | | 5 | | | | 1 | | | | 7 | | | | (2) | |
MOMENTUM SOCIAL INVESTMENT 2011, S.L. | | SPAIN | | FINANCIAL SERVICES | | | - | | | | 100.00 | | | | 100.00 | | | | 3 | | | | 3 | | | | - | | | | 3 | | | | - | |
MOMENTUM SOCIAL INVESTMENT 2012, S.L. | | SPAIN | | FINANCIAL SERVICES | | | - | | | | 100.00 | | | | 100.00 | | | | 2 | | | | 2 | | | | - | | | | 2 | | | | - | |
MULTIASISTENCIA OPERADORA S.A. DE C.V. | | MEXICO | | INSURANCES SERVICES | | | - | | | | 100.00 | | | | 100.00 | | | | - | | | | 2 | | | | 2 | | | | - | | | | - | |
MULTIASISTENCIA SERVICIOS S.A. DE C.V. | | MEXICO | | INSURANCES SERVICES | | | - | | | | 100.00 | | | | 100.00 | | | | 1 | | | | 2 | | | | 2 | | | | - | | | | - | |
Impairment losses due to property, real estate and stocks, of Spanish Real Estate companies, according to Royal Decree-Law 10/2008 and successive, are not counted for purposes of Article 363 of the Companies Act Capital.
(*) Information on foreign companies at exchange rate on December 31, 2013
(**) This company has an equity loan from BBVA, S. A.
(***) These companies has an equity loan from lnverpro Desenvolupament, S.L.
(*****) This company has an equity loan from BILBAO VIZCAYA HOLDING, S.A.
(******) This company has an equity loan from PROMOTORA DEL VALLES, S.L.
(1) Full consolidation method is used according to accounting rules (see Glossary)
A-7
Additional Information on Consolidated Subsidiaries composing the BBVA Group (Continued)
| | | | | | | | | | | | | | | | | | | | | | | | | | | | | | | | | | | | | | | | |
| | | | | | | | | % of Voting Rights | | | Millions of Euros(*) | | | |
| | | | | | | | | Controlled by the Bank | | | Affiliate Entity Data | | | |
| | | Company | | Location | | Activity | | Direct | | | Indirect | | | Total | | | Net Carrying
Amount | | | Assets
12.31.13 | | | Liabilities
12.31.13 | | | Equity
12.31.13 | | | Profit (Loss)
12.31.13 | | | |
| | | MULTIASISTENCIA, S.A. DE C.V. | | MEXICO | | INSURANCES SERVICES | | | - | | | | 100.00 | | | | 100.00 | | | | 25 | | | | 33 | | | | 8 | | | | 22 | | | | 4 | | | |
| | | OPCION VOLCAN, S.A. | | MEXICO | | REAL ESTATE | | | - | | | | 100.00 | | | | 100.00 | | | | 53 | | | | 56 | | | | 2 | | | | 49 | | | | 4 | | | |
| | | OPPLUS OPERACIONES Y SERVICIOS, S.A. | | SPAIN | | SERVICES | | | 100.00 | | | | - | | | | 100.00 | | | | 1 | | | | 25 | | | | 17 | | | | 4 | | | | 4 | | | |
| | | OPPLUS S.A.C | | PERU | | SERVICES | | | - | | | | 100.00 | | | | 100.00 | | | | 1 | | | | 1 | | | | - | | | | 1 | | | | - | | | |
| | | PARCSUD PLANNER, S.L. | | SPAIN | | REAL ESTATE | | | - | | | | 100.00 | | | | 100.00 | | | | - | | | | 7 | | | | 8 | | | | (1) | | | | - | | | |
| | | PARTICIPACIONES ARENAL, S.L. | | SPAIN | | INACTIVE | | | - | | | | 100.00 | | | | 100.00 | | | | 8 | | | | 8 | | | | - | | | | 8 | | | | - | | | |
| | | PECRI INVERSION S.A | | SPAIN | | OTHER INVESTMENT COMPANIES | | | 100.00 | | | | - | | | | 100.00 | | | | 95 | | | | 95 | | | | - | | | | 93 | | | | 2 | | | |
| | | PENSIONES BANCOMER, S.A. DE C.V. | | MEXICO | | INSURANCES SERVICES | | | - | | | | 100.00 | | | | 100.00 | | | | 238 | | | | 3,576 | | | | 3,337 | | | | 204 | | | | 34 | | | |
| | | PHOENIX LOAN HOLDINGS, INC. | | UNITED STATES | | FINANCIAL SERVICES | | | - | | | | 100.00 | | | | 100.00 | | | | 417 | | | | 435 | | | | 18 | | | | 410 | | | | 7 | | | |
| | | PI HOLDINGS NO. 1, INC. | | UNITED STATES | | FINANCIAL SERVICES | | | - | | | | 100.00 | | | | 100.00 | | | | 69 | | | | 69 | | | | - | | | | 68 | | | | - | | | |
| | | PI HOLDINGS NO. 3, INC. | | UNITED STATES | | FINANCIAL SERVICES | | | - | | | | 100.00 | | | | 100.00 | | | | 21 | | | | 21 | | | | - | | | | 21 | | | | - | | | |
| | | PROMOCION EMPRESARIAL XX, S.A.(**) | | SPAIN | | INVESTMENT COMPANY | | | 100.00 | | | | - | | | | 100.00 | | | | 1 | | | | 9 | | | | 10 | | | | 1 | | | | (2) | | | |
| | | PROMOTORA DE RECURSOS AGRARIOS, S.A. | | SPAIN | | COMERCIAL | | | 100.00 | | | | - | | | | 100.00 | | | | - | | | | - | | | | - | | | | - | | | | - | | | |
| | | PROMOTORA DEL VALLES, S.L. | | SPAIN | | INVESTMENT COMPANY | | | - | | | | 100.00 | | | | 100.00 | | | | - | | | | 192 | | | | 265 | | | | (59) | | | | (15) | | | |
| | | PROMOU CT 3AG DELTA, S.L. | | SPAIN | | REAL ESTATE | | | - | | | | 100.00 | | | | 100.00 | | | | - | | | | 9 | | | | 10 | | | | - | | | | (1) | | | |
| | | PROMOU CT EIX MACIA, S.L. | | SPAIN | | REAL ESTATE | | | - | | | | 100.00 | | | | 100.00 | | | | - | | | | 13 | | | | 14 | | | | (1) | | | | (1) | | | |
| | | PROMOU CT GEBIRA, S.L. | | SPAIN | | REAL ESTATE | | | - | | | | 100.00 | | | | 100.00 | | | | - | | | | 9 | | | | 11 | | | | (1) | | | | (1) | | | |
| | | PROMOU CT OPENSEGRE, S.L. | | SPAIN | | REAL ESTATE | | | - | | | | 100.00 | | | | 100.00 | | | | - | | | | 18 | | | | 31 | | | | (7) | | | | (6) | | | |
| | | PROMOU CT VALLES, S.L. | | SPAIN | | REAL ESTATE | | | - | | | | 100.00 | | | | 100.00 | | | | 2 | | | | 10 | | | | 8 | | | | 3 | | | | (1) | | | |
| | | PROMOU GLOBAL, S.L.(***) | | SPAIN | | REAL ESTATE | | | - | | | | 100.00 | | | | 100.00 | | | | - | | | | 75 | | | | 114 | | | | (27) | | | | (12) | | | |
| | | PRO-SALUD, C.A. | | VENEZUELA | | INACTIVE | | | - | | | | 58.86 | | | | 58.86 | | | | - | | | | - | | | | - | | | | - | | | | - | | | |
| | | PROVINCIAL DE VALORES CASA DE BOLSA, C.A. | | VENEZUELA | | FINANCIAL SERVICES | | | - | | | | 49.69 | | | | 49.69 | | | | 1 | | | | 3 | | | | 1 | | | | 1 | | | | - | | | |
| | | PROVINCIAL SDAD.ADMIN.DE ENTIDADES DE INV.COLECTIVA, C.A. | | VENEZUELA | | FINANCIAL SERVICES | | | - | | | | 100.00 | | | | 100.00 | | | | 2 | | | | 2 | | | | - | | | | 1 | | | | - | | | |
| | | PROV-INFI-ARRAHONA, S.L.(****) | | SPAIN | | REAL ESTATE | | | - | | | | 100.00 | | | | 100.00 | | | | - | | | | 12 | | | | 17 | | | | (3) | | | | (1) | | | |
| | | | | | | | | | | | |
| | | PROVIVIENDA ENTIDAD RECAUDADORA Y ADMIN.DE APORTES, S.A. | | BOLIVIA | | PENSION FUNDS MANAGEMENT | | | - | | | | 100.00 | | | | 100.00 | | | | 1 | | | | 5 | | | | 4 | | | | 1 | | | | - | | | |
| | | PROXIMA ALFA INVESTMENTS (USA) LLC | | UNITED STATES | | IN LIQUIDATION | | | - | | | | 100.00 | | | | 100.00 | | | | 7 | | | | 1 | | | | - | | | | 1 | | | | - | | | |
| | | PROXIMA ALFA INVESTMENTS HOLDINGS (USA) II INC. | | UNITED STATES | | IN LIQUIDATION | | | - | | | | 100.00 | | | | 100.00 | | | | - | | | | - | | | | - | | | | - | | | | - | | | |
| | | PROXIMA ALFA INVESTMENTS HOLDINGS (USA) INC. | | UNITED STATES | | IN LIQUIDATION | | | 100.00 | | | | - | | | | 100.00 | | | | - | | | | 7 | | | | 3 | | | | 4 | | | | - | | | |
| | | RENTRUCKS, ALQUILER Y SERVICIOS DE TRANSPORTE, S.A. | | SPAIN | | INACTIVE | | | 99.23 | | | | - | | | | 99.23 | | | | 1 | | | | 4 | | | | 3 | | | | 2 | | | | - | | | |
| | | RESIDENCIAL CUMBRES DE SANTA FE, S.A. DE C.V. | | MEXICO | | REAL ESTATE | | | - | | | | 100.00 | | | | 100.00 | | | | 9 | | | | 9 | | | | 2 | | | | 7 | | | | - | | | |
| | | RWHC, INC | | UNITED STATES | | FINANCIAL SERVICES | | | - | | | | 100.00 | | | | 100.00 | | | | 552 | | | | 553 | | | | 1 | | | | 540 | | | | 12 | | | |
| | | SCALDIS FINANCE, S.A. | | BELGIUM | | INVESTMENT COMPANY | | | - | | | | 100.00 | | | | 100.00 | | | | 4 | | | | 18 | | | | - | | | | 18 | | | | - | | | |
| | | SEGUROS BANCOMER, S.A. DE C.V. | | MEXICO | | INSURANCES SERVICES | | | - | | | | 100.00 | | | | 100.00 | | | | 575 | | | | 3,050 | | | | 2,475 | | | | 310 | | | | 265 | | | |
| | | SEGUROS PROVINCIAL, C.A. | | VENEZUELA | | INSURANCES SERVICES | | | - | | | | 100.00 | | | | 100.00 | | | | 47 | | | | 64 | | | | 17 | | | | 44 | | | | 3 | | | |
| | | SERVICIOS CORPORATIVOS BANCOMER, S.A. DE C.V. | | MEXICO | | SERVICES | | | - | | | | 100.00 | | | | 100.00 | | | | 4 | | | | 10 | | | | 6 | | | | 3 | | | | - | | | |
| | | SERVICIOS CORPORATIVOS DE SEGUROS, S.A. DE C.V. | | MEXICO | | SERVICES | | | - | | | | 100.00 | | | | 100.00 | | | | 2 | | | | 8 | | | | 6 | | | | 2 | | | | - | | | |
| | | SERVICIOS EXTERNOS DE APOYO EMPRESARIAL, S.A DE C.V. | | MEXICO | | SERVICES | | | - | | | | 100.00 | | | | 100.00 | | | | 5 | | | | 7 | | | | 2 | | | | 4 | | | | 1 | | | |
| | | SERVICIOS TECNOLOGICOS SINGULARES, S.A. | | SPAIN | | SERVICES | | | - | | | | 100.00 | | | | 100.00 | | | | 2 | | | | 11 | | | | 9 | | | | 2 | | | | - | | | |
| | | EMPRESAS Y PARTICULARES, S.L. | | SPAIN | | SERVICES | | | 100.00 | | | | - | | | | 100.00 | | | | - | | | | 2 | | | | - | | | | 1 | | | | - | | | |
| | | SOCIEDAD DE ESTUDIOS Y ANALISIS FINANCIERO.,S.A. | | SPAIN | | SERVICES | | | 100.00 | | | | - | | | | 100.00 | | | | 112 | | | | 112 | | | | - | | | | 113 | | | | (1) | | | |
|
Impairment losses due to property, real estate and stocks, of Spanish Real Estate companies, according to Royal Decree-Law 10/2008 and successive, are not counted for purposes of Article 363 of the Companies Act Capital. (*) Information on foreign companies at exchange rate on December 31, 2013 (**) This company has an equity loan from BBVA, S. A. (***) This company has an equity loan from ARRELS CT PROMOU, S.A. (****) This company has an equity loan from PROMOTORA DEL VALLES S.L. |
A-8
Additional Information on Consolidated Subsidiaries composing the BBVA Group (Continued) and consolidated structured entities
| | | | | | | | | | | | | | | | | | | | | | | | | | | | | | | | | | | | | | | | | | | | |
| | | | | | | | | | | | | % of Voting Rights | | | | | | Millions of Euros(*) | | | | | | |
| | | | | | | | | | | | | Controlled by the Bank | | | | | | Affiliate Entity Data | | | | | | |
| | | | | | | | | | | | | | |
| | | Company | | | | Location | | Activity | | | | Direct | | | Indirect | | | Total | | | Net Carrying
Amount | | | Assets
12.31.13 | | | Liabilities
12.31.13 | | | Equity
12.31.13 | | | Profit (Loss)
12.31.13 | | | |
| | SOCIEDAD GESTORA DEL FONDO PUBLICO DE REGULACION DEL MERCADO HIPOTECARIO, S.A. | | | | SPAIN | | INACTIVE | | | | | 77.20 | | | | - | | | | 77.20 | | | | - | | | | - | | | | - | | | | - | | | | - | | | |
| | SOCIETE INMOBILIERE BBV D’ILBARRIZ | | | | FRANCE | | REAL ESTATE | | | | | - | | | | 100.00 | | | | 100.00 | | | | 1 | | | | 1 | | | | - | | | | 1 | | | | - | | | |
| | SPORT CLUB 18, S.A. | | | | SPAIN | | INVESTMENT COMPANY | | | | | 100.00 | | | | - | | | | 100.00 | | | | 25 | | | | 25 | | | | 5 | | | | 25 | | | | (5 | ) | | |
| | STATE NATIONAL CAPITAL TRUST I | | | | UNITED STATES | | FINANCIAL SERVICES | | | | | - | | | | 100.00 | | | | 100.00 | | | | - | | | | 11 | | | | 11 | | | | - | | | | - | | | |
| | STATE NATIONAL STATUTORY TRUST II | | | | UNITED STATES | | FINANCIAL SERVICES | | | | | - | | | | 100.00 | | | | 100.00 | | | | - | | | | 7 | | | | 7 | | | | - | | | | - | | | |
| | TEXAS LOAN SERVICES, LP. | | | | UNITED STATES | | FINANCIAL SERVICES | | | | | - | | | | 100.00 | | | | 100.00 | | | | 901 | | | | 902 | | | | - | | | | 895 | | | | 6 | | | |
| | TEXAS REGIONAL STATUTORY TRUST I | | | | UNITED STATES | | FINANCIAL SERVICES | | | | | - | | | | 100.00 | | | | 100.00 | | | | 1 | | | | 37 | | | | 36 | | | | 1 | | | | - | | | |
| | TEXASBANC CAPITAL TRUST I | | | | UNITED STATES | | FINANCIAL SERVICES | | | | | - | | | | 100.00 | | | | 100.00 | | | | 1 | | | | 19 | | | | 18 | | | | 1 | | | | - | | | |
| | TEXTIL TEXTURA, S.L. | | | | SPAIN | | COMERCIAL | | | | | - | | | | 68.67 | | | | 68.67 | | | | 2 | | | | - | | | | - | | | | - | | | | - | | | |
| | TMF HOLDING INC. | | | | UNITED STATES | | INVESTMENT COMPANY | | | | | - | | | | 100.00 | | | | 100.00 | | | | 9 | | | | 12 | | | | 4 | | | | 8 | | | | 1 | | | |
| | TUCSON LOAN HOLDINGS, INC. | | | | UNITED STATES | | FINANCIAL SERVICES | | | | | - | | | | 100.00 | | | | 100.00 | | | | 120 | | | | 120 | | | | - | | | | 118 | | | | 2 | | | |
| | UNIDAD DE AVALUOS MEXICO, S.A. DE CV | | | | MEXICO | | FINANCIAL SERVICES | | | | | - | | | | 100.00 | | | | 100.00 | | | | 2 | | | | 5 | | | | 2 | | | | 2 | | | | - | | | |
| | UNITARIA GESTION DE PATRIMONIOS INMOBILIARIOS | | | | SPAIN | | REAL ESTATE | | | | | - | | | | 100.00 | | | | 100.00 | | | | 2 | | | | 3 | | | | - | | | | 3 | | | | - | | | |
| | UNIVERSALIDAD “E5” | | | | COLOMBIA | | FINANCIAL SERVICES | | | | | - | | | | 100.00 | | | | 100.00 | | | | - | | | | 15 | | | | 13 | | | | 2 | | | | - | | | |
| | UNIVERSALIDAD TIPS PESOS E-9 | | | | COLOMBIA | | FINANCIAL SERVICES | | | | | - | | | | 100.00 | | | | 100.00 | | | | - | | | | 166 | | | | 140 | | | | 22 | | | | 4 | | | |
| | UNNIM SERVEIS DE DEPENDENCIA, S.A. | | | | SPAIN | | SERVICES | | | | | 100.00 | | | | - | | | | 100.00 | | | | - | | | | 1 | | | | - | | | | 1 | | | | - | | | |
| | UNNIM SOCIEDAD PARA LA GESTION DE ACTIVOS INMOBILIARIOS, S.A. | | | | SPAIN | | REAL ESTATE | | | | | 100.00 | | | | - | | | | 100.00 | | | | - | | | | 900 | | | | 853 | | | | 254 | | | | (206 | ) | | |
| | UNNIM VIDA, S.A.DE SEGUROS Y REASEGUROS | | | | SPAIN | | INSURANCES SERVICES | | | | | 100.00 | | | | - | | | | 100.00 | | | | 323 | | | | 2,264 | | | | 1,938 | | | | 291 | | | | 35 | | | |
| | UNO-E BANK, S.A. | | | | SPAIN | | BANKING | | | | | 100.00 | | | | - | | | | 100.00 | | | | 175 | | | | 1,329 | | | | 1,152 | | | | 162 | | | | 15 | | | |
| | URBANIZA DORA SANT LLORENC, S.A. | | | | SPAIN | | INACTIVE | | | | | 60.60 | | | | - | | | | 60.60 | | | | - | | | | - | | | | - | | | | - | | | | - | | | |
| | VALANZA CAPITAL RIESGO S.G.E.C.R. S.A. UNIPERSONAL | | | | SPAIN | | VENTURE CAPITAL | | | | | 100.00 | | | | - | | | | 100.00 | | | | 1 | | | | 13 | | | | 6 | | | | 7 | | | | - | | | |
| | | | | | | | | | | | | | | | | | | | | | | | | | | | | | | | | | | | | | | | | | | | |
| | | | | | | | | | | | | | |
| | Consolidated Structured entities | | | | | | | | | | | | | | | | | | | | | | | | | | | | | | | | | | | | | | | | | | |
| | | CID II FINANCE B.V. | | | | NEDERLANDS | | FINANCIAL SERVICES | | | | | | | | | | | | | | | | | | | | | 414 | | | | 414 | | | | | | | | | | | |
| | | | | | | | | | | | | | | | | | | | | | | | | | | | | | | | | | | | | | | | | | | | |
| | Impairment losses due to property, real estate and stocks, of Spanish Real Estate companies, according to Royal Decree-Law 10/2008 and successive, are not counted for purposes of Article 363 of the Companies Act Capital. | | | | | | | | | | | | | | | | | | | | | | | | | | | | | | | | | | | | | | | | | | |
| | | | | | | | | | | | | | | | | | | | | | | | | | | | | | | | | | | | | | | | | | | | |
| | (*) Information on foreign companies at exchange rate on December 31, 2013 | | | | | | | | | | | | | | | | | | | | | | | | | | | | | | | | | | | | | | | | | | |
A-9
| APPENDIX II | Additional information on investments in associate and joint ventures entities accounted for under the equity method in the BBVA Group |
(Including the most significant entities, jointly representing 98% of all investment in this group)
| | | | | | | | | | | | | | | | | | | | | | | | | | | | | | | | | | | | | | |
| | | | | | | | | | | | | % of Voting Rights | | Millions of Euros (**) | | | |
| | | | | | | | | | | | | Controlled by the Bank | | Affiliate Entity Data | | | |
| | | Company | | | | Location | | Activity | | | | Direct | | Indirect | | Total | | Net Carrying
Amount | | | Assets
12.31.12 | | | Liabilities
12.31.12 | | | Equity
12.31.12 | | | Profit (Loss)
12.31.12 | | | |
| | | ACA, S.A. SOCIEDAD DE VALORES | | | | SPAIN | | REAL ESTATE | | | | 37.50 | | - | | 37.50 | | | 3 | | | | 160 | | | | 138 | | | | 22 | | | | - | (1) | | |
| | | ADQUIRA ESPAÑA, S.A. | | | | SPAIN | | COMERCIAL | | | | - | | 40.00 | | 40.00 | | | 3 | | | | 15 | | | | 9 | | | | 6 | | | | 1 | | | |
| | | ALMAGRARIO, S.A. | | | | COLOMBIA | | SERVICES | | | | - | | 35.38 | | 35.38 | | | 5 | | | | 53 | | | | 17 | | | | 33 | | | | 3 | | | |
| | | ALTITUDE SOFTWARE SGPS, S.A.(*) | | | | PORTUGAL | | SERVICES | | | | - | | 31.00 | | 31.00 | | | 9 | | | | 20 | | | | 16 | | | | 9 | | | | (5) | | | |
| | | | | | | | | | | | | | | |
| | | ALTURA MARKETS, SOCIEDAD DE VALORES, S.A.(*) | | | | SPAIN | | REAL ESTATE | | | | 50.00 | | - | | 50.00 | | | 17 | | | | 862 | | | | 828 | | | | 30 | | | | 3 | | | |
| | | ASOCIACION TECNICA CAJAS DE AHORROS, A.I.E. (ATCA, AIE)(*) | | | | SPAIN | | SERVICES | | | | 31.00 | | - | | 31.00 | | | 2 | | | | 7 | | | | - | | | | 7 | | | | - | | | |
| | | AUREA, S.A. (CUBA) | | | | CUBA | | REAL ESTATE | | | | - | | 49.00 | | 49.00 | | | 3 | | | | 8 | | | | - | | | | 8 | | | | - | | | |
| | | BRUNARA, SICAV, S.A. | | | | SPAIN | | VARIABLE CAPITAL | | | | 1.64 | | 9.39 | | 11.03 | | | 48 | | | | 141 | | | | 1 | | | | 131 | | | | 10 | | | |
| | | CANCUN SUN & GOLF COUNTRY CLUB, S.A.P.I. DE C.V. | | | | MEXICO | | REAL ESTATE | | | | - | | 33.33 | | 33.33 | | | 37 | | | | 74 | | | | 14 | | | | 61 | | | | (1) | | | |
| | | CITIC INTERNATIONAL FINANCIAL HOLDINGS LIMITED CIFH | | | | HONG-KONG | | INVESTMENT COMPANY | | | | 29.68 | | - | | 29.68 | | | 631 | | | | 17,695 | | | | 15,814 | | | | 1,734 | | | | 146 | (1) | | |
| | | COMPAÑIA ESPAÑOLA DE FINANCIACION DEL DESARROLLO S.A. | | | | SPAIN | | FINANCIAL SERVICES | | | | 17.82 | | - | | 17.82 | | | 16 | | | | 88 | | | | 6 | | | | 74 | | | | 8 | | | |
| | | COMPAÑIA MEXICANA DE PROCESAMIENTO, S.A. DE C.V. | | | | MEXICO | | SERVICES | | | | - | | 50.00 | | 50.00 | | | 6 | | | | 17 | | | | 5 | | | | 11 | | | | 1 | | | |
| | | CORPORACION IBV PARTICIPACIONES EMPRESARIALES, S.A.(*) | | | | SPAIN | | INVESTMENT COMPANY | | | | - | | 50.00 | | 50.00 | | | 206 | | | | 443 | | | | 179 | | | | 257 | | | | 7 | (2) | | |
| | | FERROMOVIL 3000, S.L.(*) | | | | SPAIN | | SERVICES | | | | - | | 20.00 | | 20.00 | | | 6 | | | | 605 | | | | 575 | | | | 29 | | | | 1 | | | |
| | | FERROMOVIL 9000, S.L.(*) | | | | SPAIN | | SERVICES | | | | - | | 20.00 | | 20.00 | | | 4 | | | | 387 | | | | 365 | | | | 22 | | | | 1 | | | |
| | | FIDEICOMISO F 403853- 5 BBVA BANCOMER SERVICIOS ZIBATA(*) | | | | MEXICO | | REAL ESTATE | | | | - | | 30.00 | | 30.00 | | | 20 | | | | 111 | | | | 44 | | | | 69 | | | | (2) | | | |
| | | FIDEICOMISO F 404015-0 BBVA BANCOMER LOMAS III | | | | MEXICO | | REAL ESTATE | | | | - | | 25.00 | | 25.00 | | | 3 | | | | 146 | | | | 135 | | | | 10 | | | | 1 | | | |
| | | FIDEICOMISO MIRASIERRA BBVA-BANCOMER Nº F/70413-0(*) | | | | MEXICO | | REAL ESTATE | | | | - | | 38.68 | | 38.68 | | | 12 | | | | 69 | | | | 34 | | | | 33 | | | | 2 | | | |
| | | I+D MEXICO, S.A. DE C.V.(*) | | | | MEXICO | | SERVICES | | | | - | | 50.000 | | 50.00 | | | 14 | | | | 78 | | | | 39 | | | | 25 | | | | 14 | (1) | | |
| | | INVERSIONES PLATCO, C.A.(*) | | | | VENEZUELA | | FINANCIAL SERVICES | | | | - | | 50.00 | | 50.00 | | | 14 | | | | 46 | | | | 18 | | | | 37 | | | | (8) | | | |
| | | METROVACESA, S.A. | | | | SPAIN | | REAL ESTATE | | | | 18.31 | | - | | 18.31 | | | 315 | | | | 5,795 | | | | 5,539 | | | | 442 | | | | (186) | | | |
| | | OCCIDENTAL HOTELES MANAGEMENT, S.L. | | | | SPAIN | | SERVICES | | | | - | | 57.54 | | 57.54 | | | 98 | | | | 666 | | | | 474 | | | | 198 | | | | (6 | )(1) | | |
| | | PARQUE REFORMA SANTA FE, S.A. de C.V. | | | | MEXICO | | REAL ESTATE | | | | - | | 30.00 | | 30.00 | | | 3 | | | | 46 | | | | 35 | | | | 17 | | | | (6) | | | |
| | | PSA FINANCE ARGENTINA COMPAÑIA FINANCIERA, S.A.(*) | | | | ARGENTINA | | FINANCIAL SERVICES | | | | - | | 50.00 | | 50.00 | | | 19 | | | | 297 | | | | 263 | | | | 21 | | | | 13 | | | |
| | | REDSYS SERVICIOS DE PROCESAMIENTO, S.L. | | | | SPAIN | | FINANCIAL SERVICES | | | | 16.75 | | 0.22 | | 16.97 | | | 4 | | | | 83 | | | | 70 | | | | 7 | | | | 6 | | | |
| | | ROMBO COMPAÑIA FINANCIERA, S.A. | | | | ARGENTINA | | FINANCIAL SERVICES | | | | - | | 40.00 | | 40.00 | | | 19 | | | | 308 | | | | 270 | | | | 22 | | | | 16 | | | |
| | | SERVICIOS ELECTRONICOS GLOBALES, S.A. DE C.V. | | | | MEXICO | | SERVICES | | | | - | | 46.14 | | 46.14 | | | 5 | | | | 23 | | | | 12 | | | | 10 | | | | 1 | | | |
| | | SERVICIOS ON LINE PARA USUARIOS MULTIPLES, S.A. (SOLIUM)(*) | | | | SPAIN | | SERVICES | | | | - | | 66.67 | | 66.67 | | | 6 | | | | 14 | | | | 9 | | | | 5 | | | | 1 | (1) | | |
| | | SERVIRED SOCIEDAD ESPAÑOLA DE MEDIOS DE PAGO, S.A. | | | | SPAIN | | FINANCIAL SERVICES | | | | 22.30 | | 0.29 | | 22.59 | | | 8 | | | | 71 | | | | 39 | | | | 28 | | | | 3 | | | |
| | | S.A. | | | | CHILE | | PENSION FUNDS MANAGEMENT | | | | - | | 48.60 | | 48.60 | | | 9 | | | | 7 | | | | - | | | | 7 | | | | - | | | |
| | | TELEFONICA FACTORING ESPAÑA, S.A. | | | | SPAIN | | FINANCIAL SERVICES | | | | 30.00 | | - | | 30.00 | | | 4 | | | | 165 | | | | 152 | | | | 7 | | | | 6 | | | |
| | | TUBOS REUNIDOS, S.A. | | | | SPAIN | | INDUSTRY | | | | - | | 22.07 | | 22.07 | | | 53 | | | | 687 | | | | 443 | | | | 233 | | | | 11 | (1) | | |
| | | TURKIYE GARANTI BANKASI A.S(*) | | | | TURKEY | | BANKING | | | | 25.01 | | - | | 25.01 | | | 3,245 | | | | 17,575 | | | | 15,634 | | | | 1,646 | | | | 295 | (3) | | |
| | | VITAMEDICA ADMINISTRADORA, S.A. DE C.V(*) | | | | MEXICO | | SERVICES | | | | - | | 51.00 | | 51.00 | | | 3 | | | | 14 | | | | 7 | | | | 7 | | | | - | (1) | | |
| | | OTRAS SOCIEDADES | | | | | | | | | | - | | - | | - | | | 98 | | | | - | | | | - | | | | - | | | | - | | | |
| | | (*) Joint venture entities accounted for using the equity method Information on foreign companies at exchange rate on December 31, 2012 | | | | | | | | | | | | | | | | | | | | | | | | | | | | | | | | | | | | |
| | | (1) Consolidated data | | | | | | | | | | | | | | | | | | | | | | | | | | | | | | | | | | | | |
| | | (2) Non-currents sets held for sale | | | | | | | | | | | | | | | | | | | | | | | | | | | | | | | | | | | | |
| | | (3) Information on Garanti Group as of December 31, 2013. Total market capitalization as of December 31, 2013 w as€9,874 million. Total received dividends amounted to€63 million. | | | | | | | | | | | | | | | | | | | | | | | | | | | | | | | | | | | | |
A-10
| APPENDIX III | Changes and notification of investments and divestments in the BBVA Group in 2013 |
| | | | | | | | | | | | | | | | | | | | | | | | | | |
| | | Acquisitions or Increases of Interest Ownership in Consolidated Subsidiaries | | |
| | | | | | | | | | | | | Millions of Euros | | | % of Voting Rights | | | | |
| | | Company | | | | Type of
Transaction | | Activity | | | | Price Paid in the
Transactions +
Expenses
directly
attributable to
the
Transactions | | | Fair Value of
Equity
Instruments
issued for
the
Transactions | | | % Participation
(net) Acquired in the Period | | Total Voting
Rights
Controlled
after the
Transactions | | Effective Date for
the Transaction
(or Notification
Date) | | |
| | | INVERSIONES PREVISIONALES, S.A. | | | | FOUNDING | | FINANCIAL SERVICES | | | | | 126 | | | | - | | | 100.00% | | 100.00% | | 28/02/2013 | | |
| | | UNNIM PROTECCIO, S.A. | | | | ACQUISITION | | INSURANCES SERVICES | | | | | 68 | | | | - | | | 50.00% | | 100.00% | | 28/02/2013 | | |
| | | UNNIM VIDA, S.A.DE SEGUROS Y REASEGUROS | | | | ACQUISITION | | INSURANCES SERVICES | | | | | 353 | | | | - | | | 50.00% | | 100.00% | | 07/05/2013 | | |
| | | MOMENTUM SOCIAL INVESTMENT 2012, S.L. | | | | FOUNDING | | INVESTMENT COMPANY | | | | | 2 | | | | - | | | 100.00% | | 100.00% | | 30/05/2013 | | |
| | | FIDEICOMISO N.989, EN THE BANK OF NEW YORK MELLON, S.A. | | | | | | | | | | | | | | | | | | | | | | | | |
| | | INSTITUCION DE BANCA MULTIPLE, FIDUCIARIO (FIDEIC.00989 6 EMISION) | | | | FOUNDING | | FINANCIAL SERVICES | | | | | - | | | | - | | | 100.00% | | 100.00% | | 30/06/2013 | | |
| | | FIDEICOMISO HARES BBVA BANCOMER F/ 47997-2 | | | | DILUTION EFFECT | | REAL ESTATE | | | | | - | | | | - | | | 2.21% | | 100.00% | | 31/07/2013 | | |
| | | BBVA AUTO ENTIDAD DE DESARROLLO A LA PEQUEÑA Y MICRO EMPRESA, EDPYME, S.A. | | | | FOUNDING | | FINANCIAL SERVICES | | | | | - | | | | - | | | 84.32% | | 84.32% | | 28/11/2013 | | |
| | | INMESP DESARROLLADORA, S.A. DE C.V. | | | | ACQUISITION | | REAL ESTATE | | | | | 67 | | | | - | | | 100.00% | | 100.00% | | 30/11/2013 | | |
| | | CONSORCIO DE CASAS MEXICANAS, S.A.P.I. DE C.V. | | | | ACQUISITION | | REAL ESTATE | | | | | - | | | | - | | | 99.81% | | 99.81% | | 30/11/2013 | | |
| | | F/403035-9 HORIZONTES RESIDENCIAL | | | | ACQUISITION | | REAL ESTATE | | | | | 2 | | | | - | | | 65.00% | | 65.00% | | 30/11/2013 | | |
| | | F/11032604 FRACCIONAMIENTO LOARCA TERCERA SECCION | | | | ACQUISITION | | REAL ESTATE | | | | | 1 | | | | - | | | 60.05% | | 60.05% | | 30/11/2013 | | |
| | | F/253863 EL DESEO RESIDENCIAL | | | | ACQUISITION | | REAL ESTATE | | | | | 1 | | | | - | | | 65.00% | | 65.00% | | 30/11/2013 | | |
A-11
Disposals or Reduction of Interest Ownership in Consolidated Subsidiaries
| | | | | | | | | | | | | | | | | | | | | | | | |
| | | | | | | | | | | | | Millions of Euros | | | % of Voting Rights |
| | | Company | | | | Type of Transaction | | Activity | | | | Profit (Loss)
in the Transaction | | | Changes in the
Equity due to the
transaction | | | % Participation
Sold in the Period | | Total Voting Rights
Controlled after the Disposal | | Effective Date for
the Transaction
(or Notification
Date) |
| | | | | | | | | | |
| | | ADMINISTRADORA DE FONDOS PARA EL RETIRO-BANCOMER,S.A DE C.V. (*) | | | | DISPOSAL | | PENSION FUND MANAGEMENT | | | | | 771 | | | | - | | | 100.00% | | 0.00% | | 09/01/2013 |
| | | BBVA AUTORENTING SPA | | | | DISPOSAL | | SERVICES | | | | | - | | | | - | | | 100.00% | | 0.00% | | 27/02/2013 |
| | | BBVA RENTING, SPA | | | | DISPOSAL | | SERVICES | | | | | - | | | | - | | | 100.00% | | 0.00% | | 27/02/2013 |
| | | | | | | | | | |
| | | BBVA HORIZONTE PENSIONES Y CESANTIAS, S.A. (*) | | | | DISPOSAL | | PENSION FUND MANAGEMENT | | | | | 255 | | | | - | | | 99.96% | | 0.00% | | 18/04/2013 |
| | | | | | | | | | |
| | | AFP HORIZONTE, S.A. (*) | | | | DISPOSAL | | PENSION FUND MANAGEMENT | | | | | 206 | | | | - | | | 100.00% | | 0.00% | | 23/04/2013 |
| | | ITINERARI 2002, S.L. | | | | DISPOSAL | | SERVICES | | | | | - | | | | - | | | 52.08% | | 0.00% | | 30/04/2013 |
| | | BBVA COMPASS BANCSHARES, INC. (1) | | | | MERGER | | INVESTMENT COMPANY | | | | | - | | | | - | | | 100.00% | | 0.00% | | 14/05/2013 |
| | | BBVA COMPASS INVESTMENT SOLUTIONS, INC (2) | | | | MERGER | | FINANCIAL SERVICES | | | | | - | | | | - | | | 100.00% | | 0.00% | | 16/05/2013 |
| | | UNNIM BANC, S.A.(3) | | | | MERGER | | BANKING | | | | | - | | | | - | | | 100.00% | | 0.00% | | 23/05/2013 |
| | | VIRTUAL DOC, S.L. | | | | LIQUIDATION | | SERVICES | | | | | - | | | | - | | | 70.00% | | 0.00% | | 31/05/2013 |
| | | BBVA BANCO FRANCES, S.A. | | | | DISPOSAL | | BANKING | | | | | - | | | | - | | | 0.02% | | 75.96% | | 30/06/2013 |
| | | | | | | | | | |
| | | BBVA & PARTNERS SICAV SIF EQUITY ARBITRAGE MASTER SIF | | | | DISPOSAL | | VARIABLE CAPITAL | | | | | - | | | | - | | | 100.00% | | 0.00% | | 30/06/2013 |
| | | RIVERWAY HOLDINGS CAPITAL TRUST I | | | | LIQUIDATION | | FINANCIAL SERVICES | | | | | - | | | | - | | | 100.00% | | 0.00% | | 30/06/2013 |
| | | FORUM COMERCIALIZADORA DEL PERU, S.A. | | | | DISPOSAL | | SERVICES | | | | | - | | | | - | | | 15.68% | | 84.32% | | 26/07/2013 |
| | | FORUM DISTRIBUIDORA DEL PERU, S.A. | | | | DISPOSAL | | FINANCIAL SERVICES | | | | | - | | | | - | | | 15.68% | | 84.32% | | 26/07/2013 |
| | | FIDEICOMISO F/29763-0 SOCIO LIQUIDADOR DE OPERACIONES FINANCIERAS | | | | | | | | | | | | | | | | | | | | | | |
| | | DERIVADAS CUENTA PROPIA | | | | LIQUIDATION | | FINANCIAL SERVICES | | | | | - | | | | - | | | 100.00% | | 0.00% | | 31/07/2013 |
| | | UNICOM TELECOMUNICACIONES S.DE R.L. DE C.V. | | | | LIQUIDATION | | SERVICES | | | | | - | | | | - | | | 100.00% | | 0.00% | | 30/08/2013 |
| | | | | | | | | | |
| | | UNNIMCAIXA OPERADOR DE BANCA D’ASSEGURANCES VINCULAT, S.L.(4) | | | | MERGER | | FINANCIAL SERVICES | | | | | - | | | | - | | | 100.00% | | 0.00% | | 01/10/2013 |
| | | ADMINISTRADORA DE FONDOS DE PENSIONES PROVIDA, S.A. (AFP PROVIDA) (*) | | | | DISPOSAL | | PENSION FUND MANAGEMENT | | | | | 500 | | | | - | | | 64.32% | | 0.00% | | 02/10/2013 |
| | | | | | | | | | |
| | | AFP GENESIS ADMINISTRADORA DE FONDOS Y FIDEICOMISOS, S.A. | | | | DISPOSAL | | PENSION FUND MANAGEMENT | | | | | - | | | | - | | | 100.00% | | 0.00% | | 02/10/2013 |
| | | INVERSIONES PREVISIONALES, S.A. | | | | DISPOSAL | | INVESTMENT COMPANY | | | | | - | | | | - | | | 100.00% | | 0.00% | | 02/10/2013 |
| | | | | | | | | | |
| | | PROVIDA INTERNACIONAL, S.A. | | | | DISPOSAL | | PENSION FUND MANAGEMENT | | | | | - | | | | - | | | 100.00% | | 0.00% | | 02/10/2013 |
| | | UNNIM PROTECCIÓ, S.A. (5) | | | | MERGER | | INSURANCES SERVICES | | | | | - | | | | | | | 100.00% | | 0.00% | | 31/10/2013 |
| | | | | | | | | | |
| | | BBVA PATRIMONIOS GESTORA SGIIC, S.A. (6) | | | | MERGER | | OTHER INVESTMENT COMPANIE | | | | | - | | | | - | | | 100.00% | | 0.00% | | 13/11/2013 |
| | | VISACOM, S.A. DE C.V. | | | | LIQUIDATION | | SERVICES | | | | | 1 | | | | - | | | 100.00% | | 0.00% | | 11/12/2013 |
| | | PORT ARTHUR ABSTRACT & TITLE COMPANY | | | | LIQUIDATION | | FINANCIAL SERVICES | | | | | - | | | | - | | | 100.00% | | 0.00% | | 19/12/2013 |
| | | SOUTHEAST TEXAS TITLE COMPANY | | | | LIQUIDATION | | FINANCIAL SERVICES | | | | | - | | | | - | | | 100.00% | | 0.00% | | 19/12/2013 |
| | | TWOENC, INC | | | | LIQUIDATION | | FINANCIAL SERVICES | | | | | - | | | | - | | | 100.00% | | 0.00% | | 19/12/2013 |
| | | PI HOLDINGS NO. 4, INC. | | | | LIQUIDATION | | FINANCIAL SERVICES | | | | | - | | | | - | | | 100.00% | | 0.00% | | 19/12/2013 |
| | | | | | | | | | |
| | | RIVER OAKS BANK BUILDING, INC. | | | | LIQUIDATION | | INSTRUMENTAL REAL ESTATE | | | | | - | | | | - | | | 100.00% | | 0.00% | | 19/12/2013 |
| | | COMPASS WEALTH MANAGERS COMPANY | | | | LIQUIDATION | | SERVICES | | | | | - | | | | - | | | 100.00% | | 0.00% | | 19/12/2013 |
| | | RIVER OAKS TR CORPORATION | | | | LIQUIDATION | | FINANCIAL SERVICES | | | | | - | | | | - | | | 100.00% | | 0.00% | | 19/12/2013 |
| | | BANCO BILBAO VIZCAYA ARGENTARIA (PANAMA), S.A. | | | | DISPOSAL | | BANKING | | | | | 230 | | | | - | | | 98.93% | | 0.00% | | 19/12/2013 |
| | | | | | | | | | |
| | | TRANSITORY CO | | | | DISPOSAL | | INSTRUMENTAL REAL ESTATE | | | | | - | | | | - | | | 100.00% | | 0.00% | | 19/12/2013 |
| | | INGENIERIA EMPRESARIAL MULTIBA, S.A. DE C.V. | | | | LIQUIDATION | | SERVICES | | | | | - | | | | - | | | 99.99% | | 0.00% | | 31/12/2013 |
| | | BANCO PROVINCIAL S.A.—BANCO UNIVERSAL | | | | DISPOSAL | | BANKING | | | | | - | | | | (3 | ) | | 0.39% | | 55.21% | | 31/12/2013 |
| | | | | | | | | | |
| | | UNNIM GESFONS SGIIC, S.A. | | | | LIQUIDATION | | OTHER INVESTMENT COMPANIE | | | | | - | | | | - | | | 100.00% | | 0.00% | | 31/12/2013 |
| | | | | | | | | | |
| | | Structured Entities: | | | | | | | | | | | | | | | | | | | | | | |
| | | BOIRO FINANCE B.V. | | | | LIQUIDATION | | FINANCIAL SERVICES | | | | | - | | | | - | | | | | | | 31/10/2013 |
| | | | | | | | | | | | | | | | | | | | | | | | |
| | (1) Absorbed by BBVA USA Bancshares inc. | | | | | | | | | | | | | | | | | | | | | | |
| | (2) Absorbed by BBVA S.A. | | | | | | | | | | | | | | | | | | | | | | |
| | (3) Absorbed by BBVA Securities Inc. | | | | | | | | | | | | | | | | | | | | | | |
| | (4) Absorbed by BBVA Mediación Operador de Banca-Seguros Vinculado, S.A. | | | | | | | | | | | | | | | | | | | | | | |
| | (5) Absorbed by BBVA Seguros, S.A., De Seguros y Reaseguros | | | | | | | | | | | | | | | | | | | | | | |
| | (6) Absorbed by BBVA Asset Management, S.A., SGIIC | | | | | | | | | | | | | | | | | | | | | | |
| | (*) Profit refers to net profit attributable | | | | | | | | | | | | | | | | | | | | | | |
A-12
Business Combinations and Other Acquisitions or Increases of Interest Ownership in Associates and Joint-Ventures Accounted for Under the Equity Method
| | | | | | | | | | | | | | | | | | | | | | | | | | | | |
| | | | | | | | | | | Millions of Euros | | | % of Voting Rights | |
| Company | | | | Type of
Transaction | | Activity | | | | Price Paid in the
Transactions +
Expenses Directly
Attributable to the
Transactions | | | Fair Value of
Equity
Instruments
Issued for the
Transactions | | | % Participation
(Net)
Acquired
in the Period | | | Total Voting
Rights
Controlled After
the
Transactions | | | Effective Date for
the Transaction
(or Notification
Date) | |
OSONA CIPSA, S.L. | | | | ACQUISITION | | IN LIQUIDATION | | | | | - | | | | - | | | | 50.00 | % | | | 50.00 | % | | | 31/03/2013 | |
NAVIERA ATTILA, AIE | | | | ACQUISITION | | SERVICES | | | | | - | | | | - | | | | 21.01 | % | | | 21.01 | % | | | 30/04/2013 | |
NAVIERA ELECTRA, AIE | | | | ACQUISITION | | SERVICES | | | | | - | | | | - | | | | 21.00 | % | | | 21.00 | % | | | 30/04/2013 | |
NAVIERA CABO ESTAY, AIE | | | | ACQUISITION | | SERVICES | | | | | - | | | | - | | | | 16.00 | % | | | 16.00 | % | | | 30/04/2013 | |
METROVACESA, S.A. (1) | | | | ACQUISITION | | REAL ESTATE | | | | | 22 | | | | - | | | | 0.94 | % | | | 18.31 | % | | | 16/05/2013 | |
VITAMEDICA ADMINISTRADORA S.A. DE C.V | | | | FOUNDING | | SERVICES | | | | | 2 | | | | - | | | | 51.00 | % | | | 51.00 | % | | | 01/07/2013 | |
VITAMEDICA S.A DE C.V. | | | | DILUTION EFFECT | | INSURANCES SERVICES | | | | | - | | | | - | | | | 0.01 | % | | | 51.00 | % | | | 30/09/2013 | |
FIDEICOMISO MIRASIERRA BBVA-BANCOMER Nº F/70413-0 | | | | DILUTION EFFECT | | REAL ESTATE | | | | | - | | | | - | | | | 1.22 | % | | | 38.68 | % | | | 28/11/2013 | |
CANCUN SUN & GOLF COUNTRY CLUB, S.A.P.I. DE C.V. | | | | ACQUISITION | | REAL ESTATE | | | | | 39 | | | | - | | | | 33.33 | % | | | 33.33 | % | | | 30/11/2013 | |
FIDEICOMISO 1729 INVEX ENAJENACION DE CARTERA | | | | FOUNDING | | INSTRUMENTAL REAL ESTATE | | | | | 63 | | | | - | | | | 32.25 | % | | | 32.25 | % | | | 30/12/2013 | |
RESIDENCIAL SARRIA-BONANOVA, S.L. | | | | DILUTION EFFECT | | REAL ESTATE | | | | | - | | | | - | | | | 1.69 | % | | | 27.22 | % | | | 30/12/2013 | |
| | | | | | | | | |
| (1) Unlisted in the Stock Market since May 23, 2013 | | | | | | | | | | | | | | | | | | | | | | | | | | | | |
A-13
Disposal or Reduction of Interest Ownership in Associates and Joint-Ventures Companies Accounted for Under the Equity Method
| | | | | | | | | | | | | | | | |
| | | | | | | | | | | Millions of
Euros | | % of Voting Rights | | Effective Date for
the Transaction
(or Notification
Date) |
| Company | | | | Type of Transaction | | Activity | | | | Profit (Loss)
in the
Transaction | | % Participation
Sold in the Period | | Total Voting
Rights
Controlled after
the Disposal | |
GARANTI TEKNOLOJINET ILETISIM HIZ. VE TIC. A.S. (GARANTI TEKNOLOJINET) | | | | LIQUIDATION | | SERVICES | | | | - | | 99.99% | | - | | 28/02/2013 |
ADMINISTRADORA DE SOLUCIONES INTEGRALES, S.A. (ASI,S.A.) | | | | DISPOSAL | | FINANCIAL SERVICES | | | | 3 | | 34.00% | | - | | 30/03/2013 |
REDSYS SERVICIOS DE PROCESAMIENTO, S.L. | | | | DISPOSAL | | FINANCIAL SERVICES | | | | - | | 0.28% | | 16.97% | | 30/03/2013 |
ACTIVA CT BADEBAÑO, S.L. | | | | DISPOSAL | | COMMERCIAL | | | | - | | 50.00% | | - | | 05/04/2013 |
FIDEICOMISO MIRASIERRA BBVA-BANCOMER Nº F/70413-0 | | | | DILUTION EFFECT | | REAL ESTATE | | | | - | | 7.90% | | 37.45% | | 30/04/2013 |
VANTOUREIX, S.L. | | | | DISPOSAL | | REAL ESTATE | | | | 11 | | 40.72% | | 0.00% | | 30/07/2013 |
| | | | | | | | |
ADMINISTRADORA DE FONDOS DE CESANTIA DE CHILE, S.A. | | | | DISPOSAL | | PENSION FUND MANAGEMENT | | | | - | | 60.90% | | 0.00% | | 02/10/2013 |
INVERSIONES DCV S.A. | | | | DISPOSAL | | PENSION FUND MANAGEMENT | | | | - | | 23.14% | | 4.06% | | 02/10/2013 |
SERVICIOS DE ADMINISTRACION PREVISIONAL, S.A. | | | | DISPOSAL | | PENSION FUND MANAGEMENT | | | | - | | 37.87% | | 0.00% | | 02/10/2013 |
CHINA CITIC BANK CORPORATION LIMITED CNCB | | | | DISPOSAL | | BANKING | | | | (2,600) | | 15.00% | | 0.00% | | 21/10/2013 |
TUBOS REUNIDOS, S.A. | | | | DISPOSAL | | INDUSTRY | | | | 1 | | 0.70% | | 22.07% | | 14/11/2013 |
COMPAÑIA ESPAÑOLA DE FINANCIACION DEL DESARROLLO S.A. | | | | DISPOSAL | | FINANCIAL SERVICES | | | | - | | 0.99% | | 17.82% | | 31/12/2013 |
Changes in other Companies quoted recognize as Available-For-Sale
| | | | | | | | | | | | | | | | |
| | | | | | | | | | | % of Voting Rights | | | | Effective Date for
the Transaction
(or Notification
Date) |
| Company | | | | Type of
Transaction | | Activity | | | | % Participation Acquired (Sold) in the Period | | Totally Controlled after Transaction | | | |
| | | | | | | | |
BOLSAS Y MERCADOS ESPAÑOLES SDAD.HOLDING MDOS.Y STMAS.FIN., S.A. | | | | DISPOSAL | | FINANCIAL SERVICES | | | | -1.00% | | 4.09% | | | | 15/07/2013 |
| | | | | | | | |
COMPANYIA D’AIGUES DE SABADELL SA. | | | | DISPOSAL | | SERVICES | | | | -7.25% | | - | | | | 16/07/2013 |
BOLSAS Y MERCADOS ESPAÑOLES SDAD.HOLDING MDOS.Y STMAS.FIN., S.A. | | | | DISPOSAL | | FINANCIAL SERVICES | | | | -0.60% | | 2.53% | | | | 14/08/2013 |
A-14
| APPENDIX IV | Fully consolidated subsidiaries with more than 10% owned by non-Group shareholders as of December 31, 2013 |
| | | | | | | | | | | | | | | | |
| | | | | | | | | | | % of Voting Rights | | �� |
| | | | | | | | | | | Controlled by the Bank | | |
| | | Company | | | | Activity | | | | Direct | | Indirect | | Total | | |
| | | BANCO BILBAO VIZCAYA ARGENTARIA CHILE, S.A. | | | | BANKING | | | | - | | 68.18 | | 68.18 | | |
| | | BANCO PROVINCIAL S.A.—BANCO UNIVERSAL | | | | BANKING | | | | 1.46 | | 53.75 | | 55.21 | | |
| | | BBVA AUTO ENTIDAD DE DESARROLLO A LA PEQUEÑA Y MICRO EMPRESA, EDPYME, S.A. (BBVA AUTO - EDPYME) | | | | FINANCIAL SERVICES | | | | - | | 84.32 | | 84.32 | | |
| | | BBVA ELCANO EMPRESARIAL, S.C.R., S.A. | | | | VENTURE CAPITAL | | | | 45.00 | | - | | 45.00 | | |
| | | BBVA INMOBILIARIA E INVERSIONES, S.A. | | | | REAL ESTATE | | | | - | | 68.11 | | 68.11 | | |
| | | CATALONIA GEBIRA, S.L, | | | | REAL ESTATE | | | | - | | 81.66 | | 81.66 | | |
| | | DESARROLLO URBANISTICO DE CHAMARTIN, S.A. | | | | REAL ESTATE | | | | - | | 72.50 | | 72.50 | | |
| | | ECOARENYS, S.L. | | | | REAL ESTATE | | | | - | | 50.00 | | 50.00 | | |
| | | EL OASIS DE LAS RAMBLAS, S.L. | | | | REAL ESTATE | | | | - | | 70.00 | | 70.00 | | |
| | | ESTACION DE AUTOBUSES CHAMARTIN, S.A. | | | | SERVICES | | | | - | | 51.00 | | 51.00 | | |
| | | F/11032604 FRACCIONAMIENTO LOARCA TERCERA SECCION | | | | REAL ESTATE | | | | - | | 60.05 | | 60.05 | | |
| | | F/253863 EL DESEO RESIDENCIAL | | | | REAL ESTATE | | | | - | | 65.00 | | 65.00 | | |
| | | F/403035-9 BBVA HORIZONTES RESIDENCIAL | | | | REAL ESTATE | | | | - | | 65.00 | | 65.00 | | |
| | | FORUM COMERCIALIZADORA DEL PERU, S.A. | | | | SERVICES | | | | - | | 84.32 | | 84.32 | | |
| | | FORUM DISTRIBUIDORA DEL PERU, S.A. | | | | FINANCIAL SERVICES | | | | - | | 84.32 | | 84.32 | | |
| | | FORUM DISTRIBUIDORA, S.A. | | | | FINANCIAL SERVICES | | | | - | | 75.52 | | 75.52 | | |
| | | FORUM SERVICIOS FINANCIEROS, S.A. | | | | FINANCIAL SERVICES | | | | - | | 75.50 | | 75.50 | | |
| | | GESTION DE PREVISION Y PENSIONES, S.A. | | | | PENSION FUNDS MANAGEMENT | | | | 60.00 | | - | | 60.00 | | |
| | | GRUPO PROFESIONAL PLANEACION Y PROYECTOS, S.A. DE C.V. | | | | SERVICES | | | | - | | 72.06 | | 72.06 | | |
| | | HABITATGES INVERVIC, S.L. | | | | REAL ESTATE | | | | - | | 35.00 | | 35.00 | | |
| | | HOLDING CONTINENTAL, S.A. | | | | INVESTMENT COMPANY | | | | 50.00 | | - | | 50.00 | | |
| | | INVERSIONES BANPRO INTERNATIONAL INC. N.V. | | | | IN LIQUIDATION | | | | 48.00 | | - | | 48.00 | | |
| | | INVERSIONES P.H.R.4, C.A. | | | | NO ACTIVITY | | | | - | | 60.46 | | 60.46 | | |
| | | PRO-SALUD, C.A. | | | | NO ACTIVITY | | | | - | | 58.86 | | 58.86 | | |
| | | TEXTIL TEXTURA, S.L. | | | | COMERCIAL | | | | - | | 68.67 | | 68.67 | | |
A-15
| APPENDIX V | BBVA Group’s structured entities. Securitization funds |
| | | | | | | | | | | | | | | | | | | | |
| | | | | | | | | | | | | | Millions of Euros | |
| Securitization Fund (consolidated) | | | | Company | | | | Origination
Date | | | | | Total Securitized
Exposures at the
Origination Date | | | Total Securitized
Exposures as of
December 31, 2012 | |
FTA IM-1 FTGENCAT | | | | BBVA, S.A | | | | | 12/2005 | | | | | | 320 | | | | 36 | |
FTA IM TERRASSA MBS-1 | | | | BBVA, S.A | | | | | 07/2006 | | | | | | 525 | | | | 208 | |
GC FTGENCAT CAIXA SABADELL 1, FTA | | | | BBVA, S.A | | | | | 10/2006 | | | | | | 305 | | | | 85 | |
GC FTGENCAT CAIXA SABADELL 2, FTA | | | | BBVA, S.A | | | | | 12/2008 | | | | | | 238 | | | | 93 | |
TDA 20-MIXTO, FTA | | | | BBVA, S.A | | | | | 06/2004 | | | | | | 100 | | | | 30 | |
FTA TDA-22 MIXTO | | | | BBVA, S.A | | | | | 12/2004 | | | | | | 62 | | | | 22 | |
AYT HIPOTECARIO MIXTO, FTA | | | | BBVA, S.A | | | | | 03/2004 | | | | | | 100 | | | | 28 | |
FTA AYT CONSUMO III | | | | BBVA, S.A | | | | | 08/2004 | | | | | | 60 | | | | 3 | |
AYT HIPOTECARIO MIXTO IV, FTA | | | | BBVA, S.A | | | | | 06/2005 | | | | | | 100 | | | | 37 | |
AYT CAIXA SABADELL HIPOTECARIO I, FTA | | | | BBVA, S.A | | | | | 07/2008 | | | | | | 300 | | | | 222 | |
FTA TDA-27 | | | | BBVA, S.A | | | | | 12/2006 | | | | | | 275 | | | | 147 | |
FTA TDA-28 | | | | BBVA, S.A | | | | | 07/2007 | | | | | | 250 | | | | 150 | |
FTA GAT FTGENCAT 2007 | | | | BBVA, S.A | | | | | 11/2007 | | | | | | 225 | | | | 63 | |
FTA GAT FTGENCAT 2008 | | | | BBVA, S.A | | | | | 08/2008 | | | | | | 350 | | | | 143 | |
BBVA-3 FTPYME FTA | | | | BBVA, S.A | | | | | 11/2004 | | | | | | 1,000 | | | | 24 | |
BBVA AUTOS 2 FTA | | | | BBVA, S.A | | | | | 12/2005 | | | | | | 1,000 | | | | 58 | |
BBVA HIPOTECARIO 3 FTA | | | | BBVA, S.A | | | | | 06/2005 | | | | | | 1,450 | | | | 116 | |
BBVA-4 PYME FTA | | | | BBVA, S.A | | | | | 09/2005 | | | | | | 1,250 | | | | 41 | |
BBVA CONSUMO 1 FTA | | | | BBVA, S.A | | | | | 05/2006 | | | | | | 1,500 | | | | 78 | |
BBVA-5 FTPYME FTA | | | | BBVA, S.A | | | | | 10/2006 | | | | | | 1,900 | | | | 117 | |
BBVA CONSUMO 2 FTA | | | | BBVA, S.A | | | | | 11/2006 | | | | | | 1,500 | | | | 106 | |
BBVA CONSUMO 3 FTA | | | | BBVA, S.A | | | | | 04/2008 | | | | | | 975 | | | | 110 | |
BBVA CONSUMO 4 FTA | | | | BBVA, S.A | | | | | 12/2009 | | | | | | 1,100 | | | | 265 | |
BBVA SECURITISED FUNDING 1.FTA | | | | BBVA, S.A | | | | | 03/2013 | | | | | | 848 | | | | 831 | |
BBVA UNIVERSALIDAD E10 | | | | BBVA COLOMBIA, S.A. | | | | | 03/2009 | | | | | | 28 | | | | 4 | |
BBVA UNIVERSALIDAD E11 | | | | BBVA COLOMBIA, S.A. | | | | | 05/2009 | | | | | | 18 | | | | 3 | |
BBVA UNIVERSALIDAD E12 | | | | BBVA COLOMBIA, S.A. | | | | | 08/2009 | | | | | | 30 | | | | 3 | |
BBVA UNIVERSALIDAD E5 | | | | BBVA COLOMBIA, S.A. | | | | | 11/2004 | | | | | | 131 | | | | 1 | |
BBVA UNIVERSALIDAD E9 | | | | BBVA COLOMBIA, S.A. | | | | | 12/2008 | | | | | | 53 | | | | 7 | |
BBVA EMPRESAS 1 FTA | | | | BBVA, S.A | | | | | 11/2007 | | | | | | 1,450 | | | | 126 | |
BBVA EMPRESAS 2 FTA | | | | BBVA, S.A | | | | | 03/2009 | | | | | | 2,850 | | | | 631 | |
BBVA EMPRESAS 3 FTA | | | | BBVA, S.A | | | | | 12/2009 | | | | | | 2,600 | | | | 491 | |
BBVA EMPRESAS 4 FTA | | | | BBVA, S.A | | | | | 07/2010 | | | | | | 1,700 | | | | 422 | |
BBVA EMPRESAS 5 FTA | | | | BBVA, S.A | | | | | 03/2011 | | | | | | 1,250 | | | | 503 | |
BBVA EMPRESAS 6 FTA | | | | BBVA, S.A | | | | | 12/2011 | | | | | | 1,200 | | | | 615 | |
BACOMCB 07 | | | | BBVA BANCOMER, S.A | | | | | 12/2007 | | | | | | 146 | | | | 58 | |
BACOMCB 08 | | | | BBVA BANCOMER, S.A | | | | | 03/2008 | | | | | | 64 | | | | 29 | |
BACOMCB 08U | | | | BBVA BANCOMER, S.A | | | | | 08/2008 | | | | | | 315 | | | | 178 | |
BACOMCB 08-2 | | | | BBVA BANCOMER, S.A | | | | | 12/2008 | | | | | | 322 | | | | 150 | |
BACOMCB 09 | | | | BBVA BANCOMER, S.A | | | | | 08/2009 | | | | | | 362 | | | | 219 | |
BMERCB 13 | | | | BBVA BANCOMER, S.A | | | | | 06/2013 | | | | | | 599 | | | | 222 | |
BBVA-FINANZIA AUTOS 1 FTA | | | | BBVA, S.A | | | | | 04/2007 | | | | | | 800 | | | | 67 | |
BBVA RMBS 1 FTA | | | | BBVA, S.A | | | | | 02/2007 | | | | | | 2,500 | | | | 1,482 | |
BBVA RMBS 2 FTA | | | | BBVA, S.A | | | | | 03/2007 | | | | | | 5,000 | | | | 2,874 | |
BBVA RMBS 3 FTA | | | | BBVA, S.A | | | | | 07/2007 | | | | | | 3,000 | | | | 1,956 | |
BBVA RMBS 5 FTA | | | | BBVA, S.A | | | | | 05/2008 | | | | | | 5,000 | | | | 3,256 | |
BBVA RMBS 9 FTA | | | | BBVA, S.A | | | | | 04/2010 | | | | | | 1,295 | | | | 1,102 | |
BBVA RMBS 10 FTA | | | | BBVA, S.A | | | | | 06/2011 | | | | | | 1,600 | | | | 1,469 | |
BBVA RMBS 11 FTA | | | | BBVA, S.A | | | | | 06/2012 | | | | | | 1,400 | | | | 1,312 | |
BBVA RMBS 12 FTA | | | | BBVA, S.A | | | | | 12/2013 | | | | | | 4,350 | | | | 4,335 | |
BBVA LEASING 1 FTA | | | | BBVA, S.A | | | | | 06/2007 | | | | | | 2,500 | | | | 286 | |
BBVA UNIVERSALIDAD N6 | | | | BBVA COLOMBIA, S.A. | | | | | 08/2012 | | | | | | 80 | | | | 43 | |
PEP80040F110 | | | | BANCO CONTINENTAL, S.A | | | | | 12/2007 | | | | | | 6 | | | | 4 | |
BBVA-6 FTPYME FTA | | | | BBVA, S.A | | | | | 06/2007 | | | | | | 1,500 | | | | 137 | |
BBVA-7 FTGENCAT FTA | | | | BBVA, S.A | | | | | 02/2008 | | | | | | 250 | | | | 36 | |
BBVA-8 FTPYME FTA | | | | BBVA, S.A | | | | | 07/2008 | | | | | | 1,100 | | | | 190 | |
BBVA PYME 9 FTA | | | | BBVA, S.A | | | | | 12/2012 | | | | | | 470 | | | | 328 | |
2 PS INTERAMERICANA | | | | BBVA CHILE, S.A. | | | | | 10/2004 | | | | | | 10 | | | | 3 | |
2 PS INTERAMERICANA | | | | BBVA SOCIEDAD DE LEASING INMOBILIARIO, S.A. | | | | | 10/2004 | | | | | | 19 | | | | 6 | |
| | | | | | | | | | | | | | | | | | | | |
| | | | | | | | | | | | | | Millions of Euros | |
| Securitization Fund (not consolidated) | | | | Company | | | | Origination
Date | | | | | Total Securitized
Exposures at the
Origination Date | | | Total Securitized
Exposures as of
December 31, 2012 | |
FTA TDA13 | | | | BBVA, S.A | | | | | 12/2000 | | | | | | 84 | | | | 10 | |
FTA TDA-18 MIXTO | | | | BBVA, S.A | | | | | 11/2003 | | | | | | 91 | | | | 21 | |
AYT 1 HIPOTECARIO, FTH | | | | BBVA, S.A | | | | | 06/1999 | | | | | | 149 | | | | 5 | |
BCL MUNICIPIOS I FTA | | | | BBVA, S.A | | | | | 06/2000 | | | | | | 1,205 | | | | 75 | |
2 PS RBS (ex ABN) | | | | BBVA SOCIEDAD DE LEASING INMOBILIARIO, S.A. | | | | | 09/2002 | | | | | | 8 | | | | 5 | |
A-16
| APPENDIX VI | Details of the outstanding subordinated debt and preferred securities issued by the Bank or entities in the Group consolidated as of as of December 31, 2013 and December 31, 2012. |
Outstanding as of December 31, 2013 of subordinated issues
| | | | | | | | | | | | | | | | | | | | | | | | | | |
| | | | | | | | | Millions of Euros | | | | | | | | |
| | | Issuer Entity and Issued Date | | | | Currency | | December
2013 | | | December
2012 | | | December
2011 | | | Prevailing
Interest Rate at
2013 | | | Maturity
Date | | |
| | | Issues in Euros | | | | | | | | | | | | | | | | | | | | | | | | |
| | | BBVA | | | | | | | | | | | | | | | | | | | | | | | | |
| | | July-96 | | | | EUR | | | 27 | | | | 27 | | | | 27 | | | | 9.37 | % | | 12/22/16 | | |
| | | October-04 | | | | EUR | | | 628 | | | | 628 | | | | 992 | | | | 4.38 | % | | 10/20/19 | | |
| | | February-07 | | | | EUR | | | 255 | | | | 255 | | | | 297 | | | | 4.50 | % | | 02/16/22 | | |
| | | March-08 | | | | EUR | | | 125 | | | | 125 | | | | 125 | | | | 6.03 | % | | 03/03/33 | | |
| | | July-08 | | | | EUR | | | 100 | | | | 100 | | | | 100 | | | | 6.20 | % | | 07/04/23 | | |
| | | December-11 | | | | EUR | | | - | | | | 1,237 | | | | 3,430 | | | | | | | 06/30/13 | | |
| | | Various | | | | EUR | | | 292 | | | | - | | | | - | | | | - | | | | | |
| | | Subtotal | | | | EUR | | | 1,427 | | | | 2,372 | | | | 4,971 | | | | | | | | | |
| | | BBVA GLOBAL FINANCE, LTD. (*) | | | | | | | | | | | | | | | | | | | | | | | | |
| | | July-99 | | | | EUR | | | 59 | | | | 60 | | | | 64 | | | | - | | | 10/16/15 | | |
| | | October-01 | | | | EUR | | | 10 | | | | 10 | | | | 40 | | | | - | | | 10/10/16 | | |
| | | October-01 | | | | EUR | | | 45 | | | | 46 | | | | 50 | | | | 6.08 | % | | 10/15/16 | | |
| | | November-01 | | | | EUR | | | 53 | | | | 53 | | | | 55 | | | | 0.83 | % | | 11/02/16 | | |
| | | December-01 | | | | EUR | | | 56 | | | | 56 | | | | 56 | | | | 0.93 | % | | 12/20/16 | | |
| | | Subtotal | | | | EUR | | | 223 | | | | 225 | | | | 265 | | | | | | | | | |
| | | BBVA SUBORDINATED CAPITAL, S.A.U. (*) | | | | | | | | | | | | | | | | | | | | | | | | |
| | | May-05 | | | | EUR | | | - | | | | - | | | | 389 | | | | - | | | 23/05/2017 | | |
| | | October-05 | | | | EUR | | | 99 | | | | 99 | | | | 126 | | | | 0.53 | % | | 10/13/20 | | |
| | | October-05 | | | | EUR | | | 26 | | | | 26 | | | | 199 | | | | 0.97 | % | | 10/20/17 | | |
| | | April-07 | | | | EUR | | | - | | | | - | | | | 594 | | | | - | | | 04/03/17 | | |
| | | April-07 | | | | EUR | | | 68 | | | | 68 | | | | 100 | | | | 1.70 | % | | 04/04/22 | | |
| | | May-08 | | | | EUR | | | 50 | | | | 50 | | | | 50 | | | | 3.00 | % | | 05/19/23 | | |
| | | July-08 | | | | EUR | | | 20 | | | | 20 | | | | 20 | | | | 6.11 | % | | 07/22/18 | | |
| | | Subtotal | | | | EUR | | | 263 | | | | 263 | | | | 1,478 | | | | | | | | | |
| | | BBVABANCOMER,S.A.de C.V. | | | | | | | | | | | | | | | | | | | | | | | | |
| | | May-07 | | | | EUR | | | - | | | | - | | | | 469 | | | | | | | 07/17/17 | | |
| | | Subtotal | | | | EUR | | | - | | | | - | | | | 469 | | | | | | | | | |
| | | Others | | | | | | | | | | | | | | | | | | | | | | | | |
| | | Subtotal | | | | | | | - | | | | 291 | | | | 18 | | | | | | | | | |
| | | | | | | | | | |
| | | Total issued in Euros | | | | | | | 1,913 | | | | 3,151 | | | | 7,201 | | | | | | | | | |
| | | (*) The issues of BBVA Subordinated Capital, S.A.U. and BBVA Global Finance, LTD. are guaranteed (secondary liability) by the Bank. |
A-17
| | | | | | | | | | | | | | |
| Outstanding as of December 31, 2013 of subordinated issues |
| | | | | |
| | | | | | | Millions of Euros | | | | |
| Issuer Entity and Issued Date | | | | Currency | | December
2013 | | December
2012 | | December
2011 | | Prevailing
Interest Rate at
2013 | | Maturity
Date |
Issues in foreign currency | | | | | | | | | | | | | | |
BBVA | | | | | | | | | | | | | | |
May-13 | | | | USD | | 1,088 | | -- | | -- | | 9.00% | | Perpetual |
Subtotal | | | | USD | | 1,088 | | | | | | | | |
BBVA GLOBAL FINANCE, LTD. (*) | | | | | | | | | | | | | | |
December-95 | | | | USD | | 146 | | 151 | | 155 | | 7.00% | | 12/01/25 |
October-95 | | | | JPY | | -- | | -- | | 100 | | -- | | 10/26/15 |
BANCO BILBAO VIZCAYA ARGENTARIA, CHILE | | | | | | | | | | | | | | |
Different issues | | | | CLP | | 574 | | 647 | | 597 | | | | Various |
Subtotal | | | | CLP | | 574 | | 647 | | 597 | | | | |
BBVA BANCOMER, S.A. de C.V. | | | | | | | | | | | | | | |
May-07 | | | | USD | | 362 | | 377 | | 386 | | 6.00% | | 05/17/22 |
April-10 | | | | USD | | 724 | | 755 | | 773 | | 7.00% | | 04/22/20 |
March-11 | | | | USD | | 905 | | 943 | | 966 | | 7.00% | | 03/10/21 |
July-12 | | | | USD | | 724 | | 755 | | -- | | 7.00% | | 09/30/22 |
September-12 | | | | USD | | 362 | | 377 | | -- | | 7.00% | | 09/30/22 |
Subtotal | | | | USD | | 3,077 | | 3,207 | | 2,125 | | | | |
September-06 | | | | MXN | | 138 | | 146 | | 138 | | 5.00% | | 09/18/14 |
October-08 | | | | MXN | | - | | 175 | | 166 | | -- | | 09/24/18 |
December-08 | | | | MXN | | 158 | | 166 | | 165 | | 5.00% | | 11/26/20 |
June-09 | | | | MXN | | 151 | | 159 | | 151 | | 6.00% | | 06/07/19 |
Subtotal | | | | MXN | | 447 | | 646 | | 620 | | | | |
BBVA SUBORDINATED CAPITAL, S.A.U. | | | | | | | | | | | | | | |
October-05 | | | | JPY | | -- | | -- | | 200 | | -- | | 10/22/35 |
Subtotal | | | | JPY | | -- | | -- | | 200 | | | | |
march-07 | | | | GBP | | 20 | | 19 | | 258 | | 1.25% | | 03/11/18 |
Subtotal | | | | GBP | | 20 | | 19 | | 258 | | | | |
TEXAS REGIONAL STATUTORY TRUST I | | | | | | | | | | | | | | |
February-04 | | | | USD | | 36 | | 38 | | 39 | | 3.09% | | 03/17/34 |
Subtotal | | | | USD | | 36 | | 38 | | 39 | | | | |
|
| (*) The issues of BBVA Subordinated Capital, S.A.U. and BBVA Global Finance, LTD. are guaranteed (secondary liability) by the Bank. |
A-18
| | | | | | | | | | | | | | | | | | | | | | | | | | | | |
Outstanding as of December 31, 2013 of subordinated issues |
| | | | | | | | | Millions of Euros | | | | | | | | | |
| | | Issuer Entity and Issued Date | | | | Currency | | December
2013 | | | December
2012 | | | December
2011 | | | Prevailing
Interest Rate at
2013 | | | Maturity
Date | | | |
| | | STATE NATIONAL CAPITAL TRUST I | | | | | | | | | | | | | | | | | | | | | | | | | | |
| | | July-03 | | | | USD | | | 11 | | | | 12 | | | | 12 | | | | 3.30 | % | | | 09/30/33 | | | |
| | | Subtotal | | | | USD | | | 11 | | | | 12 | | | | 12 | | | | | | | | | | | |
| | | STATE NATIONAL STATUTORY TRUST II | | | | | | | | | | | | | | | | | | | | | | | | | | |
| | | March-04 | | | | USD | | | 7 | | | | 8 | | | | 8 | | | | 3.04 | % | | | 03/17/34 | | | |
| | | Subtotal | | | | USD | | | 7 | | | | 8 | | | | 8 | | | | | | | | | | | |
| | | TEXASBANC CAPITAL TRUST I | | | | | | | | | | | | | | | | | | | | | | | | | | |
| | | June-04 | | | | USD | | | 18 | | | | 19 | | | | 19 | | | | 2.84 | % | | | 07/23/34 | | | |
| | | Subtotal | | | | USD | | | 18 | | | | 19 | | | | 19 | | | | | | | | | | | |
| | | COMPASS BANK | | | | | | | | | | | | | | | | | | | | | | | | | | |
| | | March-05 | | | | USD | | | 159 | | | | 217 | | | | 220 | | | | 5.50 | % | | | 04/01/20 | | | |
| | | March-06 | | | | USD | | | 49 | | | | 90 | | | | 202 | | | | 5.90 | % | | | 04/01/26 | | | |
| | | September-07 | | | | USD | | | 253 | | | | 264 | | | | 269 | | | | 6.40 | % | | | 10/01/17 | | | |
| | | Subtotal | | | | USD | | | 461 | | | | 571 | | | | 691 | | | | | | | | | | | |
| | | BBVA COLOMBIA, S.A. | | | | | | | | | | | | | | | | | | | | | | | | | | |
| | | September-11 | | | | COP | | | 40 | | | | 45 | | | | 42 | | | | 6.38 | % | | | 09/19/21 | | | |
| | | September-11 | | | | COP | | | 59 | | | | 67 | | | | 62 | | | | 6.63 | % | | | 09/19/26 | | | |
| | | September-11 | | | | COP | | | 38 | | | | 44 | | | | 41 | | | | 5.84 | % | | | 09/19/18 | | | |
| | | September-13 | | | | COP | | | 75 | | | | - | | | | - | | | | | | | | 02/19/23 | | | |
| | | September-13 | | | | COP | | | 62 | | | | - | | | | - | | | | | | | | 02/19/23 | | | |
| | | Subtotal | | | | COP | | | 274 | | | | 156 | | | | 145 | | | | | | | | | | | |
| | | BANCO CONTINENTAL, S.A. | | | | | | | | | | | | | | | | | | | | | | | | | | |
| | | December-06 | | | | USD | | | 22 | | | | 23 | | | | 23 | | | | 2.90 | % | | | 02/15/17 | | | |
| | | May-07 | | | | - | | | 14 | | | | 15 | | | | 15 | | | | 6.00 | % | | | 05/14/27 | | | |
| | | September-07 | | | | USD | | | 14 | | | | 15 | | | | 15 | | | | 2.53 | % | | | 09/24/17 | | | |
| | | February-08 | | | | USD | | | 14 | | | | 15 | | | | 15 | | | | 6.47 | % | | | 02/28/28 | | | |
| | | June-08 | | | | USD | | | 22 | | | | 23 | | | | 23 | | | | 2.99 | % | | | 06/15/18 | | | |
| | | November-08 | | | | USD | | | 14 | | | | 15 | | | | 15 | | | | 3.90 | % | | | 02/15/19 | | | |
| | | October-10 | | | | USD | | | 145 | | | | 152 | | | | 156 | | | | 7.38 | % | | | 10/07/40 | | | |
| | | October-13 | | | | USD | | | 33 | | | | - | | | | - | | | | 6.53 | % | | | 10/08/28 | | | |
| | | Subtotal | | | | USD | | | 278 | | | | 258 | | | | 262 | | | | | | | | | | | |
| | | June-07 | | | | PEN | | | 10 | | | | 12 | | | | 11 | | | | 5.85 | % | | | 05/07/22 | | | |
| | | November-07 | | | | PEN | | | 18 | | | | 19 | | | | 19 | | | | 3.47 | % | | | 06/18/32 | | | |
| | | November-07 | | | | PEN | | | 16 | | | | 17 | | | | 16 | | | | 3.56 | % | | | 11/19/32 | | | |
| | | July-08 | | | | PEN | | | 14 | | | | 15 | | | | 14 | | | | 3.06 | % | | | 07/08/23 | | | |
| | | September-08 | | | | PEN | | | 15 | | | | 17 | | | | 16 | | | | 3.09 | % | | | 09/09/23 | | | |
| | | December-08 | | | | PEN | | | 9 | | | | 10 | | | | 10 | | | | 4.19 | % | | | 12/15/33 | | | |
| | | Subtotal | | | | PEN | | | 82 | | | | 90 | | | | 86 | | | | | | | | | | | |
| | | Others | | | | | | | | | | | | | | | | | | | | | | | | | | |
| | | Subtotal | | | | | | | - | | | | 157 | | | | 268 | | | | | | | | | | | |
| | | Total issues in foreign currencies (Millions of Euros) | | | | | | | 6,519 | | | | 5,987 | | | | 5,585 | | | | | | | | | | | |
| | | | | | | | | | | | | | | | | | | | | | | | | | | | | |
| | | | | | | | | | | | | | | | | | |
Outstanding as of December 31, 2013 of preferred issues |
| | | | | | | December 2013 | | December 2012 | | December 2011 | | |
| | | Issuer Entity and Issued Date | | | | Currency | | Amount Issued
(Millions) | | Currency | | Amount Issued
(Millions) | | Currency | | Amount Issued
(Millions) | | |
| | | BBVA International, Ltd. | | | | | | | | | | | | | | | | |
| | | December-07 | | | | EUR | | 14 | | - | | - | | - | | - | | |
| | | BBVA International, Ltd. | | | | | | | | | | | | | | | | |
| | | December-02 | | | | EUR | | 9 | | EUR | | 9 | | EUR | | 9 | | |
| | | BBVA Capital Finance, S.A.U. | | | | | | | | | | | | | | | | |
| | | December-03 | | | | EUR | | 350 | | EUR | | 350 | | EUR | | 5 | | |
| | | July-04 | | | | EUR | | 500 | | EUR | | 500 | | EUR | | 7 | | |
| | | December-04 | | | | EUR | | 1,125 | | EUR | | 1,125 | | EUR | | 17 | | |
| | | December-08 | | | | EUR | | 1,000 | | EUR | | 1,000 | | EUR | | 7 | | |
| | | BBVA International Preferred, S.A.U. | | | | | | | | | | | | | | | | |
| | | September-05 | | | | EUR | | 85 | | EUR | | 85 | | EUR | | 85 | | |
| | | September-06 | | | | EUR | | 164 | | EUR | | 164 | | EUR | | 164 | | |
| | | April-07 | | | | USD | | 600 | | USD | | 600 | | USD | | 600 | | |
| | | July-07 | | | | GBP | | 31 | | GBP | | 31 | | GBP | | 31 | | |
| | | October-09 | | | | EUR | | 645 | | EUR | | 645 | | EUR | | 645 | | |
| | | October-09 | | | | GBP | | 251 | | GBP | | 251 | | GBP | | 251 | | |
| | | Phoenix Loan Holdings Inc. | | | | | | | | | | | | | | | | |
| | | November-00 | | | | USD | | 25 | | USD | | 25 | | USD | | 25 | | |
| | | Caixa Terrasa Societat de Participacion | | | | | | | | | | | | | | | | |
| | | August-05 | | | | EUR | | 75 | | EUR | | 75 | | - | | - | | |
| | | Caixasabadell Preferents, S.A. | | | | | | | | | | | | | | | | |
| | | December-04 | | | | EUR | | 1 | | EUR | | 75 | | - | | - | | |
| | | July-06 | | | | EUR | | 90 | | EUR | | 90 | | - | | - | | |
| | | Others | | | | - | | - | | - | | 82 | | - | | - | | |
| | | | | | | | | | | | | | | | | | | |
| | | (*) Issued by Unnim Banc, S.A. Follow ing the merge w ith BBVA, S.A. in 2013 it is included in BBVA, S.A |
| | | | | | | | | | | | | | | | | | | |
A-19
APPENDIX VII Consolidated balance sheets held in foreign currency as of December 31, 2013 and December 31, 2012
| | | | | | | | | | | | | | | | | | | | | | | | | | | | |
| | | | | | | | | | | | | | | | | | | | | | | | | |
| | | | | | | Millions of Euros | | | |
| | | December 2013 | | | | USD | | | | | Mexican
Pesos | | | | | Other Foreign
Currencies | | | | | Total Foreign
Currencies | | | |
| | | Assets - | | | | | | | | | | | | | | | | | | | | | | | | | | |
| | | Cash and balances with central banks | | | | | 6,786 | | | | | | 6,097 | | | | | | 10,446 | | | | | | 23,330 | | | |
| | | Financial assets held for trading | | | | | 2,592 | | | | | | 15,465 | | | | | | 3,979 | | | | | | 22,036 | | | |
| | | Available-for-sale financial assets | | | | | 8,588 | | | | | | 9,344 | | | | | | 7,529 | | | | | | 25,461 | | | |
| | | Loans and receivables | | | | | 61,846 | | | | | | 36,110 | | | | | | 46,201 | | | | | | 144,157 | | | |
| | | Investments in entities accounted for using the equity method | | | | | 5 | | | | | | 189 | | | | | | 4,197 | | | | | | 4,391 | | | |
| | | Tangible assets | | | | | 673 | | | | | | 1,457 | | | | | | 958 | | | | | | 3,087 | | | |
| | | Other assets | | | | | 2,433 | | | | | | 4,544 | | | | | | 3,501 | | | | | | 10,478 | | | |
| | | Total | | | | | 82,924 | | | | | | 73,206 | | | | | | 76,810 | | | | | | 232,940 | | | |
| | | Liabilities- | | | | | | | | | | | | | | | | | | | | | | | | | | |
| | | Financial liabilities held for trading | | | | | 1,450 | | | | | | 4,400 | | | | | | 1,100 | | | | | | 6,950 | | | |
| | | Financial liabilities at amortised cost | | | | | 85,756 | | | | | | 51,036 | | | | | | 58,267 | | | | | | 195,059 | | | |
| | | Other liabilities | | | | | (64 | ) | | | | | 8,131 | | | | | | 2,586 | | | | | | 10,653 | | | |
| | | Total | | | | | 87,142 | | | | | | 63,567 | | | | | | 61,953 | | | | | | 212,662 | | | |
| | | | | | | | | | | | | | | | | | | | | | | | | | | | | |
| | | | | | | | | | | | | | | | | | | | | | | | | | | | | |
| | | | | | | | | | | | | | | | | | | | | | | | | |
| | | | | | | Millions of Euros | | | |
| | | December 2012 | | | | USD | | | | | Mexican
Pesos | | | | | Other Foreign
Currencies | | | | | Total Foreign
Currencies | | | |
| | | Assets - | | | | | | | | | | | | | | | | | | | | | | | | | | |
| | | Cash and balances with central banks | | | | | 7,842 | | | | | | 5,894 | | | | | | 10,799 | | | | | | 24,535 | | | |
| | | Financial assets held for trading | | | | | 4,028 | | | | | | 15,539 | | | | | | 3,686 | | | | | | 23,254 | | | |
| | | Available-for-sale financial assets | | | | | 7,596 | | | | | | 8,789 | | | | | | 6,754 | | | | | | 23,139 | | | |
| | | Loans and receivables | | | | | 59,940 | | | | | | 38,033 | | | | | | 44,912 | | | | | | 142,885 | | | |
| | | Investments in entities accounted for using the equity method | | | | | 5 | | | | | | 95 | | | | | | 4,426 | | | | | | 4,526 | | | |
| | | Tangible assets | | | | | 753 | | | | | | 1,275 | | | | | | 892 | | | | | | 2,920 | | | |
| | | Other assets | | | | | 4,166 | | | | | | 4,210 | | | | | | 3,351 | | | | | | 11,727 | | | |
| | | Total | | | | | 84,330 | | | | | | 73,835 | | | | | | 74,820 | | | | | | 232,985 | | | |
| | | Liabilities- | | | | | | | | | | | | | | | | | | | | | | | | | | |
| | | Financial liabilities held for trading | | | | | 1,950 | | | | | | 4,587 | | | | | | 1,387 | | | | | | 7,924 | | | |
| | | Financial liabilities at amortised cost | | | | | 85,320 | | | | | | 52,037 | | | | | | 57,167 | | | | | | 194,524 | | | |
| | | Other liabilities | | | | | 1,122 | | | | | | 7,975 | | | | | | 2,801 | | | | | | 11,898 | | | |
| | | Total | | | | | 88,392 | | | | | | 64,598 | | | | | | 61,355 | | | | | | 214,346 | | | |
| | | | | | | | | | | | | | | | | | | | | | | | | | | | | |
| | | | | | | | | | | | | | | | | | | | | | | | | | | | | |
| | | | | | | | | | | | | | | | | | | | | | | | | |
| | | | | | | Millions of Euros | | | |
| | | December 2011 | | | | USD | | | | | Mexican
Pesos | | | | | Other Foreign
Currencies | | | | | Total Foreign
Currencies | | | |
| | | Assets - | | | | | | | | | | | | | | | | | | | | | | | | | | |
| | | Cash and balances with central banks | | | | | 5,802 | | | | | | 5,412 | | | | | | 5,993 | | | | | | 17,207 | | | |
| | | Financial assets held for trading | | | | | 3,320 | | | | | | 13,568 | | | | | | 3,537 | | | | | | 20,425 | | | |
| | | Available-for-sale financial assets | | | | | 8,621 | | | | | | 7,642 | | | | | | 5,859 | | | | | | 22,122 | | | |
| | | Loans and receivables | | | | | 66,347 | | | | | | 34,363 | | | | | | 38,183 | | | | | | 138,893 | | | |
| | | Investments in entities accounted for using the equity method | | | | | 5 | | | | | | 101 | | | | | | 4,235 | | | | | | 4,341 | | | |
| | | Tangible assets | | | | | 842 | | | | | | 1,060 | | | | | | 811 | | | | | | 2,713 | | | |
| | | Other assets | | | | | 4,708 | | | | | | 2,769 | | | | | | 3,168 | | | | | | 10,645 | | | |
| | | Total | | | | | 89,645 | | | | | | 64,915 | | | | | | 61,787 | | | | | | 216,346 | | | |
| | | Liabilities- | | | | | - | | | | | | | | | | | | - | | | | | | - | | | |
| | | Financial liabilities held for trading | | | | | 2,182 | | | | | | 4,113 | | | | | | 2,166 | | | | | | 8,461 | | | |
| | | Financial liabilities at amortised cost | | | | | 81,373 | | | | | | 47,906 | | | | | | 46,133 | | | | | | 175,412 | | | |
| | | Other liabilities | | | | | 1,159 | | | | | | 6,288 | | | | | | 2,765 | | | | | | 10,212 | | | |
| | | Total | | | | | 84,714 | | | | | | 58,307 | | | | | | 51,064 | | | | | | 194,086 | | | |
| | | | | | | | | | | | | | | | | | | | | | | | | | | | | |
A-20
| APPENDIX VIII | Other requirement under Bank of Spain Circular 6/2012. |
A) Quantitative information on the concentration of risk by activity.
LOANS AND ADVANCES TO CUSTOMERS BY ACTIVITY (carrying amount)
| | | | | | | | | | | | | | | | | | | | | | | | | | | | | | | | | | | | | | | | | | | | | | | | | | |
| | | | | | | | | | | | | | | | | | | | | | | | | | | | | | | | | | | | | | | | | | | | | | | | | | | |
| | | Millions of Euros |
| | | | | | | | | | | | | | | | | | | | Collateralized Credit Risk. Loan to value | | | |
| | | December 2013 | | TOTAL (*) | | | | | Of which:
Mortgage
loans | | | | | Of which:
Secured
loans | | | | | Less than or
equal to
40% | | | | | Over 40% but
less than or
equal to 60% | | | | | Over 60% but
less than or
equal to 80% | | | | | Over 80% but
less than or
equal to 100% | | | | | Over 100% | | | |
| | | 1 Government agencies | | | 34,152 | | | | | | 355 | | | | | | 2,233 | | | | | | 180 | | | | | | 91 | | | | | | 206 | | | | | | 261 | | | | | | 1,850 | | | |
| | | 2 Other financial institutions | | | 8,637 | | | | | | 50 | | | | | | 49 | | | | | | 12 | | | | | | 23 | | | | | | 31 | | | | | | 32 | | | | | | - | | | |
| | | 3 Non-financial institutions and individual entrepreneurs | | | 133,593 | | | | | | 31,258 | | | | | | 16,996 | | | | | | 15,751 | | | | | | 9,352 | | | | | | 9,813 | | | | | | 7,089 | | | | | | 6,251 | | | |
| | | 3.1 Construction and property development | | | 6,008 | | | | | | 5,896 | | | | | | 111 | | | | | | 1,490 | | | | | | 1,264 | | | | | | 1,359 | | | | | | 711 | | | | | | 1,183 | | | |
| | | 3.2 Construction of civil works | | | 5,659 | | | | | | 1,153 | | | | | | 559 | | | | | | 653 | | | | | | 280 | | | | | | 187 | | | | | | 238 | | | | | | 354 | | | |
| | | 3.3 Other purposes | | | 121,926 | | | | | | 24,209 | | | | | | 16,326 | | | | | | 13,607 | | | | | | 7,809 | | | | | | 8,267 | | | | | | 6,139 | | | | | | 4,714 | | | |
| | | 3.3.1 Large companies | | | 74,290 | | | | | | 8,685 | | | | | | 3,267 | | | | | | 4,223 | | | | | | 2,552 | | | | | | 1,505 | | | | | | 1,549 | | | | | | 2,123 | | | |
| | | 3.3.2 SMEs (**) and individual entrepreneurs | | | 47,636 | | | | | | 15,524 | | | | | | 13,059 | | | | | | 9,384 | | | | | | 5,257 | | | | | | 6,762 | | | | | | 4,590 | | | | | | 2,591 | | | |
| | | 4 Rest of households and NPISHs (***) | | | 149,717 | | | | | | 110,442 | | | | | | 3,629 | | | | | | 23,477 | | | | | | 28,878 | | | | | | 40,128 | | | | | | 14,026 | | | | | | 7,561 | | | |
| | | 4.1 Housing | | | 115,337 | | | | | | 108,992 | | | | | | 359 | | | | | | 22,333 | | | | | | 28,045 | | | | | | 38,882 | | | | | | 12,783 | | | | | | 7,309 | | | |
| | | 4.2 Consumption | | | 29,430 | | | | | | 464 | | | | | | 2,965 | | | | | | 636 | | | | | | 500 | | | | | | 1,056 | | | | | | 1,123 | | | | | | 114 | | | |
| | | 4.3 Other purposes | | | 4,950 | | | | | | 986 | | | | | | 305 | | | | | | 508 | | | | | | 333 | | | | | | 191 | | | | | | 120 | | | | | | 139 | | | |
| | | SUBTOTAL | | | 326,099 | | | | | | 142,105 | | | | | | 22,907 | | | | | | 39,419 | | | | | | 38,345 | | | | | | 50,179 | | | | | | 21,408 | | | | | | 15,662 | | | |
| | | 5 Less: Valuation adjustments due to impairment of assets not attributable to specific operations | | | 2,385 | | | | | | | | | | | | | | | | | | | | | | | | | | | | | | | | | | | | | | | | | | | | | |
| | | 6 TOTAL | | | 323,714 | | | | | | 142,105 | | | | | | 22,907 | | | | | | | | | | | | | | | | | | | | | | | | | | | | | | | | | |
| | | MEMORANDUM: | | | | | | | | | | | | | | | | | | | | | | | | | | | | | | | | | | | | | | | | | | | | | | | | |
| | | Forbereance operations | | | 23,994 | | | | | | 18,032 | | | | | | 419 | | | | | | 3,418 | | | | | | 2,404 | | | | | | 3,156 | | | | | | 3,572 | | | | | | 5,901 | | | |
| | | | | | | | | | | | | | | | | | | | | | | | | | | | | | | | | | | | | | | | | | | | | | | | | | | |
| | (*) | The amounts included in this table are net of impairment losses. |
| | (**) | Small and medium enterprises. |
| | (***) | Non profit institutions serving households. |
A-21
B) Quantitative information on the concentration of risk by activity and geographical areas.
| | | | | | | | | | | | | | | | | | | | | | | | | | | | | | |
| | | | | Millions of Euros | |
| | | | | | | | | | |
December 2013 | | | | TOTAL(*) | | | | | Spain | | | | | European
Union Other | | | | | America | | | | | Other | |
Credit institutions | | | | | 62,068 | | | | | | 15,689 | | | | | | 28,893 | | | | | | 8,241 | | | | | | 9,245 | |
Government agencies | | | | | 112,738 | | | | | | 61,343 | | | | | | 8,797 | | | | | | 41,629 | | | | | | 970 | |
Central Administration | | | | | 80,847 | | | | | | 35,255 | | | | | | 8,291 | | | | | | 36,540 | | | | | | 761 | |
Other | | | | | 31,891 | | | | | | 26,088 | | | | | | 506 | | | | | | 5,088 | | | | | | 209 | |
Other financial institutions | | | | | 44,059 | | | | | | 13,574 | | | | | | 13,433 | | | | | | 16,156 | | | | | | 896 | |
Non-financial institutions and individual entrepreneurs | | | | | 175,887 | | | | | | 77,291 | | | | | | 21,687 | | | | | | 71,360 | | | | | | 5,549 | |
Construction and property development | | | | | 13,019 | | | | | | 8,440 | | | | | | 159 | | | | | | 4,419 | | | | | | 0 | |
Construction of civil works | | | | | 8,886 | | | | | | 4,293 | | | | | | 2,056 | | | | | | 2,455 | | | | | | 82 | |
Other purposes | | | | | 153,983 | | | | | | 64,558 | | | | | | 19,472 | | | | | | 64,486 | | | | | | 5,467 | |
Large companies | | | | | 98,967 | | | | | | 43,550 | | | | | | 16,841 | | | | | | 33,949 | | | | | | 4,626 | |
SMEs and individual entrepreneurs | | | | | 55,016 | | | | | | 21,008 | | | | | | 2,631 | | | | | | 30,537 | | | | | | 841 | |
Other households and NPISHs | | | | | 152,003 | | | | | | 88,414 | | | | | | 3,775 | | | | | | 59,512 | | | | | | 302 | |
Housing | | | | | 115,341 | | | | | | 82,130 | | | | | | 2,788 | | | | | | 30,199 | | | | | | 224 | |
Consumer | | | | | 29,604 | | | | | | 2,640 | | | | | | 492 | | | | | | 26,469 | | | | | | 3 | |
Other purposes | | | | | 7,058 | | | | | | 3,645 | | | | | | 494 | | | | | | 2,844 | | | | | | 75 | |
SUBTOTAL | | | | | 546,756 | | | | | | 256,311 | | | | | | 76,585 | | | | | | 196,898 | | | | | | 16,961 | |
Less: Valuation adjustments due to impairment of assets not attributable to specific operations | | | | | 2,698 | | | | | | - | | | | | | - | | | | | | - | | | | | | - | |
TOTAL | | | | | 544,058 | | | | | | 256,311 | | | | | | 76,585 | | | | | | 196,898 | | | | | | 16,961 | |
| | (*) | The definition of risk for the purpose of this statement includes the following items on the public balance sheet: Loans and advances to credit institutions, Loans and advances to customers, Debt securities, Other equity securities, Trading derivatives, Hedging derivatives, Investments and Contingent risks. The amounts included in this table are net of impairment losses. | |
A-22
| APPENDIX IX | Additional disclosure required by the Regulation S-X. |
Following are the consolidated balance sheets and consolidated statements of income of the Group under the IFRS reformatted to conform to the presentation guidelines for bank holding companies set forth in Regulation S-X of the Securities and Exchange Commission of the United States of America.
The preparation of these financial statements requires management to make estimates and assumptions that affect the reported amounts and allocations of assets and liabilities and disclosure of contingent assets and liabilities and the reported amounts of revenues and expenses during the reported period. Actual results could differ from those estimates.
| | | | | | | | | | | | | | | | |
| | | | | | | | | | | | | | | | | |
| | | BANCO BILBAO VIZCAYA ARGENTARIA GROUP |
| | |
| | | CONSOLIDATED BALANCE SHEETS AS OF DECEMBER 31, 2013, 2012 AND 2011 |
| | | | | | |
| | | | | 2013 | | | 2012 | | | 2011 | | | |
| | | | | Millions of Euros | | | |
| | | | | | |
| | | ASSETS | | | | | | | | | | | | | | |
| | | Cash and due from banks | | | 8,336 | | | | 8,234 | | | | 9,002 | | | |
| | | Interest bearing deposits in other banks | | | 42,481 | | | | 45,449 | | | | 39,060 | | | |
| | | Securities purchased under agreements to resell | | | 11,397 | | | | 12,491 | | | | 11,110 | | | |
| | | Trading securities | | | 74,525 | | | | 82,359 | | | | 73,244 | | | |
| | | Investment securities | | | 77,774 | | | | 77,662 | | | | 65,596 | | | |
| | | Net Loans & Leases | | | 323,634 | | | | 340,666 | | | | 340,585 | | | |
| | | Loans and leases net of unearned income | | | 338,588 | | | | 354,836 | | | | 349,687 | | | |
| | | Less: Allowance for loan losses | | | (14,954) | | | | (14,170) | | | | (9,101) | | | |
| | | Hedging Derivatives | | | 2,629 | | | | 5,120 | | | | 4,684 | | | |
| | | Premises and equipment, net | | | 7,534 | | | | 7,572 | | | | 7,127 | | | |
| | | Investments in affiliated companies | | | 4,742 | | | | 10,782 | | | | 9,299 | | | |
| | | Intangible assets | | | 1,691 | | | | 1,702 | | | | 1,344 | | | |
| | | Goodwill in consolidation | | | 5,069 | | | | 5,430 | | | | 5,536 | | | |
| | | Accrual Accounts | | | 643 | | | | 660 | | | | 568 | | | |
| | | Other assets | | | 22,122 | | | | 22,943 | | | | 15,683 | | | |
| | | | | | | | | |
| | | Total assets | | | 582,575 | | | | 621,072 | | | | 582,838 | | | |
| | | | | | | | | |
| | | | | | |
| | | LIABILITIES AND EQUITY | | | | | | | | | | | | | | |
| | | | | | |
| | | Liabilities | | | | | | | | | | | | | | |
| | | Demand Deposits | | | 112,786 | | | | 100,845 | | | | 92,560 | | | |
| | | Saving deposits | | | 56,473 | | | | 56,419 | | | | 47,677 | | | |
| | | Time deposits | | | 136,349 | | | | 130,957 | | | | 124,947 | | | |
| | | Due to Bank of Spain | | | 15,361 | | | | 29,758 | | | | 13,990 | | | |
| | | Trading account liabilities | | | 45,648 | | | | 55,833 | | | | 51,178 | | | |
| | | Hedging derivatives | | | 1,792 | | | | 2,968 | | | | 2,709 | | | |
| | | Short term borrowings | | | 60,038 | | | | 77,870 | | | | 72,885 | | | |
| | | Long-term debt | | | 79,941 | | | | 89,382 | | | | 107,868 | | | |
| | | Taxes payable | | | 2,530 | | | | 3,820 | | | | 2,146 | | | |
| | | Accounts payable | | | 5,659 | | | | 7,590 | | | | 7,410 | | | |
| | | Accrual accounts | | | 2,199 | | | | 2,302 | | | | 2,210 | | | |
| | | Pension allowance | | | 5,512 | | | | 5,777 | | | | 5,577 | | | |
| | | Other provisions | | | 1,341 | | | | 2,057 | | | | 1,894 | | | |
| | | Others liabilities | | | 12,095 | | | | 11,691 | | | | 9,726 | | | |
| | | | | | | | | |
| | | Total liabilities | | | 537,725 | | | | 577,270 | | | | 542,780 | | | |
| | | | | | | | | |
| | | Shareholder’s equity | | | | | | | | | | | | | | |
| | | Common stocks | | | 2,835 | | | | 2,670 | | | | 2,403 | | | |
| | | Additional paid-in capital | | | 22,111 | | | | 20,968 | | | | 18,970 | | | |
| | | Dividends | | | 765 | | | | (1,323) | | | | (1,116) | | | |
| | | Other capital instruments | | | 66 | | | | (111) | | | | (300) | | | |
| | | Retained earnings | | | 16,701 | | | | 19,226 | | | | 18,209 | | | |
| | | | | | | | | |
| | | Total Shareholder’s equity | | | 42,479 | | | | 41,430 | | | | 38,166 | | | |
| | | | | | | | | |
| | | Non-controlling interest | | | 2,371 | | | | 2,373 | | | | 1,893 | | | |
| | | Total Equity | | | 44,850 | | | | 43,802 | | | | 40,058 | | | |
| | | | | | | | | |
| | | Total liabilities and equity | | | 582,575 | | | | 621,072 | | | | 582,838 | | | |
| | | | | | | | | |
| | | | | | | | | |
A-23
BANCO BILBAO VIZCAYA ARGENTARIA GROUP
CONSOLIDATED STATEMENTS OF INCOME FOR THE YEARS ENDED
DECEMBER 31, 2013, 2012 AND 2011
| | | | | | | | | | | | |
| | | 2013 | | | 2012 | | | 2011 | |
| | | Millions of Euros | |
Interest Income | | | | | | | | | | | | |
Interest and fees on loans and leases | | | 18,593 | | | | 19,743 | | | | 18,409 | |
Interest on deposits in other banks | | | 1,358 | | | | 1,336 | | | | 1,409 | |
Interest on securities purchased under agreements to resell | | | 159 | | | | 157 | | | | 209 | |
Interest on investment securities | | | 3,627 | | | | 3,968 | | | | 3,761 | |
| | | | |
Total interest income | | | 23,738 | | | | 25,203 | | | | 23,789 | |
| | | | |
Interest Expense | | | | | | | | | | | | |
Interest on deposits | | | (6,042) | | | | (6,570) | | | | (7,139) | |
Interest on Bank of Spain & Deposit Guarantee Fund | | | (128) | | | | (300) | | | | (63) | |
Interest on short-term borrowings | | | (1,012) | | | | (1,925) | | | | (1,636) | |
Interest on long term debt | | | (1,835) | | | | (1,035) | | | | (1,212) | |
| | | | |
Total interest expense | | | (9,016) | | | | (9,830) | | | | (10,051) | |
| | | | |
NET INTEREST INCOME | | | 14,722 | | | | 15,373 | | | | 13,739 | |
| | | | |
Provision for loan losses | | | (5,577) | | | | (7,817) | | | | (4,163) | |
| | | | |
Net Interest Income after provison for loan losses | | | 9,145 | | | �� | 7,556 | | | | 9,576 | |
| | | | |
Non-interest income | | | | | | | | | | | | |
Contingent liablillities (collected) | | | 316 | | | | 334 | | | | 302 | |
Collection and payments services (collected) | | | 3,095 | | | | 2,881 | | | | 2,560 | |
Securities services (collected) | | | 1,142 | | | | 1,120 | | | | 1,079 | |
Other transactions (collected) | | | 925 | | | | 956 | | | | 933 | |
Ceded to other entities and correspondents (paid) | | | (869) | | | | (789) | | | | (640) | |
Other transactions (paid) | | | (314) | | | | (295) | | | | (291) | |
Gains (losses) from: | | | | | | | | | | | | |
Affiliated companies securities | | | (1,822) | | | | 1,033 | | | | 805 | |
Investment securities | | | 1,010 | | | | 759 | | | | 58 | |
Foreign exchange, derivatives and other ,net | | | 1,466 | | | | 904 | | | | 1,400 | |
Other gains (losses) | | | 5,291 | | | | 4,539 | | | | 3,973 | |
| | | | |
Total non-interest income | | | 10,239 | | | | 11,442 | | | | 10,179 | |
| | | | |
Non-interest expense | | | | | | | | | | | | |
Salaries and employee benefits | | | (5,588) | | | | (5,467) | | | | (5,053) | |
Occupancy expense of premises, depreciation and maintenance, net | | | (2,018) | | | | (1,850) | | | | (1,618) | |
General and administrative expenses | | | (3,190) | | | | (3,057) | | | | (2,773) | |
Impairment of goodwill | | | (5) | | | | (54) | | | | (1,444) | |
Net provision for specific allowances | | | (609) | | | | (641) | | | | (503) | |
Other expenses | | | (6,814) | | | | (6,348) | | | | (4,965) | |
| | | | |
Total non-interest expense | | | (18,224) | | | | (17,417) | | | | (16,356) | |
| | | | |
Income Before Taxes | | | 1,160 | | | | 1,582 | | | | 3,398 | |
| | | | |
Income Tax expense | | | (46) | | | | 352 | | | | (158) | |
| | | | |
Income or loss from continuing operations | | | 1,114 | | | | 1,934 | | | | 3,240 | |
| | | | |
Discontinued operations | | | 1,866 | | | | 393 | | | | 245 | |
| | | | |
NET INCOME | | | 2,981 | | | | 2,327 | | | | 3,485 | |
| | | | |
Net income attributed to the non-controlling interests | | | (753) | | | | (651) | | | | (481) | |
| | | | |
NET INCOME ATTRIBUTED TO PARENT COMPANY | | | 2,228 | | | | 1,676 | | | | 3,004 | |
| | | | |
A-24
Financial Statements of Issuers of Guaranteed Securities
In connection with Rule 3-10 (Financial Statements of Guarantors and Issuers of Guaranteed Securities Registered or Being Registered) of Regulation S-X:
| | — | | BBVA International Preferred, S.A. (Unipersonal) — an issuer of registered preferred securities guaranteed by the Bank — does not file the financial statements required for a registrant by Regulation S-X as it is a 100% owned finance subsidiary of the Bank and the Bank fully and unconditionally guarantees its preferred securities (Serie “C” is listed in the United States). No other subsidiary of the Bank guarantees such securities. |
| | — | | BBVA U.S Senior S.A. (Unipersonal) and BBVA Subordinated Capital, S.A. (Unipersonal) do not file the financial statements required for a registrant by Regulation S-X as these companies are 100% owned finance subsidiaries of the Bank and the Bank will fully and unconditionally guarantee any future securities issued by any of such companies. No other subsidiary of the Bank will guarantee any such securities. |
We are not aware of any legal or economic restrictions on the ability of these subsidiaries to transfer funds to the Bank in the form of cash dividends, loans or advances, capital repatriation or otherwise. There is no assurance that in the future such restrictions will not be adopted.
A-25
| APPENDIX X | Reconciliation between operating segments and Group’s income statement |
The tables set forth below reconcile the income statement of our operating segments presented in this section to the consolidated income statement of the Group. The “Adjustments” column reflects the differences between the Group income statement and the income statement calculated in accordance with management operating segment reporting criteria, which are the following:
| | • | The treatment of Garanti: Under management criteria, 25.01% of the assets liabilities and income statement of Garanti are included in every line of the balance sheet and income statement, respectively, while for purposes of the Group financial statements the participation in Garanti is accounted under “Share of profit or loss of entities accounted for using the equity method”. |
| | • | The creation of a line in the income statement called “Profit from corporate operations” which is in place of “Profit from discontinued operations” that includes the following: |
| | – | The earning from the transaction entered into by BBVA Seguros and SCOR Global Life Reinsurance Ireland plc. (“SCOR”), pursuant to which SCOR assumed a quota share of 90% of the majority of BBVA Seguros’ single premium and regular premium business in Spain in the Spain operating segment. The gross impact is €630 million, and |
| | – | The earnings from the sale of the pension businesses in Mexico, Colombia, Peru and Chile and also the earnings of these businesses until their sale (€1,866 million net); the capital gain from the sale of BBVA Panama (€230 million gross); and the reduction of the stake in CNCB (which led to the repricing at market value of BBVA’s stake in CNCB, as well as the impact of the equity-adjusted earnings from CNCB, excluding dividends, (negative €2.374 million gross), in the Corporate Center. |
| | – | The badwill generated by the Unnim acquisition (€376 million net), the capital gain from the sale of BBVA Puerto Rico (negative €15 million gross), the earnings from the pension business in Latin America (€392 million net), and the equity-adjusted earnings from CNCB, excluding dividends, (€550 million gross),in the Corporate Center. |
| | – | The earnings from the pension business in Latin America and the equity accounted earning from CNCB (excluding dividends), in the Corporate Center |
| | | | | | | | | | | | | | | | | | | | | | | | | | | | | | | | | | | | | | | | |
| | | For the Year Ended December 31, 2013 | |
| | | Spain | | | Real-estate in Spain | | | Eurasia | | | Mexico | | | United
States | | | South
America | | | Corporate
center | | | Total | | | Adjustments | | | Group
Income | |
| | | (In Millions of Euros) | |
| Net interest income | | | 3,830 | | | | (3) | | | | 911 | | | | 4,484 | | | | 1,407 | | | | 4,703 | | | | (719) | | | | 14,613 | | | | (713) | | | | 13,900 | |
| Net fees and commissions | | | 1,376 | | | | 8 | | | | 391 | | | | 1,184 | | | | 557 | | | | 976 | | | | (61) | | | | 4,431 | | | | (181) | | | | 4,250 | |
| Net gains (losses) on financial assets and liabilities and net exchange differences | | | 807 | | | | 67 | | | | 194 | | | | 208 | | | | 139 | | | | 764 | | | | 347 | | | | 2,527 | | | | (16) | | | | 2,511 | |
| Other operating income and expenses (*) | | | 82 | | | | (111) | | | | 225 | | | | 325 | | | | (3) | | | | (812) | | | | 119 | | | | (175) | | | | 472 | | | | 297 | |
| Administration costs | | | (2,903) | | | | (130) | | | | (683) | | | | (2,173) | | | | (1,296) | | | | (2,213) | | | | (671) | | | | (10,068) | | | | 367 | | | | (9,701) | |
| Depreciation and amortization | | | (111) | | | | (23) | | | | (51) | | | | (163) | | | | (179) | | | | (173) | | | | (434) | | | | (1,133) | | | | (571) | | | | (1,704) | |
| Impairment losses on financial assets (net) | | | (2,577) | | | | (643) | | | | (330) | | | | (1,439) | | | | (78) | | | | (701) | | | | (8) | | | | (5,776) | | | | 164 | | | | (5,612) | |
| Provisions (net) and other gains (losses) | | | (282) | | | | (1,008) | | | | (65) | | | | (64) | | | | (14) | | | | (157) | | | | (80) | | | | (1,670) | | | | (1,111) | | | | (2,781) | |
| Operating profit/ (loss) before tax | | | 222 | | | | (1,840) | | | | 593 | | | | 2,362 | | | | 534 | | | | 2,387 | | | | (1,507) | | | | 2,750 | | | | (1,590) | | | | 1,160 | |
| Income tax | | | (60) | | | | 595 | | | | (139) | | | | (557) | | | | (144) | | | | (530) | | | | 241 | | | | (593) | | | | 547 | | | | (46) | |
| Profit from continuing oprations | | | 163 | | | | (1,245) | | | | 454 | | | | 1,805 | | | | 390 | | | | 1,856 | | | | (1,266) | | | | 2,158 | | | | (1,044) | | | | 1,114 | |
| Profit from discontinued/corporate operations (net) (**) | | | 440 | | | | - | | | | - | | | | - | | | | - | | | | - | | | | 383 | | | | 823 | | | | 1,043 | | | | 1,866 | |
| Profit | | | 603 | | | | (1,245) | | | | 454 | | | | 1,805 | | | | 390 | | | | 1,856 | | | | (883) | | | | 2,981 | | | | - | | | | 2,981 | |
| Profit attributable to non-controlling interests | | | (20) | | | | (9) | | | | - | | | | (1) | | | | - | | | | (608) | | | | (116) | | | | (753) | | | | - | | | | (753) | |
| Profit attributable to parent company | | | 583 | | | | (1,254) | | | | 454 | | | | 1,805 | | | | 390 | | | | 1,249 | | | | (999) | | | | 2,228 | | | | - | | | | 2,228 | |
(*) Includes share of profit or loss of entities accounted for using the equity method.
(**) For Group income this line represents discontinued operations and for operating segments the corporate operations as explained previously.
A-26
| | | | | | | | | | | | | | | | | | | | | | | | | | | | | | | | | | | | | | | | |
| | | For the Year Ended December 31, 2012 | |
| | | Spain | | | Real-estate
in Spain | | | Eurasia | | | Mexico | | | United
States | | | South
America | | | Corporate
center | | | Total | | | Adjustments | | | | |
| | | | | | | | | | | | | | | | | | | | | | | | | | | | | | | | | | | | | | | | | |
Net interest income | | | 4,748 | | | | (20) | | | | 851 | | | | 4,178 | | | | 1,551 | | | | 4,288 | | | | (473) | | | | 15,122 | | | | (648) | | | | 14,474 | |
Net fees and commissions | | | 1,342 | | | | 18 | | | | 451 | | | | 1,073 | | | | 581 | | | | 913 | | | | (25) | | | | 4,353 | | | | (197) | | | | 4,156 | |
Net gains (losses) on financial assets and liabilities and net exchange differences | | | 256 | | | | (29) | | | | 131 | | | | 219 | | | | 153 | | | | 443 | | | | 594 | | | | 1,767 | | | | (62) | | | | 1,705 | |
Other operating income and expenses (*) | | | 318 | | | | (53) | | | | 232 | | | | 286 | | | | (41) | | | | (284) | | | | 192 | | | | 650 | | | | 839 | | | | 1,489 | |
Administration costs | | | (2,788) | | | | (103) | | | | (724) | | | | (2,033) | | | | (1,321) | | | | (2,120) | | | | (679) | | | | (9,768) | | | | 372 | | | | (9,396) | |
Depreciation and amortization | | | (99) | | | | (24) | | | | (54) | | | | (133) | | | | (185) | | | | (173) | | | | (350) | | | | (1,018) | | | | (601) | | | | (1,619) | |
Impairment losses on financial assets (net) | | | (1,853) | | | | (3,799) | | | | (328) | | | | (1,320) | | | | (72) | | | | (593) | | | | (15) | | | | (7,980) | | | | 121 | | | | (7,859) | |
Provisions (net) and other gains (losses) | | | (273) | | | | (1,695) | | | | (49) | | | | (41) | | | | (46) | | | | (202) | | | | (70) | | | | (2,377) | | | | 1,009 | | | | (1,368) | |
Operating profit/ (loss) before tax | | | 1,652 | | | | (5,705) | | | | 508 | | | | 2,229 | | | | 619 | | | | 2,271 | | | | (826) | | | | 749 | | | | 833 | | | | 1,582 | |
Income tax | | | (487) | | | | 1,659 | | | | (105) | | | | (539) | | | | (177) | | | | (494) | | | | 418 | | | | 276 | | | | 76 | | | | 352 | |
Profit from continuing oprations | | | 1,165 | | | | (4,046) | | | | 404 | | | | 1,690 | | | | 442 | | | | 1,777 | | | | (408) | | | | 1,024 | | | | 910 | | | | 1,934 | |
Profit from discontinued/corporate operations (net) (**) | | | - | | | | - | | | | - | | | | - | | | | - | | | | - | | | | 1,303 | | | | 1,303 | | | | (910) | | | | 393 | |
Profit | | | 1,165 | | | | (4,046) | | | | 404 | | | | 1,690 | | | | 442 | | | | 1,777 | | | | 895 | | | | 2,327 | | | | - | | | | 2,327 | |
Profit attributable to non-controlling interests | | | (3) | | | | 3 | | | | - | | | | (1) | | | | - | | | | (578) | | | | (72) | | | | (651) | | | | - | | | | (651) | |
Profit attributable to parent company | | | 1,162 | | | | (4,044) | | | | 404 | | | | 1,689 | | | | 443 | | | | 1,199 | | | | 823 | | | | 1,676 | | | | - | | | | 1,676 | |
| (*) | | Includes share of profit or loss of entities accounted for using the equity method. |
| (**) | | For Group income this line represents discontinued operations and for operating segments the corporate operations as explained previously. |
A-27
| | | | | | | | | | | | | | | | | | | | | | | | | | | | | | | | | | | | | | | | |
| | | For the Year Ended December 31, 2011 | |
| | | Spain | | | Real-estate
in Spain | | | Eurasia | | | Mexico | | | United
States | | | South
America | | | Corporate
center | | | Total | | | Adjustments | | | | |
| Net interest income | | | 4,248 | | | | 104 | | | | 806 | | | | 3,782 | | | | 1,518 | | | | 3,159 | | | | (465) | | | | 13,152 | | | | (428) | | | | 12,724 | |
| Net fees and commissions | | | 1,291 | | | | 22 | | | | 391 | | | | 1,015 | | | | 611 | | | | 722 | | | | (21) | | | | 4,031 | | | | (137) | | | | 3,894 | |
| Net gains (losses) on financial assets and liabilities and net exchange differences | | | 238 | | | | 12 | | | | 114 | | | | 296 | | | | 132 | | | | 485 | | | | 204 | | | | 1,481 | | | | (1) | | | | 1,480 | |
| Other operating income and expenses (*) | | | 468 | | | | (14) | | | | 156 | | | | 229 | | | | (79) | | | | (267) | | | | 371 | | | | 864 | | | | 678 | | | | 1,542 | |
| Administration costs | | | (2,737) | | | | (88) | | | | (602) | | | | (1,826) | | | | (1,253) | | | | (1,732) | | | | (659) | | | | (8,898) | | | | 264 | | | | (8,634) | |
| Depreciation and amortization | | | (101) | | | | (13) | | | | (44) | | | | (105) | | | | (166) | | | | (152) | | | | (259) | | | | (839) | | | | (474) | | | | (1,313) | |
| Impairment losses on financial assets (net) | | | (1,619) | | | | (481) | | | | (111) | | | | (1,180) | | | | (320) | | | | (449) | | | | (66) | | | | (4,226) | | | | 41 | | | | (4,185) | |
| Provisions (net) and other gains (losses) | | | (274) | | | | (757) | | | | 13 | | | | (59) | | | | (1,496) | | | | (89) | | | | 44 | | | | (2,618) | | | | 508 | | | | (2,110) | |
| Operating profit/ (loss) before tax | | | 1,515 | | | | (1,216) | | | | 722 | | | | 2,153 | | | | (1,053) | | | | 1,677 | | | | (852) | | | | 2,946 | | | | 452 | | | | 3,398 | |
| Income tax | | | (438) | | | | 405 | | | | (159) | | | | (514) | | | | 340 | | | | (346) | | | | 505 | | | | (206) | | | | 48 | | | | (158) | |
| Profit from continuing oprations | | | 1,077 | | | | (810) | | | | 563 | | | | 1,639 | | | | (713) | | | | 1,332 | | | | (347) | | | | 2,740 | | | | 500 | | | | 3,240 | |
Profit from discontinued/corporate operations
(net) (**) | | | 1 | | | | 1 | | | | - | | | | - | | | | 1 | | | | - | | | | 745 | | | | 748 | | | | (503) | | | | 245 | |
| Profit | | | 1,077 | | | | (810) | | | | 563 | | | | 1,639 | | | | (713) | | | | 1,332 | | | | 398 | | | | 3,485 | | | | - | | | | 3,485 | |
| Profit attributable to non-controlling interests | | | (2) | | | | 2 | | | | 1 | | | | (1) | | | | - | | | | (434) | | | | (47) | | | | (481) | | | | - | | | | (481) | |
| Profit attributable to parent company | | | 1,075 | | | | (809) | | | | 563 | | | | 1,638 | | | | (713) | | | | 898 | | | | 351 | | | | 3,004 | | | | - | | | | 3,004 | |
(*) Includes share of profit or loss of entities accounted for using the equity method.
(**) For Group income this line represents discontinued operations and for operating segments the corporate operations as explained previously.
A-28
Glossary
| | | | |
Adjusted acquisition cost | | The acquisition cost of the securities less accumulated amortizations, plus interest accrued, but not net of any other valuation adjustments. |
| Amortized cost | | The amortized cost of a financial asset is the amount at which it was measured at initial recognition minus principal repayments, plus or minus, as warranted, the cumulative amount taken to profit or loss using the effective interest rate method of any difference between the initial amount and the maturity amount, and minus any reduction for impairment or change in measured value. |
| Associates | | Companies in which the Group has a significant influence, without having control. Significant influence is deemed to exist when the Group owns 20% or more of the voting rights of an investee directly or indirectly. |
| Available-for-sale financial assets | | Available-for-sale (AFS) financial assets are debt securities that are not classified as held-to-maturity investments or as financial assets designated at fair value through profit or loss (FVTPL) and equity instruments that are not subsidiaries, associates or jointly controlled entities and have not been designated as at FVTPL. |
| Basic earnings per share | | Calculated by dividing profit or loss attributable to ordinary equity holders of the parent by the weighted average number of ordinary shares outstanding during the period |
| Business combination | | A business combination is a transaction, or any other event, through which a single entity obtains the control of one or more businesses |
| Cash flow hedges | | Those that hedge the exposure to variability in cash flows attributable to a particular risk associated with a recognized asset or liability or a highly probable forecast transaction and could effect profit or loss. |
| Commissions and fees | | Income and expenses relating to commissions and similar fees are recognized in the consolidated income statement using criteria that vary according to their nature. The most significant income and expense items in this connection are: |
| | – | | Fees and commissions relating linked to financial assets and liabilities measured at fair value through profit or loss, which are recognized when collected |
| | – | | Fees and commissions arising from transactions or services that are provided over a period of time, which are recognized over the life of these transactions or services. |
| | – | | Fees and commissions generated by a single act are accrued upon execution of that act. |
A-29
| | | | |
| Consolidated statements of cash flows | | The indirect method has been used for the preparation of the consolidated statement of cash flows. This method starts from the entity’s consolidated profit and adjusts its amount for the effects of transactions of a non-cash nature, any deferrals or accruals of past or future operating cash receipts or payments, and items of income or expense associated with cash flows classified as investment or finance. As well as cash, short-term, highly liquid investments subject to a low risk of changes in value, such as cash and deposits in central banks, are classified as cash and equivalents. |
| | When preparing these financial statements the following definitions have been used: |
| | – | | Cash flows: Inflows and outflows of cash and equivalents. Operating activities: The typical activities of credit institutions and other activities that cannot be classified as investment or financing activities. |
| | – | | Investing activities: The acquisition, sale or other disposal of long-term assets and other investments not included in cash and cash equivalents or in operating activities. |
| | – | | Financing activities: Activities that result in changes in the size and composition of the Group’s equity and of liabilities that do not form part of operating activities. |
| Consolidated statements of changes in equity | | The consolidated statements of changes in equity reflect all the movements generated in each year in each of the headings of the consolidated equity, including those from transactions undertaken with shareholders when they act as such, and those due to changes in accounting criteria or corrections of errors, if any. The applicable regulations establish that certain categories of assets and liabilities are recognized at their fair value with a charge to equity. These charges, known as “Valuation adjustments” (see Note 31), are included in the Group’s total consolidated equity net of tax effect, which has been recognized as deferred tax assets or liabilities, as appropriate. |
| Consolidated statements of recognized income and expenses | | The consolidated statements of recognized income and expenses reflect the income and expenses generated each year. Such statement distinguishes between income and expenses recognized in the consolidated income statements and “Other recognized income (expenses)” recognized directly in consolidated equity. “Other recognized income (expenses)” include the changes that have taken place in the year in the “Valuation adjustments” broken down by item. The sum of the changes to the heading “Valuation adjustments” of the consolidated total equity and the consolidated profit for the year comprise the “Total recognized income/expenses of the year”. |
| Contingencies | | Current obligations of the entity arising as a result of past events whose existence depends on the occurrence or non-occurrence of one or more future events independent of the will of the entity. |
| Contingent liabilities | | Possible obligations of the entity that arise from past events and whose existence depends on the occurrence or non-occurrence of one or more future events independent of the entity’s will and that could lead to the recognition of financial assets. |
| Contingent risks | | Transactions through which the entity guarantees commitments assumed by third parties in respect of financial guarantees granted or other types of contracts. |
A-30
| | | | |
| Control | | An investor controls an investee when it is exposed, or has rights, to variable returns from its involvement with the investee and has the ability to affect those returns through its power over the investee. An investor controls an investee if and only if the investor has all the following: |
| | a) | | Power ; An investor has power over an investee when the investor has existing rights that give it the current ability to direct the relevant activities, ie the activities that significantly affect the investee’s returns. |
| | b) | | Returns; An investor is exposed, or has rights, to variable returns from its involvement with the investee when the investor’s returns from its involvement have the potential to vary as a result of the investee’s performance. The investor’s returns can be only positive, only negative or both positive and negative. |
| | c) | | Link between power and returns; An investor controls an investee if the investor not only has power over the investee and exposure or rights to variable returns from its involvement with the investee, but also has the ability to use its power to affect the investor’s returns from its involvement with the investee. |
| Correlation risk | | Correlation risk is related to derivatives whose final value depends on the performance of more than one underlying asset (primarily, stock baskets) and indicates the existing variability in the correlations between each pair of assets. |
| Credit Valuation Adjustment (CVA) | | An adjustment to the valuation of OTC derivative contracts to reflect the creditworthiness of OTC derivative counterparties. |
| Current service cost | | Current service cost is the increase in the present value of a defined benefit obligation resulting from employee service in the current period. |
| Current tax assets | | Taxes recoverable over the next twelve months. |
| Current tax liabilities | | Corporate income tax payable on taxable profit for the year and other taxes payable in the next twelve months. |
| Debt certificates | | Obligations and other interest-bearing securities that create or evidence a debt on the part of their issuer, including debt securities issued for trading among an open group of investors, that accrue interest, implied or explicit, whose rate, fixed or benchmarked to other rates, is established contractually, and take the form of securities or book-entries, irrespective of the issuer. |
| Debit Valuation Adjustment (DVA) | | An adjustment made by an entity to the valuation of OTC derivative liabilities to reflect within fair value the entity’s own credit risk. |
| Deferred tax assets | | Taxes recoverable in future years, including loss carryforwards or tax credits for deductions and tax rebates pending application. |
| Deferred tax liabilities | | Income taxes payable in subsequent years. |
A-31
| | | | |
| Defined benefit plans | | Defined contribution plans are retirement benefit plans under which amounts to be paid as retirement benefits are determined by contributions to a fund together with investment earnings thereon. The employer’s obligations in respect of its employees current and prior years’ employment service are discharged by contributions to the fund. |
| Defined contribution plans | | Post-employment obligation under which the entity, directly or indirectly via the plan, retains the contractual or implicit obligation to pay remuneration directly to employees when required or to pay additional amounts if the insurer, or other entity required to pay, does not cover all the benefits relating to the services rendered by the employees when insurance policies do not cover all of the corresponding post-employees benefits. |
| Deposits from central banks | | Deposits of all classes, including loans and money market operations, received from the Bank of Spain and other central banks. |
| Deposits from credit institutions | | Deposits of all classes, including loans and money market operations received, from credit entities. |
| Deposits from customers | | Redeemable cash balances received by the entity, with the exception of debt certificates, money market operations through counterparties and subordinated liabilities, are not received from either central banks or credit entities. This category also includes cash deposits and consignments received that can be readily withdrawn. |
| Diluted earnings per share | | This calculation is similar to that used to measure basic earnings per share, except that the weighted average number of shares outstanding is adjusted to reflect the potential dilutive effect of any stock options, warrants and convertible debt instruments outstanding the year. For the purpose of calculating diluted earnings per share, an entity shall assume the exercise of dilutive warrants of the entity. The assumed proceeds from these instruments shall be regarded as having been received from the issue of ordinary shares at the average market price of ordinary shares during the period. The difference between the number of ordinary shares issued and the number of ordinary shares that would have been issued at the average market price of ordinary shares during the period shall be treated as an issue of ordinary shares for no consideration. Such shares are dilutive and are added to the number of ordinary shares outstanding in the calculation of diluted earnings per share. |
| Early retirements | | Employees that no longer render their services to the entity but which, without being legally retired, remain entitled to make economic claims on the entity until they formally retire. |
| Economic capital | | Eligible capital for regulatory capital adequacy calculations. |
A-32
| | | | |
| Economic profit | | This metric measures the part of attributable adjusted profit (attributable profit + adjustment for expected loss, net income and valuation) in excess of the cost of equity employed, and measures the profits generated in excess of market expectations of returns on equity capital. This is used at the management level; for annual public reporting; for incentives in some operating segments; and in the Group’s value map. |
| Effective interest rate | | Discount rate that exactly equals the value of a financial instrument with the cash flows estimated over the expected life of the instrument based on its contractual period as well as its anticipated amortization, but without taking the future losses of credit risk into consideration. |
| Employee expenses | | All compensation accrued during the year in respect of personnel on the payroll, under permanent or temporary contracts, irrespective of their jobs or functions, irrespective of the concept, including the current costs of servicing pension plans, own share based compensation schemes and capitalized personnel expenses. Amounts reimbursed by the state Social Security or other welfare entities in respect of employee illness are deducted from personnel expenses. |
| Equity | | The residual interest in an entity’s assets after deducting its liabilities. It includes owner or venturer contributions to the entity, at incorporation and subsequently, unless they meet the definition of liabilities, and accumulated net profits or losses, fair value adjustments affecting equity and, if warranted, non-controlling interests. |
| Equity instruments | | An equity instrument that evidences a residual interest in the assets of an entity after deducting all of its liabilities. |
| Equity Method | | Is a method of accounting whereby the investment is initially recognised at cost and adjusted thereafter for the post-acquisition change in the investor’s share of the investee’s net assets. The investor’s profit or loss includes its share of the investee’s profit or loss and the investor’s other comprehensive income includes its share of the investee’s other comprehensive income. |
| Exchange/translation differences | | Exchange differences (PyL): Includes the earnings obtained in currency trading and the differences arising on translating monetary items denominated in foreign currency to the functional currency. Exchange differences (valuation adjustments): those recorded due to the translation of the financial statements in foreign currency to the functional currency of the Group and others recorded against equity. |
| Exposure at default | | EAD is the amount of risk exposure at the date of default by the counterparty. |
| Fair value | | The price that would be received to sell an asset or paid to transfer a liability in an orderly transaction between market participants at the measurement date. |
| Fair value hedges | | Derivatives that hedge the exposure to changes in the fair value of assets and liabilities or firm commitments that have not be recognized, or of an identified portion of said assets, liabilities or firm commitments, attributable to a specific risk, provided it could affect the income statement. |
A-33
| | | | |
| Fees | | See Commissions, fees and similar items |
| Financial guarantees | | Contracts that require the issuer to make specified payments to reimburse the holder for a loss it incurs when a specified debtor fails to make payment when due in accordance with the original or modified terms of a debt instrument, irrespective of its instrumentation. These guarantees may take the form of deposits, technical or financial guarantees, insurance contracts or credit derivatives. |
| Financial instrument | | A financial instrument is any contract that gives rise to a financial asset of one entity and to a financial liability or equity instrument of another entity. |
| Financial liabilities at amortized cost | | Financial liabilities that do not meet the definition of financial liabilities designated at fair value through profit or loss and arise from the financial entities’ ordinary activities to capture funds, regardless of their instrumentation or maturity. |
| Full consolidation method | | Method used for the consolidation of the accounts of the Group’s subsidiaries. The assets and liabilities of the Group entities are incorporated line-by-line on the consolidate balance sheets, after conciliation and the elimination in full of intragroup balances, including amounts payable and receivable. Group entity income statement income and expense headings are similarly combined line by line into the consolidated income statement, having made the following consolidation eliminations: |
| | a) | | income and expenses in respect of intragroup transactions are eliminated in full. |
| | b) | | profits and losses resulting from intragroup transactions are similarly eliminated. |
| | The carrying amount of the parent’s investment and the parent’s share of equity in each subsidiary are eliminated. |
| Gains or losses on financial assets and liabilities, net | | This heading reflects fair value changes in financial instruments—except for changes attributable to accrued interest upon application of the interest rate method and asset impairment losses (net) recognized in the income statement—as well as gains or losses generated by their sale—except for gains or losses generated by the disposal of investments in subsidiaries, jointly controlled entities and associates an of securities classified as held to maturity. |
| Goodwill | | Goodwill acquired in a business combination represents a payment made by the acquirer in anticipation of future economic benefits from assets that are not able to be individually identified and separately recognized. |
Hedges of net investments in foreign operations | | Foreign currency hedge of a net investment in a foreign operation. |
| Hedging derivatives | | Derivatives designated as hedging instruments in an accounting hedge. The fair value or future cash flows of those derivatives is expected to offset the differences in the fair value or cash flows of the items hedged. |
A-34
| | | | |
| Held-to-maturity investments | | Held-to-maturity investments are financial assets traded on an active market, with fixed maturity and fixed or determinable payments and cash flows that an entity has the positive intention and financial ability to hold to maturity. |
| Held for trading (assets and liabilities) | | Financial assets and liabilities acquired or incurred primarily for the purpose of profiting from variations in their prices in the short term. This category also includes financial derivatives not qualifying for hedge accounting, and in the case of borrowed securities, financial liabilities originated by the firm sale of financial assets acquired under repurchase agreements or received on loan (“short positions”). |
| Impaired financial assets | | A financial asset is deemed impaired, and accordingly restated to fair value, when there is objective evidence of impairment as a result of one or more events that give rise to: |
| | - | | A measurable decrease in the estimated future cash flows since the initial recognition of those assets in the case of debt instruments (loans and receivables and debt securities). |
| | - | | A significant or prolonged drop in fair value below cost in the case of equity instruments. |
| Income from equity instruments | | Dividends and income on equity instruments collected or announced during the year corresponding to profits generated by investees after the ownership interest is acquired. Income is recognized gross, i.e., without deducting any withholdings made, if any. |
Insurance contracts linked to pensions | | The fair value of insurance contracts written to cover pension commitments. |
| Inventories | | Assets, other than financial instruments, under production, construction or development, held for sale during the normal course of business, or to be consumed in the production process or during the rendering of services. Inventories include land and other properties held for sale at the real estate development business. |
| Investment properties | | Investment property is property (land or a building—or part of a building—or both) held (by the owner or by the lessee under a finance lease) to earn rentals or for capital appreciation or both, rather than for own use or sale in the ordinary course of business. |
| Joint arrangement | | An arrangement of which two or more parties have joint control. |
| Joint control | | The contractually agreed sharing of control of an arrangement, which exists only when decisions about the relevant activities require the unanimous consent of the parties sharing control. |
A-35
| | | | |
| Joint venture | | A joint arrangement whereby the parties that have joint control of the arrangement have rights to the net assets of the arrangement. A joint venturer shall recognise its interest in a joint venture as an investment and shall account for that investment using the equity method in accordance with IAS 28 Investments in Associates and Joint Ventures. |
| Leases | | A lease is an agreement whereby the lessor conveys to the lessee in return for a payment or series of payments the right to use an asset for an agreed period of time, a stream of cash flows that is essentially equivalent to the combination of principal and interest payments under a loan agreement. |
| | a) | | A lease is classified as a finance lease when it substantially transfers all the risks and rewards incidental to ownership of the asset forming the subject-matter of the contract. |
| | b) | | A lease will be classified as operating lease when it is not a financial lease. |
Liabilities associated with non-current
assets held for sale | | The balance of liabilities directly associated with assets classified as non-current assets held for sale, including those recognized under liabilities in the entity’s balance sheet at the balance sheet date corresponding to discontinued operations. |
| Liabilities under insurance contracts | | The technical reserves of direct insurance and inward reinsurance recorded by the consolidated entities to cover claims arising from insurance contracts in force at period-end. |
| Loans and advances to customers | | Loans and receivables, irrespective of their type, granted to third parties that are not credit entities. |
| Loans and receivables | | Financial instruments with determined or determinable cash flows and in which the entire payment made by the entity will be recovered, except for reasons attributable to the solvency of the debtor. This category includes both the investments from the typical lending activity (amounts of cash available and pending maturity by customers as a loan or deposits lent to other entities, and unlisted debt certificates), as well as debts contracted by the purchasers of goods, or users of services, that form part of the entity’s business. It also includes all finance lease arrangements in which the consolidated subsidiaries act as lessors. |
| Loss given default (LGD) | | It is the estimate of the loss arising in the event of default. It depends mainly on the characteristics of the counterparty, and the valuation of the guarantees or collateral associated with the asset. |
| Mortgage-covered bonds | | Financial asset or security created from mortgage loans and backed by the guarantee of the mortgage loan portfolio of the entity. |
| Non-controlling interests | | The net amount of the profit or loss and net assets of a subsidiary attributable to associates outside the group (that is, the amount that is not owned, directly or indirectly, by the parent), including that amount in the corresponding part of the consolidated earnings for the period. |
A-36
| | | | |
Non-current assets held for sale | | A non-current asset or disposal group, whose carrying amount is expected to be realized through a sale transaction, rather than through continuing use, and which meets the following requirements: |
| | a) | | it is immediately available for sale in its present condition at the balance sheet date, i.e. only normal procedures are required for the sale of the asset |
| | b) | | the sale is considered highly probable. |
| Non-monetary assets | | Assets and liabilities that do not provide any right to receive or deliver a determined or determinable amount of monetary units, such as tangible and intangible assets, goodwill and ordinary shares subordinate to all other classes of capital instruments. |
| NPA Coveraged ratio | | Impairment allowances as a percentage of the non performing assets (the sum of impaired loans and advances to customers and impaired contingent liabilities to customers). |
| NPA ratio | | Represents the sum of impaired loans and advances to customers and impaired contingent liabilities to customers divided by the sum of Loans and advances to customers and Contingent liabilities to customers. |
| Other equity instruments | | This heading reflects the increase in equity resulting from various forms of owner contributions, retained earnings, restatements of the financial statements and valuation adjustments. |
A-37
| | | | |
| Other financial assets/liabilities at fair value through profit or loss | | Instruments designated by the entity from the inception at fair value with changes in profit or loss. |
| | An entity may only designate a financial instrument at fair value through profit or loss, if doing so more relevant information is obtained, because: |
| | a. | | It eliminates or significantly reduces a measurement or recognition inconsistency (sometimes called “accounting mismatch”) that would otherwise arise from measuring assets or liabilities or recognizing the gains and losses on them on different bases. It might be acceptable to designate only some of a number of similar financial assets or financial liabilities if doing so a significant reduction (and possibly a greater reduction than other allowable designations) in the inconsistency is achieved. |
| | b. | | The performance of a group of financial assets or financial liabilities is managed and evaluated on a fair value basis, in accordance with a documented risk management or investment strategy, and information about the group is provided internally on that basis to the entity’s key management personnel. |
| | These are financial assets managed jointly with “Liabilities under insurance contracts” measured at fair value, in combination with derivatives written with a view to significantly mitigating exposure to changes in these contracts’ fair value, or in combination with financial liabilities and derivatives designed to significantly reduce global exposure to interest rate risk. |
| | These headings include customer loans and deposits effected via so-called unit-linked life insurance contracts, in which the policyholder assumes the investment risk. |
| Own/treasury shares | | The amount of own equity instruments held by the entity. |
| Past service cost | | It is the change in the present value of the defined benefit obligation for employee service in prior periods, resulting in the current period from the introduction of, or changes to, post- employment benefits or other long-term employee benefits. |
| Post-employment benefits | | Retirement benefit plans are arrangements whereby an enterprise provides benefits for its employees on or after termination of service. |
| Potential problem risk | | All debt instruments and contingent risks which do not meet the criteria to be classified individually as non-performing or written-off, but show weaknesses that may entail for the entity the need to assume losses greater than the hedges for impairment of risks subject to special monitoring. |
| Probability of default (PD) | | It is the probability of the counterparty failing to meet its principal and/or interest payment obligations. |
Property, plant and equipment/tangible assets | | Buildings, land, fixtures, vehicles, computer equipment and other facilities owned by the entity or acquired under finance leases. |
| Provisions | | Provisions include amounts recognized to cover the Group’s current obligations arising as a result of past events, certain in terms of nature but uncertain in terms of amount and/or cancellation date. |
A-38
| | |
Provisions for contingent liabilities and commitments | | Provisions recorded to cover exposures arising as a result of transactions through which the entity guarantees commitments assumed by third parties in respect of financial guarantees granted or other types of contracts, and provisions for contingent commitments, i.e., irrevocable commitments which may arise upon recognition of financial assets. |
Provision for credit losses | | Provisions recognized during the year, net of recoveries on amounts provisioned in prior years, with the exception of provisions for pensions and contributions to pension funds which constitute current or interest expense. |
Provisions for pensions and similar obligation | | Constitutes all provisions recognized to cover retirement benefits, including commitments assumed vis-à-vis beneficiaries of early retirement and analogous schemes. |
| Public-covered bonds | | Financial asset or security created from public loans and backed by the guarantee of the public debt portfolio of the entity. |
| Refinancing Operation | | An operation which, irrespective of the holder or guarantees involved, is granted or used for financial or legal reasons related to current or foreseeable financial difficulties that the holder(s) may have in settling one or more operations granted by the entity itself or by other companies in its group to the holder(s) or to another company or companies of its group, or through which such operations are totally or partially brought up to date with their payments, in order to enable the holders of the settled or refinanced operations to pay off their debt (principal and interest) because they are unable, or are expected to be unable, to meet the conditions in a timely and appropriate manner. |
| Renewal Operation | | An operation arranged to replace another one granted previously by the entity itself, when the borrower is not experiencing financial difficulties, and is not expected to experience them in the future, i.e. the operation is arranged for reasons other than refinancing. |
| Restructured Operation | | An operation whose financial conditions are modified for economic or legal reasons related to the holder’s (or holders’) current or foreseeable financial difficulties, in order to enable payment of the debt (principal and interest), because the holder is unable, or is expected to be unable, to meet those conditions in a timely and appropriate manner, even if such modification is provided for in the contract. In any event, the following are considered restructured operations: operations in which a haircut is made or assets are received in order to reduce the debt, or in which their conditions are modified in order to extend their maturity, change the amortization table in order to reduce the amount of the installments in the short term or reduce their frequency, or to establish or extend the grace period for the principal, the interest or both; except when it can be proved that the conditions are modified for reasons other than the financial difficulties of the holders and, are similar to those applied on the market on the modification date for operations granted to customers with a similar risk profile. |
| Refinanced Operation | | An operation which is totally or partially brought up to date with its payments as a result of a refinancing operation made by the entity itself or by another company in its group. |
A-39
| | | | |
| Renegotiated Operation | | An operation whose financial conditions are modified when the borrower is not experiencing financial difficulties, and is not expected to experience them in the future, i.e. the conditions are modified for reasons other than restructuring. |
| Reserves | | Accumulated net profits or losses recognized in the income statement in prior years and retained in equity upon distribution. Reserves also include the cumulative effect of adjustments recognized directly in equity as a result of costs in the issue or reduction of own equity instruments, sale of own equity instruments, actuarial gains on pension plans and the retroactive restatement of the financial statements due to changes in accounting policy and the correction of errors. |
| Securitization fund | | A fund that is configured as a separate equity and administered by a management company. An entity that would like funding sells certain assets to the securitization fund, which, in turn, issues securities backed by said assets. |
| Separate vehicle | | A separately identifiable financial structure, including separate legal entities or entities recognised by statute, regardless of whether those entities have a legal personality. |
| Share premium | | The amount paid in by owners for issued equity at a premium to the shares’ nominal value. |
| Short positions | | Financial liabilities arising as a result of the final sale of financial assets acquired under repurchase agreements or received on loan. |
| Significant influence | | Is the power to participate in the financial and operating policy decisions of the investee but is not control or joint control of those policies. If an entity holds, directly or indirectly (eg through subsidiaries), 20 per cent or more of the voting power of the investee, it is presumed that the entity has significant influence, unless it can be clearly demonstrated that this is not the case. Conversely, if the entity holds, directly or indirectly (eg through subsidiaries), less than 20 per cent of the voting power of the investee, it is presumed that the entity does not have significant influence, unless such influence can be clearly demonstrated. A substantial or majority ownership by another investor does not necessarily preclude an entity from having significant influence. The existence of significant influence by an entity is usually evidenced in one or more of the following ways: |
| | (a) | | representation on the board of directors or equivalent governing body of the investee; |
| | (b) | | participation in policy-making processes, including participation in decisions about dividends or other distributions; |
| | (c) | | material transactions between the entity and its investee; |
| | (d) | | interchange of managerial personnel; or |
| | (e) | | provision of essential technical information. |
A-40
| | | | |
| Structured Entities | | A structured entity is an entity that has been designed so that voting or similar rights are not the dominant factor in deciding who controls the entity, such as when any voting rights relate to administrative tasks only and the relevant activities are directed by means of contractual arrangements. A structured entity often has some or all of the following features or attributes: |
| | a) | | restricted activities. |
| | b) | | a narrow and well-defined objective, such as to effect a tax-efficient lease, carry out research and development activities, provide a source of capital or funding to an entity or provide investment opportunities for investors by passing on risks and rewards associated with the assets of the structured entity to investors. |
| | c) | | insufficient equity to permit the structured entity to finance its activities without subordinated financial support. |
| | d) | | financing in the form of multiple contractually linked instruments to investors that create concentrations of credit or other risks (tranches). |
| Subordinated liabilities | | Financing received, regardless of its instrumentation, which ranks after the common creditors in the event of a liquidation. |
| Subsidiaries | | Companies over which the Group exercises control. An entity is presumed to have control over another when it possesses the right to oversee its financial and operational policies, through a legal, statutory or contractual procedure, in order to obtain benefits from its economic activities. Control is presumed to exist when the parent owns, directly or indirectly through subsidiaries, more than one half of an entity’s voting power, unless, exceptionally, it can be clearly demonstrated that ownership of more than one half of an entity’s voting rights does not constitute control of it. Control also exists when the parent owns half or less of the voting power of an entity when there is: |
| | a) | | an agreement that gives the parent the right to control the votes of other shareholders; |
| | b) | | power to govern the financial and operating policies of the entity under a statute or an agreement; power to appoint or remove the majority of the members of the board of directors or equivalent governing body and control of the entity is by that board or body; |
| | c) | | power to cast the majority of votes at meetings of the board of directors or equivalent governing body and control of the entity is by that board or body. |
| Stockholders’ funds | | Contributions by stockholders, accumulated earnings recognized in the income statement and the equity components of compound financial instruments. |
Structured credit products | | Special financial instrument backed by other instruments building a subordination structure. |
A-41
| | | | |
| Tax liabilities | | All tax related liabilities except for provisions for taxes. |
| Trading derivatives | | The fair value in favor (assets) or again (liabilities) of the entity of derivatives not designated as accounting hedges. |
| TSR | | Total Shareholder Return. The total return of a stock to an investor (capital gain plus dividends) |
| Unit-link | | This is life insurance in which the policyholder assumes the risk. In these policies, the funds for the technical insurance provisions are invested in the name of and on behalf of the policyholder in shares of Collective Investment Institutions and other financial assets chosen by the policyholder, who bears the investment risk. |
| Value at Risk (VaR) | | Value at Risk (VaR) is the basic variable for measuring and controlling the Group’s market risk. This risk metric estimates the maximum loss that may occur in a portfolio’s market positions for a particular time horizon and given confidence level VaR figures are estimated following two methodologies: |
| | - | | VaR without smoothing, which awards equal weight to the daily information for the immediately preceding last two years. This is currently the official methodology for measuring market risks vis-à-vis limits compliance of the risk. |
| | - | | VaR with smoothing, which weights more recent market information more heavily. This is a metric which supplements the previous one. |
| | - | | VaR with smoothing adapts itself more swiftly to the changes in financial market conditions, whereas VaR without smoothing is, in general, a more stable metric that will tend to exceed VaR with smoothing when the markets show less volatile trends, while it will tend to be lower when they present upturns in uncertainty. |
A-42