- BBVA Dashboard
- Financials
- Filings
- Holdings
- Transcripts
- ETFs
-
Insider
- Institutional
- Shorts
-
6-K Filing
Banco Bilbao Vizcaya Argentaria (BBVA) 6-KCurrent report (foreign)
Filed: 31 Jul 19, 6:40am
UNITED STATES
SECURITIES AND EXCHANGE COMMISSION
WASHINGTON, D.C. 20549
FORM6-K
REPORT OF FOREIGN ISSUER
PURSUANT TO RULE13a-16 OR15d-16
UNDER THE SECURITIES EXCHANGE ACT OF 1934
For the month of July, 2019
Commission file number:1-10110
BANCO BILBAO VIZCAYA ARGENTARIA, S.A.
(Exact name of Registrant as specified in its charter)
BANK BILBAO VIZCAYA ARGENTARIA, S.A.
(Translation of Registrant’s name into English)
Calle Azul 4,
28050 Madrid
Spain
(Address of principal executive offices)
Indicate by check mark whether the registrant files or will file annual reports under cover of Form20-F or Form40-F:
Form20-F ☒ Form40-F ☐
Indicate by check mark if the registrant is submitting the Form6-K in paper as permitted by RegulationS-T Rule 101(b)(1):
Yes ☐ No ☒
Indicate by check mark if the registrant is submitting the Form6-K in paper as permitted by RegulationS-T Rule 101(b)(7):
Yes ☐ No ☒
 | Press Release
07.31.2019 |
JANUARY-JUNE 2019
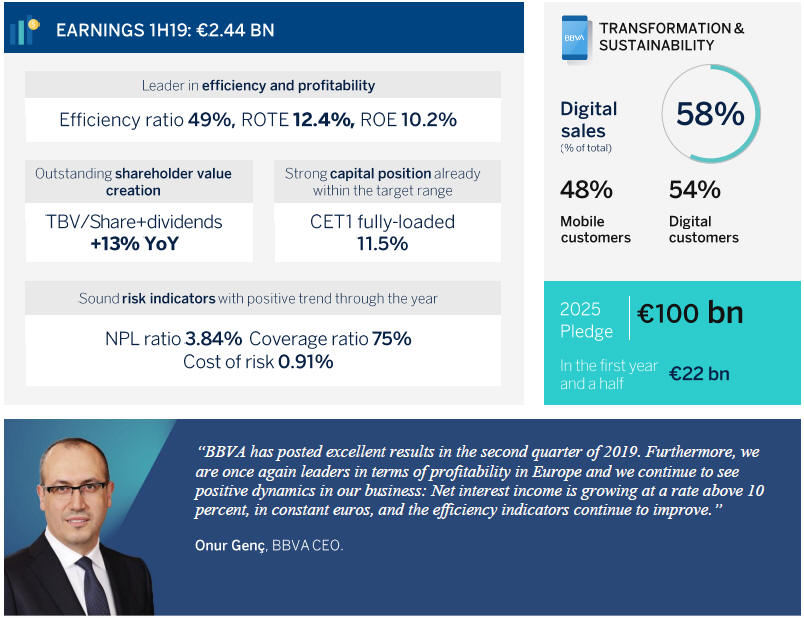
BBVA earns€2.44 billion in first half of the year
Between January and June 2019, BBVA Group earned €2.44 billion. In the second quarter, the net attributable profit reached €1.28 billion, up 10 percent qoq, and 6 percent yoy, excluding the sale of BBVA Chile, thus maintaining the same business perimeter (or +2.6 percent including Chile). The results were driven by a solid evolution of more recurring revenue items, with a double-digit growth of the net interest income, and lower impairments on financial assets.
The bank continues to be a leader in efficiency and boasts solid risk and capital indicators, with a CET1 fully-loaded ratio reaching its target earlier than expected. Additionally, BBVA generated a significant value for its shareholders, with double-digit profitability, at the forefront of its European peers. BBVA continues to be ahead of the curve in transformation, with positive impacts on growth, efficiency, engagement and customer satisfaction.
 | 07.31.2019 |
In order to provide a more accurate view of the company’s performance, 1H18 figures exclude the results corresponding to BBVA Chile. (BBVA sold this unit in July 2018).
BBVA Group’snet interest income increased 7.4 percent yoy in the first half of the year in current euros (+9.9 percent in constant terms) to €8.99 billion, with positive performance in most business areas.Net fees and commissions reached €2.47 billion (+1.0 percent at current euros; +2.8 percent in constant terms). Both items combined, considered the core revenues in the banking business, grew 6.0 percent (+8.3 percent in constant terms), reaching €11.46 billion.
Despite a decline in net trading income (NTI),gross income reached €11.99 billion in the first six months of the year, up 3.7 percent from the same period a year earlier (+6.0 percent in constant terms).
Cost control efforts have continued, withoperating expenses increasing below the average inflation rate (6.3 percent) recorded across BBVA’s footprint (+2.3 percent at current exchange rates, +3.9 percent at constant rates). Consequently, theefficiency ratio continued to improve and stood at 49.0 percent, 41 basis points below the 2018 figure (in constant terms), and significantly below the average of the European peer group. Thus,operating income reached €6.12 billion in the semester, up 5.2 percent yoy (+8.2 percent in constant euros).
BBVA Group’s net attributable profit stood at €2.44 billion between January and June, down 1.2 percent from a year earlier(-0.8 percent in constant euros).
Net attributable profit BBVA Group
Breakdown 6M 20191
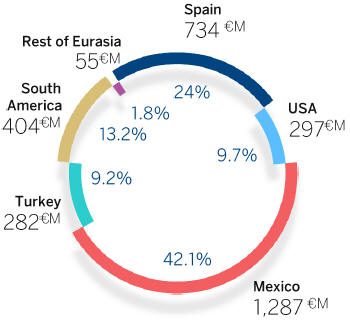
(1) Figures exclude corporate center.
In terms of value creation for the shareholder, tangible book value per share plus dividends stood at €6.36, a 12.6 percent increase from June 2018. Also, BBVA once again posted leadingprofitability metrics, both the Group’s ROTE (12.4 percent) and ROE (10.2 percent) stood clearly above its European peer group average.
At the end of June, the CET1 fully-loadedcapitalratio stood at 11.52 percent, thanks to the Group’s organic generation capacity, and after absorbing the24-bps regulatory impact resulting from the implementation of NIIF 16 and TRIM (Targeted Review of Internal Models). Consequently, BBVA delivered already in this quarter its target of placing the ratio in the11.5-12.0 percent range. BBVA also maintains its shareholder remuneration policy with a cash payout of 35 to 40 percent of profit, following a €0.16 gross cash payment of a supplementary dividend in April.
 | 07.31.2019 |
Asset quality indicators improved during the quarter. Coverage ratio reached 75 percent in June, compared to 74 percent in the previous quarter, with the NPL ratio dropping to 3.8 percent vs. 3.9 percent in March. This indicator has been declining since June 2015, and reached its lowest level since September 2009. The accumulated cost of risk was 0.91 percent in June, compared to 1.06 percent three months earlier.
As forbalance sheet and business activity, loans and advances to customers grew 0.8 percent at current exchange rates, compared to December 2018, reaching €377.16 billion, with increases in Mexico, South America, Rest of Eurasia and, to a lesser extent, Spain. Customer deposits remained virtually flat(-0.2 percent) in the period and stood at €375.1 billion in June 2019.
Transformation
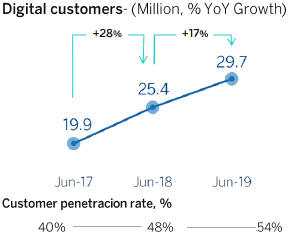
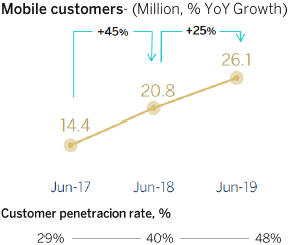
The number of digital customers increased 17 percent in the last 12 months to 29.7 million. This figure represents 54 percent of the total customer base. A 48 percent of customers (26.1 million) interact via mobile, up 25 percent from June 2018. The goal for this year is to exceed the 50 percent threshold. Unit sales through digital channels already account for 58 percent of the total.
Thanks to its transformation, BBVA has grown its customer base. For instance, in Spain, customer acquisition through digital channels grew 33 percent over the past two years. Transformation has also had a positive impact on customer satisfaction and engagement levels. Since 2017, BBVA has led the Net Promoter Score (NPS) index in Spain and customer attrition rate has dropped 18 percent. All this in the context of a new, more efficient distribution model. In fact, operating costs in Spain have dropped 8 percent over the past two years.
Finally, it is worth mentioning that BBVA Spain’s mobile app was named best in Europe by Forrester for a third consecutive year. In Turkey, Garanti BBVA’s app ranked second.
 |  |
Sustainability
In the first six months of 2019, BBVA has mobilized over €10 billion in sustainable finance (about €22 billion in the last year and a half), as part of its Pledge 2025, the bank’s climate change and sustainable development strategy.
 | 07.31.2019 |
In 1H19, BBVA successfully completed the issue of its second green bond, a €1 billion in seniornon-preferred debt. BBVA was also recognized as best bank for financial inclusion and best bank in sustainable finance in Latin America by Euromoney.
Business Areas
The main highlights of each business area are detailed below.
InSpain,lending activity grew 0.8 percent compared to June 2018, supported by the most profitable segments (retail,medium-sized enterprises, consumer loans and credit cards). Customer resources also grew 2.2 percent yoy, thanks to demand deposits. Spain posted a €734 million profit in 1H19, down 1.7 percent from 1H18, mainly due to a lower contribution from NTI. In the second quarter, however, it earned 13 percent more than the previous quarter, mostly thanks to the solid behavior in net interest income (+5 percent over the same period). It is also worth mentioning the positive performance in operating expenses, which fell in the quarter(-3.5 percent yoy). Asset quality improved thanks to the decline in NPLs during the quarter, as a result of the sale of portfolios of non-performing real estate developer loans in the second quarter. Consequently, the NPL ratio declined during the quarter from 4.95 percent to 4.60 percent, the lowest level since September 2009. The coverage ratio remained stable at 58 percent.
In theUnited States,lending grew 3.7 percent (at constant exchange rates) yoy thanks to retail and commercial segments. Customer resources increased 1.3 percent in the last 12 months. The net attributable profit stood at €297 million for the Jan.-June period, down 22.9 percent (-27.8 percent in constant euros) from 1H18. The decline was mainly the result of higher provisions during the period. However, net interest income performed favorably thanks to the focus on portfolio profitability. Risk indicators performed positively. The coverage ratio increased from 84.9 percent to 91.2 percent starting in March, while the NPL ratio dropped from 1.4 percent to 1.31 percent.
InMexico,BBVA continues to be the market leader, with a share of more than 22 percent. Activity continued to grow, with a 4.9 percent increase in loans yoy, driven by the performance in the mortgage and consumer lending segments. Customer resources grew 5.8 percent, with positive progress across all headings. The net attributable profit grew 7.2 percent to €1.29 billion (+0.6 percent in constant euros), thanks to strong performance in net interest income, which stood at 14.9 percent at current exchange rates (+7.8 percent in constant euros). The unit posted, once again, positive jaws, with recurring revenues growing above operating expenses. The efficiency ratio improved during 1H19 to 33.1 percent. As for risk indicators, the NPL ratio stood at 2.19 percent, while the coverage ratio was 147.7 percent.
InTurkey,lira- denominated loans decreased 3.5 percent compared to June 2018, while loans in foreign currency declined by 20.5 percent. Deposits in lira increased 4.0 percent, while deposits in foreign currency dropped 2.6 percent. The area posted a net attributable profit of €282 million in 1H19, down 24.2 percent in current euros(-2.8 percent in constant euros). Despite the positive performance in net interest income terms, the net attributable profit was negatively affected by increased impairments on financial assets as a result of the current macroeconomic environment. However, lower expenses under this heading during the second quarter drove the net attributable profit to increase 6.9 percent in constant euros, compared to 1Q19. As for risk indicators, the NPL ratio stood at 6.3 percent, while the coverage ratio reached 75 percent.
 | 07.31.2019 |
InSouth America,customer loans increased 6.3 percent yoy, driven by activity growth in Peru (+6.3 percent), Argentina (+20.1 percent) and Colombia (+2.0 percent). Customer resources grew 11.5 percent, also driven by these countries (+10.4 percent, +45.1 percent and +2.9 percent, respectively). The area’s attributable profit stood at €404 million, plus 51.8 percent yoy in current euros (+72.4 percent in constant euros). The NPL ratio stood at 4.4 percent, while the coverage ratio reached 95 percent.
 | BBVA Corporate Communications |
Tel. +34 91 374 40 10
comunicacion.corporativa@bbva.com
For more financial information about BBVA visit:
http://shareholdersandinvestors.bbva.com
For more BBVA news visit:https://www.bbva.com
 | 07.31.2019 |
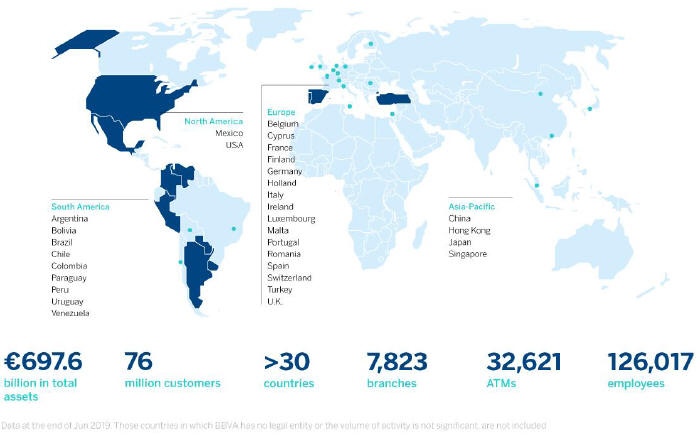
BBVA is a customer-centric global financial services group founded in 1857. The Group has a strong leadership position in the Spanish market, is the largest financial institution in Mexico, it has leading franchises in South America and the Sunbelt Region of the United States. It is also the leading shareholder in Turkey’s BBVA Garanti. Its purpose is to bring the age of opportunities to everyone, based on our customers’ real needs: provide the best solutions, helping them make the best financial decisions, through an easy and convenient experience. The institution rests in solid values: Customer comes first, we think big and we are one team. Its responsible banking model aspires to achieve a more inclusive and sustainable society.
 | 07.31.2019 |
BBVA Group highlights (Consolidated figures) | ||||||||
| 30-06-19 | r% | 30-06-18 | 31-12-18 | |||||||||||||
Balance sheet (millions of euros) | ||||||||||||||||
Total assets | 697,626 | 1.1 | 689,850 | 676,689 | ||||||||||||
Loans and advances to customers (gross) | 389,306 | (0.3) | 390,661 | 386,225 | ||||||||||||
Deposits from customers | 375,104 | 2.1 | 367,312 | 375,970 | ||||||||||||
Total customer funds | 478,907 | 2.2 | 468,811 | 474,120 | ||||||||||||
Total equity | 54,690 | 4.6 | 52,278 | 52,874 | ||||||||||||
Income statement (millions of euros) | ||||||||||||||||
Net interest income | 8,987 | 4.6 | 8,590 | 17,591 | ||||||||||||
Gross income | 11,989 | 1.1 | 11,863 | 23,747 | ||||||||||||
Operating income | 6,115 | 2.5 | 5,967 | 12,045 | ||||||||||||
Net attributable profit | 2,442 | (3.7) | 2,536 | 5,324 | ||||||||||||
The BBVA share and share performance ratios | ||||||||||||||||
Number of shares (million) | 6,668 | - | 6,668 | 6,668 | ||||||||||||
Share price (euros) | 4.92 | (19.0) | 6.07 | 4.64 | ||||||||||||
Earning per share (euros) (1) | 0.34 | (5.5) | 0.36 | 0.76 | ||||||||||||
Book value per share (euros) | 7.34 | 6.2 | 6.91 | 7.12 | ||||||||||||
Tangible book value per share (euros) | 6.10 | 8.0 | 5.65 | 5.86 | ||||||||||||
Market capitalization (millions of euros) | 32,786 | (19.0) | 40,501 | 30,909 | ||||||||||||
Yield (dividend/price; %) | 5.3 | 4.0 | 5.4 | |||||||||||||
Significant ratios (%) | ||||||||||||||||
ROE (net attributable profit/average shareholders’ funds +/- average accumulated other comprehensive income) (2) | 10.2 | 11.2 | 11.5 | |||||||||||||
ROTE (net attributable profit/average shareholders’ funds excluding average intangible assets +/- average accumulated other comprehensive income) (2) | 12.4 | 13.7 | 14.1 | |||||||||||||
ROA (Profit or loss for the year/average total assets) | 0.86 | 0.90 | 0.91 | |||||||||||||
RORWA (Profit or loss for the year/average risk-weighted assets - RWA) | 1.65 | 1.72 | 1.74 | |||||||||||||
Efficiency ratio | 49.0 | 49.7 | 49.3 | |||||||||||||
Cost of risk | 0.91 | 0.82 | 1.01 | |||||||||||||
NPL ratio | 3.8 | 4.4 | 3.9 | |||||||||||||
NPL coverage ratio | 75 | 71 | 73 | |||||||||||||
Capital adequacy ratios (%) | ||||||||||||||||
CET1 fully-loaded | 11.5 | 10.8 | 11.3 | |||||||||||||
CET1phased-in(3) | 11.8 | 11.1 | 11.6 | |||||||||||||
Total ratiophased-in(3) | 15.8 | 15.4 | 15.7 | |||||||||||||
Other information | ||||||||||||||||
Number of clients (million) | 76.0 | 1.4 | 75.0 | 74.8 | ||||||||||||
Number of shareholders | 888,559 | (0.3) | 890,821 | 902,708 | ||||||||||||
Number of employees | 126,017 | (4.4) | 131,784 | 125,627 | ||||||||||||
Number of branches | 7,823 | (3.9) | 8,141 | 7,963 | ||||||||||||
Number of ATMs | 32,621 | 1.6 | 32,121 | 32,635 | ||||||||||||
General note: the application of accounting for hyperinflation in Argentina was performed for the first time in September 2018 with accounting effects on January 1, 2018, recording the impact of the nine months in the third quarter. In order to make the 2019 information comparable to the 2018, the income statements and balance sheets of the first three quarters of 2018 have been reexpressed to reflect these impacts.
(1) Adjusted by additional Tier 1 instrument remuneration.
(2) The ROE and ROTE ratios include, in the denominator, the Group’s average shareholders’ funds and take into account the item called “Accumulated other comprehensive income”, which forms part of the equity. Excluding this item, the ROE would stand at 9.0%, in the first semester of 2019; 10.1%, in 2018; and 9.8%, in the first semester of 2018; and the ROTE at 10.6%, 11.9% and 11.7%, respectively.
(3) As of June 30, 2019,phased-in ratios include the temporary treatment on the impact of IFRS 9, calculated in accordance with Article 473 bis of the Capital Requirements Regulation (CRR).
 | 07.31.2019 |
Consolidated income statement: quarterly evolution (Millions of euros)
|
| |||||||||||||||||||||||
| 2019 | 2018 �� | |||||||||||||||||||||||
2Q
| 1Q
| 4Q
| 3Q
| 2Q
| 1Q
| |||||||||||||||||||
Net interest income | 4,566 | 4,420 | 4,692 | 4,309 | 4,302 | 4,287 | ||||||||||||||||||
Net fees and commissions | 1,256 | 1,214 | 1,226 | 1,173 | 1,244 | 1,236 | ||||||||||||||||||
Net trading income | 116 | 426 | 316 | 212 | 285 | 410 | ||||||||||||||||||
Other operating income and expenses | (18) | 8 | (83) | 38 | 6 | 92 | ||||||||||||||||||
Gross income | 5,920 | 6,069 | 6,151 | 5,733 | 5,838 | 6,026 | ||||||||||||||||||
Operating expenses | (2,952) | (2,922) | (2,981) | (2,825) | (2,921) | (2,975) | ||||||||||||||||||
Personnel expenses | (1,578) | (1,553) | (1,557) | (1,459) | (1,539) | (1,565) | ||||||||||||||||||
Other administrative expenses | (976) | (977) | (1,119) | (1,062) | (1,087) | (1,106) | ||||||||||||||||||
Depreciation | (398) | (392) | (305) | (304) | (295) | (304) | ||||||||||||||||||
Operating income | 2,968 | 3,147 | 3,170 | 2,908 | 2,917 | 3,050 | ||||||||||||||||||
Impairment on financial assets not measured at fair value through profit or loss | (753) | (1,023) | (1,353) | (1,023) | (783) | (823) | ||||||||||||||||||
Provisions or reversal of provisions | (117) | (144) | (66) | (123) | (85) | (99) | ||||||||||||||||||
Other gains (losses) | (3) | (22) | (183) | (36) | 67 | 41 | ||||||||||||||||||
Profit/(loss) before tax | 2,095 | 1,957 | 1,568 | 1,727 | 2,116 | 2,170 | ||||||||||||||||||
Income tax | (577) | (559) | (421) | (419) | (605) | (617) | ||||||||||||||||||
Profit/(loss) after tax from ongoing operations | 1,519 | 1,398 | 1,147 | 1,307 | 1,511 | 1,553 | ||||||||||||||||||
Results from corporate operations (1) | - | - | - | 633 | - | - | ||||||||||||||||||
Profit/(loss) for the year | 1,519 | 1,398 | 1,147 | 1,941 | 1,511 | 1,553 | ||||||||||||||||||
Non-controlling interests | (241) | (234) | (145) | (154) | (265) | (262) | ||||||||||||||||||
Net attributable profit | 1,278 | 1,164 | 1,001 | 1,787 | 1,245 | 1,290 | ||||||||||||||||||
Net attributable profit excluding results from corporate operations | 1,278 | 1,164 | 1,001 | 1,154 | 1,245 | 1,290 | ||||||||||||||||||
Earning per share (euros) (2) | 0.17 | 0.16 | 0.14 | 0.26 | 0.17 | 0.18 | ||||||||||||||||||
General note: the application of accounting for hyperinflation in Argentina was performed for the first time in September 2018 with accounting effects on January 1, 2018, recording the impact of the 9 months in the third quarter. In order to make the 2019 information comparable to the 2018, the income statements for the first three quarters of 2018 have been reexpressed to reflect the impacts of inflation on their income and expenses.
(1) Includes net capital gains from the sale of BBVA Chile.
(2) Adjusted by additional Tier 1 instrument remuneration.
 | 07.31.2019 |
Consolidated income statement (Millions of euros)
| ||||||||
| 1H19 | r% | r% at constant exchange rates | 1H18 | |||||||||||||
Net interest income | 8,987 | 4.6 | 7.1 | 8,590 | ||||||||||||
Net fees and commissions | 2,470 | (0.4) | 1.4 | 2,480 | ||||||||||||
Net trading income | 542 | (22.0) | (20.9) | 696 | ||||||||||||
Other operating income and expenses | (10) | n.s. | n.s. | 98 | ||||||||||||
Gross income | 11,989 | 1.1 | 3.3 | 11,863 | ||||||||||||
Operating expenses | (5,874) | (0.4) | 1.2 | (5,896) | ||||||||||||
Personnel expenses | (3,131) | 0.9 | 2.6 | (3,104) | ||||||||||||
Other administrative expenses | (1,953) | (11.0) | (9.5) | (2,193) | ||||||||||||
Depreciation | (790) | 32.0 | 33.3 | (599) | ||||||||||||
Operating income | 6,115 | 2.5 | 5.4 | 5,967 | ||||||||||||
Impairment on financial assets not measured at fair value through profit or loss | (1,777) | 10.6 | 12.9 | (1,606) | ||||||||||||
Provisions or reversal of provisions | (261) | 41.7 | 45.0 | (184) | ||||||||||||
Other gains (losses) | (25) | n.s. | n.s. | 108 | ||||||||||||
Profit/(loss) before tax | 4,052 | (5.4) | (2.4) | 4,286 | ||||||||||||
Income tax | (1,136) | (7.1) | (4.7) | (1,222) | ||||||||||||
Profit/(loss) after tax from ongoing operations | 2,916 | (4.8) | (1.5) | 3,063 | ||||||||||||
Results from corporate operations | - | - | - | - | ||||||||||||
Profit/(loss) for the year | 2,916 | (4.8) | (1.5) | 3,063 | ||||||||||||
Non-controlling interests | (475) | (10.1) | 9.4 | (528) | ||||||||||||
Net attributable profit | 2,442 | (3.7) | (3.3) | 2,536 | ||||||||||||
Net attributable profit excluding results from corporate operations | 2,442 | (3.7) | (3.3) | 2,536 | ||||||||||||
Earning per share (euros) (1) | 0.34 | 0.36 | ||||||||||||||
General note: the application of accounting for hyperinflation in Argentina was performed for the first time in September 2018 with accounting effects on January 1, 2018, recording the impact of the 9 months in the third quarter. In order to make the 2019 information comparable to the 2018, the income statements for the first three quarters of 2018 have been reexpressed to reflect the impacts of inflation on their income and expenses.
(1) Adjusted by additional Tier 1 instrument remuneration.
SIGNATURE
Pursuant to the requirements of the Securities Exchange Act of 1934, the registrant has duly caused this report to be signed on its behalf by the undersigned, thereunto duly authorized.
| Banco Bilbao Vizcaya Argentaria, S.A. | ||||||
| Date: July 31, 2019 | ||||||
| By: | /s/ María Ángeles Peláez Morón | |||||
| Name: | María Ángeles Peláez Morón | |||||
| Title: | Authorized representative | |||||