Table of Contents
UNITED STATES
SECURITIES AND EXCHANGE COMMISSION
WASHINGTON, D.C. 20549
FORM6-K
REPORT OF FOREIGN ISSUER
PURSUANT TO RULE13a-16 OR15d-16
UNDER THE SECURITIES EXCHANGE ACT OF 1934
For the month of July, 2019
Commission file number:1-10110
BANCO BILBAO VIZCAYA ARGENTARIA, S.A.
(Exact name of Registrant as specified in its charter)
BANK BILBAO VIZCAYA ARGENTARIA, S.A.
(Translation of Registrant’s name into English)
Calle Azul 4,
28050 Madrid
Spain
(Address of principal executive offices)
Indicate by check mark whether the registrant files or will file annual reports under cover of Form20-F or Form40-F:
Form20-F ☒ Form40-F ☐
Indicate by check mark if the registrant is submitting the Form6-K in paper as permitted by RegulationS-T Rule 101(b)(1):
Yes ☐ No ☒
Indicate by check mark if the registrant is submitting the Form6-K in paper as permitted by RegulationS-T Rule 101(b)(7):
Yes ☐ No ☒
Table of Contents

January-June 2019 2Q19
Table of Contents
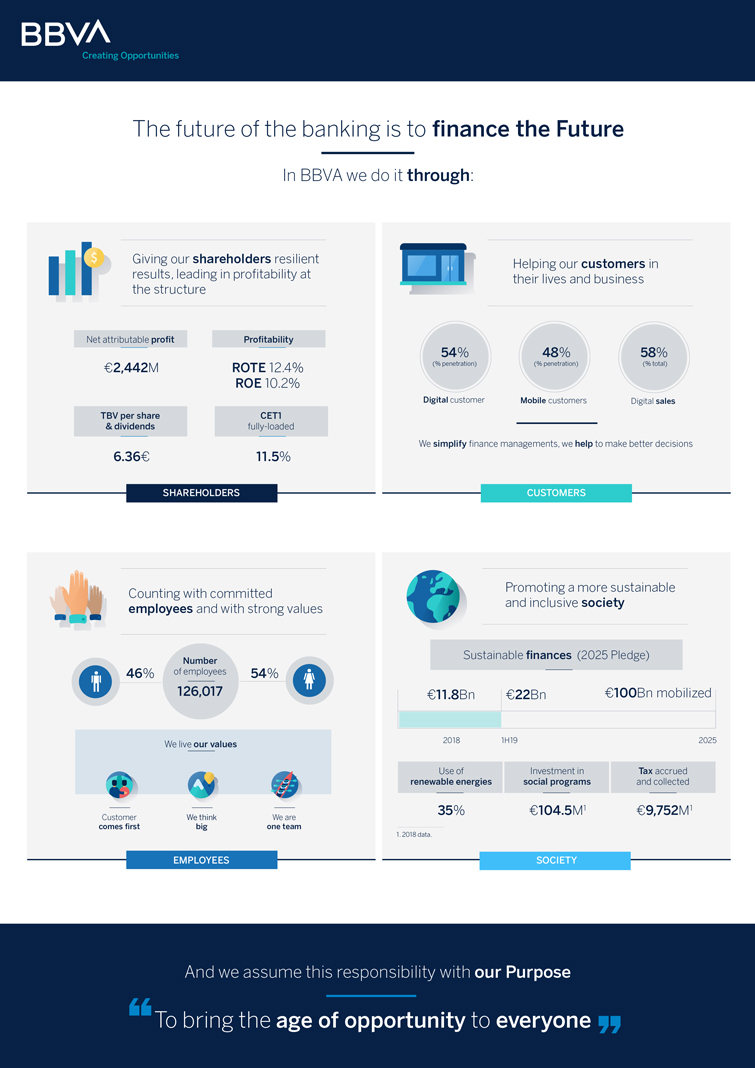
The future of the banking is to finance the Future In BBVA we do it through: Giving our shareholders resilient results, leading in profitability at the structure Net attributable profit Profitability €2,442M ROTE 12.4% ROE 10.2% TBV per share CET1 & dividends fully-loaded 6.36€ 11.5% Helping our customers in their lives and business 54% 48% 58% (% penetration) (% penetration) (% total) Digital customer Mobile customers Digital sales We simplify finance managements, we help to make better decisions SHAREHOLDERS CUSTOMERS Counting with committed employees and with strong values Number 46% of employees 54% 126,017 We live our values Customer We think We are comes first big one team EMPLOYEES Promoting a more sustainable and inclusive society Sustainable finances (2025 Pledge) €11.8Bn €22Bn €100Bn mobilized 2018 1H19 2025 Use of Investment in Tax accrued renewable energies social programs and collected 35% €104.5M1 €9,752M1 1. 2018 data. SOCIETY And we assume this responsibility with our Purpose “To bring the age of opportunity to everyone”
Table of Contents
| 2 | ||||
| 3 | ||||
| 3 | ||||
| 6 | ||||
| 12 | ||||
| 14 | ||||
| 16 | ||||
| 20 | ||||
| 23 | ||||
| 25 | ||||
| 28 | ||||
| 31 | ||||
| 34 | ||||
| 37 | ||||
| 40 | ||||
| 43 | ||||
| 47 | ||||
| 49 | ||||
| 51 | ||||
Table of Contents
| 2 |
BBVA GROUP HIGHLIGHTS
(CONSOLIDATED FIGURES)
| 30-06-19 | D % | 30-06-18 | 31-12-18 | |||||||||||||
Balance sheet (millions of euros) | ||||||||||||||||
Total assets | 697,626 | 1.1 | 689,850 | 676,689 | ||||||||||||
Loans and advances to customers (gross) | 389,306 | (0.3 | ) | 390,661 | 386,225 | |||||||||||
Deposits from customers | 375,104 | 2.1 | 367,312 | 375,970 | ||||||||||||
Total customer funds | 478,907 | 2.2 | 468,811 | 474,120 | ||||||||||||
Total equity | 54,690 | 4.6 | 52,278 | 52,874 | ||||||||||||
Income statement (millions of euros) | ||||||||||||||||
Net interest income | 8,987 | 4.6 | 8,590 | 17,591 | ||||||||||||
Gross income | 11,989 | 1.1 | 11,863 | 23,747 | ||||||||||||
Operating income | 6,115 | 2.5 | 5,967 | 12,045 | ||||||||||||
Net attributable profit | 2,442 | (3.7 | ) | 2,536 | 5,324 | |||||||||||
The BBVA share and share performance ratios | ||||||||||||||||
Number of shares (million) | 6,668 | — | 6,668 | 6,668 | ||||||||||||
Share price (euros) | 4.92 | (19.0 | ) | 6.07 | 4.64 | |||||||||||
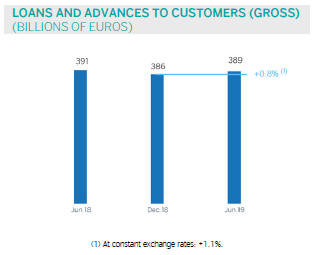
Earning per share (euros)(1) | 0.34 | (5.5 | ) | 0.36 | 0.76 | |||||||||||
Book value per share (euros) | 7.34 | 6.2 | 6.91 | 7.12 | ||||||||||||
Tangible book value per share (euros) | 6.10 | 8.0 | 5.65 | 5.86 | ||||||||||||
Market capitalization (millions of euros) | 32,786 | (19.0 | ) | 40,501 | 30,909 | |||||||||||
Yield (dividend/price; %) | 5.3 | 4.0 | 5.4 | |||||||||||||
Significant ratios (%) | ||||||||||||||||
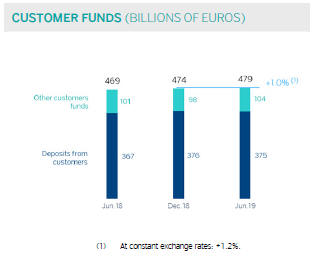
ROE (net attributable profit/average shareholders’ funds +/- average accumulated other comprehensive income)(2) | 10.2 | 11.2 | 11.5 | |||||||||||||
ROTE (net attributable profit/average shareholders’ funds excluding average intangible assets +/- average accumulated other comprehensive income)(2) | | 12.4 | | | 13.7 | | | 14.1 | | |||||||
ROA (Profit or loss for the year/average total assets) | 0.86 | 0.90 | 0.91 | |||||||||||||
RORWA (Profit or loss for the year/average risk-weighted assets - RWA) | 1.65 | 1.72 | 1.74 | |||||||||||||
Efficiency ratio | 49.0 | 49.7 | 49.3 | |||||||||||||
Cost of risk | 0.91 | 0.82 | 1.01 | |||||||||||||
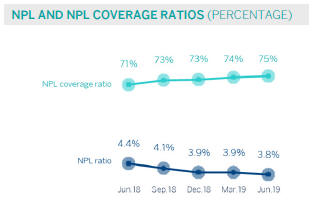
NPL ratio | 3.8 | 4.4 | 3.9 | |||||||||||||
NPL coverage ratio | 75 | 71 | 73 | |||||||||||||
Capital adequacy ratios (%) | ||||||||||||||||
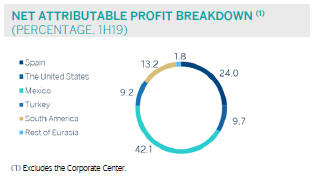
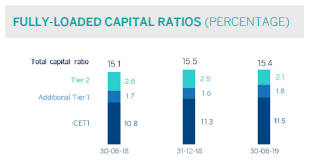
CET1 fully-loaded | 11.5 | 10.8 | 11.3 | |||||||||||||
CET1phased-in(3) | 11.8 | 11.1 | 11.6 | |||||||||||||
Total ratiophased-in(3) | 15.8 | 15.4 | 15.7 | |||||||||||||
Other information | ||||||||||||||||
Number of clients (million) | 76.0 | 1.4 | 75.0 | 74.8 | �� | |||||||||||
Number of shareholders | 888,559 | (0.3 | ) | 890,821 | 902,708 | |||||||||||
Number of employees | 126,017 | (4.4 | ) | 131,784 | 125,627 | |||||||||||
Number of branches | 7,823 | (3.9 | ) | 8,141 | 7,963 | |||||||||||
Number of ATMs | 32,621 | 1.6 | 32,121 | 32,635 | ||||||||||||
General note: the application of accounting for hyperinflation in Argentina was performed for the first time in September 2018 with accounting effects on January 1, 2018, recording the impact of the nine months in the third quarter. In order to make the 2019 information comparable to the 2018, the income statements and balance sheets of the first three quarters of 2018 have been reexpressed to reflect these impacts.
| (1) | Adjusted by additional Tier 1 instrument remuneration. |
| (2) | The ROE and ROTE ratios include, in the denominator, the Group’s average shareholders’ funds and take into account the item called “Accumulated other comprehensive income”, which forms part of the equity. Excluding this item, the ROE would stand at 9.0%, in the first semester of 2019; 10.1%, in 2018; and 9.8%, in the first semester of 2018; and the ROTE at 10.6%, 11.9% and 11.7%, respectively. |
| (3) | As of June 30, 2019,phased-in ratios include the temporary treatment on the impact of IFRS 9, calculated in accordance with Article 473 bis of the Capital Requirements Regulation (CRR). |
Table of Contents
 | 3 |
Results
| • | In the first half of 2019, the overall growthin recurring revenue itemsis maintained,with a positive evolution in terms of net interest income in most business areas. |
| • | The trend of containingoperating expensesand improving the efficiency ratio compared to the same period of the previous year continues. |
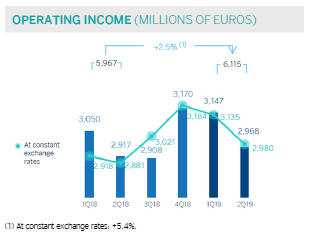
| • | As a result of the above,operating incomeincreased 2.5%year-on-year. |
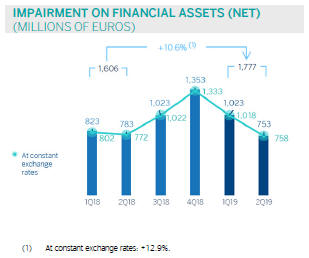
| • | Impairment on financial assetsincreased 10.6%year-on-year as a result of the higher loan-loss provisions due to the deterioration of specific portfolios and the update of macroeconomic scenarios in the United States, Mexico and Turkey, especially in the first quarter of the year. The second quarter registered one of the lowest levels of impairment in recent years, thanks to lower needs in Spain, including the positive impact of the sale ofnon-performing andwritten-off loan portfolios. |
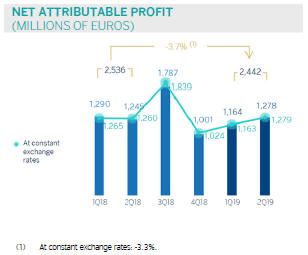
| • | Finally, thenet attributable profitstood at €2,442m, a 3.7% lower than in the same period of 2018, but increased 9.8% in the second quarter of 2019 compared to the first quarter of the year. |
Balance sheet and business activity
| • | As of June 30, 2019,loans and advances to customers (gross) grew 0.8% compared to December 31, 2018, with improved levels of activity in all business areas. |
| • | Strong performance ofcustomer funds (up1.0% compared to December 31, 2018). Noteworthy is the strong performance of demand deposits, mutual funds and pension funds. |
| • | Issuance in June of agreen bond of €1,000m in a seniornon-preferred debt format (the second in this category issued by BBVA). |
Solvency
| • | TheCET1 fully-loadedratio reached 11.5%, up 17 basis points in the first half of the year due to recurring organic capital generation and supported by the positive evolution of the markets. Thus, this ratio is positioned within the range of this capital target defined for the Group. |
Table of Contents
| 4 |
Risk management
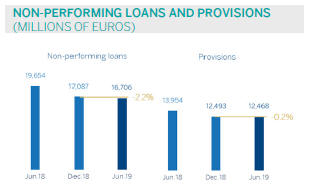
| • | Positive performance ofrisk metrics in the first half of 2019:non-performing loans fell by 2.2% in the first six months of the year. As of June 30, 2019, the NPL ratio stood at 3.8%, the NPL coverage ratio 75%, and the cost of risk 0.91%. |
| • | In the second quarter of 2019, the great majority of the credits that composed the loans from anon-performing andwritten-off mortgages loan portfolio, with a gross amount of €1,162m, were transferred to Anfora Investing UK Limited Partnership, an entity belonging to Canada Pension Plan Investment Board, has taken place. The positive impact of this transaction in the net attributable profit was €130m, and on the fully loaded CET1 it’s slightly positive. The transfer of the remainder of the portfolio took place inmid-July, with a slightly positive result which will be accounted in the third quarter of 2019. |
Transformation
| • | In the second quarter of 2019, the Group changed itsbrand name to BBVA in the countries in which it operates, discontinuing the local brand names in Argentina (Francés), the United States (Compass), Mexico (Bancomer) and Peru (Continental). The franchise in Turkey has changed its name to Garanti BBVA. As a result of this rebranding, BBVA has updated its logo and corporate identity. |
| • | The new corporate identity reinforces BBVA’s aim of offering a unique value proposition and a homogeneous customer experience which, leveraged on technology and data, will help customers manage their finances. In addition, it has a better design for the growing digital world in which BBVA operates and it’s an example of the Group’s values, in particular “We are one team” value, which emphasizes the importance of its employees and their commitment to the BBVA project. The new brand also reflects the Bank’s purpose: to bring the age of opportunity to everyone. |
| • | While the new logo retains key elements already known by BBVA - especially the color and the use of capital letters- it introduces a new font and design that provides it with more versatility and functionality on digital channels and platforms. |
| • | This change emphasises the Group’s digital transformation and BBVA’s commitment to offer its customers global products and services with the aim of being a global digital financial advisor, with a value proposition that helps people and companies in their real needs, lives and businesses in order to make better financial decisions. |
| • | In addition, the Group’sdigital and mobile customerbase continues to grow, as well as itsdigital sales. |
Table of Contents
| 5 |

Dividends
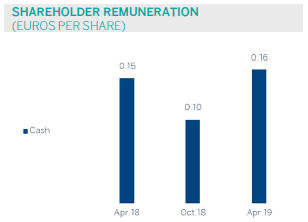
| • | On April 10, 2019, there was a gross cash payment of €0.16 per share, corresponding to the supplementary dividend for 2018 that was approved at the General Shareholders’ Meeting held on March 15. |
Other matters of interest
| • | IFRS 16 “Leases” came into effect on January 1, 2019, which requires lessees to recognize the assets and liabilities arising from the rights and obligations of lease agreements. The main impacts are the recognition of an asset through the right of use and a liability based on future payment obligations. The impact of the first implementation was €3,419m and €3,472m, respectively, resulting in a decrease of 11 basis points of the CET1 capital ratio. |
| • | In order to ensure that the information for 2019 is comparable to that of 2018, the balance sheets, income statements and ratios of the first three quarters of 2018 financial year for the Group and the South America business area have been restated to reflect the impact of the hyperinflation in Argentina as a result of the application of IAS 29 “Financial Reporting in Hyperinflationary Economies”. This impact was first registered in the third quarter of 2018, but with accounting effects as of January 1, 2018. |
Table of Contents
| 6 |
In the first half of 2019, BBVA Group generated anet attributableprofit of €2,442m, a decrease of 3.7% compared to the same period of 2018 (down 3.3% at constant exchange rates), while it showed an increase of 9.8% compared to the first quarter of the year. The strong performance in recurring
revenue items, especially that of net interest income, along with the positive impact on the impairment on financial assets due to the sale ofnon-performing andwritten-off loans explain the improvement when compared to the first quarter of 2019.
CONSOLIDATED INCOME STATEMENT: QUARTERLY EVOLUTION
(MILLIONS OF EUROS)
| 2019 | 2018 | |||||||||||||||||||||||
| 2Q | 1Q | 4Q | 3Q | 2Q | 1Q | |||||||||||||||||||
Net interest income | 4,566 | 4,420 | 4,692 | 4,309 | 4,302 | 4,287 | ||||||||||||||||||
Net fees and commissions | 1,256 | 1,214 | 1,226 | 1,173 | 1,244 | 1,236 | ||||||||||||||||||
Net trading income | 116 | 426 | 316 | 212 | 285 | 410 | ||||||||||||||||||
Other operating income and expenses | (18 | ) | 8 | (83 | ) | 38 | 6 | 92 | ||||||||||||||||
Gross income | 5,920 | 6,069 | 6,151 | 5,733 | 5,838 | 6,026 | ||||||||||||||||||
Operating expenses | (2,952 | ) | (2,922 | ) | (2,981 | ) | (2,825 | ) | (2,921 | ) | (2,975 | ) | ||||||||||||
Personnel expenses | (1,578 | ) | (1,553 | ) | (1,557 | ) | (1,459 | ) | (1,539 | ) | (1,565 | ) | ||||||||||||
Other administrative expenses | (976 | ) | (977 | ) | (1,119 | ) | (1,062 | ) | (1,087 | ) | (1,106 | ) | ||||||||||||
Depreciation | (398 | ) | (392 | ) | (305 | ) | (304 | ) | (295 | ) | (304 | ) | ||||||||||||
Operating income | 2,968 | 3,147 | 3,170 | 2,908 | 2,917 | 3,050 | ||||||||||||||||||
Impairment on financial assets not measured at fair value through profit or loss | (753 | ) | (1,023 | ) | (1,353 | ) | (1,023 | ) | (783 | ) | (823 | ) | ||||||||||||
Provisions or reversal of provisions | (117 | ) | (144 | ) | (66 | ) | (123 | ) | (85 | ) | (99 | ) | ||||||||||||
Other gains (losses) | (3 | ) | (22 | ) | (183 | ) | (36 | ) | 67 | 41 | ||||||||||||||
Profit/(loss) before tax | 2,095 | 1,957 | 1,568 | 1,727 | 2,116 | 2,170 | ||||||||||||||||||
Income tax | (577 | ) | (559 | ) | (421 | ) | (419 | ) | (605 | ) | (617 | ) | ||||||||||||
Profit/(loss) after tax from ongoing operations | 1,519 | 1,398 | 1,147 | 1,307 | 1,511 | 1,553 | ||||||||||||||||||
Results from corporate operations(1) | — | — | — | 633 | — | — | ||||||||||||||||||
Profit/(loss) for the year | 1,519 | 1,398 | 1,147 | 1,941 | 1,511 | 1,553 | ||||||||||||||||||
Non-controlling interests | (241 | ) | (234 | ) | (145 | ) | (154 | ) | (265 | ) | (262 | ) | ||||||||||||
Net attributable profit | 1,278 | 1,164 | 1,001 | 1,787 | 1,245 | 1,290 | ||||||||||||||||||
Net attributable profit excluding results from corporate operations | 1,278 | 1,164 | 1,001 | 1,154 | 1,245 | 1,290 | ||||||||||||||||||
Earning per share (euros)(2) | 0.17 | 0.16 | 0.14 | 0.26 | 0.17 | 0.18 | ||||||||||||||||||
General note: the application of accounting for hyperinflation in Argentina was performed for the first time in September 2018 with accounting effects on January 1, 2018, recording the impact of the 9 months in the third quarter. In order to make the 2019 information comparable to the 2018, the income statements for the first three quarters of 2018 have been reexpressed to reflect the impacts of inflation on their income and expenses.
| (1) | Includes net capital gains from the sale of BBVA Chile. |
| (2) | Adjusted by additional Tier 1 instrument remuneration. |
Table of Contents
| 7 |
CONSOLIDATED INCOME STATEMENT
(MILLIONS OF EUROS)
| 1H19 | D % | D % at constant exchange rates | 1H18 | |||||||||||||
Net interest income | 8,987 | 4.6 | 7.1 | 8,590 | ||||||||||||
Net fees and commissions | 2,470 | (0.4 | ) | 1.4 | 2,480 | |||||||||||
Net trading income | 542 | (22.0 | ) | (20.9 | ) | 696 | ||||||||||
Other operating income and expenses | (10 | ) | n.s. | n.s. | 98 | |||||||||||
Gross income | 11,989 | 1.1 | 3.3 | 11,863 | ||||||||||||
Operating expenses | (5,874 | ) | (0.4 | ) | 1.2 | (5,896 | ) | |||||||||
Personnel expenses | (3,131 | ) | 0.9 | 2.6 | (3,104 | ) | ||||||||||
Other administrative expenses | (1,953 | ) | (11.0 | ) | (9.5 | ) | (2,193 | ) | ||||||||
Depreciation | (790 | ) | 32.0 | 33.3 | (599 | ) | ||||||||||
Operating income | 6,115 | 2.5 | 5.4 | 5,967 | ||||||||||||
Impairment on financial assets not measured at fair value through profit or loss | (1,777 | ) | 10.6 | 12.9 | (1,606 | ) | ||||||||||
Provisions or reversal of provisions | (261 | ) | 41.7 | 45.0 | (184 | ) | ||||||||||
Other gains (losses) | (25 | ) | n.s. | n.s. | 108 | |||||||||||
Profit/(loss) before tax | 4,052 | (5.4 | ) | (2.4 | ) | 4,286 | ||||||||||
Income tax | (1,136 | ) | (7.1 | ) | (4.7 | ) | (1,222 | ) | ||||||||
Profit/(loss) after tax from ongoing operations | 2,916 | (4.8 | ) | (1.5 | ) | 3,063 | ||||||||||
Results from corporate operations | — | — | — | — | ||||||||||||
Profit/(loss) for the year | 2,916 | (4.8 | ) | (1.5 | ) | 3,063 | ||||||||||
Non-controlling interests | (475 | ) | (10.1 | ) | 9.4 | (528 | ) | |||||||||
Net attributable profit | 2,442 | (3.7 | ) | (3.3 | ) | 2,536 | ||||||||||
Net attributable profit excluding results from corporate operations | 2,442 | (3.7 | ) | (3.3 | ) | 2,536 | ||||||||||
Earning per share (euros)(1) | 0.34 | 0.36 | ||||||||||||||
General note: the application of accounting for hyperinflation in Argentina was performed for the first time in September 2018 with accounting effects on January 1, 2018, recording the impact of the 9 months in the third quarter. In order to make the 2019 information comparable to the 2018, the income statements for the first three quarters of 2018 have been reexpressed to reflect the impacts of inflation on their income and expenses.
| (1) | Adjusted by additional Tier 1 instrument remuneration. |
Unless expressly indicated otherwise, to better understand the changes in the main headings of the Group’s income statement, theyear-on-year percentage changes provided below refer toconstant exchange rates and the quarterly changes are for the quarter ending with respect to the previous quarter.
Gross income
Gross income grew 3.3%year-on-year, supported by the strong performance of the net interest income and, to a lesser extent, the growth of net fees and commissions.
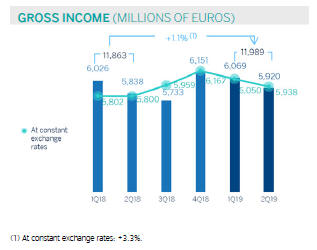
Table of Contents
| 8 |
Net interest income increased 7.1%year-on-year and 4.0%quarter-on-quarter. This is explained by a higher activity during the first half of the year in Spain, Mexico, Turkey, South America and the Rest of Eurasia.
Net fees and commissionsin the first half of 2019 grew 1.4%year-on-year, driven by an adequate diversification. Net fees and commissions increased by 4.2% in the second quarter.
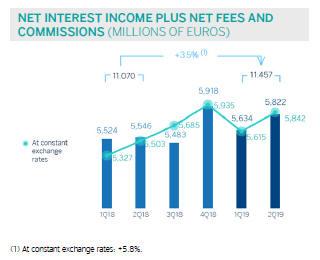
As a result, the morerecurring revenue items (net interest income plus net fees and commissions) increased by 5.8%year-on-year (up 4.0% compared to the previous quarter).
The positive contribution ofNTI moderatedin the first half of 2019 compared to the same period in 2018, mainly explained by a lower contribution from Corporate & Investment Banking (CIB), which was partially offset by capital gains coming from the sale of Prisma Medios de Pago, S.A. in Argentina.
Other operating income and expenses recorded a negative balance as a result of BBVA’s annual contribution in Spain to the Single Resolution Fund (SRF) of €144m made in the second quarter (€124m in the same period of 2018), and the negative impact from the inflation in Argentina. However, the net contribution of the insurance business grew by 10.4%year-on-year.
Operating income
Operating expenses in the first half of 2019 increased 1.2%year-on-year, (down 0.4% at current exchange rates), with a variation below the inflation recorded in most of the countries where BBVA operates, highlighting the cost reduction in Spain.
Table of Contents
| 9 |
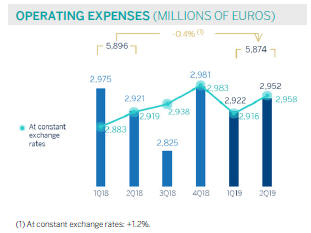
Theefficiency ratio stood at 49.0% in the first half of the year, improving as a result of the lower growth in expenses compared to the increase in gross income, and it was slightly below the level reached in the 2018 financial year (49.3%).Operating income grew 5.4%year-on-year.

Provisions and other
Impairment on financial assets not measured at fair value through profit or loss (impairment on financial assets)in the second quarter of 2019 stood at €753m, one of the lowest quarterly figures in the last five years (down 25.6% in the quarter). In the first half of 2019, impairment on financial assets increased by 12.9% compared to the same period of 2018. By business area, the United States recorded higher loan-loss provisions for specific customers in the commercial portfolio and increased write-offs in consumer loans. In the case of Mexico and Turkey higher loan-loss provisions are explained by the deterioration of specific customer portfolios and by d the update of their macroeconomic scenarios. On the other hand Spain registered a positive amount due to the lower loan-loss provisioning needs mainly due to, the positive effect of the sale ofnon-performing andwritten-off portfolios especially mortgage loans during the second quarter of 2019.
Table of Contents
| 10 |
Provisions or reversal of provisions (provisions) increased by 45.0% compared to the same period of 2018, which incorporated the gains for certain sales of holdings carried out in Mexico, Turkey and the former Non Core Real Estate business area.
Results
As a result of the above, the Group’snet attributable profit in the first half of 2019 was 3.3% lower than in the same period last year (down 3.7% at current exchange rates), featured by higher levels of recurring revenues but negatively impacted by lower net trading income and by higher loan-loss provisions.
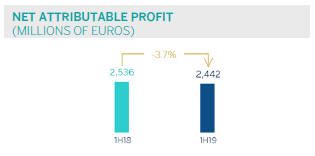
Bybusiness areas, during the first six months of the year Spain generated a net attributable profit of €734m, the United States contributed €297m, Mexico registered €1,287m of profit, Turkey contributed €282m, South America €404m and the Rest of Eurasia €55m.
Table of Contents
| 11 |
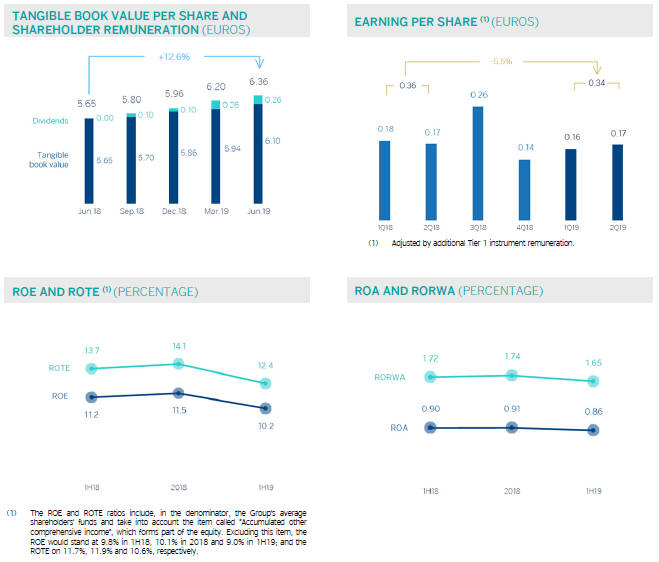
Table of Contents
| 12 |
Balance sheet and business activity
The most relevantaspects of the Group’s balance sheet and business activity as of June 30, 2019 are summarized below:
| • | Loans and advances to customers (gross) registered a growth of 0.8% in the first half of 2019 (up 1.1% at constant exchange rates), with increases in the business areas of Mexico, South America, the Rest of Eurasia, and, to a lesser extent, Spain. |
| • | Non-performing loans fell by 2.2% in the first six months of 2019 (down 15.0%year-on-year), mainly due to the decrease registered in Spain resulting from the sale ofnon-performing loans portfolios and, to a lesser extent, in the Rest of Eurasia. |
| • | In terms of customerdeposits, time deposits decreased by 8.0% in the first half (down 15.2%year-on-year), primarily in Spain, Turkey and the United States, which was not compensated by the 3.2% increase in demand deposits in the first six months of 2019 (up 6.7%year-on-year), especially in Spain. |
| • | Off-balance sheet funds registered a growth of 5.8% in the first half of the year, thanks to the strong performance of, both, mutual funds and pension funds. |
| • | In terms oftangible assets, the balance as of June 30, 2019 is affected, above all, by the implementation of IFRS 16 “Leases”, with a growth of 42.5% compared to the end of the previous fiscal year. |
CONSOLIDATED BALANCE SHEET
(MILLIONS OF EUROS)
| 30-06-19 | D % | 31-12-18 | 30-06-18 | |||||||||||||
Cash, cash balances at central banks and other demand deposits | 44,565 | (23.4 | ) | 58,196 | 37,279 | |||||||||||
Financial assets held for trading | 105,369 | 16.9 | 90,117 | 91,018 | ||||||||||||
Non-trading financial assets mandatorily at fair value through profit or loss | 4,918 | (4.2 | ) | 5,135 | 4,377 | |||||||||||
Financial assets designated at fair value through profit or loss | 1,403 | 6.9 | 1,313 | 1,487 | ||||||||||||
Financial assets at fair value through accumulated other comprehensive income | 63,364 | 12.5 | 56,337 | 63,212 | ||||||||||||
Financial assets at amortized cost | 430,930 | 2.7 | 419,660 | 426,349 | ||||||||||||
Loans and advances to central banks and credit institutions | 16,421 | 25.3 | 13,103 | 17,092 | ||||||||||||
Loans and advances to customers | 377,155 | 0.8 | 374,027 | 377,175 | ||||||||||||
Debt securities | 37,354 | 14.8 | 32,530 | 32,082 | ||||||||||||
Investments in subsidiaries, joint ventures and associates | 1,638 | 3.8 | 1,578 | 1,470 | ||||||||||||
Tangible assets | 10,302 | 42.5 | 7,229 | 6,987 | ||||||||||||
Intangible assets | 8,262 | (0.6 | ) | 8,314 | 8,377 | |||||||||||
Other assets | 26,876 | (6.7 | ) | 28,809 | 49,295 | |||||||||||
Total assets | 697,626 | 3.1 | 676,689 | 689,850 | ||||||||||||
Financial liabilities held for trading | 91,358 | 13.1 | 80,774 | 83,667 | ||||||||||||
Other financial liabilities designated at fair value through profit or loss | 8,922 | 27.6 | 6,993 | 6,221 | ||||||||||||
Financial liabilities at amortized cost | 513,937 | 0.9 | 509,185 | 503,073 | ||||||||||||
Deposits from central banks and credit institutions | 61,457 | 3.7 | 59,259 | 62,041 | ||||||||||||
Deposits from customers | 375,104 | (0.2 | ) | 375,970 | 367,312 | |||||||||||
Debt certificates | 62,685 | 2.6 | 61,112 | 62,349 | ||||||||||||
Other financial liabilities | 14,692 | 14.4 | 12,844 | 11,370 | ||||||||||||
Liabilities under insurance and reinsurance contracts | 10,634 | 8.1 | 9,834 | 9,500 | ||||||||||||
Other liabilities | 18,085 | 6.2 | 17,029 | 35,112 | ||||||||||||
Total liabilities | 642,936 | 3.1 | 623,814 | 637,573 | ||||||||||||
Non-controlling interests | 5,839 | 1.3 | 5,764 | 6,400 | ||||||||||||
Accumulated other comprehensive income | (6,923 | ) | (4.1 | ) | (7,215 | ) | (6,612 | ) | ||||||||
Shareholders’ funds | 55,774 | 2.7 | 54,326 | 52,490 | ||||||||||||
Total equity | 54,690 | 3.4 | 52,874 | 52,278 | ||||||||||||
Total liabilities and equity | 697,626 | 3.1 | 676,689 | 689,850 | ||||||||||||
Memorandum item: | ||||||||||||||||
Guarantees given | 45,650 | 1.0 | 45,831 | 45,207 | ||||||||||||
General note: the application of accounting for hyperinflation in Argentina was performed for the first time in September 2018 with accounting effects on January 1, 2018, recording the impact of the nine months in the third quarter. In order to make the 2019 information comparable to the 2018, the balance sheet of the first three quarters of 2018 has been reexpressed to reflect the impacts of inflation on its assets and liabilities.
Table of Contents
| 13 |
LOANS AND ADVANCES TO CUSTOMERS
(MILLIONS OF EUROS)
| 30-06-19 | D % | 31-12-18 | 30-06-18 | |||||||||||||
Public sector | 29,062 | 2.0 | 28,504 | 28,716 | ||||||||||||
Individuals | 173,191 | 1.6 | 170,501 | 171,481 | ||||||||||||
Mortgages | 110,908 | (0.6 | ) | 111,528 | 113,184 | |||||||||||
Consumer | 36,413 | 4.2 | 34,939 | 34,317 | ||||||||||||
Credit cards | 13,928 | 3.1 | 13,507 | 13,105 | ||||||||||||
Other loans | 11,942 | 13.4 | 10,527 | 10,875 | ||||||||||||
Business | 171,053 | 0.1 | 170,872 | 171,836 | ||||||||||||
Non-performing loans | 15,999 | (2.1 | ) | 16,348 | 18,627 | |||||||||||
Loans and advances to customers (gross) | 389,306 | 0.8 | 386,225 | 390,661 | ||||||||||||
Loan-loss provisions | (12,151 | ) | (0.4 | ) | (12,199 | ) | (13,486 | ) | ||||||||
Loans and advances to customers | 377,155 | 0.8 | 374,027 | 377,175 | ||||||||||||
CUSTOMER FUNDS
(MILLIONS OF EUROS)
| 30-06-19 | D % | 31-12-18 | 30-06-18 | |||||||||||||
Deposits from customers | 375,104 | (0.2 | ) | 375,970 | 367,312 | |||||||||||
Current accounts | 269,010 | 3.2 | 260,573 | 249,579 | ||||||||||||
Time deposits | 99,693 | (8.0 | ) | 108,313 | 110,548 | |||||||||||
Other deposits | 6,401 | (9.6 | ) | 7,084 | 7,185 | |||||||||||
Other customer funds | 103,804 | 5.8 | 98,150 | 101,498 | ||||||||||||
Mutual funds and investment companies | 65,681 | 7.0 | 61,393 | 64,686 | ||||||||||||
Pension funds | 34,960 | 3.4 | 33,807 | 33,890 | ||||||||||||
Otheroff-balance sheet funds | 3,162 | 7.2 | 2,949 | 2,922 | ||||||||||||
Total customer funds | 478,907 | 1.0 | 474,120 | 468,811 | ||||||||||||
Table of Contents
| 14 |
Capital base
BBVA’sfully loadedCET1 ratio stood at 11.5% as of the end of June 2019, increasing by 17 basis points in the first half of the year, supported by recurring organic capital generation and strong market performance.
Risk-weighted assets (RWAs) increased by more than €11,700m in the first half of the year, as a result of activity growth mainly in emerging markets, the incorporation of regulatory impacts of (IFRS 16 implementation and TRIM - Targeted Review of Internal Models) worth approximately €7,300m(-24 basis points in the CET1 ratio), and a decrease of approximately €1,500m in RWAs (+5 basis points in the CET1 ratio) due to the recognition by the European Commission of Argentina as an equivalent country for the purposes of supervisory and regulatory requirements1.
CAPITAL BASE
(MILLIONS OF EUROS)
| CRD IVphased-in | CRD IV fully-loaded | |||||||||||||||||||||||
| 30-06-19 (1) (2) | 31-12-18 | 30-06-18 | 30-06-19 (1) (2) | 31-12-18 | 30-06-18 | |||||||||||||||||||
Common Equity Tier 1 (CET 1) | 42,328 | 40,313 | 39,550 | 41,519 | 39,571 | 38,746 | ||||||||||||||||||
Tier 1 | 48,997 | 45,947 | 45,717 | 48,047 | 45,047 | 44,685 | ||||||||||||||||||
Tier 2 | 7,944 | 8,756 | 9,241 | 7,514 | 8,861 | 9,263 | ||||||||||||||||||
Total Capital (Tier 1 + Tier 2) | 56,941 | 54,703 | 54,958 | 55,561 | 53,907 | 53,947 | ||||||||||||||||||
Risk-weighted assets | 360,069 | 348,264 | 356,887 | 360,563 | 348,804 | 357,107 | ||||||||||||||||||
CET1 (%) | 11.8 | 11.6 | 11.1 | 11.5 | 11.3 | 10.8 | ||||||||||||||||||
Tier 1 (%) | 13.6 | 13.2 | 12.8 | 13.3 | 12.9 | 12.5 | ||||||||||||||||||
Tier 2 (%) | 2.2 | 2.5 | 2.6 | 2.1 | 2.5 | 2.6 | ||||||||||||||||||
Total capital ratio (%) | 15.8 | 15.7 | 15.4 | 15.4 | 15.5 | 15.1 | ||||||||||||||||||
| (1) | As of June 30, 2019, the difference between thephased-in and fully-loaded ratios arises from the temporary treatment of certain capital items, mainly of the impact of IFRS9, to which the BBVA Group has adhered voluntarily (in accordance with article 473bis of the CRR). |
| (2) | Provisional data. |
In terms of capitalissuances, BBVA S.A. conducted two public capital issuances: the issuance of preferred securities that may be converted into ordinary BBVA shares (CoCos), registered with the Spanish Securities Market Commission (CNMV) for an amount of €1,000m, at an annual coupon of 6.0% and with an amortization option after five years of being issued; ; and an issuance of Tier 2 subordinated debt for an amount of €750m,
with a 10-year maturity and an amortization option in the fifth year and a coupon of 2.575%2. In the first half of 2019, the Group continued its funding program to meet theMREL(minimum requirement for own funds and eligible liabilities) requirement published in May 2018, by closing two public issuances of seniornon-preferreddebt for a total amount of €2,000m, one of them of €1,000m in the form of a green bond.
| 1 | On April 1, 2019, the Official Journal of the European Union published Commission Implementing Decision (EU) 2019/536, which includes Argentina within the list of third countries and territories whose supervisory and regulatory requirements are considered equivalent for the purposes of the treatment of exposures in accordance with Regulation (EU) No 575/2013. |
| 2 | Royal Decree 309/2019, of April 26, which partially implements Law 5/2019, of March 15, regulating real estate loan agreements and adopting other financial measures, excludes in Spain the obligation for prior approval of the supervisor for additional tier 1 capital and tier 2 capital instruments. |
Table of Contents
| 15 |
Additionally, the early amortization options on three issuances were exercised: one of CoCos, for €1,500m with a 7% coupon issued in February 2014; another issuance of Tier 2 subordinated debt, for €1,500m with a coupon of 3.5% issued in April 2014 and amortized in April 2019; and another Tier 2 security issued in June 2009 by Caixa d’Estalvis de Sabadell with an outstanding nominal amount of €4,878,000, amortized in June 2019.
Regardingshareholder remuneration, on April 10, 2019, BBVA paid a supplementary gross cash dividend for the financial year 2018 of €0.16 per share, in line with the Group’s dividend policy of maintaining apay-out ratio of35-40% of recurring profit. This supplementary dividend does not have any impact on the Group’s solvency ratio during the first half of the year, as it was already incorporated on December 2018.
Thephased-in CET1ratio stood at 11.8% as of June 30, 2019, taking into account the effect of IFRS 9.Tier 1 stood at
13.6% and Tier 2 at 2.2%, resulting in atotal capital ratio of 15.8%.
These levels are above the requirements established by the supervisor in its SREP letter (Supervisory Review and Evaluation Process), applicable in 2019. Since March 1, 2019, at the consolidated level, this requirement has been established at 9.26% for the CET1 ratio and 12.76% for the total capital ratio. Its variation compared to 2018 is explained by the end of the transitional period for the implementation of the capital conservation buffer and the capital buffer applicable to Other Systemically Important Institutions, as well as the progression of the countercyclical capital buffer. For its part, the CET1 Pillar 2 requirement (P2R) remains unchanged at 1.5%.
Finally, the Group’s maintained a solidleverageratio of 6.6% fully-loaded (6.7%phased-in), the highest among its peergroup.
Ratings
During the first six months of the year, Moody’s, S&P, DBRS and Scope confirmed BBVA’s senior preferred debt (A3,A-, A (high) and A+, respectively) rating. Fitch increasedthis ratingby a notch in July 2019, considering that BBVA’s loss-absorbing capital buffers (such as seniornon-preferred debt) are sufficient to materially reduce the risk of default. In these actions, the agencies highlighted the Group’s diversification and self-sufficient franchise model, with subsidiaries responsible for managing their own liquidity. These ratings, together with their outlook, are detailed in the table below:
RATINGS
Rating agency | Long term (1) | Short term | Outlook | |||||||||
| DBRS | A (high) | R-1 (middle) | Stable | |||||||||
| Fitch | A | F-1 | Negative | |||||||||
| Moody’s | A3 | P-2 | Stable | |||||||||
| Scope Ratings | A+ | S-1+ | Stable | |||||||||
| Standard & Poor’s | A- | A-2 | Negative | |||||||||
| (1) | Ratings assigned to long term senior preferred debt. Additionally, Moody’s and Fitch assign A2 and A rating respectively, to BBVA’s long term deposits. |
Table of Contents
| 16 |
Credit risk
During thefirst half of 2019, BBVA Group’s risk metrics performed well:
| • | Credit risk increased slightly by 0.3% in the first half of the year, both at current and constant exchange rates, rising in all areas except the United States and Turkey, and remaining stable in Spain. |
| • | Balance ofnon-performing loans registered a 2.2% decrease in the first six months of 2019 (down 2.3% in constant terms) and a 15.0% decreaseyear-on-year, primarily due to the sale ofnon-performing loan portfolios in Spain. |
| • | The NPL ratiostood at 3.8% as of June 30, 2019, a decrease of 10 basis points compared to the end of December 2018. |
| • | Loan-loss provisions remained stable in the first half of the year (up 0.6% at constant exchange rates). |
| • | TheNPL coverage ratio stood at 75% at the end of June, an improvement of 152 basis points in the first six months of 2019 and 55 basis points higher than at the end of March 2019. |
| • | The accumulatedcost of risk as of June 2019 was 0.91%, 10 basis points lower than at the end of 2018. |
CREDIT RISK(1)
(MILLIONS OF EUROS)
| 30-06-19 | 31-03-19 | 31-12-18 | 30-09-18 | 30-06-18 (2) | ||||||||||||||||
Credit risk | 434,955 | 439,152 | 433,799 | 428,318 | 451,587 | |||||||||||||||
Non-performing loans | 16,706 | 17,297 | 17,087 | 17,693 | 19,654 | |||||||||||||||
Provisions | 12,468 | 12,814 | 12,493 | 12,890 | 13,954 | |||||||||||||||
NPL ratio (%) | 3.8 | 3.9 | 3.9 | 4.1 | 4.4 | |||||||||||||||
NPL coverage ratio (%) | 75 | 74 | 73 | 73 | 71 | |||||||||||||||
| (1) | Include gross loans and advances to customers plus guarantees given. |
| (2) | Figures without considering the classification ofnon-current assets held for sale. |
NON-PERFORMING LOANS EVOLUTION
(MILLIONS OF EUROS)
| 2Q19(1) | 1Q19 | 4Q18 | 3Q18 | 2Q18(2) | ||||||||||||||||
Beginning balance | 17,297 | 17,087 | 17,693 | 19,654 | 19,516 | |||||||||||||||
Entries | 2,461 | 2,353 | 3,019 | 2,168 | 2,596 | |||||||||||||||
Recoveries | (1,531 | ) | (1,409 | ) | (1,560 | ) | (1,946 | ) | (1,655 | ) | ||||||||||
Net variation | 930 | 944 | 1,459 | 222 | 942 | |||||||||||||||
Write-offs | (958 | ) | (775 | ) | (1,693 | ) | (1,606 | ) | (863 | ) | ||||||||||
Exchange rate differences and other | (564 | ) | 41 | (372 | ) | (576 | ) | 59 | ||||||||||||
Period-end balance | 16,706 | 17,297 | 17,087 | 17,693 | 19,654 | |||||||||||||||
Memorandum item: | ||||||||||||||||||||
Non-performing loans | 15,999 | 16,559 | 16,348 | 17,045 | 18,627 | |||||||||||||||
Non performing guarantees given | 707 | 738 | 739 | 649 | 1,027 | |||||||||||||||
| (1) | Preliminary data. |
| (2) | Figures without considering the classification ofnon-current assets held for sale. |
Table of Contents
| 17 |
Structural risks
Liquidity and funding
Management ofliquidity and funding at BBVA aims to finance the recurring growth of the banking business at suitable maturities and costs, using a wide range of instruments that provide access to a large number of alternative sources of financing, always in compliance with current regulatory requirements.
Due to its subsidiary-based management model, BBVA is one of the few major European banks that follows the Multiple Point of Entry (MPE) resolutionstrategy: the parent company sets the liquidity and risk policies, but the subsidiaries are self-sufficient and responsible for managing their own liquidity (taking deposits or accessing the market with their own rating), without fund transfers or financing occurring between either the parent company and the subsidiaries, or between different subsidiaries. This strategy limits the spread of a liquidity crisis among the Group’s different areas, and ensures that the cost of liquidity and financing is correctly reflected in the price formation process.
The financial soundness of the BBVA Group’s banks continues to be based on the funding of lending activity, fundamentally through the use of stable customer funds. During the first half of 2019,liquidityconditions remained comfortable across all countries in which the BBVA Group operates:
| • | In the eurozone, the liquidity situation remains comfortable, with a slight increase in the credit gap over the first six months of the year. |
| • | In the United States, the liquidity situation is solid. In the first half of this year, there has been a decrease in the credit gap due primarily to the increase in deposits as a result of deposit-taking campaigns, and a slowdown in lending activity. |
| • | In Mexico, the liquidity position is stable The credit gap increased slightly in the first half of the year, affected by the seasonal outflow of deposits, while the loan portfolio remained virtually flat. |
| • | In Turkey, positive liquidity situation, with an adequate buffer against a possible liquidity stress scenario. The credit gap improved in the first half of 2019, both in terms of the balance sheet in foreign currency, due to a greater contraction of loans than deposits, and in local currency, due to higher growth in deposits than loans. |
| • | In South America, the liquidity situation remains comfortable throughout the region. In Argentina, the liquidity situation improved due to moderate growth in lending activity and the increase in deposits. |
The BBVA Group’sliquidity coverage ratio (LCR) remained comfortably above 100% during the first half of 2019, and stood at 132% as of June 30, 2019. It comfortably exceeded 100% in all subsidiaries (eurozone 155%, Mexico 147%, the United States 144% and Turkey 187%). For the calculation of the ratio, it is assumed that there is no transfer of liquidity among subsidiaries; i.e. no kind of excess liquidity levels in foreign subsidiaries are considered in the calculation of the consolidated ratio. When considering these excess liquidity levels, the BBVA Group’s LCR would stand at 163% (31 percentage points above 132%).
TheNet Stable Funding Ratio (NSFR), defined as the ratio between the amount of stable funding available and the amount of stable funding required, is one of the Basel Committee’s essential reforms, and requires banks to maintain a stable funding profile in relation to the composition of their assets andoff-balance-sheet activities. This ratio should be at least 100% at all times. BBVA Group’s, NSFR ratio, calculated according to Basel requirements, remained above 100% throughout the first half of 2019 and stood at 121% as of June 30, 2019. It comfortably exceeded 100% in all subsidiaries (eurozone 116%, Mexico 131%, United States 111% and Turkey 151%).
The wholesalefinancing markets in which the Group operates remained stable.
The maintransactions carried out by entities of the BBVA Group in the first half of 2019 were:
| • | BBVA, S.A. carried out two issuances of seniornon-preferred debt: the first for€1,000m with a fixed-rate annual coupon of 1.125% and a maturity period of five years; the second, a green bond (following the first green bond issuance in May 2018), also for €1,000m, with an annual coupon of 1% and a maturity period of seven years. |
| • | Regarding capital issuances, BBVA, S.A. carried out two public issuances: an issuance of preferred securities that may be converted into ordinary BBVA shares (CoCos), registered in the Spanish Securities Market Commission (CNMV) for €1,000m with an annual coupon of 6.0% and amortization option from the fifth year; and a Tier 2 subordinated debt issuance for €750m, with a maturity period of 10 years, an amortization option in the fifth year, and a coupon of 2.575%. |
| • | Additionally, in the first half of 2019, the early amortization option for the issuance of CoCos for €1,500m with a coupon of 7%, issued in February 2014, was exercised; and a Tier 2 subordinated debt issuance for €1,500m with a coupon of 3.5%, issued in April 2014, was amortized. In June 2019, BBVA, S.A., as the successor to Unnim Banc, S.A.U., exercised the early amortization of the issuance of subordinated bonds, originally issued by Caixa d’Estalvis de Sabadell, for an outstanding nominal amount of €4,878,000. |
Table of Contents
| 18 |
| • | In Mexico, €458m of senior debt was issued on the local market in two tranches: €229m with a maturity period of three years at the Interbank Equilibrium Interest Rate (TIIE) +28 basis points, and €229m with a maturity period of eight years at the Mbono rate +80 basis points, obtaining the lowest cost of funding in history in the local market in both maturities. |
| • | In Turkey, Garanti BBVA issued a Diversified Payment Rights (DPR) securitization for US$150m with a maturity period of five years. It also renewed syndicated loans for US$784m. |
| • | In South America, BBVA Argentina issued negotiable instruments on the local market for an amount equivalent to €33m, while BBVA Peru issued three-year senior bonds for an amount equivalent to €32m in the first week of July. Meanwhile, Forum in Chile issued a bond on the local market for an amount equivalent to €108m. |
Foreign exchange
Foreign exchangerisk management of BBVA’s long-term investments, principally stemming from its overseas franchises, aims to preserve the Group’s capital adequacy ratios and ensure the stability of its income statement.
In the first half of2019, the Turkish lira (down 7.7%) and the Argentine peso (down 11.2%) depreciated against the euro, while the Mexican peso (up 3.1%) and the US dollar (up 0.6%) appreciated compared to rates at the end of 2018. BBVA has maintained its policy of actively hedging its main investments in emerging markets, covering on average between 30% and 50% of annual earnings and around 70% of the CET1 capital ratio excess. Based on this policy, the sensitivity of the CET1 ratio to a depreciation of 10% against the euro of the main emerging-market currencies stood at-3 basis points for the Mexican peso and-2 basis points for the Turkish lira. In the case of the US dollar, the sensitivity to a depreciation of 10% against the euro is approximately +11 basis points, as a result of RWAs denominated in US dollars outside the United States. The coverage level for expected earnings for 2019 is currently 75% for Mexico and Turkey.
Interest rate
The aim of managinginterest rate risk is to maintain sustained growth of net interest income in the short- and medium-term, irrespective of interest rate fluctuations, while controlling the impact on capital through the valuation of the portfolio of financial assets at fair value through profit or loss.
Regarding themonetary policies pursued by central banks in the main countries where BBVA operates, in the first half of 2019 it should be noted that:
| • | In the eurozone, interest rates remain at 0% and the deposit facility rate at down 0.40%. The ECB left the door open to new monetary stimuli in the face of the possible negative impacts on the eurozone’s economy from the global slowdown and geopolitical uncertainty. This led to a downward movement in forecasts of future interest rates. In addition, at its June meeting, it announced details of the new round of liquidity injections(TLTRO-III) that will begin in September. |
| • | In the United States, the FED maintained interest rates at 2.5%. However, it paved the way for possible rate reductions given the increased risks of lower activity, primarily due to the weakness of the global economy and the absence of inflationary pressures. In fact, the market is currently discounting at least two rate reductions in 2019, pushing forecasts for future rates downward. |
| • | In Mexico, Banxico maintained the monetary policy rate at 8.25%, showing a restrictive tone until the June meeting, when one of the governing board members voted in favor of a rate reduction. |
| • | In Turkey, the Central Bank of the Republic of Turkey (CBRT) maintained rates at 24.00% during the first half of 2019. Meanwhile, at the market level, there was an increase in volatility prior to the final local elections held on March 31 which led the CBRT to intervene, raising the cost of financing to stabilize the Turkish lira, with no impact on the balance sheet structure. Subsequently, tension with the United States led to this volatility continuing throughout the second quarter. In this context, management of the customer spread was very positive, thanks to efforts to reduce the cost of funds, which enabled strong performance in net interest income in the first half of 2019, despite a lower contribution from inflation-linked bonds compared to previous quarters. |
| • | In South America, monetary authorities in Colombia and Peru maintained their respective benchmark rates during the first half of the year, with these rates expected to remain unchanged during the second half of 2019. In Argentina, interest rates showed somepre-election volatility in response to the improved inflation outlook, closing at 62.7% at the end of June. |
The Group’s banks maintain fixed-income portfolios to manage their balance sheet structure. During the first half of 2019, the results of this management were satisfactory, with limited risk strategies maintained in all the Group’s banks.
Table of Contents
| 19 |
Economic capital
Economic risk capital (ERC) consumption reached €28,829m at the end of May 2019 in consolidated terms, equivalent to an increase of 0.4% compared to the end of February 2019 (up
2.1% at constant exchange rates). This increase was primarily due to credit risk, in line with higher exposure in the different portfolios and geographic areas.
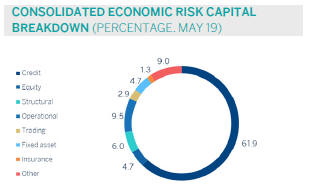
Table of Contents
| 20 |
The mainstock marketindexes performed strongly during the first half of 2019. In Europe, increases in the first quarter of the year were expanded on, with the Stoxx 50 and Euro Stoxx 50 rising 15.2% and 15.7%, respectively. In Spain, the rise of the Ibex 35 during the same period was more moderate at 7.7%, with a decline in the second quarter partially offsetting the increase during the first three months of the year. In the United States, the S&P 500 Index rose 17.3% in the first half of the year, maintaining in the second quarter the positive trend initiated in the first quarter.
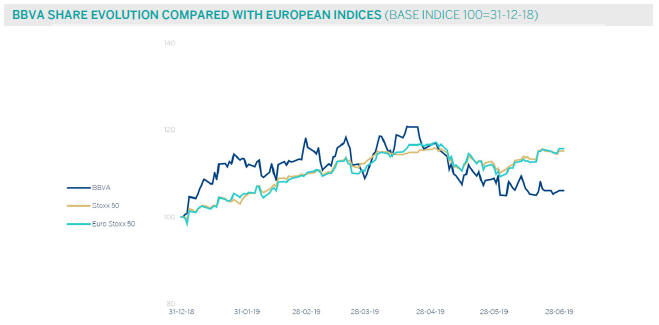
The performance of Europeanbanking sector indexes remained positive during the first half of 2019, although to a lesser extent than general market indexes, having been hindered by declines during the second quarter of the year. The Stoxx Europe 600 Banks index, which includes banks in the United Kingdom, rose 0.9% during the first half of 2019, and the Euro Stoxx Banks index for the eurozone rose 1.3%, while in the United States, the S&P Regional Banks Select Industry Index built on gains made during the first quarter, rising by 14.4% compared to the close of the 2018 financial year.
For its part, theBBVA share outperformed the European banking sector during the first half of the year, with the share price increasing by 6.1% and closing June 2019 at €4.92.
THE BBVA SHARE AND SHARE PERFORMANCE RATIOS
| 30-06-19 | 31-12-18 | |||||||
Number of shareholders | 888,559 | 902,708 | ||||||
Number of shares issued | 6,667,886,580 | 6,667,886,580 | ||||||
Daily average number of shares traded | 31,586,100 | 35,909,997 | ||||||
Daily average trading (millions of euros) | 164 | 213 | ||||||
Maximum price (euros) | 5.68 | 7.73 | ||||||
Minimum price (euros) | 4.51 | 4.48 | ||||||
Closing price (euros) | 4.92 | 4.64 | ||||||
Book value per share (euros) | 7.34 | 7.12 | ||||||
Tangible book value per share (euros) | 6.10 | 5.86 | ||||||
Market capitalization (millions of euros) | 32,786 | 30,909 | ||||||
Yield (dividend/price; %)(1) | 5.3 | 5.4 | ||||||
| (1) | Calculated by dividing shareholder remuneration over the last twelve months by the closing price of the period. |
Regardingshareholder remunerationin 2019,in line with the policy announced in the Relevant Event released on
February 1, 2017, BBVA plans to distribute between 35% and 40% of annual earnings in dividends. This shareholder
remuneration policy, will consist of two cash payments that are expected to be made in October of this year and in April
2020, all subject to the appropriate approvals by the relevant governing bodies.
Table of Contents
| 21 |
As of June 30, 2019, the number of BBVAshares remained at 6.668 billion, held by 888,559shareholders, of which
43.55% are Spanish residents and the remaining 56.45% arenon-residents.
SHAREHOLDER STRUCTURE
(30-06-19)
| Shareholders | Shares | |||||||||||||||
Number of shares | Number | % | Number | % | ||||||||||||
Up to 150 | 176,075 | 19.8 | 12,448,419 | 0.2 | ||||||||||||
151 to 450 | 176,014 | 19.8 | 48,275,584 | 0.7 | ||||||||||||
451 to 1800 | 278,981 | 31.4 | 273,197,704 | 4.1 | ||||||||||||
1,801 to 4,500 | 135,493 | 15.2 | 386,002,666 | 5.8 | ||||||||||||
4,501 to 9,000 | 62,927 | 7.1 | 396,491,180 | 5.9 | ||||||||||||
9,001 to 45,000 | 52,631 | 5.9 | 912,487,236 | 13.7 | ||||||||||||
More than 45,001 | 6,438 | 0.7 | 4,638,983,791 | 69.6 | ||||||||||||
|
|
|
|
|
|
|
| |||||||||
Total | 888,559 | 100.0 | 6,667,886,580 | 100.0 | ||||||||||||
|
|
|
|
|
|
|
| |||||||||
BBVAshares are included on the main stock market indexes, including the Ibex 35, Euro Stoxx 50 and Stoxx 50, with a weighting of 6.9%, 1.3% and 0.9%, respectively, as of the close of June 2019. They also form part of several sector indexes, including the Euro Stoxx Banks index, with a weighting of 8.7%, and the Stoxx Europe 600 Banks index, with a weighting of 4.0%.
Finally, BBVA maintains a significant presence on a number of internationalsustainability indexes or Environmental, Social and Governance (ESG) indexes, which evaluate companies’ performance in these areas. This presence is summarized in the following table:
Table of Contents
| 22 |
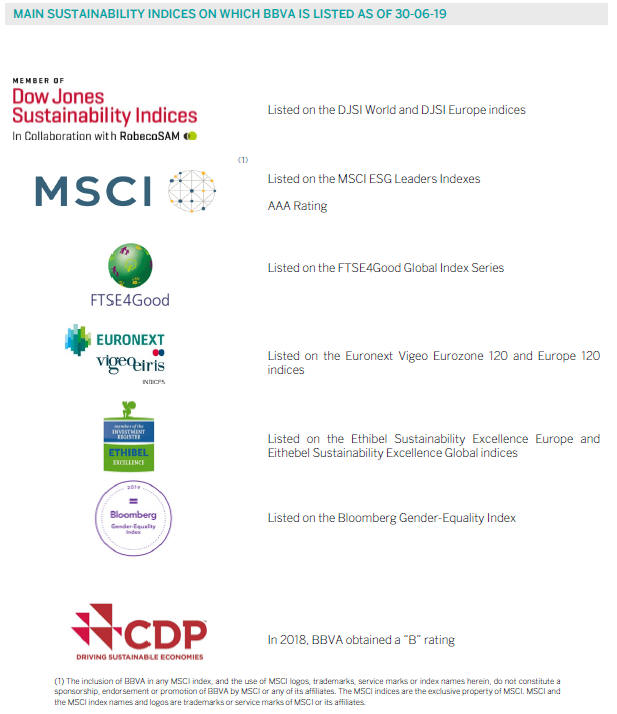
Table of Contents
| 23 |
At BBVA we have adifferential bankingmodel that we refer to as responsible banking, based on seeking out the profitability adjusted to principles, strict legal compliance, best practices and the creation of long-term value for all stakeholders. The fourpillars of BBVA’s responsible banking model are as follows:
| • | Balanced relationships with its customers, based on transparency, clarity and responsibility. |
| • | Sustainable finance to combat climate change, respect human rights and achieve the United Nations Sustainable Development Goals (SDGs). |
| • | Responsible practices with employees, suppliers and other stakeholders. |
| • | Community investment to promote social change and create opportunities for all. |
In 2018, BBVA announced its2025 Pledge. This sets out the Bank’s strategy for climate change and sustainable development, working toward meeting the United Nations Sustainable Development Goals (SDGs) and the Paris Agreement on climate change. The pledge is an eight-year commitment based on three lines of action:
| • | To finance: BBVA is pledging to mobilize €100 billion in green and social financing, sustainable infrastructure and agribusiness, social entrepreneurship and financial inclusion. |
| • | To manage the environmental and social risks associated with the Group’s activity in order to minimize its potential direct and indirect negative impacts. BBVA pledges that 70% of energy used by the Group will be renewable by 2025, reaching 100% by 2030, and to reduce direct CO2 emissions by 68% with respect to 2015. |
| • | To engage all stakeholders to collectively promote the financial sector’s contribution to sustainable development. |
The figure forsustainable financemobilized in the first half of 2019 amounts to €10,000m (up 50%year-on-year) which, added to €11,815m of 2018, represents a cumulative amount of approximately €22,000m mobilized since the launch of the Pledge.
In the second quarter of 2019, BBVA published the first monitoring report on its first green bond as part of its commitment to issue sustainable bonds. With this issuance, as noted in the report, BBVA contributed to reducing the carbon footprint by 274,609 tons of CO2 in 2018 from the date of issue in May of that year, and by another 106,529 tons estimated in
2019, and s generated 558 gigawatt/hour of renewable energy. The Bank allocated €1,000m obtained from wholesale markets to finance renewable energy and sustainable transportation projects. In addition, BBVA issued its second green bond in June, also on a seniornon-preferred bond, with a maturity of seven years and an amount of €1,000m. The operation was very well received by investors.
In the retail business BBVA launched in Spain a new green line of loan worth €20m for all customers wishing to purchase electric or hybrid cars. This new product seeks to respond to growing demand from society, which is increasingly aware of the fight against climate change.
As part of its objective to engage its stakeholders, BBVA continues to participate in different initiatives within sector associations such as the Spanish Banking Association (Asociación Española de Banca, AEB) and the European Banking Federation (EBF), where the Bank chairs the sustainable finance group as well as in working groups related to this issue, also collaborating in consultations on taxonomy, regulation, disclosure and other objectives of the European Commission Sustainable Finance Action Plan.
Within the framework ofcommunity investment, education for society has an important weight. Thus, BBVA in Mexico decided to double the contribution it makes to the Foundation from 2019, allocating more than MXN 1,000m (€46m at the average exchange rate of the first half of the year) which, added to the voluntary contributions of the community, will have more than MXN1,500m per year, significantly increasing the number of education grants awarded.
For its part, theLearning Togethereducational project, BBVA aims to lead and promote conversation about education in the 21st century, bearing in mind that education is the great opportunity to improve people’s lives. The project, which was born in January 2018 with a transforming vocation and which aims to create opportunities in more than 3 million homes and its educational community,is being followed by more than one million people in social networks (Facebook, Twitter, Instagram and YouTube), with about 400 million views of its inspiring content, and with more than 24,700 teachers and parents being trained in the online courses it offers. .
In addition,, in June 2019, theBBVA Foundation held a ceremony in Bilbao to award the Frontiers of Knowledge prizes , worth 400,000 euros in each of its eight categories. In this eleventh edition of the awards, focused on achieving a greater commitment to sustainability of the planet, twelve new researchers were added to recognize contributions on subjects ranging from sea level rise to discovery of the microbiome.
Table of Contents
| 24 |
Finally, BBVA developsentrepreneurshipprograms and initiatives that benefited 2.2 million people in 2018. These programs especially target entrepreneurs who are in vulnerable circumstances and those whose projects will have a positive impact on society or the environment. With them, BBVA seeks to foster social change and create opportunities for all. Among the global initiatives related to entrepreneurship, the following stand out:
| • | TheBBVA Microfinance Foundation, the private philanthropic initiative with the greatest social impact in Latin America, supports vulnerable entrepreneurs through productive finance. It has two lines of action: establish a group of sustainable and innovative microfinance institutions, and to promote the transformation of the financial sector. Since its launch in 2007, the BBVA Microfinance Foundation has invested $11,775m in productive loans that have benefited 2 million people across 5 countries, with special focus on women. |
| • | BBVA Momentum is a global program that includes training, strategic accompaniment, financing, collaboration, networking and visibility for social entrepreneurs who are changing the world through their companies. Since its launch in 2011, more than 500 entrepreneurs from Colombia, Spain, the United States, Mexico, Peru and Turkey have participated. |
| • | BBVA Open Talent is a fintech startups competition that aims to promote innovative technological solutions and make emerging projects visible with the capacity to transform the financial sector. Since 2008, this contest has handed out €1.8m in prizes to 600 startups in over 80 countries, with more than 700 professionals involved. |
| • | BBVA Blue Challenge is a program aimed at helping young university students to channel all their energy into development of projects with which they can change the world by offering entrepreneurship training program that stands out for the high level of its participants. Since its inception in 2016, more than 5,000 young people from 23 countries have completed the program. |
Table of Contents
| 25 |
This section presents and analyzes the most relevant aspects of the Group’s different business areas. Specifically, for each one of them, it shows a summary of the income statement and balance sheet, the business activity figures and the most significant ratios.
In 2019, BBVA Group’s business areasreporting structure of the BBVA Group’s business areas differs from the one presented at the end of 2018, as a result of the integration of theNon-Core Real Estate business area into Banking Activity in Spain, now reported as “Spain”. In order to make the 2019 information comparable to 2018, the figures for both areas have been reexpressed.
In the second quarter of the year, the Group carried out the unification of the BBVA brand in the countries in which it operates, discontinuing the local brand names in Argentina (Francés), the United States (Compass), Mexico (Bancomer), and Peru (Continental). The franchise in Turkey has been renamed Garanti BBVA.
BBVA Group’s business areas are summarized below:
| • | Spain mainly includes the banking and insurance businesses that the Group carries out in this country. |
| • | The United States includes the financial business activity that BBVA carries out in the country and the activity of the BBVA, S.A branch in New York. |
| • | Mexico includes banking and insurance businesses in this country as well as the activity that BBVA Mexico carries out through its branch in Houston. |
| • | Turkey reports the activity of BBVA Garanti group that is mainly carried out in this country and, to a lesser extent, in Romania and the Netherlands. |
| • | South America basically includes banking and insurance businesses in the region. |
| • | Rest of Eurasia includes the banking business activity carried out in Asia and in Europe, excluding Spain. |
The Corporate Center exercises centralized Group functions, including: the costs of the head offices with a corporate function; management of structural exchange rate positions; some equity instruments issuances to ensure an adequate management of the Group’s global solvency. It also includes portfolios whose management is not linked to customer relationships, such as industrial holdings; certain tax assets and liabilities; funds due to commitments to employees; goodwill and other intangible assets.
In addition to these geographical breakdowns, supplementary information is provided for thewholesale business carried out by BBVA, i.e. Corporate & Investment Banking (CIB), in the countries where it operates. This business is relevant to have a broader understanding of the Group’s activity and results due to the important features of the type of customers served, products offered and risks assumed.
Theinformation by business area is based on units at the lowest level and/or companies that comprise the Group, which are assigned to the different areas according to the main region or company group in which they carry out their activity.
As usual, in the case of the different business areas in America and Turkey and in CIB, the results of applying constantexchange rates are given as well as theyear-on-year variations at current exchange rates.
Table of Contents
| 26 |
MAJOR INCOME STATEMENT ITEMS BY BUSINESS AREA
(MILLIONS OF EUROS)
| Business areas | ||||||||||||||||||||||||||||||||||||
| BBVA Group | Spain | The United States | Mexico | Turkey | South America | Rest of Eurasia | S Business areas | Corporate Center | ||||||||||||||||||||||||||||
1H19 | ||||||||||||||||||||||||||||||||||||
Net interest income | 8,987 | 1,808 | 1,217 | 3,042 | 1,353 | 1,613 | 84 | 9,118 | (132 | ) | ||||||||||||||||||||||||||
Gross income | 11,989 | 2,818 | 1,615 | 3,901 | 1,677 | 1,994 | 220 | 12,225 | (236 | ) | ||||||||||||||||||||||||||
Operating income | 6,115 | 1,190 | 655 | 2,611 | 1,084 | 1,215 | 78 | 6,833 | (718 | ) | ||||||||||||||||||||||||||
Profit/(loss) before tax | 4,052 | 1,027 | 363 | 1,783 | 726 | 847 | 69 | 4,814 | (762 | ) | ||||||||||||||||||||||||||
Net attributable profit | 2,442 | 734 | 297 | 1,287 | 282 | 404 | 55 | 3,058 | (616 | ) | ||||||||||||||||||||||||||
1H18(1)(2) | ||||||||||||||||||||||||||||||||||||
Net interest income | 8,590 | 1,852 | 1,082 | 2,648 | 1,510 | 1,553 | 83 | 8,727 | (137 | ) | ||||||||||||||||||||||||||
Gross income | 11,863 | 3,023 | 1,437 | 3,465 | 1,924 | 1,987 | 217 | 12,052 | (188 | ) | ||||||||||||||||||||||||||
Operating income | 5,967 | 1,336 | 544 | 2,309 | 1,245 | 1,078 | 77 | 6,588 | (621 | ) | ||||||||||||||||||||||||||
Profit/(loss) before tax | 4,286 | 1,056 | 493 | 1,654 | 964 | 724 | 93 | 4,984 | (698 | ) | ||||||||||||||||||||||||||
Net attributable profit | 2,536 | 746 | 385 | 1,200 | 372 | 332 | 60 | 3,094 | (558 | ) | ||||||||||||||||||||||||||
| (1) | The impact derived from the accounting for hyperinflation in Argentina for the first nine months of 2018 was recorded for the first time in the third quarter of the year, with accounting effects on January 1, 2018. In order to make the 2019 information comparable to the 2018, the income statements for the first three quarters of the 2018 fiscal year have been reexpressed to reflect the impacts of inflation on their income and expenses. |
| (2) | The income statements for 2018 were reexpressed due to changes in the reallocation of some expenses related to global projects and activities between the Corporate Center and the business areas incorporated in 2019. |
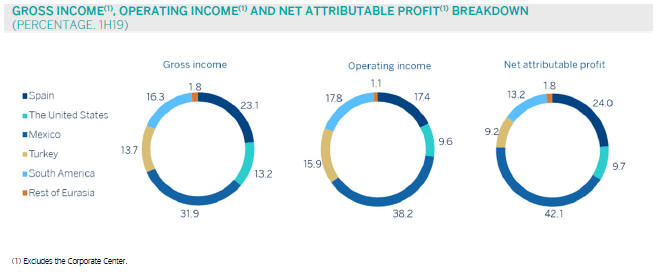
Table of Contents
| 27 |
MAJOR BALANCE-SHEET ITEMS AND RISK-WEIGHTED ASSETS BY BUSINESS AREA
(MILLIONS OF EUROS)
| Business areas | ||||||||||||||||||||||||||||||||||||||||
| BBVA Group | Spain | The United States | Mexico | Turkey | South America | Rest of Eurasia | S Business areas | Corporate Center | Deletions | |||||||||||||||||||||||||||||||
30-06-19 | ||||||||||||||||||||||||||||||||||||||||
Loans and advances to customers | 377,155 | 171,081 | 60,130 | 54,432 | 39,286 | 35,712 | 17,552 | 378,193 | 349 | (1,386 | ) | |||||||||||||||||||||||||||||
Deposits from customers | 375,104 | 180,434 | 63,122 | 52,960 | 39,456 | 36,896 | 4,294 | 377,162 | 302 | (2,361 | ) | |||||||||||||||||||||||||||||
Off-balance sheet funds | 103,804 | 64,370 | — | 23,419 | 2,983 | 12,577 | 454 | 103,804 | — | — | ||||||||||||||||||||||||||||||
Total assets/liabilities and equity | 697,626 | 368,982 | 86,229 | 105,366 | 64,641 | 56,433 | 20,209 | 701,860 | 10,567 | (14,801 | ) | |||||||||||||||||||||||||||||
Risk-weighted assets | 360,069 | 107,486 | 62,383 | 55,919 | 57,551 | 43,995 | 16,405 | 343,739 | 16,331 | — | ||||||||||||||||||||||||||||||
31-12-18(1) | ||||||||||||||||||||||||||||||||||||||||
Loans and advances to customers | 374,027 | 170,438 | 60,808 | 51,101 | 41,478 | 34,469 | 16,598 | 374,893 | 990 | (1,857 | ) | |||||||||||||||||||||||||||||
Deposits from customers | 375,970 | 183,414 | 63,891 | 50,530 | 39,905 | 35,842 | 4,876 | 378,456 | 36 | (2,523 | ) | |||||||||||||||||||||||||||||
Off-balance sheet funds | 98,150 | 62,559 | — | 20,647 | 2,894 | 11,662 | 388 | 98,150 | — | — | ||||||||||||||||||||||||||||||
Total assets/liabilities and equity | 676,689 | 354,901 | 82,057 | 97,432 | 66,250 | 54,373 | 18,834 | 673,848 | 16,281 | (13,440 | ) | |||||||||||||||||||||||||||||
Risk-weighted assets | 348,264 | 104,113 | 64,175 | 53,177 | 56,486 | 42,724 | 15,476 | 336,151 | 12,113 | — | ||||||||||||||||||||||||||||||
| (1) | The impact derived from the accounting for hyperinflation in Argentina for the first nine months of 2018 was recorded for the first time in the third quarter of the year, with accounting effects on January 1, 2018. In order to make the 2019 information comparable to the 2018, the balance sheets of the first three quarters of the 2018 have been reexpressed to reflect the impacts of inflation on their assets and liabilities. |
Since 2019, a column has been included in the balance sheet, which includes thedeletions and balance adjustments between different business areas, especially in terms of the relationship between the areas in which the parent company operates, i.e.
Spain, Rest of Eurasia and Corporate Center. In previous years, these deletions were allocated to the different areas, mainly in Banking Activity in Spain. Accordingly, the figures from the previous year have been reexpressed to show comparable series.
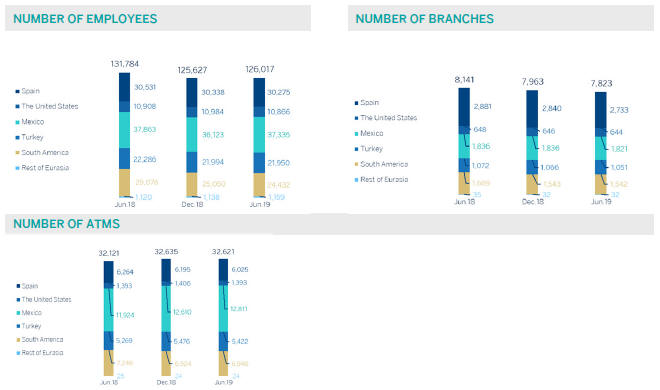
Table of Contents
| 28 |
Global growth is slowing in the face of protectionist pressures affecting the global industrial sector and international trade, although first quarter data indicates a certain degree of stabilization, supported by the strength of the service sector, strong employment and low inflation. This trend is occurring across all regions, with cyclical slowdown in the United States, the trend toward growth moderation in China and the consolidation of lower growth in Europe. Thus, global growth is forecasted at around 3.3% in 2019 and 2020, implying a soft landing. However, the deterioration of trade negotiations between the United States and China since late April poses a major risk to the global economy.
In terms ofmonetary policy, the main central banks signaled their intention to adopt further measures that would provide a stimulus to counteract the high level of uncertainty in the economy, as well as the continued decrease in the long-term inflation outlook. The Federal Reserve, after raising its benchmark interest rate to 2.50% in December, laid the foundations to initiate interest rate reductions in the face of more moderate growth forecasts, weighed down by the trade threat and political uncertainty. For its part, the ECB strengthened its accommodative monetary policy stance by approving a new liquidity provision program, postponing its commitment to maintain interest rates at current levels untilmid-2020, and indicating that it has a range of instruments at its disposal to combat growth and inflation risks, including the reduction of deposit rates or the renewal of the bond purchase program. Accordingly,interest rates will remain low in major economies, enabling emerging countries to gain room to maneuver.
Spain
The most recent data confirms that GDP is growing at a faster pace than in the rest of the eurozone, with a growth of 0.7% in the first quarter of 2019 and a rate between 0.6% and 0.7% expected for the second quarter. The activity was driven by investment in machinery and equipment as well as tourism, which offset moderation in both public and private consumption, and exports of goods.
With regard to the banking system, both the deleveraging of the system and the improvement in asset quality indicators continue (the NPL ratio stood at 5.7% in April 2019). Profitability remained under pressure (ROE of 5.8% in the first quarter of 2019) due to low interest rates and lower business volumes. Spanish banks maintain comfortable levels of capital adequacy and liquidity.
United States
In the first quarter of 2019, GDP grew by 3.1% on ayear-on-year rate, the highest rate in four years, and growth is expected to be below 2% in the second quarter. The largest contribution in the first quarter came from net exports, inventory accumulation and local government spending. However, private consumption and fixed investment slowed, reflecting decreases in durable goods consumption and residential construction. In the absence of inflationary pressures, the Federal Reserve may lower interest rates, which would be a factor that would contribute to preventing further slowdown in the face of rising uncertainty and the prolongation still-unresolved trade disputes.
The most recent bank activity figures (May 2019) shows that loans and deposits grew at rates of 4.3% and 5.1%, respectively.Non-performing loans continued to decrease, with the NPL ratio standing at 1.55% at the end of the first quarter of 2019.
Mexico
GDP contracted in the first quarter of 2019 (down 0.2%quarter-on-quarter) and remains weak in the second quarter despite the strength of the services sector. This weakness is due to several factors: the delay in the ratification of the new USMCA (the United States, Mexico and Canada Agreement), the weakness of investment, continued uncertainty due to external and internal factors, the deceleration of the manufacturing sector in the United States and the slowdown in private consumption and job creation. The central bank remains cautious, but the good performance of inflation (forecast at 3.4% in 2019) and the exchange rate would allow interest rates to be cut to alleviate the slowdown in growth.
The banking system continues to grow inyear-on-year terms. According to data May 2019, loans and deposits grew by 8.3% and 7.6%, respectively, with increases in all portfolios. Thenon-performing loan ratio remained under control (2.16%, compared to 2.20% twelve months earlier) while capital indicators remain at comfortable levels.
Turkey
The Turkish economy technically moved out of recession in the first quarter of 2019, growing at a quarterly rate of 1.3%, while theyear-on-year rate remains negative and declined by 2.6%. The economy is expected to grow by 0.3% in 2019. However, risks remain and a prudent policy combination continues to be key to keeping the recovery trend alive. The disinflationary process continued in the first months of the year at a faster pace than expected, which allowed inflation to decrease from 20.3% in December 2018 to 15.7% in June of this year. In this context, a cycle of official interest rate cuts can begin.
Table of Contents
| 29 |
With figures of May 2019, the total loan volume in the system grew by 8.9%year-on-year (down 0.1% in local currency and up 25.4% in foreign currency affected by the variation effect of the exchange rate. The system’s NPL ratio stood at 4.2% in May 2019.
Argentina
In the first half of 2019, the economy improved slowly after a sharp contraction in 2018, as a consequence of the currency crisis and a severe drought on the primary sector. In the first quarter of 2019, GDP contracted by 0.2% compared to the previous quarter, while slight growth is expected from the second quarter onwards, driven by the good performance of the sectors related to agriculture and the positive effects of lower volatility, as well as the positive effect of the higher confidence of the agents. During the second quarter, inflation has improved at a lower pace, reflecting the contractionary monetary policy of the central bank and the calm in the currency market, which we expect a decline in the next year.
In the financial system, loans and deposits are growing at high rates, albeit with the notable influence of high inflation. Profitability indicators are very high (ROE: 41.2% and ROA: 4.5% in April 2019) andnon-performing loans increased, with a NPL ratio of 4.2% in April 2019.
Colombia
The economy continues to recover at a slow pace after the oil price crisis, growing by 2.6% in 2018 and 2.8% in the first quarter of 2019. This recovery was driven mainly by consumption, both private and public, and recently by a
recovery in investments not related to construction. Investment in construction is still affected by the aftermath of the previous economic cycle, since the high level of stock caused a reduction in the launch of new constructions and therefore, the production of the sector. Going forward, it is expected that the economy will grow at a faster pace, reaching 3.0% growth in this year.
The total loan system grew by 6.9%year-on-year in April 2019, with a NPL ratio of 4.7%. Total deposits increased by 6.6%year-on-year in the same period.
Peru
GDP in the first quarter of 2019 contracted, although is expected to recover slightly in the second quarter. This low growth is mainly due to the primary sector (extractive industries) which remain negative due to factors of a temporary nature. Simultaneously, the expenditure indicators aims to moderation, while the recovery in investment was lower. It is expected that growth for the first half of the year will be around 3%. The central bank maintains interest rates at 2.75%, which implies an expansionary tone in monetary policy. The context of a transitory slowdown in activity, increased external volatility and anchored inflation expectations suggest the possibility of cutting interest rates.
The banking system is showing moderateyear-on-year growth rates in lending and deposits (up 7.6% and up 10.5%, respectively, in April 2019), with reasonably high levels of profitability (ROE: 18.2%) and containednon-performing loans (NPL ratio: 2.5%).
Table of Contents
| 30 |
END OF PERIOD INTEREST RATES
(PERCENTAGE)
| 30-06-19 | 31-03-19 | 31-12-18 | 30-09-18 | 30-06-18 | 31-03-18 | |||||||||||||||||||
Official ECB rate | 0.00 | 0.00 | 0.00 | 0.00 | 0.00 | 0.00 | ||||||||||||||||||
Euribor 3 months | (0.33 | ) | (0.31 | ) | (0.31 | ) | (0.32 | ) | (0.32 | ) | (0.33 | ) | ||||||||||||
Euribor 1 year | (0.19 | ) | (0.11 | ) | (0.13 | ) | (0.17 | ) | (0.18 | ) | (0.19 | ) | ||||||||||||
USA Federal rates | 2.40 | 2.43 | 2.40 | 2.18 | 1.91 | 1.67 | ||||||||||||||||||
TIIE (Mexico) | 8.51 | 8.52 | 8.41 | 8.11 | 7.93 | 7.83 | ||||||||||||||||||
CBRT (Turkey) | 23.86 | 25.50 | 24.06 | 24.01 | 17.77 | 12.75 | ||||||||||||||||||
EXCHANGE RATES
(EXPRESSED IN CURRENCY/EURO)
| Year-end exchange rates | Average exchange rates | |||||||||||||||||||
| D % on | D % on | D % on | ||||||||||||||||||
| 30-06-19 | 30-06-18 | 31-12-18 | 1H19 | 1H18 | ||||||||||||||||
Mexican peso | 21.8201 | 4.9 | 3.1 | 21.6509 | 6.6 | |||||||||||||||
U.S. dollar | 1.1380 | 2.4 | 0.6 | 1.1297 | 7.2 | |||||||||||||||
Argentine peso | 48.7557 | (33.5 | ) | (11.2 | ) | 48.7557 | (33.5 | ) | ||||||||||||
Chilean peso | 773.68 | (2.4 | ) | 2.8 | 763.29 | (3.0 | ) | |||||||||||||
Colombian peso | 3,638.45 | (5.6 | ) | 2.9 | 3,602.32 | (4.3 | ) | |||||||||||||
Peruvian sol | 3.7402 | 2.0 | 3.3 | 3.7516 | 4.8 | |||||||||||||||
Turkish lira | 6.5655 | (18.7 | ) | (7.7 | ) | 6.3577 | (22.0 | ) | ||||||||||||
Table of Contents
| 31 |
| Highlights | ||||||||||
• |
Favorable trend of activity, especially in high profitable segments. | |||||||||
• |
Net Interest income affected by lower ALCO contribution and the impact of IFRS 16. | |||||||||
• |
The positive trend in operating expenses continues. | |||||||||
• |
Positive impact of the sale of NPL andwrite-off portfolios on loan loss provisions and risk indicators. | |||||||||
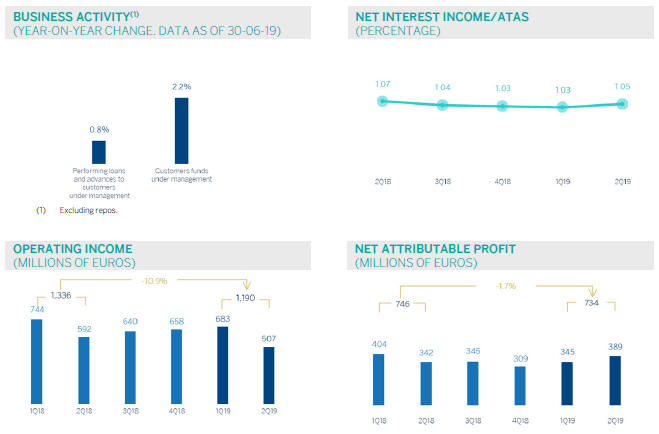
Table of Contents
| 32 |
FINANCIAL STATEMENTS AND RELEVANT BUSINESS INDICATORS(MILLIONS OF EUROS AND PERCENTAGE)
Income statement | 1H19 | D % | 1H18 | |||||||||
Net interest income | 1,808 | (2.4 | ) | 1,852 | ||||||||
Net fees and commissions | 846 | (0.6 | ) | 851 | ||||||||
Net trading income | 92 | (67.4 | ) | 282 | ||||||||
Other operating income and expenses | 72 | 91.7 | 38 | |||||||||
Of which: Insurance activities(1) | 258 | 9.4 | 235 | |||||||||
Gross income | 2,818 | (6.8 | ) | 3,023 | ||||||||
Operating expenses | (1,628 | ) | (3.5 | ) | (1,687 | ) | ||||||
Personnel expenses | (942 | ) | (0.8 | ) | (950 | ) | ||||||
Other administrative expenses | (447 | ) | (23.5 | ) | (584 | ) | ||||||
Depreciation | (239 | ) | 56.5 | (152 | ) | |||||||
Operating income | 1,190 | (10.9 | ) | 1,336 | ||||||||
Impairment on financial assets not measured at fair value through profit or loss | 25 | n.s. | (213 | ) | ||||||||
Provisions or reversal of provisions and other results | (188 | ) | 181.9 | (67 | ) | |||||||
Profit/(loss) before tax | 1,027 | (2.8 | ) | 1,056 | ||||||||
Income tax | (292 | ) | (5.5 | ) | (309 | ) | ||||||
Profit/(loss) for the year | 735 | (1.7 | ) | 748 | ||||||||
Non-controlling interests | (1 | ) | (17.0 | ) | (2 | ) | ||||||
Net attributable profit | 734 | (1.7 | ) | 746 | ||||||||
| (1) | Includes premiums received net of estimated technical insurance reserves. |
Balance sheets | 30-06-19 | D % | 31-12-18 | |||||||||
Cash, cash balances at central banks and other demand deposits | 12,157 | (57.4 | ) | 28,545 | ||||||||
Financial assets designated at fair value | 127,397 | 18.7 | 107,320 | |||||||||
Of which: Loans and advances | 37,564 | 24.3 | 30,222 | |||||||||
Financial assets at amortized cost | 200,008 | 2.3 | 195,467 | |||||||||
Of which: Loans and advances to customers | 171,081 | 0.4 | 170,438 | |||||||||
Inter-area positions | 18,794 | 34.0 | 14,026 | |||||||||
Tangible assets | 3,484 | 169.3 | 1,294 | |||||||||
Other assets | 7,142 | (13.4 | ) | 8,249 | ||||||||
Total assets/liabilities and equity | 368,982 | 4.0 | 354,901 | |||||||||
Financial liabilities held for trading and designated at fair value through profit or loss | 80,487 | 13.3 | 71,033 | |||||||||
Deposits from central banks and credit institutions | 47,280 | 3.0 | 45,914 | |||||||||
Deposits from customers | 180,434 | (1.6 | ) | 183,414 | ||||||||
Debt certificates | 32,861 | 4.8 | 31,352 | |||||||||
Inter-area positions | — | — | — | |||||||||
Other liabilities | 19,099 | 31.5 | 14,519 | |||||||||
Economic capital allocated | 8,822 | 1.8 | 8,670 | |||||||||
Relevant business indicators | 30-06-19 | D % | 31-12-18 | |||||||||
Performing loans and advances to customers under management(1) | 167,541 | 0.7 | 166,396 | |||||||||
Non-performing loans | 9,096 | (9.7 | ) | 10,073 | ||||||||
Customer deposits under management(1) | 180,434 | (1.4 | ) | 182,984 | ||||||||
Off-balance sheet funds(2) | 64,370 | 2.9 | 62,559 | |||||||||
Risk-weighted assets | 107,486 | 3.2 | 104,113 | |||||||||
Efficiency ratio (%) | 57.8 | 55.9 | ||||||||||
NPL ratio (%) | 4.6 | 5.1 | ||||||||||
NPL coverage ratio (%) | 58 | 57 | ||||||||||
Cost of risk (%) | (0.03 | ) | 0.21 | |||||||||
| (1) | Excluding repos. |
| (2) | Includes mutual funds, pension funds and otheroff-balance sheet funds. |
Table of Contents
| 33 |
Activity
The most relevant aspects related to the area’s activity during the first half of 2019 were:
| • | As of June 30, 2019lending (performing loans under management) increased 0.7% compared to the end of 2018 (up 0.8%year-on-year), supported by the positive performance of consumer loans and credit cards (up 9.2% in the first half of 2019, and up 18.2%year-on-year) as well as retail andmedium-sized enterprises (up 3.5% in the first half of the year, and up 6.0%year-on-year), which more than offset the reduction in mortgage loans (down 1.6% in the first half of the year, and down 3.4%year-on-year). |
| • | In terms ofasset quality, NPL balances decreased in the quarter, with a positive impact on the NPL ratio which stood at 4.6% as of June 30, 2019 (5.1% as of December 31, 2018), mainly explained by the sale ofnon-performing real estate developer loans in the second quarter and, in general, due to a lower level ofnon-performing mortgage loans. The coverage ratio stood at 58%, above the closing of 2018. |
| • | Customerdeposits under management registered a slight reduction compared to December 2018, with growth in demand deposits of 3.6% in the first half of the year (up 9.2%year-on-year) and a reduction in time deposits (down 19.2% in the first half of the year, and down 19.4%year-on-year). However, total deposits remained stable over the first six months of 2019, and increased by 2.7% in the last twelve months. Demand deposits now account for more than 80% of total customer deposits. |
| • | Off-balance sheet funds performed well (up 2.9% since December 31, 2018 and up 0.8%year-on-year), especially in mutual funds, supported by the positive evolution of the market in the first half of the year. |
Results
Net attributableprofit of BBVA in Spain stood at €734m, in the first half of 2019 slightly below the figure registered in the same period of the previous year (down 1.7%).
The main highlights of the area’s income statement are:
| • | Net interest incomedecreased by 2.4%year-on-year, affected by the lower contribution from the ALCO portfolios and the effect of IFRS 16 implementation. |
| • | Net fees and commissions remained virtually flatyear-on-year (down 0.6%). |
| • | Lower contribution fromNTI (down 67.4% compared to the first half of 2018), due to uneven market performance in the first six months of the year and lower portfolio sales. |
| • | Other operating income and expenses showed ayear-on-year growth (up 91.7%) driven by the strong performance of net earnings from the insurance business, although thequarter-on-quarter comparison is negatively affected by the contribution to the SRF in the second quarter of 2019. |
| • | The positive trend inoperating expenses (down 3.5%year-on-year) continues, driven by the cost reduction plans. As a result, the efficiency ratio stood at 57.8%. |
| • | The favorable performance ofimpairment on financial assets continues as a result of the positive impact of the aforementioned sale ofnon-performing and write-offs from real estate developer loans, and the lower reserve requirements, primarily in real estate developer loan portfolios. |
| • | Finally,provisions (net) and other gains (losses) showed ayear-on-year increase due to the positive valuation of assets in the former Non Core Real Estate area in the first half of last year. |
Table of Contents
| 34 |
| ||||||||||
| Highlights | ||||||||||
• |
Good performance of retail lending | |||||||||
• |
Positive trend in net interest income and customer spreads. | |||||||||
• |
The improvement in the efficiency ratio continues. | |||||||||
• |
Net attributable profit affected by the impairment on financial assets associated with specific customers of the commercial portfolio and to write-offs in consumer loans. | |||||||||
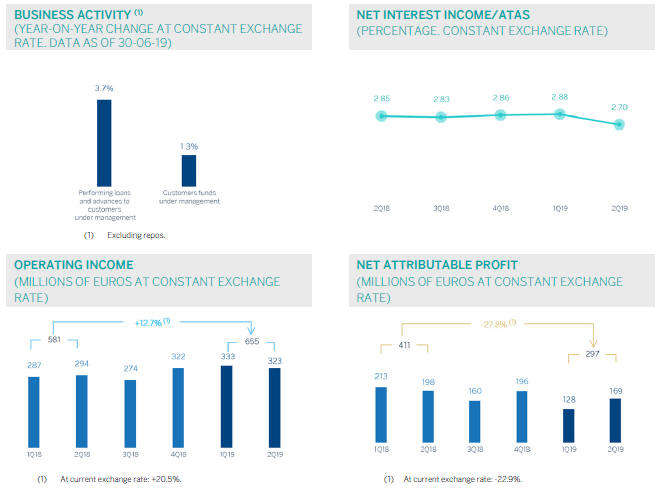
Table of Contents
| 35 |
FINANCIAL STATEMENTS AND RELEVANT BUSINESS INDICATORS (MILLIONS OF EUROS AND PERCENTAGE)
Income statement | 1H19 | D % | D % (1) | 1H18 | ||||||||||||
Net interest income | 1,217 | 12.6 | 5.2 | 1,082 | ||||||||||||
Net fees and commissions | 320 | 5.8 | (1.0 | ) | 302 | |||||||||||
Net trading income | 79 | 61.8 | 52.5 | 49 | ||||||||||||
Other operating income and expenses | (1 | ) | n.s. | n.s. | 4 | |||||||||||
Gross income | 1,615 | 12.4 | 5.1 | 1,437 | ||||||||||||
Operating expenses | (959 | ) | 7.5 | 0.4 | (893 | ) | ||||||||||
Personnel expenses | (554 | ) | 8.0 | 0.9 | (513 | ) | ||||||||||
Other administrative expenses | (295 | ) | 0.5 | (6.1 | ) | (294 | ) | |||||||||
Depreciation | (110 | ) | 28.3 | 19.8 | (86 | ) | ||||||||||
Operating income | 655 | 20.5 | 12.7 | 544 | ||||||||||||
Impairment on financial assets not measured at fair value through profit or loss | (286 | ) | n.s. | n.s. | (63 | ) | ||||||||||
Provisions or reversal of provisions and other results | (6 | ) | n.s. | n.s. | 12 | |||||||||||
Profit/(loss) before tax | 363 | (26.3 | ) | (31.0 | ) | 493 | ||||||||||
Income tax | (67 | ) | (38.4 | ) | (42.3 | ) | (108 | ) | ||||||||
Profit/(loss) for the year | 297 | (22.9 | ) | (27.8 | ) | 385 | ||||||||||
Non-controlling interests | — | — | — | — | ||||||||||||
Net attributable profit | 297 | (22.9 | ) | (27.8 | ) | 385 | ||||||||||
Balance sheets | 30-06-19 | D % | D % (1) | 31-12-18 | ||||||||||||
Cash, cash balances at central banks and other demand deposits | 7,504 | 55.2 | 54.2 | 4,835 | ||||||||||||
Financial assets designated at fair value | 10,283 | (1.9 | ) | (2.5 | ) | 10,481 | ||||||||||
Of which: Loans and advances | 1,433 | n.s. | n.s. | 156 | ||||||||||||
Financial assets at amortized cost | 64,839 | 2.0 | 1.4 | 63,539 | ||||||||||||
Of which: Loans and advances to customers | 60,130 | (1.1 | ) | (1.7 | ) | 60,808 | ||||||||||
Inter-area positions | — | — | — | — | ||||||||||||
Tangible assets | 925 | 38.4 | 37.5 | 668 | ||||||||||||
Other assets | 2,678 | 5.7 | 5.0 | 2,534 | ||||||||||||
|
|
|
|
|
|
|
| |||||||||
Total assets/liabilities and equity | 86,229 | 5.1 | 4.4 | 82,057 | ||||||||||||
|
|
|
|
|
|
|
| |||||||||
Financial liabilities held for trading and designated at fair value through profit or loss | 1,475 | n.s. | n.s. | 234 | ||||||||||||
Deposits from central banks and credit institutions | 4,568 | 35.6 | 34.7 | 3,370 | ||||||||||||
Deposits from customers | 63,122 | (1.2 | ) | (1.8 | ) | 63,891 | ||||||||||
Debt certificates | 3,382 | (6.0 | ) | (6.6 | ) | 3,599 | ||||||||||
Inter-area positions | 3,757 | 95.0 | 93.8 | 1,926 | ||||||||||||
Other liabilities | 6,232 | 10.2 | 9.6 | 5,654 | ||||||||||||
Economic capital allocated | 3,692 | 9.1 | 8.5 | 3,383 | ||||||||||||
Relevant business indicators | 30-06-19 | D % | D % (1) | 31-12-18 | ||||||||||||
Performing loans and advances to customers under management(2) | 60,172 | (1.0 | ) | (1.6 | ) | 60,784 | ||||||||||
Non-performing loans | 827 | 3.2 | 2.5 | 802 | ||||||||||||
Customer deposits under management(2) | 63,120 | (1.2 | ) | (1.8 | ) | 63,888 | ||||||||||
Off-balance sheet funds(3) | — | — | — | — | ||||||||||||
Risk-weighted assets | 62,383 | (2.8 | ) | (3.4 | ) | 64,175 | ||||||||||
Efficiency ratio (%) | 59.4 | 62.2 | ||||||||||||||
NPL ratio (%) | 1.3 | 1.3 | ||||||||||||||
NPL coverage ratio (%) | 91 | 85 | ||||||||||||||
Cost of risk (%) | 0.94 | 0.39 | ||||||||||||||
| (1) | Figures at constant exchange rate. |
| (2) | Excluding repos. |
| (3) | Includes mutual funds, pension funds and otheroff-balance sheet funds. |
Table of Contents
| 36 |
Activity
Unless expressly stated otherwise, all the comments below on rates of change, for both activity and earnings, will be given at constant exchange rate. These rates, together with changes at current exchange rate, can be seen in the attached tables of financial statements and relevant business indicators. In addition, the quarterly variations are from the quarter ending with respect to the previous quarter.
The most relevant evolution to the area’s activity in the first semester of 2019 was:
| • | Lending activity (performing loans under management) showed a decrease of 1.6%year-to-date, although it grew by 3.7% compared to the figure for the same period of the previous year. Loan growth has been moderate throughout 2019, mainly due to a contraction in the commercial portfolio as well as, to a lesser extent, in the retail portfolio. |
| • | Thecommercial portfolio showed a negative evolution in the semester (down 1.8%) but increasedyear-on-year (up 3.7%). The high level of interest rates continued to negatively affect the mortgages portfolios (down 0.4%year-to-date and up 0.9%year-on-year). Regarding the rest ofretail portfolios, credit cards and consumer loan portfolios, which are increasingly being granted through digital channels and have higher margins, decreased slightly by 1.6%year-to-date but increased by 11.2%year-on-year. |
| • | Regarding the risk indicators, the NPL ratio remained stable throughout the semester at 1.3%. The NPL coverage ratio improved to 91% as of June 30, 2019. |
| • | As the competition for deposits remains intense, customerdeposits under management decreased slightly by 1.8%year-to-date but increased 1.3%year-on-year, mainly due to the increase in time deposits (up 4.0%year-on-year, down 5.9% in the semester) and, to a lesser extent, in demand deposits (up 0.4%year-on-year, down 0.4%year-to-date). |
Results
The United States generated a cumulative net attributable profit of €297m in the first half of 2019, down 27.8%year-on-year, as a result of higher levels of impairments on financial assets registered in the first six months of 2019. The most relevant aspects of the evolution of the results are summarized below:
| • | Net interest income continued to perform positively, with an increase of 5.2%year-on-year, despite the current market situation in the United States, which is affected by the uncertainties about the monetary policy decisions that the FED will take. |
| • | Net fees and commissions decreased by 1.0%year-on-year, mainly due to those related to deposits and investment banking and a lower contribution from markets. |
| • | Higher contribution fromNTIdue to the good performance during the first half of 2019 associated with higher ALCO portfolio sales in the first quarter of 2019. |
| • | Operating expensesgrew slightly by 0.4%year-on-year but this increase is lower than the growth in gross income (up 5.1%), as a result, the efficiency ratio improved. |
| • | Impairment on financial assets increased during the first half of 2019, due to provisions for some specific commercial customers, a higher level of write-offs in the consumer portfolio and, to a lesser extent, to the macro scenario adjustment. In addition, 2018 was positively impacted by the release of provisions related to the hurricanes the previous year. As a result, the cumulative cost of risk on June 30, 2019 increased to 0.94% compared to 0.39% on December 31, 2018. |
Table of Contents
| 37 |
| ||||||||||
| Highlights | ||||||||||
| • | Lending growth boosted by the retail portfolio. | |||||||||
| • | Favourable performance of customer funds especially in time deposits andoff-balance sheet funds. | |||||||||
| • | Positive performance of net interest income growing above activity. | |||||||||
| • | Good asset quality indicators. | |||||||||
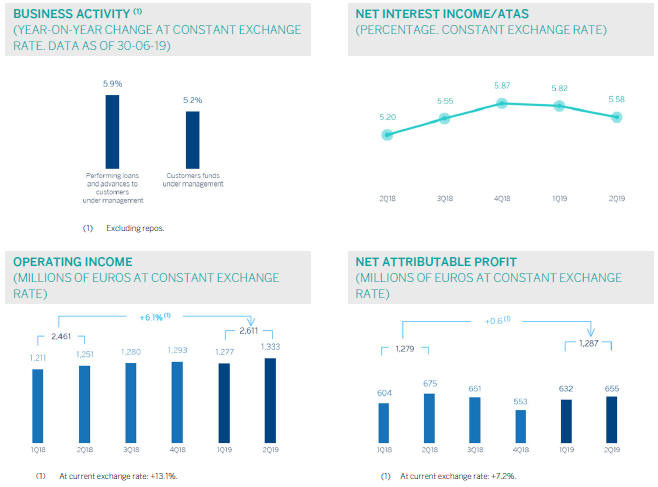
Table of Contents
| 38 |
FINANCIAL STATEMENTS AND RELEVANT BUSINESS INDICATORS(MILLIONS OF EUROS AND PERCENTAGE)
Income statement | 1H19 | D % | D % (1) | 1H18 | ||||||||||||
Net interest income | 3,042 | 14.9 | 7.8 | 2,648 | ||||||||||||
Net fees and commissions | 621 | 5.5 | (1.0 | ) | 589 | |||||||||||
Net trading income | 135 | (6.0 | ) | (11.8 | ) | 144 | ||||||||||
Other operating income and expenses | 102 | 21.6 | 14.0 | 84 | ||||||||||||
Gross income | 3,901 | 12.6 | 5.6 | 3,465 | ||||||||||||
Operating expenses | (1,290 | ) | 11.6 | 4.7 | (1,156 | ) | ||||||||||
Personnel expenses | (548 | ) | 9.9 | 3.1 | (498 | ) | ||||||||||
Other administrative expenses | (570 | ) | 6.4 | (0.2 | ) | (536 | ) | |||||||||
Depreciation | (172 | ) | 41.3 | 32.5 | (122 | ) | ||||||||||
Operating income | 2,611 | 13.1 | 6.1 | 2,309 | ||||||||||||
Impairment on financial assets not measured at fair value through profit or loss | (818 | ) | 15.5 | 8.4 | (708 | ) | ||||||||||
Provisions or reversal of provisions and other results | (10 | ) | n.s. | n.s. | 54 | |||||||||||
Profit/(loss) before tax | 1,783 | 7.8 | 1.1 | 1,654 | ||||||||||||
Income tax | (496 | ) | 9.2 | 2.5 | (454 | ) | ||||||||||
Profit/(loss) for the year | 1,287 | 7.2 | 0.6 | 1,200 | ||||||||||||
Non-controlling interests | (0 | ) | 12.1 | 5.1 | (0 | ) | ||||||||||
Net attributable profit | 1,287 | 7.2 | 0.6 | 1,200 | ||||||||||||
Balance sheets | 30-06-19 | D % | D % (1) | 31-12-18 | ||||||||||||
Cash, cash balances at central banks and other demand deposits | 10,051 | 21.5 | 17.9 | 8,274 | ||||||||||||
Financial assets designated at fair value | 28,405 | 9.2 | 5.9 | 26,022 | ||||||||||||
Of which: Loans and advances | 1,276 | n.s. | n.s. | 72 | ||||||||||||
Financial assets at amortized cost | 61,510 | 6.6 | 3.4 | 57,709 | ||||||||||||
Of which: Loans and advances to customers | 54,432 | 6.5 | 3.3 | 51,101 | ||||||||||||
Tangible assets | 2,020 | 13.0 | 9.6 | 1,788 | ||||||||||||
Other assets | 3,379 | (7.1 | ) | (9.9 | ) | 3,639 | ||||||||||
|
|
|
|
|
|
|
| |||||||||
Total assets/liabilities and equity | 105,366 | 8.1 | 4.9 | 97,432 | ||||||||||||
|
|
|
|
|
|
|
| |||||||||
Financial liabilities held for trading and designated at fair value through profit or loss | 20,682 | 14.7 | 11.3 | 18,028 | ||||||||||||
Deposits from central banks and credit institutions | 1,868 | 173.4 | 165.2 | 683 | ||||||||||||
Deposits from customers | 52,960 | 4.8 | 1.7 | 50,530 | ||||||||||||
Debt certificates | 9,512 | 11.0 | 7.7 | 8,566 | ||||||||||||
Other liabilities | 16,287 | 5.2 | 2.0 | 15,485 | ||||||||||||
Economic capital allocated | 4,058 | (2.0 | ) | (4.9 | ) | 4,140 | ||||||||||
Relevant business indicators | 30-06-19 | D % | D % (1) | 31-12-18 | ||||||||||||
Performing loans and advances to customers under management(2) | 55,046 | 7.1 | 3.9 | 51,387 | ||||||||||||
Non-performing loans | 1,289 | 13.3 | 9.9 | 1,138 | ||||||||||||
Customer deposits under management(2) | 52,679 | 5.9 | 2.7 | 49,740 | ||||||||||||
Off-balance sheet funds(3) | 23,419 | 13.4 | 10.0 | 20,647 | ||||||||||||
Risk-weighted assets | 55,919 | 5.2 | 2.0 | 53,177 | ||||||||||||
Efficiency ratio (%) | 33.1 | 33.3 | ||||||||||||||
NPL ratio (%) | 2.2 | 2.1 | ||||||||||||||
NPL coverage ratio (%) | 148 | 154 | ||||||||||||||
Cost of risk (%) | 2.98 | 3.07 | ||||||||||||||
| (1) | Figures at constant exchange rate. |
| (2) | Excluding repos. |
| (3) | Includes mutual funds, pension funds and otheroff-balance sheet funds. |
Table of Contents
| 39 |
Activity
Unless expressly stated otherwise, all the comments below on rates of change, for both activity and results, will be given at constant exchange rates. These rates, together with changes at current exchange rates, can be found in the attached tables of financial statements and relevant business indicators. In addition, the quarterly variations are from the quarter ending with respect to the previous quarter.
The most relevant aspects related to the area’s activity during the first half of 2019 were:
| • | Lendingactivity (performing loans under management) increased by 3.9% during the first half of the year (5.9%year-on-year). That allows BBVA to maintain its leading position in Mexico, with a market share of 22.2% in performing loans, according to local figures as of the end of May 2019 released by the National Banking and Securities Commission (CNBV). |
| • | Thewholesale portfolio, which represents 50% of total lending, grew by 0.5% in the first six months of the year, supported by 4.3% growth in corporate loans.Year-on-year growth was 1.9%, due to the strong lending activity to corporates and the public sector. Meanwhile, theretail portfolio (including SMEs) continues to perform strongly over the first six months of 2019 (up 4.8%), driven by consumer lending (payroll and personal loans) and mortgages. Noteworthy is the 8.3% growth in consumer loans resulting from the Bank’s strategy to increase penetration among its customer base. |
| • | Asset qualityindicators as of June 30, 2019 remained similar to levels seen at the end of 2018: the NPL ratio closed at 2.2%, and coverage ratio stood at 148%. |
| • | Total customerfunds (customer deposits under management, mutual funds and otheroff-balance sheet funds) showed an increase of 4.9% in the first six months of the year, despite the highly competitive market. This is mainly explained by an increase of 5.8% in time deposits and 11.0% in mutual funds over the period. Theyear-on-year growth of total customer funds was 5.2%, driven by growth in both demand and time deposits. The funding mix remains unchanged from the end of December 2018, with demand deposits which represents 76% of total customer deposits under management, despite the transfer of demand deposits to time deposits and mutual funds. There was also a strong performance fromoff-balance sheet funds (up 10.0% compared to December 2018) and, in particular, mutual funds (up 11.0%). |
Results
BBVA in Mexico showed a net attributableprofit of €1,287m in the first six months of 2019, up 0.6%year-on-year. Net attributable profit was higher in the second quarter of the year (up 3.7% compared to the previous quarter). The most relevant aspects of the income statement evolution for the first half of 2019 are summarized below:
| • | Positive performance ofnet interest income, which showed ayear-on-year growth of 7.8%, driven by higher income from the retail portfolio and low financing costs. |
| • | Net fees and commissions registered a slight decrease of 1.0%year-on-year, with the comparison being affected by lower activity levels in corporate segments versus those registered in the same period of the previous year. |
| • | NTI fell by 11.8%, mainly due to lower income from Global Markets and exchange rate transactions, which decreased compared to the previous year. |
| • | The headingother operating income and expenses registered ayear-on-year increase of 14.0%, resulting from higher earnings in the insurance business. |
| • | Gross income grew by 5.6%year-on-year. This growth is higher than the increase inoperating expenses (up 4.7%) which, despite being strongly influenced by the effect of doubling the contribution to the Foundation, remain subject to a strict cost control policy. As a result, the efficiency ratio improved in the first half of 2019, standing at 33.1%. |
| • | Impairment on financial assets grew by 8.4%, primarily due toone-off customers in the corporate portfolio and the impact due to the macroeconomic scenario adjustments. The cost of risk stood at 2.98%, improving slightly from the cumulative cost of risk of 3.07% in 2018. |
| • | In the headingprovisions (net) and other gains (losses), the comparison was negative due to extraordinary income in the first half of 2018 from the sale of holdings in real estate developments by BBVA in Mexico. |
Table of Contents
| 40 |
| Highlights | ||||||||||
| • | Positive trend in activity. | |||||||||
| • | Good performance of net interest income, favored by the income from inflation-linked bonds. | |||||||||
| • | Operating expenses growth below the inflation rate. | |||||||||
| • | Positive evolution of the recurring revenue items offset by higher loan-loss provisions on financial assets. | |||||||||
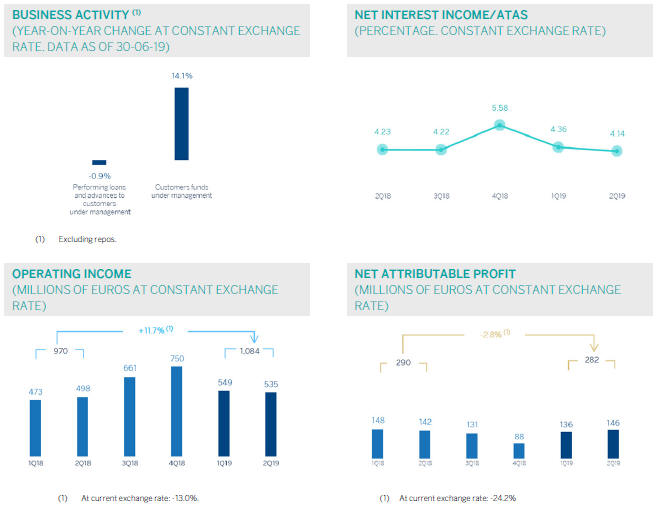
Table of Contents
| 41 |
FINANCIAL STATEMENTS AND RELEVANT BUSINESS INDICATORS (MILLIONS OF EUROS AND PERCENTAGE)
Income statement | 1H19 | D % | D % (1) | 1H18 | ||||||||||||
Net interest income | 1,353 | (10.4 | ) | 15.0 | 1,510 | |||||||||||
Net fees and commissions | 360 | (2.9 | ) | 24.5 | 371 | |||||||||||
Net trading income | (65 | ) | n.s. | n.s. | 4 | |||||||||||
Other operating income and expenses | 30 | (24.1 | ) | (2.6 | ) | 39 | ||||||||||
Gross income | 1,677 | (12.8 | ) | 11.9 | 1,924 | |||||||||||
Operating expenses | (594 | ) | (12.5 | ) | 12.2 | (679 | ) | |||||||||
Personnel expenses | (335 | ) | (5.9 | ) | 20.7 | (356 | ) | |||||||||
Other administrative expenses | (173 | ) | (29.4 | ) | (9.4 | ) | (244 | ) | ||||||||
Depreciation | (86 | ) | 9.8 | 40.9 | (78 | ) | ||||||||||
Operating income | 1,084 | (13.0 | ) | 11.7 | 1,245 | |||||||||||
Impairment on financial assets not measured at fair value through profit or loss | (337 | ) | 6.8 | 37.1 | (315 | ) | ||||||||||
Provisions or reversal of provisions and other results | (21 | ) | n.s. | n.s. | 34 | |||||||||||
Profit/(loss) before tax | 726 | (24.7 | ) | (3.5 | ) | 964 | ||||||||||
Income tax | (153 | ) | (27.2 | ) | (6.6 | ) | (210 | ) | ||||||||
Profit/(loss) for the year | 573 | (24.1 | ) | (2.6 | ) | 754 | ||||||||||
Non-controlling interests | (291 | ) | (23.9 | ) | (2.4 | ) | (383 | ) | ||||||||
Net attributable profit | 282 | (24.2 | ) | (2.8 | ) | 372 | ||||||||||
Balance sheets | 30-06-19 | D % | D % (1) | 31-12-18 | ||||||||||||
Cash, cash balances at central banks and other demand deposits | 7,687 | (2.1 | ) | 6.1 | 7,853 | |||||||||||
Financial assets designated at fair value | 5,257 | (4.5 | ) | 3.5 | 5,506 | |||||||||||
Of which: Loans and advances | 414 | 1.0 | 9.4 | 410 | ||||||||||||
Financial assets at amortized cost | 49,119 | (2.4 | ) | 5.8 | 50,315 | |||||||||||
Of which: Loans and advances to customers | 39,286 | (5.3 | ) | 2.6 | 41,478 | |||||||||||
Tangible assets | 1,129 | 6.5 | 15.4 | 1,059 | ||||||||||||
Other assets | 1,449 | (4.4 | ) | 3.6 | 1,517 | |||||||||||
|
|
|
|
|
|
|
| |||||||||
Total assets/liabilities and equity | 64,641 | (2.4 | ) | 5.7 | 66,250 | |||||||||||
|
|
|
|
|
|
|
| |||||||||
Financial liabilities held for trading and designated at fair value through profit or loss | 2,275 | 22.9 | 33.2 | 1,852 | ||||||||||||
Deposits from central banks and credit institutions | 5,459 | (18.9 | ) | (12.2 | ) | 6,734 | ||||||||||
Deposits from customers | 39,456 | (1.1 | ) | 7.1 | 39,905 | |||||||||||
Debt certificates | 5,799 | (2.8 | ) | 5.4 | 5,964 | |||||||||||
Other liabilities | 9,051 | (2.3 | ) | 5.8 | 9,267 | |||||||||||
Economic capital allocated | 2,601 | 2.8 | 11.4 | 2,529 | ||||||||||||
Relevant business indicators | 30-06-19 | D % | D % (1) | 31-12-18 | ||||||||||||
Performing loans and advances to customers under management(2) | 38,542 | (6.0 | ) | 1.9 | 40,996 | |||||||||||
Non-performing loans | 3,254 | 13.1 | 22.6 | 2,876 | ||||||||||||
Customer deposits under management(2) | 39,452 | (1.1 | ) | 7.2 | 39,897 | |||||||||||
Off-balance sheet funds(3) | 2,983 | 3.1 | 11.7 | 2,894 | ||||||||||||
Risk-weighted assets | 57,551 | 1.9 | 10.4 | 56,486 | ||||||||||||
Efficiency ratio (%) | 35.4 | 32.0 | ||||||||||||||
NPL ratio (%) | 6.3 | 5.3 | ||||||||||||||
NPL coverage ratio (%) | 75 | 81 | ||||||||||||||
Cost of risk (%) | 1.57 | 2.44 | ||||||||||||||
| (1) | Figures at constant exchange rate. |
| (2) | Excluding repos. |
| (3) | Includes mutual funds, pension funds and otheroff-balance sheet funds. |
Table of Contents
| 42 |
Activity
Unless expressly stated and communicated otherwise, rates of changes explained ahead, both for activity and for income, will be presented at constant exchange rates. These rates, together with changes at current exchange rates, can be observed in the attached tables of the financial statements and relevant business indicators. In addition, the quarterly variations are from the quarter ending with respect to the previous quarter.
The most relevant aspects related to the area’s activityyear-to-date as of June 30, 2019 were:
| • | Lendingactivity (performing loans under management) increased slightly by 1.9%year-to-date (down 0.9%year-on-year) mainly driven by currency depreciation impact and continued contraction of foreign-currency loans (in U.S. dollar terms). Turkish Lira loans reduced in the second quarter by-4.8%, after experiencing a notable growth in the first quarter. |
| • | Despite contracting in the second quarter, Turkish Liracommercial loans grew year to date thanks to a strong performance in the first quarter supported by the Credit Guarantee Fund (CGF) utilization and short term corporate loans. Additionally, a downward trend in the consumer loans continued mainly driven by mortgage and auto loans. On the other hand, credit cards showed a solid performance during the quarter. |
| • | In terms ofasset quality, the NPL ratio increased to 6.3% mainly due to some specific customers in the wholesale portfolio. The NPL coverage ratio stood at 75%. |
| • | Customerdeposits(61% of total liabilities in the area as of June 30, 2019) remained the main source of funding for the balance sheet and increased by 7.2% on a year to date basis, yet it remained stable during the quarter. It is worth mentioning the good performance of demand deposits, which increased by 21.5% year to date and 5.6% in the quarter. |
Results
Turkey generated a net attributableprofitof €282m in the first half of 2019, representing a 2.8% decrease inyear-on-year terms (up 6.9% in the second quarter of 2019). The most significant aspects of theyear-on-year evolution in the income statement are the following:
| • | Positive performance of netinterest income (up 15.0%) mainly thanks to the significant income from inflation-linked bonds and, to a lesser extent good ALM portfolio management despite the increase in cost of funding. |
| • | Income from net fees and commissions grew by 24.5%. This significant increase was mainly driven by the positive performance in payment systems and backed by money transfers andnon-cash loans. |
| • | Decrease inNTI due to the unfavorable market conditions which was not offset by the strong performance of the asset and liabilities management and derivative gains. |
| • | Gross income grew 11.9% in the first half of 2019 compared to the same period of 2018, thanks to increased core banking revenues and the aforementioned high contribution from inflation-linked bonds. |
| • | Operating expensesincreased by 12.2%, significantly below the average inflation rate during the last 12 months (19.9%). As a result of strict cost-control discipline, the efficiency ratio remained at low levels (35.4%). |
| • | Impairment losses on financial assets rose by 37.1% on a year on year basis due to some negative impacts from wholesale portfolio and higher macro scenario adjustments. As a result, the cumulative cost of risk of the area stood at 1.57%. |
Table of Contents
| 43 |
| Highlights | ||||||||||
• |
Positive trend of lending in the main countries. | |||||||||
• |
Good performance of net interest income is maintained. | |||||||||
• |
Net Attributable profit impacted by Argentina’s hyperinflation adjustment. | |||||||||
• |
Positive contribution of the main countries: Argentina, Colombia and Peru to the Group’s attributable profit. | |||||||||
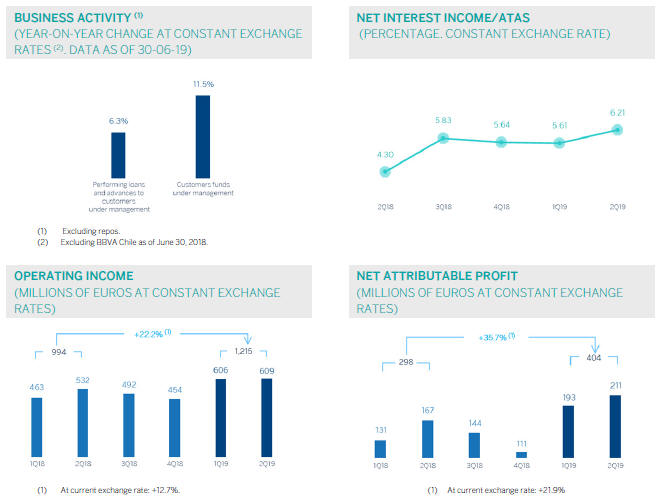
Table of Contents
| 44 |
FINANCIAL STATEMENTS AND RELEVANT BUSINESS INDICATORS(MILLIONS OF EUROS AND PERCENTAGE)
Income statement | 1H19 | D % | D % (1) | 1H18 | ||||||||||||
Net interest income | 1,613 | 3.9 | 12.1 | 1,553 | ||||||||||||
Net fees and commissions | 298 | (6.9 | ) | 0.0 | 321 | |||||||||||
Net trading income | 314 | 43.7 | 59.3 | 219 | ||||||||||||
Other operating income and expenses | (231 | ) | 118.9 | 100.2 | (106 | ) | ||||||||||
Gross income | 1,994 | 0.4 | 9.7 | 1,987 | ||||||||||||
Operating expenses | (779 | ) | (14.3 | ) | (5.5 | ) | (909 | ) | ||||||||
Personnel expenses | (402 | ) | (13.7 | ) | (4.5 | ) | (465 | ) | ||||||||
Other administrative expenses | (293 | ) | (25.0 | ) | (17.5 | ) | (391 | ) | ||||||||
Depreciation | (84 | ) | 60.8 | 73.4 | (52 | ) | ||||||||||
Operating income | 1,215 | 12.7 | 22.2 | 1,078 | ||||||||||||
Impairment on financial assets not measured at fair value through profit or loss | (349 | ) | 9.0 | 13.8 | (321 | ) | ||||||||||
Provisions or reversal of provisions and other results | (19 | ) | (43.6 | ) | (33.9 | ) | (34 | ) | ||||||||
Profit/(loss) before tax | 847 | 17.0 | 28.6 | 724 | ||||||||||||
Income tax | (271 | ) | 4.8 | 14.4 | (259 | ) | ||||||||||
Profit/(loss) for the year | 576 | 23.8 | 36.6 | 465 | ||||||||||||
Non-controlling interests | (171 | ) | 28.8 | 38.7 | (133 | ) | ||||||||||
Net attributable profit | 404 | 21.9 | 35.7 | 332 | ||||||||||||
Balance sheets | 30-06-19 | D % | D % (1) | 31-12-18 | ||||||||||||
Cash, cash balances at central banks and other demand deposits | 7,662 | (14.7 | ) | (12.8 | ) | 8,987 | ||||||||||
Financial assets designated at fair value | 7,378 | 31.0 | 30.7 | 5,634 | ||||||||||||
Of which: Loans and advances | 70 | (45.8 | ) | (47.3 | ) | 129 | ||||||||||
Financial assets at amortized cost | 37,996 | 3.7 | 3.4 | 36,649 | ||||||||||||
Of which: Loans and advances to customers | 35,712 | 3.6 | 3.3 | 34,469 | ||||||||||||
Tangible assets | 1,001 | 23.1 | 24.1 | 813 | ||||||||||||
Other assets | 2,397 | 4.7 | 3.6 | 2,290 | ||||||||||||
|
|
|
|
|
|
|
| |||||||||
Total assets/liabilities and equity | 56,433 | 3.8 | 3.9 | 54,373 | ||||||||||||
|
|
|
|
|
|
|
| |||||||||
Financial liabilities held for trading and designated at fair value through profit or loss | 1,931 | 42.3 | 38.9 | 1,357 | ||||||||||||
Deposits from central banks and credit institutions | 3,231 | 5.0 | 3.0 | 3,076 | ||||||||||||
Deposits from customers | 36,896 | 2.9 | 3.6 | 35,842 | ||||||||||||
Debt certificates | 3,202 | (0.1 | ) | (2.7 | ) | 3,206 | ||||||||||
Other liabilities | 8,722 | 2.1 | 2.3 | 8,539 | ||||||||||||
Economic capital allocated | 2,452 | 4.2 | 4.7 | 2,355 | ||||||||||||
Relevant business indicators | 30-06-19 | D % | D % (1) | 31-12-18 | ||||||||||||
Performing loans and advances to customers under management(2) | 35,429 | 2.6 | 2.3 | 34,518 | ||||||||||||
Non-performing loans | 1,853 | 6.1 | 4.4 | 1,747 | ||||||||||||
Customer deposits under management(3) | 36,909 | 2.6 | 3.2 | 35,984 | ||||||||||||
Off-balance sheet funds(4) | 12,577 | 7.8 | 7.4 | 11,662 | ||||||||||||
Risk-weighted assets | 43,995 | 3.0 | 3.5 | 42,724 | ||||||||||||
Efficiency ratio (%) | 39.1 | 46.2 | ||||||||||||||
NPL ratio (%) | 4.4 | 4.3 | ||||||||||||||
NPL coverage ratio (%) | 95 | 97 | ||||||||||||||
Cost of risk (%) | 1.89 | 1.44 | ||||||||||||||
| (1) | Figures at constant exchange rates. |
| (2) | Excluding repos. |
| (3) | Excluding repos and including specific marketable debt securities. |
| (4) | Includes mutual funds, pension funds and otheroff-balance sheet funds. |
Table of Contents
| 45 |
SOUTH AMERICA. DATA PER COUNTRY
(MILLIONS OF EUROS)
| Operating income | Net attributable profit | |||||||||||||||||||||||||||||||
Country | 1H19 | D % | D % (1) | 1H18 | 1H19 | D % | D % (1) | 1H18 | ||||||||||||||||||||||||
Argentina | 335 | 174.3 | n.s. | 122 | 110 | n.s. | n.s. | (2 | ) | |||||||||||||||||||||||
Chile | 70 | (68.4 | ) | (67.4 | ) | 221 | 33 | (66.9 | ) | (65.9 | ) | 101 | ||||||||||||||||||||
Colombia | 331 | 3.3 | 7.9 | 320 | 130 | 8.2 | 13.1 | 120 | ||||||||||||||||||||||||
Peru | 409 | 19.0 | 13.6 | 344 | 98 | 17.9 | 12.6 | 83 | ||||||||||||||||||||||||
Other countries(2) | 70 | (0.7 | ) | 3.4 | 71 | 33 | 10.2 | 16.7 | 30 | |||||||||||||||||||||||
Total | 1,215 | 12.7 | 22.2 | 1,078 | 404 | 21.9 | 35.7 | 332 | ||||||||||||||||||||||||
| (1) | Figures at constant exchange rates. |
| (2) | Venezuela, Paraguay, Uruguay and Bolivia. Additionally, it includes eliminations and other charges. |
SOUTH AMERICA. RELEVANT BUSINESS INDICATORS PER COUNTRY
(MILLIONS OF EUROS)
| Argentina | Chile | Colombia | Peru | |||||||||||||||||||||||||||||
| 30-06-19 | 31-12-18 | 30-06-19 | 31-12-18 | 30-06-19 | 31-12-18 | 30-06-19 | 31-12-18 | |||||||||||||||||||||||||
Performing loans and advances to customers under management(1)(2) | 3,891 | 3,748 | 2,067 | 2,103 | 12,252 | 12,183 | 14,332 | 13,786 | ||||||||||||||||||||||||
Non-performing loans and guarantees given(1) | 114 | 77 | 64 | 60 | 753 | 791 | 781 | 732 | ||||||||||||||||||||||||
Customer deposits under management(1)(3) | 5,840 | 5,315 | 7 | 10 | 12,726 | 12,912 | 13,808 | 13,261 | ||||||||||||||||||||||||
Off-balance sheet funds(1)(4) | 1,043 | 695 | — | — | 1,431 | 1,325 | 1,686 | 1,720 | ||||||||||||||||||||||||
Risk-weighted assets | 6,435 | 8,036 | 2,268 | 2,243 | 13,778 | 12,680 | 17,715 | 15,739 | ||||||||||||||||||||||||
Efficiency ratio (%) | 41.8 | 73.7 | 32.5 | 42.1 | 35.3 | 37.1 | 35.4 | 36.0 | ||||||||||||||||||||||||
NPL ratio (%) | 2.8 | 2.0 | 3.0 | 2.8 | 5.6 | 6.0 | 4.1 | 4.0 | ||||||||||||||||||||||||
NPL coverage ratio (%) | 104 | 111 | 93 | 93 | 97 | 100 | 95 | 93 | ||||||||||||||||||||||||
Cost of risk (%) | 3.00 | 1.60 | 2.25 | 0.81 | 1.87 | 2.16 | 1.64 | 0.98 | ||||||||||||||||||||||||
| (1) | Figures at constant exchange rates. |
| (2) | Excluding repos. |
| (3) | Excluding repos and including specific marketable debt securities. |
| (4) | Includes mutual funds, pension funds and otheroff-balance sheet funds. |
Activity and results
Unless expressly stated otherwise, all the comments below on rates of change, for both activity and results, will be given at constant exchange rates. These rates, together with changes at current exchange rates, can be found in the attached tables of financial statements and relevant business indicators. In addition, the quarterly variations are from the quarter ending with respect to the previous quarter.
The most relevant aspects related to the area’s activity in the first half of 2019 were:
| • | Lending activity (performing loans under management), increased by 2.3% compared to the end of 2018. Credit cards and corporate lending performed particularly well. |
| • | Inasset quality, the NPL ratio stood at 4.4% as of June 30, 2019, slightly higher that at December 31, 2018; the coverage ratio stood at 95%, marginally lower than at the end of the previous year. |
| • | In terms of customerfunds, deposits increased by 3.2% in the first half of the year, driven mainly by time deposits,off-balance sheet funds grew by 7.4% in the same period. |
Table of Contents
| 46 |
With respect to results, South America generated a cumulative net attributableprofit of €404m in the first half of 2019, representing ayear-on-year increase of 35.7% (21.9% at current exchange rates). As in the previous quarter, this performance was affected by the negative impact of inflation in Argentina on the area’s net attributable profit (-€94m). The most relevant aspects of the income statement in the first half of the year were:
| • | Continued growth of recurring income (10.0%, 2.0% at current exchange rates), especially due to the contribution ofnet interest income (12.1%, 3.9% at current exchange rates). |
| • | Net fees and commissions remained stable(-6.9% at current exchange rates) compared to the same period last year. |
| • | Increased requirements due to theimpairment on financial assets (up 13.8%, up 9.0% at current exchange rates), bringing the cumulative cost of risk to 1.89% at the end of June 2019. |
| • | Lowerprovisions (net) and other gains (losses) than in the same period of the previous year (down 33.9%, down 43.6% at current exchange rates). |
On n homogeneous comparison, i.e. excluding BBVA Chile due to the sale completed in July 2018, net attributable profit grew by 51.8%year-on-year in the first half of 2019 at current exchange rates (up 72.4% at constant exchange rates).
The most significant countries in the business area, Argentina, Colombia and Peru, performed as follows in the first half of 2019 in terms of activity and results:
Argentina
| • | Lending activity grew by 3.8% in the first half of 2019, driven by retail consumer portfolios, mortgages and credit cards. Regarding asset quality, there was an increase in the NPL ratio, which stood at 2.8% as of June 30, 2019, although it continued to compare favorably with the system. |
| • | Customerdeposits increased by 9.9%, whileoff-balance sheet funds increased by 50.0%, both with respect to December 2018 figures. |
| • | Net attributable profit stood at €110m, supported by the strong performance of recurring revenue items (driven by |
an increased contribution from securities portfolios and a better customer spread) as well as an increase in NTI, positively impacted by the sale of the holding in Prisma Medios de Pago S.A. in the first quarter of 2019. This strong performance was partially offset by increased operating expenses, significantly influenced by high levels of inflation and greater requirements due to impairment on financial assets as a result of the country’s macroeconomic situation. |
Colombia
| • | Lending activity grew by 0.6% in the first six months of the year, driven by the performance of retail portfolios (mainly mortgages and credit cards). In terms of asset quality, the NPL ratio decreased in the first half of the year, reaching 5.6%. |
| • | Deposits from customers declined by 1.4% compared to the end of 2018, although they increased 1.3%year-on-year. |
| • | Net attributable profit stood at €130m, increasing by 13.1%year-on-year, driven by the strong performance of net interest income (3.8%), due to higher business volumes, solid management of customer spreads, and a stable level of impairments on financial asset (0.3%). |
Peru
| • | Lending activity grew by 4.0% compared to the end of 2018, explained by the positive performance of both, the retail o (consumer loans, credit cards and mortgages) and the wholesale portfolios; on ayear-on-year basis, the lending activity increased by 6.3%. Regarding asset quality, there was a slight increase in the NPL ratio to 4.1% and in the coverage ratio to 95%. |
| • | Customers deposits increased by 4.1% in the first half of 2019 (up 12.2%year-on-year), supported by time deposits (up 20.9% in the first half of the year). |
| • | Strong performance of net interest income, which grew by 13.7%year-on-yeardue to higher business volumes. NTI also grew by 11.4%year-on-year, influenced by positive performance in foreign exchange transactions. As a result, net attributableprofit stood at €98 million, an increase of 12.6%year-on-year. |
Table of Contents
| 47 |
Highlights
| • | Good performance in lending. |
| • | Positive trend of net interest income, in an environment of negative interest rates. |
| • | Moderated growth of the operating expenses. |
| • | Improvement of asset quality indicators. |
FINANCIAL STATEMENTS AND RELEVANT BUSINESS INDICATORS(MILLIONS OF EUROS AND PERCENTAGE)
Income statement | 1H19 | D % | 1H18 | |||||||||
Net interest income | 84 | 2.2 | 83 | |||||||||
Net fees and commissions | 69 | (12.7 | ) | 79 | ||||||||
Net trading income | 60 | 10.2 | 55 | |||||||||
Other operating income and expenses | 6 | n.s. | (0 | ) | ||||||||
Gross income | 220 | 1.4 | 217 | |||||||||
Operating expenses | (142 | ) | 1.3 | (140 | ) | |||||||
Personnel expenses | (69 | ) | 3.3 | (67 | ) | |||||||
Other administrative expenses | (64 | ) | (8.4 | ) | (70 | ) | ||||||
Depreciation | (9 | ) | 183.9 | (3 | ) | |||||||
Operating income | 78 | 1.5 | 77 | |||||||||
Impairment on financial assets not measured at fair value through profit or loss | (11 | ) | n.s. | 14 | ||||||||
Provisions or reversal of provisions and other results | 1 | (41.4 | ) | 2 | ||||||||
Profit/(loss) before tax | 69 | (26.1 | ) | 93 | ||||||||
Income tax | (13 | ) | (59.3 | ) | (33 | ) | ||||||
Profit/(loss) for the year | 55 | (8.0 | ) | 60 | ||||||||
Non-controlling interests | — | — | — | |||||||||
Net attributable profit | 55 | (8.0 | ) | 60 | ||||||||
Balance sheets | 30-06-19 | D % | 31-12-18 | |||||||||
Cash, cash balances at central banks and other demand deposits | 217 | (9.0 | ) | 238 | ||||||||
Financial assets designated at fair value | 511 | 1.3 | 504 | |||||||||
Of which: Loans and advances | — | — | — | |||||||||
Financial assets at amortized cost | 19,144 | 7.6 | 17,799 | |||||||||
Of which: Loans and advances to customers | 17,552 | 5.7 | 16,598 | |||||||||
Inter-area positions | — | — | — | |||||||||
Tangible assets | 94 | 137.8 | 39 | |||||||||
Other assets | 244 | (4.2 | ) | 254 | ||||||||
|
|
|
|
|
| |||||||
Total assets/liabilities and equity | 20,209 | 7.3 | 18,834 | |||||||||
|
|
|
|
|
| |||||||
Financial liabilities held for trading and designated at fair value through profit or loss | 43 | 2.9 | 42 | |||||||||
Deposits from central banks and credit institutions | 879 | (30.9 | ) | 1,271 | ||||||||
Deposits from customers | 4,294 | (11.9 | ) | 4,876 | ||||||||
Debt certificates | 985 | n.s. | 213 | |||||||||
Inter-area positions | 12,660 | 11.0 | 11,406 | |||||||||
Other liabilities | 532 | �� | 97.2 | 270 | ||||||||
Economic capital allocated | 817 | 7.9 | 757 | |||||||||
Table of Contents
| 48 |
Relevant business indicators | 30-06-19 | D % | 31-12-18 | |||||||||
Performing loans and advances to customers under management(1) | 17,542 | 6.0 | 16,553 | |||||||||
Non-performing loans | 365 | (15.1 | ) | 430 | ||||||||
Customer deposits under management(1) | 4,294 | (11.9 | ) | 4,876 | ||||||||
Off-balance sheet funds(2) | 454 | 17.2 | 388 | |||||||||
Risk-weighted assets | 16,405 | 6.0 | 15,476 | |||||||||
Efficiency ratio (%) | 64.5 | 69.3 | ||||||||||
NPL ratio (%) | 1.4 | 1.7 | ||||||||||
NPL coverage ratio (%) | 98 | 83 | ||||||||||
Cost of risk (%) | 0.12 | (0.11 | ) | |||||||||
| (1) | Excluding repos. |
| (2) | Includes mutual funds, pension funds and otheroff-balance sheet funds. |
Activity and results
The most relevant aspects of the activity and results in the area during the first half of 2019 were:
| • | Lendingactivity (performing loans under management) recorded an increase of 6.0% in the first half of 2019 (up 5.5%year-on-year), thanks, above all, to the good performance in Asia. |
| • | Credit risk indicators improved in the first six months of the year: the NPL ratio closed at 1.4% and the NPL coverage ratio at 98% (1.7% and 83%, respectively at the end of December 2018). |
| • | Customerdeposits under management fell by 9.9% in the first half of 2019, affected by the negative interest rate environment in Europe. |
| • | Regardingresults, net interest income (up 2.2%year-on-year) and NTI (up 10.2%year-on-year) performed strongly, thanks to the contribution of commercial activity in the Global Markets unit, partially offset by a reduction innet fees and commissions.Operating expenses showed a moderate growth due to the continuous management of discretionary spending. Theimpairment on financial assets line showed an increase compared to the first six months of the previous year. The comparison is affected by the release of provisions in the first half of 2018, due to lower loan-loss provision requirements in Europe. As a result, the area’s cumulativenet attributable profit for the first half of 2019 was €55m (down 8.0%year-on-year). |
Table of Contents
| 49 |
FINANCIAL STATEMENTS
(MILLIONS OF EUROS AND PERCENTAGE)
Income statement | 1H19 | D % | 1H18 | |||||||||
Net interest income | (132 | ) | (4.1 | ) | (137 | ) | ||||||
Net fees and commissions | (44 | ) | 36.6 | (32 | ) | |||||||
Net trading income | (74 | ) | 27.8 | (58 | ) | |||||||
Other operating income and expenses | 13 | (65.7 | ) | 39 | ||||||||
Gross income | (236 | ) | 25.4 | (188 | ) | |||||||
Operating expenses | (482 | ) | 11.3 | (433 | ) | |||||||
Personnel expenses | (280 | ) | 10.4 | (254 | ) | |||||||
Other administrative expenses | (111 | ) | 50.2 | (74 | ) | |||||||
Depreciation | (91 | ) | (13.6 | ) | (105 | ) | ||||||
Operating income | (718 | ) | 15.6 | (621 | ) | |||||||
Impairment on financial assets not measured at fair value through profit or loss | — | — | — | |||||||||
Provisions or reversal of provisions and other results | (44 | ) | (43.3 | ) | (77 | ) | ||||||
Profit/(loss) before tax | (762 | ) | 9.1 | (698 | ) | |||||||
Income tax | 156 | 3.9 | 150 | |||||||||
Profit/(loss) after tax from ongoing operations | (606 | ) | 10.6 | (548 | ) | |||||||
Results from corporate operations | — | — | — | |||||||||
Profit/(loss) for the year | (606 | ) | 10.6 | (548 | ) | |||||||
Non-controlling interests | (10 | ) | 2.4 | (10 | ) | |||||||
Net attributable profit | (616 | ) | 10.4 | (558 | ) | |||||||
Net attributable profit excluding results from corporate operations | (616 | ) | 10.4 | (558 | ) | |||||||
Balance sheets | 30-06-19 | D % | 31-12-18 | |||||||||
Cash, cash balances at central banks and other demand deposits | 933 | 27.4 | 732 | |||||||||
Financial assets designated at fair value | 2,615 | (4.5 | ) | 2,738 | ||||||||
Of which: Loans and advances | — | — | — | |||||||||
Financial assets at amortized cost | 2,034 | (23.7 | ) | 2,665 | ||||||||
Of which: Loans and advances to customers | 349 | (64.8 | ) | 990 | ||||||||
Inter-area positions | (18,794 | ) | 34.0 | (14,026 | ) | |||||||
Tangible assets | 2,232 | 41.9 | 1,573 | |||||||||
Other assets | 21,546 | (4.7 | ) | 22,598 | ||||||||
|
|
|
|
|
| |||||||
Total assets/liabilities and equity | 10,567 | (35.1 | ) | 16,281 | ||||||||
|
|
|
|
|
| |||||||
Financial liabilities held for trading and designated at fair value through profit or loss | 16 | (60.3 | ) | 39 | ||||||||
Deposits from central banks and credit institutions | 874 | 19.2 | 733 | |||||||||
Deposits from customers | 302 | n.s. | 36 | |||||||||
Debt certificates | 6,945 | (15.4 | ) | 8,212 | ||||||||
Inter-area positions | (28,822 | ) | 26.4 | (22,808 | ) | |||||||
Other liabilities | 197 | (90.0 | ) | 1,975 | ||||||||
Economic capital allocated | (22,442 | ) | 2.8 | (21,833 | ) | |||||||
Shareholders’ funds | 53,496 | 7.1 | 49,927 | |||||||||
Table of Contents
| 50 |
The Corporate Center registered a net attributableloss of €616m in the first half of 2019, compared to the loss of €558m in the same period of 2018 (up 10.4%). The most relevant results in the first half of the year were:
| • | Negative contribution fromNTI, mainly due to the solid performance of the Mexican peso, since this line includes results related to exchange rate hedges of the year’s results and those from operations with industrial and financial holdings |
| • | Other income/expensesmainly includes the dividends of Telefónica, S.A. and the earnings of the companies accounted for the equity method, including certain investments in companies in the real estate sector. |
| • | Operating expenses include those expenses for central functions that are of corporate nature; the year-on- year increase is related to data and cybersecurity costs. |
| • | Provisions (net) and other gains (losses) decreased 43.3%year-on-year, and includes various expenses such as the Group’s pension contributions and restructuring costs, etc. |
Table of Contents
| 51 |
Other information: Corporate & Investment Banking
Highlights
| • | Leadership position in green and sustainable loans. |
| • | Good performance of net interest income. |
| • | Net attributable profit impacted by lower net trading income and higher impairments on financial assets. |
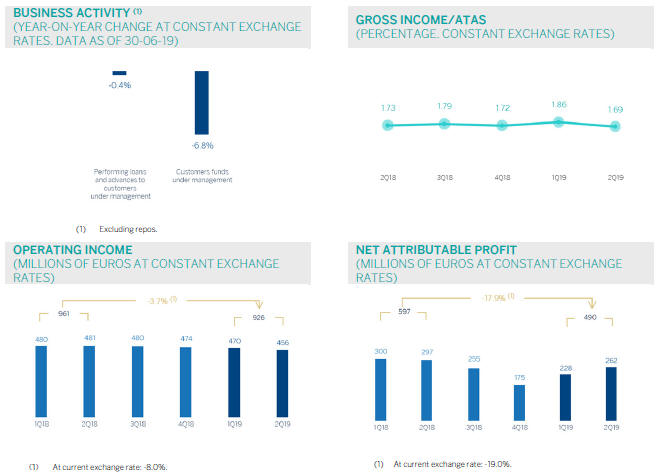
Table of Contents
| 52 |
FINANCIAL STATEMENTS AND RELEVANT BUSINESS INDICATORS
(MILLIONS OF EUROS AND PERCENTAGE)
Income statement | 1H19 | D % | D % (1) | 1H18 | ||||||||||||
Net interest income | 769 | 14.9 | 20.1 | 669 | ||||||||||||
Net fees and commissions | 344 | (8.8 | ) | (7.1 | ) | 377 | ||||||||||
Net trading income | 365 | (27.0 | ) | (25.0 | ) | 500 | ||||||||||
Other operating income and expenses | (27 | ) | 46.5 | 38.7 | (18 | ) | ||||||||||
Gross income | 1,451 | (5.1 | ) | (1.8 | ) | 1,528 | ||||||||||
Operating expenses | (525 | ) | 0.7 | 1.7 | (522 | ) | ||||||||||
Personnel expenses | (236 | ) | 3.6 | 4.1 | (228 | ) | ||||||||||
Other administrative expenses | (226 | ) | (5.7 | ) | (3.9 | ) | (239 | ) | ||||||||
Depreciation | (64 | ) | 16.4 | 15.8 | (55 | ) | ||||||||||
Operating income | 926 | (8.0 | ) | (3.7 | ) | 1,007 | ||||||||||
Impairment on financial assets not measured at fair value through profit or loss | (77 | ) | n.s. | n.s. | 9 | |||||||||||
Provisions or reversal of provisions and other results | 17 | n.s. | n.s. | (21 | ) | |||||||||||
Profit/(loss) before tax | 866 | (12.9 | ) | (10.0 | ) | 994 | ||||||||||
Income tax | (211 | ) | (19.8 | ) | (17.6 | ) | (263 | ) | ||||||||
Profit/(loss) for the year | 655 | (10.4 | ) | (7.3 | ) | 732 | ||||||||||
Non-controlling interests | (166 | ) | 30.7 | 50.3 | (127 | ) | ||||||||||
Net attributable profit | 490 | (19.0 | ) | (17.9 | ) | 605 | ||||||||||
| (1) | Figures at constant exchange rates. |
Balance sheets | 30-06-19 | D % | D % (1) | 31-12-18 | ||||||||||||
Cash, cash balances at central banks and other demand deposits | 4,841 | (4.8 | ) | (5.4 | ) | 5,087 | ||||||||||
Financial assets designated at fair value | 108,378 | 17.3 | 16.8 | 92,391 | ||||||||||||
Of which: Loans and advances | 37,486 | 30.0 | 30.0 | 28,826 | ||||||||||||
Financial assets at amortized cost | 67,297 | 3.3 | 3.8 | 65,167 | ||||||||||||
Of which: Loans and advances to customers | 58,069 | (1.1 | ) | (0.6 | ) | 58,720 | ||||||||||
Inter-area positions | — | — | — | — | ||||||||||||
Tangible assets | 75 | 161.0 | 161.7 | 29 | ||||||||||||
Other assets | 1,889 | (13.3 | ) | (15.3 | ) | 2,179 | ||||||||||
Total assets/liabilities and equity | 182,481 | 10.7 | 10.6 | 164,852 | ||||||||||||
Financial liabilities held for trading and designated at fair value through profit or loss | 94,045 | 28.5 | 28.4 | 73,163 | ||||||||||||
Deposits from central banks and credit institutions | 16,398 | (15.8 | ) | (16.5 | ) | 19,464 | ||||||||||
Deposits from customers | 33,970 | (21.1 | ) | (21.2 | ) | 43,069 | ||||||||||
Debt certificates | 2,986 | 54.6 | 54.0 | 1,931 | ||||||||||||
Inter-area positions | 27,298 | 38.3 | 39.6 | 19,742 | ||||||||||||
Other liabilities | 4,097 | (5.8 | ) | (6.5 | ) | 4,348 | ||||||||||
Economic capital allocated | 3,687 | 17.6 | 16.8 | 3,136 | ||||||||||||
| (1) | Figures at constant exchange rates. |
Relevant business indicators | 30-06-19 | D % | D % (1) | 31-12-18 | ||||||||||||
Performing loans and advances to customers under management(2) | 57,289 | (2.6 | ) | (2.1 | ) | 58,796 | ||||||||||
Non-performing loans | 1,107 | 45.3 | 49.0 | 762 | ||||||||||||
Customer deposits under management(2) | 33,945 | (14.4 | ) | (14.2 | ) | 39,642 | ||||||||||
Off-balance sheet funds(3) | 1,306 | 31.6 | 31.4 | 993 | ||||||||||||
Efficiency ratio (%) | 36 | 34 | ||||||||||||||
| (1) | Figures at constant exchange rates. |
| (2) | Excluding repos. |
| (3) | Includes mutual funds, pension funds and otheroff-balance sheet funds. |
Table of Contents
| 53 |
Activity
Unless expressly stated otherwise, all the comments below onrates of change, for both activity and results, will be given at constant exchange rates. These rates, together with changes at current exchange rates, can be found in the attached tables of financial statements and relevant business indicators. In addition, the quarterly variations are from the quarter ending with respect to the previous quarter.
The most relevant aspects of the evolution of the area’s activity in the first half of 2019 were:
| • | Margin pressure and excess liquidity in the market persists.Lending activity (performing loans under management) fell by 2.1% compared to the end of December 2018 and remained flatyear-on-year (down 0.4%). |
| • | Customer fundsfell 13.1% in the first half of 2019 (down 6.8%year-on-year), mainly due to the decline in time deposits. |
| • | During the first half of 2019, BBVA was one of the most active financial institutions in sustainability and digitalization, two processes that the Bank wants to continue to promote together with its customers. |
| • | Insustainable finance, the Bank was involved in 19 green transactions and/or transactions linked to a sustainability criteria (ESG scores, environmental and social indicators), certified by renowned independent consultants, compared to a total of 23 transactions in the whole of 2018. In addition to Spain, where a second green bond was issued, BBVA led major transactions in the United Kingdom, France, Portugal, Belgium and China in various sectors including hotelier, energy (gas and electricity), recycling and automotive components, among others. Of these 19 transactions, 11 were led by BBVA as a sustainability coordinator. |
| • | In terms of innovation, following the recognition of financing via blockchain in 2018, BBVA was a pioneer in linking a company’s degree of digitization to its bank financing with theso-calleddigital loan orD-loan. The syndicated loan, placed in Asia and led by BBVA, is the first of its kind worldwide, and demonstrates that the Bank remains at the forefront of innovative solutions for its customers. |
Results
CIB registerednet attributableprofitof €490m in the first half of 2019, down 17.9%year-on-year. The most relevant aspects of theyear-on-year changes in the income statement for Corporate & Investment Banking are summarized below:
| • | Net interest income increased (up 20.1%year-on-year) as a result of a strong performance in all geographic areas (especially Spain, Rest of Eurasia, Turkey and South America). |
| • | Netfees and commissions continued to fall due to a decreasing number ofone-off transactions (down 7.1%year-on-year, up 3.1% compared to the first quarter of 2019). |
| • | NTI decreased by 25.0%year-on-year, mainly in Spain, due to the fall in interest rates to record lows, which was partially offset by the strong performance in South America and, to a lesser extent, Turkey thanks to a very positive first quarter. |
| • | As a result,gross income fell slightly in the first half of 2019 (down 1.8%year-on-year, down 1.6% in the quarter). |
| • | Efficient management ofoperating expenses, which increased by 1.7%year-on-year (up 0.7% compared to the first quarter of 2019) associated, in part, with investment in various technology projects. |
| • | Impairment on financial assets increased, mainly due to higher loan-loss provisions from specific customers in Spain, Eurasia, the United States and South America, which was partially offset by lower provisions in Mexico and Turkey. |
Table of Contents
SIGNATURE
Pursuant to the requirements of the Securities Exchange Act of 1934, the registrant has duly caused this report to be signed on its behalf by the undersigned, thereunto duly authorized.
| Banco Bilbao Vizcaya Argentaria, S.A. | ||||||
| Date: July 31, 2019 | By: | /s/ María Ángeles Peláez Morón | ||||
| Name: María Ángeles Peláez Morón | ||||||
| Title: Authorized representative | ||||||