Table of Contents
UNITED STATES SECURITIES AND EXCHANGE
COMMISSION
WASHINGTON, D.C. 20549
FORM 6-K
REPORT OF FOREIGN ISSUER PURSUANT TO RULE 13a-16 OR 15d-16
UNDER THE SECURITIES EXCHANGE ACT OF 1934
For the month of April, 2020
Commission file number: 1-10110
BANCO BILBAO VIZCAYA ARGENTARIA, S.A.
(Exact name of Registrant as specified in its charter)
BANK BILBAO VIZCAYA ARGENTARIA, S.A.
(Translation of Registrant’s name into English)
Calle Azul 4,
28050 Madrid
Spain
(Address of principal executive offices)
Indicate by check mark whether the registrant files or will file annual reports under cover of Form 20-F or Form 40-F:
| Form 20-F | ☒ | Form 40-F | ☐ |
Indicate by check mark if the registrant is submitting the Form 6-K in paper as permitted by Regulation S-T Rule 101(b)(1):
|
| Yes | ☐ | No | ☒ |
Indicate by check mark if the registrant is submitting the Form 6-K in paper as permitted by Regulation S-T Rule 101(b)(7):
|
| Yes | ☐ | No | ☒ |
Table of Contents

Table of Contents
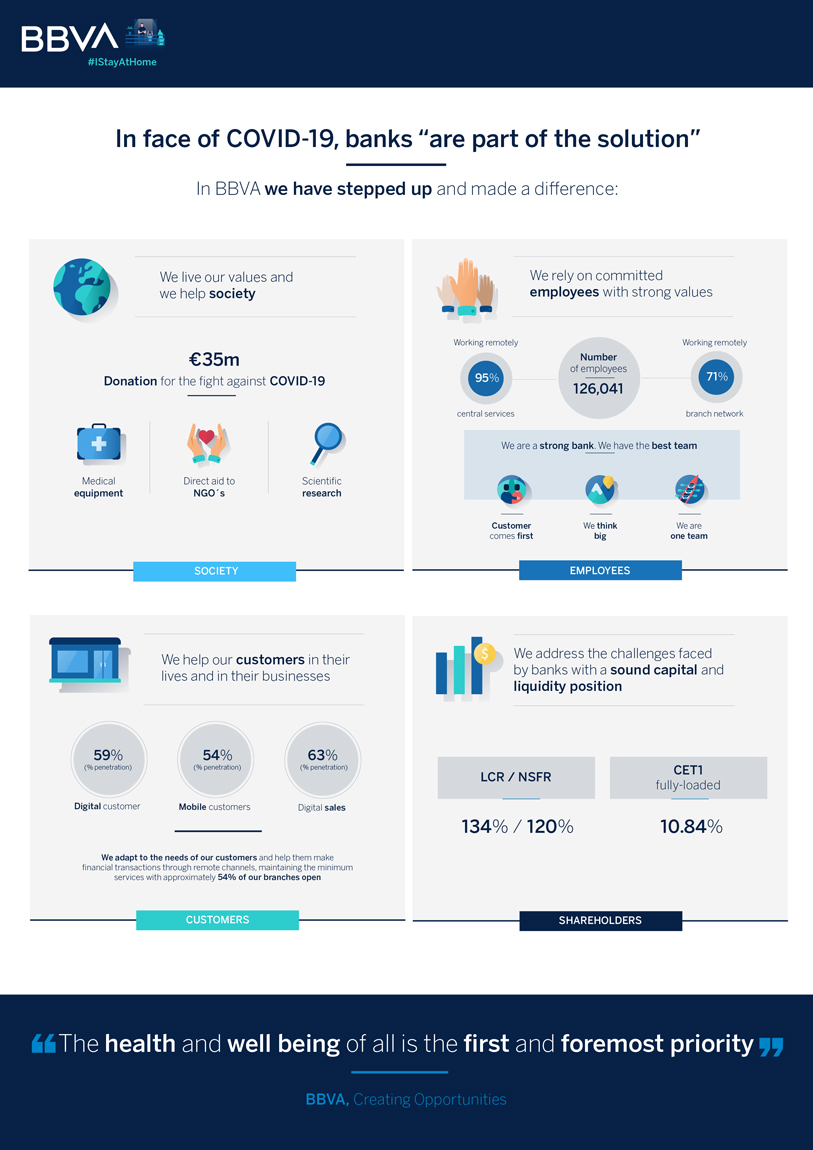
Table of Contents
| 2 | ||||
| 3 | ||||
| 6 | ||||
| 6 | ||||
| 9 | ||||
| 14 | ||||
| 16 | ||||
| 19 | ||||
| 24 | ||||
| 25 | ||||
| 28 | ||||
| 31 | ||||
| 34 | ||||
| 37 | ||||
| 40 | ||||
| 44 | ||||
| 46 | ||||
| 48 | ||||
Table of Contents
| 2 |
BBVA GROUP HIGHLIGHTS
(CONSOLIDATED FIGURES)
| 31-03-20 | r% | 31-03-19 | 31-12-19 | |||||||||||||
Balance sheet (millions of euros) | ||||||||||||||||
Total assets | 730,923 | 5.7 | 691,200 | 698,690 | ||||||||||||
Loans and advances to customers (gross) | 395,911 | 0.7 | 393,321 | 394,763 | ||||||||||||
Deposits from customers | 385,050 | 1.7 | 378,527 | 384,219 | ||||||||||||
Total customer funds | 481,488 | (0.0 | ) | 481,717 | 492,022 | |||||||||||
Total equity | 49,174 | (8.2 | ) | 53,547 | 54,925 | |||||||||||
Income statement (millions of euros) | ||||||||||||||||
Net interest income | 4,556 | 3.6 | 4,398 | 18,124 | ||||||||||||
Gross income | 6,484 | 7.2 | 6,046 | 24,463 | ||||||||||||
Operating income | 3,566 | 14.1 | 3,124 | 12,561 | ||||||||||||
Net attributable profit | (1,792 | ) | n.s. | 1,182 | 3,512 | |||||||||||
Adjusted net attributable profit(1) | 292 | (75.3 | ) | 1,182 | 4,830 | |||||||||||
The BBVA share and share performance ratios | ||||||||||||||||
Number of shares (million) | 6,668 | — | 6,668 | 6,668 | ||||||||||||
Share price (euros) | 2.92 | (42.8 | ) | 5.09 | 4.98 | |||||||||||
Earning per share (euros)(2) | (0.29 | ) | n.s. | 0.16 | 0.47 | |||||||||||
Adjusted earning per share (euros)(1)(2) | 0.03 | (83.4 | ) | 0.16 | 0.66 | |||||||||||
Book value per share (euros) | 6.49 | (9.9 | ) | 7.20 | 7.32 | |||||||||||
Tangible book value per share (euros) | 5.78 | (2.7 | ) | 5.94 | 6.27 | |||||||||||
Market capitalization (millions of euros) | 19,440 | (42.8 | ) | 33,960 | 33,226 | |||||||||||
Yield (dividend/price; %)(3) | 8.9 | 4.9 | 5.2 | |||||||||||||
Significant ratios (%) | ||||||||||||||||
ROE (net attributable profit/average shareholders’ funds +/- average accumulated other comprehensive income) (1) | 2.4 | 10.0 | 9.9 | |||||||||||||
ROTE (net attributable profit/average shareholders’ funds excluding average intangible assets +/- average accumulated other comprehensive income) (1) | 2.8 | 12.1 | 11.9 | |||||||||||||
ROA (Profit or loss for the year/average total assets) (1) | 0.26 | 0.85 | 0.82 | |||||||||||||
RORWA (Profit or loss for the year/average risk-weighted assets - RWA) (1) | 0.50 | 1.62 | 1.57 | |||||||||||||
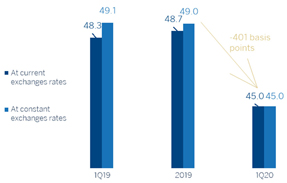
Efficiency ratio | 45.0 | 48.3 | 48.7 | |||||||||||||
Cost of risk | 2.57 | 1.03 | 1.02 | |||||||||||||
NPL ratio | 3.6 | 3.9 | 3.8 | |||||||||||||
NPL coverage ratio | 86 | 74 | 77 | |||||||||||||
Capital adequacy ratios (%) | ||||||||||||||||
CET1 fully-loaded(4) | 10.84 | 11.35 | 11.74 | |||||||||||||
CET1phased-in(5) | 11.08 | 11.58 | 11.98 | |||||||||||||
Total ratiophased-in(5) | 15.39 | 15.19 | 15.92 | |||||||||||||
Other information | ||||||||||||||||
Number of clients (million) | 78.5 | 3.8 | 75.6 | 77.9 | ||||||||||||
Number of shareholders | 876,785 | (1.7 | ) | 892,316 | 874,148 | |||||||||||
Number of employees | 126,041 | 0.2 | 125,749 | 126,973 | ||||||||||||
Number of branches | 7,694 | (1.9 | ) | 7,844 | 7,744 | |||||||||||
Number of ATMs | 32,275 | (0.8 | ) | 32,528 | 32,658 | |||||||||||
General note: as a result of the decision taken by the International Financial Reporting Standards Interpretations Committee (IFRIC) regarding the collecting of interests ofwritten-off financial assets for the purpose of IFRS 9, those collections are presented as reduction of the credit allowances and not as a higher interest income, recognition method applied until December 2019. Therefore, and in order to make the information comparable, the quarterly information of the 2019 income statements has been restated.
| (1) | Excluding the goodwill impairment in the United States as of31-03-2020 and31-12-2019, for an amount of 2,084 and 1,318 millions of euros, respectively. |
| (2) | Adjusted by additional Tier 1 instrument remuneration. |
| (3) | Calculated by dividing shareholder remuneration over the last twelve months by the closing price of the period. |
| (4) | As of March 31, 2020 the fully-loaded capital ratios include the positive impact of +2 basis points due the reduction of the limit of share buybacks which is pending to be approved by the ECB. |
| (5) | Phased-in ratios include the temporary treatment on the impact of IFRS 9, calculated in accordance with Article 473 bis of the Capital Requirements Regulation (CRR). |
Table of Contents
| 3 |
Results
| • | Good performance ofgross income, withyear-on-year growth in all its components:recurring income (net interest income and fees and commissions), which grew in most geographical areas, net trading income (NTI), and theother operating income and expensesline. |
| • | Operating expenses closed in line with the same quarter of the previous year. |
| • | As a result of the above, theefficiency ratio improved. |
| • | Impairment on financial assets increased mainly due to the deterioration of the macroeconomic scenario resulting mostly from the impacts ofCOVID-19, which have amounted to €-1,433m at the Group level. |
| • | As a result of the valuation of thegoodwill of its subsidiaries, the Group has estimated that there is animpairment in the United States which has been recorded in the line item “Other results” of the Consolidated income statement as of March 31, 2020. This impairment represents an impact of €-2,084m in the net attributable profit and is mainly due to the negative impact of the update of the macroeconomic scenario affected by theCOVID-19 pandemic. This impact does not affect the tangible net equity, the capital, or the liquidity of BBVA Group and is included in the line item other gains (losses) of the income statement of the Corporate Center. |
| • | Finally, thenet attributable loss stood at €-1,792m. If the goodwill impairment in the United States is excluded from theyear-on-year comparison, the Group’s net attributable profit decreased 75.3% compared to the first quarter of 2019 and stood at €292m. |
NET ATTRIBUTABLE PROFIT (MILLIONS OF EUROS) |
 |
(1) Excluding the goodwill impairment in the United States. |
Balance sheet and business activity
| • | The figure forloans and advances to customers (gross) remained stable compared to December 2019 (up 0.3%), with increases in the commercial portfolio which offsets the deleveraging in the rest of the portfolios. |
| • | Customer funds fell in the quarter (down 2.1%) as a result of the negative impact on mutual and pension funds due to the market instability caused byCOVID-19. |
Liquidity
| • | The availability of ampleliquidity buffers in each of the geographical areas in which the BBVA Group operates and their management have allowed internal and regulatory ratios to remain comfortably above the minimum levels required. |
Table of Contents
| 4 |
Solvency
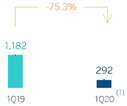
| • | The BBVA Group has set the objective to maintain a buffer on its CET1 capital ratio requirement (currently, at 8.59%) between 225 and 275 basis points. As of March 31, 2020, the CET1 fully-loaded ratio stood at 10.84%. |
CAPITAL AND LEVERAGE RATIOS AND COST OF RISK (PERCENTAGE AS OF31-03-20) |
 |
Risk management
| • | The calculation of theexpected credit losses at the end of March includes the update of the forward looking information in the models under IFRS 9 in order to reflect the circumstances created by theCOVID-19 pandemic in the macroeconomic environment, which is characterized by a high degree of uncertainty regarding its intensity and duration. |
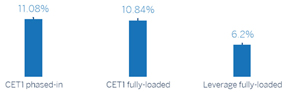
NPL AND NPL COVERAGE RATIOS AND COST OF RISK (PERCENTAGE) |
 |
Dividend
| • | On April 9, a cash payment was made for the supplementary dividend for the 2019 financial year for a gross amount of €0.16 per share, in line with that approved at the General Shareholders’ Meeting held on March 13. Thus, thetotal dividend for the 2019 financial year amounts to €0.26 gross per share. |
Bancassurance agreement
| • | On April 27, 2020, BBVA reached an agreement withAllianz, Compañía de Seguros y Reaseguros, S.A. in order to create a bancassurance partnership, for the purpose of developing thenon-life insurance business in Spain, excluding the health insurance line, by establishing a newly-incorporated insurance company. On the closing date of the transaction, BBVA Seguros will transfer 50% plus one share of this new company to Allianz for an initial fixed price of approximately €277m, which will be adjusted based on the variation in the company’s shareholders equity between signing and closing date. Excluding a variable part of the price (up to €100m related to achieving specific business goals and certain milestones), it is estimated that the transaction will generate a profit net of taxes amounting to approximately €300m, and that the positive impact on the fully-loaded CET1 capital ratio of the BBVA Group will be approximately 7 basis points. The closing of the transaction is subject to obtaining the required regulatory authorizations. |
Table of Contents
| 5 |
Security, business continuity and support measures taken by BBVA
In response to theCOVID-19 pandemic, BBVA has focused on guaranteeing the security and the continuity of the business operations as a priority, and on closely monitoring the impact on the Group’s business and risks. Additionally, BBVA adopted from the outset a number of measures to support its main stakeholders, acting with the utmost responsibility and taking a step forward. The mainbusiness continuity measures taken are:
| • | In order to servecustomers, and since financial services are legally considered an essential service in most of the countries where the Group operates, thebranch network remains operational, with dynamic management of the network and with information about branches and opening times on the website. In addition, customers are using thedigital channels and their remote agents as the recommended option. BBVA is therefore trying to minimize the number of employees who need to provide services at the branches, trying to limit the risk of contagion as much as possible and protecting the health of its employees, customers and society in general. |
DIGITAL AND MOBILE CUSTOMERS (MILLIONS) |
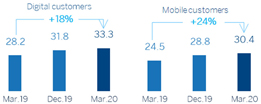 |
| • | Withemployees, the measures established by the health authorities have been implemented, including taking an early stance on promoting working from home. At the beginning of April 2020, the proportion of the Group’s employees working remotely stood at 95% for central service employees and 71% for the branch network. |
Other support and responsibility measures taken are the following:
| • | The banks are a key part of the solution to theCOVID-19 crisis. Specifically, BBVA has activatedsupport initiativeswith a focus on the most affectedcustomers, regardless of whether they are companies, SMEs, self-employed workers or private individuals. The following are just some of those initiatives: |
| o | InSpain, credit facilities for SMEs and self-employed workers of up to €25,000m, deferment of mortgage loan repayments for individuals and self-employed workers, and early payment of pensions, with free cash withdrawals for pensioners at the nearest ATM; |
| o | In theUnited States, flexibility in the repayment of loans for small businesses and for consumer finance, and the removal of certain fees for individual customers; |
| o | InMexico, a repayment deferment of up to four months on various credit products, fixed payment plan to reduce monthly credit card charges and interruption of Point of Sale (POS) fees to support retailers with lower turnover; |
| o | InTurkey, delay of loan repayments, penalty-free interest and repayments for individual customers, and deferment for up to six months of loan capital repayments for companies; |
| o | InSouth America, some countries such as Argentina have provided a credit facility for micro-SMEs to help them purchase remote work equipment; Colombia has frozen repayments for up to six months on loans to individuals and companies, and is offering a special working capital facility for companies; and in Peru, a loan facility has been approved to support SMEs. |
| • | To supportsociety in its fight against theCOVID-19 pandemic, BBVA is committed to making a global donation of €35m to support the health authorities and social organizations and to promote scientific research. |
Pronouncements of regulatory bodies and supervisors
| • | With the aim ofmitigatingthe impact ofCOVID-19, various European and international bodies have made pronouncements aimed at allowing greater flexibility in the implementation of the accounting and prudential frameworks. The BBVA Group has taken these pronouncements into consideration when preparing this report. |
| • | With regard to thepayment of dividends, on March 27 the European Central Bank recommended that credit institutions should refrain from distributing dividends or making irrevocable commitments to distribute them, and from repurchasing shares to remunerate shareholders, until October 1, 2020 at the earliest. Consequently, the Board of Directors of BBVA has agreed to modify, for the financial year 2020, the Group’s shareholder remuneration policy, which was announced through the Relevant Event notification of February 1, 2017, establishing a new policy for 2020 of not making any dividend payment for the 2020 financial year until the uncertainties caused byCOVID-19 are resolved and, in any case, not before the end of the financial year. |
Table of Contents
| 6 |
Global growth slowed throughout 2019 to 3.0%, down from 3.7% in 2018. However, this more stable environment, supported by the counter-cyclical economic policies announced last year and the reduction in trade tensions, has changed since March 2020 as a result of theCOVID-19 pandemic. To contain this health crisis, most countries have put in place strong social distancing measures. At the time of publication of this report, it is unclear how long these will last for and how quickly they will be relaxed. However, they will undoubtedly have a severe impact on activity through the supply, demand and financial channels, despite the economic stimulus measures announced.
Therefore, a severeglobal recession seems inevitable in 2020, although the level ofuncertaintyon around the forecasts is very high. BBVA Research’s baseline scenario works on the assumption that the confinement measures will generally last for about six weeks, and that they will be relaxed slowly to prevent new waves of infections. This will result in a sharp contraction in activity in the first half of 2020 and a rebound in the third quarter, but which will not be sufficient to compensate for the previous decline. The economic policy measures should prevent a deeper recession and support a partial recovery in 2021. However, the forecast is that the global GDP will shrink by about 2.5% in 2020, and that it will rebound to about 5% in 2021, although the risks for these forecasts are on the downside.
In terms ofeconomic policy, the stimuli in the major economies have generally been large and have been adopted relatively quickly. In theUnited States, a significant fiscal package of about 12% of the GDP has been announced to cover health expenditures and mitigate the effects of rising unemployment through financial support to households and businesses. The Federal Reserve (hereafter the Fed), for its part, has cut interest rates by a total of 150 basis points in March to around0%-0.25%, relaunched its program of quantitative easing, and put in place credit and liquidity facilities (up to USD 2.3 trillion, which represents 11% of the GDP).
InEurope, the member states of the European Union (EU) are implementing support packages aimed at guaranteeing credit for businesses, along with discretionary fiscal stimuli as a supplement to the automatic stabilizers. Despite differences between countries, at an aggregate level the fiscal stimulus would account for about 2% of the EU’s GDP, and the liquidity facilities would account for 15%. These national measures are supplemented by the approval of a supranational emergency package of about 4% of the GDP to cover healthcare costs, implement a framework to support employment and increase the funds available from the European Investment Bank to support funding for companies. For its part, the European Central Bank (hereafter the ECB) will make purchases of assets for the value of €1,050 billion (8% of the GDP) until the end of 2020, after approving a new extraordinary program (Pandemic Emergency Purchase Programme or PEPP) of €750 billion and increasing the Expanded Asset Purchase Programme (APP) by €120 billion, which is in addition to the monthly purchases of €20 billion. Moreover, the European monetary authority has adopted temporary measures to support the liquidity of the banks, especially by relaxing the requirements for the collateral accepted in their transactions, and has acted in a coordinated manner with the Fed for the supply of US dollars.
In this context,interest rates will remain low in the major economies for a longer time than previously anticipated, while many emerging countries have recently cut interest rates to mitigate the effects of the pandemic.
As for thebanking system, in an environment where much of the economic activity is paralyzed, banking services are of fundamental importance for three reasons: first, families and businesses need to make payments and authorize charges to maintain activity; second, a new loan or the renewal of a maturing loan can help families and businesses manage the shock to their income. In the current situation, it is very important to ensure that the temporary liquidity problems faced by companies do not become solvency problems, thus jeopardizing their survival and the jobs they create. To this end, the support provided by banks and public guarantees is essential. Third, banking has become the only source of financing for most companies in light of the turbulence on the financial markets.
While inprofitability terms the European and Spanish banks are still far from the levels seen before the financial crisis, due mainly to the low interest rate environment we have been experiencing for some time now, the financial institutions are facing this challenge from a position of financial strength since their solvency has been constantly improving since the 2008 financial crisis, with increased capital and liquidity buffers and therefore a greater capacity to lend.
Spain
In terms ofgrowth, the most recent activity-level data, along with the deterioration of the labor market, indicate that the emergence of the pandemic earlier this year has suspended the signs of stabilization that had led to its GDP growth in 2019, of about 0.4% quarterly, which was above the growth rates in the rest of the Eurozone. To face this situation, the government launched various support measures amongst which the program of credits with public guarantees, the employment protection and the deferment repayment for the most vulnerable ones stand out. The hibernation of the economy following the strong confinement measures adopted inmid-March will result in a sharp reduction in the capacity being utilized by the economy and a fall in demand in the first half of the year. This will be reflected in a fall in the GDP of around 8% in 2020, according to BBVA Research estimates. However, a gradual recovery of the economy is expected in the second half of 2020 following the lifting of the confinement, although some sectors and demand segments, such as construction and tourism,
Table of Contents
| 7 |
may be affected for a longer time. In 2021, the economy is expected to only recover partially growing at a rate of slightly below 5.7%. The uncertainty surrounding the forecasts is high and depends mainly on the evolution of the pandemic, the duration and intensity of the isolation measures, and the effect of the extraordinary economic policy measures being taken.
The United States
TheCOVID-19 outbreak has created a combination of supply and demand shocks that, although transitional, were already having a significant economic impact at the end of the first quarter, with a sharp reduction in utilized capacity and an unprecedented increase in people applying for unemployment benefits. According to BBVA Research forecasts, the GDP will fall by about 4.4% in 2020, before seeing an increase of around 3.4% in 2021. The risks for this scenario are on the downside. Uncertainty about the economy over the coming quarters is very high due to the ongoing scarcity of data, the volatility of the financial markets and the possible effect of the unprecedented economic policy measures adopted, both fiscal and monetary. In this regard, we expect the Fed to hold rates at 0% at least until the end of 2021 and remain prepared to take further action if necessary, while it is also possible that a new infrastructure spending tax package will be approved.
Mexico
The latest figures suggest that activity continued to stagnate in the first months of 2020, although the fall in industrial production and investment points to a gloomier scenario, especially because, in the face of the pandemic, there is not enough fiscal space for economic policy measures to compensate for the negative effects on the economy. In this context of a sharp moderation in demand, inflation has unexpectedly declined to 3.3% in March, and a greater reduction is forecasted for the remainder of the year. On March 20 and April 21, 2020, Banxico cut the benchmark interest rate for a total of 100 basis points, to 6.0%, and is likely to continue making cuts, causing it to fall below 5% by the end of the year. In addition, Banxico announced an unprecedented program of measures to promote a controlled behavior of the financial markets, strengthen the channels for granting credits and provide liquidity for the development of the financial system. The measures announced for the moment amount to 3.3% of the GDP. Likewise, the Mexican banks have offered deferments of payments up to four months and payment facilities to allow clients to cope with their obligations. There is great uncertainty about the evolution of the economy in the coming months, but the Mexican economy could be one of the most affected in the region because of its close relationship with the United States economy, in addition to the adverse effects related to internal uncertainty, the lack of fiscal stimuli seen so far and weak oil prices. In this context, rating agencies have revised Mexico’s long-term sovereign rating in foreign currency. Namely, Fitch announced on April 15th a downgrade from “BBB” to“BBB-“, maintaining a stable Outlook and Moody’s did the same on April 17th by revising it down from “Baa3” to “Ba2”. According to BBVA Research estimates, the GDP could fall by about 7% in 2020.
Turkey
After the strong recovery in activity in the second half of 2019, growth was showing some signs of moderation at the end of the first quarter of 2020, with a reduction in confidence and utilized capacity. In the face of theCOVID-19 outbreak, the Turkish government has taken partial confinement measures and announced a program of fiscal measures equivalent to 1.5% of the GDP to fight the effects of the pandemic. The main measures that stand out include the increase in the minimum pension and financial support for the worst affected households, the protection of employment through providing more flexibility in the rules on short-term labor subsidies and the postponement of the payment of taxes in certain industries. The central bank has cut the reference rate in several monetary policy meetings, in the latest reducing it by 100 basis points to 8.75% from 12% at the end of 2019, all of this in addition to the measures announced to provide liquidity through long-term instruments and discount rates. BBVA Research forecasts that the reference rate will reduce to 8% as from May, given the perspective regarding inflation, which could stand at 7.5% at the end of the year according to the latest forecasts. Public banks have granted a three-month deferment in the repayment of bank loans to companies affected by the crisis. According to BBVA Research forecasts, the economy could stagnate in 2020 before returning to more robust growth of around 5% in 2021.
Argentina
The recession seen in the Argentine economy since the middle of last year has been exacerbated in early 2020 by the negative impact on economic growth due to the confinement measures put in place in order to contain the health crisis caused by theCOVID-19. To offset the negative impact, the government has announced a series of fiscal measures of about 2.8% of the GDP. This will have a direct cost to the Treasury of at least 1.6% of the GDP, as the rest will be financed through the banking system. It has also imposed the postponement of all capital and interest payments in accordance with local legislation until the end of the year, while debt obligations to other public bodies will be automatically extended with new bond issues. According to BBVA Research forecasts, the GDP could contract by about 6% in 2020 and will grow by around 1.5% in 2021, although there is still a great deal of uncertainty.
Table of Contents
| 8 |
Colombia
After the good performance of 3.3% growth in 2019, up from 2.5% in 2018, the figures available early in the year were already showing certain moderation and they have deteriorated sharply sincemid-March because of the impact of the pandemic and the fall in oil prices. In addition to the mandatory confinement, a number of measures have been taken to counter the effects of the pandemic. With regard to monetary policy, the central bank has cut the interest rate by 50 basis points to 3.75% and adopted measures to inject liquidity, amongst them, the one destined to provide US dollars with the help of the facility maintained with the Fed (FIMA Repo Facility). However, the BBVA Research scenario foresees a fall in the GDP of around 3% in 2020 and a strong recovery in 2021 (4%). In return, the announced economic measures and low oil prices will result in a weakening of the public finances. This has led Fitch to revise the rating for government debt down to“BBB-”, with a negative outlook, which could increase the pressure to obtain external financing.
Peru
Following the slowdown in the economy in 2019 (2.2% after 4% in 2018), the rebound in growth in January (3%year-on-year) was cut short as a result of theCOVID-19 epidemic. Containment measures have been adopted to tackle this. The government has announced a comprehensive package of measures of up to 12% of the GDP that will be used to finance pandemic-related expenditures, support the labor market and guarantee loans, as well as to underpin the recovery once the health crisis has been overcome. Among these measures, the creation of a universal family allowances, from which a total of 6.8 million families (75% of the total) will benefit, and a new tax on the highest incomes has been announced to try to mitigate the negative effects ofCOVID-19. In this context, and with the inflation located within the target range (1.8% in March), the central bank reduced interest rates by 200 basis points between March and April to 0.25%, while it has reinforced the message that it is prepared to provide greater monetary stimuli if necessary. However, BBVA Research forecasts consider that the GDP will fall by around 6% in 2020 and partially recover in 2021 with a growth rate of around 5%, although there is still much uncertainty and the risks are on the downside.
INTEREST RATES
(PERCENTAGE)
| 31-03-20 | 31-12-19 | 30-09-19 | 30-06-19 | 31-03-19 | ||||||||||||||||||
Official ECB rate | 0.00 | 0.00 | 0.00 | 0.00 | 0.00 | |||||||||||||||||
Euribor 3 months(1) | (0.42 | ) | (0.39 | ) | (0.42 | ) | (0.33 | ) | (0.31 | ) | ||||||||||||
Euribor 1 year(1) | (0.27 | ) | (0.26 | ) | (0.34 | ) | (0.19 | ) | (0.11 | ) | ||||||||||||
USA Federal rates | 0.25 | 1.75 | 2.00 | 2.50 | 2.50 | |||||||||||||||||
TIIE (Mexico) | 6.50 | 7.25 | 7.75 | 8.25 | 8.25 | |||||||||||||||||
CBRT (Turkey) | 9.75 | 12.00 | 16.50 | 24.00 | 24.00 | |||||||||||||||||
| (1) | Calculated as the month average. |
EXCHANGE RATES
(EXPRESSED IN CURRENCY/EURO)
| Year-end exchange rates | Average exchange rates | |||||||||||||||||||||||
| 31-03-20 | r % on 31-03-19 | r % on 31-12-19 | 1Q20 | r % on 1Q19 | ||||||||||||||||||||
U.S. dollar | 1.0956 | 2.5 | 2.5 | 1.1027 | 3.0 | |||||||||||||||||||
Mexican peso | 26.1772 | (17.1 | ) | (18.9 | ) | 22.0918 | (1.3 | ) | ||||||||||||||||
Turkish lira | 7.2063 | (12.0 | ) | (7.2 | ) | 6.7428 | (9.4 | ) | ||||||||||||||||
Peruvian sol | 3.7524 | (0.7 | ) | (0.9 | ) | 3.7528 | 0.6 | |||||||||||||||||
Argentine peso(1) | 70.6330 | (30.7 | ) | (4.7 | ) | — | — | |||||||||||||||||
Chilean peso | 927.21 | (17.5 | ) | (9.3 | ) | 885.33 | (14.4 | ) | ||||||||||||||||
Colombian peso | 4,453.41 | (19.5 | ) | (17.3 | ) | 3,900.44 | (8.7 | ) | ||||||||||||||||
| (1) | According to IAS 29 “Financial information in hyperinflationary economies”, theyear-end exchange rate is used for the conversion of the Argentina income statement. |
Table of Contents
| 9 |
The BBVA Group generated a net attributableloss of €1,792m in the first quarter of 2020. The strong performance of the recurring revenue items (net interest income and fees and commissions), net trading income (NTI) and the other income line was offset by a higher impairments on financial assets, mainly due to the deterioration of the macroeconomic scenario resulting fromCOVID-19 and higher provisions, and, in addition, to the goodwill impairment in the United States in the first quarter of 2020 of €2,084m included in Other gains (losses) also caused by theCOVID-19 pandemic. The comparison with the same period in 2019 is impacted by those two factors. Without taking into account the goodwill impairment in the United States, the Group’s net attributable profit stood at €292m which corresponds to a decrease of 75.3% compared to the first quarter of 2019.
CONSOLIDATED INCOME STATEMENT: QUARTERLY EVOLUTION
(MILLIONS OF EUROS)
| 2020 | 2019 | |||||||||||||||||||
| 1Q | 4Q | 3Q | 2Q | 1Q | ||||||||||||||||
Net interest income | 4,556 | 4,709 | 4,473 | 4,544 | 4,398 | |||||||||||||||
Net fees and commissions | 1,258 | 1,290 | 1,273 | 1,256 | 1,214 | |||||||||||||||
Net trading income | 594 | 490 | 351 | 116 | 426 | |||||||||||||||
Other operating income and expenses | 75 | (89 | ) | 22 | (18 | ) | 8 | |||||||||||||
Gross income | 6,484 | 6,400 | 6,120 | 5,897 | 6,046 | |||||||||||||||
Operating expenses | (2,918 | ) | (3,082 | ) | (2,946 | ) | (2,952 | ) | (2,922 | ) | ||||||||||
Personnel expenses | (1,532 | ) | (1,637 | ) | (1,572 | ) | (1,578 | ) | (1,553 | ) | ||||||||||
Other administrative expenses | (988 | ) | (1,039 | ) | (971 | ) | (976 | ) | (977 | ) | ||||||||||
Depreciation | (397 | ) | (406 | ) | (403 | ) | (398 | ) | (392 | ) | ||||||||||
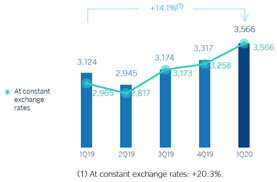
Operating income | 3,566 | 3,317 | 3,174 | 2,945 | 3,124 | |||||||||||||||
Impairment on financial assets not measured at fair value through profit or loss | (2,575 | ) | (1,169 | ) | (1,172 | ) | (731 | ) | (1,001 | ) | ||||||||||
Provisions or reversal of provisions | (312 | ) | (243 | ) | (113 | ) | (117 | ) | (144 | ) | ||||||||||
Other gains (losses) | (2,113 | ) | (1,444 | ) | (4 | ) | (3 | ) | (22 | ) | ||||||||||
Profit/(loss) before tax | (1,435 | ) | 460 | 1,886 | 2,095 | 1,957 | ||||||||||||||
Income tax | (186 | ) | (430 | ) | (488 | ) | (595 | ) | (541 | ) | ||||||||||
Profit/(loss) for the year | (1,621 | ) | 31 | 1,398 | 1,500 | 1,416 | ||||||||||||||
Non-controlling interests | (172 | ) | (186 | ) | (173 | ) | (241 | ) | (234 | ) | ||||||||||
Net attributable profit | (1,792 | ) | (155 | ) | 1,225 | 1,260 | 1,182 | |||||||||||||
Earning per share (euros)(1) | (0.29 | ) | (0.04 | ) | 0.17 | 0.17 | 0.16 | |||||||||||||
Of which: | ||||||||||||||||||||
Goodwill impairment in the United States | (2,084 | ) | (1,318 | ) | ||||||||||||||||
Net attributable profit excluding the goodwill impairment in the United States | 292 | 1,163 | 1,225 | 1,260 | 1,182 | |||||||||||||||
Earning per share excluding the goodwill impairment in the United States (euros)(1) | 0.03 | 0.16 | 0.17 | 0.17 | 0.16 | |||||||||||||||
General note: as a result of the decision taken by the International Financial Reporting Standards Interpretations Committee (IFRIC) regarding the collecting of interests ofwritten-off financial assets for the purpose of IFRS 9, those collections are presented as reduction of the credit allowances and not as a higher interest income, recognition method applied until December 2019. Therefore, and in order to make the information comparable, the quarterly information of the 2019 income statements has been restated.
| (1) | Adjusted by additional Tier 1 instrument remuneration. |
Table of Contents
| 10 |
CONSOLIDATED INCOME STATEMENT
(MILLIONS OF EUROS)
| 1Q20 | D % | D % at constant exchange rates | 1Q19 | |||||||||||||
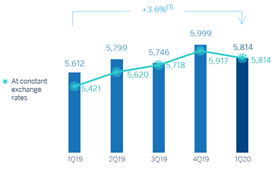
Net interest income | 4,556 | 3.6 | 7.5 | 4,398 | ||||||||||||
Net fees and commissions | 1,258 | 3.6 | 6.3 | 1,214 | ||||||||||||
Net trading income | 594 | 39.5 | 54.6 | 426 | ||||||||||||
Other operating income and expenses | 75 | n.s. | n.s. | 8 | ||||||||||||
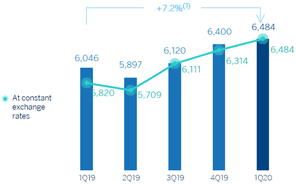
Gross income | 6,484 | 7.2 | 11.4 | 6,046 | ||||||||||||
Operating expenses | (2,918 | ) | (0.1 | ) | 2.2 | (2,922 | ) | |||||||||
Personnel expenses | (1,532 | ) | (1.3 | ) | 1.0 | (1,553 | ) | |||||||||
Other administrative expenses | (988 | ) | 1.1 | 3.7 | (977 | ) | ||||||||||
Depreciation | (397 | ) | 1.3 | 3.1 | (392 | ) | ||||||||||
Operating income | 3,566 | 14.1 | 20.3 | 3,124 | ||||||||||||
Impairment on financial assets not measured at fair value through profit or loss | (2,575 | ) | 157.3 | 166.6 | (1,001 | ) | ||||||||||
Provisions or reversal of provisions | (312 | ) | 117.0 | 119.7 | (144 | ) | ||||||||||
Other gains (losses) | (2,113 | ) | n.s. | n.s. | (22 | ) | ||||||||||
Profit/(loss) before tax | (1,435 | ) | n.s. | n.s. | 1,957 | |||||||||||
Income tax | (186 | ) | (65.6 | ) | (63.4 | ) | (541 | ) | ||||||||
Profit/(loss) for the year | (1,621 | ) | n.s. | n.s. | 1,416 | |||||||||||
Non-controlling interests | (172 | ) | (26.6 | ) | (15.7 | ) | (234 | ) | ||||||||
Net attributable profit | (1,792 | ) | n.s. | n.s. | 1,182 | |||||||||||
Earning per share (euros)(1) | (0.29 | ) | 0.16 | |||||||||||||
Of which: | ||||||||||||||||
Goodwill impairment in the United States | (2,084 | ) | ||||||||||||||
Net attributable profit excluding the goodwill impairment in the United States | 292 | (75.3) | (74.0) | 1,182 | ||||||||||||
Earning per share excluding the goodwill impairment in the United States (euros)(1) | 0.03 | 0.16 | ||||||||||||||
General note: as a result of the decision taken by the International Financial Reporting Standards Interpretations Committee (IFRIC) regarding the collecting of interests ofwritten-off financial assets for the purpose of IFRS 9, those collections are presented as reduction of the credit allowances and not as a higher interest income, recognition method applied until December 2019. Therefore, and in order to make the information comparable, the quarterly information of the 2019 income statements has been restated.
| (1) | Adjusted by additional Tier 1 instrument remuneration. |
Unless expressly indicated otherwise, to better understand the changes in the main headings of the Group’s income statement, theyear-on-year percentage changes provided below refer toconstant exchange rates.
Gross income
Gross income increased by 11.4%year-on-year, supported by the good performance of net interest income and NTI and, to a lesser extent, the growth in net fees and commissions and the other operating income and expenses line.
| GROSS INCOME(MILLIONS OF EUROS) |
(1) At constant exchange rates: +11.4%. |
Table of Contents
| 11 |
Net interest income grew by 7.5%year-on-year, fostered by the good performance from Turkey, South America and, to a lesser extent, Mexico, which compensated the lower contribution from the United States as a result of the Fed’s interest-rate cuts in the second half of 2019.
Net fees and commissions also performed well and grew by 6.3%year-on-year, thanks to the strong contribution from Spain and the United States.
As a result, themore recurring revenueitems grew in all geographical areas, with the exception of the United States, and ended the quarter with ayear-on-year increase of 7.2%.
| NET INTEREST INCOME/ATAS (PERCENTAGE) |
| NET INTEREST INCOME PLUS NET FEES AND COMMISSIONS (MILLIONS OF EUROS) |
(1) At constant exchange rates: +7.2%.
NTI recorded ayear-on-year increase of 54.6% mainly due to the foreign-exchange rate hedging gains registered at the Corporate Center, and, to a lesser extent, the earnings generated mainly from Turkey and the United States.
Theother operating income and expenses line closed the first quarter of the year at €75m, which compares very positively with the €8m recorded in the same period of 2019, mostly due to the evolution of the insurance business in Mexico.
Operating income
Operating expenses increased by 2.2% between January and March 2020 (down 0.1% at current exchange rates) showing a variation below the inflation in most of the countries where BBVA is present. The main drivers are the reduction in expenses in Spain and the Corporate Center, as a result of the cost discipline plans.
| OPERATING EXPENSES (MILLIONS OF EUROS) |
(1) At constant exchange rates: +2.2%.
Theefficiency ratio stood at 45.0% at the end of the quarter, significantly below the level reached at the end of March 2019 (48.3%). As a result of gross income growing faster than expenses, theoperating income line increased by 20.3%year-on-year.
Table of Contents
| 12 |
| EFFICIENCY RATIO (PERCENTAGE) |
| OPERATING INCOME (MILLIONS OF EUROS) |
Provisions and other
The impairment on financial assets not measured at fair value through profit or loss (impairment on financial assets) increased by 166.6% in the first quarter of 2020, mainly due to the negative impact of the deterioration in the macroeconomic scenario resulting fromCOVID-19, and had an impact at Group level of €-1,433m.
IMPAIRMENT ON FINANCIAL ASSETS (MILLIONS OF EUROS) |
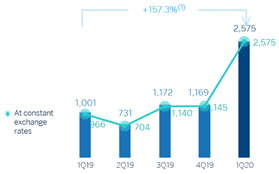
(1) At constant exchange rates: +166.6%.
Provisions or reversal of provisions (hereafter provisions) closed the quarter with a negative balance of €312m, 119.7% higher than the figure recorded in the same period of 2019, mainly due to higher provisions in Spain and additional provisions of €27m forCOVID-19.
On the other hand,other gains (losses) mainly reflects the above mentioned goodwill impairment in the United States closing with a loss of €-2,113m.
Results
As a result of the above, the Group’s net attributable loss for the first quarter of 2020 amounted to €1,792m, which compares negatively with the profit of €1,182m obtained in the same quarter of 2019. This comparison is affected by the increase in the impairment on financial assets as well as by the goodwill impairment in the United States, both related to the impact ofCOVID-19.
Table of Contents
| 13 |
| NET ATTRIBUTABLE PROFIT (MILLIONS OF EUROS) |

| (1) | At constant exchange rates: n.s. |
NET ATTRIBUTABLE PROFIT EXCLUDING THE UNITED STATES GOODWILL IMPAIRMENT (MILLIONS OF EUROS) |
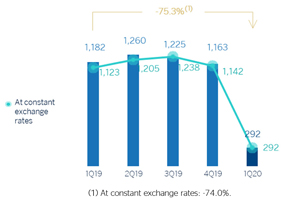
| (1) | At constant exchange rates:-74.0%. |
Bybusiness areas, and in millions of euros, Spain and the United States had a net attributable loss of 141 and 100, respectively, and Mexico, Turkey, South America and the Rest of Eurasia recorded a net attributable profit of 372, 129, 70 and 44, respectively.
| TANGIBLE BOOK VALUE PER SHARE AND DIVIDENDS(1)(EUROS) |
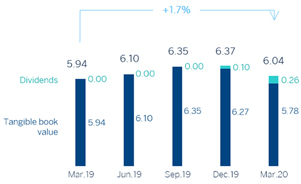
| (1) | Replenishing dividends paid in the period. |
| EARNING PER SHARE(1) (EUROS) |
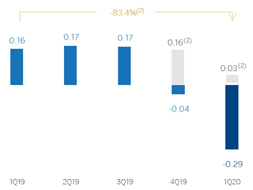
| (1) | Adjusted by additional Tier 1 instrument remuneration. |
| (2) | Excluding the goodwill impairment in the United States in 4Q19 and 1Q20. |
| ROE AND ROTE(1)(PERCENTAGE) |
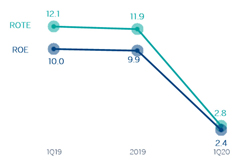
| (1) | Ratios excluding the goodwill impairment in the United States in 2019 and 1Q20. |
| ROA AND RORWA(1) (PERCENTAGE) |
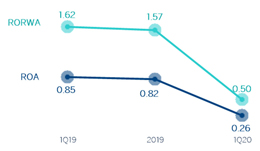
| (1) | Ratios excluding the goodwill impairment in the United States in 2019 and 1Q20. |
Table of Contents
| 14 |
Balance sheet and business activity
The most relevant aspects related to theevolution of the Group’s balance sheet and business activity as of March 31, 2020, are summarized below:
| • | Loans and advances to customers (gross) remained stable compared to December 2019 (up 0.3%), with an increase in the corporate portfolio that offsets the deleveraging in the rest of the portfolios. |
| • | Non-performing loans fell by 4.4% in the quarter mainly due to decreases in Spain. |
| • | Customer deposits remained at the same level as at the end of 2019 (up 0.2%), with ayear-on-year increase of 1.7%, strongly supported by the good performance of demand deposits (up 3.0% in the quarter, up 7.9%year-on-year), where customers have deposited the liquidity available to face the pandemic. |
| • | Off-balance sheet funds fell by 10.5% in the quarter (down 6.5%year-on-year) as a result of the negative performance of the markets caused byCOVID-19. |
| • | Regarding theintangible assets, during the first quarter of 2020, the United States goodwill has been impaired by €2,084m due to theCOVID-19 pandemic, which does neither affect the tangible net equity, nor the solvency, nor liquidity of the BBVA Group. |
CONSOLIDATED BALANCE SHEET (MILLIONS OF EUROS)
|
| |||||||||||||||
| 31-03-20 | D % | 31-12-19 | 31-03-19 | |||||||||||||
Cash, cash balances at central banks and other demand deposits | 49,544 | 11.8 | 44,303 | 50,059 | ||||||||||||
Financial assets held for trading | 127,103 | 23.8 | 102,688 | 92,366 | ||||||||||||
Non-trading financial assets mandatorily at fair value through profit or loss | 5,100 | (8.2 | ) | 5,557 | 5,535 | |||||||||||
Financial assets designated at fair value through profit or loss | 1,175 | (3.2 | ) | 1,214 | 1,311 | |||||||||||
Financial assets at fair value through accumulated other comprehensive income | 61,229 | 0.1 | 61,183 | 60,204 | ||||||||||||
Financial assets at amortized cost | 442,831 | 0.8 | 439,162 | 433,008 | ||||||||||||
Loans and advances to central banks and credit institutions | 18,854 | 5.2 | 17,924 | 15,787 | ||||||||||||
Loans and advances to customers | 382,592 | 0.1 | 382,360 | 380,799 | ||||||||||||
Debt securities | 41,385 | 6.5 | 38,877 | 36,421 | ||||||||||||
Investments in subsidiaries, joint ventures and associates | 1,440 | (3.3 | ) | 1,488 | 1,587 | |||||||||||
Tangible assets | 9,344 | (7.2 | ) | 10,068 | 10,408 | |||||||||||
Intangible assets | 4,702 | (32.5 | ) | 6,966 | 8,383 | |||||||||||
Other assets | 28,456 | 9.2 | 26,060 | 28,338 | ||||||||||||
Total assets | 730,923 | 4.6 | 698,690 | 691,200 | ||||||||||||
Financial liabilities held for trading | 113,699 | 26.8 | 89,633 | 80,818 | ||||||||||||
Other financial liabilities designated at fair value through profit or loss | 8,641 | (13.7 | ) | 10,010 | 7,846 | |||||||||||
Financial liabilities at amortized cost | 533,205 | 3.2 | 516,641 | 520,464 | ||||||||||||
Deposits from central banks and credit institutions | 69,290 | 26.7 | 54,700 | 64,427 | ||||||||||||
Deposits from customers | 385,050 | 0.2 | 384,219 | 378,527 | ||||||||||||
Debt certificates | 64,937 | 1.5 | 63,963 | 62,365 | ||||||||||||
Other financial liabilities | 13,928 | 1.2 | 13,758 | 15,144 | ||||||||||||
Liabilities under insurance and reinsurance contracts | 9,593 | (9.6 | ) | 10,606 | 10,577 | |||||||||||
Other liabilities | 16,612 | (1.6 | ) | 16,875 | 17,947 | |||||||||||
Total liabilities | 681,749 | 5.9 | 643,765 | 637,653 | ||||||||||||
Total equity | 49,174 | (10.5 | ) | 54,925 | 53,547 | |||||||||||
Total liabilities and equity | 730,923 | 4.6 | 698,690 | 691,200 | ||||||||||||
Memorandum item: | ||||||||||||||||
Guarantees given | 45,478 | (0.8 | ) | 45,952 | 45,831 | |||||||||||
General note: figures considering the classification of BBVA Paraguay asnon-current assets and liabilities held for sale (NCA&L), which are included within the other assets and other liabilities figures, respectively, as of31-03-20 and31-12-19.
Table of Contents
| 15 |
LOANS AND ADVANCES TO CUSTOMERS
(MILLIONS OF EUROS)(1)
| 31-03-20 | D % | 31-12-19 | 31-03-19 | |||||||||||||
Public sector | 27,391 | (2.8 | ) | 28,193 | 29,138 | |||||||||||
Individuals | 167,316 | (4.2 | ) | 174,608 | 171,947 | |||||||||||
Mortgages | 107,393 | (2.8 | ) | 110,500 | 111,776 | |||||||||||
Consumer | 35,058 | (3.8 | ) | 36,438 | 36,159 | |||||||||||
Credit cards | 12,591 | (15.4 | ) | 14,892 | 13,644 | |||||||||||
Other loans | 12,274 | (3.9 | ) | 12,778 | 10,367 | |||||||||||
Business | 185,962 | 5.7 | 176,008 | 175,678 | ||||||||||||
Non-performing loans | 15,242 | (4.5 | ) | 15,954 | 16,559 | |||||||||||
Loans and advances to customers (gross) | 395,911 | 0.3 | 394,763 | 393,321 | ||||||||||||
Allowances(2) | (13,319 | ) | 7.4 | (12,402 | ) | (12,522 | ) | |||||||||
Loans and advances to customers | 382,592 | 0.1 | 382,360 | 380,799 | ||||||||||||
| (1) | Figures considering the classification of BBVA Paraguay asnon-current assets and liabilities held for sale (NCA&L), which are included within the other assets and other liabilities figures of the Group consolidated balance sheet, respectively, as of31-03-20 and31-12-19. |
| (2) | Allowances include the valuation adjustments for credit risk during the expected residual life of those financial instruments which have been acquired (mainly originated from the acquisition of Catalunya Banc, S.A.). As of March 31, 2020, December 31, 2019 and March 31, 2019 the remaining amount was €418m, €433m and €520m, respectively. |
| LOANS AND ADVANCES TO CUSTOMERS(GROSS. BILLIONS OF EUROS) |
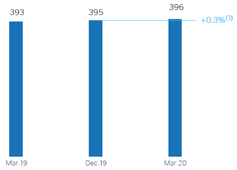
| (1) | At constant exchange rates: +4.5%. |
| CUSTOMER FUNDS (BILLIONS OF EUROS) |
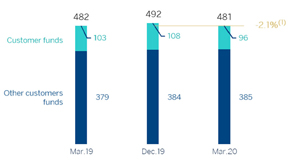
| (1) | At constant exchange rates: +1.9%. |
CUSTOMER FUNDS
(MILLIONS OF EUROS)(1)
| 31-03-20 | D % | 31-12-19 | 31-03-19 | |||||||||||||
Deposits from customers | 385,050 | 0.2 | 384,219 | 378,527 | ||||||||||||
Current accounts | 288,773 | 3.0 | 280,391 | 267,614 | ||||||||||||
Time deposits | 88,688 | (8.2 | ) | 96,583 | 104,698 | |||||||||||
Other deposits | 7,589 | 4.7 | 7,246 | 6,215 | ||||||||||||
Other customer funds | 96,438 | (10.5 | ) | 107,803 | 103,189 | |||||||||||
Mutual funds and investment companies | 59,507 | (13.3 | ) | 68,639 | 64,928 | |||||||||||
Pension funds | 34,853 | (4.8 | ) | 36,630 | 35,071 | |||||||||||
Otheroff-balance sheet funds | 2,078 | (18.0 | ) | 2,534 | 3,191 | |||||||||||
Total customer funds | 481,488 | (2.1 | ) | 492,022 | 481,717 | |||||||||||
| (1) | Figures considering the classification of BBVA Paraguay asnon-current assets and liabilities held for sale (NCA&L), which are included within the other assets and other liabilities figures of the Group consolidated balance sheet, respectively, as of31-03-20 and31-12-19. |
Table of Contents
| 16 |
Capital base
BBVA’sfully-loaded CET1 ratio has decreased by 90 basis points in the first quarter of 2020 to 10.84%. It should be noted that the impairment of goodwill recorded by BBVA in the United States at the end of 2019 and the first quarter of 2020, for the amount of €1,318m and €2,084m, respectively, has not had an impact on capital at the consolidated level.
The uncertainty caused by theCOVID-19 pandemic has led to a significant fluctuation in asset prices in the financial markets, accompanied by a sharp increase in volatility. The stock exchanges have experienced falls in response to the impact of the crisis on corporate earnings and the increase in risk aversion that has also spread to the debt markets, as well as the evolution of exchange rates. All of this has had a negative impact on the Group’s capital base, particularly with regard to the value of financial assets not valued at fair value through profit and loss, due mainly to the negative impact of the deterioration in the macroeconomic scenario resulting fromCOVID-19.
The national and supranational authorities are responding to this adverse economic situation by taking steps to mitigate its effects. In the area of prudential regulation, the main measures include the announcements by the European Banking Authority that have focused on making the regulatory framework more flexible, especially in relation to the treatment of public and private moratorium measures for prudential purposes, and the guarantees granted by the different authorities.
As a result of all of the above,risk-weighted assets (RWA) increased by approximately €3,884m in the first quarter of the year. Isolating the effect of exchange rates, mainly due to the depreciation of the Mexican peso and the emerging currencies, it would result in a growth of €16,065m. This reflects the strength of the activity in the first two months of the year, as well as the increased demand for credit and drawing down of funding facilities resulting from theCOVID-19 situation.
Thefully loaded Additional Tier 1 capital (AT1) stood at 1.63% at the end of March 2020. In February, we saw the early amortization of the issue of CoCos worth €1,500m and with a coupon of 6.75%, issued in February 2015, which since December 2019 no longer computed in the capital adequacy ratio.
In terms of theissues eligible as Tier 2 capital, in January 2020 BBVA, S.A. issued €1,000m of Tier 2 subordinated debt over aten-year period, with an option for early amortization in the fifth year, and a coupon of 1% in January 2020.
With regard to the rest of the Group’s subsidiaries, Garanti BBVA carried out a Tier 2 issue in February for TRY 750m (€114m) at TLREF (Turkish Lira Overnight Reference Rate) plus 250 basis points.
All of this, together with the evolution of the remaining elements computable as Tier 2 capital, has placed thefully loaded Tier 2 ratio at 2.40% as of March 31, 2020.
Moreover, at the supervisory level, the European Central Bank, in its announcement on March 12, has allowed the banks to operate temporarily below the capital level defined by the Pillar II Guide (P2G), the Capital Conservation Buffer (CCB) and the Liquidity Coverage Ratio (LCR). In addition to the above, the banks are allowed to use additional Tier 1 and Tier 2 capital instruments to meet the Pillar II Requirements (P2R). These measures are reinforced by the relaxation of the Countercyclical Capital Buffer (CCyB) announced by various national macroprudential authorities and by other complementary measures published by the European Central Bank. All of this has resulted in a reduction of 68 basis points in the fully loaded CET1 requirement for BBVA, with that requirement standing at 8.59%. The reduction in the requirement at the total ratio level is only around 2 basis points, as a result of the lower applicable countercyclical buffer.
As a result, it has been agreed to modify theCET1 capital target in line with the new situation, which has been set as a management buffer between 225 to 275 basis points to the CET1 requirements. This range is the one used as a reference for determining the previous CET1 capital target (under fully-loaded view) of between 11.5% and 12%, which means that the new target maintains an equivalent distance in terms of CET1. At the end of March, the management buffer of the fully-loaded CET1 would amount to 225 basis points.
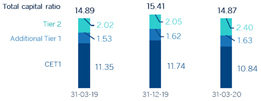
Thephased-in CET1 ratio stood at 11.08% at the end of March 2020, taking into account the transitory effect of the IFRS 9 standard.AT1 stood at 1.66% andTier 2 at 2.65%, resulting in atotal capital ratio of 15.39%. The current management buffer at the CET1 level would therefore be 249 basis points.
Regardingshareholder remuneration, on April 9 a cash payment was made for a supplementary dividend for the 2019 financial year for the gross amount of €0.16 per share, in line with that approved at the General Meeting of Shareholders on March 13. This amounted to €1,067m. Thus, the total dividend for the 2019 financial year amounts to €0.26 gross per share.
In addition, in accordance with recommendation ECB/2020/19 issued by the ECB on March 27, 2020, on dividend distributions during theCOVID-19 pandemic, and the subsequent notifications clarifying the treatment of dividend accruals by financial institutions under its supervision, the Board of Directors of BBVA has agreed to modify, for the financial year 2020, the Group’s shareholder remuneration policy, which was announced through the Relevant Event notification of February 1, 2017, establishing a new policy for 2020 of not making any dividend payment for the 2020 financial year until the uncertainties caused byCOVID-19 are resolved and, in any case, not before the end of the financial year.
Table of Contents
| 17 |
SHAREHOLDER STRUCTURE
(31-03-2020)
| Shareholders | Shares | |||||||||||||||
Number of shares | Number | % | Number | % | ||||||||||||
Up to 500 | 360,533 | 41.1 | 67,493,011 | 1.0 | ||||||||||||
501 to 5,000 | 405,879 | 46.3 | 707,872,492 | 10.6 | ||||||||||||
5,001 to 10,000 | 58,796 | 6.7 | 413,591,321 | 6.2 | ||||||||||||
10,001 to 50,000 | 46,208 | 5.3 | 886,021,853 | 13.3 | ||||||||||||
50,001 to 100,000 | 3,455 | 0.4 | 235,353,161 | 3.5 | ||||||||||||
100,001 to 500,000 | 1,606 | 0.2 | 289,282,093 | 4.3 | ||||||||||||
More than 500,001 | 308 | 0.0 | 4,068,272,649 | 61.0 | ||||||||||||
|
|
|
|
|
|
|
| |||||||||
Total | 876,785 | 100.0 | 6,667,886,580 | 100.0 | ||||||||||||
|
|
|
|
|
|
|
| |||||||||
| FULLY-LOADED CAPITAL RATIOS(PERCENTAGE) |
CAPITAL BASE
(MILLIONS OF EUROS)
| CRD IVphased-in | CRD IV fully-loaded | |||||||||||||||||||||||
| 31-03-20 (1)(2) | 31-12-19 | 31-03-19 | 31-03-20 (1)(2)(3) | 31-12-19 | 31-03-19 | |||||||||||||||||||
Common Equity Tier 1 (CET 1) | 40,852 | 43,653 | 41,784 | 39,984 | 42,856 | 40,975 | ||||||||||||||||||
Tier 1 | 46,972 | 49,701 | 47,455 | 45,979 | 48,775 | 46,503 | ||||||||||||||||||
Tier 2 | 9,753 | 8,304 | 7,341 | 8,848 | 7,464 | 7,286 | ||||||||||||||||||
Total Capital (Tier 1 + Tier 2) | 56,725 | 58,005 | 54,797 | 54,827 | 56,240 | 53,789 | ||||||||||||||||||
Risk-weighted assets | 368,654 | 364,448 | 360,679 | 368,827 | 364,942 | 361,173 | ||||||||||||||||||
CET1 (%) | 11.08 | 11.98 | 11.58 | 10.84 | 11.74 | 11.35 | ||||||||||||||||||
Tier 1 (%) | 12.74 | 13.64 | 13.16 | 12.47 | 13.37 | 12.88 | ||||||||||||||||||
Tier 2 (%) | 2.65 | 2.28 | 2.04 | 2.40 | 2.05 | 2.02 | ||||||||||||||||||
Total capital ratio (%) | 15.39 | 15.92 | 15.19 | 14.87 | 15.41 | 14.89 | ||||||||||||||||||
| (1) | As of March 31, 2020, the difference between thephased-in and fully-loaded ratios arises from the temporary treatment of certain capital items, mainly of the impact of IFRS9, to which the BBVA Group has adhered voluntarily (in accordance with article 473bis of the CRR). |
| (2) | Provisional data. |
| (3) | As of March 31, 2020 the fully-loaded capital ratios include the positive impact of +2 basis points due the reduction of the limit of share buybacks which is pending to be approved by the ECB. |
Regarding theMREL (Minimum requirement for own funds and eligible liabilities) requirements, BBVA has continued its issuance plan during 2020 by closing two public issues ofnon-preferred senior debt, one in January 2020 for €1,250m over seven years and one coupon of 0.5%, and another in February 2020 for CHF 160m over six and a half years and a coupon of 0.125%.
The supervisor has also made announcements regarding the fulfillment of this MREL requirement, with a delay to be expected in the timetable for its entry into force.
The Group finds that the present structure of shareholders’ funds and admissible liabilities, together with the proposed plan for issuances, should enable it to comply with the MREL by the date of entry into force of the requirement.
Finally, the Group’sleverage ratio maintained a solid position, at 6.2% fully loaded (6.4%phased-in), which remains the highest among its peer group.
Table of Contents
| 18 |
Ratings
The rating agencies have kept BBVA’s rating unchanged during the first quarter of the year. As a result of the uncertainty generated by theCOVID-19 pandemic, on March 27 Fitch decided to change BBVA’s outlook to Rating Watch Negative in a joint action that affected 17 Spanish banking groups. This resulted from a review of financial institutions in several European countries. On April 1, 2020, DBRS reported the result of its annual review of BBVA, confirming the rating of A (high). Moody’s and S&P have held BBVA’s rating at A3 andA-, respectively. These ratings, together with their corresponding outlooks, are shown in the following table:
RATINGS
Rating agency | Long term (1) | Short term | Outlook | |||
Axesor Rating | A+ | n/a | Stable | |||
DBRS | A(high) | R-1 (middle) | Stable | |||
Fitch | A | F-1 | Rating Watch Negative | |||
Moody’s | A3 | P-2 | Stable | |||
Standard & Poor’s | A- | A-2 | Negative |
| (1) | Ratings assigned to long term senior preferred debt. Additionally, Moody’s and Fitch assign A2 and A rating respectively, to BBVA’s long term deposits. |
Table of Contents
| 19 |
Credit risk
The calculation of theexpected credit losses at the end of March includes the update of the forward looking information in the models under IFRS 9 in order to reflect the circumstances created by theCOVID-19 pandemic in the macroeconomic environment, which is characterized by a high degree of uncertainty regarding its intensity and duration. As a consequence, this update is based on the best information available between the reporting date of this report and its date of publication. This information may change in the future depending on the evolution of the macroeconomic environment or its uncertainty. The effect of the aforementioned update is significant in terms of estimated losses and has been calculated for all geographical areas where the Group operates, taking into account both the macroeconomic scenarios as well as the effects on specific sectors and customers as much as possible. The scenarios consider the various economic measures which have been announced by governments and monetary authorities all over the world. Due to this, the scenarios include the prediction that in a relatively close time horizon, a more aligned economic environment with the previously existing long-term perspectives may be reached.
BBVA Group’s main risk indicators evolved as follows in the first quarter of 2020, as a result, among other reasons, of the situation explained in the previous paragraph
| • | Credit risk remained stable at +0.2% in the quarter. Nonetheless, at constant exchange rates, it grew by 3.1% with generalized increases in all geographical areas. |
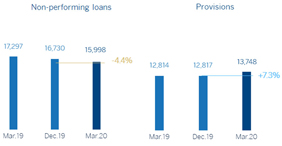
| • | The balance ofnon-performing loans fell by 4.4% in the first quarter of 2020 (down 1.3% at constant exchange rates), primarily due to the reduction in Spain. |
| • | The NPL ratio stood at 3.6% as of March 31, 2020 which represents a decrease of 17 basis points compared to December 2019. |
| • | Loan-loss provisions increased strongly by 7.3% in the last three months (up 13.6% at constant exchange rates) due to the higher provisions for the adjustment in the macro scenario due to the negative effects ofCOVID-19 and for specific clients in the commercial portfolio of certain business areas. |
| • | TheNPL coverage ratio closed at 86%, which was an improvement of 932 basis points compared to the end of 2019. |
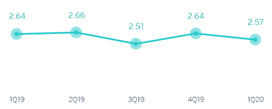
| • | The cumulativecost of risk stood at 2.57% as of March 31, 2020, which represents a significant increase of 155 basis points compared to the figure at the end of 2019. |
| NON-PERFORMING LOANS AND PROVISIONS (MILLIONS OF EUROS) |
CREDIT RISK(1)
(MILLIONS OF EUROS)
| 31-03-20 (2) | 31-12-19 (2) | 30-09-19 (2) | 30-06-19 | 31-03-19 | ||||||||||||||||
Credit risk | 442,648 | 441,964 | 438,177 | 434,955 | 439,152 | |||||||||||||||
Non-performing loans | 15,998 | 16,730 | 17,092 | 16,706 | 17,297 | |||||||||||||||
Provisions | 13,748 | 12,817 | 12,891 | 12,468 | 12,814 | |||||||||||||||
NPL ratio (%) | 3.6 | 3.8 | 3.9 | 3.8 | 3.9 | |||||||||||||||
NPL coverage ratio (%)(3) | 86 | 77 | 75 | 75 | 74 | |||||||||||||||
| (1) | Include gross loans and advances to customers plus guarantees given. |
| (2) | Figures without considering the classification of BBVA Paraguay asnon-current assets and liabilities held for sale (NCA&L). |
| (3) | The NPL coverage ratio includes the valuation adjustments for credit risk during the expected residual life of those financial instruments which have been acquired (mainly originated from the acquisition of Catalunya Banc, S.A.). Excluding these allowances, the NPL coverage ratio would stand at 83% as of March 31, 2020, 74% in 2019 and 71% as of March 31, 2019. |
Table of Contents
| 20 |
BREAKDOWN OF CREDIT RISK ACCORDING TO STAGE (MILLIONS OF EUROS) |
| |||||||||||||||||||||||
| 31-03-2020 | 31-12-2019 | 31-03-19 | ||||||||||||||||||||||
| Gross exposure | Provisions | Gross exposure | Provisions | Gross exposure | Provisions | |||||||||||||||||||
Loans and advances to customers | 397,170 | (13,368 | ) | 396,012 | (12,447 | ) | 393,321 | (12,522 | ) | |||||||||||||||
|
|
|
|
|
|
|
|
|
|
|
| |||||||||||||
Stage 1 | 348,564 | (2,794 | ) | 346,548 | (2,138 | ) | 345,654 | (2,152 | ) | |||||||||||||||
Stage 2 | 33,316 | (2,448 | ) | 33,464 | (2,185 | ) | 31,109 | (2,440 | ) | |||||||||||||||
Stage 3 | 15,291 | (8,126 | ) | 16,000 | (8,124 | ) | 16,559 | (7,930 | ) | |||||||||||||||
Contingent risks | 45,478 | (380 | ) | 45,952 | (370 | ) | 45,831 | (292 | ) | |||||||||||||||
Stage 1 | 41,266 | (58 | ) | 41,715 | (60 | ) | 41,955 | (34 | ) | |||||||||||||||
Stage 2 | 3,504 | (98 | ) | 3,507 | (83 | ) | 3,138 | (92 | ) | |||||||||||||||
Stage 3 | 708 | (224 | ) | 731 | (227 | ) | 738 | (167 | ) | |||||||||||||||
| Credit risk | 442,648 | (13,748) | 441,964 | (12,817) | 439,152 | (12,814) | ||||||||||||||||||
Stage 1 | 389,830 | (2,852 | ) | 388,263 | (2,197 | ) | 387,608 | (2,185 | ) | |||||||||||||||
Stage 2 | 36,820 | (2,546 | ) | 36,971 | (2,269 | ) | 34,247 | (2,532 | ) | |||||||||||||||
Stage 3 | 15,998 | (8,349 | ) | 16,730 | (8,351 | ) | 17,297 | (8,097 | ) | |||||||||||||||
| (1) | Figures without considering the classification of BBVA Paraguay asnon-current assets and liabilities held for sale (NCA&L). |
NON-PERFORMING LOANS EVOLUTION (MILLIONS OF EUROS)
|
| |||||||||||||||||||
| 1Q20 (1) (2) | 4Q19 (2) | 3Q19 (2) | 2Q19 | 1Q19 | ||||||||||||||||
Beginning balance | 16,730 | 17,092 | 16,706 | 17,297 | 17,087 | |||||||||||||||
Entries | 2,121 | 2,484 | 2,565 | 2,458 | 2,353 | |||||||||||||||
Recoveries | (1,435 | ) | (1,509 | ) | (1,425 | ) | (1,531 | ) | (1,409 | ) | ||||||||||
Net variation | 686 | 975 | 1,139 | 927 | 944 | |||||||||||||||
Write-offs | (944 | ) | (1,074 | ) | (991 | ) | (958 | ) | (775 | ) | ||||||||||
Exchange rate differences and other | (474 | ) | (262 | ) | 237 | (561 | ) | 41 | ||||||||||||
| Period-end balance | 15,998 | 16,730 | 17,092 | 16,706 | 17,297 | |||||||||||||||
Memorandum item: | ||||||||||||||||||||
Non-performing loans | 15,291 | 16,000 | 16,400 | 15,999 | 16,559 | |||||||||||||||
Non performing guarantees given | 708 | 731 | 692 | 707 | 738 | |||||||||||||||
(1) Preliminary data. |
| |||||||||||||||||||
(2) Figures without considering the classification of BBVA Paraguay asnon-current assets and liabilities held for sale (NCA&L). |
| |||||||||||||||||||
Structural risks
Liquidity and funding
Management ofliquidity and funding at BBVA aims to finance the recurring growth of the banking business at suitable maturities and costs, using a wide range of instruments that provide access to a large number of alternative sources of financing. In this context, it is important to notice that given the nature of BBVA’s business, the funding of lending activity is fundamentally carried out through the use of stable customer funds.
Due to its subsidiary-based management model, BBVA is one of the few major European banks that follows the Multiple Point of Entry (MPE) resolutionstrategy: the parent company sets the liquidity policies, but the subsidiaries are self-sufficient and responsible for managing their own liquidity (taking deposits or accessing the
market with their own rating), without fund transfers or financing occurring between either the parent company and the subsidiaries, or between the different subsidiaries. This strategy limits the spread of a liquidity crisis among the Group’s different areas, and ensures that the cost of liquidity and financing is correctly reflected in the price formation process.
During the first quarter of 2020,liquidity conditions remained comfortable across all countries in which the BBVA Group operates. In the second part of the quarter, the global crisis caused byCOVID-19 had a significant impact on financial markets. The effects of this crisis on the Group’s balance sheets have fundamentally been felt through greater drawing down of credit facilities by wholesale customers in the face of worsening funding conditions in the markets, with no significant effect in the retail world. In view of this situation, a joint response has been made by the different central banks, through specific measures and programs to facilitate the funding of the real economy and the availability of liquidity in the financial markets.
BBVA Group maintains a solid liquidity position in every geographical area with regulatory ratios remained comfortably above the minimum levels required:
Table of Contents
| 21 |
| • | The BBVA Group’sliquidity coverage ratio (LCR) remained significantly above 100% and stood at 134% as of March 31, 2020. For the calculation of this ratio, it is assumed that there is no transfer of liquidity among subsidiaries; i.e. no kind of excess liquidity levels in foreign subsidiaries are considered in the calculation of the consolidated ratio. When considering these excess liquidity levels, the BBVA Group’s LCR would stand at 156% (22 percentage points above 134%). In addition, it comfortably exceeded 100% in all subsidiaries (Eurozone 156%, Mexico 146%, the United States 144% and Turkey 153%). |
| • | TheNet Stable Funding Ratio (NSFR), defined as the ratio between the amount of stable funding available and the amount of stable funding required, is one of the Basel Committee’s essential reforms, and requires banks to maintain a stable funding profile in relation to the composition of their assets andoff-balance sheet activities. This ratio should be at least 100% at all times. At the BBVA Group, the NSFR, calculated according to the Basel requirements, remained above 100% throughout 2020 and stood at 120% as of March 31, 2020. It comfortably exceeded 100% in all subsidiaries (Eurozone 114%, Mexico 127%, United States 112% and Turkey 151%). |
The most relevant aspects related to the main geographical areas are the following:
| • | In the Eurozone, the liquidity situation remains comfortable with a high quality ample liquidity buffer. The impact of theCOVID-19 crisis has led to greater loan volumes through the increase in the drawing down of credit facilities in the wholesale business of Corporate & Investment Banking, also accompanied by a growth in customer deposits. In addition, it is important to mention the different measures implemented by the European Central Bank (ECB) in order to face the crisis such as the expansion of asset purchase programs, especially through the PEPP (Pandemic Emergency Purchase Program) for €750,000m until the end of the year, the coordinated action of Central Banks for the provision of US dollars, a package of temporary collateral easing measures affecting eligibility for use in funding operations and the easing and improvement of the conditions for the TLTRO III program. This easing of the TLTRO III program conditions will allow the increase of the maximum amount available for BBVA from €21 billion to €35 billion. |
| • | BBVA USA also maintains an adequate liquidity buffer consisting of high-quality assets which allows it to face this environment from a sound position. As in the Eurozone, there was an increase in loans mainly due to a rise in the drawing down of credit facilities by companies. Deposits also grew in the quarter although at a slower rate than loans. |
| • | In BBVA Mexico, the liquidity situation remained sound in the first quarter of 2020. As in the previously mentioned geographical areas, as a result of theCOVID-19 crisis, there was an increase in the drawdowns of credit facilities, mainly by wholesale customers, which was largely offset by the increase in deposits, and ending the quarter with a comfortable position in all liquidity ratios. Regarding the measures taken by Banxico, in addition to reducing the monetary policy rate, it announced a reduction in the Monetary Regulation Deposit and the start of auctions of US dollars with credit institutions (swap line with the Fed). |
| • | In Garanti BBVA, the liquidity situation remained comfortable in the first quarter of 2020 with a similar contraction in foreign currency loans and deposits, while in the local currency there was similar growth in deposits and loans. As a result of theCOVID-19 crisis, there have been increases in some credit risk indicators in Turkey (Credit Default Swaps) which have led to increased collateral requirements that cover derivative valuations and wholesale funding. These increased collateral requirements have been met through the entity’s excess liquidity. Despite these outflows, Garanti BBVA maintains a sound liquidity buffer. |
| • | In South America, an adequate liquidity situation prevails throughout the region despite increased volatility in the financial markets in the last month. In Argentina, outflows of US dollar deposits in the banking system have been gradually declining over the first quarter. BBVA Argentina continues to maintain a sound liquidity position, as shown by the liquidity ratios. In Colombia, market volatility has resulted in an increase in customer bank deposits (improving the credit gap) by increasing the preference for liquidity and reducingoff-balance sheet funds (mutual funds). An adequate liquidity position also prevails in Peru. |
After two months of great stability at the start of 2020, the wholesalefunding markets in which the Group operates were affected by the events ofCOVID-19 and secondary prices suffered a material correction as a result of the increased volatility. This led to a significant increase in the issue premiums and levels of access to the primary market.
The main transactions carried out by the companies that form part of the BBVA Group in the first quarter of 2020 were:
| • | BBVA S.A. carried out two issuances of seniornon-preferred debt totaling €1,400m and a Tier 2 issuance totaling €1,000m (see the “Solvency” chapter of this report for more information). |
| • | In the United States, BBVA USA did not issue wholesale debt in the first quarter, in line with the funding plan. |
| • | In Mexico, a local senior issuance was successfully carried out in February for MXN 15,000m (€573m) in three tranches. Two tranches in Mexican pesos over 3 and 5 years (one for MXN 7,123m at the Interbank Equilibrium Interest Rate (TIIE) 28 plus 5 basis points and another for MXN 6,000m at TIIE 28 plus 15 basis points, respectively), and another tranche in US dollars over 3 years (USD 100m at3-month Libor plus 49 basis points). The purpose of this issuance was to bring forward the refinancing of maturities in the year, taking advantage of the good market conditions, as well as to strengthen the liquidity situation by offsetting the seasonal outflows of deposits in the early months of the year. |
| • | In Turkey, Garanti BBVA carried out a Tier 2 issuance for TRY 750m (see the “Solvency” chapter of this report for more information). |
Table of Contents
| 22 |
| • | In South America, there have been no issuances during the first quarter of 2020. |
Foreign exchange
Foreign exchange risk management of BBVA’s long-term investments, principally stemming from its overseas franchises, aims to preserve the Group’s capital adequacy ratios and ensure the stability of its income statement.
In the first quarter of 2020, foreign exchange markets have also been affected by the shock ofCOVID-19 spreading globally and its effects on the economy. As a result, after a good start to the year, the Mexican peso closed the first quarter with a depreciation of 18.9% against the euro. Another currency that has been hit hard by these conditions is the Colombian peso (down 17.3%), which like the Mexican peso has been affected by the sharp fall in oil prices. Other currency depreciations have been smaller: Chilean peso (down 9.3%), Turkish lira (down 7.2%), Argentine peso (down 4.7%) and Peruvian sol (down 0.9%). In contrast, the US dollar (up 2.5%) has appreciated against the euro in this environment. BBVA has maintained its policy of actively hedging its main investments in emerging markets, covering on average between 30% and 50% of annual earnings and around 70% of the CET1 capital ratio excess. Based on this policy, the sensitivity of the CET1 ratio to a 10% depreciation of the main emerging-market
currencies against the euro stood at-3 basis points for the Mexican peso and-3 basis points for the Turkish lira. In the case of the US dollar, the sensitivity to a depreciation of 10% against the euro is approximately +10 basis points, as a result of RWAs denominated in US dollars outside the United States. At the close of March, the coverage level for expected earnings for 2020 stood near 50% in Turkey, 100% in Mexico and also at a very high level in the case of Colombia.
Interest rate
The aim of managing interest-rate risk is to limit the sensitivity of the balance sheets to interest rate fluctuations. BBVA carries out this work through an internal procedure following the guidelines established by the European Banking Authority (EBA), which measures the sensitivity of net interest income and economic value to determine the potential impact of a range of scenarios on the Group’s different balance sheets.
The model is based on assumptions intended to realistically mimic the behavior of the balance sheet. Of particular relevance are assumptions regarding the behavior of accounts with no explicit maturity and prepayment estimates. These assumptions are reviewed and adapted at least once a year to take into account any changes in behavior.
At the aggregate level, BBVA continues to maintain a moderate risk profile, in line with the established target, showing a net interest income position which would be favored by an increase in interest rates, through effective management of structural balance sheet risk, taking into account the volatility in rates generated byCOVID-19 in the second part of the quarter, this having virtually no effect due to the sound recurrence of the income.
By area, the main features are:
| • | Spain and the United States have balance sheets characterized by a high proportion of variable-rate loans in the loan portfolio (basically, mortgages in Spain and corporate lending in both countries) and liability composed mainly of customer deposits. The ALCO portfolios act as hedging for the bank’s balance sheet, mitigating its sensitivity to interest rate fluctuations. The profile of both balance sheets has remained stable during the first quarter of 2020, with a moderate increase in the sensitivity of net interest income in the United States due to higher forecasts for prepayments in mortgage assets in the face of falling market rates. |
In addition, European benchmark interest rates (Euribor) have continued to fall slightly from the close of 2019 tomid-March, recovering since then by around20-30 basis points (depending on the maturity). This has mainly been the result of two aspects: first, the adjustment of expectations after the European Central Bank maintained the marginal deposit facility rate at-0.50% when the market had discounted a reduction; second, the increase in the required credit spread (since Euribor is anon-collateralized interest rate) and the illiquidity or lack of transactions in the commercial paper market. In the United States, benchmark rates (Libor) have fallen in the quarter(-75 basis points for the1-month benchmark,-100 basis points for the12-month benchmark) following the Fed’s rate cuts.
| • | Mexico continues to show a balance between the balance sheet items benchmarked at fixed and variable interest rates. In terms of the assets most sensitive to interest rate fluctuations, the corporate portfolio stands out, while consumer loans and mortgages are mostly at a fixed rate. The ALCO portfolio is used to neutralize the longer duration of customer deposits. The sensitivity of net interest income continues to be limited and stable in 2020, considering the new interest rate scenario that emerged in March, where the market is discounting lower benchmark rates throughout 2020 compared to the start of the quarter. The variation has been significantly lower for longer maturities. |
| • | In Turkey, the interest rate risk (broken down into Turkish lira and US dollars) was very limited: on the asset side, the sensitivity of loans, mostly fixed rate but with relatively short maturities and the ALCO portfolio, including inflation-linked bonds, is balanced by the sensitivity of deposits, which arere-priced in the short term, in liabilities. The evolution of the currency balance sheets was positive in the year, showing a reduction in the sensitivity of the net interest income. In this new scenario, the market is discounting a benchmark rate below that discounted at the beginning of the quarter. |
| • | In South America, the interest rate risk remained low due to the fixed/variable composition and maturities being very similar for assets and liabilities in most countries in the region. In addition, in balance sheets with several |
Table of Contents
| 23 |
currencies, interest rate risk is managed for each of the currencies, showing a very low level of risk. Balance sheet profiles in the countries that make up this business area remain stable, maintaining a near-constant and limited net interest income sensitivity throughout 2020. Central bank reactions have shown a benchmark rate path below that expected at the beginning of the quarter. |
Table of Contents
| 24 |
At BBVA we have adistinct banking model, anchored in our purpose: to bring the age of opportunity to everyone. This model is based on the pursuit of profitability grounded on principles, strict compliance with legal regulations, good practices, and the creation of long-term value for all stakeholders.
The key strategicinitiatives of responsible banking are:
| • | Creating lasting and more balanced relations with our customers via transparent, clear and responsible communications, and supporting financial literacy in all of the solutions that we offer. |
| • | A fully integrated approach to doing business via responsible business policies, a reputational risk model and people-centric culture throughout the organization. |
| • | Supporting responsible and sustainable growth via financial inclusion, sustainable financing, support for SMEs and responsible investment. |
| • | Investment in the community, prioritizing financial literacy initiatives, entrepreneurship, learning, and other locally significant social causes. |
In addition to the business continuity and financial support measures for the commercial and private sector in the light of the situation caused byCOVID-19 mentioned at the beginning of this report, BBVA has stepped up efforts tohelp society in its fight against theCOVID-19 pandemic. This is in the form of a pledge to make a donation of around€35m in the countries in which the company operates, providing support to health authorities and social organizations and promoting scientific research.
In addition to this institutional donation, BBVA has launched an initiative among its employees in Spain so that they can join in solidarity with providing aid against the pandemic. Employees who want to join this cause can do so through the“Your contribution is worth double” campaign, where for every euro contributed by an employee, the Bank contributes another euro. This campaign has been implemented gradually in the countries in which the Group operates. The funds raised are used in the fight against the virus in three lines of action:
| • | Providing medical equipment and resources to the public health systems in each country where the Group operates. |
| • | Supporting the most vulnerable population in their basic needs. |
| • | Promoting scientific research on the virus and its treatment. |
Regardingsuppliers, BBVA has supported the closest ones with protection schemes for employees and companies, and advancing payment of bills without waiting until the agreed payment date.
For its part, in order to maintain a balanced relationship with its customers, in addition to advancing transparency and clarity in recent years, BBVA has placed emphasis on promoting thefinancial health of its customers. Financial health is defined as the dynamic relationship between health and personal finance and is reached when the individual makes decisions and adopts behaviors, routines and habits that allow him or her to be in a better financial situation to overcome crises and achieve their objectives.
In the area of sustainable finance, BBVA has mobilized around €30 billion since the launch of its2025 Pledge, which represents 30% of the total pledge. On the other hand, the Bank set an internal price on its CO2 emissions from January 1 and pledged to be carbon neutral in 2020.
With regard to responsible practices with employees, on International Women’s Day, BBVA held a week of events dedicated to commemorating the organization’s progress ingender diversity. The Bank has identified three major areas to act on in order to foster women’s talent: the elimination of unconscious biases in recruitment processes, visibility of women’s talent, and balancing professional opportunities for men and women. It should be noted that in the first quarter of 2020, BBVA was included in the Bloomberg Gender-Equality Index for the third consecutive year.
BBVA is present on other internationalsustainability indexes or Environmental, Social and Governance (ESG) indexes, which evaluate companies’ performance in these areas. As of March 31, 2020, the main sustainability indexes in which BBVA is included are: Dow Jones Sustainability Indices, as member of the DJSI World and DJSI Europe Indexes; MSCI1, being listed on the MSCI ESG Leaders Indexes; FTSE4Good, being listed on the FTSE4Good Index Series; Euronext Vigeo, as listed entity of the Euronext Vigeo Eurozone 120 and Europe 120 Indexes; and Ethibel Sustainability Excellence, namely the Ethibel Sustainability Excellence Europe and Ethibel Sustainability Excellence Global Indexes.
Finally, in terms of community investment, BBVA allocated €113.8m tosocial initiatives in 2019, which benefited more than 11.4 million people. This figure represents 2.4% of the net attributable profit for that financial year. Through social programs, BBVA acts as an engine of opportunities for people, and seeks to have a positive impact on their lives, with regard to vulnerable people in particular.
| 1 | The inclusion of BBVA in any MSCI index, and the use of logos, trademarks, service marks or index names herein does not constitute the sponsorship or promotion of BBVA by MSCI or any of its subsidiaries. The MSCI indexes are the exclusive property of MSCI. MSCI and the MSCI indexes and logos are trademarks or service marks of MSCI or its subsidiaries. |
Table of Contents
| 25 |
This section presents and analyzes the most relevant aspects of the Group’s different business areas. Specifically, for each one of them, it shows a summary
of the income statement and balance sheet, the business activity figures and the most significant ratios.
In the first quarter of 2020, BBVA Group’s business areasreporting structure basically continued to be the same as the one presented at the end of 2019. BBVA Group’s business areas are summarized below:
| • | Spain mainly includes the banking and insurance businesses that the Group carries out in this country. |
| • | The United States includes the business in BBVA USA and the activity of the BBVA, S.A. branch in New York. |
| • | Mexico includes banking and insurance businesses in this country, as well as the activity that BBVA Mexico carries out through its branch in Houston. |
| • | Turkey reports the activity of the group Garanti BBVA that is mainly carried out in this country and, to a lesser extent, in Romania and the Netherlands. |
| • | South America basically includes banking and insurance businesses in the region. With respect to the agreement reached with Banco GNB Paraguay, S.A., for the sale of BBVA Paraguay, the closing of the transaction is subject to obtaining the regulatory authorizations from the competent authorities. |
| • | Rest of Eurasia includes the banking business activity carried out in Asia and in Europe, excluding Spain. |
TheCorporate Center contains the centralized functions of the Group, including: the costs of the head offices with a corporate function; management of structural exchange rate positions; some equity instruments issuances to ensure an adequate management of the Group’s global solvency. It also includes portfolios whose management is not linked to customer relationships, such as industrial holdings; certain tax assets and liabilities; funds due to commitments to employees; goodwill and other intangible assets.
In addition to these geographical breakdowns, supplementary information is provided for the wholesale business carried out by BBVA,Corporate & Investment Banking (CIB), in the countries where it operates. This business is relevant to have a broader understanding of the Group’s activity and results due to the important features of the type of customers served, products offered and risks assumed.
Theinformation by business area is based on units at the lowest level and/or companies that comprise the Group, which are assigned to the different areas according to the main region or company group in which they carry out their activity.
As usual, in the case of the different business areas in America, in Turkey and CIB, the results of applying constantexchange ratesare given as well as theyear-on-year variations at current exchange rates.
Table of Contents
| 26 |
MAIN INCOME STATEMENT LINE ITEMS BY BUSINESS AREA (MILLIONS OF EUROS) |
| |||||||||||||||||||||||||||||||||||
| Business areas | ||||||||||||||||||||||||||||||||||||
| BBVA Group | Spain | The United States | Mexico | Turkey | South America | Rest of Eurasia | S Business areas | Corporate Center | ||||||||||||||||||||||||||||
31-03-20 | ||||||||||||||||||||||||||||||||||||
Net interest income | 4,556 | 873 | 549 | 1,545 | 819 | 763 | 47 | 4,598 | (41 | ) | ||||||||||||||||||||||||||
Gross income | 6,484 | 1,506 | 814 | 1,991 | 1,073 | 863 | 126 | 6,373 | 111 | |||||||||||||||||||||||||||
Operating income | 3,566 | 728 | 315 | 1,330 | 763 | 473 | 53 | 3,664 | (98 | ) | ||||||||||||||||||||||||||
Profit/(loss) before tax | (1,435 | ) | (196 | ) | (112 | ) | 545 | 340 | 137 | 59 | 772 | (2,207 | ) | |||||||||||||||||||||||
Net attributable profit | (1,792 | ) | (141 | ) | (100 | ) | 372 | 129 | 70 | 44 | 374 | (2,166 | ) | |||||||||||||||||||||||
31-03-19 | ||||||||||||||||||||||||||||||||||||
Net interest income | 4,398 | 859 | 615 | 1,500 | 695 | 760 | 40 | 4,469 | (71 | ) | ||||||||||||||||||||||||||
Gross income | 6,046 | 1,475 | 804 | 1,902 | 884 | 985 | 104 | 6,153 | (107 | ) | ||||||||||||||||||||||||||
Operating income | 3,124 | 661 | 331 | 1,268 | 571 | 606 | 34 | 3,471 | (346 | ) | ||||||||||||||||||||||||||
Profit/(loss) before tax | 1,957 | 482 | 160 | 877 | 368 | 417 | 23 | 2,327 | (370 | ) | ||||||||||||||||||||||||||
Net attributable profit | 1,182 | 345 | 127 | 627 | 142 | 193 | 16 | 1,450 | (268 | ) | ||||||||||||||||||||||||||
General note: as a result of the decision taken by the International Financial Reporting Standards Interpretations Committee (IFRIC) regarding the collecting of interests ofwritten-off financial assets for the purpose of IFRS 9, those collections are presented as reduction of the credit allowances and not as a higher interest income, recognition method applied until December 2019. Therefore, and in order to make the information comparable, the quarterly information of the 2019 income statements has been restated. |
| |||||||||||||||||||||||||||||||||||
GROSS INCOME(1) AND OPERATING INCOME(1) BREAKDOWN(PERCENTAGE. 1Q20) |
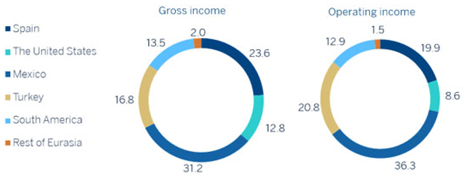
| (1) | Excludes the Corporate Center. |
Table of Contents
| 27 |
MAIN BALANCE-SHEET ITEMS AND RISK-WEIGHTED ASSETS BY BUSINESS AREA (MILLIONS OF EUROS) |
| |||||||||||||||||||||||||||||||||||||||||||
| Business areas | S Business areas | |||||||||||||||||||||||||||||||||||||||||||
| BBVA Group | Spain | The United States | Mexico | Turkey | South America | Rest of Eurasia | Corporate Center | Deletions | NCA&L (1) | |||||||||||||||||||||||||||||||||||
31-03-20 | ||||||||||||||||||||||||||||||||||||||||||||
Loans and advances to customers | 382,592 | 168,342 | 69,619 | 50,484 | 39,916 | 34,202 | 22,248 | 384,811 | 353 | (1,362 | ) | (1,211 | ) | |||||||||||||||||||||||||||||||
Deposits from customers | 385,050 | 186,327 | 70,917 | 49,072 | 41,058 | 35,949 | 5,138 | 388,462 | 323 | (2,227 | ) | (1,509 | ) | |||||||||||||||||||||||||||||||
Off-balance sheet funds | 96,438 | 58,528 | — | 20,617 | 3,863 | 12,935 | 495 | 96,438 | — | — | — | |||||||||||||||||||||||||||||||||
Total assets/liabilities and equity | 730,923 | 413,193 | 99,077 | 104,201 | 63,504 | 54,772 | 26,543 | 761,290 | 41,227 | (71,593 | ) | — | ||||||||||||||||||||||||||||||||
RWAs | 368,654 | 110,929 | 68,765 | 53,522 | 59,163 | 44,876 | 18,878 | 356,134 | 12,520 | — | — | |||||||||||||||||||||||||||||||||
31-12-19 | ||||||||||||||||||||||||||||||||||||||||||||
Loans and advances to customers | 382,360 | 167,332 | 63,162 | 58,081 | 40,500 | 35,701 | 19,669 | 384,445 | 813 | (1,692 | ) | (1,205 | ) | |||||||||||||||||||||||||||||||
Deposits from customers | 384,219 | 182,370 | 67,525 | 55,934 | 41,335 | 36,104 | 4,708 | 387,976 | 308 | (2,598 | ) | (1,467 | ) | |||||||||||||||||||||||||||||||
Off-balance sheet funds | 107,803 | 66,068 | — | 24,464 | 3,906 | 12,864 | 500 | 107,803 | — | — | — | |||||||||||||||||||||||||||||||||
Total assets/liabilities and equity | 698,690 | 365,380 | 88,529 | 109,079 | 64,416 | 54,996 | 23,257 | 705,656 | 49,886 | (56,852 | ) | — | ||||||||||||||||||||||||||||||||
RWAs | 364,448 | 104,911 | 65,170 | 59,299 | 56,642 | 45,413 | 17,989 | 349,422 | 15,026 | — | — | |||||||||||||||||||||||||||||||||
(1) Non-current assets and liabilities held for sale (NCA&L) from the BBVA Paraguay. |
| |||||||||||||||||||||||||||||||||||||||||||
The balance sheet includes a column, which represents thedeletions and balance sheet adjustments between the different business areas, especially in terms of the relationship between the areas in which the parent company operates, i.e. Spain, Rest of Eurasia, the United States and the Corporate Center.
Table of Contents
| 28 |
Highlights
| • | Positive evolution in the consumer and corporate banking portfolios in the quarter. |
| • | Year-on-year growth in recurring income. |
| • | Reduction of operating expenses. |
| • | Net attributable profit affected by the significant increase in the impairment on financial assets line. |
BUSINESS ACTIVITY(1) (YEAR-ON-YEAR CHANGE. DATA AS OF31-03-20)
| NET INTEREST INCOME/ATAS (PERCENTAGE)
|
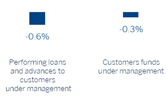
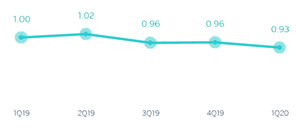
| (1) | Excluding repos. |
OPERATING INCOME (MILLIONS OF EUROS)
| NET ATTRIBUTABLE PROFIT (MILLIONS OF EUROS)
|

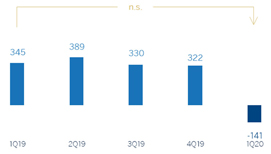
Table of Contents
| 29 |
FINANCIAL STATEMENTS AND RELEVANT BUSINESS INDICATORS (MILLIONS OF EUROS AND PERCENTAGE) |
| |||||||||||
Income statement | 1Q20 | D % | 1Q19 | |||||||||
Net interest income | 873 | 1.7 | 859 | |||||||||
Net fees and commissions | 469 | 13.4 | 413 | |||||||||
Net trading income | 61 | (44.0 | ) | 108 | ||||||||
Other operating income and expenses | 103 | 10.1 | 94 | |||||||||
of which: Insurance activities(1) | 119 | (8.3 | ) | 130 | ||||||||
Gross income | 1,506 | 2.2 | 1,475 | |||||||||
Operating expenses | (778 | ) | (4.4 | ) | (814 | ) | ||||||
Personnel expenses | (440 | ) | (6.8 | ) | (472 | ) | ||||||
Other administrative expenses | (223 | ) | 0.3 | (222 | ) | |||||||
Depreciation | (115 | ) | (3.7 | ) | (119 | ) | ||||||
Operating income | 728 | 10.3 | 661 | |||||||||
Impairment on financial assets not measured at fair value through profit or loss | (660 | ) | n.s. | (55 | ) | |||||||
Provisions or reversal of provisions and other results | (265 | ) | 115.4 | (123 | ) | |||||||
Profit/(loss) before tax | (196 | ) | n.s. | 482 | ||||||||
Income tax | 57 | n.s. | (137 | ) | ||||||||
Profit/(loss) for the year | (140 | ) | n.s. | 346 | ||||||||
Non-controlling interests | (1 | ) | 47.5 | (1 | ) | |||||||
Net attribbutable profit | (141 | ) | n.s. | 345 | ||||||||
| (1) | Includes premiums received net of estimated technical insurance reserves. |
Balance sheets | 31-03-20 | D % | 31-12-19 | |||||||||
Cash, cash balances at central banks and other demand deposits | 20,057 | 26.1 | 15,903 | |||||||||
Financial assets designated at fair value | 155,484 | 26.6 | 122,844 | |||||||||
Of which: Loans and advances | 42,671 | 24.9 | 34,175 | |||||||||
Financial assets at amortized cost | 198,606 | 1.7 | 195,260 | |||||||||
of which: Loans and advances to customers | 168,342 | 0.6 | 167,332 | |||||||||
Inter-area positions | 28,467 | 31.6 | 21,637 | |||||||||
Tangible assets | 3,219 | (2.5 | ) | 3,302 | ||||||||
Other assets | 7,362 | 14.4 | 6,436 | |||||||||
Total assets/liabilities and equity | 413,193 | 13.1 | 365,380 | |||||||||
Financial liabilities held for trading and designated at fair value through profit or loss | 109,856 | 39.6 | 78,684 | |||||||||
Deposits from central banks and credit institutions | 55,280 | 34.5 | 41,092 | |||||||||
Deposits from customers | 186,327 | 2.2 | 182,370 | |||||||||
Debt certificates | 37,360 | 5.2 | 35,520 | |||||||||
Inter-area positions | — | — | — | |||||||||
Other liabilities | 14,687 | (20.5 | ) | 18,484 | ||||||||
Economic capital allocated | 9,683 | 4.9 | 9,229 | |||||||||
Relevant business indicators | 31-03-20 | D % | 31-12-19 | |||||||||
Performing loans and advances to customers under management(1) | 165,786 | 1.0 | 164,140 | |||||||||
Non-performing loans | 8,413 | (2.6 | ) | 8,635 | ||||||||
Customer deposits under management(1) | 186,327 | 2.2 | 182,370 | |||||||||
Off-balance sheet funds(2) | 58,528 | (11.4 | ) | 66,068 | ||||||||
Risk-weighted assets | 110,929 | 5.7 | 104,911 | |||||||||
Efficiency ratio (%) | 51.6 | 57.5 | ||||||||||
NPL ratio (%) | 4.3 | 4.4 | ||||||||||
NPL coverage ratio (%) | 66 | 60 | ||||||||||
Cost of risk (%) | 1.54 | 0.08 | ||||||||||
(1) Excluding repos. |
| |||||||||||
(2) Includes mutual funds, pension funds and otheroff-balance sheet funds. |
| |||||||||||
Table of Contents
| 30 |
Activity
The most relevant aspects related to the area’s activity during the first quarter of 2020 were:
| • | Thelending activity (performing loans under management) was 1.0% higher than at the end of 2019. The reduction in mortgage loans and credit cards was largely offset by higher balances in consumer (up 2.5%) and corporate banking (up 7.3%), where there was an increase in the availability of wholesale customer credit facilities toward the end of the quarter, triggered by the confinement decreed by the Government of Spain inmid-March 2020 as a result of the health crisis caused byCOVID-19. The balances in the retail business and SMEs remained stable. |
| • | In terms ofasset quality, thenon-performing loan ratio stood at 4.3% and the NPL coverage ratio at 66%. |
| • | Total customerfunds decreased by 1.4% from the end of 2019, resulting from two opposing trends: while customerdeposits under management increased by 2.2%,off-balance sheet funds recorded a negative trend (down 11.4%) due to negative behavior of the markets. |
Results
Spain generated anet attributable loss of €141m during the first quarter of 2020, compared to a profit of €345m in the same period the previous year, due to an increase in impairment on financial assets, as the operating income increased by 10.3% compared to the same period in 2019.
The main highlights of the area’s income statement are:
| • | Thenet interest income increased from the first quarter of the previous year (up 1.7%), mainly due to the greater contribution of the ALCO portfolios. |
| • | Net fees and commissions performed well (up 13.4%year-on-year), strongly supported by asset management commissions. |
| • | NTI contribution was lower (down 44.0%) mainly due to lower ALCO portfolio contributions as well as irregular market performance during the first quarter as a result of the health crisis. |
| • | Other operating income and expenses recorded a growth of 10.1% with respect to the first quarter of 2019, due to lower costs associated with foreclosed properties. |
| • | The downward trend inoperating expenses (down 4.4%year-on-year) continued as a result of the cost reduction plans. As a result, theefficiency ratio stood at 51.6% compared to 55.2% registered during the same period in the previous year. |
| • | Theimpairment on financial assets increased by €605m compared to the first quarter of 2019, mainly due to the negative impact of €517m from the deterioration of the macro scenario caused byCOVID-19, which includes loan-loss provisions for the most affected sectors. The comparison is also affected by the portfolio sales last year. |
| • | Finally,provisions and other results closed at €-265m, or 115.4% above the previous year, where the provisions derived from the rates applied in theso-called revolving credit cards are noteworthy. |
Table of Contents
| 31 |
Highlights
| • | Activity driven by the dynamic performance of the commercial portfolio and corporate banking in the quarter. |
| • | Net interest income affected by the Fed’s rate cuts. |
| • | Good performance of fees and commissions and excellent NTI results. |
| • | Net attributable profit affected by the significant increase in the impairment on financial assets line. |
BUSINESS ACTIVITY(1) (YEAR-ON-YEAR CHANGE AT CONSTANT EXCHANGE RATE. DATA AS OF31-03-20) | NET INTEREST INCOME/ATAS (PERCENTAGE. CONSTANT EXCHANGE RATE) | |||
(1) Excluding repos. |
|
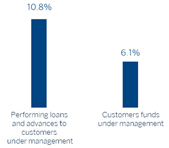
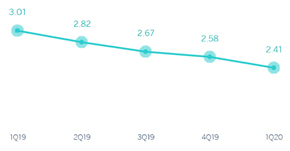
OPERATING INCOME (MILLIONS OF EUROS AT CONSTANT EXCHANGE RATE) | NET ATTRIBUTABLE PROFIT (MILLIONS OF EUROS AT CONSTANT EXCHANGE RATE) | |||
(1) At current exchange rate:-4.8%. |
(1) At current exchange rate: n.s. |
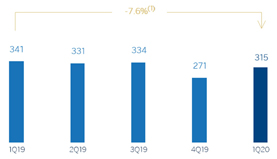

Table of Contents
| 32 |
FINANCIAL STATEMENTS AND RELEVANT BUSINESS INDICATORS
(MILLIONS OF EUROS AND PERCENTAGE)
Income statement | 1Q20 | D % | D % (1) | 1Q19 | ||||||||||||
Net interest income | 549 | (10.7 | ) | (13.3 | ) | 615 | ||||||||||
Net fees and commissions | 176 | 16.9 | 13.5 | 151 | ||||||||||||
Net trading income | 93 | 128.4 | 122.0 | 41 | ||||||||||||
Other operating income and expenses | (4 | ) | 51.4 | 46.5 | (3 | ) | ||||||||||
Gross income | 814 | 1.3 | (1.7 | ) | 804 | |||||||||||
Operating expenses | (499 | ) | 5.5 | 2.4 | (473 | ) | ||||||||||
Personnel expenses | (299 | ) | 7.8 | 4.6 | (278 | ) | ||||||||||
Other administrative expenses | (147 | ) | 5.2 | 2.2 | (140 | ) | ||||||||||
Depreciation | (53 | ) | (5.1 | ) | (7.9 | ) | (55 | ) | ||||||||
Operating income | 315 | (4.8 | ) | (7.6 | ) | 331 | ||||||||||
Impairment on financial assets not measured at fair value through profit or loss | (426 | ) | 163.9 | 156.2 | (162 | ) | ||||||||||
Provisions or reversal of provisions and other results | (1 | ) | (91.4 | ) | (91.6 | ) | (10 | ) | ||||||||
Profit/(loss) before tax | (112 | ) | n.s. | n.s. | 160 | |||||||||||
Income tax | 12 | n.s. | n.s. | (32 | ) | |||||||||||
Profit/(loss) for the year | (100 | ) | n.s. | n.s. | 127 | |||||||||||
Non-controlling interests | — | — | — | — | ||||||||||||
Net attributable profit | (100 | ) | n.s. | n.s. | 127 | |||||||||||
Balance sheets | 31-03-20 | D % | D % (1) | 31-12-19 | ||||||||||||
Cash, cash balances at central banks and other demand deposits | 10,668 | 28.6 | 25.5 | 8,293 | ||||||||||||
Financial assets designated at fair value | 7,674 | 0.2 | (2.3 | ) | 7,659 | |||||||||||
Of which: Loans and advances | 346 | 32.5 | 29.2 | 261 | ||||||||||||
Financial assets at amortized cost | 77,134 | 11.0 | 8.2 | 69,510 | ||||||||||||
Of which: Loans and advances to customers | 69,619 | 10.2 | 7.5 | 63,162 | ||||||||||||
Inter-area positions | — | — | — | — | ||||||||||||
Tangible assets | 933 | 2.1 | (0.4 | ) | 914 | |||||||||||
Other assets | 2,668 | 23.9 | 20.9 | 2,153 | ||||||||||||
Total assets/liabilities and equity | 99,077 | 11.9 | 9.1 | 88,529 | ||||||||||||
Financial liabilities held for trading and designated at fair value through profit or loss | 633 | 124.9 | 119.3 | 282 | ||||||||||||
Deposits from central banks and credit institutions | 4,405 | 7.9 | 5.3 | 4,081 | ||||||||||||
Deposits from customers | 70,917 | 5.0 | 2.4 | 67,525 | ||||||||||||
Debt certificates | 3,458 | (2.6 | ) | (5.0 | ) | 3,551 | ||||||||||
Inter-area positions | 9,398 | 175.1 | 168.3 | 3,416 | ||||||||||||
Other liabilities | 6,397 | 9.7 | 7.0 | 5,831 | ||||||||||||
Economic capital allocated | 3,869 | 0.7 | (1.8 | ) | 3,843 | |||||||||||
Relevant business indicators | 31-03-20 | D % | D % (1) | 31-12-19 | ||||||||||||
Performing loans and advances to customers under management(2) | 70,117 | 10.9 | 8.1 | 63,241 | ||||||||||||
Non-performing loans | 740 | 1.4 | (1.1 | ) | 730 | |||||||||||
Customer deposits under management(2) | 70,914 | 5.0 | 2.4 | 67,528 | ||||||||||||
Off-balance sheet funds(3) | — | — | — | — | ||||||||||||
Risk-weighted assets | 68,765 | 5.5 | 2.9 | 65,170 | ||||||||||||
Efficiency ratio (%) | 61.3 | 61.0 | ||||||||||||||
NPL ratio (%) | 1.0 | 1.1 | ||||||||||||||
NPL coverage ratio (%) | 142 | 101 | ||||||||||||||
Cost of risk (%) | 2.60 | 0.88 | ||||||||||||||
| (1) | Figures at constant exchange rate. |
| (2) | Excluding repos. |
| (3) | Includes mutual funds, pension funds and otheroff-balance sheet funds. |
Table of Contents
| 33 |
Activity
Unless expressly stated otherwise, all the comments below on rates of change, for both activity and earnings, will be given at constant exchange rates. These rates, together with the changes at the current exchange rates, can be found in the attached tables of financial statements and relevant business indicators.
The most relevant aspects related to the area’s activity during the first quarter of 2020 were:
| • | TheLending activity for the area (performing loans under management) increased both in the quarter and over the same period in the previous year (up 8.1% and up 10.8%, respectively), mainly due to the dynamism of the commercial portfolio and corporate banking, where an increase in the drawing down of credit facilities has been observed toward the end of the first quarter. The rest of theretail portfolio remained virtually unchanged over the quarter (down 0.3%), with increases in the consumer and credit card portfolios. |
| • | In terms of therisk indicators, the NPL ratio remained virtually unchanged over the quarter and closed at 1.0% as of March 31, 2020. The NPL coverage ratio improved to 142%. |
| • | Customerdeposits under management increased by 2.4% in the quarter, explained by an increase in demand deposits (up 5.5%), which offset the decrease in time deposits (down 9.0%). |
Results
The United States generated a net attributableloss of €100m during the first quarter of 2020, compared to the profit of €127m in the same period of the previous year. The most relevant aspects related to the income statement are summarized below:
| • | Net interest income fell by 13.3%year-on-year, impacted by interest rate cuts, for a total of 225 basis points, made by the Fed since the first quarter 2019. |
| • | Net fees and commissions closed with an increase of 13.5% compared to the same period in the previous year, due mainly to the increase in those relating to investment banking and retail establishments. |
| • | NTI contribution increased (up 122.0%year-on-year) as a result of higher capital gains from the sale of ALCO portfolios. |
| • | Operating expenses increased (up 2.4%year-on-year), mainly due to the growth in personnel expenses. |
| • | Increase in theimpairment on financial assets (up 156.2%year-on-year), fundamentally related to the adjustment in the macro scenario due to the negative effects ofCOVID-19 and, to a lesser extent, to higher loan-loss provisions to cover specific clients from the Oil & Gas sector, for an aggregated amount of €280m. Consequently, the cumulative cost of risk as of March 2020 increased to 2.60%, compared to 1.06 % as of March 2019. |
| • | Finally, the heading ofprovisions and other results closed at €-1m, including provisions as a consequence ofCOVID-19 amounting to €23m. |
Table of Contents
| 34 |
Highlights
| • | Good performance of lending activity, supported by the strength of the wholesale portfolio. |
| • | Positive evolution of customer funds, both demand and time deposits. |
| • | Strong operating income. |
| • | Net attributable profit affected by the significant increase in the impairment on financial assets line. |
BUSINESS ACTIVITY(1) (YEAR-ON-YEAR CHANGE AT CONSTANT EXCHANGE RATE. DATA AS OF31-03-20) | NET INTEREST INCOME/ATAS (PERCENTAGE. CONSTANT EXCHANGE RATE) | |||
(1) Excluding repos. |
|

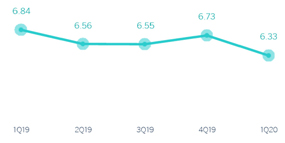
OPERATING INCOME (MILLIONS OF EUROS AT CONSTANT EXCHANGE RATE) | NET ATTRIBUTABLE PROFIT (MILLIONS OF EUROS AT CONSTANT EXCHANGE RATE) | |||
(1) At current exchange rate: +4.9%. |
(1) At current exchange rate:-40.6%. |
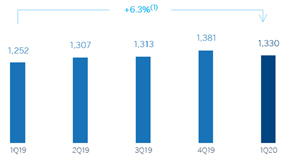
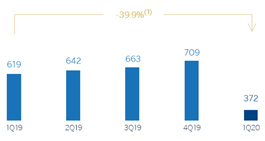
Table of Contents
| 35 |
FINANCIAL STATEMENTS AND RELEVANT BUSINESS INDICATORS
(MILLIONS OF EUROS AND PERCENTAGE)
Income statement | 1Q20 | D % | D % (1) | 1Q19 | ||||||||||||
Net interest income | 1,545 | 3.0 | 4.4 | 1,500 | ||||||||||||
Net fees and commissions | 296 | (1.4 | ) | (0.1 | ) | 300 | ||||||||||
Net trading income | 78 | 25.1 | 26.7 | 63 | ||||||||||||
Other operating income and expenses | 71 | 78.5 | 80.8 | 40 | ||||||||||||
Gross income | 1,991 | 4.6 | 6.0 | 1,902 | ||||||||||||
Operating expenses | (660 | ) | 4.1 | 5.5 | (634 | ) | ||||||||||
Personnel expenses | (286 | ) | 6.3 | 7.7 | (269 | ) | ||||||||||
Other administrative expenses | (289 | ) | 2.7 | 4.1 | (281 | ) | ||||||||||
Depreciation | (86 | ) | 1.8 | 3.1 | (84 | ) | ||||||||||
Operating income | 1,330 | 4.9 | 6.3 | 1,268 | ||||||||||||
Impairment on financial assets not measured at fair value through profit or loss | (773 | ) | 95.9 | 98.5 | (395 | ) | ||||||||||
Provisions or reversal of provisions and other results | (13 | ) | n.s. | n.s. | 4 | |||||||||||
Profit/(loss) before tax | 545 | (37.9 | ) | (37.1 | ) | 877 | ||||||||||
Income tax | (172 | ) | (31.1 | ) | (30.2 | ) | (250 | ) | ||||||||
Profit/(loss) for the year | 372 | (40.6 | ) | (39.9 | ) | 627 | ||||||||||
Non-controlling interests | — | — | — | — | ||||||||||||
Net attributable profit | 372 | (40.6 | ) | (39.9 | ) | 627 | ||||||||||
Balance sheets | 31-03-20 | D % | D % (1) | 31-12-19 | ||||||||||||
Cash, cash balances at central banks and other demand deposits | 5,848 | (9.9 | ) | 11.2 | 6,489 | |||||||||||
Financial assets designated at fair value | 34,750 | 10.7 | 36.5 | 31,402 | ||||||||||||
Of which: Loans and advances | 990 | 27.4 | 57.2 | 777 | ||||||||||||
Financial assets at amortized cost | 58,839 | (11.1 | ) | 9.7 | 66,180 | |||||||||||
Of which: Loans and advances to customers | 50,484 | (13.1 | ) | 7.2 | 58,081 | |||||||||||
Tangible assets | 1,598 | (21.0 | ) | (2.5 | ) | 2,022 | ||||||||||
Other assets | 3,166 | 6.0 | 30.8 | 2,985 | ||||||||||||
Total assets/liabilities and equity | 104,201 | (4.5 | ) | 17.8 | 109,079 | |||||||||||
Financial liabilities held for trading and designated at fair value through profit or loss | 25,598 | 17.5 | 45.0 | 21,784 | ||||||||||||
Deposits from central banks and credit institutions | 3,270 | 54.4 | 90.5 | 2,117 | ||||||||||||
Deposits from customers | 49,072 | (12.3 | ) | 8.2 | 55,934 | |||||||||||
Debt certificates | 8,879 | 0.4 | 23.9 | 8,840 | ||||||||||||
Other liabilities | 11,831 | (23.7 | ) | (5.9 | ) | 15,514 | ||||||||||
Economic capital allocated | 5,551 | 13.5 | 40.1 | 4,889 | ||||||||||||
Relevant business indicators | 31-03-20 | D % | D % (1) | 31-12-19 | ||||||||||||
Performing loans and advances to customers under management(2) | 51,172 | (12.7 | ) | 7.7 | 58,617 | |||||||||||
Non-performing loans | 1,251 | (15.4 | ) | 4.4 | 1,478 | |||||||||||
Customer deposits under management(2) | 48,937 | (11.6 | ) | 9.1 | 55,331 | |||||||||||
Off-balance sheet funds(3) | 20,617 | (15.7 | ) | 4.0 | 24,464 | |||||||||||
Risk-weighted assets | 53,522 | (9.7 | ) | 11.3 | 59,299 | |||||||||||
Efficiency ratio (%) | 33.2 | 32.9 | ||||||||||||||
NPL ratio (%) | 2.3 | 2.4 | ||||||||||||||
NPL coverage ratio (%) | 155 | 136 | ||||||||||||||
Cost of risk (%) | 5.30 | 3.01 | ||||||||||||||
| (1) | Figures at constant exchange rate. |
| (2) | Excluding repos. |
| (3) | Includes mutual funds, pension funds and otheroff-balance sheet funds. |
Table of Contents
| 36 |
Activity
Unless expressly stated otherwise, all the comments below on rates of change, for both activity and earnings, will be given at constant exchange rates. These rates, together with changes at current exchange rates, can be found in the attached tables of financial statements and relevant business indicators.
The most important developments in relation to activity in the area during the first three months of 2020 have been:
| • | Lending activity (performing loans under management) grew 7.7% in the quarter, supported by the performance of the wholesale portfolio and without any significant impacts fromCOVID-19 having yet materialized. |
| • | Thewholesale portfolio increased 15.2%, mainly driven by the depreciation of the Mexican peso against the US dollar, which especially benefited the corporate portfolio due to its higher percentage of US dollar-denominated loans and therefore increased by 16.9% in the quarter. Theretail portfolio remained flat during the first three months of 2020 (up 0.2%), thanks to the stability in consumer loans (payroll and auto loans, mainly) and mortgages that grew 1.0% and 1.3%, respectively, compared to December 2019. |
| • | Theasset quality indicators improved compared to December 2019. As a result, the NPL ratio stood at 2.3% and the coverage ratio at 155%. |
| • | Total customerfunds (customer deposits under management, mutual funds and otheroff-balance sheet funds) grew by 7.5% in the quarter. The increase is explained by a rise in both demand deposits and time deposits (up 9.1%), partly benefiting from the depreciation of the Mexican peso, as well as the positive trend in mutual funds (up 4.3%). |
Results
BBVA Mexico achieved a net attributableprofit of €372m in the first quarter of 2020, which is a 39.9% reduction compared to the same quarter in the previous year. This was due to an increase in the impairment on financial assets, as the area’s operating income grew by 6.3% compared to the same quarter in 2019. The most relevant aspects related to the income statement are summarized below:
| • | Net interest income grew by 4.4%year-on-year, mainly due to the increase in volumes in both the wholesale and retail portfolios. |
| • | Net fees and commissions remained flat (down 0.1%), as a result of the bank’s ongoing review and reduction of fees for the benefit of customers. |
| • | NTI performed strongly, with ayear-on-year growth of 26.7%. This was mainly a result of the performance of the BBVA Seguros portfolio in Mexico. |
| • | Theother operating income and expenses line registered ayear-on-year increase of 80.8%, helped by the good performance of the insurance business. |
| • | Theimpairment on financial assets line increased by 98.5%, mainly due to the extraordinary deterioration in the macro scenario resulting from the impact ofCOVID-19, which amounted to €320m. As a result, the cost of risk stood at 5.30%. |
| • | In theprovisions and other results line, the comparison was negative due to higher provisions for contingencies. |
Table of Contents
| 37 |
Highlights
| • | Activity has performed well, in both Turkish lira and US dollars. |
| • | Positive evolution of customer funds, especially from demand deposits. |
| • | Good NTI performance and operating expenses growing below inflation. |
| • | Net attributable profit affected by the significant increase in the impairment on financial assets line. |
BUSINESS ACTIVITY(1) (YEAR-ON-YEAR CHANGE AT CONSTANT EXCHANGE RATE. DATA AS OF31-03-20) | NET INTEREST INCOME/ATAS (PERCENTAGE. CONSTANT EXCHANGE RATE) | |||
(1) Excluding repos. |
|
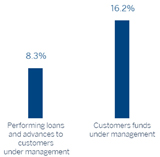

OPERATING INCOME (MILLIONS OF EUROS AT CONSTANT EXCHANGE RATE) | NET ATTRIBUTABLE PROFIT (MILLIONS OF EUROS AT CONSTANT EXCHANGE RATE) | |||
(1) At current exchange rate: +33.7%. |
(1) At current exchange rate:-9.1%. |
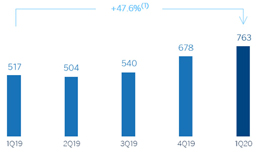
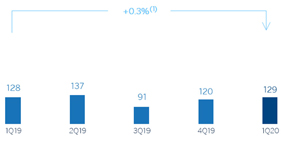
Table of Contents
| 38 |
FINANCIAL STATEMENTS AND RELEVANT BUSINESS INDICATORS
(MILLIONS OF EUROS AND PERCENTAGE)
Income statement | 1Q20 | D % | D % (1) | 1Q19 | ||||||||||||
Net interest income | 819 | 18.0 | 30.2 | 695 | ||||||||||||
Net fees and commissions | 165 | (14.9 | ) | (6.1 | ) | 194 | ||||||||||
Net trading income | 67 | n.s. | n.s. | (11 | ) | |||||||||||
Other operating income and expenses | 22 | 273.6 | n.s. | 6 | ||||||||||||
Gross income | 1,073 | 21.5 | 34.0 | 884 | ||||||||||||
Operating expenses | (310 | ) | (0.9 | ) | 9.3 | (313 | ) | |||||||||
Personnel expenses | (157 | ) | (8.5 | ) | 0.9 | (171 | ) | |||||||||
Other administrative expenses | (105 | ) | 8.2 | 19.4 | (97 | ) | ||||||||||
Depreciation | (48 | ) | 8.4 | 19.6 | (44 | ) | ||||||||||
Operating income | 763 | 33.7 | 47.6 | 571 | ||||||||||||
Impairment on financial assets not measured at fair value through profit or loss | (403 | ) | 100.1 | 120.8 | (202 | ) | ||||||||||
Provisions or reversal of provisions and other results | (20 | ) | n.s. | n.s. | (1 | ) | ||||||||||
Profit/(loss) before tax | 340 | (7.6 | ) | 1.9 | 368 | |||||||||||
Income tax | (78 | ) | (1.4 | ) | 8.8 | (79 | ) | |||||||||
Profit/(loss) for the year | 262 | (9.3 | ) | 0.0 | 289 | |||||||||||
Non-controlling interests | (133 | ) | (9.6 | ) | (0.2 | ) | (147 | ) | ||||||||
Net attributable profit | 129 | (9.1 | ) | 0.3 | 142 | |||||||||||
Balance sheets | 31-03-20 | D % | D % (1) | 31-12-19 | ||||||||||||
Cash, cash balances at central banks and other demand deposits | 5,194 | (5.3 | ) | 2.1 | 5,486 | |||||||||||
Financial assets designated at fair value | 5,059 | (4.0 | ) | 3.5 | 5,268 | |||||||||||
Of which: Loans and advances | 463 | 4.2 | 12.4 | 444 | ||||||||||||
Financial assets at amortized cost | 50,863 | (0.8 | ) | 6.9 | 51,285 | |||||||||||
Of which: Loans and advances to customers | 39,916 | (1.4 | ) | 6.3 | 40,500 | |||||||||||
Tangible assets | 1,033 | (7.5 | ) | (0.3 | ) | 1,117 | ||||||||||
Other assets | 1,355 | 7.6 | 16.0 | 1,260 | ||||||||||||
Total assets/liabilities and equity | 63,504 | (1.4 | ) | 6.3 | 64,416 | |||||||||||
Financial liabilities held for trading and designated at fair value through profit or loss | 2,336 | 7.0 | 15.3 | 2,184 | ||||||||||||
Deposits from central banks and credit institutions | 4,415 | (1.3 | ) | 6.4 | 4,473 | |||||||||||
Deposits from customers | 41,058 | (0.7 | ) | 7.1 | 41,335 | |||||||||||
Debt certificates | 4,201 | (1.6 | ) | 6.0 | 4,271 | |||||||||||
Other liabilities | 8,704 | (8.2 | ) | (1.0 | ) | 9,481 | ||||||||||
Economic capital allocated | 2,790 | 4.4 | 12.5 | 2,672 | ||||||||||||
Relevant business indicators | 31-03-20 | D % | D % (1) | 31-12-19 | ||||||||||||
Performing loans and advances to customers under management (2) | 39,473 | (0.5 | ) | 7.3 | 39,662 | |||||||||||
Non-performing loans | 3,503 | (4.4 | ) | 3.1 | 3,663 | |||||||||||
Customer deposits under management(2) | 41,050 | (0.7 | ) | 7.1 | 41,324 | |||||||||||
Off-balance sheet funds(3) | 3,863 | (1.1 | ) | 6.6 | 3,906 | |||||||||||
Risk-weighted assets | 59,163 | 4.5 | 12.6 | 56,642 | ||||||||||||
Efficiency ratio (%) | 28.9 | 33.8 | ||||||||||||||
NPL ratio (%) | 6.7 | 7.0 | ||||||||||||||
NPL coverage ratio (%) | 86 | 75 | ||||||||||||||
Cost of risk (%) | 3.80 | 2.07 | ||||||||||||||
| (1) | Figures at constant exchange rate. |
| (2) | Excluding repos. |
| (3) | Includes mutual funds, pension funds and otheroff-balance sheet funds. |
Table of Contents
| 39 |
Activity
Unless expressly stated and communicated otherwise, rates of changes explained ahead, both for activity and for income, will be presented at constant exchange rates. These rates, together with changes at current exchange rates, can be observed in the attached tables of the financial statements and relevant business indicators.
The most relevant aspects related to the area’s activity during the first quarter of 2020 were:
| • | Lendingactivity (performing loans under management) increased by 7.3%year-to-date mainly driven by a growth in Turkish lira loans (up 4.7%) which was supported by a lower interest rate environment and pent up demand from both commercial and retail customers after the contraction in 2019. Foreign-currency loans (in US dollars) also showed a positive trend during the first quarter 2020 and increased by 2.2%. |
| • | By segments, Turkish-liracommercial loans continued to grow in the quarter thanks to declining interest rates, although a reduction in activity was noted by the end of the quarter. In addition,consumer loans increased significantly, mainly driven by the increase in General Purpose Loans. |
| • | In terms ofasset quality, the NPL ratio improved to 6.7% from 7.0% as of December 31, 2019 due to less NPL entries in the quarter supported by the good performance of the recoveries. The NPL coverage ratio stood at 86% as of March 31, 2020. |
| • | Customerdeposits (65% of total liabilities in the area as of March 31, 2020) remained the main source of funding for the balance sheet and increased by 7.1% in the quarter. It is worth mentioning the good performance of demand deposits, whose share in total customer deposits is 42.1%, which increased by 18.3% as of March 2020. |
Results
Turkey generated a net attributableprofit of €129m in the first quarter of 2020, in line with the one generated in the same period of the previous year, despite the impact of the increase in the impairment losses on financial assets, rising the operating income by 47.6%. The most significant aspects of theyear-on-year evolution in the income statement are the following:
| • | Net interest income grew (up 30.2%) mainly due to higher Turkish lira customer spreads as well as to higher loan volumes and which was partially offset by a lower contribution from inflation-linked bonds. |
| • | Changes in the regulation that limit certain commissions banks can charge customers, which entered into force in March 2020, are the main drivers for the decrease innet fees and commissions of 6.1% in the quarter. |
| • | NTI closed the quarter with a positive result comparing favorably with the losses of the first quarter of 2019. This is mainly due to the positive impact of foreign-exchange rates, the good performance of hedging and foreign currency trading operations and the results generated by trading operations. |
| • | Other operating income and expenses increased significantly compared to the same period in 2019 mainly due to the positive evolution ofnon-financial services and net insurance earnings, and stood at €22m at the end of March 2020. |
| • | Operating expenses increased by 9.3%, significantly below the average inflation rate. As a result of a strict cost-control discipline, the efficiency ratio remained at low levels (28.9%). |
| • | Impairment losses on financial assets strongly increased by 120.8% because of provisions for specific commercial portfolio customers and, specially, the adjustment in the macro scenario due to the negative effects ofCOVID-19. This increase amounted to €169m. As a result, the cost of risk increased to 3.80%. |
Table of Contents
| 40 |
Highlights
| • | Growth in lending, driven by the wholesale portfolio. |
| • | Year-on-year increase of net interest income. |
| • | Lower contribution from NTI. |
| • | Net attributable profit affected by the increase in the impairment on financial assets line. |
BUSINESS ACTIVITY(1) (YEAR-ON-YEAR CHANGE AT CONSTANT EXCHANGE RATE. DATA AS OF31-03-20) | NET INTEREST INCOME/ATAS (PERCENTAGE. CONSTANT EXCHANGE RATE) | |||
(1) Excluding repos. |
|
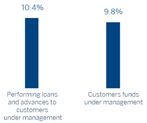
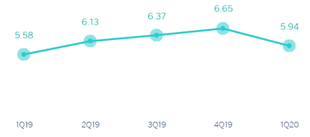
OPERATING INCOME (MILLIONS OF EUROS AT CONSTANT EXCHANGE RATE) | NET ATTRIBUTABLE PROFIT (MILLIONS OF EUROS AT CONSTANT EXCHANGE RATE) | |||
(1) At current exchange rate:-22.0%. |
(1) At current exchange rate:-63.8% . |
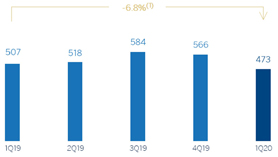
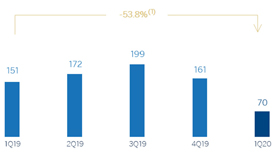
Table of Contents
| 41 |
FINANCIAL STATEMENTS AND RELEVANT BUSINESS INDICATORS
(MILLIONS OF EUROS AND PERCENTAGE)
Income statement | 1Q20 | D % | D % (1) | 1Q19 | ||||||||||||
Net interest income | 763 | 0.4 | 14.6 | 760 | ||||||||||||
Net fees and commissions | 119 | (11.5 | ) | (1.9 | ) | 135 | ||||||||||
Net trading income | 80 | (61.0 | ) | (50.7 | ) | 206 | ||||||||||
Other operating income and expenses | (100 | ) | (13.8 | ) | (7.7 | ) | (116 | ) | ||||||||
Gross income | 863 | (12.4 | ) | 2.4 | 985 | |||||||||||
Operating expenses | (390 | ) | 2.9 | 16.4 | (379 | ) | ||||||||||
Personnel expenses | (197 | ) | 1.2 | 15.8 | (195 | ) | ||||||||||
Other administrative expenses | (148 | ) | 4.2 | 17.5 | (142 | ) | ||||||||||
Depreciation | (44 | ) | 6.6 | 15.6 | (41 | ) | ||||||||||
Operating income | 473 | (22.0 | ) | (6.8 | ) | 606 | ||||||||||
Impairment on financial assets not measured at fair value through profit or loss | (319 | ) | 80.1 | 97.5 | (177 | ) | ||||||||||
Provisions or reversal of provisions and other results | (18 | ) | 42.3 | 67.8 | (12 | ) | ||||||||||
Profit/(loss) before tax | 137 | (67.2 | ) | (59.3 | ) | 417 | ||||||||||
Income tax | (29 | ) | (78.7 | ) | (74.4 | ) | (138 | ) | ||||||||
Profit/(loss) for the year | 107 | (61.6 | ) | (51.4 | ) | 279 | ||||||||||
Non-controlling interests | (37 | ) | (56.6 | ) | (46.4 | ) | (86 | ) | ||||||||
Net attributable profit | 70 | (63.8 | ) | (53.8 | ) | 193 | ||||||||||
Balance sheets | 31-03-20 | D % | D % (1) | 31-12-19 | ||||||||||||
Cash, cash balances at central banks and other demand deposits | 8,313 | (3.3 | ) | 2.4 | 8,601 | |||||||||||
Financial assets designated at fair value | 7,561 | 23.5 | 36.5 | 6,120 | ||||||||||||
Of which: Loans and advances | 263 | 130.8 | 179.1 | 114 | ||||||||||||
Financial assets at amortized cost | 36,146 | (4.5 | ) | 3.7 | 37,869 | |||||||||||
Of which: Loans and advances to customers | 34,202 | (4.2 | ) | 4.2 | 35,701 | |||||||||||
Tangible assets | 921 | (4.9 | ) | (1.1 | ) | 968 | ||||||||||
Other assets | 1,830 | 27.2 | 36.7 | 1,438 | ||||||||||||
Total assets/liabilities and equity | 54,772 | (0.4 | ) | 7.8 | 54,996 | |||||||||||
Financial liabilities held for trading and designated at fair value through profit or loss | 2,006 | 7.8 | 28.1 | 1,860 | ||||||||||||
Deposits from central banks and credit institutions | 4,055 | 10.9 | 16.9 | 3,656 | ||||||||||||
Deposits from customers | 35,949 | (0.4 | ) | 8.1 | 36,104 | |||||||||||
Debt certificates | 3,105 | (3.6 | ) | 3.1 | 3,220 | |||||||||||
Other liabilities | 7,143 | (6.8 | ) | (1.1 | ) | 7,664 | ||||||||||
Economic capital allocated | 2,514 | 0.9 | 10.9 | 2,492 | ||||||||||||
Relevant business indicators | 31-03-20 | D % | D % (1) | 31-12-19 | ||||||||||||
Performing loans and advances to customers under management (2) | 34,153 | (4.1 | ) | 4.3 | 35,598 | |||||||||||
Non-performing loans | 1,803 | (2.7 | ) | 6.3 | 1,853 | |||||||||||
Customer deposits under management(3) | 35,964 | (0.4 | ) | 8.1 | 36,123 | |||||||||||
Off-balance sheet funds(4) | 12,935 | 0.6 | 1.0 | 12,864 | ||||||||||||
Risk-weighted assets | 44,876 | (1.2 | ) | 6.5 | 45,413 | |||||||||||
Efficiency ratio (%) | 45.2 | 40.9 | ||||||||||||||
NPL ratio (%) | 4.4 | 4.4 | ||||||||||||||
NPL coverage ratio (%) | 104 | 100 | ||||||||||||||
Cost of risk (%) | 3.00 | 1.88 | ||||||||||||||
| (1) | Figures at constant exchange rates. |
| (2) | Excluding repos. |
| (3) | Excluding repos and including specific marketable debt securities. |
| (4) | Includes mutual funds, pension funds and otheroff-balance sheet funds. |
Table of Contents
| 42 |
SOUTH AMERICA. DATA PER COUNTRY
(MILLIONS OF EUROS)
| Operating income | Net attributable profit | |||||||||||||||||||||||||||||||
Country | 1Q20 | D % | D % (1) | 1Q19 | 1Q20 | D % | D % (1) | 1Q19 | ||||||||||||||||||||||||
Argentina | 92 | (47.1 | ) | (4.8 | ) | 174 | 8 | (87.0 | ) | (70.4 | ) | 60 | ||||||||||||||||||||
Colombia | 140 | (17.3 | ) | (9.4 | ) | 169 | 8 | (85.8 | ) | (84.5 | ) | 58 | ||||||||||||||||||||
Peru | 183 | (5.2 | ) | (5.8 | ) | 194 | 30 | (30.3 | ) | (30.7 | ) | 43 | ||||||||||||||||||||
Other countries(2) | 58 | (17.2 | ) | (6.2 | ) | 70 | 24 | (26.1 | ) | (15.8 | ) | 32 | ||||||||||||||||||||
Total | 473 | (22.0 | ) | (6.8 | ) | 606 | 70 | (63.8 | ) | (53.8 | ) | 193 | ||||||||||||||||||||
| (1) | Figures at constant exchange rates. |
| (2) | Bolivia, Chile (Forum), Paraguay, Uruguay and Venezuela. Additionally, it includes eliminations and other charges. |
SOUTH AMERICA. RELEVANT BUSINESS INDICATORS PER COUNTRY
(MILLIONS OF EUROS)
| Argentina | Colombia | Peru | ||||||||||||||||||||||||||
| 31-03-20 | 31-12-19 | 31-03-20 | 31-12-19 | 31-03-20 | 31-12-19 | |||||||||||||||||||||||
Performing loans and advances to customers under management(1)(2) | 3,143 | 2,791 | 11,094 | 10,625 | 15,470 | 14,902 | ||||||||||||||||||||||
Non-performing loans and guarantees given(1) | 114 | 100 | 628 | 613 | 866 | 800 | ||||||||||||||||||||||
Customer deposits under management(1)(3) | 4,638 | 4,159 | 12,015 | 10,495 | 14,765 | 14,518 | ||||||||||||||||||||||
Off-balance sheet funds(1)(4) | 946 | 614 | 689 | 1,148 | 1,861 | 1,805 | ||||||||||||||||||||||
Risk-weighted assets | 6,910 | 6,093 | 13,100 | 14,172 | 19,278 | 19,293 | ||||||||||||||||||||||
Efficiency ratio (%) | 56.2 | 46.9 | 39.3 | 36.2 | 39.5 | 35.8 | ||||||||||||||||||||||
NPL ratio (%) | 3.5 | 3.4 | 5.2 | 5.3 | 4.3 | 4.1 | ||||||||||||||||||||||
NPL coverage ratio (%) | 148 | 161 | 107 | 98 | 100 | 96 | ||||||||||||||||||||||
Cost of risk (%) | 2.62 | 4.22 | 4.01 | 1.67 | 2.43 | 1.45 | ||||||||||||||||||||||
| (1) | Figures at constant exchange rates. |
| (2) | Excluding repos. |
| (3) | Excluding repos and including specific marketable debt securities. |
| (4) | Includes mutual funds and otheroff-balance sheet funds. |
Activity and results
Unless expressly stated otherwise, all the comments below on rates of change, for both activity and results, will be given at constant exchange rates. These rates, together with the changes at current exchange rates, can be found in the attached tables of financial statements and relevant business indicators.
The most relevant aspects related to the area’s activity in the first quarter of 2020 were:
| • | Lending activity (performing loans under management) was higher than at the end of 2019, up 4.3%. The performance of the wholesale portfolio is noteworthy, due to greater drawdowns of credit facilities by companies in response to the situation generated by theCOVID-19 health crisis. With regard toasset quality, the NPL ratio remained at 4.4%, the same level seen at the end of 2019, and the NPL coverage ratio has increased to 104%. |
| • | On thefunding side, customer deposits under management increased by 8.1% in the year, mainly due to the growth of demand deposits and, to a lesser extent, time deposits.Off-balance sheet funds grew by 1.0% in the same period. |
Regardingresults, South America generated a cumulative net attributable profit of €70m between January and March 2020, representing ayear-on-year change of-53.8% (down 63.8% at current exchange rates), mainly due to the increase in the impairment on financial assets caused by theCOVID-19 crisis. The cumulative impact of inflation in Argentina on the area’s net attributable profit in the first quarter of 2020 amounted to €-34m, compared to €-49m in the first quarter of 2019.
The most notable aspects of the evolution of the income statement in the first quarter are summarized below:
| • | Net interest incomeincreased by 14.6% (up 0.4% at current exchange rates). |
| • | Reduced contribution fromNTI (down 50.7% at constant exchange rates, down 61.0% at current exchange rates) due to the effect of the generalized fall in the markets which affected the valuation of the portfolio, and a smaller contribution from foreign currency transactions. |
| • | Increase inoperating expensesbelow the inflation rate of the region (up 16.4%, up 2.9% at current exchange rates), mainly due to the impact of inflation in Argentina. |
| • | Increased need forimpairment on financial assets (up 97.5%, up 80.1% at current exchange rates) mainly due to the extraordinary deterioration in the macroeconomic scenario caused by the impact ofCOVID-19 for €145m, causing the cost of risk to increase to 3.00% at the end of March 2020. |
Table of Contents
| 43 |
The most significant countries in the business area,Argentina,Colombia andPeru, performed as follows in the first quarter of 2020 in terms of activity and results:
Argentina
| • | Lending activity grew by 12.6% in the quarter due to the increase in wholesale portfolios. With regard to asset quality, the NPL ratio increased and stood at 3.5% as of March 31, 2020, continuing to perform better than the system according to the latest data available. |
| • | In terms offunding, the customer deposits under management increased by 11.5%, with growth in both time and demand deposits, whileoff-balance sheet funds increased by 54.1%, both compared to December 2019 figures. |
| • | Net attributableprofit stood at €8m, or 70.4% below the previous year’s figure. The good performance in the generation of net interest income and fees and commissions was negatively impacted by higher operating expenses, strongly influenced by the high levels of inflation, and by the greater need for the impairment on financial assets resulting from theCOVID-19 crisis (€39m). |
Colombia
| • | Lending activity increased by 4.4% in the quarter due to the performance of the wholesale portfolios. In terms of asset quality, the NPL ratio improved and fell to 5.2% at the end of March 2020. |
| • | Customerdeposits under management increased by 14.5%, driven by the growth in demand and time deposits. In contrast,off-balance sheet funds declined due to withdrawals in mutual funds at the end of the quarter. |
| • | The net attributableprofit stood at €8m, with ayear-on-year fall of 84.5%. The generation of recurring income remains stable regarding the net interest income, but theCOVID-19 crisis has had a negative impact on both the generation of NTI, and especially on loan-loss provisions for an amount of €64m. |
Peru
| • | Lending activity was 3.8% higher than at the end of 2019, mainly due to the wholesale portfolio. With regard to asset quality, the NPL ratio increased to 4.3% and the NPL coverage ratio reached 100%. |
| • | Customerdeposits under management increased by 1.7% in the quarter, mainly due to the 3.5% growth in demand deposits.Off-balance sheet funds increased by 3.1%. |
| • | Net interest income remained stable with respect to 2019 because the pressure on interest rates offset the effect of the higher volume of activity. Of great significance is the increase in the impairment on financial assets as a result of increased loan-loss provisions due to theCOVID-19 crisis, which amounted to €42m, as well as a provision of €1m in provisions and other results, and resulted in a 30.7% decrease in net attributableprofit to €30m. |
Table of Contents
| 44 |
Highlights
| • | Good performance of lending activity. |
| • | Increased recurring revenues resulting from positive transactional and investment banking and the good performance of NTI. |
| • | Contained growth of operating expenses. |
| • | Improved risk indicators. |
FINANCIAL STATEMENTS AND RELEVANT BUSINESS INDICATORS
(MILLIONS OF EUROS AND PERCENTAGE)
Income statement | 1Q20 | D % | 1Q19 | |||||||||
Net interest income | 47 | 19.3 | 40 | |||||||||
Net fees and commissions | 40 | 12.9 | 36 | |||||||||
Net trading income | 36 | 36.2 | 27 | |||||||||
Other operating income and expenses | 2 | 32.2 | 2 | |||||||||
Gross income | 126 | 21.6 | 104 | |||||||||
Operating expenses | (73 | ) | 3.9 | (70 | ) | |||||||
Personnel expenses | (36 | ) | 6.9 | (34 | ) | |||||||
Other administrative expenses | (32 | ) | 1.2 | (32 | ) | |||||||
Depreciation | (4 | ) | 1.4 | (4 | ) | |||||||
Operating income | 53 | 58.4 | 34 | |||||||||
Impairment on financial assets not measured at fair value through profit or loss | 6 | n.s. | (10 | ) | ||||||||
Provisions or reversal of provisions and other results | (0 | ) | (35.2 | ) | (1 | ) | ||||||
Profit/(loss) before tax | 59 | 160.6 | 23 | |||||||||
Income tax | (15 | ) | 125.8 | (7 | ) | |||||||
Profit/(loss) for the year | 44 | 175.3 | 16 | |||||||||
Non-controlling interests | — | — | — | |||||||||
Net attributable profit | 44 | 175.3 | 16 | |||||||||
Balance sheets | 31-03-20 | D % | 31-12-19 | |||||||||
Cash, cash balances at central banks and other demand deposits | 287 | 16.2 | 247 | |||||||||
Financial assets designated at fair value | 511 | 7.1 | 477 | |||||||||
Of which: Loans and advances | — | — | — | |||||||||
Financial assets at amortized cost | 25,415 | 14.3 | 22,233 | |||||||||
Of which: Loans and advances to customers | 22,248 | 13.1 | 19,669 | |||||||||
Inter-area positions | — | — | — | |||||||||
Tangible assets | 69 | (4.3 | ) | 72 | ||||||||
Other assets | 261 | 14.7 | 228 | |||||||||
Total assets/liabilities and equity | 26,543 | 14.1 | 23,257 | |||||||||
Financial liabilities held for trading and designated at fair value through profit or loss | 44 | (23.1 | ) | 57 | ||||||||
Deposits from central banks and credit institutions | 792 | (23.7 | ) | 1,039 | ||||||||
Deposits from customers | 5,138 | 9.1 | 4,708 | |||||||||
Debt certificates | 807 | (3.8 | ) | 838 | ||||||||
Inter-area positions | 18,449 | 20.2 | 15,351 | |||||||||
Other liabilities | 399 | 0.1 | 399 | |||||||||
Economic capital allocated | 913 | 5.7 | 864 | |||||||||
Table of Contents
| 45 |
Relevant business indicators | 31-03-20 | D % | 31-12-19 | |||||||||
Performing loans and advances to customers under management (1) | 22,307 | 13.4 | 19,663 | |||||||||
Non-performing loans | 276 | (21.0 | ) | 350 | ||||||||
Customer deposits under management(1) | 5,138 | 9.1 | 4,708 | |||||||||
Off-balance sheet funds(2) | 495 | (1.1 | ) | 500 | ||||||||
Risk-weighted assets | 18,878 | 4.9 | 17,989 | |||||||||
Efficiency ratio (%) | 57.7 | 64.6 | ||||||||||
NPL ratio (%) | 0.9 | 1.2 | ||||||||||
NPL coverage ratio (%) | 121 | 98 | ||||||||||
Cost of risk (%) | (0.12 | ) | 0.02 | |||||||||
| (1) | Excluding repos. |
| (2) | Includes mutual funds, pension funds and otheroff-balance sheet funds. |
Activity and results
The most relevant aspects of the activity and results in the area in the first quarter of 2020 were:
| • | Lendingactivity (performing loans under management) grew by 13.4% during the first quarter of the year. |
| • | Asset quality indicators improved compared to the end of 2019: the NPL ratio and NPL coverage ratio closed at 0.9% and 121%, respectively, as of March 31, 2020. |
| • | Customer deposits under management increased by 9.1% in the first quarter of 2020, supported by the good evolution of both demand deposits and time deposits. |
| • | In terms ofresults, income of a more recurring nature registered ayear-on-year increase of 16.2% due to the positive performance of bothnet interest income (up 19.3%year-on-year) andnet fees and commissions (up 12.9%year-on-year), supported by transactional banking and investment and finance banking. TheNTI line increased (up 36.2%year-on-year) from the Global Markets activity. Contained growth ofoperating expenses (up 3.9%year-on-year). |
| • | Theimpairment on financial assets line presented releases of €6m in the quarter for lower loan-loss provisions and includes the impacts recognized as a consequence of the deterioration of the macroeconomic scenario caused byCOVID-19 which amounted to €2m. As a result, the area’s net attributableprofit in the first quarter of 2020 stood at €44m (up 175.3%year-on-year). |
Table of Contents
| 46 |
FINANCIAL STATEMENTS
(MILLIONS OF EUROS AND PERCENTAGE)
Income statement | 1Q20 | D % | 1Q19 | |||||||||
Net interest income | (41 | ) | (41.3 | ) | (71 | ) | ||||||
Net fees and commissions | (9 | ) | (43.3 | ) | (15 | ) | ||||||
Net trading income | 179 | n.s. | (7 | ) | ||||||||
Other operating income and expenses | (19 | ) | 30.9 | (14 | ) | |||||||
Gross income | 111 | n.s. | (107 | ) | ||||||||
Operating expenses | (208 | ) | (12.9 | ) | (239 | ) | ||||||
Personnel expenses | (117 | ) | (12.2 | ) | (133 | ) | ||||||
Other administrative expenses | (44 | ) | (30.1 | ) | (63 | ) | ||||||
Depreciation | (48 | ) | 10.0 | (43 | ) | |||||||
Operating income | (98 | ) | (71.8 | ) | (346 | ) | ||||||
Impairment on financial assets not measured at fair value through profit or loss | (0 | ) | (95.8 | ) | (1 | ) | ||||||
Provisions or reversal of provisions and other results | (2,109 | ) | n.s. | (23 | ) | |||||||
Profit/(loss) before tax | (2,207 | ) | n.s. | (370 | ) | |||||||
Income tax | 41 | (60.1 | ) | 102 | ||||||||
Profit/(loss) for the year | (2,166 | ) | n.s. | (268 | ) | |||||||
Non-controlling interests | — | — | — | |||||||||
Net attributable profit | (2,166 | ) | n.s. | (268 | ) | |||||||
Of which: | ||||||||||||
Goodwill impairment in the United States | (2,084 | ) | ||||||||||
Net attributable profit excluding the goodwill impairment in the United States | (82 | ) | (69.4 | ) | (268 | ) | ||||||
Balance sheets | 31-03-20 | D % | 31-12-19 | |||||||||
Cash, cash balances at central banks and other demand deposits | 767 | (8.2 | ) | 836 | ||||||||
Financial assets designated at fair value | 1,967 | (20.0 | ) | 2,458 | ||||||||
Of which: Loans and advances | — | — | — | |||||||||
Financial assets at amortized cost | 2,052 | (17.3 | ) | 2,480 | ||||||||
Of which: Loans and advances to customers | 353 | (56.5 | ) | 813 | ||||||||
Inter-area positions | 15,433 | (28.1 | ) | 21,477 | ||||||||
Tangible assets | 2,177 | (2.8 | ) | 2,240 | ||||||||
Other assets | 18,831 | (7.7 | ) | 20,394 | ||||||||
Total assets/liabilities and equity | 41,227 | (17.4 | ) | 49,886 | ||||||||
Financial liabilities held for trading and designated at fair value through profit or loss | 93 | n.s. | 14 | |||||||||
Deposits from central banks and credit institutions | 851 | 18.5 | 718 | |||||||||
Deposits from customers | 323 | 4.9 | 308 | |||||||||
Debt certificates | 7,169 | (7.7 | ) | 7,764 | ||||||||
Inter-area positions | — | — | — | |||||||||
Other liabilities | 8,937 | (11.9 | ) | 10,148 | ||||||||
Economic capital allocated | (25,320 | ) | 5.5 | (23,989 | ) | |||||||
Total equity | 49,174 | (10.5 | ) | 54,925 | ||||||||
Table of Contents
| 47 |
The Corporate Center registered a net attributableloss of €2,166m in the first quarter of 2020, due to the goodwill impairment in the United States of €2,084m in the same quarter which is fundamentally caused by the negative impact of the adjustment of the macroeconomic scenario due toCOVID-19. The most relevant aspects about the evolution of the area are:
| • | Thenet interest income reflects lower financing costs. |
| • | TheNTI recorded €179m mainly from gains in foreign-exchange rate hedging, which compares very positively to the €-7m of the first quarter of 2019. |
| • | Containment ofoperating expenses, which decreased by 12.9%year-on-year, both for personnel expenses (mainly for variable remuneration) and for general expenses. |
| • | Provisions or reversal of provisions and other results include in the first quarter of 2020 the goodwill impairment in the United States. |
Table of Contents
| 48 |
Other information: Corporate & Investment Banking
Highlights
| • | Good performance of customer activity affecting positively the net interest income and fees and commissions. |
| • | Leadership position in green and sustainable loans. |
| • | Net attributable profit affected by the significant increase in the impairment on financial assets line. |
BUSINESS ACTIVITY(1) (YEAR-ON-YEAR CHANGE AT CONSTANT EXCHANGE RATE. DATA AS OF31-03-20) | NET INTEREST INCOME/ATAS (PERCENTAGE. CONSTANT EXCHANGE RATE) | |||
(1) Excluding repos. |
|
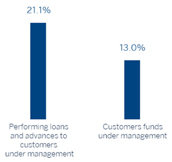
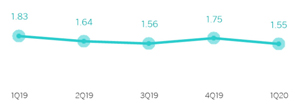
OPERATING INCOME (MILLIONS OF EUROS AT CONSTANT EXCHANGE RATE) | NET ATTRIBUTABLE PROFIT (MILLIONS OF EUROS AT CONSTANT EXCHANGE RATE) | |||
(1) At current exchange rate: +0.6%. |
(1) At current exchange rate: -60.4%. |
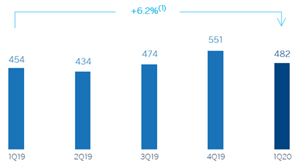
Table of Contents
| 49 |
FINANCIAL STATEMENTS AND RELEVANT BUSINESS INDICATORS
(MILLIONS OF EUROS AND PERCENTAGE)
Income statement | 1Q20 | D % | D % (1) | 1Q19 | ||||||||||||
Net interest income | 389 | 5.9 | 10.6 | 367 | ||||||||||||
Net fees and commissions | 196 | 13.4 | 16.7 | 173 | ||||||||||||
Net trading income | 182 | (15.4 | ) | (11.4 | ) | 215 | ||||||||||
Other operating income and expenses | (13 | ) | (13.2 | ) | (7.3 | ) | (15 | ) | ||||||||
Gross income | 754 | 1.8 | 6.0 | 740 | ||||||||||||
Operating expenses | (272 | ) | 4.1 | 5.8 | (261 | ) | ||||||||||
Personnel expenses | (125 | ) | 3.8 | 4.7 | (120 | ) | ||||||||||
Other administrative expenses | (117 | ) | 7.2 | 10.3 | (109 | ) | ||||||||||
Depreciation | (30 | ) | (5.5 | ) | (5.4 | ) | (32 | ) | ||||||||
Operating income | 482 | 0.6 | 6.2 | 479 | ||||||||||||
Impairment on financial assets not measured at fair value through profit or loss | (311 | ) | n.s. | n.s. | (55 | ) | ||||||||||
Provisions or reversal of provisions and other results | (11 | ) | n.s. | n.s. | 5 | |||||||||||
Profit/(loss) before tax | 160 | (62.5 | ) | (60.3 | ) | 428 | ||||||||||
Income tax | (44 | ) | (59.2 | ) | (56.9 | ) | (107 | ) | ||||||||
Profit/(loss) for the year | 117 | (63.7 | ) | (61.4 | ) | 321 | ||||||||||
Non-controlling interests | (24 | ) | (72.4 | ) | (69.9 | ) | (87 | ) | ||||||||
Net attributable profit | 93 | (60.4 | ) | (58.4 | ) | 234 | ||||||||||
| (1) | Figures at constant exchange rates. |
Balance sheets | 31-03-20 | D % | D % (1) | 31-12-19 | ||||||||||||
Cash, cash balances at central banks and other demand deposits | 5,952 | 69.4 | 67.3 | 3,513 | ||||||||||||
Financial assets designated at fair value | 138,068 | 31.0 | 34.8 | 105,386 | ||||||||||||
Of which: Loans and advances | 42,896 | 25.6 | 25.8 | 34,153 | ||||||||||||
Financial assets at amortized cost | 87,370 | 14.7 | 19.5 | 76,169 | ||||||||||||
Of which: Loans and advances to customers | 74,561 | 13.1 | 17.8 | 65,915 | ||||||||||||
Inter-area positions | — | — | — | — | ||||||||||||
Tangible assets | 57 | (9.6 | ) | (5.4 | ) | 63 | ||||||||||
Other assets | 1,641 | (34.5 | ) | (37.5 | ) | 2,506 | ||||||||||
Total assets/liabilities and equity | 233,090 | 24.2 | 28.2 | 187,637 | ||||||||||||
Financial liabilities held for trading and designated at fair value through profit or loss | 119,659 | 30.5 | 34.2 | 91,657 | ||||||||||||
Deposits from central banks and credit institutions | 19,484 | 26.3 | 27.6 | 15,426 | ||||||||||||
Deposits from customers | 40,931 | 4.5 | 10.4 | 39,166 | ||||||||||||
Debt certificates | 2,183 | (16.8 | ) | (13.6 | ) | 2,625 | ||||||||||
Inter-area positions | 42,320 | 35.1 | 38.4 | 31,316 | ||||||||||||
Other liabilities | 3,817 | 29.0 | 34.0 | 2,959 | ||||||||||||
Economic capital allocated | 4,696 | 4.7 | 9.5 | 4,487 | ||||||||||||
| (1) | Figures at constant exchange rates. |
Relevant business indicators | 31-03-20 | D % | D % (1) | 31-12-19 | ||||||||||||
Performing loans and advances to customers under management(2) | 74,386 | 13.6 | 18.3 | 65,509 | ||||||||||||
Non-performing loans | 1,093 | (9.8 | ) | (5.4 | ) | 1,211 | ||||||||||
Customer deposits under management(2) | 40,607 | 3.7 | 9.6 | 39,150 | ||||||||||||
Off-balance sheet funds(3) | 724 | (30.2 | ) | (19.0 | ) | 1,037 | ||||||||||
Efficiency ratio (%) | 36.1 | 35.2 | ||||||||||||||
| (1) | Figures at constant exchange rates. |
| (2) | Excluding repos. |
| (3) | Includes mutual funds, pension funds and otheroff-balance sheet funds. |
Table of Contents
| 50 |
Activity
Unless expressly stated otherwise, all the comments below onrates of change, for both activity and profit and loss, will be given at constant exchange rates. These rates, together with changes at current exchange rates, can be found in the attached tables of the financial statements and relevant business indicators.
The most relevant aspects related to the area’s activity during the first quarter of 2020 have been:
| • | Lending activity (performing loans under management) grew by 18.3% between January and March 2020. By geographical area, the comparison in the United States, Mexico, Turkey and the Rest of Eurasia was more favorable. It is noteworthy that at the end of March 2020, activity has not yet been affected by the negative effects ofCOVID-19. |
| • | Customer funds increased 8.9% in the first quarter of 2020, mainly due to the performance in Mexico, the United States and Spain. |
| • | BBVA was one of the most active financial institutions insustainable finance in 2019, having participated in a total of 47 green transactions and/or transactions linked to sustainability criteria (ESG scores, environmental and social KPIs), certified by renowned independent consultants. Of these 47 transactions, including syndicated loans (36 transactions) and bilateral loans (11 transactions), 23 were led by BBVA as the sustainable coordinator. This leadership of BBVA materialized in relevant transactions in countries such as Spain, the United Kingdom, France, Portugal, Belgium, Mexico and China, and in various sectors including hospitality, energy (gas and electricity), recycling and automotive components, among others. |
| • | At the end of the first quarter of 2020, BBVA continued to maintain its activity in the field of sustainable financing with stakes in seven transactions with these characteristics, leading two of them as the sustainable coordinator. |
Results
CIB generated a net attributableprofit of €93m euros in the first quarter of 2020, which is 58.4% less than in the first quarter of 2019. This is due to the increase in the impairment on financial assets, as the operating income grew 6.2% over the same period of time. The most relevant aspects of theyear-on-year changes in the income statement are summarized below:
| • | Positive performance ofnet interest income (up 10.6%) linked to the activity and an improvement in the customer spreads during the first quarter. |
| • | Increase innet fees and commissions (up 16.7%), supported by transactional business and investment, and finance banking in most geographic areas.NTI closed lower compared to the same period of 2019 (down 11.4%) due to the market turbulences caused byCOVID-19. This is despite the positive developments in customer activity, foreign exchange transactions and placement of bonds. |
| • | Operating expenses increased 5.8%year-on-year, mainly due to the growing inflation in emerging countries and investments in technology projects. |
| • | Provisions for theimpairment on financial assets increased significantly, mainly due to the deterioration of the macroeconomic scenario as a result ofCOVID-19, and amounted to €193m. |
Table of Contents
| 51 |
Disclaimer
This document is only provided for information purposes and does not constitute, nor should it be interpreted as, an offer to sell, exchange or acquire, or an invitation for offers to acquire securities issued by any of the aforementioned companies, or to contract any financial product. Any decision to purchase or invest in securities or contract any financial product must be made solely and exclusively on the basis of the information made available to such effects by the company in relation to each specific matter.
This document includes or may include forward looking statements with respect to the intentions, expectations or projections of BBVA or its management on the date thereof, that refer to or incorporate various assumptions and projections, including projections regarding future earnings of the business. The statements contained herein are based on our current projections, although the actual results may be substantially modified in the future due to certain risks and uncertainties and other factors that may cause the final results or decisions to differ from said intentions, projections or estimates. These factors include, but are not limited to, (1) the market situation, macroeconomic factors, regulatory, political or government guidelines, (2) domestic and international stock markets movements, exchange rates and interest rates, (3) competitive pressure, (4) technological changes, (5) variations in the financial situation, creditworthiness or solvency of our clients, debtors or counterparts. These factors could cause or result in actual events differing from the information and intentions set forth, projected, or forecast in this document or in other past or future documents. BBVA does not undertake to publicly update or communicate the update of the content of this or any other document, either if the events are not as described herein, or if there are changes in the information contained in this document.
Table of Contents
SIGNATURE
Pursuant to the requirements of the Securities Exchange Act of 1934, the registrant has duly caused this report to be signed on its behalf by the undersigned, thereunto duly authorized.
| Banco Bilbao Vizcaya Argentaria, S.A. | ||
Date: April 29, 2020 |
By: /s/ Marĺa Ángeles Peláez Morón
__________________________________ Name: Marĺa Ángeles Peláez Morón Title: Authorized representative |