Table of Contents
UNITED STATES
SECURITIES AND EXCHANGE COMMISSION
WASHINGTON, D.C. 20549
FORM 6-K
REPORT OF FOREIGN ISSUER
PURSUANT TO RULE 13a-16 OR 15d-16
UNDER THE SECURITIES EXCHANGE ACT OF 1934
For the month of March, 2022
Commission file number: 1-10110
BANCO BILBAO VIZCAYA ARGENTARIA, S.A.
(Exact name of Registrant as specified in its charter)
BANK BILBAO VIZCAYA ARGENTARIA, S.A.
(Translation of Registrant’s name into English)
Calle Azul 4,
28050 Madrid
Spain
(Address of principal executive offices)
Indicate by check mark whether the registrant files or will file annual reports under cover of Form 20-F or Form 40-F:
Form 20-F ☒ Form 40-F ☐
Indicate by check mark if the registrant is submitting the Form 6-K in paper as permitted by Regulation S-T Rule 101(b)(1):
Yes ☐ No ☒
Indicate by check mark if the registrant is submitting the Form 6-K in paper as permitted by Regulation S-T Rule 101(b)(7):
Yes ☐ No ☒
Table of Contents

Table of Contents
| BBVA. PILLAR 3 2021 | INDEX | P. 1 |
Table of Contents
| BBVA. PILLAR 3 2021 | INDEX | P. 2 |
Table of Contents
| BBVA. PILLAR 3 2021 | INDEX | P. 3 |
8.5. | Risk management associated with climate change | 241 | ||||
8.6. | Management of direct and indirect impacts | 249 | ||||
8.7. | Participation in international initiatives | 256 | ||||
8.8. | Sustainability index | 257 | ||||
| 258 | ||||||
Table of Contents
| BBVA. PILLAR 3 2021 | INDEX OF TABLES | P. 4 |
Table of Contents
| BBVA. PILLAR 3 2021 | INDEX OF TABLES | P. 5 |
Table of Contents
| BBVA. PILLAR 3 2021 | INDEX OF TABLES | P. 6 |
Table of Contents
| BBVA. PILLAR 3 2021 | INDEX OF TABLES | P. 7 |
Table of Contents
| BBVA. PILLAR 3 2021 | INDEX OF CHARTS | P. 8 |
Table of Contents
| BBVA. PILLAR 3 2021 | EXECUTIVE SUMMARY | P. 9 |
The consolidated fully-loaded CET1 ratio stood at 12.75% at the end of December 2021, which represents an increase of 102 basis points compared to 2020, with the phased-in CET1 ratio of 12.98%, which represents an increase of 83 basis points compared to 2020. The difference between both ratios is mainly explained by the effect of the temporary adjustments for the treatment of the solvency indicators of the impacts of IFRS 9.
These ratios include the effects of the divestments in Paraguay in the first quarter and in the United States in the second quarter of 2021. Additionally, these ratios include the negative non recurring impact of €696 million from the net costs associated with the restructuring process in Spain, as well as the deduction of the total amount of the share buyback program authorized by the European Central Bank, for an amount of €3.5 billion. Excluding these impacts, during the 2021 financial year a high organic generation of results has been registered, which, net of shareholder remuneration and remuneration of the Contingent Convertible bonds (CoCos, for its acronym in English), have contributed +82 basis points to the CET1 ratio and have made it possible to cover the negative evolution of market variables, as well as supervisory impacts and regulatory changes.
Fully loaded risk-weighted assets (RWA) decreased by approximately €-45.4 billion in 2021 compared to 2020, mainly due to the aforementioned divestments in Paraguay and the United States.
Additional Tier 1 capital (AT1) fully-loaded stood at 1.87% (1.86% phased-in) at the end of December 2021, which
includes the reduction effect of €1 billion due to early amortization of an issuance of CoCos dating back to 2016, offset by the positive effect of reducing RWAs.
The Tier 2 fully-loaded ratio stood at 2.37%, which represents an increase of +7 basis points compared to 2020, mainly explained by the effect of the RWA reduction during the 2021 financial year. Regarding the tier 2 phased-in, stood at 2.40%, the difference being with respect to the fully-loaded Tier 2 ratio, mainly due to the temporary treatment of certain subordinated issues.
As a consequence of the foregoing, the fully-loaded total capital ratio stands at 16.99% as of December 2021, with the total phased-in ratio being 17.24% as of the same date.
The Liquidity Coverage Ratio (LCR) and the Net Stable Funding Ratio (NSFR) in the Group remained well above 100% throughout 2021. At December 31, 2021, these ratios stood at 165% (213% considering the excess liquidity of the subsidiaries) and 135%, respectively. Although these requirements are only established at Group level, this minimum is comfortably exceeded in all subsidiaries.
As for the leverage ratio, as of December 31, 2021, the fully loaded ratio was 6.69% (6.80% phased-in), above the minimum required ratio of 3.06%.
The following table shows the main metrics according article 447 of the CRR:
Table of Contents
| BBVA. PILLAR 3 2021 | EXECUTIVE SUMMARY | P. 10 |
Table 1. EU KM1 - Key metrics (Million Euros)
| 12-31-2021 | 9-30-2021 | 6-30-2021 | ||||||||||
Available own funds (amounts) | ||||||||||||
Common Equity Tier 1 (CET1) capital | 39,949 | 44,558 | 43,903 | |||||||||
Tier 1 capital | 45,686 | 50,329 | 49,599 | |||||||||
|
|
|
|
|
| |||||||
Total capital | 53,069 | 58,098 | 57,287 | |||||||||
|
|
|
|
|
| |||||||
Risk-weighted exposure amounts | ||||||||||||
|
|
|
|
|
| |||||||
Total risk-weighted exposure amount | 307,795 | 303,002 | 305,599 | |||||||||
|
|
|
|
|
| |||||||
Capital ratios (as a percentage of risk-weighted exposure amount) | ||||||||||||
Common Equity Tier 1 ratio (%) | 12.98 | % | 14.71 | % | 14.37 | % | ||||||
Tier 1 ratio (%) | 14.84 | % | 16.61 | % | 16.23 | % | ||||||
|
|
|
|
|
| |||||||
Total capital ratio (%) | 17.24 | % | 19.17 | % | 18.75 | % | ||||||
|
|
|
|
|
| |||||||
Additional own funds requirements to address risks other than the risk of excessive leverage (as a percentage of risk-weighted exposure amount) | ||||||||||||
Additional own funds requirements to address risks other than the risk of excessive leverage (%) | 1.50 | % | 1.50 | % | 1.50 | % | ||||||
of which: to be made up of CET1 capital (percentage points) | 0.84 | % | 0.84 | % | 0.84 | % | ||||||
of which: to be made up of Tier 1 capital (percentage points) | 1.13 | % | 1.13 | % | 1.13 | % | ||||||
|
|
|
|
|
| |||||||
Total SREP own funds requirements (%) | 9.50 | % | 9.50 | % | 9.50 | % | ||||||
|
|
|
|
|
| |||||||
Combined buffer requirement (as a percentage of risk-weighted exposure amount) | ||||||||||||
Capital conservation buffer (%) | 2.50 | % | 2.50 | % | 2.50 | % | ||||||
Conservation buffer due to macro-prudential or systemic risk identified at the level of a Member State (%) | — | — | — | |||||||||
Institution specific countercyclical capital buffer (%) | 0.01 | % | 0.01 | % | 0.01 | % | ||||||
Systemic risk buffer (%) | — | — | — | |||||||||
Global Systemically Important Institution buffer (%) | — | — | — | |||||||||
Other Systemically Important Institution buffer | 0.75 | % | 0.75 | % | 0.75 | % | ||||||
Combined buffer requirement (%) | 3.26 | % | 3.26 | % | 3.26 | % | ||||||
Overall capital requirements (%) | 12.76 | % | 12.76 | % | 12.76 | % | ||||||
CET1 available after meeting the total SREP own funds requirements (%) | 23,501 | 28,366 | 27,572 | |||||||||
Leverage ratio | ||||||||||||
|
|
|
|
|
| |||||||
Total exposure measure | 671,789 | 663,861 | 665,751 | |||||||||
|
|
|
|
|
| |||||||
Leverage ratio (%) | 6.80 | % | 7.58 | % | 7.45 | % | ||||||
Additional own funds requirements to address the risk of excessive leverage (as a percentage of total exposure measure) | ||||||||||||
Additional own funds requirements to address the risk of excessive leverage (%) | — | — | — | |||||||||
of which: to be made up of CET1 capital (percentage points) | — | — | — | |||||||||
|
|
|
|
|
| |||||||
Total SREP leverage ratio requirements (%) | 3.06 | % | 3.06 | % | 3.06 | % | ||||||
|
|
|
|
|
| |||||||
Leverage ratio buffer and overall leverage ratio requirement (as a percentage of total exposure measure) | ||||||||||||
Leverage ratio buffer requirement (%) | — | — | — | |||||||||
Overall leverage ratio requirements (%) | 3.06 | % | 3.06 | % | 3.06 | % | ||||||
Liquidity Coverage Ratio | ||||||||||||
|
|
|
|
|
| |||||||
Total high-quality liquid assets (HQLA) (Weighted value - average) | 103,823 | 109,943 | 108,610 | |||||||||
|
|
|
|
|
| |||||||
Cash outflows - Total weighted value | 87,615 | 86,066 | 84,470 | |||||||||
Cash inflows - Total weighted value | 24,712 | 21,575 | 23,775 | |||||||||
|
|
|
|
|
| |||||||
Total net cash outflows (adjusted value) | 62,903 | 64,491 | 60,696 | |||||||||
|
|
|
|
|
| |||||||
Liquidity coverage ratio (%) | 165.05 | % | 170.48 | % | 178.94 | % | ||||||
Net Stable Funding Ratio | ||||||||||||
|
|
|
|
|
| |||||||
Total available stable funding | 430,759 | 431,415 | 429,074 | |||||||||
|
|
|
|
|
| |||||||
Total required stable funding | 319,017 | 320,752 | 320,838 | |||||||||
|
|
|
|
|
| |||||||
NSFR ratio (%) | 135.03 | % | 134.50 | % | 133.74 | % | ||||||
|
|
|
|
|
| |||||||
This table is a summary of the main metrics presented in the Pillar 3 report.
Table of Contents
| BBVA. PILLAR 3 2021 | EXECUTIVE SUMMARY | P. 11 |
| • | For information on Capital and solvency, see section 3, Own funds and capital. |
| • | For information on Leverage, see section 5, Leverage ratio. |
| • | For information on Liquidity ratios, see section 4.5. Liquidity risk. |
The following sections detail matters relating to the Group’s solvency. These are supplemented by information included in the Group’s Consolidated Financial Statements and Management Report as of year 2021, which also contain the Group’s main activity and profitability indicators.
Table of Contents
| BBVA. PILLAR 3 2021 | 1. INTRODUCTION | P. 12 |
1.1. | Applicable regulatory framework | 13 | ||||
1.2. | Regulatory developments in 2021 | 14 | ||||
1.3. | Contents of the 2021 Prudential Relevance Report | 16 | ||||
Table of Contents
| BBVA. PILLAR 3 2021 | 1. INTRODUCTION | P. 13 |
1.1. Applicable regulatory framework
As a Spanish credit institution, BBVA is subject to Directive 2013/36/EU of the European Parliament and of the Council dated June 26, 2013, on access to the activity of credit institutions and the prudential supervision of credit institutions and investment firms (the “CRD IV Directive”) amended by Directive 2019/878/EU (the “CRD V Directive).
The major regulation governing the solvency of credit institutions is (EU) Regulation No. 575/2013 of the European Parliament and of the Council of June 26, 2013, on the prudential requirements for credit institutions and investment firms amending (EU) Regulation No 648/2012 (“CRR” and in conjunction with Directive CRD IV and any implementing measures of CRD IV, “CRD IV”), which is complemented by several binding Regulatory Technical Standards that are directly applicable to all EU member states, without the need to implement national measures. This Regulation was amended by Regulation 2019/876/EU (“CRR2”) and Regulation 2020/873/EU (“Quick Fix”).
The CRD IV Directive was transposed to Spanish national law by means of the Royal Decree-Law 14/2013, of November 29 (“RD-L 14/2013”), Law 10/2014 of June 26, Royal Decree 84/2015, of February 13 (“RD 84/2015”), Bank of Spain Circular 2/2014 of January 31 and Circular 2/2016 of February 2 (“Bank of Spain Circular 2/2016”).
During 2021, Directive 2019/878 was transposed into the Spanish legal system through the publication of Royal Decree-Law 7/2021, of April 27 (amending Law 10/2014), Royal Decree 970/2021, of November 8 (which modifies RDL 84/2015) and Circular 5/2021, of September 22 (which modifies Circular 2/2016).
In the Macroprudential field, Royal Decree 102/2019 was published in March 2019, establishing the Macroprudential Authority of the Financial Stability Board, establishing its legal regime. The aforementioned Royal Decree also develops certain aspects related to the macroprudential tools contained in Royal Decree-Law 22/2018. Among them, it provides that the Bank of Spain may adopt measures such as the countercyclical buffer for a given sector, sectoral limits on the concentration of exposures or the establishment of limits and conditions on the granting of loans and other operations. These measures are developed in Bank of Spain Circular 5/2021, of September 22.
Table of Contents
| BBVA. PILLAR 3 2021 | 1. INTRODUCTION | P. 14 |
1.2. Regulatory developments in 2021
In the field of prudential regulation, the most significant in 2021 has been:
| • | The publication by the European Commission of the proposal for the fully implementation of the Basel III, which represents the last step of the regulatory reform that began after the financial crisis. The European Commission has proposed to the European Parliament and the Council a series of amendments to banking regulations known as the “banking package 2021” to strengthen the resilience of European Union banks against possible future economic shocks, contribute to the recovery of the pandemic and the transition to climate neutrality. The main objective of the reform is to achieve a simpler, more comparable and risk-sensitive framework. To this end, modifications to CRR2 and CRD V are proposed. The European Commission proposes that the new regulations begin to apply from January 1, 2025, for which the debate with the European Parliament and the Council is now beginning. |
| • | The decision of the European Central Bank (hereinafter ECB) not to extend beyond September 2021 the recommendation to limit the distribution of dividends that prompted credit institutions for the first time in March 2020. |
| • | The entry into force of the guidelines on the definition of default (applicable from January 1, 2021), the full application of CRR2 and the updating of the guidelines on internal governance, the guidelines on adequate remuneration policies and the guidelines on the assessment of the suitability of the members of the management body and the holders of key functions (these updates apply from December 31). |
| • | In Spain, in April 2021, Decree-Law 7/2021 was approved, which transposes the CRD V and resolution directives (BRRD 2) into Spanish legislation. In the prudential part, changes have been included in the definition and requirements of Pillar II, the macroprudential buffers and the remuneration regime. |
| • | Regarding the regulations related to macroprudential regulation, during the year 2021, the Basel Committee on Banking Supervision has published its final report on the methodology for the identification of Global Systemic Banks (G-SIBS), proposing a continuous review of this methodology instead of doing it every three years. Additionally, the European Commission has published a public |
consultation on the macroprudential framework and, in turn, has asked the opinion of the European Banking Authority, the European Systemic Risk Board and the European Central Bank on a future review of the framework. |
In the field of resolution, the most significant in 2021 was:
| • | Amendment of CRR2 and BRRD 2 regarding the scope of the resolution (known as the Daisy Chain proposal) through a separate proposal for a Regulation (“Proposal for a Regulation amending Regulation (EU) No 575/2013 and Directive 2014/59 /EU as regards the prudential treatment of global systemically important institution groups with a multiple point of entry resolution strategy and a methodology for the indirect subscription of instruments eligible for meeting the minimum requirement for own funds and eligible liabilities”). |
At the date of publication of this report, the proposal is in the negotiation phase between the Council and the European Parliament.
| • | In Europe, the reform of the European Stability Mechanism Treaty was signed, allowing it to act as a security mechanism for the Single Resolution Fund from the beginning of 2022. The European Banking Authority has developed several level 2 and 3 regulatory texts related to the BRRD 2 and the Single Resolution Board (SRB) has published various guides to improve the resolvability of financial institutions. |
| • | In Spain, the approval of Royal Decree-Law 7/2021 that transposes CRD V and BRRD 2 into Spanish law. In the resolution part, the inclusion of adjustments in the hierarchy of creditors in the event of liquidation and the calibration and subordination of the MREL requirement stand out. |
In the field of Sustainable Finance, the most significant of 2021 has been the following:
The year 2021 has been key to beginning to integrate ESG criteria into decision-making and risk management of financial institutions and for accelerating the development of regulatory frameworks aimed at promoting sustainability.
At a global level, it should be noted that the International Financial Reporting Standards (IFRS) Foundation has announced the creation of a sustainability standards council (International Sustainability Standards Board, ISSB) to create international standards for the disclosure of information related to sustainability. In addition, the Basel Committee of Banking Supervisors is developing
Table of Contents
| BBVA. PILLAR 3 2021 | 1. INTRODUCTION | P. 15 |
principles for the management and supervision of these risks, which have been reflected in a consultation.
For its part, Europe has managed to position itself as the pioneer region in this area, giving rise to the adoption of important legislative measures such as the European taxonomy of sustainable activities, the Sustainable Finance Disclosure Regulation (SFDR, for its acronym and, more recently, the proposal for the Corporate Sustainability Reporting Directive (CSRD).
Additionally, the European Commission presented in July 2021 a new strategy for sustainable finance, which establishes new initiatives to face climate change and other environmental challenges. These initiatives have materialized in the Basel III implementation proposal presented by the European Commission in October 2021.
Moreover, the preliminary reports of the European Platform for Sustainable Finance have been published on:
(I) the extension of the taxonomy to intermediate economic activities in terms of sustainability, with the aim of supporting activities that allow the transition to a sustainable economy; and
(II) a social taxonomy that would complete the European taxonomy of “green” activities.
For its part, the ECB published in September the results of the first stress tests in which climate risks have been measured in different activities, and it plans to carry out the first supervisory stress tests on banks by 2022 based on climatic risks.
At the national level, Law 7/2021, of May 20, on climate change and energy transition, provides the regulatory and institutional framework aimed at facilitating and guiding the decarbonisation of the Spanish economy in 2050, as established by the European Union and the commitment made by signing the Paris Agreement. This regulation establishes obligations both for the financial and business sector and for supervisors.
In the field of disclosure, article 32 of this Law requires the publication (both in the management report and in Pillar 3) of an annual report on climate change, the content of which will be developed by means of a decree-law (RDL) within a period of two years. This report can be found in section 8 of this document.
In terms of disclosure and supervisory reporting, the main regulatory developments that occurred during 2021 were as follows:
Supervisory reporting
The regulators have continued with the process of reviewing and updating the reporting framework, highlighting the following publications:
| • | Technical Implementation Standards on supervisory reporting requirements, which amend Commission Regulation 2021/451 with regard to COREP, asset encumbrance, ALMM and G-SII reporting |
The European Banking Authority (EBA) published the final version of the document in December, which has not yet been adopted by the European Commission. The proposed date of application is December 1, 2022, although it is yet to be published in the Official Journal of the European Union (OJEU).
The purpose of these technical standards is to implement in the reporting the regulatory changes referring mainly to securitizations, the non-deductibility of the CET1 software and the additional liquidity monitoring metrics (ALMM), as well as to introduce the measures of proportionality contained in the CRR2.
| • | Technical Implementation Standards amending Regulation 2018/1624 on the provision of information regarding resolution plans in the context of the BRRD 2. |
The EBA published the final version of the document in August, which has not yet been adopted by the European Commission or published in the OJEU. The changes introduced are minimal and are intended to align with the changes introduced by BRRD 2 on MREL.
Disclosure
In the field of Pillar 3, the following regulatory developments stand out:
| • | Technical Implementation Standards amending Regulation 637/2021 on disclosure of information regarding interest rate risk in portfolios other than trading. |
In November, the EBA published the final version of the document, which contains the tables and instructions to breakdown the information regarding interest rate risk in the banking book (IRRBB) in the Pillar 3 report.
These standards have not yet been adopted by the European Commission or published in the OJEU. However, given that the requirement to break down this information (contained in article 448 CRR2) is applicable from June 28, 2021, the EBA recommended using the tables included in this document breaking down the methodology used to calculate the information.
| • | In November, the Basel Committee on Banking Supervision (BCBS) published a technical amendment to its G-SII assessment |
Table of Contents
| BBVA. PILLAR 3 2021 | 1. INTRODUCTION | P. 16 |
methodology review process technical amendment completion”). In it, the three-year cycle for the review of the methodology is replaced by a process of monitoring and continuous review. |
Related to the above, in January 2022 it launched its annual exercise to identify which entities are considered to be of global systemic importance (G-SII) based on data as of December 2021. It is an exercise of collection of data on various indicators that are used to determine global systemic importance.
In Europe, these indicators must be broken down both by the entities considered G-SII and those that, not being G-SII, have an exposure measurement greater than €200,000 million, as established in the EBA Guidelines on the breakdown of the indicators of systemic importance (EBA/GL/2020/14). These guidelines establish the table format that must be used to disclose the indicators, which must be identical to that presented to the BCBS.
The annual exercise of the BCBS of January 2022 introduces changes to the indicators. However, given that the EBA guidelines have not yet been modified to include the new table format and taking into account the need to align with the BCBS, this report breaks down using the new indicators established by the BCBS.
| • | Technical Implementation Standards on public disclosures and reporting of MREL and TLAC |
These standards have been published in the OJEU in May 2021 (Regulation 2021/763). The date of application of the reporting requirements is June 28, 2021 for MREL and TLAC, while different dates are established for the public breakdown: June 1, 2021 for TLAC and not before January 1, 2024 for MREL.
Given that at the date of publication of this report BBVA is not considered a G-SII, the TLAC does not apply to it.
| • | Technical Implementation Standards on prudential disclosures of ESG risks. |
In accordance with article 449a CRR2, the EBA has published in January 2022 the final document that establishes the formats and tables to be used to disclose the information related to environmental, social and governance (ESG) risks. Its application will be gradual starting in Pillar 3 of 2022 (to be published in 2023). At the date of publication of this report, it had not yet been adopted by the European Commission or published in the OJEU.
Crypto assets
Another field that has attracted much attention from international organizations and national regulators during 2021 has been that of crypto assets.
At a global level, the Basel Committee on Banking Supervision published in June a preliminary proposal for the prudential treatment of bank exposures to crypto assets, although it has already announced that it is necessary to have a definitive standard, it will continue working on this new framework during 2022.
At the national level, the National Securities Market Commission (Comisión Nacional del Mercado de Valores. CNMV in Spanish) has issued a Circular to regulate the advertising of crypto assets, which will come into force at the beginning of next year. Meanwhile, in Turkey, the Central Bank issued a new regulation in April that forbids the development of business models by financial institutions that involve the use of crypto assets to make payments.
1.3. Contents of the 2021 Prudential Relevance Report
Article 13 of the CRR establishes that the parent entities of the European Union are subject, based on their consolidated situation, to the disclosure requirements set by Part Eight of CRR.
This report provides the prudential information of BBVA Consolidated Group as of December 31, 2021 which has been prepared in accordance with the precepts contained in Part Eight of the CRR, complying with the guidelines published by EBA and the applicable technical implementation standards.
In addition, the main EBA guidelines that apply as of December 31, 2021 are highlighted below:
| • | Guidelines on materiality, proprietary information, and confidentiality, and on the frequency of disclosure of information according to Article 432, sections 1 and 2, and Article 433 of Regulation (EU) No. 575/2013 (EBA/GL/2014/14). These guidelines detail the process and the criteria to be followed regarding the principles of materiality, proprietary information, confidentiality and the right to omit information, and provide guidance for entities to assess the need to publish information more frequently than the annual one. These guidelines were adopted by the Executive Commission of the Bank of Spain in February 2015. |
Table of Contents
| BBVA. PILLAR 3 2021 | 1. INTRODUCTION | P. 17 |
| • | Guidelines on reporting and disclosure of exposures subject to measures applied in response to the crisis arising from COVID-19 (EBA/GL/2020/07). These guidelines were adopted by the Executive Commission of the Bank of Spain on June 23, 2020. |
| • | Guidelines amending the EBA/GL/2018/01 guidelines on the uniform disclosure of information pursuant to Article 473a of Regulation (EU) No. 575/2013 (CRR) with regard to transitional provisions to mitigate the impact on own funds caused by the implementation of IFRS 9, aiming to guarantee compliance with the Quick Fix made to the CRR in response to the COVID-19 Pandemic (EBA/GL/2020/12). These guidelines are applicable from August 11, 2020 until the end of the transitional periods contemplated in articles 468 and 473 bis of the CRR (December 31, 2024 and December 31, 2022, respectively) |
| • | Implementing Technical Standards published in June 2020 concerning reporting and disclosure of public information (EBA/ITS/2020/04, hereinafter “New EBA ITS”). These technical standards implement the changes introduced by CRR2. |
In these technical implementation standards, the EBA, following the mandate of the European Commission in article 434a of the CRR2, implements the changes introduced by aforementioned regulation, integrating in a single document most of the disclosure requirements to the market that were disseminated in various guidelines published to date.
Additionally, these regulations also aim to unify, as far as possible, public information with the information reported to the Supervisor through integration in regulatory reporting and has meant in some cases the simplification of standard templates that could contain similar information, maintaining only those templates that include just complete and relevant information, such as those referring to the credit quality of the exposures.
Likewise, together with the aforementioned ITS, the EBA publishes for informative purposes a document called mapping tool that interrelates the quantitative information of most of the standard templates required in Pillar 3 with the regulatory reporting, which has been taken into account in the preparation of this report. The implementation of these standards may produce variations in the content and the way in which the information is presented with respect to previous periods.
| • | Guidelines on sound remuneration policies under Directive 2013/36/EU (EBA/GL/2021/04). These guidelines were adopted by the Executive Commission of the Bank of Spain in December 2021. |
Annex VII contains the list of main changes to the tables with respect to December 2020 derived from the adaptation to the regulations in force as of December 31, 2021.
Additionally, Annex VIII of this report contains the correspondence of the articles of Part Eight of the CRR on disclosure of information that are applicable at the date of the report with the different sections of the document where the required information is found.
The aforementioned annex, together with the rest of the annexes and the tables included in this report, are in an editable format in order to facilitate their treatment, following the recommendations of the EBA Guidelines. This document is called “Pillar 3 2021 - Tables & Annexes”, available in the Shareholders and Investors / Financial Information section of the Group’s website.
The Prudential Relevance Report (IRP - Pillar 3) of the BBVA Group, corresponding to the year ended December 31, 2021, has been prepared in accordance with the requirements of Part Eight of the CRR and approved by the Audit Committee (in its meeting held on March 1, 2022), applying the rules for the preparation of financial information of the BBVA Group and in compliance with the “General Policy for disclosure of economic-financial, non-financial and corporate information” approved by the governance bodies of Banco Bilbao Vizcaya Argentaria, SA.
Likewise, it should be noted that the data disclosed in the IRP - Pillar 3, have been prepared in accordance with the internal processes and controls described in the “Standard for the preparation of periodic public information of Banco Bilbao Vizcaya Argentaria, S.A.” and BBVA Group”. The aforementioned policies and standards guarantee that the information disclosed in the IRP Report - Pillar 3 is subject to the internal control framework defined by the Group, as well as to an adequate level of internal review.
Table of Contents
| BBVA. PILLAR 3 2021 | 2. GENERAL INFORMATION REQUIREMENTS | P. 18 |
2. General information requirements
Table of Contents
| BBVA. PILLAR 3 2021 | 2. GENERAL INFORMATION REQUIREMENTS | P. 19 |
2.1. Corporate name and differences between the consolidated group for the purposes of solvency regulations and accounting criteria
2.1.1. Corporate name and scope of application
Banco Bilbao Vizcaya Argentaria, S.A. (hereinafter the “Bank” or “BBVA”) is a private law entity subject to the rules and regulations of the banking entities operating in Spain and carries out its activity through branches and agencies throughout the country and abroad.
The bylaws and other public information are available for consultation at the Bank’s registered office (Plaza San Nicolás, 4, Bilbao) and on its website (www.bbva.com).
Solvency regulations are applicable at a consolidated level for the whole Group.
2.1.2. Differences between the consolidated group for the purposes of solvency regulations and accounting criteria
The Consolidated Financial Statements of BBVA Group are presented in accordance with the International Financial Reporting Standards adopted by the European Union (hereinafter referred to as ‘IFRS-EU’) applicable as of December 31, 2021, considering the Bank of Spain Circular 4/2017, and its successive modifications and the other provisions of the financial reporting framework which are applicable and the marking and format requirements established by Regulation EU 2019/815 of European Commission.
On the basis of accounting criteria, companies are considered to form part of a consolidated group when the parent entity holds or can hold, directly or indirectly, control of them. An institution is understood to control a subsidiary when it is exposed, or is entitled to, variable returns as a result of its involvement in the subsidiary and has the capacity to influence those returns through the power it exercises over the subsidiary. For control to exist, the following aspects must be fulfilled:
| a. | Power: An investor has power over a subsidiary when it has current rights that provide it with the capacity to direct its relevant activities, i.e. those that significantly affect the returns of the subsidiary. |
| b. | Returns: An investor is exposed, or is entitled to variable returns, as a result of its involvement in the subsidiary when the returns obtained by the investor for such involvement may vary based on |
| the economic performance of the subsidiary. Investor returns can be positive only, negative only, or positive and negative at the same time. |
| c. | Relationship between power and returns: An investor has control over a subsidiary when it not only has power over the subsidiary and is exposed, or is entitled to, variable returns for its involvement in the subsidiary, but it also has the capacity to use its power to influence the returns it obtains due to its involvement in the subsidiary. |
Therefore, in drawing up the Consolidated Financial Statements of BBVA Group, all dependent companies and consolidating structured entities have been consolidated by applying the full consolidation method.
Associated companies, as well as joint ventures (those over which joint control arrangements are in place), are valued using the equity method.
The list of all the companies forming part of the Group is included in the appendices to the Consolidated Financial Statements of BBVA Group.
For the purposes of solvency regulations, the following subsidiaries form part of the consolidated group, as defined in Article 18 of the CRR:
| • | Credit institutions |
| • | Investment firms |
| • | Financial Institutions |
A financial institution is a company, separate from other institutions (credit institution or investment firm), whose main activity may consist of acquiring holdings or performing one or more of the following activities:
| • | Loans, including in particular consumer finance, credit agreements relating to immovable property, recourse and non-recourse factoring, and financing of commercial transactions (including forfaiting) |
| • | Financial leasing |
| • | Payment services |
| • | Issuing and managing other payment channels (e.g. traveler’s checks and bank checks) |
| • | Granting of guarantees and commitments |
Table of Contents
| BBVA. PILLAR 3 2021 | 2. GENERAL INFORMATION REQUIREMENTS | P. 20 |
| • | Trading on their own account or on behalf of customers on any of the following instruments: |
| • | Money market instruments (checks, bills, certificates of deposit etc.) |
| • | Foreign currency |
| • | Financial futures and options |
| • | Foreign-exchange or interest-rate instruments |
| • | Marketable securities |
| • | Participating in the issuance of securities and the provision of corresponding services |
| • | Advising companies with regard to capital structure, industrial strategy and related matters, as well as advice and services for mergers and acquisitions of companies |
| • | Brokerage in the interbank markets |
| • | Managing or advising on equity management |
| • | Custody and administration of marketable securities |
| • | Issuance of electronic money |
This definition includes financial holding companies, mixed financial holding companies, payment institutions and asset management firms, but excludes pure industrial holding companies, insurance companies, insurance holding companies and mixed insurance holding companies.
| • | Auxiliary services companies: A company whose main activity is holding or management of property, management of computing services or any other similar activity of an auxiliary nature with regard to the main activity of one or more institutions (credit institution or investment firm). |
Therefore, for the purposes of calculating solvency requirements, and hence the drawing up of this Prudential Relevance Report, the scope of consolidating entities is different from the scope defined for the purposes of drawing up the Consolidated Financial Statements of BBVA Group.
The effect of the difference between the two regulations is mainly due to:
| • | Withdrawals from the balance made by entities (largely insurance companies regulated by the Solvency II regulatory framework) that are |
consolidated in the Consolidated Financial Statements of BBVA Group by the full consolidation method and consolidated for the purposes of solvency by applying the equity method. |
| • | Entries to the balance contributed mainly by financial entities, consolidated by applying the equity method at the accounting level, but for the purposes of solvency, are proportionally integrated. |
The list of entities that use different consolidation methods in their public and regulatory balance sheets is included in table LI3 in Annex I.
2.1.3. Significant transactions in the Group in 2021
Voluntary takeover bid for the entire share capital of Türkiye Garanti BankasI A.Ş (Garanti)
On November 15, 2021, BBVA announced a voluntary takeover bid addressed to the holders of the 2,106,300,000 shares1 not controlled by BBVA, representing 50.15% of Garanti’s total share capital. BBVA submitted for authorization an application of the voluntary takeover bid to the Capital Markets Board of Turkey (CMB) on November 18, 2021.
The consideration offered by BBVA to Garanti shareholders is 12.20 Turkish Liras in cash for each share. The maximum amount payable by BBVA will be 25,697 million Turkish Liras (equivalent to approximately €1,690 million at an exchange rate of 15.23 Turkish Liras per Euro estimated as of December 31, 2021) assuming all of Garanti’s shareholders sell their shares. BBVA will pay the consideration with its current shareholder’s funds. BBVA reserves the right to reduce or otherwise modify the voluntary takeover bid price by an amount equal to the gross amount of the distribution per share, if Garanti declares or distributes dividends, reserves or any other kind of distribution to its shareholders at any time from the date of the announcement on November 15, 2021 until the day of completion of the voluntary takeover bid. BBVA may cancel the takeover bid at any time before the commencement of the acceptance period.
The acquisition by BBVA of more than 50% of Garanti’s total share capital is subject to the prior approval of several authorities, both in Turkey and in other jurisdictions. BBVA will disclose to the market when all relevant authorizations are obtained. BBVA has received confirmation from the CMB that it will not formally approve the voluntary takeover bid application until the CMB receives confirmation from BBVA that all relevant approvals required by BBVA have been duly obtained. Only after approval by the CMB of the voluntary takeover bid application will the voluntary takeover bid period begin.
| 1 | All references to “shares” or “share” shall be deemed made to lots of 100 shares, which is the trading unit at Borsa Istanbul. |
Table of Contents
| BBVA. PILLAR 3 2021 | 2. GENERAL INFORMATION REQUIREMENTS | P. 21 |
The estimated impact will depend on the percentage of shares that are tendered. As of December 31, 2021, BBVA estimated maximum impact of minus 32 basis points in the Common Equity Tier 1 fully loaded ratio and approximately 2% accretion to its book value per share2, (all the above assuming that all Garanti shareholders accept the offer).
On the contrary, in 2021, the BBVA Group underwent two significant divestment operations.
Sale of BBVA’s U.S. subsidiary to PNC Financial Service Group
On June 1 2021, after obtaining all the required authorizations, BBVA completed the sale to The PNC Financial Services Group, Inc. of 100% of the capital stock of its subsidiary BBVA USA Bancshares, Inc., which in turn owned all the capital stock of the bank, BBVA USA.
The consideration received in cash by BBVA amounted to approximately $11.5 billion (price provided in the agreement minus the agreed closing price adjustments) equivalent to approximately €9.6 billion (with an exchange rate of 1.20 EUR / USD).
The accounting of both the results generated by BBVA USA Bancshares since the announcement of the transaction and the closing of its sale has had an aggregate positive impact on the BBVA Group’s Common Equity Tier 1 (“fully loaded”) ratio of approximately 294 basis points, which includes the generation of capital contributed by the subsidiary to the Group until the closing of the transaction (on June 1, 2021) and a profit net of taxes of €582 million. As a result thereof, the BBVA Group has been reflecting the results that BBVA USA Bancshares, Inc. has been generating, as well as the positive impact, mainly, of these results on the Common Equity Tier 1 (“fully loaded”) ratio of BBVA Group. The calculation of the impact on Common Equity Tier 1 has been made taking into account the amount of the transaction in euros and BBVA Group’s financial statements as of June 2021.
The BBVA Group continues to develop an institutional and wholesale business in the United States that it currently carries out through its broker-dealer BBVA Securities Inc. and the New York branch. BBVA also maintains its investment activity in the fintech sector through its participation in Propel Venture Partners US Fund I, L.P.
Sale of the BBVA Group’s stake in Paraguay
On January 22, 2021, once the mandatory authorizations were obtained, BBVA completed the sale of its direct and indirect shareholding of 100% of the capital stock of Banco Bilbao Vizcaya Argentaria Paraguay, S.A. (“BBVA Paraguay”) to Banco GNB Paraguay S.A., a subsidiary of the Gilinski Group. This transaction was originally agreed in 2019. The total amount received by BBVA amounted to approximately USD 250 million (approximately €210 million). The transaction generated a capital loss net of taxes of approximately €9 million. This transaction had a positive impact on the Common Equity Tier 1 (fully loaded) of the BBVA Group of approximately 6 basis points, which is reflected in the capital base of the BBVA Group in the fiscal year 2021.
2.1.4. Reconciliation of the Public Balance Sheet from the accounting perimeter to the regulatory perimeter
This section includes an exercise in transparency to show the reconciliation process between the book balances reported in the public balance sheet (attached to the Consolidated Financial Statements of BBVA Group) and the book balances this report uses (regulatory perimeter), revealing the main differences between both perimeters.
| 2 | The calculation of the impact on Common Equity Tier 1 and tangible book value per share was made taking into consideration the consolidated Group’s financial statements as of December 31, 2021, and an exchange rate of 15.23 Turkish Lira per Euro. The impact on CET1 and the tangible book value per share may be different from the date of this disclosure up to the date of closing of the Voluntary Takeover Bid due to, among other circumstances, changes in the book value of Garanti and changes in the Turkish Lira/Euro exchange rate. |
Table of Contents
| BBVA. PILLAR 3 2021 | 2. GENERAL INFORMATION REQUIREMENTS | P. 22 |
Table 2. EU CC2 - Reconciliation of regulatory capital to balance sheet (Million Euros. 12-31-2021)
Public Balance Sheet Headings | Public Balance Sheet | Regulatory balance sheet | Reference to template EU CC1 | |||||||||
Cash, cash balances at central banks and other demand deposits | 67,799 | 68,031 | ||||||||||
Financial assets held for trading | 123,493 | 124,555 | ||||||||||
Non-trading financial assets mandatorily at fair value through profit or loss | 6,086 | 1,728 | ||||||||||
Financial assets designated at fair value through profit or loss | 1,092 | — | ||||||||||
Financial assets at fair value through accumulated other comprehensive income | 60,421 | 45,656 | ||||||||||
Financial assets at amortised cost | 372,676 | 366,622 | ||||||||||
Derivatives - Hedge accounting | 1,805 | 1,649 | ||||||||||
Fair value changes of the hedged items in portfolio hedges of interest rate risk | 5 | 5 | ||||||||||
Joint ventures and associates | 900 | 3,857 | ||||||||||
Insurance and reinsurance assets | 269 | — | ||||||||||
Tangible assets | 7,298 | 7,051 | ||||||||||
Intangible assets | 2,197 | 2,159 | g | ) | ||||||||
Tax assets | 15,850 | 15,462 | ||||||||||
Of which: deferred tax assets | 14,917 | 14,629 | h | ) | ||||||||
Other assets | 1,934 | 3,609 | ||||||||||
Non-current assets and disposal groups classified as held for sale | 1,061 | 1,127 | ||||||||||
|
|
|
| |||||||||
Total Assets | 662,885 | 641,511 | ||||||||||
|
|
|
| |||||||||
Financial liabilities held for trading | 91,135 | 91,417 | ||||||||||
Financial liabilities designated at fair value through profit or loss | 9,683 | 3,396 | ||||||||||
Financial liabilities at amortised cost | 487,893 | 484,848 | o | ) p) r) | ||||||||
Derivatives - Hedge accounting | 2,626 | 2,457 | ||||||||||
Fair value changes of the hedged items in portfolio hedges of interest rate risk | — | — | ||||||||||
Liabilities under insurance and reinsurance contracts | 10,865 | 56 | ||||||||||
Provisions | 5,889 | 5,411 | ||||||||||
Tax liabilities | 2,413 | 1,622 | ||||||||||
Of which: deferred tax liabilities | 1,769 | 1,019 | ||||||||||
Other liabilities | 3,621 | 3,610 | ||||||||||
Non-current assets and disposal groups classified as held for sale | — | 66 | ||||||||||
|
|
|
| |||||||||
Total liabilities | 614,125 | 592,882 | ||||||||||
|
|
|
| |||||||||
Capital | 3,267 | 3,267 | a | ) | ||||||||
Share premium | 23,599 | 23,599 | a | ) | ||||||||
Equity instruments issued other than capital | — | — | ||||||||||
Other equity | 60 | 60 | c | ) | ||||||||
Retained earnings | 31,841 | 30,745 | b | ) | ||||||||
Revaluation reserves | — | — | ||||||||||
Other reserves | (1,857 | ) | (907 | ) | c | ) | ||||||
Less: treasury shares | (647 | ) | (647 | ) | l | ) | ||||||
Profit or loss attributable to owners of the parent | 4,653 | 4,601 | e | ) | ||||||||
Less: interim dividend | (532 | ) | (532 | ) | e | ) | ||||||
Accumulated other comprehensive income (loss) | (16,476 | ) | (16,352 | ) | c | ) | ||||||
Minority interests | 4,853 | 4,797 | ||||||||||
|
|
|
| |||||||||
Total equity | 48,760 | 48,630 | ||||||||||
|
|
|
| |||||||||
Total equity and total liabilities | 662,885 | 641,511 | ||||||||||
|
|
|
| |||||||||
The main differences between the public balance sheet and the regulatory balance sheet are due to withdrawals from the balance generated by insurance, real estate and financial entities that are consolidated through the application of the equity method for the amount of €-22.530 million; and balance entries generated by entities that are consolidated using the proportional integration method for an amount of €+1.156 million.
The following table also shows the risk to which each of the items on the regulatory balance sheet is exposed:
Table of Contents
| BBVA. PILLAR 3 2021 | 2. GENERAL INFORMATION REQUIREMENTS | P. 23 |
Table 3. EU LI1 - Differences between the accounting and regulatory scopes of consolidation and the mapping of the financial statements categories with regulatory risk categories (Million Euros. 12-31-2021)
| Carrying values of items(1) | ||||||||||||||||||||||||||||
| Carrying values as reported in published financial statements (2) | Carrying Values under scope of regulatory consolidation (5) | Subject to credit risk framework | Subject to counterparty credit risk framework | Subject to the Securitisation framework | Subject to the market risk framework | Not subject to capital requirements or subject to deduction from capital | ||||||||||||||||||||||
Assets | ||||||||||||||||||||||||||||
Cash, cash balances at central banks and other demand deposits | 67,799 | 68,032 | 67,179 | 853 | — | — | — | |||||||||||||||||||||
Financial assets held for trading | 123,493 | 124,555 | 551 | 83,321 | — | 124,004 | — | |||||||||||||||||||||
Non-trading financial assets mandatorily at fair value through profit or loss | 6,086 | 1,728 | 1,681 | — | 33 | — | 14 | |||||||||||||||||||||
Financial assets designated at fair value through profit or loss | 1,092 | — | — | — | — | — | — | |||||||||||||||||||||
Financial assets at fair value through accumulated other comprehensive income | 60,421 | 45,656 | 45,383 | — | 124 | — | 149 | |||||||||||||||||||||
Financial assets at amortised cost | 372,676 | 366,653 | 353,024 | 9,646 | 3,653 | — | 330 | |||||||||||||||||||||
Derivatives - Hedge accounting | 1,805 | 1,649 | — | 1,649 | — | — | — | |||||||||||||||||||||
Fair value changes of the hedged items in portfolio hedges of interest rate risk | 5 | 5 | — | — | — | — | 5 | |||||||||||||||||||||
Joint ventures and associates | 900 | 3,857 | 3,511 | — | — | — | 346 | |||||||||||||||||||||
Insurance and reinsurance assets | 269 | — | — | — | — | — | — | |||||||||||||||||||||
Tangible assets | 7,298 | 7,053 | 7,053 | — | — | — | — | |||||||||||||||||||||
Intangible assets | 2,197 | 2,159 | 687 | — | — | — | 1,472 | |||||||||||||||||||||
Tax assets(6) | 15,850 | 15,462 | 14,453 | — | — | — | 1,009 | |||||||||||||||||||||
Other assets(7) | 1,934 | 3,682 | 1,472 | — | — | — | 2,210 | |||||||||||||||||||||
Non-current assets and disposal groups classified as held for sale (4) | 1,061 | 1,020 | 1,020 | — | — | — | — | |||||||||||||||||||||
|
|
|
|
|
|
|
|
|
|
|
|
|
| |||||||||||||||
Total assets | 662,886 | 641,511 | 496,014 | 95,469 | 3,809 | 124,004 | 5,535 | |||||||||||||||||||||
|
|
|
|
|
|
|
|
|
|
|
|
|
| |||||||||||||||
Liabilities | ||||||||||||||||||||||||||||
Financial liabilities held for trading | 91,134 | 91,417 | — | 75,596 | — | 91,417 | — | |||||||||||||||||||||
Financial liabilities designated at fair value through profit or loss | 9,683 | 3,396 | — | — | — | — | 3,396 | |||||||||||||||||||||
Financial liabilities at amortised cost | 487,893 | 484,848 | — | 10,454 | — | — | 474,394 | |||||||||||||||||||||
Derivatives - Hedge accounting | 2,626 | 2,457 | — | 2,457 | — | — | — | |||||||||||||||||||||
Fair value changes of the hedged items in portfolio hedges of interest rate risk | — | — | — | — | — | — | — | |||||||||||||||||||||
Liabilities under insurance and reinsurance contracts | 10,865 | 73 | — | — | — | — | 73 | |||||||||||||||||||||
Provisions | 5,889 | 5,411 | 691 | — | — | — | 4,720 | |||||||||||||||||||||
Tax liabilities(3) | 2,413 | 1,622 | 878 | — | — | — | 744 | |||||||||||||||||||||
Other liabilities | 3,621 | 3,593 | — | — | — | — | 3,593 | |||||||||||||||||||||
Liabilities included in disposal groups classified as held for sale (4) | — | 66 | — | — | — | — | 66 | |||||||||||||||||||||
|
|
|
|
|
|
|
|
|
|
|
|
|
| |||||||||||||||
Total Liabilities | 614,124 | 592,883 | 1,569 | 88,507 | — | 91,417 | 486,986 | |||||||||||||||||||||
|
|
|
|
|
|
|
|
|
|
|
|
|
| |||||||||||||||
| (1) | For the purpose of the template, when a single item is associated with the capital requirements according to more than one risk framework, it is shown in all the columns corresponding to the capital requirements to which it is associated. As a result, the sum of the values of the columns by type of risk may be greater than the carrying value according to the scope of regulatory consolidation. |
| (2) | Deferred tax assets that depend on future income, reduced by the amount of deferred tax liabilities (article 38 of the CRR) are € 3,119 million and have a risk weighting of 250% in application of article 48 of the CRR. The remaining tax assets include deferred tax assets that do not depend on future income and current tax assets. |
| (3) | Other assets include mainly an amount of €1,883 million relating to insurance contracts linked to pensions, which are not subject to capital requirements. |
A summary table with the main sources of differences between the amount of exposures in regulatory terms (EAD) and the accounting balances according to the Financial Statements is below:
Table of Contents
| BBVA. PILLAR 3 2021 | 2. GENERAL INFORMATION REQUIREMENTS | P. 24 |
Table 4. EU LI2 - Main sources of the differences between regulatory original exposure amounts and carrying values in financial statements (Million Euros. 12-31-2021)
| Items subject to: | ||||||||||||||||||||
| Total | Credit risk framework | Counterparty credit risk framework | Securitisation framework | Market risk framework | ||||||||||||||||
Asset carrying value amount under scope of regulatory consolidation | 719,296 | 496,014 | 95,469 | 3,809 | 124,004 | |||||||||||||||
Liabilities carrying value amount under scope of regulatory consolidation | 181,493 | 1,569 | 88,507 | — | 91,417 | |||||||||||||||
|
|
|
|
|
|
|
|
|
| |||||||||||
Total net amount under regulatory scope of consolidation | 537,803 | 494,445 | 6,962 | 3,809 | 32,587 | |||||||||||||||
|
|
|
|
|
|
|
|
|
| |||||||||||
Amount of off-balance-sheet | 170,432 | 166,804 | 3,628 | — | ||||||||||||||||
Differences in valuation(1) | (260 | ) | — | — | — | (260 | ) | |||||||||||||
Differences due to netting agreements (netting, long/short positions) (2) | 113,750 | — | 113,750 | |||||||||||||||||
Differences due to accounting Provisions(3) | 5,115 | 5,115 | — | |||||||||||||||||
Differences due to credit risk mitigation techniques (CRM) | (28,582 | ) | (5,267 | ) | (23,315 | ) | — | |||||||||||||
Differences due to credit conversion factors (CCF) | (93,151 | ) | (93,151 | ) | ||||||||||||||||
Differences due to risk transfer securitisations | (1,141 | ) | — | — | (1,141 | ) | ||||||||||||||
Counterparty credit risk in derivatives (includes the add-on) | 12,296 | 12,296 | ||||||||||||||||||
Other | (757 | ) | (9 | ) | (748 | ) | ||||||||||||||
|
|
|
|
|
|
|
|
|
| |||||||||||
Exposure amounts considered for regulatory purposes | 715,505 | 567,937 | 112,573 | 2,668 | 32,327 | |||||||||||||||
|
|
|
|
|
|
|
|
|
| |||||||||||
| (1) | It includes the deduction for prudent valuation adjustments. This deduction is included in row 7 of table EU CC1. |
| (2) | This amount includes the reversal of the accounting netting of derivatives and repurchase agreements to include the netting adjustment applicable in prudential regulation; and the impact of the collateral adjustment on securities financing transactions. |
| (3) | Includes provisions for exposures to credit risk under advanced approach that do not reduce the EAD. |
As the table shows, the main sources of difference between the accounting value on the balance sheet and the amount of exposure for regulatory purposes are the inclusion of off-balance sheet items after the conversion factor, the different treatment of the guarantees eligible as risk mitigation techniques and the regulatory treatment of derivative and securities financing transactions (inclusion of netting rules other than those applied in accounting value and the inclusion of the potential future exposure).
Table of Contents
| BBVA. PILLAR 3 2021 | 2. GENERAL INFORMATION REQUIREMENTS | P. 25 |
2.2. Identification of dependent entities with bank capital below the minimum requirement. Possible impediments to transferring own funds
As of December 31, 2021, there are no entities in the Group with capital adequacy below their applicable minimum regulatory requirement.
The Group operates mainly in Spain, Mexico, Turkey and South America. The Group’s banking subsidiaries around the world are subject to supervision and regulation (with respect to issues such as compliance with a minimum level of regulatory capital) by a number of regulatory bodies.
The obligation to comply with these capital requirements may affect the capacity of these banking subsidiaries to transfer funds (e.g. via dividends) to the parent company.
In some jurisdictions in which the Group operates, the regulations lay down that dividends may only be paid with the funds available by regulation for this purpose.
2.3. Exemptions from capital requirements at the individual or sub-consolidated level
In accordance with what is set out in the solvency regulations regarding the exemption from capital requirements compliance for Spanish credit institutions belonging to a consolidated group (at individual or sub-consolidated level) established in the aforementioned regulation, the Group obtained exemption from the supervisor on December 30, 2009 for the following companies (this exemption was ratified through ECB decision 1024/2013):
| • | Banco Industrial de Bilbao, S.A. |
| • | Banco Occidental, S.A. |
In addition, for Financiero de Crédito de Portugal (BBVA IFIC, S.A.), the ECB has decided not to apply prudential or liquidity requirements individually
Table of Contents
| BBVA. PILLAR 3 2021 | 3. ELIGIBLE OWN FUNDS AND MINIMUM REQUIREMENTS | P. 26 |
3. Eligible own funds and minimum requirements
3.1. | BBVA Group’s regulatory capital tiers | 27 | ||||
3.2. | Eligible own funds | 31 | ||||
3.3. | Own Funds requirements by risk type | 36 | ||||
3.3.1. | Entity risk profile | 36 | ||||
3.3.2. | Breakdown of minimum capital requirements by risk type | 39 | ||||
3.4. | IFRS 9 and OCI Transitional Arrangements | 42 | ||||
3.5. | Procedure used in the capital self- assesment process | 44 | ||||
Table of Contents
| BBVA. PILLAR 3 2021 | 3. ELIGIBLE OWN FUNDS AND MINIMUM REQUIREMENTS | P. 27 |
3.1. BBVA Group’s regulatory capital tiers
Article 92 of the CRR establishes that credit institutions must maintain the following own funds requirements at all times:
| a. | Common Equity Tier 1 capital ratio of 4.5%, calculated as Common Equity Tier 1 capital expressed as a percentage on the total amount of risk-weighted assets. |
| b. | Tier 1 capital ratio of 6%, calculated as the level of tier capital 1 expressed as a percentage of the total amount of risk-weighted assets. |
| c. | Total capital ratio of 8%, calculated as the total own funds expressed as a percentage of the total amount of risk-weighted assets |
Notwithstanding the application of the Pillar 1 requirement, CRD IV allows competent authorities to require credit institutions to maintain a level of own funds higher than the requirements of Pillar 1 to cover types of risk other than those already covered by the Pillar 1 requirement (this power of the competent authority is commonly referred to as “Pillar 2”).
Furthermore, from 2016 and in accordance with CRD IV, credit institutions must comply with the following combined requirement of capital buffers at all times: (i) the capital conservation buffer, (ii) the buffer for global systemically important banks (the “G-SIB” buffer), (iii) the entity-specific countercyclical capital buffer, (iv) the buffer for other systemically important banks (“D-SIB” buffer) and (v) the systemic risk capital buffer. The “combined capital buffer requirement” must be met with Common Equity Tier 1 capital (“CET1”) to cover both minimum capital required by “Pillar 1” and “Pillar 2”.
Both the capital conservation buffer and the G-SIB buffer (where appropriate) will apply to credit institutions as it establishes a percentage greater than 0%.
The buffer for global systemically important banks applies to those institutions on the list of global systemically important banks, which is updated annually by the Financial Stability Board (“FSB”). Considering the fact that BBVA does not appear on that list, as at the report date, the G-SIB buffer does not apply to BBVA.
For more details on the quantitative indicators for assessing global systemically important entities, see “Annex VI – G-SIB indicators”.
The Bank of Spain has extensive discretionary powers as regards the countercyclical capital buffer specific to each bank, the buffer for other systemically important financial institutions (which are those institutions considered to be systemically important domestic financial institutions “D-SIB”) and the buffer against systemic risk (to prevent or avoid systemic or
macroprudential risk). The European Central Bank (ECB) has the powers to issue recommendations in this respect following the entry into force on November 4, 2014 of the Single Supervisory Mechanism (SSM).
With regard to minimum capital requirements, following the latest decision of the SREP (Supervisory Review and Evaluation Process), which comes into force as of March 1, 2022, the ECB has notified the Group of maintaining the Pillar 2 requirement at 1.5% (of which at least 0.84% should be satisfied with CET1). Therefore, BBVA must maintain a CET1 capital ratio of 8.60% and a total capital ratio of 12.76% at a consolidated level.
Thus, the consolidated overall capital requirement includes: i) the minimum capital requirement of Common Equity Tier 1 (CET1) of Pillar 1 (4.5%); ii) the capital requirement of Additional Tier 1 (AT1) of Pillar 1 (1.5%); iii) the capital requirement of Tier 2 of Pillar 1 (2%); iv) the CET1 requirement of Pillar 2 (0.84%), v) the capital requirement of Additional Tier 1 (AT1) of Pillar 2 (0.28%); vi) the capital requirement of Tier 2 of Pillar 2 (0.38%); vii) the capital conservation buffer (2.5% of CET1); viii) the capital buffer for Other Systemically Important Institutions (O-SIIs) (0.75% of CET1); and ix) the countercyclical buffer (CCyB) (0.01% of CET1).
The BBVA Group has set the objective of maintaining a fully loaded CET1 ratio at a consolidated level of between 11.5% -12.0%, increasing the target distance to the minimum requirement (currently at 8.60%) at 290-340 basis points. At closing of the financial year 2021, the fully loaded CET1 ratio is above this target management range.
CET1 phased-in ratio reach 12.98% which represents +438 basis points over the minimum requirement of 8.60%.
Table of Contents
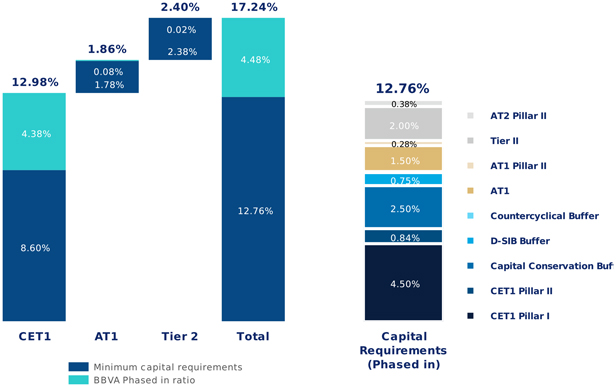
Table of Contents
| BBVA. PILLAR 3 2021 | 3. ELIGIBLE OWN FUNDS AND MINIMUM REQUIREMENTS | P. 29 |
The following table shows the CET1 ratio that would
trigger restrictions on capital distribution and the capital
ratios as of December 2021:
Table 5. Capital distribution constraints (12-31-2021)
| CET1 capital ratio that would trigger capital distribution constraints (%) | Current CET 1 capital ratio(%) | |||||||
CET1 Pillar 1 | 4.50 | % | ||||||
CET1 Pillar 2 (P2R) | 0.84 | % | ||||||
Capital conservation buffer | 2.50 | % | ||||||
D-SIB buffer | 0.75 | % | ||||||
Countercyclical buffer | 0.01 | % | ||||||
CET1 phased-in minimum plus Basel III buffers (excluding capital used to meet other minimum regulatory capital) | 8.60 | % | 12.98 | % | ||||
CET1 phased-in minimum plus Basel III buffers (including capital used to meet other minimum regulatory capital) | N/A | N/A | ||||||
The Group has not been required to use phased-in CET1
capital to meet other capital requirements other than
those established by the SREP letter.
The following table shows the distribution by geographic
areas of the credit exposure for calculation of the
countercyclical capital buffer. Countries where no buffer
is established are grouped:
Table of Contents
| BBVA. PILLAR 3 2021 | 3. ELIGIBLE OWN FUNDS AND MINIMUM REQUIREMENTS | P. 30 |
Table 6.1. Geographical breakdown of relevant credit exposures for the calculation of the countercyclical capital buffer (Million Euros. 12-31-2021)
| General credit exposures (1) | Trading book exposure | Securitisation exposure | Own funds requirements | |||||||||||||||||||||||||||||||||||||||||||||||||
| Exposure value for SA | Exposure value for IRB | Sum of long and short position of trading book | Trading book exposure value for internal models | Exposure value for SA | Total exposure value | Of which: General credit exposures | Of which: Trading book exposures | Of which: Securitisation exposures | Total | Risk-weighted exposure amounts | Own funds requirements weights | Countercyclical capital buffer rate | ||||||||||||||||||||||||||||||||||||||||
Geographical |
|
|
|
|
|
|
|
|
|
|
|
|
| |||||||||||||||||||||||||||||||||||||||
Bulgary | 26 | 5 | — | — | — | 31 | 2 | — | — | 2 | 29 | 0.01 | % | 0.50 | % | |||||||||||||||||||||||||||||||||||||
Slovakia | 3 | 161 | — | — | — | 163 | 19 | — | — | 19 | 238 | 0.11 | % | 1.00 | % | |||||||||||||||||||||||||||||||||||||
Hong Kong | 4 | 3,324 | — | — | — | 3,328 | 50 | — | — | 50 | 621 | 0.30 | % | 1.00 | % | |||||||||||||||||||||||||||||||||||||
Luxemburg | 90 | 1,693 | 16 | 16 | — | 1,816 | 69 | — | — | 69 | 864 | 0.41 | % | 0.50 | % | |||||||||||||||||||||||||||||||||||||
Norway | 20 | 57 | 1 | 1 | — | 78 | 3 | — | — | 3 | 44 | 0.02 | % | 1.00 | % | |||||||||||||||||||||||||||||||||||||
Czech Republic | 14 | 99 | — | — | — | 113 | 2 | — | — | 2 | 30 | 0.01 | % | 0.50 | % | |||||||||||||||||||||||||||||||||||||
|
|
|
|
|
|
|
|
|
|
|
|
|
|
|
|
|
|
|
|
|
|
|
|
|
| |||||||||||||||||||||||||||
Total countries with countercyclical capital buffer | 157 | 5,339 | 17 | 17 | — | 5,529 | 145 | — | — | 145 | 1,826 | 0.86 | % | |||||||||||||||||||||||||||||||||||||||
|
|
|
|
|
|
|
|
|
|
|
|
|
|
|
|
|
|
|
|
|
|
|
|
|
| |||||||||||||||||||||||||||
Germany | 208 | 6,371 | 243 | 255 | 47 | 7,124 | 179 | 1 | — | 180 | 2,254 | 1.08 | % | — | ||||||||||||||||||||||||||||||||||||||
Argentina | 7,037 | 372 | 10 | — | — | 7,419 | 332 | — | — | 332 | 4,151 | 1.99 | % | — | ||||||||||||||||||||||||||||||||||||||
Colombia | 14,926 | 704 | 613 | — | — | 16,244 | 792 | 8 | — | 800 | 9,998 | 4.79 | % | — | ||||||||||||||||||||||||||||||||||||||
Spain | 24,491 | 179,418 | 140 | 5 | 2,861 | 206,916 | 5,780 | 15 | 26 | 5,820 | 72,755 | 34.88 | % | — | ||||||||||||||||||||||||||||||||||||||
United States | 692 | 23,758 | 154 | 151 | — | 24,754 | 644 | 2 | — | 645 | 8,066 | 3.87 | % | — | ||||||||||||||||||||||||||||||||||||||
France | 1,312 | 9,045 | 61 | 65 | — | 10,483 | 284 | 1 | — | 286 | 3,572 | 1.71 | % | — | ||||||||||||||||||||||||||||||||||||||
Italy | 20 | 6,487 | 13 | 12 | — | 6,532 | 169 | 1 | — | 169 | 2,116 | 1.01 | % | — | ||||||||||||||||||||||||||||||||||||||
Mexico | 37,477 | 42,311 | 148 | 39 | — | 79,974 | 3,306 | 11 | — | 3,317 | 41,468 | 19.88 | % | — | ||||||||||||||||||||||||||||||||||||||
Netherlands | 548 | 5,150 | 57 | 60 | — | 5,815 | 196 | 1 | — | 197 | 2,458 | 1.18 | % | — | ||||||||||||||||||||||||||||||||||||||
Peru | 22,476 | 847 | 958 | 4 | — | 24,285 | 1,002 | 14 | — | 1,016 | 12,697 | 6.09 | % | — | ||||||||||||||||||||||||||||||||||||||
Portugal | 2,558 | 2,013 | — | 1 | — | 4,573 | 216 | — | — | 216 | 2,696 | 1.29 | % | — | ||||||||||||||||||||||||||||||||||||||
United Kingdom | 2,803 | 7,237 | 139 | 144 | — | 10,322 | 380 | 1 | — | 380 | 4,756 | 2.28 | % | — | ||||||||||||||||||||||||||||||||||||||
Turkey | 43,341 | 510 | 116 | — | — | 43,966 | 2,286 | 2 | — | 2,288 | 28,605 | 13.71 | % | — | ||||||||||||||||||||||||||||||||||||||
|
|
|
|
|
|
|
|
|
|
|
|
|
|
|
|
|
|
|
|
|
|
|
|
|
| |||||||||||||||||||||||||||
Total countries with a 0% countercyclical buffer or without countercyclical capital buffer (with own funds requirements greater than 1%) | 157,889 | 284,223 | 2,652 | 736 | 2,908 | 448,407 | 15,566 | 57 | 26 | 15,646 | 195,592 | 93.76 | % | |||||||||||||||||||||||||||||||||||||||
|
|
|
|
|
|
|
|
|
|
|
|
|
|
|
|
|
|
|
|
|
|
|
| |||||||||||||||||||||||||||||
Other areas (2) | 8,353 | 14,825 | 243 | 68 | — | 23,491 | 891 | 7 | — | 901 | 11,231 | 5.38 | % | |||||||||||||||||||||||||||||||||||||||
|
|
|
|
|
|
|
|
|
|
|
|
|
|
|
|
|
|
|
|
|
|
|
| |||||||||||||||||||||||||||||
Total countries without countercyclical capital buffer (with own funds requirements less than 1%) | 8,353 | 14,825 | 243 | 68 | — | 23,491 | 891 | 7 | — | 901 | 11,231 | 5.38 | % | |||||||||||||||||||||||||||||||||||||||
|
|
|
|
|
|
|
|
|
|
|
|
|
|
|
|
|
|
|
|
|
|
|
| |||||||||||||||||||||||||||||
Total | 166,399 | 304,387 | 2,912 | 821 | 2,908 | 477,427 | 16,602 | 64 | 26 | 16,692 | 208,649 | 100.00 | % | |||||||||||||||||||||||||||||||||||||||
|
|
|
|
|
|
|
|
|
|
|
|
|
|
|
|
|
|
|
|
|
|
|
| |||||||||||||||||||||||||||||
| (1) | Credit exposure excludes exposures to Central Governments or Central Banks, Regional Governments or Local Authorities, Public sector entities, Multilateral Development Banks, International Organisations and Institutions in accordance with art. 140.4 of Directive 2013/36/EU |
| (2) | A full breakdown of the countries with relevant exposures for the calculation of the countercyclical capital buffer which are included in “Other areas”, is in Annex IV. |
Table of Contents
| BBVA. PILLAR 3 2021 | 3. ELIGIBLE OWN FUNDS AND MINIMUM REQUIREMENTS | P. 31 |
Table 6.2. Amount of institution-specific countercyclical capital buffer (Million Euros. 12-31-2021)
| Amount | ||||
Total risk exposure amount | 307,795 | |||
Institution specific countercyclical buffer rate (1) | 0.01 | % | ||
Institution specific countercyclical buffer requirement | 20 | |||
| (1) | Countercyclical capital buffer calculated as of December 2020 in accordance with Commission Delegated Regulation (EU) 2015/1555 |
The countercyclical capital buffer requirement applicable to the BBVA Group is approximately 0.01%, which increased slightly compared to December 2020, mainly due to the sale of the US subsidiary. This sale has
increased the contribution of countries where there are countercyclical buffer requirements. Within this group is Luxembourg with a buffer of 0.5% (rising from 0.25% in 2020) and Hong Kong with a buffer of 1%.
For the purposes of calculating minimum capital requirements, according to Regulation (EU) 575/2013 and subsequent amendments, which entered into force on June 27, 2019 (CRR), the elements and instruments of Tier 1 capital are defined as the sum of Common Equity Tier 1 capital (CET1) and additional Tier 1 capital (AT1), as defined in Part Two, Title I, Chapters I to III of the CRR, as well as their corresponding deductions, in accordance with Articles 36 and 56, respectively.
Also considered are the elements of Tier 2 capital defined in Part Two of Chapter IV, Section I of the CRR. The deductions defined as such in Section II of the same Chapter are also considered.
The level of Common Equity Tier 1 capital essentially comprises the following elements:
| a. | Capital and share premium: this includes the elements described in article 26 section 1, and 28 of the CRR and the EBA list referred to in Article 26 Section 3 of the CRR. |
| b. | Accumulated gains: in accordance with Article 26. 1 c), the gains that may be used immediately and with no restriction to cover any risk or losses are included, in the event that they occur. |
| c. | Other accumulated income and other reserves: in accordance with Article 26. 1, d) and e), this item primarily classifies the exchange-rate differences and the valuation adjustments associated with the portfolio of financial assets at fair value with changes to other comprehensive income. |
| d. | Minority interests eligible as CET1: includes the sum of the Common Equity Tier 1 capital instruments of a subsidiary that arise in the process of its global consolidation and are attributable to natural or legal third persons other than companies included in the consolidation, calculated in accordance with Article 84 et seq. of the CRR. |
| e. | Net profit of the year attributed to the Group: the independently verified profits are included, net of any possible expense or foreseeable dividend |
| previously authorised by the supervisor (following the treatment set out in Article 5 of Decision (EU) 2015/656 of the ECB). As of December 2021, it includes the prudential accrual of 0.23 cents/share as Shareholders remuneration related to 2021 results, which has been agreed by the Management Board on February, 15, 2022 (pending approval by the General Shareholders’ Meeting to be held on March 18, 2022). |
Furthermore, CET1 capital is adjusted mainly through the following deductions:
| f. | Additional value adjustments: this includes adjustments resulting from the prudent valuation of positions at fair value, as set out in Article 105 of the CRR. |
| g. | Intangible assets: these are included net of the corresponding tax liabilities, as set out in Article 36.1 b) and Article 37 of the CRR. It mainly includes goodwill, software and other intangible assets. The amount shall be deducted from the amount of the accounting revaluation of the intangible assets of the subsidiaries derived from the consolidation of the subsidiaries attributable to persons other than the companies included in the consolidation. This includes the positive effect due to the prudent treatment of software following the publication of Delegated Regulation 2020/2176 of December 22. |
| h. | Deferred tax assets: it includes deferred tax assets that rely on future profitability and do not rise from temporary differences (net of the corresponding tax liabilities when the conditions established in Article 38.3 of the CRR are met), as per Article 36.1 c) and Article 38 of the CRR, mainly loss carryforwards (LCFs). |
| i. | Reserves at fair value related to losses or gains from cash flow hedging: includes value adjustments of cash flow hedging of financial instruments not valued at fair value, including expected cash flows in accordance with Article 33 a) of the CRR. |
Table of Contents
| BBVA. PILLAR 3 2021 | 3. ELIGIBLE OWN FUNDS AND MINIMUM REQUIREMENTS | P. 32 |
| j. | Negative amounts due to the calculation of the expected losses: the default provision on expected losses in exposure weighted by method based on internal ratings, calculated in accordance with Article 36.1 d) of the CRR, is included. |
| k. | Profit and loss at fair value: these are derived from the entity’s own credit risk, in accordance with Article 33 b) of the CRR. |
| l. | Direct, indirect and synthetic holdings of own instruments (treasury stock): includes the shares and other instruments eligible as capital that are held by any of the Group’s consolidating entities, together with those held by non-consolidating entities belonging to the economic Group, as set out in Article 36.1 f) and Article 42 of the CRR. It mainly includes the amount of the treasury stock up to the maximum limit authorized by the ECB to the BBVA Group and the financing of own treasury shares. |
It should be noted that on October 26, 2021, BBVA received the required authorization from the ECB to repurchase up to 10% of its share capital for a maximum amount of €3.5 billion, in one or several times and over a maximum period of 12 months (Share Buyback Program). This amount has been fully deducted from the Group’s capital ratios as of December 31, 2021.
| m. | Securitisation: any instance of securitisation that receives a risk weighting of 1.250% is included, as set out in Article 36.1 k) ii) of the CRR. |
| n. | Other regulatory adjustments: other CET1 deductions are included according to the CRR, which were not recognised in the above headings, such as: |
| i. | losses and gains at fair value arising from the entity’s own credit risk related to derivative liabilities (DVA). |
| ii. | the amount corresponding to the insufficient coverage of non-performing exposures, taking into account the supervisory expectations on prudential provisions for non-performing exposures published in the Appendix to the ECB Guide on non-performing loans for credit institutions published in March 2018. |
| iii. | the adjustment for the transitional treatment of the impact of IFRS9. In this regard, it is worth mentioning that since 2018, the BBVA Group has applied the static and dynamic treatment of the impacts of IFRS 9, therefore, the phased-in capital and leverage ratios are calculated taking into account the transitional provisions defined in Article 473 bis of the CRR and its subsequent amendments to |
| the aforementioned article introduced by Regulation 2020/873 of the Parliament and of the Council of June 24, 2020 in response to the COVID19 Pandemic, opting to apply section 7a of the aforementioned article in the calculation of the impact of the transitory treatment on phased-in risk-weighted assets. |
| iv. | the amount of the deduction arise from significant holdings in financial institutions and deferred tax assets arising from temporary differences that exceed the 10% limit of the CET1, as well as the deduction for exceeding the joint limit of 17.65% of the CET1 according to Article 48.2 of the CRR. |
In addition, as of December 31, 2021, the Group do not hold stakes in financial institutions that are excluded from the application of the previously mentioned limits (article 49 of the CRR) and, therefore, the standard template of the EBA INS1 shall not be applicable.
In addition, the Group includes as total eligible additional Tier 1 capital instruments defined in Articles 51, 52, 85, 86 and 484 of the CRR, including the corresponding adjustments, in accordance with Article 472 of the CRR:
| o. | Capital instruments and share premium eligible as AT1: this item includes the perpetual contingent convertible securities that meet the conditions set out in Articles 51 and 52.1, 53 and 54 of the CRR. |
| p. | Elements referred to in Article 484.4 of the CRR: this section includes preferred securities issued by the Group. |
| q. | Qualifying Tier 1 capital included in the consolidated additional capital issued by affiliates and held by third parties: this item includes the amount of additional Tier 1 capital from the subsidiaries, calculated in accordance with Article 85 and 86 of the CRR. |
Finally, the Group also includes Tier 2 eligible capital as own funds, which includes the following elements:
| r. | Capital instruments and Tier 2 share premiums: includes funding that, for credit ranking purposes, comes behind all the common creditors. The issues, moreover, have to fulfil a number of conditions, which are laid out in Article 63 of the CRR, taking into account the transitory provisions established in Part Ten, Chapter 4 of the CRR |
| s. | Eligible own funds instruments eligible as Tier 2 capital issued by subsidiaries and held by third parties: these instruments are included under Articles 87 and 88 of the CRR. |
Table of Contents
| BBVA. PILLAR 3 2021 | 3. ELIGIBLE OWN FUNDS AND MINIMUM REQUIREMENTS | P. 33 |
| t. | Credit risk adjustments: it includes the surplus resulting from comparing the provisions and expected credit losses related to exposures calculated under IRB approach with the limit of 0.6% of the risk-weighted exposure. |
| u. | Tier 2 Regulatory adjustments: this mainly includes direct and indirect holdings of own Tier 2 capital instruments and the adjustment of the element described in letter t) derived from the transitional treatment of the impact of IFRS9. |
Annex III outlines the main characteristics of capital instruments eligible for inclusion as additional Tier 1 and Tier 2 capital.
Table of Contents
| BBVA. PILLAR 3 2021 | 3. ELIGIBLE OWN FUNDS AND MINIMUM REQUIREMENTS | P. 34 |
The amount of total eligible capital, net of deductions, for the different items making up the capital base as of December 31, 2021 and 2020, respectively, is below, in accordance with the requirements for the disclosure of
information related to regulatory own funds established by the Implementing Technical Standards (EBA/ ITS/2020/04):
Table 7. Amount of capital (EU CC1) (Million Euros)
Reference to template EU CC2(1) | 12-31-2021 | 6-30-2021 | 12-31-2020 | |||||||||
a) Capital and share premium | 26,866 | 26,866 | 27,259 | |||||||||
b) Retained earnings | 30,745 | 30,249 | 29,974 | |||||||||
c) Other accumulated earnings and other reserves | (17,200 | ) | (14,531 | ) | (14,023 | ) | ||||||
d) Minority interests eligible as CET1 | 2,800 | 3,069 | 3,656 | |||||||||
e) Net profit of the year attributed to the Group | 2,573 | 1,124 | 860 | |||||||||
|
|
|
|
|
| |||||||
Common Equity Tier 1 Capital before other regulatory adjustments | 45,784 | 46,776 | 47,726 | |||||||||
|
|
|
|
|
| |||||||
f) Additional value adjustments | (260 | ) | (303 | ) | (233 | ) | ||||||
g) Intangible assets | (1,484 | ) | (1,585 | ) | (3,455 | ) | ||||||
h) Deferred tax assets | (1,009 | ) | (1,168 | ) | (1,478 | ) | ||||||
i) Fair value reserves related to gains o losses on cash flow hedges | 483 | 309 | (204 | ) | ||||||||
j) Expected losses in equity | — | — | — | |||||||||
k) Profit or losses on liabilities measured at fair value | (2 | ) | 5 | 21 | ||||||||
l) Direct, indirect and synthetic holdings of own instruments(2) | (2,800 | ) | (350 | ) | (366 | ) | ||||||
m) Securitisations tranches at 1250% | (22 | ) | (23 | ) | (29 | ) | ||||||
n) Other CET1 regulatory adjustments | (741 | ) | 241 | 949 | ||||||||
|
|
|
|
|
| |||||||
Total Common Equity Tier 1 regulatory adjustments | (5,835 | ) | (2,874 | ) | (4,795 | ) | ||||||
|
|
|
|
|
| |||||||
Common Equity Tier 1 (CET1) | 39,949 | 43,903 | 42,931 | |||||||||
|
|
|
|
|
| |||||||
o) Equity instruments and AT1 share premium | 5,265 | 5,183 | 6,130 | |||||||||
p) Elements referred in Article 484(4) of the CRR | — | — | — | |||||||||
q) Qualifying Tier 1 capital included in consolidated AT1 capital issued by subsidiaries and held by third parties | 472 | 513 | 536 | |||||||||
|
|
|
|
|
| |||||||
Additional Tier 1 before regulatory adjustments | 5,737 | 5,696 | 6,666 | |||||||||
|
|
|
|
|
| |||||||
Total regulatory adjustments of Additional Tier 1 | — | — | — | |||||||||
|
|
|
|
|
| |||||||
Additional Tier 1 (AT1) | 5,737 | 5,696 | 6,666 | |||||||||
|
|
|
|
|
| |||||||
Tier 1 (Common Equity Tier 1+Additional Tier 1) | 45,686 | 49,599 | 49,597 | |||||||||
|
|
|
|
|
| |||||||
r) Equity instruments and Tier 2 share premiums | 4,324 | 4,328 | 4,540 | |||||||||
s) Eligible own funds instruments included in consolidated Tier 2 issued by subsidiaries and held by third parties | 2,516 | 2,735 | 3,410 | |||||||||
-Of which: instruments issued by subsidiaries subject to phase-out | — | 31 | 23 | |||||||||
t) Credit risk adjustments | 722 | 722 | 604 | |||||||||
|
|
|
|
|
| |||||||
Tier 2 before regulatory adjustments | 7,562 | 7,785 | 8,554 | |||||||||
|
|
|
|
|
| |||||||
u) Tier 2 regulatory adjustments | (179 | ) | (97 | ) | (6 | ) | ||||||
|
|
|
|
|
| |||||||
Tier 2 | 7,383 | 7,688 | 8,547 | |||||||||
|
|
|
|
|
| |||||||
Total Capital (Total capital = Tier 1 + Tier 2) | 53,069 | 57,287 | 58,145 | |||||||||
|
|
|
|
|
| |||||||
Total RWAs | 307,795 | 305,599 | 353,273 | |||||||||
|
|
|
|
|
| |||||||
CET 1 (phased-in) | 12.98 | % | 14.37 | % | 12.15 | % | ||||||
CET 1 (fully loaded) | 12.75 | % | 14.17 | % | 11.73 | % | ||||||
TIER 1 (phased-in) | 14.84 | % | 16.23 | % | 14.04 | % | ||||||
TIER 1 (fully loaded) | 14.62 | % | 16.04 | % | 13.62 | % | ||||||
Total Capital (phased-in) | 17.24 | % | 18.75 | % | 16.46 | % | ||||||
Total Capital (fully loaded) | 16.99 | % | 18.48 | % | 15.91 | % | ||||||
| (*) | As of 31 December 2021, the difference between the phased-in and fully loaded ratios arises from the transitional treatment of certain elements of capital, mainly the impact of IFRS 9, to which the BBVA Group has voluntarily adhered (in accordance with article 473a of the CRR). See table 11 for more information on the transitional impact of IFRS 9. In addition, noted that the Group to date is not applying the transitional treatment of unrealised gains and losses valued at fair value through Other comprehensive Income (hereinafter, unrealised P&L measured at fair value through OCI) as defined in Article 1.6 of that Regulation amending Article 468 of the CRR. Therefore, the Group’s own funds, capital and leverage ratios to date reflect the full impact of the above-mentioned unrealised P&L measured at fair value through OCI. |
| (1) | References to regulatory balance sheet (EU CC2) where these items are included |
| (2) | As of 31 December 2021, €3,500 million is included as a deduction corresponding to the maximum amount authorised by the ECB for the repurchase of own shares under the Share Buyback Program, of which the first tranche approved by the Board of Directors and pending to be executed by an amount of €931 million is recorded under “Accumulated other income and other reserves” while the remaining amount of €2,569 million is included under the row “Direct, indirect and synthetic holdings of own instruments”. |
The consolidated fully-loaded CET1 ratio stood at 12.75% at the end of December 2021, which represents an increase of 102 basis points compared to 2020, with the phased-in CET1 ratio of 12.98%, which represents an increase of 83 basis points compared to 2020. The
difference between both ratios is mainly explained by the effect of the temporary adjustments for the treatment of the solvency indicators of the impacts of IFRS 9.
Table of Contents
| BBVA. PILLAR 3 2021 | 3. ELIGIBLE OWN FUNDS AND MINIMUM REQUIREMENTS | P. 35 |
These ratios include the effects of the divestments in Paraguay in the first quarter and in the United States in the second quarter of 2021. Additionally, these ratios include the negative non recurring impact of €696 million from the net costs associated with the restructuring process in Spain, as well as the deduction of the total amount of the share buyback program authorized by the European Central Bank, for an amount of €3.5 billion. Excluding these impacts, during the 2021 financial year a high organic generation of results has been registered, which, net of shareholder remuneration and remuneration of the Contingent Convertible bonds (CoCos, for its acronym in English), have contributed +82 basis points to the CET1 ratio and have made it possible to cover the negative evolution of market variables, as well as supervisory impacts and regulatory changes.
Fully loaded risk-weighted assets (RWA) decreased by approximately €-45.4 billion in 2021 compared to 2020, mainly due to the aforementioned divestments in Paraguay and the United States.
Additional Tier 1 capital (AT1) fully-loaded stood at 1.87% (1.86% phased-in) at the end of December 2021, which includes the reduction effect of €1 billion due to early amortization of an issuance of CoCos dating back to 2016, offset by the positive effect of reducing RWAs.
The Tier 2 fully-loaded ratio stood at 2.37%, which represents an increase of +7 basis points compared to 2020, mainly explained by the effect of the RWA reduction during the 2021 financial year. Regarding the tier 2 phased-in, stood at 2.40%, the difference being with respect to the fully-loaded Tier 2 ratio, mainly due to the temporary treatment of certain subordinated issues.
As a consequence of the foregoing, the fully-loaded total capital ratio stands at 16.99% as of December 2021, with the total phased-in ratio being 17.24% as of the same date.
The evolution of fully loaded CET1 ratio during the year 2021 is below:
Chart 2. Annual evolution of the CET1 fully loaded ratio
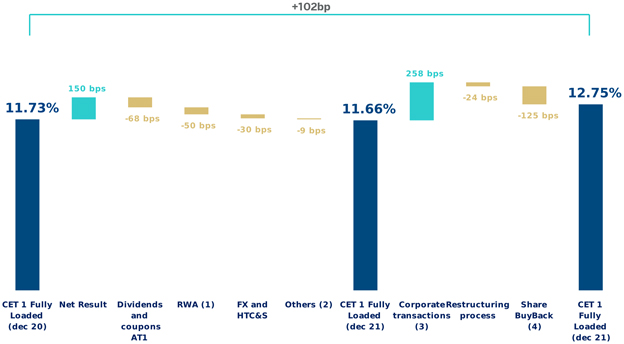
| (1) | “RWA” includes the effects derived from the TRIM (Targeted Review of Internal Models) and other regulatory/supervisory impacts. (2) “Others” includes, among others, minority interests and regulatory deductions. (3) “M&A” includes the sale of BBVA Paraguay and BBVA USA. (4) “Share Buyback” includes the deduction of the maximum amount of €3.5 billion from the framework program for the repurchase of own shares. That deduction was carried out in October in accordance with the authorization of the ECB. |
The characteristics of the main capital instruments are shown in Annex III, in accordance with the standard template EU CCA.
The process of reconciliation between accounting own funds and regulatory own funds is shown below. Based
on the shareholders’ equity reported in the Consolidated Financial Statements of BBVA Group and applying the deductions and adjustments shown in the table below, reaching to the regulatory capital figure eligible for solvency purposes:
Table of Contents
| BBVA. PILLAR 3 2021 | 3. ELIGIBLE OWN FUNDS AND MINIMUM REQUIREMENTS | P. 36 |
Table 8. Reconciliation of the Public Balance Sheet from the accounting perimeter to the regulatory perimeter (Million Euros)
Eligible capital own funds | 31-12-2021 | 31-12-2020 | ||||||
Capital | 3,267 | 3,267 | ||||||
Share premium | 23,599 | 23,992 | ||||||
Retained earnings, revaluation reserves and other reserves | 29,984 | 30,344 | ||||||
Other equity | 60 | 42 | ||||||
Less: Treasury shares | (647 | ) | (46 | ) | ||||
Attributable to the parent company | 4,653 | 1,305 | ||||||
Attributable dividend | (532 | ) | — | |||||
|
|
|
| |||||
Total equity | 60,384 | 58,904 | ||||||
|
|
|
| |||||
Accumulated other comprehensive income (Loss) | (16,477 | ) | (14,356 | ) | ||||
Non-controlling interest | 4,853 | 5,472 | ||||||
|
|
|
| |||||
Shareholders`equity | 48,760 | 50,020 | ||||||
Goodwill and other intangible assets | (1,484 | ) | (3,775 | ) | ||||
Deductions | (1,484 | ) | (3,775 | ) | ||||
Differences from solvency and accounting level | (130 | ) | (186 | ) | ||||
|
|
|
| |||||
Equity not eligible at solvency level | (130 | ) | (186 | ) | ||||
|
|
|
| |||||
Other adjustments and deductions(2) | (7,197 | ) | (3,128 | ) | ||||
|
|
|
| |||||
Common Equity Tier 1 (CET 1) | 39,949 | 42,931 | ||||||
|
|
|
| |||||
Additional Tier 1 before Regulatory Adjustments | 5,737 | 6,666 | ||||||
|
|
|
| |||||
Total regulatory adjustments of additional Tier 1 | — | — | ||||||
|
|
|
| |||||
Tier 1 | 45,686 | 49,597 | ||||||
|
|
|
| |||||
Tier 2 | 7,383 | 8,548 | ||||||
|
|
|
| |||||
Total Capital (Tier 1 + Tier 2) | 53,069 | 58,145 | ||||||
|
|
|
| |||||
Total Minimum capital required(1) | 39,275 | 45,042 | ||||||
|
|
|
| |||||
| (1) | Calculated over minimum total capital applicable for each period |
| (2) | Other adjustments and deductions include, among others, the adjustment related to the amount of minority interest not eligible as capital, the amount of the treasury shares repurchase up to the maximum limit authorised by the ECB to BBVA Group and the amount of dividends not yet distributed |
3.3.Own Funds requirements by risk type
The BBVA Group has a general risk management and control model (hereinafter, the “Model”) that is appropriate for its business model, its organisation, the countries where it operates and its corporate governance system. This model allows the Group to carry out its activity within the risk management and control strategy and policy defined by the corporate bodies of BBVA and to adapt itself to a changing economic and regulatory environment, facing this management at a global level and aligned to the circumstances at all times. The Model establishes a suitable risk management system related to the risk profile and strategy of the entity.
The types of risk inherent in the business that make up the risk profile of the Group are as follows:
| • | Credit risk and dilution: Credit risk arises from the probability that one party to a financial instrument will fail to meet its contractual obligations for reasons of insolvency or inability to pay and cause a financial loss for the other party. This includes counterparty risk, issuer risk, liquidation risk and country risk. |
| • | Counterparty risk: The credit risk corresponding to derivative instruments, repurchase and reverse repurchase transactions, securities or commodities lending or borrowing transactions and deferred settlement transactions. |
| • | Credit Valuation Adjustment Risk (CVA): Its aim is to reflect the impact on the fair value of the counterparty’s credit risk, resulting from OTC derivative instruments which are not recognised credit derivatives for the purpose of reducing the amount of credit risk weighted exposure |
| • | Market risk: Market risk originates in the possibility that there may be losses in the value of positions held due to movements in the market variables that affect the valuation of financial products and assets in the trading book. This includes risk with respect to the position in debt and equity instruments, exchange rate risk and commodity risk. |
Table of Contents
| BBVA. PILLAR 3 2021 | 3. ELIGIBLE OWN FUNDS AND MINIMUM REQUIREMENTS | P. 37 |
| • | Operational risk: a risk that may cause losses as a result of human error; inadequate or defective internal processes; inadequate conduct towards customers, in the markets or against the company; failures, interruptions or deficiencies in systems or communications; theft, loss or misuse of information, as well as deterioration of its quality; internal or external fraud including, in all cases, fraud resulting from cyber-attacks; theft or physical damage to assets or persons; legal risks; risks resulting from workforce and occupational health management; and inadequate service provided by suppliers. This definition includes legal risk, but excludes strategic and/or business risk and reputational risk. |
| • | Structural risk: This is divided into structural interest-rate risk (movements in market interest rates that cause changes in an entity’s net interest income and book value) and structural exchange-rate risk (exposure to variations in exchange rates originating in the Group’s foreign companies and in the provision of funds to foreign branches financed in a different currency from that of the investment). |
| • | Liquidity risk: Risk of an entity having difficulties in duly meeting its payment commitments, or where, to meet them, it has to resort to funding under burdensome terms which may harm the Group’s image or reputation. |
| • | Reputational risk: Considered to be the potential loss in earnings as a result of events that may negatively affect the perception of the Group’s different stakeholders. |
The following table shows the total capital requirements broken down by risk type as of December 31, 2021 and December 31, 2020:
Table of Contents
| BBVA. PILLAR 3 2021 | 3. ELIGIBLE OWN FUNDS AND MINIMUM REQUIREMENTS | P. 38 |
Table 9. EU OV1 - Overview of RWAs (Million Euros)
| RWEAs(1) | Minimum Capital Requirements (2) (3) | |||||||||||||||||||||||
| 12-31-2021 | 9-30-2021 | 6-30-2021 | 3-31-2021 | 12-31-2020 | 12-31-2021 | |||||||||||||||||||
Credit risk (excluding CCR) (4) (5) | 247,299 | 248,114 | 249,971 | 294,538 | 293,210 | 19,784 | ||||||||||||||||||
|
|
|
|
|
|
|
|
|
|
|
| |||||||||||||
Of which the standardised approach (6) | 129,741 | 133,827 | 132,910 | 186,059 | 186,576 | 10,379 | ||||||||||||||||||
Of which the Foundation IRB (F-IRB) approach | — | — | — | — | — | — | ||||||||||||||||||
Of which: slotting approach | 4,498 | 4,348 | 4,124 | 4,252 | 4,263 | 360 | ||||||||||||||||||
Of which equity IRB under the simple risk-weighted approach(7) | 2,442 | 2,570 | 2,623 | 1,991 | 1,831 | 195 | ||||||||||||||||||
Of which the Advanced IRB (A-IRB) approach (8) | 97,614 | 92,279 | 95,878 | 91,323 | 81,817 | 7,809 | ||||||||||||||||||
Counterparty credit risk - CCR | 13,870 | 11,282 | 11,286 | 9,304 | 9,284 | 1,110 | ||||||||||||||||||
|
|
|
|
|
|
|
|
|
|
|
| |||||||||||||
Of which the standardised approach | 11,298 | 9,520 | 9,356 | 7,859 | 7,710 | 904 | ||||||||||||||||||
Of which internal model method (IMM) | — | — | — | — | — | — | ||||||||||||||||||
Of which exposures to a CCP | 54 | 68 | 63 | 99 | 89 | 4 | ||||||||||||||||||
Of which credit valuation adjustment - CVA | 2,518 | 1,694 | 1,867 | 1,346 | 1,485 | 201 | ||||||||||||||||||
Of which other CCR | — | — | — | — | — | — | ||||||||||||||||||
Settlement risk | — | — | — | — | 1 | — | ||||||||||||||||||
|
|
|
|
|
|
|
|
|
|
|
| |||||||||||||
Securitisation exposures in the non-trading book (after the cap) | 325 | 131 | 139 | 279 | 347 | 26 | ||||||||||||||||||
|
|
|
|
|
|
|
|
|
|
|
| |||||||||||||
Of which internal assessment approach (SEC-IRBA) | 300 | 103 | 116 | 130 | 143 | 24 | ||||||||||||||||||
Of which external assessment approach (SEC-ERBA) | 25 | 28 | 23 | 149 | 204 | 2 | ||||||||||||||||||
Of which standardised approach (SEC-SA) | — | — | — | — | — | — | ||||||||||||||||||
Of which 1250%/ deduction | — | — | — | — | — | — | ||||||||||||||||||
Market Risk | 14,712 | 12,846 | 13,440 | 14,733 | 14,773 | 1,177 | ||||||||||||||||||
|
|
|
|
|
|
|
|
|
|
|
| |||||||||||||
Of which the standardised approach (SA) | 4,445 | 4,118 | 5,375 | 5,937 | 6,397 | 356 | ||||||||||||||||||
Of which IMA | 10,267 | 8,728 | 8,065 | 8,796 | 8,376 | 821 | ||||||||||||||||||
Large exposures | — | — | — | — | — | — | ||||||||||||||||||
|
|
|
|
|
|
|
|
|
|
|
| |||||||||||||
Operational risk | 31,589 | 30,629 | 30,763 | 35,488 | 35,656 | 2,527 | ||||||||||||||||||
|
|
|
|
|
|
|
|
|
|
|
| |||||||||||||
Of which basic indicator approach | 748 | 757 | 755 | 849 | 883 | 60 | ||||||||||||||||||
Of which standardised approach | 30,841 | 29,872 | 30,008 | 34,639 | 34,773 | 2,467 | ||||||||||||||||||
Of which advanced measurement approach | — | — | — | — | — | — | ||||||||||||||||||
|
|
|
|
|
|
|
|
|
|
|
| |||||||||||||
Amounts below the thresholds for deduction (subject to 250% risk weight)(9) | 15,112 | 16,851 | 16,127 | 15,182 | 15,566 | 1,209 | ||||||||||||||||||
|
|
|
|
|
|
|
|
|
|
|
| |||||||||||||
Total | 307,795 | 303,002 | 305,599 | 354,342 | 353,273 | 24,624 | ||||||||||||||||||
|
|
|
|
|
|
|
|
|
|
|
| |||||||||||||
| (1) | Risk-weighted assets according to the phased-in period |
| (2) | Considering the minimum total capital requirement of 8% (Article 92 of the CRR) |
| (3) | Under the total capital requirement ratio after the supervisory review process (SREP), the total capital requirement ratio amounts to 12.76% (€39,275 million as of the reporting date) |
| (4) | It has been modified in accordance with the EBA mapping tool and the figures of previous periods have been restated for comparison purposes only. The main modifications are indicated in the following notes 5, 6, 7 and 8 of this table. |
| (5) | Including amounts below the deduction thresholds subject to 250% weighting (DTAs rise to €7,309 million and significant investments in financial sector entities and insurance companies amounting to €7,800 million). |
| (6) | Excluding deferred tax assets arising from temporary differences subject to 250% risk weighting in accordance with Article 48.4 CRR. This amount is €7,312 million as of december 31, 2021. |
| (7) | It includes only equity exposures under the IRB approach with the simple weighting method. In previous periods, equity exposures under internal models were also included. |
| (8) | It includes only equity exposures under the advanced internal ratings-based approach (AIRB). Previous periods also included equity exposures under the PD/LGD method and capital consumptions that the Group incorporates to reflect a more conservative treatment of certain elements under article 3 CRR. |
| (9) | The information in this row is disclosed for information purposes only, as the amount included here is also included in row 1, where institutions are requested to disclose information on credit risk. As a consequence, this row should not be taken into account when calculating the total indicated at the bottom of the table. |
During 2021, several singular impacts have been recorded which explain the evolution of Risk-Weighted Assets (RWAs):
i) Relevant corporate transactions: The sale of the BBVA subsidiary in USA has generated a reduction in RWAs of approximately €50 billion, which is mainly reflected in credit risk under the standardised approach, in market risk under the standardized approach (SA) and in risk operational under the standard method. Likewise, the sale of BBVA Paraguay has generated a reduction of approximately €1.2 billion in RWAs under the standardised approach.
ii) Regulatory changes and supervisory impacts:
| • | The adoption of the new counterparty credit risk framework (SA-CCR) in June 2021 has generated an increase in RWAs of approximately €2.7 billion (includes both the impact on counterparty credit risk and CVA). |
| • | The implementation of the new definition of default, which in terms of RWAs has generated an increase of approximately €3.2 billion among the standard method and IRB portfolios which also includes the effect derived from |
Table of Contents
| BBVA. PILLAR 3 2021 | 3. ELIGIBLE OWN FUNDS AND MINIMUM REQUIREMENTS | P. 39 |
parameters such as the probability of default or its severity.
| • | During 2021 the Group included the effects derived from the process known as TRIM (Targeted Review of Internal Models) and which has had a net impact of €3.9 billion once the Group applied the front loading of RWAs constituted in previous periods by an amount of approximately €10.87 billion. |
iii) The effect, mainly on sovereign exposures under the standard model that the downgrade of Peru’s credit
quality had in the third quarter of 2021 for an amount of approximately +€800 million.
The evolution of RWAs by type of risk is explained in more detail in the respective sections of the report.
Total risk-weighted assets are shown below, broken down by type of risk (where credit risk includes counterparty risk) as of December 31, 2021 and December 31, 2020:
Chart 3. Distribution of RWAs by risk type eligible on Pillar I

| (1) | Credit Risk includes Risk for CVA adjustment and the prudential advance for the impacts of the TRIM and other regulatory/supervisory impacts |
3.3.2. Breakdown of minimum capital requirements by risk type
This section provides an overview of risk-weighted assets and the minimum capital requirements established by Article 92 of the CRR.
The following is a breakdown of risk-weighted assets and capital requirements broken down by risk type and exposure categories as of December 31, 2021, September 30, 2021 and December 31, 2020:
Table of Contents
| BBVA. PILLAR 3 2021 | 3. ELIGIBLE OWN FUNDS AND MINIMUM REQUIREMENTS | P. 40 |
Table 10. Capital requirements by risk type and exposure class (Million Euros)
| Capital requirements(2) | RWA’s(1) | |||||||||||||||||||||||
Exposure Class and risk type | 12-31-2021 | 9-30-2021 | 12-31-2020 | 12-31-2021 | 9-30-2021 | 12-31-2020 | ||||||||||||||||||
Credit Risk | 10,853 | 11,051 | 14,926 | 135,660 | 138,140 | 186,576 | ||||||||||||||||||
|
|
|
|
|
|
|
|
|
|
|
| |||||||||||||
Central governments or central banks | 2,521 | 2,506 | 2,347 | 31,511 | 31,320 | 29,343 | ||||||||||||||||||
Regional governments or local authorities | 95 | 67 | 185 | 1,189 | 837 | 2,317 | ||||||||||||||||||
Public sector entities | 70 | 51 | 61 | 876 | 644 | 768 | ||||||||||||||||||
Multilateral development banks | — | 1 | 1 | 6 | 6 | 7 | ||||||||||||||||||
International organisations | �� | — | — | — | — | — | — | |||||||||||||||||
Institutions | 566 | 494 | 626 | 7,073 | 6,173 | 7,827 | ||||||||||||||||||
Corporates | 3,177 | 3,358 | 6,226 | 39,710 | 41,969 | 77,821 | ||||||||||||||||||
Retail | 2,282 | 2,386 | 2,749 | 28,520 | 29,822 | 34,362 | ||||||||||||||||||
Secured by mortgages on immovable property | 691 | 701 | 1,022 | 8,637 | 8,767 | 12,769 | ||||||||||||||||||
Exposures in default | 280 | 366 | 358 | 3,495 | 4,581 | 4,480 | ||||||||||||||||||
Exposures associated with particularly high risk | 292 | 329 | 381 | 3,654 | 4,116 | 4,758 | ||||||||||||||||||
Covered bonds | — | — | — | — | — | — | ||||||||||||||||||
Claims on institutions and corporates with a short-term credit assessment | — | — | — | — | — | 1 | ||||||||||||||||||
Collective investments undertakings | — | — | — | 1 | 1 | 3 | ||||||||||||||||||
Other exposures | 879 | 792 | 970 | 10,987 | 9,904 | 12,120 | ||||||||||||||||||
|
|
|
|
|
|
|
|
|
|
|
| |||||||||||||
Total credit risk by standardised approach | 10,853 | 11,051 | 14,926 | 135,660 | 138,140 | 186,576 | ||||||||||||||||||
|
|
|
|
|
|
|
|
|
|
|
| |||||||||||||
Credit Risk | 8,599 | 8,147 | 6,939 | 107,492 | 101,834 | 86,729 | ||||||||||||||||||
|
|
|
|
|
|
|
|
|
|
|
| |||||||||||||
Central governments or central banks | 79 | 84 | 68 | 983 | 1,052 | 849 | ||||||||||||||||||
Institutions | 578 | 543 | 567 | 7,228 | 6,785 | 7,084 | ||||||||||||||||||
Corporates | 6,044 | 5,671 | 4,826 | 75,554 | 70,881 | 60,325 | ||||||||||||||||||
Of which: SMEs | 1,202 | 1,113 | 916 | 15,023 | 13,907 | 11,452 | ||||||||||||||||||
Of which: Specialised lending | 414 | 409 | 393 | 5,173 | 5,110 | 4,912 | ||||||||||||||||||
Of which: Others | 4,429 | 4,149 | 3,517 | 55,359 | 51,864 | 43,961 | ||||||||||||||||||
Retail | 1,898 | 1,849 | 1,478 | 23,727 | 23,116 | 18,471 | ||||||||||||||||||
Of which: Secured by mortgages on immovable property | 882 | 793 | 586 | 11,027 | 9,910 | 7,319 | ||||||||||||||||||
Of which: Qualifying revolving | 523 | 528 | 479 | 6,541 | 6,601 | 5,987 | ||||||||||||||||||
Of which: Other SMEs | 122 | 127 | 103 | 1,520 | 1,588 | 1,289 | ||||||||||||||||||
Of which: Other Non-SMEs | 371 | 401 | 310 | 4,639 | 5,017 | 3,876 | ||||||||||||||||||
Equity | 1,059 | 1,236 | 1,162 | 13,235 | 15,449 | 14,532 | ||||||||||||||||||
|
|
|
|
|
|
|
|
|
|
|
| |||||||||||||
Simple risk weight approach | 195 | 206 | 146 | 2,442 | 2,570 | 1,830 | ||||||||||||||||||
Exposures in sufficiently diversified portfolios (RW 190%) | 108 | 115 | 89 | 1,351 | 1,431 | 1,114 | ||||||||||||||||||
Exchange traded exposures (RW 290%) | 56 | 61 | 34 | 702 | 768 | 425 | ||||||||||||||||||
Others (RW 370%) | 31 | 30 | 23 | 389 | 371 | 291 | ||||||||||||||||||
Exposures subject to a 250% risk weight | 624 | 319 | 651 | 7,800 | 3,992 | 8,144 | ||||||||||||||||||
PD/LGD approach | 205 | 34 | 316 | 2,559 | 429 | 3,945 | ||||||||||||||||||
Internal models approach | 35 | 677 | 49 | 433 | 8,458 | 613 | ||||||||||||||||||
|
|
|
|
|
|
|
|
|
|
|
| |||||||||||||
Total credit risk by IRB approach | 9,658 | 9,382 | 8,101 | 120,727 | 117,283 | 101,261 | ||||||||||||||||||
|
|
|
|
|
|
|
|
|
|
|
| |||||||||||||
Total contributions to the default fund of a CCP | 4 | 5 | 7 | 54 | 68 | 89 | ||||||||||||||||||
|
|
|
|
|
|
|
|
|
|
|
| |||||||||||||
Securitisation exposures | 26 | 11 | 28 | 325 | 131 | 347 | ||||||||||||||||||
|
|
|
|
|
|
|
|
|
|
|
| |||||||||||||
Total credit risk | 20,541 | 20,450 | 23,062 | 256,766 | 255,622 | 288,273 | ||||||||||||||||||
|
|
|
|
|
|
|
|
|
|
|
| |||||||||||||
Settlement risk | — | — | — | — | — | 1 | ||||||||||||||||||
|
|
|
|
|
|
|
|
|
|
|
| |||||||||||||
Standardised approach: | 191 | 196 | 275 | 2,386 | 2,459 | 3,431 | ||||||||||||||||||
Of which: Fixed income price risk | 113 | 120 | 155 | 1,414 | 1,505 | 1,943 | ||||||||||||||||||
Of which: Securitisation price risk | — | — | — | 2 | 2 | 4 | ||||||||||||||||||
Of which: Correlation Trading Portfolio market risk | 44 | 46 | 97 | 555 | 575 | 1,210 | ||||||||||||||||||
Of which: Equity market risk | 28 | 24 | 22 | 353 | 305 | 264 | ||||||||||||||||||
Of which: Commodities risk | 5 | 6 | 1 | 63 | 72 | 10 | ||||||||||||||||||
IRB: Market Risk | 821 | 698 | 669 | 10,267 | 8,728 | 8,376 | ||||||||||||||||||
|
|
|
|
|
|
|
|
|
|
|
| |||||||||||||
Total trading book risk | 1,012 | 894 | 944 | 12,653 | 11,187 | 11,807 | ||||||||||||||||||
|
|
|
|
|
|
|
|
|
|
|
| |||||||||||||
Foreign exchange risk (standardised approach) | 165 | 133 | 237 | 2,059 | 1,659 | 2,966 | ||||||||||||||||||
|
|
|
|
|
|
|
|
|
|
|
| |||||||||||||
CVA risk | 201 | 136 | 119 | 2,518 | 1,694 | 1,485 | ||||||||||||||||||
|
|
|
|
|
|
|
|
|
|
|
| |||||||||||||
Operational risk | 2,527 | 2,450 | 2,853 | 31,589 | 30,629 | 35,656 | ||||||||||||||||||
|
|
|
|
|
|
|
|
|
|
|
| |||||||||||||
Others (3) | 177 | 177 | 1,047 | 2,211 | 2,211 | 13,084 | ||||||||||||||||||
|
|
|
|
|
|
|
|
|
|
|
| |||||||||||||
Capital requirements | 24,624 | 24,240 | 28,262 | 307,795 | 303,002 | 353,273 | ||||||||||||||||||
|
|
|
|
|
|
|
|
|
|
|
| |||||||||||||
| (1) | Risk-weighted assets for the transitional period (phased-in) |
| (2) | Calculated on the minimum total capital requirements of 8% (Article 92 of the CRR). |
| (3) | This line includes capital consumptions that the Group incorporates to reflect a more conservative treatment of certain elements in accordance with article 3 CRR |
Table of Contents
| BBVA. PILLAR 3 2021 | 3. ELIGIBLE OWN FUNDS AND MINIMUM REQUIREMENTS | P. 41 |
The full series of the capital requirements and RWA by risk type, during the year 2021, is available in the editable file “Pillar 3 2021 - Tables & Annexes”.
A breakdown of RWAs distribution by method each exposure category is below:
Chart 4. Distribution of RWAs by exposure category and method (Million Euros and %. 12-31-2021)
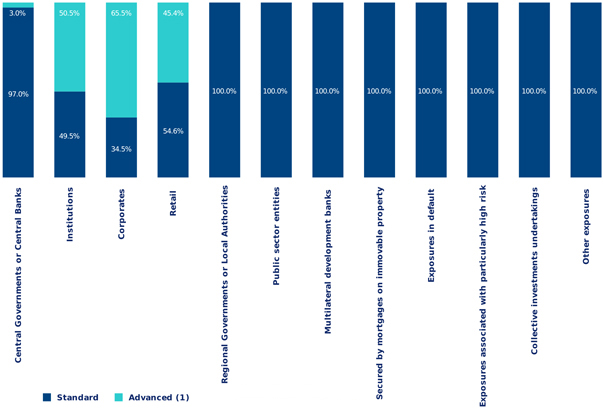
| (*) | Excluding securitisation positions and equity credit risk. |
| (1) | Table 28 of the report details the models and portfolios authorised by the supervisor for use in the calculation of capital requirements. |
Table of Contents
| BBVA. PILLAR 3 2021 | 3. ELIGIBLE OWN FUNDS AND MINIMUM REQUIREMENTS | P. 42 |
3.4. IFRS 9 and OCI Transitional Arrangements
The table below shows a comparison of institutions’ own funds and capital and leverage ratios with and without the application of the transitional treatment of IFRS9 impact, and with and without the application of the transitional treatment in accordance with Article 468 of the CRR, according to the standard format set by EBA guidelines (EBA/GL/2018/01).
Since 2018 BBVA Group has applied the transitional treatment of IFRS9 impact. Therefore, phased-in capital ratios and leverage ratio are calculated taking into account the transitional provisions as defined by article 473a of the CRR and its subsequent amendments made by Regulation 2020/873 of the Parliament and Council of
24 June 2020 in response to the COVID-19 pandemia.
The Group also applies paragraph 7a of the aforementioned article in calculating the impact of the transitional treatment on phased in risk-weighted assets.
In addition, as of the date of the report, the Group is not applying the transitional treatment of unrealised gains and losses measured at fair value through other comprehensive income (hereinafter, unrealised gains and losses measured at FVTOCI) outlined in Article 1, Paragraph 6 of the aforementioned regulation amending Article 468 of the CRR. Therefore, the Group’s own funds, and its capital adequacy and leverage ratios, reflect to date the full impact of the aforementioned unrealised gains and losses measured at FVTOCI.
In addition, the own funds and capital adequacy ratios without the application of the transitional treatment of IFRS 9 and unrealised gains and losses measured at FVTOCI do include the impact of applying other transitional regulatory adjustments, such as the transitory treatment of Tier 2 eligible capital instruments described in Part Ten, Chapter 4 of the CRR.
Table of Contents
| BBVA. PILLAR 3 2021 | 3. ELIGIBLE OWN FUNDS AND MINIMUM REQUIREMENTS | P. 43 |
Table 11. IFRS 9-FL - Comparison of institutions’ own funds and capital and leverage ratios with and without the application of transitional arrangements for IFRS 9 or analogous ECLs and with and without the application of the temporary treatment of gains and losses measured at Fair Value through OCI (Million Euros)
Available capital (Million Euros) | 12-31-2021 | 9-30-2021 | 6-30-2021 | 3-31-2021 | 12-31-2020 | |||||||||||||||
Common Equity Tier 1 Capital (CET1) | 39,949 | 44,558 | 43,903 | 43,234 | 42,931 | |||||||||||||||
Common Equity Tier 1 (CET1) if the transitional provisions of IFRS 9 or similar ECL had not been applied | 39,184 | 43,793 | 43,297 | 42,083 | 41,333 | |||||||||||||||
Common Equity Tier 1 (CET1) if the transitional treatment of unrealized gains and losses measured at fair value through OCI (other comprehensive income) had not been applied | ||||||||||||||||||||
Tier 1 capital (T1) | 45,686 | 50,329 | 49,599 | 48,955 | 49,597 | |||||||||||||||
Tier 1 capital (T1) if the transitional provisions of IFRS 9 or similar ECL had not been applied | 44,922 | 49,564 | 48,993 | 47,804 | 48,000 | |||||||||||||||
Tier 1 (T1) capital if the transitional treatment of unrealized gains and losses measured at fair value through OCI (other comprehensive income) had not been applied | ||||||||||||||||||||
Total capital | 53,069 | 58,098 | 57,287 | 57,249 | 58,145 | |||||||||||||||
|
|
|
|
|
|
|
|
|
| |||||||||||
Total capital if the transitional provisions of IFRS 9 or similar ECL had not been applied | 52,473 | 57,331 | 56,768 | 56,097 | 56,544 | |||||||||||||||
|
|
|
|
|
|
|
|
|
| |||||||||||
Total capital if the transitional treatment of unrealized gains and losses measured at fair value with changes in OCI had not been applied (other comprehensive income) | ||||||||||||||||||||
Risk-weighted assets (Million Euros) | ||||||||||||||||||||
|
|
|
|
|
|
|
|
|
| |||||||||||
Total risk-weighted assets | 307,795 | 303,002 | 305,599 | 354,342 | 353,273 | |||||||||||||||
|
|
|
|
|
|
|
|
|
| |||||||||||
Total risk-weighted assets had the transitional provisions of IFRS 9 or similar ECL not been applied | 307,335 | 302,542 | 305,543 | 354,433 | 352,679 | |||||||||||||||
|
|
|
|
|
|
|
|
|
| |||||||||||
Total risk-weighted assets if the transitional treatment of unrealised gains and losses measured at fair value through OCI had not been applied (other comprehensive income) | ||||||||||||||||||||
Capital ratios | ||||||||||||||||||||
Common Equity Tier 1 (CET1) (as a percentage of the risk exposure amount) | 12.98 | % | 14.71 | % | 14.37 | % | 12.20 | % | 12.15 | % | ||||||||||
Common Equity Tier 1 (CET1) (as a percentage of the risk exposure amount) if the transitional provisions of IFRS 9 or similar ECL had not been applied | 12.75 | % | 14.48 | % | 14.17 | % | 11.87 | % | 11.72 | % | ||||||||||
Common Equity Tier 1 (CET1) (as a percentage of the risk exposure amount) if the transitional treatment of unrealized gains and losses measured at fair value through OCI (other comprehensive income) had not been applied | ||||||||||||||||||||
Tier 1 capital (T1) (as a percentage of the amount of the exposure) | 14.84 | % | 16.61 | % | 16.23 | % | 13.82 | % | 14.04 | % | ||||||||||
Tier 1 capital (T1) (as a percentage of the exposure amount) if the transitional provisions of IFRS 9 or similar ECL had not been applied | 14.61 | % | 16.38 | % | 16.03 | % | 13.49 | % | 13.61 | % | ||||||||||
Tier 1 (T1) capital (as a percentage of the exposure amount) if the transitional treatment of unrealized gains and losses measured at fair value through OCI (other comprehensive income) had not been applied | ||||||||||||||||||||
Total capital (as a percentage of the amount of the exposure) | 17.24 | % | 19.17 | % | 18.75 | % | 16.16 | % | 16.46 | % | ||||||||||
Total capital (as a percentage of the amount of the exposure) if the transitional provisions of IFRS 9 or similar ECL had not been applied | 17.07 | % | 18.95 | % | 18.58 | % | 15.83 | % | 16.04 | % | ||||||||||
Total capital (as a percentage of the amount of the risk exposure) if the transitional treatment of unrealized gains and losses measured at fair value through OCI (other comprehensive income) had not been applied | ||||||||||||||||||||
Leverage ratio | ||||||||||||||||||||
Measurement of total exposure corresponding to the leverage ratio (Million Euros) | 671,789 | 663,861 | 665,751 | 741,373 | 741,095 | |||||||||||||||
Leverage ratio | 6.80 | % | 7.58 | % | 7.45 | % | 6.60 | % | 6.69 | % | ||||||||||
Leverage ratio if the transitional provisions of IFRS 9 or similar ECL had not been applied | 6.69 | % | 7.47 | % | 7.37 | % | 6.46 | % | 6.46 | % | ||||||||||
Leverage ratio if the transitional treatment of unrealized gains and losses measured at fair value through OCI (other comprehensive income) had not been applied | ||||||||||||||||||||
Table of Contents
| BBVA. PILLAR 3 2021 | 3. ELIGIBLE OWN FUNDS AND MINIMUM REQUIREMENTS | P. 44 |
3.5. Procedure used in the capital self-assessment process
The Group carries out the internal capital assessment process in accordance with the Capital Requirements Directive 2013/36/EU and guidelines on the supervisory review and evaluation process (SREP) published by the European Banking Authority. In accordance with Article 108 of the Capital Requirements Directive (2013/36/ EU), the Group complies with the obligations set out in Article 73 thereof on a consolidated basis. Furthermore, the document is structured on the basis of the ECB’s guidance on the internal capital adequacy assessment process (ICAAP) of November 2018.
Within the framework of the internal capital assessment process, the Group assesses and quantifies all risk that could significantly affect its capital position and draws a conclusion on the capital adequacy from a holistic medium-term perspective.
The Group applies a proportionate approach that aims to ensure the entity’s survival and continued compliance with all legal and internal requirements. In addition to regulatory and accounting perspectives, the Group bases its capital adequacy position analysis on a sound internal approach in which its capital position is assessed under an economic vision, which includes quantifying capital needs for risk covered in Pillar 1 of Basel and the needs due to risk not covered by Pillar 1.
The following are some of the points assessed in the internal capital assessment process:
| • | Business and strategy model, describing both the changes planned by the bank in the current business model and its underlying activities such as the relationship between the business strategy and internal capital assessment process. |
| • | Internal governance, risk management and the control framework, reviewing the processes and mechanisms that ensure that the bank has a sound and integrated framework for managing present and future material risk. |
| • | Risk appetite framework, describing the correspondence between this framework and the bank’s business strategy and model. |
| • | Identification and assessment of risk (including credit, operational, market, liquidity and other structural risk) and quantification of the capital necessary to cover them, with a quantitative reconciliation between the Pillar 1 and Pillar 2 approaches. |
| • | Planning capital under baseline and stress scenarios, projecting the capital base of the Group, the parent and its main subsidiaries over the next three years and analyzing capital sufficiency in accordance with the regulatory requirements and the internal objectives set out by the entity for the close of the period, also dealing with the planned capital actions. |
This internal capital assessment process concludes with submission to the supervisor of an annual report on the process. The report plays a key role in the review and evaluation methodology applied by the Single Supervisory Mechanism, and is an important element for determining capital requirements under Pillar 2.
Table of Contents
| BBVA. PILLAR 3 2021 | 4. RISKS | P. 45 |
4.1. | 47 | |||||
4.1.1. | 47 | |||||
4.1.2. | 52 | |||||
4.1.3. | 54 | |||||
4.1.4. | 54 | |||||
4.1.5. | 55 | |||||
4.2. | 55 | |||||
4.2.1. | Scope and nature of the Credit Risk measurement and reporting systems for capital framework purposes | 55 | ||||
4.2.2. | 56 | |||||
4.2.3. | 58 | |||||
4.2.4. | 79 | |||||
4.2.5. | 85 | |||||
4.2.6. | 119 | |||||
4.2.7. | 133 | |||||
4.2.8. | Hedging and risk reduction policies. Supervision strategies and processes | 145 | ||||
4.2.9. | 146 | |||||
4.3. | 150 | |||||
4.3.1. | Scope and nature of the market risk measurement and reporting systems | 150 | ||||
4.3.2. | Differences in the trading book under accounting and prudential regulation | 151 | ||||
4.3.3 | 151 | |||||
4.3.4. | 153 | |||||
4.4. | 167 | |||||
4.4.1. | 168 | |||||
4.4.2. | 173 | |||||
4.4.3. | 174 | |||||
4.5. | 176 | |||||
4.5.1. | 176 | |||||
4.5.2. | 177 | |||||
4.5.3. | 179 | |||||
4.5.4. | 181 | |||||
Table of Contents
| BBVA. PILLAR 3 2021 | 4. RISKS | P. 46 |
4.5.5. | 183 | |||||
4.5.6. | 185 | |||||
4.5.7. | 187 | |||||
4.6. | 190 | |||||
4.6.1. | 191 | |||||
4.6.2. | 191 | |||||
4.6.3. | 193 | |||||
4.6.4. | 194 | |||||
4.6.5. | 195 | |||||
Table of Contents
| BBVA. PILLAR 3 2021 | 4. RISKS | P. 47 |
4.1. General Risk Management and Control Model
The BBVA Group has a general risk management and control model (hereinafter, the ‘Model’) that is appropriate for its business model, its organisation, the countries where it operates and its corporate governance system. This model allows the Group to carry out its activity within the risk management and control strategy and policy defined by the corporate bodies of BBVA (where sustainability is specifically considered) and to adapt itself to a changing economic and regulatory environment, facing this management at a global level and aligned to the circumstances at all times.
The Model, for which the Group’s Chief Risk Officer (CRO) is responsible, must be updated or reviewed at least annually. The Model, which is fully applied in the Group, comprises the following basic elements:
| • | Governance and organisation |
| • | Risk Appetite Framework |
| • | Assessment, monitoring and reporting |
| • | Infrastructure |
The Group promotes the development of a risk culture that ensures a consistent application of the Model in the Group, and that guarantees that the risks function is understood and internalised at all levels of the organisation
4.1.1. Governance and organisation
The risk governance model in the BBVA Group is characterized by a special involvement of its corporate bodies, both in setting the risk strategy and in monitoring and supervising its implementation on an ongoing basis.
Thus, and as explained below, the corporate bodies are responsible for approving the risk strategy and the general policies for the different types of risks. Global Risk Management (hereinafter, GRM) and Regulation & Internal Control (including, among other areas, Non-Financial Risks) are the functions responsible for its implementation and development, with the appropriate reporting to corporate bodies.
Responsibility for day-to-day management of risks falls on business and corporate areas, the activities of which adhere to the general policies, regulation, infrastructures and controls that, based on the framework set by corporate bodies, are defined by GRM and Regulation & Internal Control in their corresponding areas of responsibility.
To carry out this work adequately, the financial risks function in the BBVA Group has been set up as a single, global function and independent from commercial areas.
The head of the risks function at an executive level, with respect to financial risks, is the Group’s Chief Risk Officer (CRO), who is appointed by the Board of Directors as a member of its senior management, and reports directly on the development of the corresponding functions to the corporate bodies. The Chief Risk Officer, for the best fulfilment of the functions, is supported by a structure consisting of cross-cutting risk units in the corporate area and specific risk units in the Group’s geographical and/or business areas.
In addition, and with regard to non-financial risks and internal control, the Group has a Regulation & Internal Control area independent from the rest of units and whose head (Head of Regulation & Internal Control) is also appointed by the Board of Directors of BBVA and reports directly to corporate bodies on the performance of its functions. This area is responsible for proposing and implementing non-financial risks policies and the Internal Control Model of the Group, and it is composed by, among other, the Non-Financial Risks, Regulatory Compliance and Risk Internal Control units.
The Risk Internal Control unit, within the Regulation & Internal Control area and, therefore, independent from the financial risks function (GRM), acts as a control unit for the activities carried out by GRM. In this regard, and without prejudice to the functions performed in this regard by the Internal Audit area, Risk Internal Control checks that the regulatory framework, processes and established measures are sufficient and appropriate for each type of financial risk. It also monitors its implementation and operation, and confirms that those decisions taken by GRM are taken independently from the business lines and, in particular, that there’s an adequate segregation of functions between units.
Governance and organizational structure are basic pillars for ensuring an effective risk management and control. This section summarizes the roles and responsibilities of the corporate bodies in the risks area, of the Group’s Chief Risk Officer and, in general, of the risks function, its interrelation and the group of committees, in addition to the Risk Internal Control unit.
Corporate Bodies of BBVA
According to the corporate governance system of BBVA, the Board of Directors of the Bank has certain reserved competencies, concerning management, through the implementation of the corresponding most relevant decisions, and concerning supervision and control, through the monitoring and supervision of implemented decisions and management of the Bank.
In addition, and to ensure an adequate performance of the management and supervisory functions of the Board of Directors, the corporate governance system comprises different committees supporting the Board of
Table of Contents
| BBVA. PILLAR 3 2021 | 4. RISKS | P. 48 |
Directors with regard to matters falling within their competence, and according to the specific charters of each committee. For this purpose, a coordinated work scheme between these corporate bodies has been established.
With regard to risks, the Board of Directors’ competencies are those relating to establishing the policy for controlling and managing risk and the oversight and control of its implementation.
In addition, and for an adequate performance of its duties, the Board of Directors is assisted by the Risk and Compliance Committee (hereinafter, CRC), on the issues detailed below, and by the Executive Committee (hereinafter, CDP), which is focused on the strategy, finance and business functions of the Group, for the purposes of which it monitors the risks of the Group.
The involvement of the corporate bodies of BBVA in the control and management of the risks of the Group is detailed below:
Board of Directors
The Board of Directors is responsible for establishing the risk strategy of the Group and, in this role, it determines the control and risk management policy, through the following documents:
| • | The Risk Appetite Framework of the Group, which includes in the one hand the risk appetite statement of the Group, that is, the general principles governing the risk strategy of the Group and its target profile; and, on the other hand, and based on the above mentioned risk appetite statement, a set of quantitative metrics (core metrics, and their corresponding statements, and by type of risk metrics), reflecting the risk profile of the Group; |
| • | the framework of management policies of the different types of risk to which the Bank is or could be exposed, which contain the basic lines for managing and controlling risks in a uniform way across the Group and consistently with the Model and Risk Appetite Framework; |
| • | and the Model. |
All of the above in coordination with the rest of prospective-strategic decisions of the Bank, which includes the Strategic Plan, the Annual Budget, the Capital Plan and the Liquidity & Funding Plan, in addition to the rest of management objectives, whose approval is a responsibility of the Board of Directors.
In addition to defining the risk strategy, the Board of Directors (in the performance of its risks monitoring, management and control tasks) also monitors the evolution of the risks of the Group and of each main geographical and/or business area, ensuring compliance with the Risk Appetite Framework of the Group; and also supervising the internal information and control systems.
For the development of all these functions, the Board of Directors is supported by the CRC and the CDP, which are responsible for the functions detailed below.
Risk and Compliance Committee
The CRC is, according to its own charter, composed of non-executive directors and its main purpose is to assist the Board of Directors on the establishment and monitoring of the risk control and management policy of the Group.
For this purpose, it assists the Board of Directors in a variety of risk control and monitoring areas, in addition to its analysis functions, based on the strategic pillars established at all times by both the Board of Directors and the CDP, the proposals on the strategy, control and risk management of the Group, which are particularly specified in the Risk Appetite Framework and in the “Model”. After the analysis, the Risk Appetite Framework and Model proposal is submitted to the Board of Directors for consideration and, where appropriate, approval purposes.
In addition, the CRC proposes, in a manner consistent with the Risk Appetite Framework of the Group approved by the Board of Directors, the control and management policies of the different risks of the Group, and supervises the information and internal control systems.
With regard to the monitoring of the evolution of the risks of the Group and their degree of compliance with the Risk Appetite Framework and defined general policies, and without prejudice to the monitoring task carried out by the Board of Directors and the CDP, the CRC carries out monitoring and control tasks with greater frequency and receives information with a sufficient granularity to achieve an adequate performance of its duties.
The CRC also analyzes all measures planned to mitigate the impact of all identified risks, should they materialize, which must be implemented by the CDP or the Board of Directors, as the case may be. The CRC also monitors the procedures, tools and measurement indicators of those risks established at a Group level in order to have a comprehensive view of the risks of BBVA and its Group, and monitors compliance with the regulation and supervisory requirements in terms of risks.
The CRC is also responsible for analyzing those project-related risks that are considered strategic for the Group or corporate transactions that are going to be submitted to the Board of Directors of the CDP, within its scope of competence.
In addition, it contributes to the setting of the remuneration policy, checking that it is compatible with an appropriate and effective management of risks and that it does not provide incentives to take risks breaching the level tolerated by the Bank.
Table of Contents
| BBVA. PILLAR 3 2021 | 4. RISKS | P. 49 |
Lastly, the CRC ensures the promotion of the risk culture in the Group.
In 2021, the CRC has held 22 meetings.
Executive Committee
In order to have a complete and comprehensive view of the progress of the businesses of the Group and its business units, the CDP monitors the evolution of the risk profile and the core metrics defined by the Board of Directors, being aware of any potential deviation or breach of the metrics of the Risk Appetite Framework and implementing, when applicable, the appropriate measures, as explained in the Model.
In addition, the CDP is responsible for proposing the basis for developing the Risk Appetite Framework, which will be established in coordination with the rest of prospective/strategic decisions of the Bank and the rest of management objectives.
Lastly, the CDP is the committee supporting the Board of Directors in decisions related to business risk and reputational risk, according to the dispositions set out in its own charter.
Chief Risk Officer of the Group
The Group’s Chief Risk Officer (CRO) is responsible for the management of all the financial risks of the Group with the necessary independence, authority, rank, experience, knowledge and resources. The CRO is appointed by the Board of Directors of BBVA and has direct access to its corporate bodies (Board of Directors, CDP and CRC), with the corresponding regular reporting on the risk situation in the Group.
The GRM area has a responsibility as the unit transversal to all the businesses of the BBVA Group. This responsibility is part of the structure of the BBVA Group, which is formed by subsidiaries based in different jurisdictions, which have autonomy and must comply with their local regulations, but always according to the risk management and control scheme designed by BBVA as the parent company of the BBVA Group.
The Chief Risk Officer of the BBVA Group is responsible for ensuring that the risks of BBVA Group, within the scope of its functions, are managed according to the established model, assuming, among other, the following responsibilities:
| • | Prepare, in coordination with the rest of areas responsible for risks monitoring and control, and propose to corporate bodies the risk strategy of the BBVA Group, which includes the Risk Appetite statement of the BBVA Group, core (and their respective statements) and by type of risk metrics, and the Model. |
| • | Ensure the necessary coordination to define and prepare the proposals for the Appetite |
Framework of the Group companies, and make sure they are applied correctly.
| • | Define, in coordination with the rest of areas responsible for risks monitoring and control, and propose to corporate bodies the general policies for each type of risk within its scope of responsibility and, as part these, to establish the required specific regulation. |
| • | Prepare, in coordination with the rest of areas responsible for risks monitoring and control, and propose for approval, or approving if within its competence, the risk limits for the geographical areas, business areas and/or legal entities, which shall be consistent with the defined Risk Appetite Framework; it is also responsible for the monitoring, supervision and control of risk limits within its scope of responsibility. |
| • | Submit to the Risk and Compliance Committee the information required to carry out its supervisory and control functions. |
| • | Regular reporting to the corresponding corporate bodies on the situation of those risks of the BBVA Group within its scope of responsibility. |
| • | Identify and assess the material risks faced by the BBVA Group within its scope of responsibility, with an effective management of those risks and, where necessary, with the implementation of the required mitigation measures. |
| • | Early warning to the relevant corporate bodies and the Chief Executive Officer of any material risk within its scope of responsibility that could compromise the solvency of the BBVA Group. |
| • | Ensure, within its scope of responsibility, the integrity of measurement techniques and management information systems and, in general, the provision of models, tools, systems, structures and resources to implement the risk strategy defined by the corporate bodies. |
| • | Promote the risk culture of the BBVA Group to ensure the consistency of the Model in the different countries where it operates, strengthening the cross-cutting model of the risks function. |
For decision-making, the Group’s Chief Risk Officer has a governance structure for the role that culminates in a support forum, the Global Risk Management Committee (GRMC), which is established as the main executive-level committee on the risks within its remit. Its purpose is to develop the strategies, policies, regulations and infrastructures needed to identify, assess, measure and manage the material risks within its remit that the Group faces in its business activity. This committee is composed by the Chief Risk Officer, who chairs the meetings, and the heads of the Corporate Area of the disciplines of GRM, the “Risk Management Group”,
Table of Contents
| BBVA. PILLAR 3 2021 | 4. RISKS | P. 50 |
“Strategy and Development”, “South America and Turkey”, and “Risk Internal Control”; and by the heads of GRM in the three most important geographical units and in CIB. The purpose of the GRMC is to propose and challenge, among other issues, the internal regulatory framework of GRM and the infrastructures required to identify, assess, measure and manage the risks faced by the Group in carrying out its businesses and to approve risk limits.
The GRMC carries out its functions assisted by various support committees which include:
| • | Global Credit Risk Management Committee: It is responsible for analyzing and decision-making related to wholesale credit risk admission. |
| • | Wholesale Credit Risk Management Committee: It is responsible for analyzing and making decisions related to wholesale credit risk admission in specific customer segments of BBVA Group, as well as being informed of the relevant decisions adopted by members of the committee within their scope of decision-making at corporate level. |
| • | Work Out Committee: Its purpose is to be informed about decisions taken under the delegation framework regarding risk proposals concerning clients on Watch List and clients classified as NPL or written-off of certain customer segments of BBVA Group; and the sanction of proposals regarding entries, exits and changes of Watch List, entries and exits in non-performing, unlikely to pay and turns to written off; as well as the approval of other proposals that must be seen in this Committee according to the established thresholds and criteria. |
| • | Asset Allocation Committee: The executive authority responsible for managing the limits by asset class for credit risk, equities and real estate not for own use and by business area and at group level established in the Asset Allocation limits planning exercise, which aims to achieve an optimal combination and composition of portfolios under the restrictions imposed by the Risk Appetite Framework (RAF), which allows maximizing the risk- adjusted return on regulatory and economic capital when appropriate. Additionally, it takes into account the concentration and asset quality objectives of the portfolio, as well as the prospects and strategic needs of the Bank. |
| • | Risk Models Management Committee: It ensures an appropriate decision-making process regarding the planning, development, implementation, use, validation and monitoring of the models required to achieve an appropriate management of the Model Risk in the BBVA Group. |
| • | Global Market Risk Unit Global Committee (CGGMRU): its purpose is to formalize, |
supervise and communicate the trading risk monitoring in all Global Markets business units, as well as coordinating and approving the key decisions to GMRU activity, and preparing and proposing the corporate regulation of the unit to the GRMC.
| • | Retail Credit Risk Committee: it ensures for the analysis, discussion and decision support on all issues regarding the retail credit risk management that impact or potentially do in the practices, processes and corporate metrics established in the General Policies, Rules and Operating Frameworks. |
| • | Asset Management Global Risk Committee: the purpose of the committee is to develop and coordinate the strategies, policies, procedures and infrastructure necessary to identify, evaluate, measure and manage the material risks faced by the institution in the performance of its businesses linked to BBVA Asset Management. |
| • | Global Insurance Risk Committee: its purpose is to serve as the basis for the development of the risk management model and the monitoring of the insurance companies of the BBVA Group by developing and coordinating the strategies, policies, procedures and infrastructure necessary to identify, evaluate, measure, monitor and manage the material risks faced by insurance companies. |
| • | Products, Operations and Risks Committee (COPOR): Its purpose is the analysis and decision-making in relation to the operations in the various geographical areas in which Global Markets is present. |
Also:
| • | GRM Continuity Committee: this committee operates under the provisions of the Corporate Continuity Committee for the different Areas. Its purpose is to analyze and make decisions about exceptional crisis situations, with the aim of managing continuity and the restoration of critical GRM processes, minimizing the impact of its operations through the Continuity Plan, which covers crisis management and Recovery Plans. |
| • | The Corporate Committee for Admission of Operational Risk and Product Governance (CCAROyGP) aims to ensure the adequate evaluation of initiatives with significant operational risk (new business, product, outsourcing, process transformation, new systems, etc.) from the perspective of operational risk and approval of the proposed control environment |
Risk units of the corporate areas and the business/geographical areas
Table of Contents
| BBVA. PILLAR 3 2021 | 4. RISKS | P. 51 |
The risks function is comprised of risk units from the corporate area, which carry out cross-cutting functions, and of risk units of the geographical/business areas.
| • | The risk units of the corporate area develop and submit to the Group’s Chief Risk Officer the different elements required to define the proposal for the Group’s Risk Appetite Framework, the general policies, regulation and global infrastructures within the operating framework approved by corporate bodies; they ensure their application and report directly or through the Group’s Chief Risk Officer to the corporate bodies of BBVA. With regard to non-financial risks and reputational risk, which are entrusted to the Regulation & Internal Control and Communications & Responsible Business areas respectively, the corporate units of GRM will coordinate, with the corresponding corporate units of those areas, the development of the elements that should be integrated into the Appetite Framework of the Group. |
| • | The risk units of the business and/or geographical areas develop and submit to the Chief Risk Officer of the geographical and/or business areas the Risk Appetite Framework proposal applicable in each geographical and/or business area, independently and always according to the Group’s Risk Appetite Framework. In addition, they ensure the application of general policies and corporate rules with the necessary adaptations, when applicable, to local requirements, providing the appropriate infrastructures for risk management and control purposes, within the global risk infrastructure framework defined by the corporate areas, and reporting to the corresponding corporate bodies and senior management, as applicable. With regard to Non-financial risks, which are integrated in the Regulation & Internal Control area, the local risk units will coordinate, with the unit responsible for those risks, the development of the elements that should be integrated into the local Risk Appetite Framework. |
Thus, the local risk units work with the risk units of the corporate area with the aim of adapting themselves to the risk strategy at Group level and pooling all the information required to monitor the evolution of their risks.
As previously mentioned, the risks function has a decision-making process supported by a structure of committees, and also a top-level committee, the GRMC, whose composition and functions are described in the section “Chief Risk Officer of the Group.”
Each geographical and/or business area has its own risk management committee(s), with objectives and contents similar to those of the corporate area. These committees perform their duties consistently and in line with general
risk policies and corporate rules, and its decisions are reflected in the corresponding minutes.
Under this organizational scheme, the risks function ensures the integration and application throughout the Group of the risk strategy, the regulatory framework, the infrastructures and standardized risk controls. It also benefits from the knowledge and proximity to customers in each geographical and/or business area, and conveys the corporate risk culture to the Group’s different levels. Moreover, this organization enables the risks function to conduct and report to the corporate bodies an integrated monitoring and control of the risks of the entire Group.
The risks function is cross-cutting, i.e. it is present in all of the Group’s geographical and/or business areas through specific risk units. Each of these units is headed by a Chief Risk Officer for the geographical and/or business area who, within the relevant scope of responsibility, carries out risk management and control functions and is responsible for applying the Model, the general policies and corporate rules approved at Group level in a consistent manner, adapting them if necessary to local requirements and with the subsequent reporting to local corporate bodies.
The Chief Risk Officers of the geographical and/or business areas have functional reporting to the Group’s Chief Risk Officer and hierarchical reporting to the head of their geographical and/or business area. This dual reporting system aims to ensure the independence of the local risks function from the operational functions and enable its alignment with the Group’s general policies and goals related to risks.
Risk internal control
The Group has a specific Risk Internal Control unit, within the Regulation & Internal Control area, that, among other tasks, independently challenges and control the regulation and governance structure in terms of financial risks and its implementation and deployment in GRM, in addition to the challenge of the development and implementation of financial risks control and management processes. It is also responsible for the validation of risk models.
For this purpose, it has 3 subunits: RIC-Processes, Risks Technical Secretariat and Risk Internal Validation.
| • | RIC-Processes. It is responsible for challenging an appropriate development of the functions of GRM units, and for reviewing that the functioning of financial risk management and control processes is appropriate and in line with the corresponding regulation, identifying potential opportunities for improvement and contributing to the design of the action plans to be implemented by the responsible units. In addition, it is the Risk Control Specialist (RCS) in the Group’s Internal Control Model and, therefore, establishes the frameworks for |
Table of Contents
| BBVA. PILLAR 3 2021 | 4. RISKS | P. 52 |
mitigating and controlling the risks for which it is responsible.
| • | Risks Technical Secretariat. It is responsible for the definition, design and management of the principles, policies, criteria and processes through which the regulatory risk framework is developed, processed, reported and disclosed to the countries; and for the coordination, monitoring and assessment of its consistency and completeness. In addition, it coordinates the definition and structure of the most relevant GRM Committees, and monitors their proper functioning, in order to ensure that all risk decisions are taken through an adequate governance and structure, ensuring their traceability. It also provides to the CRC the technical support required in terms of financial risks for a better performance of its functions. |
| • | Risk Internal Validation. It is responsible for validating the risks models. In this regard, it effectively challenges the relevant models used to manage and control the risks faced by the Group, as an independent third party from those developing or using the models in order to ensure its accuracy, robustness and stability. This review process is not restricted to the approval process, or to the introduction of changes in the models; it is a plan to make a regular assessment of those models, with the subsequent issue of recommendations and actions to mitigate identified weaknesses. |
The Head of Risk Internal Control of the Group is responsible for the function and reports about his activities and work plans to the Head of Regulation & Internal Control and to the CRC, with the corresponding support in the issues required, and, in particular, challenging that GRM’s reports submitted to the Committee are aligned with the criteria established at the time.
In addition, the risk internal control function is global and transversal, it includes all types of financial risks and has specific units in all geographical and/or business areas, with functional reporting to the Head of Risk Internal Control of the Group.
The Risk Internal Control function must ensure compliance with the general risks strategy defined by the Board of Directors, with adequate proportionality and continuity. In order to comply with the control activity within its scope. Risk Internal Control is member of GRM’s top-level committees (sometimes even assuming the Secretariat role), independently verifying the decisions that may be taken and, specifically, the decisions related to the definition and application of internal risk regulation.
Furthermore, the control activity is developed within a homogeneous methodological framework at a Group level, covering the entire life cycle of financial risk
management and carried out under a critical and analytical approach.
The Risk Internal Control team reports the results of its control function to the corresponding heads and teams, promoting the implementation of corrective measures and submitting these assessments and the resolution commitments in a transparent manner to the established levels.
Lastly, and notwithstanding the control responsibility that GRM teams have in the first instance, Risk Internal Control teams promote a control culture in GRM, conveying the importance of having robust processes.
4.1.2. Risk Appetite Framework
The Group’s Risk Appetite Framework approved by the corporate bodies determines the risks and the risk level that the Group is willing to assume to achieve its business objectives considering the organic evolution of business. These are expressed in terms of solvency, liquidity and funding, and profitability, as well as recurrence of revenue, which are reviewed not only periodically but also if there are any substantial changes in the business strategy or relevant corporate transactions.
The Risk Appetite Framework is expressed through the following elements:
| • | Risk appetite statement: sets out the general principles of the Group’s risk strategy and the target risk profile: |
“The BBVA Group develops a multichannel and responsible universal banking business model, based on values, committed to sustainable development and centred on our customers’ needs, focusing on operational excellence and the preservation of adequate security and business continuity.
BBVA intends to achieve these goals while maintaining a moderate risk profile, so the risk model established aims at ensuring a robust financial position, facilitating its commitment with sustainability and obtaining a sound risk-adjusted profitability throughout the cycle, as the best way to face adverse environments without jeopardizing its strategies.
BBVA Group’s risk management is based on prudent management, and a comprehensive and prospective vision of all risks, to allow us to adapt to the disruptive risks inherent in the banking business. It includes the climate factor, a diversification of portfolios by geographies, asset classes and customer segments, prevention of money laundering and terrorist financing, and the maintenance of a long-term
Table of Contents
| BBVA. PILLAR 3 2021 | 4. RISKS | P. 53 |
relationship with customers, supporting them in the transition to a sustainable future, to promote profitable growth and recurring generation of value.”
| • | Statements and core metrics: Statements are established, based on the risk appetite statement, specifying the general principles of risk management in terms of solvency, liquidity and funding, profitability and income recurrence. Moreover, the core metrics reflect, in quantitative terms, the principles and the target risk profile set out in the Risk Appetite statement. Each core metric has three thresholds ranging from usual management of the businesses to higher levels of impairment: |
| • | Management benchmark: a benchmark that determines a comfortable management level for the Group. |
| • | Maximum appetite: the maximum level of risk that the Group is willing to accept in its ordinary activity. |
| • | Maximum capacity: the maximum risk level that the Group could assume, which for some metrics is associated with regulatory requirements. |
| • | Metrics by type of risk: based on the core metrics and their thresholds, a number of metrics are determined for each type of risk, whose observance enables compliance with the core metrics and the Group’s Risk Appetite statement. These metrics have a maximum risk appetite threshold. |
In addition to this Framework, statements are established that include the general principles for each risk type, as well as a level of management limits that is defined and managed by the areas responsible for the management of each type of risk in the development of the structure of metrics by type of risk, in order to ensure that the early management of risks complies with that structure and, in general, with the established Risk Appetite Framework.
Each significant geographical area (that is, those representing more than 1% of the assets or operating income of the BBVA Group) has its own Risk Appetite framework, consisting of its local Risk Appetite statement, core statements and metrics, and metrics by type of risk, which must be consistent with those set at the Group level, but adapted to their own reality. These are approved by the corresponding corporate bodies of each entity. This Appetite Framework is supplemented by statements for each risk type and has a limit structure in line and consistent with the above.
The corporate risks area works with the various geographical and/or business areas to define their Risk Appetite Framework, so that it is coordinated with, and integrated into, the Group’s Risk Appetite Framework, making sure that its profile is in line with the one defined.
Moreover, and for the purposes of monitoring at local level, the Chief Risks Officer of the geographical and/or business area regularly reports on the evolution of the metrics of the Local Risk Appetite Framework to the corporate bodies, as well as to the relevant top-level local committees, following a scheme similar to that of the Group, in accordance with its own corporate governance systems.
Within the issuing process of the Risk Appetite Framework, Risk Internal Control carries out, within the scope of the GRM area the effective challenge of the Framework proposal prior to its escalation to corporate bodies, which is also documented, and it is extended to the approval of the management limits under which it is developed, also supervising its adequate approval and extension to the different entities of the Group. Likewise, in each significant geographical area, the local Risk Internal Control unit, working in the Risk Management Committee (hereinafter, RMC), carries out an effective challenge of the local Risk Appetite Framework prior to its escalation to local corporate bodies, which is also documented, and extended to the local approval process of the management limits.
Monitoring of the Risk Appetite Framework and management of breaches
So that corporate bodies can develop the risk functions of the Group, the heads of risks at an executive level will regularly report (more frequently in the case of the CRC, within its scope of responsibility) on the evolution of the metrics of the Risk Appetite Framework of the Group, with the sufficient granularity and detail, in order to check the degree of compliance of the risks strategy set out in the Risk Appetite Framework of the Group approved by the Board of Directors.
If, through the monitoring of the metrics and supervision of the Risk Appetite Framework by the executive areas, a relevant deviation or breach of the maximum appetite levels of the metrics is identified, that situation must be reported and, where applicable, the corresponding corrective measures must be submitted to the CRC.
After the relevant review by the CRC, the deviation must be reported to the CDP (as part of its role in the monitoring of the evolution of the risk profile of the Group) and to the Board of Directors, which will be responsible, when applicable, for implementing the corresponding executive measures, including the modification of any metric of the Risk Appetite Framework. For this purpose, the CRC will submit to the corresponding corporate bodies all the information received and the proposals prepared by the executive areas, together with its own analysis.
Notwithstanding the foregoing, once the information has been analyzed and the proposal of corrective measures has been reviewed by the CRC, the CDP may adopt, on grounds of urgency and under the terms established by law, measures corresponding the Board of Directors, but
Table of Contents
| BBVA. PILLAR 3 2021 | 4. RISKS | P. 54 |
always reporting those measures to the Board of Directors in the first meeting held after the implementation for ratification purposes.
In any case, an appropriate monitoring process will be established (with a greater information frequency and granularity, if required) regarding the evolution of the breached or deviated metric, and the implementation of the corrective measures, until it has been completely redressed, with the corresponding reporting to corporate bodies, in accordance with its risks monitoring, supervision and control functions.
Integration of the Risk Appetite Framework into the management
The transfer of the Risk Appetite Framework to ordinary management is underpinned by three basic elements:
| 1. | The existence of a standardized set of regulations: the corporate risks area defines and proposes the general policies within its scope of action, and develops the additional internal regulation required for the development of those policies and the operating frameworks on the basis of which risk decisions must be adopted within the Group. The approval of the general policies for all types of risks is a responsibility of the corporate bodies of BBVA, while the rest of regulation is defined at an executive level according to the framework of competences applicable at any given time. The Risks units of the geographical and/or business areas comply with this regulation and performing, where necessary, the relevant adaptation to local requirements, in order to have a decision-making process that is appropriate at local level and aligned with the Group’s policies. |
| 2. | Risk planning, which ensures the integration into the management of the Risk Appetite Framework through a cascade process established to set limits adjusted to the target risk profile. The Risks units of the corporate area and of the geographical and/or business areas are responsible for ensuring the alignment of this process with the Group’s Risk Appetite Framework in terms of solvency, liquidity and funding, profitability, and recurrence of earnings. |
| 3. | A comprehensive management of risks during their life cycle, based on differentiated treatment according to their type. |
4.1.3. Assessment, monitoring and reporting
Assessment, monitoring and reporting is a cross-cutting function at Group level. This function ensures that the model has a dynamic and proactive vision to enable
compliance with the Risk Appetite Framework approved by the Board of Directors, even in adverse scenarios.
This process is integrated in the activity of the Risk units, both of the corporate area and in the geographical and/ or business units, together with the units specialized in non-financial risks and reputational risk within the Regulation & Internal Control and Communications & Responsible Business areas respectively, in order to generate a comprehensive and single view of the risk profile of the Group.
This process is developed through the following phases:
| 1. | Monitoring of the identified risk factors that can compromise the performance of the Group or of the geographical and/or business areas in relation to the defined risk thresholds. |
| 2. | Assessment of the impact of the materialization of the risk factors on the metrics that define the Risk Appetite Framework based on different scenarios, including stress testing scenarios (EU-wide stress testing). |
| 3. | Response to unwanted situations and proposals for redressing measures to the corresponding levels, in order to enable a dynamic management of the situation, even before it takes place. |
| 4. | Monitoring the Group’s risk profile and the identified risk factors, through internal, competitor and market indicators, among others, to anticipate their future development. |
| 5. | Reporting: complete and reliable information on the evolution of risks to corporate bodies and senior management, in accordance with the principles of accuracy, exhaustiveness, clarity and utility, frequency, and adequate distribution and confidentiality. The principle of transparency governs all the risk information reporting process. |
For the implementation of the Model, the Group has the resources required for an effective management and supervision of risks and for achieving its goals. In this regard, the Group’s risks function:
| 1. | Has the appropriate human resources in terms of number, ability, knowledge and experience. The profile of resources will evolve over time based on the specific needs of the GRM and Regulation & Internal Control areas, always with a high analytical and quantitative capacity as the main feature in the profile of those resources. Likewise, the corresponding units of the geographical and/or business areas have sufficient means from the resources, structures and tools perspective in order to achieve a risk management process aligned with the corporate model. |
Table of Contents
| BBVA. PILLAR 3 2021 | 4. RISKS | P. 55 |
| 2. | Develops the appropriate methodologies and models for the measurement and management of the different risk profiles, and the assessment of the capital required to take those risks. |
| 3. | Has the technological systems required to: support the Risk Appetite Framework in its broadest definition; calculate and measure the variables and specific data of the risk function; support risk management according to this Model; and provide an environment for storing and using the data required for risk management purposes and reporting to supervisory bodies. |
| 4. | Promotes adequate data governance, in accordance with the principles of governance, infrastructure, precision and integrity, completeness, promptness and adaptability, following the quality standards of the internal regulations referring to this matter. |
Within the risk functions, both the profiles and the infrastructure and data shall have a global and consistent approach.
The human resources among the countries must be equivalent, ensuring a consistent operation of the risk function within the Group. However, they will be distinguished from those of the corporate area, as the latter will be more focused on the conceptualization of appetite frameworks, operating frameworks, the definition of the regulatory framework and the development of models, among other tasks.
As in the case of the human resources, technological platforms must be global, thus enabling the implementation of the Risk Appetite Framework and the standardized management of the risk life cycle in all countries.
The corporate area is responsible for deciding on the platforms and for defining the knowledge and roles of the
human resources. It is also responsible for defining risk data governance.
The foregoing is reported to the corporate bodies of BBVA so they can ensure that the Group has the appropriate means, systems, structures and resources.
4.1.5. Transactions with related parties
Regarding operations with related parties and intragroup transactions, BBVA Group has internal policies and procedures to approve, supervise and control such operations.
In this regard, BBVA and other Group subsidiaries, in their capacity as financial entities, carry out transactions with their related parties in the normal course of their business, all of which are not significant and are carried out under normal market conditions.
Additionally, BBVA Group has a resolution strategy defined by the SRB as Multiple Point of Entry (MPE), which is based, according to the Financial Self-Sufficiency Principle and the Decentralized Management Principle, on a decentralized business model in which the subsidiaries are substantially self-sufficient in terms of legal structure, governance, capital, funding relationships and operations, subject, however, to the corporate policies established for the BBVA Group and to the general supervision and control of the corporate areas. Under this model, and subject to these principles, funding operations for subsidiaries are limited and at market prices.
Details of transactions with related parties and transactions with joint ventures and associates can be found in note 53 of the BBVA Group Consolidated Annual Accounts.
4.2. Credit and Counterparty Risk
4.2.1. Scope and nature of the Credit Risk measurement and reporting systems for capital framework purposes
Credit risk arises from the probability that one of the parties to the financial instrument contract will default on its contractual obligations due to insolvency or inability to pay and cause the other party to incur a financial loss.
It is the most relevant risk for the Group and includes the management of counterparty, issuer, counterparty and country risks.
The Group has a risk strategy established by the Board of Directors of the parent company, which establishes the Group’s Risk Appetite statement, core metrics and the metrics by type of risk in which it materializes, as well as the General Risk Management and Control Model.
The Risk and Compliance Committee assists the Board of Directors in different areas relating to risk control and monitoring, complementing these functions by submitting to the Board proposals on the Group’s risk strategy, control and management. It also establishes, in line with the Group’s Risk Appetite Framework approved by the Board of Directors, the control and management policies for the different risks of the Group.
Table of Contents
| BBVA. PILLAR 3 2021 | 4. RISKS | P. 56 |
The Risk and Compliance Committee, the Executive Committee and the Board itself adequately monitor the implementation of the Group’s risk strategy and profile.
Based on the risk strategy determined by the Board of Directors, the Global Risk Management Committee approves the statements by risk type and the management limits structure that articulates the Risk Appetite Framework at the level of geographies, risk types, asset classes and portfolios, including the proposed Asset Allocation management limits with the appropriate level of disaggregation. The limits establish, on an annual basis, maximum exposure levels by type of portfolio.
Asset Allocation limits for portfolios, businesses and risks are defined, considering the established metrics, in terms of exposure, capital consumption and composition of the portfolio mix and aimed at maximizing the generation of the Group’s recurring economic profit, subject to the restrictions framework resulting from the target risk profile definition.
The Corporate Risk Area establishes individual, portfolio, sector and geographic risk concentration thresholds. These thresholds are established in terms of EAD and Herfindahl indexes in order to limit the impact on capital consumption.
The Business Areas work in line with the global view and the defined metrics, optimizing in terms of profitability/ risk, within the Group’s limits and policies, each of the portfolios for which they are responsible.
Existing gaps with regard to the target portfolio are identified at global level and submitted to the Business Areas, establishing global and local plans to align the risk with the predefined target profile and taking into account the expected future evolution of the portfolios.
For risk and capital management purposes, credit risk at BBVA is quantified using two main measures: expected loss (“EL”) and economic capital (“EC”). The expected loss reflects the average value of losses and is considered as business cost. However, economic capital is the amount of capital considered necessary to cover unexpected losses arising from the possibility that actual losses may exceed expected losses.
These risk measures are combined with profitability information within the value-based management framework, thus integrating the profitability-risk binomial in decision-making, from the business strategy definition to the approval of individual loans, pricing, the assessment of non-performing portfolios, incentives to the Group’s areas, etc.
There are three essential parameters for obtaining the aforementioned measures (PE and CE): probability of default (“PD”), loss given default (“LGD”) and exposure at default (“EAD”), based mainly on the estimation of
credit conversion factors (“CCF”), which are generally estimated using the historical information available in the systems, and which are assigned to transactions and customers depending on their characteristics.
In this context, credit rating tools (ratings and scorings) assess the risk of each client/transaction based on its credit quality through a score, which is used in the allocation of risk metrics along with other additional information: age of facilities, loan-to-value ratio, client segment, etc.
Section 4.2.5.1. of this document details the definitions, methods and data used by the Group in determining the equity requirements for the estimation of the probability of default (PD), loss given default (LGD) and exposure at default (EAD) parameters.
4.2.2. Definitions and methodologies
4.2.2.1. Prudential definition of default
The definition of default in the prudential field is included in Article 178 of Regulation (EU) No. 575/2013. This definition is applicable both under the standardized approach and under the internal ratings-based (IRB) approach.
In 2021, the EBA Guidelines (EBA/GL/2016/07) and the Regulations on materiality thresholds (Delegated Regulation of the European Commission 2018/171 and Regulation 2018/1845 of the European Central Bank) that develop the content of the aforementioned article 178, have entered into force. The modifications introduced cover aspects such as the calculation of past due days, clarifications on the indicators of probable non-payment (“Unlikely to Pay”), the criteria for the classification to non-defaulted status, definition of retail exposures and aspects related to documentation and external governance. During 2021, BBVA has completed the implementation of the prudential definition of default, both for portfolios under the standardised approach, as well as portfolios under the IRB approach, once the relevant supervisory authorization has been received.
Currently, the BBVA Group considers that a default has occurred in relation to a certain obligor when at least one of the following circumstances occurs:
a) that the obligor has a delay for more than 90 consecutive days with respect to any significant credit obligation to the entity.
b) that the entity considers that there are reasonable doubts about the payment of all of its credit obligations to the entity itself, the parent company or any of its subsidiaries,
Table of Contents
| BBVA. PILLAR 3 2021 | 4. RISKS | P. 57 |
without resorting to actions such as the execution of guarantees.
In relation to the computation of past due days, a obligor is considered in default when the sum of the past due amounts in all its credit obligations with the entity exceed the materiality thresholds (both absolute and relative) for more than 90 consecutive days. The absolute threshold is set at €100 for retail exposures and €500 for wholesale exposures and the relative threshold at 1% of all on-balance sheet exposures to the obligor.
Regarding the existence of reasonable doubts about payment, the following elements are considered as indicators of probability of default:
A) Specific credit risk adjustments: a specific adjustment as a result of a sharp deterioration in the credit quality of the obligor is an indicator of probable default.
B) Sale of credit obligations with significant economic loss: a sale of a credit obligation against an obligor with a material economic loss related to a deterioration in credit quality should be considered an indicator of default. When the economic loss exceeds the 5% threshold, the credit obligations will be considered to be in default.
C) Distressed restructuring: it is considered that there is an indicator of probable default, and therefore the client must be considered in default, when the restructuring or refinancing measures may result in a reduction of the financial obligation that is considered to be caused by a material forgiveness or deferral of principal, interest or fees.
Specifically, unless proven otherwise, transactions that meet any of the following criteria will be reclassified to the default risk category:
a) They are supported by an inadequate payment plan.
b) They Include contractual clauses that delay the reimbursement of the operation through regular payments.
c) Present amounts derecognized from the balance sheet.
In any case, a restructuring will be considered impaired when the reduction in the net present value of the financial obligation is greater than 1%.
D) Bankruptcy/Arrangement/Liquidation/Failure/Prearrangement of the client: These situations will be valued as indicators of non-payment as long as this prevents or delays the payments of credit obligations to the institution.
E) Fraud: If credit fraud is identified before the default is recognized.
The definition of default is applied at the debtor level for wholesale counterparties. Therefore, the classification of any material exposure of a client as defaulted, either because it is more than 90 past due days or due to any of the subjective criteria, implies the consideration of all the client’s exposures as default.
Regarding retail customers, the definition of default is applied at the contract level following risk management practices. Notwithstanding the foregoing, when an operation of a retail client presents defaults of more than 90 days and this represents more than 20% of the client’s total balance, all its operations are considered in default.
Additionally, it should be noted that when operations of related entities with the holder are considered in default, including both entities of the same group and those with which there is a relationship of economic or financial dependence, the operations of the holder are also classified as default if after its analysis it is concluded that there are reasonable doubts about its total reimbursement.
The classification of an operation as in default is carried out in such a way that each contract can only be either in default or non default in its entirety.
With regard to transactions/customers classified as in default, it should be noted that they will cease to be classified as such when no default trigger is still applicable, either because the client/transaction does not have material past due balances, that is, above both materiality thresholds, for more than 90 consecutive days, either when the recovery process is considered complete in accordance with the entity’s recovery management or because no criterion of probable non-payment continues to apply. However, in any case, at least three months must elapse from the moment in which the situation that triggered the non-payment ceased to be fulfilled in order to stop classifying an operation in a defaulted situation as such. During this period, the obligor must show good payment behaviour and an improvement in its credit quality. In restructuring processes, the minimum period will be one year.
4.2.2.2. Accounting definitions and methodologies
The calculation of credit risk adjustments applicable to the BBVA Group’s Consolidated Financial Statements follows the provisions of IFRS 9 - Financial Instruments. This standard establishes an expected loss model to calculate aforementioned provision for credit risk.
Credit risk provision is calculated for financial assets valued at amortized cost, debt instruments valued at fair value with changes in accumulated other comprehensive income, financial guarantee contracts and other commitments. All financial instruments measured at fair
Table of Contents
| BBVA. PILLAR 3 2021 | 4. RISKS | P. 58 |
value through profit or loss are excluded from the impairment model.
Given the nature of the calculation of provisions under IFRS 9, all adjustments are considered specific credit risk adjustments for the purposes of Regulation (EU) No. 575/2013 of the European Parliament and of the Council.
Definition of impaired financial asset
According to IFRS 9, a financial asset is impaired when one or more events have occurred that give rise to a negative impact on its estimated future cash flows.
Historically, the definition of impaired assets under IFRS 9 has been substantially aligned with the definition of
4.2.3. Information on credit risk
4.2.3.1. Exposure to credit risk
According to Article 5 of the CRR, with respect to the regulatory capital requirements for credit risk, exposure is understood to be any asset item and all items included in the Group’s off-balance sheet accounts involving credit risk and not deducted from the Group’s bank capital. Accordingly, mainly loan and advances to customers are included, with their corresponding undrawn balances, letters of credit and guarantees, debt securities and capital instruments, cash and balances with central banks and credit institutions, repurchase and reverse repurchase agreements, financial derivatives and intangible assets.
The credit risk exposure specified in the following sections of this document is broken down into credit risk according to the standardised approach (Section 4.2.4), credit risk according to the advanced approach (Section 4.2.5), counterparty credit risk (Section 4.2.6), securitisation credit risk (Section 4.2.7) and structural equity risk (Section 4.4.3).
In addition to the exposure at default and the risk-weighted assets, the table below shows the original exposure, the exposure net of provisions and the exposure after conversion factors under the standardised and advanced approaches as of December 31, 2021 and December 31, 2020 (including counterparty credit risk):
default used by the Group for internal credit risk management purposes, which is also the definition used for regulatory purposes. As stated in section 4.2.2.1, in 2021 the Group has updated its definition of default to adapt it to the EBA Guidelines in compliance with article 178 of Regulation (EU) No 575/2013 (CRR). Consequently, the Group has considered it appropriate to update the definition of impaired financial asset (Stage 3), considering it a change in accounting estimates, so that its consistency with the definition of non-payment is restored, thereby guaranteeing the integration of both definitions in the management of credit risk.
Table of Contents
| BBVA. PILLAR 3 2021 | 4. RISKS | P. 59 |
Table 12. Credit Risk and Counterparty Risk Exposure (Million Euros. 12-31-2021)
Exposure Class | Original Exposure(1) | Provisions | Net exposure of provisions(3) | On-balance exposure after credit risk mitigation techniques(4a) | Off-balance exposure after credit risk mitigation techniques(4b) | Exposure in the adjusted value(5) | EAD(6) | RWA’s(8) | RWA density (9=(8)/(6)) | |||||||||||||||||||||||||||
Central governments or central banks | 145,683 | (106 | ) | 145,578 | 157,250 | 6,884 | 168,450 | 164,492 | 31,511 | 19 | % | |||||||||||||||||||||||||
Regional governments or local authorities | 6,442 | (6 | ) | 6,436 | 1,506 | 1,221 | 2,527 | 1,981 | 1,189 | 60 | % | |||||||||||||||||||||||||
Public sector entities | 1,442 | (1 | ) | 1,441 | 610 | 769 | 1,410 | 903 | 876 | 97 | % | |||||||||||||||||||||||||
Multilateral development banks | 104 | — | 104 | 104 | — | 104 | 104 | 6 | 6 | % | ||||||||||||||||||||||||||
International organisations | — | — | — | — | — | — | — | — | — | |||||||||||||||||||||||||||
Institutions | 36,960 | (21 | ) | 36,939 | 9,762 | 17,396 | 30,369 | 14,648 | 7,073 | 48 | % | |||||||||||||||||||||||||
Corporates | 53,899 | (961 | ) | 52,938 | 35,260 | 11,325 | 47,537 | 42,405 | 39,710 | 94 | % | |||||||||||||||||||||||||
Retail | 65,577 | (1,254 | ) | 64,323 | 41,306 | 18,408 | 56,647 | 40,898 | 28,520 | 70 | % | |||||||||||||||||||||||||
Secured by mortgages on immovable property | 24,581 | (251 | ) | 24,330 | 24,057 | 268 | 24,160 | 24,035 | 8,637 | 36 | % | |||||||||||||||||||||||||
Exposures in default | 7,233 | (3,769 | ) | 3,464 | 3,107 | 266 | 3,304 | 3,175 | 3,495 | 110 | % | |||||||||||||||||||||||||
Exposures associated with particularly high risk | 3,309 | (424 | ) | 2,885 | 2,276 | 484 | 2,754 | 2,436 | 3,654 | 150 | % | |||||||||||||||||||||||||
Covered bonds | — | — | — | — | — | — | — | — | — | |||||||||||||||||||||||||||
Claims on institutions and corporates with a short-term credit assesment | — | — | — | — | — | — | — | — | 93 | % | ||||||||||||||||||||||||||
Collective investments undertakings | 1 | — | 1 | — | 1 | 1 | 1 | 1 | 100 | % | ||||||||||||||||||||||||||
Other exposures | 18,457 | — | 18,457 | 18,726 | 109 | 18,835 | 18,795 | 10,987 | 58 | % | ||||||||||||||||||||||||||
|
|
|
|
|
|
|
|
|
|
|
|
|
|
|
|
|
| |||||||||||||||||||
Total standardised approach | 363,688 | (6,790 | ) | 356,898 | 293,963 | 57,130 | 356,099 | 313,872 | 135,660 | 43 | % | |||||||||||||||||||||||||
|
|
|
|
|
|
|
|
|
|
|
|
|
|
|
|
|
| |||||||||||||||||||
Central governments or central banks | 16,271 | (2 | ) | 17,064 | 317 | 17,380 | 17,225 | 983 | 6 | % | ||||||||||||||||||||||||||
Institutions | 124,505 | (41 | ) | 101,034 | 7,686 | 108,720 | 106,119 | 7,228 | 7 | % | ||||||||||||||||||||||||||
Corporates | 176,355 | (2,295 | ) | 89,294 | 76,934 | 166,228 | 138,651 | 75,554 | 54 | % | ||||||||||||||||||||||||||
Corporates (SMEs) | 26,393 | (1,143 | ) | 16,186 | 4,847 | 21,033 | 18,168 | 15,023 | 83 | % | ||||||||||||||||||||||||||
Corporates: Specialised lending | 6,797 | (62 | ) | 5,907 | 890 | 6,797 | 6,395 | 5,173 | 81 | % | ||||||||||||||||||||||||||
Corporates: Others | 143,165 | (1,089 | ) | 67,201 | 71,197 | 138,398 | 114,088 | 55,359 | 49 | % | ||||||||||||||||||||||||||
Retail | 122,224 | (2,777 | ) | 95,058 | 24,367 | 119,425 | 98,835 | 23,727 | 24 | % | ||||||||||||||||||||||||||
Of which: secured by immovable property | 77,198 | (893 | ) | 72,291 | 4,907 | 77,198 | 72,393 | 11,027 | 15 | % | ||||||||||||||||||||||||||
Of which: Qualifying revolving | 25,660 | (607 | ) | 7,172 | 18,488 | 25,660 | 10,315 | 6,541 | 63 | % | ||||||||||||||||||||||||||
Of which: Others | 19,366 | (1,277 | ) | 15,595 | 972 | 16,567 | 16,127 | 6,159 | 38 | % | ||||||||||||||||||||||||||
Retail: Other SMEs | 6,759 | (390 | ) | 3,104 | 902 | 4,005 | 3,592 | 1,520 | 42 | % | ||||||||||||||||||||||||||
Retail: Other Non-SMEs | 12,607 | (887 | ) | 12,492 | 70 | 12,562 | 12,535 | 4,639 | 37 | % | ||||||||||||||||||||||||||
|
|
|
|
|
|
|
|
|
|
|
|
|
|
|
|
|
| |||||||||||||||||||
Total IRB approach | 439,355 | (5,115 | ) | — | 302,450 | 109,304 | 411,754 | 360,831 | 107,492 | 30 | % | |||||||||||||||||||||||||
|
|
|
|
|
|
|
|
|
|
|
|
|
|
|
|
|
| |||||||||||||||||||
Total credit risk dilution and delivery | 2,908 | — | 2,907 | 2,907 | — | 2,907 | 2,690 | 325 | 12 | % | ||||||||||||||||||||||||||
|
|
|
|
|
|
|
|
|
|
|
|
|
|
|
|
|
| |||||||||||||||||||
Total positions in securitisation (7) | 805,951 | (11,906 | ) | 359,805 | 599,320 | 166,434 | 770,760 | 677,393 | 243,477 | 36 | % | |||||||||||||||||||||||||
|
|
|
|
|
|
|
|
|
|
|
|
|
|
|
|
|
| |||||||||||||||||||
Equity | 5,809 | 5,809 | 5,809 | 5,809 | 13,234 | 228 | % | |||||||||||||||||||||||||||||
|
|
|
|
|
|
|
|
|
|
|
|
|
|
|
|
|
| |||||||||||||||||||
Simple risk weight approach | 1,058 | 1,058 | 1,058 | 1,058 | 2,442 | 231 | % | |||||||||||||||||||||||||||||
Exposures in sufficiently diversified portfolios (RW 190%) | 711 | 711 | 711 | 711 | 1,351 | 190 | % | |||||||||||||||||||||||||||||
Exchange traded exposures (RW 290%) | 242 | 242 | 242 | 242 | 702 | 290 | % | |||||||||||||||||||||||||||||
Others (RW 370%) | 105 | 105 | 105 | 105 | 389 | 370 | % | |||||||||||||||||||||||||||||
PD/LGD approach | 1,489 | 1,489 | 1,489 | 1,489 | 2,559 | 172 | % | |||||||||||||||||||||||||||||
Internal models approach | 142 | 142 | 142 | 142 | 433 | 306 | % | |||||||||||||||||||||||||||||
Exposures subject to a 250% risk weight | 3,120 | 3,120 | 3,120 | 3,120 | 7,800 | 250 | % | |||||||||||||||||||||||||||||
|
|
|
|
|
|
|
|
|
|
|
|
|
|
|
|
|
| |||||||||||||||||||
Total credit risk | 811,760 | (11,906 | ) | 359,805 | 605,129 | 166,434 | 776,569 | 683,202 | 256,711 | 38 | % | |||||||||||||||||||||||||
|
|
|
|
|
|
|
|
|
|
|
|
|
|
|
|
|
| |||||||||||||||||||
| (1) | Gross exposure value before credit risk mitigation techniques and CCF, excluding contributions to the default fund for a CCP | |
| (2) | Includes provisions and impairment of financial assets and contingent risk and commitments | |
| (3) | Standardised Approach exposures are adjusted by credit risk adjustments. The original equity exposure is shown net of impairment | |
| (4a) (4b) | Eligible credit risk mitigation techniques are included, either on-balance sheet or off-balance sheet, according to Chapter 4 of CRR. In the case of securitisation exposure, unfunded credit protection is included | |
| (5) | Under the standardised approach, it corresponds to the exposure value after the application of the eligible credit risk mitigation techniques, net of volatility adjustments. | |
| (6) | Exposure at default, calculated as (4a)+((4b)*CCF) | |
| (7) | This row includes the SEC-SA, SEC-ERBA and SEC-IRBA methods. The exposure of securitisations with a risk weight of 1,250% which are deducted from own funds is included (€22 million) |
Table of Contents
| BBVA. PILLAR 3 2021 | 4. RISKS | P. 60 |
Credit Risk and Counterparty Risk Exposure (Million Euros. 31-12-2020)
Exposure Class | Original Exposure(1) | Provisions | Net exposure of provisions(3) | On-balance exposure after credit risk mitigation techniques(4a) | Off-balance exposure after credit risk mitigation techniques(4b) | Exposure in the adjusted value(5) | EAD(6) | RWA’s(8) | RWA density (9=(8)/(6)) | |||||||||||||||||||||||||||
Central governments or central banks | 177,273 | (120 | ) | 177,153 | 204,373 | 9,038 | 213,411 | 207,083 | 29,392 | 14 | % | |||||||||||||||||||||||||
Regional governments or local authorities | 19,740 | (28 | ) | 19,712 | 6,881 | 851 | 7,732 | 7,207 | 2,317 | 32 | % | |||||||||||||||||||||||||
Public sector entities | 1,926 | (1 | ) | 1,925 | 1,678 | 242 | 1,920 | 1,835 | 768 | 42 | % | |||||||||||||||||||||||||
Multilateral development banks | 271 | — | 271 | 303 | 38 | 341 | 303 | 7 | 2 | % | ||||||||||||||||||||||||||
International organisations | — | — | — | — | — | — | — | — | — | |||||||||||||||||||||||||||
Institutions | 35,589 | (41 | ) | 35,548 | 15,386 | 13,541 | 28,927 | 17,047 | 7,827 | 46 | % | |||||||||||||||||||||||||
Corporates | 106,523 | (1,507 | ) | 105,016 | 64,598 | 30,885 | 95,483 | 79,985 | 77,822 | 97 | % | |||||||||||||||||||||||||
Retail | 82,631 | (1,815 | ) | 80,816 | 46,040 | 25,794 | 71,833 | 49,019 | 34,362 | 70 | % | |||||||||||||||||||||||||
Secured by mortgages on immovable property | 35,013 | (324 | ) | 34,690 | 34,433 | 216 | 34,649 | 34,614 | 12,769 | 37 | % | |||||||||||||||||||||||||
Exposures in default | 8,392 | (4,309 | ) | 4,083 | 3,847 | 170 | 4,017 | 3,959 | 4,480 | 113 | % | |||||||||||||||||||||||||
Exposures associated with particularly high risk | 4,122 | (544 | ) | 3,578 | 3,035 | 419 | 3,454 | 3,172 | 4,758 | 150 | % | |||||||||||||||||||||||||
Covered bonds | — | — | — | — | — | — | — | — | — | |||||||||||||||||||||||||||
Claims on institutions and corporates with a short-term credit assesment | 1 | — | 1 | 1 | — | 1 | 1 | 1 | 88 | % | ||||||||||||||||||||||||||
Collective investments undertakings | 8 | — | 8 | — | 5 | 5 | 3 | 3 | 100 | % | ||||||||||||||||||||||||||
Other exposures | 20,030 | — | 20,030 | 19,964 | 675 | 20,638 | 20,389 | 12,071 | 59 | % | ||||||||||||||||||||||||||
|
|
|
|
|
|
|
|
|
|
|
|
|
|
|
|
|
| |||||||||||||||||||
Total standardised approach | 491,521 | (8,691 | ) | 482,830 | 400,539 | 81,872 | 482,412 | 424,616 | 186,576 | 44 | % | |||||||||||||||||||||||||
|
|
|
|
|
|
|
|
|
|
|
|
|
|
|
|
|
| |||||||||||||||||||
Central governments or central banks | 13,333 | (7 | ) | 14,233 | 193 | 14,427 | 14,328 | 849 | 6 | % | ||||||||||||||||||||||||||
Institutions | 112,423 | (33 | ) | 91,252 | 5,813 | 97,065 | 94,455 | 7,084 | 8 | % | ||||||||||||||||||||||||||
Corporates | 162,314 | (2,335 | ) | 82,250 | 69,516 | 151,767 | 115,181 | 60,324 | 52 | % | ||||||||||||||||||||||||||
Corporates (SMEs) | 23,254 | (1,028 | ) | 14,156 | 4,019 | 18,175 | 15,734 | 11,452 | 73 | % | ||||||||||||||||||||||||||
Corporates: Specialised lending | 6,407 | (23 | ) | 5,790 | 616 | 6,407 | 6,136 | 4,912 | 80 | % | ||||||||||||||||||||||||||
Corporates: Others | 132,653 | (1,285 | ) | 62,304 | 64,881 | 127,185 | 93,312 | 43,960 | 47 | % | ||||||||||||||||||||||||||
Retail | 115,544 | (3,020 | ) | 91,886 | 21,425 | 113,310 | 95,236 | 18,471 | 19 | % | ||||||||||||||||||||||||||
Of which: secured by immovable property | 76,070 | (1,129 | ) | 71,737 | 4,308 | 76,045 | 71,824 | 7,319 | 10 | % | ||||||||||||||||||||||||||
Of which: Qualifying revolving | 22,516 | (734 | ) | 6,222 | 16,293 | 22,516 | 9,035 | 5,987 | 66 | % | ||||||||||||||||||||||||||
Of which: Others | 16,959 | (1,157 | ) | 13,926 | 823 | 14,749 | 14,377 | 5,165 | 36 | % | ||||||||||||||||||||||||||
Retail: Other SMEs | 5,768 | (296 | ) | 2,765 | 813 | 3,578 | 3,211 | 1,289 | 40 | % | ||||||||||||||||||||||||||
Retail: Other Non-SMEs | 11,191 | (862 | ) | 11,161 | 10 | 11,171 | 11,166 | 3,876 | 35 | % | ||||||||||||||||||||||||||
|
|
|
|
|
|
|
|
|
|
|
|
|
|
|
| |||||||||||||||||||||
Total IRB approach | 403,615 | (5,395 | ) | 279,622 | 96,946 | 376,568 | 319,200 | 86,729 | 27 | % | ||||||||||||||||||||||||||
|
|
|
|
|
|
|
|
|
|
|
|
|
|
|
| |||||||||||||||||||||
Total credit risk dilution and delivery | 1,723 | 1,649 | 1,649 | 1,649 | 347 | 21 | % | |||||||||||||||||||||||||||||
|
|
|
|
|
|
|
|
|
|
|
|
|
|
|
|
|
| |||||||||||||||||||
Total positions in securitisation (7) | 895,135 | (14,086 | ) | 482,830 | 680,161 | 178,819 | 858,980 | 743,816 | 273,304 | 37 | % | |||||||||||||||||||||||||
|
|
|
|
|
|
|
|
|
|
|
|
|
|
|
|
|
| |||||||||||||||||||
Equity | 6,123 | 6,123 | 6,123 | 6,123 | 14,532 | 237 | % | |||||||||||||||||||||||||||||
|
|
|
|
|
|
|
|
|
|
|
|
|
|
|
|
|
| |||||||||||||||||||
Simple risk weight approach | 812 | 812 | — | 812 | 812 | 1,831 | 226 | % | ||||||||||||||||||||||||||||
Exposures in sufficiently diversified portfolios (RW 190%) | 586 | 586 | — | 586 | 586 | 1,114 | 190 | % | ||||||||||||||||||||||||||||
Exchange traded exposures (RW 290%) | 147 | 147 | — | 147 | 147 | 425 | 290 | % | ||||||||||||||||||||||||||||
Others (RW 370%) | 79 | 79 | — | 79 | 79 | 291 | 370 | % | ||||||||||||||||||||||||||||
PD/LGD approach | 1,869 | 1,869 | — | 1,869 | 1,869 | 3,945 | 211 | % | ||||||||||||||||||||||||||||
Internal models approach | 185 | 185 | — | 185 | 185 | 613 | 331 | % | ||||||||||||||||||||||||||||
Exposures subject to a 250% risk weight | 3,257 | 3,257 | — | 3,257 | 3,257 | 8,144 | 250 | % | ||||||||||||||||||||||||||||
|
|
|
|
|
|
|
|
|
|
|
|
|
|
|
|
|
| |||||||||||||||||||
Total credit risk | 902,981 | (14,086 | ) | 482,830 | 687,934 | 178,819 | 866,753 | 751,588 | 288,184 | 38 | % | |||||||||||||||||||||||||
|
|
|
|
|
|
|
|
|
|
|
|
|
|
|
|
|
| |||||||||||||||||||
| (1) | Gross exposure value before credit risk mitigation techniques and CCF, excluding contributions to the default fund for a CCP | |
| (2) | Includes provisions and impairment of financial assets and contingent risk and commitments | |
| (3) | Standardised Approach exposures are adjusted by credit risk adjustments. The original equity exposure is shown net of impairment | |
| (4a) (4b) | Eligible credit risk mitigation techniques are included, either on-balance sheet or off-balance sheet, according to Chapter 4 of CRR. In the case of securitisation exposure, unfunded credit protection is included | |
| (5) | It corresponds to the exposure value adjusted by eligible credit risk mitigation techniques. | |
| (6) | Exposure at default, calculated as (4a)+((4b)*CCF) | |
| (7) | This row includes the SEC-SA, SEC-ERBA and SEC-IRBA methods. The exposure of securitisations with a risk weight of 1,250% which are deducted from own funds is included (€29 million) |
Table of Contents
| BBVA. PILLAR 3 2021 | 4. RISKS | P. 61 |
The sale of the subsidiary BBVA USA, besides the reduction in the Group’s RWAs, it also has indirect effects on the relative densities of RWAs, particularly in the categories where the contribution of the exposure in the North American subsidiary was more relevant, such as “Regional governments and Local Authorities”, “Public Sector Entities and Other Public Institutions” and “Corporates”.
On the other hand, in IRB there is also a slight increase in RWA densities as a result of the regulatory impacts mentioned above.
See Table 9 for more information on the variations of RWAs by standardised and IRB approaches.
The distribution of the Group’s original exposure by geography (classification by country of the counterparty) is shown below:
Chart 5. Distribution by geographical area of Exposure to Credit Risk
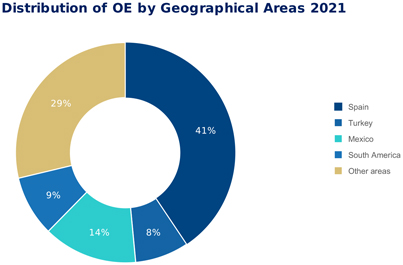
| (*) | Other Countries includes mainly exposures in Europe (excluding Spain), United States and Asia. |
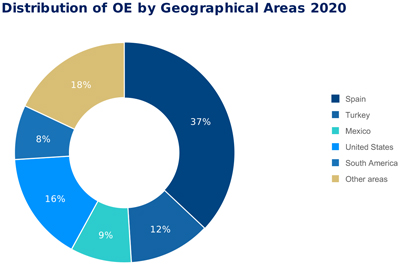
| (*) | Other Countries includes mainly exposures in Europe (excluding Spain) and Asia. |
Table of Contents
| BBVA. PILLAR 3 2021 | 4. RISKS | P. 62 |
As of December 31, 2021, as a result of the sale of BBVA USA, exposures to counterparties located in the United States have been grouped within the “Other areas” group.
The average RWAs densities for credit and counterparty risk are shown below, by exposure class and geography where the Group operates.
Table 13. Breakdown of RWA density by geographical area and approach (Million euros. 12-31-2021)
| RWA Density(1)(2) | ||||||||||||||||||||||||
Category of exposure | Total | Spain(3) | Mexico | Turkey | South America | Other areas(4) | ||||||||||||||||||
Central governments or central banks | 19 | % | 14 | % | 16 | % | 69 | % | 45 | % | — | |||||||||||||
Regional governments or local authorities | 60 | % | 28 | % | 97 | % | 100 | % | 88 | % | 17 | % | ||||||||||||
Public sector entities | 97 | % | — | 82 | % | 75 | % | 100 | % | 20 | % | |||||||||||||
Multilateral Development Banks | 6 | % | — | — | — | 7 | % | — | % | |||||||||||||||
International organisations | — | — | — | — | — | — | ||||||||||||||||||
Institutions | 48 | % | 62 | % | 65 | % | 70 | % | 82 | % | 29 | % | ||||||||||||
Corporates | 94 | % | 102 | % | 96 | % | 94 | % | 99 | % | 76 | % | ||||||||||||
Retail | 70 | % | 63 | % | 71 | % | 68 | % | 73 | % | 73 | % | ||||||||||||
Secured by mortgages on immovable property | 36 | % | 34 | % | 36 | % | 40 | % | 36 | % | 37 | % | ||||||||||||
Exposures in default | 110 | % | 112 | % | 101 | % | 119 | % | 103 | % | 109 | % | ||||||||||||
Exposures associated with particularly high risk | 150 | % | 150 | % | 150 | % | 150 | % | 150 | % | 150 | % | ||||||||||||
Covered bonds | — | — | — | — | — | — | ||||||||||||||||||
Short-term claims on institutions and corporate | 93 | % | — | — | — | 93 | % | — | ||||||||||||||||
Collective investments undertakings | 100 | % | 100 | % | — | % | — | — | 100 | % | ||||||||||||||
Other exposures | 58 | % | 84 | % | 48 | % | 32 | % | 40 | % | 15 | % | ||||||||||||
|
|
|
|
|
|
|
|
|
|
|
| |||||||||||||
Total credit risk by standardised approach | 43 | % | 24 | % | 43 | % | 78 | % | 69 | % | 24 | % | ||||||||||||
|
|
|
|
|
|
|
|
|
|
|
| |||||||||||||
Central governments or central banks | 6 | % | 81 | % | 40 | % | 87 | % | 25 | % | 5 | % | ||||||||||||
Institutions | 7 | % | 11 | % | 67 | % | 201 | % | 18 | % | 5 | % | ||||||||||||
Corporates | 54 | % | 65 | % | 68 | % | 104 | % | 60 | % | 41 | % | ||||||||||||
Retail | 24 | % | 19 | % | 89 | % | 12 | % | 35 | % | 47 | % | ||||||||||||
|
|
|
|
|
|
|
|
|
|
|
| |||||||||||||
Total credit risk by IRB approach | 30 | % | 33 | % | 73 | % | 105 | % | 44 | % | 19 | % | ||||||||||||
|
|
|
|
|
|
|
|
|
|
|
| |||||||||||||
Securitisation exposures | 12 | % | 12 | % | — | — | — | — | ||||||||||||||||
|
|
|
|
|
|
|
|
|
|
|
| |||||||||||||
Total credit risk dilution and delivery | 36 | % | 29 | % | 53 | % | 78 | % | 67 | % | 20 | % | ||||||||||||
|
|
|
|
|
|
|
|
|
|
|
| |||||||||||||
| (1) | Equity positions are not included |
| (2) | Calculated as RWA/EAD. |
| (3) | In Spain, the category Central Governments and Central Banks includes deferred assets net of deferred tax liabilities. |
| (4) | Other areas includes mainly exposures in Europe (excluding Spain), United States and Asia. |
Table of Contents
| BBVA. PILLAR 3 2021 | 4. RISKS | P. 63 |
Breakdown of RWA density by geographical area and approach (Million euros. 12-31-2020)
| RWA Density(1)(2) | ||||||||||||||||||||||||||||
Category of exposure | Total | Spain(3) | Turkey | Mexico | USA | South America | Other areas(4) | |||||||||||||||||||||
Central governments or central banks | 14 | % | 12 | % | 11 | % | 58 | % | 1 | % | 39 | % | 1 | % | ||||||||||||||
Regional governments or local authorities | 32 | % | 16 | % | 63 | % | 100 | % | 20 | % | 83 | % | 20 | % | ||||||||||||||
Public sector entities | 42 | % | — | 52 | % | 98 | % | 20 | % | 63 | % | 19 | % | |||||||||||||||
Multilateral Development Banks | 2 | % | — | — | — | — | 9 | % | — | |||||||||||||||||||
International organisations | — | — | — | — | — | — | — | |||||||||||||||||||||
Institutions | 46 | % | 23 | % | 81 | % | 70 | % | 22 | % | 56 | % | 31 | % | ||||||||||||||
Corporates | 97 | % | 94 | % | 99 | % | 95 | % | 99 | % | 98 | % | 95 | % | ||||||||||||||
Retail | 70 | % | 63 | % | 71 | % | 68 | % | 74 | % | 73 | % | 72 | % | ||||||||||||||
Secured by mortgages on immovable property | 37 | % | 33 | % | 37 | % | 35 | % | 36 | % | 40 | % | 37 | % | ||||||||||||||
Exposures in default | 113 | % | 111 | % | 101 | % | 112 | % | 126 | % | 109 | % | 108 | % | ||||||||||||||
Exposures associated with particularly high risk | 150 | % | 150 | % | 150 | % | 150 | % | 150 | % | 150 | % | 150 | % | ||||||||||||||
Covered bonds | — | — | — | — | — | — | — | |||||||||||||||||||||
Short-term claims on institutions and corporate | 87 | % | — | — | — | — | 87 | % | — | |||||||||||||||||||
Collective investments undertakings | 100 | % | 100 | % | — | — | 100 | % | — | 100 | % | |||||||||||||||||
Other exposures | 59 | % | 80 | % | 50 | % | 46 | % | 75 | % | 34 | % | 18 | % | ||||||||||||||
|
|
|
|
|
|
|
|
|
|
|
|
|
| |||||||||||||||
Total credit risk by standardised approach | 44 | % | 23 | % | 38 | % | 77 | % | 50 | % | 65 | % | 37 | % | ||||||||||||||
|
|
|
|
|
|
|
|
|
|
|
|
|
| |||||||||||||||
Central governments or central banks | 6 | % | 71 | % | 49 | % | 96 | % | 1 | % | 18 | % | 9 | % | ||||||||||||||
Institutions | 8 | % | 13 | % | 59 | % | 132 | % | 14 | % | 15 | % | 6 | % | ||||||||||||||
Corporates | 52 | % | 56 | % | 72 | % | 90 | % | 37 | % | 53 | % | 42 | % | ||||||||||||||
Retail | 19 | % | 14 | % | 92 | % | 6 | % | 16 | % | 21 | % | 22 | % | ||||||||||||||
|
|
|
|
|
|
|
|
|
|
|
|
|
| |||||||||||||||
Total credit risk by IRB approach | 27 | % | 27 | % | 77 | % | 92 | % | 22 | % | 35 | % | 16 | % | ||||||||||||||
|
|
|
|
|
|
|
|
|
|
|
|
|
| |||||||||||||||
Securitisation exposures | 21 | % | 19 | % | — | — | 74 | % | — | — | ||||||||||||||||||
|
|
|
|
|
|
|
|
|
|
|
|
|
| |||||||||||||||
Total credit risk dilution and delivery | 37 | % | 25 | % | 49 | % | 77 | % | 45 | % | 63 | % | 20 | % | ||||||||||||||
|
|
|
|
|
|
|
|
|
|
|
|
|
| |||||||||||||||
| (1) | Does not include equity positions. |
| (2) | Calculated as RWAs/EAD. |
| (3) | In Spain, the category Central Governments and Central Banks includes deferred assets net of deferred tax liabilities.. |
| (4) | Includes all other countries not included in the previous columns. The countries with the largest exposure in this area are: United Kingdom, France, Italy, Germany and Portugal. |
4.2.3.2. Credit quality of exposures
The carrying amount of performing and non-performing exposures, broken down by product and counterparty sector, as of December 31, 2021 and as of December 31, 2020, is below:
Table of Contents
| BBVA. PILLAR 3 2021 | 4. RISKS | P. 64 |
Table 14. EU CR1 - Performing and non-performing exposures and related provisions (Million Euros. 31-12-2021)
| Gross carrying amount/nominal amount | Accumulated impairment, accumulated negative changes in fair value due to credit risk and provisions | |||||||||||||||||||||||||||||||||||||||||||||||||||||||||||
| Performing exposures (1) | Non-performing exposures | Performing exposures | Non-performing exposures | Collateral and financial guarantees received | ||||||||||||||||||||||||||||||||||||||||||||||||||||||||
| Of which stage 1 | Of which stage 2 | Of which stage 2 | Of which stage 3 | Of which stage 1 | Of which stage 2 | Of which stage 2 | Of which stage 3 | Accumulated partial write-off | On performing exposures | On non- performing exposures | ||||||||||||||||||||||||||||||||||||||||||||||||||
Cash balances at central banks and other demand deposits | 61,159 | 61,159 | — | — | — | — | (5 | ) | (5 | ) | — | — | — | — | — | — | — | |||||||||||||||||||||||||||||||||||||||||||
Loans and advances | 334,639 | 299,825 | 34,159 | 14,693 | 17 | 14,659 | (4,089 | ) | (2,001 | ) | (2,088 | ) | (7,064 | ) | (2 | ) | (7,061 | ) | — | 161,158 | 4,880 | |||||||||||||||||||||||||||||||||||||||
Central banks | 5,687 | 5,687 | — | — | — | — | (6 | ) | (6 | ) | — | — | — | — | — | 1,182 | — | |||||||||||||||||||||||||||||||||||||||||||
General governments | 19,797 | 19,287 | 369 | 62 | — | 62 | (18 | ) | (13 | ) | (5 | ) | (19 | ) | — | (19 | ) | — | 5,655 | 10 | ||||||||||||||||||||||||||||||||||||||||
Credit institutions | 13,807 | 13,797 | 10 | — | — | — | (18 | ) | (18 | ) | — | — | — | — | — | 609 | — | |||||||||||||||||||||||||||||||||||||||||||
Other financial corporations | 9,229 | 9,097 | 131 | 24 | — | 24 | (14 | ) | (8 | ) | (6 | ) | (9 | ) | — | (9 | ) | — | 1,565 | 6 | ||||||||||||||||||||||||||||||||||||||||
Non-financial corporations | 139,903 | 120,125 | 19,340 | 7,316 | 15 | 7,290 | (2,061 | ) | (757 | ) | (1,303 | ) | (3,741 | ) | (2 | ) | (3,738 | ) | — | 60,850 | 1,803 | |||||||||||||||||||||||||||||||||||||||
Of which: SME | 49,447 | 39,824 | 9,548 | 3,957 | 7 | 3,941 | (1,039 | ) | (464 | ) | (575 | ) | (2,256 | ) | (1 | ) | (2,254 | ) | — | 29,536 | 1,332 | |||||||||||||||||||||||||||||||||||||||
Households | 146,216 | 131,832 | 14,309 | 7,291 | 2 | 7,283 | (1,972 | ) | (1,199 | ) | (773 | ) | (3,296 | ) | — | (3,296 | ) | — | 91,297 | 3,062 | ||||||||||||||||||||||||||||||||||||||||
Debt securities | 73,696 | 72,825 | 765 | 23 | — | 23 | (104 | ) | (21 | ) | (82 | ) | (18 | ) | — | (18 | ) | — | — | — | ||||||||||||||||||||||||||||||||||||||||
Central banks | 1,712 | 1,712 | — | — | — | — | (2 | ) | (2 | ) | — | — | — | — | — | — | — | |||||||||||||||||||||||||||||||||||||||||||
General governments | 63,541 | 62,790 | 751 | — | — | — | (97 | ) | (15 | ) | (82 | ) | — | — | — | — | — | — | ||||||||||||||||||||||||||||||||||||||||||
Credit institutions | 1,795 | 1,795 | — | — | — | — | — | — | — | — | — | — | — | — | — | |||||||||||||||||||||||||||||||||||||||||||||
Other financial corporations | 2,258 | 2,149 | 4 | 20 | — | 20 | (3 | ) | (2 | ) | — | (16 | ) | — | (16 | ) | — | — | — | |||||||||||||||||||||||||||||||||||||||||
Non-financial corporations | 4,389 | 4,379 | 10 | 3 | — | 3 | (2 | ) | (2 | ) | — | (2 | ) | — | (2 | ) | — | — | — | |||||||||||||||||||||||||||||||||||||||||
Off-balance-sheet exposures | 164,487 | 152,418 | 12,069 | 962 | 1 | 957 | 455 | 185 | 270 | 237 | — | 236 | 7,389 | 135 | ||||||||||||||||||||||||||||||||||||||||||||||
Central banks | 2 | 2 | — | — | — | — | — | — | — | — | — | — | — | — | ||||||||||||||||||||||||||||||||||||||||||||||
General governments | 3,830 | 3,742 | 88 | 27 | — | 26 | 2 | 1 | — | 1 | — | 1 | 17 | — | ||||||||||||||||||||||||||||||||||||||||||||||
Credit institutions | 20,694 | 20,246 | 447 | 2 | — | 2 | 6 | 4 | 2 | — | — | — | 51 | — | ||||||||||||||||||||||||||||||||||||||||||||||
Other financial corporations | 6,736 | 6,582 | 154 | 8 | — | 8 | 2 | 2 | — | — | — | — | 45 | 3 | ||||||||||||||||||||||||||||||||||||||||||||||
Non-financial corporations | 97,019 | 87,707 | 9,312 | 812 | 1 | 810 | 342 | 103 | 239 | 213 | — | 213 | 6,945 | 119 | ||||||||||||||||||||||||||||||||||||||||||||||
Households | 36,206 | 34,138 | 2,068 | 113 | — | 112 | 102 | 74 | 28 | 22 | — | 22 | 332 | 13 | ||||||||||||||||||||||||||||||||||||||||||||||
|
|
|
|
|
|
|
|
|
|
|
|
|
|
|
|
|
|
|
|
|
|
|
|
|
|
|
|
|
| |||||||||||||||||||||||||||||||
Total exposures December 2021 | 633,980 | 586,227 | 46,993 | 15,678 | 18 | 15,639 | (3,743 | ) | (1,843 | ) | (1,900 | ) | (6,845 | ) | (2 | ) | (6,843 | ) | — | 168,548 | 5,015 | |||||||||||||||||||||||||||||||||||||||
|
|
|
|
|
|
|
|
|
|
|
|
|
|
|
|
|
|
|
|
|
|
|
|
|
|
|
|
|
| |||||||||||||||||||||||||||||||
| (*) | Includes the carrying amount of reverse repurchase agreements and positions subject to the securitisation framework. |
| (**) | Off-balance sheet provisions exposures are shown as positive, in line with FINREP regulatory financial reporting models. . |
| (***) | As of 31 December 2021, the table has been adapted to the New EBA ITS, the main modifications being the inclusion of Cash balances at central banks and other demand deposits and the breakdown of accumulated partial write-offs instead of accumulated total write-offs. |
| (1) | Includes gross carrying amount of the “amortised cost” portfolio, the “fair value through other comprehensive income” portfolio and the “fair value through P&L” portfolios. Due to this, the balance of the rows other than “Cash and balances with central banks” performing may differ from the sum of the balances of stage 1 and stage 2 columns for these rows.. |
Table of Contents
| BBVA. PILLAR 3 2021 | 4. RISKS | P. 65 |
EU CR1 - Performing and non-performing exposures and related provisions (Million Euros. 31-12-2020)
| Gross carrying amount/nominal amount | Accumulated impairment, accumulated negative changes in fair value due to credit risk and provisions | |||||||||||||||||||||||||||||||||||||||||||||||||||||||||||
| Performing exposures | Non-performing exposures | Performing exposures | Non-performing exposures | Collateral and financial guarantees received | ||||||||||||||||||||||||||||||||||||||||||||||||||||||||
| Of which stage 1 | Of which stage 2 | Of which stage 2 | Of which stage 3 | Of which stage 1 | Of which stage 2 | Of which stage 2 | Of which stage 3 | Accumulated write-off | On performing exposures | On non- performing exposures | ||||||||||||||||||||||||||||||||||||||||||||||||||
Loans and advances | 329,513 | 298,940 | 30,573 | 14,684 | — | 14,684 | (4,331 | ) | (2,042 | ) | (2,289 | ) | (7,820 | ) | — | (7,820 | ) | 21,963 | 159,684 | 4,152 | ||||||||||||||||||||||||||||||||||||||||
Central banks | 6,229 | 6,229 | — | — | — | — | (20 | ) | (20 | ) | — | — | — | — | — | 479 | — | |||||||||||||||||||||||||||||||||||||||||||
General governments | 19,447 | 19,247 | 200 | 76 | — | 76 | (23 | ) | (14 | ) | (9 | ) | (25 | ) | — | (25 | ) | 36 | 4,477 | 19 | ||||||||||||||||||||||||||||||||||||||||
Credit institutions | 14,607 | 14,587 | 20 | 6 | — | 6 | (12 | ) | (10 | ) | (2 | ) | (2 | ) | — | (2 | ) | 4 | 237 | — | ||||||||||||||||||||||||||||||||||||||||
Other financial corporations | 9,347 | 9,252 | 95 | 14 | — | 14 | (32 | ) | (26 | ) | (6 | ) | (7 | ) | — | (7 | ) | 3 | 1,977 | — | ||||||||||||||||||||||||||||||||||||||||
Non-financial corporations | 135,720 | 120,542 | 15,178 | 7,475 | — | 7,475 | (1,882 | ) | (772 | ) | (1,110 | ) | (4,238 | ) | — | (4,238 | ) | 16,556 | 60,931 | 1,548 | ||||||||||||||||||||||||||||||||||||||||
Of which: SME | 50,784 | 44,160 | 6,624 | 4,150 | — | 4,150 | (960 | ) | (397 | ) | (563 | ) | (2,463 | ) | — | (2,463 | ) | 5,060 | 30,142 | 1,107 | ||||||||||||||||||||||||||||||||||||||||
Households | 144,163 | 129,083 | 15,080 | 7,113 | — | 7,113 | (2,362 | ) | (1,200 | ) | (1,162 | ) | (3,548 | ) | — | (3,548 | ) | 5,364 | 91,583 | 2,585 | ||||||||||||||||||||||||||||||||||||||||
Debt securities | 84,765 | 84,350 | 415 | 20 | — | 20 | (119 | ) | (75 | ) | (44 | ) | (16 | ) | — | (16 | ) | — | — | — | ||||||||||||||||||||||||||||||||||||||||
Central banks | 1,624 | 1,624 | — | — | — | — | (13 | ) | (13 | ) | — | — | — | — | — | — | — | |||||||||||||||||||||||||||||||||||||||||||
General governments | 69,339 | 68,934 | 405 | — | — | — | (93 | ) | (50 | ) | (43 | ) | — | — | — | — | — | — | ||||||||||||||||||||||||||||||||||||||||||
Credit institutions | 2,064 | 2,064 | — | — | — | — | (1 | ) | (1 | ) | — | — | — | — | — | — | — | |||||||||||||||||||||||||||||||||||||||||||
Other financial corporations | 7,429 | 7,424 | 5 | 19 | — | 19 | (9 | ) | (8 | ) | — | (15 | ) | — | (15 | ) | — | — | — | |||||||||||||||||||||||||||||||||||||||||
Non-financial corporations | 4,309 | 4,304 | 5 | 1 | — | 1 | (3 | ) | (3 | ) | (1 | ) | (1 | ) | — | (1 | ) | — | — | — | ||||||||||||||||||||||||||||||||||||||||
Off-balance-sheet exposures | 177,866 | 165,184 | 12,682 | 1,032 | — | 1,032 | (453 | ) | (238 | ) | (215 | ) | (274 | ) | — | (274 | ) | 7,021 | 103 | |||||||||||||||||||||||||||||||||||||||||
Central banks | 125 | 125 | — | — | — | — | — | — | — | — | — | — | — | — | ||||||||||||||||||||||||||||||||||||||||||||||
General governments | 3,244 | 3,146 | 98 | 7 | — | 7 | (2 | ) | (1 | ) | (1 | ) | (3 | ) | — | (3 | ) | 46 | — | |||||||||||||||||||||||||||||||||||||||||
Credit institutions | 17,049 | 16,743 | 306 | 1 | — | 1 | (13 | ) | (11 | ) | (2 | ) | — | — | — | 2 | — | |||||||||||||||||||||||||||||||||||||||||||
Other financial corporations | 8,798 | 8,315 | 483 | — | — | — | (6 | ) | (6 | ) | — | — | — | — | 123 | — | ||||||||||||||||||||||||||||||||||||||||||||
Non-financial corporations | 106,978 | 97,395 | 9,583 | 917 | — | 917 | (280 | ) | (108 | ) | (172 | ) | (258 | ) | — | (258 | ) | 6,525 | 100 | |||||||||||||||||||||||||||||||||||||||||
Households | 41,672 | 39,460 | 2,212 | 107 | — | 107 | (152 | ) | (112 | ) | (40 | ) | (13 | ) | — | (13 | ) | 325 | 3 | |||||||||||||||||||||||||||||||||||||||||
|
|
|
|
|
|
|
|
|
|
|
|
|
|
|
|
|
|
|
|
|
|
|
|
|
|
|
|
|
| |||||||||||||||||||||||||||||||
Total exposures December 2021 | 592,144 | 548,474 | 43,670 | 15,736 | — | 15,736 | (4,903 | ) | (2,355 | ) | (2,548 | ) | (8,110 | ) | — | (8,110 | ) | 21,963 | 166,705 | 4,255 | ||||||||||||||||||||||||||||||||||||||||
|
|
|
|
|
|
|
|
|
|
|
|
|
|
|
|
|
|
|
|
|
|
|
|
|
|
|
|
|
| |||||||||||||||||||||||||||||||
| (*) | Includes the carrying amount of reverse repurchase agreements and positions subject to the securitisation framework. |
| (**) | The Group’s general policy is to align the concepts of default and stage 3 so that they are uniform in the field of management. However, for portfolios where IRB models are used, there may be some differences due to the use of materiality thresholds in wholesale exposures due to other prudential specifications. In any case, the Group estimates that the difference between the two concepts is not material as of December 31, 2020, since it would not exceed 1% of the exposures in default. |
Table of Contents
| BBVA. PILLAR 3 2021 | 4. RISKS | P. 66 |
During 2021 there is a reduction in debt securities derived from changes in the portfolio of financial assets issued by governments in BBVA, S.A.
In addition, the decrease in off-balance sheet exposures is mainly due to the fact that the December 2020 balances include the contribution of Group companies in the United States whose sale took place in June 2021. It should be noted that in the 2020 figures the contribution of these companies to the rest of the headings is not included as they are reclassified as “Non-current assets and disposal groups that have been classified as held for sale” until their sale.
The following table shows the credit quality of performing and non-performing exposures according to the number of past due days as of December 31, 2021 and December 31, 2020:
Table of Contents
| BBVA. PILLAR 3 2021 | 4. RISKS | P. 67 |
Table 15. EU CQ3 - Credit quality of performing and non-performing exposures by past due days (Million Euros. 12-31-2021)
| Gross carrying amount/nominal amount | ||||||||||||||||||||||||||||||||||||||||||||||||
| Performing exposures | Non-performing exposures | |||||||||||||||||||||||||||||||||||||||||||||||
| Not past due or past due ≤ 30 days | Past due > 30 days ≤ 90 days | Unlikely to pay that are not past due or are past due ≤ 90 days | Past due > 90 days ≤ 180 days | Past due > 180 days ≤ 1 year | Past due > 1 year ≤ 2 years | Past due > 2 years ≤ 5 years | Past due > 5 years ≤ 7 years | Past due > 7 years | Of which defaulted | |||||||||||||||||||||||||||||||||||||||
Cash balances at central banks and other demand deposits | 61,159 | 61,159 | — | — | — | — | — | — | — | — | — | — | ||||||||||||||||||||||||||||||||||||
Loans and advances | 334,639 | 332,811 | 1,173 | 14,693 | 8,983 | 834 | 967 | 1,437 | 2,246 | 108 | 118 | 14,693 | ||||||||||||||||||||||||||||||||||||
Central banks | 5,687 | 5,687 | — | — | — | — | — | — | — | — | — | — | ||||||||||||||||||||||||||||||||||||
General governments | 19,797 | 19,639 | 17 | 62 | 45 | — | — | — | 2 | — | 15 | 62 | ||||||||||||||||||||||||||||||||||||
Credit institutions | 13,807 | 13,807 | — | — | — | — | — | — | — | — | — | — | ||||||||||||||||||||||||||||||||||||
Other financial corporations | 9,229 | 9,228 | — | 24 | 15 | 7 | — | 1 | 1 | — | — | 24 | ||||||||||||||||||||||||||||||||||||
Non-financial corporations | 139,903 | 139,235 | 229 | 7,316 | 4,602 | 232 | 334 | 723 | 1,264 | 81 | 79 | 7,316 | ||||||||||||||||||||||||||||||||||||
Of which SMEs | 49,447 | 49,232 | 140 | 3,957 | 1,941 | 185 | 266 | 523 | 966 | 47 | 30 | 3,957 | ||||||||||||||||||||||||||||||||||||
Households | 146,216 | 145,215 | 925 | 7,291 | 4,321 | 595 | 632 | 712 | 979 | 27 | 24 | 7,291 | ||||||||||||||||||||||||||||||||||||
Debt Securities | 73,696 | 73,591 | — | 23 | 23 | — | — | — | — | — | — | 23 | ||||||||||||||||||||||||||||||||||||
Central banks | 1,712 | 1,712 | — | — | — | — | — | — | — | — | — | — | ||||||||||||||||||||||||||||||||||||
General governments | 63,541 | 63,541 | — | — | — | — | — | — | — | — | — | — | ||||||||||||||||||||||||||||||||||||
Credit institutions | 1,795 | 1,795 | — | — | — | — | — | — | — | — | — | — | ||||||||||||||||||||||||||||||||||||
Other financial corporations | 2,258 | 2,153 | — | 20 | 20 | — | — | — | — | — | — | 20 | ||||||||||||||||||||||||||||||||||||
Non-financial corporations | 4,389 | 4,389 | — | 3 | 3 | — | — | — | — | — | — | 3 | ||||||||||||||||||||||||||||||||||||
Off-balance sheet exposures | 164,487 | 962 | 962 | |||||||||||||||||||||||||||||||||||||||||||||
Central banks | 2 | — | — | |||||||||||||||||||||||||||||||||||||||||||||
General governments | 3,830 | 27 | 27 | |||||||||||||||||||||||||||||||||||||||||||||
Credit institutions | 20,694 | 2 | 2 | |||||||||||||||||||||||||||||||||||||||||||||
Other financial corporations | 6,736 | 8 | 8 | |||||||||||||||||||||||||||||||||||||||||||||
Non-financial corporations | 97,019 | 812 | 812 | |||||||||||||||||||||||||||||||||||||||||||||
Households | 36,206 | 113 | 113 | |||||||||||||||||||||||||||||||||||||||||||||
|
|
|
|
|
|
|
|
|
|
|
|
|
|
|
|
|
|
|
|
|
|
|
| |||||||||||||||||||||||||
Total exposures December 2021 | 633,980 | 467,561 | 1,173 | 15,678 | 9,006 | 834 | 967 | 1,437 | 2,246 | 108 | 118 | 15,677 | ||||||||||||||||||||||||||||||||||||
|
|
|
|
|
|
|
|
|
|
|
|
|
|
|
|
|
|
|
|
|
|
|
| |||||||||||||||||||||||||
| (*) | Includes the carrying amount of reverse repurchase agreements and positions subject to the securitisation framework. |
| (**) | As of December 31st, 2021, the table has been adapted to the new EBA ITS, notably including Cash and deposits with Central Banks as the main changes. |
Table of Contents
| BBVA. PILLAR 3 2021 | 4. RISKS | P. 68 |
EU CQ3 - Credit quality of performing and non-performing exposures by past due days (Million Euros. 12-31-2020)
| Gross carrying amount/nominal amount | ||||||||||||||||||||||||||||||||||||||||||||||||
| Performing exposures | Non-performing exposures | |||||||||||||||||||||||||||||||||||||||||||||||
| Not past due or past due ≤ 30 days | Past due > 30 days ≤ 90 days | Unlikely to pay that are not past due or are past due ≤ 90 days | Past due > 90 days ≤ 180 days | Past due > 180 days ≤ 1 year | Past due > 1 year ≤ 2 years | Past due > 2 years ≤ 5 years | Past due > 5 years ≤ 7 years | Past due > 7 years | Of which defaulted | |||||||||||||||||||||||||||||||||||||||
Loans and advances | 329,513 | 327,647 | 1,866 | 14,684 | 7,800 | 1,251 | 948 | 1,972 | 2,393 | 179 | 141 | 14,684 | ||||||||||||||||||||||||||||||||||||
Central banks | 6,229 | 6,229 | — | — | — | — | — | — | — | — | — | — | ||||||||||||||||||||||||||||||||||||
General governments | 19,447 | 19,444 | 3 | 76 | 53 | — | 1 | 2 | 3 | — | 17 | 76 | ||||||||||||||||||||||||||||||||||||
Credit institutions | 14,607 | 14,607 | — | 6 | 4 | 2 | — | — | — | — | — | 6 | ||||||||||||||||||||||||||||||||||||
Other financial corporations | 9,347 | 9,347 | — | 14 | 6 | 7 | — | — | 1 | — | — | 14 | ||||||||||||||||||||||||||||||||||||
Non-financial corporations | 135,720 | 135,310 | 410 | 7,476 | 4,102 | 322 | 413 | 995 | 1,443 | 113 | 88 | 7,476 | ||||||||||||||||||||||||||||||||||||
Of which SMEs | 50,784 | 50,590 | 194 | 4,150 | 1,714 | 246 | 269 | 655 | 1,144 | 92 | 29 | 4,150 | ||||||||||||||||||||||||||||||||||||
Households | 144,163 | 142,710 | 1,453 | 7,112 | 3,635 | 920 | 534 | 976 | 945 | 66 | 36 | 7,112 | ||||||||||||||||||||||||||||||||||||
Debt Securities | 84,765 | 84,765 | — | 20 | 17 | 3 | — | — | — | — | — | 20 | ||||||||||||||||||||||||||||||||||||
Central banks | 1,624 | 1,624 | — | — | — | — | — | — | — | — | — | — | ||||||||||||||||||||||||||||||||||||
General governments | 69,339 | 69,339 | — | — | — | — | — | — | — | — | — | — | ||||||||||||||||||||||||||||||||||||
Credit institutions | 2,064 | 2,064 | — | — | — | — | — | — | — | — | — | — | ||||||||||||||||||||||||||||||||||||
Other financial corporations | 7,429 | 7,429 | — | 19 | 16 | 3 | — | — | — | — | — | 19 | ||||||||||||||||||||||||||||||||||||
Non-financial corporations | 4,309 | 4,309 | — | 1 | 1 | — | — | — | — | — | — | 1 | ||||||||||||||||||||||||||||||||||||
Off-balance sheet exposures | 177,866 | 1,032 | 1,032 | |||||||||||||||||||||||||||||||||||||||||||||
Central banks | 125 | — | — | |||||||||||||||||||||||||||||||||||||||||||||
General governments | 3,244 | 7 | 7 | |||||||||||||||||||||||||||||||||||||||||||||
Credit institutions | 17,049 | 1 | 1 | |||||||||||||||||||||||||||||||||||||||||||||
Other financial corporations | 8,798 | — | — | |||||||||||||||||||||||||||||||||||||||||||||
Non-financial corporations | 106,978 | 917 | 917 | |||||||||||||||||||||||||||||||||||||||||||||
Households | 41,672 | 107 | 107 | |||||||||||||||||||||||||||||||||||||||||||||
|
|
|
|
|
|
|
|
|
|
|
|
|
|
|
|
|
|
|
|
|
|
|
| |||||||||||||||||||||||||
Total exposures December 2020 | 592,144 | 412,412 | 1,866 | 15,736 | 7,817 | 1,254 | 948 | 1,972 | 2,393 | 179 | 141 | 15,736 | ||||||||||||||||||||||||||||||||||||
|
|
|
|
|
|
|
|
|
|
|
|
|
|
|
|
|
|
|
|
|
|
|
| |||||||||||||||||||||||||
| (*) | Includes the carrying amount of reverse repurchase agreements and positions subject to the securitisation framework. |
Table of Contents
| BBVA. PILLAR 3 2021 | 4. RISKS | P. 69 |
The distribution of exposures by geographical area as of December 31, 2021 and December 31, 2020 are below:
Table 16. EU CQ4 - Quality of non-performing exposures by geography (Million Euros. 31-12-2021)
| Gross carrying amount(2) / nominal amount | ||||||||||||||||||||||||||||
| Of which: non performing | Of which: defaulted | Of which: subject to impairment (3) | Accumulated impairment | Provisions on off- balance sheet | Accumulated negative changes in fair value due to credit risk on non-performing exposures | |||||||||||||||||||||||
On balance expousures | 423,050 | 14,716 | 14,716 | 422,290 | (11,275 | ) | — | |||||||||||||||||||||
Spain | 194,453 | 7,822 | 7,822 | 194,280 | (4,983 | ) | — | |||||||||||||||||||||
Mexico | 71,410 | 1,939 | 1,939 | 71,190 | (2,051 | ) | — | |||||||||||||||||||||
Turkey | 42,261 | 2,697 | 2,697 | 41,966 | (1,934 | ) | — | |||||||||||||||||||||
South America | 45,317 | 1,817 | 1,817 | 45,317 | (1,888 | ) | — | |||||||||||||||||||||
Other areas (1) | 69,609 | 442 | 442 | 69,537 | (419 | ) | — | |||||||||||||||||||||
|
|
|
|
|
|
|
|
|
|
|
|
|
| |||||||||||||||
Off balance expousures | 165,448 | 962 | 962 | 691 | ||||||||||||||||||||||||
Spain | 52,051 | 655 | 655 | 261 | ||||||||||||||||||||||||
Mexico | 19,805 | 12 | 12 | 67 | ||||||||||||||||||||||||
Turkey | 14,052 | 170 | 170 | 209 | ||||||||||||||||||||||||
South America | 11,317 | 116 | 116 | 110 | ||||||||||||||||||||||||
Other areas (1) | 68,223 | 9 | 9 | 45 | ||||||||||||||||||||||||
|
|
|
|
|
|
|
|
|
|
|
| |||||||||||||||||
Total | 588,498 | 15,678 | 15,678 | 422,290 | (11,275 | ) | 691 | |||||||||||||||||||||
|
|
|
|
|
|
|
|
|
|
|
| |||||||||||||||||
| (*) | Includes the carrying amount of reverse repurchase agreements and positions subject to the securitisation framework. |
| (**) | Impairment of off-balance sheet exposures is shown as positive, in line with FINREP regulatory financial reporting models. |
| (1) | Other Countries includes mainly exposures in Europe (excluding Spain), United States and Asia. |
| (2) | Includes gross carrying amount of the “amortised cost” portfolio, the “fair value through other comprehensive income” portfolio and the “fair value through P&L” portfolios |
| (3) | Includes gross carrying amount of assets at amortised cost and assets at fair value through other comprehensive income. |
Table of Contents
| BBVA. PILLAR 3 2021 | 4. RISKS | P. 70 |
EU CQ4 - Quality of non-performing exposures by geography (Million Euros. 12-31-2020)
| Gross carrying amount(2) / nominal amount | ||||||||||||||||||||||||||||
| Of which: non performing | Of which: defaulted | Of which: subject to impairment (3) | Accumulated impairment | Provisions on off- balance sheet | Accumulated negative changes in fair value due to credit risk on non-performing exposures | |||||||||||||||||||||||
On balance expousures | 488,309 | 14,704 | 14,704 | 487,291 | (12,285 | ) | — | |||||||||||||||||||||
Spain | 239,786 | 7,826 | 7,826 | 239,651 | (5,365 | ) | — | |||||||||||||||||||||
Mexico | 73,056 | 1,791 | 1,791 | 72,846 | (2,220 | ) | — | |||||||||||||||||||||
Turkey | 50,602 | 2,842 | 2,842 | 49,998 | (2,240 | ) | — | |||||||||||||||||||||
United States | 18,043 | 32 | 32 | 17,975 | (44 | ) | — | |||||||||||||||||||||
South America | 49,521 | 1,744 | 1,744 | 49,520 | (1,997 | ) | — | |||||||||||||||||||||
Other areas (1) | 57,301 | 469 | 469 | 57,301 | (419 | ) | — | |||||||||||||||||||||
|
|
|
|
|
|
|
|
|
|
|
|
|
| |||||||||||||||
Off balance expousures | 178,898 | 1,032 | 1,032 | (728 | ) | |||||||||||||||||||||||
Spain | 52,907 | 535 | 535 | (224 | ) | |||||||||||||||||||||||
Mexico | 17,391 | 86 | 86 | (114 | ) | |||||||||||||||||||||||
Turkey | 15,480 | 210 | 210 | (246 | ) | |||||||||||||||||||||||
United States | 36,284 | 100 | 100 | (11 | ) | |||||||||||||||||||||||
South America | 10,357 | 82 | 82 | (98 | ) | |||||||||||||||||||||||
Other areas (1) | 46,479 | 19 | 19 | (35 | ) | |||||||||||||||||||||||
|
|
|
|
|
|
|
|
|
|
|
|
|
| |||||||||||||||
Total | 667,207 | 15,736 | 15,736 | 487,291 | (12,285 | ) | (728 | ) | — | |||||||||||||||||||
|
|
|
|
|
|
|
|
|
|
|
|
|
| |||||||||||||||
| (*) | Includes the carrying amount of reverse repurchase agreements and positions subject to the securitisation framework. Excluding the assets of BBVA USA and BBVA Paraguay, which are accounted for as non-current assets held for sale (see Note 1.3 of the Consolidated Financial Statements). |
| (1) | Includes all other countries not included on the previous columns. The countries with the greatest exposure in this area are: United Kingdom, France, Italy, Germany and Portugal. |
| (2) | Includes gross carrying amount of assets at amortised cost, assets at fair value through other comprehensive income and assets designated at fair value through profit and loss other than those held for trading. |
| (3) | Includes gross carrying amount of assets at amortised cost and assets at fair value through other comprehensive income. |
Table of Contents
| BBVA. PILLAR 3 2021 | 4. RISKS | P. 71 |
As of December 31, 2021, as a result of the sale of BBVA USA, exposures to counterparties located in the United States have been grouped within the “Other areas” group.
The distribution by counterparty sector of total and non-performing exposures of loans and advances, as well as their impairment, are shown below:
Table 17. EU CQ5 - Credit quality of loans and advances to non-financial corporations by industry (Million Euros. 12-31-2021)
| Gross carrying amount(1)/nominal amount | ||||||||||||||||||||||||
| Of which: non performing | Of which: defaulted | Of which: subject to impairment (2) | Accumulated impairment | Accumulated negative changes in fair value due to credit risk on non-performing exposures | ||||||||||||||||||||
Agriculture, forestry and fishing | 4,077 | 125 | 125 | 4,077 | (154 | ) | — | |||||||||||||||||
Mining and quarrying | 4,889 | 222 | 222 | 4,889 | (130 | ) | — | |||||||||||||||||
Manufacturing | 35,129 | 1,008 | 1,008 | 35,058 | (867 | ) | — | |||||||||||||||||
Electricity, gas, steam and air conditioning supply | 13,718 | 570 | 570 | 13,718 | (489 | ) | — | |||||||||||||||||
Water supply | 782 | 22 | 22 | 782 | (21 | ) | — | |||||||||||||||||
Construction | 8,336 | 896 | 896 | 8,336 | (619 | ) | — | |||||||||||||||||
Wholesale and retail trade | 25,856 | 1,312 | 1,312 | 25,856 | (1,104 | ) | — | |||||||||||||||||
Transport and storage | 10,310 | 879 | 879 | 10,310 | (400 | ) | — | |||||||||||||||||
Accommodation and food service activities | 7,693 | 470 | 470 | 7,693 | (405 | ) | — | |||||||||||||||||
Information and communication | 6,827 | 118 | 118 | 6,533 | (56 | ) | — | |||||||||||||||||
Real estate activities | 9,511 | 719 | 719 | 9,438 | (466 | ) | — | |||||||||||||||||
Financial activities and insurance | 6,236 | 210 | 210 | 6,236 | (181 | ) | — | |||||||||||||||||
Professional, scientific and technical activities | 3,910 | 185 | 185 | 3,910 | (152 | ) | — | |||||||||||||||||
Administrative and support service activities | 3,049 | 185 | 185 | 3,049 | (132 | ) | — | |||||||||||||||||
Public administration and defence, compulsory social security | 203 | 9 | 9 | 203 | (11 | ) | — | |||||||||||||||||
Education | 582 | 43 | 43 | 582 | (34 | ) | — | |||||||||||||||||
Human health services and social work activities | 1,888 | 48 | 48 | 1,888 | (41 | ) | — | |||||||||||||||||
Arts, entertainment and recreation | 1,011 | 209 | 209 | 1,011 | (95 | ) | — | |||||||||||||||||
Other services | 3,211 | 84 | 84 | 3,211 | (445 | ) | — | |||||||||||||||||
|
|
|
|
|
|
|
|
|
|
|
| |||||||||||||
Total | 147,219 | 7,316 | 7,316 | 146,781 | (5,801 | ) | — | |||||||||||||||||
|
|
|
|
|
|
|
|
|
|
|
| |||||||||||||
| (*) | Includes the carrying amount of reverse repurchase agreements and positions subject to the securitisation framework. |
| (1) | Includes gross carrying amount of the “amortised cost” portfolio, the “fair value through other comprehensive income” portfolio and the “fair value through P&L” portfolios |
| (2) | Includes gross carrying amount of assets at amortised cost and assets at fair value through other comprehensive income. |
Table of Contents
| BBVA. PILLAR 3 2021 | 4. RISKS | P. 72 |
EU CQ5 - Credit quality of loans and advances to non-financial corporations by activity sector (Million Euros. 12-31-2020)
| Gross carrying amount(1)/nominal amount | ||||||||||||||||||||||||
| Of which: non performing | Of which: defaulted | Of which: subject to impairment (2) | Accumulated impairment | Accumulated negative changes in fair value due to credit risk on non-performing exposures | ||||||||||||||||||||
Agriculture, forestry and fishing | 3,438 | 132 | 132 | 3,438 | (108 | ) | — | |||||||||||||||||
Mining and quarrying | 4,349 | 47 | 47 | 4,349 | (59 | ) | — | |||||||||||||||||
Manufacturing | 33,811 | 1,487 | 1,487 | 33,770 | (1,129 | ) | — | |||||||||||||||||
Electricity, gas, steam and air conditioning supply | 13,490 | 591 | 591 | 13,490 | (509 | ) | — | |||||||||||||||||
Water supply | 899 | 17 | 17 | 899 | (15 | ) | — | |||||||||||||||||
Construction | 10,021 | 1,397 | 1,397 | 10,019 | (722 | ) | — | |||||||||||||||||
Wholesale and retail trade | 24,593 | 1,456 | 1,456 | 24,593 | (1,222 | ) | — | |||||||||||||||||
Transport and storage | 8,117 | 489 | 489 | 8,117 | (368 | ) | — | |||||||||||||||||
Accommodation and food service activities | 8,337 | 358 | 358 | 8,337 | (294 | ) | — | |||||||||||||||||
Information and communication | 6,179 | 73 | 73 | 5,764 | (60 | ) | — | |||||||||||||||||
Real estate activities | 10,099 | 617 | 617 | 10,025 | (494 | ) | — | |||||||||||||||||
Financial activities and insurance | 5,289 | 123 | 123 | 5,289 | (132 | ) | — | |||||||||||||||||
Professional, scientific and technical activities | 2,895 | 177 | 177 | 2,886 | (124 | ) | — | |||||||||||||||||
Administrative and support service activities | 4,031 | 142 | 142 | 4,031 | (192 | ) | — | |||||||||||||||||
Public administration and defence, compulsory social security | 129 | 5 | 5 | 129 | (4 | ) | — | |||||||||||||||||
Education | 665 | 54 | 54 | 665 | (43 | ) | — | |||||||||||||||||
Human health services and social work activities | 1,812 | 67 | 67 | 1,812 | (59 | ) | — | |||||||||||||||||
Arts, entertainment and recreation | 1,131 | 46 | 46 | 1,131 | (65 | ) | — | |||||||||||||||||
Other services | 3,911 | 198 | 198 | 3,911 | (521 | ) | — | |||||||||||||||||
|
|
|
|
|
|
|
|
|
|
|
| |||||||||||||
Total | 143,196 | 7,476 | 7,476 | 142,655 | (6,120 | ) | — | |||||||||||||||||
|
|
|
|
|
|
|
|
|
|
|
| |||||||||||||
| (*) | Includes the carrying amount of reverse repurchase agreements and positions subject to the securitisation framework. Excluding the assets of BBVA USA and BBVA Paraguay, which are accounted for as non-current assets held for sale (see Note 1.3 of the Consolidated Financial Statements). |
| (1) | Includes gross carrying amount of assets at amortised cost, assets at fair value through other comprehensive income and assets designated at fair value through profit and loss other than those held for trading. |
| (2) | Includes gross carrying amount of assets at amortised cost and assets at fair value through other comprehensive income. |
Table of Contents
| BBVA. PILLAR 3 2021 | 4. RISKS | P. 73 |
The distribution of the gross book value of performing and non-performing exposures of loans and debt securities by residual maturity is presented below. The accounting values as of December 31, 2021 are presented:
Table 18. EU CR1-A - Maturity of exposures
Value of net exposure | ||||||||||||
On demand | ≤ 1 | > 1 year ≤ 5 year | > 5 year | No stated | Total | |||||||
Loans and advances | 3,161 | 131,370 | 101,019 | 153,524 | — | 389,075 | ||||||
Debt securities | — | 19,876 | 46,539 | 31,346 | 1,251 | 99,012 | ||||||
|
|
|
|
|
| |||||||
Total | 3,161 | 151,247 | 147,558 | 184,870 | 1,251 | 488,087 | ||||||
|
|
|
|
|
| |||||||
Until December 2020, the maturity of the exposures were published broken down by COREP regulatory categories in the EU CRB-E table in accordance with the EBA guidelines EBA/GL/2016/11. As of December 31, 2021, the EU CRB-E table has been replaced by the present EU CR1-A table, as a result of the update to the New EBA ITS.
The changes of non performing exposures between December 31, 2020 and December 31, 2021 is shown below in the following tables:
Table 19. EU CR2 - Changes in the balance of loans and debt securities in default and impaired (Million Euros)
| Gross book value of defaulted exposures | ||||
Opening balance as at December 2020 (1) | 15,478 | |||
Loans and debt securities that have defaulted or whose value has deteriorated since the last reporting period | 4,235 | |||
Reclassification to non-default status | (2,000 | ) | ||
Amounts recognized as write-offs | (1,918 | ) | ||
Other changes (2) | 1,205 | |||
|
| |||
Closing balance as at June 2021 | 17,000 | |||
|
| |||
| (1) | Excludes off-balance loan commitments granted |
| (2) | Other changes include the impact of the new definition of default recorded during the first half of 2021 for standardised credit risk exposures. |
| Gross book value of defaulted exposures | ||||
Opening balance as at June 2021 | 17,000 | |||
Loans and debt securities that have defaulted or whose value has deteriorated since the last reporting period | 3,058 | |||
Reclassification to non-default status | (2,565 | ) | ||
Amounts recognized as write-offs | (1,679 | ) | ||
Other changes (1) | (137 | ) | ||
|
| |||
Closing balance as at December 2021 | 15,677 | |||
|
| |||
| (1) | Includes the impact of the new definition of default recorded during the second half of 2021 for IRB credit risk exposures. |
The Group estimates that the update in the definition of credit impairment (default) led to an increase of €1,262 million in impaired financial assets. Regarding expected credit losses, the impact of this change is not considered to be significant, since most of the affected operations were previously classified within stage 2 and, consequently, their credit risk coverage already correspond to the expected credit losses throughout the expected lifetime of the operation.
A table with a general overview of forborne exposures is shown below, which includes the amounts as of December 31, 2021 and the main figures as of December 31, 2020:
Table of Contents
| BBVA. PILLAR 3 2021 | 4. RISKS | P. 74 |
Table 20. EU CQ1 - Credit quality of forborne exposures (Million Euros. 12-31-2021)
| Gross carrying amount/nominal amount of exposures with forbearance measures | Accumulated impairment, accumulated negative changes in fair value due to credit risk and | Collateral received and financial | ||||||||||||||||||||||||||||||
| Non-performing forborne | provisions | exposures | ||||||||||||||||||||||||||||||
| Performing forborne | Of which defaulted | Of which impaired | On performing forborne exposures | On non- performing forborne exposures | Of which collateral and financial guarantees received on non- performing exposures with forbearance measures | |||||||||||||||||||||||||||
Cash balances at central banks and other demand deposits (1) | — | — | — | — | — | — | — | — | ||||||||||||||||||||||||
Loans and advances | 8,736 | 9,212 | 9,212 | 9,200 | (801 | ) | (4,033 | ) | 7,992 | 3,187 | ||||||||||||||||||||||
Central banks | — | — | — | — | — | — | — | — | ||||||||||||||||||||||||
General governments | 47 | 38 | 38 | 38 | (1 | ) | (10 | ) | 15 | 6 | ||||||||||||||||||||||
Credit institutions | — | — | — | — | — | — | — | — | ||||||||||||||||||||||||
Other financial corporations | 17 | 9 | 9 | 9 | — | (4 | ) | 21 | 4 | |||||||||||||||||||||||
Non-financial corporations | 4,436 | 5,217 | 5,217 | 5,205 | (531 | ) | (2,491 | ) | 3,170 | 1,242 | ||||||||||||||||||||||
Households | 4,236 | 3,947 | 3,947 | 3,947 | (268 | ) | (1,529 | ) | 4,786 | 1,935 | ||||||||||||||||||||||
Debt Securities | — | — | — | — | — | — | — | — | ||||||||||||||||||||||||
Loan commitments given | 364 | 34 | 34 | 34 | 16 | 4 | — | — | ||||||||||||||||||||||||
|
|
|
|
|
|
|
|
|
|
|
|
|
|
|
| |||||||||||||||||
Total exposures December 2021 | 9,101 | 9,246 | 9,246 | 9,234 | (786 | ) | (4,029 | ) | 7,992 | 3,187 | ||||||||||||||||||||||
|
|
|
|
|
|
|
|
|
|
|
|
|
|
|
| |||||||||||||||||
| (*) | Includes the carrying amount of reverse repurchase agreements and positions subject to the securitisation framework. |
| (1) | As of December 31, 2021, the table has been adapted to the New EBA ITS, the main modifications being the inclusion of Cash balances at central banks and other demand deposits |
EU CQ1 - Credit quality of forborne exposures (Million Euros. 12-31-2020)
| Gross carrying amount/ nominal amount of exposures with forbearance measures | Accumulated impairment, accumulated negative changes in fair value due to credit risk and | Collateral received and financial guarantees received on forborne | ||||||||||||||||||||||||||||||
| Non-performing forborne | provisions | exposures | ||||||||||||||||||||||||||||||
| Performing forborne | Of which defaulted | Of which impaired | On performing forborne exposures | On non- performing forborne exposures | Of which collateral and financial guarantees received on non- performing exposures with forbearance measures | |||||||||||||||||||||||||||
Loans and advances | 7,659 | 9,040 | 9,040 | 9,040 | (759 | ) | (4,100 | ) | 7,408 | 3,149 | ||||||||||||||||||||||
Central banks | — | — | — | — | — | — | — | — | ||||||||||||||||||||||||
General governments | 83 | 56 | 56 | 56 | (3 | ) | (12 | ) | 45 | 14 | ||||||||||||||||||||||
Credit institutions | — | — | — | — | — | — | — | — | ||||||||||||||||||||||||
Other financial corporations | 2 | 2 | 2 | 2 | — | — | 1 | — | ||||||||||||||||||||||||
Non-financial corporations | 2,996 | 5,023 | 5,023 | 5,023 | (372 | ) | (2,566 | ) | 2,638 | 1,158 | ||||||||||||||||||||||
Households | 4,578 | 3,959 | 3,959 | 3,959 | (384 | ) | (1,522 | ) | 4,724 | 1,977 | ||||||||||||||||||||||
Debt Securities | — | — | — | — | — | — | — | — | ||||||||||||||||||||||||
Loan commitments given | 182 | 57 | 57 | 57 | (4 | ) | (4 | ) | 1 | 1 | ||||||||||||||||||||||
|
|
|
|
|
|
|
|
|
|
|
|
|
|
|
| |||||||||||||||||
Total exposures December 2020 | 7,841 | 9,097 | 9,097 | 9,097 | (763 | ) | (4,104 | ) | 7,409 | 3,150 | ||||||||||||||||||||||
|
|
|
|
|
|
|
|
|
|
|
|
|
|
|
| |||||||||||||||||
| (*) | Includes the carrying amount of reverse repurchase agreements and positions subject to the securitisation framework. |
Table of Contents
| BBVA. PILLAR 3 2021 | 4. RISKS | P. 75 |
The amounts of collateral obtained by taking possession and execution processes as of December 31, 2021 and December, 31 2020 are shown below, differenciating property, plant and equipment from other collateral:
Table 21. EU CQ7 - Collateral obtained by taking possession and execution processes (Million Euros)
| 31-12-2021 | 31-12-2020 | |||||||||||||||
| Collateral obtained | Collateral obtained | |||||||||||||||
| Value at initial | Accumulated | Value at initial | Accumulated | |||||||||||||
| recognition(1) | negative changes(2) | recognition(1) | negative changes(2) | |||||||||||||
Property, plant and equipment (PP&E) | — | — | — | — | ||||||||||||
Other than PP&E | 2,140 | (948 | ) | 3,028 | �� | (853 | ) | |||||||||
Residential immovable property | 1,369 | (522 | ) | 1,504 | (371 | ) | ||||||||||
Commercial Immovable property | 344 | (139 | ) | 367 | (135 | ) | ||||||||||
Movable property (auto, shipping, etc.) | 9 | (7 | ) | 23 | (11 | ) | ||||||||||
Equity and debt instruments | 412 | (278 | ) | 1,074 | (279 | ) | ||||||||||
Other | 6 | (2 | ) | 60 | (57 | ) | ||||||||||
|
|
|
|
|
|
|
| |||||||||
Total | 2,140 | (948 | ) | 3,028 | (853 | ) | ||||||||||
|
|
|
|
|
|
|
| |||||||||
| (1) | Value at initial recognition: the gross carrying amount of the collateral obtained by taking possession at initial recognition. |
| (2) | Cumulative negative changes: cumulative impairment or negative cumulative changes in the value of collateral initially recognised. |
4.2.3.3. Public guarantees and moratorium programmes in response to COVID-19 crisis
Since the beginning of the pandemic, the Group offered COVID-19 support measures to its customers (individuals, SMEs and wholesale) in all the geographic areas where it operates, consisting of both deferrals on existing loans and new public-guaranteed lending. These measures were extended to individual customers and, in the case of legal entities, to different sectors, with Leisure and Real Estate being the sectors that have used them most. Deferral support schemes have expired in all geographical areas.
Deferrals were both legislative (based on national laws) and non-legislative (based on sectorial or individual schemes) and were aimed at mitigating the effects of COVID-19 and deferring the payment of principal and/or interest, while maintaining the original contracts. The detail of legislative deferrals by geographical area is as follows:
Spain:
| • | Mainly covered by Royal Decree Laws (hereinafter “RDL”) 8/2020 and 11/2020, as well as by the sector agreement promoted by the Spanish Banking Association (hereinafter “AEB”) to which BBVA adhered. |
| • | Legislative deferrals consisted of a three-month deferral of principal and interest payments and were aimed, by type of client, at individuals, sole proprietors or the self-employed and, by type of |
product, at mortgages, personal loans or consumer loans.
| • | In addition, once the legal deferral expired, customers could adhere to the sector agreement for the remaining term up to the limit established in that agreement. |
| • | Deferrals granted under the AEB sectorial agreement had a duration of up to 12 months of principal deferral in the case of mortgage loans and up to 6 months in personal loans. |
| • | Under RDL 26/2020, the possibility of deferring the principal and/or interests was offered for companies in the transport sector for up to 6 months and for companies in the tourism sector for up to 12 months. |
Mexico:,
| • | The National Banking and Securities Commission (hereinafter, “CNBV”) published the official records P285/2020 dated March 26, 2020 and P293/2020 dated April 15, 2020, allowing the granting of deferrals on principal and interest for a term of 4 months, extendable for 2 months more. The main beneficiaries of these measures were individuals and companies, impacting mortgage loans, personal loans and consumer loans, including credit cards. |
Turkey:
| • | The Banking Regulation and Supervisory Agency (hereinafter, “BRSA”) instructed banks to support customers through deferrals, consisting of deferring payments for a period of |
Table of Contents
| BBVA. PILLAR 3 2021 | 4. RISKS | P. 76 |
3 months, with a potential extension of up to 6 months. These support measures were granted to individual customers.
Colombia:
| • | The binding legislation for deferrals is provided by the Financial Superintendence of Colombia, specifically by its Circulars 07/2020 and 14/2020, as well as Resolution No. 385. The deferrals offered consisted of the deferral of principal and interest payments for up to 6 months. |
Peru:
| • | Several measures were approved by the Superintendence of Banking and Insurance (SBS) of Peru, allowing the deferral of principal and interest payments, initially for up to 6 months and later extended for up to 12 months, mainly for individuals, self-employed and small companies. |
Argentina:
| • | Based on state legislation such as Royal Decree 544/2020 or Decree 319/2020, as well as on various regulations from the Central Bank. Deferral for up to 3 months of principal and interest. |
With regard to new financing with public guarantees, the Group’s involvement in the following is noteworthy:
Spain:
| • | The Official Credit Institute (hereinafter, ICO) published several aid programs aimed at the self-employed, small and medium-sized enterprises (hereinafter “SMEs”) and companies, through which a guarantee of between 60% and 80% (in SMEs always 80%) was granted for a term of up to 5 years for new financing granted (RDL Mar/2020). |
| • | The amount and duration of the guarantee depended on the size of the company and the type of aid to which it applied, and could be extended for up to a maximum term of 3 additional years and the grace period could be extended for up to 12 additional months with respect to the terms and grace periods initially agreed (RDL Nov/2020). |
| • | Likewise, facilities were provided in term extensions (up to a maximum term of 10 years), conversion of financing operations into Participative Loans as well as debt forgiveness in part of the financing (RDL 5/2021 and Code of Good Practices). |
| • | The ICO has also subsidized for individuals the amount of the rent for up to 6 months in loans of up to 6 years. |
| • | Almost all of the ICO loans with the expired grace period have resumed payment on a regular basis or canceled their debt. |
| • | ICO loan extensions represented around 25% of all ICO financing. |
Turkey:
| • | Public support programs have been registered guaranteeing up to 80% of loans to companies for a term of 1 year. |
Colombia:
| • | Different public support programs (FNG, Bancoldex, Finagro, Findeter) provide for guarantees covering between 50-90%. |
Peru:
| • | There were public support programs such as Reactiva, Crecer or FAE aimed at companies and micro-enterprises with guaranteed amounts ranging from 60% to 98%, depending on the program and the type of company. |
| • | For loans granted under the Reactiva program, it was possible to extend both the maturity date and the grace period of the loans. |
Argentina:
| • | Guarantees of up to 100% for micro-SMEs or self-employed and up to 25% for other companies in loans of up to 1 year. |
Information about public guarantees and moratorium schemes, introduced by the governments in response to COVID-19 crisis as of December 31, 2021 and as of December 31, 2020 is shown below.
Table of Contents
| BBVA. PILLAR 3 2021 | 4. RISKS | P. 77 |
Table 22. Information on loans and advances subject to to legislative and non-legislative moratoria (Million Euros. 12-31-2021)
| Gross carrying amount | Accumulated impairment, accumulated negative changes in fair value due to credit risk | Gross carrying amount | ||||||||||||||||||||||||||||||||||||||||||||||||||||||||||
| Performing | Non performing |
| Performing | Non performing | ||||||||||||||||||||||||||||||||||||||||||||||||||||||||
| Of which: exposures with forbearance measures | Of which: Instruments with significant increase in credit risk since initial recognition but not credit- impaired (Stage 2) | Of which: exposures with forbearance measures | Of which: Unlikely to pay that are not past-due or past-due <= 90 days | Of which:exposures with forbearance measures | Of which: Instruments with significant increase in credit risk since initial recognition but not credit- impaired (Stage 2) | Of which:exposures with forbearance measures | Of which: Unlikely to pay that are not past-due or past-due <= 90 days | Inflows to non- performing exposures | ||||||||||||||||||||||||||||||||||||||||||||||||||||
Loans and advances subject to moratorium |
| 189 |
|
| 169 |
|
| 60 |
|
| 122 |
|
| 20 |
|
| 13 |
|
| 18 |
|
| (23 | ) |
| (19 | ) |
| (6 | ) |
| (19 | ) |
| (4 | ) |
| (2 | ) |
| (3 | ) |
| 3 |
| |||||||||||||||
of which: Households | 107 | 90 | 11 | 46 | 17 | 12 | 17 | (12 | ) | (10 | ) | — | (10 | ) | (2 | ) | (2 | ) | (2 | ) | 1 | |||||||||||||||||||||||||||||||||||||||
of which: Collateralised by residential immovable property | 97 | 81 | 9 | 42 | 16 | 11 | 15 | (11 | ) | (10 | ) | — | (10 | ) | (2 | ) | (1 | ) | (2 | ) | 1 | |||||||||||||||||||||||||||||||||||||||
of which: Non-financial corporations | 82 | 79 | 49 | 76 | 3 | 1 | 2 | (11 | ) | (9 | ) | (5 | ) | (9 | ) | (2 | ) | — | (1 | ) | 2 | |||||||||||||||||||||||||||||||||||||||
of which: Small and Medium-sized Corporates | 44 | 42 | 22 | 40 | 2 | 1 | 2 | (7 | ) | (6 | ) | (5 | ) | (6 | ) | (1 | ) | — | (1 | ) | 1 | |||||||||||||||||||||||||||||||||||||||
of which: Collateralised by commercial immovable property | 50 | 49 | 22 | 48 | 1 | 1 | 1 | (7 | ) | (7 | ) | (3 | ) | (7 | ) | — | — | — | 1 | |||||||||||||||||||||||||||||||||||||||||
Information on loans and advances subject to to legislative and non-legislative moratoria (Million Euros. 12-31-2020)
| Gross carrying amount | Accumulated impairment, accumulated negative changes in fair value due to credit risk | Gross carrying amount | ||||||||||||||||||||||||||||||||||||||||||||||||||||||||||
| Performing | Non performing |
| Performing | Non performing | ||||||||||||||||||||||||||||||||||||||||||||||||||||||||
| Of which: exposures with forbearance measures | Of which: Instruments with significant increase in credit risk since initial recognition but not credit- impaired (Stage 2) | Of which: exposures with forbearance measures | Of which: Unlikely to pay that are not past-due or past-due <= 90 days | Of which:exposures with forbearance measures | Of which: Instruments with significant increase in credit risk since initial recognition but not credit- impaired (Stage 2) | Of which:exposures with forbearance measures | Of which: Unlikely to pay that are not past-due or past-due <= 90 days | Inflows to non- performing exposures | ||||||||||||||||||||||||||||||||||||||||||||||||||||
Loans and advances subject to moratorium | 6,803 | 6,265 | 1,311 | 3,049 | 538 | 488 | 502 | (582 | ) | (457 | ) | (257 | ) | (427 | ) | (126 | ) | (104 | ) | (106 | ) | 59 | ||||||||||||||||||||||||||||||||||||||
of which: Households | 4,657 | 4,179 | 614 | 1,874 | 478 | 447 | 464 | (267 | ) | (166 | ) | (42 | ) | (149 | ) | (100 | ) | (86 | ) | (91 | ) | 35 | ||||||||||||||||||||||||||||||||||||||
of which: Collateralised by residential immovable property | 3,664 | 3,248 | 441 | 1,421 | 417 | 406 | 411 | (169 | ) | (93 | ) | (24 | ) | (88 | ) | (76 | ) | (74 | ) | (74 | ) | 21 | ||||||||||||||||||||||||||||||||||||||
of which: Non-financial corporations | 2,086 | 2,026 | 697 | 1,175 | 60 | 41 | 37 | (315 | ) | (290 | ) | (215 | ) | (278 | ) | (26 | ) | (18 | ) | (15 | ) | 25 | ||||||||||||||||||||||||||||||||||||||
of which: Small and Medium- sized Corporates | 1,031 | 983 | 217 | 544 | 48 | 34 | 30 | (145 | ) | (126 | ) | (70 | ) | (118 | ) | (19 | ) | (15 | ) | (11 | ) | 21 | ||||||||||||||||||||||||||||||||||||||
of which: Collateralised by commercial immovable property | 918 | 886 | 213 | 416 | 31 | 21 | 22 | (101 | ) | (92 | ) | (60 | ) | (86 | ) | (9 | ) | (6 | ) | (6 | ) | 10 | ||||||||||||||||||||||||||||||||||||||
Table of Contents
| BBVA. PILLAR 3 2021 | 4. RISKS | P. 78 |
Table 23. Breakdown of loans and advances subject to legislative and non-legislative moratoria by residual maturity of moratoria (Million Euros. 12-31-2021)
| Gross carrying amount | ||||||||||||||||||||||||||||||||||||
Number of obligors | Of which: legislative | Of which: expired | Residual maturity of moratoria | |||||||||||||||||||||||||||||||||
| <= 3 months | > 3 months <= 6 months | > 6 months <= 9 months | > 9 months <= 12 months | > 1 year | ||||||||||||||||||||||||||||||||
Loans and advances for which moratorium was offered | 2,230,390 | 24,392 | ||||||||||||||||||||||||||||||||||
Loans and advances subject to moratorium (granted) | 2,188,720 | 21,931 | 19,116 | 21,743 | 152 | 2 | — | 33 | 1 | |||||||||||||||||||||||||||
of which: Households | 15,011 | 12,213 | 14,904 | 105 | — | — | 2 | — | ||||||||||||||||||||||||||||
of which: Collateralised by residential immovable property | 10,291 | 7,848 | 10,195 | 94 | — | — | 2 | — | ||||||||||||||||||||||||||||
of which: Non-financial corporations | 6,798 | 6,781 | 6,716 | 47 | 1 | — | 31 | 1 | ||||||||||||||||||||||||||||
of which: Small and Medium-sized Corporates | 3,994 | 3,987 | 3,950 | 11 | — | — | 31 | 1 | ||||||||||||||||||||||||||||
of which: Collateralised by commercial immovable property | 1,573 | 1,556 | 1,523 | 18 | — | — | 31 | — | ||||||||||||||||||||||||||||
Breakdown of loans and advances subject to legislative and non-legislative moratoria by residual maturity of moratoria (Million Euros. 12-31-2020)
| _ | Gross carrying amount | |||||||||||||||||||||||||||||||||||
Number of obligors | Of which: legislative | Of which: expired | Residual maturity of moratoria | |||||||||||||||||||||||||||||||||
| <= 3 months | > 3 months <= 6 months | > 6 months <= 9 months | > 9 months <= 12 months | > 1 year | ||||||||||||||||||||||||||||||||
Loans and advances for which moratorium was offered | 2,866,628 | 35,150 | ||||||||||||||||||||||||||||||||||
Loans and advances subject to moratorium (granted) | 2,843,977 | 33,828 | 30,101 | 27,025 | 3,173 | 1,987 | 1,415 | 213 | 15 | |||||||||||||||||||||||||||
of which: Households | 21,333 | 17,628 | 16,676 | 1,835 | 1,612 | 1,113 | 98 | — | ||||||||||||||||||||||||||||
of which: Collateralised by residential immovable property | 12,387 | 9,148 | 8,723 | 1,005 | 1,490 | 1,074 | 95 | — | ||||||||||||||||||||||||||||
of which: Non-financial corporations | 12,237 | 12,217 | 10,151 | 1,309 | 357 | 289 | 115 | 15 | ||||||||||||||||||||||||||||
of which: Small and Medium-sized Corporates | 6,087 | 6,086 | 5,056 | 644 | 94 | 199 | 85 | 9 | ||||||||||||||||||||||||||||
of which: Collateralised by commercial immovable property | 2,511 | 2,503 | 1,593 | 548 | 38 | 228 | 92 | 12 | ||||||||||||||||||||||||||||
Table of Contents
| BBVA. PILLAR 3 2021 | 4. RISKS | P. 79 |
Table 24. Information on new loans and advances subject to public guarantee schemes introduced in response to the COVID-19 crisis (Million Euros. 12-31-2021)
| Maximum amount of collateral that | Gross carrying | |||||||||||||||
| Gross carrying amount | can be considered | amount | ||||||||||||||
| of which: forborne | Public guarantees received | Inflows to non-performing exposures | ||||||||||||||
Newly originated loans and advances subject to public guarantee schemes | 16,093 | 471 | 12,560 | 275 | ||||||||||||
of which: Households | 1,376 | 20 | ||||||||||||||
of which: Collateralised by residential immovable property | 6 | — | ||||||||||||||
of which: Non-financial corporations | 14,700 | 464 | 11,454 | 254 | ||||||||||||
of which: Small and medium-sized Corporates | 10,911 | 211 | ||||||||||||||
of which: Collateralised by commercial immovable property | 8 | 1 | ||||||||||||||
Information on new loans and advances subject to public guarantee schemes introduced in response to the COVID-19 crisis (Million Euros. 12-31-2020)
| Maximum amount of collateral that | Gross carrying | |||||||||||||||
| Gross carrying amount | can be considered | amount | ||||||||||||||
| of which: forborne | Public guarantees received | Inflows to non-performing exposures | ||||||||||||||
Newly originated loans and advances subject to public guarantee schemes | 18,619 | 170 | 15,242 | 60 | ||||||||||||
of which: Households | 1,237 | 3 | ||||||||||||||
of which: Collateralised by residential immovable property | 1 | — | ||||||||||||||
of which: Non-financial corporations | 17,303 | 168 | 14,163 | 57 | ||||||||||||
of which: Small and medium-sized Corporates | 11,373 | 39 | ||||||||||||||
of which: Collateralised by commercial immovable property | 4 | — | ||||||||||||||
4.2.4. Information on the standardised approach
4.2.4.1. Identification of external rating agencies
The external credit assessment institutions (ECAIs) appointed by the Group to determine the risk weightings applicable to its exposure are as follows: Standard&Poors, Moodys, Fitch and DBRS.
The ratings of ECAI are used for exposures to wholesale portfolios, basically those involving “Sovereigns and central banks” in developed countries, and “Financial Institutions”.
In cases where a counterparty has ratings from different ECAIs, the Group follows the procedure laid down in Article 138 of the Solvency Regulations, which specifies the order of priority to be used in the assignment of ratings.
When two different credit ratings made by designated ECAIs are available for a rated exposure, the higher risk weighting will be applied. However, when there are more than two credit ratings for the same rated exposure, use is to be made of the two credit ratings that provide the lowest risk weightings. If the two lowest risk weightings
coincide, then that weighting will be applied; if they do not coincide, the higher of the two will be applied.
The correspondence between the alphanumeric scale of each agency used and the risk categories used by the Group are defined in the Final Draft Implementing Technical Standards on the mapping of ECAIs credit assessment under Article 136(1) and (3) of Regulation (EU) No. 575/2013; complying with the provisions of Article 136 of the CRR.
4.2.4.2. Assignment of the credit ratings to public share issues
The number of cases and the amount of these assignments are not relevant for the Group in terms of credit admission and issuer risk management.
4.2.4.3. Exposure values before and after the application of credit risk mitigation techniques
The original exposure net of value adjustments and provisions, exposure after risk mitigation techniques, and RWA density for each exposure category, according to
Table of Contents
| BBVA. PILLAR 3 2021 | 4. RISKS | P. 80 |
the standardised approach, are shown below, excluding securitisation and counterparty credit risk exposure:
Table of Contents
| BBVA. PILLAR 3 2021 | 4. RISKS | P. 81 |
Table 25. EU CR4 - Standardised approach - credit risk exposure and credit risk mitigation effects (Million Euros. 12-31-2021)
| Exposures before CCF and | ||||||||||||||||||||||||
| CRM(1) | Exposures post-CCF and CRM(2) | RWA(3) and RWA Density | ||||||||||||||||||||||
Exposure Class | On-balance sheet amount | Off-balance sheet amount | On-balance sheet amount | Off-balance sheet amount | RWA | RWA Density | ||||||||||||||||||
Central governments or central banks | 126,752 | 979 | 157,250 | 2,925 | 30,094 | 19 | % | |||||||||||||||||
Regional governments or local authorities | 5,255 | 1,179 | 1,304 | 675 | 1,188 | 60 | % | |||||||||||||||||
Public sector entities | 615 | 769 | 610 | 262 | 846 | 97 | % | |||||||||||||||||
Multilateral development banks | 104 | — | 104 | — | 6 | 6 | % | |||||||||||||||||
International Organisations | — | — | — | — | — | — | ||||||||||||||||||
Institutions | 9,640 | 17,439 | 9,751 | 1,674 | 4,863 | 43 | % | |||||||||||||||||
Corporates | 36,166 | 11,382 | 33,745 | 6,020 | 37,525 | 94 | % | |||||||||||||||||
Retail | 45,470 | 18,828 | 38,476 | 2,404 | 28,508 | 70 | % | |||||||||||||||||
Secured by mortgages on immovable property | 24,062 | 269 | 23,893 | 142 | 8,637 | 36 | % | |||||||||||||||||
Exposures in default | 3,190 | 267 | 3,040 | 127 | 3,483 | 110 | % | |||||||||||||||||
Exposures associated with particularly high risk | 2,366 | 484 | 2,238 | 164 | 3,602 | 150 | % | |||||||||||||||||
Covered bonds | — | — | — | — | — | — | ||||||||||||||||||
Institutions and corporates with a short term credit assessment | — | — | — | — | — | 93 | % | |||||||||||||||||
Collective Investment Undertakings | — | 1 | — | 1 | 1 | 100 | % | |||||||||||||||||
Equity | — | — | — | — | — | — | ||||||||||||||||||
Other Items | 18,457 | — | 18,726 | 69 | 10,987 | 58 | % | |||||||||||||||||
|
|
|
|
|
|
|
|
|
|
|
| |||||||||||||
Total | 272,077 | 51,598 | 289,137 | 14,461 | 129,741 | 43 | % | |||||||||||||||||
|
|
|
|
|
|
|
|
|
|
|
| |||||||||||||
| (1) | Net OE: original exposure net of value adjustments and provisions |
| (2) | EAD: original exposure net of value adjustments and provisions after CRM and CCF |
| (3) | RWAs: EAD after risk-weighting |
EU CR4 - Standardised approach - credit risk exposure and credit risk mitigation effects (Million Euros. 12-31-2020)
| Exposures before CCF and | ||||||||||||||||||||||||
| CRM(1) | Exposures post-CCF and CRM(2) | RWA(3) and RWA Density | ||||||||||||||||||||||
Exposure Class | On-balance sheet amount | Off-balance sheet amount | On-balance sheet amount | Off-balance sheet amount | RWA | RWA Density | ||||||||||||||||||
Central governments or central banks | 159,908 | 3,740 | 202,956 | 2,709 | 29,227 | 14 | % | |||||||||||||||||
Regional governments or local authorities | 18,791 | 857 | 6,880 | 326 | 2,316 | 32 | % | |||||||||||||||||
Public sector entities | 1,195 | 298 | 1,525 | 157 | 690 | 41 | % | |||||||||||||||||
Multilateral development banks | 232 | 38 | 302 | — | 7 | 2 | % | |||||||||||||||||
International Organisations | — | — | — | — | — | — | ||||||||||||||||||
Institutions | 12,604 | 13,851 | 12,698 | 1,661 | 7,014 | 49 | % | |||||||||||||||||
Corporates | 69,279 | 31,594 | 62,616 | 15,388 | 75,828 | 97 | % | |||||||||||||||||
Retail | 53,759 | 26,629 | 46,005 | 2,979 | 34,337 | 70 | % | |||||||||||||||||
Secured by mortgages on immovable property | 34,472 | 218 | 34,433 | 180 | 12,769 | 37 | % | |||||||||||||||||
Exposures in default | 3,911 | 172 | 3,847 | 112 | 4,480 | 113 | % | |||||||||||||||||
Exposures associated with particularly high risk | 3,104 | 426 | 2,988 | 137 | 4,687 | 150 | % | |||||||||||||||||
Covered bonds | — | — | — | — | — | — | ||||||||||||||||||
Institutions and corporates with a short term credit assessment | 1 | — | 1 | — | 1 | 87 | % | |||||||||||||||||
Collective Investment Undertakings | — | 5 | — | 3 | 3 | 100 | % | |||||||||||||||||
Equity | — | — | — | — | — | — | ||||||||||||||||||
Other Items | 20,030 | — | 19,964 | 425 | 12,120 | 59 | % | |||||||||||||||||
|
|
|
|
|
|
|
|
|
|
|
| |||||||||||||
Total | 377,286 | 77,828 | 394,215 | 24,077 | 183,479 | 44 | % | |||||||||||||||||
|
|
|
|
|
|
|
|
|
|
|
| |||||||||||||
| (1) | Net OE: original exposure net of value adjustments and provisions |
| (2) | EAD: original exposure net of value adjustments and provisions after CRM and CCF |
| (3) | RWAs: EAD after risk-weighting |
The reduction in exposure observed during the period is mainly explained by the sale of BBVA USA and BBVA Paraguay (see section 3.3.1.)
In addition, the following tables show the exposure net of provisions, before and after the application of credit risk mitigation techniques by risk weights and exposure
Table of Contents
| BBVA. PILLAR 3 2021 | 4. RISKS | P. 82 |
categories under the standardised approach, excluding securitisation positions and counterparty credit risk exposure.
Exposure net of provisions and after applying CCF and CRM related to counterparty credit risk are shown in table EU CCR3 of Section 4.2.6.2.1 of this report.
Table of Contents
| BBVA. PILLAR 3 2021 | 4. RISKS | P. 83 |
Table 26. EU CR5 - Standardised approach: exposure values after application of credit risk mitigation techniques (Million Euros. 12-31-2021)
| Risk Weight | Total credit exposures amount (post-CCF and | |||||||||||||||||||||||||||||||||||||||||||||||||||||||||||||||||||
Exposure Class | 0% | 2% | 4% | 10% | 20% | 35% | 50% | 70% | 75% | 100% | 150% | 250% | 370% | 1250% | Others | post-CRM) | Of which: unrated(1) | |||||||||||||||||||||||||||||||||||||||||||||||||||
Central Government or central banks | 131,024 | — | — | — | 350 | — | 7,721 | — | — | 17,152 | 808 | 3,120 | — | — | — | 160,175 | 56,724 | |||||||||||||||||||||||||||||||||||||||||||||||||||
Regional government or local authorities | 58 | — | — | — | 806 | — | 177 | — | — | 938 | — | — | — | — | — | 1,979 | 244 | |||||||||||||||||||||||||||||||||||||||||||||||||||
Public sector entities | — | — | — | — | 28 | — | 5 | — | — | 838 | — | — | — | — | — | 871 | 871 | |||||||||||||||||||||||||||||||||||||||||||||||||||
Multilateral development banks | 93 | — | — | — | — | — | 12 | — | — | — | — | — | — | — | — | 104 | — | |||||||||||||||||||||||||||||||||||||||||||||||||||
International Organisations | — | — | — | — | — | — | — | — | — | — | — | — | — | — | — | — | — | |||||||||||||||||||||||||||||||||||||||||||||||||||
Institutions | — | 204 | — | — | 6,876 | — | 1,806 | — | — | 2,456 | 83 | — | — | — | — | 11,425 | 3,566 | |||||||||||||||||||||||||||||||||||||||||||||||||||
Corporates | — | — | — | — | 347 | — | 974 | — | — | 37,430 | 1,014 | — | — | — | — | 39,765 | 34,150 | |||||||||||||||||||||||||||||||||||||||||||||||||||
Retail | — | — | — | — | — | — | — | — | 40,880 | — | — | — | — | — | — | 40,880 | 40,880 | |||||||||||||||||||||||||||||||||||||||||||||||||||
Secured by mortgages on immovable property | — | — | — | — | — | 20,136 | 3,727 | — | 2 | 171 | — | — | — | — | — | 24,035 | 24,035 | |||||||||||||||||||||||||||||||||||||||||||||||||||
Exposures in default | — | — | — | — | — | — | — | — | — | 2,534 | 633 | — | — | — | — | 3,167 | 3,167 | |||||||||||||||||||||||||||||||||||||||||||||||||||
Exposures associated with particularly high risk | — | — | — | — | — | — | — | — | — | — | 2,401 | — | — | — | — | 2,401 | 2,401 | |||||||||||||||||||||||||||||||||||||||||||||||||||
Covered bonds | — | — | — | — | — | — | — | — | — | — | — | — | — | — | — | — | — | |||||||||||||||||||||||||||||||||||||||||||||||||||
Institutions and corporates with a short-term credit assessment | — | — | — | — | — | — | — | — | — | — | — | — | — | — | — | — | — | |||||||||||||||||||||||||||||||||||||||||||||||||||
Collective investment undertakings | — | — | — | — | — | — | — | — | — | 1 | — | — | — | — | — | 1 | 1 | |||||||||||||||||||||||||||||||||||||||||||||||||||
Other Items | 7,773 | — | — | — | 42 | — | — | — | — | 10,979 | — | — | — | — | — | 18,795 | 18,795 | |||||||||||||||||||||||||||||||||||||||||||||||||||
Equity | — | — | — | — | — | — | — | — | — | — | — | — | — | — | — | — | — | |||||||||||||||||||||||||||||||||||||||||||||||||||
|
|
|
|
|
|
|
|
|
|
|
|
|
|
|
|
|
|
|
|
|
|
|
|
|
|
|
|
|
|
|
|
|
| |||||||||||||||||||||||||||||||||||
Total | 138,948 | 204 | — | — | 8,450 | 20,136 | 14,421 | — | 40,882 | 72,500 | 4,939 | 3,120 | — | — | — | 303,599 | 184,834 | |||||||||||||||||||||||||||||||||||||||||||||||||||
|
|
|
|
|
|
|
|
|
|
|
|
|
|
|
|
|
|
|
|
|
|
|
|
|
|
|
|
|
|
|
|
|
| |||||||||||||||||||||||||||||||||||
| (1) | Of which: Unrated refers to exposure for which no credit rating from designated ECAIs is available |
Table of Contents
| BBVA. PILLAR 3 2021 | 4. RISKS | P. 84 |
EU CR5 - Standardised approach: exposure values after application of credit risk mitigation techniques (Million Euros. 12-31-2020)
| Risk Weight | Total credit exposures amount (post-CCF and | |||||||||||||||||||||||||||||||||||||||||||||||||||||||||||||||||||
Exposure Class | 0% | 2% | 4% | 10% | 20% | 35% | 50% | 70% | 75% | 100% | 150% | 250% | 370% | 1250% | Others | post-CRM) | Of which: unrated(1) | |||||||||||||||||||||||||||||||||||||||||||||||||||
Central Government or central banks | 176,480 | — | — | — | 3,752 | — | 4,795 | — | — | 16,536 | 661 | 3,441 | — | — | — | 205,665 | 59,394 | |||||||||||||||||||||||||||||||||||||||||||||||||||
Regional government or local authorities | 1 | — | — | — | 5,582 | — | 847 | — | — | 776 | — | — | — | — | — | 7,206 | 2,032 | |||||||||||||||||||||||||||||||||||||||||||||||||||
Public sector entities | — | — | — | — | 906 | — | 534 | — | — | 242 | — | — | — | — | — | 1,682 | 643 | |||||||||||||||||||||||||||||||||||||||||||||||||||
Multilateral development banks | 288 | — | — | — | — | — | 14 | — | — | — | — | — | — | — | — | 302 | 229 | |||||||||||||||||||||||||||||||||||||||||||||||||||
International Organisations | — | — | — | — | — | — | — | — | — | — | — | — | — | — | — | — | — | |||||||||||||||||||||||||||||||||||||||||||||||||||
Institutions | — | 280 | — | — | 7,826 | — | 1,701 | — | — | 4,472 | 80 | — | — | — | — | 14,359 | 12,720 | |||||||||||||||||||||||||||||||||||||||||||||||||||
Corporates | — | — | — | — | 50 | — | 499 | — | — | 76,551 | 904 | — | — | — | — | 78,004 | 76,329 | |||||||||||||||||||||||||||||||||||||||||||||||||||
Retail | — | — | — | — | — | — | — | — | 48,984 | — | — | — | — | — | — | 48,984 | 48,984 | |||||||||||||||||||||||||||||||||||||||||||||||||||
Secured by mortgages on immovable property | — | — | — | — | — | 30,049 | 3,505 | — | 845 | 214 | — | — | — | — | — | 34,613 | 34,614 | |||||||||||||||||||||||||||||||||||||||||||||||||||
Exposures in default | — | — | — | — | — | — | — | — | — | 2,917 | 1,042 | — | — | — | — | 3,959 | 3,959 | |||||||||||||||||||||||||||||||||||||||||||||||||||
Exposures associated with particularly high risk | — | — | — | — | — | — | — | — | — | — | 3,125 | — | — | — | — | 3,125 | 3,125 | |||||||||||||||||||||||||||||||||||||||||||||||||||
Covered bonds | — | — | — | — | — | — | — | — | — | — | — | — | — | — | — | — | — | |||||||||||||||||||||||||||||||||||||||||||||||||||
Institutions and corporates with a short-term credit assessment | — | — | — | — | — | — | — | — | — | 1 | — | — | — | — | — | 1 | 1 | |||||||||||||||||||||||||||||||||||||||||||||||||||
Collective investment undertakings | — | — | — | — | — | — | — | — | — | 3 | — | — | — | — | — | 3 | 3 | |||||||||||||||||||||||||||||||||||||||||||||||||||
Other Items | 8,269 | — | — | — | — | — | — | — | — | 12,120 | — | — | — | — | — | 20,389 | 20,389 | |||||||||||||||||||||||||||||||||||||||||||||||||||
Equity | — | — | — | — | — | — | — | — | — | — | — | — | — | — | — | — | — | |||||||||||||||||||||||||||||||||||||||||||||||||||
|
|
|
|
|
|
|
|
|
|
|
|
|
|
|
|
|
|
|
|
|
|
|
|
|
|
|
|
|
|
|
|
|
| |||||||||||||||||||||||||||||||||||
Total | 185,038 | 280 | — | — | 18,116 | 30,049 | 11,895 | — | 49,829 | 113,832 | 5,812 | 3,441 | — | — | — | 418,292 | 262,422 | |||||||||||||||||||||||||||||||||||||||||||||||||||
|
|
|
|
|
|
|
|
|
|
|
|
|
|
|
|
|
|
|
|
|
|
|
|
|
|
|
|
|
|
|
|
|
| |||||||||||||||||||||||||||||||||||
| (1) | Of which: Unrated refers to exposure for which no credit rating from designated ECAIs is available |
The reduction in exposure observed during the period is mainly explained by the sale of BBVA USA and BBVA Paraguay (see section 3.3.1.)
Table of Contents
| BBVA. PILLAR 3 2021 | 4. RISKS | P. 85 |
The following table shows the flow statements of credit and counterparty credit risk RWA under standardised approach during the fourth quarter of 2021:
Table 27. RWA flow statements of credit risk exposures under the standardised approach (Million Euros)
| Credit Risk | Counterparty Credit Risk | Total | ||||||||||||||||||||||
| RWA amounts | Capital Requirements | RWA amounts | Capital Requirements | RWA amounts | Capital requirements | |||||||||||||||||||
|
|
|
|
|
|
|
|
|
|
|
| |||||||||||||
RWAs as of September 30, 2021 | 133,827 | 10,706 | 4,313 | 345 | 138,140 | 11,051 | ||||||||||||||||||
|
|
|
|
|
|
|
|
|
|
|
| |||||||||||||
Asset size | 2,929 | 234 | 1,555 | 124 | 4,484 | 359 | ||||||||||||||||||
Asset quality | (1,223 | ) | (98 | ) | — | — | (1,223 | ) | (98 | ) | ||||||||||||||
Model updates | — | — | — | — | — | — | ||||||||||||||||||
Methodology and policy | — | — | — | — | — | — | ||||||||||||||||||
Acquisitions and disposals | — | — | — | — | — | — | ||||||||||||||||||
Foreign exchange movements | (5,792 | ) | (463 | ) | 51 | 4 | (5,741 | ) | (459 | ) | ||||||||||||||
Other | — | — | — | — | — | — | ||||||||||||||||||
|
|
|
|
|
|
|
|
|
|
|
| |||||||||||||
RWAs as of December 31, 2021 | 129,741 | 10,379 | 5,919 | 474 | 135,660 | 10,853 | ||||||||||||||||||
|
|
|
|
|
|
|
|
|
|
|
| |||||||||||||
During the fourth quarter of 2021, there is a reduction of standardised credit risk weighted assets derived from the depreciation of the currencies in which the group operates, especially the Turkish lira. Isolating the effect of the exchange rate, the dynamism of the credit activity in the retail and corporate portfolios boosted the growth of the RWAs in the quarter. Moreover, there is a significant reduction of the capital requirements related to the quality of the asset, which includes the evolution of exposures at default or those classified as high risk. Regarding the evolution of counterparty risk, there is an increase in exposure, mainly due to temporary market volatilities observed in Turkey that increases the Mark to Market in some derivative instruments.
The full annual series of RWA flow of credit risk under the standardised approach is available in the editable file “Pillar III 2021 – Tables & Annexes”.
4.2.5. Information on the IRB approach
4.2.5.1. General information
4.2.5.1.1. Authorisation by the supervisor to use the IRB approach
The following are the models authorised by the supervisor for use in the calculation of regulatory capital requirements.
Table 28. Models authorised by the supervisor for the purpose of their use in the calculation of capital requirements (12-31-2021)
Institution Portfolio | Portfolio | Number of models | Model description | |||||
BBVA S.A. | Financial institutions | 4 | 1 Rating, 1 PD model, 1 LGD model, 1 EAD model | |||||
Public institutions | 5 | 1 Rating, 1 PD model, 2 LGD models, 1 EAD model | ||||||
Specialised finance | 2 | 1 Slotting criteria, 1 EAD model | ||||||
Developers | 4 | 1 Rating, 1 PD model, 1 LGD model, 1 EAD model | ||||||
Small Corporates | 5 | 1 Rating, 1 PD model, 2 LGD models, 1 EAD model | ||||||
Medium-sized Corporates | 5 | 1 Rating, 1 PD model, 2 LGD models, 1 EAD model | ||||||
Large Corporates | 5 | 1 Rating, 1 PD model, 2 LGD models, 1 EAD model | ||||||
Mortgages | 6 | 2 Scorings, 2 PD models, 1 LGD model, 1 EAD model | ||||||
Consumer finance | 5 | 2 Scorings, 2 PD models, 1 LGD model | ||||||
Credit cards | 10 | 2 Scorings, 2 PD models, 3 LGD models, 3 EAD models | ||||||
Automobiles | 4 | 2 Scorings, 1 PD model, 1 LGD model | ||||||
BBVA Bancomer | Retail Revolving (Credit Cards) | 11 | 4 Scorings, 5 PD models, 1 LGD model, 1 EAD model | |||||
Large Corporates | 5 | 1 Rating, 1 PD model, 2 LGD models, 1 EAD model | ||||||
Medium-sized Corporates | 5 | 1 Rating, 1 PD model, 2 LGD models, 1 EAD model | ||||||
BBVA Group | Equity | 1 | 1 capital model | |||||
Table of Contents
| BBVA. PILLAR 3 2021 | 4. RISKS | P. 86 |
The following table shows the distribution of EAD of credit and counterparty risk by method for each category of exposure as of December 31, 2021, in addition to the percentage subject to rollout3 (securitisations are excluded):
Table 29. EU CR6-A – Scope of the use of IRB and SA approaches (Million euros. 12-31-2021)
| Exposure value as defined in Article 166 CRR for exposures subject to IRB approach | Total exposure value for exposures subject to the Standardised approach and to the IRB approach | Percentage of total exposure value subject to the permanent partial use of the SA (%) | Percentage of total exposure value subject to IRB Approach (%) | Percentage of total exposure value subject to a roll-out plan (%) | ||||||||||||||||
Central governments or central banks | 16,117 | 145,807 | 0.61 | 0.07 | 0.31 | |||||||||||||||
Of which Regional governments or local authorities | — | — | — | — | — | |||||||||||||||
Of which Public sector entities | — | — | — | — | — | |||||||||||||||
Institutions | 120,899 | 99,448 | 7.23 | % | 76.63 | % | 16.13 | % | ||||||||||||
Corporates | 147,326 | 192,649 | 7.77 | % | 71.84 | % | 20.39 | % | ||||||||||||
Of which Corporates - Specialised lending, excluding slotting approach | — | — | — | — | — | |||||||||||||||
Of which Corporates - Specialised lending under slotting approach | — | 6,333 | — | 100.00 | % | — | ||||||||||||||
Retail | 101,191 | 162,671 | 12.80 | % | 59.07 | % | 28.13 | % | ||||||||||||
of which Retail – Secured by real estate SMEs | — | 2,538 | 22.46 | % | 42.91 | % | 34.63 | % | ||||||||||||
of which Retail – Secured by real estate non-SMEs | — | 91,855 | 5.64 | % | 76.66 | % | 17.71 | % | ||||||||||||
of which Retail – Qualifying revolving | — | 17,831 | 11.48 | % | 54.44 | % | 34.08 | % | ||||||||||||
of which Retail – Other SMEs | — | 22,556 | 17.42 | % | 14.31 | % | 68.27 | % | ||||||||||||
of which Retail – Other non-SMEs | — | 27,891 | 32.64 | % | 41.77 | % | 25.59 | % | ||||||||||||
Equity | 5,809 | 5,809 | 0.00 | 100.00 | % | — | ||||||||||||||
Other non-credit obligation assets | — | 13,693 | 6.57 | % | — | 93.43 | % | |||||||||||||
|
|
|
|
|
|
|
|
|
| |||||||||||
Total | 391,342 | 620,077 | 21.46 | % | 52.77 | % | 25.77 | % | ||||||||||||
|
|
|
|
|
|
|
|
|
| |||||||||||
The above table is shown according to the New ITS EBA where the first column includes the exposure value (EAD) of the portfolios subject to the IRB method, while the second column includes the value of the exposures subject to the standard and IRB method.
Additionally, the latter includes the value of the exposure defined by article 429(4) of the CRR that corresponds to
the exposure to the leverage ratio (see section 5.1. for more information on the definition of the exposure to the leverage ratio).
The following chart shows the exposures distributed by permanent partial use of the standard method, subject to roll-out plans and those that are already subject to the IRB method:
| 3 | Sequential deployment process of IRB models in each exposure category. |
Table of Contents
| BBVA. PILLAR 3 2021 | 4. RISKS | P. 87 |
Chart 6. Distribution of Exposure between the use of PPU, IRB and rollout plans
The main types of rating models used in the IRB portfolios are ratings for wholesale portfolios and proactive and reactive scorings in the case of retail portfolios.
The rating models give contracts/customers a score that orders customers according to their credit quality. This score is determined by the characteristics of the transactions, economic and financial conditions of the customer, information on payment behaviour, credit bureau, etc.
The approval of the models by the supervisor includes both own estimations of the probability of default (PD), loss given default (LGD) and the internal estimation of credit conversion factors (CCFs).
The Group continues with the development of a new rollout plan that increases the coverage of IRB models (see table EU CR6-A for more information).
4.2.5.1.2. Structure of internal rating systems and relationship between internal and external ratings
The Group has rating tools for each exposure category listed in the Basel Agreement.
The retail portfolio has scoring tools for determining the credit quality of transactions on the basis of information
on the transaction itself and on the customer. The scoring models are algorithms calculated using statistical methods that score each transaction. This score reflects the transaction’s level of risk and is in direct relation to its probability of default (PD).
These decision models are the basic tool to decide who should receive a loan and the amount to be granted, thereby contributing to both the arrangement and management of retail-type loans.
For the wholesale portfolio, the Group has rating tools that, unlike scorings, do not assess transactions but rather customers. The Group has different tools for rating the various customer segments: small companies, corporates, government and the public sector, etc. In those wholesale portfolios where the number of defaults is very low (sovereign risk, corporates, financial institutions) the internal information is supplemented by the benchmarks of external rating agencies.
The PD estimates made by the Group are transferred to the Master Scale, enabling a comparison to be made with the scales used by external agencies.
Table of Contents
| BBVA. PILLAR 3 2021 | 4. RISKS | P. 88 |
Table 30. Master Scale of BBVA’s rating (12-31-2021)
External rating | Internal rating | Probability of default (basic points) | ||||||||||||||
Standard & Poor’s List | Reduced List (22 groups) | Average | Minimum from >= | Maximum | ||||||||||||
AAA | AAA | 1 | 0 | 2 | ||||||||||||
AA+ | AA+ | 2 | 2 | 3 | ||||||||||||
AA | AA | 3 | 3 | 4 | ||||||||||||
AA- | AA- | 4 | 4 | 5 | ||||||||||||
A+ | A+ | 5 | 5 | 6 | ||||||||||||
A | A | 8 | 6 | 9 | ||||||||||||
A- | A- | 10 | 9 | 11 | ||||||||||||
BBB+ | BBB+ | 14 | 11 | 17 | ||||||||||||
BBB | BBB | 20 | 17 | 24 | ||||||||||||
BBB- | BBB- | 31 | 24 | 39 | ||||||||||||
BB+ | BB+ | 51 | 39 | 67 | ||||||||||||
BB | BB | 88 | 67 | 116 | ||||||||||||
BB- | BB- | 150 | 116 | 194 | ||||||||||||
B+ | B+ | 255 | 194 | 335 | ||||||||||||
B | B | 441 | 335 | 581 | ||||||||||||
B- | B- | 785 | 581 | 1,061 | ||||||||||||
CCC+ | CCC+ | 1,191 | 1,061 | 1,336 | ||||||||||||
CCC | CCC | 1,500 | 1,336 | 1,684 | ||||||||||||
CCC- | CCC- | 1,890 | 1,684 | 2,121 | ||||||||||||
CC+ | CC+ | 2,381 | 2,121 | 2,673 | ||||||||||||
CC | CC | 3,000 | 2,673 | 3,367 | ||||||||||||
CC- | CC- | 3,780 | 3,367 | 4,243 | ||||||||||||
4.2.5.1.3. Use of internal estimates for purposes other than the calculation of regulatory capital requirements
The Group’s internal estimates are a critical component of management based on value creation, giving rise to criteria for assessing the risk-return trade-off.
These measures have a broad range of uses, from the adoption of strategic business decisions through to the individual admission of transactions.
Specifically, internal estimates are used in everyday business in support of credit risk management through their inclusion in admission and monitoring processes, as well as in the pricing of transactions.
The management use of performance metrics that consider expected loss, economic capital and risk-adjusted return enables the monitoring of portfolios and the assessment of non-performing positions, among others.
4.2.5.1.4. Process for managing and recognizing the effects of credit risk mitigation
Mitigation is an iterative process whose purpose is to recognize the benefits of the existence of collateral and guarantees, ordering them from the highest to the lowest credit quality.
The Group uses risk mitigation techniques for exposure pertaining to the wholesale portfolio by replacing the debtor’s PD with that of the guarantor, in cases in which the latter is eligible and its PD is lower than the debtor’s.
In retail admission processes the guarantor is included in the scoring itself.
Collateral in IRB models is recognised through the LGD and must meet eligibility criteria based on maturity and minimum exposure coverage, and making the necessary adjustments depending on the type of existing collateral, financial or real.
4.2.5.1.5. Control mechanisms for internal rating models
The Group has a management framework for rating models that includes all the phases of its life cycle: from the time when a need that triggers the construction or modification of a model is identified, through to its use and monitoring.
Model Development
The development of a model is an activity that requires the involvement of different stakeholders, experience and specific multidisciplinary technical knowledge. GRM Analytics is responsible for the development of BBVA Group’s risk models. As a global function, it must ensure an efficient management of existing resources and homogeneity of developments.
All developments must be properly documented. A correct and updated documentation allows to reduce the dependencies of key people and facilitates control, review and training tasks, mitigating model risk more effectively.
Table of Contents
| BBVA. PILLAR 3 2021 | 4. RISKS | P. 89 |
An outsourcing of specific activities in the development of risk models is possible, but in no case does this imply a transfer of responsibility by the entity.
The Group has internal policies where all concepts are defined.
Model Approval
The Group’s Chief Risk Officer (CRO) is the head of the risk function in the executive line and, in order to better perform his duties, he is supported by a committee structure.
The Regulation for Changes in Risk Models defines the internal governance process that must be followed in order to start using the BBVA Group’s risk models, as defined in the Model Risk Management Policy; indicating the committees that must authorize the new models and their changes, specifically, methodological changes, the scope of application and the uses of the model, as well as the cessation of its use; depending on the nature of the change and the relevance of the model for the BBVA group.
The Global Risk Management Committee (GRMC) is constituted as a forum for advising and supporting the Group Risk Director for the exercise of the functions and decision-making that the latter is responsible for adopting; having, in relation to the model risk, among other functions, approving both the material modifications or measures of the Internal Models that are used in the Calculations of Regulatory Capital (IRB; IMA; Longevity) as well as of new models that are going to be used to this end.
Additionally, the Risk’s Models Management Committee (RMMC) reports to the GRMC, providing it with adequate technical support in decisions associated with model risk management; One of its functions is the review, prior to its presentation by the GRMC, of the requests for new Internal models that are used in the calculations of Regulatory Capital or of the modifications of the existing ones; acting in a delegated manner by the same to approve those changes of less relevance or immaterial.
Given its technical component, the presidency is exercised by the Head of GRM Analytics. In addition to including members of GRM’s Senior Management and the person responsible for GRM Internal Control, the committee is complemented by members of the GRM Analytics and Internal Validation COEs.
Model Monitoring
Proper monitoring allows unexpected behaviour to be detected, misuse to be identified, and even to anticipate when changes in the risk profile of portfolios or products require corrective actions to be taken. The risk rating models are monitored with a frequency appropriate to the nature of the model, the availability of new data, modelling techniques and the importance of their use in
management. It is analysed from a double perspective: performance and use.
Performance monitoring aims to detect deficiencies in the behaviour of risk rating models, anticipating their possible deterioration over time. It is a mechanism to determine if the models are working correctly, helping to verify that the components of the model work as expected. The performance monitoring framework makes it possible to identify weaknesses and establish the necessary action plans to ensure its proper functioning. This analytical framework, a fundamental component of risk model planning, establishes the minimum criteria that must be taken into account, as well as the metrics and thresholds that allow warning of unwanted behaviour.
Usage monitoring aims to verify that the model is used in a general way, for the intended uses, and in an appropriate way. This control mechanism continuously allows the detection of deviations from the intended use of the models, as well as the establishment of action plans for their correction.
In addition, the Group has an area independent of the developers and users of the rating models, as well as independent of the departments responsible for the model monitoring, whose main function is to backtest the models, in order to guarantee their accuracy, robustness and stability (see next section “Validation Process”)
On the other hand, a series of reports are periodically presented to the governing bodies for their review, the purpose of which is to monitor the main risk indicators and management metrics, the presentation of follow-up reports and plans to redirect exceeded indicators with respect to the action frameworks approved annually.
4.2.5.1.6. Description of the internal rating process
There follows a description of the internal rating process by type of customer:
| • | Central banks and central governments: For this segment, the assignment of ratings is made by country risk unit, which periodically analyse this type of customer, rating them according to the parameters included in the corresponding rating model. There are 3 different methodologies currently in use for allocating country ratings: (i) ratings from external agencies, used for developed countries, emerging countries with elevated incomes and emerging countries where the Group has little risk; (ii) internal rating based on a proprietary tool used for emerging countries where the Group has an appreciable risk; and lastly (iii) the country risk scores published by the Belgian export credit agency (which manages the quantitative model used by the OECD to assign its country risk scores) for countries of marginal importance for the |
Table of Contents
| BBVA. PILLAR 3 2021 | 4. RISKS | P. 90 |
Group that have no external ratings. Sovereign ratings are generated in local and foreign currency for all countries, as well as a transfer rating, which evaluates the risk of inconvertibility/transfer restrictions.
For emerging countries rated with the internal tool, the local currency rating is obtained by adjusting the foreign currency rating provided by the internal tool with authorization from the Risk Committee allocated for such purpose.
| • | Institutions: The relevant risk unit periodically rates these types of clients, and constantly monitors the evolution of these clients in national and international markets. External ratings are a key factor in the allocation of ratings to financial institutions. |
| • | Financial institutions: the rating is generally obtained by the risk units responsible for their sanction, on an annual basis, at the same time as the review of clients’ risks or the publication of their accounts. |
| • | Large Companies: Includes the rating of exposure with corporate business groups. The result is affected both by indicators of business risk (evaluation of the competitive environment, business positioning, regulation, etc.) and financial risk indicators (size of the group by sales, cash generation, levels of debt, financial flexibility, etc.). |
In accordance with the characteristics of the large companies, the rating model has a global nature with specific algorithms according to the sector of activity and geographical adaptations. The rating of these customers is generally calculated within the framework of the annual risk review process, or the admission of new operations.
The responsibility for the assessment lies with the units proposing the risk, while those responsible of approvals, validate it when the decision is taken.
| • | Medium-sized companies: This segment also takes into account quantitative factors derived from economic and financial information, and qualitative factors that are related to the age of the company, the sector, management quality, etc. and alert factors derived from risk monitoring. |
As in the Corporate segment, the rating tends to run parallel to the admission process, so the responsibility for rating lies with the unit proposing the risk, while the decision-making level is in charge of validating it.
| • | Small-sized companies: As in the case of medium-sized companies, this segment also takes into account quantitative factors derived from economic and financial information, and qualitative factors |
that are related to the age of the company, the sector, management quality, etc. and alert factors derived from risk monitoring. Similarly, the rating tends to run parallel with the admission process, so the responsibility for rating is with the unit proposing the risk, while the decision-making level is in charge of validating it.
| • | Specialised Lending: To classify this segment, the Group has chosen to use the approach of slotting criteria, as included in the Basel Accord of June 2004 and in the solvency regulations (CRR Article 153.5). |
| • | Developers: The rating of real estate developers covers the rating of both customers who are developers and the Property Projects unit. Its use makes it easier to monitor and rate projects during their execution phase, as well as enriching the admission processes. |
| • | BBVA Mexico Corporates: This segment also takes into account quantitative factors derived from economic and financial information and bureau information, as well as qualitative factors related to the age of the company, the sector, the quality of its management, etc. The rating tends to run parallel to the admission process, so that responsibility for the rating is with the unit originating the risk, while the decision-making body validates it. |
In general in the wholesale area, the rating of customers is not limited to admission, as the ratings are updated according to new information available at any time (economic and financial data, changes in the company, external factors, etc.).
| • | Retailers: Retail exposure is rated by models developed internally by the Entity that allow the credit risk of portfolios to be assessed. The model score can be assigned at the customer or product level and transformed into a probability of default, allowing for management based on risk groups. Depending on the information available, ratings can be reactive or proactive. The reactive ratings are generated from the customer’s request to take out a product, while the proactive ratings are periodically calculated on the basis of the information available, internal and external, on the customer’s payment behaviour. Proactive models allow offers of pre-approved and/or pre-offered products, which are instrumentalised in mass marketing campaigns. Ratings are integrated into admission and monitoring processes for retail portfolios, ensuring adequate credit risk management. |
The rating process is as follows for each specific category of retail exposure:
| a. | Mortgages, Consumer Finance and Retail Cards - Spain: The manager collects data on |
Table of Contents
| BBVA. PILLAR 3 2021 | 4. RISKS | P. 91 |
| the customer (personal, financial, banking relationship information) and on the transaction (LTV, amount, maturity, destination etc.) and calculates the rating of the transaction with the scoring. The decision on whether it is approved is made based on the results of applying the model and risk policies. |
| b. | Consumer Finance Autos Spain: The financing request may come through the call center or be directly recorded in the web application by our authorised dealers. The necessary information on the customer (personal, financial information, authorisation to consult the external bureau of credit) and on the transaction (maturity, amount, etc.) is recorded to rate the transaction with the scoring. Once the validity of the information provided is verified, the decision of whether to approve it is made based on the results of applying the model and risk policies. |
| c. | Retail Revolving- Cards BBVA Mexico: The manager or specialist party gathers the necessary information on the customer (personal, financial information and authorisation to consult the external bureau of credit) and on the transaction (limit requested) to rate the transaction with the scoring. There are additional processes for validating and checking this information through the back office or operational support areas. The decision on whether it is approved is made based on the results of applying the model and risk policies. |
| • | Behavioural: Every month all the active cards are rated according to their transactional behaviour and payment status. |
| • | Proactive: Each month all the customers who have asset positions on credit cards, consumer finance or mortgages and liabilities positions are rated, based on information on internal behaviour and flows. |
| d. | Proactive - Spain: Each month all the customers who have asset positions in credit cards, consumer finance or mortgages and first and second in liability seniority, are rated according to information on their behavior. |
| e. | SMEs Spain (legal persons): Management is based on the allocation of limits/ceilings at the customer level, based on the results of a proactive monthly update rating. |
| • | Equity: For its portfolio position registered as equity, the Group is applying the rating obtained for |
customers as a result of their rating in the lending process. |
4.2.5.1.7. Definitions, methods and data for estimating and validating risk parameters
The estimation of the parameters is based on the uniform definition of default established at Group level. Specifically, for a contract or customer to be considered in a situation of default, the provisions of current regulations must be met.
Specifically, there are two approaches in the Group for considering default and estimating parameters:
| • | The facility level approach is applied within the sphere of retail risk. Each customer transaction is handled as an independent unit in terms of credit risk. Therefore, noncompliance with credit obligations to the bank is handled at the transaction level, regardless of the customer’s behaviour with respect to other obligations. |
| • | The obligor level approach is applied to the remainder portfolios. The significant unit for defining default is the customer’s sum of contracts, which enter a situation of default en masse when the customer defaults. |
Furthermore, to avoid including non material defaults in the estimates, non-performing volumes have to pass through a materiality filter that depends on the type of customer and transaction.
Estimating parameters
In the case of Spain and Mexico, the Group has an internal information system denominated CORE – Risk Adjusted Return that reflects exposure to credit risk in the Group’s different portfolios included in advanced internal models.
This information system guarantees the availability of historical data recorded by the Group, which are used to estimate the parameters of Probability of Default (PD), Loss Given Default (LGD) and Credit Conversion Factors (CCF). These are then used to calculate the regulatory capital using the advanced approach, economic capital and expected loss by credit risk.
Other sources of information for the Bank may be used in addition, depending on any new needs detected in the estimation process. Internal estimates of the PD, LGD and CCF parameters are made for all the Group’s portfolios.
In the case of low default portfolios (LDP), in which the number of defaults tends to be insufficient for obtaining empirical estimates, use is made of data from external agencies that are merged with the internal information available and expert criteria.
Table of Contents
| BBVA. PILLAR 3 2021 | 4. RISKS | P. 92 |
The following shows the estimation methodologies used for the PD, LGD and CCF risk parameters, for the purpose of calculating regulatory capital requirements.
| • | Probability of default (PD) |
The methodology used for estimating the PD in cases that have a sufficiently large mass of internal data is based on the creation of risk groups. The groups proposed with a view to calibration are defined by grouping contracts together, seeking to achieve intragroup homogeneity in terms of credit quality and differentiation with all the other risk groups. The largest possible number of groups is defined in order to allow a suitable discrimination of risk.
The fundamental metric used for making these groupings is the score, being supplemented by other metrics relevant to PD that are proven to be sufficiently discriminating depending on the portfolio.
Once the risk groups have been defined, the average empirical PD recorded for each one is obtained and adjusted to the cycle. The adjustment to the cycle provides stable estimates over the course of the economic cycle, referred to as PD-TTC (through the cycle). This calculation considers the portfolio’s track record and provides long-term levels of PD.
In low default portfolios (LDPs) the empirical PDs observed by external rating agencies are used to obtain the PD of internal risk groups.
Finally, in obligor level portfolios there is a Master Scale, which is simply a standard and uniform rule for credit levels that makes it possible to make comparisons of credit quality in the Group’s different portfolios.
| • | Loss given default (LGD) |
As a general rule, the method used to estimate loss given default (LGD) in portfolios with a sufficient number of defaults is Workout LGD. Here, the LGD of a contract is obtained as a quotient of the sum of all the financial flows recorded during the recovery process that takes place when a transaction defaults, and the transaction’s exposure at the time of default.
This estimate is made by considering all the historical data recorded in internal systems. When making the estimates, there are transactions that have already defaulted but for which the recovery process is still ongoing. The loss given default recorded at the time of the estimate is therefore higher than it will ultimately be. The necessary adjustments are made in these cases so as not to distort the estimate.
These estimates are made by defining uniform risk groups in terms of the nature of the operations that determine the LGD. They are made in such a way that there are enough groups for each one to be distinguishable and receive a different estimate.
In line with the guidelines set out by the regulations, the estimates are made by distinguishing between wholesale and retail type exposure.
There is insufficient historical experience to make a robust estimate in low default portfolios (LDP) using the Workout LGD method, so external sources of information are used, combined with internal data to provide the portfolio with a representative rate of loss given default (LGD).
The loss given default (LGD) rates estimated according to the internal databases the Bank holds are conditioned to the moment of the cycle of the data window used, since loss given default varies over the economic cycle. Hence, the following concepts can be defined: long-run loss given default (LRLGD), the downturn loss given default (DLGD), and loss given default best estimate (LGD BE).
LRLGD is calculated by making an adjustment to capture the difference between the loss given default obtained empirically with the available sample and the average loss given default observed throughout the economic cycle if the observation of the cycle is complete. In addition, the loss given default observed in a period of stress in the economic cycle, the downturn loss given default (DLGD) is determined.
These estimates are made for those portfolios whose loss given default (LGD) is noticeably sensitive to the cycle. The different ways in which the recovery cycles can conclude are determined for each portfolio where this loss given default (LGD) in conditions of stress has not yet been observed, and the level these parameters would have in a downturn situation are estimated.
Finally, LGD BE is determined according to the loss given default (LGD) observed in the BE period, which aims to cover the defaults closest in time to the present, in other words those that have been produced at a time of the economic cycle that is similar to the present and that also correspond to a very similar portfolio to the present one.
However, for defaulted transactions, the LGD at the worst time will be the LGD BE plus a stress, which is measured based on the volatility of LGD.
| • | Credit conversion factor (CCF) |
As with the two preceding parameters, exposure at default is another of the necessary inputs for calculating expected loss and regulatory capital. A contract’s exposure usually coincides with its balance. However, this is not applicable in all cases.
For example, for products with explicit limits, such as credit cards or credit facilities, the exposure should incorporate the potential increase in the balance that may be recorded up to the time of default.
Table of Contents
| BBVA. PILLAR 3 2021 | 4. RISKS | P. 93 |
In observance of regulatory requirements, exposure is calculated as the drawn balance, which is the real risk at any specific moment, plus a percentage (CCF) of the undrawn balance, which is the part that the customer can still use until the available limit is reached. Therefore, the CCF is defined as the percentage of the undrawn balance that is expected to be used before default occurs.
CCF is estimated by using the cohort4 approach, analysing how the exposure varies from a pre-established reference date through to the moment of default, obtaining the average performance according to the relevant metrics.
Different approaches are used for retail and wholesale exposure. The facility level approach analyses the evolution of the exposure up to the time of the breach of contract, while the obligor level approach analyses the evolution of the exposure up to the moment of the non-compliance of the client.
Again, in low-default portfolios there is not enough historical experience to be able to make a reliable estimate with the defined LGD methodology. In this case, external sources are also used, which are combined with internal data to obtain a CCF representative of the portfolio.
| • | Validation process |
The models used for calculating the parameters, as explained above, are subject to an effective contrast, in accordance with the principle of proportionality, by the Internal Approval team, independent from those that have developed or used said calculation, in order to ensure its accuracy, robustness and stability.
This review process is not restricted as to the time of approval, or the inclusion of changes in the models, but rather is framed within a plan that allows for a periodic evaluation of them, resulting in the issuance of recommendations and mitigating actions for the deficiencies identified.
As such, all models used in regulatory capital calculations using internal models must be subject to an annual review of the calculation, which meet the minimum quantitative and qualitative test content requested by the regulator in Section 4 of the ECB’s Guidelines on Internal Models (General Aspects); even when, in accordance with the principle of proportionality, certain aspects or models that are relatively insignificant within the capital calculation may be subject to revision in the context of a broader review cycle.
However, this possibility does not provide an exemption from conducting the various tests defined in the Instructions for Reporting the Validation Results of Internal Models, issued by the ECB in February 2019, and that should—for Internal Models on Capital for Credit
Risk—be sent to the supervisor on an annual basis and include:
| • | Back-testing of the parameters by comparing the model estimates with the levels actually achieved in the annual study period. |
| • | Discrimination Capacity Analysis, it being important to analyse the evolution of the calculated indices over time by comparing them with indices obtained at different points in time (for example, during model construction). |
| • | Representativeness Analysis, both in order to analyse that the model’s application perimeter is set to the approved and defined perimeter, and in order to analyse the representativeness of the historical data used in the estimation of the risk parameters applied; with particular emphasis on tracking the record of changes made to the definition of default. |
| • | Override analyses, which modify the final score obtained as a large number of analyses could indicate that the model is lacking certain important information. |
| • | Stability Analysis: in order to assess the stability of the rating system, analyses will be conducted on customer migrations, on the stability of the migration matrix and on concentration in rating grades; these analyses may be supplemented, optionally and based on results, by comparing the Population Stability Index (PSI). |
| • | Evaluation of the Data Used in the calibration by analysing the data extraction, processing and purging processes; analysing the Data Quality Management Framework and the results obtained therefrom. |
The various aspects detected by Internal Validation during the review process which are susceptible to be improved will be reflected in the validation report by setting weaknesses (recommendations, suggestions or limitations) whose criticality is expressed on a four-color scale based on the risk assigned to the same.
For each recommendation issued, the validation report will include the details of the person responsible for its resolution, the proposed action plan and the committed resolution date (which will be limited by the maximum terms defined by validation based on the severity granted to the same, these being greater for recommendations of lesser severity).
Once the suggestions, limitations and recommendations have been established, Internal Validation will issue its opinion on the level of risk existing in the revised model, using a four-level scale.
| 4 | A cohort is a twelve-month window that has a reference date (closing of each month) and contains all delinquent transactions whose default date occurs within the cohort. All operations must have a contract date prior to the reference date. |
Table of Contents
| BBVA. PILLAR 3 2021 | 4. RISKS | P. 94 |
The reports issued by Internal Validation, required as part of the approval process for the implementation of new models or changes to existing ones, will be presented to the committees established for this purpose.
Additionally, at least every six months, the periodic reports that have been issued throughout the period will be sent to the Risk Models Management Committee (RMMC) for information purposes, and those classified as having a high level of Model Risk will be presented.
Annually, the results of the year’s Internal Validation work will be presented to the Global Risk Management Committee (GRMC) and to the Risk and Compliance Committee of the BBVA Group Board of Directors (CRyC), with a summary of the conclusions obtained on the models reviewed detailing the main strengths and weaknesses of the most relevant.
In addition, the details of the expired recommendations will be presented to the RMMC. The Committee urges its members to take the appropriate measures to execute the necessary plans aiming to solve or mitigate the weaknesses associated with the expired recommendations. Moreover, the information and measures to these recommendations adopted in the RMMC will be submitted to the GRMC.
4.2.5.2. Exposure values by category and PD range
The following table presents the information on credit risk as of December 31, 2021 (excluding counterparty credit risk, which is set out in detail in Table CCR4 in section 4.2.6.2.2) using the internal ratings-based (IRB) approach, by debtor grade for the different categories of exposure:
Table of Contents
| BBVA. PILLAR 3 2021 | 4. RISKS | P. 95 |
Table 31. EU CR6 - IRB approach - Credit risk exposures by exposure class and PD range (Million Euros. 12-31-2021)
PD Scale (1)(6) | Original on- balance sheet gross exposure | Off-balance sheet exposures pre CCF | Average CCF(2) | EAD post CRM and post-CCF | Average PD(3) | Number of obligors | Average LGD(4) | Average Maturity (days)(5) | RWAs | RWA Density | EL | Value adjustments and provisions | ||||||||||||||||||||||||||||||||||||
Prudential portfolios for AIRB approach | 195,081 | 108,414 | 51.52 | % | 252,973 | 4.29 | % | 13,058,657 | 38.46 | % | 97,614 | 39 | % | 4,032 | (5,053 | ) | ||||||||||||||||||||||||||||||||
|
|
|
|
|
|
|
|
|
|
|
|
|
|
|
|
|
|
|
|
|
|
|
| |||||||||||||||||||||||||
Central governments or central banks | 11,516 | 317 | 49.59 | % | 11,678 | 0.06 | % | 93 | 24.03 | % | 2 | 958 | 8 | % | 2 | (2 | ) | |||||||||||||||||||||||||||||||
|
|
|
|
|
|
|
|
|
|
|
|
|
|
|
|
|
|
|
|
|
|
|
| |||||||||||||||||||||||||
0,00 to <0,15 | 11,401 | 130 | 50.07 | % | 11,472 | 0.03 | % | 22 | 23.74 | % | 2 | 821 | 7 | % | 1 | — | ||||||||||||||||||||||||||||||||
0,00 to <0,10 | 11,400 | 130 | 50.07 | % | 11,471 | 0.03 | % | 17 | 23.74 | % | 2 | 821 | 7 | % | 1 | — | ||||||||||||||||||||||||||||||||
0,10 to <0,15 | 1 | — | 50.00 | % | 1 | 0.10 | % | 5 | 40.23 | % | 5 | 1 | 46 | % | — | — | ||||||||||||||||||||||||||||||||
0,15 to <0,25 | 38 | 152 | 50.00 | % | 114 | 0.20 | % | 9 | 40.00 | % | 2 | 40 | 35 | % | — | — | ||||||||||||||||||||||||||||||||
0,25 to <0,50 | — | 11 | 28.72 | % | 3 | 0.31 | % | 4 | 47.27 | % | 1 | 1 | 45 | % | — | — | ||||||||||||||||||||||||||||||||
0,50 to <0,75 | — | — | 37.88 | % | — | 0.51 | % | 1 | 19.43 | % | 3 | — | 32 | % | — | — | ||||||||||||||||||||||||||||||||
0,75 to <2,50 | 66 | — | — | 66 | 1.50 | % | 7 | 40.00 | % | 1 | 57 | 87 | % | — | — | |||||||||||||||||||||||||||||||||
0,75 to <1,75 | 66 | — | — | 66 | 1.50 | % | 7 | 40.00 | % | 1 | 57 | 87 | % | — | — | |||||||||||||||||||||||||||||||||
1,75 to <2,50 | — | — | — | — | — | — | — | — | — | — | — | — | ||||||||||||||||||||||||||||||||||||
2,50 to <10,00 | 6 | 24 | 49.90 | % | 17 | 5.25 | % | 16 | 40.51 | % | 4 | 28 | 160 | % | — | — | ||||||||||||||||||||||||||||||||
2,50 to <5,00 | 2 | 22 | 50.00 | % | 13 | 4.41 | % | 6 | 40.02 | % | 4 | 20 | 155 | % | — | — | ||||||||||||||||||||||||||||||||
5,00 to <10,00 | 3 | 2 | 48.51 | % | 4 | 7.78 | % | 10 | 41.99 | % | 2 | 8 | 178 | % | — | — | ||||||||||||||||||||||||||||||||
10,00 to <100,00 | 5 | — | 78.93 | % | 5 | 17.44 | % | 32 | 37.25 | % | 1 | 10 | 179 | % | — | (1 | ) | |||||||||||||||||||||||||||||||
10,00 to <20,00 | 4 | — | — | 4 | 11.91 | % | 2 | 40.00 | % | 1 | 8 | 185 | % | — | (1 | ) | ||||||||||||||||||||||||||||||||
20,00 to <30,00 | — | — | — | — | — | — | — | — | — | — | — | — | ||||||||||||||||||||||||||||||||||||
30,00 to <100,00 | 1 | — | 78.93 | % | 1 | 36.59 | % | 30 | 27.75 | % | 1 | 2 | 160 | % | — | — | ||||||||||||||||||||||||||||||||
100,00 (Default) | — | — | — | — | — | 2 | — | — | — | — | — | — | ||||||||||||||||||||||||||||||||||||
Institutions | 10,003 | 7,686 | 63.16 | % | 15,088 | 0.70 | % | 2,970 | 42.11 | % | 2 | 4,630 | 31 | % | 32 | (41 | ) | |||||||||||||||||||||||||||||||
|
|
|
|
|
|
|
|
|
|
|
|
|
|
|
|
|
|
|
|
|
|
|
| |||||||||||||||||||||||||
0,00 to <0,15 | 7,152 | 5,368 | 62.51 | % | 10,643 | 0.08 | % | 1,488 | 43.40 | % | 2 | 2,544 | 24 | % | 3 | (13 | ) | |||||||||||||||||||||||||||||||
0,00 to <0,10 | 5,118 | 4,322 | 63.58 | % | 7,957 | 0.06 | % | 268 | 44.14 | % | 2 | 1,759 | 22 | % | 2 | (3 | ) | |||||||||||||||||||||||||||||||
0,10 to <0,15 | 2,034 | 1,046 | 58.09 | % | 2,686 | 0.11 | % | 1,220 | 41.22 | % | 3 | 785 | 29 | % | 1 | (10 | ) | |||||||||||||||||||||||||||||||
0,15 to <0,25 | 1,635 | 1,738 | 69.48 | % | 2,864 | 0.18 | % | 604 | 44.08 | % | 3 | 1,145 | 40 | % | 2 | (2 | ) | |||||||||||||||||||||||||||||||
0,25 to <0,50 | 676 | 292 | 54.37 | % | 871 | 0.33 | % | 286 | 21.83 | % | 2 | 239 | 27 | % | 1 | (4 | ) | |||||||||||||||||||||||||||||||
0,50 to <0,75 | 249 | 72 | 55.56 | % | 288 | 0.55 | % | 159 | 37.76 | % | 2 | 177 | 62 | % | 1 | (1 | ) | |||||||||||||||||||||||||||||||
0,75 to <2,50 | 139 | 129 | 63.58 | % | 214 | 1.15 | % | 154 | 44.72 | % | 2 | 221 | 103 | % | 1 | (1 | ) | |||||||||||||||||||||||||||||||
0,75 to <1,75 | 139 | 129 | 63.58 | % | 214 | 1.15 | % | 154 | 44.72 | % | 2 | 221 | 103 | % | 1 | (1 | ) | |||||||||||||||||||||||||||||||
1,75 to <2,50 | — | — | — | — | — | — | — | — | — | — | — | — | ||||||||||||||||||||||||||||||||||||
2,50 to <10,00 | 60 | 23 | 48.97 | % | 71 | 5.03 | % | 116 | 42.96 | % | 4 | 117 | 164 | % | 1 | (3 | ) | |||||||||||||||||||||||||||||||
2,50 to <5,00 | 15 | 18 | 49.87 | % | 24 | 3.90 | % | 94 | 46.23 | % | 5 | 36 | 150 | % | — | (1 | ) | |||||||||||||||||||||||||||||||
5,00 to <10,00 | 45 | 4 | 45.22 | % | 47 | 5.61 | % | 22 | 41.27 | % | 4 | 80 | 171 | % | 1 | (3 | ) | |||||||||||||||||||||||||||||||
10,00 to <100,00 | 56 | 34 | 46.12 | % | 73 | 23.64 | % | 84 | 42.80 | % | 2 | 173 | 236 | % | 7 | (2 | ) | |||||||||||||||||||||||||||||||
10,00 to <20,00 | 26 | 31 | 50.26 | % | 46 | 14.77 | % | 16 | 43.99 | % | 2 | 108 | 236 | % | 2 | (1 | ) | |||||||||||||||||||||||||||||||
20,00 to <30,00 | — | — | — | — | 23.81 | % | 2 | 51.59 | % | 1 | — | 290 | % | — | — | |||||||||||||||||||||||||||||||||
30,00 to <100,00 | 30 | 3 | — | 28 | 38.42 | % | 66 | 40.80 | % | 1 | 65 | 236 | % | 4 | (1 | ) | ||||||||||||||||||||||||||||||||
100,00 (Default) | 37 | 31 | 86.27 | % | 64 | 100.00 | % | 79 | 25.42 | % | 3 | 13 | 20 | % | 16 | (16 | ) | |||||||||||||||||||||||||||||||
Table of Contents
| BBVA. PILLAR 3 2021 | 4. RISKS | P. 96 |
PD Scale (1)(6) | Original on- balance sheet gross exposure | Off-balance sheet exposures pre CCF | Average CCF(2) | EAD post CRM and post-CCF | Average PD(3) | Number of obligors | Average LGD(4) | Average Maturity (days)(5) | RWAs | RWA Density | EL | Value adjustments and provisions | ||||||||||||||||||||||||||||||||||||
Corporate - SMEs | 16,050 | 4,847 | 41.30 | % | 18,031 | 14.23 | % | 50,962 | 42.28 | % | 3 | 14,858 | 82 | % | 969 | (1,143 | ) | |||||||||||||||||||||||||||||||
|
|
|
|
|
|
|
|
|
|
|
|
|
|
|
|
|
|
|
|
|
|
|
| |||||||||||||||||||||||||
0,00 to <0,15 | 562 | 309 | 43.08 | % | 694 | 0.12 | % | 2,481 | 43.66 | % | 2 | 171 | 25 | % | — | (1 | ) | |||||||||||||||||||||||||||||||
0,00 to <0,10 | 50 | 1 | 2.02 | % | 50 | 0.04 | % | 167 | 28.82 | % | 5 | 9 | 18 | % | — | — | ||||||||||||||||||||||||||||||||
0,10 to <0,15 | 512 | 308 | �� | 43.24 | % | 644 | 0.12 | % | 2,314 | 44.82 | % | 2 | 162 | 25 | % | — | (1 | ) | ||||||||||||||||||||||||||||||
0,15 to <0,25 | 543 | 213 | 46.37 | % | 638 | 0.20 | % | 1,806 | 45.24 | % | 2 | 203 | 32 | % | — | (1 | ) | |||||||||||||||||||||||||||||||
0,25 to <0,50 | 1,811 | 451 | 40.31 | % | 1,989 | 0.34 | % | 4,228 | 44.45 | % | 2 | 875 | 44 | % | 3 | (6 | ) | |||||||||||||||||||||||||||||||
0,50 to <0,75 | 1,626 | 450 | 46.04 | % | 1,831 | 0.53 | % | 3,483 | 45.59 | % | 2 | 1,058 | 58 | % | 4 | (7 | ) | |||||||||||||||||||||||||||||||
0,75 to <2,50 | 3,492 | 764 | 42.84 | % | 3,815 | 1.21 | % | 7,030 | 43.88 | % | 3 | 2,957 | 77 | % | 19 | (28 | ) | |||||||||||||||||||||||||||||||
0,75 to <1,75 | 3,279 | 761 | 42.95 | % | 3,602 | 1.16 | % | 6,923 | 43.97 | % | 3 | 2,713 | 75 | % | 17 | (24 | ) | |||||||||||||||||||||||||||||||
1,75 to <2,50 | 214 | 3 | 11.17 | % | 214 | 2.04 | % | 107 | 42.37 | % | 4 | 244 | 114 | % | 2 | (3 | ) | |||||||||||||||||||||||||||||||
2,50 to <10,00 | 4,948 | 2,133 | 38.29 | % | 5,738 | 4.88 | % | 11,788 | 38.92 | % | 3 | 5,759 | 100 | % | 106 | (181 | ) | |||||||||||||||||||||||||||||||
2,50 to <5,00 | 3,191 | 1,696 | 38.13 | % | 3,814 | 3.55 | % | 7,562 | 39.16 | % | 3 | 3,472 | 91 | % | 52 | (103 | ) | |||||||||||||||||||||||||||||||
5,00 to <10,00 | 1,757 | 438 | 38.91 | % | 1,923 | 7.51 | % | 4,226 | 38.44 | % | 3 | 2,287 | 119 | % | 55 | (78 | ) | |||||||||||||||||||||||||||||||
10,00 to <100,00 | 1,623 | 348 | 48.06 | % | 1,789 | 24.18 | % | 14,332 | 42.06 | % | 3 | 3,385 | 189 | % | 184 | (118 | ) | |||||||||||||||||||||||||||||||
10,00 to <20,00 | 856 | 197 | 44.18 | % | 939 | 13.56 | % | 1,813 | 41.57 | % | 3 | 1,527 | 163 | % | 53 | (71 | ) | |||||||||||||||||||||||||||||||
20,00 to <30,00 | 102 | 12 | 48.53 | % | 108 | 23.80 | % | 254 | 37.80 | % | 3 | 181 | 168 | % | 10 | (7 | ) | |||||||||||||||||||||||||||||||
30,00 to <100,00 | 665 | 138 | 53.54 | % | 742 | 37.68 | % | 12,265 | 43.30 | % | 3 | 1,676 | 226 | % | 121 | (39 | ) | |||||||||||||||||||||||||||||||
100,00 (Default) | 1,444 | 180 | 51.93 | % | 1,537 | 100.00 | % | 5,814 | 42.52 | % | 3 | 451 | 29 | % | 653 | (802 | ) | |||||||||||||||||||||||||||||||
Corporate - Non-SMEs | 62,456 | 71,197 | 66.28 | % | 109,343 | 1.67 | % | 10,847 | 45.59 | % | 2 | 53,442 | 49 | % | 854 | (1,089 | ) | |||||||||||||||||||||||||||||||
|
|
|
|
|
|
|
|
|
|
|
|
|
|
|
|
|
|
|
|
|
|
|
| |||||||||||||||||||||||||
0,00 to <0,15 | 13,793 | 20,491 | 70.67 | % | 28,262 | 0.10 | % | 1,041 | 45.09 | % | 3 | 6,974 | 25 | % | 12 | (21 | ) | |||||||||||||||||||||||||||||||
0,00 to <0,10 | 7,812 | 11,474 | 70.43 | % | 15,882 | 0.08 | % | 348 | 45.00 | % | 3 | 3,287 | 21 | % | 6 | (12 | ) | |||||||||||||||||||||||||||||||
0,10 to <0,15 | 5,982 | 9,016 | 70.98 | % | 12,379 | 0.12 | % | 693 | 45.20 | % | 2 | 3,687 | 30 | % | 7 | (8 | ) | |||||||||||||||||||||||||||||||
0,15 to <0,25 | 28,170 | 33,823 | 65.92 | % | 50,405 | 0.19 | % | 2,530 | 45.87 | % | 2 | 19,909 | 40 | % | 44 | (12 | ) | |||||||||||||||||||||||||||||||
0,25 to <0,50 | 8,897 | 8,649 | 63.80 | % | 14,421 | 0.37 | % | 1,503 | 46.24 | % | 2 | 8,618 | 60 | % | 24 | (12 | ) | |||||||||||||||||||||||||||||||
0,50 to <0,75 | 2,834 | 1,951 | 63.37 | % | 4,075 | 0.60 | % | 946 | 45.00 | % | 2 | 3,067 | 75 | % | 11 | (14 | ) | |||||||||||||||||||||||||||||||
0,75 to <2,50 | 3,729 | 2,722 | 57.84 | % | 5,285 | 1.33 | % | 1,533 | 45.77 | % | 2 | 5,340 | 101 | % | 32 | (35 | ) | |||||||||||||||||||||||||||||||
0,75 to <1,75 | 2,535 | 1,884 | 53.65 | % | 3,537 | 1.09 | % | 1,219 | 45.56 | % | 2 | 3,335 | 94 | % | 17 | (11 | ) | |||||||||||||||||||||||||||||||
1,75 to <2,50 | 1,194 | 839 | 67.27 | % | 1,747 | 1.80 | % | 314 | 46.18 | % | 2 | 2,005 | 115 | % | 15 | (23 | ) | |||||||||||||||||||||||||||||||
2,50 to <10,00 | 3,440 | 3,119 | 52.28 | % | 5,050 | 4.85 | % | 1,912 | 43.18 | % | 2 | 7,409 | 147 | % | 106 | (468 | ) | |||||||||||||||||||||||||||||||
2,50 to <5,00 | 1,823 | 2,024 | 44.47 | % | 2,702 | 3.28 | % | 973 | 42.16 | % | 2 | 3,438 | 127 | % | 37 | (84 | ) | |||||||||||||||||||||||||||||||
5,00 to <10,00 | 1,617 | 1,096 | 66.70 | % | 2,349 | 6.66 | % | 939 | 44.36 | % | 2 | 3,971 | 169 | % | 69 | (384 | ) | |||||||||||||||||||||||||||||||
10,00 to <100,00 | 696 | 205 | 51.10 | % | 810 | 28.22 | % | 909 | 43.70 | % | 2 | 1,914 | 236 | % | 98 | (57 | ) | |||||||||||||||||||||||||||||||
10,00 to <20,00 | 263 | 108 | 51.85 | % | 323 | 14.79 | % | 261 | 45.01 | % | 2 | 748 | 232 | % | 21 | (23 | ) | |||||||||||||||||||||||||||||||
20,00 to <30,00 | 49 | 32 | 63.60 | % | 70 | 23.58 | % | 63 | 46.36 | % | 2 | 176 | 250 | % | 8 | (8 | ) | |||||||||||||||||||||||||||||||
30,00 to <100,00 | 385 | 65 | 43.75 | % | 417 | 39.40 | % | 585 | 42.23 | % | 2 | 990 | 237 | % | 69 | (26 | ) | |||||||||||||||||||||||||||||||
100,00 (Default) | 898 | 236 | 59.13 | % | 1,035 | 100.00 | % | 473 | 50.79 | % | 3 | 213 | 21 | % | 526 | (471 | ) | |||||||||||||||||||||||||||||||
Table of Contents
| BBVA. PILLAR 3 2021 | 4. RISKS | P. 97 |
PD Scale (1)(6) | Original on- balance sheet gross exposure | Off-balance sheet exposures pre CCF | Average CCF(2) | EAD post CRM and post-CCF | Average PD(3) | Number of obligors | Average LGD(4) | Average Maturity (days)(5) | RWAs | RWA Density | EL | Value adjustments and provisions | ||||||||||||||||||||||||||||||||||||
Retail - Immovable property SMEs | 1,093 | 422 | 2.05 | % | 1,101 | 26.12 | % | 21,516 | 20.60 | % | — | 1,347 | 122 | % | 60 | (12 | ) | |||||||||||||||||||||||||||||||
|
|
|
|
|
|
|
|
|
|
|
|
|
|
|
|
|
|
|
|
|
|
|
| |||||||||||||||||||||||||
0,00 to <0,15 | — | — | — | — | — | — | — | — | — | — | — | — | ||||||||||||||||||||||||||||||||||||
0,00 to <0,10 | — | — | — | — | — | — | — | — | — | — | — | — | ||||||||||||||||||||||||||||||||||||
0,10 to <0,15 | — | — | — | — | — | — | — | — | — | — | — | — | ||||||||||||||||||||||||||||||||||||
0,15 to <0,25 | — | — | — | — | — | — | — | — | — | — | — | — | ||||||||||||||||||||||||||||||||||||
0,25 to <0,50 | — | — | — | — | — | — | — | — | — | — | — | — | ||||||||||||||||||||||||||||||||||||
0,50 to <0,75 | — | — | — | — | — | — | — | — | — | — | — | — | ||||||||||||||||||||||||||||||||||||
0,75 to <2,50 | — | — | — | — | — | — | — | — | — | — | — | — | ||||||||||||||||||||||||||||||||||||
0,75 to <1,75 | — | — | — | — | — | — | — | — | — | — | — | — | ||||||||||||||||||||||||||||||||||||
1,75 to <2,50 | — | — | — | — | — | — | — | — | — | — | — | — | ||||||||||||||||||||||||||||||||||||
2,50 to <10,00 | — | — | — | — | — | — | — | — | — | — | — | — | ||||||||||||||||||||||||||||||||||||
2,50 to <5,00 | — | — | — | — | — | — | — | — | — | — | — | — | ||||||||||||||||||||||||||||||||||||
5,00 to <10,00 | — | — | — | — | — | — | — | — | — | — | — | — | ||||||||||||||||||||||||||||||||||||
10,00 to <100,00 | 1,052 | 420 | 2.05 | % | 1,060 | 23.24 | % | 20,847 | 20.51 | % | — | 1,339 | 126 | % | 51 | (2 | ) | |||||||||||||||||||||||||||||||
10,00 to <20,00 | — | — | — | — | — | — | — | — | — | — | — | — | ||||||||||||||||||||||||||||||||||||
20,00 to <30,00 | 1,036 | 420 | 2.05 | % | 1,045 | 22.36 | % | 20,638 | 20.48 | % | — | 1,331 | 127 | % | 48 | (1 | ) | |||||||||||||||||||||||||||||||
30,00 to <100,00 | 15 | — | — | % | 15 | 82.72 | % | 209 | 22.38 | % | — | 8 | 49 | % | 3 | (1 | ) | |||||||||||||||||||||||||||||||
100,00 (Default) | 41 | 2 | 2.69 | % | 41 | 100.00 | % | 669 | 22.99 | % | — | 8 | 18 | % | 9 | (11 | ) | |||||||||||||||||||||||||||||||
Retail - Immovable property non-SMEs | 71,199 | 4,485 | 2.07 | % | 71,292 | 4.65 | % | 1,015,918 | 21.90 | % | — | 9,681 | 14 | % | 572 | (881 | ) | |||||||||||||||||||||||||||||||
|
|
|
|
|
|
|
|
|
|
|
|
|
|
|
|
|
|
|
|
|
|
|
| |||||||||||||||||||||||||
0,00 to <0,15 | 44,579 | 3,206 | 2.06 | % | 44,645 | 0.05 | % | 656,561 | 21.24 | % | — | 1,374 | 3 | % | 4 | (7 | ) | |||||||||||||||||||||||||||||||
0,00 to <0,10 | 42,186 | 3,079 | 2.06 | % | 42,249 | 0.04 | % | 624,609 | 21.00 | % | — | 1,187 | 3 | % | 3 | (6 | ) | |||||||||||||||||||||||||||||||
0,10 to <0,15 | 2,393 | 127 | 2.24 | % | 2,396 | 0.12 | % | 31,952 | 25.47 | % | — | 187 | 8 | % | 1 | (1 | ) | |||||||||||||||||||||||||||||||
0,15 to <0,25 | 9,022 | 629 | 2.09 | % | 9,035 | 0.19 | % | 135,037 | 22.69 | % | — | 866 | 10 | % | 4 | (5 | ) | |||||||||||||||||||||||||||||||
0,25 to <0,50 | 4,908 | 249 | 2.12 | % | 4,914 | 0.35 | % | 69,130 | 23.36 | % | — | 759 | 15 | % | 4 | (4 | ) | |||||||||||||||||||||||||||||||
0,50 to <0,75 | 1,645 | 88 | 2.10 | % | 1,646 | 0.57 | % | 24,365 | 24.32 | % | — | 370 | 23 | % | 2 | (4 | ) | |||||||||||||||||||||||||||||||
0,75 to <2,50 | 4,975 | 188 | 2.20 | % | 4,979 | 1.41 | % | 63,538 | 24.43 | % | — | 2,059 | 41 | % | 17 | (25 | ) | |||||||||||||||||||||||||||||||
0,75 to <1,75 | 4,154 | 148 | 2.21 | % | 4,157 | 1.30 | % | 53,981 | 23.51 | % | — | 1,553 | 37 | % | 12 | (15 | ) | |||||||||||||||||||||||||||||||
1,75 to <2,50 | 821 | 41 | 2.18 | % | 822 | 1.97 | % | 9,557 | 29.13 | % | — | 506 | 62 | % | 5 | (10 | ) | |||||||||||||||||||||||||||||||
2,50 to <10,00 | 1,943 | 89 | 2.05 | % | 1,945 | 5.08 | % | 23,296 | 26.03 | % | — | 1,772 | 91 | % | 26 | (168 | ) | |||||||||||||||||||||||||||||||
2,50 to <5,00 | 1,107 | 52 | 2.07 | % | 1,108 | 3.38 | % | 13,022 | 25.97 | % | — | 834 | 75 | % | 10 | (121 | ) | |||||||||||||||||||||||||||||||
5,00 to <10,00 | 835 | 37 | 2.02 | % | 836 | 7.33 | % | 10,274 | 26.11 | % | — | 938 | 112 | % | 16 | (46 | ) | |||||||||||||||||||||||||||||||
10,00 to <100,00 | 1,422 | 27 | 2.06 | % | 1,423 | 21.74 | % | 14,701 | 26.46 | % | — | 2,152 | 151 | % | 84 | (65 | ) | |||||||||||||||||||||||||||||||
10,00 to <20,00 | 774 | 20 | 2.08 | % | 775 | 13.03 | % | 8,217 | 25.89 | % | — | 1,089 | 141 | % | 26 | (28 | ) | |||||||||||||||||||||||||||||||
20,00 to <30,00 | 353 | 6 | 2.00 | % | 353 | 23.46 | % | 3,605 | 26.01 | % | — | 576 | 163 | % | 22 | (16 | ) | |||||||||||||||||||||||||||||||
30,00 to <100,00 | 295 | — | 2.67 | % | 295 | 42.54 | % | 2,879 | 28.52 | % | — | 486 | 165 | % | 36 | (21 | ) | |||||||||||||||||||||||||||||||
100,00 (Default) | 2,705 | 10 | 2.01 | % | 2,705 | 100.00 | % | 29,290 | 15.99 | % | — | 330 | 12 | % | 432 | (603 | ) | |||||||||||||||||||||||||||||||
Table of Contents
| BBVA. PILLAR 3 2021 | 4. RISKS | P. 98 |
PD Scale (1)(6) | Original on- balance sheet gross exposure | Off-balance sheet exposures pre CCF | Average CCF(2) | EAD post CRM and post-CCF | Average PD(3) | Number of obligors | Average LGD(4) | Average Maturity (days)(5) | RWAs | RWA Density | EL | Value adjustments and provisions | ||||||||||||||||||||||||||||||||||||
Retail - Other exposures SMEs | 3,101 | 902 | 57.94 | % | 3,590 | 19.63 | % | 204,978 | 47.08 | % | — | 1,519 | 42 | % | 347 | (390 | ) | |||||||||||||||||||||||||||||||
|
|
|
|
|
|
|
|
|
|
|
|
|
|
|
|
|
|
|
|
|
|
|
| |||||||||||||||||||||||||
0,00 to <0,15 | 207 | 179 | 56.30 | % | 299 | 0.12 | % | 24,069 | 46.36 | % | — | 33 | 11 | % | — | (1 | ) | |||||||||||||||||||||||||||||||
0,00 to <0,10 | — | — | — | — | — | — | — | — | — | — | — | — | ||||||||||||||||||||||||||||||||||||
0,10 to <0,15 | 207 | 179 | 56.30 | % | 299 | 0.12 | % | 24,069 | 46.36 | % | — | 33 | 11 | % | — | (1 | ) | |||||||||||||||||||||||||||||||
0,15 to <0,25 | 107 | 59 | 57.75 | % | 139 | 0.20 | % | 8,682 | 47.11 | % | — | 22 | 16 | % | — | (1 | ) | |||||||||||||||||||||||||||||||
0,25 to <0,50 | 197 | 102 | 57.76 | % | 252 | 0.31 | % | 14,362 | 46.82 | % | — | 54 | 22 | % | — | (1 | ) | |||||||||||||||||||||||||||||||
0,50 to <0,75 | 252 | 112 | 58.88 | % | 314 | 0.51 | % | 18,162 | 46.76 | % | — | 91 | 29 | % | 1 | (3 | ) | |||||||||||||||||||||||||||||||
0,75 to <2,50 | 575 | 192 | 59.03 | % | 682 | 1.19 | % | 37,137 | 46.49 | % | — | 290 | 42 | % | 4 | (13 | ) | |||||||||||||||||||||||||||||||
0,75 to <1,75 | 573 | 192 | 59.03 | % | 680 | 1.19 | % | 37,059 | 46.57 | % | — | 289 | 43 | % | 4 | (13 | ) | |||||||||||||||||||||||||||||||
1,75 to <2,50 | 2 | — | — | 2 | 1.89 | % | 78 | 17.41 | % | — | — | 21 | % | — | — | |||||||||||||||||||||||||||||||||
2,50 to <10,00 | 899 | 184 | 58.02 | % | 997 | 4.64 | % | 48,789 | 43.98 | % | — | 553 | 55 | % | 20 | (52 | ) | |||||||||||||||||||||||||||||||
2,50 to <5,00 | 638 | 145 | 57.76 | % | 716 | 3.58 | % | 36,244 | 44.99 | % | — | 392 | 55 | % | 11 | (31 | ) | |||||||||||||||||||||||||||||||
5,00 to <10,00 | 260 | 38 | 59.00 | % | 281 | 7.35 | % | 12,545 | 41.39 | % | — | 161 | 57 | % | 9 | (21 | ) | |||||||||||||||||||||||||||||||
10,00 to <100,00 | 426 | 20 | 60.48 | % | 437 | 26.90 | % | 33,537 | 44.89 | % | — | 406 | 93 | % | 52 | (22 | ) | |||||||||||||||||||||||||||||||
10,00 to <20,00 | 96 | 11 | 61.82 | % | 102 | 14.53 | % | 5,585 | 45.80 | % | — | 78 | 76 | % | 7 | (13 | ) | |||||||||||||||||||||||||||||||
20,00 to <30,00 | 289 | 3 | 44.88 | % | 290 | 29.41 | % | 25,300 | 45.46 | % | — | 289 | 100 | % | 39 | (4 | ) | |||||||||||||||||||||||||||||||
30,00 to <100,00 | 41 | 6 | 65.32 | % | 45 | 38.84 | % | 2,652 | 39.13 | % | — | 39 | 86 | % | 7 | (5 | ) | |||||||||||||||||||||||||||||||
100,00 (Default) | 439 | 55 | 57.20 | % | 470 | 100.00 | % | 20,240 | 57.34 | % | — | 70 | 15 | % | 269 | (297 | ) | |||||||||||||||||||||||||||||||
Retail - Other exposures Non-SMEs | 12,492 | 70 | 61.52 | % | 12,535 | 10.50 | % | 1,290,640 | 47.38 | % | — | 4,639 | 37 | % | 679 | (887 | ) | |||||||||||||||||||||||||||||||
|
|
|
|
|
|
|
|
|
|
|
|
|
|
|
|
|
|
|
|
|
|
|
| |||||||||||||||||||||||||
0,00 to <0,15 | 3,944 | 3 | 57.34 | % | 3,946 | 0.06 | % | 300,733 | 43.51 | % | — | 308 | 8 | % | 1 | (3 | ) | |||||||||||||||||||||||||||||||
0,00 to <0,10 | 3,022 | — | 54.55 | % | 3,022 | 0.04 | % | 202,507 | 43.03 | % | — | 175 | 6 | % | — | (2 | ) | |||||||||||||||||||||||||||||||
0,10 to <0,15 | 923 | 2 | 57.40 | % | 924 | 0.13 | % | 98,226 | 45.08 | % | — | 133 | 14 | % | — | (1 | ) | |||||||||||||||||||||||||||||||
0,15 to <0,25 | 1,057 | 1 | 53.11 | % | 1,057 | 0.22 | % | 101,141 | 45.28 | % | — | 225 | 21 | % | 1 | (2 | ) | |||||||||||||||||||||||||||||||
0,25 to <0,50 | 1,001 | 1 | 57.00 | % | 1,001 | 0.39 | % | 111,797 | 45.36 | % | — | 309 | 31 | % | 2 | (3 | ) | |||||||||||||||||||||||||||||||
0,50 to <0,75 | 557 | 2 | 55.51 | % | 558 | 0.63 | % | 66,857 | 47.81 | % | — | 236 | 42 | % | 2 | (2 | ) | |||||||||||||||||||||||||||||||
0,75 to <2,50 | 3,404 | 27 | 51.15 | % | 3,418 | 1.44 | % | 447,148 | 48.84 | % | — | 2,059 | 60 | % | 24 | (33 | ) | |||||||||||||||||||||||||||||||
0,75 to <1,75 | 2,393 | 27 | 51.15 | % | 2,406 | 1.12 | % | 301,368 | 47.91 | % | — | 1,318 | 55 | % | 13 | (18 | ) | |||||||||||||||||||||||||||||||
1,75 to <2,50 | 1,011 | — | 66.67 | % | 1,011 | 2.20 | % | 145,780 | 51.06 | % | — | 741 | 73 | % | 11 | (15 | ) | |||||||||||||||||||||||||||||||
2,50 to <10,00 | 1,072 | 8 | 57.83 | % | 1,076 | 4.37 | % | 123,391 | 51.98 | % | — | 882 | 82 | % | 24 | (72 | ) | |||||||||||||||||||||||||||||||
2,50 to <5,00 | 751 | 6 | 57.94 | % | 755 | 3.50 | % | 91,577 | 52.73 | % | — | 614 | 81 | % | 14 | (52 | ) | |||||||||||||||||||||||||||||||
5,00 to <10,00 | 321 | 2 | 57.53 | % | 322 | 6.40 | % | 31,814 | 50.21 | % | — | 268 | 83 | % | 10 | (20 | ) | |||||||||||||||||||||||||||||||
10,00 to <100,00 | 444 | 25 | 72.26 | % | 462 | 29.72 | % | 45,930 | 50.82 | % | — | 570 | 123 | % | 68 | (50 | ) | |||||||||||||||||||||||||||||||
10,00 to <20,00 | 183 | 4 | 42.54 | % | 184 | 13.64 | % | 16,691 | 55.23 | % | — | 210 | 114 | % | 14 | (18 | ) | |||||||||||||||||||||||||||||||
20,00 to <30,00 | 76 | 13 | 87.73 | % | 87 | 26.85 | % | 15,628 | 49.93 | % | — | 116 | 132 | % | 12 | (8 | ) | |||||||||||||||||||||||||||||||
30,00 to <100,00 | 186 | 8 | 62.13 | % | 191 | 46.59 | % | 13,611 | 46.97 | % | — | 245 | 128 | % | 43 | (24 | ) | |||||||||||||||||||||||||||||||
100,00 (Default) | 1,012 | 4 | 92.18 | % | 1,016 | 100.00 | % | 93,643 | 54.96 | % | — | 49 | 5 | % | 558 | (723 | ) | |||||||||||||||||||||||||||||||
Table of Contents
| BBVA. PILLAR 3 2021 | 4. RISKS | P. 99 |
PD Scale (1)(6) | Original on- balance sheet gross exposure | Off-balance sheet exposures pre CCF | Average CCF(2) | EAD post CRM and post-CCF | Average PD(3) | Number of obligors | Average LGD(4) | Average Maturity (days)(5) | RWAs | RWA Density | EL | Value adjustments and provisions | ||||||||||||||||||||||||||||||||||||
Retail - qualifying revolving (QRRE) | 7,172 | 18,488 | 17.08 | % | 10,315 | 6.96 | % | 10,460,733 | 69.68 | % | — | 6,541 | 63 | % | 516 | (607 | ) | |||||||||||||||||||||||||||||||
|
|
|
|
|
|
|
|
|
|
|
|
|
|
|
|
|
|
|
|
|
|
|
| |||||||||||||||||||||||||
0,00 to <0,15 | 698 | 2,906 | 28.07 | % | 1,514 | 0.04 | % | 1,587,147 | 41.86 | % | — | 20 | 1 | % | — | — | ||||||||||||||||||||||||||||||||
0,00 to <0,10 | 627 | 2,734 | 27.96 | % | 1,392 | 0.03 | % | 1,437,152 | 41.55 | % | — | 15 | 1 | % | — | — | ||||||||||||||||||||||||||||||||
0,10 to <0,15 | 71 | 172 | 29.77 | % | 122 | 0.14 | % | 149,995 | 45.31 | % | — | 5 | 4 | % | — | — | ||||||||||||||||||||||||||||||||
0,15 to <0,25 | 494 | 1,917 | 29.50 | % | 1,060 | 0.19 | % | 1,243,165 | 42.10 | % | — | 50 | 5 | % | 1 | (1 | ) | |||||||||||||||||||||||||||||||
0,25 to <0,50 | 241 | 1,160 | 10.45 | % | 362 | 0.43 | % | 327,427 | 73.83 | % | — | 58 | 16 | % | 1 | (5 | ) | |||||||||||||||||||||||||||||||
0,50 to <0,75 | 639 | 2,446 | 9.43 | % | 870 | 0.60 | % | 776,720 | 74.01 | % | — | 181 | 21 | % | 4 | (15 | ) | |||||||||||||||||||||||||||||||
0,75 to <2,50 | 1,898 | 4,973 | 12.45 | % | 2,517 | 1.42 | % | 2,081,563 | 79.34 | % | — | 1,075 | 43 | % | 28 | (76 | ) | |||||||||||||||||||||||||||||||
0,75 to <1,75 | 1,325 | 3,647 | 11.95 | % | 1,760 | 1.15 | % | 1,413,293 | 78.64 | % | — | 638 | 36 | % | 16 | (47 | ) | |||||||||||||||||||||||||||||||
1,75 to <2,50 | 573 | 1,326 | 13.83 | % | 757 | 2.05 | % | 668,270 | 80.97 | % | — | 437 | 58 | % | 12 | (29 | ) | |||||||||||||||||||||||||||||||
2,50 to <10,00 | 2,187 | 4,380 | 14.08 | % | 2,804 | 5.65 | % | 3,252,103 | 80.74 | % | — | 3,189 | 114 | % | 127 | (186 | ) | |||||||||||||||||||||||||||||||
2,50 to <5,00 | 1,032 | 1,887 | 15.27 | % | 1,320 | 3.69 | % | 1,240,999 | 78.99 | % | — | 1,120 | 85 | % | 38 | (68 | ) | |||||||||||||||||||||||||||||||
5,00 to <10,00 | 1,155 | 2,493 | 13.19 | % | 1,484 | 7.40 | % | 2,011,104 | 82.29 | % | — | 2,069 | 139 | % | 90 | (118 | ) | |||||||||||||||||||||||||||||||
10,00 to <100,00 | 785 | 690 | 24.96 | % | 957 | 23.75 | % | 994,170 | 77.48 | % | — | 1,956 | 205 | % | 160 | (143 | ) | |||||||||||||||||||||||||||||||
10,00 to <20,00 | 467 | 385 | 25.29 | % | 564 | 13.22 | % | 603,827 | 82.54 | % | — | 1,093 | 194 | % | 61 | (65 | ) | |||||||||||||||||||||||||||||||
20,00 to <30,00 | 129 | 79 | 14.63 | % | 141 | 24.70 | % | 151,787 | 81.11 | % | — | 351 | 250 | % | 28 | (30 | ) | |||||||||||||||||||||||||||||||
30,00 to <100,00 | 188 | 226 | 27.99 | % | 252 | 46.82 | % | 238,556 | 64.13 | % | — | 512 | 203 | % | 71 | (49 | ) | |||||||||||||||||||||||||||||||
100,00 (Default) | 229 | 15 | 20.13 | % | 232 | 100.00 | % | 198,438 | 84.01 | % | — | 13 | 6 | % | 195 | (181 | ) | |||||||||||||||||||||||||||||||
|
|
|
|
|
|
|
|
|
|
|
|
|
|
|
|
|
|
|
|
|
|
|
| |||||||||||||||||||||||||
Total IRB Approach | 195,081 | 108,414 | 51.52 | % | 252,973 | 4.29 | % | 13,058,657 | 38.46 | % | 97,614 | 39 | % | 4,032 | (5,053 | ) | ||||||||||||||||||||||||||||||||
|
|
|
|
|
|
|
|
|
|
|
|
|
|
|
|
|
|
|
|
|
|
|
| |||||||||||||||||||||||||
| (*) | Exposures of less than 500,000 euros rounded down to zero are shown with a dash. |
| (**) | As of 31 December 2021, the table has been adapted to the New EBA ITS, highlighting the following modifications: greater granularity is included in the PD tranches; exposures secured by real estate are split between SMEs and Non-SMEs; equity and specialised lending exposures are excluded; the average maturity is shown in years; the gross exposure corresponds to the exposure after value adjustments and after the effect of guarantor substitution. |
| (1) | PD intervals established by the New EBA ITS. |
| (2) | Calculated as EAD after CCF for off-balance sheet exposure over total off-balance exposure before CCF |
| (3) | Corresponds to obligor grade PD weighted by EAD post CRM |
| (4) | Corresponds to obligor grade LGD weighted by EAD post CRM |
| (5) | Corresponds to the maturity of the obligor in years weighted by EAD. In accordance with Regulation (EU) 680/2014, it is reported only for those categories where average maturities are relevant for the calculation of RWAs. Residual maturities of less than one year are rounded to 1. |
| (6) | Specialised lending exposures are included in the FIRB approach. The Group has chosen to use the supervisory category attribution criteria method, in line with the provisions of article 153.5 of the CRR, and therefore, following the New EBA ITS, Specialised lending exposures are not included in this table. |
Table of Contents
| BBVA. PILLAR 3 2021 | 4. RISKS | P. 100 |
EU CR6 - IRB approach - Credit risk exposures by exposure class and PD range (Million Euros. 12-31-2020)
PD Scale (1)(7) | Original on- balance sheet gross exposure | Off-balance sheet exposures pre CCF | Average CCF(2) | EAD post CRM and post-CCF | Average PD(3) | Number of obligors | Average LGD(4) | Average Maturity (days)(5) | RWAs | RWA Density | EL | Value adjustments and provisions | ||||||||||||||||||||||||||||||||||||
Prudential portfolios for FIRB approach(6) | 4,938 | 616 | 56.01 | % | 5,283 | — | 332 | — | — | 4,263 | 81 | % | 69 | (23 | ) | |||||||||||||||||||||||||||||||||
|
|
|
|
|
|
|
|
|
|
|
|
|
|
|
|
|
|
|
|
|
|
|
| |||||||||||||||||||||||||
Corporate - Specialised lending | 4,938 | 616 | 56.01 | % | 5,283 | — | 332 | — | — | 4,263 | 81 | % | 69 | (23 | ) | |||||||||||||||||||||||||||||||||
|
|
|
|
|
|
|
|
|
|
|
|
|
|
|
|
|
|
|
|
|
|
|
| |||||||||||||||||||||||||
Prudential portfolios for AIRB approach | 214,542 | 100,982 | 40.73 | % | 231,880 | 4.03 | % | 11,107,380 | 37.28 | % | — | 81,798 | 35 | % | 3,665 | (5,372 | ) | |||||||||||||||||||||||||||||||
|
|
|
|
|
|
|
|
|
|
|
|
|
|
|
|
|
|
|
|
|
|
|
| |||||||||||||||||||||||||
Central governments or central banks | 12,664 | 271 | 48.78 | % | 13,930 | 0.27 | % | 66 | 23.19 | % | 370 | 843 | 6 | % | 14 | (7 | ) | |||||||||||||||||||||||||||||||
|
|
|
|
|
|
|
|
|
|
|
|
|
|
|
|
|
|
|
|
|
|
|
| |||||||||||||||||||||||||
0,00 to <0,15 | 12,315 | 108 | 48.31 | % | 13,749 | 0.03 | % | 28 | 22.91 | % | 366 | 734 | 5 | % | 1 | (1 | ) | |||||||||||||||||||||||||||||||
0,15 to <0,25 | 79 | 51 | 50.30 | % | 82 | 0.20 | % | 4 | 43.62 | % | 680 | 41 | 50 | % | — | — | ||||||||||||||||||||||||||||||||
0,25 to <0,50 | 3 | 3 | 40.68 | % | 38 | 0.29 | % | 3 | 48.72 | % | 887 | 29 | 76 | % | — | — | ||||||||||||||||||||||||||||||||
0,50 to <0,75 | — | — | 52.14 | % | 8 | 0.48 | % | 1 | 51.81 | % | 627 | 10 | 125 | % | — | (1 | ) | |||||||||||||||||||||||||||||||
0,75 to <2,50 | 63 | 1 | 51.20 | % | 14 | 1.11 | % | 4 | 47.73 | % | 819 | 13 | 93 | % | — | — | ||||||||||||||||||||||||||||||||
2,50 to <10,00 | 14 | 41 | 54.35 | % | 4 | 2.76 | % | 14 | 47.03 | % | 756 | 5 | 139 | % | — | (1 | ) | |||||||||||||||||||||||||||||||
10,00 to <100,00 | 1 | 7 | 50.24 | % | 3 | 19.15 | % | 6 | 39.87 | % | 103 | 7 | 201 | % | — | — | ||||||||||||||||||||||||||||||||
100,00 (Default) | 189 | 61 | 0.00 | % | 32 | 100.00 | % | 6 | 39.99 | % | 401 | 4 | 14 | % | 13 | (4 | ) | |||||||||||||||||||||||||||||||
Institutions | 26,470 | 6,932 | 55.10 | % | 15,934 | 0.35 | % | 3,200 | 42.50 | % | 594 | 4,754 | 30 | % | 26 | (33 | ) | |||||||||||||||||||||||||||||||
|
|
|
|
|
|
|
|
|
|
|
|
|
|
|
|
|
|
|
|
|
|
|
| |||||||||||||||||||||||||
0,00 to <0,15 | 20,022 | 5,153 | 55.48 | % | 12,803 | 0.07 | % | 1,844 | 43.96 | % | 591 | 3,099 | 24 | % | 4 | (8 | ) | |||||||||||||||||||||||||||||||
0,15 to <0,25 | 2,262 | 582 | 52.29 | % | 1,011 | 0.20 | % | 489 | 42.45 | % | 529 | 402 | 40 | % | 1 | (2 | ) | |||||||||||||||||||||||||||||||
0,25 to <0,50 | 2,848 | 862 | 58.85 | % | 1,006 | 0.31 | % | 310 | 25.29 | % | 683 | 297 | 30 | % | 1 | (3 | ) | |||||||||||||||||||||||||||||||
0,50 to <0,75 | 344 | 109 | 47.36 | % | 265 | 0.51 | % | 170 | 37.30 | % | 1,143 | 160 | 61 | % | 1 | (1 | ) | |||||||||||||||||||||||||||||||
0,75 to <2,50 | 785 | 149 | 53.27 | % | 725 | 1.44 | % | 153 | 42.41 | % | 403 | 616 | 85 | % | 4 | (2 | ) | |||||||||||||||||||||||||||||||
2,50 to <10,00 | 88 | 63 | 50.29 | % | 71 | 5.27 | % | 143 | 39.97 | % | 690 | 101 | 143 | % | 2 | (1 | ) | |||||||||||||||||||||||||||||||
10,00 to <100,00 | 53 | 15 | 50.09 | % | 31 | 16.97 | % | 20 | 45.67 | % | 817 | 75 | 242 | % | 2 | — | ||||||||||||||||||||||||||||||||
100,00 (Default) | 67 | — | 46.88 | % | 21 | 100.00 | % | 71 | 53.92 | % | 98 | 3 | 14 | % | 11 | (15 | ) | |||||||||||||||||||||||||||||||
Corporate SMEs | 17,961 | 5,155 | 39.27 | % | 15,596 | 12.57 | % | 34,205 | 44.14 | % | 825 | 11,329 | 73 | % | 866 | (1,028 | ) | |||||||||||||||||||||||||||||||
|
|
|
|
|
|
|
|
|
|
|
|
|
|
|
|
|
|
|
|
|
|
|
| |||||||||||||||||||||||||
0,00 to <0,15 | 2,399 | 1,230 | 41.41 | % | 2,796 | 0.11 | % | 6,157 | 50.59 | % | 654 | 739 | 26 | % | 2 | (3 | ) | |||||||||||||||||||||||||||||||
0,15 to <0,25 | 768 | 323 | 42.85 | % | 795 | 0.20 | % | 1,745 | 50.82 | % | 632 | 307 | 39 | % | 1 | (2 | ) | |||||||||||||||||||||||||||||||
0,25 to <0,50 | 1,293 | 494 | 44.91 | % | 1,274 | 0.31 | % | 2,610 | 48.11 | % | 676 | 632 | 50 | % | 2 | (3 | ) | |||||||||||||||||||||||||||||||
0,50 to <0,75 | 2,185 | 551 | 44.68 | % | 1,803 | 0.52 | % | 3,316 | 44.41 | % | 879 | 1,232 | 68 | % | 4 | (8 | ) | |||||||||||||||||||||||||||||||
0,75 to <2,50 | 4,387 | 1,102 | 36.74 | % | 3,342 | 1.12 | % | 6,117 | 41.94 | % | 946 | 2,934 | 88 | % | 16 | (26 | ) | |||||||||||||||||||||||||||||||
2,50 to <10,00 | 4,337 | 1,143 | 36.23 | % | 3,213 | 4.79 | % | 9,005 | 38.56 | % | 1,148 | 3,753 | 117 | % | 59 | (131 | ) | |||||||||||||||||||||||||||||||
10,00 to <100,00 | 943 | 270 | 30.87 | % | 773 | 19.39 | % | 2,620 | 37.04 | % | 1,264 | 1,248 | 162 | % | 56 | (54 | ) | |||||||||||||||||||||||||||||||
100,00 (Default) | 1,649 | 42 | 33.17 | % | 1,602 | 100.00 | % | 2,635 | 45.37 | % | 160 | 486 | 30 | % | 727 | (801 | ) | |||||||||||||||||||||||||||||||
Table of Contents
| BBVA. PILLAR 3 2021 | 4. RISKS | P. 101 |
PD Scale (1)(7) | Original on- balance sheet gross exposure | Off-balance sheet exposures pre CCF | Average CCF(2) | EAD post CRM and post-CCF | Average PD(3) | Number of obligors | Average LGD(4) | Average Maturity (days)(5) | RWAs | RWA Density | EL | Value adjustments and provisions | ||||||||||||||||||||||||||||||||||||
Corporate Non-SMEs | 62,268 | 66,392 | 47.79 | % | 89,319 | 2.31 | % | 12,818 | 42.14 | % | 692 | 42,456 | 48 | % | 771 | (1,285 | ) | |||||||||||||||||||||||||||||||
|
|
|
|
|
|
|
|
|
|
|
|
|
|
|
|
|
|
|
|
|
|
|
| |||||||||||||||||||||||||
0,00 to <0,15 | 21,200 | 30,625 | 48.69 | % | 36,839 | 0.11 | % | 2,576 | 43.93 | % | 674 | 10,049 | 27 | % | 18 | (12 | ) | |||||||||||||||||||||||||||||||
0,15 to <0,25 | 10,499 | 14,432 | 46.99 | % | 17,369 | 0.29 | % | 1,259 | 41.95 | % | 713 | 7,366 | 42 | % | 21 | (12 | ) | |||||||||||||||||||||||||||||||
0,25 to <0,50 | 11,463 | 11,008 | 47.28 | % | 16,400 | 0.33 | % | 2,149 | 40.57 | % | 714 | 8,833 | 54 | % | 22 | (22 | ) | |||||||||||||||||||||||||||||||
0,50 to <0,75 | 7,248 | 5,041 | 46.21 | % | 8,308 | 0.60 | % | 1,831 | 39.72 | % | 763 | 5,639 | 68 | % | 20 | (21 | ) | |||||||||||||||||||||||||||||||
0,75 to <2,50 | 6,295 | 3,768 | 47.32 | % | 5,836 | 1.48 | % | 1,990 | 41.20 | % | 776 | 5,574 | 96 | % | 36 | (58 | ) | |||||||||||||||||||||||||||||||
2,50 to <10,00 | 3,115 | 1,093 | 48.51 | % | 2,242 | 4.30 | % | 2,167 | 41.84 | % | 513 | 2,980 | 133 | % | 40 | (248 | ) | |||||||||||||||||||||||||||||||
10,00 to <100,00 | 907 | 306 | 42.02 | % | 808 | 20.41 | % | 270 | 40.92 | % | 688 | 1,730 | 214 | % | 66 | (33 | ) | |||||||||||||||||||||||||||||||
100,00 (Default) | 1,542 | 120 | 29.75 | % | 1,517 | 100.00 | % | 576 | 36.13 | % | 211 | 286 | 19 | % | 548 | (880 | ) | |||||||||||||||||||||||||||||||
Retail - Mortgage exposures | 71,759 | 4,311 | 2.00 | % | 71,824 | 4.17 | % | 1,030,894 | 24.03 | % | — | 7,319 | 10 | % | 570 | (1,129 | ) | |||||||||||||||||||||||||||||||
|
|
|
|
|
|
|
|
|
|
|
|
|
|
|
|
|
|
|
|
|
|
|
| |||||||||||||||||||||||||
0,00 to <0,15 | 55,416 | — | — | 55,463 | 0.04 | % | 824,534 | 23.35 | % | — | 1,733 | 3 | % | 6 | (18 | ) | ||||||||||||||||||||||||||||||||
0,15 to <0,25 | 3,312 | — | — | 3,311 | 0.20 | % | 41,258 | 28.60 | % | — | 402 | 12 | % | 2 | (5 | ) | ||||||||||||||||||||||||||||||||
0,25 to <0,50 | 1,703 | — | — | 1,710 | 0.32 | % | 24,476 | 30.88 | % | — | 314 | 18 | % | 2 | (8 | ) | ||||||||||||||||||||||||||||||||
0,50 to <0,75 | 2,197 | 261 | — | 2,201 | 0.49 | % | 30,465 | 27.96 | % | — | 500 | 23 | % | 3 | (12 | ) | ||||||||||||||||||||||||||||||||
0,75 to <2,50 | 3,737 | 321 | 2.00 | % | 3,743 | 1.01 | % | 49,590 | 27.08 | % | — | 1,342 | 36 | % | 10 | (46 | ) | |||||||||||||||||||||||||||||||
2,50 to <10,00 | 2,167 | 210 | 2.01 | % | 2,171 | 4.98 | % | 27,586 | 26.23 | % | — | 1,900 | 88 | % | 28 | (245 | ) | |||||||||||||||||||||||||||||||
10,00 to <100,00 | 509 | 42 | 2.00 | % | 509 | 16.96 | % | 6,337 | 27.23 | % | — | 779 | 153 | % | 24 | (46 | ) | |||||||||||||||||||||||||||||||
100,00 (Default) | 2,718 | — | 2.36 | % | 2,715 | 100.00 | % | 26,648 | 18.27 | % | — | 350 | 13 | % | 496 | (749 | ) | |||||||||||||||||||||||||||||||
Retail - Other exposures SMEs | 4,153 | 1,611 | 54.78 | % | 3,208 | 15.63 | % | 162,989 | 51.77 | % | — | 1,287 | 40 | % | 304 | (296 | ) | |||||||||||||||||||||||||||||||
|
|
|
|
|
|
|
|
|
|
|
|
|
|
|
|
|
|
|
|
|
|
|
| |||||||||||||||||||||||||
0,00 to <0,15 | 422 | — | 52.31 | % | 418 | 0.12 | % | 25,064 | 52.62 | % | — | 55 | 13 | % | — | (1 | ) | |||||||||||||||||||||||||||||||
0,15 to <0,25 | 193 | — | 56.80 | % | 173 | 0.20 | % | 7,615 | 52.35 | % | — | 37 | 21 | % | — | — | ||||||||||||||||||||||||||||||||
0,25 to <0,50 | 327 | — | 55.55 | % | 304 | 0.31 | % | 13,110 | 52.43 | % | — | 90 | 30 | % | — | (1 | ) | |||||||||||||||||||||||||||||||
0,50 to <0,75 | 387 | 218 | 54.38 | % | 312 | 0.52 | % | 15,445 | 51.71 | % | — | 112 | 36 | % | 1 | (1 | ) | |||||||||||||||||||||||||||||||
0,75 to <2,50 | 863 | 329 | 56.98 | % | 593 | 1.17 | % | 32,103 | 50.92 | % | — | 287 | 48 | % | 4 | (5 | ) | |||||||||||||||||||||||||||||||
2,50 to <10,00 | 1,283 | 276 | 57.58 | % | 829 | 4.28 | % | 44,179 | 46.67 | % | — | 484 | 58 | % | 17 | (18 | ) | |||||||||||||||||||||||||||||||
10,00 to <100,00 | 252 | 41 | 45.84 | % | 161 | 23.31 | % | 10,139 | 47.24 | % | — | 143 | 89 | % | 18 | (13 | ) | |||||||||||||||||||||||||||||||
100,00 (Default) | 427 | 10 | 39.98 | % | 418 | 100.00 | % | 15,334 | 63.31 | % | — | 80 | 19 | % | 265 | (256 | ) | |||||||||||||||||||||||||||||||
Retail - Other exposures Non-SMEs | 11,175 | 15 | 52.81 | % | 11,166 | 8.58 | % | 1,013,058 | 55.25 | % | — | 3,876 | 35 | % | 538 | (862 | ) | |||||||||||||||||||||||||||||||
|
|
|
|
|
|
|
|
|
|
|
|
|
|
|
|
|
|
|
|
|
|
|
| |||||||||||||||||||||||||
0,00 to <0,15 | 4,751 | 4 | 42.32 | % | 4,752 | 0.06 | % | 362,577 | 52.40 | % | — | 418 | 9 | % | 1 | (4 | ) | |||||||||||||||||||||||||||||||
0,15 to <0,25 | 440 | 1 | 60.42 | % | 441 | 0.20 | % | 48,192 | 57.91 | % | — | 111 | 25 | % | 1 | (2 | ) | |||||||||||||||||||||||||||||||
0,25 to <0,50 | 1,129 | 1 | 76.75 | % | 1,130 | 0.31 | % | 120,280 | 57.51 | % | — | 373 | 33 | % | 2 | (7 | ) | |||||||||||||||||||||||||||||||
0,50 to <0,75 | 881 | 1 | 56.92 | % | 879 | 0.60 | % | 97,446 | 56.22 | % | — | 415 | 47 | % | 3 | (8 | ) | |||||||||||||||||||||||||||||||
0,75 to <2,50 | 1,612 | 3 | 47.86 | % | 1,609 | 1.22 | % | 169,642 | 58.61 | % | — | 1,073 | 67 | % | 11 | (29 | ) | |||||||||||||||||||||||||||||||
2,50 to <10,00 | 1,322 | 3 | 56.00 | % | 1,316 | 3.90 | % | 122,097 | 57.46 | % | — | 1,136 | 86 | % | 30 | (107 | ) | |||||||||||||||||||||||||||||||
10,00 to <100,00 | 234 | 1 | 33.85 | % | 233 | 29.49 | % | 23,870 | 55.79 | % | — | 320 | 137 | % | 38 | (47 | ) | |||||||||||||||||||||||||||||||
100,00 (Default) | 807 | — | 42.86 | % | 806 | 100.00 | % | 68,954 | 55.96 | % | — | 30 | 4 | % | 451 | (657 | ) | |||||||||||||||||||||||||||||||
Table of Contents
| BBVA. PILLAR 3 2021 | 4. RISKS | P. 102 |
PD Scale (1)(7) | Original on- balance sheet gross exposure | Off-balance sheet exposures pre CCF | Average CCF(2) | EAD post CRM and post-CCF | Average PD(3) | Number of obligors | Average LGD(4) | Average Maturity (days)(5) | RWAs | RWA Density | EL | Value adjustments and provisions | ||||||||||||||||||||||||||||||||||||
Retail - qualifying revolving (QRRE) | 6,222 | 16,294 | 17.26 | % | 9,035 | 7.77 | % | 8,850,150 | 67.80 | % | — | 5,987 | 66 | % | 557 | (734 | ) | |||||||||||||||||||||||||||||||
|
|
|
|
|
|
|
|
|
|
|
|
|
|
|
|
|
|
|
|
|
|
|
| |||||||||||||||||||||||||
0,00 to <0,15 | 906 | 4,522 | 23.80 | % | 1,982 | 0.04 | % | 2,568,735 | 46.79 | % | — | 25 | 1 | % | — | (1 | ) | |||||||||||||||||||||||||||||||
0,15 to <0,25 | 130 | 204 | 22.88 | % | 177 | 0.21 | % | 248,504 | 47.48 | % | — | 10 | 5 | % | — | (1 | ) | |||||||||||||||||||||||||||||||
0,25 to <0,50 | 50 | 105 | 25.19 | % | 76 | 0.31 | % | 98,125 | 49.42 | % | — | 7 | 9 | % | — | — | ||||||||||||||||||||||||||||||||
0,50 to <0,75 | 548 | 1,911 | 12.35 | % | 784 | 0.53 | % | 652,799 | 69.48 | % | — | 147 | 19 | % | 3 | (4 | ) | |||||||||||||||||||||||||||||||
0,75 to <2,50 | 1,296 | 4,493 | 12.66 | % | 1,865 | 1.19 | % | 1,516,590 | 73.95 | % | — | 688 | 37 | % | 16 | (31 | ) | |||||||||||||||||||||||||||||||
2,50 to <10,00 | 2,203 | 4,566 | 16.34 | % | 2,949 | 5.28 | % | 2,814,082 | 75.07 | % | — | 3,120 | 106 | % | 118 | (206 | ) | |||||||||||||||||||||||||||||||
10,00 to <100,00 | 770 | 492 | 22.85 | % | 883 | 22.59 | % | 766,499 | 75.99 | % | — | 1,977 | 224 | % | 151 | (230 | ) | |||||||||||||||||||||||||||||||
100,00 (Default) | 319 | — | 25.27 | % | 319 | 100.00 | % | 184,816 | 84.02 | % | — | 14 | 5 | % | 268 | (260 | ) | |||||||||||||||||||||||||||||||
Equity | 1,869 | — | — | 1,869 | 1.08 | % | — | 90.00 | % | — | 3,945 | 211 | % | 18 | — | |||||||||||||||||||||||||||||||||
|
|
|
|
|
|
|
|
|
|
|
|
|
|
|
|
|
|
|
|
|
|
|
| |||||||||||||||||||||||||
0,00 to <0,15 | 895 | — | — | 895 | 0.14 | % | — | 90.00 | % | — | 1,073 | 120 | % | 1 | — | |||||||||||||||||||||||||||||||||
0,15 to <0,25 | 106 | — | — | 106 | 0.20 | % | — | 90.00 | % | — | 160 | 151 | % | — | — | |||||||||||||||||||||||||||||||||
0,25 to <0,50 | 17 | — | — | 17 | 0.31 | % | — | 90.00 | % | — | 29 | 173 | % | — | — | |||||||||||||||||||||||||||||||||
0,50 to <0,75 | — | — | — | — | — | — | — | — | — | — | — | — | ||||||||||||||||||||||||||||||||||||
0,75 to <2,50 | 285 | — | — | 285 | 1.50 | % | — | 90.00 | % | — | 831 | 292 | % | 4 | — | |||||||||||||||||||||||||||||||||
2,50 to <10,00 | 567 | — | — | 567 | 2.55 | % | — | 90.00 | % | — | 1,852 | 327 | % | 13 | — | |||||||||||||||||||||||||||||||||
10,00 to <100,00 | — | — | — | — | — | — | — | — | — | — | — | — | ||||||||||||||||||||||||||||||||||||
100,00 (Default) | — | — | — | — | — | — | — | — | — | — | — | — | ||||||||||||||||||||||||||||||||||||
|
|
|
|
|
|
|
|
|
|
|
|
|
|
|
|
|
|
|
|
|
|
|
| |||||||||||||||||||||||||
Total IRB Approach | 219,480 | 101,598 | 40.73 | % | 237,163 | 4.03 | % | 11,107,380 | 37.28 | % | 86,061 | 36 | % | 3,733 | (5,395 | ) | ||||||||||||||||||||||||||||||||
|
|
|
|
|
|
|
|
|
|
|
|
|
|
|
|
|
|
|
|
|
|
|
| |||||||||||||||||||||||||
| (*) | Exposures of less than 500,000 euros rounded down to zero are shown with a dash. |
| (1) | PD Intervals recommended by the EBA Guidelines on Disclosure Requirements under Part Eight of the CRR |
| (2) | Calculated as EAD after CCF for off-balance sheet exposure over total off-balance exposure before CCF |
| (3) | Corresponds to obligor grade PD weighted by EAD post CRM |
| (4) | Corresponds to obligor grade LGD weighted by EAD post CRM |
| (5) | Corresponds to the obligor maturity in days weighted by EAD post CRM. According to Regulation (EU) No 680/2014, it is reported only for categories in which the average maturities are relevant for the calculation of RWAs. |
| (6) | Exposure classified in the FIRB approach corresponds to specialised lending. The Group has chosen to use the slotting criteria, in line with Article 153.5 of the CRR. |
| (7) | It does not include the frontloading amount to partially cover the regulatory impacts derived from Targeted Review of Internal Models (TRIM) and other regulatory/supervisory impacts. |
For information about exposures and RWA under IRB approach, see Table 12.
Table of Contents
| BBVA. PILLAR 3 2021 | 4. RISKS | P. 103 |
The information included in the above tables is set out below in chart format:
Chart 7. IRB Approach: EAD by obligor category
Chart 8. IRB Approach: Weighted average PD by EAD
Chart 9. IRB Approach: Weighted average LGD by EAD
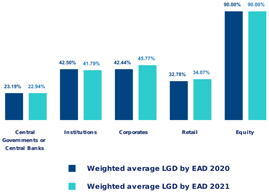
Chart 10. IRB Approach: RWAs by obligor category
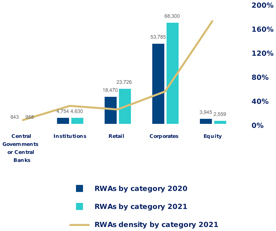
The following table shows the flow statements of credit and counterparty credit risk RWA under internal model (IRB) during the last quarter of 2021:
Table of Contents
| BBVA. PILLAR 3 2021 | 4. RISKS | P. 104 |
Table 32. EU CR8 - RWA flow statements of credit and counterparty risk exposures under the IRB approach (Million Euros)
| Credit Risk | Counterparty Credit Risk | Total | ||||||||||||||||||||||
| RWA amounts | Capital Requirements | RWA amounts | Capital Requirements | RWA amounts | Capital requirements | |||||||||||||||||||
RWAs as of September 30, 2021 | 96,628 | 7,730 | 5,206 | 416 | 101,834 | 8,146 | ||||||||||||||||||
|
|
|
|
|
|
|
|
|
|
|
| |||||||||||||
Asset size | 2,410 | 192 | (471 | ) | (38 | ) | 1,939 | 154 | ||||||||||||||||
Asset quality | (31 | ) | (2 | ) | 597 | 48 | 566 | 46 | ||||||||||||||||
Model updates | — | — | — | — | — | — | ||||||||||||||||||
Methodology and policy | 2,294 | 184 | — | — | 2,294 | 184 | ||||||||||||||||||
Acquisitions and disposals | — | — | — | — | — | — | ||||||||||||||||||
Foreign exchange movements | 812 | 65 | 48 | 4 | 859 | 69 | ||||||||||||||||||
Other | — | — | — | — | — | — | ||||||||||||||||||
|
|
|
|
|
|
|
|
|
|
|
| |||||||||||||
RWAs as of December 31, 2021 | 102,113 | 8,169 | 5,379 | 430 | 107,492 | 8,599 | ||||||||||||||||||
|
|
|
|
|
|
|
|
|
|
|
| |||||||||||||
Within the variation of RWAs due to credit risk in the last quarter of the year it is worth noting the singular effect of the implementation of the new definition of default after the supervisory authorization was received, which had an impact of approximately 10 basis points on the CET 1 of the Group, classified as variation due to “Methodology and policies”5 . In addition, similarly to the evolution of exposures under the standard method, the dynamism of the activity in the wholesale portfolio had a significant effect on the growth of requirements, together with a positive exchange rate effect derived from the appreciation of exposures denominated in USD and MXN.
The full annual series of RWA flow of credit risk under the IRB approach is available in the editable file “Pillar III 2021 – Tables & Annexes”.
4.2.5.3. Comparative analysis of the estimates made
In application of article 452.h) of the CRR, two tables are presented below that show relevant information on the retrospective tests of the probability of default (PD backesting) of exposures to credit risk (excluding counterparty and securitizations), at consolidated level of the BBVA Group. Specifically, the PD estimated for the IRB models is compared with the average annual default rate of obligors.
As of December 31, 2021, this information is shown in the standard format and applying the instructions of the New EBA ITS:
| • | EU CR9: Backtesting of PD per exposure class by fixed PD scale. |
| • | EU CR9.1: Backtesting of PD by exposure class where an additional column is added to report the equivalent external rating. The equivalence between the PD and the external ratings described in section 4.2.5.1.2 has been used. |
Both tables exclude counterparty risk, securitizations and equity. It should be noted that this information is presented at a consolidated level, adding the IRB portfolios of BBVA.S.A. and BBVA Mexico. The information presented in these tables is as follows:
| • | Number of obligors: the obligors at the end of the previous fiscal year are presented. |
| • | Of which: number of obligors who have defaulted: customers who defaulted at some point during the last 12 months, so that the debtors in default during the year are shown for each PD interval. |
| • | Observed average default rate: arithmetic mean of one-year default rates. To calculate this rate, the obligors at the end of the previous year are taken into account in the denominator, and the obligors in default in the numerator. |
| • | Arithmetic average PD and weighted average PD (EU CR9 only): the first one refers to the arithmetic average of the PD per obligor grade at the beginning of the period. The weighted average PD will be calculated by weighting by the exposure value of each PD range used for the RWA calculation. This weighted average PD will be the same as the one reported in the EU CR6 table. |
| • | Average historical annual default rate: it corresponds to the average annual default rate for the previous five years. |
| 5 | The impact of the New Definition of Default in portfolios under the standardised approach was recorded in the first quarter of 2021. |
Table of Contents
| BBVA. PILLAR 3 2021 | 4. RISKS | P. 105 |
Table 33. EU CR9 - IRB approach - Backtesting of PD per exposure class (12-31-2021)
PD Range | Number of obligors at the end of previous year | Of which number of obligors which defaulted in the year | Observed average default rate | Weighted average PD(1) | Arithmetic average PD by obligors(1) | Average historical annual default rate | ||||||||||||||||||
Central governments or central banks |
| |||||||||||||||||||||||
0,00 to <0,15 | 28 | 2 | 7.14 | % | 0.03 | % | 0.07 | % | 11.90 | % | ||||||||||||||
0,00 to <0,10 | 19 | — | — | 0.03 | % | 0.04 | % | 17.54 | % | |||||||||||||||
0,10 to <0,15 | 9 | 2 | 22.22 | % | 0.10 | % | 0.13 | % | — | |||||||||||||||
0,15 to <0,25 | 4 | — | — | 0.20 | % | 0.20 | % | — | ||||||||||||||||
0,25 to <0,50 | 3 | — | — | 0.31 | % | 0.31 | % | — | ||||||||||||||||
0,50 to <0,75 | 1 | — | — | 0.51 | % | 0.51 | % | — | ||||||||||||||||
0,75 to <2,50 | — | — | — | 1.50 | % | — | — | |||||||||||||||||
0,75 to <1,75 | — | — | — | 1.50 | % | — | — | |||||||||||||||||
1,75 to <2,50 | — | — | — | — | — | — | ||||||||||||||||||
2,50 to <10,00 | 8 | — | — | 5.25 | % | 6.13 | % | — | ||||||||||||||||
2,50 to <5,00 | 4 | — | — | 4.41 | % | 4.41 | % | — | ||||||||||||||||
5,00 to <10,00 | 4 | — | — | 7.78 | % | 7.85 | % | — | ||||||||||||||||
10,00 to <100,00 | 6 | — | — | 17.44 | % | 26.48 | % | — | ||||||||||||||||
10,00 to <20,00 | 3 | — | — | 11.91 | % | 18.51 | % | — | ||||||||||||||||
20,00 to <30,00 | — | — | — | — | — | — | ||||||||||||||||||
30,00 to <100,00 | 3 | — | — | 36.59 | % | 34.46 | % | — | ||||||||||||||||
100,00 (Default) | 6 | — | — | — | 100.00 | % | — | |||||||||||||||||
Institutions | ||||||||||||||||||||||||
0,00 to <0,15 | 1,856 | 22 | 1.19 | % | 0.08 | % | 0.11 | % | 2.77 | % | ||||||||||||||
0,00 to <0,10 | 370 | 1 | 0.27 | % | 0.06 | % | 0.06 | % | 5.73 | % | ||||||||||||||
0,10 to <0,15 | 1,486 | 21 | 1.41 | % | 0.11 | % | 0.13 | % | 2.03 | % | ||||||||||||||
0,15 to <0,25 | 494 | 6 | 1.21 | % | 0.18 | % | 0.20 | % | 1.40 | % | ||||||||||||||
0,25 to <0,50 | 311 | 4 | 1.29 | % | 0.33 | % | 0.31 | % | 2.37 | % | ||||||||||||||
0,50 to <0,75 | 172 | — | — | 0.55 | % | 0.51 | % | 2.47 | % | |||||||||||||||
0,75 to <2,50 | 155 | 2 | 1.29 | % | 1.15 | % | 1.22 | % | 1.15 | % | ||||||||||||||
0,75 to <1,75 | 154 | 2 | 1.30 | % | 1.15 | % | 1.21 | % | 1.16 | % | ||||||||||||||
1,75 to <2,50 | 1 | — | — | — | 2.34 | % | — | |||||||||||||||||
2,50 to <10,00 | 144 | 3 | 2.08 | % | 5.03 | % | 4.37 | % | 2.76 | % | ||||||||||||||
2,50 to <5,00 | 114 | 3 | 2.63 | % | 3.90 | % | 3.45 | % | 2.64 | % | ||||||||||||||
5,00 to <10,00 | 30 | — | — | 5.61 | % | 7.89 | % | 3.23 | % | |||||||||||||||
10,00 to <100,00 | 21 | — | — | 23.64 | % | 16.52 | % | 0.26 | % | |||||||||||||||
10,00 to <20,00 | 19 | — | — | 14.77 | % | 15.21 | % | — | ||||||||||||||||
20,00 to <30,00 | 1 | — | — | 23.81 | % | 20.08 | % | 5.56 | % | |||||||||||||||
30,00 to <100,00 | 1 | — | — | 38.42 | % | 37.80 | % | — | ||||||||||||||||
100,00 (Default) | 71 | — | — | 100.00 | % | 100.00 | % | — | ||||||||||||||||
Table of Contents
| BBVA. PILLAR 3 2021 | 4. RISKS | P. 106 |
PD Range | Number of obligors at the end of previous year | Of which number of obligors which defaulted in the year | Observed average default rate | Weighted average PD(1) | Arithmetic average PD by obligors(1) | Average historical annual default rate | ||||||||||||||||||
Corporate - SMEs |
| |||||||||||||||||||||||
0,00 to <0,15 | 5,898 | 50 | 0.85 | % | 0.12 | % | 0.11 | % | 0.81 | % | ||||||||||||||
0,00 to <0,10 | 964 | 4 | 0.41 | % | 0.04 | % | 0.08 | % | 0.64 | % | ||||||||||||||
0,10 to <0,15 | 4,934 | 46 | 0.93 | % | 0.12 | % | 0.11 | % | 0.85 | % | ||||||||||||||
0,15 to <0,25 | 2,113 | 27 | 1.28 | % | 0.20 | % | 0.20 | % | 0.99 | % | ||||||||||||||
0,25 to <0,50 | 3,354 | 76 | 2.27 | % | 0.34 | % | 0.33 | % | 1.33 | % | ||||||||||||||
0,50 to <0,75 | 2,987 | 76 | 2.54 | % | 0.53 | % | 0.53 | % | 2.02 | % | ||||||||||||||
0,75 to <2,50 | 6,111 | 200 | 3.27 | % | 1.21 | % | 1.21 | % | 3.34 | % | ||||||||||||||
0,75 to <1,75 | 5,775 | 183 | 3.17 | % | 1.16 | % | 1.15 | % | 3.26 | % | ||||||||||||||
1,75 to <2,50 | 336 | 17 | 5.06 | % | 2.04 | % | 2.16 | % | 4.71 | % | ||||||||||||||
2,50 to <10,00 | 8,704 | 314 | 3.61 | % | 4.88 | % | 4.38 | % | 5.68 | % | ||||||||||||||
2,50 to <5,00 | 6,805 | 204 | 3.00 | % | 3.55 | % | 3.58 | % | 5.53 | % | ||||||||||||||
5,00 to <10,00 | 1,899 | 110 | 5.79 | % | 7.51 | % | 7.22 | % | 6.23 | % | ||||||||||||||
10,00 to <100,00 | 2,609 | 373 | 14.30 | % | 24.18 | % | 19.92 | % | 13.64 | % | ||||||||||||||
10,00 to <20,00 | 1,656 | 229 | 13.83 | % | 13.56 | % | 14.27 | % | 11.93 | % | ||||||||||||||
20,00 to <30,00 | 400 | 49 | 12.25 | % | 23.80 | % | 22.82 | % | 15.64 | % | ||||||||||||||
30,00 to <100,00 | 553 | 95 | 17.18 | % | 37.68 | % | 34.74 | % | 17.31 | % | ||||||||||||||
100,00 (Default) | 2,634 | — | — | 100.00 | % | 100.00 | % | — | ||||||||||||||||
Corporate - Non-SMEs |
| |||||||||||||||||||||||
0,00 to <0,15 | 2,428 | 38 | 1.57 | % | 0.10 | % | 0.11 | % | 1.57 | % | ||||||||||||||
0,00 to <0,10 | 409 | 6 | 1.47 | %�� | 0.08 | % | 0.07 | % | 1.98 | % | ||||||||||||||
0,10 to <0,15 | 2,019 | 32 | 1.58 | % | 0.12 | % | 0.12 | % | 1.49 | % | ||||||||||||||
0,15 to <0,25 | 1,722 | 37 | 2.15 | % | 0.19 | % | 0.20 | % | 1.53 | % | ||||||||||||||
0,25 to <0,50 | 3,396 | 36 | 1.06 | % | 0.37 | % | 0.34 | % | 1.27 | % | ||||||||||||||
0,50 to <0,75 | 1,464 | 31 | 2.12 | % | 0.60 | % | 0.54 | % | 2.05 | % | ||||||||||||||
0,75 to <2,50 | 2,266 | 51 | 2.25 | % | 1.33 | % | 1.14 | % | 2.59 | % | ||||||||||||||
0,75 to <1,75 | 2,160 | 44 | 2.04 | % | 1.09 | % | 1.09 | % | 2.52 | % | ||||||||||||||
1,75 to <2,50 | 106 | 7 | 6.60 | % | 1.80 | % | 2.10 | % | 3.95 | % | ||||||||||||||
2,50 to <10,00 | 1,565 | 90 | 5.75 | % | 4.85 | % | 4.57 | % | 6.00 | % | ||||||||||||||
2,50 to <5,00 | 1,179 | 65 | 5.51 | % | 3.28 | % | 3.50 | % | 5.58 | % | ||||||||||||||
5,00 to <10,00 | 386 | 25 | 6.48 | % | 6.66 | % | 7.82 | % | 7.27 | % | ||||||||||||||
10,00 to <100,00 | 415 | 60 | 14.46 | % | 28.22 | % | 26.58 | % | 11.81 | % | ||||||||||||||
10,00 to <20,00 | 162 | 29 | 17.90 | % | 14.79 | % | 15.05 | % | 11.62 | % | ||||||||||||||
20,00 to <30,00 | 58 | 11 | 18.97 | % | 23.58 | % | 21.89 | % | 14.09 | % | ||||||||||||||
30,00 to <100,00 | 195 | 20 | 10.26 | % | 39.40 | % | 37.56 | % | 11.30 | % | ||||||||||||||
100,00 (Default) | 672 | — | — | 100.00 | % | 100.00 | % | — | ||||||||||||||||
Table of Contents
| BBVA. PILLAR 3 2021 | 4. RISKS | P. 107 |
PD Range | Number of obligors at the end of previous year | Of which number of obligors which defaulted in the year | Observed average default rate | Weighted average PD(1) | Arithmetic average PD by obligors(1) | Average historical annual default rate | ||||||||||||||||||
Retail - Immovable property SMEs |
| |||||||||||||||||||||||
0,00 to <0,15 | — | — | — | — | — | — | ||||||||||||||||||
0,00 to <0,10 | — | — | — | — | — | — | ||||||||||||||||||
0,10 to <0,15 | — | — | — | — | — | — | ||||||||||||||||||
0,15 to <0,25 | — | — | — | — | — | — | ||||||||||||||||||
0,25 to <0,50 | — | — | — | — | — | — | ||||||||||||||||||
0,50 to <0,75 | 3 | — | — | — | 0.71 | % | — | |||||||||||||||||
0,75 to <2,50 | 92 | 3 | 3.26 | % | — | 1.89 | % | 2.08 | % | |||||||||||||||
0,75 to <1,75 | — | — | — | — | — | — | ||||||||||||||||||
1,75 to <2,50 | 92 | 3 | 3.26 | % | — | 1.89 | % | 2.08 | % | |||||||||||||||
2,50 to <10,00 | 25 | — | — | — | 3.45 | % | — | |||||||||||||||||
2,50 to <5,00 | 25 | — | — | — | 3.45 | % | — | |||||||||||||||||
5,00 to <10,00 | — | — | — | — | — | — | ||||||||||||||||||
10,00 to <100,00 | — | — | — | 23.24 | % | — | — | |||||||||||||||||
10,00 to <20,00 | — | — | — | — | — | — | ||||||||||||||||||
20,00 to <30,00 | — | — | — | 22.36 | % | — | — | |||||||||||||||||
30,00 to <100,00 | — | — | — | 82.72 | % | — | — | |||||||||||||||||
100,00 (Default) | 1 | — | — | 100.00 | % | 100.00 | % | — | ||||||||||||||||
Retail - Immovable property non-SMEs |
| |||||||||||||||||||||||
0,00 to <0,15 | 815,838 | 1,138 | 0.14 | % | 0.05 | % | 0.03 | % | 0.60 | % | ||||||||||||||
0,00 to <0,10 | 753,831 | 626 | 0.08 | % | 0.04 | % | 0.02 | % | 0.53 | % | ||||||||||||||
0,10 to <0,15 | 62,007 | 512 | 0.83 | % | 0.12 | % | 0.04 | % | 1.36 | % | ||||||||||||||
0,15 to <0,25 | 50,012 | 549 | 1.10 | % | 0.19 | % | 0.19 | % | 1.76 | % | ||||||||||||||
0,25 to <0,50 | 43,494 | 898 | 2.06 | % | 0.35 | % | 0.37 | % | 2.19 | % | ||||||||||||||
0,50 to <0,75 | 15,891 | 419 | 2.64 | % | 0.57 | % | 0.62 | % | 2.26 | % | ||||||||||||||
0,75 to <2,50 | 47,833 | 1,806 | 3.78 | % | 1.41 | % | 1.12 | % | 2.62 | % | ||||||||||||||
0,75 to <1,75 | 44,105 | 1,436 | 3.26 | % | 1.30 | % | 1.03 | % | 2.48 | % | ||||||||||||||
1,75 to <2,50 | 3,728 | 370 | 9.92 | % | 1.97 | % | 2.15 | % | 4.26 | % | ||||||||||||||
2,50 to <10,00 | 24,526 | 3,253 | 13.26 | % | 5.08 | % | 5.19 | % | 11.82 | % | ||||||||||||||
2,50 to <5,00 | 14,532 | 1,212 | 8.34 | % | 3.38 | % | 3.49 | % | 7.58 | % | ||||||||||||||
5,00 to <10,00 | 9,994 | 2,041 | 20.42 | % | 7.33 | % | 7.65 | % | 17.98 | % | ||||||||||||||
10,00 to <100,00 | 6,652 | 1,991 | 29.93 | % | 21.74 | % | 17.08 | % | 24.55 | % | ||||||||||||||
10,00 to <20,00 | 4,574 | 1,521 | 33.25 | % | 13.03 | % | 14.28 | % | 26.79 | % | ||||||||||||||
20,00 to <30,00 | 1,964 | 395 | 20.11 | % | 23.46 | % | 22.69 | % | 19.70 | % | ||||||||||||||
30,00 to <100,00 | 114 | 75 | 65.79 | % | 42.54 | % | 32.95 | % | 18.07 | % | ||||||||||||||
100,00 (Default) | 26,648 | — | — | 100.00 | % | 100.00 | % | — | ||||||||||||||||
Table of Contents
| BBVA. PILLAR 3 2021 | 4. RISKS | P. 108 |
PD Range | Number of obligors at the end of previous year | Of which number of obligors which defaulted in the year | Observed average default rate | Weighted average PD(1) | Arithmetic average PD by obligors(1) | Average historical annual default rate | ||||||||||||||||||
Retail - Other exposures SMEs |
| |||||||||||||||||||||||
0,00 to <0,15 | 24,678 | 92 | 0.37 | % | 0.12 | % | 0.11 | % | 0.24 | % | ||||||||||||||
0,00 to <0,10 | 1,000 | 1 | 0.10 | % | — | 0.10 | % | — | ||||||||||||||||
0,10 to <0,15 | 23,678 | 91 | 0.38 | % | 0.12 | % | 0.11 | % | 0.25 | % | ||||||||||||||
0,15 to <0,25 | 8,078 | 52 | 0.64 | % | 0.20 | % | 0.20 | % | 0.37 | % | ||||||||||||||
0,25 to <0,50 | 13,944 | 112 | 0.80 | % | 0.31 | % | 0.32 | % | 0.62 | % | ||||||||||||||
0,50 to <0,75 | 15,417 | 197 | 1.28 | % | 0.51 | % | 0.53 | % | 0.95 | % | ||||||||||||||
0,75 to <2,50 | 34,210 | 544 | 1.59 | % | 1.19 | % | 1.28 | % | 1.61 | % | ||||||||||||||
0,75 to <1,75 | 31,007 | 474 | 1.53 | % | 1.19 | % | 1.18 | % | 1.39 | % | ||||||||||||||
1,75 to <2,50 | 3,203 | 70 | 2.19 | % | 1.89 | % | 2.25 | % | 3.69 | % | ||||||||||||||
2,50 to <10,00 | 41,176 | 1,477 | 3.59 | % | 4.64 | % | 4.47 | % | 4.14 | % | ||||||||||||||
2,50 to <5,00 | 31,131 | 865 | 2.78 | % | 3.58 | % | 3.55 | % | 3.43 | % | ||||||||||||||
5,00 to <10,00 | 10,045 | 612 | 6.09 | % | 7.35 | % | 7.33 | % | 6.34 | % | ||||||||||||||
10,00 to <100,00 | 10,152 | 1,341 | 13.21 | % | 26.90 | % | 21.64 | % | 16.22 | % | ||||||||||||||
10,00 to <20,00 | 5,880 | 479 | 8.15 | % | 14.53 | % | 14.86 | % | 11.89 | % | ||||||||||||||
20,00 to <30,00 | 1,532 | 229 | 14.95 | % | 29.41 | % | 23.51 | % | 17.29 | % | ||||||||||||||
30,00 to <100,00 | 2,740 | 633 | 23.10 | % | 38.84 | % | 35.14 | % | 24.94 | % | ||||||||||||||
100,00 (Default) | 15,334 | — | — | 100.00 | % | 100.00 | % | — | ||||||||||||||||
Retail - Other exposures Non-SMEs |
| |||||||||||||||||||||||
0,00 to <0,15 | 357,509 | 691 | 0.19 | % | 0.06 | % | 0.06 | % | 0.29 | % | ||||||||||||||
0,00 to <0,10 | 290,988 | 400 | 0.14 | % | 0.04 | % | 0.05 | % | 0.21 | % | ||||||||||||||
0,10 to <0,15 | 66,521 | 291 | 0.44 | % | 0.13 | % | 0.12 | % | 0.65 | % | ||||||||||||||
0,15 to <0,25 | 53,260 | 440 | 0.83 | % | 0.22 | % | 0.20 | % | 1.09 | % | ||||||||||||||
0,25 to <0,50 | 120,284 | 1,331 | 1.11 | % | 0.39 | % | 0.31 | % | 1.55 | % | ||||||||||||||
0,50 to <0,75 | 107,941 | 2,452 | 2.27 | % | 0.63 | % | 0.61 | % | 2.21 | % | ||||||||||||||
0,75 to <2,50 | 188,607 | 5,917 | 3.14 | % | 1.44 | % | 1.48 | % | 3.63 | % | ||||||||||||||
0,75 to <1,75 | 140,326 | 3,434 | 2.45 | % | 1.12 | % | 1.26 | % | 3.58 | % | ||||||||||||||
1,75 to <2,50 | 48,281 | 2,483 | 5.14 | % | 2.20 | % | 2.15 | % | 3.78 | % | ||||||||||||||
2,50 to <10,00 | 91,513 | 8,071 | 8.82 | % | 4.37 | % | 4.51 | % | 7.23 | % | ||||||||||||||
2,50 to <5,00 | 64,183 | 3,941 | 6.14 | % | 3.50 | % | 3.26 | % | 6.08 | % | ||||||||||||||
5,00 to <10,00 | 27,330 | 4,130 | 15.11 | % | 6.40 | % | 7.45 | % | 9.94 | % | ||||||||||||||
10,00 to <100,00 | 24,990 | 13,320 | 53.30 | % | 29.72 | % | 30.36 | % | 43.86 | % | ||||||||||||||
10,00 to <20,00 | 5,905 | 2,507 | 42.46 | % | 13.64 | % | 14.62 | % | 26.60 | % | ||||||||||||||
20,00 to <30,00 | 7,922 | 3,497 | 44.14 | % | 26.85 | % | 23.99 | % | 41.02 | % | ||||||||||||||
30,00 to <100,00 | 11,163 | 7,316 | 65.54 | % | 46.59 | % | 43.22 | % | 55.01 | % | ||||||||||||||
100,00 (Default) | 68,954 | — | — | 100.00 | % | 100.00 | % | — | ||||||||||||||||
Table of Contents
| BBVA. PILLAR 3 2021 | 4. RISKS | P. 109 |
PD Range | Number of obligors at the end of previous year | Of which number of obligors which defaulted in the year | Observed average default rate | Weighted average PD(1) | Arithmetic average PD by obligors(1) | Average historical annual default rate | ||||||||||||||||||
Retail - qualifying revolving (QRRE) |
| |||||||||||||||||||||||
0,00 to <0,15 | 2,568,728 | 1,399 | 0.05 | % | 0.04 | % | 0.02 | % | 0.20 | % | ||||||||||||||
0,00 to <0,10 | 2,482,235 | 963 | 0.04 | % | 0.03 | % | 0.02 | % | 0.18 | % | ||||||||||||||
0,10 to <0,15 | 86,493 | 436 | 0.50 | % | 0.14 | % | 0.13 | % | 0.72 | % | ||||||||||||||
0,15 to <0,25 | 249,808 | 1,636 | 0.65 | % | 0.19 | % | 0.21 | % | 0.72 | % | ||||||||||||||
0,25 to <0,50 | 291,353 | 3,029 | 1.04 | % | 0.43 | % | 0.40 | % | 1.04 | % | ||||||||||||||
0,50 to <0,75 | 573,866 | 7,126 | 1.24 | % | 0.60 | % | 0.60 | % | 1.68 | % | ||||||||||||||
0,75 to <2,50 | 1,904,841 | 39,866 | 2.09 | % | 1.42 | % | 1.50 | % | 2.29 | % | ||||||||||||||
0,75 to <1,75 | 1,159,842 | 20,663 | 1.78 | % | 1.15 | % | 1.14 | % | 1.92 | % | ||||||||||||||
1,75 to <2,50 | 744,999 | 19,203 | 2.58 | % | 2.05 | % | 2.07 | % | 2.85 | % | ||||||||||||||
2,50 to <10,00 | 2,370,143 | 121,254 | 5.12 | % | 5.65 | % | 5.76 | % | 5.85 | % | ||||||||||||||
2,50 to <5,00 | 1,061,259 | 37,981 | 3.58 | % | 3.69 | % | 3.65 | % | 4.16 | % | ||||||||||||||
5,00 to <10,00 | 1,308,884 | 83,273 | 6.36 | % | 7.40 | % | 7.47 | % | 7.22 | % | ||||||||||||||
10,00 to <100,00 | 893,050 | 217,284 | 24.33 | % | 23.75 | % | 21.27 | % | 21.46 | % | ||||||||||||||
10,00 to <20,00 | 516,104 | 69,368 | 13.44 | % | 13.22 | % | 13.59 | % | 13.59 | % | ||||||||||||||
20,00 to <30,00 | 197,936 | 58,525 | 29.57 | % | 24.70 | % | 25.24 | % | 24.36 | % | ||||||||||||||
30,00 to <100,00 | 179,010 | 89,391 | 49.94 | % | 46.82 | % | 39.01 | % | 40.94 | % | ||||||||||||||
100,00 (Default) | 196,051 | — | — | 100.00 | % | 100.00 | % | 0.83 | % | |||||||||||||||
| (1) | A floor of 0.03% PD is applied to exposures in the categories of Institutions, Corporates and Retail, according to Articles 160 and 163 of the CRR. |
Table of Contents
| BBVA. PILLAR 3 2021 | 4. RISKS | P. 110 |
Table 34. EU CR9.1 - Backtesting of PD per exposure class (12-31-2021)
| External rating | Number of obligors at the | Of which number of obligors | Observed average default | Arithmetic average PD by | Average historical annual | |||||||||||||||||
PD Scale | equivalent | end of previous year | which defaulted in the year | rate | obligors(1) | default rate | ||||||||||||||||
Central governments or central banks |
| |||||||||||||||||||||
0.00 to <0.02 | AAA | 5 | — | — | 0.01 | % | 20.00 | % | ||||||||||||||
0.02 to <0.03 | AA+ | — | — | — | — | — | ||||||||||||||||
0.03 to <0.04 | AA | 1 | — | — | 0.03 | % | — | |||||||||||||||
0.04 to <0.05 | AA- | 4 | — | — | 0.04 | % | 25.00 | % | ||||||||||||||
0.05 to <0.06 | A+ | 8 | — | — | 0.05 | % | 16.67 | % | ||||||||||||||
0.06 to <0.09 | A | 1 | — | — | 0.08 | % | — | |||||||||||||||
0.09 to <0.11 | A- | 3 | 1 | 33.33 | % | 0.10 | % | — | ||||||||||||||
0.11 to <0.17 | BBB+ | 6 | 1 | 16.67 | % | 0.14 | % | — | ||||||||||||||
0.17 to <0.24 | BBB | 4 | — | — | 0.20 | % | — | |||||||||||||||
0.29 to <0.39 | BBB- | 3 | — | — | 0.31 | % | — | |||||||||||||||
0.39 to <0.67 | BB+ | 1 | — | — | 0.51 | % | — | |||||||||||||||
0.67 to <1.16 | BB | — | — | — | — | — | ||||||||||||||||
1.16 to <1.94 | BB- | — | — | — | — | — | ||||||||||||||||
1.94 to <3.35 | B+ | — | — | — | — | — | ||||||||||||||||
3.35 to <5.81 | B | 4 | — | — | 4.41 | % | — | |||||||||||||||
5.81 to <11.61 | B- | 4 | — | — | 7.85 | % | — | |||||||||||||||
11.61 to <100.00 | C | 6 | — | — | 26.48 | % | — | |||||||||||||||
100.00 (default) | D | 6 | — | — | 100.00 | % | — | |||||||||||||||
Institutions | ||||||||||||||||||||||
0.00 to <0.02 | AAA | — | — | — | — | — | ||||||||||||||||
0.02 to <0.03 | AA+ | — | — | — | — | — | ||||||||||||||||
0.03 to <0.04 | AA | 23 | — | — | 0.03 | % | 5.88 | % | ||||||||||||||
0.04 to <0.05 | AA- | 75 | — | — | 0.04 | % | 8.70 | % | ||||||||||||||
0.05 to <0.06 | A+ | 162 | 1 | 0.62 | % | 0.05 | % | 4.84 | % | |||||||||||||
0.06 to <0.09 | A | 107 | — | — | 0.08 | % | 5.13 | % | ||||||||||||||
0.09 to <0.11 | A- | 401 | 9 | 2.24 | % | 0.10 | % | 3.19 | % | |||||||||||||
0.11 to <0.17 | BBB+ | 1,089 | 12 | 1.10 | % | 0.14 | % | 1.53 | % | |||||||||||||
0.17 to <0.24 | BBB | 493 | 6 | 1.22 | % | 0.20 | % | 1.41 | % | |||||||||||||
0.29 to <0.39 | BBB- | 311 | 4 | 1.29 | % | 0.31 | % | 2.38 | % | |||||||||||||
0.39 to <0.67 | BB+ | 172 | — | — | 0.51 | % | 2.37 | % | ||||||||||||||
0.67 to <1.16 | BB | 71 | 1 | 1.41 | % | 0.88 | % | 1.00 | % | |||||||||||||
1.16 to <1.94 | BB- | 83 | 1 | 1.20 | % | 1.50 | % | 1.15 | % | |||||||||||||
1.94 to <3.35 | B+ | 60 | — | — | 2.55 | % | 2.82 | % | ||||||||||||||
3.35 to <5.81 | B | 55 | 3 | 5.45 | % | 4.41 | % | 4.35 | % | |||||||||||||
5.81 to <11.61 | B- | 30 | — | — | 7.89 | % | 3.23 | % | ||||||||||||||
11.61 to <100.00 | C | 21 | — | — | 16.52 | % | 3.70 | % | ||||||||||||||
100.00 (default) | D | 71 | — | — | 100.00 | % | — | |||||||||||||||
Table of Contents
| BBVA. PILLAR 3 2021 | 4. RISKS | P. 111 |
| External rating | Number of obligors at the | Of which number of obligors | Observed average default | Arithmetic average PD by | Average historical annual | |||||||||||||||||
PD Scale | equivalent | end of previous year | which defaulted in the year | rate | obligors(1) | default rate | ||||||||||||||||
Corporate - SMEs | ||||||||||||||||||||||
0.00 to <0.02 | AAA | — | — | — | — | — | ||||||||||||||||
0.02 to <0.03 | AA+ | — | — | — | — | — | ||||||||||||||||
0.03 to <0.04 | AA | 175 | — | — | 0.02 | % | — | |||||||||||||||
0.04 to <0.05 | AA- | 2 | — | — | 0.05 | % | — | |||||||||||||||
0.05 to <0.06 | A+ | 31 | — | — | 0.05 | % | 5.26 | % | ||||||||||||||
0.06 to <0.09 | A | 75 | — | — | 0.07 | % | — | |||||||||||||||
0.09 to <0.11 | A- | 3,979 | 30 | 0.75 | % | 0.10 | % | 0.73 | % | |||||||||||||
0.11 to <0.17 | BBB+ | 1,910 | 22 | 1.15 | % | 0.14 | % | 1.02 | % | |||||||||||||
0.17 to <0.24 | BBB | 1,792 | 25 | 1.40 | % | 0.20 | % | 1.06 | % | |||||||||||||
0.29 to <0.39 | BBB- | 2,787 | 61 | 2.19 | % | 0.31 | % | 1.35 | % | |||||||||||||
0.39 to <0.67 | BB+ | 3,375 | 85 | 2.52 | % | 0.51 | % | 1.79 | % | |||||||||||||
0.67 to <1.16 | BB | 3,421 | 94 | 2.75 | % | 0.87 | % | 2.66 | % | |||||||||||||
1.16 to <1.94 | BB- | 2,664 | 101 | 3.79 | % | 1.50 | % | 3.84 | % | |||||||||||||
1.94 to <3.35 | B+ | 3,290 | 101 | 3.07 | % | 2.64 | % | 4.89 | % | |||||||||||||
3.35 to <5.81 | B | 4,311 | 130 | 3.02 | % | 4.47 | % | 5.73 | % | |||||||||||||
5.81 to <11.61 | B- | 1,357 | 94 | 6.93 | % | 7.91 | % | 6.60 | % | |||||||||||||
11.61 to <100.00 | C | 2,607 | 373 | 14.31 | % | 19.93 | % | 13.45 | % | |||||||||||||
100.00 (default) | D | 2,634 | — | — | 100.00 | % | — | |||||||||||||||
Corporate - Non-SMEs | ||||||||||||||||||||||
0.00 to <0.02 | AAA | — | — | — | — | — | ||||||||||||||||
0.02 to <0.03 | AA+ | — | — | — | — | — | ||||||||||||||||
0.03 to <0.04 | AA | 66 | 3 | 4.55 | % | 0.02 | % | 2.38 | % | |||||||||||||
0.04 to <0.05 | AA- | 20 | — | — | 0.04 | % | — | |||||||||||||||
0.05 to <0.06 | A+ | 49 | 1 | 2.04 | % | 0.05 | % | 1.89 | % | |||||||||||||
0.06 to <0.09 | A | 199 | 2 | 1.01 | % | 0.08 | % | 2.69 | % | |||||||||||||
0.09 to <0.11 | A- | 1,165 | 14 | 1.20 | % | 0.10 | % | 1.19 | % | |||||||||||||
0.11 to <0.17 | BBB+ | 1,175 | 20 | 1.70 | % | 0.14 | % | 1.75 | % | |||||||||||||
0.17 to <0.24 | BBB | 1,468 | 34 | 2.32 | % | 0.20 | % | 1.89 | % | |||||||||||||
0.29 to <0.39 | BBB- | 2,612 | 34 | 1.30 | % | 0.31 | % | 1.48 | % | |||||||||||||
0.39 to <0.67 | BB+ | 2,238 | 34 | 1.52 | % | 0.50 | % | 1.79 | % | |||||||||||||
0.67 to <1.16 | BB | 1,392 | 25 | 1.80 | % | 0.86 | % | 1.93 | % | |||||||||||||
1.16 to <1.94 | BB- | 792 | 19 | 2.40 | % | 1.50 | % | 3.45 | % | |||||||||||||
1.94 to <3.35 | B+ | 672 | 40 | 5.95 | % | 2.51 | % | 4.89 | % | |||||||||||||
3.35 to <5.81 | B | 649 | 36 | 5.55 | % | 4.44 | % | 5.98 | % | |||||||||||||
5.81 to <11.61 | B- | 345 | 21 | 6.09 | % | 8.12 | % | 7.29 | % | |||||||||||||
11.61 to <100.00 | C | 414 | 60 | 14.49 | % | 26.62 | % | 12.57 | % | |||||||||||||
100.00 (default) | D | 672 | — | — | 100.00 | % | — | |||||||||||||||
Table of Contents
| BBVA. PILLAR 3 2021 | 4. RISKS | P. 112 |
| External rating | Number of obligors at the | Of which number of obligors | Observed average default | Arithmetic average PD by | Average historical annual | |||||||||||||||||
PD Scale | equivalent | end of previous year | which defaulted in the year | rate | obligors(1) | default rate | ||||||||||||||||
Retail - Immovable property SMEs |
| |||||||||||||||||||||
0.00 to <0.02 | AAA | — | — | — | — | — | ||||||||||||||||
0.02 to <0.03 | AA+ | — | — | — | — | — | ||||||||||||||||
0.03 to <0.04 | AA | — | — | — | — | — | ||||||||||||||||
0.04 to <0.05 | AA- | — | — | — | — | — | ||||||||||||||||
0.05 to <0.06 | A+ | — | — | — | — | — | ||||||||||||||||
0.06 to <0.09 | A | — | — | — | — | — | ||||||||||||||||
0.09 to <0.11 | A- | — | — | — | — | — | ||||||||||||||||
0.11 to <0.17 | BBB+ | — | — | — | — | — | ||||||||||||||||
0.17 to <0.24 | BBB | — | — | — | — | — | ||||||||||||||||
0.29 to <0.39 | BBB- | — | — | — | — | — | ||||||||||||||||
0.39 to <0.67 | BB+ | — | — | — | — | — | ||||||||||||||||
0.67 to <1.16 | BB | 3 | — | — | 0.71 | % | — | |||||||||||||||
1.16 to <1.94 | BB- | 92 | 3 | 3.26 | % | 1.89 | % | 2.08 | % | |||||||||||||
1.94 to <3.35 | B+ | — | — | — | — | — | ||||||||||||||||
3.35 to <5.81 | B | 25 | — | — | 3.45 | % | — | |||||||||||||||
5.81 to <11.61 | B- | — | — | — | — | — | ||||||||||||||||
11.61 to <100.00 | C | — | — | — | — | — | ||||||||||||||||
100.00 (default) | D | 1 | — | — | 100.00 | % | — | |||||||||||||||
Retail - Immovable property non-SMEs |
| |||||||||||||||||||||
0.00 to <0.02 | AAA | — | — | — | — | — | ||||||||||||||||
0.02 to <0.03 | AA+ | — | — | — | — | — | ||||||||||||||||
0.03 to <0.04 | AA | 561,742 | 26 | — | 0.01 | % | 0.51 | % | ||||||||||||||
0.04 to <0.05 | AA- | 20,469 | 72 | 0.35 | % | 0.05 | % | 0.30 | % | |||||||||||||
0.05 to <0.06 | A+ | 64,563 | 156 | 0.25 | % | 0.05 | % | 0.19 | % | |||||||||||||
0.06 to <0.09 | A | 90,446 | 355 | 0.39 | % | 0.07 | % | 0.90 | % | |||||||||||||
0.09 to <0.11 | A- | 59,002 | 332 | 0.56 | % | 0.03 | % | 0.89 | % | |||||||||||||
0.11 to <0.17 | BBB+ | 29,295 | 215 | 0.73 | % | 0.14 | % | 1.32 | % | |||||||||||||
0.17 to <0.24 | BBB | 41,258 | 531 | 1.29 | % | 0.20 | % | 2.02 | % | |||||||||||||
0.29 to <0.39 | BBB- | 24,476 | 289 | 1.18 | % | 0.31 | % | 1.33 | % | |||||||||||||
0.39 to <0.67 | BB+ | 30,465 | 946 | 3.11 | % | 0.50 | % | 2.20 | % | |||||||||||||
0.67 to <1.16 | BB | 37,919 | 947 | 2.50 | % | 0.85 | % | 2.57 | % | |||||||||||||
1.16< to 1.94 | BB- | 10,688 | 571 | 5.34 | % | 1.55 | % | 3.03 | % | |||||||||||||
1.94 to <3.35 | B+ | 10,484 | 859 | 8.19 | % | 2.64 | % | 5.46 | % | |||||||||||||
3.35 to <5.81 | B | 7,741 | 771 | 9.96 | % | 4.46 | % | 9.83 | % | |||||||||||||
5.81 to <11.61 | B- | 9,361 | 2,017 | 21.55 | % | 7.95 | % | 18.78 | % | |||||||||||||
11.61 to <100.00 | C | 6,337 | 1,915 | 30.22 | % | 17.43 | % | 23.08 | % | |||||||||||||
100.00 (default) | D | 26,648 | — | — | 100.00 | % | — | |||||||||||||||
Table of Contents
| BBVA. PILLAR 3 2021 | 4. RISKS | P. 113 |
| External rating | Number of obligors at the | Of which number of obligors | Observed average default | Arithmetic average PD by | Average historical annual | |||||||||||||||||
PD Scale | equivalent | end of previous year | which defaulted in the year | rate | obligors(1) | default rate | ||||||||||||||||
Retail - Other exposures SMEs |
| |||||||||||||||||||||
0.00 to <0.02 | AAA | — | — | — | — | — | ||||||||||||||||
0.02 to <0.03 | AA+ | — | — | — | — | — | ||||||||||||||||
0.03 to <0.04 | AA | — | — | — | — | — | ||||||||||||||||
0.04 to <0.05 | AA- | — | — | — | — | — | ||||||||||||||||
0.05 to <0.06 | A+ | — | — | — | — | — | ||||||||||||||||
0.06 to <0.09 | A | — | — | — | — | 12.50 | % | |||||||||||||||
0.09 to <0.11 | A- | 16,860 | 47 | 0.28 | % | 0.10 | % | 0.18 | % | |||||||||||||
0.11 to <0.17 | BBB+ | 8,204 | 45 | 0.55 | % | 0.14 | % | 0.36 | % | |||||||||||||
0.17 to <0.24 | BBB | 7,615 | 51 | 0.67 | % | 0.20 | % | 0.38 | % | |||||||||||||
0.29 to <0.39 | BBB- | 13,110 | 105 | 0.80 | % | 0.31 | % | 0.62 | % | |||||||||||||
0.39 to <0.67 | BB+ | 15,445 | 193 | 1.25 | % | 0.52 | % | 0.84 | % | |||||||||||||
0.67 to <1.16 | BB | 16,924 | 229 | 1.35 | % | 0.88 | % | 1.20 | % | |||||||||||||
1.16 to <1.94 | BB- | 15,179 | 267 | 1.76 | % | 1.50 | % | 1.62 | % | |||||||||||||
1.94 to <3.35 | B+ | 17,364 | 397 | 2.29 | % | 2.61 | % | 2.75 | % | |||||||||||||
3.35 to <5.81 | B | 18,853 | 629 | 3.34 | % | 4.43 | % | 4.12 | % | |||||||||||||
5.81 to <11.61 | B- | 7,962 | 512 | 6.43 | % | 7.81 | % | 6.80 | % | |||||||||||||
11.61 to <100.00 | C | 10,139 | 1,340 | 13.22 | % | 21.65 | % | 15.85 | % | |||||||||||||
100.00 (default) | D | 15,334 | — | — | 100.00 | % | — | |||||||||||||||
Retail - Other exposures Non-SMEs |
| |||||||||||||||||||||
0.00 to <0.02 | AAA | — | — | — | — | — | ||||||||||||||||
0.02 to <0.03 | AA+ | — | — | — | — | — | ||||||||||||||||
0.03 to <0.04 | AA | 168,140 | 80 | 0.05 | % | 0.03 | % | 0.09 | % | |||||||||||||
0.04 to <0.05 | AA- | — | — | — | — | 0.27 | % | |||||||||||||||
0.05 to <0.06 | A+ | 46,484 | 123 | 0.26 | % | 0.06 | % | 0.29 | % | |||||||||||||
0.06 to <0.09 | A | 76,354 | 197 | 0.26 | % | 0.08 | % | 0.43 | % | |||||||||||||
0.09 to <0.11 | A- | 140 | — | — | % | 0.10 | % | 0.59 | % | |||||||||||||
0.11 to <0.17 | BBB+ | 71,459 | 321 | 0.45 | % | 0.12 | % | 0.76 | % | |||||||||||||
0.17 to <0.24 | BBB | 48,192 | 410 | 0.85 | % | 0.20 | % | 1.08 | % | |||||||||||||
0.29 to <0.39 | BBB- | 120,280 | 1,331 | 1.11 | % | 0.31 | % | 1.54 | % | |||||||||||||
0.39 to <0.67 | BB+ | 97,446 | 1,719 | 1.76 | % | 0.60 | % | 2.18 | % | |||||||||||||
0.67 to <1.16 | BB | 92,219 | 2,254 | 2.44 | % | 1.01 | % | 3.23 | % | |||||||||||||
1.16 to <1.94 | BB- | 77,423 | 2,765 | 3.57 | % | 1.62 | % | 4.04 | % | |||||||||||||
1.94 to <3.35 | B+ | 64,274 | 3,013 | 4.69 | % | 2.58 | % | 4.65 | % | |||||||||||||
3.35 to <5.81 | B | 39,594 | 3,757 | 9.49 | % | 4.20 | % | 6.68 | % | |||||||||||||
5.81 to <11.61 | B- | 18,229 | 3,101 | 17.01 | % | 8.85 | % | 11.65 | % | |||||||||||||
11.61 to <100.00 | C | 23,870 | 13,151 | 55.09 | % | 31.31 | % | 38.94 | % | |||||||||||||
100.00 (default) | D | 68,954 | — | — | 100.00 | % | — | |||||||||||||||
Table of Contents
| BBVA. PILLAR 3 2021 | 4. RISKS | P. 114 |
| External rating | Number of obligors at the | Of which number of obligors | Observed average default | Arithmetic average PD by | Average historical annual | |||||||||||||||||
PD Scale | equivalent | end of previous year | which defaulted in the year | rate | obligors(1) | default rate | ||||||||||||||||
Retail - qualifying revolving (QRRE) |
| |||||||||||||||||||||
0.00 to <0.02 | AAA | — | — | — | — | — | ||||||||||||||||
0.02 to <0.03 | AA+ | — | — | — | — | — | ||||||||||||||||
0.03 to <0.04 | AA | 2,384,317 | 538 | 0.02 | % | 0.02 | % | 0.17 | % | |||||||||||||
0.04 to <0.05 | AA- | — | — | — | — | 0.29 | % | |||||||||||||||
0.05 to <0.06 | A+ | 2,186 | 5 | 0.23 | % | 0.05 | % | 0.49 | % | |||||||||||||
0.06 to <0.09 | A | 80,719 | 355 | 0.44 | % | 0.07 | % | 0.48 | % | |||||||||||||
0.09 to <0.11 | A- | 25,896 | 150 | 0.58 | % | 0.10 | % | 0.36 | % | |||||||||||||
0.11 to <0.17 | BBB+ | 75,610 | 351 | 0.46 | % | 0.14 | % | 0.76 | % | |||||||||||||
0.17 to <0.24 | BBB | 248,466 | 1,633 | 0.66 | % | 0.21 | % | 0.72 | % | |||||||||||||
0.29 to <0.39 | BBB- | 97,898 | 945 | 0.97 | % | 0.31 | % | 1.03 | % | |||||||||||||
0.39 to <0.67 | BB+ | 664,659 | 7,928 | 1.19 | % | 0.54 | % | 1.42 | % | |||||||||||||
0.67 to <1.16 | BB | 710,923 | 10,278 | 1.45 | % | 0.89 | % | 1.55 | % | |||||||||||||
1.16 to <1.94 | BB- | 837,929 | 18,313 | 2.19 | % | 1.53 | % | 2.37 | % | |||||||||||||
1.94 to <3.35 | B+ | 876,809 | 26,154 | 2.98 | % | 2.55 | % | 3.29 | % | |||||||||||||
3.35 to <5.81 | B | 795,262 | 33,010 | 4.15 | % | 4.38 | % | 4.79 | % | |||||||||||||
5.81 to <11.61 | B- | 1,232,414 | 82,177 | 6.67 | % | 7.89 | % | 7.72 | % | |||||||||||||
11.61 to <100.00 | C | 818,701 | 209,757 | 25.62 | % | 22.26 | % | 22.28 | % | |||||||||||||
100.00 (default) | D | 196,051 | — | — | 100.00 | % | — | |||||||||||||||
As of December 31, 2021, the total number of short-term wholesale obligors (residual maturity of less than 1 year) whose exposures are calculated under IRB approach rises to approximately 2,000 obligors. The largest proportion of these corresponds to the regulatory categories of Institutions and Central Governments and Central Banks. Additionally, the Group only has one PD model authorized by the Supervisor for each of the aforementioned categories, therefore, 100% of the RWAs are calculated under this PD model.
The comparability of the information and the composition of the time window are conditioned by the following factors:
| • | Long life cycle between the time the IRB parameters are updated and their final implementation, depending on the materiality of the change, supervisory prioritization for the inspection and decision phases. |
| • | Different nature, risk profile and economic cycles of the different portfolios, especially relevant in cases where several geographies are aggregated in the same exposure class (mainly Corporates and Credit Cards in Spain and Mexico). |
Minimum historical depth of 5 years: The annual historical default rates cover more than 5 years, seeking consistency between regulatory and economic capital, as long as the supervisory process for the approval of the changes allows it.
Window overlap: Although there is an overlap of quarterly windows in the calibration of the pools, analysis are carried out to measure and mitigate the possible bias that this overlapping could imply. In the quantification of the long-term PD, however, there are no overlapping windows.
Table of Contents
| BBVA. PILLAR 3 2021 | 4. RISKS | P. 115 |
4.2.5.4. Risk weights of specialised lending exposure
The solvency regulation stipulates that the classification of specialised lending companies should apply to legal entities with the following characteristics:
| • | The exposure is to an entity created specifically to finance and/or operate physical assets. |
| • | The contractual arrangements give the lender a substantial degree of control over the assets and income they generate. |
| • | The primary source of repayment of the obligation is the income generated by the assets being financed, rather than the independent capacity of the borrower. |
Corporate specialized lending exposures subject to the IRB Supervisory Slotting Approach are assigned to a grade, the determination of which takes into account the following factors:
| 1. | Financial Strength that includes: market conditions, financial ratios, stress analysis and financial structure. |
| 2. | Political and legal environment that includes: political risks, country risks, force majeure risks, government support, stability of legal and regulatory environment, local support and legal force of the contracts. |
| 3. | Asset and operational characteristics that includes: design and technology risks, permits and license risks, construction risks, completion guarantees, Contractor and Operator qualifications, O&M agreements and supply risks. |
| 4. | Strength of the Sponsor that includes: financial strength, experience and support to the project. |
| 5. | Legal & Finance Structure that includes: pledges and assignments, covenants and restrictions, DSRA. |
Once assigned to a grade, the exposure is risk-weighted in accordance with the risk weight applicable to that grade and remaining maturity banding.
The following table shows the exposure assigned to each of the risk weightings of the specialised lending exposure (including counterparty credit risk) as of December 31, 2021 and December 31, 2020:
Table 35. EU CR10 (1-4) - IRB: specialised lending (Million Euros. 12-31-2021)
Specialised lending: Project Finance | ||||||||||||||||||||||||||
Regulatory categories | Remaining Maturity | On-balance sheet amount(1) | Off-balance sheet amount(2) | RW | Exposure Amount(3) | RWAs | Expected Losses | |||||||||||||||||||
Category 1 | Less than 2.5 years | 103 | 5 | 50 | % | 108 | 51 | — | ||||||||||||||||||
Category 1 | Equal to or more than 2.5 years | 2,793 | 212 | 70 | % | 2,917 | 1,850 | 11 | ||||||||||||||||||
Category 2 | Less than 2.5 years | 88 | 15 | 70 | % | 99 | 59 | — | ||||||||||||||||||
Category 2 | Equal to or more than 2.5 years | 1,493 | 560 | 90 | % | 1,782 | 1,402 | 13 | ||||||||||||||||||
Category 3 | Less than 2.5 years | 46 | 1 | 115 | % | 47 | 53 | 1 | ||||||||||||||||||
Category 3 | Equal to or more than 2.5 years | 396 | 64 | 115 | % | 436 | 502 | 12 | ||||||||||||||||||
Category 4 | Less than 2.5 years | 9 | — | 250 | % | 9 | 23 | 1 | ||||||||||||||||||
Category 4 | Equal to or more than 2.5 years | 312 | 12 | 250 | % | 319 | 796 | 26 | ||||||||||||||||||
Category 5 | Less than 2.5 years | 6 | — | 6 | — | 3 | ||||||||||||||||||||
Category 5 | Equal to or more than 2.5 years | 38 | 3 | 40 | — | 20 | ||||||||||||||||||||
|
|
|
|
|
|
|
|
|
| |||||||||||||||||
Total | Less than 2.5 years | 252 | 20 | 269 | 186 | 5 | ||||||||||||||||||||
|
|
|
|
|
|
|
|
|
| |||||||||||||||||
Total | Equal to or more than 2.5 years | 5,032 | 850 | 5,493 | 4,550 | 82 | ||||||||||||||||||||
|
|
|
|
|
|
|
|
|
| |||||||||||||||||
| (1) | Corresponds to the original exposure |
| (2) | Corresponds to the value of off-balance sheet exposure, regardless of credit conversion factors (CCF), or the effect of the Credit Risk Mitigation (CRM) techniques |
| (3) | Corresponds to exposure value after CRM and CCF |
Table of Contents
| BBVA. PILLAR 3 2021 | 4. RISKS | P. 116 |
Specialised lending: bienes inmuebles generadores de rentas y bienes inmuebles comerciales de alta volatilidad (IPRE & HVCRE) | ||||||||||||||||||||||||||
Regulatory categories | Remaining Maturity | On-balance sheet amount (1) | Off-balance sheet amount (2) | RW | Exposure Amount (3) | RWAs | Expected Losses | |||||||||||||||||||
Category 1 | Less than 2.5 years | 163 | 2 | 50 | % | 165 | 83 | — | ||||||||||||||||||
Category 1 | Equal to or more than 2.5 years | 206 | 4 | 70 | % | 208 | 145 | 1 | ||||||||||||||||||
Category 2 | Less than 2.5 years | 1 | 5 | 70 | % | 3 | 2 | — | ||||||||||||||||||
Category 2 | Equal to or more than 2.5 years | 50 | 7 | 90 | % | 54 | 48 | — | ||||||||||||||||||
Category 3 | Less than 2.5 years | — | — | 115 | % | — | — | — | ||||||||||||||||||
Category 3 | Equal to or more than 2.5 years | — | — | 115 | % | — | — | — | ||||||||||||||||||
Category 4 | Less than 2.5 years | — | — | 250 | % | — | — | — | ||||||||||||||||||
Category 4 | Equal to or more than 2.5 years | — | — | 250 | % | — | — | — | ||||||||||||||||||
Category 5 | Less than 2.5 years | — | — | — | — | — | ||||||||||||||||||||
Category 5 | Equal to or more than 2.5 years | — | — | — | — | — | ||||||||||||||||||||
|
|
|
|
|
|
|
|
|
| |||||||||||||||||
Total | Less than 2.5 years | 164 | 7 | 168 | 85 | — | ||||||||||||||||||||
|
|
|
|
|
|
|
|
|
| |||||||||||||||||
Total | Equal to or more than 2.5 years | 256 | 11 | 261 | 194 | 1 | ||||||||||||||||||||
|
|
|
|
|
|
|
|
|
| |||||||||||||||||
| (1) | Corresponds to the original exposure |
| (2) | Corresponds to the value of off-balance sheet exposure, regardless of credit conversion factors (CCF), or the effect of the Credit Risk Mitigation (CRM) techniques |
| (3) | Corresponds to exposure value after CRM and CCF |
Specialised lending: Object Finance | ||||||||||||||||||||||||||
Regulatory categories | Remaining Maturity | On-balance sheet amount(1) | Off-balance sheet amount(2) | RW | Exposure Amount(3) | RWAs | Expected Losses | |||||||||||||||||||
Category 1 | Less than 2.5 years | 18 | — | 50 | % | 18 | 9 | — | ||||||||||||||||||
Category 1 | Equal to or more than 2.5 years | 14 | — | 70 | % | 14 | 10 | — | ||||||||||||||||||
Category 2 | Less than 2.5 years | 71 | 1 | 70 | % | 71 | 50 | — | ||||||||||||||||||
Category 2 | Equal to or more than 2.5 years | 100 | — | 90 | % | 100 | 90 | 1 | ||||||||||||||||||
Category 3 | Less than 2.5 years | — | — | 115 | % | — | — | — | ||||||||||||||||||
Category 3 | Equal to or more than 2.5 years | — | — | 115 | % | — | — | — | ||||||||||||||||||
Category 4 | Less than 2.5 years | — | — | 250 | % | — | — | — | ||||||||||||||||||
Category 4 | Equal to or more than 2.5 years | — | — | 250 | % | — | — | — | ||||||||||||||||||
Category 5 | Less than 2.5 years | — | — | — | — | — | ||||||||||||||||||||
Category 5 | Equal to or more than 2.5 years | — | — | — | — | — | ||||||||||||||||||||
|
|
|
|
|
|
|
|
|
| |||||||||||||||||
Total | Less than 2.5 years | 90 | 1 | 90 | 59 | — | ||||||||||||||||||||
|
|
|
|
|
|
|
|
|
| |||||||||||||||||
Total | Equal to or more than 2.5 years | 115 | — | 115 | 100 | 1 | ||||||||||||||||||||
|
|
|
|
|
|
|
|
|
| |||||||||||||||||
| (1) | Corresponds to the original exposure |
| (2) | Corresponds to the value of off-balance sheet exposure, regardless of credit conversion factors (CCF), or the effect of the Credit Risk Mitigation (CRM) techniques |
| (3) | Corresponds to exposure value after CRM and CCF |
Specialised lending: Commodities Finance | ||||||||||||||||||||||||||
Regulatory categories | Remaining Maturity | On-balance sheet amount(1) | Off-balance sheet amount(2) | RW | Exposure Amount(3) | RWAs | Expected Losses | |||||||||||||||||||
Category 1 | Less than 2.5 years | — | — | 50 | % | — | — | — | ||||||||||||||||||
Category 1 | Equal to or more than 2.5 years | — | — | 70 | % | — | — | — | ||||||||||||||||||
Category 2 | Less than 2.5 years | — | — | 70 | % | — | — | — | ||||||||||||||||||
Category 2 | Equal to or more than 2.5 years | — | — | 90 | % | — | — | — | ||||||||||||||||||
Category 3 | Less than 2.5 years | — | — | 115 | % | — | — | — | ||||||||||||||||||
Category 3 | Equal to or more than 2.5 years | — | — | 115 | % | — | — | — | ||||||||||||||||||
Category 4 | Less than 2.5 years | — | — | 250 | % | — | — | — | ||||||||||||||||||
Category 4 | Equal to or more than 2.5 years | — | — | 250 | % | — | — | — | ||||||||||||||||||
Category 5 | Less than 2.5 years | — | — | — | — | — | ||||||||||||||||||||
Category 5 | Equal to or more than 2.5 years | — | — | — | — | — | ||||||||||||||||||||
|
|
|
|
|
|
|
|
|
| |||||||||||||||||
Total | Less than 2.5 years | — | — | — | — | — | ||||||||||||||||||||
|
|
|
|
|
|
|
|
|
| |||||||||||||||||
Total | Equal to or more than 2.5 years | — | — | — | — | — | ||||||||||||||||||||
|
|
|
|
|
|
|
|
|
| |||||||||||||||||
| (1) | Corresponds to the original exposure |
| (2) | Corresponds to the value of off-balance sheet exposure, regardless of credit conversion factors (CCF), or the effect of the Credit Risk Mitigation (CRM) techniques |
| (3) | Corresponds to exposure value after CRM and CCF |
Table of Contents
| BBVA. PILLAR 3 2021 | 4. RISKS | P. 117 |
EU CR10 (1) - IRB: specialised lending (Million Euros. 12-31-2020)
Specialised lending | ||||||||||||||||||||||||
Regulatory categories | Remaining Maturity | On-balance sheet amount(1) | Off-balance sheet amount(2) | RW | Exposure Amount(3) | RWAs | Expected Losses | |||||||||||||||||
Category 1 | Less than 2.5 years | 320 | 38 | 50 | % | 355 | 177 | — | ||||||||||||||||
Category 1 | Equal to or more than 2.5 years | 2,549 | 866 | 70 | % | 3,297 | 2,308 | 13 | ||||||||||||||||
Category 2 | Less than 2.5 years | 224 | 122 | 70 | % | 303 | 212 | 1 | ||||||||||||||||
Category 2 | Equal to or more than 2.5 years | 1,213 | 349 | 90 | % | 1,465 | 1,319 | 12 | ||||||||||||||||
Category 3 | Less than 2.5 years | 148 | 1 | 115 | % | 148 | 170 | 4 | ||||||||||||||||
Category 3 | Equal to or more than 2.5 years | 341 | 79 | 115 | % | 414 | 476 | 12 | ||||||||||||||||
Category 4 | Less than 2.5 years | 20 | 1 | 250 | % | 21 | 53 | 2 | ||||||||||||||||
Category 4 | Equal to or more than 2.5 years | 75 | 4 | 250 | % | 79 | 197 | 6 | ||||||||||||||||
Category 5 | Less than 2.5 years | 3 | 2 | 4 | — | 2 | ||||||||||||||||||
Category 5 | Equal to or more than 2.5 years | 45 | 6 | 51 | — | 25 | ||||||||||||||||||
|
|
|
|
|
|
|
|
| ||||||||||||||||
Total | Less than 2.5 years | 715 | 165 | 830 | 612 | 9 | ||||||||||||||||||
|
|
|
|
|
|
|
|
| ||||||||||||||||
Total | Equal to or more than 2.5 years | 4,223 | 1,304 | 5,305 | 4,299 | 68 | ||||||||||||||||||
|
|
|
|
|
|
|
|
| ||||||||||||||||
| (1) | Corresponds to the original exposure |
| (2) | Corresponds to the value of off-balance sheet exposure, regardless of credit conversion factors (CCF), or the effect of the Credit Risk Mitigation (CRM) techniques |
| (3) | Corresponds to exposure value after CRM and CCF |
For risk measurement of the Specialised Lending portfolio, the Group uses the “slotting criteria” approach, which classifies exposures into different regulatory categories based on the risk assessment performed by the entity and the residual maturity. In terms of the type of specialised lending, project finance represents 90% of total portfolio with a total exposure of €6,395 million and RWAs consumption of €5,173 million.
During the second half of the year there were no significant movements in the portfolio.
4.2.5.5. Equity exposure by method
The following table shows equity exposure by the following approaches: internal, PD/LGD and simple method (in this case, broken down by risk weights), as of December 31, 2021 and December 31, 2020.
Table 36. EU CR10 (5) - IRB: equity (Million Euros. 12-31-2021)
| Equity under the IRB approach | ||||||||||||||||||||||||
Categories | On-balance sheet amount(1) | Off-balance sheet amount(2) | RW | Exposure Amount(3) | RWAs | Expected Losses (4) | ||||||||||||||||||
Simple method - Private Equity Exposures | 711 | — | 190 | % | 711 | 1,351 | 6 | |||||||||||||||||
Simple method - Exchange-traded equity exposures | 242 | — | 290 | % | 242 | 702 | 2 | |||||||||||||||||
Simple method - Other Equity Exposures | 105 | — | 370 | % | 105 | 389 | 2 | |||||||||||||||||
|
|
|
|
|
|
|
|
|
| |||||||||||||||
Total | 1,058 | — | 1,058 | 2,442 | 10 | |||||||||||||||||||
|
|
|
|
|
|
|
|
|
| |||||||||||||||
| (1) | Corresponds to the original exposure |
| (2) | Corresponds to the value of off-balance sheet exposure, regardless of credit conversion factors (CCF), or the effect of the Credit Risk Mitigation (CRM) techniques |
| (3) | Corresponds to exposure value after CRM and CCF |
| (4) | As of 31 December 2021, the table has been adapted to the New EBA ITS, highlighting as a modification the inclusion of the Expected Loss column instead of Capital Requirements. |
EU CR10 (2) - IRB: equity (Million Euros. 12-31-2020)
| Equity under the IRB approach | ||||||||||||||||||||||||
Categories | On-balance sheet amount(1) | Off-balance sheet amount(2) | RW | Exposure Amount(3) | RWAs | Capital Requirements | ||||||||||||||||||
Simple method - Private Equity Exposures | 586 | — | 190 | % | 586 | 1,114 | 89 | |||||||||||||||||
Simple method - Exchange-traded equity exposures | 147 | — | 290 | % | 147 | 425 | 34 | |||||||||||||||||
Simple method - Other Equity Exposures | 79 | — | 370 | % | 79 | 291 | 23 | |||||||||||||||||
|
|
|
|
|
|
|
|
|
| |||||||||||||||
Total | 812 | — | 812 | 1,830 | 146 | |||||||||||||||||||
|
|
|
|
|
|
|
|
|
| |||||||||||||||
| (1) | Corresponds to the original exposure |
| (2) | Corresponds to the value of off-balance sheet exposure, regardless of credit conversion factors (CCF), or the effect of the Credit Risk Mitigation (CRM) techniques |
| (3) | Corresponds to exposure value after CRM and CCF |
Table of Contents
| BBVA. PILLAR 3 2021 | 4. RISKS | P. 118 |
During 2021 there is no relevant changes in the composition of equity exposures using the simple method.
Additionally, section 4.4.3 shows detailed information on the structural risk of equities.
Table of Contents
| BBVA. PILLAR 3 2021 | 4. RISKS | P. 119 |
4.2.6. Information on counterparty credit risk
Counterparty credit risk exposure involves that part of the original exposure corresponding to derivative instruments, repurchase and reverse repurchase transactions, securities or commodities lending transactions and deferred settlement transactions.
4.2.6.1. Policies for managing counterparty risk
2.2.6.1.1. Methodology: allocation of internal capital and limits to exposure subject to counterparty risk
The Group has an economic model for calculating internal capital through exposure to counterparty risk in treasury operations. This model has been implemented in the Risk unit systems in Market areas. It is used to estimate the credit exposure for each of the counterparties for which the entity operates.
Exposure is generated in a manner consistent with those used for the monitoring and control of credit risk limits. The time horizon is divided up into intervals, and the market risk factors (interest rates, exchange rates, etc.) underlying the instruments that determine their valuation are simulated for each interval.
Exposure is obtained based on the 2000 different scenarios generated using the Monte Carlo method for risk factors (subject to counterparty risk) and applying the corresponding mitigating factors to each counterparty (i.e. applying collateral and/or compensation arrangements, or netting, as applicable).
The correlations, loss given defaults, internal ratings and associated probabilities of default are consistent with the Group’s economic model for general credit risk.
The capital for each counterparty is then calculated using the exposure profile and taking into account the analytical formula adopted by Basel. This figure is modified by an adjustment factor for possible subsequent maturity after one year of the operations, in a similar vein to the general approach adopted by Basel for the treatment of credit risk.
Counterparty limits are specified within the financial programs authorised for each subsidiary within the line item of treasury limits. It stipulates both the limit and the maximum maturity for the transaction.
Small businesses Transactions that generate counterparty risk are subject to risk limits that control both bilateral risk and risk with CCPs. When setting these limits for each business area and segment, and to ensure their correct application, the corresponding capital consumption and revenue generated by this operation are taken into account.
There is also a risk committee that individually analyzes the most significant transactions to assess (among other aspects) the relationship between profitability and risk.
The consumption of transactions within the limits is measured in terms of market capitalisation (mark to market) plus the potential risk with Monte Carlo Simulation methodology (95% confidence level or above if there are mitigating agreements or a risk of adverse links) and considering possible mitigating factors (such as netting, break clauses and collateral contracts).
Management of consumption by lines in the Markets area is carried out through a corporate platform that enables online monitoring of the limits and liquid assets established for the different counterparties and customers. This control is completed by independent units of the business area to guarantee proper segregation of functions.
4.2.6.1.2. Policies for ensuring the effectiveness of collateral and setting the value adjustments for impairment losses to cover this risk
The Group negotiates agreements with its customers to mitigate counterparty risk within the legal frameworks applicable in each of the countries where it operates. These agreements regulate the exchange of guarantees as a mechanism to reduce exposure derived from transactions that generate counterparty risk.
The assets covered by these agreements include cash, as well as financial assets with a high credit quality. In addition, the agreements with customers include mechanisms that allow the immediate replacement of the collateral if its quality is impaired (for example, a reduction in the market capitalisation or adverse changes in the asset rating).
Mitigation by compensation or netting transactions and by collateral only reduces the consumption of limits and capital if there is a positive opinion on their immediate effectiveness in case of the counterparty’s default or insolvency.
An internal tool has been specifically designed to store and process the collateral contracts concluded with counterparties. This application enables the existence of collateral to be taken into account at the transaction level (useful for controlling and monitoring the status of specific operations) as well as at the counterparty level. Furthermore, this tool feeds the applications responsible for estimating counterparty risk by providing all the necessary parameters for considering the impact of mitigation in the portfolio due to the agreements signed.
Likewise, there is also application process that reconciles and adjusts the positions serving the Collateral and Risk units.
Table of Contents
| BBVA. PILLAR 3 2021 | 4. RISKS | P. 120 |
In order to guarantee the effectiveness of collateral contracts, the Group carries out daily monitoring of the market values of operations governed by such contracts and of the deposits made by the counterparties. Once the amount of the collateral to be delivered or received is obtained, the collateral demand (margin call), or the demand received, is carried out at the intervals established in the contract, usually daily.
If significant variations arise from the process of reconciliation between the counterparties, after a reconciliation in economic terms, they are reported by the Collateral unit to the Risk unit for subsequent analysis and monitoring. Within the control process, the Collateral unit issues a daily report on the guarantees which includes a description by counterparty of the exposure and deposited collateral, making special reference to those guarantee deficits at or beyond the set warning levels.
Financial assets and liabilities may be the object of compensation, or netting, in other words presentation for a net amount in the consolidated balance sheet, only when the Group’s entities comply with the provisions laid down in IAS 32 - Paragraph 42, and thus have the legally obliged right to offset the amounts recognised, and the intention to settle the net amount or to divest the asset and pay the liability at the same time.
In addition, the Group has assets and liabilities on the balance sheet that are not netted and for which there are master netting agreements, but for which there is neither the intention nor the right to settle. The most common types of events that trigger the compensation of reciprocal obligations include the bankruptcy of the credit institution in question, swiftly accumulating indebtedness, default, and the restructuring or dissolution of the entity.
In the current market context, derivatives are arranged under a variety of framework contracts, with the most general being those developed by the International Swaps and Derivatives Association (ISDA), and for the Spanish market the Framework Agreement for Financial Transactions (FAFT). Practically all portfolio derivative operations have been concluded under these master contracts, including in them the netting clauses referred to in the above point as Master Netting Agreements, considerably reducing the credit exposure in these instruments. Furthermore, in the contracts concluded with professional counterparties, annexes are included with collateral agreements called Credit Support Annexes (CSA), thus minimizing exposure to a possible counterparty insolvency.
At the same time, the Group has a high volume of assets sold under repurchase agreements traded through clearing houses that use mechanisms to reduce counterparty risk, as well as through various master contracts in bilateral operations, the most common being the Global Master Repurchase Agreement (GMRA), which is published by the International Capital Market
Association (ICMA). This tends to have clauses added relating to the exchange of collateral within the main body of the master contract itself.
4.2.6.1.3. Policies on the risk of adverse effects due to correlations
Derivatives contracts may give rise to potential adverse correlation effects between the exposure to the counterparty and its credit quality (wrong-way-exposure).
The Group has specific policies for handling these type of exposures, which establish:
| • | How to identify transactions subject to adverse correlation risk. |
| • | A specific transaction-by-transaction admission procedure. |
| • | Measurements appropriate to the risk profile with adverse correlation and sanctioned in the corresponding decision-making areas. |
| • | Control and monitoring of the transaction. |
4.2.6.1.4. Impact of collateral in the event of a downgrade in credit quality
In derivatives transactions, as a general policy the Group does not subscribe collateral contracts that involve an increase in the amount to be deposited in the event of the Group being downgraded.
The general criteria applied to date with banking counterparties is to establish a zero threshold within collateral contracts, irrespective of the mutual rating; provision will be made as collateral of any difference that arises through market capitalisation (mark to market).
Since 2018, with the entry into force of the regulatory obligations for exchange of margins for derivatives that are not offset in the clearing houses, all the collateral annexes have been adapted to the characteristics required by the regulation, among which is that of establishing a zero threshold. Furthermore, the obligation to exchange initial margins with the main financial counterparties to overcollateralize exposure was added in 2019.
4.2.6.2. Amounts of counterparty risk
The exposure value of derivative instruments will be determined based on one of the following methods established in sections 3 to 6 of chapter 6 of the CRR: standard method for counterparty credit risk, simplified standard method for credit risk counterparty, original risk method or internal models method.
Table of Contents
| BBVA. PILLAR 3 2021 | 4. RISKS | P. 121 |
The exposure value of the securities financing transactions (SFTs) is determined in accordance with the methods provided in the preceding paragraph or using those provided for in Chapter 4 of the CRR.
In this regard, the BBVA S.A. Group calculates the exposure value of derivative instruments in accordance with the standardised method for counterparty credit risk (SA-CCR).
The new SA-CCR framework calculates the aforementioned exposure by each netting set of the entity. The SA-CCR method defines the exposure value as the product of a surcharge (α) to the sum of the replacement cost (RC) and the potential future exposure (PFE). Where α is equal to 1.4.
Exposure value = α * (RC + PFE)
The BBVA Group S.A. calculates the exposure value of the repurchase operations in accordance with the provisions of chapter 4 on credit risk mitigation and in accordance with the financial collateral comprehensive method.
The SA-CCR method is applicable since June 2021, therefore, the counterparty risk tables as of December 2020 presented in this section include the counterparty risk under the original exposure method applicable at that date.
A breakdown of the original exposure, EAD and RWAs under counterparty credit risk (including exposures to Central Counterparties) is below:
Table 37. Positions subject to counterparty credit risk in terms of OE, EAD and RWAs (Million Euros. 12-31-2021)
| Securities financing transactions | Derivatives and transactions with deferred settlement | Total | ||||||||||||||||||||||||||||||||||
Exposure Class and risk types | OE | EAD | RWAs | OE | EAD | RWAs | OE | EAD | RWAs | |||||||||||||||||||||||||||
Central governments or central banks | 16,430 | 2,716 | 300 | 1,419 | 1,601 | 1,117 | 17,848 | 4,317 | 1,417 | |||||||||||||||||||||||||||
Regional governments or local authorities | — | — | — | 2 | 2 | 1 | 2 | 2 | 1 | |||||||||||||||||||||||||||
Public sector entities | 26 | 1 | 1 | 31 | 31 | 29 | 57 | 32 | 29 | |||||||||||||||||||||||||||
Multilateral Development Banks | — | — | — | — | — | — | — | — | — | |||||||||||||||||||||||||||
International Organisations | — | — | — | — | — | — | — | — | — | |||||||||||||||||||||||||||
Institutions | 6,954 | 311 | 84 | 2,912 | 2,912 | 2,127 | 9,866 | 3,223 | 2,211 | |||||||||||||||||||||||||||
Corporates | 2,862 | 112 | 87 | 2,528 | 2,528 | 2,098 | 5,390 | 2,640 | 2,185 | |||||||||||||||||||||||||||
Retail | 10 | 2 | 1 | 16 | 16 | 11 | 26 | 18 | 12 | |||||||||||||||||||||||||||
Secured by mortgages on immovable property | — | — | — | — | — | — | — | — | — | |||||||||||||||||||||||||||
Exposures in default | — | — | — | 8 | 8 | 12 | 8 | 8 | 12 | |||||||||||||||||||||||||||
Exposures associated with particularly high risk | — | — | — | 34 | 34 | 52 | 34 | 34 | 52 | |||||||||||||||||||||||||||
Covered bonds | — | — | — | — | — | — | — | — | — | |||||||||||||||||||||||||||
Short-term claims on institutions and corporate | — | — | — | — | — | — | — | — | — | |||||||||||||||||||||||||||
Collective investments undertakings | — | — | — | — | — | — | — | — | — | |||||||||||||||||||||||||||
Other exposures | — | — | — | — | — | — | — | — | — | |||||||||||||||||||||||||||
|
|
|
|
|
|
|
|
|
|
|
|
|
|
|
|
|
| |||||||||||||||||||
Total counterparty risk by standardised approach | 26,282 | 3,141 | 473 | 6,950 | 7,132 | 5,446 | 33,231 | 10,273 | 5,919 | |||||||||||||||||||||||||||
|
|
|
|
|
|
|
|
|
|
|
|
|
|
|
|
|
| |||||||||||||||||||
Central governments or central banks | 5,536 | 5,536 | 21 | 11 | 11 | 3 | 5,548 | 5,548 | 25 | |||||||||||||||||||||||||||
Institutions | 83,461 | 83,461 | 1,091 | 7,752 | 7,569 | 1,506 | 91,213 | 91,031 | 2,598 | |||||||||||||||||||||||||||
Corporates | 236 | 236 | — | 5,484 | 5,484 | 2,755 | 5,720 | 5,720 | 2,756 | |||||||||||||||||||||||||||
Of which: SMEs | — | — | — | 136 | 136 | 164 | 136 | 136 | 164 | |||||||||||||||||||||||||||
Of which: specialised lending | — | — | — | 839 | 839 | 675 | 839 | 839 | 675 | |||||||||||||||||||||||||||
Of which: other | 236 | 236 | — | 4,509 | 4,509 | 1,916 | 4,745 | 4,745 | 1,917 | |||||||||||||||||||||||||||
Retail | — | — | — | 3 | 3 | 1 | 3 | 3 | 1 | |||||||||||||||||||||||||||
Of which: Secured by immovable property | — | — | — | — | — | — | — | — | — | |||||||||||||||||||||||||||
Of which: Qualifying revolving | — | — | — | — | — | — | — | — | — | |||||||||||||||||||||||||||
Of which: Other retail | — | — | — | 3 | 3 | 1 | 3 | 3 | 1 | |||||||||||||||||||||||||||
Other retail: SMEs | — | — | — | 3 | 3 | 1 | 3 | 3 | 1 | |||||||||||||||||||||||||||
Other retail: Non SMEs | — | — | — | — | — | — | — | — | — | |||||||||||||||||||||||||||
|
|
|
|
|
|
|
|
|
|
|
|
|
|
|
|
|
| |||||||||||||||||||
Total counterparty risk by IRB approach | 89,234 | 89,234 | 1,113 | 13,250 | 13,067 | 4,266 | 102,483 | 102,301 | 5,379 | |||||||||||||||||||||||||||
|
|
|
|
|
|
|
|
|
|
|
|
|
|
|
|
|
| |||||||||||||||||||
Total counterparty risk | 115,515 | 92,375 | 1,586 | 20,199 | 20,199 | 9,712 | 135,714 | 112,574 | 11,298 | |||||||||||||||||||||||||||
|
|
|
|
|
|
|
|
|
|
|
|
|
|
|
|
|
| |||||||||||||||||||
Table of Contents
| BBVA. PILLAR 3 2021 | 4. RISKS | P. 122 |
Positions subject to counterparty credit risk in terms of OE, EAD and RWAs (Million Euros. 12-31-2020)
| Securities financing transactions | Derivatives and transactions with deferred settlement | Total | ||||||||||||||||||||||||||||||||||
Exposure Class and risk types | OE | EAD | RWAs | OE | EAD | RWAs | OE | EAD | RWAs | |||||||||||||||||||||||||||
Central governments or central banks | 13,259 | 1,008 | 7 | 245 | 410 | 108 | 13,504 | 1,418 | 115 | |||||||||||||||||||||||||||
Regional governments or local authorities | — | — | — | 65 | 1 | 1 | 65 | 1 | 1 | |||||||||||||||||||||||||||
Public sector entities | — | — | — | 431 | 153 | 78 | 431 | 153 | 78 | |||||||||||||||||||||||||||
Multilateral Development Banks | — | — | — | 1 | 1 | — | 1 | 1 | — | |||||||||||||||||||||||||||
Institutions | 6,563 | 675 | 137 | 2,530 | 2,013 | 676 | 9,093 | 2,688 | 813 | |||||||||||||||||||||||||||
Corporates | 2,208 | 77 | 73 | 1,934 | 1,905 | 1,922 | 4,142 | 1,982 | 1,995 | |||||||||||||||||||||||||||
Retail | 393 | — | — | 36 | 34 | 25 | 429 | 34 | 25 | |||||||||||||||||||||||||||
Secured by mortgages on immovable property | — | — | — | — | — | — | — | — | — | |||||||||||||||||||||||||||
Exposures in default | — | — | — | — | — | — | — | — | — | |||||||||||||||||||||||||||
Exposures associated with particularly high risk | — | — | — | 48 | 48 | 70 | 48 | 48 | 70 | |||||||||||||||||||||||||||
Covered bonds | — | — | — | — | — | — | — | — | — | |||||||||||||||||||||||||||
Short-term claims on institutions and corporate | — | — | — | — | — | — | — | — | — | |||||||||||||||||||||||||||
Collective investments undertakings | 3 | — | — | — | — | — | 3 | — | — | |||||||||||||||||||||||||||
Other exposures | — | — | — | — | — | — | — | — | — | |||||||||||||||||||||||||||
|
|
|
|
|
|
|
|
|
|
|
|
|
|
|
|
|
| |||||||||||||||||||
Total counterparty risk by standardised approach | 22,426 | 1,760 | 217 | 5,290 | 4,565 | 2,880 | 27,716 | 6,325 | 3,097 | |||||||||||||||||||||||||||
|
|
|
|
|
|
|
|
|
|
|
|
|
|
|
|
|
| |||||||||||||||||||
Central governments or central banks | 365 | 365 | 1 | 33 | 33 | 5 | 398 | 398 | 6 | |||||||||||||||||||||||||||
Institutions | 60,338 | 60,338 | 985 | 18,684 | 18,184 | 1,346 | 79,022 | 78,522 | 2,331 | |||||||||||||||||||||||||||
Corporates | 204 | 204 | — | 4,779 | 4,779 | 2,275 | 4,983 | 4,983 | 2,275 | |||||||||||||||||||||||||||
Of which: SMEs | — | — | — | 138 | 138 | 122 | 138 | 138 | 122 | |||||||||||||||||||||||||||
Of which: specialised lending | — | — | — | 853 | 853 | 649 | 853 | 853 | 649 | |||||||||||||||||||||||||||
Of which: other | 204 | 204 | — | 3,788 | 3,788 | 1,504 | 3,992 | 3,992 | 1,504 | |||||||||||||||||||||||||||
Retail | — | — | — | 3 | 3 | 1 | 3 | 3 | 1 | |||||||||||||||||||||||||||
Of which: Secured by immovable property | — | — | — | — | — | — | — | — | — | |||||||||||||||||||||||||||
Of which: Qualifying revolving | — | — | — | — | — | — | — | — | — | |||||||||||||||||||||||||||
Of which: Other retail | — | — | — | 3 | 3 | 1 | 3 | 3 | 1 | |||||||||||||||||||||||||||
Other retail: SMEs | — | — | — | — | — | — | — | — | — | |||||||||||||||||||||||||||
Other retail: Non SMEs | — | — | — | 3 | 3 | 1 | 3 | 3 | 1 | |||||||||||||||||||||||||||
|
|
|
|
|
|
|
|
|
|
|
|
|
|
|
|
|
| |||||||||||||||||||
Total counterparty risk by IRB approach | 60,907 | 60,907 | 986 | 23,499 | 22,999 | 3,627 | 84,406 | 83,906 | 4,613 | |||||||||||||||||||||||||||
|
|
|
|
|
|
|
|
|
|
|
|
|
|
|
|
|
| |||||||||||||||||||
Total counterparty risk | 83,333 | 62,666 | 1,203 | 28,789 | 27,565 | 6,507 | 112,122 | 90,231 | 7,710 | |||||||||||||||||||||||||||
|
|
|
|
|
|
|
|
|
|
|
|
|
|
|
|
|
| |||||||||||||||||||
The main variation with respect to December 2020 is observed in the Entities category, where the exposure increases due to the securities financing transactions, partially offset by the reduction in the exposure in derivatives.
Table of Contents
| BBVA. PILLAR 3 2021 | 4. RISKS | P. 123 |
From the amounts shown in the table above, those referring to the counterparty risk of trading book exposures in terms of capital requirements are shown below:
Table 38. Amounts of counterparty risk in the trading book (Million Euros)
| Capital requirements | ||||||||||||||||
| 2021 | 2020 | |||||||||||||||
Counterparty Risk Trading Book Activities | Mtm Method | Internal Models (IMM) | Mtm Method | Internal Models (IMM) | ||||||||||||
Standardised Approach | 444 | 239 | ||||||||||||||
Advanced Approach | 406 | 337 | ||||||||||||||
|
|
|
| |||||||||||||
Total | 850 | 576 | ||||||||||||||
|
|
|
| |||||||||||||
The Group currently has a totally immaterial amount of own funds requirements for settlement risk of the trading portfolio.
Below is an overview of the methods used to calculate the regulatory requirements for counterparty credit risk
and the main parameters of each method (excluding requirements for CVA and exposure cleared through a CCP, which are shown in tables CCR2 and CCR8, respectively).
Table 39. EU CCR1 - Analysis of CCR exposure by approach (Million Euros)
| 12-31-2021 | ||||||||||||||||||||||||||||||||
| Replacement cost (RC) | Potential future exposure (PFE) | Expected Effective Positive Exposure (EEPE) | Alfa | Exposure value pre- CRM | Exposure value post- CRM | Exposure value (without CVA) | RWEA | |||||||||||||||||||||||||
EU - Original Exposure Method (for derivatives) | — | — | 1.40 | — | — | — | — | |||||||||||||||||||||||||
EU - Simplified SA-CCR (for derivatives) | — | — | 1.40 | — | — | — | — | |||||||||||||||||||||||||
SA-CCR (for derivatives) | 5,393 | 7,273 | 1.40 | 19,135 | 19,221 | 19,135 | 9,662 | |||||||||||||||||||||||||
IMM (for derivatives and SFTs) | — | — | — | — | — | — | ||||||||||||||||||||||||||
Of which securities financing transactions netting sets | — | — | — | — | — | |||||||||||||||||||||||||||
Of which derivatives and long settlement transactions netting sets | — | — | — | — | — | |||||||||||||||||||||||||||
Of which from contractual cross-product netting sets | — | — | — | — | — | |||||||||||||||||||||||||||
Financial collateral simple method (for SFTs) | — | — | — | — | ||||||||||||||||||||||||||||
Financial collateral comprehensive method (for SFTs) | 96,621 | 75,680 | 75,680 | 1,551 | ||||||||||||||||||||||||||||
VaR for SFTs | — | — | — | — | ||||||||||||||||||||||||||||
|
|
|
|
|
|
|
| |||||||||||||||||||||||||
Total | 115,756 | 94,901 | 94,815 | 11,213 | ||||||||||||||||||||||||||||
|
|
|
|
|
|
|
| |||||||||||||||||||||||||
EU CCR1 - Analysis of CCR exposure by approach (Million Euros)
| 12-31-2020 | ||||||||||||||||
| Replacement Cost / Current market value | Potential future credit exposure | EAD post-CRM | RWAs | |||||||||||||
Mark to market | 14,299 | 10,370 | 21,082 | 6,146 | ||||||||||||
Internal Model Method (for derivatives and SFTs) | — | — | — | — | ||||||||||||
Simple Approach for credit risk mitigation (for SFTs) | — | — | — | — | ||||||||||||
Comprehensive Approach for credit risk mitigation (for SFTs) | — | — | 62,320 | 1,195 | ||||||||||||
VaR for SFTs | — | — | — | — | ||||||||||||
|
|
|
|
|
|
|
| |||||||||
Total | 14,299 | 10,370 | 83,402 | 7,341 | ||||||||||||
|
|
|
|
|
|
|
| |||||||||
The most relevant variation during the period is the adoption of the new SA-CCR counterparty risk measurement method for calculating the capital requirements of derivative operations, being applicable a multiplier of 1.4. over the exposure value. Consequently,
the table as of December 31, 2021 is adapted to the New EBA ITS that includes this change in methodology.
Table of Contents
| BBVA. PILLAR 3 2021 | 4. RISKS | P. 124 |
4.2.6.2.1. Counterparty credit risk by standardised approach
The following table shows a breakdown of exposure to counterparty credit risk (following credit risk mitigation and CCF techniques) calculated using the standardised approach, by exposure category and risk weights (excluding exposures to central counterparties):
Table of Contents
| BBVA. PILLAR 3 2021 | 4. RISKS | P. 125 |
Table 40. EU CCR3 - Standardised approach - CCR exposures by regulatory portfolio and risk (Million Euros. 12-31-2021)
| Risk weight | ||||||||||||||||||||||||||||||||||||||||||||||||
Exposure Class | 0% | 2% | 4% | 10% | 20% | 50% | 70% | 75% | 100% | 150% | Others | Total | ||||||||||||||||||||||||||||||||||||
Central governments or central banks | 2,491 | — | — | — | 3 | 814 | — | — | 1,010 | — | — | 4,317 | ||||||||||||||||||||||||||||||||||||
Regional government or local authorities | — | — | — | — | — | 1 | — | — | — | — | — | 2 | ||||||||||||||||||||||||||||||||||||
Public sector entities | — | — | — | — | — | 5 | — | — | 27 | — | — | 32 | ||||||||||||||||||||||||||||||||||||
Multilateral development banks | — | — | — | — | — | — | — | — | — | — | — | — | ||||||||||||||||||||||||||||||||||||
International organisations | — | — | — | — | — | — | — | — | — | — | — | — | ||||||||||||||||||||||||||||||||||||
Institutions | — | 127 | 86 | — | 277 | 1,167 | — | — | 1,566 | — | — | 3,223 | ||||||||||||||||||||||||||||||||||||
Corporates | — | — | — | — | 19 | 915 | — | — | 1,641 | 65 | — | 2,640 | ||||||||||||||||||||||||||||||||||||
Retail | — | — | — | — | — | — | — | 18 | — | — | — | 18 | ||||||||||||||||||||||||||||||||||||
Institutions and corporates with a short term credit assessment | — | — | — | — | — | — | — | — | — | — | — | — | ||||||||||||||||||||||||||||||||||||
Other items | — | — | — | — | — | — | — | — | — | 42 | — | 42 | ||||||||||||||||||||||||||||||||||||
|
|
|
|
|
|
|
|
|
|
|
|
|
|
|
|
|
|
|
|
|
|
|
| |||||||||||||||||||||||||
Total | 2,491 | 127 | 86 | — | 298 | 2,902 | — | 18 | 4,244 | 107 | — | 10,273 | ||||||||||||||||||||||||||||||||||||
|
|
|
|
|
|
|
|
|
|
|
|
|
|
|
|
|
|
|
|
|
|
|
| |||||||||||||||||||||||||
| (*) | As of 31 December 2021, the table has been adapted to the New EBA ITS, the main modification being the elimination of the column for unrated exposures. |
EU CCR3 - Standardised approach - CCR exposures by regulatory portfolio and risk (Million Euros. 12-31-2020)
| Risk weight | Of which: unrated (1) | |||||||||||||||||||||||||||||||||||||||||||||||||||
Exposure Class | 0% | 2% | 4% | 10% | 20% | 50% | 70% | 75% | 100% | 150% | Others | Total | ||||||||||||||||||||||||||||||||||||||||
Central governments or central banks | 1,271 | — | — | — | 10 | 48 | — | — | 89 | — | — | 1,418 | 856 | |||||||||||||||||||||||||||||||||||||||
Regional government or local authorities | — | — | — | — | — | — | — | — | 1 | — | — | 1 | 1 | |||||||||||||||||||||||||||||||||||||||
Public sector entities | — | — | — | — | 151 | — | — | 2 | — | — | 153 | 2 | ||||||||||||||||||||||||||||||||||||||||
Multilateral development banks | 1 | — | — | — | — | — | — | — | — | — | — | 1 | 1 | |||||||||||||||||||||||||||||||||||||||
International organisations | — | — | — | — | — | — | — | — | — | — | — | — | — | |||||||||||||||||||||||||||||||||||||||
Institutions | — | 101 | 591 | — | 1,186 | 521 | — | — | 290 | — | — | 2,689 | 2,162 | |||||||||||||||||||||||||||||||||||||||
Corporates | — | — | — | — | 2 | 9 | — | — | 1,889 | 82 | — | 1,982 | 1,940 | |||||||||||||||||||||||||||||||||||||||
Retail | — | — | — | — | — | — | — | 34 | — | — | — | 34 | 34 | |||||||||||||||||||||||||||||||||||||||
Institutions and corporates with a short term credit assessment | — | — | — | — | — | — | — | — | — | — | — | — | — | |||||||||||||||||||||||||||||||||||||||
Other items | — | — | — | — | — | — | — | — | 47 | — | 47 | 47 | ||||||||||||||||||||||||||||||||||||||||
|
|
|
|
|
|
|
|
|
|
|
|
|
|
|
|
|
|
|
|
|
|
|
|
|
| |||||||||||||||||||||||||||
Total | 1,272 | 101 | 591 | — | 1,198 | 729 | — | 34 | 2,271 | 129 | — | 6,325 | 5,043 | |||||||||||||||||||||||||||||||||||||||
|
|
|
|
|
|
|
|
|
|
|
|
|
|
|
|
|
|
|
|
|
|
|
|
|
| |||||||||||||||||||||||||||
| (1) | Of which: Unrated refers to exposure for which no credit rating from designated ECAIs is available |
Table of Contents
| BBVA. PILLAR 3 2021 | 4. RISKS | P. 126 |
4.2.6.2.2. Composition of collateral for counterparty risk exposure
A table with a breakdown of collaterals contributed or
received by the Group to strengthen or reduce exposure
to counterparty credit risk related to derivatives
transactions and securities financing transactions as of
December 31, 2021 and December 31, 2020 is presented
below:
Table 41. EU CCR4 - IRB approach: CCR exposures by portfolio and PD scale (Million Euros. 12-31-2021)
PD scale (1)(5) | EAD post-CRM | Average PD(2) | Number of Obligors | Average LGD(3) | Average Maturity (days)(4) | RWAs | RWA Density | |||||||||||||||||||||
Total AIRB approach | 83,933 | 0.21 | % | 3,505 | 10.04 | % | 4,651 | 6 | % | |||||||||||||||||||
|
|
|
|
|
|
|
|
|
|
|
|
|
| |||||||||||||||
Central governments or central banks | 5,548 | 0.05 | % | 6 | 2.61 | % | — | 25 | — | |||||||||||||||||||
|
|
|
|
|
|
|
|
|
|
|
|
|
| |||||||||||||||
0,00 <0,15 | 5,469 | 0.05 | % | 4 | 2.45 | % | — | 18 | — | |||||||||||||||||||
0,15 <0,25 | 79 | 0.20 | % | 2 | 13.47 | % | — | 6 | 8 | % | ||||||||||||||||||
0,25 <0,50 | — | — | — | — | — | — | — | |||||||||||||||||||||
0,50 <0,75 | — | — | — | — | — | — | — | |||||||||||||||||||||
0,75 <2,50 | — | — | — | — | — | — | — | |||||||||||||||||||||
2,50 <10,00 | — | — | — | — | — | — | — | |||||||||||||||||||||
10,00 <100,00 | — | — | — | — | — | — | — | |||||||||||||||||||||
100,00 (Default) | — | — | — | — | — | — | — | |||||||||||||||||||||
Institutions | 73,502 | 0.14 | % | 1,095 | 8.40 | % | — | 2,545 | 3 | % | ||||||||||||||||||
|
|
|
|
|
|
|
|
|
|
|
|
|
| |||||||||||||||
0,00 <0,15 | 49,121 | 0.06 | % | 708 | 10.23 | % | — | 1,437 | 3 | % | ||||||||||||||||||
0,15 <0,25 | 12,123 | 0.19 | % | 105 | 5.13 | % | — | 489 | 4 | % | ||||||||||||||||||
0,25 <0,50 | 10,534 | 0.34 | % | 42 | 3.62 | % | — | 366 | 3 | % | ||||||||||||||||||
0,50 <0,75 | 1,181 | 0.56 | % | 27 | 2.51 | % | — | 46 | 4 | % | ||||||||||||||||||
0,75 <2,50 | 458 | 1.05 | % | 192 | 24.64 | % | — | 189 | 41 | % | ||||||||||||||||||
2,50 <10,00 | 80 | 3.35 | % | 10 | 3.76 | % | — | 8 | 11 | % | ||||||||||||||||||
10,00 <100,00 | 4 | 37.90 | % | 9 | 40.13 | % | — | 10 | 250 | % | ||||||||||||||||||
100,00 (Default) | 1 | 100.00 | % | 2 | 45.00 | % | — | — | 14 | % | ||||||||||||||||||
Corporate - SMEs | 136 | 10.77 | % | 941 | 42.61 | % | 3 | 164 | 121 | % | ||||||||||||||||||
|
|
|
|
|
|
|
|
|
|
|
|
|
| |||||||||||||||
0,00 <0,15 | 1 | 0.12 | % | 48 | 40.36 | % | 1 | — | 15 | % | ||||||||||||||||||
0,15 <0,25 | 1 | 0.20 | % | 40 | 40.39 | % | 1 | — | 20 | % | ||||||||||||||||||
0,25 <0,50 | 12 | 0.35 | % | 186 | 41.53 | % | 4 | 8 | 65 | % | ||||||||||||||||||
0,50 <0,75 | 14 | 0.54 | % | 110 | 42.96 | % | 3 | 10 | 75 | % | ||||||||||||||||||
0,75 <2,50 | 34 | 1.24 | % | 220 | 42.56 | % | 3 | 28 | 82 | % | ||||||||||||||||||
2,50 <10,00 | 41 | 4.90 | % | 199 | 41.56 | % | 2 | 44 | 106 | % | ||||||||||||||||||
10,00 <100,00 | 32 | 35.32 | % | 115 | 44.17 | % | 3 | 74 | 232 | % | ||||||||||||||||||
100,00 (Default) | 1 | 100.00 | % | 23 | 51.59 | % | 4 | — | 26 | % | ||||||||||||||||||
Corporate - Non-SMEs | 4,745 | 1.09 | % | 960 | 43.16 | % | 5 | 1,917 | 40 | % | ||||||||||||||||||
|
|
|
|
|
|
|
|
|
|
|
|
|
| |||||||||||||||
0,00 <0,15 | 1,786 | 0.11 | % | 138 | 40.38 | % | 10 | 480 | 27 | % | ||||||||||||||||||
0,15 <0,25 | 2,246 | 0.18 | % | 303 | 44.41 | % | 2 | 773 | 34 | % | ||||||||||||||||||
0,25 <0,50 | 340 | 0.37 | % | 167 | 47.10 | % | 3 | 253 | 74 | % | ||||||||||||||||||
0,50 <0,75 | 52 | 0.60 | % | 84 | 44.94 | % | 2 | 38 | 74 | % | ||||||||||||||||||
0,75 <2,50 | 221 | 1.36 | % | 107 | 45.46 | % | 3 | 249 | 112 | % | ||||||||||||||||||
2,50 <10,00 | 56 | 5.89 | % | 109 | 45.16 | % | 3 | 96 | 172 | % | ||||||||||||||||||
10,00 <100,00 | 9 | 33.80 | % | 40 | 41.94 | % | 3 | 22 | 247 | % | ||||||||||||||||||
100,00 (Default) | 35 | 100.00 | % | 12 | 46.02 | % | — | 5 | 15 | % | ||||||||||||||||||
Retail - Other SMEs | 3 | 4.39 | % | 431 | 40.16 | % | — | 1 | 32 | % | ||||||||||||||||||
|
|
|
|
|
|
|
|
|
|
|
|
|
| |||||||||||||||
0,00 <0,15 | — | 0.10 | % | 81 | 40.00 | % | — | — | 6 | % | ||||||||||||||||||
0,15 <0,25 | — | 0.20 | % | 19 | 40.00 | % | — | — | 11 | % | ||||||||||||||||||
0,25 <0,50 | — | 0.31 | % | 17 | 40.00 | % | — | — | 16 | % | ||||||||||||||||||
0,50 <0,75 | 1 | 0.51 | % | 114 | 40.89 | % | — | — | 25 | % | ||||||||||||||||||
0,75 <2,50 | — | 1.12 | % | 84 | 40.00 | % | — | — | 34 | % | ||||||||||||||||||
2,50 <10,00 | 1 | 5.74 | % | 93 | 40.06 | % | — | — | 49 | % | ||||||||||||||||||
10,00 <100,00 | — | 33.16 | % | 9 | 40.00 | % | — | — | 87 | % | ||||||||||||||||||
100,00 (Default) | — | 100.00 | % | 14 | 26.38 | % | — | — | 13 | % | ||||||||||||||||||
Table of Contents
| BBVA. PILLAR 3 2021 | 4. RISKS | P. 127 |
PD scale (1)(5) | EAD post-CRM | Average PD(2) | Number of Obligors | Average LGD(3) | Average Maturity (days)(4) | RWAs | RWA Density | |||||||||||||||||||||
Retail - Other Non-SMEs | — | 5.69 | % | 72 | 40.00 | % | — | — | 38 | % | ||||||||||||||||||
|
|
|
|
|
|
|
|
|
|
|
|
|
| |||||||||||||||
0,00 <0,15 | — | 0.10 | % | 14 | 40.00 | % | — | — | 5 | % | ||||||||||||||||||
0,15 <0,25 | — | — | — | — | — | — | — | |||||||||||||||||||||
0,25 <0,50 | — | — | — | — | — | — | — | |||||||||||||||||||||
0,50 <0,75 | — | 0.51 | % | 6 | 40.00 | % | — | — | 14 | % | ||||||||||||||||||
0,75 <2,50 | — | 1.50 | % | 2 | 40.00 | % | — | — | — | |||||||||||||||||||
2,50 <10,00 | — | 6.41 | % | 3 | 40.00 | % | — | — | 50 | % | ||||||||||||||||||
10,00 <100,00 | — | 37.80 | % | 47 | 40.00 | % | — | — | 125 | % | ||||||||||||||||||
100,00 (Default) | — | — | — | — | — | — | — | |||||||||||||||||||||
|
|
|
|
|
|
|
|
|
|
|
| |||||||||||||||||
Total AIRB Approach | 83,933 | 0.21 | % | 3,505 | 10.04 | % | 4,651 | 6 | % | |||||||||||||||||||
|
|
|
|
|
|
|
|
|
|
|
| |||||||||||||||||
| (*) | Exposures of less than 500,000 euros which are rounded down to zero are shown with a dash. |
| (**) | As of 31 December 2021, the table has been adapted to the New EBA ITS, highlighting the following modifications: greater granularity is included in the PD tranches; exposures secured by real estate are split between SMEs and Non-SMEs; equity and specialised lending exposures are excluded; the average maturity is shown in years; the gross exposure corresponds to the exposure after value adjustments and after the effect of guarantor substitution. |
| (1) | PD intervals established by the New EBA ITS. |
| (2) | Corresponds to obligor grade PD weighted by EAD |
| (3) | Corresponds to obligor grade LGD weighted by EAD |
| (4) | Corresponds to the maturity of the obligor in years weighted by EAD. In accordance with Regulation (EU) 680/2014, it is reported only for those categories where average maturities are relevant for the calculation of RWAs. Residual maturities of less than one year are rounded to 1. |
| (5) | Specialized lending exposures are included in the FIRB approach. The Group has chosen to use the supervisory category criteria method, in line with the provisions of article 153.5 of the CRR, therefore, following the New EBA ITS, Specialized Lending exposures are not included in this table. |
Table of Contents
| BBVA. PILLAR 3 2021 | 4. RISKS | P. 128 |
EU CCR4 - IRB approach: CCR exposures by portfolio and PD scale (Million Euros. 12-31-2020)
Escala de PD(1) | EAD post-CRM | Average PD(2) | Number of Obligors | Average LGD(3) | Average Maturity (days)(4) | RWAs | RWA Density | |||||||||||||||||||||
Prudential Portfolio - FIRB method(5) | 853 | — | 260 | — | 649 | 76 | % | |||||||||||||||||||||
|
|
|
|
|
|
|
|
|
|
|
|
|
| |||||||||||||||
Corporate - Specialised lending | 853 | — | 260 | — | — | 649 | 76 | % | ||||||||||||||||||||
|
|
|
|
|
|
|
|
|
|
|
|
|
| |||||||||||||||
Prudential Portfolio - AIRB method | 83,053 | 0.10 | % | 3,416 | 13.00 | % | 3,964 | 5 | % | |||||||||||||||||||
|
|
|
|
|
|
|
|
|
|
|
|
|
| |||||||||||||||
Central governments or central banks | 398 | 0.07 | % | 5 | 4.51 | % | 102 | 7 | 2 | % | ||||||||||||||||||
|
|
|
|
|
|
|
|
|
|
|
|
|
| |||||||||||||||
0,00 <0,15 | 382 | 0.06 | % | 4 | 3.00 | % | 88 | 2 | — | |||||||||||||||||||
0,15 <0,25 | 16 | 0.20 | % | 1 | 40.00 | % | 417 | 5 | 29 | % | ||||||||||||||||||
0,25 <0,50 | — | — | — | — | — �� | — | — | |||||||||||||||||||||
0,50 <0,75 | — | — | — | — | — | — | — | |||||||||||||||||||||
0,75 <2,50 | — | — | — | — | — | — | — | |||||||||||||||||||||
2,50 <10,00 | — | — | — | — | — | — | — | |||||||||||||||||||||
10,00 <100,00 | — | — | — | — | — | — | — | |||||||||||||||||||||
100,00 (Default) | — | — | — | — | — | — | — | |||||||||||||||||||||
Institutions | 78,522 | 0.10 | % | 978 | 11.72 | % | 229 | 2,330 | 3 | % | ||||||||||||||||||
|
|
|
|
|
|
|
|
|
|
|
|
|
| |||||||||||||||
0,00 <0,15 | 66,024 | 0.06 | % | 717 | 13.13 | % | 215 | 1,795 | 3 | % | ||||||||||||||||||
0,15 <0,25 | 6,601 | 0.20 | % | 54 | 3.79 | % | 412 | 243 | 4 | % | ||||||||||||||||||
0,25 <0,50 | 4,464 | 0.31 | % | 46 | 4.46 | % | 207 | 154 | 3 | % | ||||||||||||||||||
0,50 <0,75 | 817 | 0.51 | % | 13 | 4.82 | % | 129 | 51 | 6 | % | ||||||||||||||||||
0,75 <2,50 | 519 | 1.06 | % | 135 | 8.40 | % | 93 | 77 | 15 | % | ||||||||||||||||||
2,50 <10,00 | 97 | 4.08 | % | 11 | 3.28 | % | — | 10 | 10 | % | ||||||||||||||||||
10,00 <100,00 | — | 37.80 | % | 2 | 45.00 | % | 1,825 | — | 305 | % | ||||||||||||||||||
100,00 (Default) | — | — | — | — | — | — | — | |||||||||||||||||||||
Corporate - SMEs | 138 | 11.12 | % | 932 | 40.05 | % | 474 | 122 | 89 | % | ||||||||||||||||||
|
|
|
|
|
|
|
|
|
|
|
|
|
| |||||||||||||||
0,00 <0,15 | 6 | 0.11 | % | 173 | 40.42 | % | 406 | 1 | 13 | % | ||||||||||||||||||
0,15 <0,25 | 7 | 0.20 | % | 59 | 40.30 | % | 357 | 1 | 20 | % | ||||||||||||||||||
0,25 <0,50 | 11 | 0.31 | % | 124 | 40.59 | % | 338 | 4 | 33 | % | ||||||||||||||||||
0,50 <0,75 | 25 | 0.54 | % | 152 | 39.21 | % | 270 | 15 | 58 | % | ||||||||||||||||||
0,75 <2,50 | 42 | 1.18 | % | 215 | 40.19 | % | 558 | 34 | 80 | % | ||||||||||||||||||
2,50 <10,00 | 30 | 5.63 | % | 158 | 39.23 | % | 511 | 37 | 129 | % | ||||||||||||||||||
10,00 <100,00 | 5 | 20.22 | % | 21 | 42.05 | % | 1,234 | 10 | 192 | % | ||||||||||||||||||
100,00 (Default) | 12 | 100.00 | % | 30 | 41.60 | % | 415 | 20 | 167 | % | ||||||||||||||||||
Corporate - Non-SMEs | 3,992 | 0.44 | % | 1,027 | 37.78 | % | 560 | 1,504 | 38 | % | ||||||||||||||||||
|
|
|
|
|
|
|
|
|
|
|
|
|
| |||||||||||||||
0,00 <0,15 | — | 0.00 | % | — | 0.00 | % | — | — | — | % | ||||||||||||||||||
0,15 <0,25 | — | 0.00 | % | — | 0.00 | % | — | — | — | % | ||||||||||||||||||
0,25 <0,50 | — | 0.00 | % | — | 0.00 | % | — | — | — | % | ||||||||||||||||||
0,50 <0,75 | — | 0.00 | % | — | 0.00 | % | — | — | — | % | ||||||||||||||||||
0,75 <2,50 | — | 0.00 | % | — | 0.00 | % | — | — | — | % | ||||||||||||||||||
2,50 <10,00 | — | 0.00 | % | — | 0.00 | % | — | — | — | % | ||||||||||||||||||
10,00 <100,00 | — | 0.00 | % | — | 0.00 | % | — | — | — | % | ||||||||||||||||||
100,00 (Default) | 3 | 100.00 | % | 11 | 43.72 | % | 978 | 1 | 16 | % | ||||||||||||||||||
Retail - Other SMEs | 3 | 13.08 | % | 464 | 40.02 | % | — | 1 | 38 | % | ||||||||||||||||||
|
|
|
|
|
|
|
|
|
|
|
|
|
| |||||||||||||||
0,00 <0,15 | — | 0.12 | % | 73 | 40.00 | % | — | — | 8 | % | ||||||||||||||||||
0,15 <0,25 | — | 0.20 | % | 11 | 40.00 | % | — | — | — | |||||||||||||||||||
0,25 <0,50 | 1 | 0.31 | % | 58 | 40.00 | % | — | — | 17 | % | ||||||||||||||||||
0,50 <0,75 | — | 0.51 | % | 45 | 40.00 | % | — | — | 22 | % | ||||||||||||||||||
0,75 <2,50 | 1 | 1.12 | % | 95 | 40.13 | % | — | — | 34 | % | ||||||||||||||||||
2,50 <10,00 | 1 | 5.02 | % | 127 | 40.00 | % | — | 1 | 46 | % | ||||||||||||||||||
10,00 <100,00 | — | 22.30 | % | 40 | 40.00 | % | — | — | 63 | % | ||||||||||||||||||
100,00 (Default) | — | 100.00 | % | 15 | 40.05 | % | — | — | 14 | % | ||||||||||||||||||
Retail - Other Non-SMEs | — | 3.07 | % | 10 | 40.00 | % | — | — | 39 | % | ||||||||||||||||||
|
|
|
|
|
|
|
|
|
|
|
|
|
| |||||||||||||||
0,00 <0,15 | — | 0.10 | % | 6 | 40.00 | % | — | — | 10 | % | ||||||||||||||||||
0,15 <0,25 | — | — | — | — | — | — | — | |||||||||||||||||||||
0,25 <0,50 | — | — | — | — | — | — | — | |||||||||||||||||||||
0,50 <0,75 | — | 0.51 | % | 3 | 40.00 | % | — | — | 33 | % | ||||||||||||||||||
0,75 <2,50 | — | — | — | — | — | — | — | |||||||||||||||||||||
2,50 <10,00 | — | 3.84 | % | 1 | 40.00 | % | — | — | 45 | % | ||||||||||||||||||
10,00 <100,00 | — | — | — | — | — | — | — | |||||||||||||||||||||
100,00 (Default) | — | — | — | — | — | — | — | |||||||||||||||||||||
|
|
|
|
|
|
|
|
|
|
|
|
|
| |||||||||||||||
Total Advanced Approach | 83,906 | 0.13 | % | 3,676 | 12.99 | % | 0.00 | % | 4,613 | 6 | % | |||||||||||||||||
|
|
|
|
|
|
|
|
|
|
|
|
|
| |||||||||||||||
| (*) | Exposures of less than 500,000 euros which are rounded down to zero are shown with a dash. |
| (1) | PD Intervals recommended by the EBA Guidelines on Disclosure Requirements under Part Eight of the CRR. |
| (2) | Corresponds to obligor grade PD weighted by EAD post CRM. |
| (3) | Corresponds to obligor grade LGD weighted by EAD post CRM. |
| (4) | Corresponds to the maturity of the obligor in years weighted by EAD. In accordance with Regulation (EU) 680/2014, it is reported only for those categories where average maturities are relevant for the calculation of RWAs. Residual maturities of less than one year are rounded to 1. |
Table of Contents
| BBVA. PILLAR 3 2021 | 4. RISKS | P. 129 |
As of December 31, 2021, exposures to central
counterparties included in EU CCR8 table are excluded
from this table.
4.2.6.2.3. Composition of collateral for counterparty risk exposure
A table with a breakdown of collaterals contributed or received by the Group to strengthen or reduce exposure to counterparty credit risk related to derivatives
transactions and securities financing transactions as of December 31, 2021 is presented below:
Table 42. EU CCR5 - Composition of collateral for exposure to Counterparty Credit Risk (Million Euros. 12-31-2021)
| Collateral used in derivative transactions | Collateral used in SFTs | |||||||||||||||||||||||||||||||
| Fair Value of Collateral received | Fair Value of posted Collateral(1) | Fair Value of Collateral received | Fair Value of posted Collateral | |||||||||||||||||||||||||||||
| Segregated(2) | Unsegregated(3) | Segregated(2) | Unsegregated(3) | Segregated(2) | Unsegregated(3) | Segregated(2) | Unsegregated(3) | |||||||||||||||||||||||||
Cash- domestic currency | — | 2,773 | — | 6,270 | 300 | 30,824 | 26 | 40,342 | ||||||||||||||||||||||||
Cash- other currencies | 170 | 1,223 | 933 | 976 | 12 | 22,945 | — | 13,609 | ||||||||||||||||||||||||
Domestic sovereign debt | 63 | 2,744 | 2,101 | 494 | — | 13,726 | 548 | 15,685 | ||||||||||||||||||||||||
Other sovereign debt | 1,052 | 231 | 179 | 23 | 12 | 34,635 | — | 25,320 | ||||||||||||||||||||||||
Government agency debt | — | — | — | — | — | 2,198 | — | 630 | ||||||||||||||||||||||||
Corporate bonds | 147 | 480 | 4 | 28 | — | 5,498 | — | 11,213 | ||||||||||||||||||||||||
Equity securities | — | — | — | — | — | — | — | — | ||||||||||||||||||||||||
Other collateral | — | — | — | — | — | — | — | — | ||||||||||||||||||||||||
|
|
|
|
|
|
|
|
|
|
|
|
|
|
|
| |||||||||||||||||
Total | 1,433 | 7,451 | 3,216 | 7,791 | 324 | 109,826 | 574 | 106,800 | ||||||||||||||||||||||||
|
|
|
|
|
|
|
|
|
|
|
|
|
|
|
| |||||||||||||||||
| (*) | As of 31 December 2021, the table has been adapted to the New EBA ITS, including only the eligible collateral in capital. In addition, both initial margins and variation margins are included. |
| (1) | In accordance with Articles 279 and 298 of Regulation (EU) 2015/13 regarding the treatment of collateral for the purpose of calculating counterparty risk, the amount of collateral provided as collateral for the netting of derivative liability arrangements has been taken into account in the EAD calculation. |
| (2) | Refers to collateral that is held in a bankruptcy-remote manner |
| (3) | Refers to collateral that is not held in a bankruptcy-remote manner |
4.2.6.2.4. Credit derivatives transactions
The table below shows the amounts of credit derivative transactions, broken down into purchased and sold derivatives:
Table 43. EU CCR6 - Credit derivatives exposures (Million Euros. 12-31-2021)
| Credit derivative hedges | ||||||||
| Protection Bought | Protection Sold | |||||||
Notionals | ||||||||
Single-name credit default swaps | 5,246 | 5,408 | ||||||
Index credit default swaps | 3,570 | 3,898 | ||||||
Total return swaps | — | 1,815 | ||||||
Credit options | — | — | ||||||
Other credit derivatives | — | — | ||||||
|
|
|
| |||||
Notionals Total | 8,816 | 11,121 | ||||||
|
|
|
| |||||
Fair Values | ||||||||
Positive fair value (asset) | 236 | — | ||||||
Negative fair value (liability) | (38 | ) | (452 | ) | ||||
Table of Contents
| BBVA. PILLAR 3 2021 | 4. RISKS | P. 130 |
EU CCR6 - Credit derivatives exposures (Million Euros. 12-31-2020)
| Credit derivative hedges | ||||||||
| Protection Bought | Protection Sold | |||||||
Notionals | ||||||||
Single-name credit default swaps | 5,166 | 6,243 | ||||||
Index credit default swaps | 4,982 | 5,985 | ||||||
Total return swaps | — | 1,882 | ||||||
Credit options | — | — | ||||||
Other credit derivatives | — | — | ||||||
|
|
|
| |||||
Notionals Total | 10,148 | 14,110 | ||||||
|
|
|
| |||||
Fair Values | ||||||||
Positive fair value (asset) | 21 | 132 | ||||||
Negative fair value (liability) | (142 | ) | (163 | ) | ||||
There is no relevant variations during 2021.
Additionally, at the end of 2021 and 2020, the Group has no credit derivatives used as collateral in brokerage activities.
4.2.6.3. CVA charge requirements
The CVA surcharge in Capital refers to the additional capital requirements to cover unexpected losses due to credit valuation adjustments, for which there are two approaches:
| • | Standardised Approach (Art. 384 CRR): application of a standard regulatory formula. The formula applied is an analytical approximation to the calculation of the CVA VaR by supposing that the counterparty spreads depend on a single systematic risk factor and on its own idiosyncratic factor, both variables distributed by independent normal distributions, assuming a 99% confidence level. |
| • | Advanced Approach (Art 383 CRR): based on the market risk VaR methodology, which requires a calculation of the “CVA VaR”, assuming the same confidence level (99%) and time horizon (10 days), as well as a stressed scenario. As of December 31, 2021 and December 31, 2020, the Group has no surcharge for CVA calculated under the advanced approach. |
Procedures for calculating the valuation adjustments and reserves
The fair value of liabilities should reflect the entity’s default risk, which includes, among other components, its own credit risk. Taking this into account, the Group makes valuation adjustments for credit risk in the estimates of the fair value of its assets and liabilities.
These adjustments are calculated by estimating Exposure At Default, Probability of Default and Loss Given Default, which are based on the recovery levels for all derivative products on any instrument, deposits and repos at the legal entity level (all counterparties under a same master agreement), in which BBVA has exposure.
Credit Valuation Adjustment (hereinafter “CVA”) and Debit Valuation Adjustments (hereinafter “DVA”) are included in the valuation of derivatives, both assets and liabilities, to reflect the impact on the fair value of the counterparty credit risk and its own, respectively. The Group incorporates in its valuation, for all exposures classified in any of the categories valued at fair value, both the counterparty credit risk and its own. In the trading portfolio, and in the specific case of derivatives, credit risk is recognized through such adjustments.
As a general rule, the calculation of CVA is the sum of the expected positive exposure in time t, the probability of default between t-1 and t, and the Loss Given Default of the counterparty. Consequently, the DVA is calculated as the sum of the expected negative exposure in time t, the probability of default of BBVA between t-1 and t, and the Loss Given Default of BBVA. Both calculations are performed throughout the entire period of potential exposure.
The calculation of the expected positive and negative exposure is done through a Montecarlo simulation of the market variables involved in all trades’ valuation under the same legal netting set.
The information needed to calculate the probability of default and the loss given default of a counterparty comes from the credit markets. The counterparty’s Credit Default Swaps are used if liquid quotes are available. If a market price is not available, BBVA has implemented a mapping process based on the sector, rating and geography of the counterparty to assign probabilities of default and loss given default calibrated directly to market.
An additional adjustment for Own Credit Adjustment (OCA) is applied to the instruments accounted for by applying the Fair Value Option permitted by IFRS 9.
Table of Contents
| BBVA. PILLAR 3 2021 | 4. RISKS | P. 131 |
The credit valuation adjustments in million euros as of December 31, 2021 and December 31, 2020 are shown below:
Table 44. EU CCR2 - CVA Capital Charge (Million Euros. 12-31-2021)
| Exposure value | RWA | |||||||
Total portfolios subject to the advanced method | — | — | ||||||
(i) VaR component (included 3x multiplier) | — | |||||||
(ii) SVaR component (included 3x multiplier) | — | |||||||
All portfolios subject to the standardised method | 6,977 | 2,518 | ||||||
Total subject to the CVA capital charge | — | — | ||||||
|
|
|
| |||||
Total sujeto al requerimiento de capital por CVA | 6,977 | 2,518 | ||||||
|
|
|
| |||||
EU CCR2 - CVA Capital Charge (Million Euros. 12-31-2020)
| Exposure value | RWA | |||||||
Total portfolios subject to the advanced method | — | — | ||||||
(i) VaR component (included 3x multiplier) | — | — | ||||||
(ii) SVaR component (included 3x multiplier) | — | — | ||||||
All portfolios subject to the standardised method | 7,369 | 1,485 | ||||||
|
|
|
| |||||
Total subject to the CVA capital charge | 7,369 | 1,485 | ||||||
|
|
|
| |||||
As of December 31, 2021, BBVA calculates the capital requirements for credit valuation adjustment (CVA) according to the standard method described in Part Three, Title VI of the CRR in accordance with Regulation (EU) 2019/876.
The value of the exposure used to calculate the CVA capital requirements is calculated in accordance with the
Table 45. Flow statements CVA RWAs (Million Euros)
CVA | ||||
RWAs as of December 31, 2020 | 1,485 | |||
|
| |||
Asset size | 749 | |||
Foreign exchange movements | (227 | ) | ||
SA-CCR | 511 | |||
Other | — | |||
|
| |||
RWAs as of December 31, 2021 | 2,518 | |||
|
| |||
As of December 31, 2021, CVA’s risk-weighted assets increased by 70% annually to reach €2,518 million . The increase in CVA risk-weighted assets is mainly explained by the increase in market volatility observed in Turkey and reflected in the increase in the mark-to-market of certain derivative transactions not settled through clearing houses. Additionally, the effect of the incorporation in the measurement of the new counterparty risk framework (SA-CCR) in June 2021 impacted by €511 million.
standardized method for counterparty credit risk. The table as of December 31, 2021 is adapted to the New ITS EBA that includes this change in methodology.
The variations in terms of RWAs during 2021 are presented below:
Table of Contents
| BBVA. PILLAR 3 2021 | 4. RISKS | P. 132 |
4.2.6.4. Exposure to central counterparty clearing houses
The following table presents a complete overview of the exposure to central counterparty clearing houses by type
of exposure (arising from transactions, margins, or contributions to the default fund) and their corresponding capital requirements:
Table 46. EU CCR8 - Exposures to CCPs (Million Euros)
| 12-31-2021 | ||||||||
| EAD post CRM | RWA | |||||||
Exposures to QCCPs (total) | 129 | |||||||
|
| |||||||
Exposures for trades at QCCPs (excluding initial margin and default fund contributions); of which | 17,730 | 58 | ||||||
(i) OTC Derivatives | 726 | 17 | ||||||
(ii) Exchange-traded derivatives | 309 | 6 | ||||||
(iii) Securities financing transactions (SFTs) | 16,695 | 35 | ||||||
(iv) Netting sets where cross-product netting has been approved | — | — | ||||||
Segregated initial margin | 1,075 | |||||||
Non-segregated initial margin | 617 | 17 | ||||||
Pre-funded default fund contributions | 247 | 54 | ||||||
Alternative calculation of own funds requirements for exposures | 482 | — | ||||||
Exposures to non-QCCPs (total) | 27 | |||||||
|
| |||||||
Exposures for trades at non-QCCPs (excluding initial margin and default to contributions); of which | 29 | 27 | ||||||
(i) OTC Derivatives | 11 | 1 | ||||||
(ii) Exchange-traded derivatives | 18 | 26 | ||||||
(iii) Securities financing transactions (SFTs) | — | — | ||||||
(iv) Netting sets where cross-product netting has been approved | — | — | ||||||
Segregated initial margin | — | |||||||
Non-segregated initial margin | — | — | ||||||
Pre-funded default fund contributions | — | — | ||||||
Unfunded default fund contributions | — | — | ||||||
As of December 31, 2021, the table is adapted to the New ITS EBA, highlighting as modification, the presentation of the EAD of securities financing transactions under the internal credit risk model (IRB) gross of real guarantees.
Table of Contents
| BBVA. PILLAR 3 2021 | 4. RISKS | P. 133 |
4.2.7. Information on securitisation
4.2.7.1. General characteristics of securitisation
4.2.7.1.1. Purposes of securitisation
The Group’s current securitisation policy considers a recurrent issuance program with a deliberate diversification of securitised assets that adjusts their volume to the Bank’s capital requirements and to market conditions.
This program is complemented by all the other finance and capital instruments, thereby diversifying the need to resort to wholesale markets.
The definition of the strategy and the execution of the operations, as with all other wholesale finance and capital management, is supervised by the Assets & Liabilities Committee, with the pertinent internal authorisations obtained directly from the Board of Directors or from the Executive Committee.
The main objective of securitisation is to serve as an instrument for the efficient management of the balance sheet, above all as a source of liquidity at an efficient cost, obtaining liquid assets through eligible collateral, as a complement to other financial instruments. In addition, there are other secondary objectives associated with the use of securitisation instruments, such as the freeing up of regulatory capital by transferring risk and the freeing of potential excess over the expected loss, provided it is allowed by the volume of the first-loss tranche and risk transfer.
In accordance with the STS (Simple, Transparent and Standardized) securitisation framework, the Group does not take into account the STS classification when selecting the portfolios to be securitised.
Main risk exposed in securitisation operations.
1. Default risk
Default risk is the risk that the debtor does not pay the assumed contractual obligations by the due date and in the correct manner (for example, potential non-payment of installments).
In the particular case of securitisation, the entities provide information to investors on the situation of the securitised loan portfolio. In this respect, it is worth noting that transactions transferred to the Securitisation Fund do not include defaults, or at most, if there is one, in no case do they exceed 30 days of non-payment, demonstrating the high quality of securitised transactions. The rating agencies take this element closely into account when analysing the credit risk of transactions.
BBVA monitors the changes in these indicators with the aim of establishing specific action plans in the different products, in order to correct any deviations that are leading to a deterioration in credit quality.
In order to monitor these indicators, monthly, and in some cases, daily information is available. It includes flows of additions, recoveries, irregular investments and non-performing loans. The information is obtained through different applications and reports prepared in the Risk area.
BBVA’s policy of recovery for impaired loans consists of defining an operating system that allows a speedy and efficient correction of the irregular situation. It is based on a highly personalised management, with a key role being played by the Recovery Manager and his close and ongoing relationship with the debtor.
The main guarantee is always mortgage on the asset subject of the transaction, or on the main residence. In addition, there are frequent personal guarantees issued by the holders of the loan or the guarantors, which reinforce the repayment of the debt and quality of the risk. The rights to collection before insurance companies are also subrogated in favour of the Bank in cases where there is damage to the mortgaged building due to fire or other duly stipulated causes.
BBVA’s policy regarding the use of guarantees on retained securitised exposures, at this stage, is limited to the signature of a financial guarantee with the European Investment Bank on specific tranches of synthetic securitisations, including pools of corporates and SMEs loans granted by BBVA.
2. Early repayment risk
This derives from the potential total or partial prepayment by the debtor of the amounts corresponding to the (fully or partially) securitised loans, which could imply that the maturity of the securitisation bonds calculated at the time of the issue is shorter than the maturity of the loans transferred to the Fund.
This risk is mainly due to the variations of market interest rates, but despite its importance it is not the only determining factor; to this have to be added other more personal elements, such as inheritance, divorce, change of residence, etc.
In the specific case of the Group’s securitisations, this risk is very limited, as the maturity date of the securitisation Bonds is set according to the maturity of the last loan of the securitised portfolio.
3. Liquidity risk
At times it is noted that a possible limited liquidity of the markets in which the Bonds are traded could constitute a risk derived from the securitisation processes.
Table of Contents
| BBVA. PILLAR 3 2021 | 4. RISKS | P. 134 |
Although an entity may not undertake contracts in the secondary market of Bonds issued by the Securitisation Fund, and thus provide liquidity to the funds, the securitisation process itself consists of converting illiquid assets that form part of the Bank’s balance sheet into liquid assets in the form of securitisation Bonds, which give the possibility for trading and transferring them in a regulated market. This would not be the case if they were not subject to the securitisation process.
In addition, understanding liquidity risk as the possible time mismatch between the maturities of the collections generated by the loans and the payments the Bonds originate, BBVA has not so far made any securitisation
issues in which there is a divergence between collections and payments. The entities that have programs for debt security issues, in which this risk is typically present, mitigate it with the use of liquidity lines that are included in the structure of the Fund.
4.2.7.1.2. Functions performed by the securitisation process and degree of involvement
The Group’s degree of involvement in its securitisation funds is not usually restricted to the mere role of assignor and administrator of the securitised portfolio.
Chart 11. Functions performed in the securitization process and Group’s level of involvement
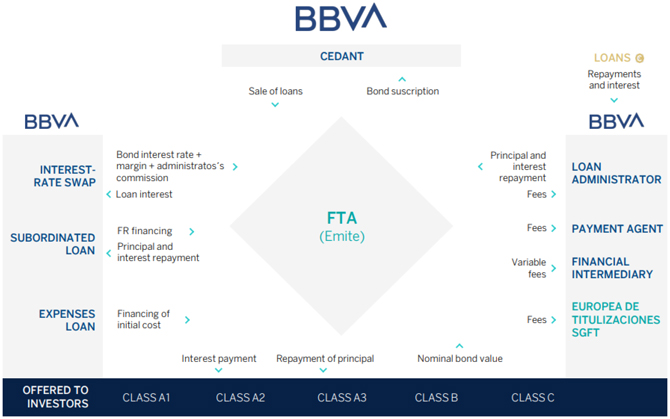
Table of Contents
| BBVA. PILLAR 3 2021 | 4. RISKS
| P. 135 |
As can be seen in the above chart, the Group has usually taken additional roles such as:
| • | Payment Agent. |
| • | Provider of treasury account. |
| • | Provider of the subordinated loan and of the financing of initial costs, with the former being the one that finances the first-loss tranche, and the latter financing the fund’s fixed expenditure. |
| • | Administrative agent of the securitised portfolio. |
The Group has not assumed the role of sponsor of securitisation originated by third-party institutions.
The Group’s balance sheet maintains the first-loss tranches of all securitisation that has been carried out.
It is worth noting that the Group has maintained a consistent line on generating securitisation operations since the credit crunch, which began in July 2007.
In addition, the Group has performed various Synthetic Securitisation operations to date, introducing this new operation as an additional source of regulatory capital release.
4.2.7.1.3. Methods used for the calculation of risk-weighted exposure in securitisation transactions.
When securitisation positions meet the criteria for significant and effective risk transfer as defined by Articles 244 and 245 of Regulation 2017/2401, under the securitisation framework set in Regulation 2017/2402, the Group calculates the capital requirements of these securitisations by applying the following methods, which apply to both originated securitisations and investment positions in securitisation funds originated by third parties:
| • | IRBA method (Article 259): When according to the securitisation features, all information on the underlying loans of the securitised portfolio is accesible, and at least for 95% of the loans the risk weights are calculated under IRB approach. |
| • | SA method (Article 261): When information is available on the underlying loans of the securitised portfolio, but the threshold of 95% of the loans under the IRB approach is not reached. |
| • | ERBA method (Article 263): When information on the underlying securitisation loans is not accesible, and it is necessary to use external rating data. |
4.2.7.1.4. Transfer of risk in securitisation activities and criteria for recognition of gains on sales
The Group considers that the risks and benefits of the securitisations are substantially retained if the subordinated bonds are held and/or if subordination funding has been granted to those securitisation funds, which means that the credit loss risk of the securitised assets will be assumed. Consequently, the Group is not derecognizing those transferred loan portfolios.
In addition, the Group recognizes the gains on sales of securitised assets when they are derecognised from the balance sheet, which implies to comply with the substantial transfer of risks and benefits requirements described above.
The result will be recognised in the income statement and calculated as the difference between the carrying amount and the sum of the amount received, including any new asset received minus liabilities assumed.
When the amount of the transferred financial asset matches the total amount of the original financial asset, the new financial assets, financial liabilities and service-delivery liabilities, which, if any, arise as a result of the transfer, shall be recorded at fair value
4.2.7.2. Securitisation exposure in the banking and trading book
The Group has carried out four securitisations in 2021, two of them in cash or traditional format and the other in synthetic securitisation format. Both the synthetic operations with risk transfer.
The first of them in March, from a portfolio of Consumer loans (BBVA Consumer 11 FT) amounting to €2.5 billion, the second in June, for an amount of €2.5 billion (BBVA RMBS 20 FT), from a portfolio of mortgages the third one, a synthetic operation (VELA SME 2021-1) in December, for an amount of €1.5 billion from a portfolio of loans to SMEs and corporates, and the fourth one, a synthetic operation (CID Finance B.V.—Series 2021-59), also in December, for an amount of €500 million from a Project Finance portfolio. Given that there is no risk transfer for the BBVA Consumer 11 FT and for BBVA RMBS 20 FT securitisation, these operations are not included in the securitisation framework defined by the CRR, the calculation of its risk-weighted assets based on the underlying loans.
Table EU SEC1 below shows the exposure to securitisations of the banking book, broken down by type of underlying asset, indicating whether it is traditional or synthetic securitisations, and identifying the functions (origination, sponsorship and investment). In the “Bank acts as originator” block, the figures presented in the total columns are the total securitised amounts, obtained
Table of Contents
| BBVA. PILLAR 3 2021 | 4. RISKS | P. 136 |
as the sum of the amount corresponding to the first loss tranche, and those with risk transfer:
Table of Contents
| BBVA. PILLAR 3 2021 | 4. RISKS | P. 137 |
Table 47. EU SEC1 - Securitisation exposures in the banking book (Million Euros. 12-31-2021)
| Bank acts as originator | Bank acts as sponsor | Bank acts as investor | ||||||||||||||||||||||||||||||||||||||||||||||||||||||||||
| Traditional | Synthetic | Traditional | Traditional | |||||||||||||||||||||||||||||||||||||||||||||||||||||||||
| STS | Non STS | Of which: | ||||||||||||||||||||||||||||||||||||||||||||||||||||||||||
| Of which: SRT | Of which: SRT | SRT | Subtotal | STS | Non STS | Synthetic | Subtotal | STS | Non STS | Synthetic | Subtotal | |||||||||||||||||||||||||||||||||||||||||||||||||
Total | 331 | 157 | — | — | 2,604 | 2,399 | 2,935 | — | — | — | — | 114 | 21 | — | 135 | |||||||||||||||||||||||||||||||||||||||||||||
|
|
|
|
|
|
|
|
|
|
|
|
|
|
|
|
|
|
|
|
|
|
|
|
|
|
|
|
|
| |||||||||||||||||||||||||||||||
Retail (total)- of which | 331 | 157 | — | — | 2,604 | 2,399 | 2,935 | — | — | — | — | 114 | 14 | — | 128 | |||||||||||||||||||||||||||||||||||||||||||||
|
|
|
|
|
|
|
|
|
|
|
|
|
|
|
|
|
|
|
|
|
|
|
|
|
|
|
|
|
| |||||||||||||||||||||||||||||||
Residential mortgage | — | — | — | — | — | — | — | — | — | — | — | — | 14 | — | 14 | |||||||||||||||||||||||||||||||||||||||||||||
Credit card | — | — | — | — | — | — | — | — | — | — | — | — | — | — | — | |||||||||||||||||||||||||||||||||||||||||||||
Other retail exposures | 331 | 157 | — | — | 2,604 | 2,399 | 2,935 | — | — | — | — | 114 | — | — | 114 | |||||||||||||||||||||||||||||||||||||||||||||
Re-Securitisation | — | — | — | — | — | — | — | — | — | — | — | — | — | — | — | |||||||||||||||||||||||||||||||||||||||||||||
Wholesale (total)- of which | — | — | — | — | — | — | — | — | — | — | — | — | 7 | — | 7 | |||||||||||||||||||||||||||||||||||||||||||||
|
|
|
|
|
|
|
|
|
|
|
|
|
|
|
|
|
|
|
|
|
|
|
|
|
|
|
|
|
| |||||||||||||||||||||||||||||||
Loans to corporates | — | — | — | — | — | — | — | — | — | — | — | — | — | — | — | |||||||||||||||||||||||||||||||||||||||||||||
Commercial mortgage | — | — | — | — | — | — | — | — | — | — | — | — | — | — | — | |||||||||||||||||||||||||||||||||||||||||||||
Lease and receivables | — | — | — | — | — | — | — | — | — | — | — | — | — | — | — | |||||||||||||||||||||||||||||||||||||||||||||
Other wholesale | — | — | — | — | — | — | — | — | — | — | — | — | 7 | — | 7 | |||||||||||||||||||||||||||||||||||||||||||||
Re-Securitisation | — | — | — | — | — | — | — | — | — | — | — | — | — | — | — | |||||||||||||||||||||||||||||||||||||||||||||
| (*) | As of December 31, 2021, the table has been adapted to the New EBA ITS, highlighting the reorganisation of columns and the inclusion of those relating to significant risk transfer. |
SEC1 - Securitisation exposures in the banking book (Million Euros. 12-31-2020)
| Bank acts as originator | Bank acts as sponsor | Bank acts as investor | ||||||||||||||||||||||||||||||||||||||||||||||||||
| Traditional | Of which: STS | Synthetic | Subtotal | Traditional | Of which: STS | Synthetic | Subtotal | Traditional | Of which: STS | Synthetic | Subtotal | |||||||||||||||||||||||||||||||||||||||||
Retail (total)- of which | 269 | 269 | 931 | 1,200 | — | — | — | — | 410 | 73 | — | 410 | ||||||||||||||||||||||||||||||||||||||||
|
|
|
|
|
|
|
|
|
|
|
|
|
|
|
|
|
|
|
|
|
|
|
|
|
| |||||||||||||||||||||||||||
Residential mortgage | — | — | — | — | — | — | — | — | 337 | — | — | 337 | ||||||||||||||||||||||||||||||||||||||||
Credit card | — | — | — | — | — | — | — | — | — | — | — | — | ||||||||||||||||||||||||||||||||||||||||
Other retail exposures | 269 | 269 | 931 | 1,200 | — | — | — | — | 73 | 73 | — | 73 | ||||||||||||||||||||||||||||||||||||||||
Re-Securitisation | — | — | — | — | — | — | — | — | — | — | — | — | ||||||||||||||||||||||||||||||||||||||||
Wholesale (total)- of which | — | — | — | — | — | — | — | — | 54 | — | — | 54 | ||||||||||||||||||||||||||||||||||||||||
|
|
|
|
|
|
|
|
|
|
|
|
|
|
|
|
|
|
|
|
|
|
|
|
|
| |||||||||||||||||||||||||||
Loans to corporates | — | — | — | — | — | — | — | — | — | — | — | — | ||||||||||||||||||||||||||||||||||||||||
Commercial mortgage | — | — | — | — | — | — | — | — | — | — | — | — | ||||||||||||||||||||||||||||||||||||||||
Lease and receivables | — | — | — | — | — | — | — | — | — | — | — | — | ||||||||||||||||||||||||||||||||||||||||
Other wholesale | — | — | — | — | — | — | — | — | 54 | — | — | 54 | ||||||||||||||||||||||||||||||||||||||||
Re-Securitisation | — | — | — | — | — | — | — | — | — | — | — | — | ||||||||||||||||||||||||||||||||||||||||
The securitisation exposures in the investment portfolio are reduced, mainly due to the sale of BBVA USA. In addition, the expiration of one of the bonds in the first half of the year also contributed to the reduction. On the other hand, the originating exposures are impacted by the four securitisations originated during the year, as indicated above.
The EU SEC2 table below shows the amounts in terms of net positions of the securitisation positions in the trading book, broken down by type of underlying asset of the securitization, indicating whether it is traditional or synthetic securitisations, and identifying the functions (origination, sponsorship and investment):
Table of Contents
| BBVA. PILLAR 3 2021 | 4. RISKS | P. 138 |
Table 48. EU SEC2: Securitisation exposures in the trading portfolio (Million Euros. 12-31-2021)
| Bank acts as originator | Bank acts as sponsor | Bank acts as investor | ||||||||||||||||||||||||||||||||||||||||||||||
| Traditional | Traditional | Traditional | ||||||||||||||||||||||||||||||||||||||||||||||
| STS | Non-STS | Synthetic | Subtotal | STS | Non-STS | Synthetic | Subtotal | STS | Non-STS | Synthetic | Subtotal | |||||||||||||||||||||||||||||||||||||
Total | — | — | — | — | — | — | — | — | — | 7 | — | 7 | ||||||||||||||||||||||||||||||||||||
|
|
|
|
|
|
|
|
|
|
|
|
|
|
|
|
|
|
|
|
|
|
|
| |||||||||||||||||||||||||
Retail (total) - of which | — | — | — | — | — | — | — | — | — | 7 | — | 7 | ||||||||||||||||||||||||||||||||||||
|
|
|
|
|
|
|
|
|
|
|
|
|
|
|
|
|
|
|
|
|
|
|
| |||||||||||||||||||||||||
Residential mortgage | — | — | — | — | — | — | — | — | — | 7 | — | 7 | ||||||||||||||||||||||||||||||||||||
Credit card | — | — | — | — | — | — | — | — | — | — | — | — | ||||||||||||||||||||||||||||||||||||
Other retail exposures | — | — | — | — | — | — | — | — | — | — | — | — | ||||||||||||||||||||||||||||||||||||
Re-Securitisation | — | — | — | — | — | — | — | — | — | — | — | — | ||||||||||||||||||||||||||||||||||||
Wholesale (total)- of which | — | — | — | — | — | — | — | — | — | — | — | — | ||||||||||||||||||||||||||||||||||||
|
|
|
|
|
|
|
|
|
|
|
|
|
|
|
|
|
|
|
|
|
|
|
| |||||||||||||||||||||||||
Loans to corporates | — | — | — | — | — | — | — | — | — | — | — | — | ||||||||||||||||||||||||||||||||||||
Commercial mortgage | — | — | — | — | — | — | — | — | — | — | — | — | ||||||||||||||||||||||||||||||||||||
Lease and receivables | — | — | — | — | — | — | — | — | — | — | — | — | ||||||||||||||||||||||||||||||||||||
Other wholesale | — | — | — | — | — | — | — | — | — | — | — | — | ||||||||||||||||||||||||||||||||||||
Re-Securitisation | — | — | — | — | — | — | — | — | — | — | — | — | ||||||||||||||||||||||||||||||||||||
| (*) | As of 31 December 2021, the table has been adapted to the New EBA ITS, in this case, there is a reorganisation of columns. |
| (**) | It includes securitisation positions in the trading portfolio. |
EU SEC2 - Securitisation exposures in the trading portfolio (Million Euros. 12-31-2020)
| Bank acts as originator | Bank acts as sponsor | Bank acts as investor | ||||||||||||||||||||||||||||||||||||||||||||||
| Traditional | Of which: STS | Synthetic | Subtotal | Traditional | Of which: STS | Synthetic | Subtotal | Traditional | Of which: STS | Synthetic | Subtotal | |||||||||||||||||||||||||||||||||||||
Retail (total)- of which | — | — | — | — | — | — | — | — | 16 | — | — | 16 | ||||||||||||||||||||||||||||||||||||
|
|
|
|
|
|
|
|
|
|
|
|
|
|
|
|
|
|
|
|
|
|
|
| |||||||||||||||||||||||||
Residential mortgage | — | — | — | — | — | — | — | — | 16 | — | — | 16 | ||||||||||||||||||||||||||||||||||||
Credit card | — | — | — | — | — | — | — | — | — | — | — | — | ||||||||||||||||||||||||||||||||||||
Other retail exposures | — | — | — | — | — | — | — | — | — | — | — | — | ||||||||||||||||||||||||||||||||||||
Re-Securitisation | — | — | — | — | — | — | — | — | — | — | — | — | ||||||||||||||||||||||||||||||||||||
Wholesale (total)- of which | — | — | — | — | — | — | — | — | — | — | — | — | ||||||||||||||||||||||||||||||||||||
|
|
|
|
|
|
|
|
|
|
|
|
|
|
|
|
|
|
|
|
|
|
|
| |||||||||||||||||||||||||
Loans to corporates | — | — | — | — | — | — | — | — | — | — | — | — | ||||||||||||||||||||||||||||||||||||
Commercial mortgage | — | — | — | — | — | — | — | — | — | — | — | — | ||||||||||||||||||||||||||||||||||||
Lease and receivables | — | — | — | — | — | — | — | — | — | — | — | — | ||||||||||||||||||||||||||||||||||||
Other wholesale | — | — | — | — | — | — | — | — | — | — | — | — | ||||||||||||||||||||||||||||||||||||
Re-Securitisation | — | — | — | — | — | — | — | — | — | — | — | — | ||||||||||||||||||||||||||||||||||||
| (*) | It includes securitisation positions in the trading portfolio. |
Table of Contents
| BBVA. PILLAR 3 2021 | 4. RISKS | P. 139 |
4.2.7.3. Securitisation – Group acting as originator
4.2.7.3.1. Rating agencies used
The external credit assessment institutions (ECAI) involved in the rating of those securitisations originated by the Group which fulfill the criteria of risk transfer and falling within the securitisation solvency framework are, generally, Fitch, Moody’s, S&P, and DBRS. The types of securitisation exposure for which each agency is used are, with no differentiation between the different agencies, all the asset types that tend to be used as residential mortgage loans to Corporates and SMEs, consumer finance and autos and leasing.
In all the securitisation funds, the agencies have assessed the risk of the entire issuance structure:
| • | Awarding ratings to all bond tranches. |
| • | Establishing the volume of the credit enhancement. |
| • | Establishing the necessary triggers (early termination of the restitution period, pro-rata depreciation of AAA classes, pro-rata depreciation of series subordinated to AAA and depreciation of the reserve fund, amongst others). |
For each issue, in addition to the initial rating, the agencies carry out regular quarterly monitoring.
4.2.7.3.2. Positions in securitisation originated by the Group
The table below shows the EAD and RWAs of securitisation positions originated by the Group in the banking book, broken down by type of securitised exposure, tranches and weighting ranges and their corresponding capital requirements as of December 31, 2021 and December 31, 2020.
Table of Contents
| BBVA. PILLAR 3 2021 | 4. RISKS | P. 140 |
Table 49. EU SEC3 - Securitisation exposures in the banking book and associated regulatory capital requirements – bank acting as originator or as sponsor (Million Euros. 12-31-2021)
| Exposure values (by RW bands) | Exposure values (by regulatory approach) | RWA (by regulatory approach) | Capital requirement after cap | |||||||||||||||||||||||||||||||||||||||||||||||||||||||||||||||||
| ≤20% RW | >20% to 50% RW | >50% to100% RW | >100% to <1250% RW | 1250% RW / deductions | SEC-IRBA | SEC-ERBA & SEC-IAA | SEC-SA | 1250% RW / deductions | SEC-IRBA | SEC-ERBA & SEC-IAA | SEC-SA | 1250% RW / deductions | SEC-IRBA | SEC-ERBA & SEC-IAA | SEC-SA | 1250% RW / deductions | ||||||||||||||||||||||||||||||||||||||||||||||||||||
Total Exposures | 2,378 | 156 | — | — | 22 | 2,534 | — | — | 22 | 300 | — | — | — | 24 | — | — | — | |||||||||||||||||||||||||||||||||||||||||||||||||||
|
|
|
|
|
|
|
|
|
|
|
|
|
|
|
|
|
|
|
|
|
|
|
|
|
|
|
|
|
|
|
|
|
| |||||||||||||||||||||||||||||||||||
Traditional Securitisation | — | 156 | — | — | 1 | 156 | — | — | 1 | 40 | — | — | — | 3 | — | — | — | |||||||||||||||||||||||||||||||||||||||||||||||||||
|
|
|
|
|
|
|
|
|
|
|
|
|
|
|
|
|
|
|
|
|
|
|
|
|
|
|
|
|
|
|
|
|
| |||||||||||||||||||||||||||||||||||
Of which Securitisation | — | 156 | — | — | 1 | 156 | — | — | 1 | 40 | 3 | |||||||||||||||||||||||||||||||||||||||||||||||||||||||||
Of which retail underlying | — | 156 | 1 | 156 | 1 | 40 | 3 | |||||||||||||||||||||||||||||||||||||||||||||||||||||||||||||
Of which STS | — | 156 | 1 | 156 | 1 | 40 | 3 | |||||||||||||||||||||||||||||||||||||||||||||||||||||||||||||
Of which wholesale | — | — | — | — | — | — | — | — | — | — | — | — | — | — | — | — | — | |||||||||||||||||||||||||||||||||||||||||||||||||||
Of which STS | — | — | — | — | — | — | — | — | — | — | — | — | — | — | — | — | — | |||||||||||||||||||||||||||||||||||||||||||||||||||
Of which re-Securitisation | — | — | — | — | — | — | — | — | — | — | — | — | — | — | — | — | — | |||||||||||||||||||||||||||||||||||||||||||||||||||
Synthetic Securitisation | 2,378 | — | — | — | 21 | 2,378 | — | — | 21 | 260 | — | — | — | 21 | — | — | — | |||||||||||||||||||||||||||||||||||||||||||||||||||
|
|
|
|
|
|
|
|
|
|
|
|
|
|
|
|
|
|
|
|
|
|
|
|
|
|
|
|
|
|
|
|
|
| |||||||||||||||||||||||||||||||||||
Of which Securitisation | 2,378 | — | — | — | 21 | 2,378 | — | — | 21 | 260 | — | — | — | 21 | — | — | — | |||||||||||||||||||||||||||||||||||||||||||||||||||
Of which retail underlying | 2,378 | — | — | — | 21 | 2,378 | — | — | 21 | 260 | — | — | — | 21 | — | — | — | |||||||||||||||||||||||||||||||||||||||||||||||||||
Of which wholesale | — | — | — | — | — | — | — | — | — | — | — | — | — | — | — | — | — | |||||||||||||||||||||||||||||||||||||||||||||||||||
Of which re-Securitisation | — | — | — | — | — | — | — | — | — | — | — | — | — | — | — | — | — | |||||||||||||||||||||||||||||||||||||||||||||||||||
| (*) | Securitisations with a risk weighting of 1250% are deducted from own funds, as explained in section m) of chapter 3.2 of this report. |
SEC3 - Securitisation exposures in the banking book and associated regulatory capital requirements – bank acting as originator or as sponsor (Million Euros. 12-31-2020)
| Exposure values (by RW bands) | Exposure values (by regulatory approach) | RWA (by regulatory approach) | Capital requirement after cap | |||||||||||||||||||||||||||||||||||||||||||||||||||||||||||||||||
| ≤20% RW | >20% to 50% RW | >50% to100% RW | >100% to <1250% RW | 1250% RW / deductions | SEC-IRBA | SEC-ERBA & SEC-IAA | SEC-SA | 1250% RW / deductions | SEC-IRBA | SEC-ERBA & SEC-IAA | SEC-SA | 1250% RW / deductions | SEC-IRBA | SEC-ERBA & SEC-IAA | SEC-SA | 1250% RW / deductions | ||||||||||||||||||||||||||||||||||||||||||||||||||||
Total Exposures | 1,175 | — | — | 3 | 22 | 1,178 | — | — | 22 | 143 | — | — | — | 11 | — | — | — | |||||||||||||||||||||||||||||||||||||||||||||||||||
|
|
|
|
|
|
|
|
|
|
|
|
|
|
|
|
|
|
|
|
|
|
|
|
|
|
|
|
|
|
|
|
|
| |||||||||||||||||||||||||||||||||||
Traditional Securitisation | 264 | — | — | 3 | 2 | 267 | — | — | 2 | 52 | — | — | — | 4 | — | — | — | |||||||||||||||||||||||||||||||||||||||||||||||||||
|
|
|
|
|
|
|
|
|
|
|
|
|
|
|
|
|
|
|
|
|
|
|
|
|
|
|
|
|
|
|
|
|
| |||||||||||||||||||||||||||||||||||
Of which Securitisation | 264 | — | — | 3 | 2 | 267 | — | — | 2 | 52 | — | — | — | 4 | — | — | — | |||||||||||||||||||||||||||||||||||||||||||||||||||
Of which retail underlying | 264 | — | — | 3 | 2 | 267 | — | — | 2 | 52 | — | — | — | 4 | — | — | — | |||||||||||||||||||||||||||||||||||||||||||||||||||
Of which STS | 264 | — | — | 3 | 2 | 267 | — | — | 2 | 52 | — | — | — | 4 | — | — | — | |||||||||||||||||||||||||||||||||||||||||||||||||||
Of which wholesale | — | — | — | — | — | — | — | — | — | — | — | — | — | — | — | — | — | |||||||||||||||||||||||||||||||||||||||||||||||||||
Of which STS | — | — | — | — | — | — | — | — | — | — | — | — | — | — | — | — | — | |||||||||||||||||||||||||||||||||||||||||||||||||||
Of which re-Securitisation | — | — | — | — | — | — | — | — | — | — | — | — | — | — | — | — | — | |||||||||||||||||||||||||||||||||||||||||||||||||||
Of which senior | — | — | — | — | — | — | — | — | — | — | — | — | — | — | — | — | — | |||||||||||||||||||||||||||||||||||||||||||||||||||
Of which non-senior | — | — | — | — | — | — | — | — | — | — | — | — | — | — | — | — | — | |||||||||||||||||||||||||||||||||||||||||||||||||||
Synthetic Securitisation | 911 | — | — | — | 21 | 911 | — | — | 21 | 91 | — | — | — | 7 | — | — | — | |||||||||||||||||||||||||||||||||||||||||||||||||||
|
|
|
|
|
|
|
|
|
|
|
|
|
|
|
|
|
|
|
|
|
|
|
|
|
|
|
|
|
|
|
|
|
| |||||||||||||||||||||||||||||||||||
Of which Securitisation | 911 | — | — | — | 21 | 911 | — | — | 21 | 91 | — | — | — | 7 | — | — | — | |||||||||||||||||||||||||||||||||||||||||||||||||||
Of which retail underlying | 911 | — | — | — | 21 | 911 | — | — | 21 | 91 | — | — | — | 7 | — | — | — | |||||||||||||||||||||||||||||||||||||||||||||||||||
Of which wholesale | — | — | — | — | — | — | — | — | — | — | — | — | — | — | — | — | — | |||||||||||||||||||||||||||||||||||||||||||||||||||
Of which re-Securitisation | — | — | — | — | — | — | — | — | — | — | — | — | — | — | — | — | — | |||||||||||||||||||||||||||||||||||||||||||||||||||
Of which senior | — | — | — | — | — | — | — | — | — | — | — | — | — | — | — | — | — | |||||||||||||||||||||||||||||||||||||||||||||||||||
Of which non-senior | — | — | — | — | — | — | — | — | — | — | — | — | — | — | — | — | — | |||||||||||||||||||||||||||||||||||||||||||||||||||
| (*) | Securitisations with a risk weighting of 1250% are deducted from own funds, as explained in section m) of chapter 3.2 of this report. |
Table of Contents
| BBVA. PILLAR 3 2021 | 4. RISKS | P. 141 |
In the case of securitisations where the Group acts as originator, the variation of the requirements in 2021 is explained by the two new synthetic securitisations mentioned above which complied with the risk transfer requirements set in the applicable regulatory provision. The net effect on the Group’s RWAs by changing the capital consumption of the underlying assets under the credit risk framework to the capital consumption under the securitisation framework is a reduction of approximately €1.2 billion.
4.2.7.3.3. Breakdown of securitised positions by type of asset
The table below shows the outstanding amount, non-performing exposures and impairment losses recognised in the period by underlying assets of originated securitisation operations which meet the risk transfer criteria, broken down by asset type as of December 31, 2021 and December 31, 2020.
Table 50. EU SEC5 - Exposures securitised by the institution - Exposures in default and specific credit risk adjustments (Million Euros. 12-31-2021)
Asset | Nominal amount | Of which exposures in default | Total amount of specific credit risk adjustments made during the period(1) | |||||||||
Total | 36,079 | 231 | 41 | |||||||||
|
|
|
|
|
| |||||||
Retail exposure | 34,644 | 206 | 47 | |||||||||
|
|
|
|
|
| |||||||
Residential mortgage | 26,690 | 193 | 35 | |||||||||
Credit card | — | — | — | |||||||||
Other retail exposures | 7,954 | 12 | 12 | |||||||||
Re-securitisation | — | — | — | |||||||||
Wholesale exposure | 1,434 | 25 | (6 | ) | ||||||||
|
|
|
|
|
| |||||||
Loans to corporates | — | — | — | |||||||||
Commercial mortgage | — | — | — | |||||||||
Lease and receivables | 1,434 | 25 | (6 | ) | ||||||||
Other wholesale | — | — | — | |||||||||
Re-securitisation | — | — | — | |||||||||
| (*) | As of December 31st, 2021, the table has been adapted to the New EBA ITS, notably the inclusion of the breakdown between retail and wholesale, as well as the reorganisation of the underlying asset types. |
| (1) | Negative amounts indicate an increase in credit risk adjustments during the period |
Breakdown of securitised balances by type of asset (Million Euros. 12-31-2020)
Asset | Nominal amount | Of which exposures in default | Total amount of specific credit risk adjustments made during the period | |||||||||
Residential mortgage | 23,987 | 1 | — | |||||||||
Credit card | — | — | — | |||||||||
Finance leases | 1,955 | — | — | |||||||||
Loans to corporates or SMEs | 20 | — | — | |||||||||
Loans to consume | 3,306 | 1 | — | |||||||||
Collection rigth | — | — | — | |||||||||
Securitisation | — | — | — | |||||||||
Other | — | — | — | |||||||||
|
|
|
|
|
| |||||||
Total | 29,268 | 2 | — | |||||||||
|
|
|
|
|
| |||||||
| (*) | The asset type classification is based on the BBVA Group’s internal classification. |
The above tables include balances of all securitised exposures, regardless of whether they meet the risk transfer criteria. The table of “Securitized balances by type of asset” of December 2020 is restated only for comparison purposes (in December 2020 data was only presented for those securitisations that met the risk transfer criteria).
The table below shows the outstanding balance corresponding to the underlying assets of securitisation originated by the Group, which do not meet the risk transfer criteria, and which, therefore, are not included in the securitisation framework, but rather for which the capital calculation of the exposure is carried out as if it had not been securitised:
Table of Contents
| BBVA. PILLAR 3 2021 | 4. RISKS | P. 142 |
Table 51. Outstanding balance corresponding to the underlying assets of the Group’s originated securitisations, in which risk transfer criteria are not fulfilled (Million Euros)
| Outstanding amount | ||||||||
Type of asset | 2021 | 2020 | ||||||
Commercial and residential mortgages | 26,690 | 23,988 | ||||||
Credit cards | — | — | ||||||
Financial leasing | 1,434 | 1,955 | ||||||
Lending to corporates and SMEs | 37 | 20 | ||||||
Consumer finance | 3,822 | 2,749 | ||||||
Receivables | — | — | ||||||
Securitisation balances | — | — | ||||||
Mortgage-covered bonds | — | — | ||||||
Others | — | — | ||||||
|
|
|
| |||||
Total | 31,983 | 28,711 | ||||||
|
|
|
| |||||
4.2.7.4. Securitisation - Group acting as investor
The amounts in terms of EAD and RWAs of the securitisation positions of the banking book where the Group acts as investor are shown below, broken down by type of underlying asset, tranches and weighting bands that correspond to the securitisations and their corresponding capital requirements at 31 December 2021 and December 31, 2020.
Table of Contents
| BBVA. PILLAR 3 2021 | 4. RISKS | P. 143 |
Table 52. EU SEC4: Securitisation exposures in the banking book and associated capital requirements – bank acting as investor (Million Euros. 12-31-2021)
| Exposure values (by RW bands) | Exposure values (by regulatory approach) | RWA (by regulatory approach) | Capital requirement after cap | |||||||||||||||||||||||||||||||||||||||||||||||||||||||||||||||||
| ≤20% RW | >20% to 50% RW | >50% to 100% RW | >100% to <1250% RW | 1250% RW | SEC-IRBA | SEC-ERBA & SEC-IAA | SEC-SA | 1250% RW | SEC-IRBA | SEC-ERBA & SEC-IAA | SEC-SA | 1250% RW | SEC-IRBA | SEC-ERBA & SEC-IAA | SEC-SA | 1250% RW | ||||||||||||||||||||||||||||||||||||||||||||||||||||
Total Exposures | 114 | 13 | 7 | — | — | — | 134 | — | — | — | 25 | — | — | — | 2 | — | — | |||||||||||||||||||||||||||||||||||||||||||||||||||
|
|
|
|
|
|
|
|
|
|
|
|
|
|
|
|
|
|
|
|
|
|
|
|
|
|
|
|
|
|
|
|
|
| |||||||||||||||||||||||||||||||||||
Traditional Securitisation | 114 | 13 | 7 | — | — | — | 134 | — | — | — | 25 | — | — | — | 2 | — | — | |||||||||||||||||||||||||||||||||||||||||||||||||||
|
|
|
|
|
|
|
|
|
|
|
|
|
|
|
|
|
|
|
|
|
|
|
|
|
|
|
|
|
|
|
|
|
| |||||||||||||||||||||||||||||||||||
Of which Securitisation | 114 | 13 | 7 | — | — | — | 134 | — | — | — | 25 | — | — | — | 2 | — | — | |||||||||||||||||||||||||||||||||||||||||||||||||||
Of which retail underlying | 114 | 13 | — | — | — | — | 127 | — | — | — | 22 | — | — | — | 2 | — | — | |||||||||||||||||||||||||||||||||||||||||||||||||||
Of which STS | 114 | — | — | — | — | — | 114 | — | — | — | 16 | — | — | — | 1 | — | — | |||||||||||||||||||||||||||||||||||||||||||||||||||
Of which wholesale | — | — | 7 | — | — | — | 7 | — | — | — | 4 | — | — | — | — | — | — | |||||||||||||||||||||||||||||||||||||||||||||||||||
Of which STS | — | — | — | — | — | — | — | — | — | — | — | — | — | — | — | — | — | |||||||||||||||||||||||||||||||||||||||||||||||||||
Of which re- Securitisation | — | — | — | — | — | — | — | — | — | — | — | — | — | — | — | — | ||||||||||||||||||||||||||||||||||||||||||||||||||||
Of which senior | — | — | — | — | — | — | — | — | — | — | — | — | — | — | — | — | — | |||||||||||||||||||||||||||||||||||||||||||||||||||
|
|
|
|
|
|
|
|
|
|
|
|
|
|
|
|
|
|
|
|
|
|
|
|
|
|
|
|
|
|
|
|
|
| |||||||||||||||||||||||||||||||||||
Of which non-senior | — | — | — | — | — | — | — | — | — | — | — | — | — | — | — | — | — | |||||||||||||||||||||||||||||||||||||||||||||||||||
Synthetic Securitisation | — | — | — | — | — | — | — | — | — | — | — | — | — | — | — | — | — | |||||||||||||||||||||||||||||||||||||||||||||||||||
Of which Securitisation | — | — | — | — | — | — | — | — | — | — | — | — | — | — | �� | — | — | |||||||||||||||||||||||||||||||||||||||||||||||||||
Of which retail underlying | — | — | — | — | — | — | — | — | — | — | — | — | — | — | — | — | — | |||||||||||||||||||||||||||||||||||||||||||||||||||
| (*) | Securitisations with a risk weighting of 1250% are deducted from own funds, as explained in section m) of chapter 3.2 of this report. |
Table of Contents
| BBVA. PILLAR 3 2021 | 4. RISKS | P. 144 |
SEC4 - Securitisation exposures in the banking book and associated capital requirements – bank acting as investor (Million Euros. 12-31-2020)
| Exposure values (by RW bands) | Exposure values (by regulatory approach) | RWA (by regulatory approach) | Capital requirement after cap | |||||||||||||||||||||||||||||||||||||||||||||||||||||||||||||||||
| ≤20% RW | >20% to 50% RW | >50% to 100% RW | >100% to <1250% RW | 1250% RW | SEC- IRBA | SEC- ERBA & SEC-IAA | SEC-SA | 1250% RW | SEC- IRBA | SEC- ERBA & SEC-IAA | SEC-SA | 1250% RW | SEC- IRBA | SEC- ERBA & SEC-IAA | SEC-SA | 1250% RW | ||||||||||||||||||||||||||||||||||||||||||||||||||||
Total Exposures | 75 | 308 | 50 | 9 | 7 | — | 442 | — | 7 | — | 204 | — | — | — | 16 | — | — | |||||||||||||||||||||||||||||||||||||||||||||||||||
|
|
|
|
|
|
|
|
|
|
|
|
|
|
|
|
|
|
|
|
|
|
|
|
|
|
|
|
|
|
|
|
|
| |||||||||||||||||||||||||||||||||||
Traditional Securitisation | 75 | 308 | 50 | 9 | 7 | — | 442 | — | 7 | — | 204 | — | — | — | 16 | — | — | |||||||||||||||||||||||||||||||||||||||||||||||||||
|
|
|
|
|
|
|
|
|
|
|
|
|
|
|
|
|
|
|
|
|
|
|
|
|
|
|
|
|
|
|
|
|
| |||||||||||||||||||||||||||||||||||
Of which Securitisation | 75 | 308 | 50 | 9 | 7 | — | 442 | — | 7 | — | 204 | — | — | — | 16 | — | — | |||||||||||||||||||||||||||||||||||||||||||||||||||
Of which retail underlying | 74 | 269 | 38 | 8 | 6 | — | 388 | — | 6 | — | 175 | — | — | — | 14 | — | — | |||||||||||||||||||||||||||||||||||||||||||||||||||
Of which STS | 73 | — | — | — | — | — | 73 | — | — | — | 7 | — | — | — | 1 | — | — | |||||||||||||||||||||||||||||||||||||||||||||||||||
Of which wholesale | 1 | 39 | 12 | 2 | — | — | 54 | — | — | — | 29 | — | — | — | 2 | — | — | |||||||||||||||||||||||||||||||||||||||||||||||||||
Of which STS | — | — | — | — | — | — | — | — | — | — | — | — | — | — | — | — | — | |||||||||||||||||||||||||||||||||||||||||||||||||||
Of which re-Securitisation | — | — | — | — | — | — | — | — | — | — | — | — | — | — | — | — | — | |||||||||||||||||||||||||||||||||||||||||||||||||||
Of which senior | — | — | — | — | — | — | — | — | — | — | — | — | — | — | — | — | — | |||||||||||||||||||||||||||||||||||||||||||||||||||
Of which non-senior | — | — | — | — | — | — | — | — | — | — | — | — | — | — | — | — | — | |||||||||||||||||||||||||||||||||||||||||||||||||||
Synthetic Securitisation | — | — | — | — | — | — | — | — | — | — | — | — | — | — | — | — | — | |||||||||||||||||||||||||||||||||||||||||||||||||||
|
|
|
|
|
|
|
|
|
|
|
|
|
|
|
|
|
|
|
|
|
|
|
|
|
|
|
|
|
|
|
|
|
| |||||||||||||||||||||||||||||||||||
Of which Securitisation | — | — | — | — | — | — | — | — | — | — | — | — | — | — | — | — | — | |||||||||||||||||||||||||||||||||||||||||||||||||||
Of which retail underlying | — | — | — | — | — | — | — | — | — | — | — | — | — | — | — | — | — | |||||||||||||||||||||||||||||||||||||||||||||||||||
Of which wholesale | — | — | — | — | — | — | — | — | — | — | — | — | — | — | — | — | — | |||||||||||||||||||||||||||||||||||||||||||||||||||
Of which re-Securitisation | — | — | — | — | — | — | — | — | — | — | — | — | — | — | — | — | — | |||||||||||||||||||||||||||||||||||||||||||||||||||
Of which senior | — | — | — | — | — | — | — | — | — | — | — | — | — | — | — | — | — | |||||||||||||||||||||||||||||||||||||||||||||||||||
Of which non-senior | — | — | — | — | — | — | — | — | — | — | — | — | — | — | — | — | — | |||||||||||||||||||||||||||||||||||||||||||||||||||
| (*) | Securitisations with a risk weighting of 1250% are deducted from own funds, as explained in section m) of chapter 3.2 of this report. |
Table of Contents
| BBVA. PILLAR 3 2021 | 4. RISKS | P. 145 |
The decrease in EAD and RWAs of this kind of securitisations is mainly due to the sale of the USA subsidiary, and, to a lesser extent, to the maturity of a securitisation in the first half.
4.2.8. Hedging and risk reduction policies. Supervision strategies and processes
In certain cases, maximum credit risk exposure is reduced by collateral, credit enhancements and other actions which mitigate the Group’s exposure. The BBVA Group applies a credit risk hedging and mitigation policy deriving from a banking approach focused on relationship banking.
The existence of guarantees could be a necessary but not sufficient instrument for accepting risks, as the assumption of risks by the Group requires prior evaluation of the debtor’s capacity for repayment, or that the debtor can generate sufficient resources to allow the amortization of the risk incurred under the agreed terms.
The policy of accepting risks is therefore organized into three different levels in the BBVA Group:
| • | Analysis of the financial risk of the transaction, based on the debtor’s capacity for repayment or generation of funds. |
| • | The constitution of guarantees that are adequate, or at any rate generally accepted, for the risk assumed, in any of the generally accepted forms: monetary, secured, personal or hedge guarantees; and finally |
| • | Assessment of the repayment risk (asset liquidity) of the guarantees received. |
This is carried out through a prudent risk policy that consists of the analysis of the financial risk, based on the capacity for reimbursement or generation of resources of the borrower, the analysis of the guarantee, assessing, among others, the efficiency, the robustness and the risk, the adequacy of the guarantee with the operation and other aspects such as the location, currency, concentration or the existence of limitations. Additionally, the necessary tasks for the constitution of guarantees must be carried out—in any of the generally accepted forms (collaterals, personal guarantees and financial hedge instruments)—appropriate to the risk assumed.
The procedures for the management and valuation of collateral are set out in the corporate general policies (retail and wholesale), which establish the basic principles for credit risk management, including the management of collaterals assigned in transactions with customers. The criteria for the systematic, standardized and effective treatment of collateral in credit transaction
procedures in BBVA Group’s wholesale and retail banking are included in the Specific Collateral Rules.
The methods used to value the collateral are in line with the best market practices and imply the use of appraisal of real-estate collateral, the market price in market securities, the trading price of shares in mutual funds, etc. All the collaterals received must be correctly assigned and entered in the corresponding register. They must also have the approval of the Group’s legal units.
The valuation of the collateral is taken into account in the calculation of the expected losses. The Group has developed internal models to estimate the realization value of the collaterals received, the time that elapses until then, the costs for their acquisition, maintenance and subsequent sale, from real observations based on its own experience. This modeling is part of the LGD estimation processes that are applied to the different segments, and is included within the annual review and validation procedures.
The following is a description of the main types of collateral for each financial instrument class:
| • | Debt instruments held for trading: The guarantees or credit enhancements obtained directly from the issuer or counterparty are implicit in the clauses of the instrument (mainly guarantees of the issuer). |
| • | Derivatives and hedging derivatives: In derivatives, credit risk is minimized through contractual netting agreements, where positive- and negative-value derivatives with the same counterparty are offset for their net balance. There may likewise be other kinds of guarantees and collaterals, depending on counterparty solvency and the nature of the transaction (mainly collaterals). |
| • | Other financial assets designated at fair value through profit or loss and financial assets at fair value through other comprehensive income: The guarantees or credit enhancements obtained directly from the issuer or counterparty are inherent to the structure of the instrument (mainly personal guarantees). |
| • | Financial assets at amortized cost: |
| a. | Loans and advances to credit institutions: These usually have the counterparty’s personal guarantee or pledged securities in the case of repos. |
| b. | Loans and advances to customers: Most of these loans and advances are backed by personal guarantees extended by the customer. There may also be collateral to secure loans and advances to customers (such as |
Table of Contents
| BBVA. PILLAR 3 2021 | 4. RISKS | P. 146 |
| mortgages, cash collaterals, pledged securities and other collateral), or to obtain other credit enhancements (bonds or insurances). |
| c. | Debt securities: The guarantees or credit enhancements obtained directly from the issuer or counterparty are inherent to the structure of the instrument. |
| • | Financial guarantees, other contingent risks and drawable by third parties: these have the counterparty’s personal guarantee or other types of collaterals. |
4.2.9. Information on credit risk mitigation techniques
4.2.9.1. Hedging based on on-balance sheet and off-balance sheet netting
Within the limits established by the netting rules in each operating country, the Group negotiates with its customers the assignment of the derivatives business to master agreements (e.g., ISDA or CMOF) by including the netting of off-balance sheet transactions.
The specific clauses of each agreement determine the transactions subject to netting.
The mitigation of counterparty risk exposure stemming from the use of mitigation techniques (netting plus the use of collateral agreements) leads to a reduction in overall exposure (mark to market plus add-on).
As pointed out above, financial assets and liabilities may be netted in certain cases. In particular, they are presented for a net amount on the consolidated balance sheet only when the Group’s entities satisfy the provisions of IAS 32-Paragraph 42, so they have both the legal right to net recognised amounts, and the intention of settling the net amount or of realizing the asset and simultaneously paying the liability.
4.2.9.2. Hedging based on collateral
4.2.9.2.1. Management and valuation policies and procedures
The procedures for management and valuation of collateral are included in the Specific Collateral Rules, or in the Policies and Procedures for Retail and Wholesale Credit Risk.
These Policies and Procedures lay down the basic principles of credit risk management, which includes the management of the collateral assigned in transactions with customers.
Accordingly, the risk management model jointly values the existence of a suitable cash flow generation by the debtor that enables them to service the debt, together with the existence of suitable and sufficient guarantees that ensure the recovery of the credit when the debtor’s circumstances render them unable to meet their obligations.
The valuation of collaterals is carried out in a rigorous and prudent manner, with the necessary information to determine it and with extreme caution in the use of appraisal values and any other type of valuation by independent experts. At the time of granting credit, unless local regulations provide for a shorter term, individual appraisals / independent expert appraisals must be available for a maximum age of one year in new origination proposals or that imply an increase in the amount over the existing risk; and three years in proposals on existing risk such as subrogations, forbearance, financing of assets on the group’s balance sheet, etc. In the case of non-performing assets, as well as in restructuring and refinancing, the appraisal review period will be twelve months.
The milestones under which the valuations of the collaterals must be updated in accordance with local regulation are established under these prudential principles.
Random or rotating case assignment processes must be established to ensure the independence in the activity of the professionals or companies in charge of the appraisal with respect to the credit originating units. The valuation of non-real estate guarantees will also be carried out considering the general principles of prudence and rigour. Similarly, the independence and objectivity of the valuations is a critical factor that must be guaranteed through the use of external sources or the value contrast with them. Given the heterogeneity of this type of guarantees, in general the validity of the valuations must be ensured through documentation (for example, pro-forma invoices for movable property, certificates of deposits) or through consultation processes of market values (eg. in securities accounts, investment funds).
With respect to the entities that carry out the valuation of the collateral, principles are in place in accordance with local regulations that govern the level of customer loyalty and dependence on the Group, along with related processes. These valuations will be updated by statistical methods, indices or appraisals of goods, consultation of internal and external sources, etc. which shall be carried out under the generally accepted standards in each market and in accordance with local regulations.
For the validation of the collaterals, the Legal Services, support in the formalisation process ensuring that the requirements are met so that the guarantees are duly established in the corresponding jurisdiction. The guarantees are required to be included in the corresponding policies, duly guarded and registered in the official formats and bodies established, in order to
Table of Contents
| BBVA. PILLAR 3 2021 | 4. RISKS | P. 147 |
fully preserve their recovery effectiveness. In general, these policies must include the general circumstances of the guarantees, the description of the assets that act as collateral, the obligations and rights of the parties involved and the related insurance.
Additionally, a critical review of the valuation is carried out, focusing in particular on aspects such as its understandability, the prudence of the assumptions and the clear and reasonable identification of other comparable properties used as a reference to determine the appraised value.In the wholesale sphere, the possibility of carrying out a due diligence will be considered when the risk or complexity of the operation so requires.
4.2.9.2.2. Types of collateral
As collateral for the purpose of calculating bank capital, the Group uses the hedging established in the solvency regulations. The following are the main types of collateral available in the Group:
| • | Mortgage Guarantees: The collateral is the property upon which the loan is arranged. |
| • | Financial guarantees: Their object is any one of the following financial assets, as per articles 197 and 198 of the solvency regulation. |
| • | Cash deposits, deposit certificates or similar instruments. |
| • | Debt securities issued for the different categories. |
| • | Shares or convertible bonds. |
| • | Other goods and rights used as a real collateral: The following property and rights are considered |
acceptable as collateral as per Article 200 of the solvency regulation. |
| • | Cash deposits, deposit certificates or similar instruments held in third-party institutions other than the lending credit institution, when these are pledged in favour of the latter. |
| • | Life insurance policies pledged in favour of the lending credit institution. |
| • | Debt securities issued by other institutions, provided that these securities are to be repurchased at a pre-set price by the issuing institutions at the request of the holder of the securities. |
4.2.9.3. Hedging based on personal guarantees
According to the solvency regulations, unfunded credit protection consists of personal guarantees, including those arising from credit insurance, that have been granted by the providers of protection defined in Articles 201 and 202 of the solvency regulation.
In the category of Retail exposure under the advanced measurement approach, unfunded credit protection impacts the PD and does not reduce the amount of the credit risk in EAD.
In line with the EBA standards published in June 2020 (EBA/ITS/2020/04), the following table shows the book value of secured and unsecured exposures, including all guarantees recognised for accounting purposes, regardless of their use for capital purposes. The main change with respect to the previous version is the inclusion of a row to breakdown non-performing exposures.
Table 53. EU CR3 - CRM techniques - overview (Million Euros. 12-31-2021)
| Exposures unsecured - carrying amount | Exposures secured - Carrying amount | Exposures secured by collateral | Exposures secured by financial guarantees(1) | Exposures secured by credit derivatives | ||||||||||||||||
Total Loans | 244,452 | 166,038 | 117,359 | 48,680 | — | |||||||||||||||
Total debt securities | 73,718 | — | — | — | — | |||||||||||||||
|
|
|
|
|
|
|
|
|
| |||||||||||
Total exposures | 318,170 | 166,038 | 117,359 | 48,680 | — | |||||||||||||||
|
|
|
|
|
|
|
|
|
| |||||||||||
Of which: non performing | 9,835 | 4,880 | 3,989 | 891 | — | |||||||||||||||
|
|
|
|
|
|
|
|
|
| |||||||||||
Of which: defaulted | 9,835 | 4,880 | 3,989 | 891 | — | |||||||||||||||
|
|
|
|
|
|
|
|
|
| |||||||||||
| (1) | Excluding personal guarantees (unfunded credit protection which impacts on the PD but not in EAD |
EU CR3 - CRM techniques - overview (Million Euros. 12-31-2020)
| Exposures unsecured - carrying amount | Exposures secured - Carrying amount | Exposures secured by collateral | Exposures secured by financial guarantees(1) | Exposures secured by credit derivatives | ||||||||||||||||
Total Loans | 239,644 | 163,879 | 116,867 | 47,012 | — | |||||||||||||||
Total debt securities | 84,786 | — | — | — | — | |||||||||||||||
|
|
|
|
|
|
|
|
|
| |||||||||||
Total exposures | 324,430 | 163,879 | 116,867 | 47,012 | — | |||||||||||||||
|
|
|
|
|
|
|
|
|
| |||||||||||
Of which: defaulted | 10,552 | 4,152 | 3,577 | 575 | — | |||||||||||||||
|
|
|
|
|
|
|
|
|
| |||||||||||
| (1) | Excluding personal guarantees (unfunded credit protection which impacts on the PD but not in EAD |
During 2021, no significant variations have been observed in the coverage level, which reached a percentage of 34% as of December 31, 2021.
Table of Contents
| BBVA. PILLAR 3 2021 | 4. RISKS | P. 148 |
The breakdown of the credit mitigation techniques used in the IRB credit risk approach is below.
Table 54. EU CR7-A - IRB approach – Disclosure of the extent of the use of CRM techniques (Million Euros. 12-31-2021)
| Funded credit Protection (FCP) | Unfunded credit Protection (UFCP) | |||||||||||||||||||||||||||||||||||||||||||||||||||||||
| Part of exposures covered by Financial Collaterals (%) | Part of exposures covered by Other eligible collaterals (%) | Part of exposures covered by Other funded credit protection (%) | ||||||||||||||||||||||||||||||||||||||||||||||||||||||
Exposure | Total exposures |
| Part of exposures covered by Immovable property Collaterals (%) | Part of exposures covered by Receivables (%) | Part of exposures covered by Other physical collateral (%) |
| Part of exposures covered by Cash on deposit (%) | Part of exposures covered by Life insurance policies (%) | Part of exposures covered by Instruments held by a third party (%) | Part of exposures covered by Guarantees (%) | Part of exposures covered by Credit Derivatives (%) | RWEA without substitution effects (reduction effects only) | RWEA with substitution effects (both reduction and sustitution effects) | |||||||||||||||||||||||||||||||||||||||||||
Central governments and central banks | — | — | — | — | — | — | — | — | — | — | — | — | — | — | ||||||||||||||||||||||||||||||||||||||||||
Institutions | — | — | — | — | — | — | — | — | — | — | — | — | — | — | ||||||||||||||||||||||||||||||||||||||||||
Corporates | 5,556 | — | — | — | — | — | — | — | — | — | — | — | 5,935 | 4,498 | ||||||||||||||||||||||||||||||||||||||||||
Of which Corporates – SMEs | — | — | — | — | — | — | — | — | — | — | — | — | — | — | ||||||||||||||||||||||||||||||||||||||||||
Of which Corporates –Specialised lending | 5,556 | — | — | — | — | — | — | — | — | — | — | — | 5,935 | 4,498 | ||||||||||||||||||||||||||||||||||||||||||
Of which Corporates – Other | — | — | — | — | — | — | — | — | — | — | — | — | — | — | ||||||||||||||||||||||||||||||||||||||||||
|
|
|
|
|
|
|
|
|
|
|
|
|
|
|
|
|
|
|
|
|
|
|
|
|
|
|
| |||||||||||||||||||||||||||||
Total FIRB | 5,556 | — | — | — | — | — | — | — | — | — | — | — | 5,935 | 4,498 | ||||||||||||||||||||||||||||||||||||||||||
|
|
|
|
|
|
|
|
|
|
|
|
|
|
|
|
|
|
|
|
|
|
|
|
|
|
|
| |||||||||||||||||||||||||||||
Central governments and central banks | 11,678 | — | — | — | — | — | — | — | — | — | — | — | 1,027 | 958 | ||||||||||||||||||||||||||||||||||||||||||
Institutions | 15,088 | 2.15 | % | 0.88 | % | 0.73 | % | — | 0.15 | % | — | — | — | — | — | — | 11,389 | 4,630 | ||||||||||||||||||||||||||||||||||||||
Corporates | 127,375 | 0.32 | % | 6.00 | % | 2.82 | % | 0.05 | % | 3.13 | % | — | — | — | — | — | — | 99,295 | 68,300 | |||||||||||||||||||||||||||||||||||||
Of which Corporates – SMEs | 18,031 | 1.66 | % | 25.62 | % | 13.52 | % | 0.25 | % | 11.84 | % | — | — | — | — | — | — | 26,448 | 14,858 | |||||||||||||||||||||||||||||||||||||
Of which Corporates –Specialised lending | — | — | — | — | — | — | — | — | — | — | — | — | — | — | ||||||||||||||||||||||||||||||||||||||||||
Of which Corporates – Other | 109,343 | 0.10 | % | 2.77 | % | 1.06 | % | 0.02 | % | 1.69 | % | — | — | — | — | — | — | 72,848 | 53,442 | |||||||||||||||||||||||||||||||||||||
Retail | 98,833 | 0.05 | % | 67.66 | % | 67.34 | % | — | 0.32 | % | — | — | — | — | — | — | 33,740 | 23,726 | ||||||||||||||||||||||||||||||||||||||
Of which Retail – Immovable property SMEs | 1,101 | — | 92.31 | % | 92.28 | % | — | 0.03 | % | — | — | — | — | — | — | 1,946 | 1,347 | |||||||||||||||||||||||||||||||||||||||
Of which Retail – Immovable property non-SMEs | 71,292 | — | 91.52 | % | 91.51 | % | — | 0.02 | % | — | — | — | — | — | — | 10,068 | 9,681 | |||||||||||||||||||||||||||||||||||||||
Of which Retail – Qualifying revolving | 10,315 | — | — | — | — | — | — | — | — | — | — | — | 13,511 | 6,541 | ||||||||||||||||||||||||||||||||||||||||||
Of which Retail – Other SMEs | 3,590 | 1.27 | % | 16.48 | % | 8.11 | % | — | 8.36 | % | — | — | — | — | — | — | 3,531 | 1,519 | ||||||||||||||||||||||||||||||||||||||
Of which Retail – Other non- SMEs | 12,535 | 0.05 | % | 0.13 | % | 0.06 | % | — | 0.07 | % | — | — | — | — | — | — | 4,684 | 4,639 | ||||||||||||||||||||||||||||||||||||||
|
|
|
|
|
|
|
|
|
|
|
|
|
|
|
|
|
|
|
|
|
|
|
|
|
|
|
| |||||||||||||||||||||||||||||
Total AIRB | 252,973 | 0.31 | % | 29.51 | % | 27.77 | % | 0.03 | % | 1.71 | % | — | — | — | — | — | — | 145,452 | 97,614 | |||||||||||||||||||||||||||||||||||||
|
|
|
|
|
|
|
|
|
|
|
|
|
|
|
|
|
|
|
|
|
|
|
|
|
|
|
| |||||||||||||||||||||||||||||
Table of Contents
| BBVA. PILLAR 3 2021 | 4. RISKS | P. 149 |
The table includes all collaterals meeting the eligibility criteria for solvency purposes, and have an effect on EAD or other parameters such as LGD in the case of credit risk exposures under internal models (IRB).
Currently, the Group does not use credit derivatives as a credit risk mitigation technique, so the EU CR7 table “IRB Approach—Effect on RWAs of credit derivatives used as credit risk mitigation techniques” is not applicable.
4.2.9.4. Risk concentration
BBVA has established the measurement, monitoring and reporting criteria for the analysis of large credit exposures that could represent a concentration risk, with the aim of ensuring their alignment with the risk appetite framework defined in the Group.
In particular, measurement and monitoring criteria are established for large exposures at the level of individual concentrations, concentrations of retail portfolios, wholesale sectors and geographies.
A quarterly measurement and monitoring process has been established for reviewing concentration risk.
The main measures to prevent risk concentration in BBVA are:
| • | At both the Group level and the subsidiaries belonging to the banking group, the information of |
4.3.1. Scope and nature of the market risk measurement and reporting systems
Market risk is the possibility that there may be losses in the value of positions held due to movements in the market variables that affect the valuation of financial products and assets in trading activity.
The market activity of the BBVA Group is mainly focused on obtaining recurrent income from the stable client activity and from the exploitation of market opportunities derived from the book management originated by client transactions. The purpose of market risk management is to achieve an appropriate return on capital, maintaining a market risk profile in line with the type of business developed in each geography.
The main market risks can be classified into the following groups:
customers (groups) that hold the largest exposures (greater than 10% of fully loaded CET1; in the subsidiaries their level of own funds are used) is available. If a customer presents a concentration that exceeds the thresholds, the reasonableness of maintaining this exposure must be justified, or the measures to reduce the exposure be explained (for example, cancellation of risk) in writing every year.
| • | As an additional support to management, the portfolio concentration is calculated using the Herfindahl index. To date, the concentration at Group level is “very low”. |
| • | The credit risk mitigation does not have a significant impact on the Group’s large exposures, being used solely as a mechanism for mitigating intra-group risk (“standby letters of credit” issued by BBVA in favor of the banking Group’s subsidiaries). |
| • | The concentration to different industries is calculated based on the risk aggregation by economic activity. BBVA uses a classification that groups activities into 15 sectors. All of them are under the acceptable thresholds at the Group level. |
| • | In retail portfolios, the analysis is carried out at subportfolio level (mortgages and non-mortgage retail). Both are below the acceptable thresholds at the Group level. |
| • | Interest-rate risk: This arises as a result of exposure to movements in the different interest-rate curves involved in trading. Although the typical products that generate sensitivity to the movements in interest rates are money-market products (deposits, interest-rate futures, call money swaps, etc.) and traditional interest-rate derivatives (swaps and interest-rate options such as caps, floors, swaptions, etc.), practically all the financial products are exposed to interest-rate movements due to the effect that such movements have on the valuation of the financial discount. |
| • | Equity risk: This arises as a result of movements in share prices. This risk is generated in spot positions in shares or any derivative products whose underlying asset is a share or an equity index. Dividend risk is a sub-risk of equity risk, arising as an input for any equity option. Its variation may affect the valuation of positions and it is therefore a factor that generates risk on the books. |
| • | Exchange-rate risk: This is caused by movements in the exchange rates of the different currencies in which a position is held. |
Table of Contents
| BBVA. PILLAR 3 2021 | 4. RISKS | P. 150 |
As in the case of equity risk, this risk is generated in spot currency positions, and in any derivative product whose underlying asset is an exchange rate. In addition, the quanto effect (operations where the underlying asset and the instrument itself are denominated in different currencies) means that in certain transactions in which the underlying asset is not a currency, an exchange-rate risk is generated that has to be measured and monitored. |
| • | Credit-spread risk: Credit spread is an indicator of an issuer’s credit quality. Spread risk occurs due to variations in the levels of spread of both corporate and government issues, and affects positions in bonds and credit derivatives. |
| • | Volatility risk: This occurs as a result of changes in the levels of implied price volatility of the different market instruments on which derivatives are traded. This risk, unlike the others, is exclusively a component of trading in derivatives and is defined as a first-order convexity risk that is generated in all possible underlying assets in which there are products with options that require a volatility input for their valuation. |
The metrics developed to control and monitor market risk in the BBVA Group are aligned with market practices and are implemented consistently across all the local market risk units.
Measurement procedures are established in terms of the possible impact of negative market conditions on the trading portfolio of the Group’s Global Markets units, both under ordinary circumstances and in situations of heightened risk factors.
In addition, in Chapter 4.3.4.2 more information about the risk measurement models used in the Group, focused on internal models approved by the supervisor for BBVA S.A. and BBVA Mexico to calculate regulatory capital requirements on trading portfolios is detailed. For the other geographic areas (mainly South America and
Garanti BBVA), the calculation of own funds requirements for trading portfolios is carried out using the standardised approach.
Analysis of the Group’s RWA structure shows that almost 5% corresponds to Market Risk (including structural exchange risk).
4.3.2. Differences in the trading book under accounting and prudential regulation
According to the solvency regulations, trading book shall be made up of all the positions on financial instruments and commodities that the credit institution holds for the purpose of trading or that act as hedging for other elements in this portfolio.
With respect to this portfolio, the rule also refers to the need to establish clearly defined policies and procedures.
For this purpose, regulatory trading book defined by the Group includes the positions managed by the Group’s Trading units, for which market risk limits are set and then monitored daily. Moreover, they comply with the other requirements defined in the solvency regulations.
Financial assets are recorded under the heading “Financial assets held for trading” if the objective of the business model is to generate gains by buying and selling these financial instruments or generate short-term results.
Market risk-weighted assets under the standardised approach (including structural exchange rate risk) account for 30% of total market risk-weighted assets.
The amounts in terms of RWAs and market risk capital requirements calculated by standardised approach as of December 31, 2021 and December 31, 2020 are below.
Table 55. EU MR1 - Market risk under the standardised approach (Million Euros. 12-31-2021)
| RWAs | Capital Requirements | |||||||
Outright Products | 3,889 | 311 | ||||||
Interest Rate Risk | 1,414 | 113 | ||||||
Equity Risk | 353 | 28 | ||||||
Foreign Exchange Risk | 2,059 | 165 | ||||||
Commodity Risk | 63 | 5 | ||||||
Options | — | — | ||||||
Simplified approach | — | — | ||||||
Delta-plus method | — | — | ||||||
Scenario approach | — | — | ||||||
Securitisation | 557 | 45 | ||||||
|
|
|
| |||||
Total | 4,445 | 356 | ||||||
|
|
|
| |||||
| (1) | As of 31 December 2021, the table has been adapted to the New EBA ITS, including the RWAs and capital requirements of the correlation trading book and securitisation instruments within the row “Securitisation”. |
Table of Contents
| BBVA. PILLAR 3 2021 | 4. RISKS | P. 151 |
EU MR1 - Market risk under the standardised approach (Million Euros. 12-31-2021)
| RWAs | Capital Requirements | |||||||
Outright Products | 5,183 | 415 | ||||||
Interest Rate Risk | 1,943 | 155 | ||||||
Equity Risk | 264 | 21 | ||||||
Foreign Exchange Risk | 2,966 | 238 | ||||||
Commodity Risk | 10 | 1 | ||||||
Options | — | — | ||||||
Simplified approach | — | — | ||||||
Delta-plus method | — | — | ||||||
Scenario approach | — | — | ||||||
Securitisation | 4 | — | ||||||
Correlation trading portfolio | 1,210 | 97 | ||||||
|
|
|
| |||||
Total | 6,397 | 512 | ||||||
|
|
|
| |||||
During 2021, the main variations in market risk under the standardised approach are produced by: i) interest rate risks, mainly explained by the sale of BBVA USA, where the Group applied this model; ii) the reduction of the exchange rate risk, mainly in the Mexican peso derived from a greater positive effect regarding the provisions of article 352.2 that the Group has been applying and iii) the lower capital requirement of the trading portfolio of correlation due to the improvement of the structure of the positions subject to this risk.
Table of Contents
| BBVA. PILLAR 3 2021 | 4. RISKS | P. 152 |
4.3.4.1. Scope of application
For the purposes of calculating own funds requirements as approved by the supervisor, the scope of application of the internal market risk model extends to BBVA S.A. and BBVA Mexico trading activity.
As explained in the following section, most of the items on the Group’s consolidated balance sheet that are subject to market risk are positions whose principal metric used to measure their market risk is VaR.
4.3.4.2. Characteristics of the models used
Measurement procedures are established in terms of the possible impact of negative market conditions on the trading portfolio of the Group’s Global Markets units, both under ordinary circumstances and in situations of heightened risk factors.
The standard metric used to measure market risk is Value at Risk (“VaR”), which indicates the maximum loss that may occur in the portfolios at a given confidence level (99%) and time horizon (one day).
This statistic value is widely used in the market and has the advantage of summing up in a single metric the risks inherent to trading activity, taking into account how they are related and providing a prediction of the loss that the trading book could sustain as a result of fluctuations in equity prices, interest rates, foreign exchange rates and credit spreads. The market risk analysis considers various risks, such as credit spread risk, basis risk, as well as volatility and correlation risk.
With respect to the risk measurement models used in the Group, the supervisor has authorised the use of the internal model to determine the regulatory capital requirements deriving from risk positions on the BBVA, S.A. and BBVA Mexico trading book, which together, account for around 77% of the Group’s trading book market risk at December 31, 2021.
BBVA uses a single model to calculate the regulatory requirements by risk, taking into account the correlation between the assets and thus recognizing the diversification effect of the portfolios. The model used estimates the VaR in accordance with the “historical simulation” methodology, which involves estimating the profit and loss that would have been incurred in the current portfolio if the changing market conditions that occurred over a given period of time were repeated. Based on this information, it infers the maximum foreseeable loss in the current portfolio with a given level of confidence.
Absolute and relative returns are used in simulating the potential variation of the risk factors, depending on the
type of risk factor. Relative returns are used in the case of equity and foreign currency; while absolute returns are used in the case of spreads and interest rates.
The decision on the type of return to apply is made according to the risk factor metric subject to variation. The relative return is used in the case of price risk factors, while for interest-rate risk factors it is absolute returns.
The model has the advantage of accurately reflecting the historical distribution of the market variables and of not requiring any specific distribution assumption. The historical period used in this model is two years.
VaR figures are estimated with the following methodologies:
| • | VaR without smoothing, which awards equal weight to the daily information for the previous two years. This is currently the official methodology for measuring market risks for the purpose of monitoring compliance with risk limits. |
| • | VaR with smoothing, which gives a greater weight to more recent market information. This model adjusts the historical information of each market variable to reflect the differences between historical volatility and current volatility. This metric supplements the previous one. . |
VaR with smoothing adapts more swiftly to the changes in financial market conditions, whereas VaR without smoothing is, in general, a more stable metric that will tend to exceed VaR with smoothing when the markets show less volatile trends, but be lower when they present upturns in uncertainty.
At the same time, and following the guidelines established by the Spanish and European authorities, BBVA incorporates metrics in addition to VaR with the aim of meeting the Bank of Spain’s regulatory requirements with respect to the calculation of bank capital for the trading book. Specifically, the measures incorporated in the Group since December 2011 (stipulated by Basel 2.5) are:
| • | VaR: In regulatory terms, the VaR charge incorporates the stressed VaR charge, and the sum of the two (VaR and stressed VaR) is calculated. This quantifies the losses associated with the movements of the risk factors inherent to market operations (including interest-rate risk, exchange-rate risk, equity risk and credit risk, among others). Both VaR and stressed VaR are rescaled by a regulatory multiplier (between three and four) and by the square root of ten to calculate the capital charge. |
Table of Contents
| BBVA. PILLAR 3 2021 | 4. RISKS | P. 153 |
| • | Specific Risk - Incremental Risk Capital (“IRC”). Quantification of the risks of default and changes of the credit ratings of the bond and derivative positions and debt funds with daily look-through or significant benchmark (correlation > 90%) in the trading portfolio. The IRC charge is exclusively applied in entities in respect of which the internal market risk model is used (i.e. BBVA, S.A. and BBVA Mexico). The IRC charge is determined based on the associated losses (calculated at 99.9% confidence level over a one year horizon under the hypothesis of constant risk) due to a rating change and/or default of the issuer with respect to an asset. In addition, the price risk is included in sovereign positions for the specified items. |
| • | Specific Risk: Securitization, correlation portfolios and Investment funds without look-through. Capital charges for securitizations and correlation portfolios are assessed based on the potential losses associated with the occurrence of a credit event in the underlying exposures. They are calculated by the standard model. The scope of the correlations portfolios refers to the First To Default (FTD)-type market operation and/or tranches of market CDOs and only for positions with an active market and hedging capacity. Capital charge for Funds include losses associated with volatility and credit risk of the underling positions of the fund. All charges are calculated by the standard model. |
The capital charge is determined based on the associated losses (at 99.9% over a time horizon of 1 year under the assumption of constant risk) resulting from the rating migration and/or default of the asset’s issuer. Also included is the price risk in sovereign positions for the indicated items.
The calculation methodology is based on the Monte Carlo simulation of the impact of defaults and rating transitions on the portfolio subject to incremental risk capital. The model defining the transition and default process of a counterparty is based on the changes in a counterparty’s credit quality. Under a one-factor Merton model, which underlies the Basel or Creditmetrics model, this credit quality will correspond to the value of the issuer’s assets, depending on a systemic factor that is common to all the issuers, and an idiosyncratic factor specific to each.
All that is needed to simulate the rating and default transition process for the issuers is to simulate the systemic factor and the idiosyncratic component. Once the underlying variable is available, the final rating can be obtained. The individual credit quality simulation of the issuers allows losses due to systemic risk and idiosyncratic risk to be obtained.
Transition matrices
The transition matrix used for calculation is estimated based on the external information about the rating transitions provided by the rating agencies. Specifically, the information provided by the Standard & Poors agency is used.
The appropriateness of using information on external transitions is justified by:
| • | The internal ratings for the Sovereign, Emerging Sovereign Country, Financial Institution and Corporate segments (which constitute the core positions subject to incremental risk capital) are aligned with the external ratings. By way of example, the internal rating system for financial institutions is based on an algorithm that uses external ratings. |
| • | The rating agencies provide sufficient historical information to cover a complete economic cycle (rating transition information is available dating back to the 1981 financial year) and obtain a long-term transition matrix in the same way that long-term probabilities of default are required for the calculation of the regulatory capital for credit risk in the banking book. |
This depth level of historical information is not available for the internal rating systems.
Although external data are used for determining the transitions between ratings, to establish the default, the probabilities used are assigned by the BBVA master scale, which ensures consistency with the probabilities used for the calculations of capital in the Banking Book.
The transition matrix is recalibrated every year, based on information on transitions provided by Standard & Poor’s. A procedure has been defined to readjust the transitions in accordance with the probability of default assigned by the master scale.
Liquidity horizons
The calculation of incremental risk capital used by BBVA explicitly includes the use of positions with a hypothesis of a constant level of risk and quarterly liquidity horizons of less than one year. The average liquidity horizon is in the range of 3-6 months.
The establishment of liquidity horizons follows the guidelines/criteria established by Basel in its guidelines for computing capital for incremental risk.
First, a criterion has been used of capacity for managing positions through liquid instruments that allow their inherent risk to be hedged. The main
Table of Contents
| BBVA. PILLAR 3 2021 | 4. RISKS | P. 154 |
instrument for hedging the price risk for rating transitions and defaults is the Credit Default Swap (CDS). The existence of this hedging instrument serves as a justification for considering a short term liquidity horizon.
However, in addition to considering the existence of a liquid CDS, a distinction has to be made according to the issuer’s rating (this factor is also mentioned in the aforementioned guidelines). Specifically, between investment grade issuers or those with a rating of BBB- or above, and issuers below this limit.
According to these criteria, the issuers are mapped to standard liquidity horizons of 3, 6 or 12 months.
Correlation
The calculation methodology is based on a single-factor model, in which there is one factor common to all the counterparties. The coefficient of the model is determined by the correlation curves established by Basel for corporates, financial institutions and sovereigns based on the probability of default.
The use of the Basel correlation curve ensures consistency with the calculation of regulatory capital under the IRB approach for the positions on the banking book.
Validity tests are performed periodically on the risk measurement models used by the Group. They estimate the maximum loss that could have been incurred in the positions assessed with a given level of probability (backtesting), as well as measurements of the impact of extreme market events on the risk positions held (stress testing).
Backtesting is performed at the trading floor level as an additional control measure in order to carry out a more specific monitoring of the validity of the measurement models.
The current structure for market risk management includes monitoring market risk limits, which consists of a system of limits based on Value at Risk (VaR), economic capital (based on VaR measurements) and VaR sub-limits, as well as stop-loss limits for each of the Group’s business units. The global limits are approved by the Executive Committee on an annual basis, once they have been analysed by the Global Risk Management Committee (GRMC). This limits structure is developed by identifying specific risks by type, trading activity and trading floor. The market risk unit also maintains consistency between limits. The control structure in place is supplemented by limits on loss and a system of alert signals to anticipate the effects of adverse situations in terms of risk and/or result.
The review of the quality of the inputs used by the evaluation processes is based on checking the data
against other sources of information accepted as standard. These checks detect errors in the historical series such as repetitions, data outside the range, missing data, etc. As well as these periodic checks of the historical data loaded, the daily data that feed these series are subject to a data quality process to guarantee their integrity.
The choice of proxies is based on the correlation detected between the performance of the factor to be entered and the proxy factor. A Simple Linear Regression model is used, selecting the proxy that best represents the determination coefficient (R2) within the whole period for which the performance of both series is available. Next, the performance of the factor on the necessary dates is reconstructed, using the beta parameter estimated in the simple linear regression.
4.3.4.2.1. Valuation methodology and description of the independent price verification process
As part of the process established in the Group for determining the fair value in order to ensure that financial assets and liabilities are properly following the IFRS 13 principles: Fair value is the price that would be received to sell an asset or paid to transfer a liability in an orderly transaction between market participants in the principal market or most advantageous market, at the measurement date.
The fair value is reached without making any deduction in transaction costs that might be incurred due to sale or disposal by other means.
BBVA has established, at a geographic level, a structure of Risk Operational Admission and Product Governance Committees responsible for validating and approving new products or types of financial assets and liabilities before being contracted. Local management responsible for valuation, which are independent from the business (see Management Report—Risk) are members of these committees.
These areas are required to ensure, prior to the approval stage, the existence of not only technical and human resources, but also adequate informational sources to measure the fair value of these financial assets and liabilities, in accordance with the rules established by the valuation global area and using models that have been validated and approved by the responsible areas complying with the governance of BBVA Group’s official models.
Fair value hierarchy
All financial instruments, both assets and liabilities are initially recognized at fair value, which at that point is equivalent to the transaction price, unless there is evidence to the contrary in the market. Subsequently, depending on the type of financial instrument, it may continue to be recognized at amortized cost or fair value
Table of Contents
| BBVA. PILLAR 3 2021 | 4. RISKS | P. 155 |
through adjustments in the consolidated income statement or equity.
When possible, the fair value is determined as the market price of a financial instrument. However, for many of the financial assets and liabilities of the Group, especially in the case of derivatives, there is no market price available, so its fair value is estimated on the basis of the price established in recent transactions involving similar instruments or, in the absence thereof, by using mathematical measurement models that are sufficiently tried and trusted by the international financial community. The estimates of the fair value derived from the use of such models take into consideration the specific features of the asset or liability to be measured and, in particular, the various types of risk associated with such asset or liability. However, the limitations inherent in the measurement models and possible inaccuracies in the assumptions and parameters required by these models may mean that the estimated fair value of an asset or liability does not exactly match the price for which the asset or liability could be exchanged or settled on the date of its measurement.
Additionally, for financial assets and liabilities that show significant uncertainty in inputs or model parameters used for valuation, criteria is established to measure said uncertainty and activity limits are set based on these. Finally, these measurements are compared, as much as possible, against other sources such as the measurements obtained by the business teams or those obtained by other market participants.
The process for determining the fair value requires the classification of the financial assets and liabilities according to the measurement processes used as set forth below:
| • | Level 1: Valuation using directly the quotation of the instrument, observable and readily and regularly available from independent price sources and referenced to active markets that the entity can access at the measurement date. The instruments classified within this level are fixed-income securities, equity instruments and certain derivatives. |
| • | Level 2: Valuation of financial instruments with commonly accepted techniques that use inputs obtained from observable data in markets. |
| • | Level 3: Valuation of financial instruments with valuation techniques that use significant unobservable inputs in the market. As of December 31, 2021, the affected instruments at fair value accounted for approximately 0.74% of financial assets and 0.35% of the Group’s financial liabilities. Model selection and validation is undertaken by control areas outside the business areas. |
Full revaluation is used for most financial products at BBVA Group.
In addition, the Group calculates Prudent Valuation Adjustments (PVA) for all instruments valued at fair value. PVA is an additional or conservative adjustment to the fair value that allows a more prudent assessment to be obtained by considering sources of risks that exist in the calculation of the fair value (uncertainty inputs, risk model, etc). A detailed breakdown of the method for calculating PVAs for the Group is below:
Table of Contents
| BBVA. PILLAR 3 2021 | 4. RISKS | P. 156 |
Table 56. EU PV1 - Prudent Valuation Adjustments (Million Euros. 12-31-2021)
| Risk category | Category level AVA -Valuation uncertainty | |||||||||||||||||||||||||||||||||||||||
Category | Equity | Interest Rates | Foreign exchange | Credit | Commodities | Unearned credit spreads AVA | Investment and funding costs AVA | Total category level post-diversification | Of which: Total core approach in the trading book | Of which: Total core approach in the banking book | ||||||||||||||||||||||||||||||
Market price uncertainty | 37 | 120 | 21 | 3 | — | 4 | — | 93 | 75 | 17 | ||||||||||||||||||||||||||||||
Close-out cost | 31 | 64 | 32 | 7 | — | 5 | — | 69 | 60 | 9 | ||||||||||||||||||||||||||||||
Concentrated positions | 26 | 40 | — | — | — | — | — | 67 | 28 | 39 | ||||||||||||||||||||||||||||||
Early termination | — | — | — | — | — | — | — | — | — | — | ||||||||||||||||||||||||||||||
Model risk | 6 | 1 | — | 1 | — | 8 | 3 | 10 | 10 | — | ||||||||||||||||||||||||||||||
Operational risk | 3 | 9 | 3 | 1 | — | — | — | 16 | 14 | 3 | ||||||||||||||||||||||||||||||
Future administrative costs | — | 6 | — | — | — | — | — | 6 | 6 | — | ||||||||||||||||||||||||||||||
|
|
|
|
|
|
|
|
|
|
|
|
|
|
|
|
|
|
|
| |||||||||||||||||||||
Total Additional Valuation Adjustments (AVAs) | 260 | 193 | 68 | |||||||||||||||||||||||||||||||||||||
|
|
|
|
|
| |||||||||||||||||||||||||||||||||||
EU PV1 - Prudent Valuation Adjustments (Million Euros. 12-31-2020)
| Risk category | Category level AVA -Valuation uncertainty | |||||||||||||||||||||||||||||||||||||||
Category | Equity | Interest Rates | Foreign exchange | Credit | Commodities | Unearned credit spreads AVA | Investment and funding costs AVA | Total category level post-diversification | Of which: Total core approach in the trading book | Of which: Total core approach in the banking book | ||||||||||||||||||||||||||||||
Market price uncertainty | 28 | 183 | 11 | 2 | — | 1 | — | 77 | 39 | 37 | ||||||||||||||||||||||||||||||
Close-out cost | 30 | 136 | 17 | 10 | — | 4 | — | 67 | 47 | 20 | ||||||||||||||||||||||||||||||
Concentrated positions | 15 | 46 | — | — | — | — | — | 62 | 15 | 47 | ||||||||||||||||||||||||||||||
Early termination | — | 1 | — | — | — | — | — | 1 | 1 | — | ||||||||||||||||||||||||||||||
Model risk | 16 | 3 | — | 3 | — | — | 2 | 8 | 3 | 5 | ||||||||||||||||||||||||||||||
Operational risk | 2 | 11 | 1 | 1 | — | — | — | 14 | 9 | 6 | ||||||||||||||||||||||||||||||
Future administrative costs | — | 4 | — | — | — | — | — | 4 | 4 | — | ||||||||||||||||||||||||||||||
|
|
|
|
|
|
|
|
|
|
|
|
|
|
|
|
|
|
|
| |||||||||||||||||||||
Total Additional Valuation Adjustments (AVAs) | 233 | 118 | 115 | |||||||||||||||||||||||||||||||||||||
|
|
|
|
|
| |||||||||||||||||||||||||||||||||||
Comparison between periods has been affected by the end, on January 1, 2021, of the transitional period during which it was allowed to use an aggregation factor of 66% instead of 50% (Regulation EU 2020/866).
Table of Contents
| BBVA. PILLAR 3 2021 | 4. RISKS | P. 157 |
4.3.4.2.2. Market risk in 2021
The Group’s market risk related to its trading portfolio remained in 2021 at low levels compared to other risks managed by BBVA, particularly credit risk. This is due to the nature of the business. In 2021 the average VaR was €29 million, above the figure of 2020, with a maximum
level in the year reached on the day April 7, 2021 of €36 million. The evolution in the BBVA Group’s market risk during 2021, measured as VaR without smoothing (see Glossary) with a 99% confidence level and a 1-day horizon (shown in million euros) is as follows:
VaR without smoothing figures by risk factors are below :
Chart 12. Trading book. Trends in VaR without smoothing
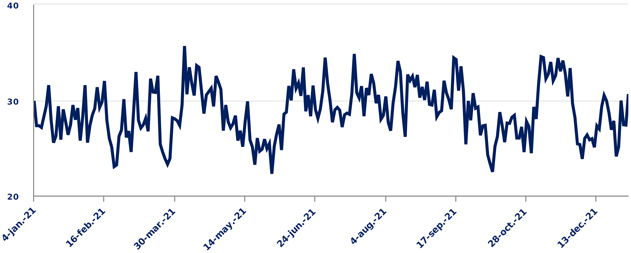
Table 57. Trading Book. VaR without smoothing by risk factors (Million Euros)
VaR by risk factors | Interest-rate and spread risk | Exchange -rate risk | Equity risk | Vega / correlation risk | Diversification effect(1) | Total | ||||||||||||||||||
December 2021 | ||||||||||||||||||||||||
Average VaR for the period | 33 | 10 | 2 | 11 | (28 | ) | 29 | |||||||||||||||||
Maximum VaR for the period | 32 | 13 | 4 | 1 | (14 | ) | 36 | |||||||||||||||||
Minimum VaR for the period | 27 | 9 | 1 | 10 | (25 | ) | 22 | |||||||||||||||||
|
|
|
|
|
|
|
|
|
|
|
| |||||||||||||
VaR at the end of the period | 34 | 9 | 5 | 11 | (29 | ) | 31 | |||||||||||||||||
|
|
|
|
|
|
|
|
|
|
|
| |||||||||||||
December 2020 | ||||||||||||||||||||||||
Average VaR for the period | 29 | 12 | 4 | 11 | (28 | ) | 27 | |||||||||||||||||
Maximum VaR for the period | 39 | 20 | 10 | 20 | (14 | ) | 39 | |||||||||||||||||
Minimum VaR for the period | 20 | 3 | 1 | 6 | (39 | ) | 18 | |||||||||||||||||
|
|
|
|
|
|
|
|
|
|
|
| |||||||||||||
VaR at the end of the period | 32 | 12 | 2 | 11 | (29 | ) | 28 | |||||||||||||||||
|
|
|
|
|
|
|
|
|
|
|
| |||||||||||||
| (1) | The diversification effect is the difference between the sum of the average individual risk factors and the total VaR figure that includes the implied correlation between all the variables and scenarios used in the measurement |
By type of market risk assumed by the Group’s trading portfolio, the main risk factor for the Group continued to be that linked to interest rates, with a weight of 57% of the total at December 31, 2021 (this figure includes the spread risk). The relative weight of this risk has slightly increased compared with the close of 2020 (56%). Exchange-rate risk accounted for 16% of the total risk, decreasing its weight with respect to December 2020 (22%), while equity, volatility and correlation risk has
increased, with a weight of 28% at the close of 2021 (vs. 22% at the close of 2020).
According to article 455, letter d) and e) of the CRR -corresponding to the breakdown of information on internal models of Market Risk-, the elements that make up the Own Funds requirements to which a reference is made in articles 364 and 365 of the CRR, are presented below.
Table of Contents
| BBVA. PILLAR 3 2021 | 4. RISKS | P. 158 |
Table 58. EU MR2-A - Market risk under the IMA (Million Euros. 12-31-2021)
| RWAs | Capital Requirements | |||||||
VaR | 2,634 | 211 | ||||||
Previous day’s VaR | 74 | |||||||
Average of the daily VaR on each of the preceding sixty business days (VaRavg) x multiplication factor | 211 | |||||||
SVaR | 5,431 | 434 | ||||||
Latest SVaR | 143 | |||||||
Average of the SVaR during the preceding sixty business days (sVaRavg) x multiplication factor (mc) | 434 | |||||||
Incremental risk charge - IRC | 2,201 | 176 | ||||||
Most recent IRC value | 176 | |||||||
Average of the IRC number over the preceding 12 weeks | 135 | |||||||
Comprehensive Risk Measure- CRM | — | — | ||||||
Most recent risk number for the correlation trading portfolio over the preceding 12 weeks | — | |||||||
Average of the risk number for the correlation trading portfolio over the preceding 12 weeks | — | |||||||
8% of the own funds requirement in SA on most recent risk number for the correlation trading portfolio | — | |||||||
Others | — | |||||||
|
|
|
| |||||
Total | 10,267 | 821 | ||||||
|
|
|
| |||||
EU MR2-A - Market risk under the IMA (Million Euros. 12-31-2020)
| RWAs | Capital Requirements | |||||||
VaR | 2,276 | 182 | ||||||
Previous day’s VaR | 63 | |||||||
Average of the daily VaR on each of the preceding sixty business days (VaRavg) x multiplication factor | 182 | |||||||
SVaR | 3,639 | 291 | ||||||
Latest SVaR | 127 | |||||||
Average of the SVaR during the preceding sixty business days (sVaRavg) x multiplication factor (mc) | 291 | |||||||
Incremental risk charge - IRC | 2,461 | 197 | ||||||
Most recent IRC value | 166 | |||||||
Average of the IRC number over the preceding 13 weeks | 197 | |||||||
Comprehensive Risk Measure- CRM | 0 | 0 | ||||||
Most recent risk number for the correlation trading portfolio over the preceding 13 weeks | 0 | |||||||
Average of the risk number for the correlation trading portfolio over the preceding 13 weeks | 0 | |||||||
8% of the own funds requirement in SA on most recent risk number for the correlation trading portfolio | 0 | |||||||
Others | 0 | |||||||
|
|
|
| |||||
Total | 8,376 | 670 | ||||||
|
|
|
| |||||
For more information about RWA and capital requirements under IMA, see Table 9.
Table of Contents
| BBVA. PILLAR 3 2021 | 4. RISKS | P. 159 |
Table 59. EU MR3 - IMA values for trading portfolios (Million Euros. 12-31-2021)
IMA values for trading portfolios (1)(2) | ||||
VaR (10 day 99%) | ||||
Maximum value | 95 | |||
Average value | 70 | |||
Minimum value | 46 | |||
Period value | 74 | |||
SVar (10 day 99%) | ||||
Maximum value | 198 | |||
Average value | 144 | |||
Minimum value | 100 | |||
Period value | 143 | |||
IRC (99.9%) | ||||
Maximum value | 176 | |||
Average value | 135 | |||
Minimum value | 121 | |||
Period value | 176 | |||
CRM (99.9%) | ||||
Maximum value | — | |||
Average value | — | |||
Minimum value | — | |||
Period value | — |
| (1) | Data related to the second half of 2021 |
| (2) | As of 31 December 2021, the table has been adapted to the New EBA ITS, which implies the mapping of the period-end data to Corep 24 (Supervisory reporting). This means including, for the purposes of presenting this table, the additional surcharge of 1.60 on the IRC component already applied in December 2020. In addition, the information for the previous period has been restated for comparative purposes. |
EU MR3 - IMA values for trading portfolios (Million Euros. 12-31-2020)
IMA values for trading portfolios (1)(2) | ||||
VaR (10 day 99%) | ||||
Maximum value | 91 | |||
Average value | 61 | |||
Minimum value | 35 | |||
Period value | 63 | |||
SVar (10 day 99%) | ||||
Maximum value | 163 | |||
Average value | 109 | |||
Minimum value | 59 | |||
Period value | 127 | |||
IRC (99.9%) | ||||
Maximum value | 264 | |||
Average value | 203 | |||
Minimum value | 134 | |||
Period value | 166 |
| (1) | Data related to the second half of 2020 |
| (2) | The December 2020 IRC data have been restated to reflect the 1.60 surcharge on the IRC component for the purposes of presenting this table (this surcharge is included in the RWAs and capital requirements per IMA model, but not included in this table). |
For more information about capital requirements under IMA see Table 9
The main changes in the market RWAs, calculated using the method based on internal models are below:
Table of Contents
| BBVA. PILLAR 3 2021 | 4. RISKS | P. 160 |
Table 60. EU MR2-B - RWA flow statements of market risk exposures under the IMA (Million Euros)
| VaR | SVaR | IRC | CRM | Other | Total RWAs | Capital Requirements | ||||||||||||||||||||||
RWAs September, 2021 | 2,755 | 4,542 | 1,431 | — | — | 8,728 | 698 | |||||||||||||||||||||
|
|
|
|
|
|
|
|
|
|
|
|
|
| |||||||||||||||
Regulatory adjustments | (1,812 | ) | (2,869 | ) | — | — | — | (4,681 | ) | (374 | ) | |||||||||||||||||
RWAs as of last day of September 2021 | 943 | 1,673 | 1,431 | — | — | 4,047 | 324 | |||||||||||||||||||||
|
|
|
|
|
|
|
|
|
|
|
|
|
| |||||||||||||||
Level risk variation | (137 | ) | 764 | 727 | — | — | 1,354 | 108 | ||||||||||||||||||||
Model updates | — | — | — | — | — | — | — | |||||||||||||||||||||
Methodology and policy | — | — | — | — | — | — | — | |||||||||||||||||||||
Acquisitions and disposals | — | — | — | — | — | — | — | |||||||||||||||||||||
Foreign Exchange movements | 16 | 125 | 22 | — | — | 163 | 13 | |||||||||||||||||||||
Other | 1 | — | 21 | — | — | 22 | 2 | |||||||||||||||||||||
RWAs as of last day of December 2021 | 926 | 1,783 | 2,201 | — | — | 4,911 | 393 | |||||||||||||||||||||
|
|
|
|
|
|
|
|
|
|
|
|
|
| |||||||||||||||
Regulatory adjustments | 1,709 | 3,648 | — | — | — | 5,356 | 428 | |||||||||||||||||||||
RWAs December, 2021 | 2,635 | 5,431 | 2,201 | — | — | 10,267 | 821 | |||||||||||||||||||||
|
|
|
|
|
|
|
|
|
|
|
|
|
| |||||||||||||||
In the fourth quarter of 2021, the own funds requirements for market risk under the internal model are mainly affected by the increase in capital requirements in IRC in BBVA S.A. and in BBVA Mexico and in Stressed VaR in BBVA Mexico:
The capital requirements in BBVA S.A. increased in December 2021 by 11% quarterly to reach €455 million. Capital requirements for IRC increased by 109% (€51 million) compared to the previous quarter as a result of changes in the positions of the Italian Sovereign. The level of the entity has remained stable in levels of capital requirements for VaR and SVaR compared to the previous quarter, falling €5 million.
Capital requirements in BBVA Mexico increase by 26% in December 2021 to reach €366 million. The increase in requirements is mainly explained by the increase in sensitivity reflected in the increase in SVaR by 57% (€76 million). IRC capital requirements increased by 13% (€9 million) compared to the previous quarter as a result of the increase in positions
The IRC component remains subject to the additional surcharge of 1.60, following the internal model review process in 2019.
The full annual series of RWA flow of market risk under the IMA is available in the editable file “Pillar III 2021 – Tables & Annexes”.
4.3.4.2.3 Stress testing
All the tasks associated with stress, methodologies, scenarios of market variables or reports are undertaken in coordination with the Group’s Risk Areas.
A number of stress tests are carried out on the BBVA Group’s trading portfolios. First, global and local historical scenarios are used that replicate the behavior of an extreme past event, such as for example the collapse of Lehman Brothers or the “Tequilazo” crisis. These stress tests are complemented with simulated scenarios, where the aim is to generate scenarios that have a significant impact on the different portfolios, but
without being anchored to any specific historical scenario.
Finally, for some portfolios or positions, fixed stress tests are also carried out that have a significant impact on the market variables affecting these positions.
Historical scenarios
The historical benchmark stress scenario for the BBVA Group is Lehman Brothers, whose sudden collapse in September 2008 led to a significant impact on the behavior of financial markets at a global level. The following are the most relevant effects of this historical scenario:
| • | Credit shock: reflected mainly in the increase of credit spreads and downgrades in credit ratings. |
| • | Increased volatility in most of the financial markets (giving rise to a great deal of variation in the prices of different assets (currency, equity, debt). |
| • | Liquidity shock in the financial systems, reflected by a major movement in interbank curves, particularly in the shortest sections of the euro and dollar curves. |
Table of Contents
| BBVA. PILLAR 3 2021 | 4. RISKS | P. 161 |
Table 61. Trading Book. Impact on earnings in Lehman scenario (Million Euros)
Impact on earnings in Lehman scenario | ||||||||
| 31-12-2021 | 31-12-2020 | |||||||
GM Europe, NY & Asia | (40.2 | ) | (54.0 | ) | ||||
GM Mexico | (106.5 | ) | (23.0 | ) | ||||
GM Argentina | (1.3 | ) | (0.8 | ) | ||||
GM Chile | — | — | ||||||
GM Colombia | (2.7 | ) | (2.9 | ) | ||||
GM Peru | (3.2 | ) | (2.5 | ) | ||||
GM Venezuela | — | — | ||||||
Simulated scenarios
Unlike the historical scenarios, which are fixed and therefore not suited to the composition of the risk portfolio at all times, the scenario used for the exercises of economic stress is based on resampling methodology. This methodology is based on the use of dynamic scenarios that are recalculated periodically depending on the main risks affecting the trading portfolios. On a data window wide enough to collect different periods of stress (data are taken from January 1, 2008 until the date of the assessment), a simulation is performed by resampling of historic observations, generating a distribution of losses and gains that serve to analyze the most extreme of births in the selected historical window.
The advantage of this methodology is that the period of stress is not predetermined, but depends on the portfolio maintained at each time, and making a large number of simulations (10,000 simulations) allows a greater
richness of information for the analysis of expected shortfall than what is available in the scenarios included in the calculation of VaR.
The main features of this approach are:
a) the generated simulations respect the correlation structure of the data,
b) there is flexibility in the inclusion of new risk factors
c) it allows the introduction of a lot of variability in the simulations (desirable for considering extreme events).
The impact of the stress tests by simulated scenarios (Stress VaR 95% at 20 days, Expected Shortfall 97,5 % at 20 days and Stress VaR 99% at 1 day) is shown below.
Table 62. Trading Book. Stress resampling (Million Euros. 12-31-2020)
| Europe | Mexico | Peru | Venezuela | Argentina | Colombia | Turkey | ||||||||||||||||||||||
Expected impact | (76 | ) | (75 | ) | (11 | ) | — | (5 | ) | (5 | ) | (8 | ) | |||||||||||||||
| Stress VaR | Expected Shortfall | Stress Period | Stress VaR 1D | |||||||||||||
| 2020 | 95 20 D | 95 20 D | 99% Resampling | |||||||||||||
Total | ||||||||||||||||
GM Europe, NY and Asia | (51.1 | ) | (75.9 | ) | | 11/17/2010 - 10/17/2012 | | (16.7 | ) | |||||||
GM Mexico | (52.9 | ) | (75.0 | ) | | 05/09/2008 - 05/06/2010 | | (13.8 | ) | |||||||
4.3.4.2.4. Backtesting
Introduction
The ex-post or Backtesting validation is based on the comparison of the periodic results of the portfolio with the market risk measures from the established measurement system. The validity of a VaR model is particularly dependent on whether the empirical reality of the results does not enter into open contradiction with what is expected in the model. If the observed results were sufficiently adjusted to what was predicted by the
model, it would be rated as good, and if the discrepancy were notable, revisions would be required in order to correct possible errors or modifications and to improve quality.
In order to determine whether the results have been sufficiently adjusted to the risk measurements, it is necessary to establish objective criteria, which are specified in a series of validation tests carried out with a given methodology. In establishing the most appropriate
Table of Contents
| BBVA. PILLAR 3 2021 | 4. RISKS | P. 162 |
methodology, the criteria recommended by Basel have been largely followed as they are considered appropriate.
Validation test
In the comparison between results and risk measurements, a key element that is of interest is the confidence that the losses do not exceed the VaR risk measurements made more than a number of times according to the level of confidence adopted in the model. The validation test presented below, which focuses on contrasting this aspect, emphasizes that the risk measurement model is underestimating the risk that is actually being borne.
For the establishment of a hypothesis comparison test, we start from the observed results and try to infer whether there is enough evidence to reject the model (the null hypothesis that the trust of the model is established is not met).
In cases where the model functions properly, the VaR measurement indicates that the variation of the value of a portfolio in a given time horizon will not exceed the value obtained in a percentage of times determined by the level of confidence. In other words, the probability of having a loss that is higher than the VaR measurement, what we will call an exception, will be 1%, and the probability that the exception will not occur will be 99%.
| GREEN Zone: model acceptance zone | It is characterised as being an area in which there is a high probability of accepting a suitable model and a low probability of accepting an unsuitable model. This is defined by the set for which the accumulated probability of less than 95%, with the null hypothesis proving correct. It covers a number between zero and four exceptions. | |
| YELLOW zone: ambiguous zone | Possible results for both a suitable and inadequate model. It begins when the accumulated probability is greater than equal to 95% (it must be less than 99.99%), with the null hypothesis proving correct. It covers a number of between five and nine exceptions. | |
| RED zone: model rejection zone | High probability that the model is unsuitable and unlikely to reject if suitable. It is defined by the fact that the level of significance is less than 0.1% or, which is the same, the accumulated probability is greater than or equal to 99.99%, with the null hypothesis proving correct. It corresponds to a number of exceptions equal to or greater than ten. | |
To carry out this test it is advisable to have, at least, a one-year historical series of both results and risk estimates on a daily basis.
The criterion used is perfectly adapted to the priority of supervisory, which is to avoid situations where excess risk for which the entity is not prepared jeopardizes its survival. However, the use of risk measurements as a tool for managing positions entails a concern that the risk measurements are adjusted to the real risk on both sides: not only is there concern that the risk is being underestimated, but also that It may be overestimating.
At the close of December 31, 2021, the model is in the green zone of acceptance of the model, both in BBVA SA and BBVA Mexico.
Backtesting results
Regulatory backtesting is made up of two types: Hypothetical Backtesting and Actual Backtesting:
| • | Hypothetical Backtesting is defined as the contrast of the Hypothetical P&L on the estimated VaR, the day before the performance of said result. Actual Backtesting is defined as the contrast with the Actual P&L on the same estimated VaR, the day before the performance of said result. |
| • | Actual Backtesting was implemented and entered into force on January 1, 2013, as a result of the transposition in the national legal order through the Bank of Spain Circular 4/2011 of November 30, of the CRD III that introduces Basel 2.5 in the European Union. The results that are used for the construction of both types of Backtesting are based on the actual results of the management tools. |
According to Article 369 of the CRR, the P&L used in Backtesting should have a sufficient level of granularity in order to be shown at the “top-of-house” level, differentiating between Hypothetical and Actual P&L. In addition to the above, the historical Backtesting series will include a minimum of one year.
Actual P&L
The Actual P&L contains the complete management results, including the intraday operation and the daily and non-daily valuation adjustments, discounting the results of the franchises and commissions of each day and each desk.
The valuation functions and the parameters of the valuation models used in the calculation of the Actual P&L are the same as those used in the calculation of the Economic P&L.
Hypothetical P&L
The Hypothetical P&L contains the management results without the P&L of the daily activity, it is said, excluding intraday operations, premiums, and commissions. The
Table of Contents
| BBVA. PILLAR 3 2021 | 4. RISKS | P. 163 |
data is provided by the management systems and broken down by desk, in adherence with the Volcker Rule on desk distribution.
The valuation functions and the parameters assigned to the valuation models used in the calculation of the Hypothetical P&L are the same as those used in the calculation of the Actual P&L.
The P&L figures used in both Backtesting types exclude Credit Valuation Adjustments (CVA), Debt Valuation Adjustments (DVA) and Additional Valuation Adjustments (AVA). As well as any change in value resulting from migrations from rating to default, except those reflected in prices by the market itself, since the changes in value due to migration from rating to default are included in the Counterparty Credit Risk metrics.
Perimeter of the backtesting and internal model exceptions
The calculation scope of VaR and P&L (Hypothetical and Actual) is limited to the totality of the Trading Book portfolios of the Global Markets Internal Model of BBVA S.A. and BBVA Mexico.
All the positions belonging to the Banking Book, the portfolios under the Standardised Approach and the trading activity with Hedge Funds (this activity was excluded from the Internal Model in its original approval) are thus excluded from this scope of application.
It is considered that there is an exception at the Top of House level, when the two following circumstances concur in the same internal model and date:
| • | The Hypothetical P&L and/or the Actual P&L are negative. |
| • | With an amount equal to or greater than the maximum between VaR without smoothing and VaR with smoothing calculated based on the previous day |
For the purposes of calculating the number of exceptions of the Regulatory Backtesting, exceptions will only be taken into account within a mobile window of 250 consecutive Business Days at the Top of House level in each respective internal model.
At the end of December 31, 2021, there is one exception in BBVA SA Backtesting and one exception in BBVA Mexico.
BBVA S.A.:
As of September 30, 2021, the P&L at the entity or top-of-house level (i.e. BBVA SA) presents a negative result of €-0.1 million and €-15.8 million in terms of Hypothetical and Actual P&L, respectively; against a VaR figure of the previous business day (September 29, 2021) of €-10.2 million. Therefore, there was an
exception in the Real Backtesting at entity level on that date, 154% above the VaR amount.
This exception was basically due to the negative results obtained as a result of the monthly variation of the fair value adjustments at the end of the month that were included in the real P&L of September 30.
The equity desk with the largest negative contribution to the actual profit and loss account was the only trading desk to have a profit and loss exception on that date.
BBVA Mexico:
On March 24, 2021, the P&L at the entity or top-of-house level (ie BBVA Mexico) showed a negative result of €-11.8 million and €-12.1 million in terms of hypothetical P&L and actual, respectively; compared to a VaR figure for the previous business day (March 23, 2021) of € -8.4 million. Thus, there was an exception in the Hypothetical and Real backtesting at entity level on that date, 140% and 143 % above the VaR amount.
On March 24, the fortnightly inflation data was released. The observed inflation rate (0.53) was much higher than the market consensus (0.33). This led to an increase in annual inflation to 4.12%, above Banxico’s annual target (3% +/- one basis point). The data sparked speculation that Banxico would not apply the inflation rate cut it had anticipated, with some data even pointing to further hikes ahead, prompting a sharp sell-off of government bonds in Mexico. This movement, together with the generally long position of Global Markets Mexico, generated a loss of 292 million Mexican pesos (€12 million). The government curve experienced particularly strong movements at 2 years maturity and upwards. On average, the movement of the curve from two to 30 years was +26 bp.
Table of Contents
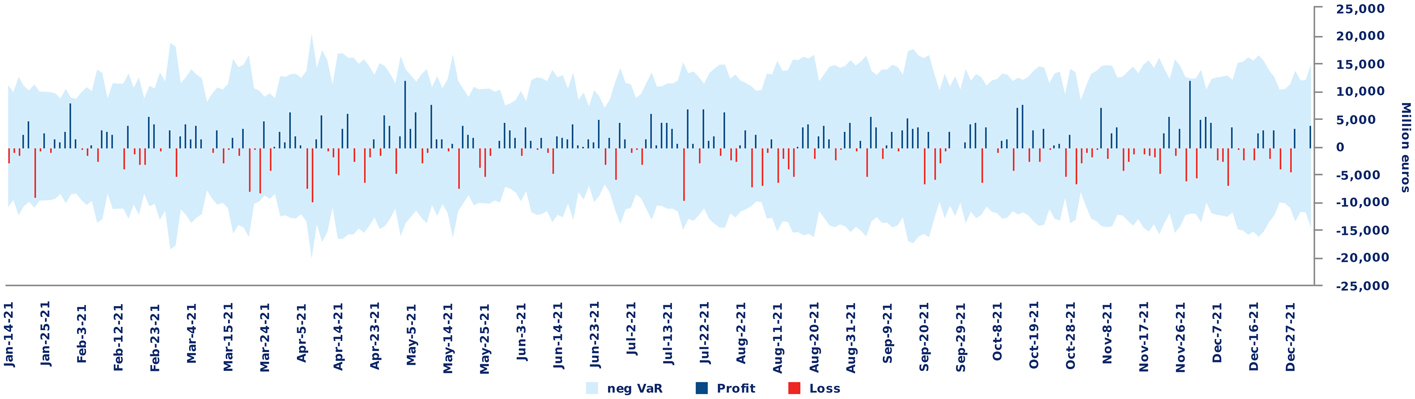
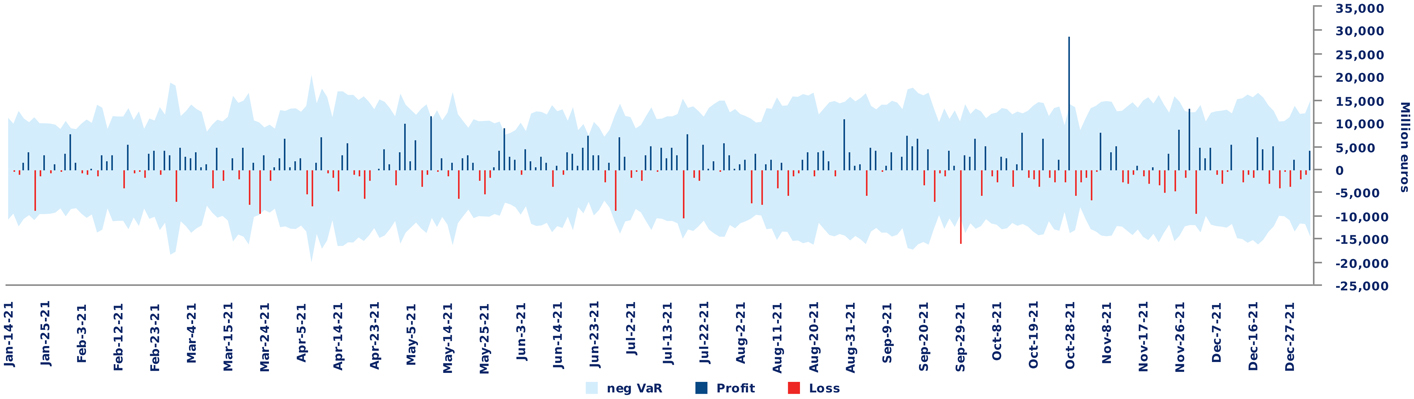
Table of Contents
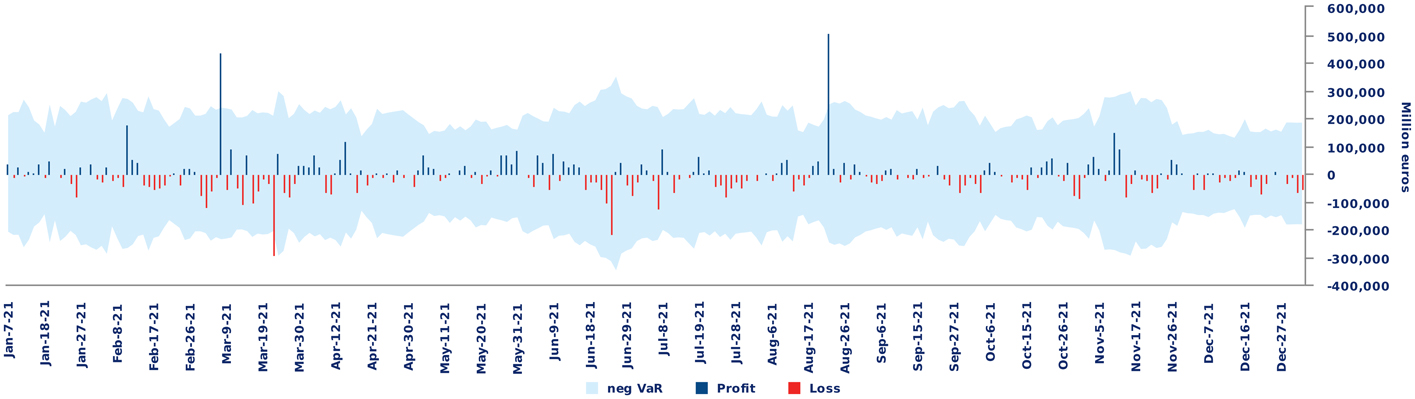
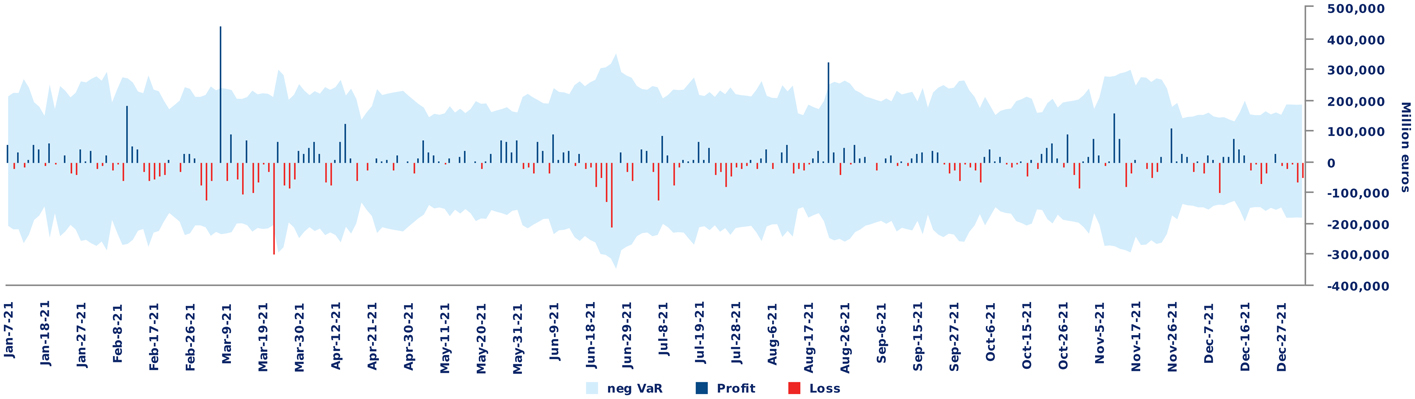
Table of Contents
| BBVA. PILLAR 3 2021 | 4. RISKS | P. 166 |
4.3.4.3. Characteristics of the risk management system
The Group has a risk management system in place which is appropriate for the volume of risk managed, complying with the functions set out in the Corporate Policy on Market Risk in Market Activities.
The risk units must have:
| • | A suitable organisation (means, resources and experience) in line with the nature and complexity of the business. |
| • | Segregation of functions and independence in decision-making. |
| • | Performance under integrity and good governance principles, driving the best practices in the industry and complying with the rules, both internal (policies, procedures) and external (regulation, supervision, guidelines). |
| • | The existence of channels for communication with the relevant corporate bodies at local level according to their corporate governance system, as well as with the Corporate Area. |
| • | All market risk existing in the business units that carry out trading activity must be adequately identified, measured and assessed, and procedures must be in place for its control and mitigation. |
| • | The Global Market Risk Unit (GMRU), as the unit responsible for managing market risk at Group level, must promote the use of objective and uniform metrics for measuring the different types of risks. |
The structural risks are defined, in general terms, as the possibility of suffering losses due to adverse movements in market risk factors as a result of mismatches in the financial structure of an entity’s balance sheet.
In the Group, the following types of structural risks are defined, according to the nature and the following market factors: interest rate risk, credit spread risk, exchange rate risk and equity risk.
The scope of structural risks in the Group is limited to the banking book, excluding market risks in the trading book that are clearly delimited and separated and make up the Market Risks.
The Assets and Liabilities Committee (ALCO) is the main responsible body for the management of structural risks regarding liquidity/ funding, interest rate, credit spread, currency, equity and solvency. Every month, with the participation of the CEO and representatives from the areas of Finance, Risks and Business Areas; this committee monitors the structural risks and is presented with proposals with regard to action plans related with its management for its approval.
These management proposals are made by the Finance area with a forward-looking focus, maintaining the alignment with the risk appetite framework, trying to guarantee the recurrence of results and financial stability, as well as to preserve the solvency of the entity. All balance sheet management units have a local ALCO, which is permanently attended by members of the corporate center, and there is a corporate ALCO where management strategies are monitored and presented in the Group’s subsidiaries.
The GRM area acts as an independent unit, ensuring adequate separation between the management and risk control functions, and is responsible for ensuring that the structural risks in the Group are managed according to the strategy approved by the Board of Directors.
Consequently, GRM deals with the identification, measurement, monitoring and control of those risks and their reporting to the corresponding corporate bodies. Through the Global Risk Management Committee (GRMC), it performs the function of control and risk assessment and is responsible for developing the strategies, policies, procedures and infrastructure necessary to identify, evaluate, measure and manage the significant risks that the BBVA Group faces. To this end, GRM, through the corporate unit of Structural Risks, proposes a scheme of limits that defines the risk appetite set for each of the relevant structural risk types, both at Group level and by management units, which will be reviewed annually, reporting the situation periodically to the Group’s corporate bodies as well as to the GRMC.
Additionally, both the management system and the control and measurement system for structural risks are necessarily adjusted to the Group’s internal control model, complying with the evaluation and certification processes that comprise it. In this sense, the tasks and controls necessary for its scope of action have been identified and documented, supporting a regulatory framework which includes specific processes and measures for structural risks, from abroad geographical perspective.
Within the three lines of defense scheme in which BBVA’s internal control model is based according to the most
Table of Contents
| BBVA. PILLAR 3 2021 | 4. RISKS | P. 167 |
advanced standards in terms of internal control, the first line of defense is maintained by the Finance area, which is responsible for managing the structural risk.
As a second line of defense, GRM is in charge of identifying risks, and establishing policies and control models, periodically evaluating their effectiveness.
In the second line of defense, there are also the Internal Risk Control units, which independently review the Structural Risk control, and Internal Financial Control, which carries out a review of the design and effectiveness of the operational controls over structural risk management.
The third line of defense is represented by the Internal Audit area, an independent unit within BBVA Group, which is responsible for reviewing specific controls and processes.
4.4.1. Structural interest rate risk
4.4.1.1. Scope and nature of interest rate risk and credit spread risk
The structural interest-rate risk in the Banking Book (“IRRBB”) is defined as the potential change on an entity’s net interest income and/or economic value of the equity due to variations in market interest rates with an impact on structural balance sheet positions.
Furthermore, the credit spread risk (CSRBB) in the banking book arises from the potential impact on the value of fixed-income portfolios and credit derivatives classified as HtC&S produced by a variation in the level of credit spreads associated with those instruments/ issuers and that are not explained by default risk or by movements in market interest rates.
When managing structural interest rate risk, the effects of interest rate fluctuations are considered from a double perspective: Impact on the economic value of equity and Impact on the net interest income of the entity. In addition, it is assessed the impact on the market value of financial instruments of the banking book that, due to their accounting treatment, could affect P&L and/or equity, as a result of: Interest rate risk fluctuations and Credit spread risk changes.
The banking book instruments accounted for its market value (fair value) are subject to a specific monitoring, due to their impact on risk and on the capital, through OCI (Other Comprehensive Income) or profit and loss (P&L). So, the analysis of the impact of interest rates fluctuations on earnings is completed. Furthermore, the impact on earnings is added to the risk metrics, through the combination of the effect of interest rate shocks on the NII and the impact on the market value of the instruments accounted at fair value.
Likewise, within the evaluation of risk sources, climate change risks (ESG) is considered through the incorporation of their potential effect on structural interest rate risk factors. This risk materializes on IRRBB through the potential impact on the valuation of fixed income portfolios (reflected in their credit spread) due to their exposure to transition risk.
Structural interest rate risk perimeter is limited to the structural balance sheet (banking book), and includes all those entities whose structural balance sheet contributes to the banking book of the Group, as well as their banking subsidiaries. All trading activities (trading book), developed by the Global Markets unit, are excluded from the scope, as they are included in the market risk monitoring and control process.
The exposure of a financial entity to adverse interest rates movements is a risk inherent to the development of the banking business, which is also, in turn, an opportunity to create economic value. Therefore, interest rate risk must be effectively managed so that it is limited in accordance with the entity’s equity and in line with the expected economic result.
In BBVA, the purpose of structural interest rate risk management is to maintain the stability of the net interest income and the long-term sustainability of the equity in the event of interest rate fluctuations. It contributes to a recurrent generation of earnings, limits the capital consumption due to structural interest rate risk and monitors potential mark-to-market impacts on “held to collect and sell” (HtC&S) portfolios. Likewise, the spread risk management in banking book portfolios is aimed at limiting the impact on the valuation of fixed income instruments, which are used for balance sheet liquidity and interest rate risk management purposes in order to increase diversification, and at reducing the concentration of each issuer, maintaining the spread risk at levels aligned with the total volume of the investment portfolio and the equity of the Group.
In order to manage the structural interest rate risk so that it remains within the approved limits, Finance-ALM uses fixed-rate bond portfolios with a conservative risk profile, as they are mainly invested in the country’s sovereign bonds, which can be classified for accounting under the HTC&S or HTC modality. Additionally, financial derivatives are also used, which have hedge accounting treatment of both Fair Value Hedge and Cash Flow Hedge. Derivative instruments (like swaps, forward agreements or interest rate options) may be used, always complying with the accounting requirements regarding their treatment as hedges minimizing the P&L impacts. Before being implemented, these tools have to be previously analysed and approved in the assets and liabilities committees (both at the local level and at the holding level) and are subsequently followed up in the next committees.
Structural interest rate risk is embedded in the economic capital adequacy process, in order to assure that it is
Table of Contents
| BBVA. PILLAR 3 2021 | 4. RISKS | P. 168 |
adequately considered during the general allocation of capital of the entity.
IRRBB management is decentralized, and is carried out independently in each Group’s entity, keeping the exposure to interest rates and credit spreads movements aligned with the strategy and the target risk profile of the Group, and in compliance with the regulatory requirements according to the EBA guidelines and the different local and supranational supervisory authorities. Besides, in order to preserve the capital position of the Group, the corporate unit of GRM-SSRR monitors the banking book exposure to interest rates at a consolidated level.
4.4.1.2. Nature of IRRBB and CSRBB
Structural interest rate risk may arise from different sources, which are part of the four types of risk faced by the entities:
| • | Repricing Risk: arises due to different maturity (fixed-rate products) or repricing (variable rate products) periods of assets, liabilities and off-balance sheet positions. |
| • | Curve risk: arises from a change on the slope and/or curvature of the yield curve as a result of different fluctuations in each time slot. |
| • | Basis risk: arises from imperfect correlation between changes on the reference interest rates for different instruments with similar repricing and maturity characteristics. |
| • | Option risk: arises from the (implicit or explicit) options associated with certain balance sheet transactions that may change their future flows and generate mismatches in their maturities. |
To monitor and control IRRBB and CSRBB, a comprehensive set of metrics is assessed on a regular basis, from a dual perspective of economic value (EVE) and net interest income (NII), including sensitivity and probabilistic measures.
Among others, EVE and NII sensitivity measures to parallel interest rate shifts are calculated, broken down by currency and yield curve. In addition, the aggregate cross-currency sensitivity is calculated in order to obtain a figure of the total sensitivity of the entity to parallel shifts in multiple interest rate curves (currencies), considering the volatility of the currencies and their correlation among each other.
Scenarios of parallel and sudden rate shifts of different magnitudes are evaluated. The general shift reference is +/-100 bps, as well as the specific shock size calibrated for each currency according to its volatility, which is used to obtain the aggregate sensitivity. Negative rates
scenarios are allowed until plausible levels according to the observed volatility.
Likewise, MtM sensitivity to parallel interest rates shocks is monitored in isolation for the structural balance sheet assets accounted at fair value, including fixed-income portfolios and derivatives. Furthermore, credit spread sensitivities are also estimated by comparing the MtM of the baseline scenario with the MtM recalculated after applying a consistent shock to the credit spreads of the discount rates curve of each security (market spread).
These metrics are complemented by the sensitivity on earnings, which adds the impact of a parallel and instantaneous interest rate shock, on the net interest income and on the future market value of the instruments of the Banking Book accounted at fair value, at the end of the projection horizon, generally 12 months.
The probabilistic measures are the main monitoring metrics, and they are included in the Risk Appetite by type of risk metrics. These measures complete the sensitivity analysis metrics as they consider additional effects like changes on the slope and shape of the curve or the basis among interest rate yield curves (“risk free”), as well as ramp shocks (gradual) of interest rates and credit spread shocks. The simulation methodology is based on an analysis of the major IRs components, on the basis of which different scenarios are generated for each currency with a specific probability of occurrence, calculating then the impact in terms of value and income for each scenario.
The IRRBB probabilistic metrics are composed by the Economic Capital (EC), and the Earnings at risk (EaR), and they estimate the maximum negative impact for a given horizon and confidence level, on the Economic Value and the projected NII, respectively.
Additionally, the Economic Capital for credit spread risk, quantifies the maximum negative variation in the MtM of the fixed income portfolios, accounted at fair value, that would arise due to credit spread shocks, with a given confidence level, and time horizon.
The periodicity of the calculation of the main risk measures is monthly, except for the contribution of the fair value instruments which is monitored on a weekly basis.
These measures are complemented with the periodical calculation of other scenarios that complete the analysis of the entity risk, such as, changes of the slope/ curvature, gradual shifts (ramps), individual shifts by tenor, individual shocks by curve (basis), or changes in model assumptions.
In addition to the analysis under normal conditions, stress tests are regularly run to assess the level of exposure to interest rate risk under stress scenarios of market variables. The stress scenarios are simulated based on historical information, and consider directional
Table of Contents
| BBVA. PILLAR 3 2021 | 4. RISKS | P. 169 |
movements, changes in the slope, curvature and basis of the yield curves according to market stress conditions. These scenarios are evaluated from the two risk perspectives, economic value and net interest income.
The stress exercise is completed with a reverse stress test whose objective is to identify those scenarios capable of producing a certain impact within a set range of values.
Likewise, the stress scenarios of the market variables are complemented with stress tests to the main assumptions of the model.
Finally, the analysis of IRRBB scenarios under the ICAAP (Internal Capacity Adequacy Assessment Process) and GRM Stress Program processes are carried out, which assess, on a regular basis, global stress situations under a comprehensive view for the set of financial risks.
4.4.1.3. Key assumptions of the model
In order to measure structural interest rate risk, the setting of assumptions on the evolution and behaviour of certain balance sheet items is particularly relevant, especially those related to products without an explicit or contractual maturity which characteristics are not established in their contractual terms and must be therefore estimated
The assumptions that characterize these balance sheet items must be understandable for the areas and bodies involved in risk management and control and remain duly updated, justified and documented. The modelling of these assumptions must be conceptually reasonable and consistent with the evidence based on historical experience, reviewed at least once a year and, if any, the behaviour of the customers induced by the business areas. These assumptions are regularly subject to a sensitivity analysis to assess and understand the impact of the modelling on the risk metrics.
In view of the heterogeneity of the financial markets, customers and products in the multiple jurisdictions, each one of the entities of the Group is responsible for determining the behaviour assumptions to be applied to the balance sheet items, always under the guidelines and the applicability of the corporate models existing in the Group.
To calculate IRRBB measures, internal models are used to set the behavioural assumptions. The key modelling assumptions applied are:
Treatment of balance sheet items without a contractual maturity date:
Non-maturity Deposits (NMDs)
The NMDs internal model distinguishes between volatile and stable deposits.
The volatile portion of NMDs is stripped out using the moving average of the historical series, which is shifted down according to the volatility of the error of the regression. The volatile part of deposits is assumed that matures at short term (<1 Month).
Meanwhile, the stable amount of deposits is run off to long term following a decay distribution estimated according to the conditional probabilities of maturity during the life of the product. Besides, based on the observed data and applying a conservatism criterion, a maximum life of 25 years is assumed, preventing the maturing cash flows to extend beyond that time.
The following table shows the average maturities obtained by the NMDs internal model:
Table 63. Average Maturities for NMDs (Years. 12-31-2021)
| Core deposits(1) | Full amount of deposits | |||||||
Retail transactional | 3.80 | 3.10 | ||||||
Retail non-transactional | 4.50 | 3.40 | ||||||
Wholesale | 4.60 | 2.20 | ||||||
| (1) | For Retail Transactional includes stable deposits in current conditions, that may migrate to a different type of deposits in a higher interest rate environment |
Furthermore, the model also estimates the evolution of the mix of customer deposits, considering the potential migration between different types of deposits (demand / time deposits) under different interest rates scenarios. The potential asymmetry between the behaviour in interest rate increase and decrease scenarios is considered in the analysis.
Finally, for those deposits with administered rates, the model estimates the translation dynamic of interest rates shocks to these accounts’ remuneration, based on the analysis of its relationship with the evolution of market interest rates. For retail accounts a general floor is set at 0% assuming that retail customer rate will never be negative.
Revolving Credit cards
They mature gradually according to the monthly expected average repayment rate.
Expectations about the exercise of interest rate options (explicit and implicit), both purchased or sold, under different interest rate scenarios:
Loans subject to prepayment risk
The balance is segmented into several categories based on the characteristics of the loan and/or the client (that is, loan rate, original face amount, original maturity, scoring. etc.)
The “prepayment” behaviour, understood as all extraordinary payments over those established in the regular payment schedule and that therefore changes
Table of Contents
| BBVA. PILLAR 3 2021 | 4. RISKS | P. 170 |
the contractual payment scheme, is then analysed in order to be modelled. The model captures total and partial prepayments, if relevant.
The potential link with the interest rates evolution is also examined, and incorporated in the model when the incentive of the client to pre-cancel determines the prepayment speed.
Customer deposits with early redemption optionality.
An early cancellation assumption is established for those deposits with a redemption option before maturity. The cancellation rate is based on the economic incentive of the client, and linked to the level of market interest rates, if applicable.
Treatment of Non performing exposures (NPEs)
The amount of NPEs, net of provisions, is considered interest rate sensitive, while the provisioned amount is considered non-earning, consistently with the treatment of the allowances in the liability side. A maturity ladder is assigned to the expected recovery flows of the NPEs. The future cash flows distribution is estimated according to the internal Loss Given Default recovery model.
The governance of structural interest rate risk models is subject to internal model risk regulation, under the scope of GRM-Analytics. In this way, they must be properly inventoried and catalogued and comply with the requirements for their development, updating and management of the changes included in the internal procedures. Likewise, they are subject to the corresponding internal validations and monitoring requirements established based on their relevance, as well as back-testing procedures against experience to confirm the validity of the assumptions applied.
4.4.1.4. Interest rate risk in the banking book
During 2021, central banks began withdrawing the expansionary policies implemented during the year 2020, to mitigate the economic impact caused by the COVID-19 pandemic, with the aim of reducing the inflationary pressures that are occurring in most countries of the world. In Europe, the end of the PEPP (Pandemic Emergency Purchase Programme) was announced for the month of March 2022.
In Turkey, although it initially showed an upward trend in interest rates, there have been significant drops since September, ending the year 300 basis points below the level of December 2020.
Regarding Mexico, the Central Bank implemented the last rate cut in February, placing it at a level of 4%. Starting in June, there was a change in trend, initiating an upward cycle in rates, reaching a level of 5.50% in December. The objective of the Central Bank is to
moderate the rise in inflation and bring it back within its target range.
In South America, the monetary policy was restrictive, with increases in the policy rates in Colombia and Peru, affected by higher levels of inflation, reaching above the central banks targets. Regarding Argentina it has had a stable monetary policy without changes during the year.
The BBVA Group, at an aggregate level, continues to maintain a moderate risk profile, in accordance with the established objective, showing a favourable position to a rise in interest rates on net interest income. Effective management of the balance sheet structural risk has mitigated the negative impact of the low interest rates derived from the expansive monetary policies implemented by the different central banks to offset the negative economic effects derived from the COVID-19 pandemic, and is reflected in the strength and recurrence of the net interest income:
In Europe, the downward trend in interest rates remains limited by current levels, preventing extremely adverse scenarios from occurring. The balance sheet is characterized by a high proportion of variable-rate loans (basically mortgages and corporate lending) and liabilities are composed mainly of customer on demand deposits. The ALCO portfolio acts as a management lever and hedging for the balance sheet, mitigating its sensitivity to interest rate fluctuations. The balance sheet ´s interest rate profile has remained stable during the year, showing an interest net income sensitivity to 100 basis points increases by the interest rates slightly above 20%.
On the other hand, the ECB held the marginal deposit facility rate unchanged at -0.50% in 2021 and maintained the extraordinary support programs created after the outbreak of the COVID-19 crisis. This has created stability in European benchmark interest rates (EURIBOR).
In Mexico, a balance has been maintained between balances referenced to fixed and variable interest rates.
Among the assets most sensitive to interest rate movements, the wholesale portfolio stands out, while consumer and mortgages are mostly at a fixed rate. The ALCO portfolio is mainly invested in fixed-rate sovereign bonds with limited durations. The sensitivity of the net interest income continues to be limited, stable, and slightly biased towards higher interest rates, which have increased during 2021 by 125 basis points.
In Turkey, the sensitivity of loans, mostly fixed-rate but with relatively short maturities, and the ALCO portfolio balance the sensitivity of deposits on the liability side. In this way, the interest rate risk is limited, both in Turkish lira and in foreign currency.
In South America, the risk profile on interest rates continues to be low, as most of the countries in the area
Table of Contents
| BBVA. PILLAR 3 2021 | 4. RISKS | P. 171 |
have a composition of fixed / variable and very similar maturities between assets and liabilities, showing a sensitivity of the margin interest rate limited and with slight variations throughout 2021. Likewise, in countries with balances in several currencies, interest rate risk is also managed for each of the currencies, showing a very low level of risk. The more restrictive measures promoted by the central banks during 2021 are expected to have a slightly positive impact, given the sensitivity maintained by the different banks in the region.
The table below shows the profile of average structural interest rate risk and credit spread risk of fixed income portfolio in the banking book classified as HtC&S in terms of sensitivities of the main currencies for the BBVA Group in 2021:
Table 64. Sensitivity to interest-rate and credit spread analysis (12-31-2021)
| Interest rate | Credit spread | |||||||||||||||||||
| Impact on net interest income (1) | Impact on economic value (2) | Impact on economic value (2) | ||||||||||||||||||
| 100 basis-point increase | 100 basis-point decrease (3) | 100 basis-point increase | 100 basis-point decrease (3) | 100 basis-point increase | ||||||||||||||||
EUR | [3.5% , 5.5%] | [-3.5% , -1.5%] | [3.5% , 5.5%] | [-3.5% , -1.5%] | [-3.5% , -1.5%] | |||||||||||||||
MXN | [0.5% , 1.5%] | [-1.5% , -0.5%] | [-1.5% , -0.5%] | [0.5% , 1.5%] | [-0.5% , 0.5%] | |||||||||||||||
USD | [0.5% , 1.5%] | [-1.5% , -0.5%] | [0.5% , 1.5%] | [-1.5% , -0.5%] | [-0.5% , 0.5%] | |||||||||||||||
TRY | [-0.5% , 0.5%] | [-0.5% , 0.5%] | [-0.5% , 0.5%] | [-0.5% , 0.5%] | [-0.5% , 0.5%] | |||||||||||||||
Other | [-0.5% , 0.5%] | [-0.5% , 0.5%] | [-0.5% , 0.5%] | [-0.5% , 0.5%] | [-0.5% , 0.5%] | |||||||||||||||
BBVA Group | [7.5% , 10.0%] | [-5.5% , -3.5%] | [3.5% , 5.5%] | [-3.5% , -1.5%] | [-3.5% , -1.5%] | |||||||||||||||
| (1) | Percentage of “12 months” net interest income for the BBVA Group |
| (2) | Percentage of CET1 (Fully Loaded) for BBVA Group. |
| (3) | In EUR and USD (and GBP included in “Other”), negative interest rate scenarios are allowed up to plausible levels lower than current rates |
The key modelling and parametric assumptions used for internal calculations are the same as those used for the prescribed for the SOT regulatory IRRBB metrics, except for the following settings:
| • | Multiple risk free discount curves are used in order to capture basis risk, instead of one single curve as for the SOT calculations. |
| • | Floors applied to negative rates in the internal risk scenarios are different from the one prescribed for EBA SOT scenarios. |
| • | Cross-currency aggregation methods, based on historical correlation among currencies, are used. |
4.4.1.5. IRRBB SOT regulatory metrics
As described above, the structural interest rate risk in the banking book (IRRBB) is part of the entity’s risk management framework and is included in the internal capital self-assessment process as part of Pillar 3.
The table below shows the changes in the economic value of equity (EVE) and in net interest income (NII):
Table 65. EU IRRBB1 - Interest rate risk in the banking book
Currency | Δ EVE 12-31-2021 | Δ NII 12-31-2021 | Δ EVE 6-30-2021 | Δ NII 6-30-2021 | ||||||||||||
Parallel ascent | (0.24 | )% | 5.61 | % | 1.23 | % | 6.90 | % | ||||||||
Parallel descent | (5.10 | )% | (9.85 | )% | (4.38 | )% | (7.89 | )% | ||||||||
Slope inclination | 1.33 | % | 1.89 | % | ||||||||||||
Flattening of slope | (4.78 | )% | (3.29 | )% | ||||||||||||
Short rate rise | (3.48 | )% | (1.63 | )% | ||||||||||||
Short rate decline | (1.82 | )% | (0.91 | )% | ||||||||||||
The SOT regulatory metrics have been calculated as described in the guidelines.
IRRBB measures cover the four principal material currencies (EUR, USD, MXN and TRY) up to a cumulative percentage of the banking book above 90%.
Table of Contents
| BBVA. PILLAR 3 2021 | 4. RISKS | P. 172 |
Reported changes of the economic value of equity (EVE) are calculated as follows:
| • | Changes in EVE under the six supervisory interest rate shock scenarios |
| • | The supervisory maturity-dependent post-shock interest rate floor has been applied for each currency |
| • | Changes in EVE are expressed as a percentage of BBVA’s TIER 1 fully loaded at the reporting date |
| • | Aggregate EVE change for each interest rate shock scenario has been calculated by adding together any negative and positive changes to EVE occurring in each currency. Positive changes have been weighted by a factor of 50%. |
| • | Run-off balance sheet assumption: existing positions mature and are not replaced |
| • | Own equity has been excluded from the computation of the exposure level |
| • | Commercial margins are included in the interest cash flows |
| • | Cash flows have been discounted using a risk-free rate yield curve |
Reported changes of the net interest income (NII) are calculated as follows:
| • | Changes in projected NII over a forward-looking rolling 12-month period under the two parallel supervisory interest rate shock scenario out of the six supervisory shock scenarios for EVE |
| • | The supervisory maturity-dependent post-shock interest rate floor has been applied for each currency |
| • | Instantaneous shocks are applied |
| • | Changes in NII are expressed as a percentage of BBVA’s Net Interest Income of the last 12 months |
| • | Aggregate NII change for each interest rate shock scenario has been calculated by adding together any negative and positive changes to NII occurring in each currency. Positive changes have been weighted by a factor of 50%. |
| • | Dynamic balance sheet assumption |
| • | New exposures are repriced considering the margin of new productions at the reporting date. |
| • | Commercial margins are included in the interest cash flows |
| • | Fees and commissions attributable for interest rate changes are not included |
SOT metrics significance and evolution
SOT IRRBB measures at Group level maintain a medium-low risk level, with a negative exposure to parallel down scenarios for the both approaches, EVE and NII.
From EVE perspective, the negative impacts in the downward scenario are mainly derived from the EUR Balance in BBVA, while from NII perspective, MXN balance of BBVA México explains the principal negative changes in earnings.
As of December 2021, the BBVA balance shows negative EVE impacts for both parallel up and down scenarios, which is explained by the minor weight (50%) applied for the positive impacts for the currency aggregation method.
Compared to the previous disclosure, risk remains at moderate levels, even though the SOT scenario impacts worsen, showing higher losses and lower gains. This evolution is explained by the rise in the market long term interest rates in EUR, which leads to higher negative impacts in downward scenarios, as there is more room to fall until the interest rate floor. Besides, the reduction in the positive impact in TRY, due to the FX depreciation, has contributed to this effect. On the other hand, the negative EVE impact for MXN balance has decreased since June, due to higher market interest rates.
For the ratio levels, it is also relevant the reduction in the Group’s TIER 1 (-8%) and the increase in the last 12 month NII (+5%) since june-21.
4.4.2. Structural exchange rate risk
Structural exchange rate risk, is defined as the possibility of impacts on solvency, equity value and results driven by fluctuations in the exchange rates due to exposures in foreign currencies.
Structural exchange rate risk is inherent to the business of international banking groups, such as BBVA, that develop their activities in different geographies and currencies. At a consolidated level, structural exchange-rate risk arises from the consolidation of holdings in subsidiaries with functional currencies other than the euro. Its management is centralized in order to optimize the joint management of permanent foreign currency exposures, taking diversification into account.
The purpose of structural exchange rate risk management is protecting solvency by limiting volatility of the consolidated CET1 ratio and income to consolidate denominated in a currency other the euro in the Group, as well as to limit the capital requirements under exchange rate fluctuations to which the Group is exposed due to its international diversification. The ALM Global corporate unit, through the ALCO, is responsible for the management of this risk all through an active hedging policy, deliberately taken for each objective, and fully aligned with the management strategy.
Table of Contents
| BBVA. PILLAR 3 2021 | 4. RISKS | P. 173 |
At the corporate level, the risk monitoring metrics included in the limits framework are aligned with the Risk Appetite Framework, and are targeted to control the effects on the solvency through the economic capital metric and the fluctuations in the Common Equity Tier I fully loaded (CET1 fully loaded) consolidated ratio, as well as the maximum deviation in the Group’s attributable profit. The probabilistic metrics make it possible to estimate the joint impact of exposure to different currencies taking into account the different variability in exchange rates and their correlations. These metrics are supplemented with additional assessment indicators.
The suitability of these risk assessment metrics is reviewed on a regular basis through backtesting exercises. The final element of structural exchange-rate risk control is the stress and scenario analysis aimed to assess the vulnerabilities of foreign currency structural exposure not contemplated by the risk metrics and to serve as an additional tool when making management decisions. The scenarios are based both on historical situations simulated by the risk model and on the risk scenarios provided by BBVA Research.
The purpose of the exchange rate risk management of BBVA’s long term investments, which arises mainly from its foreign franchises, is to preserve the capital ratios of the Group and to maintain the stability of the profits. The U.S. dollar accumulated an appreciation of 8.3% against the euro in 2021, thus reversing much of the movement in favor of the euro in 2020 after the outbreak of the pandemic. Among the emerging currencies, the sharp depreciation of the Turkish lira in 2021 (-40.2%) stood out, severely penalized by rate cuts in the recent months. The positive side came from the good performance of the Mexican peso, which has appreciated by 5.5% against the euro since the end of 2020. With regard to the South American currencies, the Peruvian Sol finally closed the year with a slight depreciation against Euro (-1.3%) while the Chilean peso (-8.8%) and the Colombian peso (-6.6%) showed a greater depreciation. The Argentine peso depreciated (-11.3%) but in a more contained manner than in previous years.
BBVA maintains its active management policies of the main investments in emerging countries, which are set, on average, between 30% and 50% of the annual profits and around 70% of the excess of the CET1 capital ratio. The sale of BBVA USA in June modified the sensitivity against movements in the exchange rates of the ratio CET1 fully-loaded of the Group. USD sensitivity has been the most affected by this change, reaching +18 basis points in case of a depreciation of -10% in the currency. At the end of December 2021, the sensitivity is estimated as -7 bps for the Mexican Peso and -1 bps for the Turkish lira, both against a depreciation of -10%. Regarding the hedging of the expected profits for 2022, it stands at around 65% in the case of Mexico, 20% for Turkey and 100% for Peru and Colombia.
The evolution of the structural exchange risk requirements in 2021 is in section 4.3.3. of this Report.
For the years 2021 and 2020, the estimated sensitivities of the result attributable to the parent company are shown below, taking into account the coverage, against depreciations and appreciations of 1% of the average rate in the main currencies. To the extent that hedging positions are periodically modulated, the sensitivity estimate attempts to reflect an average (or effective) sensitivity in the year:
Table 66. Sensitivity to 1% change (Million euros)
Currency | 2021 | 2020 | ||||||
Mexican peso | 14.0 | 4.9 | ||||||
Turkish lira | 4.7 | 4.5 | ||||||
Peruvian sol | 0.3 | 0.4 | ||||||
Chilean peso | 0.6 | 0.3 | ||||||
Colombian peso | 1.1 | 1.4 | ||||||
Argentine peso | 0.6 | 0.9 | ||||||
Structural equity risk refers to the possibility of suffering losses in the value of positions in shares and other equity instruments held in the banking book with long or medium term investment horizons due to fluctuations in the value of equity indexes or shares.
BBVA Group’s exposure to structural equity risk arises largely from minority shareholdings held on industrial and financial companies, and in new business (innovation). This exposure is modulated in some portfolios with positions held on derivative instruments on the same underlying assets, in order to adjust the portfolio sensitivity to potential changes in equity prices.
The structural equity risk management is aimed at increasing the income-generating capacity of those shares held by the Group, limiting the capital requirements for equity risk and narrowing the impact on the solvency level through a proactive management of the portfolio using hedges. The function of managing the structural equity portfolios is a responsibility of the corporate units of Global ALM and other Group’s units specialized in this area. Their activity is subject to the risk management corporate policy on structural equity risk management, complying with the defined management principles and Risk Appetite Framework.
The structural equity risk metrics, designed by GRM according to the corporate model, contribute to the effective monitoring of the risk by estimating the sensitivity and the capital necessary to cover the possible unexpected losses due to changes in the value of the shareholdings in the Group’s investment portfolio, with a level of confidence that corresponds to the objective rating of the entity, taking into account the liquidity of the positions and the statistical behavior of the assets to be considered
In order to analyze the risk profile in depth, stress tests and scenario analysis of sensitivity to different simulated
Table of Contents
| BBVA. PILLAR 3 2021 | 4. RISKS | P. 174 |
scenarios are carried out. They are based on both past crisis situations and forecasts made by BBVA Research. These analyses are carried out regularly to assess the vulnerabilities of structural equity exposure not contemplated by the risk metrics and to serve as an additional tool when making management decisions.
Backtesting is carried out on a regular basis on the risk measurement model used.
Equity markets in Europe and the US have rallied significantly in 2021. The excellent performance of listed companies’ corporate earnings and the continuity of central banks’ accommodative policies have been behind these revaluations. However, the Spanish stock market has once again lagged behind the rest of the European stock markets.
Structural equity risk, measured in terms of economic capital, has raised during the last year due to the higher exposure taken. The aggregate sensitivity of the BBVA Group’s consolidated equity to a 1% fall in the price of shares of the companies making up the equity portfolio increased to €-27 million as of December 31, 2021, compared to €-20 million as of December 31, 2020. This estimation takes into account the exposure in shares valued at market prices, or if not applicable, at fair value (excluding the positions in the Treasury Area portfolios) and the net delta-equivalent positions in derivatives on the same underlyings.
4.4.3.1. Classification of equity exposure not included in the trading book
The Group distinguishes between equity exposures in investments in associates, capital instruments classified as financial assets at fair value through other comprehensive income and non-trading financial assets mandatory at fair value through profit or loss.
The investments in associates are the investments in entities over which the Group has a significant influence. It is presumed that there is significant influence when
20% or more of the voting rights of the subsidiary are held, directly or indirectly, unless it can be clearly demonstrated that such influence does not exist. There are certain exceptions to this criterion that do not constitute significant amounts for the Group. These investments in associates are valued using the equity method.
The remaining capital instruments not held for trading are classified as:
The financial assets recorded in the heading “Non-trading financial assets mandatorily at fair value through profit or loss” are derived from a business model which objective is to obtain the contractual cash flows and / or to sell those instruments but its contractual cash flows do not comply with the requirements of the SPPI test.
Financial assets are classified in “Financial assets designated at fair value through profit or loss” only if it eliminates or significantly reduces a measurement or recognition inconsistency (an ‘accounting mismatch’) that would otherwise arise from measuring financial assets or financial liabilities, or recognizing gains or losses on them, on different bases.
”Financial assets at fair value through other comprehensive income” This category of valuation implies the recognition of the information in the income statement as if it were an instrument valued at amortized cost, while the instrument is valued at fair value in the balance sheet. At the time of initial recognition of specific investments in equity instruments, the BBVA Group may make the irrevocable decision to present subsequent changes in fair value in other comprehensive income.
4.4.3.2. Risk-weighted assets of investments in associates and capital instruments
A breakdown of the RWAs to investments in associates and capital instruments by accounting portfolio and applicable method as of December 31, 2021 and December 31, 2020 is shown below:
Table 67. Breakdown of RWAs, equity investments and capital instruments by applicable approach (Million Euros)
| RWAs | ||||||||||||||||||
| Internal Models | Simple Method | PD/LGD | Total | |||||||||||||||
31/12/2021 | Investments in associates | — | 8,121 | 1,150 | 9,271 | |||||||||||||
| Financial assets at fair value through other | ||||||||||||||||||
| comprehensive income | 54 | 415 | 1,409 | 1,878 | ||||||||||||||
| Non - trading financial assets mandatorily at fair value | ||||||||||||||||||
| through | 379 | 1,707 | — | 2,086 | ||||||||||||||
| profit or loss | ||||||||||||||||||
31/12/2020 | Investments in associates | — | 8,514 | 2,909 | 11,423 | |||||||||||||
| Financial assets at fair value through other | ||||||||||||||||||
| comprehensive income | 261 | 500 | 1,036 | 1,797 | ||||||||||||||
| Non - trading financial assets mandatorily at fair value | ||||||||||||||||||
| through | 352 | 960 | — | 1,312 | ||||||||||||||
| profit or loss | ||||||||||||||||||
Table of Contents
| BBVA. PILLAR 3 2021 | 4. RISKS | P. 175 |
The table below shows the main variations in RWA of equity credit risk as of December 31, 2021:
Table 68. Variation in RWAs for Equity Risk (Million Euros)
RWA as of December 31, 2020 | 14,532 | |||
Asset size(1) | 1,081 | |||
Acquisitions and disposals | (1,567 | ) | ||
Foreign exchange movements | 38 | |||
Other(2) | (850 | ) | ||
RWA as of December 31, 2021 | 13,234 |
| (1) | Asset size includes changes due to the revaluation of investments and the organic profit generation of Group’s insurance companies. |
| (2) | Other includes the effect of the deduction significant holdings value in financial sector entities exceeding the joint limit with DTAs of 17.65% of CET1 (see section 3.2 letter n). The amount of the deduction totals €340 million of exposure, resulting in a reduction of RWAs in the amount of €850 million, |
The portfolio mainly includes the Group’s insurance companies, which for regulatory purposes are considered as investments in associates. It also includes stakes in real estate investment companies and equity holdings in other sectors, with a significant stake in Telefónica.
During 2021, the most significant variation corresponds to the sale of the 20% stake in Divarian Property, S.A.U. in October 2021 with an estimated impact of approximately €-1.5 billion in terms of risk-weighted assets.
Liquidity and funding risk is defined as the incapacity of a bank in meeting its payment commitments due to lack of funds or that, to face those commitments, should have to make use of funding under burdensome terms.
4.5.1. Liquidity and funding prospects
The BBVA Group is a multinational financial institution whose business is focused mainly on retail and commercial banking activities. In addition to the retail business model, which forms its core business, the Group engages in corporate and investment banking, through the global CIB (Corporate & Investment Banking) division.
Liquidity and Funding Risk Management aims to maintain a solid balance sheet structure which allows a sustainable business model. The Group’s liquidity and funding strategy is based on the following pillars:
| • | The principle of the funding self-sufficiency of its subsidiaries, meaning that each of the Liquidity Management Units (LMU) must cover its funding needs independently on the markets where it operates. This avoids possible contagion due to a crisis affecting one or more of the Group’s LMU. |
| • | Stable customer deposits as the main source of funding in all the LMU, in accordance with the Group’s business model. |
| • | Diversification of the sources of wholesale funding, in terms of maturity, market, instruments, counterparties and currencies, with recurring access to the markets. |
| • | Compliance with regulatory requirements, ensuring the availability of ample liquidity buffers, of high quality, as well as sufficient instruments as required by regulations with the capacity to absorb losses. |
| • | Compliance with the internal Liquidity Risk and Funding metrics, while adhering to the Risk Appetite level established for each LMU at any time. |
Liquidity and Funding Risk Management aims, in the short term, to prevent an entity from having difficulties in meeting its payment commitments in due time and form or that, to meet them, it has to resort to obtaining funds in burdensome conditions that deteriorate the image or reputation of the entity.
In the medium term, its objective is to ensure the suitability of the Group’s financial structure and its evolution, within the framework of the economic situation, the markets and regulatory changes.
This management of structural and liquidity funding is based on the principle of financial self-sufficiency of the entities that comprise it. This approach helps prevent and limit liquidity risk by reducing the Group’s vulnerability during periods of high risk. This decentralized management prevents possible contagion from a crisis affecting only one or a few Group entities, which must act independently to meet their liquidity requirements in the markets where they operate.
Within this strategy, the BBVA Group is organized into eight LMUs composed of the parent company and the bank subsidiaries in each geography, plus the branches that depend on them.
In addition, the policy for managing liquidity and funding risk is also based on the model’s robustness and on the planning and integration of risk management into the budgeting process of each LMU, according to the financing risk appetite that it decides to assume in its business.
Liquidity and funding planning is part of the strategic processes for the Group’s budgetary and business planning. This objective is to allow a recurrent growth of the banking business with suitable maturities and costs within the established risk tolerance levels by using a wide range of instruments which allow the diversification of the funding sources and the maintenance of a high volume of available liquid assets.
Table of Contents
| BBVA. PILLAR 3 2021 | 4. RISKS | P. 176 |
The core objectives of the Group in terms of liquidity risk and funding are determined through Liquidity Coverage Ratio (LCR) and the Loan to Stable Customer Deposits ratio (LtSCD).
A statement of the level of appropriateness of the liquidity risk management mechanisms is included as part of the Internal Liquidity Adequacy Assessment Process (ILAAP) approved by the Board of Directors in April 2021:
“From the internal assessment carried out, the Board of Directors concluded that the liquidity and funding management model is robust, with a medium-low liquidity and funding risk profile backed by the existing Risk Appetite Framework and the liquidity and funding planning. In the budget horizon, the impact of climate change risk on liquidity and funding is low.
Also, this liquidity and funding management model considers the liquid resources necessary and the ability to generate the additional measures to continue maintaining this profile over the planning horizon and to affront unexpected situations of tension.
The assessment reveals that BBVA Group entities maintain a robust funding structure and effective governance that enables the planning and management of liquidity and funding to be adapted to adverse situations, as demonstrated during 2020 against the backdrop of the Covid-19 crisis.
All the processes described are subject to the BBVA Group internal control model, based on an organizational structure involving the 3 lines of defense that use solid corporate methodologies and tools. The risks identified in these processes are sufficiently mitigated by controls that have been tested during the year and that have worked correctly.”
4.5.2. Governance and monitoring
The responsibility for liquidity and funding management in the development of normal business activity lies with the Finance area as a first line of defense in managing the risks inherent to this activity, in accordance with the principles established by the European Banking Authority (EBA) and in line with the most demanding standards, policies, procedures and controls in the framework established by the governing bodies. Finance, through the Balance-Sheet Management area, plans and executes the funding of the structural long-term gap of each LMU and proposes to the Assets and Liabilities Committee (ALCO) the actions to be taken on this matter, in accordance with the policies established by the Risk Committee in line with the metrics of the Risk Appetite Framework approved by the Board of Directors.
Finance is also responsible for preparing the regulatory reporting of liquidity, coordinating with the responsible
areas in each LGU the necessary processes to cover the requirements at corporate and regulatory level, ensuring the integrity of the information provided.
GRM is responsible for ensuring that the liquidity and financing risk in the Group is managed in accordance with the framework established by governing bodies. It also deals with the identification, measurement, monitoring and control of such risks and their communication to the relevant corporate bodies. In order to carry out this task properly, the risk function in the Group has been configured as a single, global function, independent of the management areas
Additionally, the Group has, in its second line of defense, an Internal Risk Control unit, which performs an independent review of the control of Liquidity and Funding Risk, and a Financial Internal Control Unit that reviews the design and effectiveness of the controls operations on liquidity management and reporting.
As the third line of defense of the Group’s internal control model, Internal Audit is in charge of reviewing specific controls and processes in accordance with a work plan that is drawn up annually.
The Group’s fundamental objectives regarding the liquidity and funding risk are determined through the Liquidity Coverage Ratio (LCR) and through the Loan-to-Stable Customer Deposits (LtSCD) ratio.
The LCR ratio is a regulatory metric that aims to guarantee the resilience of entities in a scenario of liquidity tension within a time horizon of 30 days. Within its risk appetite framework and system of limits and alerts, BBVA has established a required LCR compliance level for the entire Group and for each individual LMU. The internal levels required are aimed at efficiently meeting the regulatory requirement, at a loose level above 100%.
The LtSCD ratio measures the relationship between net lending and stable customer funds. The aim is to preserve a stable funding structure in the medium term for each of the LMU which make up the BBVA Group, taking into account that maintaining an adequate volume of stable customer funds is key to achieving a sound liquidity profile. In geographical areas with dual-currency balances, the indicator is also controlled by currency to manage the mismatches that might occur.
Stable customer funds are considered to be the financing obtained and managed from the LMU among their target customers. Those funds are characterized by their low sensitivity to market changes and by their less volatile behavior at aggregated level per operation due to the loyalty of the customer to the entity. The stable resources are calculated by applying to each identified customer segment a haircut determined by the analysis of the stability if the balances by which different aspects are evaluated (concentration, stability, level of loyalty).
Table of Contents
| BBVA. PILLAR 3 2021 | 4. RISKS | P. 177 |
The main source of stable resources arises from wholesale funding and retail customer funds.
In order to establish the target (maximum) levels of LtSCD in each LMU and provide an optimal funding structure reference in terms of risk appetite, the corporate Structural Risks unit of GRM identifies and assesses the economic and financial variables that condition the funding structures in the different geographical areas.
Additionally, liquidity and funding risk management aims to achieve a proper diversification of the funding structure, avoiding excessive dependence on short-term funding by establishing a maximum level for the short-term funds raised, including both wholesale financing and the least stable proportion of customer funds In relation to long-term financing, the maturity profile does not present significant concentrations, which makes it possible to adapt the schedule of the planned issuance plan to the best financial conditions in the markets. Lastly, concentration risk is monitored at LMU level, with the aim of ensuring a correct diversification of both the counterparty and type of instrument.
One of the fundamental metrics within the general management framework of the liquidity and funding risk is the maintenance of a liquidity buffer consisting of high quality assets free of charges which can be sold or offered as collateral to obtain funding, either under normal market conditions or in stress situations.
The Finance area is responsible for the collateral management and determining the liquidity buffer within the BBVA Group. According to the principle of auto-sufficiency of the Group’s subsidiaries, each LMU is responsible for maintaining a buffer of liquid assets which complies with the regulatory requirements applicable under each jurisdiction. In addition, the liquidity buffer of each LMU must be aligned with the liquidity and funding risk tolerance as well as the management limits set and approved for each case.
In this context, the short-term resistance of the liquidity risk profile is promoted, ensuring that each LMU has sufficient collateral to deal with the risk of the closing of wholesale markets. Basic capacity is the internal metric for the management and control of short-term liquidity risk, which is defined as the relationship between the explicit assets available and the maturities of wholesale liabilities and volatile resources, at different time periods up to one year, with special relevance at 30 and 90 days, with the objective of preserving the survival period above 3 months with the available buffer, without considering the balance inflows.
As a fundamental element of the liquidity and financing risk monitoring scheme, stress tests are carried out. They enable to anticipate deviations from the liquidity targets and the limits set in the appetite, and to establish tolerance ranges in the different management areas. They also play a major role in the design of the Liquidity
Contingency Plan and the definition of specific measures to be adopted to rectify the risk profile if necessary.
For each scenario, it is checked whether BBVA has a sufficient stock of liquid assets to guarantee its capacity to meet the liquidity commitments/outflows in the different periods analyzed. The analysis considers four scenarios: one central and three crisis-related (systemic crisis; unexpected internal crisis with a considerable rating downgrade and/or affecting the ability to issue in wholesale markets and the perception of business risk by the banking intermediaries and the entity’s clients; and a mixed scenario, as a combination of the two aforementioned scenarios). Each scenario considers the following factors: existing market liquidity, customer behavior and sources of funding, the impact of rating downgrades, market values of liquid assets and collateral, and the interaction between liquidity requirements and the development of BBVA’s credit quality.
The stress tests conducted on a regular basis by GRM reveal that BBVA maintains a sufficient buffer of liquid assets to deal with the estimated liquidity outflows in a scenario resulting from the combination of a systemic crisis and an unexpected internal crisis, during a period of longer than 3 months in general for the different LMU (including Turkey closing the year above 6 months), including in the scenario of a significant downgrade of the Bank’s rating by up to three notches.
Together with the results of the stress tests and the risk metrics, the early warning indicators play an important role within the corporate model and the Liquidity Contingency Plan. They are mainly indicators of the funding structure, in relation to asset encumbrance, counterparty concentration, flights of customer deposits, unexpected use of credit facilities, and of the market, which help anticipate possible risks and capture market expectations.
Finance is the area responsible for the elaboration, monitoring, execution and update of the liquidity and funding plan and of the market access strategy to guarantee and improve the stability and diversification of the wholesale funding sources.
In order to implement and establish management in an anticipated manner, limits are set on an annual basis for the main management metrics that form part of the budgeting process for the liquidity and funding plan. This framework of limits contributes to the planning of the joint future performance of:
| • | The loan book, considering the types of assets and their degree of liquidity, as well as their validity as collateral in collateralized funding. |
| • | Stable customer funds, based on the application of a methodology for establishing which segments and customer balances are considered to be stable or volatile funds based |
Table of Contents
| BBVA. PILLAR 3 2021 | 4. RISKS | P. 178 |
on the principle of sustainability and recurrence of these funds. |
| • | Projection of the credit gap, in order to require a degree of self-funding that is defined in terms of the difference between the loan-book and stable customer funds. |
| • | Incorporating the planning of securities portfolios into the banking book, which include both fixed-interest and equity securities, and are classified as financial assets at fair value through other comprehensive income and at amortized cost, and additionally on trading portfolios. |
| • | The structural gap projection, as a result of assessing the funding needs generated both from the credit gap and by the securities portfolio in the banking book, together with the rest of on-balance-sheet wholesale funding needs, excluding trading portfolios. This gap therefore needs to be funded with customer funds that are not considered stable or on wholesale markets. |
As a result of these funding needs, the BBVA Group plans the target wholesale funding structure according to the tolerance set in each LMU target.
Thus, once the structural gap has been identified and after resorting to wholesale markets, the amount and composition of wholesale structural funding is established in subsequent years, in order to maintain a diversified funding mix and guarantee that there is not a high reliance on short-term funding (short-term wholesale funding plus volatile customer funds).
In practice, the execution of the principles of planning and self-funding at the different LMU results in the Group’s main source of funding being customer deposits, which consist mainly of demand deposits, savings deposits and time deposits.
As sources of funding, customer deposits are complemented by access to the interbank market and the domestic and international capital markets in order to address additional liquidity requirements, implementing domestic and international programs for the issuance of commercial paper and medium and long-term debt.
The process of analysis and assessment of the liquidity and funding situation and of the inherent risks is a process carried out on an ongoing basis in the BBVA Group, with the participation of all the Group areas involved in liquidity and funding risk management. This process is carried out at both local and corporate level. It is incorporated into the decision- making process for liquidity and funding management, with integration between the risk appetite strategy and establishment
and the planning process, the funding plan and the limits scheme..
4.5.3. Liquidity and funding performance
The BBVA Group maintains a robust and dynamic funding structure with a predominantly retail nature, where customer resources represent the main source of funding.
During 2021, liquidity conditions have remained comfortable in all the countries where the BBVA Group operates. The global crisis caused by COVID-19 had a significant impact on financial markets. The effects of this crisis on the Group’s balance sheets materialized fundamentally at first, through greater credit line withdrawals by wholesale clients in view of the worsening financing conditions in the markets, with no significant effect on the retail portfolio. These withdrawals were largely paid off over the following quarters. Dealing with this situation of initial uncertainty, the different central banks provided a joint response through specific measures and programs, whose extension, in some cases, has been prolonged during 2021, to facilitate the financing of the real economy and the provision of liquidity in financial markets, supporting the soundness of liquidity buffers in almost all areas with BBVA presence.
The performance of the indicators show that the robustness of the funding structure remained steady during 2021 and 2020, in the sense that all LMU held self-funding levels with stable customer resources above the requirements.
| 2021 | 2020 | |||||||
Group (average) | 95% | 95% | ||||||
BBVA S.A. | 98 | % | 97 | % | ||||
BBVA Mexico | 93 | % | 98 | % | ||||
Garanti BBVA | 81 | % | 95 | % | ||||
Other LMU | 93 | % | 86 | % | ||||
With respect to LCR, the Group has maintained a liquidity buffer at both a consolidated and individual level in 2021. As a result, the ratio has remained comfortably above 100%, with the consolidated ratio as of December 31, 2021 standing at 165%.
Although this requirement is only established at a Group level, for banks in the Eurozone, the minimum level required is comfortably exceeded in all subsidiaries. It should be noted that the calculation of the Consolidated LCR does not allow the transfer of liquidity between subsidiaries, so no excess liquidity may be transferred from these entities for the purpose of calculating the
Table of Contents
| BBVA. PILLAR 3 2021 | 4. RISKS | P. 179 |
consolidated ratio. If the impact of these highly liquid assets was considered, the LCR would be 213%, or +48 basis points above the required level.
| 2021 | 2020 | |||||||
Group | 165% | 149% | ||||||
BBVA S.A. | 190 | % | 173 | % | ||||
BBVA Mexico | 245 | % | 196 | % | ||||
Garanti BBVA | 211 | % | 183 | % | ||||
One of the key elements in BBVA’s Group liquidity and funding management is the maintenance of large high quality liquidity buffers in all business areas where the group operates.
Each entity maintains a sound liquidity buffer at the individual level for BBVA, S.A. and for each of its subsidiaries, such as BBVA Mexico, Garanti BBVA and the Latin American subsidiaries. In general, this buffer has been strengthened during 2021 in the LMU.
In this respect, the Group has maintained for the last 12 months an average volume of high quality liquid assets (HQLA) amounting to €138.2 billion, among which, 93% correspond to maximum quality assets (LCR Level 1).
The Net Stable Funding Ratio (NSFR), defined as the result between the amount of stable funding available
and the amount of stable funding required, requiring banks to maintain a stable financing profile in relation to the composition of their assets and off-balance sheet activities. This ratio should be at least 100% at all times. The NSFR ratio of the BBVA Group, calculated by applying the regulatory criteria established in Regulation (EU) 2019/876 of the European Parliament and of the Council, of May 20, 2019, entered into force in June 2021, and stood at 135% as of December 31, 2021.
The NSFR of BBVA Group and its main LMU at December 31, 2021 and 2020, calculated based on the Basel requirements, was the following:
| 2021 | 2020(*) | |||||||
Group | 135% | 127% | ||||||
BBVA S.A. | 126 | % | 121 | % | ||||
BBVA Mexico | 149 | % | 138 | % | ||||
Garanti BBVA | 162 | % | 154 | % | ||||
| (*) | 2020 ratios calculated based on Basel requirements. |
Below is a matrix of residual maturities by contractual periods based on supervisory prudential reporting as of December 31, 2021:
Table 72. Inflows - Contractual maturities (Million Euros. 12-31-2021)
| Demand | Up to 1 month | 1 to 3 months | 3 to 6 months | 6 to 9 months | 9 to 12 months | 1 to 2 years | 2 to 3 years | 3 to 5 years | Over 5 years | Total | ||||||||||||||||||||||||||||||||||
ASSETS | ||||||||||||||||||||||||||||||||||||||||||||
Cash, cash balances at central banks and other demand deposits | 39,761 | 24,598 | — | — | — | — | — | — | — | — | 64,359 | |||||||||||||||||||||||||||||||||
Deposits in credit entities | — | 3,781 | 400 | 790 | 373 | 299 | 211 | 166 | 8 | 26 | 6,056 | |||||||||||||||||||||||||||||||||
Deposits in other financial institutions | 2 | 901 | 801 | 584 | 727 | 432 | 694 | 470 | 261 | 469 | 5,343 | |||||||||||||||||||||||||||||||||
Reverse repo, securities borrowing and margin lending | — | 33,856 | 11,611 | 2,945 | 1,063 | 1,692 | 2,188 | 2,239 | 1,118 | 739 | 57,451 | |||||||||||||||||||||||||||||||||
Loans and advances | 174 | 18,531 | 23,185 | 22,141 | 11,769 | 13,782 | 39,656 | 30,049 | 44,508 | 94,780 | 298,574 | |||||||||||||||||||||||||||||||||
Securities’ portfolio settlement | 10 | 1,779 | 3,606 | 3,395 | 2,333 | 3,958 | 18,854 | 13,135 | 17,214 | 47,331 | 111,614 | |||||||||||||||||||||||||||||||||
Inflows - Contractual maturities (Million Euros. 12-31-2020) (*)
| Demand | Up to 1 month | 1 to 3 months | 3 to 6 months | 6 to 9 months | 9 to 12 months | 1 to 2 years | 2 to 3 years | 3 to 5 years | Over 5 years | Total | ||||||||||||||||||||||||||||||||||
ASSETS | ||||||||||||||||||||||||||||||||||||||||||||
Cash, cash balances at central banks and other demand deposits | 42,518 | 32,741 | — | — | — | — | — | — | — | — | 75,258 | |||||||||||||||||||||||||||||||||
Deposits in credit entities | — | 3,616 | 677 | 921 | 356 | 461 | 117 | 120 | 2 | 39 | 6,309 | |||||||||||||||||||||||||||||||||
Deposits in other financial institutions | — | 2,202 | 855 | 797 | 734 | 543 | 1,251 | 721 | 515 | 500 | 8,119 | |||||||||||||||||||||||||||||||||
Reverse repo, securities borrowing and margin lending | — | 20,033 | 4,757 | 1,351 | 364 | 368 | 3,320 | 1,849 | 891 | 1,089 | 34,021 | |||||||||||||||||||||||||||||||||
Loans and advances | 279 | 16,939 | 24,280 | 23,012 | 15,579 | 17,032 | 46,182 | 38,851 | 51,709 | 110,173 | 344,036 | |||||||||||||||||||||||||||||||||
Securities’ portfolio settlement | — | 3,896 | 6,680 | 6,557 | 5,084 | 13,014 | 9,858 | 15,494 | 17,231 | 50,045 | 127,859 | |||||||||||||||||||||||||||||||||
| (*) | Including the amounts of subsidiaries in USA which belonged to the Group. |
Table of Contents
| BBVA. PILLAR 3 2021 | 4. RISKS | P. 180 |
Table 73. Outflows - Contractual maturities (Million Euros. 12-31-2021)
| Demand | Up to 1 month | 1 to 3 months | 3 to 6 months | 6 to 9 months | 9 to 12 months | 1 to 2 years | 2 to 3 years | 3 to 5 years | Over 5 years | Total | ||||||||||||||||||||||||||||||||||
LIABILITIES | ||||||||||||||||||||||||||||||||||||||||||||
Wholesale funding | — | 3,065 | 1,077 | 3,498 | 2,914 | 1,885 | 9,477 | 4,931 | 12,332 | 19,991 | 59,169 | |||||||||||||||||||||||||||||||||
Deposits in financial institutions | 1,936 | 4,257 | 415 | 825 | 183 | 924 | 496 | 146 | 146 | 579 | 9,907 | |||||||||||||||||||||||||||||||||
Deposits in other financial institutions and international agencies | 8,894 | 2,728 | 1,700 | 382 | 289 | 227 | 578 | 231 | 337 | 722 | 16,087 | |||||||||||||||||||||||||||||||||
Customer deposits | 281,812 | 28,806 | 11,814 | 4,867 | 1,717 | 1,520 | 1,740 | 578 | 863 | 416 | 334,132 | |||||||||||||||||||||||||||||||||
Security pledge funding | — | 52,437 | 6,858 | 2,485 | 1,513 | 8,252 | 29,954 | 5,527 | 4,755 | 1,490 | 113,269 | |||||||||||||||||||||||||||||||||
Derivatives, net | (33 | ) | (395 | ) | (176 | ) | (326 | ) | (66 | ) | (641 | ) | 100 | (122 | ) | (155 | ) | (66 | ) | (1,880 | ) | |||||||||||||||||||||||
Outflows - Contractual maturities (Million Euros. 12-31-2020) (*)
| Demand | Up to 1 month | 1 to 3 months | 3 to 6 months | 6 to 9 months | 9 to 12 months | 1 to 2 years | 2 to 3 years | 3 to 5 years | Over 5 years | Total | ||||||||||||||||||||||||||||||||||
LIABILITIES | ||||||||||||||||||||||||||||||||||||||||||||
Wholesale funding | — | 4,750 | 2,618 | 3,963 | 1,283 | 1,543 | 10,573 | 7,505 | 12,793 | 23,839 | 68,868 | |||||||||||||||||||||||||||||||||
Deposits in financial institutions | 8,838 | 7,859 | 254 | 741 | 152 | 726 | 825 | 189 | 166 | 371 | 20,120 | |||||||||||||||||||||||||||||||||
Deposits in other financial institutions and international agencies | 12,735 | 4,324 | 2,694 | 588 | 353 | 272 | 957 | 337 | 459 | 870 | 23,589 | |||||||||||||||||||||||||||||||||
Customer deposits | 308,360 | 39,978 | 13,416 | 6,808 | 4,526 | 4,366 | 3,361 | 1,213 | 869 | 799 | 383,694 | |||||||||||||||||||||||||||||||||
Security pledge funding | — | 41,239 | 5,301 | 1,643 | 1,192 | 368 | 11,304 | 28,510 | 3,740 | 1,516 | 94,812 | |||||||||||||||||||||||||||||||||
Derivatives, net | — | (722 | ) | 15 | (961 | ) | (85 | ) | 134 | (400 | ) | (157 | ) | (264 | ) | (159 | ) | (2,599 | ) | |||||||||||||||||||||||||
| (*) | Including the amounts of subsidiaries in USA which belonged to the Group. |
With regard to the financing structure, the loan portfolio is mostly financed by retail deposits. The “demand” maturity bucket mainly contains the retail customer sight accounts whose behavior historically showed a high level of stability and little concentration. According to a behavior analysis which is done every year in every entity, this type of account is considered to be stable and for liquidity risk purposes receive a better treatment.
The most relevant aspects related to the main geographical areas are the following:
| • | In the Eurozone, BBVA has continued to maintain a sound position with a large high-quality liquidity buffer. During 2021, commercial activity has drawdown liquidity amounting to approximately €9 billion due to the increase in lending activity, especially in the last quarter of the year, as well as the decrease in the volume of deposits, mainly wholesale. It should also be noted that in the second quarter of 2021, the payment of the BBVA USA sale transaction was collected. In addition, in March 2021, BBVA S.A. took part in the TLTRO III liquidity window program to take advantage of the improved conditions announced by the European Central Bank (ECB) in December 2020, with an amount drawn of €3.5 billion that, together with the €34.9 billion available at the end of December 2020 , amount to €38.4 billion at the end of December 2021. |
| • | In BBVA Mexico, commercial activity has provided liquidity between January and December 2021 in the amount of approximately |
73 billion Mexican pesos, derived from a higher growth in customer funds compared to the growth in lending activity. This increased liquidity is expected to be reduced due to the recovery in lending activity expected in 2022. This solid liquidity position has contributed to an efficient policy in the cost of funding, in an environment of higher interest rates. In terms of wholesale issuances, there was no need to refinance any maturities in 2021, having matured in 2021 a subordinated issue amounting to $750 million and a senior issue amounting to 4.5 billion Mexican pesos. |
| • | In the fourth quarter, the Central Bank of the Republic of Turkey made a series of cuts in benchmark rates, despite the increases in the inflation rate, for a total of 400 basis points to 14%, triggering an adverse reaction from the markets and severe currency depreciation. In order to alleviate the depreciation of the currency, during the month of December, the Turkish government implemented a new mechanism to encourage local currency deposits. During 2021, the lending gap in local currency has widened, with a higher increase in loans than in deposits, while the lending gap in foreign currency has narrowed, due to a decline in loans and an increase in deposits. Garanti BBVA continues to maintain a stable liquidity position with comfortable ratios. |
| • | In South America, the liquidity situation remains adequate throughout the region, despite the fact that central banks in the region have started |
Table of Contents
| BBVA. PILLAR 3 2021 | 4. RISKS | P. 181 |
rate hike cycles and withdrawal of stimulus programs that mitigate the impact of the COVID-19 crisis. In Argentina, liquidity in the system and in BBVA continues to increase due to the higher growth in deposits than in loans in local currency. In BBVA Colombia, activity picks up accompanied by the growth in deposits. BBVA Peru maintains solid levels of liquidity, while reducing excess liquidity due to growth in lending activity, combined with a contraction of deposits, following a costs control strategy. |
The main wholesale financing transactions carried out by the companies of the BBVA Group are listed below:
| • | In March 2021, BBVA S.A. issued a senior preferred debt for an amount of €1 billion, with a maturity of 6 years and an option for early redemption after five years. In September 2021, BBVA S.A. issued a floating rate senior preferred bond totaling €1 billion and maturing in 2 years, the fifth issue made by BBVA linked to environmental, social and governance (ESG) criteria. Additionally, in January 2022, BBVA S.A. issued a €1 billion senior non-preferred bond, with a maturity of 7 years and an option for early redemption in the sixth year, with a coupon of 0.875%. |
| • | In Turkey, there have been no issuances in 2021. The Bank renewed its syndicated loans in June and November, indexed to sustainability criteria. On June 2, BBVA Garanti renewed 100% of a syndicated loan, formed by two separate tranches, amounting to USD 279m and €294m, with a 1-year maturity and a cost of Libor +2.50% and Euribor +2.25%, respectively. In November, the Bank renewed 100% of the second tranche of the mentioned loan, for USD 365m and €247m, at a cost of Libor + 2.15% and Euribor + 1.75% respectively. |
| • | In South America, BBVA Uruguay issued in February 2021 the first sustainable bond on the Uruguayan financial market for USD 15m at an initial interest rate of 3.854%. |
The liquidity position of the rest of subsidiaries has continued to be sound, maintaining a solid liquidity position in all the jurisdictions in which the Group operates.
In this context, BBVA has maintained its objective of strengthening the funding structure of the different Group entities based on growing their self-funding from stable customer funds, while guaranteeing a sufficient buffer of fully available liquid assets, diversifying the various sources of funding available, and optimizing the generation of collateral available for dealing with stress situations in the markets.
4.5.4. Liquidity and funding prospects
The Group faces 2022 with a comfortable liquidity situation in all the territories it operates in. The funding structure based on stable customer deposits and oriented towards the long term, as well as the proven capacity to access capital markets, allows to comfortably face the moderate volume of maturities expected for the coming quarters.
The following table is a breakdown of wholesale funding maturities of the most significant units of the Group according to their nature:
Table 74. Maturity of wholesale issuances of Balance Euro by nature (Million Euros)
Type of issuance | 2022 | 2023 | 2024 | After 2024 | Total | |||||||||||||||
Senior debt | 2,830 | 2,743 | — | 3,979 | 9,552 | |||||||||||||||
Non preferred senior debt | 1,500 | 1,650 | 2,000 | 3,527 | 8,677 | |||||||||||||||
Mortgage-covered bonds | 1,618 | 2,350 | 1,000 | 4,431 | 9,399 | |||||||||||||||
Public-covered bonds | 300 | 200 | — | — | 500 | |||||||||||||||
Preferred shares (1) | 500 | 1,000 | 1,000 | 2,766 | 5,266 | |||||||||||||||
Subordinated debt(1) | 68 | 150 | 750 | 3,488 | 4,456 | |||||||||||||||
Structured financing (2) | 3,182 | 352 | 164 | 1,300 | 4,998 | |||||||||||||||
|
|
|
|
|
|
|
|
|
| |||||||||||
Total | 9,998 | 8,445 | 4,914 | 19,491 | 42,848 | |||||||||||||||
|
|
|
|
|
|
|
|
|
| |||||||||||
| (1) | Regulatory capital instruments are classified in this table by terms according to their contractual maturity or nearest amortisation option |
| (2) | Global Markets MTN programme amounts not eligible as MREL, classified according to their earliest repayment option |
Table 75. Maturity of wholesale issuances of BBVA Mexico by nature (Million Euros)
Type of issuance | 2022 | 2023 | 2024 | After 2024 | Total | |||||||||||||||
Senior debt | 340 | 547 | 662 | 1,605 | 3,154 | |||||||||||||||
Subordinated debt(1) | 1,324 | — | 177 | 1,545 | 3,046 | |||||||||||||||
|
|
|
|
|
|
|
|
|
| |||||||||||
Total | 1,664 | 547 | 839 | 3,150 | 6,200 | |||||||||||||||
|
|
|
|
|
|
|
|
|
| |||||||||||
| (1) | Regulatory capital instruments are classified in this table by terms according to their contractual maturity or nearest amortisation option |
Table of Contents
| BBVA. PILLAR 3 2021 | 4. RISKS | P. 182 |
Table 76. Maturity of wholesale issuances of BBVA Garanti by nature (Million Euros)
Type of issuance | 2022 | 2023 | 2024 | After 2024 | Total | |||||||||||||||
Senior debt | 662 | 466 | 110 | 20 | 1,259 | |||||||||||||||
Mortgage-covered bonds | 55 | 10 | — | — | 65 | |||||||||||||||
Subordinated debt(1) | — | — | — | 662 | 662 | |||||||||||||||
Securitisations | 355 | 113 | 117 | 69 | 654 | |||||||||||||||
Syndicated loans | 1,110 | — | — | — | 1,110 | |||||||||||||||
Other long term financial instruments | 358 | 225 | 119 | 1,607 | 2,309 | |||||||||||||||
|
|
|
|
|
|
|
|
|
| |||||||||||
Total | 2,540 | 814 | 346 | 2,358 | 6,059 | |||||||||||||||
|
|
|
|
|
|
|
|
|
| |||||||||||
| (1) | Regulatory capital instruments are classified in this table by terms according to their contractual maturity or nearest amortisation option. |
Table 77. Maturity of wholesale issues of South America by nature (Million Euros)
Type of issuance | 2022 | 2023 | 2024 | After 2024 | Total | |||||||||||||||
Senior debt | 891 | 266 | 119 | 82 | 1,358 | |||||||||||||||
Subordinated debt(1) | — | 65 | — | 862 | 927 | |||||||||||||||
|
|
|
|
|
|
|
|
|
| |||||||||||
Total | 891 | 331 | 119 | 944 | 2,285 | |||||||||||||||
|
|
|
|
|
|
|
|
|
| |||||||||||
| (1) | Regulatory capital instruments are classified in this table by terms according to their contractual maturity or nearest amortisation option. |
Going into 2022, one of the main objectives of the Group’s funding strategy is maintaining the strength of the financing structure based on the growth of stable customer resources; diversifying the different sources of financing and ensuring the availability of sufficient levels of liquid assets; and optimizing the generation of collateral, for compliance with regulatory ratios, and other internal metrics to monitor liquidity and funding risk, including stress scenarios.
A breakdown of the LCR disclosure as of December 31, 2021 is shown below, according to Article 435 of Regulation (EU) No 575/2013. These figures are calculated as simple averages of end-of-month observations from the twelve months preceding each quarter. No transfer of liquidity is assumed between subsidiaries, and therefore no excess liquidity is transferred from the entities abroad to the consolidated figures displayed in the following table:
Table of Contents
| BBVA. PILLAR 3 2021 | 4. RISKS | P. 183 |
Table 78. EU LIQ1: Liquidity Coverage Ratio disclosure (Rounded Million Euros)
| Total unweighted value (average) |
| Total weighted value (average) |
| |||||||||||||||||||||||||||||||||||||
| December | September | June | March | December | December | September | June | March | December | |||||||||||||||||||||||||||||||
End of the quarter | 12-31-2021 | 9-31-2021 | 6-30-2021 | 3-31-2021 | 12-31-2020 | 12-31-2021 | 9-31-2021 | 6-30-2021 | 3-31-2021 | 12-31-2020 | ||||||||||||||||||||||||||||||
Number of data points used in the calculation of averages | 12 | 12 | 12 | 12 | 12 | 12 | 12 | 12 | 12 | 12 | ||||||||||||||||||||||||||||||
High-quality liquid assets | ||||||||||||||||||||||||||||||||||||||||
Total high-quality liquid assets (HQLA) | 110,132 | 114,998 | 118,802 | 118,296 | 113,781 | |||||||||||||||||||||||||||||||||||
Cash-outflows | ||||||||||||||||||||||||||||||||||||||||
Retail deposits and deposits from small business customers, of which: | 239,938 | 247,662 | 254,676 | 256,404 | 248,426 | 16,365 | 16,843 | 17,214 | 17,215 | 16,897 | ||||||||||||||||||||||||||||||
Stable deposits | 162,692 | 166,291 | 169,040 | 167,734 | 162,656 | 8,135 | 8,315 | 8,452 | 8,387 | 8,133 | ||||||||||||||||||||||||||||||
Less stable deposits | 71,068 | 73,462 | 75,169 | 75,338 | 74,396 | 8,231 | 8,529 | 8,762 | 8,828 | 8,764 | ||||||||||||||||||||||||||||||
Unsecured wholesale funding | 119,110 | 126,669 | 133,374 | 138,461 | 138,800 | 47,971 | 51,845 | 54,523 | 57,170 | 58,013 | ||||||||||||||||||||||||||||||
Operational deposits (all counterparties) and deposits in networks of cooperative banks | 56,173 | 57,460 | 58,820 | 58,824 | 57,717 | 12,930 | 13,169 | 13,428 | 13,391 | 13,120 | ||||||||||||||||||||||||||||||
Non-operational deposits (all counterparties) | 61,809 | 67,848 | 73,103 | 77,994 | 79,407 | 33,913 | 37,315 | 39,644 | 42,136 | 43,217 | ||||||||||||||||||||||||||||||
Unsecured debt | 1,128 | 1,361 | 1,451 | 1,643 | 1,676 | 1,128 | 1,361 | 1,451 | 1,643 | 1,676 | ||||||||||||||||||||||||||||||
Secured wholesale funding | 3,297 | 3,691 | 4,048 | 4,514 | 4,918 | |||||||||||||||||||||||||||||||||||
Additional requirements | 84,384 | 87,316 | 90,409 | 92,490 | 93,019 | 18,819 | 18,752 | 18,720 | 18,422 | 17,776 | ||||||||||||||||||||||||||||||
Outflows related to derivative exposures and other collateral requirements(1) | 9,359 | 8,870 | 8,421 | 8,250 | 7,923 | 9,348 | 8,830 | 8,354 | 8,166 | 7,834 | ||||||||||||||||||||||||||||||
Outflows related to loss of funding on debt products | 278 | 302 | 465 | 365 | 339 | 278 | 302 | 465 | 365 | 339 | ||||||||||||||||||||||||||||||
Credit and liquidity facilities | 74,747 | 78,144 | 81,523 | 83,875 | 84,757 | 9,193 | 9,620 | 9,901 | 9,891 | 9,603 | ||||||||||||||||||||||||||||||
Other contractual funding obligations | 12,153 | 12,139 | 12,548 | 12,505 | 12,906 | 1,617 | 1,354 | 1,345 | 935 | 1,032 | ||||||||||||||||||||||||||||||
Other contingent funding obligations | 83,917 | 83,380 | 83,474 | 82,555 | 80,950 | 3,472 | 3,477 | 3,450 | 3,363 | 3,300 | ||||||||||||||||||||||||||||||
|
|
|
|
|
|
|
|
|
| |||||||||||||||||||||||||||||||
Total cash outflows | 91,541 | 95,962 | 99,300 | 101,619 | 101,936 | |||||||||||||||||||||||||||||||||||
|
|
|
|
|
|
|
|
|
| |||||||||||||||||||||||||||||||
Cash - inflows | ||||||||||||||||||||||||||||||||||||||||
Secured lending (e.g. reverse repos) | 20,102 | 18,879 | 19,015 | 20,406 | 21,004 | 929 | 1,034 | 1,294 | 1,337 | 1,340 | ||||||||||||||||||||||||||||||
Inflows from fully performing exposures | 27,362 | 27,201 | 27,446 | 28,107 | 28,860 | 17,770 | 17,529 | 17,695 | 18,017 | 18,446 | ||||||||||||||||||||||||||||||
Other cash inflows | 6,010 | 5,571 | 5,383 | 4,602 | 4,620 | 6,010 | 5,571 | 5,383 | 4,602 | 4,620 | ||||||||||||||||||||||||||||||
transactions in third countries where there are transfer restrictions or which are | ||||||||||||||||||||||||||||||||||||||||
(Excess inflows from a related specialised credit institutions) | ||||||||||||||||||||||||||||||||||||||||
|
|
|
|
|
|
|
|
|
|
|
|
|
|
|
|
|
|
|
| |||||||||||||||||||||
Total cash inflows | 53,474 | 51,651 | 51,844 | 53,115 | 54,484 | 24,709 | 24,134 | 24,372 | 23,956 | 24,406 | ||||||||||||||||||||||||||||||
|
|
|
|
|
|
|
|
|
|
|
|
|
|
|
|
|
|
|
| |||||||||||||||||||||
Fully exempt inflows | ||||||||||||||||||||||||||||||||||||||||
Inflows subject to 90% cap | ||||||||||||||||||||||||||||||||||||||||
Inflows subject to 75% cap | 53,474 | 51,651 | 51,843 | 53,115 | 54,485 | 24,708 | 24,133 | 24,371 | 23,957 | 24,406 | ||||||||||||||||||||||||||||||
Total adjusted value | ||||||||||||||||||||||||||||||||||||||||
|
|
|
|
|
|
|
|
|
| |||||||||||||||||||||||||||||||
Liquidity buffer | 110,132 | 114,998 | 118,802 | 118,296 | 113,781 | |||||||||||||||||||||||||||||||||||
|
|
|
|
|
|
|
|
|
| |||||||||||||||||||||||||||||||
Total net cash outflows | 66,833 | 71,829 | 74,930 | 77,662 | 77,530 | |||||||||||||||||||||||||||||||||||
|
|
|
|
|
|
|
|
|
| |||||||||||||||||||||||||||||||
Liquidity coverage ratio (%) | 166 | % | 161 | % | 159 | % | 153 | % | 147 | % | ||||||||||||||||||||||||||||||
Liquidity buffer (including excess liquidity of subsidiaries) | 138,218 | 143,492 | 147,925 | 145,865 | 138,383 | |||||||||||||||||||||||||||||||||||
|
|
|
|
|
|
|
|
|
| |||||||||||||||||||||||||||||||
Total net cash outflows | 66,833 | 71,829 | 74,930 | 77,662 | 77,530 | |||||||||||||||||||||||||||||||||||
|
|
|
|
|
|
|
|
|
| |||||||||||||||||||||||||||||||
Liquidity coverage ratio (%) | 206.8 | % | 199.8 | % | 197.4 | % | 187.8 | % | 178.5 | % | ||||||||||||||||||||||||||||||
|
|
|
|
|
|
|
|
|
| |||||||||||||||||||||||||||||||
| (1) | Includes the amount of the collateral that the entity would have to provide in case of a credit downgrade, according to CRR Article 439(d) |
Table of Contents
| BBVA. PILLAR 3 2021 | 4. RISKS | P. 184 |
The BBVA Group’s consolidated ratio is mainly determined by the ratio of the three largest units that make up the Group: BBVA SA, BBVA Mexico and Garanti BBVA. In addition, as no transferability of liquidity between the subsidiaries is assumed, no excess liquidity is transferred from the entities abroad to the consolidated metric, so the evolution of the consolidated ratio is closely linked to the evolution of BBVA SA’s LCR. Throughout the series shown the table, the LCR has been increasing in the last year and at high levels, reflecting the Group’s comfortable and comfortable liquidity situation.
As regards the numerator of the ratio, one of the key elements in the BBVA Group’s management of liquidity and funding is the maintenance of large high-quality liquidity buffers in all geographic areas. In the last 12 months, the Group maintained an average volume of high quality liquid assets (HQLA) of €110.1 billion (€138.2 billion if we consider the excess liquidity of all the banks abroad), of which 93% corresponded to top quality assets (level 1).
As regards the composition of the denominator of the LCR, the main source of funding for all the Group’s banks is retail deposits, liabilities of a stable nature which therefore produce fewer potential outflows in the LCR ratio. The Group also has sources of wholesale funding that are adequately diversified in terms of maturity, instrument, market, currency and counterparty, oriented towards the long term, which are considered less stable for the purposes of the LCR, generating greater potential outflows.
Regarding the sustainability of wholesale funding as a source of funding, this depends on the degree of diversification. In particular, in order to ensure adequate diversification by counterparties, specific concentration thresholds are set and must be met at all times by each LMU. As of December 31, 2020, except for the positions against central clearing houses and the secured funding operations with several Central Banks, the Group has no counterparties that maintain balances greater than 1,5% of the Group’s total liabilities and the weight of the first 10 counterparties per balance represents 5%.
The establishment of an independent control framework for the Euro, USA, Mexico and Turkey LMUs, allows compliance with the Liquidity and Finance corporate requirements on the four main currencies in which the
BBVA Group operates: Euro, Dollar, Mexican Peso and Turkish Lira.
With the exception of the dollar, significant currencies at the Group level are fully managed by entities resident in the jurisdictions of each of them, with their funding needs covered in the local markets in which they operate.
For those LMUs operating in dollarised economies (Argentina, Peru, Mexico and Turkey) there are specific regulatory requirements that limit the level of risk of each subsidiary. In addition, the LCR in US dollars in all of them exceeds 100%.
Finally, the Group’s exposure to derivatives is limited (see section on counterparty risk exposure). In addition, the LCR of the different LMU’s includes liquidity outflows arising from the need to post additional collateral, the most relevant cases being the deterioration of the entity’s credit quality, the excess collateral to be returned to the counterparty, and the impact of an adverse market scenario. For the quantification of additional collateral in case of adverse market scenarios, a Historical Look Back Approach is used in accordance with the EBA RTS (Article 423(3) of the CRR).
4.5.6. Net Stable Funding Ratio
The Net Stable Funding Ratio (NSFR), defined as the result between the amount of stable funding available and the amount of stable funding required, requiring banks to maintain a stable financing profile in relation to the composition of their assets and off-balance sheet activities. This ratio should be at least 100% at all times. The NSFR ratio of the BBVA Group, calculated by applying the regulatory criteria established in Regulation (EU) 2019/876 of the European Parliament and of the Council, of May 20, 2019, entered into force in June 2021, and stood at 135% as of December 31, 2021.
Within its risk appetite framework, BBVA has included the NSFR indicator within the limits scheme for both the Group as a whole and for each individual LMU, aimed at keeping this metric at a comfortable level above 100%.
A table including the main components of NSFR is shown below:
Table of Contents
| BBVA. PILLAR 3 2021 | 4. RISKS | P. 185 |
Table 79. EU LIQ2 - Net Stable Funding Ratio (NSFR) (Rounded Million euros. 12-31-2021)
| Unweighted value by residual maturity | Weighted value | |||||||||||||||||||
| No Maturity | < 6 months | 6 months to <1 year | >= 1 year | |||||||||||||||||
Available stable funding (ASF) Items | ||||||||||||||||||||
Capital items and instruments | 51,522 | — | — | 9,477 | 60,999 | |||||||||||||||
Own funds | 51,522 | — | — | 7,283 | 58,805 | |||||||||||||||
Other capital instruments | — | — | 2,194 | 2,194 | ||||||||||||||||
Retail deposits | 226,717 | 2,287 | 1,902 | 215,961 | ||||||||||||||||
Stable deposits | 158,159 | 954 | 552 | 151,709 | ||||||||||||||||
Less stable deposits | 68,558 | 1,334 | 1,350 | 64,252 | ||||||||||||||||
Wholesale funding: | 184,057 | 16,699 | 78,957 | 139,857 | ||||||||||||||||
Operational deposits | 57,873 | — | — | 28,937 | ||||||||||||||||
Other wholesale funding | 126,183 | 16,699 | 78,957 | 110,921 | ||||||||||||||||
Interdependent liabilities | — | — | — | — | ||||||||||||||||
Other liabilities: | 4,111 | 16,623 | 9 | 13,938 | 13,942 | |||||||||||||||
NSFR derivative liabilities | 4,111 | |||||||||||||||||||
All other liabilities and capital instruments not included in the above categories | 16,623 | 9 | 13,938 | 13,942 | ||||||||||||||||
|
| |||||||||||||||||||
Total available stable funding (ASF) | 430,759 | |||||||||||||||||||
|
| |||||||||||||||||||
Required stable funding (RSF) Items | ||||||||||||||||||||
Total high-quality liquid assets (HQLA) | 10,862 | |||||||||||||||||||
Assets encumbered for a residual maturity of one year or more in a cover pool | 1,882 | 1,328 | 21,228 | 20,773 | ||||||||||||||||
Deposits held at other financial institutions for operational purposes | 143 | — | — | 71 | ||||||||||||||||
Performing loans and securities: | 111,432 | 28,309 | 224,063 | 233,874 | ||||||||||||||||
Performing securities financing transactions with financial customers collateralised by Level 1 HQLA subject to 0% haircut | 35,693 | 1,369 | 3,224 | 5,129 | ||||||||||||||||
Performing securities financing transactions with financial customer collateralised by other assets and loans and advances to financial institutions | 13,410 | 2,221 | 7,861 | 10,073 | ||||||||||||||||
Performing loans to non- financial corporate clients, loans to retail and small business customers, and loans to sovereigns, and PSEs, of which: | 50,012 | 19,186 | 127,762 | 203,902 | ||||||||||||||||
With a risk weight of less than or equal to 35% under the Basel II Standardised Approach for credit risk | 2,900 | 1,993 | 19,576 | 49,224 | ||||||||||||||||
Performing residential mortgages, of which: | 2,756 | 2,633 | 71,260 | — | ||||||||||||||||
With a risk weight of less than or equal to 35% under the Basel II Standardised Approach for credit risk | 1,469 | 1,431 | 40,117 | — | ||||||||||||||||
Other loans and securities that are not in default and do not qualify as HQLA, including exchange-traded equities and trade finance on-balance sheet products | 9,561 | 2,900 | 13,956 | 14,770 | ||||||||||||||||
Interdependent assets | — | — | — | — | ||||||||||||||||
Other assets: | — | 33,379 | 939 | 39,959 | 47,428 | |||||||||||||||
Physical traded commodities | 295 | 251 | ||||||||||||||||||
Assets posted as initial margin for derivative contracts and contributions to default funds of CCPs | — | — | 729 | 620 | ||||||||||||||||
NSFR derivative assets | 5,359 | — | — | 5,359 | ||||||||||||||||
NSFR derivative liabilities before deduction of variation margin posted | 13,480 | — | — | 674 | ||||||||||||||||
All other assets not included in the above categories | 14,540 | 939 | 38,935 | 40,524 | ||||||||||||||||
Off-balance sheet items | 4,736 | 1,547 | 103,934 | 6,009 | ||||||||||||||||
|
| |||||||||||||||||||
Total RSF | 319,017 | |||||||||||||||||||
|
| |||||||||||||||||||
Net Stable Funding Ratio (%) | 135 | % | ||||||||||||||||||
|
| |||||||||||||||||||
The table shows a balanced funding structure that maintains a significant volume of retail deposits as the main source of funding for investment activity. This type of funds is characterised by a more favourable treatment for NSFR purposes, given its low sensitivity to market fluctuations and its low volatility in aggregate balances per transaction, as a result of customer linkage. This results in a level of NSFR that comfortably exceeds the regulatory requirement of 100%, with a stable evolution over time.
Table of Contents
| BBVA. PILLAR 3 2021 | 4. RISKS | P. 186 |
4.5.7. Encumbered assets in funding operations
In relation to the management of encumbered liquid assets6, all LMUs maintain adequate positions not only to cover the minimum survival periods in a stress situation, but also uncollateralised wholesale liabilities, which are ultimately the most affected by the ratio of encumbered assets.
All of the Group’s LMUs have implemented procedures and controls to ensure that the risk associated with the management of guarantees and asset assessment are properly identified, controlled and managed in compliance with the Corporate Liquidity and Financing Risk Policy, highlighting: i) monitoring and control scheme for encumbered assets risk indicators, ii) periodic evaluation of stress scenarios as a result of the risk levels achieved, and iii) a contingency plan with action measures based on the degree of criticality and immediacy of the situation.
The impact on the business model of the level of the asset pledging, as well as the importance in the Group’s funding model is low because the funding is based on stable customer deposits, the dependence on short term funding is reduced, and a robust funding structure is maintained, with a moderate level of encumbered assets.
The ratio of encumbered assets to total assets for the main LMUs as of December 31, 2021 is:
Table 80. Committed assets over total assets
BBVA Group | 22 | % | ||
LMU Euro | 27 | % | ||
LMU Mexico | 11 | % | ||
LMU Garanti | 8 | % |
The Group mainly has the following pledging sources:
| • | Guaranteed bonds |
The issuance of guaranteed bonds is one of the main sources of guaranteed funding which give the holders a high degree of protection. Issuances are backed by on-balance sheet assets that are susceptible to being pooled and have a joint guarantee from the Entity that will support the issuance in the event that the underlying assets cannot cope with the payments. The products through which this type of funding is implemented are mortgage-covered bonds, public covered bonds and internationalisation bonds.
| • | Assets sold under repurchase agreement |
Co-financing operations collateralised by assets sold under repurchase agreement are among the short term sources of funding. These operations play an important role in the type of encumbered assets in the Group.
| • | Assets pledged with Central Banks |
The role of central banks as suppliers of liquidity ultimately constitutes one of the key contingent funding resources in the event of there being tensions in the financial markets. In this regard, in accordance with the principles established for management of collateral, the Group’s strategy consists of maintaining broad credit policies with the central banks concerned by pledging assets as collateral in geographical areas where these instruments are used as part of monetary policy.
Additionally, a relevant element is, in the case of the ECB, the non-standard monetary policy measures related to the “Targeted Longer-Term Refinancing Operations” (TLTRO) to provide long-term financing in order to facilitate the credit conditions of the private sector and stimulate financing to the real economy. In this sense, BBVA SA maintained at the end of December 2021 an amount drawn down from the TLTRO III program of €38,392 million.
| • | Management of collateral agreements |
The use of collateral is one of the most effective techniques to mitigate exposure to Credit Risk arising from operations with Derivatives or in operations with repurchase agreements or Value Loans. The assets currently used as collateral are: cash, fixed-income and credit letters.
| • | Securitisation |
The issuance of securitisation represents one of the main potential sources of risk for pledged assets on the balance sheet. According to the type of assets supporting the securitisation, the following classes are issued: residential mortgage-backed securities (RMBS), consumer loans and loans to SMEs. The impact of this pledging source is very low for the Group.
With respect to the products that are subject to overcollateralisation are::
| • | Mortgage-covered bonds. |
These are mortgage bonds issued with first-rank mortgage loan collateral constituted in favour of the bank. In the case of BBVA SA, which accounts for more than 95% of the issuance of mortgage-covered bonds in the Group, the bonds have to be overcollateralised at 125% of their nominal value, and the amount of loans
| 6 | An asset is considered encumbered if it is subject to any form of agreement with the objective of ensuring, collateralizing or improving the credit quality of a transaction, and it cannot be freely removed. |
In any case, the consideration of a committed asset is not based on an explicit legal definition, such as the transfer of a title, but on an economic criterion, so any asset that is subject to any restriction to be used or to replace another asset, is considered pledged.
Table of Contents
| BBVA. PILLAR 3 2021 | 4. RISKS | P. 187 |
that back them cannot be more than 80% of the value of the collateral. The other geographic area that issues these types of product (to a residual extent) is Garanti BBVA.
| • | Public covered bonds. |
Public covered bonds are similar to mortgage-covered bonds. They are backed by loans and credit granted by the issuer to the State, to central and regional governments, local authorities and autonomous bodies that answer to them, as well as other public-sector entities in the European Economic Area. In this case, the issuances have to be overcollateralised at 143% of their nominal value. BBVA SA accounts for 100% of this type of issue.
| • | Internationalisation bonds. |
These are securities guaranteed by loans and credit linked to the financing of contracts for the export of goods and services or to the internationalisation of companies. The level of overcollateralisation is the same as for public covered bonds. BBVA SA accounts for 100% of this type of issue. The weight of this type of issuance is very residual.
Within the Group there are units responsible for the execution, monitoring and control of issuances of this type, as well as the calculation of the capacity for additional issuances, with the aim of ensuring that the Entity is not over-issued and complies with the established limits of the Asset Encumbrance Ratio.
The following table shows assets contributed as collateral (loans) underlying the issuance of mortgage-covered bonds, public covered bonds and internationalisation bonds, as well as the total issued and excess issuance capacity as of December 31, 2021:
Table 81. Mortgage-covered bonds (Million Euros. 12-31-2021)
Withheld | ||||
Withheld applied | 22,000 | |||
Withheld not applied | 500 | |||
Issued to Market | 9,399 | |||
Total mortgage-covered bonds issued | 31,899 | |||
Eligible collateral to consider | 43,963 | |||
Maximum to issue | 35,170 | |||
Capacity to issue | 3,271 |
Table 82. Public-covered bonds (Million Euros. 12-31-2021)
Withheld | ||||
Withheld applied | 6,040 | |||
Withheld not applied | — | |||
Issued to Market | 500 | |||
Total mortgage-covered bonds issued | 6,540 | |||
Eligible collateral to consider | 12,789 | |||
Maximum to issue | 8,952 | |||
Capacity to issue | 2,412 |
Table 83. Internationalisation-covered bonds. (Million Euros. 12-31-2021)
Withheld | ||||
Withheld applied | 1,500 | |||
Withheld not applied | — | |||
Issued to Market | — | |||
Total internationalisation-covered bonds issued | 1,500 | |||
Eligible collateral to consider | 3,524 | |||
Maximum to issue | 2,467 | |||
Capacity to issue | 967 |
The assets on the balance sheet and the collaterals received that, as of December 31, 2021, are encumbered (provided as collateral or guarantee with respect to certain liabilities), as well as the collateral that is unencumbered, are shown below. It should be noted that the value used for the purpose of this disclosure is the carrying amount and fair value, for both the assets on the balance sheet and the pledged and unpledged guarantees received. The balances are calculated as annual medians using as a sample the four quarters of the last year.
Table of Contents
| BBVA. PILLAR 3 2021 | 4. RISKS | P. 188 |
Table 84. EU AE1 - Encumbered and unencumbered Assets (Million Euros. 12-31-2021)
| Carrying value of encumbered assets | Fair value of encumbered assets | Carrying value of unencumbered assets | Fair value of unencumbered assets | |||||||||||||||||||||||||||||
| of which notionally eligible EHQLA and HQLA | of which notionally eligible EHQLA and HQLA | of which EHQLA and HQLA | of which EHQLA and HQLA | |||||||||||||||||||||||||||||
Institution’s assets | 117,018 | 34,599 | 521,374 | 108,160 | ||||||||||||||||||||||||||||
|
|
|
|
|
|
|
|
|
|
|
|
|
|
|
| |||||||||||||||||
Equity instruments | 1,740 | 1,313 | 1,740 | 1,740 | 14,297 | 6,799 | 14,297 | 6,799 | ||||||||||||||||||||||||
Debt securities | 34,773 | 33,286 | 32,558 | 32,049 | 75,278 | 48,441 | 77,008 | 49,542 | ||||||||||||||||||||||||
Of which: covered bonds | 39 | 30 | 38 | 38 | 258 | 254 | 258 | 254 | ||||||||||||||||||||||||
Of which: ABSs | 15 | — | 15 | — | 172 | — | 171 | — | ||||||||||||||||||||||||
Of which: issued by general governments | 30,201 | 30,099 | 27,829 | 27,610 | 65,454 | 45,906 | 67,322 | 46,990 | ||||||||||||||||||||||||
Of which: issued by financial corporations | 1,304 | 749 | 1,430 | 1,149 | 4,274 | 551 | 4,143 | 551 | ||||||||||||||||||||||||
Of which: issued by non- financial corporations | 2,961 | 2,096 | 2,967 | 2,767 | 2,601 | 779 | 2,594 | 793 | ||||||||||||||||||||||||
Loans and Other assets | 81,379 | — | 434,127 | 55,565 | ||||||||||||||||||||||||||||
Of which: Loans and advances | 81,379 | — | 348,581 | 47,226 | ||||||||||||||||||||||||||||
Of which: Other assets | — | — | 74,629 | 6,128 | ||||||||||||||||||||||||||||
Encumbered and unencumbered Assets (Million Euros. 12-31-2020)
| Carrying value of encumbered assets | Fair value of encumbered assets | Carrying value of unencumbered assets | Fair value of unencumbered assets | |||||||||||||||||||||||||||||
| of which notionally eligible EHQLA and HQLA | of which notionally eligible EHQLA and HQLA | of which EHQLA and HQLA | of which EHQLA and HQLA | |||||||||||||||||||||||||||||
Institution’s assets | 122,054 | 31,223 | 593,490 | 144,764 | ||||||||||||||||||||||||||||
|
|
|
|
|
|
|
|
|
|
|
|
|
|
|
| |||||||||||||||||
Equity instruments | 2,231 | 1,495 | 6,073 | 2,684 | ||||||||||||||||||||||||||||
Debt securities | 31,409 | 30,159 | 28,149 | 30,159 | 82,078 | 74,084 | 85,229 | 75,078 | ||||||||||||||||||||||||
Of which: covered bonds | 72 | 63 | 72 | 63 | 592 | 592 | 591 | 591 | ||||||||||||||||||||||||
Of which: ABSs | 31 | — | 36 | — | 220 | — | 214 | — | ||||||||||||||||||||||||
Of which: issued by general governments | 26,642 | 26,642 | 23,210 | 23,210 | 67,528 | 64,679 | 70,841 | 65,630 | ||||||||||||||||||||||||
Of which: issued by financial corporations | 2,238 | 1,650 | 2,409 | 1,650 | 8,988 | 5,738 | 8,824 | 5,826 | ||||||||||||||||||||||||
Of which: issued by non- financial corporations | 2,860 | 1,967 | 2,864 | 1,967 | 2,598 | 768 | 2,589 | 784 | ||||||||||||||||||||||||
Loans and Other assets | 91,156 | — | 506,019 | 64,394 | ||||||||||||||||||||||||||||
Of which: Loans and advances | 87,939 | — | 397,392 | 55,091 | ||||||||||||||||||||||||||||
Of which: Other assets | — | — | 105,139 | 5,780 | ||||||||||||||||||||||||||||
Table 85. EU AE2 - Collateral received (Million Euros. 12-31-2021)
| Fair value of encumbered collateral received or own debt securities issued | Fair value of collateral received or own debt securities issued available for encumbrance | |||||||||||||||
| of which notionally eligible EHQLA and HQLA | of which EHQLA and HQLA | |||||||||||||||
Collateral received | 33,832 | 31,025 | 12,833 | 5,644 | ||||||||||||
Loans on demand | — | — | — | — | ||||||||||||
Equity instruments | 247 | 90 | 257 | 169 | ||||||||||||
Debt securities | 33,585 | 30,903 | 12,565 | 5,407 | ||||||||||||
Of which: covered bonds | 472 | 122 | 262 | 3 | ||||||||||||
Of which: ABSs | — | — | 159 | — | ||||||||||||
Of which: issued by general governments | 30,491 | 30,155 | 8,516 | 5,326 | ||||||||||||
Of which: issued by financial corporations | 2,233 | 526 | 2,792 | 48 | ||||||||||||
Of which: issued by non- financial corporations | 901 | 178 | 1,257 | 46 | ||||||||||||
Loans and advances other than loans on demand | — | — | — | — | ||||||||||||
Other collateral received | — | — | — | — | ||||||||||||
Own debt securities issued other than own mortgage-covered bonds or ABSs | 9 | — | 66 | — | ||||||||||||
Own mortgage-covered bonds and ABSs issued and not yet pledged | 15,288 | — | ||||||||||||||
Total assets, collateral received and own debt securities issued | 154,453 | 66,375 | ||||||||||||||
Table of Contents
| BBVA. PILLAR 3 2021 | 4. RISKS | P. 189 |
Collateral received (Million Euros. 12-31-2020)
| Fair value of encumbered collateral received or own debt securities issued | Fair value of collateral received or own debt securities issued available for encumbrance | |||||||||||||||
| of which notionally eligible EHQLA and HQLA | of which EHQLA and HQLA | |||||||||||||||
Collateral received | 38,879 | 35,352 | 7,590 | 4,455 | ||||||||||||
Loans on demand | — | — | — | — | ||||||||||||
Equity instruments | 220 | 111 | 199 | 158 | ||||||||||||
Debt securities | 38,659 | 35,233 | 7,410 | 4,327 | ||||||||||||
Of which: covered bonds | 823 | 143 | 25 | 2 | ||||||||||||
Of which: ABSs | — | — | 24 | — | ||||||||||||
Of which: issued by general governments | 32,065 | 30,628 | 4,240 | 3,980 | ||||||||||||
Of which: issued by financial corporations | 5,115 | 2,085 | 2,400 | 535 | ||||||||||||
Of which: issued by non- financial corporations | 1,260 | 259 | 530 | 42 | ||||||||||||
Loans and advances other than loans on demand | — | — | — | — | ||||||||||||
Other collateral received | — | — | — | — | ||||||||||||
Own debt securities issued other than own mortgage-covered bonds or ABSs | — | — | 112 | — | ||||||||||||
Own mortgage-covered bonds and ABSs issued and not yet pledged | 11,141 | — | ||||||||||||||
|
|
|
|
|
|
|
| |||||||||
Total assets, collateral received and own debt securities issued | 162,044 | 68,860 | ||||||||||||||
|
|
|
|
|
|
|
| |||||||||
The pledging sources with associated collateral as of December 31, 2021 are below:
Table 86. EU AE3 - Sources of encumbrance (Million Euros. 12-31-2021)
| Matching liabilities, contingent liabilities or securities lent | Assets, collateral received and own securities issued other than mortgage-covered bonds, public- covered bonds and ABSs encumbered | |||||||
Carrying amount of selected financial liabilities | 134,418 | 150,689 | ||||||
|
|
|
| |||||
Derivatives | 14,924 | 15,534 | ||||||
Repos and other collateralised deposits | 107,202 | 119,738 | ||||||
Debt securities | 12,477 | 15,261 | ||||||
Other sources of encumbrance | 634 | 3,769 | ||||||
Sources of encumbrance (Million Euros. 12-31-2020)
| Matching liabilities, contingent liabilities or securities lent | Assets, collateral received and own securities issued other than mortgage-covered bonds, public- covered bonds and ABSs encumbered | |||||||
Carrying amount of selected financial liabilities | 138,902 | 156,573 | ||||||
|
|
|
| |||||
Derivatives | 18,165 | 16,700 | ||||||
Repos and other collateralised deposits | 104,618 | 121,009 | ||||||
Debt securities | 17,818 | 21,671 | ||||||
Other sources of encumbrance | 516 | 5,472 | ||||||
The assets without associated liabilities shown in the table above correspond to guarantees given to be able to operate in certain markets, as well as assets mainly
encumbered in security lending operations. The collateral received off the balance sheet is mostly reverse repurchase agreements, of sovereign securities.
BBVA defines operational risk (“OR”) as any risk that could result in losses caused by human error; inadequate or flawed internal processes; undue conduct with respect to customers, markets or the institution; antimoney laundering and financing of terrorist activities; failures, interruptions or flaws in systems
or communications; theft, loss or wrong use of information, as well as deterioration of its quality, internal or external fraud, including in any case those derived from cyberattacks; theft or harm to assets or persons; legal risks; risks derived from staff management and labor health; and defective service provided by suppliers; as well as damages from extreme climate events, pandemics and other natural disasters.
Table of Contents
| BBVA. PILLAR 3 2021 | 4. RISKS | P. 190 |
Operational risk management is oriented towards the identification of the root causes to avoid their occurrence and mitigate possible consequences. This is carried out through the establishment of control framework and monitoring and the development of mitigation plans aimed at minimizing resulting economic and reputational losses and their impact on the recurrent generation of results, and contributing the increase the quality, safety and availability of the provided service. Operational risk management is integrated into the global risk management structure of the BBVA Group.
4.6.1. Operational risk management principles
The BBVA Group is committed to preferably applying advanced operational risk management models, regardless of the capital calculation regulatory model applicable at the time. Operational risk management at the BBVA Group shall:
| • | Be aligned with the Risk Appetite Framework ratified by the BBVA Board of Directors. |
| • | Address BBVA’s management needs in terms of compliance with legislation, regulations and industry standards, as well as the decisions or positioning of BBVA’s corporate bodies. |
| • | Anticipate the potential operational risk to which the Group may be exposed as a result of the creation or modification of products, activities, processes or systems, as well as decisions regarding the outsourcing or hiring of services, and establish mechanisms to assess and mitigate risk to a reasonable extent prior to implementation, as well as review the same on a regular basis. |
| • | Establish methodologies and procedures to enable regular reassessment of the significant operational risk to which the Group is exposed, in order to adopt appropriate mitigation measures in each case, once the identified risk and the cost of mitigation (cost/benefit analysis) have been considered, while safeguarding the Group’s solvency at all times. |
| • | Promote the implementation of mechanisms that support careful monitoring of all sources of operational risk and the effectiveness of mitigation and control environments, fostering proactive risk management. |
| • | Examine the causes of any operational events suffered by the Group and establish means to prevent the same, provided that the cost/ benefit analysis so recommends. To this end, procedures must be in place to evaluate operational events and mechanisms and to record the operational losses that may be caused by the same. |
| • | Evaluate key public events that have generated operational risk losses at other institutions in |
the financial sector and support, where appropriate, the implementation of measures as required to prevent them from occurring at the Group. |
| • | Identify, analyze and attempt to quantify events with a low probability of occurrence and a high impact, which by their exceptional nature may not be included in the loss database; or if they are, feature with impacts that are not very representative for the purpose of valuing possible mitigation measures. |
| • | Have an effective system of governance in place, where the functions and responsibilities of the corporate areas and bodies involved in operational risk management are clearly defined. |
| • | Operational risk management must be performed in coordination with management of other risk, taking into consideration credit or market events that may have an operational origin. |
4.6.2. Operational risk management model
The operational risk management cycle at BBVA is similar to the one implemented for the rest of risks. Its elements are:.
Table of Contents
| BBVA. PILLAR 3 2021 | 4. RISKS | P. 191 |
Chart 17. Operational Risk Management Processes

Operational risk management parameters
Operational risk forms part of the risk appetite framework of the Group and includes three types of metrics and limits:
| • | Economic capital calculated with the operational losses database of the Group, considering the corresponding diversification effects and the additional estimation of potential and emerging risks through stress scenarios designed for the main types of risks. The economic capital is regularly calculated for the main banks of the Group and simulation capabilities are available to anticipate the impact of changes on the risk profile or new potential events. |
| • | ORI metrics (Operational Risk Indicator: operational risk losses vs. gross income) broken down by geography, business area and type of risk. |
| • | Indicators by risk type: a more granular common scheme of metrics (indicators and limits) covering the main types of operational risk is being implemented throughout the Group. These metrics make it possible to intensify the anticipatory management of risk and objectify the appetite to different sources. These indicators are regularly reviewed and adjusted to fix the main risks in force at any time. |
Operational risk admission
The main purposes of the operational risk admission phase are the following:
| • | To anticipate potential operational risk to which the Group may be exposed due to the release of new, or modification of existing, products, activities, processes or systems, as well as purchasing decisions (e.g. outsourcing). |
| • | To ensure that implementation and the roll out of initiatives is only performed once appropriate mitigation measures have been taken in each case, including external assurance of risks where deemed appropriate. |
The Corporate Non-Financial Risk Management Policy sets out the specific operational risk admission
Table of Contents
| BBVA. PILLAR 3 2021 | 4. RISKS | P. 192 |
framework through different committees, both at a corporate and Business Area level, that follow a delegation structure based on the risk level of proposed initiatives.
Operational risk monitoring
The purpose of this phase is to check that the target operational risk profile of the Group is within the authorized limits. Operational risk monitoring considers 2 scopes:
| • | Monitoring the operational risk admission process, oriented towards checking that accepted risks levels are within the limits and that defined controls are effective. |
| • | Monitoring the operational risk “stock” mainly associated with processes. This is done by carrying out a periodic re-evaluation in order to generate and maintain an updated map of the relevant operational risks in each Area, and evaluate the adequacy of the monitoring and mitigation environment for said risks. This promotes the implementation of action plans to redirect the weaknesses detected. |
This process is supported by a corporate Governance, Risk & Compliance tool that monitors the operational risk at a local level and its aggregation at a corporate level.
In addition, and in line with the best practices and recommendations provided by the Bank for International Settlements (hereinafter, BIS), BBVA has procedures to collect the operational losses occurred both in the different entities of the Group and in other financial groups, with the appropriate level of detail to carry out an effective analysis that provides useful information for management purposes and to contrast the consistency of the Group’s operational risks map. To that end, a corporate tool of the Group is used.
The Group ensures continuous monitoring by each Area of the due functioning and effectiveness of the control environment, taking into consideration management indicators established for the Area, any events and losses that have occurred, as well as the results of actions taken by the second line of defense, the internal audit unit, supervisors or external auditors.
Operational risk mitigation
The Group promotes the proactive mitigation of the financial risks to which it is exposed and which are identified in the monitoring activities.
In order to rollout common monitoring and anticipated mitigation practices throughout the Group, several cross-sectional plans are being promoted related to focuses from events, lived by the Group or by the industry, self-assessments and recommendations from auditors and supervisors in different geographies, thereby analyzing the best practices at these levels and
fostering comprehensive action plans to strengthen and standardize the control environment.
Operational risk insurance
Insurance is one of the possible options for managing the operational risk to which the Group is exposed, and mainly has two potential purposes:
| • | Coverage of extreme situations linked to recurrent events that are difficult to mitigate or can only be partially mitigated by other means. |
| • | Coverage of non-recurrent events that could have significant financial impact, if they occurred. |
The Group has a general framework that regulates this area, and allows systematizing risk assurance decisions, aligning insurance coverage with the risks to which the Group is exposed and reinforcing governance in the decision-making process of arranging insurance policies.
4.6.3. Operational risk governance
BBVA Group’s operational risk governance model is based on two components:
| • | Three-line defense control model, in line with industry best practices, and which guarantees compliance with the most advanced operational risk internal control standards. |
| • | Scheme of Corporate Assurance Committees and Internal Control and Operational Risk Committees at the level of the different business and support areas. |
Corporate Assurance establishes a structure of committees, both at local and corporate level, to provide senior management with a comprehensive and homogeneous vision of the main non-financial risks and significant situations of the control environment. The aim is to support rapid decision-making with foresight, for the mitigation or assumption of the main risks.
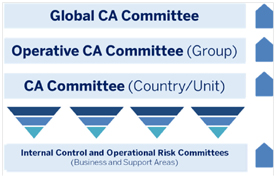
Table of Contents
| BBVA. PILLAR 3 2021 | 4. RISKS | P. 193 |
Each geography has a Corporate Assurance Committee chaired by the Country Manager and whose main functions are:
| • | Monitoring the changes in the non-financial risks and their alignment with the defined strategies and policies and the risk appetite. |
| • | Analyzing and assessing controls and measures established to mitigate the impact of the risks identified, should they materialize. |
| • | Making decisions about the proposals for risk taking that are conveyed by the working groups or that arise in the Committee itself |
| • | Promoting transparency by promoting the proactive participation of the three lines of defense in discharging their responsibilities and the rest of the organization in this area |
At the holding level there is a Global Corporate Assurance Committee, chaired by the Group’s Chief Executive Officer. Its main functions are similar to those already described but applicable to the most important issues that are escalated from the geographies and the holding company areas.
The business and support areas have an Internal Control and Operational Risk Committee, whose purpose is to ensure the due implementation of the operational risk management model within its scope of action and drive active management of such risk, taking mitigation decisions when control weaknesses are identified and monitoring the same.
Additionally, the Non-Financial Risk unit periodically reports the status of the management of non-financial risks in the Group to the Board’s Risk and Compliance Committee.
4.6.4. Methods used for calculating capital
All Group entities apply the standard method for calculating their capital requirements for operational
risk, except for Bolivia and the international subsidiaries of Garanti Bank, for which the basic method is applied.
Both the basic and standard methods use fixed parameters to calculate regulatory capital for operational risk:
| • | Basic method: according to Chapter 2 of Title III of the CRR, the capital requirement for operational risk using the basic method is calculated as the three-year average of relevant income multiplied by a single factor established by the Regulator, which amounts to 15%. The sum of the following elements of the profit and loss account is defined as relevant income: |
| • | Income from interest and other similar income |
| • | Interest expense and other similar charges |
| • | Return on equities and other fixed- or variable-income securities |
| • | Fees receivable |
| • | Fees payable |
| • | Net trading income |
| • | Other operating income |
| • | Standard method: according to Chapter 3 of Title III of the CRR, capital requirement for operational risk using the standard method is calculated as the three-year average of relevant income multiplied by a factor established by the Regulator for each line of business. |
The following table shows the operational risk capital requirements broken down according to the calculation models used and by geographic area, to provide a global vision of capital consumption for this type of risk:
Table 87. EU OR1 - Regulatory capital for Operational Risk (Million Euros)
| Relevant indicator | Own funds requirements | Risk weighted exposure amount | ||||||||||||||||||
Banking activities | Year-3 | Year-2 | Last year | |||||||||||||||||
Banking activities subject to basic indicator approach (BIA) | 327 | 636 | 233 | 60 | 748 | |||||||||||||||
Banking activities subject to standardised (TSA) / alternative standardised (ASA) approaches | 18,352 | 20,386 | 17,633 | 2,467 | 30,841 | |||||||||||||||
Subject to TSA: | 18,352 | 20,386 | 17,633 | |||||||||||||||||
Subject to ASA: | — | — | — | |||||||||||||||||
Banking activities subject to advanced measurement approaches AMA | — | — | — | — | — | |||||||||||||||
|
|
|
| |||||||||||||||||
Total December 2021 | 2,527 | 31,589 | ||||||||||||||||||
|
|
|
| |||||||||||||||||
Total December 2020 | 2,853 | 35,656 | ||||||||||||||||||
|
|
|
| |||||||||||||||||
Table of Contents
| BBVA. PILLAR 3 2021 | 4. RISKS | P. 194 |
During 2021 there has been a reduction in capital requirements for operational of €326 million, mainly due to the following effects:
| • | The sale of BBVA USA and BBVA Paraguay, which have contributed to reduce the operational risk capital by approximately €360 million. |
| • | Currency fluctuations during the period have contributed to reduce capital for operational risk by approximately €120 million, mainly due to the depreciation of the Turkish lira, partially offset by the appreciation of the Mexican peso. |
| • | The other variations contribute to increasing the operational risk capital by approximately €154 million, which is explained by the growth in revenues compared to previous periods in general throughout the Group, mainly in Turkey, Latin America and Mexico. |
4.6.5. Group’s operational risk profile
BBVA’s operational risk profile by risk type in 2021 is as follows:
Chart 18. Operational Risk Profile of BBVA Group
Table of Contents
| BBVA. PILLAR 3 2021 | 4. RISKS | P. 195 |
The following charts reflect the distribution of operational losses by risk class and country for 2021.
Chart 19. Operational Risk by risk and country
| * | During 2021, there was a release of provisions for External Fraud in Spain, as well as recoveries in Disasters. There is no percentage for these categories. |
| * | In the year 2021, in Turkey there has been a release of provisions for Commercial practices in excess of total operational losses. Therefore, the category does not indicate any percentage value.. |
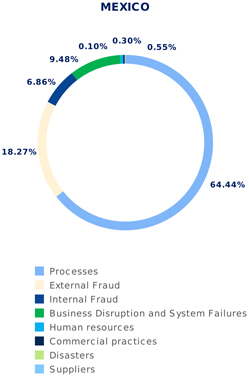
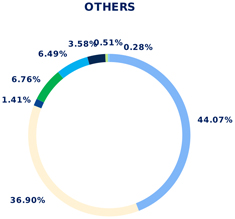
| * | This chart includes the operating losses between January and May from the USA subsidiary, which was sold in June 2021.. |
Table of Contents
| BBVA. PILLAR 3 2021 | 5. LEVERAGE RATIO | P. 196 |
5.1. | 198 | |||||
5.2. | 200 | |||||
5.3. | 201 | |||||
Table of Contents
| BBVA. PILLAR 3 2021 | 5. LEVERAGE RATIO | P. 197 |
5.1. Leverage Ratio definition and composition
The leverage ratio (LR) is a regulatory measure (not risk-based) complementing capital designed to guarantee the soundness and financial strength of institutions in terms of indebtedness.
CRR II introduces a mandatory minimum leverage ratio requirement, set at 3% of Tier 1 capital over the total exposure measure.
However, institutions that decide to exclude central bank exposures from the total exposure measure must recalibrate upwards this 3% minimum requirement such that only recently accumulated central bank exposures (only the increase in central bank exposures since the end of 2019) effectively benefit from leverage ratio relief. This exclusion applies until March 31, 2022.
Described below are the elements making up the leverage ratio, in accordance with CRR II:
| • | Tier 1 capital (letter i in the following table): Section 3.2. of this Document presents details of the eligible own funds, calculated based on the criteria defined in the CRR. |
| • | Total Exposure: As set out in Article 429 of the CRR, the total exposure measure generally follows the book value subject to the following considerations: |
| • | On-balance sheet exposure other than derivatives is included net of allowances and accounting valuation adjustments. |
| • | The measure of the Group’s total exposure is composed of the total assets as per financial statements adjusted for reconciliation between the accounting perimeter and the prudential perimeter. |
Total exposure for the purpose of calculating the leverage ratio is composed by the sum of the exposure values of:
| • | Assets: the exposure value of an asset item will be its accounting value remaining after the application of specific credit risk adjustments. In general terms, securities financing transactions will not be compensated except for certain conditions. |
| • | Derivatives contracts: the Entity calculates the exposure value of derivatives contracts in accordance with the standard method of counterparty risk (SA-CCR). When calculating the exposure value, the effects of compensation agreements (netting) will be taken into account. For the purposes of calculating the exposure value, collateral received will not be included, except under certain conditions. |
| • | Add-ons for counterparty credit risk of securities financing transactions (SFTs): in addition to the calculation of the exposure value of securities financing transactions, included in the first point, the total exposure measure shall include an add-on due to counterparty credit risk in accordance with article 429e of the CRR II |
| • | Off-balance sheet items: these correspond to risk and contingent liabilities and commitments, mainly collateral and undrawn balances. A minimum floor is applied to conversion factors (CCFs) of 10% in line with the provisions of the Article 429f (3) of CRR II. |
| • | Regular-way purchases or sales awaiting settlement. |
The exposures excluded from the total exposure measure are:
| • | Tier 1 deductions: all those amounts of assets that have been deducted in the determination of the eligible Tier 1 capital are deducted, in order not to duplicate exposure. The main deductions are intangible assets, loss carry forwards and other deductions defined in Article 36 of CRR II and indicated in section 3.2 of this report. |
| • | Additionally, as of 31 December 2021, the temporary exemption of certain exposures to central banks is included. |
The table below shows a breakdown of the items making up the leverage ratio as of December 31, 2021 and December 31, 2020.
Table of Contents
| BBVA. PILLAR 3 2021 | 5. LEVERAGE RATIO | P. 198 |
Table 88. EU LR1 - Summary reconciliation of accounting assets and exposure corresponding to the Leverage Ratio (Million Euros)
Summary table of accounting assets and leverage ratio exposure | 12-31-2021 Phased-In | 12-31-2021 Fully Loaded | 9-30-2021 Phased-In | 9-30-2021 Fully Loaded | 31-12-2020 Phased-In | 31-12-2020 Fully Loaded | ||||||||||||||||||
(a) Total assets as published financial statements | 662,885 | 662,885 | 651,834 | 651,834 | 736,176 | 736,176 | ||||||||||||||||||
(b) Adjustment for entities which are consolidated for accounting purposes but are outside the scope of regulatory consolidation | (21,373 | ) | (21,373 | ) | (21,108 | ) | (21,108 | ) | (20,326 | ) | (20,326 | ) | ||||||||||||
(Adjustment for securitised exposures that meet the operational requirements for the recognition of risk transference) | (1,899 | ) | (1,899 | ) | (2,096 | ) | (2,096 | ) | — | — | ||||||||||||||
(Adjustment for temporary exemption of exposures to central bank (if applicable)) | (33,747 | ) | (33,747 | ) | (24,382 | ) | (24,382 | ) | (26,456 | ) | (26,456 | ) | ||||||||||||
(Adjustment for fiduciary assets recognised on the balance sheet pursuant to the applicable accounting framework but excluded from the leverage ratio total exposure measure in accordance with Article 429a(1)(i) of Regulation (EU) No 575/2013) | — | — | — | — | — | — | ||||||||||||||||||
Adjustment for regular-way purchases and sales of financial assets subject to trade date accounting | — | — | — | — | — | — | ||||||||||||||||||
Adjustment for eligible cash pooling transactions | — | — | — | — | — | — | ||||||||||||||||||
(c) Adjustments for derivative financial instruments | (6,311 | ) | (6,311 | ) | (10,014 | ) | (10,014 | ) | (13,858 | ) | (13,858 | ) | ||||||||||||
(d) Adjustments for securities financing transactions “SFTs” | 12,686 | 12,686 | 10,647 | 10,647 | 1,992 | 1,992 | ||||||||||||||||||
(e) Adjustment for off-balance sheet items(1) | 64,107 | 64,107 | 62,739 | 62,739 | 67,758 | 67,758 | ||||||||||||||||||
(Adjustment for prudent valuation adjustments and general credit risk adjustments which have reduced Tier 1 capital) | — | — | — | — | — | — | ||||||||||||||||||
(f) (Adjustment for intragroup exposures excluded from the leverage ratio exposure measure in accordance with Article 429 (7) of Regulation (EU) No 575/2013) | — | — | — | — | — | — | ||||||||||||||||||
(g) (Adjustment for exposures excluded from the total exposure measure corresponding to the leverage ratio under Article 429(14) of Regulation (EU) No 575/2013) | — | — | — | — | — | — | ||||||||||||||||||
(h) Other adjustments | (4,558 | ) | (5,323 | ) | (3,759 | ) | (4,524 | ) | (4,191 | ) | (5,788 | ) | ||||||||||||
|
|
|
|
|
|
|
|
|
|
|
| |||||||||||||
Leverage ratio total exposure measure | 671,790 | 671,025 | 663,861 | 663,096 | 741,095 | 739,497 | ||||||||||||||||||
|
|
|
|
|
|
|
|
|
|
|
| |||||||||||||
i) Capital Tier 1 | 45,687 | 44,922 | 50,329 | 49,564 | 49,597 | 48,012 | ||||||||||||||||||
|
|
|
|
|
|
|
|
|
|
|
| |||||||||||||
Leverage ratio | 6.80 | % | 6.69 | % | 7.58 | % | 7.47 | % | 6.69 | % | 6.49 | % | ||||||||||||
|
|
|
|
|
|
|
|
|
|
|
| |||||||||||||
| (1) | Corresponds to the off-balance sheet exposure after applying the conversion factors obtained in accordance with Article 429(10) of the CRR. |
The full series of the reconciliation of the leverage ratio exposure, during the year 2021, is available in the editable file “Pillar 3 2021 - Tables & Annexes”.
Table 89. LR3 - Leverage ratio common disclosure (Millon euros. 12-31-2021)
| 12-31-2021 Phased-In | 12-31-2021 Fully Loaded | 6-30-2021 Phased-In | 6-30-2021 Fully Loaded | 12-31-2020 Phased-In | 12-31-2020 Fully Loaded | |||||||||||||||||||
Total on-balance sheet exposures (excluding derivatives, SFTs, and exempted exposures), of which: | 516,179 | 532,491 | 532,491 | 532,491 | 610,800 | 610,800 | ||||||||||||||||||
Trading book exposures | 41,234 | 38,722 | 38,722 | 38,722 | 35,149 | 35,149 | ||||||||||||||||||
Banking book exposures, of which: | 474,945 | 493,769 | 493,769 | 493,769 | 575,652 | 575,652 | ||||||||||||||||||
Covered bonds | 405 | 172 | 172 | 172 | 183 | 183 | ||||||||||||||||||
Exposures treated as sovereigns | 117,682 | 137,889 | 137,889 | 137,889 | 146,923 | 146,923 | ||||||||||||||||||
Exposures to regional governments, MDB, international organisations and PSE not treated as sovereigns | 8,396 | 6,362 | 6,362 | 6,362 | 19,221 | 19,221 | ||||||||||||||||||
Institutions | 16,856 | 19,969 | 19,969 | 19,969 | 39,424 | 39,424 | ||||||||||||||||||
Secured by mortgages of immovable properties | 100,550 | 94,555 | 94,555 | 94,555 | 103,285 | 103,285 | ||||||||||||||||||
Retail exposures | 71,193 | 71,332 | 71,332 | 71,332 | 73,199 | 73,199 | ||||||||||||||||||
Corporates | 118,158 | 118,032 | 118,032 | 118,032 | 149,552 | 149,552 | ||||||||||||||||||
Exposures in default | 4,937 | 6,406 | 6,406 | 6,406 | 8,493 | 8,493 | ||||||||||||||||||
Other exposures (eg equity, securitisations, and other non-credit obligation assets) | 36,769 | 39,051 | 39,051 | 39,051 | 35,372 | 35,372 | ||||||||||||||||||
Table of Contents
| BBVA. PILLAR 3 2021 | 5. LEVERAGE RATIO | P. 199 |
As of December 31, 2021, the leverage ratio stands at 6.80% (6.69% in fully loaded terms), decreasing by 78 basis points compared to September 2021. This drop is mainly due to the decrease in capital Tier 1 that has contributed negatively by 69 basis points to the leverage ratio, affected, among others, by the deduction of the maximum amount authorized by the ECB within the share buyback program (see explanation in table 1). For its part, the total exposure increased by approximately €7.9 billion euros, which represents a negative impact of 9 basis points on the leverage ratio.
Additionally, during the first 9 months of the year there have been two unique effects that have contributed to the leverage ratio increasing by 11 basis points compared to December 31, 2020 (6.69% phased-in): the sale of BBVA USA and BBVA Paraguay; and the cancellation of an issuance of preference shares eventually convertible into ordinary BBVA shares (Contingent Convertible bonds, also known as CoCos), for a value of €1 billion during the first quarter.
Regarding exposures excluded from the total exposure measure and in accordance with Regulation (EU) 2019/876, which modifies the CRR, certain exposures to central banks and certain securitized exposures are excluded. If this exclusion is not made, the total exposure (phased-in) would amount to €705,537 million, with a phased-in leverage ratio of 6.48% (6.37% in fully loaded terms).
The complete series of exposures to the leverage ratio, during the year 2021, is available in the editable file “Pillar 3 2021 - Tables & Annexes”.
It should also be noted that since June 2021, the exposure value of the derivative contracts included in the total exposure is calculated in accordance with the standardized approach for counterparty risk (SA-CCR).
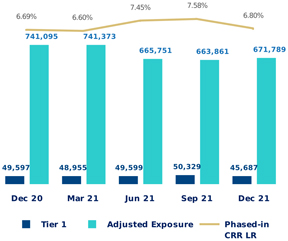
Table of Contents
| BBVA. PILLAR 3 2021 | 5. LEVERAGE RATIO | P. 200 |
The activities making up the Group’s regulatory reporting include monthly measurement and control of the leverage ratio by assessing and monitoring this measure in its more restrictive version (fully loaded), to guarantee that leverage remains far from the minimum levels (which could be considered risky levels), without undermining the return on investment.
The estimates and the evolution of the leverage ratio are reported on a regular basis to different governing bodies and committees to guarantee adequate monitoring of the entity’s leverage levels and ongoing monitoring of the main capital indicators, which allow to control the risk of excessive leverage.
In line with the risk appetite framework and structural risk management, the Group operates by establishing limits and operational measures to achieve a sustainable development and growth of the balance sheet, maintaining tolerable risk levels at all times. This can be seen in the fact that the regulatory leverage level itself is well above the minimum required levels.
Table of Contents
| BBVA. PILLAR 3 2021 | 6. INFORMATION ON REMUNERATION | P. 201 |
6. Information on remuneration
Table of Contents
| BBVA. PILLAR 3 2021 | 6. INFORMATION ON REMUNERATION | P. 202 |
In accordance with the provisions of article 85 of Act 10/2014 of June 26, on the regulation, supervision and solvency of credit institutions (“Act 10/2014”) and article 93 of Royal Decree 84/2015 of February 13, implementing said Act (“Royal Decree 84/2015”), and pursuant to the provisions of the Bank of Spain Circular 2/2016 of February 2, to credit institutions on supervision and solvency, completing the adaptation of the Spanish legal system to Directive 2013/36/EU and Regulation (EU) No. 575/2013 (the “Bank of Spain Circular 2/2016”), credit institutions shall provide the public with and update periodically, and at least once a year, inter alia, information concerning their remuneration policies and practices established in section eight of Regulation 575/2013/EU, in relation to those categories of staff whose professional activities have a significant impact on the risk profile of the institution and/or its consolidated group (the “Identified Staff” or “Risk Takers”).
Table of Contents
| BBVA. PILLAR 3 2021 | 6. INFORMATION ON REMUNERATION | P. 203 |
6.1. Information on the decision-making process used to establish the remuneration policy for the Identified Staff
In accordance with the provisions contained in the Bylaws of BBVA (“BBVA”, the “Institution” or the “Bank”), the BBVA Board of Directors Regulations grant the Board the powers, among others, to approve the remuneration policy for directors, for submission to the General Shareholders’ Meeting, that of senior management and the rest of the Identified Staff, as well as the determination of the remuneration of non-executive directors; and, in the case of executive directors, the corresponding remuneration for their executive functions and the remaining conditions to be respected in their contracts.
In addition, among the Committees constituted to support the Board in carrying out its duties, the Remuneration Committee is the body which assists it in remuneration matters related to its directors, senior management and the rest of the Identified Staff, ensuring observance of the remuneration policies established.
Thus, in accordance Article 5 of the Remuneration Committee Regulations, and without prejudice to any other functions assigned to it by law, the internal rules of the Bank or assigned to it by decision of the Board of Directors, the Remuneration Committee performs, on a general basis, the following functions:
| 1. | Propose the directors’ remuneration policy to the Board of Directors, for submission to the General Shareholders’ Meeting, likewise submitting the corresponding report, in the terms established by applicable law at any time. |
| 2. | Determine the remuneration of non-executive directors, as provided for in the directors’ remuneration policy, submitting the corresponding proposals to the Board. |
| 3. | Determine the extent and amount of individual remunerations, rights and other economic rewards, as well as the remaining contractual conditions for executive directors, so that these can be contractually agreed, in line with the directors’ remuneration policy, submitting the corresponding proposals to the Board of Directors. |
| 4. | Determine the objectives and criteria for measuring the variable remuneration of the executive directors and assess their degree of achievement thereof, submitting the corresponding proposals to the Board. |
| 5. | Analyse, where appropriate, the need to make ex ante or ex post adjustments to variable remuneration, including the application of reduction |
or recovery clauses for variable remuneration, submitting the corresponding proposals to the Board of Directors, prior report of the relevant committees in each case.
| 6. | Propose on an annual basis to the Board of Directors the annual report on the remuneration of the Bank’s directors, which will be submitted to the Annual General Shareholders’ Meeting as set out in applicable legislation. |
| 7. | Propose to the Board of Directors the remuneration policy for senior managers and other employees of the Identified Staff; and, oversee its implementation, including the supervision of the process for the identification of the aforementioned Staff. |
| 8. | Submit to the Board of Directors the Group’s remuneration policy, which may include that of the senior managers and the rest of the Identified Staff, as indicated in the previous paragraph, and oversee its implementation. |
| 9. | Submit to the Board of Directors the proposed basic contractual conditions for senior managers, including their remuneration and severance in the event of termination. |
| 10. | Directly supervise the remuneration of senior managers and determine, within the framework of the remuneration model applicable to Senior Management at any given time, the objectives and criteria for measuring variable remuneration of the heads of the Regulation & Internal Control area and the Internal Audit area, submitting the corresponding proposals to the Board of Directors, based on proposals submitted to it in turn by the Risk and Compliance Committee and the Audit Committee. |
| 11. | Ensure compliance with the remuneration policies established by the Institution and review them periodically, proposing modifications, where appropriate, to ensure, among other things, that they are adequate to attract and retain the best professionals, so that they contribute to the creation of long-term value and adequate control and management of risks, and that they attend to the principle of pay equality; in particular, ensure that the remuneration policies established by the Institution are subject to internal, central and independent review at least once a year. |
Table of Contents
| BBVA. PILLAR 3 2021 | 6. INFORMATION ON REMUNERATION | P. 204 |
| 12. | Verify information on the remuneration of directors and senior managers contained in the various corporate documents, including the annual report on the remuneration of directors. |
| 13. | Oversee the selection of external advisers, whose advice or support is required for the performance of their functions in matters of remuneration, ensuring that any potential conflicts of interest do not impair the independence of the advice provided. |
At the end of 2021 financial year, the Remuneration Committee was composed of five members; all of them had the status of non-executive directors, with the majority being independent, including the Chair. The names, positions and status of the members of the Remuneration Committee are detailed in the following table:
Table 90. Composition of the Remuneration Committee
Name and surname(s) | Position | Status | ||
Dª. Belén Garijo López | Chair | Independent | ||
Dª. Lourdes Máiz Carro | Member | Independent | ||
Dª. Ana Peralta Moreno | Member | Independent | ||
D. Carlos Salazar Lomelín | Member | External | ||
D. Jan Verplancke | Member | Independent |
The members of the Remuneration Committee who held such position at the end of 2021 have received a total amount of 278 thousand euros for their membership. The Annual Report on BBVA Directors’ Remuneration referred to said financial year includes the individual remuneration of each director, broken down by remuneration items.
The Remuneration Committee performs its functions with full autonomy of operation, meeting as often as necessary to carry out its duties, headed by its Chair. In 2021 financial year it met on a total of 7 occasions.
In order to adequately perform its functions, the Committee uses advice provided by the Bank’s internal services, and may also make use of any external advice it needs to establish criteria on matters within its remit. Thus, during 2021 the Committee has relied on information provided by the leading global consulting firm on compensation of directors and senior managers, Willis Tower Watson, and has received legal advice from the law firm J&A Garrigues S.L.P. Both have provided advice on matters including the updating of remuneration policies which, as it is set out below, was carried out in 2021.
In addition, the Board’s Risks and Compliance Committee also participates in the process of establishing a remuneration policy, ensuring that it is
compatible with adequate and efficient risk management and does not offer incentives to take risks that may exceed the level tolerated by the Group.
Since 2011, the Bank has a specific remuneration system applicable to the members of the Identified Staff, among whom are directors and senior management of BBVA. It has been designed within the framework of the regulations applicable to credit institutions, considering best practices and recommendations at the local and international level in this matter.
The new regulations governing remuneration which entered into force in 20217, together with advances in market practice, have led the Remuneration Committee to carry out a review of the remuneration policies in place, with the main aim of ensuring that they are fully aligned with the new regulatory requirements and, in particular, with the specific regulations with respect to the remuneration systems of credit institutions applicable to the Identified Staff.
One of the key elements of the review of these policies is to make progress in aligning them with the BBVA Group’s strategy and with long-term value creation. Specifically, they expressly incorporate the principle of equal remuneration for men and women; metrics related to sustainability in the remuneration scheme; changes to the payment schedule for the deferred part of the annual variable remuneration; changes in the mechanisms of reduction and recovery of the variable remuneration; in the case of the BBVA Directors’ Remuneration Policy, the transformation of the pension system of the Chairman; and other technical improvements designed to make progress in the transparency and clarity of the remuneration systems.
As indicated above, the Remuneration Committee has among its functions the one of proposing these policies to the Board of Directors for its approval, and in the case of the BBVA Directors’ Remuneration Policy, for submitting it to the General Shareholders’ Meeting, likewise submitting the corresponding report in the terms established by law at any time.
Therefore, BBVA has a remuneration policy applicable to the Institution’s directors - the BBVA Directors’ Remuneration Policy -, whose latest update was approved by the Bank’s General Shareholders’ Meeting on April 20, 2021, for the years 2021, 2022 and 2023. In accordance with BBVA’s Bylaws, it distinguishes between the remuneration system applicable to non-executive directors and executive directors. The policy is available on the Bank’s corporate website (www.bbva.com).
As stated in this Policy, the remuneration system for executive directors corresponds, generally, with the system applicable to the rest of the Identified Staff,
| 7 | Modifications introduced by Act 5/2021, of April 12, amending the consolidated text of the Corporate Enterprises Act, approved by Royal Legislative Decree of 1/2010, of July 2; by Royal Decree-Law 7/2021, of April 27, amending Act 10/2014 to transpose to Spanish legislation Directive 2019/878/EU of the European Parliament and of the Council of May 20, 2019 (“CRD V”); and by the revised Guidelines of the European Banking Authority (EBA/GL/2021/04), of July 2, 2021, on sound remuneration policies taking into account Directive 2013/36/EU. |
Table of Contents
| BBVA. PILLAR 3 2021 | 6. INFORMATION ON REMUNERATION | P. 205 |
incorporating some particularities of its own derived from their status as directors. The remuneration system for non-executive directors is based on the criteria of responsibility, dedication and incompatibilities inherent to their position, consisting only of fixed items and no variable remuneration.
BBVA also has a general remuneration policy for BBVA Group, which was updated by the Board of Directors on June 30, 2021, upon the proposal of the Remuneration Committee, and is applicable in general to all the employees of BBVA and the companies in its Group (the “BBVA Group General Remuneration Policy” or the “Policy”, and the “Group Entities”, respectively). This Policy includes the specific rules applicable to the Identified Staff, as well as the procedure for their identification.
The BBVA Group General Remuneration Policy, is coordinated at the corporate level by BBVA’s global Talent and Culture area. The supervisory functions of the Group actively and regularly cooperate in its design and oversight, in accordance with the powers conferred to them by applicable legislation.
Thus, the Board of Directors periodically reviews the general principles of the Policy and oversees its implementation, based on the information and report received by the Talent & Culture area and the various corresponding control functions, thus guaranteeing that this Policy is applied properly and in a manner consistent with BBVA’s Corporate Governance System.
In this way, the Bank employs a decision-making system for remuneration featuring the Remuneration Committee as its central element, which, as stated, is in charge of proposing to the Board of Directors both the BBVA Group General Remuneration Policy, which includes the specific rules applicable to the Identified Staff, and the BBVA Directors’ Remuneration Policy, for its subsequent submission to the General Shareholders’ Meeting in the latter case.
In the course of implementing the remuneration policies approved by the Bank’s corporate bodies, in 2021 the Remuneration Committee analysed the remuneration proposals needed for the development and implementation of these remuneration policies.
Thus, at the beginning of the financial year, the Committee was informed of the main new regulatory changes which were expected to enter into force in 2021 that could affect the remuneration policies approved by the Bank and, as stated above, analysed the approaches for their update and adaptation to the new regulations and most recent market practices and recommendations on remuneration.
Likewise, the Remuneration Committee determined the Annual Performance Indicators used for the calculation of the 2021 Annual Variable Remuneration of the executive directors and their corresponding weightings,
together with the performance targets and achievement scales associated with the indicators, submitting the corresponding proposals to the Board for approval.
The Remuneration Committee has also determined the minimum thresholds of Attributable Profit and Capital Ratio established as ex ante adjustments for the generation of Annual Variable Remuneration in 2021 for the executive directors and rest of the Identified Staff, submitting the corresponding proposals to the Board for approval.
In addition, the Remuneration Committee determined, for their proposal to the Board, the Multi-Year Performance Indicators that will be used as ex post adjustments to determine the Deferred Portion of the Annual Variable Remuneration for 2021 of the executive directors and the rest of the members of the Identified Staff, together with their corresponding weightings, counting for this with the prior analysis carried out by the Risks and Compliance Committee, which ensured their adequacy for the Bank’s risk profile.
Moreover, in 2021, the Remuneration Committee submitted to the Board for its submission in turn to the General Shareholders’ Meeting held in 2021 the proposed resolution regarding the increase of the maximum level of variable remuneration up to 200% of the fixed component of the total remuneration of a certain number of members of the Identified Staff, also proposing to the Board the report accompanying this resolution, which was made available to the Bank’s shareholders.
Likewise, in accordance with the proposal submitted by the Remuneration Committee, the Board approved the Annual Report on the Remuneration of BBVA Directors, developed in accordance with Circular 4/2013 of the National Securities Market Commission (CNMV), which was submitted to an advisory vote at the General Shareholders’ Meeting held in 2021, pursuant to article 541 of the Corporate Enterprises Act, and which was made available to the Bank’s shareholders through the corporate website (www.bbva.com).
The Annual Report on the Remuneration of Directors of BBVA includes a description of the basic principles of the Bank’s remuneration policy for the members of the Board, whether executive or non-executive, as well as a detailed presentation of the different elements and amounts making up their remuneration.
Moreover, within the framework of the function attributed to the Remuneration Committee for the oversight and periodic review of the established remuneration policies, the Committee reviewed the application of the BBVA Group Remuneration Policy in 2020, in accordance with applicable law and recommendations. For this purpose, the review covered the BBVA Group Remuneration Policy in force in that year, which includes the remuneration policy for the Identified Staff, as well as the procedure for their
Table of Contents
| BBVA. PILLAR 3 2021 | 6. INFORMATION ON REMUNERATION | P. 206 |
identification, based on an internal, central and independent review carried out by the Bank’s Internal Audit area. The result of all this was submitted to the Board.
Finally, the Committee has received information on the application of the procedure for identification of Identified Staff in 2021 financial year from the global Talent and Culture area, both at individual level for BBVA and for BBVA Group at consolidated level, in accordance with the qualitative and quantitative criteria established in the applicable regulations and internal criteria
established by the Bank. In particular, it was informed of the number of persons included in the Identified Staff and that no exclusions would be requested in 2021, the foregoing being duly reported to the Board.
All of the issues discussed above, along with other matters within its remit, are detailed in the Remuneration Committee Activity Report for 2021 financial year, published on the Bank’s corporate website on the occasion of the calling of the 2022 Annual General Meeting (www.bbva.com).
6.2. Description of the different types of employees included in the Identified Staff
In accordance with BBVA Group’s General Remuneration Policy, the selection of the persons who make up the Identified Staff within BBVA and/or its Group is part of an annual process based on the qualitative and quantitative criteria established under Article 32.1 of Act 10/2014 and (EU) Delegated Regulation 2021/923/EU of the Commission of March 25, 2021, supplementing CRD IV (the “Delegated Regulation 2021/923/EU”). This process also includes internal criteria established by BBVA complementary to those indicated in said Regulation, in compliance with Rule 38 of Bank of Spain Circular 2/2016 (hereinafter, the “Identification Process”).
The qualitative criteria established in the Identification Process are defined based on the level of responsibility of the position (for example, members of the BBVA Board of Directors, members of BBVA Senior Management, staff responsible for control functions and other key functions or significant business units within the Group), as well as on the basis of the staff’s capacity or responsibility to assume or manage risk.
The quantitative criteria establish that employees have a significant impact on the risk profile based on the total remuneration awarded, unless BBVA determines that, in fact, the activity of such staff has no significant impact on the risk profile. The application of these criteria takes into account the total remuneration awarded in the previous financial year, or the remuneration established by the applicable rules at all times.
The Identification Process is updated during the year and takes all BBVA and BBVA Group personnel into consideration, respectively, allowing the inclusion of personnel in the Identified Staff who meet or are likely to meet the qualitative criteria established under applicable law for at least three months out of a given financial year.
The Group Entities actively participate in the Identification Process carried out by BBVA, providing all the information necessary in order to adequately identify
the personnel having a significant impact on the Group’s risk profile.
In accordance with the Identification Process previously indicated, at the year-end 2021 a total of 332 Risk Takers were identified at BBVA Group level, and 185 at individual level in BBVA, of whom 168 had already been identified as Risk Takers at consolidated level, including:
| • | Members of the BBVA Board of Directors8. |
| • | Members of BBVA Senior Management. |
| • | Risk Takers by function: comprised by those members that carry out the functions that correspond to the qualitative criteria established under Article 32.1 of Act 10/2014 and Delegated Regulation 2021/923/EU, as well as those Risk Takers identified according to internal Bank criteria based on Rule 38 of Bank of Spain Circular 2/2016. |
| • | Risk Takers by remuneration: composed of those employees who meet the quantitative criteria of Article 32.1 of Act 10/2014 and Delegated Regulation EU 2021/923/EU. |
The total number of Risk Takers identified in 2021 financial year fell with respect to the total number of members identified in 2020, which was 591 people, due mainly to the sale of most of the BBVA Group businesses in the United States and the application of new identification criteria in accordance with Act 10/2014 and Delegated Regulation 2021/923/EU.
Notwithstanding the foregoing, BBVA will adapt the composition of the Identified Staff, including the categories of professionals deemed necessary at any time, in accordance with the requirements established for that purpose under the terms of applicable regulations.
| 8 | In the remuneration policy for non-executive directors, they are identified as Risk Takers under article 32.1 of Act 10/2014, although as specified in section 6.3 of this document, they have a specific system of remuneration, different from that applicable to executive directors, and do not receive variable remuneration. |
Table of Contents
| BBVA. PILLAR 3 2021 | 6. INFORMATION ON REMUNERATION | P. 207 |
6.3. Key features of the remuneration system
As stated in section 6.1, at the proposal of the Remuneration Committee, the Board of Directors approved, in 2021 financial year, the update of the BBVA Group General Remuneration Policy applicable in 2021 financial year, in which the remuneration system applicable to the Identified Staff, as well as the Identification Process referred to in section 6.2 above is included.
The BBVA Group General Remuneration Policy is geared toward the recurring generation of value for the Group, the alignment of the interests of its employees and shareholders with prudent risk management, and the development of the strategy defined by the Group.
This policy is one of the elements devised by the Board of Directors, as part of the Bank’s Corporate Governance System, to promote proper management and oversight of the Institution and its Group, and is based on the following principles:
| • | long-term value creation; |
| • | results attained through sound and responsible risk-taking; |
| • | attracting and retaining the best professionals; |
| • | rewarding the level of responsibility and professional career; |
| • | ensuring internal equity and external competitiveness; |
| • | ensuring equal pay for men and women; and |
| • | ensuring transparency of the remuneration model. |
Based on the general principles above, BBVA has defined the Group’s General Remuneration Policy, taking into account both compliance with the legal requirements applicable to credit institutions and to the different sectors in which the Group operates, and alignment with best market practices, including arrangements devised to reduce exposure to excessive risks and align remuneration with the Group’s strategy, objectives, values and long-term interests.
Thus, according to these principles, the Policy:
| • | contributes to the business strategy of BBVA and its Group, and to the achievement of its objectives, values, interests, value creation and long-term sustainability; |
| • | is compatible with and promotes sound and effective risk management and does not provide incentives to assume risks that exceed the level tolerated by the Institution or the BBVA Group, in a |
manner that is consistent with the BBVA Group’s risk strategy and culture;
| • | is clear, comprehensible and transparent, with a simple wording that enables the understanding of the different components making up remuneration and the conditions for the award, vesting and payment thereof. To that end, it distinguishes clearly between the criteria for determining fixed remuneration and variable remuneration; |
| • | is gender neutral, as it reflects equal compensation for the same duties or duties of equal value and does not establish any difference or discrimination on the basis of gender; |
| • | includes measures to avoid conflicts of interest, promoting the independence of judgement of persons involved in decision-making and in the oversight and control of management and the establishment of remuneration systems; and |
| • | pursues that remuneration is not based solely or primarily on quantitative criteria, taking into account appropriate qualitative criteria, which reflect compliance with applicable regulations. |
In accordance with the above, the remuneration system generally applicable to all BBVA Group staff comprises the following:
| a) | A fixed remuneration, which takes into account the level of responsibility, the functions carried out and the professional career of each employee, under the principles of internal equity and the market value of the function, constituting a significant portion of the total pay. The award and amount of fixed remuneration are based on predetermined objective and non-discretionary criteria. |
| b) | A variable remuneration, consisting of payments or allowances in cash or in kind, in addition to fixed remuneration, which depend on variable parameters. In no case will variable remuneration limit the ability of the Group to strengthen its capital base in accordance with regulatory requirements and it shall consider current and future risks as well as the costs of the necessary capital and liquidity, reflecting a performance that is sustainable and adapted to risk. |
Guaranteed variable remuneration will only be awarded on an exceptional basis, in accordance with the terms established under applicable regulations, only for newly hired staff, and limited to the first year of employment.
Within this remuneration model for general application, the BBVA Group General Remuneration Policy includes
Table of Contents
| BBVA. PILLAR 3 2021 | 6. INFORMATION ON REMUNERATION | P. 208 |
certain special provisions, applicable, on the one hand, to staff exercising control functions and, on the other hand, to staff exercising functions related to the sale of products and the provision of services to clients. Thus:
| i. | Staff who perform control functions are independent from the units they supervise, have the necessary authority and are remunerated according to the achievement of targets associated with their duties, regardless of the results of the areas they supervise, thereby avoiding potential conflicts of interest. |
In order to strengthen the independence and objectivity of these functions, the fixed components of their remuneration have a greater weight than the variable components, with the variable components being mainly related to objectives specific to their function.
In addition, the remuneration of BBVA senior managers in independent control functions, including compliance and risk management functions, is directly supervised by the BBVA Remuneration Committee, as is the case with the rest of the members of BBVA’s Senior Management, as the Board of Directors is the body responsible for establishing the basic conditions of their contracts.
Moreover, the Board of Directors, on the proposal of the BBVA Remuneration Committee following prior analysis by the BBVA Audit Committee and the BBVA Risk and Compliance Committee, respectively, is responsible for determining the targets and performance evaluation of the global heads of the Internal Audit and Regulation & Internal Control functions.
| ii. | The design and implementation of the remuneration of the Group staff involved in the provision of services to clients, watches for the protection of their interests and the quality of the services provided, so that: |
| • | responsible business conduct and fair treatment of clients is fostered; |
| • | incentives are not established in a way that may induce staff to put their own interests or those of BBVA Group first, to the possible detriment of the interests of their clients; |
| • | remuneration is not primordially or exclusively linked to the sale of a product, or a category or specific type of product, such as products that are more lucrative for the institution or employee, when there are others more in line with client needs; and that this objective is not set as that |
with the greatest weight in the remuneration package; and
| • | an appropriate balance is maintained between the fixed and variable elements of the remuneration. |
Moreover, BBVA and the Group Entities directly subject to the customer protection regulations must comply with the specific remuneration requirements established at any time.
Pursuant to the legal requirements established by Act 10/2014 and its regulatory implementation, the BBVA Group General Remuneration Policy defines specific rules applicable to the Identified Staff, in accordance with the regulations and recommendations applicable to remuneration schemes for these employees.
The result is a remuneration system for Identified Staff focused specifically on aligning their remuneration with the risks, and also the long-term objectives and interests of BBVA and its Group, whose fundamental characteristics are the following:
| • | Balance between the fixed and variable components of the total remuneration, in line with that established in the applicable regulations, allowing a fully flexible policy regarding the payment of variable components, which may cause them to be reduced, even in their entirety, where appropriate. |
The proportion between the two components has been established taking into account the type of functions carried out by each beneficiary (business, support or control) and, consequently, their impact on the risk profile, adapted in each case to the reality of the different Group Entities or functions.
| • | The variable component of remuneration for a financial year (understood as the sum of all the variable components of remuneration) shall be limited to a maximum amount of 100% of the fixed component of total remuneration (understood as the sum of all the fixed components of remuneration), unless the BBVA General Shareholders’ Meeting resolves to increase this percentage to a maximum of 200%. As explained in detail in section 6.7 of this report, the BBVA General Shareholders’ Meeting held on April 20, 2021, authorized the increase in the maximum limit to 200% for a maximum of 339 Risk Takers. |
| • | No personal hedging strategies or insurance may be used in connection with variable remuneration or liability that may undermine the effects of alignment with prudent risk management. |
| • | Within the framework of the corporate variable remuneration model of BBVA Group, the members of the Identified Staff receive, as is the case with the rest of the staff, an incentive or annual variable |
Table of Contents
| BBVA. PILLAR 3 2021 | 6. INFORMATION ON REMUNERATION | P. 209 |
remuneration, which constitutes the main element of the variable component of their total remuneration and reflects their performance on the basis of the level of achievement of targets that are in line with the risk incurred, calculated on the basis of:
| i. | group, area and individual annual performance indicators (financial and non-financial) that take into account current and future risks, as well as the strategic priorities defined by the Group (the “Annual Performance Indicators”); |
| ii. | the scales of achievement established where appropriate according to the weighting assigned to each Annual Performance Indicator and based on the targets set for each of them; and |
| iii. | a “target” annual variable remuneration that represents the amount of annual variable remuneration if 100% of the targets were met, which is a single amount for each function (the “Target Annual Variable Remuneration” or “Target Bonus”). |
The amount to receive as annual variable remuneration, in accordance with the corresponding scales of achievement, can range between 0% and 150% of the Target Annual Variable Remuneration.
The resulting amount constitutes the annual variable remuneration (“Annual Variable Remuneration” or “AVR”) of each beneficiary.
The financial Annual Performance Indicators are related to the Bank’s most relevant management metrics, while the non-financial indicators are related to the strategic targets defined at Group, area and individual level for each beneficiary.
Each function within the organization has an assigned weighting or slotting which determines the percentage of Annual Variable Remuneration which is linked to the performance of the Group, the area and individual; and which depends on the extent that the function is linked to the global strategy and the area or with its own individual results.
The AVR Annual Performance Indicators approved for 2021 financial year for the Identified Staff are as follows:
Table 91. 2021 AVR Annual Performance Indicators
| Weighting | ||||||||||||
Indicator | Chairman(1) | Chief Executive Officer(1) | Rest of Identified Staff(2) | |||||||||
Financial indicators | ||||||||||||
Net Attributable Profit without corporate transactions | 10 | % | 15 | % | 10 | % | ||||||
Tangible Book Value per share | 15 | % | 10 | % | 10 | % | ||||||
RORC | 10 | % | 10 | % | 15 | % | ||||||
Efficiency ratio | 10 | % | 15 | % | 15 | % | ||||||
Non-financial indicators | ||||||||||||
Net Promoted Score (NPS) | 10 | % | 15 | % | 10 | % | ||||||
Mobilization of sustainable financing | 10 | % | 10 | % | 10 | % | ||||||
Digital Sales | 10 | % | 10 | % | 10 | % | ||||||
Own indicators / other indicators(3) | 25 | % | 15 | % | 20 | % | ||||||
| (1) | Including the 2021 AVR Annual Performance Indicators for executive directors. |
| (2) | Including the 2021 AVR Annual Performance Indicators at Group level for the rest of the Identified Staff. |
| (3) | Own indicators consider the strategic dimensions to be fostered by the Chairman and Chief Executive Officer, associated with their responsibilities and functions. The other indicators which apply to the rest of the Identified Staff are related to the Group’s strategic priorities. |
In 2021 a new indicator related to sustainability was included (mobilization of sustainable finance), linked to the Bank’s strategic priority of “Helping our customers transition to a sustainable future”, directly associated with the activity carried out by the Group in compliance with its climate change commitments to the market and which strengthens BBVA’s commitment to achieve its sustainable development objectives. The Group is implementing the incorporation of metrics related to sustainability and ESG risks into the variable remuneration schemes of its employees, BBVA Senior Management and BBVA executive directors.
| • | To ensure alignment with results and long-term sustainability, the Annual Variable Remuneration for Identified Staff members for each financial year will be subject to ex ante adjustments, so that it shall be reduced at the time of the performance assessment in the event of negative performance of the Group’s results or other parameters such as the level of achievement of budgeted targets; and it will not accrue, or will accrue by a reduced amount, should a certain level of profit and capital ratios not be achieved, as established at the start of each financial year by the Board of Directors. |
Table of Contents
| BBVA. PILLAR 3 2021 | 6. INFORMATION ON REMUNERATION | P. 210 |
| • | The Annual Variable Remuneration of members of Identified Staff shall be subject to the following rules for award, vesting and payment: |
| • | Once the Annual Variable Remuneration has been awarded, at an amount determined by applying the above rules, a percentage of the Annual Variable Remuneration of the Identified Staff -40% for executive directors, members of Senior Management and members of the Identified Staff with particularly high levels of remuneration, and 60% for the rest of the Identified Staff- will be vested and paid, if the conditions are met, in the first four months of the financial year following that to which the Annual Variable Remuneration corresponds (the “Upfront Portion” of the Annual Variable Remuneration). |
| • | The remaining part -60% for executive directors, members of Senior Management and members of Identified Staff with particularly high remuneration, and 40% for the rest of the Identified Staff-, will be deferred over time (the “Deferred Portion” of the Annual Variable Remuneration, or the “Deferred Annual Variable Remuneration”). For BBVA’s executive directors and members of Senior Management, the deferral period shall be five years, and for the remaining members of the Identified Staff, four years. |
The Deferred Annual Variable Remuneration will be paid, if the conditions are met, on a pro rata basis, after each of the years of deferral, in an amount equivalent to 25% in the case of the Identified Staff and 20% in the case of BBVA’s executive directors and members of Senior Management.
| • | 50% of the Annual Variable Remuneration, both the Upfront and Deferred Portion, will be established in BBVA shares or in instruments linked to BBVA shares.. For executive directors and members of Senior Management, both 50% of the Upfront Portion and 60% of the Deferred Portion will be determined in BBVA shares. |
| • | The shares or instruments awarded as Annual Variable Remuneration, both in the Upfront and Deferred Portion, will be withheld for a one-year period after delivery, except for those shares or instruments whose sale would be required to honour the payment of taxes accruing on their shares delivery. |
| • | In order to ensure that the assessment process of the results to which the Annual Variable Remuneration is linked within a multi-year framework, considering long-term results, and that the effective payment is made |
over a period which takes into account the institution’s economic cycle and its risks, the Annual Variable Remuneration of the Identified Staff shall be subject to ex post risk adjustments, linked to the result of the multi-year performance indicators.
For this purpose, the Deferred Portion of the Annual Variable Remuneration of members of the Identified Staff may be reduced, but never increased, based on the result of multi-year performance indicators aligned with the Group’s core risk management and control metrics (“Multi-Year Performance Indicators”), related to solvency, liquidity, profitability and value creation.
The Multi-Year Performance Indicators for all Identified Staff are approved every year by the Board of Directors, at the proposal of the Remuneration Committee, and subsequent to analysis by the Risk and Compliance Committee, which ensures that they are compatible with adequate and effective risk management.
The Multi-Year Performance Indicators and their weightings approved for 2021 financial year are as follows:
Table 92. Multi-year Performance Indicators
Indicator | Weighting | |||
Common Equity Tier (CET ) 1 fully loaded | 40 | % | ||
Liquidity Coverage Ratio (LCR) | 20 | % | ||
Return On Tangible Equity (ROTE) | 30 | % | ||
Total Shareholder Return (TSR) | 10 | % | ||
Once the financial year corresponding to the third year of deferral of the Annual Variable Remuneration has ended, the result of the Multi-Year Performance Indicators established for each financial year will determine any ex post reduction adjustments to be made, if appropriate, on the amount pending payment of the Deferred Portion of the Annual Variable Remuneration.
For this purpose, the Multi-Year Performance Indicators have associated scales of achievement of the objectives established for each of them, which are determined by the Board of Directors, at the proposal of the Remuneration Committee and with a prior analysis by the Risk and Compliance Committee, once the amount of Annual Variable Remuneration for each financial year has been determined. In this way, if the pre-established thresholds set for each of the Multi-Year Performance Indicators are not achieved, the amount pending payment of the
Table of Contents
| BBVA. PILLAR 3 2021 | 6. INFORMATION ON REMUNERATION | P. 211 |
Deferred Portion of the Annual Variable Remuneration will be adjusted, and may be reduced, in the terms indicated in the above paragraph, but never increase.
| • | Moreover, all the Annual Variable Remuneration of each member of the Identified Staff corresponding to each financial year will also be subject to reduction (malus) and recovery of remuneration already paid (clawback) arrangements, both linked to a downturn in financial performance of the Bank as a whole or of a specific unit or area, or of exposures generated by a member of Identified Staff, when such downturn in financial performance arises from any of the following circumstances: |
| a) | Misconduct, fraud or serious infringement of the Code of Conduct and other applicable internal regulations by an Identified Staff member. |
| b) | Regulatory sanctions or judicial convictions due to events that could be attributable to a specific unit or to personnel responsible for such events. |
| c) | Significant failure of risk management committed by the Bank or by a business or risk control unit, to which the wilful misconduct or gross negligence of an Identified Staff member was a contributing factor. |
| d) | Restatement of the Bank’s annual financial statements, except where such restatement is due to a change in applicable accounting legislation. |
For this purpose the Bank shall compare the performance assessment carried out for the Identified Staff member with the ex post behaviour of some of the criteria that contributed to achieve the targets. Both malus and clawback arrangements will apply to the Annual Variable Remuneration corresponding to the financial year in which the event giving rise to application of the arrangement occurred, and will remain in force during the deferral and withholding period applicable to said Annual Variable Remuneration.
Nevertheless, in the event that the above circumstances give rise to a dismissal or termination of contract of the Identified Staff member due to serious and guilty breach of duties, malus arrangements may apply to the entire Deferred Annual Variable Remuneration from previous financial years pending payment at the date of the dismissal or termination of
contract, in light of the extent of the damage caused.
Moreover, if the above circumstances, regardless of the financial impact caused, create a relevant reputational damage to the Bank, the malus and clawback arrangements may also apply to the Annual Variable Remuneration, including the amounts deferred from previous financial years, whose payment corresponds to or has taken place in the financial year in which the damage is revealed.
In any case, the Annual Variable Remuneration will only vest or be paid if it is sustainable according to the Group’s situation as a whole, and justified based on the results of the Bank, the business unit and the Identified Staff member concerned.
| • | The resulting cash amounts of the Deferred Annual Variable Remuneration finally vested will be updated by applying the year-on-year change in prices given by the Consumer Price Index (CPI). |
| • | In the event of the termination of the contractual relationship of an Identified Staff member before the award of Annual Variable Remuneration, the member will be entitled, if conditions are met, to receive the proportional part of such Annual Variable Remuneration, calculated pro rata for the length of service in the said financial year; subject, in all cases, to the same award, vesting and payment system that would be applicable if the member had remained working, in accordance with the rules described above. The above shall not be applicable to cases where the termination of the contractual relationship is due to a voluntary resignation or lawful dismissal, in which cases the right to the Annual Variable Remuneration will not accrue. |
| • | If the members of the Identified Staff have the right to receive any type of remuneration other than Annual Variable Remuneration considered to be variable remuneration, this remuneration will be subject to the rules for award, vesting and payment applicable in accordance with the type and nature of the remuneration component itself and, in any case, shall comply with the applicable regulations in force at any given time. |
| • | In particular, any retention bonuses to which Identified Staff members may be entitled in accordance with their contracts shall be considered to be variable remuneration and subject to the conditions established with respect thereto in applicable regulations. Thus, they shall comply with requirements in respect of payment in shares, deferral rules, ex post risk adjustments, and malus |
Table of Contents
| BBVA. PILLAR 3 2021 | 6. INFORMATION ON REMUNERATION | P. 212 |
and clawback arrangements established for Annual Variable Remuneration in the Policy, and shall be considered to be variable remuneration for the purposes of calculating the ratio between fixed and variable remuneration. In any case, retention bonuses shall be properly justified and will be awarded upon conclusion of the retention period.
| • | The BBVA Directors’ Remuneration Policy includes additional restrictions to the transfer of shares derived from the variable remuneration of executive directors. Specifically, it establishes that once the BBVA shares have been received, the executive directors shall not be able to transfer their ownership until a period of at least three years has elapsed, except if the director in question has, at the time of the transfer, a net economic exposure to the variation in the price of the shares for a market value equivalent to an amount of at least twice their Fixed Annual Remuneration through the ownership of shares, options or other financial instruments. The foregoing shall not apply to the shares that the director needs to sell to meet the costs related to their acquisition or, upon favourable assessment of the Remuneration Committee, to address an extraordinary situation.. |
| • | Moreover, in accordance with the provisions of BBVA Group General Remuneration Policy and in line with applicable regulations, payments to members of the Identified Staff due to early termination of a contract will be based on the results obtained over time. In no case shall bad results or inappropriate conduct be rewarded, and payments may not be awarded in cases where there have been clear and serious infringements that justify the immediate termination of the contract or the dismissal of the Identified Staff member. With regard to BBVA directors, the Bank has no commitments to make severance payments. |
As regards the pension policy, this shall remain compatible at all times with the Group’s long-term business strategy, objectives, values and interests. To this end, BBVA has a pension system which is arranged on the basis of geographic areas and coverage offered to different groups of employees. These groups have been formed according to parameters that, among others, include, origin (meaning the Entity of the Group in which the employees initiated the employment relationship); date of entry; and the level or category of responsibility within the organization.
In general, BBVA’s pension schemes to cover the retirement contingency are defined-contribution. Contributions to the Group’s employee pension schemes are made within the framework of relevant labour law and individual or group agreements applicable to each Group Entity, sector or geographic area.
The scope of the system (cover for retirement, death and disability) for each group is defined in consideration of the three factors mentioned above.
The basis for the calculation of the benefits (commitments for retirement, death and disability) are established using fixed annual amounts; there are no temporary fluctuations derived from variable components or Individual results.
However, in accordance with Bank of Spain Circular 2/2016, 15% of the agreed annual contributions covering the retirement contingency of executive directors and members of Senior Management shall be considered “discretionary pension benefits” and shall therefore be based on variable components and be subject to the conditions established for these instruments in the aforementioned Circular.
To comply with the above, the annual amount of the “discretionary pension benefits” will be determined by reference to the result of the Annual Variable Remuneration awarded in each financial year and the following rules will apply:
| • | They shall form part of the total amount of variable remuneration for the purposes of the maximum limit between fixed and variable remuneration; |
| • | They shall be paid in full in BBVA shares; |
| • | They shall be subject to a five-year withholding period from the date on which the beneficiary ceases to render services to the Bank for any reason; and |
| • | During the aforementioned five-year withholding period, the Bank may apply, if the corresponding conditions are met, the malus and clawback arrangements applicable to Annual Variable Remuneration. |
Detailed information on the implementation of the obligations contracted in terms of pensions for executive directors and members of Senior Management during the financial year can be found in Note 54 of Consolidated Financial Statements for 2021, which are available on the Bank’s corporate website (www.bbva.com).
A detailed description of the remuneration system for BBVA’s executive and non-executive directors is included in the BBVA Directors’ Remuneration Policy, and its implementation in the financial year is outlined in the Annual Report on the Remuneration of BBVA Directors for 2021. Both documents are available on the Bank’s corporate website (www.bbva.com).
As set out in those documents, in the case of the non-executive directors, they do not receive variable remuneration; they receive a fixed annual amount in cash as members of the Board and of the various committees,
Table of Contents
| BBVA. PILLAR 3 2021 | 6. INFORMATION ON REMUNERATION | P. 213 |
where applicable, as well as for the performance of any other functions or responsibilities that may be attributed to them in the framework of the Bank’s Corporate Governance System. The amount of annual allowance for each of the above positions or functions is set by the Board of Directors, at the proposal of the Remuneration Committee, depending on the nature of the assigned functions and the dedication and responsibility required from each director.
In addition, the Bank has a remuneration system in BBVA shares with deferred delivery to non-executive directors, which has been approved by BBVA General Shareholders’ Meeting. This system comprises the annual allocation to non-executive directors of a number
of “theoretical shares” of the Bank, which are to be effectively delivered on the date of their removal as directors for any reason except for a serious breach of their duties.
The annual number of “theoretical shares” allocated to each non-executive director shall be equivalent to 20% of their total annual fixed allowance in cash received by each in the previous financial year, according to the average closing prices of the BBVA share during the 60 trading sessions prior to the General Shareholders’ Meetings approving the corresponding financial statements for each financial year.
6.4. Information on the connection between the remuneration of the Identified Staff and the Group’s performance
As explained in the preceding sections, the BBVA Group General Remuneration Policy provides for the payment to the members of the Identified Staff of an Annual Variable Remuneration, whose accrual is subject to ex ante adjustments, and the amount of which is calculated on the basis of the achievement of the targets established at the beginning of the year for each of the Annual Performance Indicators, according to the scales and weightings associated with each of them. In this way, the amount of variable remuneration received by the members of the Identified Staff is directly linked to the results of the BBVA Group and varies depending on them.
In addition to the results of the Group’s Annual Performance Indicators, determined by the pre-established performance scales, and according to the weighting of each indicator, the amount of the Annual Variable Remuneration of the members of the Identified Staff also takes into account the level of achievement of strategic objectives (both financial and non-financial) set at Area level and for each individual, as well as the associated weighting in each case to the aforementioned Group, Area and Individual indicators (slotting), which are established according to the extent that the function is linked to the objectives of the Group, the Area and the individual, respectively.
In the 2021 financial year, the BBVA Group obtained a recurring attributable profit of €5,069 million, an increase of 86% compared to 2020. These results do not take into account the results generated until June 2021 by BBVA USA and the rest of the companies sold to PNC, nor the costs of the restructuring plan in Spain, and are due mainly to a strong revenue growth, supported by the recovery of activity after the crisis caused by the COVID-19 pandemic.
However, the figure for profit taken into account for incentive purposes was €5,028 million, which considers the said recurring profit and excludes, in addition, non-budgeted savings generated in the year by the restructuring plan in Spain. This profit figure has been used to calculate the rest of the financial indicators for incentive purposes.
Likewise, the result of the rest of the Annual Financial performance indicators -TBV per share, RORC and Efficiency Ratio- included as Group’s indicators for members of the Identified Staff, have performed positively in 2021 with respect to the previous financial year.
With respect to the non-financial Annual Performance Indicators, as stated above, 2021 was the first year in which an indicator relating to sustainability, specifically, the “Mobilization of sustainable financing” indicator, was included in the variable remuneration system for all employees, including the members of the Identified Staff. Thus, the Bank mobilized a total of €30,615 million in 2021 of finance allocated to sustainable projects related to climate change, which puts the results of the indicator above the pre-established target.
With regard to the rest of non-financial Annual Assessment Indicators (NPS and Digital Sales), their levels of achievement have been aligned with the respective targets established by the Board to calculate the Annual Variable Remuneration for 2021 financial year.
Thus, accordingly, the Annual Variable Remuneration of the members of the Identified Staff is linked to factors such as the Group’s financial and non-financial results, all within the framework of and in accordance with the rules of the remuneration system detailed in Section 6.3 of this report.
Table of Contents
| BBVA. PILLAR 3 2021 | 6. INFORMATION ON REMUNERATION | P. 214 |
6.5. Description of the criteria used to take into consideration present and future risks in the remuneration processes
BBVA Group promotes the development of a risk culture at all levels in the organization through its Corporate Governance System. Thus, BBVA’s Corporate Bodies have provided the Group with a set of general policies and management and control basic guidelines, that allow for integrated and consistent management and supervision across the Group, highlighting among these guidelines the Risk Appetite Framework and the general policies on risk management by risk type. The BBVA Group General Remuneration Policy forms part of the elements designed by the Board of Directors, as part of the Corporate Governance System, to promote adequate management and supervision of remuneration in the BBVA Group. Among the principles inspiring it, is the achievement of the results based on a prudent and responsible risk assumption.
Thus, in line with what has been set out in section 6.3 of this report, the remuneration policy applicable to executive directors, members of Senior Management and the rest of the Identified Staff features a number of specific elements which make their remuneration take into account current and future risks for the Bank, promoting their prudent and effective management, and not offering incentives to assume risks that exceed the level tolerated by the Institution or the Group, consistently with the risk strategy and culture of the BBVA Group.
In particular, the Bank’s remuneration policies establish:
| • | Balance between the fixed and variable components of total remuneration; |
| • | Ex ante adjustments, compliance with which is verified prior to the accrual and determination of the Annual Variable Remuneration; |
| • | Financial and non-financial indicators to evaluate the results, which take account both current and future risks, and the strategic priorities defined by the Group; |
| • | Consideration, in the measurement of performance, of financial and non-financial measures that value both the individual management aspects and the objectives of the area and the Group; |
| • | Greater weight assigned to the objectives related to specific functions in the measurement of the performance of the members with control functions, to |
reinforce the independence and objectivity of these functions;
| • | Establishment of at least 50% of the Annual Variable Remuneration in BBVA shares or instruments linked to BBVA shares; |
| • | Deferral rules, designed so that a substantial portion of the Annual Variable Remuneration - 60% in the case of executive directors, members of Senior Management and Risk Takers with particularly high variable remuneration; and 40% in all other cases - is deferred over time, thus taking into account the economic cycle and business risks; |
| • | Incorporation of possible ex post risk adjustments related to the result of the Multi-Year Performance Indicators, measured over a period of three years from the beginning of the deferral period, to which weightings have been assigned and for which scales of achievement have been established; so that, in the event that the thresholds set for each indicator are not achieved, the Deferred Portion of the Annual Variable Remuneration pending payment may be reduced, but never increased. These indicators are aligned with the core metrics for the Group’s risk control and management, and in particular, are related to solvency, liquidity, profitability and value creation; |
| • | Mandatory retention periods of any shares or financial instruments delivered as Annual Variable Remuneration, so that the beneficiaries cannot freely dispose of them until one year after their delivery date, except for those whose sale would be required to honour the payment of taxes accruing on their delivery; |
| • | Prohibition of carrying out personal hedging strategies or insurance related to the remuneration and liability; |
| • | Limitation of the variable component of the remuneration for the year to 100% of the fixed component of total remuneration, except the BBVA General Meeting authorizes the application of a maximum ratio of 200% for a certain group of Risk Takers, as explained in detail in section 6.7 of this report. |
| • | Subjection of the entire Annual Variable Remuneration to malus and clawback arrangements during the whole deferral and retention period, under the terms indicated in Section 6.3. |
Table of Contents
| BBVA. PILLAR 3 2021 | 6. INFORMATION ON REMUNERATION | P. 215 |
6.6. Main parameters and the motivation of any component of possible variable compensation plans and other non-cash advantages
The main parameters and motivation behind the components of the variable remuneration plans of the Identified Staff have been set out in the previous sections of this report.
6.7. Ratios between fixed and variable remuneration of the Identified Staff
As set forth in section 6.3 above, the fixed and variable components of the overall remuneration of the Identified Staff are appropriately balanced, in line with applicable regulations, to ensure a policy that is fully flexible with regard to payment of the variable components, allowing for such components to be reduced in their entirety, where appropriate.
The proportion between both components is established taking into account the type of functions carried out by each beneficiary (business, support or control) and, consequently, their impact on the risk profile, adapting to the reality existing in the different Group Entities or functions in which the members of the Identified Staff carry out their activity.
To this end, the Bank has defined target ratios between the main components of fixed and variable remuneration, which take into account both the function performed by each member of the Identified Staff as well as their impact on the risk profile.
Notwithstanding the foregoing, the variable component of the remuneration of the Identified Staff corresponding to a financial year (understood as the sum of all the variable components of remuneration) shall be limited to a maximum amount of 100% of the fixed component of total remuneration (understood as the sum of all the fixed components of remuneration), unless the BBVA General Shareholders’ Meeting resolves to increase this percentage up to a maximum of 200%, as set forth under applicable legislation.
In this regard, the General Meeting held on April 20, 2021 resolved to increase the maximum level of the variable component of remuneration up to a maximum of 200% of the fixed component of total remuneration for certain members of the Identified Staff, in the terms indicated in the report issued for this purpose by the Board of Directors dated March 15, 2021. Thus, the Bank submitted the following proposed resolution to the General Meeting:
“For the purposes of the provisions of Article 34.1 g) of Act 10/2014 of June 26 on the regulation, supervision and solvency of credit institutions, to approve a maximum level of variable remuneration of up to 200% of the fixed component of total remuneration for a group of employees whose professional activities have significant impact on the Group’s risk profile, enabling subsidiaries of Banco Bilbao Vizcaya Argentaria, S.A. to likewise apply said maximum level to their professionals, pursuant to the Report issued in this regard by the Board of Directors of Banco Bilbao Vizcaya Argentaria S.A., on March 15, 2021, and which has been made available to shareholders as of the date on which the General Meeting was convened.”
This resolution was approved by the BBVA General Shareholders’ Meeting for a maximum of 339 Risk Takers, with a favourable vote of 97.13% out of the 67.56% of the capital present or represented at said General Shareholders’ Meeting.
The proposal submitted to the General Shareholders’ Meeting included the detailed recommendation of the Board, explaining the reasons and scope of the resolution proposed to the General Meeting, and included the number of persons affected, their positions, as well as the expected effect on maintaining a solid capital basis, taking into account the considerations established by the competent authority as regards dividend distribution policies.
As reflected in the Board’s Report, the persons for whom approval of the higher level of remuneration for 2021 financial year was requested performed one of the following functions:
| • | Members of the BBVA Board of Directors. |
| • | Members of BBVA Senior Management. |
| • | Members of the Identified Staff who perform their functions in the business areas of Spain, the United States, Mexico, Turkey, countries of South America, and Corporate and Investment Banking (CIB). |
Table of Contents
| BBVA. PILLAR 3 2021 | 6. INFORMATION ON REMUNERATION | P. 216 |
| • | Identified Staff members who perform their functions in corporate support areas, working globally for the Group as a whole, without being attached to a business area, including activities focused on digital transformation. |
6.8. Quantitative information on remuneration of the Identified Staff
After year-end 2021, the Annual Variable Remuneration corresponding to the members of the Identified Staff for said financial year was calculated in accordance with the results obtained (described in Section 6.4 above).
In accordance with the award, vesting and payment system of the Annual Variable Remuneration for 2021 financial year applicable to members of the Identified Staff:
| • | The Upfront Portion will be paid, if the conditions are met, in 2022 financial year, at 40% in the case of the executive directors, members of Senior Management and members of the Identified Staff with particularly high variable remuneration amounts, and 60% for the remaining members of the Identified Staff. |
| • | The Deferred Portion will be paid, if conditions are met, on a pro-rata basis, once each of the deferral years has elapsed, at an amount equivalent to 20% in the case of the executive directors and members |
of Senior Management, and 25% in the case of the rest of the members of the Identified Staff. The amount pending payment once the third year of deferral has concluded will be subject to the result of the Multi-Year Performance Indicators to which reference has been made in section 6.3 of this report. |
Thus the Deferred Portion will be paid, if appropriate, under the following payment schedule: (i) in the case of executive directors and members of Senior Management, 20% in 2023, 20% in 2024, 20% in 2025, 20% in 2026 and the remaining 20% in 2027; and (ii) in the case of the rest of the members of the Identified Staff, 25% in 2023, 25% in 2024, 25% in 2025 and the remaining 25% in 2026.
This gives rise to the amounts presented in the following table, broken down by types of employees:
Table of Contents
| BBVA. PILLAR 3 2021 | 6. INFORMATION ON REMUNERATION | P. 217 |
Table 93. EU REM1 - Remuneration awarded for the financial year (Thousand euros)
| Supervisory function (1) | Management function (1) | management (1) | Other identified staff | |||||||||||||||
| Number of identified staff | 13 | 2 | 16 | 301 | ||||||||||||||
| Total fixed remuneration(2) | 4,395 | 6,843 | 17,844 | 122,280 | ||||||||||||||
| Of which: cash-based | 4,293 | 6,357 | 16,435 | 111,825 | ||||||||||||||
| (Not applicable in the EU) | ||||||||||||||||||
Fixed remuneration | Of which: shares or equivalent ownership interests | — | — | — | — | |||||||||||||
| Of which: share-linked instruments or equivalent non-cash instruments | — | — | — | — | ||||||||||||||
| Of which: other instruments | — | — | — | — | ||||||||||||||
| (Not applicable in the EU) | ||||||||||||||||||
| Of which: other forms | 102 | 486 | 1,409 | 10,455 | ||||||||||||||
| (Not applicable in the EU) | ||||||||||||||||||
| Number of identified staff | 13 | 2 | 16 | 296 | ||||||||||||||
| Total variable remuneration(3) | — | 7,468 | 9,151 | 66,583 | ||||||||||||||
| Of which: cash-based | — | 3,286 | 4,027 | 39,581 | ||||||||||||||
| Of which: deferred | — | 1,792 | 2,196 | 11,520 | ||||||||||||||
Variable remuneration | Of which: shares or equivalent ownership interests | — | 4,182 | 5,125 | 24,541 | |||||||||||||
| Of which: deferred | — | 2,688 | 3,294 | 10,438 | ||||||||||||||
| Of which: share-linked instruments or equivalent non-cash instruments | — | — | — | 2,460 | ||||||||||||||
| Of which: deferred | — | — | — | 1,039 | ||||||||||||||
| Of which: other instruments | — | — | — | — | ||||||||||||||
| Of which: deferred | — | — | — | — | ||||||||||||||
| Of which: other forms | — | — | — | — | ||||||||||||||
| Of which: deferred | — | — | — | — | ||||||||||||||
|
|
|
|
|
|
|
| |||||||||||
Total remuneration (2 + 10) | 4,395 | 14,310 | 26,995 | 188,863 | ||||||||||||||
|
|
|
|
|
|
|
| |||||||||||
| (1) | Each of these columns includes remuneration for non-executive directors, executive directors and other members of Senior Management who held such position as of December, 31 2021. Information on remuneration and other benefits to the Board of Directors and members of the Bank’s Senior Management is detailed in Note 54 of the Consolidated Financial Statements for 2021. |
| (2) | Fixed remuneration received in 2021, both in cash and in kind, except for pension commitments. In the case of executive directors and Senior Management, the contributions made by the Bank in 2021 in relation to the pension commitments assumed with regard to social welfare are detailed in Note 54 of the Consolidated Financial Statements. Non-executive directors have a fixed remuneration system with deferred delivery of shares after they case to hold office. Details of this system, including the number of “theoretical shares” allocated in 2021, are also disclosed in Note 54 of the Consolidated Financial Statements for 2021. |
| (3) | Total variable remuneration corresponding to financial year 2021, which includes both the Annual Variable Remuneration and, for the purposes of this report, other payments considered variable under applicable regulations. Deferred variable remuneration is not vested and is subject to multi-year performance indicators related to the Risk Appetite Framework and shareholder return, which may reduce (but never increase) such deferred amounts, as well as to malus clauses. |
Regarding the “discretionary pension benefits” (15% of the annual contribution agreed to cover the retirement contingency of the Chairman and members of Senior Management), detailed information can be found in Note 54 of the Consolidated Financial Statements for 2021, in the section on pension commitments.
Table of Contents
| BBVA. PILLAR 3 2021 | 6. INFORMATION ON REMUNERATION | P. 218 |
Table 94. EU REM2 - Special payments to staff whose professional activities have a material impact on institutions’ risk profile (identified staff) (Thousand euros)
| MB Supervisory function | MB Management function | Other Senior Management | Other Identified Staff | Total Identified Staff | ||||||||||||||||
Guaranteed variable remuneration awards | ||||||||||||||||||||
Guaranteed variable remuneration awards - Number of identified staff | — | — | — | — | — | |||||||||||||||
Guaranteed variable remuneration awards - Total amount | — | — | — | — | — | |||||||||||||||
Of which guaranteed variable remuneration awards paid during the financial year, that are not taken into account in the bonus cap | — | — | — | — | — | |||||||||||||||
Severance payments awarded in previous periods, that have been paid out during the financial year | ||||||||||||||||||||
Severance payments awarded in previous periods, that have been paid out during the financial year - Number of identified staff | — | — | — | — | 4 | |||||||||||||||
Severance payments awarded in previous periods, that have been paid out during the financial year - Total amount | — | — | — | — | 634 | |||||||||||||||
Severance payments awarded during the financial year | ||||||||||||||||||||
Severance payments awarded during the financial year - Number of identified staff | — | — | — | — | 21 | |||||||||||||||
|
|
|
|
|
|
|
|
|
| |||||||||||
Severance payments awarded during the financial year - Total amount(1) | — | — | — | — | 19,117 | |||||||||||||||
|
|
|
|
|
|
|
|
|
| |||||||||||
Of which paid during the financial year | — | — | — | — | 16,843 | |||||||||||||||
Of which deferred | — | — | — | — | 2,274 | |||||||||||||||
Of which severance payments paid during the financial year, that are not taken into account in the bonus cap | — | — | — | — | 16,843 | |||||||||||||||
Of which highest payment that has been awarded to a single person | — | — | — | — | 3,066 | |||||||||||||||
| (1) | Includes the amount of the statutory severance payment under labor regulations, as well as, if applicable, the amount in addition to this legal severance payment. |
Additionally, non-competition agreements have been signed with some beneficiaries for a total amount of 8.238 thousand euros, that will be paid periodically from the moment the member of the Identified Staff leaves, during the non-competition period.
In addition, in accordance with Rule 40.1 of Circular 2/2016 of the Bank of Spain, it is stated that of the 21cases of payments for early termination of contract, 10 of them have exceeded two annuities of the fixed remuneration.
Payments were also made in 2021 for amounts deferred from previous years whose payment corresponded in said financial year. The following table shows the amounts of deferred remuneration from previous years awarded in 2021, distinguishing between the amounts of such remuneration that have been paid in the year and the amounts that, as of December 31, 2021 remain deferred.
Table of Contents
| BBVA. PILLAR 3 2021 | 6. INFORMATION ON REMUNERATION | P. 219 |
Table 95. EU REM3 - Deferred remuneration (Thousand euros)
Deferred and | Total amount of deferred remuneration awarded for previous performance periods | Of which due to vest in the financial year(2) | Of which vesting in subsequent financial years | Amount of performance adjustment made in the financial year to deferred remuneration that was due to vest in the financial year | Amount of performance adjustment made in the financial year to deferred remuneration that was due to vest in future performance years | Total amount of adjustment during the financial year due to ex post implicit adjustments (i.e. changes of value of deferred remuneration due to the changes of prices of instruments) | Total amount of deferred remuneration awarded before the financial year actually paid out in the financial year | Total of amount of deferred remuneration awarded for previous performance period that has vested but is subject to retention periods | ||||||||||||||||||||||||
MB Supervisory function | — | — | — | — | — | — | — | — | ||||||||||||||||||||||||
Cash-based | — | — | — | — | — | — | — | — | ||||||||||||||||||||||||
Shares or equivalent ownership interests | — | — | — | — | — | — | — | — | ||||||||||||||||||||||||
Share-linked instruments or equivalent non-cash instruments | — | — | — | — | — | — | — | — | ||||||||||||||||||||||||
Other instruments | — | — | — | — | — | — | — | — | ||||||||||||||||||||||||
Other forms | — | — | — | — | — | — | — | — | ||||||||||||||||||||||||
MB Management function(1) | 1,923 | 1,248 | 675 | — | — | (342 | ) | — | 553 | |||||||||||||||||||||||
|
|
|
|
|
|
|
|
|
|
|
|
|
|
|
| |||||||||||||||||
Cash-based | 965 | 695 | 270 | — | — | — | — | — | ||||||||||||||||||||||||
Shares or equivalent ownership interests | 958 | 553 | 405 | — | — | (342 | ) | — | 553 | |||||||||||||||||||||||
Share-linked instruments or equivalent non-cash instruments | — | — | — | — | — | — | — | — | ||||||||||||||||||||||||
Other instruments | — | — | — | — | — | — | — | — | ||||||||||||||||||||||||
Other forms | — | — | — | — | — | — | — | — | ||||||||||||||||||||||||
Other senior management(1) | 1,900 | 1,191 | 710 | — | — | (331 | ) | — | 535 | |||||||||||||||||||||||
|
|
|
|
|
|
|
|
|
|
|
|
|
|
|
| |||||||||||||||||
Cash-based | 941 | 656 | 285 | — | — | — | — | — | ||||||||||||||||||||||||
Shares or equivalent ownership interests | 959 | 535 | 425 | — | — | (331 | ) | — | 535 | |||||||||||||||||||||||
Share-linked instruments or equivalent non-cash instruments | — | — | — | — | — | — | — | — | ||||||||||||||||||||||||
Other instruments | — | — | — | — | — | — | — | — | ||||||||||||||||||||||||
Other forms | — | — | — | — | — | — | — | — | ||||||||||||||||||||||||
Other identified staff | 33,181 | 31,998 | 1,183 | — | — | (7,571 | ) | — | 12,241 | |||||||||||||||||||||||
|
|
|
|
|
|
|
|
|
|
|
|
|
|
|
| |||||||||||||||||
Cash-based | 20,230 | 19,757 | 473 | — | — | — | — | — | ||||||||||||||||||||||||
Shares or equivalent ownership interests | 12,951 | 12,241 | 710 | — | — | (7,571 | ) | — | 12,241 | |||||||||||||||||||||||
Share-linked instruments or equivalent non-cash instruments | — | — | — | — | — | — | — | — | ||||||||||||||||||||||||
Other instruments | — | — | — | — | — | — | — | — | ||||||||||||||||||||||||
Other forms | — | — | — | — | — | — | — | — | ||||||||||||||||||||||||
Total amount | 37,004 | 34,438 | 2,567 | — | — | (8,244 | ) | — | 13,329 | |||||||||||||||||||||||
|
|
|
|
|
|
|
|
|
|
|
|
|
|
|
| |||||||||||||||||
| (1) | Each of these columns includes remuneration for executive directors and other members of Senior Management who held such position as of December, 31 2021. Information on remuneration and other benefits to the Board of Directors and members of the Bank’s Senior Management is detailed in Note 54 of the Consolidated Financial Statements for 2021. |
| (2) | In addition, the cash portion of the deferred remuneration awarded in respect of previous performance periods that has been vested in 2021 has been updated in accordance with the year-on-year CPI. These amounts are as follows: 22 thousand euros for executive directors, 13 thousand euros for other members of Senior Management and 794 thousand euros for the rest of the Identified Staff. |
Table of Contents
| BBVA. PILLAR 3 2021 | 6. INFORMATION ON REMUNERATION | P. 220 |
The number of employees receiving remuneration of €1 million or more is as follows:
Table 96. EU REM4 - Remuneration of €1 million or more per year
EUR | Identified staff that are high earners as set out in Article 450(i) CRR | |||
1 000 000 to below 1 500 000 | 27 | |||
1 500 000 to below 2 000 000 | 11 | |||
2 000 000 to below 2 500 000 | 7 | |||
2 500 000 to below 3 000 000 | 4 | |||
3 000 000 to below 3 500 000 | 2 | |||
3 500 000 to below 4 000 000 | — | |||
4 000 000 to below 4 500 000 | — | |||
4 500 000 to below 5 000 000 | — | |||
5 000 000 to below 6 000 000 | — | |||
6 000 000 to below 7 000 000 | 1 | |||
7 000 000 to below 8 000 000 | 1 | |||
| (*) | Includes the sum of the fixed remuneration received in 2021 and the total variable remuneration corresponding to 2021. Of the Annual Variable Remuneration 2021, 60% has been deferred and therefore is not vested, being subject to multi-year performance indicators related to the Risk Appetite Framework and shareholder return that may reduce its amount (never increase it) and to malus clauses. |
Table of Contents
| BBVA. PILLAR 3 2021 | 6. INFORMATION ON REMUNERATION | P. 221 |
The table below gives the total remuneration of the Identified Staff for the year 2021, broken down by area of activity:
Table 97. EU REM5 - Information on remuneration of staff whose professional activities have a material impact on institutions’ risk profile (identified staff) (Thousand euros)
| Management body remuneration | Business areas | |||||||||||||||||||||||||||||||||||||||
| MB Supervisory function | MB Management function | Total MB | Investment banking(3) | Retail banking(4) | Asset management(5) | Corporate functions(6) | Independent internal control functions(7) | All other(8) | Total | |||||||||||||||||||||||||||||||
Total number of identified staff | 332 | |||||||||||||||||||||||||||||||||||||||
Of which: members of the MB(1) | 13 | 2 | 15 | |||||||||||||||||||||||||||||||||||||
Of which: other senior management(1) | 1 | 3 | — | 9 | 3 | — | ||||||||||||||||||||||||||||||||||
Of which: other identified staff | 46 | 59 | 4 | 103 | 89 | — | ||||||||||||||||||||||||||||||||||
|
|
|
|
|
|
|
|
|
|
|
|
|
|
|
|
|
| |||||||||||||||||||||||
Total remuneration of identified staff(2) | 4,395 | 14,310 | 18,705 | 40,712 | 47,256 | 2,947 | 81,235 | 43,708 | — | |||||||||||||||||||||||||||||||
|
|
|
|
|
|
|
|
|
|
|
|
|
|
|
|
|
| |||||||||||||||||||||||
Of which: variable remuneration | — | 7,468 | 7,468 | 16,397 | 17,149 | 1,168 | 26,311 | 14,708 | — | |||||||||||||||||||||||||||||||
Of which: fixed remuneration | 4,395 | 6,843 | 11,237 | 24,315 | 30,107 | 1,779 | 54,924 | 29,000 | — | |||||||||||||||||||||||||||||||
| (1) | Each of these columns includes remuneration for non-executive directors, executive directors and other members of Senior Management who held such position as of December, 31 2021. |
| (2) | Includes the sum of the fixed remuneration received in 2021 and the total variable remuneration corresponding to financial year 2021, which includes both the Annual Variable Remuneration and, for the purposes of this report, other payments considered variable under applicable regulations. Deferred variable remuneration is not vested and is subject to multi-year performance indicators related to the Risk Appetite Framework and shareholder return, which may reduce (but never increase) such deferred amounts, as well as to malus clauses. |
Regarding the “discretionary pension benefits” (15% of the annual contribution agreed to cover the retirement contingency of the Chairman and members of Senior Management), detailed information can be found in Note 54 of the Consolidated Financial Statements for 2021, in the section on pension commitments.
| (3) | Includes trading and other investment banking activities. |
| (4) | Includes Retail, Business, Corporate and Insurance Banking activities. |
| (5) | Includes Asset Management and Private Banking activities. |
| (6) | Includes support areas for the BBVA Group and business support areas (Finance, Legal, Human Resources, etc.). |
| (7) | Includes Risk Management, Internal Audit and Compliance activities. |
| (8) | Other activities not included in the previous categories. |
Table of Contents
| BBVA. PILLAR 3 2021 | 7. INFORMATION ON THE CORPORATE GOVERNANCE SYSTEM | P. 222 |
7. Information on the Corporate Governance System
| 7.1. | Members of the Board of Directors of BBVA | 224 | ||
| 7.2. | Selection, suitability and diversity policy | 228 | ||
| 7.3. | Committees of the Board of Directors | 229 | ||
| 7.4. | Information flow on risk | 231 | ||
Table of Contents
| BBVA. PILLAR 3 2021 | 7. INFORMATION ON THE CORPORATE GOVERNANCE SYSTEM | P. 223 |
BBVA has a solid and effective Corporate Governance System, which is constantly evolving to adapt to the Bank’s strategy and to its particular circumstances and needs, always in line with the Corporate Culture and Values that define BBVA’s identity.
This System is geared towards promoting BBVA’s objectives and the long-term interests and has taken shape over time on the basis of the following pillars:
| 1. | An appropriate composition of the governing bodies. |
| 2. | A clear distribution of functions and interaction among them and with Management. |
| 3. | A sound decision-making process and a robust informational model. |
| 4. | A comprehensive monitoring, oversight and control system; and |
| 5. | A well-integrated parent-subsidiary relationship model that allows for a coherent internal governance at Group level. |
The information regarding Entity’s corporate governance of this Report is complemented by the 2021 Annual Corporate Governance Report (IAGC) which is an integral part of the Management Report, which has been submitted to the General Shareholders’ Meeting, to be held on March 18, 2022, by the Board of Directors; the Corporate Governance Overview in BBVA 2021 document; and the BBVA Board of Directors selection, suitability and diversity policy; which are all of them available on the BBVA corporate website (www.bbva.com), in the Shareholders and Investors – Corporate Governance and Remuneration Policy section.
7.1. Members of the Board of Directors of BBVA
Below is the composition of the BBVA Board of Directors for the year ended December 31, 2021, along with information on their profiles:
| • | Carlos Torres Vila has been Chairman of the BBVA Board of Directors since December 2018 and he is also Chair of the Executive Committee and the Technology and Cybersecurity Committee of the Board of Directors. He is also non-executive director of the following entities of the BBVA Group: Grupo Financiero BBVA México, S.A. de C.V. and BBVA México, S.A., Institución de Banca Múltiple, Grupo Financiero BBVA México. Previously, he was Chief Executive Officer of BBVA from May 2015 to December 2018. He joined the BBVA Group in 2008 and has held various high-ranking roles since then, which include: Head of Digital Banking from March 2014 to May 2015 and Head of Strategy and Corporate Development from January 2009 to March 2014. In addition, he previously held positions of responsibility in other companies, with his roles as Chief Financial Officer, Corporate Director of Strategy and member of the Executive Committee of Endesa, being of particular note, as well as his elected partnership at McKinsey & Company. He holds a degree in Electrical Engineering (BSc) and in Business Administration from the Massachusetts Institute of Technology (MIT) and a degree in Law from the National Distance Education University (UNED). He also completed a master’s degree in Management (MS) at the MIT Sloan School of Management. |
| Count of positions in accordance with banking regulations* | 1 executive position** (executive director of BBVA and non-executive director of BBVA Group entities**) |
| • | Onur Genç has been Chief Efecutive Officer of BBVA since December 2018. Furthermore, he is non-executive director of the following entities of the BBVA Group: Grupo Financiero BBVA México, S.A. de C.V. and BBVA México, S.A., Institución de Banca Múltiple, Grupo Financiero BBVA México. He was Chairman and CEO of BBVA USA and Country Manager of BBVA in the United States between January 2017 and December 2018, Deputy CEO of Garanti BBVA between 2015 and 2017 and Executive Vice President of retail and private banking at Garanti BBVA between 2012 and 2015. He has also held positions of responsibility in different McKinsey & Company offices, having previously been a Senior Partner and Manager of its Turkish office. He holds a degree in Electrical Engineering (BSc) from the University of Bogaziçi in Turkey and a master’s degree in Business Administration (MSIA/MBA) from Carnegie Mellon University in the USA. |
| Count of positions in accordance with banking regulations* | 1 executive position** (executive director of BBVA and non-executive director of BBVA Group entities**) |
| • | José Miguel Andrés Torrecillas has been independent director of BBVA since March 2015 and Deputy Chair of the Board of Directors since April 2019. Additionally, he is Chair of the BBVA Appointments and Corporate Governance Committee. Furthermore, he is a member of the Board of Directors of Zardoya Otis, S.A. His professional career began at Ernst & Young as General Managing Partner of Audit and Advisory Services and the Chairman of Ernst & Young Spain until 2014. He has been a member of various |
Table of Contents
| BBVA. PILLAR 3 2021 | 7. INFORMATION ON THE CORPORATE GOVERNANCE SYSTEM | P. 224 |
organisations such as the ROAC (Official Registry of Auditors), the REA (Registry of Economic Auditors), the Governing Board of the Spanish Institute of Financial Analysts, Empresa y Sociedad Foundation, Spanish Institute of Chartered Accountants, Advisory Board of the Institute of Internal Auditors; and of the Institute of Chartered Accountants in England & Wales (the ICAEW). He holds a degree in Economic and Business Sciences from Complutense University of Madrid and completed post-graduate studies in Management Programmes from IESE, Harvard and IMD.
| Count of positions in accordance with banking regulations* | 2 non-executive positions (BBVA and Zardoya Otis, S.A.) |
| • | Jaime Félix Caruana Lacorte was appointed independent director of BBVA in March 2018 and has been Chair of the BBVA Audit Committee since April 2019. He currently develops activities in various international forums and in foundations such as Group of 30 (G-30), Spanish Aspen Institute Foundation, he is President of the International Center for Monetary and Banking Studies’ (ICMB) Foundation Board and he is member of the China Banking and Insurance Regulatory Commission’s (CBIRC) International Advisory Committee. He was General Manager of the Bank for International Settlements (BIS) between 2009 and 2017. Between 2006 and 2009 he was Director of the Monetary and Capital Markets Department and Financial Counsellor to the Managing Director of the International Monetary Fund (IMF); between 2003 and 2006 he was Chairman of the Basel Committee on Banking Supervision; between 2000 and 2006 he was Governor of the Bank of Spain; and between 1999 and 2000 he was General Director of Supervision of the Bank of Spain. He holds a degree in Telecommunications Engineering from the Escuela Técnica Superior de Ingenieros de Telecomunicación (ETSIT) of the Universidad Politécnica de Madrid and he is a Commercial Technician and State Economist. |
| Count of positions in accordance with banking regulations* | 1 non-executive position (BBVA) |
| • | Raúl Catarino Galamba de Oliveira was appointed independent director of BBVA in March 2020. He is independent Chair of the Board of Directors of CTT – Correios de Portugal, S.A. and non-executive director in companies of José de Mello Group (José de Mello Capital and José de Mello Saúde). His career path has been mainly linked to the firm McKinsey & Company, where he was appointed partner in 1995 and Director of the Portugal office in 2000. In this firm he has held other senior positions, including Managing Partner of Spain and Portugal between 2005 and 2011, Managing Partner of |
Global Risk practice between 2013 and 2016, member of the Global Shareholders’ Board from 2005 to 2011, member of the Global Partner Election and Evaluation Committees between 2001 and 2017, member of the Remuneration Committee from 2005 to 2013 and Chairman of the Global Learning Board from 2006 to 2011. He is a graduate in Mechanical Engineering from the Instituto Superior Técnico (IST) in Portugal, holds a master’s degree (MS) in Mechanical Engineering from IST and an MBA from the Nova School of Business Economics in Portugal.
| Count of positions in accordance with banking regulations* | 3 non-executive positions** (BBVA, CTT-Correios de Portugal, S.A. and companies of José de Mello Group**) |
| • | Belén Garijo López has been independent director of BBVA since March 2012 and she is Chair of the BBVA Remuneration Committee. She is Chair of the Executive Board and CEO of Merck Group, member of the Board of Directors of L’Oréal and, since 2011, has been Chair of the International Senior Executive Committee (ISEC) of Pharmaceutical Research and Manufacturers of America (PhRMA). She has held various positions of responsibility at Abbot Laboratories (1989-1996), Rhône-Poulenc (1996-1999), Aventis Pharma (1999-2004), Sanofi Aventis (2004-2011), and Merck (since 2011). She is graduated in Medicine from the University of Alcalá de Henares in Madrid and a specialist in Clinical Pharmacology at Hospital de La Paz – Autonomous University of Madrid. She also holds a master’s degree in Business and Management from the Ashridge Management School (UK). |
| Count of positions in accordance with banking regulations* | 1 executive position (Merck Group) and 2 non-executive positions (BBVA and L’Oréal) |
| • | Sunir Kumar Kapoor has been independent director of BBVA since March 2016. Currently, he is independent director of Stratio Big Data and non-executive director of Deep Image Analytics, Inc. and of McLaren Technology Adquisition Corp. He is also Operating Partner in Atlantic Bridge Capital and advisor to the CEO at mCloud Technologies Corp. Among other roles, he has served as Chairman and CEO of UBmatrix Incorporated from 2005 to 2011, Executive Vice President and Chief Marketing Officer of Cassatt Corporation from 2004 to 2005, Vice President of Collaboration Suite (Oracle Corporation) from 2002 to 2004, Founder and CEO of Tsola Incorporated from 1999 to 2001, Chairman and CEO of E-Stamp Corporation from 1996 to 1999 and Vice President of Strategy, Marketing and Planning at Oracle Corporation from 1994 to 1996. He holds a bacherlo’s in Physics from the University of Birmingham and a master’s in Computer Systems from Cranfield Institute of Technology. |
Table of Contents
| BBVA. PILLAR 3 2021 | 7. INFORMATION ON THE CORPORATE GOVERNANCE SYSTEM | P. 225 |
| Count of positions in accordance with banking regulations* | 4 non-executive positions (BBVA, Stratio Big Data, Deep Image Analytics, Inc. and McLaren Technology Adquisition Corp.) |
| • | Lourdes Máiz Carro has been independent director of BBVA since March 2014. She was Secretary of the Board of Directors and Director of Legal Services at Iberia, Líneas Aéreas de España from 2001 to 2016. She has also been a director of several companies, including Renfe, GIF (Gerencia de Infraestructuras Ferroviarias – Railway Infraestructure Administrator, now ADIF), the ICO (Instituto de Crédito Oficial – Official Credit Institution), Aldeasa and Banco Hipotecario. In 1992, she became Attorney for the State and practised her profession in the Spanish Ministry of Public Administration, where she was appointed deputy to the Director until 1993. From 1993 to 2001 she held various senior positions in the Public Administration, including Director of the Cabinet of the Assisstant Secretary of Public Administration and General Director of the Sociedad Estatal de Participaciones Patrimoniales (SEPPA) within the Ministry of Economy and Finance. She holds a bachelor’s degree in Law and Philosophy and Educational Sciences from Complutense University of Madrid, and a doctorate in philosophy. |
| Count of positions in accordance with banking regulations* | 1 non-executive position (BBVA) |
| • | José Maldonado Ramos has been director of BBVA since January 2000, with the status of external. Over the course of his professional career, he has held the positions of Secretary of the Board of Directors at a number of companies, must notably as Corporate General Secretary of Argentaria, before taking up the position of Director and General Secretary and Secretary of the Board of Directors of BBVA until December 2009, when he stepped down from his executive duties continuing as a member of the Board. Also, he has been Board Secretary and Director of Legal Services for Empresa Nacional para el Desarrollo de la Industria Alimentaria, S.A. (Endiasa); Astilleros Españoles, S.A.; and Iberia Líneas Aéreas de España, S.A. He holds a Law degree from Complutense University of Madrid and in 1978, he passed State exams and became an Attorney for the State. |
| Count of positions in accordance with banking regulations* | 1 non-executive position (BBVA) |
| • | Ana Cristina Peralta Moreno was appointed independent director of BBVA in March 2018. She is currently serving as an independent director of Grenergy Renovables, S.A. and of Inmobiliaria |
Colonial, SOCIMI, S.A. She was previously Chief Risk Officer and a member of the Bankinter Management Committee, and Chief Risk Officer and member of the Banco Pastor Management Committee. She has also held various positions at a number of financial organisations, notably serving as an independent director at Deutsche Bank SAE; independent director at Banco Etcheverría; independent director at Grupo Lar Holding Residencial, S.A.U. and Senior Advisor at Oliver Wyman Financial Services. She is a graduate in Economic and Business Sciences from Complutense University of Madrid. She also has a Programme for Management Development (PMD) at Harvard Business School and PADE (Programa de Alta Dirección de Empresas - senior management programme) at IESE. |
| Count of positions in accordance with banking regulations* | 3 non-executive positions (BBVA, Grenergy Renovables, S.A. and Inmobiliaria Colonial SOCIMI, S.A.) |
| • | Juan Pi Llorens has been independent director of BBVA since July 2011 and has been Lead Director of BBVA since April 2019. He is also Chair of BBVA’s Risk and Compliance Committee. In addition, he is Chairman of the Board of Directors of Ecolumber, S.A. and non-executive director of the following companies at Oesía Group: Oesía Networks, S.L., Tecnobit, S.L.U. and UAV Navigation, S.L. He has had a professional career at IBM holding various senior positions at the national and international level, including Vice President of Sales at IBM Europe from 2005 to 2008, Vice President of Technology & Systems at IBM Europe from 2008 to 2010 and Vice President of the Financial Services Sector in the Growth Markets Units (GMU) in China from 2009 to 2011. He has also served as Executive Chairman of IBM Spain between 1998 and 2001. He holds a degree in Industrial Engineering from the Universidad Politécnica de Barcelona and completed the PDG (Programa en Dirección General – general management programme) at IESE. |
| Count of positions in accordance with banking regulations* | 3 non-executive positions (BBVA, Ecolumber, S.A. y Osesía’s group entities) |
| • | Ana Leonor Revenga Shanklin was appointed independent director of BBVA in March 2020. She currently develops activities in academic field and of foundations such as Senior Fellow at The Brookings Institution since 2018, Adjunct Professor at the Walsh School of Foreign Service at Georgetown University since 2019 and Chair of the ISEAK Foundation Board of Trustees since 2018. Her career path has been mainly linked to World Bank, where she has held various senior positions, |
Table of Contents
| BBVA. PILLAR 3 2021 | 7. INFORMATION ON THE CORPORATE GOVERNANCE SYSTEM | P. 226 |
including Senior Global Director of Poverty and Equity between 2014 and 2016 and Deputy Chief Economist between 2016 and 2017. She is a graduate (BA) in Economics and Mathematics from Wellesley College in the United States, she completed a graduate programme (MA) in Economic Sciences at Harvard University in the United States as well as a PhD in Economic Sciences, also from Harvard University; and a Certificate in Human Rights from the Faculty of Law at the University of Geneva (Switzerland).
| Count of positions in accordance with banking regulations* | 1 non-executive position (BBVA) |
| • | Susana Rodríguez Vidarte has been director of BBVA since May 2002, with the status of external. She has been Professor of Strategy at the Faculty of Economics and Business Administration at the University of Deusto and a non-practising member of the Institute of Accounting and Accounts Auditing. She was Dean of the Faculty of Economics and Business Administration at the University of Deusto from 1996 to 2009, Director of the Instituto Internacional de Dirección de Empresas (INSIDE) from 2003 to 2008 and Director of the Postgraduate Area from 2009 to 2012. She holds a PhD in Economic and Business Administration from the University of Deusto. |
| Count of positions in accordance with banking regulations* | 1 non-executive position (BBVA) |
| • | Carlos Vicente Salazar Lomelín was appointed external director of BBVA in March 2020. He has been Chairman of Mexico’s Business Coordinating Council since 2019 and independent director of Sukarne, S.A. de C.V. and Alsea, S.A.B. de C.V. since 2017 y 2019, respectively. Furthermore, he is non-executive director at the following entities of BBVA Group: Grupo Financiero BBVA México, S.A. de C. V., BBVA México, S.A., Institución de Banca Múltiple, Grupo Financiero BBVA México, BBVA Seguros México, S.A. de C.V., Grupo Financiero BBVA México, BBVA Pensiones México, S.A. de C. V., Grupo Financiero BBVA México and BBVA Seguros Salud México, S.A. de C.V., Grupo Financiero BBVA México. His career path has also been linked to the Grupo Fomento Económico Mexicano S.A.B. de C.V. (Femsa) until 2019, in roles such as General Manager of Cervecería Cuauhtémoc-Moctezuma and General Manager of Femsa from 2014 to 2017. He holds a bachelor’s degree in Economics and postgraduate studies in Business Administration from the Monterrey Institute of Technology and Higher Education. |
| Count of positions in accordance with banking regulations* | 3 non-executive positions** (entities of BBVA Group**, Sukarne, S.A. de C.V. and Alsea, S.A.B. de C.V.) |
| • | Jan Paul Marie Francis Verplancke has been independent director of BBVA since 2018. He is currently an advisor to the Internal Advisory Board at Abdul Latif Jameel. In his professional career he has served as Chief Information Officer (CIO) and Group Head of Technology and Banking Operations at Standard Chartered Bank, from 2004 to 2015, Vice President of Technology and Chief Information Officer (CIO) at Dell from 1999 to 2004 as well as Vice President and Chief of Architecture and Vice President of Information of the Youth Category at Levi Strauss between 1994 and 1999. He holds a bachelor’s degree in Sciences, specialising in Computer Science, from the Programming Centre of the North Atlantic Treaty Organization (NATO) in Belgium. |
| Count of positions in accordance with banking regulations* | 1 non-executive position (BBVA) |
* The applicable banking regulation (Act 10/2014 on the regulation, supervision and solvency of credit institutions and the Circular 2/2016 on the supervision and solvency) stipulates that directors of credit institutions may not simultaneously hold more positions tan those provided for in the following combinations: a) one executive position and two non-executive positions; or b) four non-executive positions.
** In accordance with Rule 34.2 of Circular 2/2016, on the supervision and solvency, executive or non-executive positions held within the same group will count as a single position; as well as that the existence of an executive position in the joint count of several positions will determine the classification of the position resulting from the set as executive.
Moreover, in accordance with Rule 34.3 of this Circular, positions held in non-profit organizations or entities or companies pursuing non-commercial purposes will not count when determining the maximum number of positions provided in the previous star “*”.
The Board of Directors has also submitted to the General Shareholders’ Meeting, planned to be held on March 18, 2022, the appointment of Conniee Hedegaard Koksbang, for the statutory period of three years, with the status of independent director9. She has had an extensive professional career in the public sector in Denmark and the European Union, having held some senior
| 9 | Regarding the three directors of BBVA whose statutory term of three years end at 2022 (Torres Vila, Genç and Kapoor), to the aforementioned General Shareholders’ Meeting have been proposed the reelection of Carlos Torres Vila and Onur Genç. |
Table of Contents
| BBVA. PILLAR 3 2021 | 7. INFORMATION ON THE CORPORATE GOVERNANCE SYSTEM | P. 227 |
international posts, mainly in relation to sustainability and the fight against climate change (such as EU Commissioner for Climate Action or Danish Minister in charge of these matters).
She is currently an independent director of Danfoss A/S; non-executive director at Cadeler A/S.; non-executive director at Gazelle Wind Power Limited, but she will leave such position before taking over her position of director of BBVA; and she is also member of the supervisory board at Nordex SE, but she will leave such position at its Annual Shareholders’ Meeting to be held in the coming weeks. Moreover, she develops activities in international
fórums and organizations and in foundations such as member of the Supervisory Board of the European Climate Foundation, Chairman of the OECD’s Round Table on Sustainable Development, member of the Climate and Environment Advisory Council of the European Investment Bank (EIB), Chairman of the Board of Trustees at the KR Foundation, Chairman of CONCITO, Chairman of the European Commission’s Mission Adaptation to Climate Change, including Social Change, and Chairman of the Board at Aarhus University, and member of the Sustainability Council at Volkswagen.
7.2. Selection, sustainability and diversity policy
The Bank has a Policy on the selection, suitability and diversity of the BBVA Board of Directors, (the Selection Policy) approved by the Board of Directors at the end of the 2020 financial year that sets out the principles and criteria governing the process for the selection, appointment and renewal of BBVA Board members, as well as the legal requirements that directors must meet, including those relating to suitability. The Policy also provides for elements and objectives concerning the composition of the corporate bodies, including diversity, the purpose of which is to ensure that the corporate bodies properly and effectively exercise their functions. All of this is done in the Bank’s best corporate interest.
In this sense, with regard to diversity, the Selection Policy states that the BBVA Board of Directors will promote diversity in the composition of the Bank’s corporate bodies by encouraging the inclusion of people with different profiles, qualities, knowledge, training and experience.
In addition, to ensure that the corporate bodies have an adequate and balanced composition, the rotation and selection processes will encourage diversity of their members, based on the needs of the Bank at all times.
In particular, efforts will be made to ensure that the Board of Directors has a balanced representation of men and women. To this end, the Appointments and Corporate Governance Committee has set a target for representation of the lesser-represented gender, namely that female directors should represent at least 40% of the Board of Directors by the end of the 2022 financial year and beyond, with the figure not dropping below 30% prior to this.
Additionally, the aim is for the composition of the Board of Directors to feature an appropriate balance between the different types of director, for non-executive directors to represent an ample majority over executive directors and for the number of independent directors to account for at least 50% of the total seats.
The corporate bodies will also be assessed to ensure that they have a mix of individuals who have experience and
knowledge of the Group, its businesses and the financial sector in general, as well as others who have training, skills, knowledge and experience in other areas and sectors relevant to the Bank.
In addition, BBVA’s corporate bodies may take any other diversity factor into consideration that is relevant at any given moment to adapt the composition of the corporate bodies to the needs of the Bank. They may take into account criteria such as gender diversity, academic profile, professional experience, knowledge, disability, origin or age, thus being able to achieve an adequate balance aimed at ensuring that the corporate bodies can properly and effectively exercise their functions.
Furthermore, within the framework of the continuous Board rotation process, the Appointments and Corporate Governance Committee, in performing its duties, has in recent financial years put in place different selection processes for directors aimed at identifying the most suitable candidates at all times, based on the needs of the Corporate Bodies, and that these favour diversity in the manner specified in preceding sections.
In this way, the Board currently has a diverse composition, combining people with extensive experience and knowledge of the financial and banking field with profiles that possess experience and knowledge in different areas that are of interest to the Bank and its Group, such as accounting and auditing, risk management, innovation and information technologies, macroeconomic strategy and environment, human resources and remuneration, institutional, legal and regulatory fields and corporate governance and sustainability. This enables the Board overall to have a suitable balance in its composition and suitable knowledge of the Bank’s and the Group’s environment, activities, strategies and risks, helping it to better perform its functions.
In particular, the Board meets the objectives set out in its Regulations and in the Selection Policy, namely there is an appropriate balance between the different types of director. Non-executive directors make up 86.67% of all
Table of Contents
| BBVA. PILLAR 3 2021 | 7. INFORMATION ON THE CORPORATE GOVERNANCE SYSTEM | P. 228 |
directors (thereby attaining the objective of having a large majority of non-executive directors), independent directors make up two-thirds of the board (thereby attaining the objective of having at least 50% independent directors) and women make up one-third of all board members, thereby attaining the current target of at least 30%. The Board is also highly diverse in terms of skills, knowledge and experience at both the national and international levels, which has been consolidated in recent years, in addition to the diversity of experience within the Board itself.
In the context of the Board’s continuous rotation process and taking into account the continuous analysis of the structure, size and composition of the Board of Directors, the Committee developed a director selection process in 2021, inspired by the principles of the Board of Directors’ Regulations and Selection Policy, as a result of which it was proposed to the General Meeting in March 2022 that a new director be appointed with independent status, and that two directors be re-appointed with executive director status.
Should the mandatory approvals be granted by the General Meeting, this would continue to contribute to attaining the objectives set out in the Selection Policy, and specifically that women should make up 40% of all directors (thereby attaining the objective of the Selection Policy that women make up at least 40% of all directors by the end of 2022). It would also consolidate the knowledge and experience of the Board in areas of relevance to the Bank such as sustainability and institutional and regulatory environment.
Certainly, the Board, as a whole, has an adequate and diverse composition with a thorough knowledge of the environment, strategy, activities, business and risks of the Bank and its Group, resulting in a balanced composition and adapted to the needs of the moment, thus contributing to ensuring that the functions of the Corporate Bodies are developed in the best corporate interest.
7.3. Committees of the Board of Directors
BBVA Corporate Bylaws stipulates that the Board of Directors may, for the better performance of its functions, establish such Committees as it deems necessary to assist it on matters within its remit.
Thus, the Board of Directors has established the following Committees: Executive Committee, Audit Committee, Appointments and Corporate Governance Committee, Remuneration Committee, Risk and Compliance Committee and Technology and Cybersecurity Committee.
The Committees of the Board of Directors, except the Executive Committee, are composed by majority of independent directors (the Audit Committee is composed exclusively by independent directors).
Below is the composition of each Committee as of December 31, 2021:
Table of Contents
| BBVA. PILLAR 3 2021 | 7. INFORMATION ON THE CORPORATE GOVERNANCE SYSTEM | P. 229 |
Table 98. Committes of the Board of Directors
Directors | Executive Committee | Audit Committee | Appointments and Corporate Governance Committee | Remunerations Committee | Risk and Compliance Committee | Technology and Cybersecurity Committee | ||||||
Carlos Torres Vila | X | X | ||||||||||
Onur Genç | X | |||||||||||
José Miguel Andrés Torrecillas | X | X | X | |||||||||
Jaime Caruana Lacorte | X | X | X | |||||||||
Raúl Galamba de Oliveira | X | X | ||||||||||
Belén Garijo López | X | X | X | |||||||||
Sunir Kumar Kapoor | X | |||||||||||
Lourdes Máiz Carro | X | X | ||||||||||
José Maldonado Ramos | X | X | ||||||||||
Ana Peralta Moreno | X | X | ||||||||||
Juan Pi Llorens | X | X | X | |||||||||
Ana Revenga Shanklin | X | |||||||||||
Susana Rodríguez Vidarte | X | X | X | |||||||||
Carlos Salazar Lomelín | X | |||||||||||
Jan Verplancke | X | X |
The Board of Directors holds monthly ordinary meetings in accordance with the annual meeting Schedule drawn up prior to the beginning of the financial year, and extraordinary meetings as often as deemed necessary. The Committees will meet whenever it is convened by its Chair, in accordance with the provisions established in the specific Regulations of each Committee.
Below is detailed the meetings held by the Board of Directors and by its Committees in 2021 financial year:
Table 99. Number of meetings held by the Board of Directors and by its Committees in 2021 financial year
Governing body | Nº meetings in 2021 | |||
Board of Directors | 15 | |||
Executive Committee | 22 | |||
Audit Committee | 15 | |||
Risk and Compliance Committee | 22 | |||
Appointments and Corporate Governance Committee | 5 | |||
Remunerations Committee | 7 | |||
Technology and Cybersecurity Committee | 8 | |||
All the Committees of the Board of Directors have their own regulations, approved by the Board of Directors, which include their compositions, organisational and operational rules, available on the Bank’s corporate website, www.bbva.com, under Shareholders and Investors, Corporate Governance and Remuneration Policy, in the Board Committees section.
The information regarding the activity carried out by each committee in 2021 financial year is included in the 2021 IAGC (section C.2.1); as well as in the report
detailing the activity carried out by each Committee in the exercise of their functions during the 2021 financial year. Both the IAGC and the report of each committee are available on the Bank’s corporate website, www.bbva.com, under Shareholders and Investors, Corporate Governance and Remuneration Policy section.
Table of Contents
| BBVA. PILLAR 3 2021 | 7. INFORMATION ON THE CORPORATE GOVERNANCE SYSTEM | P. 230 |
In accordance with BBVA’s Corporate Governance System, the Board of Directors of the Bank has certain reserved functions in risk-related matters, concerning both the management dimension — specifically, in connection with the adoption of the corresponding most relevant decisions — as well as to the monitoring and supervision of the adopted decisions and the management of the Bank.
In particular, the Board of Directors is responsible for establishing the Group’s risk strategy and, in the exercise of this function, for determining the risk control and management policy, which is materialized in the General Risk Management and Control Model (the “Model”), the BBVA Group’s Risk Appetite Framework and in the framework of the policies for the management of the different types of risks (financial and non-financial) to which the Bank is or may be exposed, and which contain the basic guidelines for managing and controlling risks uniformly across the Group, in a consistent manner with the Model and the Risk Appetite Framework.
Furthermore, in parallel with the function of defining the risk strategy and within the scope of its risk monitoring, supervision and control functions, the Board of Directors monitors the evolution of BBVA Group risks as well as the risks affecting each one of its main geographical and/or business areas, ensuring that they comply with the BBVA Group’s Risk Appetite Framework, and is also responsible for overseeing internal information and control systems.
To guarantee an adequate performance of its management and supervision functions, the Board relies on the work carried out by the different Committees, in accordance with the matters within the scope of their remit and as established in the Regulations of the Board and in their own regulations, as well as on the information and documentation submitted by the executive areas responsible for managing and controlling risks within the Group (the Global Risk Management Area and, as regards non-financial risks and the internal control model, the Regulation and Internal Control Area).
Thus, for the adequate performance of its duties, the Board of Directors of BBVA, as a credit institution, is assisted by the Risk and Compliance Committee, which provides support mainly, in all matters related to the management and supervision of risks, and the Executive Committee, which helps ensure its alignment with the established strategy.
In general, the Risk and Compliance Committee meets twice a month, in order to carry out a permanent and adequate monitoring of the evolution of the risks of the Group.
This Committee is made up of non-executive directors, and a majority of independent directors, including its Chairman, all of them with sufficient knowledge, capacity and experience to understand and control the risk strategy of the Bank and its Group.
The Risk and Compliance Committee’s main task is to support the Board of Directors in determining and monitoring the Group’s risk control and management policy, which includes both financial and non-financial risks (including compliance risk), with the exception of the remits assigned to the Audit Committee (risks related to the supervision of internal financial control), the Technology and Cybersecurity Committee (on technology risk) and the Executive Committee (on business and reputational risks).
Thus, the Risk and Compliance Committee assists the Board in the establishment of the Group’s risk control and management policy, submitting to the Board a Model and Group’s Risk Appetite Framework proposal, based on the strategic-financial approach determined by the Board of Directors or the Executive Committee, thus ensuring its alignment with the Group’s Strategic Plan in force at all times. In addition, the Risk and Compliance Committee proposes, in a manner consistent with the Group’s Risk Appetite Framework approved by the Board, the Group’s financial and non-financial risk control and management policies; and also participates in the decision-making process regarding the strategic corporate projects or transactions presented to the Board of Directors or the Executive Committee, assessing the associated risks.
On the other hand, the Risk and Compliance Committee monitors the evolution of the risks faced by the Group and their level of adequacy with regard to the Group’s Risk Appetite Framework and the established general policies, with greater frequency and with a sufficient degree of granularity, which enables the adequate performance of its functions.
This monitoring of the different types of risks, financial and non-financial, is presented to the Risk and Compliance Committee through three types of reports: (i) a general overview of the Group’s risks, provided monthly by the Head of Global Risk Management, supplemented, with respect to non-financial risks, with the monthly report from the Head of Regulation & Internal Control; (ii) an overview on the most relevant risks of the main geographical areas in which the Group develops its activity, through six-monthly reports from the Heads of Risks in each relevant geographical area; and (iii) an update by type of risk, provided by means of the regular reports from the executives responsible for each type of risk (financial and non-financial) within the Group, and on a more frequent basis in credit risk
Table of Contents
| BBVA. PILLAR 3 2021 | 7. INFORMATION ON THE CORPORATE GOVERNANCE SYSTEM | P. 231 |
matters (retail and wholesale), as well as in the different non-financial risks (including compliance risk).
On top of the risk monitoring function performed by the Risk and Compliance Committee, the Executive Committee monitors the evolution of the Group’s risk profile through the monthly reports provided by the Head of Global Risk Management.
Besides the activity of both committees on risk-related matters, the Board of Directors itself is informed on a regular basis about the evolution of the Group’s main risks, both financial and non-financial, through the monthly activity reports of the Risk and Compliance Committee, as well as the quarterly reports of the Head of Global Risk Management, the Head of Regulation & Internal Control and the Chair of the Risk and Compliance Committee.
Thus, the Board, with support from its Committees, establishes the Group’s risk strategy and oversees and controls the evolution of the risks in the Group and its main geographical or business areas.
For more details on the activity of the Board of Directors’ committees in risk-related matters in 2021, please refer to BBVA’s 2021 Annual Corporate Governance Report and the 2021 report on Board Committees’ activity, both available on BBVA’s corporate website (www.bbva.com), under the “Shareholders and Investors”, “Corporate Governance and Remuneration Policy” section.
Table of Contents
| BBVA. PILLAR 3 2021 | 8. REPORT ON CLIMATE CHANGE AND OTHER ENVIRONMENTAL AND SOCIAL ISSUES | P. 232 |
8. Report on climate change and other environmental and social issues
8.1. | Committed to sustainability | 234 | ||||
8.2. | Governance model | 235 | ||||
8.3. | Sustainable finance | 236 | ||||
8.4. | Risks and opportunities associated with climate change | 238 | ||||
8.5. | Risk management associated with climate change | 241 | ||||
8.6. | Management of direct and indirect impacts | 249 | ||||
8.7. | Participation in international initiatives | 256 | ||||
8.8. | Sustainability index | 257 | ||||
Table of Contents
| BBVA. PILLAR 3 2021 | 8. REPORT ON CLIMATE CHANGE AND OTHER ENVIRONMENTAL AND SOCIAL ISSUES | P. 233 |
The financial sector and climate change
The fight against climate change is one of the biggest disruptive events of all time, with extraordinary economic consequences to which all actors (governments, regulators, businesses, consumers and society in general) must adapt.
Climate change and the transition toward a low-carbon economy have significant implications on the value chains of most production sectors, and may require significant investments in many industries. However, technological progress in the fields of energy efficiency, renewable energies, efficient mobility and the circular economy will continue to generate new opportunities for all.
Nevertheless, customers, markets and society as a whole not only expect large companies to create value, but to also make a positive contribution to society. In particular, that the economic development to which they contribute with their activity is inclusive.
BBVA is aware of the key role that banking plays in this transition toward a more sustainable world through its financial activity, has adhered to the Principles for Responsible Banking promoted by the UN, the Katowice Commitment and the Collective Commitment to Climate Action and is keen to play a central role, as demanded by society, and to help its customers in their transition toward this sustainable future.
As a financial institution, BBVA has an impact on the environment and society directly through the consumption of natural resources and its relationship with stakeholders; and indirectly (and most importantly) through its lending activity and the projects it finances.
Under Law 7/2021, of May 20, on climate change and energy transition (hereafter Law 7/2021), BBVA has submitted a report (hereafter, Climate Change Report), which includes, among others, the following matters: the organization’s governance structure, the strategic focus, both in terms of adaptation and mitigation of the entity to manage the financial risks associated with climate change, the real and potential impacts of the risks and opportunities associated with climate change, the processes of identification, evaluation, control and management of the risks related to the climate and the metrics, scenarios and objectives used to evaluate and manage the relevant risks and opportunities associated with climate change.
In this context, BBVA has also incorporated this Climate Change Report into the Group’s Management Report, which is attached to the Consolidated Financial Statements for 2021, as covered in the article 32 in the Law 7/2021.
Table 100. Contents index of the Law 7/2021, of May 20, about climate change and energetic transition
Topic | Reporting criteria | |
| Govern | Governance structure of organization, including the role that its various bodies perform, in relation to the identification, evaluation and management of risks and opportunities related to climate change. | |
| Strategy | Strategic approach, in terms of adaptation and mitigation of the entities to manage the financial risks associated with climate change, taking into account the current risks at the time of writing the report, and those that may arise in the future, identifying the actions necessary at that time to mitigate such risks. | |
| Impacts | The real and potential impacts of risks and opportunities associated with climate change on the organization’s activities and its strategy, as well as on its financial planning. | |
| Risk management | The processes for identifying, evaluating, controlling and managing climate-related risks and how these are integrated into its global business risk analysis and its integration into the organization’s global risk management. | |
| Metrics and goals | Metrics, scenarios and objectives used to assess and manage important risks and opportunities related to climate change and, if calculated, the scope 1, 2 and 3 of its carbon footprint and how its reduction is addressed . | |
8.1. Committed to sustainability
BBVA aims to align its activity steadily to the Paris Agreement and use its role as a bank to help its customers through finance, advice and innovative solutions to transition toward a more sustainable future, inspired by the Sustainable Development Goals. Specifically, the Group wants to help face challenges as important as climate change or support inclusive growth. Helping customers in their transition also represents a great opportunity, as it requires an unprecedented level of investment to innovate and deploy new technologies in practically all the sectors.
To this end, in 2021 BBVA has continued to make progress in decarbonizing its portfolio. It has announced its intention of reducing its exposure to coal-related activities to zero, and stopping the finance of companies in these activities by 2030 in developed countries and by 2040 in the rest of the countries where it operates. It has also set intermediate goals to decarbonize its portfolio in four emission-intensive industries, such as electricity generation, automotive, steel and cement which
Table of Contents
| BBVA. PILLAR 3 2021 | 8. REPORT ON CLIMATE CHANGE AND OTHER ENVIRONMENTAL AND SOCIAL ISSUES | P. 234 |
represent 60% of the world’s CO2 emissions10. Moreover, the Group will focus its efforts on supporting customers
with finance, advice and innovative solutions in the joint effort of decarbonization.
Corporate bodies
BBVA’s corporate bodies have defined and driven the Group’s strategy that incorporates sustainability and the fight against climate change as one of its priorities, having approved its basic elements (through its incorporation to the Group’s strategic plan in 2019, and with the approval of the General Sustainability Policy in 2020) and carrying out periodic monitoring of its implementation in the Group.
For the Board of Directors, an essential element of this strategic approach is the integration of sustainability and the fight against climate change into the Group’s activities, managing the risks associated with these areas, and considering them a great opportunity for business in which to support its growth strategy. Combined with this is the establishment of targets which facilitate their execution, supervision and monitoring. This approach allows the Group’s corporate bodies to define the basic lines of action for BBVA as regards the management of opportunities and risks arising from sustainability and oversee their execution by the executive areas in all spheres of the Entity’s operations.
In this work monitoring and supervising the implementation of the Group’s sustainability, the Board is assisted by its committees specialized in their respective areas. Thus, the active role of the Executive Committee is particularly important in driving this strategy in the monitoring of the integration of sustainability in the Group’s processes of business and activity, and their impact on its activity and results in accordance with its monitoring and analysis function of the development of the Group’s key performance indicators.
Also important is the role of the Risk and Compliance Committee, which assists the Board of Directors in the integration of sustainability in the analysis, planning and management of the Group’s risks, and in supervising their execution; that of the Audit Committee, in supervising the public information on sustainability reported to the market; and the Remuneration Committee, in driving the integration of indicators related to sustainability in the Group’s variable remuneration model.
A specific example of this activity is the work of the Board in adopting very important decisions for the Group in the area of sustainability which are described in this report, such as the increased commitment to sustainable finance (Pledge 2025); the adoption of the Net Zero pledge for 2050; the determination of commitments
related to the decarbonization of the portfolio; decisions related to the integration of risks associated with climate change in the management processes; as well as the creation of the Group’s new Sustainability Area, raising the function to the highest executive level of the organization, as described in this report.
In addition to this, there is the work of the corporate supervisory and monitoring bodies for the implementation of the Group’s sustainability strategy and activity, and compliance with the organization’s objectives, which is carried out on the basis of the reports received by the Sustainability Area and the different areas of the Bank which incorporate sustainability into their daily businesses and activities. These reports are carried out for corporate bodies according to their competence, as described in the above paragraphs, either periodically or ad hoc (worth particular mention are the specific presentations drawn up at least twice a year for the Board of Directors and the Executive Committee).
In addition to the above and in order to achieve the best performance of its duties in this matter, the Board considered it necessary to strengthen its own knowledge and experience in sustainability, by onboarding people with extensive knowledge and experience and by a continuous training program to include sustainability-related subjects, such as sustainable finance or main trends that are being developed in the market on this matter.
Transversal integration of sustainability into the executive sphere
BBVA incorporates sustainability as part of its daily activities and everything it does, encompassing not only relations with customers but also internal processes. In this sense, the definition and execution of a strategy, which includes sustainability and climate change as one of its priorities, has a transversal nature, being the responsibility of all areas of the Group to incorporate it progressively into their strategic agenda and their work dynamics.
In 2021, BBVA gave a renewed boost to its strategy of increasing sustainability to the highest executive level of the organization, reporting directly to the Chief Executive Officer and the Group Executive Chairman (in this case, both linked to strategy and transformation), creating the global area Sustainability business area with the aim of
10 According to the International Energy Agency and UNEP.
Table of Contents
| BBVA. PILLAR 3 2021 | 8.REPORT ON CLIMATE CHANGE AND OTHER ENVIRONMENTAL AND SOCIAL ISSUES | P. 235 |
becoming the model bank for customers in sustainability solutions.
In a context in which all the Group employees and areas integrate sustainability into their day-to-day activity, the new global area will design the strategic sustainability agenda, define and promote the lines of work in this area of the different global and transformation units (including Risk, Finance, Talent and Culture, Data, Engineering, and Organization) and develop new sustainable products.
In addition, BBVA has established a network of experts, comprising sustainability specialists from different areas
of the Group (Client Solutions, Corporate & Investment Banking, Global Risk Management, Communication & Responsible Business), coordinated as a network by the global Sustainability area. These experts are responsible for building knowledge in the field of sustainability at the Group. This knowledge is then used to provide customer guidance, support areas in developing new value propositions in the sphere of sustainability, make climate risks part of risk management, and draw up a public agenda and set of sustainability standards.
With respect to finance, in 2021 BBVA increased its Pledge 2025, doubling its initial target of channelling sustainable finance to €200 billion through 2025. From
2018 to 2021, BBVA earmarked a total of €85,817 million in sustainable activities, distributed as follows:
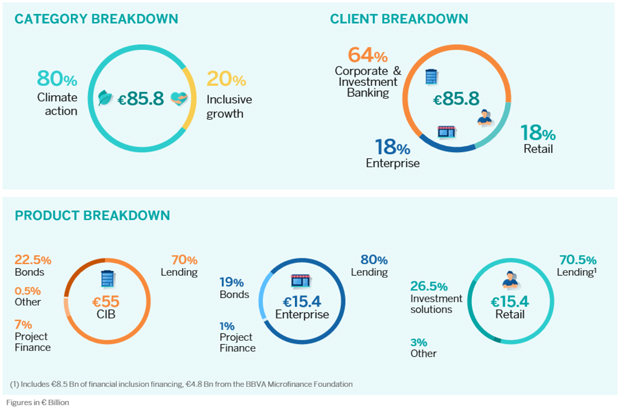
In 2021 the Group has also strengthened its community involvement to support inclusive growth in countries where it operates, for which €550 million will be allocated directly and through its support to foundations between 2021 and 2025. For more information about the community involvement, see the section “Community Commitment” in the chapter “Our stakeholders” in the Group’s Consolidated Management Report.
Among the solutions promoted by BBVA focused on identifying opportunities arising from climate change and inclusive growth, as well as creating value propositions
and offering advice to individual and corporate customers that can be highlighted are:
Sustainable solutions for wholesale (corporate and institutional) customers as well as businesses
In 2021, in the sphere of sustainable corporate lending, the Bank mobilized globally a total of €10,044m in financed linked to the achievement of certain environmental and social indicators (KPI-linked) and linked to the customer’s ESG rating (ESG-linked), both bilaterally and as a syndicate, among which are
Table of Contents
| BBVA. PILLAR 3 2021 | 8.REPORT ON CLIMATE CHANGE AND OTHER ENVIRONMENTAL AND SOCIAL ISSUES | P. 236 |
pioneering operations in the food sector. In Spain, BBVA has been a pioneer in incorporating mechanisms for the donation of part of the profit margin to sustainable or charity projects and BBVA remains one of the leading entities in the market in sustainable finance, having been lead sustainable coordinator in significant deals for the fifth year in a row. Outside Spain, BBVA has spearheaded several landmark operations, including a number of the main syndicated finance deals in Germany, the UK, Belgium, Mexico, Peru and Colombia. BBVA continues to work with its customers to develop new and demanding formats to link its long-term commitment to sustainability and to the objectives set by the European taxonomy and the Paris Agreement respectively.
Furthermore, BBVA remained extremely active in the financing of sustainable projects throughout 2021, participating in the mobilization of €1,274m (BBVA participation) of sustainable finance in the following main areas: (i) renewable projects; (ii) self-generation and energy efficiency; (iii) sustainable mobility projects; (iv) finance of sustainable agriculture; (v) social projects in the health and telecommunication sector to facilitate access to new technologies; and (vi) sustainable infrastructure projects.
Throughout 2021, BBVA has been very active in the issuance of green, social and sustainable bonds, and bonds linked to environmental indicators for customers in the United States, Mexico, South America, Asia and Europe, including Spain, with BBVA’s total disintermediated volume being €6,683m. In 2021 European customers were very active. BBVA continues to support the development of the green bond market in Mexico, Colombia, Argentina and Asia, as lead arrangers of the inaugural issuance of bonds in many of these regions.
Moreover, in the transaction area, BBVA has signed operations for €4,958m, using its sustainable banking framework, as well as adding sustainability-linked transactions to its sustainable product offering. The market for financial products linked to sustainability is relatively new and it is growing rapidly, thereby allowing companies and sectors searching for ways to start or expand their sustainable trajectory to gain access to sustainable financing. Products linked to sustainability are intended to facilitate and support economic activity and growth in both environmental and social spheres. This new approach allows BBVA to actively support its customers in the transformation toward more sustainable business models.
To complete the sustainable offer, in 2020 the ESG Advisory service was created to help global customers in their transition to a sustainable future, with advice based on data and geared to facilitating commitments that customers are assuming, each from a different starting point, to align with the Paris Agreement and make progress in the UN Sustainable Agenda 2030. BBVA offers value-added information on regulation, best
practices and the challenges and opportunities to sectors faced by the path to sustainability.
Moreover, BBVA promotes an overview of the whole range of sustainable products and services that can be offered from the Corporate & Investment Banking area, both in terms of debt and equity. This service has a global scope and is open to all sectors of activity.
Sustainable solutions for retail customers
BBVA wants to support its retail customers adopt more sustainable habits that help reduce their CO2 emissions and wants to do so proactively, through the use of data-based tools and solutions that help control their consumption and emissions. To this end, it is working on making a wide range of investment and finance products available to customers to help them in this transition, adapting to the situation in each of the geographies in which the Group operates.
The sustainable solutions offering in the different countries aims to support energy efficiency and the decarbonization of the economy with products such as financing lines for the acquisition of hybrid and electric vehicles, green mortgages for sustainable housing, or loans for improving the efficiency of homes. In 2021, BBVA achieved its commitment in Spain of offering a sustainable alternative to all its products in this segment.
Also in Spain, in 2021 BBVA became the first entity to use data analytics to calculate the carbon footprint of all its individual customers, obtaining an approximate estimate of CO2 emissions into the atmosphere, based on gas and light bills and payments for fuel.
Also, a line of inclusive growth is being boosted in the retail segment, mobilizing funds to the investment needed to build inclusive infrastructures and support inclusive economic development. Within this line, the products targeted at individuals are credit (cards, loans and mortgages), which comply with the income and/or vulnerability thresholds established for each country. Worth noting is the social mortgage, which is targeted at the segments of the population with the lowest purchasing power, and which subsidizes part of the total amount of the mortgage.
BBVA also supports entrepreneurs by granting loans to natural persons or legal entities which have begun an economic activity within the last 3.5 years, and offering finance to microenterprises, provided that they comply with the threshold levels for revenues established in BBVA’s social taxonomy for each country. Of relevance for this segment is the program for financing female entrepreneurs BBVA has in Turkey, so women who have small and medium-sized enterprises can access loans in preferential conditions.
During 2021, BBVA mobilized a total of €6,471m: €4,250m in Spain; €548m in Mexico; €350m in Turkey; €56m in Colombia; €19m in Peru; and €13m in
Table of Contents
| BBVA. PILLAR 3 2021 | 8. REPORT ON CLIMATE CHANGE AND OTHER ENVIRONMENTAL AND SOCIAL ISSUES | P. 237 |
Argentina, €1,114m through the BBVA Microfinance Foundation and €121m in the United States.
Sustainable investment solutions
In 2021, BBVA Asset Management (BBVA AM), the Group’s investment management unit that brings together all its asset management activities around the world, has made significant progress integrating sustainability, above all in the following aspects:
| • | Incorporation of the ESG extra-financial criteria in the process of investment and risk control decision-making for vehicles and portfolios they manage, both in the investment process and voting policy. |
| • | Commitment to best sustainable investment practices which, in 2021, has consisted in adherence to the Responsible Investment Principles promoted by the United Nations, the Net Zero Asset Managers Commitment, to arrive in 2050 with net zero emission portfolios and the participation in other collective initiatives involving companies and governments. |
| • | Exclusion policies. The exclusion policy affects companies which belong to sectors that are considered intrinsically harmful to society. For its application, BBVA uses exclusion lists of companies and countries, drawn up and updated periodically, with the help of an independent expert advisor. These lists include companies and countries related to defense materiel (military, police and security armaments, ammunition, explosives, etc.). Also excluded are investments in companies that severely infringe the principles of the United Nations Global Compact. |
In 2021, the offer of sustainable products has been extended, meaning products which incorporate sustainable targets or metrics in their investment policy; with a total of 4 new mutual funds (2 in Spain, 1 in Mexico and 1 in Peru) and 7 pension plans (6 in Spain and 1 in Portugal). The assets under management in sustainable solutions at the close of 2021 was €5,598m and net new assets amounted to €1,559m.
Table 101. Assets under management with Sri criteria (BBVA Asset Management. Million Euros)
| 2021 | 2020 | |||||||
Total assets under management | 119,307 | 109,355 | ||||||
Europe | 80,981 | 72,376 | ||||||
Mexico | 30,179 | 26,034 | ||||||
South America | 4,252 | 7,433 | ||||||
Turkey | 3,895 | 3,512 | ||||||
SRI strategy applied | ||||||||
Exclusion (1) | 119,307 | 109,355 | ||||||
Vote (2) | 111,160 | 72,376 | ||||||
Integration (3) | 80,981 | 9,053 | ||||||
| (1) | The exclusion strategy applies to 100% of the assets under management. |
| (2) | The vote strategy applies to 100% of the assets under management in Europe for those instruments, in BBVA AM portfolios, that generate voting rights and their issuers are in the European geographical area. |
| (3) | The integration strategy is applied in SRI pension plans and mutual funds of the Europe business. |
8.4. Risks and opportunities associated with climate change
Climate change risks for BBVA
There are two type of risks that impact the business of BBVA or its customers:
Transition risks
These are the risks pertaining to the transition to a low-carbon economy, and which arise from changes in legislation, the market, consumers, etc., to mitigate and address the requirements derived from climate change.
Table of Contents
| BBVA. PILLAR 3 2021 | 8. REPORT ON CLIMATE CHANGE AND OTHER ENVIRONMENTAL AND SOCIAL ISSUES | P. 238 |
Risk subtype | Risks associated with climate change | Risk description | Time horizon (1) | |||
| Increase in the cost of CO2emissions | Financial risk to BBVA clients whose liquidity or earnings could be harmed from having to face higher costs or, alternatively, higher investments in emission neutralization, resulting from regulatory changes | ST | ||||
| Increased cost of direct emissions from the Bank in its operations | ST | |||||
| Increase in monitoring and tracking requirements | Increased staffing and economic resources for the study and monitoring of the Group’s clients, and tracking of their compliance with environmental requirements | ST | ||||
| Uncertainty for financial agents regarding changes and their implementation | ST | |||||
| Changes in the regulation of existing products and services | Impairment of client asset positions due to the generation of stranded assets (assets that prior to the end of their economic life are no longer able to earn an economic return) | MT | ||||
| Legal and regulatory | Sales drop due to adjustments to offerings, to align with new legal specifications for a product | MT | ||||
Increase in regulatory capital requirements due to risk associated with climate change Increase in regulatory capital requirements due to risk associated with climate change | Possibly different prudential treatment of financial assets in terms of riskweighted assets based on their exposure to physical and transition risks | MT | ||||
| Adverse regulatory changes that may cause certain exposures on BBVA’s climate change balance sheet to have higher capital consumption | ST | |||||
| Risks of environmental lawsuits | Possible lawsuits against BBVA for not complying with environmental regulations in its business or supply chain | ST | ||||
| Risk of lawsuits against third parties | Potential lawsuits for environmental crimes against BBVA clients. BBVA could be impacted by its clients’ loss of solvency resulting from an increase in litigation costs | ST | ||||
| Replacement of existing products and services with lower-emission alternatives | BBVA clients with a position in sectors that are outperformed by alternative technologies could suffer solvency problems and their ability to cope with their credit commitments could be diminished | ST | ||||
| Technological | Failed investment in new technologies | Clients that invest in failed technology may go through solvency difficulties and be unable to meet their credit commitments | ST | |||
| Cost of transitioning to low-emission technology | The investments which BBVA clients need to make to change their production models can be an opportunity but they can also negatively impact the balance sheet structure or profitability of said clients if not done properly. On the other hand, the necessary R&D investments could undermine the clients’ ability to meet their commitments | ST | ||||
| Costs of investing in remodeling and adapting BBVA-owned buildings | ST | |||||
| Changes in demand caused by changes in consumer preferences can lead to falls in sales for BBVA clients and result in loss of profits and solvency | ST | |||||
Changes in (market) trends, financial agent and consumer preferences | Reduction in demand for certain products can cause price falls that affect the valuation of companies’ assets (crude oil reserves, fossil fuel cars, etc.) | ST | ||||
| Increased demand for certain products or services may impact on the price of certain raw materials. While this may be reflected in prices, it may lead to lower profits or the loss of BBVA’s clients’ market share | ST | |||||
| Risk of change in the Bank’s client preferences for not considering the Bank well positioned in the sustainable segment | ST | |||||
| Difficulty or impediments to proper price formation or allocation of financing or investment sums | ST | |||||
| Market | Uncertainty in market signals | Forecasts made by research agencies or services to dictate the strategy of entities may not be fulfilled due to abrupt changes in the market caused by changes in regulations or demand | ST | |||
| Increased cost of raw materials | Sharp changes in the price of raw materials, resulting in changes in supply or energy cost, can lead to deteriorating liquidity and declining profits for clients. It can be mitigated with end-product price increases | ST | ||||
| BBVA’s energy supply cost could also be affected | ST | |||||
| Financial risks | Risk of a significant increase in the cost of financing clients with higher exposure to climate risks, in a way that affects their solvency by making it more difficult for them to cope with their credit commitments | ST | ||||
| Risk of worsening the credit rating of clients with exposure to climate change risks, with the associated adverse effects for BBVA | ST | |||||
Table of Contents
| BBVA. PILLAR 3 2021 | 8. REPORT ON CLIMATE CHANGE AND OTHER ENVIRONMENTAL AND SOCIAL ISSUES | P. 239 |
Risk subtype | Risks associated with climate change | Risk description | Time horizon (1) | |||
| Change in consumer preferences | Direct risk of client loss for not meeting what various stakeholders expect from BBVA as regards the climate change challenge and fostering a more inclusive world | ST | ||||
| Indirect risk of our clients losing business, which affects their solvency, because they engage in an activity that is not considered sustainable | ST | |||||
| Reputational | Demand from clients to limit our operations’ direct impacts | ST | ||||
| Stigmatization of a sector | Risk of assets stranded by a sharp change in the perception of a sector, with significant loss of sales | ST | ||||
| Investment exclusions in certain sectors due to market pressures | Withdrawal from profitable deals due to reputational risk or a sectoral ban | ST | ||||
| (1) | ST: <4 years MT: 4-10 years LT: >10 years |
Physical risks
Risks which arise from climate change and can originate from increased frequency and severity of extreme weather events or long-term weather changes, and which
may imply physical damage to companies’ assets, disruptions in supply chains or increase in the expenses needed to face such risks.
Risk subtype | Risks associated with climate | Risk description | Time horizon (1) | |||
Increased severity of extreme weather events, such as cyclones and flooding | Reduced revenue from decreased production capacity (e.g. transport difficulties and supply chain disruptions) | MT | ||||
| Acute risks | Direct losses from asset damage (BBVA and clients) | MT | ||||
| Increased cost of insurance | MT | |||||
| Business continuity problems | Damage to BBVA facilities from environmental catastrophes that hinder normal service provision | MT | ||||
| Changes in precipitation patterns and extreme variability i | Loss of value of clients’ assets (guarantees) because they are located in areas with water supply problems (desertification) | MT | ||||
| weather patterns | Increases in clients’ operating costs (investments in agriculture) | MT | ||||
| Chronic risks | Lower renewables production (hydro and wind) | MT | ||||
| Rising average temperatures | Population movements that can lead to depression in certain areas, accompanied by loss of business | LT | ||||
| Sea level rise | Threats to client assets that can lead to loss of profits and their solvency | LT | ||||
| (1) | ST: <4 years MT: 4-10 years LT: >10 years |
Climate change opportunities for BBVA
As well as the risks described above, a number of associated opportunities have arisen which BBVA is
considering to use and position itself correctly with respect to the major disruption represented by climate change.
Table 104. Climate change Opportunities for BBVA
Sector | Opportunity | Time Horizon (1) | ||
| Oil & Gas | Liquefied Natural Gas (LNG) as an alternative to other fossil fuels as it has a much lower level of emissions | MT | ||
| Possibility of reusing oil & gas transport assets for biofuels and hydrogen | MT | |||
| Chemicals | Carbon capture and storage through chemical separation of carbon dioxide for later reuse | ST | ||
| Strong boost to renewable energy, electricity storage | ST | |||
| Electricity | Energy efficiency services and hydrogen development | MT | ||
Construction & infrastructures | Renovation of buildings (headquarters, housing, premises, etc.) as well as industrial plants in need of energy-efficiency improvements because of the increased regulatory impact | ST | ||
| Infrastructures to improve climate change adaptation: changes in cities, development of a smart grid, charging infrastructure for electric vehicles | ST | |||
| Transportation | Efficient low-emission and mobility services (electrical, LNG and hydrogen) | ST | ||
| Mining & metals | Production of metals to manufacture electric vehicles (copper, lithium, cobalt and nickel among others) | MT | ||
| Efficient irrigation systems, use of waste as a source of biogas | MT | |||
| Agriculture | Development of new anti-drought products | ST | ||
| Other sectors | Circular economy, recycling, waste and water treatment, tree planting, food industry, tourism industry conversion to carbon neutrality (Fossil fuel change, etc.) | ST | ||
| (1) | ST: <4 years MT: 4-10 years LT: >10 years |
Table of Contents
| BBVA. PILLAR 3 2021 | 8. REPORT ON CLIMATE CHANGE AND OTHER ENVIRONMENTAL AND SOCIAL ISSUES | P. 240 |
8.5. Risk management associated with climate change
Integrating climate change into risk planning
The risks associated with climate change (transition and physical) are considered an additional factor that impacts the risk categories already identified and defined in the Group. Because of this they are managed through the Group’s risk management frameworks (credit, market, liquidity, operational and other non-financial risks). As a result, the integration of the risks related to climate change within BBVA Group’s risk management framework is based on the incorporation of correctly established processes and governance, taking into account regulations and supervisory trends.
Correct planning requires reliable, complete and up-to-date data. To this end, in 2021 a sustainable data strategy was implemented, based in the Principles for effective risk data aggregation and risk BSBC239, in
which the sustainability data needs have been identified, the data gaps have been assessed and a conceptual model and implementation plan has been drawn up. All this is geared to guaranteeing a comprehensive vision of the Group’s climate risks to ensure their correct control and management. Among the data incorporated, which respond both to regulatory and business needs, those related to customer climate scores, energy efficiency certificates, environmental indicators, greenhouse-gas emissions and sector metrics.
Climate risk management in BBVA Group is based on the process of risk planning which is marked by the defined risk appetite and makes use of management frameworks which establish how these risks are to be treated in day-to-day business activity.
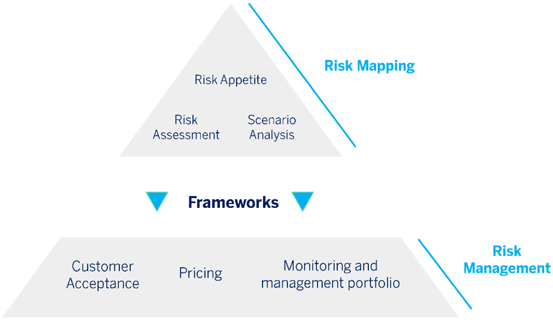
Risk planning: Risk appetite Framework (RAF)
BBVA’s Risk Appetite Framework, approved by the corporate governance bodies and applicable to all the Group’s material geographical areas, determines the risk levels that BBVA is willing to assume to achieve its targets, considering the organic evolution of the business. It is organized as a pyramid structure that is based on thresholds of core and by risk type metrics and implemented through a framework of risk limits. The Framework has a general statement that sets out the general principles of the risk strategy and the target risk profile. The statement includes a commitment to sustainable development as one of the elements defined by the BBVA business model, stressing customer
support in the transition to a sustainable future, and starting in 2022 incorporating the climate factor in risk management. This statement is complemented and detailed with an appetite quantification through metrics and thresholds that provide clear and concise guidance on the defined maximum risk profile.
In 2021 a transition risk metric was incorporated. This High Transition Risk metric measures Exposure at Default (EAD) in relation to capital of the activities most exposed to transition risk in accordance with the Taxonomy defined internally, specifically the activities classified as High or Very High risk. This taxonomy has been developed following recommendations by the TCFD with the aim of developing processes that identify and
Table of Contents
| BBVA. PILLAR 3 2021 | 8. REPORT ON CLIMATE CHANGE AND OTHER ENVIRONMENTAL AND SOCIAL ISSUES | P. 241 |
value climate risks, as well as the ECB Guide on environmental and climate-related risks. With respect to this metric, the Board of Directors of BBVA has approved thresholds at a Group and geographical area level, which determine the maximum appetite for this risk.
The definition of the levels of tolerance established in the Risk Appetite Framework are based on the Risk Assessment and Scenario analyses described below.
Risk Assessment
This section provides, firstly, a self-assessment of how the different climate-change related risk factors impact on the main types of risk currently existing (credit, market, liquidity, etc.); secondly, an analysis of the sectors that are most sensitive to this risk (under the so-called “internal risk taxonomy”); and, finally, the methodology used to assess the climate vulnerability of the relevant geographical areas where the BBVA Group operates. These last two aspects are integrated into the management through processes such as admission frameworks or the establishment of risk limits.
As part of its General Risk Management and Control Model, the Group develops periodic risk identification and assessment processes to, among other things, identify material risks that could have a negative impact on its risk profile and to manage those risks actively and proactively. These processes cover all types of risks faced by the Group in its daily activity, including those risks that are more difficult to quantify. The General Risk Management and Control Model approved this year is considered the specific form of sustainability as an essential part of the Group’s strategy.
Global Risk Assessment is a prospective exercise which updates at least twice a year, and allows a comparison between risk types, business activities and moments in time, facilitating the understanding of the Bank’s positioning and its development, and identifying the material risks to cover with capital. Since 2020 the Group has carried out a qualitative climate assessment, which assesses BBVA’s vulnerability to transition and physical risk. As in the case of the global assessment, the climate assessment process is participative and global in the
GRM area. The proposed assessment for each risk type is based on the risk specialists and verified by other group and geographical risk units. The results of the assessment are submitted to the highest executive risk committed (GRMC), as well as the corporate bodies, as this assessment is integrated in key corporate processes such as the Risk Appetite Framework and the Internal Capital Adequacy Assessment Process (ICAAP).
The climate risk assessment process runs parallel to the Group’s global risk assessment, although there are two major differences with respect to it. First, there are still no mature indicators to assess the different risks quantitatively (although they are being developed); and second, the time horizon of the analysis is much more extensive. Specifically, the analysis is carried out for a short-term horizon coinciding with the planning horizon (4 years), medium term (4-10 years) and long term (over 10 years). The climate risk assessment, like the other risks, is carried out from two perspectives. First, risk events are identified that could materially affect the Group over a 12-18 month horizon. Next, the risk event matrix identified in 2021 is included. The events are ordered according to their severity, which is estimated on the basis of the likelihood allocated to each event and their estimated impact on the BBVA Group. In the event matrix, these risks are represented graphically by their estimated impact on BBVA Group and its allocated probability.
Climate risk has been included as a material event in this inventory since 2019. In the 2021 assessment the analysis of climate risk events has been broken down into physical and transition risks. In the short term an accelerated transition to a low-carbon economy is thought to involve an event of medium-high impact, although the probability given to this type of scenario is currently medium-low. In a long-term time horizon, the risk of physical climate change is incorporated into the inventory of emerging risks (those that could have an impact in a longer time horizon) and it is assigned a medium-high risk.
Risks with materialization in the short term: 12-18 month time horizon
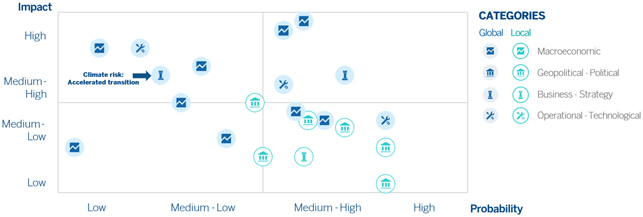
Table of Contents
| BBVA. PILLAR 3 2021 | 8. REPORT ON CLIMATE CHANGE AND OTHER ENVIRONMENTAL AND SOCIAL ISSUES | P. 242 |
The second approach followed in risk assessment is based on an assessment of the profile of each type of risk expressed in a heat map. In 2021 the climate risk assessment exercise was given greater profundity by including new risk factors including the customers’ carbon footprints, the energy efficiency of real-estate secured loans and financed emissions. Similarly, work has been done on the preliminary inclusion of quantitative metrics for some risk factors and it has been extended to BBVA Group’s material geographical areas.
The conclusions of the assessment for 2021 suggest that the main risks emerge in medium- and long-term loan portfolios, with an earlier impact on transition risk in Spain given the speed of this geographical area in adopting decarbonization policies. The factor with the biggest long-term impact on credit risk is that derived from investment in climate change which will have to be carried out by companies in the decarbonization process.
With respect to the impact of physical risk on loan portfolios, the greater frequency/severity of extreme meteorological events and structural changes in climate patterns explains the deterioration shown in the assessment at longer-term horizons.
The impact of transition risk on liquidity risk is due to the stability of the retail deposit base and the high asset quality of the liquid asset buffer. Market risk is equally low, due to the diversification of the equity portfolio and low exposure to sectors sensitive to transition risk in the fixed-income portfolio.
In operational risk, there is a difference in the perceived risk in Spain (medium-low) and in the rest of the geographical areas (medium-high), due to the greater exposure of the latter to physical risk in the medium and long term.
Table 105. Risk Assessment Climate Change 2021
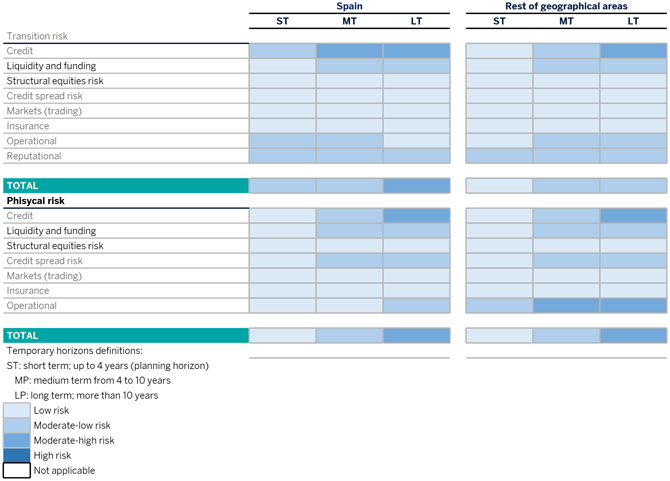
In 2021 there has been an increase in transition risk, derived from the drive in Europe for both new regulations and updates of existing ones. Similarly, the determination of the decarbonization path to be taken in carbon-intensive sectors represents an expected increase in investment in capital expenditure (CAPEX), with the resulting impacts on credit risk. To this has to be
added the greater awareness of people in general, foreseeable change in the demand for these emission-intensive sectors, as well as the increase in the price of CO2 emission rights, which hit a high in Europe of
€88.87/TCO2 in December 2021.
Table of Contents
| BBVA. PILLAR 3 2021 | 8. REPORT ON CLIMATE CHANGE AND OTHER ENVIRONMENTAL AND SOCIAL ISSUES | P. 243 |
All this has highlighted the importance of clearly defining what sectors include a material transition risk and to what extent this could affect BBVA.
BBVA, within the scope of preparing and defining its industry frameworks governing the credit admission process, has developed an internal Taxonomy of transition risk in order to classify industries according to their sensitivity to transition risk. In addition, metrics are identified at the client level to assess their vulnerability and to integrate this aspect into risk and customer support decisions.
The estimation of the transition risk-sensitivity level is based on the qualitative analysis of the amount of exposure to regulatory, technological and market changes caused by decarbonization that may have a financial impact on the companies of the industry and on the estimation of the time horizon impact of these effects.
Thus, industries are categorized according to their level of sensitivity to transition risk: very high, high, moderate
or low. The industries identified as most sensitive to transition risk are energy or fossil fuel generation sectors (energy, utilities, coal mining); emission-intensive basic industries (steel, cement); and activities that are final users of energy through their products or services (vehicles manufacturers, air and sea transportation).
As a result of this exercise, with data at 31 December 2021, 17.4% of the exposure measured by EAD of the wholesale portfolio (equivalent to 9.0% of the Group’s portfolio) has been identified as corresponding to sectors defined as “high transition risk”, with a high or very high level of exposure to this risk. This calculation was made on a portfolio of €190,880m (of the Group’s total EAD of €368,819m), corresponding to the EAD of the wholesale lending portfolio.
The percentage of exposure measured by EAD of the sectors sensitive to the transition risk of the wholesale portfolio over the EAD of the wholesale portfolio at December 31, 2021 are as follows:
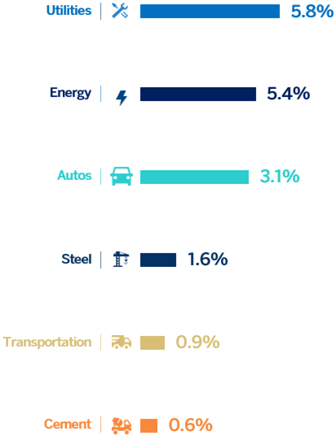
Internal development. It includes the percentage of exposure (exposure at default) of activities internally defined as “transition risk sensitive” over the EAD of the wholesale portfolio at December 31, 2020 (does not include subsidiaries of Garanti, Forum Chile, Uruguay, Venezuela and BPI). The “transition risk sensitive” portfolio includes activities that generate energy or fossil fuels (energy, utilities - excluding renewable generation and water and waste treatment -, coal mining), basic industries with emission-intensive processes (steel, cement) and final activities users of the energy through their products or services (vehicles manufacturers, air and sea transportation), with an intermediate, high or very high level of sensitivity to this risk.
Work is also being done to extend this calculation to the SME and self-employed sector. The preliminary results
obtained with data as of June 2021 indicate that the EAD associated with high or very high transition risk in this
Table of Contents
| BBVA. PILLAR 3 2021 | 8. REPORT ON CLIMATE CHANGE AND OTHER ENVIRONMENTAL AND SOCIAL ISSUES | P. 244 |
portfolio is limited, at around 3%, and focused mainly in Spain and in the automotive (components) sector.
In addition, climate and environmental risk impact has been incorporated into country risk analysis since 2019, as an additional input for establishing risk policies affecting exposures to private or sovereign administrations of all the countries with which the Bank has some type of risk (100+ countries).
To this end, a Climate Vulnerability Index (hereinafter, the CVI) has been created for more than 190 countries, which captures the physical risk and, to a lesser extent, the transition risk of each country, based on international indicators (e.g., Global Adaptation Index of the University of Notre Dame, ND-GAIN, and the Energy Transition Index, ETI, produced by the World Economic Forum). Subsidiarily, vulnerability indices issued by other international organizations and by the three rating agencies are also taken into account.
The methodology establishes 5 climate vulnerability levels, which are a comparative classification, as all countries have a certain level of vulnerability given the global nature of this phenomenon. The CVI has been integrated into risk management by including a specific section in country risk reports, so it is a factor that is taken into account when establishing risk limits (particularly in the most vulnerable countries). It is also taken into account in setting country ratings and outlooks.
In 2020 a methodology was also launched to determine climate vulnerability at the sub-national level (regions, provinces, cities). To this end, indicators developed by internationally renowned institutions such as the Andean Development Corporation (CAF), the EU or BBVA Research. Work has also been done to incorporate transition risk to a greater extent in the CVI.
Analysis of scenarios and stress testing
Scenarios and internal stress tests
Scenario analysis is one of the main tools for integrating climate change into risk management, as it allows a valuation of the vulnerabilities with a prospective vision, thus allowing early adoption of mitigating measures which prevent the materialization of severe shocks. Scenario analysis also enables the assessment of the risk factors’ impact on the metrics defined in the Risk Appetite Framework.
In 2021 the climate scenarios have been integrated into the governance of BBVA Group’s internal scenarios, with initiatives being developed in three areas:
| 1. | Reflection on the climate has been present in preparing the baseline budget scenario for 2021. |
| 2. | The climate driver has been integrated into the high-level risk scenarios (HLRS) which are monitored and assessed continuously in the |
Group by the Scenario Working Group. They serve as a basis for choosing the scenario which is used in the Group’s internal capital adequacy process (ICAAP).
| 3. | An internal pilot project has been carried out to assess the short-term (4 years) and long-term (20 years) impact on credit risk of two climate stress scenarios. A start has been made in Spain, the most important geography for the Group, and for transition risk, because of its greatest relevance, severity and plausibility in the short term, rather than physical risk, which has longer-term material and persistent impacts. |
To do so, and in line with supervisory expectations, three alternative transition risk scenarios have been selected based on a set of representative scenarios defined by the Network of Central Banks and Supervisors for Greening the Financial System (NGFS):
| • | Current Policies Hot House in which only the climate policies currently implemented are continued and therefore there is no transition risk, but with a high exposure to physical risks given the increase in global warming. This is considered the baseline scenario. |
| • | Orderly transition with Carbon Dioxide Removal (CDR), managing to limit temperature growth to 1.5ºC. |
| • | Disorderly transition with limited CDR, managing to limit temperature growth to 1.5ºC. |
The two transition scenarios are relevant for the purposes of a bank stress test. The disorderly scenario of 1.5°C is not only consistent with the Paris Agreement target, but requires the highest carbon prices of all the set of NGFS scenarios; it is therefore the most intense transition scenario and the highest risks, which makes it an obvious candidate for a stress test. Moreover, the orderly 1.5°C scenario presents a trajectory in which the adjustments for transition are progressive and gradual, as well as ambitious, although they also represent vulnerabilities.
The pilot internal stress test has been structured on the basis of these latest scenarios. This pilot project has been undertaken with a sector-based approach, adapting existing models, and transferring to the main macro variables the impact of temperature growth.
This analysis concludes that in the short term, the most affected portfolios will be SMEs and Mortgages. In SMEs the most emission-intensive sectors have a high impact at expected loss level, although in staging the impact it is very low as a result of the good quality of the current portfolio. In terms of the impact by sectors of Transition Vulnerability Factors (TVFs), which are risk factors specific to the industry which capture the dependence of an industry to CO2 emissions in relation to the economy as a whole, in the short term both in the orderly and
Table of Contents
| BBVA. PILLAR 3 2021 | 8. REPORT ON CLIMATE CHANGE AND OTHER ENVIRONMENTAL AND SOCIAL ISSUES | P. 245 |
disorderly transition scenarios the greatest impact is observed in the same emission-intensive sectors.
In the long term, the impact of TVFs does not alter the order of the top 3 obtained in the short term.
Regulatory and supervisory scenarios and stress tests
In October 2021, the ECB published the methodology for the stress tests on climate change risk programmed for 2022 in the months March to July. This test represents major challenges from the perspective of data and methodologies. In 2021 work has been done on a preparatory phase for providing a response to it.
Identification, Measurement and Integration of climate change into risk management
Once climate risk is incorporated into the Risk Appetite Framework and the business strategy, it also must be included in the day-to-day risk management, which is a part of the risk decision making that supports the Group’s clients.
For that purpose, the identification and measurement of this risk type for subsequent integration into the existing management frameworks and processes is required, including the adaptation of policies, procedures, tools, parameterization, risk limits and risk controls in a consistent manner. In a first phase, adaptation is focused on the integration of this risk in the industry frameworks (a basic tool in the definition of our risk appetite in wholesale loan portfolios), and in the Mortgage and Auto Operating Frameworks in retail credit. Currently, BBVA is developing the methodologies and tools it needs to identify and measure the different components of climate risk, and the financial impact analysis of each of them for subsequent integration into the management.
Loan portfolio alignment with Paris Agreement
The role of the bank is key as the financier of all the productive sectors. The influence which may be exercised by this finance on its customers’ behavior and in their environmental performance, is critical for achieving the targets of the Paris Agreement.
Within the framework of this focus of climate action, in April 2021 BBVA announced the Net Zero 2050 commitment (net zero emissions by 2050), including the emissions of customers who receive finance from the Bank. BBVA wants to support its customers in their transition towards a more sustainable, with plans and specific targets. It has undertaken to publish alignment targets for the sectors defined in the Guide to set the Net Zero Banking Alliance objectives.
BBVA has pledged to reduce its exposure to carbon-related activities to zero, and stopping the finance of companies in these activities by 2030 in developed countries and by 2040 in the rest of the countries where it operates.
BBVA, together with four banks which have signed the Katowice commitment, and with the support of the think tank 2 Degree Investing Initiative (2DII), has adapted the methodology called PACTA (Paris Agreement Capital Transition Assessment) to the banking sector. The concept of alignment seeks the transformation of activities considered particularly CO2 intensive, and as a result contrary to compliance with the Paris Agreements. This alignment creates an incentive for companies to shift their productive model to greener activities.
The commitment to alignment acquired by BBVA implies establishing a framework which is composed of objectives and commitments for the different sectors committed within the methodology chosen over the next 20 years. In 2021, BBVA published intermediate decarbonization objectives through 2030 for the electricity generation, automobile, steel and cement sectors which represent, together with coal, 60% of the global CO2 emissions.
Below are details of the metrics chosen to measure alignment within the framework of the Katowice group for the sectors in which decarbonization targets have been set for 2021. Included are the scope of emissions considered, benchmark scenarios, the metrics of the current situation and the target for decarbonization through 2030.
Table of Contents
| BBVA. PILLAR 3 2021 | 8. REPORT ON CLIMATE CHANGE AND OTHER ENVIRONMENTAL AND SOCIAL ISSUES | P. 246 |
Table 106. Decarbonization sectors
| Sector | Emissions scope | Metric | Benchmark scenario | BBVA baseline (2020) | BBVA 2030 target | Absolute effort | CAGR(1) | |||||||||||||||
Power | 1+2 | kg CO2e/ MWh | IEA Net Zero 2050 | 249 | 120 | (52 | )% | (7.0 | )% | |||||||||||||
Auto | 3 | g CO2/km | IEA Net Zero 2050 | 220 | 118 | (46 | )% | (6.0 | )% | |||||||||||||
Steel | 1+2 | kg CO2/tonne steel | IEA Net Zero 2050 | 665 | 515 | (23 | )% | (2.5 | )% | |||||||||||||
Cement | 1+2 | kg CO2/tonne cement | IEA Net Zero 2050 | 695 | 575 | (17 | )% | (1.9 | )% | |||||||||||||
Coal | NA(1) | Portfolio tred (€Mn) | NA(1) |
| Phase out plan already announced in March 2021: • 2030 for developed countries • 2040 globally |
| ||||||||||||||||
| (1) | Does not apply |
| (2) | Percentages are the Compound Annual Growth Rate between the base year (2020) and 2030 |
Calculation of financed emissions
BBVA has been working on this carbon footprint measurements for customers or financial assets, so that it attributes to BBVA in its accounting or indirect emissions the equivalent percentage issues of the debt.
To make this measurement, BBVA is implementing the PCAF (Partnership for Carbon Accounting Financials). This project will cover all the portfolios and geographies to obtain a global vision of the emissions financed, identify in what portfolios and sectors these emissions are focused and then define mitigation plans for them, and a cross-cutting vision of the quality of the data we have available to make these calculations.
In an initial estimate of the emissions of the finance to corporate clients and SMEs determined by BBVA SA (made with emission factors based on customer activity), we obtain 80% of the emissions focused on 6 sectors, of which the biggest emitters are: manufacturing, mining and electricity generation.
Measurement and integration of transition risk
The need to decarbonize the economy, as a consequence of climate change, requires a reallocation of resources between more emission intensive activities and those less affected. This dynamic between sectors can be further accelerated in those industries where transition risk brings the time horizon impact closer, or where regulatory measures or technological developments set the implementation schedule.
It is therefore natural to integrate these two factors results in the integration of climate factors into credit risk management processes. through the wholesale credit industry frameworks of those sectors most strongly impacted.
In 2021, sustainability factors have been incorporated as one of the dimensions of the analysis in the Operating Frameworks of all the sectors are included in the taxonomy as “high transition risk”. These frameworks analyze, based on long-term scenarios aligned with the
targets of the Paris Agreement, the financial impact of decarbonization of risks and opportunities, as well as the time horizon of the changes generated by climate transition. This is done by considering the impact on the sector of factors such as the carbon price, new regulations related to the climate transition, technological investment or transformation (change in the generation mix of energy/utilities, or electrification in the case of vehicles) and the changes in the patterns of consumption of customers or consumers. The industry frameworks take into account the transition strategies developed by the Bank’s main client in each sector.
This exercise has allowed climate transition risks and opportunities to be incorporated in the risk portfolio view exercise which is carried out every year, where risk appetite is defined at sector level. Based on the analysis, the vision of risks of some of the sectors and subsectors with greatest exposure to transition risks has been revised.
Together with the integration into the industry frameworks, the systematic integration of sustainability factors into the customer analysis processes for credit origination purposes began in 2021, thus allowing their incorporation in decision making. BBVA has aligned the loan policies to origination and monitoring guidelines issued by the European Banking Authorities. It assesses customers’ ESG and climate risks, with particular attention to the sectors classified as sensitive, called sectors with high transition risk.
This analysis is carried out based on an ESG questionnaire which reveals the climate change strategies, governance strategies and climate change risks and opportunities, decarbonization metrics and targets, and progress made in the management of other material ESG aspects for the customers’ sector of activity. This questionnaire allows us to generate a transition scorecard for customers in any sector.
Moreover, for sectors classified as of high transition risk, an advanced scorecard has been developed to incorporate transition risk dimensions in the customer’s profile. The scorecard assesses the current low-carbon
Table of Contents
| BBVA. PILLAR 3 2021 | 8. REPORT ON CLIMATE CHANGE AND OTHER ENVIRONMENTAL AND SOCIAL ISSUES | P. 247 |
profile; its transition risk in the geographical areas where it operates (and the measures taken to mitigate its exposure to long-term transition risk); its level of reporting on climate management, and the integration of results into the Paris Agreement commitments. The result of the scorecard is a valuable tool to enhance commitment to customers by identifying their strengths
and weaknesses and allows specific products to be defined to help them in the transition to low-carbon business models.
The following chart shows the results of the scorecard of the main customers in BBVA’s automobile, oil and gas as well as utilities portfolio.
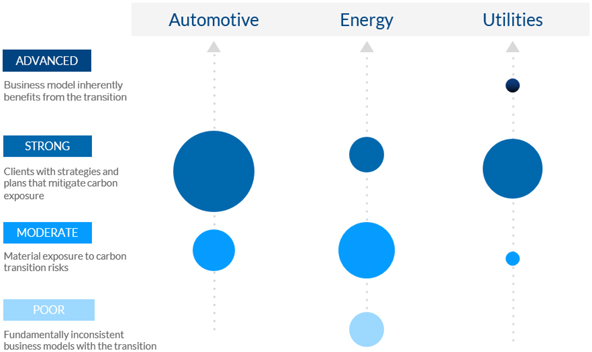
In 2022, work was done to integrate these tools and measure the transition risk of customers and portfolios (in the rules, policies and procedures for managing habitual risks).
In the retail area the transition risk analysis was focused on the Mortgage, Auto Loan and SME portfolios. In all of them, one of the main aspects that determines the transition risk are carbon emissions associated with each of them. These emissions are associated with the use of fossil fuels or electricity, or dependence on them for the correct operation of the asset or customer. The PCAF financed emissions are thus used as a level to identify the customers or assets most sensitive to changes in regulation, fuel prices or depreciation of certain types of “unsustainable” assets. In turn, to mitigate risk, BBVA also acts as a financing facilitator to address the investments required for climate change mitigation and adaptation to climate change with more sustainable forms of life and products.
In the case of mortgages, significant progress has been made to define the sustainable criteria for classification when a mortgage guarantee is considered sustainable according to its efficiency in the use of energy or water resources. These criteria determine the customer’s option to choose a sustainable product which, in general,
includes discounts. Thus in 2021 the necessary mechanisms have been implemented to promote the acquisition of sustainable housing, thus increasing BBVA’s ratio of sustainable finance. Moreover, it is worth noting that for transition risk and the estimation of emissions, detailed information is needed on the characteristics of mortgage collateral (size, efficiency, location, etc.). In 2021, in geographical areas such as Spain (the most important geography in the portfolio by volume of exposure), these data were captured for the first time with an extensive coverage. In 2022 work will continue to improve the availability of data in the rest of the geographical areas.
In the case of vehicle loans, as well as the type of fuel, mechanisms are being implemented to have information available associated with average emissions of each vehicle based on its make, model and version. As in the case of mortgages, finance with sustainable products is promoted when they comply with sustainability criteria, which define the maximum emissions for each geographic area under the Worldwide Harmonized Light Vehicles Test Procedure (WLTP), a protocol for the approval of vehicles within the European Union).
Table of Contents
| BBVA. PILLAR 3 2021 | 8. REPORT ON CLIMATE CHANGE AND OTHER ENVIRONMENTAL AND SOCIAL ISSUES | P. 248 |
Classification and measurement of physical risk
Physical risk is associated with the location of customer assets and activity. It may be materialized in credit risk by different channels of transmission, impacting multiple forms such as customer purchasing power, business productivity, market demand and asset value. In 2021, BBVA’s learning curve increased exponentially in this field and its level of maturity and knowledge of the different methodologies to evaluate the physical risk made considerable progress. The most relevant initiatives to highlight are the construction of sector vulnerability heat maps, the assessment of sources of climate data and market suppliers and the physical risk exercises carried out with a variety of suppliers to calculate a marker with both end-to-end solutions and with geospatial technology suppliers. This work will continue very active in 2022.
With respect to sector vulnerability, a physical risk vulnerability heat map has been developed for Wholesale and Investment Banking and SMEs, following the best practices identified by the Taskforce on Climate-Related Financial Disclosure (TCFD) and the United Nations Environment Program Finance Initiative (UNEP FI). The heat map is the basis for generating a qualitative classification of the portfolios in accordance with their potential exposure to climate risks. It also allows the identification of sectors whose business model and activity may be impacted by chronic or acute changes in the climate.
The heat map indicates the potential exposure, according to eight vulnerability indicators at the subsector level which allows the identification of vulnerability at the different stages of the value chain:
| • | Supply chain: dependence on natural resources and sensitivity of the supply chain to climate changes. |
| • | Logistics: dependence on transport routes. |
| • | Own operations: vulnerability of assets and processes, dependence of the labor force and vulnerability of its productivity, dependence on energy supply and impact of physical risks in the social and environmental performance of the asset. |
| • | Sales: sensitivity of sales to physical climate change. |
As a result, the sectors identified with the greatest vulnerability to physical risks, have been energy generation, utilities, basic materials, construction, consumption and real estate.
In addition, as part of the work group of UNEP-FI, BBVA carried out an exercise to assess the physical risk score with a sample of the mortgage portfolio, based on the location of the collateral. For this, physical risk was analyzed for a variety of climate dangers estimated for the year 2040 with a scenario of a greenhouse gas concentration of RCP 8.5 (hog house IPCC scenario). The results obtained show that in the case of Spain the most significant dangers are water stress, forest fires and heat stress. These dangers are related to the increase in temperature and reduction in average precipitation. The risks of flooding are limited and focused on the coast and river banks. In the case of Mexico, the most significant risks are the same as for Spain, with the added risk of hurricanes, which are extremely significant in the far east and west of the country. In South America, the risks associated with water, heat and fire stress are relevant, but also worth noting is the greater risk of flooding due to the local geography and changes in expected precipitation patterns.
The progress made in 2021 has allowed a definition of an action plan whose objective is to measure the exposure of wholesale and retail portfolios to the different climate dangers and begin to integrate risks into the risk policies and processes.
Finally, and as mentioned in previous sections, the BBVA Group is committed to sustainable development, being one of the elements that defines BBVA’s business model. In this regard, the General Retail Credit Risk Policy establishes that one of the general principles governing retail credit risk management in the BBVA Group is respect for equality and diversity, preventing access to financial products there is unfair bias for reasons such as gender, color, ethnicity, disability, religion, sexual orientation, or political opinion.
Additionally, the Model’s General Risk Management Policy establishes that in order to avoid unfair biases in access to financial products for reasons such as gender, color, ethnic origin, disability, religion, sexual orientation or political opinion; none of these variables will be included in the admission and pricing models.
8.6. Management of direct and indirect impacts
As a financial institution, BBVA has an impact on the environment and society directly through the consumption of natural resources and its relationship with stakeholders; and indirectly, and most importantly, through its lending activity and the projects it finances.
Management of direct environmental impacts
BBVA has a clear commitment to both society and the environment. The global strategy of the reduction of direct impacts is organized around four core elements: reduction in consumption through the energy efficiency initiatives; use of renewable energy; awareness and involvement of employees and other stakeholders in the path toward a low-carbon economy; and offsetting its
Table of Contents
| BBVA. PILLAR 3 2021 | 8. REPORT ON CLIMATE CHANGE AND OTHER ENVIRONMENTAL AND SOCIAL ISSUES | P. 249 |
carbon footprint through the purchase of credits of projects of the Voluntary Carbon Market to comply with the commitment acquired in 2020 to be a carbon-neutral company.
This commitment embodies in BBVA’s climate change strategy (the Pledge 2025), whose objectives are, first, a reduction of 68% of Scope 1 and 2 CO2 emissions with respect to 2015, and a consumption of 70% of renewable energy by 2025, and 100% by 2030. In line with the latter objective, BBVA has since 2018 adhered to the RE100 initiative, through which the most influential companies in the world have agreed that their energy would be 100% renewable by 2050.
New Global Eco-Efficiency Plan
BBVA has also established other ambitious objectives in its climate strategy. They are included in the Global Eco-Efficiency Plan, in force from 2008, and which was renewed in 2021 for the period 2021-202511.
The New Global Eco-Efficiency Plan sets direct targets for year-on-year impact reduction and the achievement of the Pledge 2025:
Table 107. Global Ecoefficiency Plan Goals 2021-2025
Vector | Indicators | Global target (1) | Pledge target (2) | |||||||
Renewable electricity (%) | 77 | % | 70 | % | ||||||
Electricity consumption per employee (MWh/FTE) | (10 | )% | ||||||||
Consumptions | Energy consumption per employee (MWh/FTE) | (7 | )% | |||||||
Water consumption per employee (m3/FTE) | (11 | )% | ||||||||
Paper consumption per employee (kg/FTE) | (11 | )% | ||||||||
Circular economy | Net waste per employee (t/FTE) | (4 | )% | |||||||
Carbon footprint | Scope 1&2 carbon emissions (tCO2e) | (67 | )% | (68 | )% | |||||
Sustainable building | Environmentally certified area (%) | 45 | % | |||||||
| (1) | Base year 2019. |
| (2) | Base year 2015. |
This plan is based on four lines of action:
| 1. | Consumption |
With the aim of reducing BBVA’s environmental footprint, the following lines of actions will be implemented:
| • | Electricity consumption: BBVA’s strategy is focused on the use of renewable energy, given that the most important level for contributing to the decarbonization of energy markets where the Group operates. The goal is to increase steadily its weight to comply with the Pledge 2025. The strategy for this consists of reaching Power Purchase Agreements (PPAs), such as those already in place in Mexico, Spain and Argentina, as well as the acquisition of renewable energy certificates and Guarantees of Origin in Spain and Portugal, or international Renewable Energy Certificates (iRECs) in Mexico, Colombia, Peru and Turkey. There will also be a commitment to self-generation of renewable energy by |
the installation of solar photovoltaic and solar thermal panels in the Group’s facilities, as is already happening in a number of subsidiaries in Turkey, Uruguay and Spain.
| • | Implementation of energy saving measures (ESMs) for the operation of buildings, to control and reduce consumption. |
| • | Initiatives for the reduction of water consumption, such as gray water recycling systems and rainwater recirculation for irrigation in the headquarters of Spain and Mexico, and the installation of waterless urinals in some of the buildings in Spain. |
| • | Finally, there are measures for the digitalization and centralization of printing to reduce the consumption of paper, 76% of which is also recycled or environmentally certified in most of the geographies. |
| 11 | To establish the PGE 2021-2025 targets the base year 2019 has been used, as consumption in 2020 was skewed by the effect of the pandemic. |
Table of Contents
| BBVA. PILLAR 3 2021 | 8. REPORT ON CLIMATE CHANGE AND OTHER ENVIRONMENTAL AND SOCIAL ISSUES | P. 250 |
| 2. | The circular economy |
Waste generation is becoming a serious problem at global level, so part of BBVA’s contribution to sustainable development must consist in transitioning linear consumption practices to circular consumption. BBVA has been working for many years to reduce this impact through sustainable construction standards and the implementation of environmental management systems certified with ISO 14001. The aim is to reduce to a minimum the waste which is sent to landfills, so our facilities have clearly differentiated and clearly marked zones which allow us to carry out a correct segregation and recycling of waste. Moreover, under our action plan all these sustainable practices comply with zero waste management standards in some of the Group’s geographic areas such as Turkey and Spain. Moreover, in Argentina the BBVA headquarters in Buenos Aires received the Green Seal of the city’s government in 2021, certifying its responsible waste management.
| 3. | Carbon footprint |
The reduction of the carbon footprint is one of the goals established within the Pledge 2025. BBVA’s total emissions are composed of:
| • | Scope 1 greenhouse gas emissions, which include direct emissions from combustion facilities for own use, combustion of the fleet of vehicles and refrigerant gasses. |
| • | Scope 2 greenhouse gas emissions, including indirect emissions related to electricity production, purchased and consumed by buildings and branches. |
| • | Scope 3 greenhouse gas emissions, which include other indirect emissions. This scope for BBVA includes the emissions from business trips (plane or train), emissions by waste management and emissions due to the trips made by our employees to their place of work. |
Both Scope 1 and 2 emissions and Scope 3 emissions are calculated according to the GHG Protocol standard established by the World Resources Institute (WRI) and the World Business Council for Sustainable Development (WBCSD).
Since 2020, BBVA has been a Carbon Neutral company by offsetting its residual emissions
through the purchase of credits on the Voluntary Carbon Market. Moreover, in line with the recommendations of the Taskforce on Scaling Voluntary Carbon Markets, BBVA has established requirements for the selection of projects with which to offset its residual emissions. Among these requirements are the obligation for projects to be certified under the maximum quality standards such as the Verra Verified Carbon Standard (VCS) and the Gold Standard; and that preferably they should be projects for the absorption or capture of CO2.
| 4. | Sustainable construction |
Another of the objectives is to guarantee the implementation of the best environmental and energy standards in BBVA buildings to achieve a large percentage of environmentally certified area. In fact, the BBVA facilities hold a number of construction and management certification.
Among the construction certifications, there are 16 buildings and 1 Group branch with the prestigious LEED (Leadership in Energy and Environmental Design) for sustainable construction. These buildings include the Group’s headquarters in Spain, Mexico, Argentina and Turkey. Three of them have also received the highest certification, the LEED Platinum.
With respect to management certifications, BBVA has implemented an Environmental Management System in many of its buildings, based on the ISO 14.001:2015 Standard, which is certified every year by an independent entity. This certification is used to control and evaluate environmental performance in the operations of some of its buildings. This system is implemented in 86 buildings and 1,034 branches in the main countries where the Group operates. Moreover, the headquarters in Turkey also has the WWF Green Office certification, which promotes the reduction in the carbon footprint and carbon emissions; and the Ciudad BBVA, the Bank’s headquarters in Spain, has obtained the AENOR “toward zero waste” seal as a prior stage to obtaining the “zero waste” certification of a standard which promotes the circular economy. Finally, three of our buildings in Spain also have an Energy Management System that has been certified by an independent third party and complies with the ISO 50.001:2018 standard.
Table of Contents
| BBVA. PILLAR 3 2021 | 8. REPORT ON CLIMATE CHANGE AND OTHER ENVIRONMENTAL AND SOCIAL ISSUES | P. 251 |
Table 108. Main indicators of the global ecoefficiency plan(1)
| 2021 | 2020 | |||||||||||||||||||
| 2021 Goal (%) | Reference value | Δ 21-19 | Δ 21-20 | Reference value | ||||||||||||||||
Renewable electricity (%) | 73 | % | 79 | % | 71 | % | ||||||||||||||
Electricity consumption per employee (MWh/FTE) | (5 | )% | 5.76 | (14 | )% | (4.4 | )% | 6.02 | ||||||||||||
Energy consumption per employee (MWh/FTE) | (4 | )% | 6.46 | (14 | )% | (3 | )% | 6.65 | ||||||||||||
Water consumption per employee (m3/FTE) | (1 | )% | 17.9 | (5 | )% | — | % | 17.98 | ||||||||||||
Paper consumption per employee (kg/FTE) | (8 | )% | 33.8 | (32 | )% | 4 | % | 32.65 | ||||||||||||
Net waste per employee (t/FTE) (2) | (2 | )% | 0.02 | (52 | )% | (10 | )% | 0.02 | ||||||||||||
Scope 1&2 carbon emissions (tCO2e) (3) | (59 | )% | 91,994.55 | (54 | )% | 14 | % | 80,390.37 | ||||||||||||
Environmentally certified area (%) (4) | 41 | % | 39 | % | 41 | % | ||||||||||||||
Note: These indicators are calculated on the basis of full time employees. The base year for the new Global Ecoefficiency Plan will be 2019 since 2020 has been a year that, due to the circumstances of the pandemic, could distort the evolution.
(1) The data shown here includes the countries Argentina, Colombia, Spain and Portugal, Mexico, Peru, Turkey and Uruguay. Some of the data for 2021 are estimates, as complete information for the year was not yet available at the close of the report.
(2) Net waste is the total waste generated minus the waste that is recycled.
(3) Includes scope 1 (fuels in installations and vehicle fleet and refrigerant gases), scope 2 market-based.
(4) Includes IS0 14001, ISO 50001, LEED, Edge and WWF Green Office certifications.
Environmental performance in 2021
Chart 21. Environmental performance in 2021
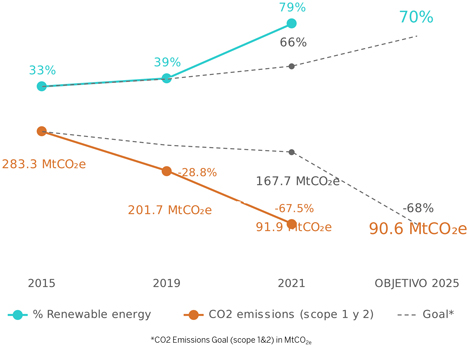
The Group’s environmental footprint shows very positive data compared to the baseline year 201912, with reductions of 54% in Scope 1 and 2 emissions (according to the market-based method), 14% in electricity
consumption, 5% in water consumption and 32% in paper (all per person). The percentage of renewable energy consumption has reached 79%, and the environmentally certified area was 39%.
| 12 | The base year of 2019 has been used because consumption in 2020 was skewed by the effect of the pandemic. |
Table of Contents
| BBVA. PILLAR 3 2021 | 8. REPORT ON CLIMATE CHANGE AND OTHER ENVIRONMENTAL AND SOCIAL ISSUES | P. 252 |
Table 109. Environmental footprint (BBVA Group) (1)
Consumption | 2021 | 2020 (7) | ||||||
Total water comsuption (cubic meters) | 1,925,850 | 1,924,660 | ||||||
Public water supply (cubic meters) | 1,873,473 | 1,924,660 | ||||||
Recycled water (cubic meters) | 52,377 | nd | ||||||
Paper (tons) | 3,636 | 3,521 | ||||||
Energy (Megawatt hour) (2) | 695,140 | 717,011 | ||||||
Energy from renewable sources (Megawatt hour) | 491,542 | 462,280 | ||||||
Energy from non renewable sources (Megawatt hour) | 203,598 | 254,731 | ||||||
CO2emissions | ||||||||
Scope 1 emissions (tons CO2e)(3) | 49,639 | 12,235 | ||||||
Emissions from fuels in facilities (t CO2e) | 13,669 | 12,235 | ||||||
Emissions from vehicle fleet fuels (t CO2e) | 8,509 | nd | ||||||
Emissions from refrigerant gases (t CO2e) | 27,461 | nd | ||||||
Scope 2 emissions (tons CO2e) market-based method (4) | 42,355 | 68,155 | ||||||
Scope 2 emissions (tons CO2e) location-based method (5) | 202,492 | 243,033 | ||||||
Scope 1&2 emissions (tons CO2e) market-based method | 91,995 | 80,390 | ||||||
Scope 1&2 emissions (tons CO2e) location-based method | 252,131 | 255,268 | ||||||
Scope 3 emissions (t CO2e) (6) | 9,432 | 5,843 | ||||||
Emissions from waste management (t CO2e) | 1,034 | nd | ||||||
Emissions from business travel (t CO2e) | 3,073 | 5,843 | ||||||
Emissions from employees commuting (t CO2e) | 5,325 | 0 | ||||||
Total CO2e emissions (t CO2e) market-based method | 101,426 | 86,233 | ||||||
Total CO2e emissions (t CO2e) location-based method | 261,563 | 261,111 | ||||||
Social cost of carbon (Scope 1&2) (€) (8) | 4,121,480 | nd | ||||||
Waste | ||||||||
Hazardous waste (tons) | 120 | 31 | ||||||
Recycled hazardous waste (tons) | 59 | nd | ||||||
Disposed hazardous waste (tons) | 61 | nd | ||||||
Non-hazardous waste (tons) | 4,198 | 3,250 | ||||||
Recycled non-hazardous waste (tons) | 2,343 | nd | ||||||
Disposed non-hazardous waste (tons) | 1,855 | nd | ||||||
Single-use plastics (9) | 27 | nd | ||||||
Donated IT equipment (units) | 1,165 | 347,382 | ||||||
| (1) | The data shown here include Argentina, Colombia, Spain and Portugal, Mexico, Peru, Turkey and Uruguay. Some of the data for 2021 are estimates, as complete information for the year was not yet available at the close of the report. |
| (2) | Includes consumption of electricity and fossil fuels (diesel, natural gas and LP gas), except fuels consumed in vehicle fleets. |
| (3) | Emissions from direct energy consumption (fossil fuels) and calculated based on the emission factors of the 2006 IPCC Guidelines for National Greenhouse Gas Inventories. The IPCC Fifth Assessment Report and the IEA have been used as sources for conversion to CO2e. From 2021 onwards, emissions derived from the use of the vehicle fleet and refrigerant gas leaks at our facilities have been included in this scope. |
| (4) | Emissions from electricity consumption and calculated based on contractual data and, failing that, on the latest available IEA emission factors for each country. |
| (5) | Emissions from electricity consumption and calculated based on the energy mix of each geography. Emission factors are the latest available according to IEA for each country. |
| (6) | From 2021 onwards, in addition to emissions from business travel by air, emissions from business travel by train, emissions from waste management and emissions from employee commuting have been included in this scope, using emission factors published by DEFRA in 2021. For our employees’ commuting emissions, a survey has been sent to BBVA employees although only those from Central Services in Argentina, Colombia, Spain, Mexico, Peru, Portual and Uruguay have been taken into account so that the data compares with those published in 2019. |
| (7) | 2020 data differ from those published in the previous annual report due to the exit of the USA from the perimeter. |
| (8) | The impact of greenhouse gas emissions for 2021 is calculated only with Scope 1 and 2 emissions and using the CO2 social cost factor according to a proportional estimate of the EPA’s social cost of carbon for 2020 ($51/tCO2) and 2025 ($56/tCO2), (discount rate of 3%, with exchange rate 1.183 €/USD). |
| (9) | Masks purchased for our employees in Argentina, Colombia, Spain, Mexico and Peru have been taken into account, although these quantities do not form part of the data on non-hazardous waste disposed of as they have not always been deposited in our containers for disposal. Also the data provided on single-use plastics from catering suppliers in Spain and Mexico. |
Given the business activities in which the BBVA Group engages, the Group has no environmental liabilities, expenses, assets, provisions or contingencies that are significant in relation to its equity, financial position and earnings. As such, as of December 31, 2021, the accompanying consolidated Annual Accounts do not include any item that warrants inclusion in the environmental information document provided for in Order JUS/318/2018, of March 21, approving a new
template for filing the consolidated annual accounts at the Companies Register for those entities obligated to disclose such information.
Management of indirect environmental and social impacts
BBVA addresses environmental and social risks from the perspective of impact prevention and mitigation. To do this, it uses tools such as the Environmental and Social
Table of Contents
| BBVA. PILLAR 3 2021 | 8. REPORT ON CLIMATE CHANGE AND OTHER ENVIRONMENTAL AND SOCIAL ISSUES | P. 253 |
Framework or the Equator Principles that have an environmental and social focus, and which are described below. Managing the impacts that customers generate on the environment is part of the Pledge 2025. To manage them, BBVA has implemented a number of initiatives and tools.
Environmental and social framework
In 2020, the Environmental and Social Framework for the due diligence in the field of mining, agribusiness, energy, infrastructure and defense was approved (Framework), which revised and integrated the previous Sector Norms (approved in 2018) and the Rules of Conduct in Defense (in force since 2012).
In line with the previous regulation, this Framework provides a decision-making guideline with regard to transactions and customers that operate in these five sectors (mining, agribusiness, energy, infrastructure and defense); as they are considered to have a bigger social and environmental impact. The Framework is public and available on the BBVA shareholders and investors website.
To guarantee its effective implementation, BBVA receives advice from an independent external expert, with whose collaboration it carries out an enhanced due diligence on its customers and transactions, in order to mitigate the risks associated with these sectors and contribute to the compliance with the General Sustainability and Social Corporate Responsibility Policies.
For the Framework review, new market trends in this area, the expectations of stakeholders and the strengthening of the implementation procedures are taken into account.
The following were the highlights of the December 2020 review:
| • | restriction to the applying of exceptions in the field of mining and energy for countries with high energy dependence only to projects under construction and existing customers; |
| • | the reduction from 35% to 25% of the threshold applied to the exclusion of customers with high coal exposure, which applies both to the extractive activity and the energy generation; |
| • | extension of the prohibition related to bituminous sands; |
| • | the incorporation of new prohibited activities such as deep-sea mining, artic oil and gas transportation, as well as large dams that are not built under the World Commission on Dams (WDC) framework. |
In the March 2021 review, BBVA highlighted the commitment to remove customer exposure to carbon by 2030 for developed countries and 2040 globally, by
dialog with customers and active monitoring with their portfolios.
Equator Principles
Energy, transport and social service infrastructures, which drive economic development and create jobs, can have an impact on the environment and society. BBVA’s commitment is to manage the financing of these projects to reduce and avoid negative impacts and in this way enhance their economic, social and environmental value.
All decisions to finance projects are based on the criterion of principle-based profitability. This implies meeting stakeholder expectations and the social demand for adaptation to climate change and respect for human rights.
In line with this commitment, since 2004 BBVA has adhered to the Equator Principles (EP), which include a series of standards for managing environmental and social risk in project financing. The EPs were developed on the basis of the International Finance Corporation’s (IFC) Policy and Performance Standards on Social and Environmental Sustainability and the World Bank’s General Guidelines on Environment, Health and Safety. These principles have set the benchmark for responsible finance.
The analysis of the projects consists of subjecting each operation to an environmental and social due diligence process, including potential impacts on human rights. The first step is the allocation of a category (A, B or C), which reflects the project’s level of risk. Category A: projects with potentially significant adverse social or environmental impacts that are irreversible or unprecedented. Category B: Projects with potentially limited adverse social and environmental impacts that are few in number, generally site-specific, largely reversible and readily addressed through mitigation measures. Category C: Projects with minimal or no social or environmental impacts. Reviewing the documentation provided by the customer and independent advisers is a way to assess compliance with the requirements established in the EPs, according to the project category. Financing agreements include the customer’s environmental and social obligations. The application of the EPs at BBVA is integrated into the internal processes for structuring, acceptance and monitoring of operations, and is subject to regular checks by the Internal Audit area.
BBVA has reinforced due diligence procedures associated with the financing of projects whose development affects indigenous peoples. When this circumstance occurs, the prior free and informed consent is required from these communities, irrespective of the geographic location of the project, including for projects in countries where a robust legislative system is presupposed, which guarantees the protection of the environment and the social rights of its inhabitants. When identifying potential risks, the operation must
Table of Contents
| BBVA. PILLAR 3 2021 | 8. REPORT ON CLIMATE CHANGE AND OTHER ENVIRONMENTAL AND SOCIAL ISSUES | P. 254 |
include an effective form of management of these risks, as well as operational mechanisms to support claims management.
In 2020 the fourth version of the Principles has come into force. This update, after an extensive public consultation period, incorporates new and more demanding
requirements in the review of projects in relation to human rights and climate change. BBVA has actively participated in the updating process and its contribution in recent years has been recognized with a new mandate in the Management Committee of the Association of the Equator Principles.
Table 110. Operational data analyzed according to the Equator Principles criteria
Category A | Category B | Category C | ||||||||||||||||||||||||||||||
| 2021 | 2020 | 2021 | 2020 | 2021 | 2020 | |||||||||||||||||||||||||||
Number of transactions | 2 | 1 | Number of transactions | 23 | 21 | Number of transactions | 17 | 8 | ||||||||||||||||||||||||
|
|
|
|
|
|
|
|
|
|
|
| |||||||||||||||||||||
Total amount (millions of euros) | 2227.6 | 869.6 | | Total amount (millions of euros) | | 10954.5 | 8220.4 | | Total amount (millions of euros) | | 5466.1 | 2971.4 | ||||||||||||||||||||
|
|
|
|
|
|
|
|
|
|
|
| |||||||||||||||||||||
Amount financed by BBVA (millions of euros) | 109.4 | 39.4 | | Amount financed by BBVA (millions of euros) | | 1714.1 | 824.1 | | Amount financed by BBVA (millions of euros) | | 756.3 | 441.0 | ||||||||||||||||||||
Note: of the 42 transactions analyzed, 20 fail under the Equator Principles, and the remaining 22 were analyzed voluntarily by BBVA using the same criteria in 2021 (30, 9 and 21 respectively, in 2020).
Table of Contents
| BBVA. PILLAR 3 2021 | 8. REPORT ON CLIMATE CHANGE AND OTHER ENVIRONMENTAL AND SOCIAL ISSUES | P. 255 |
8.7. Participation in international initiatives
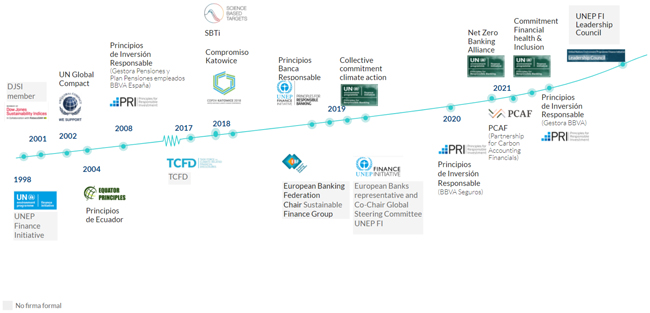
For over 20 years, BBVA has participated actively in various supranational initiatives. As well as repeating our commitment to the UN Global Compact once more this year, as part of the Pledge 2025, BBVA actively participates in numerous initiatives, always in close collaboration with all its stakeholders (such as the industry itself, regulators and supervisors, investors and organizations from civil society).
Universal reference frameworks
BBVA was one of 28 founding banks in the Principles for Responsible Banking promoted by the United Nations Environment Program Finance Initiative (UNEP FI), This initiative is a benchmark for corporate responsibility in the banking sector, which aims to respond to the growing demand from different stakeholders for a comprehensive framework that covers all aspects of sustainable banking through six core areas. Currently, more than 250 entities worldwide, approximately 40% by asset volume of the banking system, have already signed these Principles. BBVA believes that these Principles will help reaffirm its purpose, enhance its contribution to both the United Nations SDGs and the commitments derived from the Paris Climate Agreements, and align its business strategy with said commitments.
In 2020 and 2021, BBVA has reported its progress and achievements in each of the 2021 six principles to UNEP FI, in the first and second year they have been implemented. For more information on the progress and developments reported, see the chapter named “UNEP FI Principles for Responsible Banking Reporting Index” in the Group’s Consolidated Management Report..
Within the framework of these Principles, in 2021 BBVA was one of the founding banks of the Collective Commitment to Financial Health and Inclusion promoted by UNEP FI with the aim of promoting universal financial inclusion and a banking sector which supports the financial health of all its customers.
BBVA also participates in global initiatives such as the United Nations Global Compact, Principles for Responsible Investment, and the Thun Group, which describes how the United Nations Guiding Principles on Business and Human Rights (UNGPs) should be applied in the banking sector.
Transparency
In September 2017, BBVA committed to the TCFD recommendations of the FSB and has been reporting on its objectives, plans and performance in line with its utmost commitment to transparency. Also, in accordance with these recommendations, in 2020 BBVA published disclosures following the two most advanced standards in the market:
| • | WEF-IBC core metrics: BBVA has been one of the first entities in the world to support the Measuring Stakeholder Capitalism initiative of the International Business Council (IBC) of the World Economic Forum (WEF), assuming the commitment to report according to its metrics and disclosures which were published in September, 2020. |
| • | Sustainability Accounting Standards Board (SASB) - Commercial Bank standards: The SASB sets the standards to guide companies in |
Table of Contents
| BBVA. PILLAR 3 2021 | 8. REPORT ON CLIMATE CHANGE AND OTHER ENVIRONMENTAL AND SOCIAL ISSUES | P. 256 |
the disclosure of financially relevant information and consistent in terms of sustainability, which are followed by an increasing number of relevant institutional investors at a global level. |
In the Group’s Consolidated Management Report, BBVA has taken a further step forward in transparency and includes not only the above standards, but the following disclosures:
| • | Expanded WEF-IBC metrics |
| • | Sustainability Accounting Standards Board (SASB) - Mortgage Finance and Consumer Finance |
Compliance with these international standards is included in the chapter “Alignment of BBVA Group’s non-financial information with the WEF-IBC and SASB standards” in the Group’s Consolidated Management Report.
BBVA participates annually in the main sustainability analyses conducted by rating agencies in this area. Based on the evaluations obtained through these analyses, companies are chosen to be part of the sustainability indices.
In 2021, BBVA has obtained the highest score (89 points) among world banks13 in the Dow Jones Sustainability Index (DJSI), which measures the performance of the largest companies by market capitalization in economic, environmental and social matters. The Group has achieved the highest score (100 points) in the sections
on financial inclusion, environmental and social information, development of human capital, materiality and tax strategy.
BBVA has been included for the fourth consecutive year in the Bloomberg Gender Equality Index, which represents recognition of its commitment to create trusting work environments, where all employees’ professional development and equal opportunities are guaranteed, regardless of their gender. BBVA is a member of the following sustainability indices14:
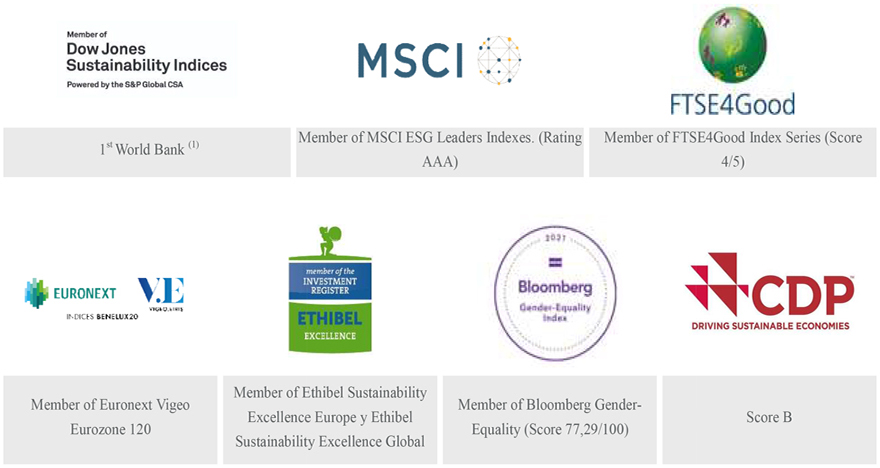
| (1) | Shared ranking position |
In addition, in 2020 the Bank joined the Nasdaq Sustainable Bond Network (NSBN). It is the only Spanish entity on this platform, which brings together the world’s various issuers of sustainable debt and provides a clear reference framework for socially responsible investment.
| 13 | Shared ranking position |
| 14 | The inclusion of BBVA in any MSCI indices and the use of the logos, trademarks, service marks or index names does not constitute the sponsorship or promotion of BBVA by MSCI or any of its subsidiaries. The MSCI indices are the exclusive property of MSCI. MSCI and the MSCI indices and logos are trademarks or service marks of MSCI or its subsidiaries. |
Table of Contents
| BBVA. PILLAR 3 2021 | ANNEXES | P. 257 |
Table of Contents
| BBVA. PILLAR 3 2021 | ANNEXES | P. 258 |
I. EU LI3 - Outline of the differences in the scopes of consolidation and non-deducted participations in insurance undertakings (Million Euros. 31-12-2021)
Company | Method of | Global Consolidation - Method of regulatory consolidation | Proportional Consolidation - Method of regulatory consolidation | Equity method - Regulatory consolidation method | No dependence - Regulatory consolidation method | Unconsolidated - Regulatory consolidation method | Deductions (1) | Activity | ||||||||||||||||||||
| ALTURA MARKETS SOCIEDAD DE VALORES SA | Equity Method | X | SECURITIES DEALER | |||||||||||||||||||||||||
| ANIDA PROYECTOS INMOBILIARIOS, S.A. DE C.V. | Fully Consolidation | X | REAL ESTATE | |||||||||||||||||||||||||
| BAHIA SUR RESORT S.C. | Fully Consolidation | X | REAL ESTATE | |||||||||||||||||||||||||
| BBVA AGENCIA DE SEGUROS COLOMBIA LTDA | Fully Consolidation | X | X | INSURANCE | ||||||||||||||||||||||||
| BBVA BROKER ARGENTINA SA | Fully Consolidation | X | X | INSURANCE | ||||||||||||||||||||||||
| BBVA PENSIONES MEXICO, S.A. DE C.V., GRUPO FINANCIERO BBVA MEXICO | Fully Consolidation | X | X | INSURANCE | ||||||||||||||||||||||||
| BBVA RE INHOUSE COMPAÑIA DE REASEGUROS, S.E. | Fully Consolidation | X | X | INSURANCE | ||||||||||||||||||||||||
| BBVA SEGUROS ARGENTINA SA | Fully Consolidation | X | X | INSURANCE | ||||||||||||||||||||||||
| BBVA SEGUROS COLOMBIA SA | Fully Consolidation | X | X | INSURANCE | ||||||||||||||||||||||||
| BBVA SEGUROS DE VIDA COLOMBIA SA | Fully Consolidation | X | X | INSURANCE | ||||||||||||||||||||||||
| BBVA SEGUROS MÉXICO SA DE CV GRUPO FINANCIERO BBVA MEXICO | Fully Consolidation | X | X | INSURANCE | ||||||||||||||||||||||||
| BBVA SEGUROS SA DE SEGUROS Y REASEGUROS | Fully Consolidation | X | X | INSURANCE | ||||||||||||||||||||||||
| BBVA SEGUROS SALUD MEXICO SA DE CV GRUPO FRO. BBVA MEXICO. | Fully Consolidation | X | X | INSURANCE | ||||||||||||||||||||||||
| BBVA SERVICIOS, S.A. | Fully Consolidation | X | COMMERCIAL | |||||||||||||||||||||||||
| CORPORACION IBV PARTICIPACIONES EMPRESARIALES, S.A. | Equity Method | X | INVESTMENT COMPANY | |||||||||||||||||||||||||
| DISTRITO CASTELLANA NORTE, S.A. | Fully Consolidation | X | REAL ESTATE | |||||||||||||||||||||||||
| F/11395 FIDEICOMISO IRREVOCABLE DE ADMINISTRACION CON DERECHO DE | REAL ESTATE | |||||||||||||||||||||||||||
| REVERSION | Fully Consolidation | X | ||||||||||||||||||||||||||
| F/253863 EL DESEO RESIDENCIAL | Fully Consolidation | X | REAL ESTATE INSTRUMENTAL | |||||||||||||||||||||||||
| FIDEICOMISO 1729 INVEX ENAJENACION DE CARTERA | Equity Method | X | REAL ESTATE | |||||||||||||||||||||||||
| FIDEICOMISO F/403112-6 DE ADMINISTRACION DOS LAGOS | Fully Consolidation | X | REAL ESTATE | |||||||||||||||||||||||||
| FIDEICOMISO HARES BBVA BANCOMER F/ 47997-2 | Fully Consolidation | X | REAL ESTATE | |||||||||||||||||||||||||
| FIDEICOMISO SCOTIABANK INVERLAT S A F100322908 | Fully Consolidation | X | REAL ESTATE | |||||||||||||||||||||||||
| FOMENTO Y DESARROLLO DE CONJUNTOS RESIDENCIALES S.L. EN LIQUIDACION | Fully Consolidation | X | REAL ESTATE | |||||||||||||||||||||||||
| FUTURO FAMILIAR, S.A. DE C.V. | Fully Consolidation | X | SERVICES | |||||||||||||||||||||||||
| GARANTI BBVA EMEKLILIK AS | Fully Consolidation | X | X | INSURANCE | ||||||||||||||||||||||||
| GARANTI BBVA FILO AS | Fully Consolidation | X | SERVICES | |||||||||||||||||||||||||
| GARANTI KULTUR AS | Fully Consolidation | X | SERVICES | |||||||||||||||||||||||||
| INMESP DESARROLLADORA, S.A. DE C.V. | Fully Consolidation | X | REAL ESTATE | |||||||||||||||||||||||||
| INVERSIONES ALDAMA, C.A. | Fully Consolidation | X | REAL ESTATE | |||||||||||||||||||||||||
| INVERSIONES P.H.R.4, C.A. | Fully Consolidation | X | REAL ESTATE | |||||||||||||||||||||||||
Table of Contents
| BBVA. PILLAR 3 2021 | ANNEXES | P. 259 |
Company | Method of | Global Consolidation - Method of regulatory consolidation | Proportional Consolidation - Method of regulatory consolidation | Equity method - Regulatory consolidation method | No dependence - Regulatory consolidation method | Unconsolidated - Regulatory consolidation method | Deductions (1) | Activity | ||||||||||||||||||||
| INMESP DESARROLLADORA, S.A. DE C.V. | Fully Consolidation | X | REAL ESTATE | |||||||||||||||||||||||||
| INVERSIONES ALDAMA, C.A. | Fully Consolidation | X | REAL ESTATE | |||||||||||||||||||||||||
| INVERSIONES P.H.R.4, C.A. | Fully Consolidation | X | REAL ESTATE | |||||||||||||||||||||||||
| INVERSIONES PLATCO CA | Equity Method | X | FINANCIAL | |||||||||||||||||||||||||
| IRB RIESGO OPERACIONAL SL | Equity Method | X | SERVICES | |||||||||||||||||||||||||
| JALE PROCAM, S.L. (EN LIQUIDACIÓN) | Fully Consolidation | X | REAL ESTATE | |||||||||||||||||||||||||
| MADIVA SOLUCIONES, S.L. | Fully Consolidation | X | SERVICES | |||||||||||||||||||||||||
| MOTORACTIVE MULTISERVICES SRL | Fully Consolidation | X | SERVICES | |||||||||||||||||||||||||
| MULTIASISTENCIA OPERADORA S.A. DE C.V. | Fully Consolidation | X | X | INSURANCE | ||||||||||||||||||||||||
| MULTIASISTENCIA SERVICIOS S.A. DE C.V. | Fully Consolidation | X | X | INSURANCE | ||||||||||||||||||||||||
| MULTIASISTENCIA, S.A. DE C.V. | Fully Consolidation | X | X | INSURANCE | ||||||||||||||||||||||||
| OPERADORA DOS LAGOS S.A. DE C.V. | Fully Consolidation | X | SERVICES | |||||||||||||||||||||||||
| PRO-SALUD, C.A. | Fully Consolidation | X | SERVICES | |||||||||||||||||||||||||
| RCI COLOMBIA SA COMPAÑIA DE FINANCIAMIENTO | Equity Method | X | FINANCIAL | |||||||||||||||||||||||||
| SEGUROS PROVINCIAL CA | Fully Consolidation | X | X | INSURANCE | ||||||||||||||||||||||||
| SERVICIOS CORPORATIVOS DE SEGUROS, S.A. DE C.V. | Fully Consolidation | X | SERVICES | |||||||||||||||||||||||||
| TRIFOI REAL ESTATE SRL | Fully Consolidation | X | REAL ESTATE | |||||||||||||||||||||||||
| URBANIZADORA SANT LLORENC SA | Fully Consolidation | X | REAL ESTATE | |||||||||||||||||||||||||
| (1) | These companies are subject to the deduction for significant shareholdings in financial entities and deferred tax assets arising from temporary differences in excess of the 10% CET1 limit, as well as the deduction for joint excess of the 17.65% CET1 limit in accordance with Article 48 paragraph 2 of the CRR. As of December 31, 2021, regarding the total of significant holdings in financial sector entities, the limits indicated in phased-in terms are exceeded in €340 million, being applicable deductions for this purpose. |
Table of Contents
| BBVA. PILLAR 3 2021 | ANNEXES | P. 260 |
II. EU CC1 - Composition of regulatory own funds
| Regulation (UE) Nº575/2013 Reference | ||||||||||
| Phased-in | to article | Reference to EU CC2 template (1) | ||||||||
| Common Equity Tier 1: instruments and reserves | ||||||||||
| 1. Capital instruments and the related share premium accounts | 26,866 | Reference to article | (a | ) | ||||||
of which: Own shares | 26,866 | 26 (1), 27, 28, 29, list of EBA 26 (3) | ||||||||
Capital | 3,267 | List 26 (3) of EBA | ||||||||
Share Premium | 23,599 | |||||||||
| 2. Retained earnings | 30,745 | (b | ) | |||||||
| 3. Accumulated other comprehensive income and any other reserves (in order to include unrealised losses or gains, in accordance with applicable accounting standards) | (17,200 | ) | 26 (1) (c) | (c | ) | |||||
| 3.a. Funds for general banking risk | — | |||||||||
| 4. Amount of qualifying items referred to in Article 484 (3) and the related share premium accounts subject to phase out from CET1 | — | 26 (1) | ||||||||
| 5. Minority interests (amount allowed in consolidated CET1) | 2,800 | 486 (2) | (d | ) | ||||||
| 5.a. Independently reviewed interim profits net of any foreseeable charge or dividend | 2,573 | 84, 479, 480 | (e | ) | ||||||
| 6. Common Equity Tier 1 (CET1) capital before regulatory adjustments | 45,785 | 26 (2) | ||||||||
| Common Equity Tier 1 (CET1) capital: regulatory adjustments | ||||||||||
| 7. Additional value adjustments (negative amount) | (260 | ) | f | ) | ||||||
| 8. Intangible assets (net of related tax liability) (negative amount) | (1,484 | ) | 34, 105 | g | ) | |||||
| 9. Empty set in the EU | — | 36 (1) (b), 37, 472 (4) | ||||||||
| 10. Deferred tax assets that rely on future profitability excluding those arising from temporary difference (net of related tax liability where the conditions in Article 38 (3) are met) (negative amount) | (1,009 | ) | h | ) | ||||||
| 11. Fair value reserves related to gains or losses on cash flow hedges | 483 | 36 (1) (c), 38, 472 (5) | i | ) | ||||||
| 12. Negative amounts resulting from the calculation of expected loss amounts (equity) | — | 33 (a) | j | ) | ||||||
| 13. Any increase in equity that results from securitised assets (negative amount) | — | 36 (1) (d), 40, 159, 472 (6) | ||||||||
| 14. Gains or losses on liabilities valued at fair value resulting from changes in own credit standing | (2 | ) | 32 (1) | k | ) | |||||
| 15. Defined-benefit pension fund assets (negative amount) | (13 | ) | 33 (b) | |||||||
| 16. Direct and indirect holdings by an institution of own CET1 instruments (negative amount) | (2,800 | ) | 36 (1) (e), 41, 472 (7) | l | ) | |||||
| 17. Direct, indirect and synthetic holdings of the CET1 instruments of financial sector entities where those entities have reciprocal cross holdings with the institution designed to inflate artificially the own funds of the institution (negative amount) | — | 36 (1) (f), 42, 472 (8) | ||||||||
| 18. Direct, indirect and synthetic holdings of the CET1 instruments of financial sector entities where the institution does not have a significant investment in those entities (amount above 10% threshold and net of eligible short positions) (negative amount) | — | 36 (1) (g), 44, 472 (9) | ||||||||
| 19. Direct, indirect and synthetic holdings of the CET1 instruments of financial sector entities where the institution has a significant investment in those entities (amount above 10% threshold and net of eligible short positions) (negative amount) | — | 36 (1) (h), 43, 45, 46, 49 (2) (3), 79, 472 (10) | ||||||||
| 20. Empty set in the EU | — | 36 (1) (i), 43, 45, 47, 48 (1) (b), 49 (1) a (3), 79, 470, 472 (11) | ||||||||
| 20.a Exposure amount of the following items which qualify for a RW of 1250%, where the institution opts for the deduction alternative | (22 | ) | ||||||||
| 20.b. of which: qualifying holdings outside the financial sector (negative amount) | — | 36 (1) (k) | ||||||||
| 20.c of which: securitisation positions (negative amount) | (22 | ) | 36 (1) (k) (i), 89 a 91 | m | ) | |||||
| 20.d of which: free deliveries (negative amount) | — | 36 (1) (k) (ii), 243 (1) (b), 244 (1) (b), 258 | ||||||||
| 21. Deferred tax assets arising from temporary difference (amount above 10 % threshold , net of related tax liability where the conditions in Article 38 (3) are met) (negative amount) | — | 36 (1) (k) (iii), 379 (3) | ||||||||
| 22. Amount exceeding the 17,65% threshold (negative amount) | (969 | ) | 36 (1) (c), 38, 48 (1) (a), 470, 472 (5) | |||||||
Table of Contents
| BBVA. PILLAR 3 2021 | ANNEXES | P. 261 |
| Regulation (UE) Nº575/2013 Reference | ||||||||||
| Phased-in | to article | Reference to EU CC2 template (1) | ||||||||
| 23. of which: direct and indirect holdings by the institution of the CET1 instruments of financial sector entities where the institution has a significant investment in those entities | (486 | ) | 48 (1) | |||||||
| 24. Empty set in the EU | — | 36 (1) (i), 48 (1) (b), 470, 472 (11) | ||||||||
| 25. of which: deferred tax assets arising from temporary difference | (483 | ) | ||||||||
| 25.a Losses for the current financial year (negative amount) | — | 36 (1) (c), 38, 48 (1) (a), 470, 472 (5) | ||||||||
| 25.b. Foreseeable tax charges relating to CET1 items except where the institution suitably adjusts the amount of CET1 items insofar as such tax charges reduce the amount up to which those items may be used to cover risks or losses (negative amount) | — | |||||||||
| 26. Empty set in the EU | — | 36 (1) (a), 472 (3) | ||||||||
| 27. Qualifying AT1 deductions that exceeds the AT1 capital of the institution (negative amount) | — | |||||||||
| 27.a. Other CET1 deductions | 241 | 36 (1) (j) | o | ) | ||||||
| 28. Total regulatory adjustments to Common Equity Tier 1 (CET1) | (5,836 | ) | ||||||||
| 29. Common Equity Tier 1 (CET1) capital | 39,949 | |||||||||
| Additional Tier 1 (AT1) capital: instruments 30. Capital instruments and the related share premium accounts | 5,265 | |||||||||
| 31. of which: classified as equity under applicable accounting standards | — | 51, 52 | ||||||||
| 32. of which: classified as liabilities under applicable accounting standards | — | p | ) | |||||||
| 33. Amount of qualifying items referred to in Article 484 (4) and the related share premium accounts subject to phase out from AT1 | — | q | ) | |||||||
| 33.a. Amount of qualifying items referred to in Article 494a(1) subject to phase out from AT1 | — | |||||||||
| 33.b. Amount of qualifying items referred to in Article 494b(1) subject to phase out from AT1 | — | |||||||||
| 34. Qualifying Tier 1 capital included in consolidated AT1 capital (including minority interest not included in row 5) issued by subsidiaries and held by third parties | 472 | 486 (3) | r | ) | ||||||
| 35. of which: instruments issued by subsidiaries subject to phase-out | — | 85, 86, 480 | ||||||||
| 36. Additional Tier 1 (AT1) capital before regulatory adjustments | 5,737 | 486 (3) | ||||||||
| Additional Tier 1 (AT1) capital: regulatory adjustments | s | ) | ||||||||
| 37. Direct and indirect holdings by an institution of own AT1 instruments (negative amount) | — | |||||||||
| 38. Holdings of the AT1 instruments of financial sector entities where those entities have reciprocal cross holdings with the institution designed to inflate artificially the own funds of the institution (negative amount) | — | 52 (1) (b), 56 (a), 57, 475 (2) | ||||||||
| 39. Direct, indirect and synthetic holdings of the AT1 instruments of financial sector entities where the institution does not have a significant investment in those entities (amount above 10% threshold and net of eligible short positions) (negative amount) | — | 56 (b), 58, 475 (3) | ||||||||
| 40. Direct, indirect and synthetic holdings of the AT1 instruments of financial sector entities where the institution has a significant investment in those entities (amount above 10% threshold and net of eligible short positions) (negative amount) | — | 56 (c), 59, 60, 79, 475 (4) | ||||||||
| 41. Empty set in the EU | — | 56 (d), 59, 79, 475 (4) | ||||||||
| 42. Qualifying T2 deductions that exceed the T2 capital of the institution (negative amount) | — | |||||||||
| 42a. Other regulatory to Additional Tier 1 | — | 56 (e) | ||||||||
| 43 Total regulatory adjustments to Additional Tier 1 (AT1) capital | — | |||||||||
| 44 Additional Tier 1 (AT1) capital | 5,737 | |||||||||
| 45 Tier 1 capital (T1 = CET1 + AT1) | 45,686 | |||||||||
| Tier 2 (T2) capital: instruments and provisions 46. Capital instruments and the related share premium accounts | 4,056 | t | ) | |||||||
| 47. Amount of qualifying items referred to in Article 484 (5) and the related share premium accounts subject to phase out from T2 | 268 | 62, 63 | u | ) | ||||||
| 47.a. Amount of qualifying items referred to in Article 494a (2) subject to phase out from T2 | — | |||||||||
| 47.b. Amount of qualifying items referred to in Article 494b (2) subject to phase out from T2 | — | |||||||||
Table of Contents
| BBVA. PILLAR 3 2021 | ANNEXES | P. 262 |
| Regulation (UE) Nº575/2013 Reference | ||||||||||
| Phased-in | to article | Reference to EU CC2 template (1) | ||||||||
| 48. Qualifying own funds instruments included in consolidated T2 capital (including minority interest and AT1 instruments not included in rows 5 or 34) issued by subsidiaries and held by third party | 2,516 | 486 (4) | v | ) | ||||||
| 49. of which: instruments issued by subsidiaries subject to phase-out | — | 87, 88, 480 | ||||||||
| 50. Credit risk adjustments | 722 | 486 (4) | w | ) | ||||||
| 51. Tier 2 (T2) capital before regulatory adjustment | 7,562 | 62 (c) y (d) | ||||||||
| Tier 2 (T2) capital: regulatory adjustments | ||||||||||
| 52. Direct and indirect holdings by an institution of own T2 instruments and subordinated loans (negative amount) | (10 | ) | ||||||||
| 53. Holdings of the T2 instruments and subordinated loans of financial sector entities where those entities have reciprocal cross holdings with the institutions designed to inflate artificially the own funds of the institution (negative amount) | — | 63 (b) (i), 66 (a), 67, 477 (2) | ||||||||
| 54. Direct, indirect and synthetic holdings of the T2 instruments and subordinated loans of financial sector entities where the institution does not have a significant investment in those entities (amount above 10 % threshold and net of eligible short positions) (negative amount) | — | 66 (b), 68, 477 (3) | ||||||||
| 54.a. Empty set in the EU | — | |||||||||
| 55. Direct, indirect and synthetic holdings of the T2 instruments and subordinated loans of financial sector entities where the institution has a significant investment in those entities (net of eligible short positions) (negative amounts) | — | 66 (c), 69, 70, 79, 477 (4) | ||||||||
| 56. Empty set in the EU | — | 66 (d), 69, 79, 477 (4) | ||||||||
| 65.a. Qualifying eligible liabilities deductions that exceed the eligible liabilities items of the institution (negative amount) | — | |||||||||
| 56.b Other regulatory adjustments to Tier 2 capital | (169 | ) | ||||||||
| 57 Total regulatory adjustments to Tier 2 (T2) capital | (179 | ) | ||||||||
| 58. Tier 2 (T2) capital | 7,383 | |||||||||
| 59. Total capital (TC = T1 + T2) | 53,069 | |||||||||
| 60 Total risk-weighted assets | 307,795 | |||||||||
| Capital ratios and capital buffers | ||||||||||
| 61. Common Equity Tier 1 (as a percentage of total risk exposure amount) | 12.98 | % | ||||||||
| 62. Tier 1 (as a percentage of total risk exposure amount) | 14.84 | % | 92 (2) (a), 465 | |||||||
| 63. Total capital (as a percentage of total risk exposure amount) | 17.24 | % | 92 (2) (b), 465 | |||||||
| 64. Institution specific buffer requirement (CET1 requirement in accordance with article 92 (1) (a) plus capital conservation and countercyclical buffer requirements plus a systemic risk buffer, plus systemically important institution buffer expressed as a percentage of total risk exposure amount) | 8.60 | % | 92 (2) (c) | |||||||
| 65. of which: capital conservation buffer requirement | 2.50 | % | DRC 128, 129 y 130 | |||||||
| 66. of which: countercyclical buffer requirement | 0.01 | % | ||||||||
| 67. of which: systemic risk buffer requirement | — | |||||||||
| 67.a. of which: Global Systemically Important Institution (G-SII) or Other Systemically Important Institution (O-SII) buffer | 0.75 | % | ||||||||
| 67.b. of which: additional own funds requirements to address the risks other than the risk of excessive leverage | 0.84 | % | ||||||||
| 68. Common Equity Tier 1 available to meet buffers (as a percentage of risk exposure amount) (*) | 7.64 | % | DRC 131 | |||||||
| 69. Not relevant in EU regulations | DRC 128 | |||||||||
| 70. Not relevant in EU regulations 71. Not relevant in EU regulations | ||||||||||
| Capital ratios and capital buffers | ||||||||||
| 72. Direct and indirect holdings of the capital of financial sector entities where the institution does not have a significant investment in those entities (amount below 10% threshold and net of eligible short positions | 1,474 | |||||||||
| 73. Direct and indirect holdings of the CET1 instruments of financial sector entities where the institution has a significant investment in those entities (amount below 10% threshold and net of eligible short positions | 2,975 | 36 (1) (h), 45, 46, 472 (10), 56 (c), 59, 60, 475 (4), 66 (c), 69, 70, 477 (4) | ||||||||
Table of Contents
| BBVA. PILLAR 3 2021 | ANNEXES | P. 263 |
| Regulation (UE) Nº575/2013 Reference | ||||||||||
| Phased-in | to article | Reference to EU CC2 template (1) | ||||||||
| 74. Empty set in the EU | — | 36 (1) (i), 45, 48, 470, 472 (11) | ||||||||
| 75. Deferred tax assets arising from temporary difference (amount below 10 % threshold , net of related tax liability where the conditions in Article 38 (3) are met) | 2,924 | |||||||||
| Applicable caps on the inclusion of provisions in Tier 2 | 36 (1)(c), 38, 48, 470, 472 (5) | |||||||||
| 76. Credit risk adjustments included in T2 in respect of exposures subject to standardised approach (prior to the application of the cap) | — | |||||||||
| 77. Cap on inclusion of credit risk adjustments in T2 under standardised approach | 1,695 | 62 | ||||||||
| 78. Credit risk adjustments included in T2 in respect of exposures subject to internal rating-based approach (prior to the application of the cap) | 956 | 62 | ||||||||
| 79. Cap for inclusion of credit risk adjustments in T2 under internal ratings-based approach | 722 | 62 | ||||||||
| Capital instruments subject to phasing-out provisions (applicable only between 1st January 2013 and 1st January 2022) | 62 | |||||||||
| 80. Current cap on CET1 instruments subject to phase-out arrangements | — | |||||||||
| 81. Amount excluded from CET1 due to cap (excess over cap after redemptions and maturities) | — | 484 (3), 486 (2) y (5) | ||||||||
| 82. Current cap on AT1 instruments subject to phase-out arrangements | 184 | 484 (3), 486 (2) y (5) | ||||||||
| 83. Amount excluded from AT1 due to cap (excess over cap after redemptions and maturities) | — | 484 (4), 486 (3) y (5) | ||||||||
| 84. Current cap on T2 instruments subject to phase-out arrangements | 129 | 484 (4), 486 (3) y (5) | ||||||||
| 85. Amount excluded from T2 due to cap (excess over cap after redemptions and maturities) | (108 | ) | 484 (5), 486 (4) y (5) | |||||||
| (*) | This template is presented in accordance with the structure and format established by the implementing technical standards published by the EBA in June 2020 (EBA/ITS/2020/04). |
| (**) | Additionally, at the reporting date, the Group is not applying the transitory treatment of unrealised gains and losses valued at fair value with changes in other comprehensive income (hereinafter, unrealised P&L at fair value with changes in OCI) defined by article 1 paragraph 6 of the aforementioned Regulation amending article 468 of the CRR. Therefore, the Group’s own funds, capital and leverage ratios to date include the full impact of the aforementioned unrealised P&L at fair value with changes in OCI. |
| (1) | Reference to the headings of the regulatory balance sheet (CC2) where the different items described are reflected. |
| (2) | As of December 31, 2021, a deduction of €3.5 billion is included corresponding to the maximum amount authorized by the ECB for the repurchase of treasury shares within the Framework Program for the Repurchase of Own Shares, of which the first tranche approved by the Board of Directors and pending execution for the amount of €931 million is recorded under the heading “Other accumulated income and other reserves” and the remaining amount of €2,569 million is included under the heading “Direct, indirect and syntheses of own instruments. |
| (3) | Excess of CET1 over the Group’s minimum Common Equity Tier 1 capital requirements established by the ECB through the SREP letter applicable to date. |
Table of Contents
| BBVA. PILLAR 3 2021 | ANNEXES | P. 264 |
III.1. Parent company AT1 issuances (Millon euros. 12-31-2021)
| 1. Issuer | Banco Bilbao Vizcaya Argentaria S.A. | Banco Bilbao Vizcaya Argentaria SA | ||
| 2. Unique identifier (e.g. ISIN) | ES0813211028 | US05946KAG67 | ||
| 2a. Public or private | Public | Public | ||
| 3. Governing law(s) of the instrument | Spanish | New York, except subordination, set-off waiver and recognition of bail-in power which are under Spanish law | ||
| 3a. Contractual recognition of conversion by resolution institution | Yes | Yes | ||
| Regulatory treatment | ||||
| 4. Transitional CRR rules | Additional Tier 1 | Additional Tier 1 | ||
| 5. Post-transitional CRR rules | Additional Tier 1 | Additional Tier 1 | ||
| 6. Eligible at solo/(sub-)consolidated/solo & (sub-)consolidated | At solo & (sub-)consolidated | At solo & (sub-)consolidated | ||
| 7. Instrument type (types to be specified by each jurisdiction) | AT1-Contingent Convertible | AT1-Contingent Convertible | ||
| 8. Amount recognised in regulatory capital (currency in million, as of most recent reporting date) | 1000 | 883 | ||
| 9. Nominal amount of instrument | EUR 1,000 Mill | USD 1,000 Mill | ||
| 9.a. Issue price | 100.00% | 100.00% | ||
| 9.b. Redemption price | 100% | 100% | ||
| 10. Accounting classification | Liability – amortised cost | Liability – amortised cost | ||
| 11. Original date of issuance | 15/7/2020 | 9/5/2019 | ||
| 12. Perpetual or dated | Perpetual | Perpetual | ||
| 13. Original maturity date | No maturity | No maturity | ||
| 14. Issuer call subject to prior supervisory approval | Yes | Yes | ||
| 15. Optional call date, contingent call dates, and redemption amount | Issuer call date: 15/01/2026; also subject to both Regulatory and Tax call. 100% | Issuer call date: 03/05/2025; also subject to both Regulatory and Tax call. 100% | ||
| 16. Subsequent call dates, if applicable | At any time on or after the first reset date | At any time on or after the first reset date | ||
| Coupons / dividends | ||||
| 17. Fixed or floating dividend/coupon | Fixed Reset | Fixed Reset | ||
| 18. Coupon rate and any related index | 6%; the 5-year Mid-Swap Rate + 6,456% | 6,5% quarterly until First Reset Date (March 5th); 5-year UST + 5,192% | ||
| 19. Existence of a dividend stopper | No | No | ||
| 20.a. Fully discretionary, partially discretionary or mandatory (in terms of timing | Fully discretionary | Fully discretionary | ||
| 20.b. Fully discretionary, partially discretionary or mandatory (in terms of amount) | Fully discretionary | Fully discretionary | ||
| 21. Existence of step up or other incentive to redeem | No | No | ||
| 22. Noncumulative or cumulative | Noncumulative | Noncumulative | ||
| 23. Convertible or non-convertible | Convertible according to its T&C (Trigger Event and Capital Reduction) and in case of non-viability or resolution (PONV) | Convertible according to its T&C (Trigger Event and Capital Reduction) and in case of non-viability or resolution (PONV) | ||
| 24. If convertible, conversion trigger (s) | Trigger event: CET1 5.125%; At solo & (sub-)consolidated. Contractual recognition Capital Reduction: Capital reduction provided for in Article 418.3 of the LSC. Contractual recognition PONV: Statutory recognition. Competent authority: SRB | Trigger event: CET1 5.125%; At solo & (sub-)consolidated. Contractual recognition Capital Reduction: Capital reduction provided for in Article 418.3 of the LSC. Contractual recognition PONV: Statutory recognition. Competent authority: SRB | ||
| 25. If convertible, fully or partially | Trigger event: Total Capital reduction: Total PONV: Total or partial, depending on what the SRB determines | Trigger event: Total Capital reduction: Total PONV: Total or partial, depending on what the SRB determines | ||
| 26. If convertible, conversion rate | Trigger Event and Capital Reduction: Variable PONV: To decide by SRB | Trigger Event and Capital Reduction: Variable PONV: To decide by SRB | ||
| 27. If convertible, mandatory or optional conversion | Trigger event: Mandatory Capital reduction: Mandatory (unless otherwise indicated by the holder) PONV: Mandatory | Trigger event: Mandatory Capital reduction: Mandatory (unless otherwise indicated by the holder) PONV: Mandatory | ||
| 28. If convertible, specify instrument type convertible into | Trigger Event and Capital Reduction: BBVA’s CET1 PONV: To be decided by SRB | Trigger Event and Capital Reduction: BBVA’s CET1 PONV: To decide by SRB | ||
| 29. If convertible, specify issuer of instrument it converts into | Trigger Event and Capital Reduction: BBVA PONV: To be decided by SRB | Trigger Event and Capital Reduction: BBVA PONV: To be decided by SRB | ||
| 30. Write-down features | Yes | Yes | ||
| 31. If write-down, write-down trigger (s) | Trigger event and Capital reduction: BBVA’s CET1 PONV:To be decided by the SRB | Trigger event and Capital reduction: BBVA’s CET1 PONV:To be decided by the SRB | ||
| 32. If write-down, full or partial | Fully or partially | Fully or partially | ||
| 33. If write-down, permanent or temporary | Permanent | Permanent | ||
| 34. If temporary write-down, description of write-up mechanism | N/A | N/A | ||
| 34a. Type of subordination | N/A | N/A | ||
| 34b. Order of priority in normal insolvency proceedings | 2 | 2 | ||
| 35. Position in subordination hierarchy in liquidation (specify instrument type immediately senior to instrument) | Senior to common shares and reserves and pari passu with preferred shares and the others AT1. Immediately subordinate to Tier 2 | Senior to common shares and reserves and pari passu with preferred shares and the rest of AT1. Immediately subordinate to Tier 2 | ||
| 36. Non-compliant transitioned features | No | No | ||
| 37. If yes, specify non-compliant features | N/A | N/A | ||
| 37a. Link to the terms and conditions of the instrument | Terms and Conditions | Terms and Conditions | ||
Table of Contents
| BBVA. PILLAR 3 2021 | ANNEXES | P. 265 |
| 1. Issuer | Banco Bilbao Vizcaya Argentaria SA | Banco Bilbao Vizcaya Argentaria SA | ||
| 2. Unique identifier (e.g. ISIN) | ES0813211010 | XS1619422865 | ||
| 2a. Public or private | Public | Private | ||
| 3. Governing law(s) of the instrument | Spanish | Spanish | ||
| 3a. Contractual recognition of conversion by resolution institution | Yes | Yes | ||
| Regulatory treatment | ||||
| 4. Transitional CRR rules | Additional Tier 1 | Additional Tier 1 | ||
| 5. Post-transitional CRR rules | Additional Tier 1 | Additional Tier 1 | ||
| 6. Eligible at solo/(sub-)consolidated/solo & (sub-)consolidated | At solo & (sub-)consolidated | At solo & (sub-)consolidated | ||
| 7. Instrument type (types to be specified by each jurisdiction) | AT1-Contingent Convertible | AT1-Contingent Convertible | ||
| 8. Amount recognised in regulatory capital (currency in million, as of most recent reporting date) | 1000 | 500 | ||
| 9. Nominal amount of instrument | EUR 1,000 Mill | EUR 500 Mill | ||
| 9.a. Issue price | 100.00% | 100.00% | ||
| 9.b. Redemption price | 100% | 100% | ||
| 10. Accounting classification | Liability – amortised cost | Liability – amortised cost | ||
| 11. Original date of issuance | 29/3/2019 | 24/5/2017 | ||
| 12. Perpetual or dated | Perpetual | Perpetual | ||
| 13. Original maturity date | No maturity | No maturity | ||
| 14. Issuer call subject to prior supervisory approval | Yes | Yes | ||
| 15. Optional call date, contingent call dates, and redemption amount | Issuer call date: 29/03/2024; also subject to both Regulatory and Tax call. 100% | Issuer call date: 24/05/2022 (fully) also subject to both Regulatory and Tax call (entirely). 100% | ||
| 16. Subsequent call dates, if applicable | At any time on or after the first reset date | At any time on or after the first reset date | ||
| Coupons / dividends | ||||
| 17. Fixed or floating dividend/coupon | Fixed Reset | Fixed Reset | ||
| 18. Coupon rate and any related index | 6%; 5-year Mid-Swap Rate + 6,039% | 5,875%; 5 year Euro mid-swap rate + 5,779% | ||
| 19. Existence of a dividend stopper | No | No | ||
| 20.a. Fully discretionary, partially discretionary or mandatory (in terms of timing | Fully discretionary | Fully discretionary | ||
| 20.b. Fully discretionary, partially discretionary or mandatory (in terms of amount) | Fully discretionary | Fully discretionary | ||
| 21. Existence of step up or other incentive to redeem | No | No | ||
| 22. Noncumulative or cumulative | Noncumulative | Noncumulative | ||
| 23. Convertible or non-convertible | Convertible according to its T&C (Trigger Event and Capital Reduction) and in case of non-viability or resolution (PONV) | Convertible according to its T&C (Trigger Event and Capital Reduction) and in case of non-viability or resolution (PONV) | ||
| 24. If convertible, conversion trigger (s) | Trigger event: CET1 5.125%; At solo & (sub-)consolidated. Contractual recognition Capital Reduction: Capital reduction provided for in Article 418.3 of the LSC. Contractual recognition PONV: Statutory recognition. Competent authority: SRB | Trigger event: CET1 5.125%; At solo & (sub-)consolidated. Contractual recognition Capital Reduction: Capital reduction provided for in Article 418.3 of the LSC. Contractual recognition PONV: Statutory recognition. Competent authority: SRB | ||
| 25. If convertible, fully or partially | Trigger event: Total Capital reduction: Total PONV: Total or partial, depending on what the SRB determines | Trigger event: Total Capital reduction: Total PONV: Total or partial, depending on what the SRB determines | ||
| 26. If convertible, conversion rate | Trigger Event and Capital Reduction: Variable PONV: To decide by SRB | Trigger Event and Capital Reduction: Variable PONV: To decide by SRB | ||
| 27. If convertible, mandatory or optional conversion | Trigger event: Mandatory Capital reduction: Mandatory (unless otherwise indicated by the holder) PONV: Mandatory | Trigger event: Mandatory Capital reduction: Mandatory (unless otherwise indicated by the holder) PONV: Mandatory | ||
| 28. If convertible, specify instrument type convertible into | Trigger Event and Capital Reduction: BBVA’s CET1 PONV: To decide by SRB | Trigger Event and Capital Reduction: BBVA’s CET1 PONV: To decide by SRB | ||
| 29. If convertible, specify issuer of instrument it converts into | Trigger Event and Capital Reduction: BBVA PONV: To be decided by SRB | Trigger Event and Capital Reduction: BBVA PONV: To be decided by SRB | ||
| 30. Write-down features | Yes | Yes | ||
| 31. If write-down, write-down trigger (s) | Trigger event and Capital reduction: BBVA’s CET1 PONV:To be decided by the SRB | Trigger event and Capital reduction: BBVA’s CET1 PONV:To be decided by the SRB | ||
| 32. If write-down, full or partial | Fully or partially | Fully or partially | ||
| 33. If write-down, permanent or temporary | Permanent | Permanent | ||
| 34. If temporary write-down, description of write-up mechanism | N/A | N/A | ||
| 34a. Type of subordination | N/A | N/A | ||
| 34b. Order of priority in normal insolvency proceedings | 2 | 2 | ||
| 35. Position in subordination hierarchy in liquidation (specify instrument type immediately senior to instrument) | Senior to common shares and reserves and pari passu with preferred shares and the rest of AT1. Immediately subordinate to Tier 2 | Senior to common shares and reserves and pari passu with preferred shares and the rest of AT1. Immediately subordinate to Tier 2 | ||
| 36. Non-compliant transitioned features | No | No | ||
| 37. If yes, specify non-compliant features | N/A | N/A | ||
| 37a. Link to the terms and conditions of the instrument | Terms and Conditions | Terms and Conditions | ||
Table of Contents
| BBVA. PILLAR 3 2021 | ANNEXES | P. 266 |
| 1. Issuer | Banco Bilbao Vizcaya Argentaria SA | Banco Bilbao Vizcaya Argentaria SA | ||
| 2. Unique identifier (e.g. ISIN) | US05946KAF84 | ES0813211002 | ||
| 2a. Public or private | Public | Public | ||
| 3. Governing law(s) of the instrument | New York law, except provisions relating to the subordination of the Preferred Securities shall be governed by with the common laws of Spain | Spanish | ||
| 3a. Contractual recognition of conversion by resolution institution | Yes | Yes | ||
| Regulatory treatment | ||||
| 4. Transitional CRR rules | Additional Tier 1 | Additional Tier 1 | ||
| 5. Post-transitional CRR rules | Additional Tier 1 | Additional Tier 1 | ||
| 6. Eligible at solo/(sub-)consolidated/solo & (sub-)consolidated | At solo & (sub-)consolidated | At solo & (sub-)consolidated | ||
| 7. Instrument type (types to be specified by each jurisdiction) | AT1-Contingent Convertible | AT1-Contingent Convertible | ||
| 8. Amount recognised in regulatory capital (currency in million, as of most recent reporting date) | 883 | 1000 | ||
| 9. Nominal amount of instrument | USD 1,000 Mill | EUR 1000 Mill | ||
| 9.a. Issue price | 100.00% | 100.00% | ||
| 9.b. Redemption price | 100% | 100% | ||
| 10. Accounting classification | Liability – amortised cost | Liability – amortised cost | ||
| 11. Original date of issuance | 16/11/2017 | 24/9/2018 | ||
| 12. Perpetual or dated | Perpetual | Perpetual | ||
| 13. Original maturity date | No maturity | No maturity | ||
| 14. Issuer call subject to prior supervisory approval | Yes | Yes | ||
| 15. Optional call date, contingent call dates, and redemption amount | Issuer call date: 16/11/2027 (fully) also subject to both Regulatory and Tax call (entirely). 100% | Issuer call date: 24/09/2023 (fully) also subject to both Regulatory and Tax call (entirely). 100% | ||
| 16. Subsequent call dates, if applicable | At any time on or after the first reset date | At any time on or after the first reset date | ||
| Coupons / dividends | ||||
| 17. Fixed or floating dividend/coupon | Fixed Reset | Fixed Reset | ||
| 18. Coupon rate and any related index | 6.125% quarterly (10 initial years); 5 year Mid-Swap + 3,870% 5.875%; EUR 5 year mid Swaps + 5.66% | |||
| 19. Existence of a dividend stopper | No | No | ||
| 20.a. Fully discretionary, partially discretionary or mandatory (in terms of timing | Fully discretionary | Fully discretionary | ||
| 20.b. Fully discretionary, partially discretionary or mandatory (in terms of amount) | Fully discretionary | Fully discretionary | ||
| 21. Existence of step up or other incentive to redeem | No | No | ||
| 22. Noncumulative or cumulative | Noncumulative | Noncumulative | ||
| 23. Convertible or non-convertible | Convertible according to its T&C (Trigger Event and Capital Reduction) and in case of non-viability or resolution (PONV) | Convertible according to its T&C (Trigger Event and Capital Reduction) and in case of non-viability or resolution (PONV) | ||
| 24. If convertible, conversion trigger (s) | Trigger event: CET1 5.125%; At solo & (sub-)consolidated. Contractual recognition Capital Reduction: Capital reduction provided for in Article 418.3 of the LSC. Contractual recognition PONV: Statutory recognition. Competent authority: SRB | Trigger event: CET1 5.125%; At solo & (sub-)consolidated. Contractual recognition Capital Reduction: Capital reduction provided for in Article 418.3 of the LSC. Contractual recognition PONV: Statutory recognition. Competent authority: SRB | ||
| 25. If convertible, fully or partially | Trigger event: Total Capital reduction: Total PONV: Total or partial, depending on what the SRB determines | Trigger event: Total Capital reduction: Total PONV: Total or partial, depending on what the SRB determines | ||
| 26. If convertible, conversion rate | Trigger Event and Capital Reduction: Variable PONV: To decide by SRB | Trigger Event and Capital Reduction: Variable PONV: To decide by SRB | ||
| 27. If convertible, mandatory or optional conversion | Trigger event: Mandatory Capital reduction: Mandatory (unless otherwise indicated by the holder) PONV: Mandatory | Trigger event: Mandatory Capital reduction: Mandatory (unless otherwise indicated by the holder) PONV: Mandatory | ||
| 28. If convertible, specify instrument type convertible into | Trigger Event and Capital Reduction: BBVA’s CET1 PONV: To decide by SRB | Trigger Event and Capital Reduction: BBVA’s CET1 PONV: To decide by SRB | ||
| 29. If convertible, specify issuer of instrument it converts into | Trigger Event and Capital Reduction: BBVA PONV: To be decided by SRB | Trigger Event and Capital Reduction: BBVA PONV: To be decided by SRB | ||
| 30. Write-down features | Yes | Yes | ||
| 31. If write-down, write-down trigger (s) | Trigger event and Capital reduction: BBVA’s CET1 PONV:To be decided by the SRB | Trigger event and Capital reduction: BBVA’s CET1 PONV:To be decided by the SRB | ||
| 32. If write-down, full or partial | Fully or partially | Fully or partially | ||
| 33. If write-down, permanent or temporary | Permanent | Permanent | ||
| 34. If temporary write-down, description of write-up mechanism | N/A | N/A | ||
| 34a. Type of subordination | N/A | N/A | ||
| 34b. Order of priority in normal insolvency proceedings | 2 | 2 | ||
| 35. Position in subordination hierarchy in liquidation (specify instrument type immediately senior to instrument) | Senior to common shares and reserves and pari passu with preferred shares and the rest of AT1. Immediately subordinate to Tier 2 | Senior to common shares and reserves and pari passu with preferred shares and the rest of AT1. Immediately subordinate to Tier 2 | ||
| 36. Non-compliant transitioned features | No | No | ||
| 37. If yes, specify non-compliant features | N/A | N/A | ||
| 37a. Link to the terms and conditions of the instrument | Terms and Conditions | Terms and Conditions | ||
Table of Contents
| BBVA. PILLAR 3 2021 | ANNEXES | P. 267 |
III.2. Parent company AT2 issuances (Millon euros. 12-31-2021)
| 1. Issuer | Banco Bilbao Vizcaya Argentaria SA | Banco Bilbao Vizcaya Argentaria SA | ||
| 2. Unique identifier (e.g. ISIN) | XS2206805769 | XS2104051433 | ||
| 2a. Public or private | Public | Public | ||
| 3. Governing law(s) of the instrument | Spanish | Spanish | ||
| 3a. Contractual recognition of conversion by resolution institution | Yes | Yes | ||
| Regulatory treatment | ||||
| 4. Transitional CRR rules | Tier 2 | Tier 2 | ||
| 5. Post-transitional CRR rules | Tier 2 | Tier 2 | ||
| 6. Eligible at solo/(sub-)consolidated/solo & (sub-)consolidated | At solo & (sub-)consolidated | At solo & (sub-)consolidated | ||
| 7. Instrument type (types to be specified by each jurisdiction) | Tier 2 instrument | Tier 2 instrument | ||
| 8. Amount recognised in regulatory capital (currency in million, as of most recent reporting date) | 349 | 1002 | ||
| 9. Nominal amount of instrument | GBP 300 Mill | EUR 1,000 Mill | ||
| 9.a. Issue price | 100.00% | 99.39% | ||
| 9.b. Redemption price | 100% | 100% | ||
| 10. Accounting classification | Liability – amortised cost | Liability – amortised cost | ||
| 11. Original date of issuance | 15/7/2020 | 16/1/2020 | ||
| 12. Perpetual or dated | Dated | Dated | ||
| 13. Original maturity date | 15/7/2031 | 16/1/2030 | ||
| 14. Issuer call subject to prior supervisory approval | Yes | Yes | ||
| 15. Optional call date, contingent call dates, and redemption amount | Issuer call date: 15/07/2025; also subject to both Regulatory (Total) and Tax call (Partial). 100% | Issuer call date: 16/01/2025; also subject to both Regulatory (Total) and Tax call (Partial). 100% | ||
| 16. Subsequent call dates, if applicable | No | No | ||
| Coupons / dividends | ||||
| 17. Fixed or floating dividend/coupon | Fixed reset | Fixed reset | ||
| 18. Coupon rate and any related index | 3,104%; 5-year GBP Mid Swap Rate + 127pbs | 1%; 5Y Euro Mid Swap + 127 bps | ||
| 19. Existence of a dividend stopper | No | No | ||
| 20.a. Fully discretionary, partially discretionary or mandatory (in terms of timing | Mandatory | Mandatory | ||
| 20.b. Fully discretionary, partially discretionary or mandatory (in terms of amount) | Mandatory | Mandatory | ||
| 21. Existence of step up or other incentive to redeem | No | No | ||
| 22. Noncumulative or cumulative | Cumulative | Cumulative | ||
| 23. Convertible or non-convertible | Convertible in case of non-viability or resolution (PONV) | Convertible in case of non-viability or resolution (PONV) | ||
| 24. If convertible, conversion trigger (s) | PONV Competent authority: SRB Contractual recognition | PONV Competent authority: SRB Contractual recognition | ||
| 25. If convertible, fully or partially | Total or partial, depending on what the SRB determines | Total or partial, depending on what the SRB determines | ||
| 26. If convertible, conversion rate | To be decided by SRB | To be decided by SRB | ||
| 27. If convertible, mandatory or optional conversion | Mandatory | Mandatory | ||
| 28. If convertible, specify instrument type convertible into | To be decided by SRB | To be decided by SRB | ||
| 29. If convertible, specify issuer of instrument it converts into | To be decided by SRB | To be decided by SRB | ||
| 30. Write-down features | Yes | Yes | ||
| 31. If write-down, write-down trigger (s) | PONV Competent authority: SRB Contractual recognition | PONV Competent authority: SRB Contractual recognition | ||
| 32. If write-down, full or partial | Fully or partially | Fully or partially | ||
| 33. If write-down, permanent or temporary | Permanent | Permanent | ||
| 34. If temporary write-down, description of write-up mechanism | N/A | N/A | ||
| 34a. Type of subordination | N/A | N/A | ||
| 34b. Order of priority in normal insolvency proceedings | 3 | 3 | ||
| 35. Position in subordination hierarchy in liquidation (specify instrument type immediately senior to instrument) | Senior to capital, reserves and instruments AT1 Pari passu to other issues of T2 (compute or not compute in capital) Junior to Tier 3 and senior bonds both preferred and non-preferred | Senior to capital, reserves and instruments AT1 Pari passu to other issues of T2 (compute or not compute in capital) Junior to Tier 3 and senior bonds both preferred and non-preferred | ||
| 36. Non-compliant transitioned features | No | No | ||
| 37. If yes, specify non-compliant features | N/A | N/A | ||
| 37a. Link to the terms and conditions of the instrument | Terms and Conditions | Terms and Conditions | ||
Table of Contents
| BBVA. PILLAR 3 2021 | ANNEXES | P. 268 |
| 1. Issuer | Banco Bilbao Vizcaya Argentaria SA | Banco Bilbao Vizcaya Argentaria SA | ||
| 2. Unique identifier (e.g. ISIN) | XS1954087695 | XS1562614831 | ||
| 2a. Public or private | Public | Public | ||
| 3. Governing law(s) of the instrument | Spanish | English legislation except provisions of status of the notes under Spanish law | ||
| 3a. Contractual recognition of conversion by resolution institution | Yes | Yes | ||
| Regulatory treatment | ||||
| 4. Transitional CRR rules | Tier 2 | Tier 2 | ||
| 5. Post-transitional CRR rules | Tier 2 | Tier 2 | ||
| 6. Eligible at solo/(sub-)consolidated/solo & (sub-)consolidated | At solo & (sub-)consolidated | At solo & (sub-)consolidated | ||
| 7. Instrument type (types to be specified by each jurisdiction) | Tier 2 instrument | Tier 2 instrument | ||
| 8. Amount recognised in regulatory capital (currency in million, as of most recent reporting date) | 770 | 1067 | ||
| 9. Nominal amount of instrument | EUR 750 Mill | EUR 1,000 Mill | ||
| 9.a. Issue price | 100.00% | 99.99% | ||
| 9.b. Redemption price | 100% | 100% | ||
| 10. Accounting classification | Liability – amortised cost | Liability – amortised cost | ||
| 11. Original date of issuance | 22/2/2019 | 2/10/2017 | ||
| 12. Perpetual or dated | Dated | Dated | ||
| 13. Original maturity date | 22/2/2029 | 2/10/2027 | ||
| 14. Issuer call subject to prior supervisory approval | Yes | No | ||
| 15. Optional call date, contingent call dates, and redemption amount | Issuer call date: 22/02/2024; also subject to both Regulatory (Total) and Tax call (Partial). 100% | Only subject to both Regulatory and Tax call 100% | ||
| 16. Subsequent call dates, if applicable | No | N/A | ||
| Coupons / dividends | ||||
| 17. Fixed or floating dividend/coupon | Fixed reset | Fixed | ||
| 18. Coupon rate and any related index | 2.575%; 5Y Euro Mid Swap + 245 bps | 3.50% | ||
| 19. Existence of a dividend stopper | No | No | ||
| 20.a. Fully discretionary, partially discretionary or mandatory (in terms of timing | Mandatory | Mandatory | ||
| 20.b. Fully discretionary, partially discretionary or mandatory (in terms of amount) | Mandatory | Mandatory | ||
| 21. Existence of step up or other incentive to redeem | No | No | ||
| 22. Noncumulative or cumulative | Cumulative | Cumulative | ||
| 23. Convertible or non-convertible | Convertible in case of non-viability or resolution (PONV) | Convertible in case of non-viability or resolution (PONV) | ||
| 24. If convertible, conversion trigger (s) | PONV Competent authority: SRB Contractual recognition | PONV Competent authority: SRB Contractual recognition | ||
| 25. If convertible, fully or partially | Total or partial, depending on what the SRB determines | Total or partial, depending on what the SRB determines | ||
| 26. If convertible, conversion rate | To be decided by SRB | To be decided by SRB | ||
| 27. If convertible, mandatory or optional conversion | Mandatory | Mandatory | ||
| 28. If convertible, specify instrument type convertible into | To be decided by SRB | To be decided by SRB | ||
| 29. If convertible, specify issuer of instrument it converts into | To be decided by SRB | To be decided by SRB | ||
| 30. Write-down features | Yes | Yes | ||
| 31. If write-down, write-down trigger (s) | PONV Competent authority: SRB Contractual recognition | PONV Competent authority: SRB Contractual recognition | ||
| 32. If write-down, full or partial | Fully or partially | Fully or partially | ||
| 33. If write-down, permanent or temporary | Permanent | Permanent | ||
| 34. If temporary write-down, description of write-up mechanism | N/A | N/A | ||
| 34a. Type of subordination | N/A | N/A | ||
| 34b. Order of priority in normal insolvency proceedings | 3 | 3 | ||
| 35. Position in subordination hierarchy in liquidation (specify instrument type immediately senior to instrument) | Senior to capital, reserves and instruments AT1 Pari passu to other issues of T2 (compute or not compute in capital) Junior to Tier 3 and senior bonds both preferred and non- preferred | Senior to capital, reserves and instruments AT1 Pari passu to other issues of T2 (compute or not compute in capital) Junior to Tier 3 and senior bonds both preferred and non- preferred | ||
| 36. Non-compliant transitioned features | No | No | ||
| 37. If yes, specify non-compliant features | N/A | N/A | ||
| 37a. Link to the terms and conditions of the instrument | Terms and Conditions | Terms and Conditions | ||
Table of Contents
| BBVA. PILLAR 3 2021 | ANNEXES | P. 269 |
| 1. Issuer | Banco Bilbao Vizcaya Argentaria SA | Banco Bilbao Vizcaya Argentaria SA | ||
| 2. Unique identifier (e.g. ISIN) | XS1569874503 | XS1579039006 | ||
| 2a. Public or private | Private | Private | ||
| 3. Governing law(s) of the instrument | English legislation except provisions of status of the notes under Spanish law | English legislation except provisions of status of the notes under Spanish law | ||
| 3a. Contractual recognition of conversion by resolution institution | Yes | Yes | ||
| Regulatory treatment | ||||
| 4. Transitional CRR rules | Tier 2 | Tier 2 | ||
| 5. Post-transitional CRR rules | Tier 2 | Tier 2 | ||
| 6. Eligible at solo/(sub-)consolidated/solo & (sub-)consolidated | At solo & (sub-)consolidated | At solo & (sub-)consolidated | ||
| 7. Instrument type (types to be specified by each jurisdiction) | Tier 2 instrument | Tier 2 instrument | ||
| 8. Amount recognised in regulatory capital (currency in million, as of most recent reporting date) | 184 | 54 | ||
| 9. Nominal amount of instrument | EUR 165 Mill | EUR 53,4 mills | ||
| 9.a. Issue price | 99.45% | 100.00% | ||
| 9.b. Redemption price | 100% | 100% | ||
| 10. Accounting classification | Liability – amortised cost | Liability – amortised cost | ||
| 11. Original date of issuance | 24/2/2017 & 14/3/2017 | 16/3/2017 | ||
| 12. Perpetual or dated | Dated | Dated | ||
| 13. Original maturity date | 24/2/2032 | 16/3/2027 | ||
| 14. Issuer call subject to prior supervisory approval | No | No | ||
| 15. Optional call date, contingent call dates, and redemption amount | Only subject to both Regulatory and Tax call 100% | Only subject to both Regulatory and Tax call 100% | ||
| 16. Subsequent call dates, if applicable | N/A | N/A | ||
| Coupons / dividends | ||||
| 17. Fixed or floating dividend/coupon | Fixed | Fixed (until 03/16/2019) and floating since that date | ||
| 18. Coupon rate and any related index | 4.00% | 3% and afterwards annually resettable at CMS (10 years) +1.30% | ||
| 19. Existence of a dividend stopper | No | No | ||
| 20.a. Fully discretionary, partially discretionary or mandatory (in terms of timing | Mandatory | Mandatory | ||
| 20.b. Fully discretionary, partially discretionary or mandatory (in terms of amount) | Mandatory | Mandatory | ||
| 21. Existence of step up or other incentive to redeem | No | No | ||
| 22. Noncumulative or cumulative | Cumulative | Cumulative | ||
| 23.Convertible or non-convertible | Convertible in case of non-viability or resolution (PONV) | Convertible in case of non-viability or resolution (PONV) | ||
| 24. If convertible, conversion trigger (s) | PONV Competent authority: | PONV Competent authority: | ||
| SRB Contractual recognition | SRB Contractual recognition | |||
| 25. If convertible, fully or partially | Total or partial, depending on what the SRB determines | Total or partial, depending on what the SRB determines | ||
| 26. If convertible, conversion rate | To be decided by SRB | To be decided by SRB | ||
| 27. If convertible, mandatory or optional conversion | Mandatory | Mandatory | ||
| 28. If convertible, specify instrument type convertible into | To be decided by SRB | To be decided by SRB | ||
| 29. If convertible, specify issuer of instrument it converts into | To be decided by SRB | To be decided by SRB | ||
| 30. Write-down features | Yes | Yes | ||
| 31. If write-down, write-down trigger (s) | PONV Competent authority: | PONV Competent authority: | ||
| SRB Contractual recognition | SRB Contractual recognition | |||
| 32. If write-down, full or partial | Fully or partially | Fully or partially | ||
| 33. If write-down, permanent or temporary | Permanent | Permanent | ||
| 34. If temporary write-down, description of write-up mechanism | N/A | N/A | ||
| 34a. Type of subordination | N/A | N/A | ||
| 34b. Order of priority in normal insolvency proceedings | 3 | 3 | ||
| 35. Position in subordination hierarchy in liquidation (specify instrument type immediately senior to instrument) | Senior to capital, reserves and instruments AT1 Pari passu to other issues of T2 (compute or not compute in capital) Junior to Tier 3 and senior bonds both preferred and non-preferred | Senior to capital, reserves and instruments AT1 Pari passu to other issues of T2 (compute or not compute in capital) Junior to Tier 3 and senior bonds both preferred and non-preferred | ||
| 36. Non-compliant transitioned features | No | No | ||
| 37. If yes, specify non-compliant features | N/A | N/A | ||
| 37a. Link to the terms and conditions of the instrument | Terms and Conditions | Terms and Conditions | ||
Table of Contents
| BBVA. PILLAR 3 2021 | ANNEXES | P. 270 |
| 1. Issuer | Banco Bilbao Vizcaya Argentaria SA | Banco Bilbao Vizcaya Argentaria SA | ||
| 2. Unique identifier (e.g. ISIN) | XS1587857498 | XS1615673701 | ||
| 2a. Public or private | Private | Private | ||
| 3. Governing law(s) of the instrument | English legislation except provisions of status of the notes under Spanish law | English legislation except provisions of status of the notes under Spanish law | ||
| 3a. Contractual recognition of conversion by resolution institution | Yes | Yes | ||
| Regulatory treatment | ||||
| 4. Transitional CRR rules | Tier 2 | Tier 2 | ||
| 5. Post-transitional CRR rules | Tier 2 | Tier 2 | ||
| 6. Eligible at solo/(sub-)consolidated/solo & (sub-)consolidated | At solo & (sub-)consolidated | At solo & (sub-)consolidated | ||
| 7. Instrument type (types to be specified by each jurisdiction) | Tier 2 instrument | Tier 2 instrument | ||
| 8. Amount recognised in regulatory capital (currency in million, as of most recent reporting date) | 115 | 20 | ||
| 9. Nominal amount of instrument | USD 120 Mill | CHF 20 Mill | ||
| 9.a. Issue price | 100.00% | 100.00% | ||
| 9.b. Redemption price | 100% | 100% | ||
| 10. Accounting classification | Liability – amortised cost | Liability – amortised cost | ||
| 11. Original date of issuance | 31/3/2017 | 24/5/2017 | ||
| 12. Perpetual or dated | Dated | Dated | ||
| 13. Original maturity date | 31/3/2032 | 24/5/2027 | ||
| 14. Issuer call subject to prior supervisory approval | No | No | ||
| 15. Optional call date, contingent call dates, and redemption amount | Only subject to both Regulatory and Tax call 100% | Only subject to both Regulatory and Tax call 100% | ||
| 16. Subsequent call dates, if applicable | N/A | N/A | ||
| Coupons / dividends | ||||
| 17. Fixed or floating dividend/coupon | Fixed | Fixed | ||
| 18. Coupon rate and any related index | 5.70% | 1.6% | ||
| 19. Existence of a dividend stopper | No | No | ||
| 20.a. Fully discretionary, partially discretionary or mandatory (in terms of timing | Mandatory | Mandatory | ||
| 20.b. Fully discretionary, partially discretionary or mandatory (in terms of amount) | Mandatory | Mandatory | ||
| 21. Existence of step up or other incentive to redeem | No | No | ||
| 22. Noncumulative or cumulative | Cumulative | Cumulative | ||
| 23.Convertible or non-convertible | Convertible in case of non-viability or resolution (PONV) | Convertible in case of non-viability or resolution (PONV) | ||
| 24. If convertible, conversion trigger (s) | PONV Competent authority: | PONV Competent authority: | ||
| SRB Contractual recognition | SRB Contractual recognition | |||
| 25. If convertible, fully or partially | Total or partial, depending on what the SRB determines | Total or partial, depending on what the SRB determines | ||
| 26. If convertible, conversion rate | To be decided by SRB | To be decided by SRB | ||
| 27. If convertible, mandatory or optional conversion | Mandatory | Mandatory | ||
| 28. If convertible, specify instrument type convertible into | To be decided by SRB | To be decided by SRB | ||
| 29. If convertible, specify issuer of instrument it converts into | To be decided by SRB | To be decided by SRB | ||
| 30. Write-down features | Yes | Yes | ||
| 31. If write-down, write-down trigger (s) | PONV Competent authority: | PONV Competent authority: | ||
| SRB Contractual recognition | SRB Contractual recognition | |||
| 32. If write-down, full or partial | Fully or partially | Fully or partially | ||
| 33. If write-down, permanent or temporary | Permanent | Permanent | ||
| 34. If temporary write-down, description of write-up mechanism | N/A | N/A | ||
| 34a. Type of subordination | N/A | N/A | ||
| 34b. Order of priority in normal insolvency proceedings | 3 | 3 | ||
| 35. Position in subordination hierarchy in liquidation (specify instrument type immediately senior to instrument) | Senior to capital, reserves and instruments AT1 Pari passu to other issues of T2 (compute or not compute in capital) Junior to Tier 3 and senior bonds both preferred and non-preferred | Senior to capital, reserves and instruments AT1 Pari passu to other issues of T2 (compute or not compute in capital) Junior to Tier 3 and senior bonds both preferred and non- preferred | ||
| 36. Non-compliant transitioned features | No | No | ||
| 37. If yes, specify non-compliant features | N/A | N/A | ||
| 37a. Link to the terms and conditions of the instrument | Terms and Conditions | Terms and Conditions | ||
Table of Contents
| BBVA. PILLAR 3 2021 | ANNEXES | P. 271 |
| 1. Issuer | Banco Bilbao Vizcaya Argentaria SA | Banco Bilbao Vizcaya Argentaria SA | ||
| 2. Unique identifier (e.g. ISIN) | XS1615674261 | XS1824263260 | ||
| 2a. Public or private | Private | Private | ||
| 3. Governing law(s) of the instrument | English legislation except provisions of status of the notes under Spanish law | English legislation except provisions of status of the notes under Spanish law | ||
| 3a. Contractual recognition of conversion by resolution institution | Yes | Yes | ||
| Regulatory treatment | ||||
| 4. Transitional CRR rules | Tier 2 | Tier 2 | ||
| 5. Post-transitional CRR rules | Tier 2 | Tier 2 | ||
| 6. Eligible at solo/(sub-)consolidated/solo & (sub-)consolidated | At solo & (sub-)consolidated | At solo & (sub-)consolidated | ||
| 7. Instrument type (types to be specified by each jurisdiction) | Tier 2 instrument | Tier 2 instrument | ||
| 8. Amount recognised in regulatory capital (currency in million, as of most recent reporting date) | 158 | 306 | ||
| 9. Nominal amount of instrument | EUR 150 Mill | USD 300 Mill | ||
| 9.a. Issue price | 100.00% | 99.23% | ||
| 9.b. Redemption price | 100% | 100% | ||
| 10. Accounting classification | Liability – amortised cost | Liability – amortised cost | ||
| 11. Original date of issuance | 24/5/2017 | 29/5/2018 | ||
| 12. Perpetual or dated | Dated | Dated | ||
| 13. Original maturity date | 24/5/2027 | 29/5/2033 | ||
| 14. Issuer call subject to prior supervisory approval | No | No | ||
| 15. Optional call date, contingent call dates, and redemption amount | Only subject to both Regulatory and Tax call 100% | Only subject to both Regulatory and Tax call 100% | ||
| 16. Subsequent call dates, if applicable | N/A | NA | ||
| Coupons / dividends | ||||
| 17. Fixed or floating dividend/coupon | Fixed | Fixed | ||
| 18. Coupon rate and any related index | 2.54% | 5.25% | ||
| 19. Existence of a dividend stopper | No | No | ||
| 20.a. Fully discretionary, partially discretionary or mandatory (in terms of timing | Mandatory | Mandatory | ||
| 20.b. Fully discretionary, partially discretionary or mandatory (in terms of amount) | Mandatory | Mandatory | ||
| 21. Existence of step up or other incentive to redeem | No | No | ||
| 22. Noncumulative or cumulative | Cumulative | Cumulative | ||
| 23.Convertible or non-convertible | Convertible in case of non-viability or resolution (PONV) | Convertible in case of non-viability or resolution (PONV) | ||
| 24. If convertible, conversion trigger (s) | PONV Competent authority: SRB Contractual recognition | PONV Competent authority: SRB Contractual recognition | ||
| 25. If convertible, fully or partially | Total or partial, depending on what the SRB determines | Total or partial, depending on what the SRB determines | ||
| 26. If convertible, conversion rate | To be decided by SRB | To be decided by SRB | ||
| 27. If convertible, mandatory or optional conversion | Mandatory | Mandatory | ||
| 28. If convertible, specify instrument type convertible into | To be decided by SRB | To be decided by SRB | ||
| 29. If convertible, specify issuer of instrument it converts into | To be decided by SRB | To be decided by SRB | ||
| 30. Write-down features | Yes | Yes | ||
| 31. If write-down, write-down trigger (s) | PONV Competent authority: SRB Contractual recognition | PONV Competent authority: SRB Contractual recognition | ||
| 32. If write-down, full or partial | Fully or partially | Fully or partially | ||
| 33. If write-down, permanent or temporary | Permanent | Permanent | ||
| 34. If temporary write-down, description of write-up mechanism | N/A | N/A | ||
| 34a. Type of subordination | N/A | N/A | ||
| 34b. Order of priority in normal insolvency proceedings | 3 | 3 | ||
| 35. Position in subordination hierarchy in liquidation (specify instrument type immediately senior to instrument) | Senior to capital, reserves and instruments AT1 Pari passu to other issues of T2 (compute or not compute in capital) Junior to Tier 3 and senior bonds both preferred and non- preferred | Senior to capital, reserves and instruments AT1 Pari passu to other issues of T2 (compute or not compute in capital) Junior to Tier 3 and senior bonds both preferred and non-preferred | ||
| 36. Non-compliant transitioned features | No | No | ||
| 37. If yes, specify non-compliant features | N/A | N/A | ||
| 37a. Link to the terms and conditions of the instrument | Terms and Conditions | Terms and Conditions | ||
Table of Contents
| BBVA. PILLAR 3 2021 | ANNEXES | P. 272 |
| 1. Issuer | Banco Bilbao Vizcaya Argentaria SA | Banco Bilbao Vizcaya Argentaria SA | ||
| 2. Unique identifier (e.g. ISIN) | ES0213211131 | XS0361684391 | ||
| 2a. Public or private | Private | Private | ||
| 3. Governing law(s) of the instrument | Spanish | English | ||
| 3a. Contractual recognition of conversion by resolution institution | No | No | ||
| Regulatory treatment | ||||
| 4. Transitional CRR rules | Tier 2 | Tier 2 | ||
| 5. Post-transitional CRR rules | Tier 2 | Non eligible | ||
| 6. Eligible at solo/(sub-)consolidated/solo & (sub-)consolidated | At solo & (sub-)consolidated | At solo & (sub-)consolidated | ||
| 7. Instrument type (types to be specified by each jurisdiction) | Tier 2 instrument | Tier 2 instrument | ||
| 8. Amount recognised in regulatory capital (currency in million, as of most recent reporting date) | 31 | 9 | ||
| 9. Nominal amount of instrument | EUR 100 Mill | EUR 50 Mill | ||
| 9.a. Issue price | 99.77% | 100.00% | ||
| 9.b. Redemption price | 100% | 100% | ||
| 10. Accounting classification | Liability – amortised cost | Liability – amortised cost | ||
| 11. Original date of issuance | 7/4/2008 | 19/5/2008 | ||
| 12. Perpetual or dated | Dated | Dated | ||
| 13. Original maturity date | 7/4/2023 | 19/5/2023 | ||
| 14. Issuer call subject to prior supervisory approval | Yes | Yes | ||
| 15. Optional call date, contingent call dates, and redemption amount | No | No optional call date; Tax call | ||
| 16. Subsequent call dates, if applicable | N/A | N/A | ||
| Coupons / dividends | ||||
| 17. Fixed or floating dividend/coupon | Fixed | From Fixed to specified index | ||
| 18. Coupon rate and any related index | 6.2% | 4.75% the first 2 years; linked to CPI afterwards | ||
| 19. Existence of a dividend stopper | No | No | ||
| 20.a. Fully discretionary, partially discretionary or mandatory (in terms of timing | Mandatory | Mandatory | ||
| 20.b. Fully discretionary, partially discretionary or mandatory (in terms of amount) | Mandatory | Mandatory | ||
| 21. Existence of step up or other incentive to redeem | No | No | ||
| 22. Noncumulative or cumulative | Cumulative | Cumulative | ||
| 23.Convertible or non-convertible | Convertible in case of non-viability or resolution (PONV) | Convertible in case of non-viability or resolution (PONV) | ||
| 24. If convertible, conversion trigger (s) | PONV Competent authority: | PONV Competent authority: | ||
| SRB Contractual recognition | SRB Contractual recognition | |||
| 25. If convertible, fully or partially | Total or partial, depending on what the SRB determines | Total or partial, depending on what the SRB determines | ||
| 26. If convertible, conversion rate | To be decided by SRB | To be decided by SRB | ||
| 27. If convertible, mandatory or optional conversion | Mandatory | Mandatory | ||
| 28. If convertible, specify instrument type convertible into | To be decided by SRB | To be decided by SRB | ||
| 29. If convertible, specify issuer of instrument it converts into | To be decided by SRB | To be decided by SRB | ||
| 30. Write-down features | Yes | Yes | ||
| 31. If write-down, write-down trigger (s) | PONV Competent authority: | PONV Competent authority: | ||
| SRB Contractual recognition | SRB Contractual recognition | |||
| 32. If write-down, full or partial | Fully or partially | Fully or partially | ||
| 33. If write-down, permanent or temporary | Permanent | Permanent | ||
| 34. If temporary write-down, description of write-up mechanism | N/A | N/A | ||
| 34a. Type of subordination | N/A | N/A | ||
| 34b. Order of priority in normal insolvency proceedings | 3 | 3 | ||
| 35. Position in subordination hierarchy in liquidation (specify instrument type immediately senior to instrument) | Senior to Preferred, Additional Level 1 instruments and Superior Level 2 instruments (Perpetual) Pari passu to other issues of T2 (compute or not compute in capital) Junior to Tier 3 and senior obligations both preferred and non-preferred | Senior to Preferred, Additional Level 1 instruments and Superior Level 2 instruments (Perpetual) Pari passu to other issues of T2 (compute or not compute in capital) Junior to Tier 3 and senior obligations both preferred and non-preferred | ||
| 36. Non-compliant transitioned features | No | Yes | ||
| 37. If yes, specify non-compliant features | N/A | Event of default and acceleration due to default of interests | ||
| 37a. Link to the terms and conditions of the instrument | Terms and Conditions | Terms and Conditions | ||
Table of Contents
| BBVA. PILLAR 3 2021 | ANNEXES | P. 273 |
| 1. Issuer | Banco Bilbao Vizcaya Argentaria SA | Banco Bilbao Vizcaya Argentaria SA | ||
| 2. Unique identifier (e.g. ISIN) | ES0213211115 | XS0291892262 | ||
| 2a. Public or private | Private | Private | ||
| 3. Governing law(s) of the instrument | Spanish | English | ||
| 3a. Contractual recognition of conversion by resolution institution | No | No | ||
| Regulatory treatment | ||||
| 4. Transitional CRR rules | Tier 2 | Tier 2 | ||
| 5. Post-transitional CRR rules | Non eligible | Non eligible | ||
| 6. Eligible at solo/(sub-)consolidated/solo & (sub-)consolidated | At solo & (sub-)consolidated | At solo & (sub-)consolidated | ||
| 7. Instrument type (types to be specified by each jurisdiction) | Tier 2 instrument | Tier 2 instrument | ||
| 8. Amount recognised in regulatory capital (currency in million, as of most recent reporting date) | 91 | 2 | ||
| 9. Nominal amount of instrument | EUR 125 Mill | EUR 100 Mill | ||
| 9.a. Issue price | 99.65% | 100.00% | ||
| 9.b. Redemption price | 100% | 100% | ||
| 10. Accounting classification | Liability – amortised cost | Liability – amortised cost | ||
| 11. Original date of issuance | 3/3/2008 | 4/4/2007 | ||
| 12. Perpetual or dated | Dated | Dated | ||
| 13. Original maturity date | 3/3/2033 | 4/4/2022 | ||
| 14. Issuer call subject to prior supervisory approval | Yes | Yes | ||
| 15. Optional call date, contingent call dates, and redemption amount | Issuer call date: 03/03/2028 and then quaterly coinciding with coupon payment dates | No optional call date; Tax call; 100% | ||
| 16. Subsequent call dates, if applicable | Issuance call date and on each interest payment day thereafter | N/A | ||
| Coupons / dividends | ||||
| 17. Fixed or floating dividend/coupon | Fixed to floating (since call date) | Floating | ||
| 18. Coupon rate and any related index | 6.025%; from 03/03/28 3M EURIBOR+1.78% | CMS 10YR + 0.03% | ||
| 19. Existence of a dividend stopper | No | No | ||
| 20.a. Fully discretionary, partially discretionary or mandatory (in terms of timing | Mandatory | Mandatory | ||
| 20.b. Fully discretionary, partially discretionary or mandatory (in terms of amount) | Mandatory | Mandatory | ||
| 21. Existence of step up or other incentive to redeem | Yes | No | ||
| 22. Noncumulative or cumulative | Cumulative | Cumulative | ||
| 23.Convertible or non-convertible | Convertible in case of non-viability or resolution (PONV) | Convertible in case of non-viability or resolution (PONV) | ||
| 24. If convertible, conversion trigger (s) | PONV Competent authority: | PONV Competent authority: | ||
| SRB Statutory recognition | SRB Statutory recognition | |||
| 25. If convertible, fully or partially | Total or partial, depending on what the SRB determines | Total or partial, depending on what the SRB determines | ||
| 26. If convertible, conversion rate | To be decided by SRB | To be decided by SRB | ||
| 27. If convertible, mandatory or optional conversion | Mandatory | Mandatory | ||
| 28. If convertible, specify instrument type convertible into | To be decided by SRB | To be decided by SRB | ||
| 29. If convertible, specify issuer of instrument it converts into | To be decided by SRB | To be decided by SRB | ||
| 30. Write-down features | Yes | Yes | ||
| 31. If write-down, write-down trigger (s) | PONV Competent authority: SRB Statutory recognition | PONV Competent authority: SRB Statutory recognition | ||
| 32. If write-down, full or partial | Fully or partially | Fully or partially | ||
| 33. If write-down, permanent or temporary | Permanent | Permanent | ||
| 34. If temporary write-down, description of write-up mechanism | N/A | N/A | ||
| 34a. Type of subordination | N/A | N/A | ||
| 34b. Order of priority in normal insolvency proceedings | 3 | 3 | ||
| 35. Position in subordination hierarchy in liquidation (specify instrument type immediately senior to instrument) | Senior to Preferred, Additional Level 1 instruments and Superior Level 2 instruments (Perpetual) Pari passu to other issues of T2 (compute or not compute in capital) Junior to Tier 3 and senior obligations both preferred and non-preferred | Senior to Preferred, Additional Level 1 instruments and Superior Level 2 instruments (Perpetual) Pari passu to other issues of T2 (compute or not compute in capital) Junior to Tier 3 and senior obligations both preferred and non-preferred | ||
| 36. Non-compliant transitioned features | Yes | Yes | ||
| 37. If yes, specify non-compliant features | Existence of step-up | Event of default and acceleration due to default of interests | ||
| 37a. Link to the terms and conditions of the instrument | Terms and Conditions | Terms and Conditions | ||
Table of Contents
| BBVA. PILLAR 3 2021 | ANNEXES | P. 274 |
| 1. Issuer | BBVA Global Finance LTD | Banco Bilbao Vizcaya Argentaria SA | ||
| 2. Unique identifier (e.g. ISIN) | US055291AC24 | ES0214974075 | ||
| 2a. Public or private | Public | Public | ||
| 3. Governing law(s) of the instrument | New York | Spanish | ||
| 3a. Contractual recognition of conversion by resolution institution | No | No | ||
| Regulatory treatment | ||||
| 4. Transitional CRR rules | Tier 2 | Tier 2 | ||
| 5. Post-transitional CRR rules | Non eligible | Non eligible | ||
| 6. Eligible at solo/(sub-)consolidated/solo & (sub-)consolidated | At solo & (sub-)consolidated | At solo & (sub-)consolidated | ||
| 7. Instrument type (types to be specified by each jurisdiction) | Tier 2 instrument | Tier 2 instrument | ||
| 8. Amount recognised in regulatory capital (currency in million, as of most recent reporting date) | 139 | 27 | ||
| 9. Nominal amount of instrument | USD 200 Mill | EUR 75 Mill | ||
| 9.a. Issue price | 98.21% | 100.00% | ||
| 9.b. Redemption price | 100% | 100% | ||
| 10. Accounting classification | Liability – amortised cost | Liability – amortised cost | ||
| 11. Original date of issuance | 12/4/1995 | 3/1/2007 | ||
| 12. Perpetual or dated | Dated | Perpetual | ||
| 13. Original maturity date | 12/1/2025 | No maturity | ||
| 14. Issuer call subject to prior supervisory approval | Yes | Yes | ||
| 15. Optional call date, contingent call dates, and redemption amount | No optional call date; Tax call; 100% | Issuer call date: 03/01/2027 and quarterly thereafter | ||
| 16. Subsequent call dates, if applicable | N/A | Issuance call date and on each interest payment day thereafter | ||
| Coupons / dividends | ||||
| 17. Fixed or floating dividend/coupon | Fixed | Floating | ||
| 18. Coupon rate and any related index | 7.00% | 3M EURIBOR + 1.30% up to 03/01/2027; from 03/01/2027 3M EURIBOR + 2.80% | ||
| 19. Existence of a dividend stopper | No | No | ||
| 20.a. Fully discretionary, partially discretionary or mandatory (in terms of timing | Mandatory | Mandatory | ||
| 20.b. Fully discretionary, partially discretionary or mandatory (in terms of amount) | Mandatory | Mandatory | ||
| 21. Existence of step up or other incentive to redeem | No | Yes | ||
| 22. Noncumulative or cumulative | Cumulative | Cumulative | ||
| 23.Convertible or non-convertible | Convertible in case of non-viability or resolution (PONV) | Convertible in case of non-viability or resolution (PONV) | ||
| 24. If convertible, conversion trigger (s) | PONV Competent authority: SRB Statutory recognition | PONV Competent authority: SRB Statutory recognition | ||
| 25. If convertible, fully or partially | Total or partial, depending on what the SRB determines | Total or partial, depending on what the SRB determines | ||
| 26. If convertible, conversion rate | To be decided by SRB | To be decided by SRB | ||
| 27. If convertible, mandatory or optional conversion | Mandatory | Mandatory | ||
| 28. If convertible, specify instrument type convertible into | To be decided by SRB | To be decided by SRB | ||
| 29. If convertible, specify issuer of instrument it converts into | To be decided by SRB | To be decided by SRB | ||
| 30. Write-down features | Yes | Yes | ||
| 31. If write-down, write-down trigger (s) | PONV Competent authority: | PONV Competent authority: | ||
| SRB Statutory recognition | SRB Statutory recognition | |||
| 32. If write-down, full or partial | Fully or partially | Fully or partially | ||
| 33. If write-down, permanent or temporary | Permanent | Permanent | ||
| 34. If temporary write-down, description of write-up mechanism | N/A | N/A | ||
| 34a. Type of subordination | N/A | N/A | ||
| 34b. Order of priority in normal insolvency proceedings | 3 | 3 | ||
| 35. Position in subordination hierarchy in liquidation (specify instrument type immediately senior to instrument) | Senior to Preferred, Additional Level 1 instruments and Superior Level 2 instruments (Perpetual) Pari passu to other issues of T2 (compute or not compute in capital) Junior to Tier 3 and senior obligations both preferred and non-preferred | Senior to Preferred and Tier 1 Additional Equity Instruments Pari passu to other issues of T2 (compute or not compute in capital) Junior to Tier 3 and senior obligations both preferred and non-preferred | ||
| 36. Non-compliant transitioned features | Yes | Yes | ||
| 37. If yes, specify non-compliant features | Issued by SPV | Existence of step-up | ||
| 37a. Link to the terms and conditions of the instrument | Terms and Conditions | Terms and Conditions | ||
Table of Contents
| BBVA. PILLAR 3 2021 | ANNEXES | P. 275 |
III.3. Mexico issuances (Millon euros. 12-31-2021)
1. Issuer | BBVA Bancomer S.A., Institución de Banca Múltiple, Grupo Financiero BBVA Bancomer, acting through its Texas Agency | BBVA Bancomer S.A., Institución de Banca Múltiple, Grupo Financiero BBVA Bancomer, acting through its Texas Agency | ||
| 2. Unique identifier (e.g. ISIN) | USP16259AN67 - US05533UAG31 | US05533UAF57 - USP16259AM84 | ||
| 2a. Public or private | Public | Public | ||
| 3. Governing law(s) of the instrument | New York, except for the determination of trigger events, capital events, or regulatory events that are determined under Mexican law. Also ranking and subordination are under Mexican law | New York, except for the determination of trigger events, capital events, or regulatory events that are determined under Mexican law. Also ranking and subordination are under Mexican law | ||
| 3a. Contractual recognition of conversion by resolution institution | Yes | Yes | ||
| Regulatory treatment | ||||
| 4. Transitional CRR rules | Tier 2 | Tier 2 | ||
| 5. Post-transitional CRR rules | Tier 2 | Tier 2 | ||
| 6. Eligible at solo/(sub-)consolidated/solo & (sub-)consolidated | At solo & (sub-)consolidated | At solo & (sub-)consolidated | ||
| 7. Instrument type (types to be specified by each jurisdiction) | Tier 2 Instruments | Tier 2 Instruments | ||
| 8. Amount recognised in regulatory capital (currency in million, as of most recent reporting date) | 476 | 597 | ||
| 9. Nominal amount of instrument | USD 750 Mill | USD 1,000 Mill | ||
| 9.a. Issue price | 100.00% | 99.51% | ||
| 9.b. Redemption price | 100.00% | 100.00% | ||
| 10. Accounting classification | Liability – amortised cost | Liability – amortised cost | ||
| 11. Original date of issuance | 13/9/2019 | 18/1/2018 | ||
| 12. Perpetual or dated | Dated | Dated | ||
| 13. Original maturity date | 13/9/2034 | 18/1/2033 | ||
| 14. Issuer call subject to prior supervisory approval | Yes | No | ||
| 15. Optional call date, contingent call dates, and redemption amount | 09/13/2029 fully or partially. (also subject to Regulatory call and Tax call, only with full amortisation). 100% | 01/18/2028 fully or partially. (also subject to Regulatory call and Tax call, only with fully amortisation. 100% | ||
| 16. Subsequent call dates, if applicable | No | No | ||
| Coupons / dividends | ||||
| 17. Fixed or floating dividend/coupon | Fixed reset | Fixed reset | ||
| 18. Coupon rate and any related index | 5.875%. From call Treasury yield optional date + 430.8 bps | 5.125%. From call Treasury yield optional date + 265 bps | ||
| 19. Existence of a dividend stopper | Yes | Yes | ||
| 20.a. Fully discretionary, partially discretionary or mandatory (in terms of timing) | Mandatory | Mandatory | ||
| 20.b. Fully discretionary, partially discretionary or mandatory (in terms of amount) | Mandatory | Mandatory | ||
| 21. Existence of step up or other incentive to redeem | No | No | ||
| 22. Noncumulative or cumulative | Cumulative | Cumulative | ||
| 23.Convertible or non-convertible | Non-convertible | Non-convertible | ||
| 24. If convertible, conversion trigger (s) | N/A | N/A | ||
| 25. If convertible, fully or partially | N/A | N/A | ||
| 26. If convertible, conversion rate | N/A | N/A | ||
| 27. If convertible, mandatory or optional conversion | N/A | N/A | ||
| 28. If convertible, specify instrument type convertible into | N/A | N/A | ||
| 29. If convertible, specify issuer of instrument it converts into | N/A | N/A | ||
| 30. Write-down features | Yes | Yes | ||
| 31. If write-down, write-down trigger (s) | (*) A Trigger Event will be deemed to have occurred if any of the following events takes places: (i) the CNBV publishes a determination, in its official publication of capitalisation levels for Mexican Banks, that the issuer’s Fundamental Capital is equal to or below 4.5%; (ii) the Issuer does not comply with the Mexican Banking Law and other regulation or (iii) the Banking Stability Committee determines that financial assistance is required by the Issuer to avoid revocation of the Issuer’s license for its failure to comply with corrective measures. | (*) A Trigger Event will be deemed to have occurred if any of the following events takes places: (i) the CNBV publishes a determination, in its official publication of capitalisation levels for Mexican Banks, that the issuer’s Fundamental Capital is equal to or below 4.5%; (ii) the Issuer does not comply with the Mexican Banking Law and other regulation or (iii) the Banking Stability Committee determines that financial assistance is required by the Issuer to avoid revocation of the Issuer’s license for its failure to comply with corrective measures. | ||
| 32. If write-down, full or partial | Fully or partially | Fully or partially | ||
| 33. If write-down, permanent or temporary | Permanent | Permanent | ||
| 34. If temporary write-down, description of write-up mechanism | N/A | N/A | ||
| 34a. Type of subordination | N/A | N/A | ||
| 34b. Order of priority in normal insolvency proceedings | N/A | N/A | ||
| 35. Position in subordination hierarchy in liquidation (specify instrument type immediately senior to instrument) | The Notes constitute Subordinated Preferred Indebtedness, and (i) will be subordinate and junior in right of payment and in liquidation to all of the present and future Senior Indebtedness, (ii) will rank pari passu without preference among themselves and with all of the present and future other unsecured subordinated preferred indebtedness and (iii) will be senior to subordinated non-preferred indebtedness and all classes of equity or capital stock. | The Notes constitute Subordinated Preferred Indebtedness, and (i) will be subordinate and junior in right of payment and in liquidation to all of the present and future Senior Indebtedness, (ii) will rank pari passu without preference among themselves and with all of the present and future other unsecured subordinated preferred indebtedness and (iii) will be senior to subordinated non-preferred indebtedness and all classes of equity or capital stock. | ||
| 36. Non-compliant transitioned features | No | No | ||
| 37. If yes, specify non-compliant features | N/A | N/A | ||
| 37a. Link to the terms and conditions of the instrument | Terms and Conditions | Terms and Conditions | ||
Table of Contents
| BBVA. PILLAR 3 2021 | ANNEXES | P. 276 |
| 1. Issuer | BBVA Bancomer S.A., Institución de Banca Múltiple, Grupo Financiero BBVA Bancomer, acting through its Texas Agency | BBVA Bancomer S.A., Institución de Banca Múltiple, Grupo Financiero BBVA Bancomer, acting through its Texas Agency | ||
| 2. Unique identifier (e.g. ISIN) | US05533UAC27—USP16259AH99 | US05533UAC27—USP16259AH99 | ||
| 2a. Public or private | Public | Public | ||
| 3. Governing law(s) of the instrument | New York | New York | ||
| 3a. Contractual recognition of conversion by resolution institution | Yes | Yes | ||
| Regulatory treatment | ||||
| 4. Transitional CRR rules | Tier 2 | Tier 2 | ||
| 5. Post-transitional CRR rules | Tier 2 | Tier 2 | ||
| 6. Eligible at solo/(sub-)consolidated/solo & (sub-)consolidated | At solo & (sub-)consolidated | At solo & (sub-)consolidated | ||
| 7. Instrument type (types to be specified by each jurisdiction) | Tier 2 Instruments | Tier 2 Instruments | ||
| 8. Amount recognised in regulatory capital (currency in million, as of most recent reporting date) | 38 | 19 | ||
| 9. Nominal amount of instrument | USD 1,000 Mill | USD 500 Mill | ||
| 9.a. Issue price | 99.97% | 109,89%+ Interest accrued from July 19, 2012 to September 28, 2012 | ||
| 9.b. Redemption price | 100.00% | 100.00% | ||
| 10. Accounting classification | Liability – amortised cost | Liability – amortised cost | ||
| 11. Original date of issuance | 19/7/2012 | 28/9/2012 | ||
| 12. Perpetual or dated | Dated | Dated | ||
| 13. Original maturity date | 30/9/2022 | 30/9/2022 | ||
| 14. Issuer call subject to prior supervisory approval | No | No | ||
| 15. Optional call date, contingent call dates, and redemption amount | Only subject to Regulatory call and Tax call (fully). 100% | Only subject to Regulatory call and Tax call (fully). 100% | ||
| 16. Subsequent call dates, if applicable | No | No | ||
| Coupons / dividends | ||||
| 17. Fixed or floating dividend/coupon | Fixed | Fixed | ||
| 18. Coupon rate and any related index | 6.75% | 6.75% | ||
| 19. Existence of a dividend stopper | Yes | Yes | ||
| 20.a. Fully discretionary, partially discretionary or mandatory (in terms of timing | Mandatory | Mandatory | ||
| 20.b. Fully discretionary, partially discretionary or mandatory (in terms of amount) | Mandatory | Mandatory | ||
| 21. Existence of step up or other incentive to redeem | No | No | ||
| 22. Noncumulative or cumulative | Cumulative | Cumulative | ||
| 23.Convertible or non-convertible | Non-convertible | Non-convertible | ||
| 24. If convertible, conversion trigger (s) | N/A | N/A | ||
| 25. If convertible, fully or partially | N/A | N/A | ||
| 26. If convertible, conversion rate | N/A | N/A | ||
| 27. If convertible, mandatory or optional conversion | N/A | N/A | ||
| 28. If convertible, specify instrument type convertible into | N/A | N/A | ||
| 29. If convertible, specify issuer of instrument it converts into | N/A | N/A | ||
| 30. Write-down features | Yes | Yes | ||
| 31. If write-down, write-down trigger (s) | CNBV. Statutory | CNBV. Statutory | ||
| 32. If write-down, full or partial | Fully or partially | Fully or partially | ||
| 33. If write-down, permanent or temporary | Permanent | Permanent | ||
| 34. If temporary write-down, description of write-up mechanism | N/A | N/A | ||
| 34a. Type of subordination | N/A | N/A | ||
| 34b. Order of priority in normal insolvency proceedings | N/A | N/A | ||
| 35. Position in subordination hierarchy in liquidation (specify instrument type immediately senior to instrument) | The Notes constitute subordinated preferred indebtedness and (i) will rank junior to all present and future senior indebtedness, (ii) will rank pari passu with all other present or future unsecured subordinated preferred indebtedness, and (iii) will be senior to unsecured subordinated non-preferred indebtedness and all classes of capital stock. | The Notes constitute subordinated preferred indebtedness and (i) will rank junior to all present and future senior indebtedness, (ii) will rank pari passu with all other present or future unsecured subordinated preferred indebtedness, and (iii) will be senior to unsecured subordinated non-preferred indebtedness and all classes of capital stock. | ||
| 36. Non-compliant transitioned features | No | No | ||
| 37. If yes, specify non-compliant features | N/A | N/A | ||
| 37a. Link to the terms and conditions of the instrument | Terms and Conditions | Terms and Conditions | ||
Table of Contents
| BBVA. PILLAR 3 2021 | ANNEXES | P. 277 |
| 1. Issuer | BBVA Bancomer S.A., Institución de Banca Múltiple, Grupo Financiero BBVA Bancomer, acting through its Texas Agency | |
| 2. Unique identifier (e.g. ISIN) | US05533UAE82—USP16259AL02 | |
| 2a. Public or private | Public | |
| 3. Governing law(s) of the instrument | New York, except for the determination of trigger events, capital events, or regulatory events that | |
| are determined under Mexican law. Also ranking and subordination are under Mexican law | ||
| 3a. Contractual recognition of conversion by resolution institution | Yes | |
| Regulatory treatment | ||
| 4. Transitional CRR rules | Tier 2 | |
| 5. Post-transitional CRR rules | Tier 2 | |
| 6. Eligible at solo/(sub-)consolidated/solo & (sub-)consolidated | At solo & (sub-)consolidated | |
| 7. Instrument type (types to be specified by each jurisdiction) | Tier 2 Instruments | |
| 8. Amount recognised in regulatory capital (currency in million, as of most recent reporting date) | 83 | |
| 9. Nominal amount of instrument | USD 200 Mill | |
| 9.a. Issue price | 99.79% | |
| 9.b. Redemption price | 100.00% | |
| 10. Accounting classification | Liability – amortised cost | |
| 11. Original date of issuance | 12/11/2014 | |
| 12. Perpetual or dated | Dated | |
| 13. Original maturity date | 12/11/2029 | |
| 14. Issuer call subject to prior supervisory approval | Yes | |
| 15. Optional call date, contingent call dates, and redemption amount | 11/12/2024 fully. (also subject to Regulatory call and Tax call, only with full amortisation). 100% | |
| 16. Subsequent call dates, if applicable | No | |
| Coupons / dividends | ||
| 17. Fixed or floating dividend/coupon | Fixed reset | |
| 18. Coupon rate and any related index | 5.35% since call date Treasury yield + 300bps | |
| 19. Existence of a dividend stopper | Yes | |
| 20.a. Fully discretionary, partially discretionary or mandatory (in terms of timing | Mandatory | |
| 20.b. Fully discretionary, partially discretionary or mandatory (in terms of amount) | Mandatory | |
| 21. Existence of step up or other incentive to redeem | No | |
| 22. Noncumulative or cumulative | Cumulative | |
| 23.Convertible or non-convertible | Non-convertible | |
| 24. If convertible, conversion trigger (s) | N/A | |
| 25. If convertible, fully or partially | N/A | |
| 26. If convertible, conversion rate | N/A | |
| 27. If convertible, mandatory or optional conversion | N/A | |
| 28. If convertible, specify instrument type convertible into | N/A | |
| 29. If convertible, specify issuer of instrument it converts into | N/A | |
| 30. Write-down features | Yes | |
| 31. If write-down, write-down trigger (s) | (*) A Trigger Event will be deemed to have occurred if any of the following events takes places: (i) the CNBV publishes a determination, in its official publication of capitalisation levels for Mexican Banks, that the issuer’s Fundamental Capital is equal to or below 4.5%; (ii) the Issuer does not comply with the Mexican Banking Law and other regulation or (iii) the Banking Stability Committee determines that financial assistance is required by the Issuer to avoid revocation of the Issuer’s license for its failure to comply with corrective measures. | |
| 32. If write-down, full or partial | Fully or partially | |
| 33. If write-down, permanent or temporary | Permanent | |
| 34. If temporary write-down, description of write-up mechanism | N/A | |
| 34a. Type of subordination | N/A | |
| 34b. Order of priority in normal insolvency proceedings | N/A | |
| 35. Position in subordination hierarchy in liquidation (specify instrument type immediately senior to instrument) | The Notes constitute Subordinated Preferred Indebtedness, and (i) will be subordinate and junior in right of payment and in liquidation to all of the present and future Senior Indebtedness, (ii) will rank pari passu without preference among themselves and with all of the present and future other unsecured subordinated preferred indebtedness and (iii) will be senior to subordinated non-preferred indebtedness and all classes of equity or capital stock. | |
| 36. Non-compliant transitioned features | No | |
| 37. If yes, specify non-compliant features | N/A | |
| 37a. Link to the terms and conditions of the instrument | Terms and Conditions | |
Table of Contents
| BBVA. PILLAR 3 2021 | ANNEXES | P. 278 |
III.4. South America issuances (Millon euros. 12-31-2021)
| 1. Issuer | BBVA Colombia | BBVA Colombia | ||
| 2. Unique identifier (e.g. ISIN) | COB13CB00197 | COB13CB00213 | ||
| 2a. Public or private | Public | Public | ||
| 3. Governing law(s) of the instrument | Colombian | Colombian | ||
| 3a. Contractual recognition of conversion by resolution institution | No | No | ||
| Regulatory treatment | ||||
| 4. Transitional CRR rules | Tier2 | Tier2 | ||
| 5. Post-transitional CRR rules | Non eligible | Tier2 | ||
| 6. Eligible at solo/(sub-)consolidated/solo & (sub-)consolidated | At solo & (sub-)consolidated | At solo & (sub-)consolidated | ||
| 7. Instrument type (types to be specified by each jurisdiction) | Tier 2 instrument | Tier 2 instrument | ||
| 8. Amount recognised in regulatory capital (currency in million, as of most recent reporting date) | 15 | 7 | ||
| 9. Nominal amount of instrument | COP 152,000 Mill | COP 200,000 Mill | ||
| 9.a. Issue price | 100.00% | 100.00% | ||
| 9.b. Redemption price | 100.00% | 100.00% | ||
| 10. Accounting classification | Liability – amortized cost | Liability – amortized cost | ||
| 11. Original date of issuance | 19/9/2011 | 19/2/2013 | ||
| 12. Perpetual or dated | Dated | Dated | ||
| 13. Original maturity date | 19/9/2026 | 19/2/2023 | ||
| 14. Issuer call subject to prior supervisory approval | No | No | ||
| 15. Optional call date, contingent call dates, and redemption amount | N/A | N/A | ||
| 16. Subsequent call dates, if applicable | N/A | N/A | ||
| Coupons / dividends | ||||
| 17. Fixed or floating dividend/coupon | Floating | Floating | ||
| 18. Coupon rate and any related index | CPI + 4.70% | CPI + 3.60% | ||
| 19. Existence of a dividend stopper | No | No | ||
| 20.a. Fully discretionary, partially discretionary or mandatory (in terms of timing | Mandatory | Mandatory | ||
| 20.b. Fully discretionary, partially discretionary or mandatory (in terms of amount) | Mandatory | Mandatory | ||
| 21. Existence of step up or other incentive to redeem | No | No | ||
| 22. Noncumulative or cumulative | Cumulative | Cumulative | ||
| 23.Convertible or non-convertible | Non-convertible | Non-convertible | ||
| 24. If convertible, conversion trigger (s) | N/A | N/A | ||
| 25. If convertible, fully or partially | N/A | N/A | ||
| 26. If convertible, conversion rate | N/A | N/A | ||
| 27. If convertible, mandatory or optional conversion | N/A | N/A | ||
| 28. If convertible, specify instrument type convertible into | N/A | N/A | ||
| 29. If convertible, specify issuer of instrument it converts into | N/A | N/A | ||
| 30. Write-down features | No | No | ||
| 31. If write-down, write-down trigger (s) | N/A | N/A | ||
| 32. If write-down, full or partial | N/A | N/A | ||
| 33. If write-down, permanent or temporary | N/A | N/A | ||
| 34. If temporary write-down, description of write-up mechanism | N/A | N/A | ||
| 34a. Type of subordination | N/A | N/A | ||
| 34b. Order of priority in normal insolvency proceedings | N/A | N/A | ||
| 35. Position in subordination hierarchy in liquidation (specify instrument type immediately senior to instrument) | Senior debt securities other than parity securities rank immediately superior | Senior debt securities other than parity securities rank immediately superior | ||
| 36. Non-compliant transitioned features | Yes | Yes | ||
| 37. If yes, specify non-compliant features | No write down existence or conversion by authority | No write down existence or conversion by authority | ||
| 37a. Link to the terms and conditions of the instrument | Terms and Conditions | Terms and Conditions | ||
Table of Contents
| BBVA. PILLAR 3 2021 | ANNEXES | P. 279 |
| 1. Issuer | BBVA Colombia | BBVA Colombia | ||
| 2. Unique identifier (e.g. ISIN) | COB13CB00221 | COB13CB00239 | ||
| 2a. Public or private | Public | Public | ||
| 3. Governing law(s) of the instrument | Colombian | Colombian | ||
| 3a. Contractual recognition of conversion by resolution institution | No | No | ||
| Regulatory treatment | ||||
| 4. Transitional CRR rules | Tier2 | Tier2 | ||
| 5. Post-transitional CRR rules | Non eligible | Non eligible | ||
| 6. Eligible at solo/(sub-)consolidated/solo & (sub-)consolidated | At solo & (sub-)consolidated | At solo & (sub-)consolidated | ||
| 7. Instrument type (types to be specified by each jurisdiction) | Tier 2 instrument | Tier 2 instrument | ||
| 8. Amount recognised in regulatory capital (currency in million, as of most recent reporting date) | 21 | 29 | ||
| 9. Nominal amount of instrument | COP 165,000 Mill | COP 160,000 Mill | ||
| 9.a. Issue price | 100.00% | 100.00% | ||
| 9.b. Redemption price | 100.00% | 100.00% | ||
| 10. Accounting classification | Liability – amortized cost | Liability – amortized cost | ||
| 11. Original date of issuance | 19/2/2013 | 26/11/2014 | ||
| 12. Perpetual or dated | Dated | Dated | ||
| 13. Original maturity date | 19/2/2028 | 26/11/2034 | ||
| 14. Issuer call subject to prior supervisory approval | No | No | ||
| 15. Optional call date, contingent call dates, and redemption amount | N/A | N/A | ||
| 16. Subsequent call dates, if applicable | N/A | N/A | ||
| Coupons / dividends | ||||
| 17. Fixed or floating dividend/coupon | Floating | Floating | ||
| 18. Coupon rate and any related index | CPI + 3.89% | CPI + 4.50% | ||
| 19. Existence of a dividend stopper | No | No | ||
| 20.a. Fully discretionary, partially discretionary or mandatory (in terms of timing | Mandatory | Mandatory | ||
| 20.b. Fully discretionary, partially discretionary or mandatory (in terms of amount) | Mandatory | Mandatory | ||
| 21. Existence of step up or other incentive to redeem | No | No | ||
| 22. Noncumulative or cumulative | Cumulative | Cumulative | ||
| 23.Convertible or non-convertible | Non-convertible | Non-convertible | ||
| 24. If convertible, conversion trigger (s) | N/A | N/A | ||
| 25. If convertible, fully or partially | N/A | N/A | ||
| 26. If convertible, conversion rate | N/A | N/A | ||
| 27. If convertible, mandatory or optional conversion | N/A | N/A | ||
| 28. If convertible, specify instrument type convertible into | N/A | N/A | ||
| 29. If convertible, specify issuer of instrument it converts into | N/A | N/A | ||
| 30. Write-down features | No | No | ||
| 31. If write-down, write-down trigger (s) | N/A | N/A | ||
| 32. If write-down, full or partial | N/A | N/A | ||
| 33. If write-down, permanent or temporary | N/A | N/A | ||
| 34. If temporary write-down, description of write-up mechanism | N/A | N/A | ||
| 34a. Type of subordination | N/A | N/A | ||
| 34b. Order of priority in normal insolvency proceedings | N/A | N/A | ||
| 35. Position in subordination hierarchy in liquidation (specify | Senior debt securities other than parity securities rank | Senior debt securities other than parity securities rank | ||
| instrument type immediately senior to instrument) | immediately superior | immediately superior | ||
| 36. Non-compliant transitioned features | Yes | Yes | ||
| 37. If yes, specify non-compliant features | No write down existence or conversion by authority | No write down existence or conversion by authority | ||
| 37a. Link to the terms and conditions of the instrument | Terms and Conditions | Terms and Conditions | ||
Table of Contents
| BBVA. PILLAR 3 2021 | ANNEXES | P. 280 |
| 1. Issuer | BBVA Colombia | BBVA Colombia | ||
| 2. Unique identifier (e.g. ISIN) | COB13CB00247 | USP1024TAN92 — US05890JAA88 | ||
| 2a. Public or private | Public | Public | ||
| 3. Governing law(s) of the instrument | Colombian | New York State Law., except in the event of Preventive Measures, or Intervention by the “Superintendencia Financiera de Colombia” or dissolution or liquidation of BBVA Colombia under Colombian banking law | ||
| 3a. Contractual recognition of conversion by resolution institution | No | No | ||
| Regulatory treatment | ||||
| 4. Transitional CRR rules | Tier2 | Tier2 | ||
| 5. Post-transitional CRR rules | Non eligible | Tier2 | ||
| 6. Eligible at solo/(sub-)consolidated/solo & (sub-)consolidated | At solo & (sub-)consolidated | At solo & (sub-)consolidated | ||
| 7. Instrument type (types to be specified by each jurisdiction) | Tier 2 instrument | Tier 2 instrument | ||
| 8. Amount recognised in regulatory capital (currency in million, as of most recent reporting date) | 14 | 161 | ||
| 9. Nominal amount of instrument | COP 90,000 Mill | USD 400 Mill | ||
| 9.a. Issue price | 100.00% | 99.91% | ||
| 9.b. Redemption price | 100.00% | 100.00% | ||
| 10. Accounting classification | Liability – amortized cost | Liability – amortized cost | ||
| 11. Original date of issuance | 26/11/2014 | 21/4/2015 | ||
| 12. Perpetual or dated | Dated | Dated | ||
| 13. Original maturity date | 26/11/2029 | 21/4/2025 | ||
| 14. Issuer call subject to prior supervisory approval | No | Yes | ||
| 15. Optional call date, contingent call dates, and redemption amount | N/A | 04/21/2020; Tax call | ||
| 16. Subsequent call dates, if applicable | N/A | Tax call can be exercised at any time after 04/21/2020 | ||
| Coupons / dividends | ||||
| 17. Fixed or floating dividend/coupon | Floating | Fixed | ||
| 18. Coupon rate and any related index | CPI + 4.38% | 4.88% | ||
| 19. Existence of a dividend stopper | No | No | ||
| 20.a. Fully discretionary, partially discretionary or mandatory (in terms of timing | Mandatory | Mandatory | ||
| 20.b. Fully discretionary, partially discretionary or mandatory (in terms of amount) | Mandatory | Mandatory | ||
| 21. Existence of step up or other incentive to redeem | No | No | ||
| 22. Noncumulative or cumulative | Cumulative | Cumulative | ||
| 23.Convertible or non-convertible | Non-convertible | Non-convertible | ||
| 24. If convertible, conversion trigger (s) | N/A | �� | N/A | |
| 25. If convertible, fully or partially | N/A | N/A | ||
| 26. If convertible, conversion rate | N/A | N/A | ||
| 27. If convertible, mandatory or optional conversion | N/A | N/A | ||
| 28. If convertible, specify instrument type convertible into | N/A | N/A | ||
| 29. If convertible, specify issuer of instrument it converts into | N/A | N/A | ||
| 30. Write-down features | No | No | ||
| 31. If write-down, write-down trigger (s) | N/A | N/A | ||
| 32. If write-down, full or partial | N/A | N/A | ||
| 33. If write-down, permanent or temporary | N/A | N/A | ||
| 34. If temporary write-down, description of write-up mechanism | N/A | N/A | ||
| 34a. Type of subordination | N/A | N/A | ||
| 34b. Order of priority in normal insolvency proceedings | N/A | N/A | ||
| 35. Position in subordination hierarchy in liquidation (specify instrument type immediately senior to instrument) | Senior debt securities other than parity securities rank immediately superior | Senior debt securities other than parity securities rank immediately superior | ||
| 36. Non-compliant transitioned features | Yes | Yes | ||
| 37. If yes, specify non-compliant features | No write down existence or conversion by authority | No write down existence or conversion by authority | ||
| 37a. Link to the terms and conditions of the instrument | Terms and Conditions | Terms and Conditions | ||
Table of Contents
| BBVA. PILLAR 3 2021 | ANNEXES | P. 281 |
| 1. Issuer | BBVA Peru | BBVA Peru | ||
| 2. Unique identifier (e.g. ISIN) | PEP11600D029 | PEP11600D037 | ||
| 2a. Public or private | Public | Public | ||
| 3. Governing law(s) of the instrument | Peruvian | Peruvian | ||
| 3a. Contractual recognition of conversion by resolution institution | Yes | Yes | ||
| Regulatory treatment | ||||
| 4. Transitional CRR rules | Tier 2 | Tier 2 | ||
| 5. Post-transitional CRR rules | Non eligible | Non eligible | ||
| 6. Eligible at solo/(sub-)consolidated/solo & (sub-)consolidated | At solo & (sub-)consolidated | At solo & (sub-)consolidated | ||
| 7. Instrument type (types to be specified by each jurisdiction) | Tier 2 instrument | Tier 2 instrument | ||
| 8. Amount recognised in regulatory capital (currency in million, as of most recent reporting date) | 1 | 1 | ||
| 9. Nominal amount of instrument | USD 20 Mill | PEN 55 Mill | ||
| 9.a. Issue price | 99.375% | 100% | ||
| 9.b. Redemption price | 100% | 100% | ||
| 10. Accounting classification | Liability – amortised cost | Liability – amortized cost | ||
| 11. Original date of issuance | 39216 | 39251 | ||
| 12. Perpetual or dated | Dated | Dated | ||
| 13. Original maturity date | 46521 | 48383 | ||
| 14. Issuer call subject to prior supervisory approval | Yes | No | ||
| 15. Optional call date, contingent call dates, and redemption amount | Issuer call date: 14/05/2022, also subject to Regulatory call | Subject to Regulatory call. | ||
| 16. Subsequent call dates, if applicable | Any time from call date | N/A | ||
| Coupons / dividends | ||||
| 17. Fixed or floating dividend/coupon | Fixed | Floating | ||
| 18. Coupon rate and any related index | 6% (until 30th coupon 05/14/2027 )—(increase of 0.5% annually since the 31st annual coupon—call date) | VAC(semester)/VAC(initial)*3.4688% | ||
| 19. Existence of a dividend stopper | No | No | ||
| 20.a. Fully discretionary, partially discretionary or mandatory (in terms of timing | Mandatory | Mandatory | ||
| 20.b. Fully discretionary, partially discretionary or mandatory (in terms of amount) | Mandatory | Mandatory | ||
| 21. Existence of step up or other incentive to redeem | Yes | No | ||
| 22. Noncumulative or cumulative | Cumulative | Cumulative | ||
| 23.Convertible or non-convertible | Non-convertible | Non-convertible | ||
| 24. If convertible, conversion trigger (s) | N/A | N/A | ||
| 25. If convertible, fully or partially | N/A | N/A | ||
| 26. If convertible, conversion rate | N/A | N/A | ||
| 27. If convertible, mandatory or optional conversion | N/A | N/A | ||
| 28. If convertible, specify instrument type convertible into | N/A | N/A | ||
| 29. If convertible, specify issuer of instrument it converts into | N/A | N/A | ||
| 30. Write-down features | Yes | Yes | ||
| 31. If write-down, write-down trigger (s) | SBS | SBS | ||
| 32. If write-down, full or partial | Fully or partially | Fully or partially | ||
| 33. If write-down, permanent or temporary | Permanent | Permanent | ||
| 34. If temporary write-down, description of write-up mechanism | N/A | N/A | ||
| 34a. Type of subordination | N/A | N/A | ||
| 34b. Order of priority in normal insolvency proceedings | N/A | N/A | ||
| 35. Position in subordination hierarchy in liquidation (specify instrument type immediately senior to instrument) | Senior debt securities other than parity securities rank immediately superior | Senior debt securities other than parity securities rank immediately superior | ||
| 36. Non-compliant transitioned features | Yes | Yes | ||
| 37. If yes, specify non-compliant features | Existence of step-up | Interest rate linked to credit quality | ||
| 37a. Link to the terms and conditions of the instrument | Terms and Conditions | Terms and Conditions | ||
Table of Contents
| BBVA. PILLAR 3 2021 | ANNEXES | P. 282 |
| 1. Issuer | BBVA Peru | BBVA Peru | ||
| 2. Unique identifier (e.g. ISIN) | PEP11600D052 | PEP11600D060 | ||
| 2a. Public or private | Public | Public | ||
| 3. Governing law(s) of the instrument | Peruvian | Peruvian | ||
| 3a. Contractual recognition of conversion by resolution institution | Yes | Yes | ||
| Regulatory treatment | ||||
| 4. Transitional CRR rules | Tier 2 | Tier 2 | ||
| 5. Post-transitional CRR rules | Non eligible | Non eligible | ||
| 6. Eligible at solo/(sub-)consolidated/solo & (sub-)consolidated | At solo & (sub-)consolidated | At solo & (sub-)consolidated | ||
| 7. Instrument type (types to be specified by each jurisdiction) | Tier 2 instrument | Tier 2 instrument | ||
| 8. Amount recognised in regulatory capital (currency in million, as of most recent reporting date) | 1 | 1 | ||
| 9. Nominal amount of instrument | PEN 50 Mill | USD 20 Mill | ||
| 9.a. Issue price | 100% | 100% | ||
| 9.b. Redemption price | 100% | 100% | ||
| 10. Accounting classification | Liability – amortised cost | Liability – amortised cost | ||
| 11. Original date of issuance | 39405 | 39506 | ||
| 12. Perpetual or dated | Dated | Dated | ||
| 13. Original maturity date | 48537 | 46811 | ||
| 14. Issuer call subject to prior supervisory approval | No | No | ||
| 15. Optional call date, contingent call dates, and redemption amount | Subject to Regulatory call. | Subject to Regulatory call. | ||
| 16. Subsequent call dates, if applicable | N/A | N/A | ||
| Coupons / dividends | ||||
| 17. Fixed or floating dividend/coupon | Floating | Fixed | ||
| 18. Coupon rate and any related index | VAC(semester)/VAC(initial)*3.5625% | 6.47% | ||
| 19. Existence of a dividend stopper | No | No | ||
| 20.a. Fully discretionary, partially discretionary or mandatory (in terms of timing | Mandatory | Mandatory | ||
| 20.b. Fully discretionary, partially discretionary or mandatory (in terms of amount) | Mandatory | Mandatory | ||
| 21. Existence of step up or other incentive to redeem | No | No | ||
| 22. Noncumulative or cumulative | Cumulative | Cumulative | ||
| 23. Convertible or non-convertible | Non-convertible | Non-convertible | ||
| 24. If convertible, conversion trigger (s) | N/A | N/A | ||
| 25. If convertible, fully or partially | N/A | N/A | ||
| 26. If convertible, conversion rate | N/A | N/A | ||
| 27. If convertible, mandatory or optional conversion | N/A | N/A | ||
| 28. If convertible, specify instrument type convertible into | N/A | N/A | ||
| 29. If convertible, specify issuer of instrument it converts into | N/A | N/A | ||
| 30. Write-down features | Yes | Yes | ||
| 31. If write-down, write-down trigger (s) | SBS | SBS | ||
| 32. If write-down, full or partial | Fully or partially | Fully or partially | ||
| 33. If write-down, permanent or temporary | Permanent | Permanent | ||
| 34. If temporary write-down, description of write-up mechanism | N/A | N/A | ||
| 34a. Type of subordination | N/A | N/A | ||
| 34b. Order of priority in normal insolvency proceedings | N/A | N/A | ||
| 35. Position in subordination hierarchy in liquidation (specify instrument type immediately senior to instrument) | Senior debt securities other than parity securities rank immediately superior | Senior debt securities other than parity securities rank immediately superior | ||
| 36. Non-compliant transitioned features | Yes | Yes | ||
| 37. If yes, specify non-compliant features | Interest rate linked to credit quality | Interest rate linked to credit quality | ||
| 37a. Link to the terms and conditions of the instrument | Terms and Conditions | Terms and Conditions | ||
Table of Contents
| BBVA. PILLAR 3 2021 | ANNEXES | P. 283 |
| 1. Issuer | BBVA Peru | BBVA Peru | ||
| 2. Unique identifier (e.g. ISIN) | PEP11600D078 | PEP11600D086 | ||
| 2a. Public or private | Public | Public | ||
| 3. Governing law(s) of the instrument | Peruvian | Peruvian | ||
| 3a. Contractual recognition of conversion by resolution institution | Yes | Yes | ||
| Regulatory treatment | ||||
| 4. Transitional CRR rules | Tier 2 | Tier 2 | ||
| 5. Post-transitional CRR rules | Non eligible | Non eligible | ||
| 6. Eligible at solo/(sub-)consolidated/solo & (sub-)consolidated | At solo & (sub-)consolidated | At solo & (sub-)consolidated | ||
| 7. Instrument type (types to be specified by each jurisdiction) | Tier 2 instrument | Tier 2 instrument | ||
| 8. Amount recognised in regulatory capital (currency in million, as of most recent reporting date) | 1 | 1 | ||
| 9. Nominal amount of instrument | PEN 45 Mill | PEN 50 Mill | ||
| 9.a. Issue price | 100% | 100% | ||
| 9.b. Redemption price | 100% | 100% | ||
| 10. Accounting classification | Liability – amortised cost | Liability – amortised cost | ||
| 11. Original date of issuance | 08/07/2008 | 09/09/2008 | ||
| 12. Perpetual or dated | Dated | Dated | ||
| 13. Original maturity date | 08/07/2023 | 09/09/2023 | ||
| 14. Issuer call subject to prior supervisory approval | No | No | ||
| 15. Optional call date, contingent call dates, and redemption amount | Subject to Regulatory call. | Subject to Regulatory call. | ||
| 16. Subsequent call dates, if applicable | N/A | N/A | ||
| Coupons / dividends | ||||
| 17. Fixed or floating dividend/coupon | Floating | Floating | ||
| 18. Coupon rate and any related index | VAC(semester)/VAC(initial)*3.0625 | VAC(semester)/VAC(initial)*3.0938% | ||
| 19. Existence of a dividend stopper | No | No | ||
| 20.a. Fully discretionary, partially discretionary or mandatory (in terms of timing | Mandatory | Mandatory | ||
| 20.b. Fully discretionary, partially discretionary or mandatory (in terms of amount) | Mandatory | Mandatory | ||
| 21. Existence of step up or other incentive to redeem | No | No | ||
| 22. Noncumulative or cumulative | Cumulative | Cumulative | ||
| 23. Convertible or non-convertible | Non-convertible | Non-convertible | ||
| 24. If convertible, conversion trigger (s) | N/A | N/A | ||
| 25. If convertible, fully or partially | N/A | N/A | ||
| 26. If convertible, conversion rate | N/A | N/A | ||
| 27. If convertible, mandatory or optional conversion | N/A | N/A | ||
| 28. If convertible, specify instrument type convertible into | N/A | N/A | ||
| 29. If convertible, specify issuer of instrument it converts into | N/A | N/A | ||
| 30. Write-down features | Yes | Yes | ||
| 31. If write-down, write-down trigger (s) | SBS | SBS | ||
| 32. If write-down, full or partial | Fully or partially | Fully or partially | ||
| 33. If write-down, permanent or temporary | Permanent | Permanent | ||
| 34. If temporary write-down, description of write-up mechanism | N/A | N/A | ||
| 34a. Type of subordination | N/A | N/A | ||
| 34b. Order of priority in normal insolvency proceedings | N/A | N/A | ||
| 35. Position in subordination hierarchy in liquidation (specify instrument type immediately senior to instrument) | Senior debt securities other than parity securities rank immediately superior | Senior debt securities other than parity securities rank immediately superior | ||
| 36. Non-compliant transitioned features | Yes | Yes | ||
| 37. If yes, specify non-compliant features | Interest rate linked to credit quality | Interest rate linked to credit quality | ||
| 37a. Link to the terms and conditions of the instrument | Terms and Conditions | Terms and Conditions | ||
Table of Contents
| BBVA. PILLAR 3 2021 | ANNEXES | P. 284 |
| 1. Issuer | BBVA Peru | BBVA Peru | ||
| 2. Unique identifier (e.g. ISIN) | PEP11600D094 | PEP11600D102 | ||
| 2a. Public or private | Public | Public | ||
| 3. Governing law(s) of the instrument | Peruvian | Peruvian | ||
| 3a. Contractual recognition of conversion by resolution institution | Yes | Yes | ||
| Regulatory treatment | ||||
| 4. Transitional CRR rules | Tier 2 | Tier 2 | ||
| 5. Post-transitional CRR rules | Non eligible | Tier 2 | ||
| 6. Eligible at solo/(sub-)consolidated/solo & (sub-)consolidated | At solo & (sub-)consolidated | At solo & (sub-)consolidated | ||
| 7. Instrument type (types to be specified by each jurisdiction) | Tier 2 instrument | Tier 2 instrument | ||
| 8. Amount recognised in regulatory capital (currency in million, as of most recent reporting date) | 1 | 12 | ||
| 9. Nominal amount of instrument | PEN 30 Mill | USD 45 Mill | ||
| 9.a. Issue price | 100% | 100% | ||
| 9.b. Redemption price | 100% | 100% | ||
| 10. Accounting classification | Liability – amortised cost | Liability – amortised cost | ||
| 11. Original date of issuance | 15/12/2008 | 02/10/2013 | ||
| 12. Perpetual or dated | Dated | Dated | ||
| 13. Original maturity date | 15/12/2033 | 02/10/2028 | ||
| 14. Issuer call subject to prior supervisory approval | No | Yes | ||
| 15. Optional call date, contingent call dates, and redemption amount | Subject to Regulatory call. | Issuer call date: 10/02/2023, also subject to Regulatory call | ||
| 16. Subsequent call dates, if applicable | N/A | Any time from call date | ||
| Coupons / dividends | ||||
| 17. Fixed or floating dividend/coupon | Floating | Fixed | ||
| 18. Coupon rate and any related index | VAC(semester)/VAC(initial)*4.1875% | 6.53125% | ||
| 19. Existence of a dividend stopper | No | No | ||
| 20.a. Fully discretionary, partially discretionary or mandatory (in terms of timing | Mandatory | Mandatory | ||
| 20.b. Fully discretionary, partially discretionary or mandatory (in terms of amount) | Mandatory | Mandatory | ||
| 21. Existence of step up or other incentive to redeem | No | No | ||
| 22. Noncumulative or cumulative | Cumulative | Cumulative | ||
| 23. Convertible or non-convertible | Non-convertible | Non-convertible | ||
| 24. If convertible, conversion trigger (s) | N/A | N/A | ||
| 25. If convertible, fully or partially | N/A | N/A | ||
| 26. If convertible, conversion rate | N/A | N/A | ||
| 27. If convertible, mandatory or optional conversion | N/A | N/A | ||
| 28. If convertible, specify instrument type convertible into | N/A | N/A | ||
| 29. If convertible, specify issuer of instrument it converts into | N/A | N/A | ||
| 30. Write-down features | Yes | Yes | ||
| 31. If write-down, write-down trigger (s) | SBS | SBS | ||
| 32. If write-down, full or partial | Fully or partially | Fully or partially | ||
| 33. If write-down, permanent or temporary | Permanent | Permanent | ||
| 34. If temporary write-down, description of write-up mechanism | N/A | N/A | ||
| 34a. Type of subordination | N/A | N/A | ||
| 34b. Order of priority in normal insolvency proceedings | N/A | N/A | ||
| 35. Position in subordination hierarchy in liquidation (specify instrument type immediately senior to instrument) | Senior debt securities other than parity securities rank immediately superior | Senior debt securities other than parity securities rank immediately superior | ||
| 36. Non-compliant transitioned features | Yes | No | ||
| 37. If yes, specify non-compliant features | Interest rate linked to credit quality | N/A | ||
| 37a. Link to the terms and conditions of the instrument | Terms and Conditions | Terms and Conditions | ||
Table of Contents
| BBVA. PILLAR 3 2021 | ANNEXES | P. 285 |
| 1. Issuer | BBVA Peru | BBVA Uruguay SA | ||
| 2. Unique identifier (e.g. ISIN) | US05537GAD79-USP16236AG98 | N/A | ||
| 2a. Public or private | Public | Private | ||
| 3. Governing law(s) of the instrument | New York | Uruguayan | ||
| 3a. Contractual recognition of conversion by resolution institution | Yes | Yes | ||
| Regulatory treatment | ||||
| 4. Transitional CRR rules | Tier 2 | Tier 2 | ||
| 5. Post-transitional CRR rules | Tier 2 | Tier 2 | ||
| 6. Eligible at solo/(sub-)consolidated/solo & (sub-)consolidated | At solo & (sub-)consolidated | At solo & (sub-)consolidated | ||
| 7. Instrument type (types to be specified by each jurisdiction) | Tier 2 instrument | Tier 2 instrument | ||
| 8. Amount recognised in regulatory capital (currency in million, as of most recent reporting date) | 93 | 13 | ||
| 9. Nominal amount of instrument | USD 300 Mill | USD 15 Mill | ||
| 9.a. Issue price | 99.317% | 100% | ||
| 9.b. Redemption price | 100% | 100% | ||
| 10. Accounting classification | Liability – amortised cost | Liability – amortised cost | ||
| 11. Original date of issuance | 22/9/2014 | 24/2/2021 | ||
| 12. Perpetual or dated | Dated | Dated | ||
| 13. Original maturity date | 22/9/2029 | 24/2/2031 | ||
| 14. Issuer call subject to prior supervisory approval | Yes | Yes | ||
| 15. Optional call date, contingent call dates, and redemption amount | Issuer call date: 09/22/2024, also subject to Regulatory call | At issuer’s discretion after 5 years from the date of issue, minimum amount of 1 MM USD | ||
| 16. Subsequent call dates, if applicable | N/A | At issuer’s discretion after 5 years from the date of issue, minimum amount of 1 MM USD | ||
| Coupons / dividends | ||||
| 17. Fixed or floating dividend/coupon | Fixed reset | Floating | ||
| 18. Coupon rate and any related index | 5.25% 2.15%+UST5Y (9/22/2024) | LIBOR 180d + 3,65% | ||
| 19. Existence of a dividend stopper | No | No | ||
| 20.a. Fully discretionary, partially discretionary or mandatory (in terms of timing | Mandatory | Mandatory | ||
| 20.b. Fully discretionary, partially discretionary or mandatory (in terms of amount) | Mandatory | Mandatory | ||
| 21. Existence of step up or other incentive to redeem | No | No | ||
| 22. Noncumulative or cumulative | Cumulative | Cumulative | ||
| 23. Convertible or non-convertible | Non-convertible | Non-convertible | ||
| 24. If convertible, conversion trigger (s) | N/A | N/A | ||
| 25. If convertible, fully or partially | N/A | N/A | ||
| 26. If convertible, conversion rate | N/A | N/A | ||
| 27. If convertible, mandatory or optional conversion | N/A | N/A | ||
| 28. If convertible, specify instrument type convertible into | N/A | N/A | ||
| 29. If convertible, specify issuer of instrument it converts into | N/A | N/A | ||
| 30. Write-down features | Yes | No | ||
| 31. If write-down, write-down trigger (s) | SBS | N/A | ||
| 32. If write-down, full or partial | Fully or partially | Fully or partially | ||
| 33. If write-down, permanent or temporary | Permanent | Permanent | ||
| 34. If temporary write-down, description of write-up mechanism | N/A | N/A | ||
| 34a. Type of subordination | N/A | N/A | ||
| 34b. Order of priority in normal insolvency proceedings | N/A | N/A | ||
| 35. Position in subordination hierarchy in liquidation (specify instrument type immediately senior to instrument) | Senior debt securities other than parity securities rank immediately superior | Senior debt securities other than parity securities rank immediately superior | ||
| 36. Non-compliant transitioned features | No | No | ||
| 37. If yes, specify non-compliant features | N/A | N/A | ||
| 37a. Link to the terms and conditions of the instrument | Terms and Conditions | Terms and Conditions | ||
Table of Contents
| BBVA. PILLAR 3 2021 | ANNEXES | P. 286 |
III.5. Turkey issuances (Millon euros. 12-31-2021)
| 1. Issuer | Garanti BBVA | Garanti BBVA | ||
| 2. Unique identifier (e.g. ISIN) | TRSGRAN23013 | TRSGRANE2915 | ||
| 2a. Public or private | Public | Public | ||
| 3. Governing law(s) of the instrument | Turkish | Turkish | ||
| 3a. Contractual recognition of conversion by resolution institution | Yes | Yes | ||
| Regulatory treatment | ||||
| 4. Transitional CRR rules | Tier 2 | Tier 2 | ||
| 5. Post-transitional CRR rules | Tier 2 | Tier 2 | ||
| 6. Eligible at solo/(sub-)consolidated/solo & (sub-)consolidated | At solo & (sub-)consolidated | At solo & (sub-)consolidated | ||
| 7. Instrument type (types to be specified by each jurisdiction) | Tier 2 instrument | Tier 2 instrument | ||
| 8. Amount recognised in regulatory capital (currency in million, as of most recent reporting date) | 31 | 10 | ||
| 9. Nominal amount of instrument | TRY 750 Mill | TRY 252.8 Mill | ||
| 9.a. Issue price | 100% | 100% | ||
| 9.b. Redemption price | 100% | 100% | ||
| 10. Accounting classification | Liability – amortised cost | Liability – amortised cost | ||
| 11. Original date of issuance | 02/14/2020 | 10/9/2019 | ||
| 12. Perpetual or dated | Dated | Dated | ||
| 13. Original maturity date | 02/14/2030 | 10/7/2029 | ||
| 14. Issuer call subject to prior supervisory approval | Yes | Yes | ||
| At five years from the date of issue in full (also subject to | At five years from the date of issue in full (also subject to | |||
| 15. Optional call date, contingent call dates, and redemption amount | both the Regulatory call and the Tax call, only in full amortisation).100%. | both the Regulatory call and the Tax call, only in full amortisation).100%. | ||
| 16. Subsequent call dates, if applicable | No | No | ||
| Coupons / dividends | ||||
| 17. Fixed or floating dividend/coupon | Floating | Floating | ||
| 18. Coupon rate and any related index | TLREF+250_bps | TLREF+130_bps | ||
| 19. Existence of a dividend stopper | No | No | ||
| 20.a. Fully discretionary, partially discretionary or mandatory (in terms of timing | Mandatory | Mandatory | ||
| 20.b. Fully discretionary, partially discretionary or mandatory (in terms of amount) | Mandatory | Mandatory | ||
| 21. Existence of step up or other incentive to redeem | No | No | ||
| 22. Noncumulative or cumulative | Cumulative | Cumulative | ||
| 23. Convertible or non-convertible | Non-convertible | Non-convertible | ||
| 24. If convertible, conversion trigger (s) | N/A | N/A | ||
| 25. If convertible, fully or partially | N/A | N/A | ||
| 26. If convertible, conversion rate | N/A | N/A | ||
| 27. If convertible, mandatory or optional conversion | N/A | N/A | ||
| 28. If convertible, specify instrument type convertible into | N/A | N/A | ||
| 29. If convertible, specify issuer of instrument it converts into | N/A | N/A | ||
| 30. Write-down features | Yes | Yes | ||
| 31. If write-down, write-down trigger (s) | Cases that by a loss the issuer has become or is likely to become non-viable. Non-viability/Write -down of the notes . BRSA. | Cases that by a loss the issuer has become or is likely to become non-viable. Non-viability/Write -down of the notes . BRSA. | ||
| 32. If write-down, full or partial | Fully or partially | Fully or partially | ||
| 33. If write-down, permanent or temporary | Permanent | Permanent | ||
| 34. If temporary write-down, description of write-up mechanism | N/A | N/A | ||
| 34a. Type of subordination | N/A | N/A | ||
| 34b. Order of priority in normal insolvency proceedings | N/A | N/A | ||
| 35. Position in subordination hierarchy in liquidation (specify instrument type immediately senior to instrument) | Constitute Non-Preferred Debt and will rank (1) junior to the Senior Debt and Preferred Debt, (2) pari passu among themselves and with all the other Non-Preferred Debt, (3) senior only to all classes of equity capital | Constitute Non-Preferred Debt and will rank (1) junior to the Senior Debt and Preferred Debt, (2) pari passu among themselves and with all the other Non-Preferred Debt, (3) senior only to all classes of equity capital | ||
| 36. Non-compliant transitioned features | No | No | ||
| 37. If yes, specify non-compliant features | N/A | N/A | ||
| 37a. Link to the terms and conditions of the instrument | Terms and Conditions | Terms and Conditions | ||
Table of Contents
| BBVA. PILLAR 3 2021 | ANNEXES | P. 287 |
| 1. Issuer | Garanti BBVA | |
| 2. Unique identifier (e.g. ISIN) | XS1617531063 (144A) | |
| US900148AE73 (Reg S) | ||
| 2a. Public or private | Public | |
| 3. Governing law(s) of the instrument | English law except regarding subordinatio that will follow Turkish law | |
| 3a. Contractual recognition of conversion by resolution institution | Yes | |
| Regulatory treatment | ||
| 4. Transitional CRR rules | Tier 2 | |
| 5. Post-transitional CRR rules | Tier 2 | |
| 6. Eligible at solo/(sub-)consolidated/solo & (sub-)consolidated | At solo & (sub-)consolidated | |
| 7. Instrument type (types to be specified by each jurisdiction) | Tier 2 instrument | |
| 8. Amount recognised in regulatory capital (currency in million, as of most recent reporting date) | 266 | |
| 9. Nominal amount of instrument | USD 750 Mill | |
| 9.a. Issue price | 100% | |
| 9.b. Redemption price | 100% | |
| 10. Accounting classification | Liability – amortised cost | |
| 11. Original date of issuance | 05/23/2017 | |
| 12. Perpetual or dated | Dated | |
| 13. Original maturity date | 05/24/2027 | |
| 14. Issuer call subject to prior supervisory approval | Yes | |
| 15. Optional call date, contingent call dates, and redemption amount | 05/24/2022 fully (also subject to Regulatory call and Tax call, only full amortisation) only in full amortisation: 100% | |
| 16. Subsequent call dates, if applicable | No | |
| Coupons / dividends | ||
| 17. Fixed or floating dividend/coupon | Fixed to fixed | |
| 18. Coupon rate and any related index | 6.125% (swap5y$+ 4.22%) | |
| 19. Existence of a dividend stopper | No | |
| 20.a. Fully discretionary, partially discretionary or mandatory (in terms of timing | Mandatory | |
| 20.b. Fully discretionary, partially discretionary or mandatory (in terms of amount) | Mandatory | |
| 21. Existence of step up or other incentive to redeem | No | |
| 22. Noncumulative or cumulative | Cumulative | |
| 23. Convertible or non-convertible | Non-convertible | |
| 24. If convertible, conversion trigger (s) | N/A | |
| 25. If convertible, fully or partially | N/A | |
| 26. If convertible, conversion rate | N/A | |
| 27. If convertible, mandatory or optional conversion | N/A | |
| 28. If convertible, specify instrument type convertible into | N/A | |
| 29. If convertible, specify issuer of instrument it converts into | N/A | |
| 30. Write-down features | Yes | |
| 31. If write-down, write-down trigger (s) | Cases that by a loss the issuer has become or is likely to become non-viable. Non-viability/Write - down of the notes . BRSA. | |
| 32. If write-down, full or partial | Fully or partially | |
| 33. If write-down, permanent or temporary | Permanent | |
| 34. If temporary write-down, description of write-up mechanism | N/A | |
| 34a. Type of subordination | N/A | |
| 34b. Order of priority in normal insolvency proceedings | N/A | |
| 35. Position in subordination hierarchy in liquidation (specify instrument type immediately senior to instrument) | Constitute Non-Preferred Debt and will rank (1) junior to the Senior Debt and Preferred Debt, (2) pari passu among themselves and with all the other Non-Preferred Debt, (3) senior only to all classes of equity capital | |
| 36. Non-compliant transitioned features | No | |
| 37. If yes, specify non-compliant features | N/A | |
| 37a. Link to the terms and conditions of the instrument | Terms and Conditions | |
Table of Contents
| BBVA. PILLAR 3 2021 | ANNEXES | P. 288 |
IV. Geographical breakdown of relevant credit exposures for the calculation of the countercyclical capital buffer (Million Euros. 12-31-2021)
| General credit exposures (1) | Trading book exposure | Securitisation exposure | Own funds requirements | |||||||||||||||||||||||||||||||||||||||||||||||||
| Exposure value for SA | Exposure value for IRB | Sum of long and short position of trading book | Trading book exposure value for internal models | Exposure value for SA | Total exposure value | Of which: General credit exposures | Of which: Trading book exposures | Of which: Securitisation exposures | Total | Risk-weighted exposure amounts | Own funds requirements weights | Countercyclical capital buffer rate | ||||||||||||||||||||||||||||||||||||||||
Geographical breakdown | ||||||||||||||||||||||||||||||||||||||||||||||||||||
Bulgary | 26 | 5 | — | — | — | 31 | 2 | — | — | 2 | 29 | 0.01 | % | 0.50 | % | |||||||||||||||||||||||||||||||||||||
Slovakia | 3 | 161 | — | — | — | 163 | 19 | — | — | 19 | 238 | 0.11 | % | 1.00 | % | |||||||||||||||||||||||||||||||||||||
Hong Kong | 4 | 3,324 | — | — | — | 3,328 | 50 | — | — | 50 | 621 | 0.30 | % | 1.00 | % | |||||||||||||||||||||||||||||||||||||
Luxemburg | 90 | 1,693 | 16 | 16 | — | 1,816 | 69 | — | — | 69 | 864 | 0.41 | % | 0.50 | % | |||||||||||||||||||||||||||||||||||||
Norway | 20 | 57 | 1 | 1 | — | 78 | 3 | — | — | 3 | 44 | 0.02 | % | 1.00 | % | |||||||||||||||||||||||||||||||||||||
Czech Republic | 14 | 99 | — | — | — | 113 | 2 | — | — | 2 | 30 | 0.01 | % | 0.50 | % | |||||||||||||||||||||||||||||||||||||
|
|
|
|
|
|
|
|
|
|
|
|
|
|
|
|
|
|
|
|
|
|
|
|
|
| |||||||||||||||||||||||||||
Total countries with countercyclical capital buffer | 157 | 5,339 | 17 | 17 | — | 5,529 | 145 | — | — | 145 | 1,826 | 0.86 | % | |||||||||||||||||||||||||||||||||||||||
|
|
|
|
|
|
|
|
|
|
|
|
|
|
|
|
|
|
|
|
|
|
|
|
|
| |||||||||||||||||||||||||||
Germany | 208 | 6,371 | 243 | 255 | 47 | 7,124 | 179 | 1 | — | 180 | 2,254 | 1.08 | % | — | ||||||||||||||||||||||||||||||||||||||
Argentina | 7,037 | 372 | 10 | — | — | 7,419 | 332 | — | — | 332 | 4,151 | 1.99 | % | — | ||||||||||||||||||||||||||||||||||||||
Colombia | 14,926 | 704 | 613 | — | — | 16,244 | 792 | 8 | — | 800 | 9,998 | 4.79 | % | — | ||||||||||||||||||||||||||||||||||||||
Spain | 24,491 | 179,418 | 140 | 5 | 2,861 | 206,916 | 5,780 | 15 | 26 | 5,820 | 72,755 | 34.88 | % | — | ||||||||||||||||||||||||||||||||||||||
United States | 692 | 23,758 | 154 | 151 | — | 24,754 | 644 | 2 | — | 645 | 8,066 | 3.87 | % | — | ||||||||||||||||||||||||||||||||||||||
France | 1,312 | 9,045 | 61 | 65 | — | 10,483 | 284 | 1 | — | 286 | 3,572 | 1.71 | % | — | ||||||||||||||||||||||||||||||||||||||
Italy | 20 | 6,487 | 13 | 12 | — | 6,532 | 169 | 1 | — | 169 | 2,116 | 1.01 | % | — | ||||||||||||||||||||||||||||||||||||||
Mexico | 37,477 | 42,311 | 148 | 39 | — | 79,974 | 3,306 | 11 | — | 3,317 | 41,468 | 19.88 | % | — | ||||||||||||||||||||||||||||||||||||||
Netherlands | 548 | 5,150 | 57 | 60 | — | 5,815 | 196 | 1 | — | 197 | 2,458 | 1.18 | % | — | ||||||||||||||||||||||||||||||||||||||
Peru | 22,476 | 847 | 958 | 4 | — | 24,285 | 1,002 | 14 | — | 1,016 | 12,697 | 6.09 | % | — | ||||||||||||||||||||||||||||||||||||||
Portugal | 2,558 | 2,013 | — | 1 | — | 4,573 | 216 | — | — | 216 | 2,696 | 1.29 | % | — | ||||||||||||||||||||||||||||||||||||||
United Kingdom | 2,803 | 7,237 | 139 | 144 | — | 10,322 | 380 | 1 | — | 380 | 4,756 | 2.28 | % | — | ||||||||||||||||||||||||||||||||||||||
Turkey | 43,341 | 510 | 116 | — | — | 43,966 | 2,286 | 2 | — | 2,288 | 28,605 | 13.71 | % | — | ||||||||||||||||||||||||||||||||||||||
Total countries with a 0% countercyclical buffer or without countercyclical capital buffer (with own funds requirements greater than 1%) | 157,889 | 284,223 | 2,652 | 736 | 2,908 | 448,407 | 15,566 | 57 | 26 | 15,646 | 195,592 | 93.76 | % | |||||||||||||||||||||||||||||||||||||||
Andorra | 2 | 33 | — | — | — | 34 | 1 | — | — | 1 | 11 | 0.01 | % | — | ||||||||||||||||||||||||||||||||||||||
Saudi Arabia | — | 70 | — | — | — | �� | 70 | 1 | — | — | 1 | 16 | 0.01 | % | — | |||||||||||||||||||||||||||||||||||||
Australia | 1 | 964 | — | — | — | 964 | 32 | — | — | 32 | 398 | 0.19 | % | — | ||||||||||||||||||||||||||||||||||||||
Austria | 78 | 348 | 3 | 3 | — | 432 | 17 | — | — | 17 | 213 | 0.10 | % | — | ||||||||||||||||||||||||||||||||||||||
Bahamas | — | 23 | — | — | — | 23 | 1 | — | — | 1 | 17 | 0.01 | % | — | ||||||||||||||||||||||||||||||||||||||
Belgium | 85 | 1,042 | — | — | — | 1,128 | 34 | — | — | 34 | 425 | 0.20 | % | — | ||||||||||||||||||||||||||||||||||||||
Bermudas | — | 112 | 1 | 1 | — | 115 | 2 | — | — | 2 | 27 | 0.01 | % | — | ||||||||||||||||||||||||||||||||||||||
Bolivia | 28 | 1 | — | — | — | 29 | 2 | — | — | 2 | 28 | 0.01 | % | — | ||||||||||||||||||||||||||||||||||||||
Brazil | 35 | 298 | 70 | 3 | — | 406 | 13 | 5 | — | 19 | 233 | 0.11 | % | — | ||||||||||||||||||||||||||||||||||||||
Canada | 2 | 266 | 3 | 3 | — | 275 | 13 | — | — | 13 | 157 | 0.08 | % | — | ||||||||||||||||||||||||||||||||||||||
Chile | 1,771 | 1,177 | 1 | — | — | 2,949 | 147 | 1 | — | 148 | 1,849 | 0.89 | % | — | ||||||||||||||||||||||||||||||||||||||
China | 4 | 738 | — | 1 | — | 744 | 19 | — | — | 19 | 243 | 0.11 | % | — | ||||||||||||||||||||||||||||||||||||||
South Korea | 20 | 185 | — | — | — | 206 | 5 | — | — | 5 | 65 | 0.03 | % | — | ||||||||||||||||||||||||||||||||||||||
Cuba | — | 21 | — | — | — | 21 | 3 | — | — | 3 | 37 | 0.02 | % | — | ||||||||||||||||||||||||||||||||||||||
Denmark | 10 | 189 | 3 | 4 | — | 207 | 9 | — | — | 9 | 111 | 0.05 | % | — | ||||||||||||||||||||||||||||||||||||||
Table of Contents
| BBVA. PILLAR 3 2021 | ANNEXES | P. 289 |
| General credit exposures (1) | Trading book exposure | Securitisation exposure | Own funds requirements | |||||||||||||||||||||||||||||||||||||||||||||||||
| Exposure value for SA | Exposure value for IRB | Sum of long and short position of trading book | Trading book exposure value for internal models | Exposure value for SA | Total exposure value | Of which: General credit exposures | Of which: Trading book exposures | Of which: Securitisation exposures | Total | Risk-weighted exposure amounts | Own funds requirements weights | Countercyclical capital buffer rate | ||||||||||||||||||||||||||||||||||||||||
Ecuador | 14 | 59 | — | — | — | 73 | 6 | — | — | 6 | 78 | 0.04 | % | — | % | |||||||||||||||||||||||||||||||||||||
Egypt | 8 | 66 | — | — | — | 74 | 2 | — | — | 2 | 19 | 0.01 | % | — | % | |||||||||||||||||||||||||||||||||||||
United Arab Emirates | 24 | 496 | — | — | — | 520 | 7 | — | — | 7 | 92 | 0.04 | % | — | % | |||||||||||||||||||||||||||||||||||||
Finland | 24 | 196 | 6 | 6 | — | 232 | 6 | — | — | 6 | 69 | 0.04 | % | — | % | |||||||||||||||||||||||||||||||||||||
Gibraltar | — | 17 | — | — | — | 17 | 1 | — | — | 1 | 7 | 0.01 | % | — | % | |||||||||||||||||||||||||||||||||||||
Greece | 2 | 26 | — | — | — | 28 | 3 | — | — | 3 | 33 | 0.02 | % | — | % | |||||||||||||||||||||||||||||||||||||
Guernesey | — | 2 | — | — | — | 2 | 1 | — | — | 1 | 9 | 0.01 | % | — | % | |||||||||||||||||||||||||||||||||||||
Hungary | 27 | 124 | — | — | — | 152 | 9 | — | — | 9 | 106 | 0.05 | % | — | % | |||||||||||||||||||||||||||||||||||||
India | 7 | 313 | — | — | — | 320 | 3 | — | — | 3 | 42 | 0.02 | % | — | % | |||||||||||||||||||||||||||||||||||||
Ireland | 10 | 1,000 | 1 | 1 | — | 1,012 | 31 | — | — | 31 | 394 | 0.19 | % | — | % | |||||||||||||||||||||||||||||||||||||
Cayman islands | 10 | 670 | 3 | 4 | — | 686 | 49 | — | — | 49 | 616 | 0.29 | % | — | % | |||||||||||||||||||||||||||||||||||||
Falkland islands | 24 | 16 | — | — | — | 40 | 1 | — | — | 1 | 15 | 0.01 | % | — | % | |||||||||||||||||||||||||||||||||||||
Japan | 31 | 48 | — | — | — | 79 | 5 | — | — | 5 | 62 | 0.03 | % | — | % | |||||||||||||||||||||||||||||||||||||
Jordan | 13 | — | — | — | — | 13 | 1 | — | — | 1 | 6 | 0.01 | % | — | % | |||||||||||||||||||||||||||||||||||||
Kuwait | — | 403 | — | — | — | 403 | 1 | — | — | 1 | 12 | 0.01 | % | — | % | |||||||||||||||||||||||||||||||||||||
North Macedonia | 15 | — | — | — | — | 15 | 1 | — | — | 1 | 15 | 0.01 | % | — | % | |||||||||||||||||||||||||||||||||||||
Malasia | — | 42 | — | — | — | 42 | 2 | — | — | 2 | 20 | 0.01 | % | — | % | |||||||||||||||||||||||||||||||||||||
Malta | 75 | — | — | — | — | 76 | 6 | — | — | 6 | 71 | 0.04 | % | — | % | |||||||||||||||||||||||||||||||||||||
Morocco | 17 | 12 | — | — | — | 28 | 2 | — | — | 2 | 21 | 0.01 | % | — | % | |||||||||||||||||||||||||||||||||||||
Marshall islands | 72 | 54 | — | — | — | 126 | 6 | — | — | 6 | 79 | 0.04 | % | — | % | |||||||||||||||||||||||||||||||||||||
Mauricio | — | 43 | — | — | — | 43 | 2 | — | — | 2 | 23 | 0.01 | % | — | % | |||||||||||||||||||||||||||||||||||||
Panama | 130 | 5 | — | — | — | 135 | 2 | — | — | 2 | 26 | 0.01 | % | — | % | |||||||||||||||||||||||||||||||||||||
Poland | 4 | 30 | — | — | — | 34 | 4 | — | — | 4 | 47 | 0.02 | % | — | % | |||||||||||||||||||||||||||||||||||||
Qatar | 3 | 231 | — | — | — | 234 | 14 | — | — | 14 | 177 | 0.08 | % | — | % | |||||||||||||||||||||||||||||||||||||
Romania | 2,342 | 9 | — | — | — | 2,351 | 98 | — | — | 98 | 1,226 | 0.59 | % | — | % | |||||||||||||||||||||||||||||||||||||
Russia | 8 | 50 | — | — | — | 58 | 3 | — | — | 3 | 37 | 0.02 | % | — | % | |||||||||||||||||||||||||||||||||||||
Singapur | 154 | 786 | — | — | — | 940 | 29 | — | — | 29 | 362 | 0.17 | % | — | % | |||||||||||||||||||||||||||||||||||||
South Africa | 4 | 60 | — | — | — | 63 | 2 | — | — | 2 | 19 | 0.01 | % | — | % | |||||||||||||||||||||||||||||||||||||
Sweden | 4 | 263 | 19 | 23 | — | 309 | 9 | — | — | 9 | 113 | 0.05 | % | — | % | |||||||||||||||||||||||||||||||||||||
Switzerland | 588 | 2,374 | 22 | 17 | — | 3,000 | 105 | — | — | 105 | 1,309 | 0.63 | % | — | % | |||||||||||||||||||||||||||||||||||||
Taiwan | 4 | 1,347 | — | — | — | 1,351 | 22 | — | — | 22 | 272 | 0.13 | % | — | % | |||||||||||||||||||||||||||||||||||||
Uruguay | 2,159 | 53 | 105 | — | — | 2,316 | 111 | — | — | 111 | 1,389 | 0.67 | % | — | % | |||||||||||||||||||||||||||||||||||||
Venezuela | 312 | 25 | — | — | — | 337 | 19 | — | — | 19 | 243 | 0.11 | % | — | % | |||||||||||||||||||||||||||||||||||||
Virgin islands (UK) | 14 | 393 | 1 | 1 | — | 408 | 24 | — | — | 24 | 299 | 0.14 | % | — | % | |||||||||||||||||||||||||||||||||||||
Virgin islands (USA) | — | 9 | — | — | — | 9 | 2 | — | — | 2 | 22 | 0.01 | % | — | % | |||||||||||||||||||||||||||||||||||||
Other countries (1) | 218 | 136 | 5 | 1 | — | 362 | 3 | 1 | — | 6 | 71 | 0.01 | % | — | % | |||||||||||||||||||||||||||||||||||||
|
|
|
|
|
|
|
|
|
|
|
|
|
|
|
|
|
|
|
|
|
|
|
|
|
| |||||||||||||||||||||||||||
Total countries without countercyclical capital buffer (withown funds requirements less than 1%) | 8,353 | 14,825 | 243 | 68 | — | 23,491 | 891 | 7 | — | 901 | 11,231 | 5.38 | % | |||||||||||||||||||||||||||||||||||||||
|
|
|
|
|
|
|
|
|
|
|
|
|
|
|
|
|
|
|
|
|
|
|
| |||||||||||||||||||||||||||||
Total | 166,399 | 304,387 | 2,912 | 821 | 2,908 | 477,427 | 16,602 | 64 | 26 | 16,692 | 208,649 | 100 | % | |||||||||||||||||||||||||||||||||||||||
|
|
|
|
|
|
|
|
|
|
|
|
|
|
|
|
|
|
|
|
|
|
|
| |||||||||||||||||||||||||||||
| (*) | The established order is alphabetical according to the Spanish version |
| (1) | Other countries include those territories (68) where exposures to credit risk, trading portfolio or securitisation, computable for the calculation of the countercyclical buffer, are less than 500,000 euros. |
Table of Contents
| BBVA. PILLAR 3 2021 | ANNEXES | P. 290 |
V. EU LR2 - Leverage ratio common disclosure (Million Euros)
| 31/12/2021 | 31/12/2021 | 30/6/2021 | 30/6/2021 | 31/12/2020 | 31/12/2020 | |||||||||||||||||||
| Phased-in | Fully-loaded | Phased-in | Fully-loaded | Phased-in | Fully-loaded | |||||||||||||||||||
On-balance sheet exposures (excluding derivatives and SFTs) | ||||||||||||||||||||||||
On-balance sheet items (excluding derivatives, SFTs, but including collateral) | 517,383 | 517,383 | 532,605 | 532,605 | 610,801 | 610,801 | ||||||||||||||||||
Gross-up for derivatives collateral provided where deducted from the balance sheet assets pursuant to the applicable accounting framework | — | — | — | — | — | — | ||||||||||||||||||
(Deductions of receivables assets for cash variation margin provided in derivatives transactions) | (1,138 | ) | (1,138 | ) | — | — | — | — | ||||||||||||||||
(Adjustment for securities received under securities financing transactions that are recognised as an asset) | — | — | — | — | — | — | ||||||||||||||||||
(General credit risk adjustments to on-balance sheet items) | — | — | — | — | — | — | ||||||||||||||||||
(Asset amounts deducted in determining Tier 1 capital) | (3,354 | ) | (4,119 | ) | (2,782 | ) | (3,388 | ) | (4,191 | ) | (5,788 | ) | ||||||||||||
|
|
|
|
|
|
|
|
|
|
|
| |||||||||||||
Total on-balance sheet exposures (excluding derivatives and SFTs) (sum of lines 1 to 6) | 512,891 | 512,126 | 529,823 | 529,217 | 606,610 | 605,013 | ||||||||||||||||||
|
|
|
|
|
|
|
|
|
|
|
| |||||||||||||
Derivative exposures | ||||||||||||||||||||||||
Replacement cost associated with SA-CCR derivatives transactions (ie net of eligible cash variation margin) | 5,093 | 5,093 | 6,074 | 6,074 | 12,863 | 12,863 | ||||||||||||||||||
Derogation for derivatives: replacement costs contribution under the simplified standardised approach | — | — | — | — | — | — | ||||||||||||||||||
Add-on amounts for potential future exposure associated with SA-CCR derivatives transactions | 12,695 | 12,695 | 11,216 | 11,216 | 13,873 | 13,873 | ||||||||||||||||||
Derogation for derivatives: Potential future exposure contribution under the simplified standardised approach | — | — | — | — | — | — | ||||||||||||||||||
Exposure determined under Original Exposure Method | — | — | — | — | — | — | ||||||||||||||||||
(Exempted CCP leg of client-cleared trade exposures) (SA-CCR) | — | — | — | — | — | — | ||||||||||||||||||
(Exempted CCP leg of client-cleared trade exposures) (simplified standardised approach) | — | — | — | — | — | — | ||||||||||||||||||
(Exempted CCP leg of client-cleared trade exposures) (original exposure method) | — | — | — | — | — | — | ||||||||||||||||||
Adjusted effective notional amount of written credit derivatives | 15,914 | 15,914 | 11,024 | 11,024 | 10,832 | 10,832 | ||||||||||||||||||
(Adjusted effective notional offsets and add-on deductions for written credit derivatives) | (5,417 | ) | (5,417 | ) | (2,967 | ) | (2,967 | ) | (6,990 | ) | (6,990 | ) | ||||||||||||
|
|
|
|
|
|
|
|
|
|
|
| |||||||||||||
Total derivatives exposures (sum of lines 8 to EU-12) | 28,285 | 28,285 | 25,347 | 25,347 | 30,578 | 30,578 | ||||||||||||||||||
|
|
|
|
|
|
|
|
|
|
|
| |||||||||||||
Securities financing transaction (SFT) exposures | ||||||||||||||||||||||||
Gross SFT assets (with no recognition of netting), after adjustment for sales accounting transactions | 59,590 | 59,590 | 42,897 | 42,897 | 34,536 | 34,536 | ||||||||||||||||||
(Netted amounts of cash payables and cash receivables of gross SFT assets) | (6,908 | ) | (6,908 | ) | (5,839 | ) | (5,839 | ) | (1,910 | ) | (1,910 | ) | ||||||||||||
Counterparty credit risk exposure for SFT assets | 14,026 | 14,026 | 12,889 | 12,889 | 3,523 | 3,523 | ||||||||||||||||||
Derogation for SFTs: Counterparty credit risk exposure in accordance with Articles 429e(5) and 222 of Regulation (EU) No 575/2013 | — | — | — | — | — | — | ||||||||||||||||||
Agent transaction exposures | — | — | — | — | — | — | ||||||||||||||||||
(Exempted CCP leg of client-cleared SFT exposure) | — | — | — | — | — | — | ||||||||||||||||||
|
|
|
|
|
|
|
|
|
|
|
| |||||||||||||
15a)Total de las exposiciones de las operaciones de financiación de valores (suma de las líneas 14 a EU-17a) | 66,708 | 66,708 | 49,947 | 49,947 | 36,149 | 36,149 | ||||||||||||||||||
|
|
|
|
|
|
|
|
|
|
|
| |||||||||||||
Other off-balance sheet exposures | ||||||||||||||||||||||||
Off-balance sheet exposures at gross notional amount | 166,115 | 166,115 | 159,162 | 159,162 | 178,030 | 178,030 | ||||||||||||||||||
(Adjustments for conversion to credit equivalent amounts) | (102,144 | ) | (102,144 | ) | (98,414 | ) | (98,414 | ) | (110,271 | ) | (110,271 | ) | ||||||||||||
(General provisions associated with off-balance sheet exposures deducted in determining Tier 1 capital) | — | — | — | — | — | — | ||||||||||||||||||
|
|
|
|
|
|
|
|
|
|
|
| |||||||||||||
Off-balance sheet exposures (sum of lines 17 to 19) | 63,971 | 63,971 | 60,748 | 60,748 | 67,758 | 67,758 | ||||||||||||||||||
|
|
|
|
|
|
|
|
|
|
|
| |||||||||||||
Exempted exposures in accordance with Article 429a(1)(c) and (j) of Regulation (EU) No 575/213X (on and off balance sheet) | ||||||||||||||||||||||||
(Exposures excluded from the leverage ratio total exposure measure in accordance with Article 429a(1)(c) of CRR) | — | — | — | — | — | — | ||||||||||||||||||
(Exposures exempted in accordance with Article 429a (1) (j) of Regulation (EU) No 575/2013 (on and off balance sheet)) | — | — | — | — | — | — | ||||||||||||||||||
(Excluded exposures of public development banks - Public sector investments) | — | — | — | — | — | — | ||||||||||||||||||
| Promotional loans granted by an entity directly set up by the central government, regional governments or local authorities of a Member State | — | — | — | — | — | — | ||||||||||||||||||
| Promotional loans granted by an entity set up by the central government, regional governments or local authorities of a Member State through an intermediate credit institution) | — | — | — | — | — | — | ||||||||||||||||||
Table of Contents
| BBVA. PILLAR 3 2021 | ANNEXES | P. 291 |
| 31/12/2021 | 31/12/2021 | 30/6/2021 | 30/6/2021 | 31/12/2020 | 31/12/2020 | |||||||||||||||||||
| Phased-in | Fully-loaded | Phased-in | Fully-loaded | Phased-in | Fully-loaded | |||||||||||||||||||
(-) Excluded passing-through promotional loan exposures by non-public development banks (or units): | ||||||||||||||||||||||||
– Promotional loans granted by a public development credit institution | ||||||||||||||||||||||||
– Promotional loans granted by an entity directly set up by the central government, regional governments or local authorities of a Member State | ||||||||||||||||||||||||
– Promotional loans granted by an entity set up by the central government, regional governments or local authorities of a Member State through an intermediate credit institution | — | — | — | — | — | — | ||||||||||||||||||
|
|
|
|
|
|
|
|
|
|
|
| |||||||||||||
(Excluded guaranteed parts of exposures arising from export credits) | (66 | ) | (66 | ) | (114 | ) | (114 | ) | — | — | ||||||||||||||
|
|
|
|
|
|
|
|
|
|
|
| |||||||||||||
(Excluded excess collateral deposited at triparty agents) | — | — | — | — | — | — | ||||||||||||||||||
(Excluded CSD related services of CSD/institutions in accordance with Article 429a(o) of the CRR) | — | — | — | — | — | — | ||||||||||||||||||
(Excluded CSD related services of designated institutions in accordance with Article 429a(1)(p) of the CRR) | — | — | — | — | — | — | ||||||||||||||||||
(Reduction of the exposure value of pre-financing or intermediate loans) | — | — | — | — | — | — | ||||||||||||||||||
|
|
|
|
|
|
|
|
|
|
|
| |||||||||||||
(Total exempted exposures) | (66 | ) | (66 | ) | (114 | ) | (114 | ) | — | — | ||||||||||||||
|
|
|
|
|
|
|
|
|
|
|
| |||||||||||||
Capital and total exposure measure | ||||||||||||||||||||||||
Tier 1 capital | 45,687 | 44,922 | 49,599 | 49,007 | 49,597 | 48,012 | ||||||||||||||||||
Leverage ratio total exposure measure | 671,790 | 671,025 | 665,751 | 665,146 | 741,095 | 739,497 | ||||||||||||||||||
Leverage ratio | ||||||||||||||||||||||||
Leverage ratio | 6.80 | % | 6.69 | % | 7.45 | % | 7.37 | % | 6.69 | % | 6.49 | % | ||||||||||||
Leverage ratio (excluding the impact of the exemption of public sector investments and promotional loans) (%) | 6.80 | % | 6.69 | % | 7.45 | % | 7.37 | % | 6.69 | % | 6.49 | % | ||||||||||||
Leverage ratio (excluding the impact of any applicable temporary waiver of central bank reserves) (%) | 6.48 | % | 6.37 | % | 7.22 | % | 7.14 | % | 6.46 | % | 6.27 | % | ||||||||||||
Regulatory minimum leverage ratio requirements (%) | 3.06 | % | 3.06 | % | 3.09 | % | 3.09 | % | ||||||||||||||||
Additional own funds requirements to address the risk of excessive leverage (%) | 0.00 | % | 0.00 | % | 0.00 | % | 0.00 | % | ||||||||||||||||
Of which: comprised of common equity tier 1 capital | 0.00 | % | 0.00 | % | 0.00 | % | 0.00 | % | ||||||||||||||||
Leverage ratio cushion requirement (%) | 0.00 | % | 0.00 | % | 0.00 | % | 0.00 | % | ||||||||||||||||
Overall leverage ratio requirement (%) | 3.06 | % | 3.06 | % | 3.09 | % | 3.09 | % | ||||||||||||||||
Choice on transitional arrangements and relevant exposures | ||||||||||||||||||||||||
Choice on transitional arrangements for the definition of the capital measure | Transitional | | Fully phased in | | Transitional | | Fully phased in | | ||||||||||||||||
Disclosure of mean values | ||||||||||||||||||||||||
Mean value of gross SFT assets, after adjustment for sale accounting transactions and netted of amounts of associated cash payables and cash receivable | 47,762 | 47,762 | 35,721 | 35,721 | ||||||||||||||||||||
Quarter-end value of gross SFT assets, after adjustment for sale accounting transactions and netted of amounts of associated cash payables and cash receivables | 52,682 | 52,682 | 37,058 | 37,058 | ||||||||||||||||||||
Total exposures (including the impact of any applicable temporary exemption of central bank reserves) incorporating mean values from row 28 of gross SFT assets (after adjustment for sale accounting transactions and netted of amounts of associated cash payables and cash receivables) | 676,710 | 675,945 | 664,415 | 663,809 | ||||||||||||||||||||
Total exposures (excluding the impact of any applicable temporary exemption of central bank reserves) incorporating mean values from row 28 of gross SFT assets (after adjustment for sale accounting transactions and netted of amounts of associated cash payables and cash receivables) | 710,457 | 709,692 | 685,385 | 684,779 | ||||||||||||||||||||
Leverage ratio (including the impact of any applicable temporary exemption of central bank reserves) incorporating mean values from row 28 of gross SFT assets (after adjustment for sale accounting transactions and netted of amounts of associated cash payables and cash receivables) | 6.75 | % | 6.65 | % | 7.47 | % | 7.38 | % | ||||||||||||||||
Leverage ratio (excluding the impact of any applicable temporary exemption of central bank reserves) incorporating mean values from row 28 of gross SFT assets (after adjustment for sale accounting transactions and netted of amounts of associated cash payables and cash receivables) | 6.43 | % | 6.33 | % | 7.24 | % | 7.16 | % | ||||||||||||||||
| (*) | As of December 31, 2021, the table has been adapted to the New EBA ITS, which has involved, among others, the inclusion of additional rows to show the additional own funds requirements to deal with the risk of excessive leverage as well as average values. |
Table of Contents
| BBVA. PILLAR 3 2021 | ANNEXES | P. 292 |
VI. Indicators of systemic importance (Million Euros 12-31-2021)
Section 1 - General Information | ||||
| b. General Information provided by the reporting institution: | ||||
(1) Reporting unit | 1,000,000 | |||
(2) Accounting standard | IFRS | |||
Section 2 - Total Exposures | Amount | |||
a. Derivatives | ||||
(1) Counterparty exposure of derivatives contracts | 5,093 | |||
(2) Capped notional amount of credit derivatives | 10,498 | |||
(3) Potential future exposure of derivative contracts | 12,695 | |||
b. Securities financing transactions (SFTs) | ||||
(1) Adjusted gross value of SFTs | 52,682 | |||
(2) Counterparty exposure of SFTs | 14,026 | |||
c. Other assets | 513,590 | |||
|
| |||
d. Gross notional amount of off-balance sheet items | ||||
(1) Items subject to a 0% credit conversion factor (CCF) | 53,378 | |||
(2) Items subject to a 20% CCF | 13,495 | |||
(3) Items subject to a 50% CCF | 86,614 | |||
(4) Items subject to a 100% CCF | 12,627 | |||
e. Regulatory adjustments | (4,119 | ) | ||
|
| |||
f. Total exposures indicator (Total exposures prior to regulatory adjustments) (sum of items 2.a.(1) thorough 2.c, 0.1 times 2.d.(1), 0.2 times 2.d.(2), 0.5 times 2.d.(3), and 2.d.(4)) | 672,554 | |||
g. Exposures of insurance subsidiaries not included in 2.f net of intragroup: | ||||
(1) On-balance sheet and off-balance sheet insurance assets | 21,866 | |||
(2) Potential future exposure of derivatives contracts for insurance subsidiaries | — | |||
(3) Investment value in consolidated entities | — | |||
h. Intragroup exposures with insurance subsidiaries reported in 2.g that are included in 2.f | — | |||
i. Total exposures indicator, including insurance subsidiaries (sum of items 2.f, 2.g.(1) thorough 2.g.(2) minus 2.g.(3) thorough 2.h) | 694,420 | |||
|
| |||
Section 3 - Intra-Financial System Assets | Amount | |||
a. Funds deposited with or lent to other financial institutions | 23,304 | |||
(1) Certificates of deposit | 38 | |||
b. Unused portion of committed lines extended to other financial institutions | 16,085 | |||
c. Holdings of securities issued by other financial institutions: | ||||
(1) Secured debt securities | 704 | |||
(2) Senior unsecured debt securities | 8,100 | |||
(3) Subordinated debt securities | 1,054 | |||
(4) Commercial paper | 147 | |||
(5) Equity securities | 3,619 | |||
(6) Offsetting short positions in relation to the specific equity securities included in item 3.c.(5) | 167 | |||
d. Net positive current exposure of securities financing transactions with other financial institutions | 2,125 | |||
e. Over-the-counter derivatives with other financial institutions that have a net positive fair value: | ||||
(1) Net positive fair value | 10,996 | |||
(2) Potential future exposure | 4,128 | |||
f. Intra-financial system assets indicator (sum of items 3.a, 3.b through 3.c.(5), 3.d, 3.e.(1), and 3.e.(2), minus 3.c.(6)) | 70,095 | |||
|
| |||
Section 4 - Intra-Financial System Liabilities | Amount | |||
a. Funds deposited by or borrowed from other financial institutions | ||||
(1) Deposits due to depository institutions | 16,744 | |||
(2) Deposits due to non-depository financial institutions | 16,889 | |||
(3) Loans obtained from other financial institutions | — | |||
b. Unused portion of committed lines obtained from other financial institutions | 6,859 | |||
Table of Contents
| BBVA. PILLAR 3 2021 | ANNEXES | P. 293 |
c. Net negative current exposure of SFTs with other financial institutions | 4,937 | |||
d. OTC derivatives with other financial institutions that have a net negative fair value | ||||
(1) Net negative fair value | 9,732 | |||
(2) Potential future exposure | 3,653 | |||
e. Intra-financial system liabilities indicator, including insurance subsidiaries (sum of items 4.a.(1) through 4.d.(2)) | 58,815 | |||
|
|
Section 5 - Securities Outstanding | Amount | |||
a. Secured debt securities | 12,400 | |||
b. Senior unsecured debt securities | 29,898 | |||
c. Subordinated debt securities | 14,794 | |||
d. Commercial paper | 1,216 | |||
e. Certificates of deposit | 851 | |||
f. Common equity | 40,641 | |||
g. Preferred shares and any other forms of subordinated funding not captured in item 5.c. | — | |||
h. Securities outstanding indicator, including the securities issued by insurance subsidiaries (sum of items 5.a through 5.g) | 99,800 | |||
|
| |||
Section 6 - Payments made in the reporting year (excluding intragroup payments) | Amount | |||
a. Australian dollars (AUD) | 22,469 | |||
b. Canadian dollars (CAD) | 36,208 | |||
c. Swiss francs (CHF) | 49,313 | |||
d. Chinese yuan (CNY) | 102,156 | |||
e. Euros (EUR) | 6,230,881 | |||
f. British pounds (GBP) | 440,911 | |||
g. Hong Kong dollars (HKD) | 70,260 | |||
h. Indian rupee (INR) | 6 | |||
i. Japanese yen (JPY) | 76,159 | |||
j. New Zealand dollars (NZD) | 22,123 | |||
k. Swedish krona (SEK) | 12,092 | |||
l. United States dollars (USD) | 3,272,541 | |||
m. Payments activity indicator (sum of items 6.a through 6.l) | 10,335,120 | |||
|
| |||
Section 7 - Assets Under Custody | Amount | |||
a. Assets under custody indicator | 426,877 | |||
|
| |||
Section 8 - Underwritten Transactions in Debt and Equity Markets | Amount | |||
a. Equity underwriting activity | — | |||
b. Debt underwriting activity | 29,756 | |||
c. Underwriting activity indicator (sum of items 8.a and 8.b) | 29,756 | |||
Section 9 - Trading Volume | Amount | |||
a. Trading volume of securities issued by other public sector entities, excluding intragroup transactions | 39,476 | |||
b. Trading volume of other fixed income securities, excluding intragroup transactions | 100,235 | |||
c. Trading volume fixed income sub-indicator (sum of items 9.a and 9.b) | 139,711 | |||
d. Trading volume of listed equities, excluding intragroup transactions | 181,720 | |||
e. Trading volume of all other securities, excluding intragroup transactions | 1,730 | |||
f. Trading volume equities and other securities sub-indicator (sum of items 9.d and 9.e) | 183,451 | |||
|
| |||
Section 10 - Notional Amount of Over-the-Counter (OTC) Derivatives | Amount | |||
a. OTC derivatives cleared through a central counterparty | 3,180,741 | |||
b. OTC derivatives settled bilaterally | 1,406,412 | |||
c. Notional amount of over-the-counter (OTC) derivatives indicator, including insurance subsidiaries (sum of items 10.a and 10.b) | 4,587,153 | |||
|
| |||
Table of Contents
| BBVA. PILLAR 3 2021 | ANNEXES | P. 294 |
Section 11 - Trading and Available-for-Sale Securities | Amount | |||
a. Held-for-trading securities (HFT) | 25,415 | |||
b. Available-for-sale securities (AFS) | 44,393 | |||
c. Trading and AFS securities that meet the definition of Level 1 assets | 52,828 | |||
d. Trading and AFS securities that meet the definition of Level 2 assets, with haircuts | 10,780 | |||
e. Trading and AFS securities indicator (sum of items 11.a and 11.b, minus the sum of 11.c and 11.d) | 6,201 | |||
|
| |||
Section 12 - Level 3 Assets | Amount | |||
a. Level 3 asset indicator, Including insurance subsidiaries | 5,301 | |||
|
| |||
Section 13 - Cross-Jurisdictional Claims | Amount | |||
a. Total foreign claims on an ultimate risk basis | 332,007 | |||
b. Foreign derivative claims on an ultimate risk basis | 28,315 | |||
c. Cross-jurisdictional claims indicator (sum of items 13.a and 13.b) | 360,321 | |||
|
| |||
Section 14 - Cross-Jurisdictional Liabilities | Amount | |||
a. Foreign liabilities on an immediate risk basis, excluding derivatives and including local liabilities in local currency | 107,298 | |||
b. Foreign derivative liabilities on an immediate risk basis | 30,646 | |||
c. Cross-jurisdictional liabilities indicator (sum of items 14.a and 14.b) | 137,944 | |||
|
| |||
Table of Contents
| BBVA. PILLAR 3 2021 | ANNEXES | P. 295 |
VII. Modifications to the tables with respect to the 2020 report
Table 2020 | Description | ITS applicable on 2020 report | Change | Table 2021 | ITS applicable on 2021 | |||||
| Key metrics | New table | EU KM1 | EBA/ITS/2020/04 | |||||||
| Table 2 | Geographical breakdown of relevant credit exposures for the calculation of the countercyclical capital buffer | Delegated Regulation UE 2015/1555 | Renamed | EU CCyB | EBA/ITS/2020/04 | |||||
| EU CRB-B | Total and average net amount of exposures (including counterparty credit risk) | EBA/GL/2016/11 | Dropped. Requirement dropped | |||||||
| EU CRB-C | Geographical breakdown of exposures (excluding counterparty credit risk) | EBA/GL/2016/11 | Dropped. Requirement covered by EU CQ4 | EU CQ4 | EBA/ITS/2020/04 | |||||
| EU CRB-D | Concentration of exposures by industry or counterparty types (excluding counterparty credit risk) | EBA/GL/2016/11 | Dropped. Requirement covered by EU CQ5 | EU CQ5 | EBA/ITS/2020/04 | |||||
| EU CRB-E | Maturity of exposures (excluding counterparty credit risk) | EBA/GL/2016/11 | Layout modified and renamed | EU CR1-A | EBA/ITS/2020/04 | |||||
| EU CR2-A | Changes in the stock of general and specific credit risk adjustments | EBA/GL/2016/11 | Dropped. Requirement dropped | |||||||
| EU CR2-B | Changes in the balance of loans and debt securities in default and impaired | EBA/GL/2016/11 | Renamed | EU CR2 | EBA/ITS/2020/04 | |||||
| Scope of the use of IRB and SA approaches | New Table | EU CR6-A | EBA/ITS/2020/04 | |||||||
| Table 33 | Average PD and LGD by category and country | CRR art. 452 j) | Dropped. Requirement dropped | |||||||
| Backtesting of PD per exposure class | New Table | EU CR9.1 | EBA/ITS/2020/04 | |||||||
| EU CR10 (1) | IRB: Specialised lending | EBA/GL/2016/11 | Layout modified and renamed | EU CR10 (1-4) | EBA/ITS/2020/04 | |||||
| EU CCR1 | Analysis of CCR exposure by approach | EBA/GL/2016/11 | Layout modified | EU CCR1 | EBA/ITS/2020/04 | |||||
| EU CCR3 | Standardised approach: CCR exposures by regulatory portfolio and risk | EBA/GL/2016/11 | Layout modified | EU CCR3 | EBA/ITS/2020/04 | |||||
| EU CCR5-A | Impact of netting and collateral held on exposure values | EBA/GL/2016/11 | Dropped. Requirement dropped | |||||||
| EU CCR5-B | Composition of collateral for exposure to Counterparty Credit Risk | EBA/GL/2016/11 | Layout modified and renamed | EU CCR5 | EBA/ITS/2020/04 | |||||
Table of Contents
| BBVA. PILLAR 3 2021 | ANNEXES | P. 296 |
Table 2020 | Description | ITS applicable on 2020 report | Change | Table 2021 | ITS applicable on 2021 | |||||
| Table 53 | Breakdown of securitised balances by type of asset | CRR art. 449 p) | Layout modified and renamed | EU SEC5 | EBA/ITS/2020/04 | |||||
| IRB approach – Disclosure of the extent of the use of CRM techniques | New table | EU CR7-A | EBA/ITS/2020/04 | |||||||
| Interest rate risk of non-tradinf book activities | New table | EU IRRBB1 | EBA/ITS/2021/07 | |||||||
| Table 65 | Breakdown of book value, EAD and RWAs of equity investments and capital instruments | CRR art. 447 b) | Dropped. Requirement dropped | |||||||
| Table 66 | Exposure in equity investments and capital instruments | CRR art. 447 c) | Dropped. Requirement dropped | |||||||
| Table 69 | Realised profit and loss from sales and settlements of equity investments and capital instruments | CRR art. 447 d) | Dropped. Requirement dropped | |||||||
| Table 70 | Valuation adjustments foor latent revaluation of equity investments and capital instruments | CRR art. 447 e) | Dropped. Requirement dropped | |||||||
| Net stable funding ratio (NSFR) | New table | EU LIQ2 | EBA/ITS/2020/04 | |||||||
| Table 81 | Encumbered and unencumbered assets | EBA/RTS/2017/03 | Renamed | EU AE1 | EBA/ITS/2020/04 | |||||
| Table 82 | Collateral received | EBA/RTS/2017/03 | Renamed | EU AE2 | EBA/ITS/2020/04 | |||||
| Table 83 | Sources of encumbrance | EBA/RTS/2017/03 | Renamed | EU AE3 | EBA/ITS/2020/04 | |||||
| Operational risk own funds requirements and risk-weighted exposure amounts | New table | EU OR1 | EBA/ITS/2020/04 | |||||||
| Table 84 | Regulatory capital for operational risk | CRR art. 446 | Dropped. Requirement covered by EU OR1 | EU OR1 | EBA/ITS/2020/04 | |||||
| LRSum | Summary reconciliation of accounting assets and exposure corresponding to the Leverage Ratio | Implementing Regulation UE 2016/200 | Renamed | EU LR1 | EBA/ITS/2020/04 | |||||
| LRCom | Leverage ratio common disclosure | Implementing Regulation UE 2016/200 | Layout modified and renamed | EU LR2 | EBA/ITS/2020/04 | |||||
| Split-up of on balance sheet exposures (excluding derivatives, SFTs and exempted exposures) | New table | EU LR3 | EBA/ITS/2020/04 | |||||||
| Table 88 | Remuneration of the Identified Staff | EBA/GL/2015/22 | Layout modified and renamed | EU REM1 | EBA/ITS/2020/04 | |||||
Table of Contents
| BBVA. PILLAR 3 2021 | ANNEXES | P. 297 |
Table 2020 | Description | ITS applicable on 2020 report | Change | Table 2021 | ITS applicable on 2021 | |||||
| Table 89 | Extraordinary remuneration of the Identified Staff | EBA/GL/2015/22 | Layout modified and renamed | EU REM2 | EBA/ITS/2020/04 | |||||
| Table 90 | Deferred variable remuneration | EBA/GL/2015/22 | Layout modified and renamed | EU REM3 | EBA/ITS/2020/04 | |||||
| Table 92 | Number of individuals with total remuneration exceeding €1 million | EBA/GL/2015/22 | Renamed | EU REM4 | EBA/ITS/2020/04 | |||||
| Table 91 | Remuneration of the Identified Staff by activity areas | EBA/GL/2015/22 | Layout modified and renamed | EU REM5 | EBA/ITS/2020/04 | |||||
| Annex III | Capital instruments main features template (issuances) | EBA/ITS/2013/01 | Layout modified and renamed | EU CCA | EBA/ITS/2020/04 | |||||
| Annex V | Indicators of systemic importance | EBA/GL/2020/14 | Layout modified | Annex VI | BCBS—End 2021 G-SIB Assessment Exercise | |||||
Table of Contents
| BBVA. PILLAR 3 2021 | ANNEXES | P. 298 |
VIII. Regulatory compliance (12-31-2021)
The following table provides the correspondence between disclosure requirements as per Part Eight of CRR and the sections of Pillar 3 report where the information can be found:
CRR Article | Description | Pilar 3 Section | ||
General principles of disclosure | ||||
| Art.431 - Disclosure requirements and policies | Scope of application of disclosure and publication requirements for data that convey a complete picture of the institution’s risk profile | 2021 Prudential Relevance Report - Pillar 3. (Section 1.3) | ||
| Art.432 - Non-material, proprietary or confidential information | Omission of disclosures considered non-significant or confidential and the reasons, if applicable, for their classification as such. | BBVA Group has not made use of the exemption for disclosures considered proprietary or confidential. | ||
| Art.433 - Frequency and scope of disclosures | Publication of the information with the frequency set by article 433a. Disclosures shall be published coinciding with the publication of the financial statements or as soon as possible thereafter. | The BBVA Group publishes more frequently than once a year, as defined in article 433a on disclosures by large entities. | ||
| Art.434 - Uniform disclosure formats | Obligation to disclose information in electronic format and in a single medium or location | The BBVA Group publishes the Prudential Relevance Report in a single document, including its annexes, in the BBVA website | ||
| Technical criteria on transparency and disclosure of information. | ||||
| Section 4.1 | ||||
| 1. Institutions shall disclose their risk management objectives and policies for each separate category of risk, including the risks referred to in this Title. Those disclosures shall include: | Section 4.2 | |||
| Section 4.3 | ||||
| Section 4.4 | ||||
| (a) the strategies and processes to manage those categories of risks; | Section 4.5 | |||
| Section 4.6 | ||||
| b) the structure and organisation of the relevant risk management function including information on the basis of its authority, its powers and accountability in accordance with the institution’s incorporation and governing documents; | Section 4.1 | |||
| Section 4.2.1 | ||||
| Section 4.3.1 | ||||
| (c) the scope and nature of risk reporting and measurement systems; | Section 4.4.1, 4.4.2 y 4.4.3 | |||
| Section 4.5.1 | ||||
| Section 4.6.1 | ||||
| (d) the policies for hedging and mitigating risk, and the strategies and processes for monitoring the continuing effectiveness of hedges and mitigants; | Section 4.2.8 | |||
| Art.435.- Disclosure of risk management objectives and policies | (e) a declaration approved by the management body on the adequacy of the risk management arrangements of the relevant institution providing assurance that the risk management systems put in place are adequate with regard to the institution’s profile and strategy | Section 4.1.1 | ||
| (f) a concise risk statement approved by the management body succinctly describing the relevant institution’s overall risk profile associated with the business strategy; that statement shall include: | ||||
| (i) key ratios and figures providing external stakeholders a comprehensive view of the institution’s management of risk, including how the risk profile of the institution interacts with the risk tolerance set by the management body; | Section 4.1 | |||
| (ii) information on intragroup transactions and transactions with related parties that may have a material impact of the risk profile of the consolidated group. | ||||
| 2. Institutions shall disclose the following information regarding governance arrangements: | Section 7 | |||
| (a) the number of directorships held by members of the management body; | ||||
| (b) the recruitment policy for the selection of members of the management body and their actual knowledge, skills and expertise; | Section 7 | |||
| (c) the policy on diversity with regard to selection of members of the management body, its objectives and any relevant targets set out in that policy, and the extent to which those objectives and targets have been achieved | Section 7 | |||
| (d) whether or not the institution has set up a separate risk committee and the number of times the risk committee has met | Section 4.1.1 | |||
| e) the description of the information flow on risk to the management body | Section 4.1.1 | |||
Table of Contents
| BBVA. PILLAR 3 2021 | ANNEXES | P. 299 |
CRR Article | Description | Pilar 3 Section | ||
| (a) the name of the institution to which this Regulation applies | Section 2.1.1 | |||
| (b) a reconciliation between the consolidated financial statements prepared in accordance with the applicable accounting framework and the consolidated financial statements prepared in accordance with the requirements on regulatory consolidation pursuant to Sections 2 and 3 of Title II of Part One; that reconciliation shall outline the differences between the accounting and regulatory scopes of consolidation and the legal entities included within the regulatory scope of consolidation where it differs from the accounting scope of consolidation; the outline of the legal entities included within the regulatory scope of consolidation shall describe the method of regulatory consolidation where it is different from the accounting consolidation method, whether those entities are fully or proportionally consolidated and whether the holdings in those legal entities are deducted from own funds | Section 2.1.2 | |||
| c) a breakdown of assets and liabilities of the consolidated financial statements prepared in accordance with the requirements on regulatory consolidation pursuant to Sections 2 and 3 of Title II of Part One, broken down by type of risks as referred to under this Part. | Section 2.1.4 | |||
| Art.436 - Disclosure of the scope of application | (d) a reconciliation identifying the main sources of differences between the carrying value amounts in the financial statements under the regulatory scope of consolidation as defined in Sections 2 and 3 of Title II of Part One, and the exposure amount used for regulatory purposes; that reconciliation shall be supplemented by qualitative information on those main sources of differences; | Section 2.1.4 | ||
| (e) for exposures from the trading book and the non-trading book that are adjusted in accordance with Article 34 and Article 105, a breakdown of the amounts of the constituent elements of an institution’s prudent valuation adjustment, by type of risks, and the total of constituent elements separately for the trading book and non-trading book positions | Section 4.3.4.2 | |||
| (f) any current or expected material practical or legal impediment to the prompt transfer of own funds or to the repayment of liabilities between the parent undertaking and its subsidiaries | N/A | |||
| (g) the aggregate amount by which the actual own funds are less than required in all subsidiaries that are not included in the consolidation, and the name or names of those subsidiaries; | N/A | |||
| (h) where applicable, the circumstances under which use is made of the derogation referred to in Article 7 or the individual consolidation method laid down in Article 9. | N/A | |||
| (a) a full reconciliation of Common Equity Tier 1 items, Additional Tier 1 items, Tier 2 items and the filters and deductions applied to own funds of the institution pursuant to Articles 32 to 36, 56, 66 and 79 with the balance sheet in the audited financial statements of the institution; | Section 3.2 | |||
| (b) a description of the main features of the Common Equity Tier 1 and Additional Tier 1 instruments and Tier 2 instruments issued by the institution | Section 3.1 | |||
| (c) the full terms and conditions of all Common Equity Tier 1, Additional Tier 1 and Tier 2 instruments | Section 3.1 | |||
| Art.437 - Disclosure of own funds | (d) a separate disclosure of the nature and amounts of the following: | |||
(i) each prudential filter applied pursuant to Articles 32 to 35; | Section 3.2 | |||
(ii) items deducted pursuant to Articles 36, 56 and 66; | ||||
(iii) items not deducted pursuant to Articles 47, 48, 56, 66 and 79 | ||||
| (e) a description of all restrictions applied to the calculation of own funds in accordance with this Regulation and the instruments, prudential filters and deductions to which those restrictions apply | Section 3.1 | |||
| (f) a comprehensive explanation of the basis on which capital ratios are calculated where those capital ratios are calculated by using elements of own funds determined on a basis other than the basis laid down in this Regulation. | N/A | |||
| a) the composition of their own funds and eligible liabilities, their maturity and their main features; | N/A | |||
| (b) the ranking of eligible liabilities in the creditor hierarchy; | N/A | |||
| Art.437a - Disclosure of own funds and eligible liabilities | (c) the total amount of each issuance of eligible liabilities instruments referred to in Article 72b and the amount of those issuances that is included in eligible liabilities items within the limits specified in Article 72b(3) and (4); | N/A | ||
| (d) the total amount of excluded liabilities referred to in Article 72a(2). | N/A | |||
Table of Contents
| BBVA. PILLAR 3 2021 | ANNEXES | P. 300 |
CRR Article | Description | Pilar 3 Section | ||
| (a) a summary of their approach to assessing the adequacy of their internal capital to support current and future activities; | Section 3.5 | |||
| (b) the amount of the additional own funds requirements based on the supervisory review process as referred to in point (a) of Article 104(1) of Directive 2013/36/EU and its composition in terms of Common Equity Tier 1, additional Tier 1 and Tier 2 instruments | Section 3.1 | |||
| (c) upon demand from the relevant competent authority, the result of the institution’s internal capital adequacy assessment process | Section 3.5 | |||
| (d) the total risk-weighted exposure amount and the corresponding total own funds requirement determined in accordance with Article 92, to be broken down by the different risk categories set out in Part Three and, where applicable, an explanation of the effect on the calculation of own funds and risk-weighted exposure amounts that results from applying capital floors and not deducting items from own funds | Section 3.3.1 | |||
| Art.438 - Disclosure of own funds requirements and risk-weighted exposure amounts | (e) the on- and off-balance-sheet exposures, the risk-weighted exposure amounts and associated expected losses for each category of specialised lending referred to in Table 1 of Article 153(5) and the on- and off-balancesheet exposures and risk-weighted exposure amounts for the categories of equity exposures set out in Article 155(2) | Section 4.2.5.4 | ||
| (f) the exposure value and the risk-weighted exposure amount of own funds instruments held in any insurance undertaking, reinsurance undertaking or insurance holding company that the institutions do not deduct from their own funds in accordance with Article 49 when calculating their capital requirements on an individual, sub-consolidated and consolidated basis | Section 3.2 | |||
| (g) the supplementary own funds requirement and the capital adequacy ratio of the financial conglomerate calculated in accordance with Article 6 of Directive 2002/87/EC and Annex I to that Directive where method 1 or 2 set out in that Annex is applied | Section 3.2 | |||
| (h) the variations in the risk-weighted exposure amounts of the current disclosure period compared to the immediately preceding disclosure period that result from the use of internal models, including an outline of the key drivers explaining those variations. | Section 4.2.5.2 | |||
Table of Contents
| BBVA. PILLAR 3 2021 | ANNEXES | P. 301 |
CRR Article | Description | Pilar 3 Section | ||
| (a) a description of the methodology used to assign internal capital and credit limits for counterparty credit exposures, including the methods to assign those limits to exposures to central counterparties; | Section 4.2.6.1.1 | |||
| (b) a description of policies related to guarantees and other credit risk mitigants, such as the policies for securing collateral and establishing credit reserves. | Section 4.2.6.1.2 | |||
| c) a description of policies with respect to General Wrong-Way risk and Specific Wrong-Way risk as defined in Article 291 | Section 4.2.6.1.3 | |||
| (d) the amount of collateral the institution would have to provide if its credit rating was downgraded | Section 4.2.6.1.4 | |||
| (e) the amount of segregated and unsegregated collateral received and posted per type of collateral, further broken down between collateral used for derivatives and securities financing transactions. | Section 4.2.6.2.3 | |||
| (f) for derivative transactions, the exposure values before and after the effect of the credit risk mitigation as determined under the methods set out in Sections 3 to 6 of Chapter 6 of Title II of Part Three, whichever method is applicable, and the associated risk exposure amounts broken down by applicable method. | Section 4.2.6.2 | |||
| (g) for securities financing transactions, the exposure values before and after the effect of the credit risk mitigation as determined under the methods set out in Chapters 4 and 6 of Title II of Part Three, whichever method is used, and the associated risk exposure amounts broken down by applicable method. | Section 4.2.6.2 | |||
| Art.439 - Disclosure of exposures to counterparty credit risk | (h) the exposure values after credit risk mitigation effects and the associated risk exposures for credit valuation adjustment capital charge, separately for each method as set out in Title VI of Part Three; | Section 4.2.6.2 | ||
| (i) the exposure value to central counterparties and the associated risk exposures within the scope of Section 9 of Chapter 6 of Title II of Part Three, separately for qualifying and non-qualifying central counterparties, and broken down by types of exposures; | Section 4.2.6.4 | |||
| (j) the notional amounts and fair value of credit derivative transactions; credit derivative transactions shall be broken down by product type; within each product type, credit derivative transactions shall be broken down further by credit protection bought and credit protection sold; | Section 4.2.6.2.3 | |||
| (k) the estimate of alpha where the institution has received the permission of the competent authorities to use its own estimate of alpha in accordance with Article 284(9); | Section 4.2.6.2 | |||
| (l) separately, the disclosures included in point (e) of Article 444 and point (g) of Article 452; | Section 4.2.6.2 | |||
| Section 4.2.6.2.2 | ||||
| (m) for institutions using the methods set out in Sections 4 to 5 of Chapter 6 of Title II Part Three, the size of their on- and off-balance- sheet derivative business as calculated in accordance with Article 273a(1) or (2), as applicable. | N/A | |||
| Where the central bank of a Member State provides liquidity assistance in the form of collateral swap transactions, the competent authority may exempt institutions from the requirements in points (d) and (e) of the first subparagraph where that competent authority considers that the disclosure of the information referred to therein could reveal that emergency liquidity assistance has been provided. For those purposes, the competent authority shall set out appropriate thresholds and objective criteria. | N/A | |||
| Art.440 - Disclosure of countercyclical capital buffers | (a) the geographical distribution of the exposure amounts and risk-weighted exposure amounts of its credit exposures used as a basis for the calculation of their countercyclical capital buffer; | Section 3.1 and Annex IV | ||
| (b) the amount of their institution-specific countercyclical capital buffer. | Section 3.1 | |||
| Art.441 - Disclosure of indicators of global systemic importance | G-SIIs shall disclose, on an annual basis, the values of the indicators used for determining their score in accordance with the identification methodology referred to in Article 131 of Directive 2013/36/EU. | Annex VI | ||
Table of Contents
| BBVA. PILLAR 3 2021 | ANNEXES | P. 302 |
CRR Article | Description | Pilar 3 Section | ||
| (a) the scope and definitions that they use for accounting purposes of ‘past due’ and ‘impaired’ and the differences, if any, between the definitions of ‘past due’ and ‘default’ for accounting and regulatory purposes. | Section 4.2.2 | |||
| (b) a description of the approaches and methods adopted for determining specific and general credit risk adjustments. | Section 4.2.2 | |||
| (c) information on the amount and quality of performing, non-performing and forborne exposures for loans, debt securities and off- balance-sheet exposures, including their related accumulated impairment, provisions and negative fair value changes due to credit risk and amounts of collateral and financial guarantees received. | Section 4.2.3.2 | |||
| Art.442 - Institutions shall disclose the following information regarding the institution’s exposure to credit risk and dilution risk | (d) an ageing analysis of accounting past due exposures. | Section 4.2.3.2 | ||
| (e) the gross carrying amounts of both defaulted and non-defaulted exposures, the accumulated specific and general credit risk adjustments, the accumulated write-offs taken against those exposures and the net carrying amounts and their distribution by geographical area and industry type and for loans, debt securities and offbalance-sheet exposures | Section 4.2.3.2 | |||
| (f) any changes in the gross amount of defaulted on- and off-balance-sheet exposures, including, as a minimum, information on the opening and closing balances of those exposures, the gross amount of any of those exposures reverted to non-defaulted status or subject to a write-off. | Section 4.2.3.2 | |||
| (g) the breakdown of loans and debt securities by residual maturity. | Section 4.2.3.2 | |||
| Art.443 - Disclosure of encumbered and unencumbered assets. | Institutions shall disclose information concerning their encumbered and unencumbered assets. For those purposes, institutions shall use the carrying amount per exposure class broken down by asset quality and the total amount of the carrying amount that is encumbered and unencumbered. Disclosure of information on encumbered and unencumbered assets shall not reveal emergency liquidity assistance provided by central banks. | Section 4.5.7 | ||
| a) the names of the nominated ECAIs and ECAs and the reasons for any changes in those nominations over the disclosure period; | Section 4.2.4.1 | |||
| (b) the exposure classes for which each ECAI or ECA is used; | Section 4.2.4.1 | |||
| (c) a description of the process used to transfer the issuer and issue credit ratings onto items not included in the trading book; | Section 4.2.4.1 | |||
| Art.444 - Disclosure of the use of the Standardised Approach | (d) the association of the external rating of each nominated ECAI or ECA with the risk weights that correspond to the credit quality steps as set out in Chapter 2 of Title II of Part Three, taking into account that it is not necessary to disclose that information where the institutions comply with the standard association published by EBA; | Section 4.2.4.1 | ||
| (e) the exposure values and the exposure values after credit risk mitigation associated with each credit quality step as set out in Chapter 2 of Title II of Part Three, by exposure class, as well as the exposure values deducted from own funds. | Section 4.2.4.3 Section 4.2.6.2 | |||
| Art.445 - Disclosure of exposure to market risk | Institutions calculating their own funds requirements in accordance with points (b) and (c) of Article 92(3) shall disclose those requirements separately for each risk referred to in those points. In addition, own funds requirements for the specific interest rate risk of securitisation positions shall be disclosed separately. | Section 4.3.3 | ||
| (a) the approaches for the assessment of own funds requirements for operation risk that the institution qualifies for. | Section 4.6.4 | |||
| Art.446 - Disclosure of operational risk management | (b) where the institution makes use of it, a description of the methodology set out in Article 312(2), which shall include a discussion of the relevant internal and external factors being considered in the institution’s advanced measurement approach; | N/A | ||
| (c) in the case of partial use, the scope and coverage of the different methodologies used. | N/A | |||
Table of Contents
| BBVA. PILLAR 3 2021 | ANNEXES | P. 303 |
CRR Article | Description | Pilar 3 Section | ||
| (a) the composition of their own funds and their own funds requirements as calculated in accordance with Article 92. | Executive summary | |||
| Section 3.1 | ||||
| (b) the total risk exposure amount as calculated in accordance with Article 92(3); | Executive summary | |||
| (c) where applicable, the amount and composition of additional own funds which the institutions are required to hold in accordance with point (a) of Article 104(1) of Directive 2013/36/EU. | Section 3.1 | |||
| (d) their combined buffer requirement which the institutions are required to hold in accordance with Chapter 4 of Title VII of Directive 2013/36/EU. | Executive summary | |||
| Executive summary | ||||
| (e) their leverage ratio and the total exposure measure as calculated in accordance with Article 429. | Section 5.1 | |||
| (f) the following information in relation to their liquidity coverage ratio as calculated in accordance with the delegated act referred to in Article 460(1): | ||||
| Art.447 - Disclosure of key metrics | (i) the average or averages, as applicable, of their liquidity coverage ratio based on end-of-the-month observations over the preceding 12 months for each quarter of the relevant disclosure period; | |||
(ii) the average or averages, as applicable, of total liquid assets, after applying the relevant haircuts, included in the liquidity buffer pursuant to the delegated act referred to in Article 460(1), based on end-of-themonth observations over the preceding 12 months for each quarter of the relevant disclosure period; | Section 4.5.5 | |||
(iii) the averages of their liquidity outflows, inflows and net liquidity outflows as calculated pursuant to the delegated act referred to in Article 460(1), based on end-of-the-month observations over the preceding 12 months for each quarter of the relevant disclosure period; | ||||
| (g) the following information in relation to their net stable funding requirement as calculated in accordance with Title IV of Part Six: | ||||
(i) the net stable funding ratio at the end of each quarter of the relevant disclosure period; | Executive summary | |||
(ii) the available stable funding at the end of each quarter of the relevant disclosure period; | Section 4.5.6 | |||
(iii) the required stable funding at the end of each quarter of the relevant disclosure period; | ||||
| (h) their own funds and eligible liabilities ratios and their components, numerator and denominator, as calculated in accordance with Articles 92a and 92b and broken down at the level of each resolution group, where applicable. | N/A | |||
| (a) the changes in the economic value of equity calculated under the six supervisory shock scenarios referred to in Article 98(5) of Directive 2013/36/EU for the current and previous disclosure periods. | Section 4.4.1 | |||
| (b) the changes in the net interest income calculated under the two supervisory shock scenarios referred to in Article 98(5) of Directive 2013/36/EU for the current and previous disclosure periods. | Section 4.4.1 | |||
| (c) a description of key modelling and parametric assumptions, other than those referred to in points (b) and © of Article 98(5a) of Directive 2013/36/EU used to calculate changes in the economic value of equity and in the net interest income required under points (a) and (b) of this paragraph. | Section 4.4.1 | |||
| (d) an explanation of the significance of the risk measures disclosed under points (a) and (b) of this paragraph and of any significant variations of those risk measures since the previous disclosure reference date. | Section 4.4.1 | |||
| e) the description of how institutions define, measure, mitigate and control the interest rate risk of their nontrading book activities for the purposes of the competent authorities’ review in accordance with Article 84 of Directive 2013/36/EU, including: | ||||
| Art.448 - Disclosure of exposures to interest rate risk on positions not held in the trading book | (i) a description of the specific risk measures that the institutions use to evaluate changes in their economic value of equity and in their net interest income; | |||
| (ii) a description of the key modelling and parametric assumptions used in the institutions’ internal measurement systems that would differ from the common modelling and parametric assumptions referred to in Article 98(5a) of Directive 2013/36/EU for the purpose of calculating changes to the economic value of equity and to the net interest income, including the rationale for those differences; | Section 4.4.1 | |||
| (iii) a description of the interest rate shock scenarios that institutions use to estimate the interest rate risk; | ||||
| (iv) the recognition of the effect of hedges against those interest rate risks, including internal hedges that meet the requirements laid down in Article 106(3); | ||||
| (v) an outline of how often the evaluation of the interest rate risk occurs. | ||||
| (f) the description of the overall risk management and mitigation strategies for those risks. | Section 4.4.1 | |||
| (g) average and longest repricing maturity assigned to non-maturity deposits. | Section 4.4.1 | |||
| 2. By way of derogation from paragraph 1 of this Article, the requirements set out in points (c) and (e)(i) to (e) | ||||
| (iv) of paragraph 1 of this Article shall not apply to institutions that use the standardised methodology or the simplified standardised methodology referred to in Article 84(1) of Directive 2013/36/EU. | Section 4.4.1 | |||
Table of Contents
| BBVA. PILLAR 3 2021 | ANNEXES | P. 304 |
CRR Article | Description | Pilar 3 Section | ||
| (a) a description of their securitisation and re-securitisation activities, including their risk management and investment objectives in connection with those activities, their role in securitisation and re-securitisation transactions, whether they use the simple, transparent and standardised securitisation (STS) as defined in point (10) of Article 242, and the extent to which they use securitisation transactions to transfer the credit risk of the securitised exposures to third parties with, where applicable, a separate description of their synthetic securitisation risk transfer policy; | Section 4.2.7.1.1 | |||
| (b) the type of risks they are exposed to in their securitisation and re-securitisation activities by level of seniority of the relevant securitisation positions providing a distinction between STS and non-STS positions and: | ||||
| (i) the risk retained in own-originated transactions; | Section 4.2.7.2 | |||
| (ii) the risk incurred in relation to transactions originated by third parties; | ||||
| (c) their approaches for calculating the risk-weighted exposure amounts that they apply to their securitisation activities, including the types of securitisation positions to which each approach applies and with a distinction between STS and non-STS positions. | Section 4.2.7.1.3 | |||
| (d) a list of SSPEs falling into any of the following categories, with a description of their types of exposures to those SSPEs, including derivative contracts: | ||||
| (i) SSPEs which acquire exposures originated by the institutions; | ||||
| (ii) SSPEs sponsored by the institutions; | Section 4.2.7.2 | |||
| (iii) SSPEs and other legal entities for which the institutions provide securitisation-related services, such as advisory, asset servicing or management services; | ||||
| (iv) SSPEs included in the institutions’ regulatory scope of consolidation. | ||||
| (e) a list of any legal entities in relation to which the institutions have disclosed that they have provided support in accordance with Chapter 5 of Title II of Part Three. | Section 4.2.7.2 | |||
| (f) a list of legal entities affiliated with the institutions and that invest in securitisations originated by the institutions or in securitisation positions issued by SSPEs sponsored by the institutions. | Section 4.2.7.2 | |||
| Art.449 - Disclosure of exposures to securitisation positions | (g) a summary of their accounting policies for securitisation activity, including where relevant a distinction between securitisation and re-securitisation positions. | Section 4.2.7.1.4 | ||
| (h) the names of the ECAIs used for securitisations and the types of exposure for which each agency is used. | Section 4.2.4.1 | |||
| (i) where applicable, a description of the Internal Assessment Approach as set out in Chapter 5 of Title II of Part Three, including the structure of the internal assessment process and the relation between internal assessment and external ratings of the relevant ECAI disclosed in accordance with point (h), the control mechanisms for the internal assessment process including discussion of independence, accountability, and internal assessment process review, the exposure types to which the internal assessment process is applied and the stress factors used for determining credit enhancement levels. | Section 4.2.7.3 | |||
| (j) separately for the trading book and the non-trading book, the carrying amount of securitisation exposures, including information on whether institutions have transferred significant credit risk in accordance with Articles 244 and 245, for which institutions act as originator, sponsor or investor, separately for traditional and synthetic securitisations, and for STS and non-STS transactions and broken down by type of securitisation exposures. | Section 4.2.7.2 | |||
| (k) for the non-trading book activities, the following information: | ||||
| (i) the aggregate amount of securitisation positions where institutions act as originator or sponsor and the associated risk-weighted assets and capital requirements by regulatory approaches, including exposures deducted from own funds or risk weighted at 1 250 %, broken down between traditional and synthetic securitisations and between securitisation and re-securitisation exposures, separately for STS and non-STS positions, and further broken down into a meaningful number of risk-weight or capital requirement bands and by approach used to calculate the capital requirements | Section 4.2.7.3.2 | |||
| (ii) the aggregate amount of securitisation positions where institutions act as investor and the associated riskweighted assets and capital requirements by regulatory approaches, including exposures deducted from own funds or risk weighted at 1 250 %, broken down between traditional and synthetic securitisations, securitisation and re-securitisation positions, and STS and non-STS positions, and further broken down into a meaningful number of risk weight or capital requirement bands and by approach used to calculate the capital requirements | Section 4.2.7.3.2 | |||
| (l) for exposures securitised by the institution, the amount of exposures in default and the amount of the specific credit risk adjustments made by the institution during the current period, both broken down by exposure type. | Section 4.2.7.3.3 | |||
Table of Contents
| BBVA. PILLAR 3 2021 | ANNEXES | P. 305 |
CRR Article | Description | Pilar 3 Section | ||
| Art.449 a - Disclosure of environmental, social and governance risks (ESG risks) | From 28 June 2022, large institutions which have issued securities that are admitted to trading on a regulated market of any Member State, as defined in point (21) of Article 4(1) of Directive 2014/65/EU, shall disclose information on ESG risks, including physical risks and transition risks, as defined in the report referred to in Article 98(8) of Directive 2013/36/EU. The information referred to in the first paragraph shall be disclosed on an annual basis for the first year and biannually thereafter. | N/A | ||
| (a) information concerning the decision-making process used for determining the remuneration policy, as well as the number of meetings held by the main body overseeing remuneration during the financial year, including, where applicable, information about the composition and the mandate of a remuneration committee, the external consultant whose services have been used for the determination of the remuneration policy and the role of the relevant stakeholders. | Section 6.1 | |||
| (b) information about the link between pay of the staff and their performance; | Section 6.4 | |||
| (c) the most important design characteristics of the remuneration system, including information on the criteria used for performance measurement and risk adjustment, deferral policy and vesting criteria; | Section 6.3 | |||
| (d) the ratios between fixed and variable remuneration set in accordance with point (g) of Article 94(1) of Directive 2013/36/EU. | Section 6.7 | |||
| (e) information on the performance criteria on which the entitlement to shares, options or variable components of remuneration is based. | Section 6.5 | |||
| (f) the main parameters and rationale for any variable component scheme and any other non-cash benefits. | Section 6.6 | |||
| (g) aggregate quantitative information on remuneration, broken down by business area. | Section 6.8 | |||
| (h) aggregate quantitative information on remuneration, broken down by senior management and members of staff whose professional activities have a material impact on the risk profile of the institutions, indicating the following: | Detailed in the following sections | |||
| (i) the amounts of remuneration awarded for the financial year, split into fixed remuneration including a description of the fixed components, and variable remuneration, and the number of beneficiaries. | Section 6.8 | |||
| (ii) the amounts and forms of awarded variable remuneration, split into cash, shares, share-linked instruments and other types separately for the part paid upfront and the deferred part. | Section 6.8 | |||
| (iii) the amounts of deferred remuneration awarded for previous performance periods, split into the amount due to vest in the financial year and the amount due to vest in subsequent years. | Section 6.8 | |||
| Art.450 - Disclosure of remuneration policy | (iv) the amount of deferred remuneration due to vest in the financial year that is paid out during the financial year, and that is reduced through performance adjustments. | Section 6.8 | ||
| (v) the guaranteed variable remuneration awards during the financial year, and the number of beneficiaries of those awards. | Section 6.8 | |||
| (vi) the severance payments awarded in previous periods, that have been paid out during the financial year. | Section 6.8 | |||
| (vii) the amounts of severance payments awarded during the financial year, split into paid upfront and deferred, the number of beneficiaries of those payments and highest payment that has been awarded to a single person. | Section 6.8 | |||
| (i) the number of individuals that have been remunerated EUR 1 million or more per financial year, with the remuneration between EUR 1 million and EUR 5 million broken down into pay bands of EUR 500 000 and with the remuneration of EUR 5 million and above broken down into pay bands of EUR 1 million. | Section 6.8 | |||
| (j) upon demand from the relevant Member State or competent authority, the total remuneration for each member of the management body or senior management. | Section 6.8 | |||
| (k) information on whether the institution benefits from a derogation laid down in Article 94(3) of Directive 2013/36/EU. For the purposes of point (k) of the first subparagraph of this paragraph, institutions that benefit from such a derogation shall indicate whether they benefit from that derogation on the basis of point (a) or (b) of Article 94(3) of Directive 2013/36/EU. They shall also indicate for which of the remuneration principles they apply the derogation(s), the number of staff members that benefit from the derogation(s) and their total remuneration, split into fixed and variable remuneration. | Section 6.8 | |||
| 2. For large institutions, the quantitative information on the remuneration of institutions’ collective management body referred to in this Article shall also be made available to the public, differentiating between executive and non-executive members. Institutions shall comply with the requirements set out in this Article in a manner that is appropriate to their size, internal organisation and the nature, scope and complexity of their activities and without prejudice to Regulation (EU) 2016/679 of the European Parliament and of the Council. | Section 6.8 | |||
Table of Contents
| BBVA. PILLAR 3 2021 | ANNEXES | P. 306 |
CRR Article | Description | Pilar 3 Section | ||
| (a) the leverage ratio and how the institutions apply Article 499(2). | Section 5.1 | |||
| (b) a breakdown of the total exposure measure referred to in Article 429(4), as well as a reconciliation of the total exposure measure with the relevant information disclosed in published financial statements. | Section 5.1 | |||
| (c) where applicable, the amount of exposures calculated in accordance with Articles 429(8) and 429a(1) and the adjusted leverage ratio calculated in accordance with Article 429a(7). | Annex V | |||
| Art.451 - Disclosure of the leverage ratio. | (d) a description of the processes used to manage the risk of excessive leverage. | Section 5.3 | ||
| (e) a description of the factors that had an impact on the leverage ratio during the period to which the disclosed leverage ratio refers. | Section 5.2 | |||
| 2. Public development credit institutions as defined in Article 429a(2) shall disclose the leverage ratio without the adjustment to the total exposure measure determined in accordance with point (d) of the first subparagraph of Article 429a(1). | Annex V | |||
| 3. In addition to points (a) and (b) of paragraph 1 of this Article, large institutions shall disclose the leverage ratio and the breakdown of the total exposure measure referred to in Article 429(4) based on averages calculated in accordance with the implementing act referred to in Article 430(7). | Annex V | |||
| (a) the average or averages, as applicable, of their liquidity coverage ratio based on end-of-the-month observations over the preceding 12 months for each quarter of the relevant disclosure period; | Section 4.5.5 | |||
| (b) the average or averages, as applicable, of total liquid assets, after applying the relevant haircuts, included in the liquidity buffer pursuant to the delegated act referred to in Article 460(1), based on end-of-the-month observations over the preceding 12 months for each quarter of the relevant disclosure period, and a description of the composition of that liquidity buffer. | Section 4.5.5 | |||
| Art 451a - Disclosure of liquidity requirements | (c) the averages of their liquidity outflows, inflows and net liquidity outflows as calculated in accordance with the delegated act referred to in Article 460(1), based on end-of-the-month observations over the preceding 12 months for each quarter of the relevant disclosure period and the description of their omposition. | Section 4.5.5 | ||
| (a) quarter-end figures of their net stable funding ratio calculated in accordance with Chapter 2 of Title IV of Part Six for each quarter of the relevant disclosure period. | Section 4.5.6 | |||
| (b) an overview of the amount of available stable funding calculated in accordance with Chapter 3 of Title IV of Part Six. | Section 4.5.6 | |||
| (c) an overview of the amount of required stable funding calculated in accordance with Chapter 4 of Title IV of Part Six. | Section 4.5.6 | |||
| 4. Institutions shall disclose the arrangements, systems, processes and strategies put in place to identify, measure, manage and monitor their liquidity risk in accordance with Article 86 of Directive 2013/36/EU. | Section 4.5.1 Section 4.5.2 | |||
Table of Contents
| BBVA. PILLAR 3 2021 | ANNEXES | P. 307 |
CRR Article | Description | Pilar 3 Section | ||
| (a) the competent authority’s permission of the approach or approved transition. | Section 4.2.5.1.1 | |||
| (b) for each exposure class referred to in Article 147, the percentage of the total exposure value of each class subject to the Standardised Approach laid down in Chapter 2 of Title II of Part Three or to the IRB Approach laid down in Chapter 3 of Title II of Part Three, as well as the part of each exposure class subject to a roll-out plan; where institutions have received permission to use own LGDs and conversion factors for the calculation of risk- weighted exposure amounts, they shall disclose separately the percentage of the total exposure value of each exposure class subject to that permission. | Section 4.2.5.1.1 | |||
| (c) the control mechanisms for rating systems at the different stages of model development, controls and changes, which shall include information on: | ||||
| (i) the relationship between the risk management function and the internal audit function; | ||||
| (ii) the rating system review; | Section 4.2.5.1.5 | |||
| (iii) the procedure to ensure the independence of the function in charge of reviewing the models from the functions responsible for the development of the models; | ||||
| (iv) the procedure to ensure the accountability of the functions in charge of developing and reviewing the models; | ||||
| (d) the role of the functions involved in the development, approval and subsequent changes of the credit risk models. | Section 4.2.5.1.5 | |||
| (e) the scope and main content of the reporting related to credit risk models. | Section 4.2.5.1.5 | |||
| (f) a description of the internal ratings process by exposure class, including the number of key models used with respect to each portfolio and a brief discussion of the main differences between the models within the same portfolio, covering: | ||||
| Art.452 - Disclosure of the use of the IRB Approach to credit risk | (i) the definitions, methods and data for estimation and validation of PD, which shall include information on how PDs are estimated for low default portfolios, whether there are regulatory floors and the drivers for differences observed between PD and actual default rates at least for the last three periods; | Section 4.2.5.1.7 | ||
| (ii) where applicable, the definitions, methods and data for estimation and validation of LGD, such as methods to calculate downturn LGD, how LGDs are estimated for low default portfolio and the time lapse between the default event and the closure of the exposure; | ||||
| (iii) where applicable, the definitions, methods and data for estimation and validation of conversion factors, including assumptions employed in the derivation of those variables. | ||||
| (g) as applicable, the following information in relation to each exposure class referred to in Article 147: | ||||
| (i) their gross on-balance-sheet exposure; | ||||
| (ii) their off-balance-sheet exposure values prior to the relevant conversion factor; | ||||
| (iii) their exposure after applying the relevant conversion factor and credit risk mitigation; | ||||
| (iv) any model, parameter or input relevant for the understanding of the risk weighting and the resulting risk exposure amounts disclosed across a sufficient number of obligor grades (including default) to allow for a meaningful differentiation of credit risk; | Section 4.2.5.2 | |||
| (v) separately for those exposure classes in relation to which institutions have received permission to use own LGDs and conversion factors for the calculation of risk-weighted exposure amounts, and for exposures for which the institutions do not use such estimates, the values referred to in points (i) to (iv) subject to that permission; | ||||
| (h) institutions’ estimates of PDs against the actual default rate for each exposure class over a longer period, with separate disclosure of the PD range, the external rating equivalent, the weighted average and arithmetic average PD, the number of obligors at the end of the previous year and of the year under review, the number of defaulted obligors, including the new defaulted obligors, and the annual average historical default rate. | Section 4.2.5.3 | |||
Table of Contents
| BBVA. PILLAR 3 2021 | ANNEXES | P. 308 |
CRR Article | Description | Pilar 3 Section | ||
| (a) the core features of the policies and processes for on- and off-balance-sheet netting and an indication of the extent to which institutions make use of balance sheet netting. | Section 4.2.6.1.2 | |||
| (b) the core features of the policies and processes for eligible collateral evaluation and management. | Section 4.2.6.1.2 | |||
| (c) a description of the main types of collateral taken by the institution to mitigate credit risk. | Section 4.2.9.2.2 | |||
| (d) for guarantees and credit derivatives used as credit protection, the main types of guarantor and credit derivative counterparty and their creditworthiness used for the purpose of reducing capital requirements, excluding those used as part of synthetic securitisation structures. | Section 4.2.9.3 | |||
| (e) information about market or credit risk concentrations within the credit risk mitigation taken. | Section 4.2.9.4 | |||
| Art.453 - Disclosure of the use of credit risk mitigation techniques | (f) for institutions calculating risk-weighted exposure amounts under the Standardised Approach or the IRB Approach, the total exposure value not covered by any eligible credit protection and the total exposure value covered by eligible credit protection after applying volatility adjustments; the disclosure set out in this point shall be made separately for loans and debt securities and including a breakdown of defaulted exposures. | Section 4.2.9.3 | ||
| (g) the corresponding conversion factor and the credit risk mitigation associated with the exposure and the incidence of credit risk mitigation techniques with and without substitution effect. | Section 4.2.9.3 | |||
| (h) for institutions calculating risk-weighted exposure amounts under the Standardised Approach, the on- and off-balance-sheet exposure value by exposure class before and after the application of conversion factors and any associated credit risk mitigation. | Section 4.2.3.3 | |||
| (i) for institutions calculating risk-weighted exposure amounts under the Standardised Approach, the riskweighted exposure amount and the ratio between that risk-weighted exposure amount and the exposure value after applying the corresponding conversion factor and the credit risk mitigation associated with the exposure; the disclosure set out in this point shall be made separately for each exposure class. | Section 4.2.3.3 | |||
| (j) for institutions calculating risk-weighted exposure amounts under the IRB Approach, the risk-weighted exposure amount before and after recognition of the credit risk mitigation impact of credit derivatives; where institutions have received permission to use own LGDs and conversion factors for the calculation of riskweighted exposure amounts, they shall make the disclosure set out in this point separately for the exposure classes subject to that permission. | Section 4.2.9.3 | |||
| Art.454 - Disclosure of the use of the Advanced Measurement Approaches to operational risk | The institutions using the Advanced Measurement Approaches set out in Articles 321 to 324 for the calculation of their own funds requirements for operational risk shall disclose a description of their use of insurance and other risk-transfer mechanisms for the purpose of mitigating that risk. . | Section 4.6.4 | ||
| (a) for each sub-portfolio covered: | ||||
| (i) the characteristics of the models used; | ||||
| (ii) where applicable, for the internal models for incremental default and migration risk and for correlation trading, the methodologies used and the risks measured through the use of an internal model including a description of the approach used by the institution to determine liquidity horizons, the methodologies used to achieve a capital assessment that is consistent with the required soundness standard and the approaches used in the validation of the model; | Section 4.3.4. | |||
| (iii) a description of stress testing applied to the sub-portfolio; | ||||
| (iv) a description of the approaches used for back-testing and validating the accuracy and consistency of the internal models and modelling processes; | ||||
| (b) the scope of permission by the competent authority. | Section 4.3.1 | |||
| Art.455 - Use of internal market risk models | (c) a description of the extent and methodologies for compliance with the requirements set out in Articles 104 and 105. | Section 4.3.2 | ||
| (d) the highest, the lowest and the mean of the following: | ||||
| (i) the daily value-at-risk measures over the reporting period and at the end of the reporting period; | ||||
| (ii) the stressed value-at-risk measures over the reporting period and at the end of the reporting period; | Section 4.3.4.2.2 | |||
| (iii) the risk numbers for incremental default and migration risk and for the specific risk of the correlation trading portfolio over the reporting period and at the end of the reporting period. | ||||
| (e) the elements of the own funds requirement as specified in Article 364. | Section 4.3.4.2.2 | |||
| (f) the weighted average liquidity horizon for each sub-portfolio covered by the internal models for incremental default and migration risk and for correlation trading. | Section 4.3.4.2 | |||
| (g) a comparison of the daily end-of-day value-at-risk measures to the one-day changes of the portfolio’s value by the end of the subsequent business day together with an analysis of any important overshooting during the reporting period. | Section 4.3.4.2.4 | |||
Table of Contents
| BBVA. PILLAR 3 2021 | GLOSSARY OF TERMS | P. 309 |
ACRONYM | DESCRIPTION | |
| ALM (Asset - Liability Management) | Mechanism for managing structural balance-sheet risk due to potential imbalances between assets and liabilities due to different types of factors (interest rate, exchange rate, liquidity, etc.) | |
| AMA | Advanced method for calculating the own funds requirements for operational risk | |
| AT1 (Additional Tier 1) | Additional Tier 1 capital consisting of hybrid instruments, mainly CoCos and preferred shares | |
| Basel III | Package of proposals for reform of banking regulation, published as of December 16, 2010 and with a period of gradual implementation | |
| BCBS (Basel Committee on Banking Supervision) | Basel Committee on Banking Supervision. International cooperation forum on banking supervision to increase the quality of banking supervision worldwide | |
| CCyB (Countercyclical Buffer) | Countercyclical buffer, the part of a set of macroprudential instruments designed to help counteract the procyclicality of the financial system | |
| CCF (Credit Conversion Factor) | Credit conversion factor. The ratio between the current available amount of a commitment that could be used and would therefore be outstanding at the time of default, and the current available amount of the commitment | |
| CCP (Central Counterparty Clearing House) | An entity that liaises between counterparties, acting as a buyer when dealing with sellers and as a seller when dealing with buyers | |
| CDS (Credit Default Swap) | Financial derivative between a beneficiary and a guarantor through which the beneficiary pays the guarantor a premium in exchange for receiving protection from possible credit events over a period of time | |
| CET1 (Common Equity Tier 1) | Common Equity Tier 1: the entity’s capital of the highest quality (see paragraph 2.1) | |
| Counterparty Credit Risk | The credit risk corresponding to derivative instruments, repurchase and reverse repurchase transactions, securities or commodities lending or borrowing transactions and deferred settlement transactions | |
| CoCo (Contingent Convertible) | Convertible contingent bond. Hybrid issues with debt and equity elements convertible into shares | |
| Credit Risk | Credit risk is based on the possibility that one party to the financial instrument’s contract will fail to meet its contractual obligations on the grounds of insolvency or inability to pay and will cause a financial loss for the other party | |
| CRM (Credit Risk Mitigation) | Credit Risk Mitigation: a technique used by the institution to reduce the credit risk associated with one or more exposures that the institution still maintains | |
| CRR / CRD IV | Solvency regulation on prudential requirements of credit institutions and investment firms (EU Regulation 575/2013) | |
| CVA (Credit Valuation Adjustment) | Valuation adjustments for counterparty credit risk | |
| DLGD (Downturn Loss Given Default) | Severity in a period of stress in the economic cycle | |
| D-SIB (Domestic Systemically Important Bank) | Domestic Systemically Important Bank | |
| EAD (Exposure at default) | Maximum loss at the time of the counterparty entering into default | |
| EBA (European Banking Authority) | European Banking Authority. Independent institution responsible for promoting the stability of the financial system, the transparency of financial markets and products and the protection of depositors and investors | |
| EC (Economic Capital) | The amount of capital considered necessary to cover unexpected losses if actual losses are greater than expected losses | |
| ECB (European Central Bank) | Central bank of the countries of the European Union that have the euro as their currency | |
| ECAI (External Credit Assessment Institutions) | External Credit Assessment Agency designated by the entity | |
| EL (Expected Loss) | The ratio between the amount expected to be lost in an exposure, due to potential non-payment by a counterparty or dilution over a period of one year, and the amount due at the time of non-payment | |
| ERBA (External Rating Base Approach) | Methodology for estimating RWAs of securitisations from external ratings | |
| Environmental, social and governance (ESG) | Environmental, social and good corporate governance criteria, the main objective of which is to contribute to sustainable development | |
| FRTB (Fundamental Review of the Trading Book) | A set of reforms proposed by the BCBS on the market risk framework, with the aim of improving the design and consistency of market risk capital standards | |
| FSB (Financial Stability Board) | Financial Stability Board. An international body that pursues the effectiveness and stability of the international financial system, monitoring it and publishing recommendations | |
| FTD (First to default) | Derivative by which both parties negotiate protection against the first default by any of the entities that form part of the basket | |
| GRM (Global Risk Management) | Global Risk Management | |
| GRMC (Global Risk Management Committee) | Global Risk Management Committee | |
| G-SIBs (Global Systemically Important Banks) | Financial institutions that, because of their large size, market importance and interconnectedness, could cause a serious crisis in the international financial system in the event of economic problems | |
| IAA (Internal Assessment Approach) | Internal evaluation method for the calculation of securitisation exposures in the banking book | |
| ICAAP (Internal Capital Adequacy Assessment Process) | Internal Capital Adequacy Assessment Process | |
Table of Contents
| BBVA. PILLAR 3 2021 | GLOSSARY OF TERMS | P. 310 |
ACRONYM | DESCRIPTION | |
| IFRS 9 (International Financial Reporting Standards – Financial Instruments) | International Financial Reporting Standards for Financial Instruments which entered into force on January 1, 2018, replacing IAS 39 in relation to the classification and valuation of financial assets and liabilities, the impairment of financial assets and the accounting of hedges | |
| ILAAP (Internal Liquidity Adequacy Assessment Process) | Internal Liquidity Adequacy Assessment Process | |
| IMA (Internal Model Approach) | Internal model approach for calculating exposure due to market risk | |
| IMM (Internal Model Method) | Internal model method for calculating exposure due to counterparty risk | |
| IRB (Internal Rating-based approach) | Internal model method for calculating exposure due to credit risk, based on internal ratings. This method can be broken down into two types, depending on the estimations set by the Supervisor or the own ones: FIRB (Foundation IRB) and AIRB (Advanced IRB) | |
| IRBA (Internal Risk Base Approach) | Methodology for estimating RWAs of securitisations from internal ratings | |
| IRC (Incremental Risk Capital) | Charge applied to the market risk exposure calculated by the internal method that quantifies the risk not captured by the VaR model, specifically in migration and default events | |
| LCR (Liquidity Coverage Ratio) | Liquidity coverage ratio | |
| LDP (Low Default Portfolios) | Low default portfolios | |
| LGD (Loss Given Default) | Severity or amount to be lost in the event of non-payment | |
| LGD BE (Loss Given Default Best Estimate) | “Actual” loss from default portfolio | |
| Liquidity Risk | Risk of an entity having difficulties in duly meeting its payment commitments, or where, to meet them, it has to resort to funding under burdensome terms which may harm the entity’s image or reputation. | |
| LMUs (Liquidity Management Units) | Group entities with financial self-sufficiency created with the aim of preventing and limiting liquidity risk, preventing it from spreading in a crisis that could affect only one or more of these Entities | |
| LR (Leverage Ratio) | Leverage ratio: a measure that relates a company’s indebtedness and assets, calculated as level 1 capital divided by the entity’s total exposure | |
| LRLGD (Long Run Loss Given Default) | Long-term severity (loss given default) | |
| LtSCD (Loan to Stable Customer Deposits) | Ratio that measures the relationship between net credit investment and stable customer resources | |
| Market Risk | Risk due to the possibility that there may be losses in the value of positions held due to movements in the market variables that affect the valuation of financial products and assets in trading activity | |
| MDA (Maximum Distributable Amount) | Trigger by which the ECB restricts the capacity to pay out dividends | |
| MREL (Minimum Required Eligible Liabilities) | Minimum requirement of own funds and eligible liabilities. New requirement faced by European banks, which aims to create a buffer of solvency that absorbs the losses of a financial entity in the event of resolution without jeopardizing taxpayers’ money. The level of this buffer is determined individually for each banking group based on their level of risk and other particular characteristics | |
| MTN (Medium Term Note) | Notes accounted as Issuances designated at fair value through P&L considered equivalent to senior issuances for liquidity | |
| NCAHS | Non-Current Assets Held for Sale | |
| NCLHS | Non-Current Liabilities Held for Sale | |
| NSFR | Net Stable Funding Ratio | |
| OE (Original Exposure) | Gross amount that the entity may lose in the event that the counterparty cannot meet its contractual payment obligations, regardless of the effect of guarantees or credit improvements or credit risk mitigation operations | |
| Operational Risk (OR) | BBVA defines operational risk (OR) as risk that may cause losses as a result of human error; inadequate or defective internal processes; inadequate conduct towards customers, in the markets or against the company; failures, interruptions or deficiencies in systems or communications; theft, loss or misuse of information, as well as deterioration of its quality; internal or external fraud including, in all cases, fraud resulting from cyber-attacks; theft or physical damage to assets or persons; legal risks; risks resulting from workforce and occupational health management; and inadequate service provided by suppliers | |
| PD (Probability of Default) | Probability of non-payment by a counterparty over a period of one year | |
| PD-TTC (PD Through the Cycle) | Probability of Default throughout the business cycle | |
| PIT (Point-In-Time) | Approach for calculating provisions under which PD and LGD parameters must be adapted at each moment in time | |
| P2G | Pillar 2 Capital Guidance | |
| P2R | Pillar 2 Capital Requirement | |
| RW (Risk Weight) | Degree of risk applied to exposures (%) | |
| RWAs (Risk-Weighted Assets) | Risk exposure of the entity weighted by a percentage derived from the applicable standard (standardised approach) or internal models | |
| SFTs | Securities financing transactions | |
| SREP (Supervisory Review and Evaluation Process) | Supervisory Review and Evaluation Process | |
| Structural Risk | This risk is divided into Structural Interest-Rate Risk (movements in market interest rates that cause changes in an entity’s net interest income and book value) and Structural Exchange-Rate Risk (exposure to variations in exchange rates originating in the Group’s foreign companies and in the provision of funds to foreign branches financed in a different currency from that of the investment) | |
Table of Contents
| BBVA. PILLAR 3 2021 | GLOSSARY OF TERMS | P. 311 |
ACRONYM | DESCRIPTION | |
| Synthetic Securitisation | A type of operation where the loan portfolio is not typically transferred to a fund; on the contrary, the credit remains in the balance sheet of the corresponding entity, but this transfers the default risk to a third party. The objective of this type of instrument is the transmission of balance risk and capital release. Normally, the assignment of risk is usually made through a derivative (CDS) or through a financial guarantee | |
| TIER I (Tier One Capital) | Capital built by instruments that are able to absorb losses when the entity is in operation. It consists of CET1 and AT1 | |
| TIER II (Tier Two Capital) | Supplementary capital consisting of instruments, mainly subordinated debt, revaluation reserves and hybrid instruments, which will absorb losses when the entity is not viable | |
| TLAC (Total Loss Absorbing Capacity) | Total loss absorption capacity: Regulatory framework approved by the FSB with the aim of ensuring that global systemically important entities (G-SIB) maintain a minimum level of eligible instruments and liabilities to ensure that in resolution procedures, and immediately thereafter, the essential functions of the entity can be maintained without jeopardizing taxpayers’ money or financial stability | |
| Traditional Securitisation | Operation through which an entity is capable of transforming a series of heterogeneous and illiquid financial assets into liquid homogeneous instruments (usually guarantees or bonds) and marketable securities, managing to transfer the risk of the assets in most cases while liquidity is preserved | |
| TRIM (Targeted Review of Internal Models) | Control model implemented by the ECB aimed at reducing inconsistencies and the variability in banks’ internal models used to calculate their risk-weighted assets | |
| VaR (Value at Risk) | A risk measurement model that provides a prediction of the maximum loss that the entity’s trading portfolios might experience as a result of market price variations over a given time horizon and for a specific confidence interval | |
Table of Contents
SIGNATURE
Pursuant to the requirements of the Securities Exchange Act of 1934, the registrant has duly caused this report to be signed on its behalf by the undersigned, thereunto duly authorized.
| Banco Bilbao Vizcaya Argentaria, S.A. | ||||||
| Date: March 14, 2022 | By: | /s/ Juan Carlos García Céspedes | ||||
| Name: Juan Carlos García Céspedes | ||||||
| Title: Authorized representative | ||||||