UNITED STATES SECURITIES AND EXCHANGE
COMMISSION
WASHINGTON, D.C. 20549
FORM 6-K
REPORT OF FOREIGN ISSUER PURSUANT TO RULE 13a-16 OR 15d-16
UNDER THE SECURITIES EXCHANGE ACT OF 1934
For the month of January, 2025
Commission file number: 1-10110
BANCO BILBAO VIZCAYA ARGENTARIA, S.A.
(Exact name of Registrant as specified in its charter)
BANK BILBAO VIZCAYA ARGENTARIA, S.A.
(Translation of Registrant’s name into English)
Calle Azul 4,
28050 Madrid
Spain
(Address of principal executive offices)
Indicate by check mark whether the registrant files or will file annual reports under cover of Form 20-F or Form 40-F:
Form 20-F X Form 40-F
Indicate by check mark if the registrant is submitting the Form 6-K in paper as permitted by Regulation S-T Rule 101(b)(1):
Yes No X
Indicate by check mark if the registrant is submitting the Form 6-K in paper as permitted by Regulation S-T Rule 101(b)(7):
Yes No X

2024 Earnings January 30, 2025

2024 Earnings 2 Disclaimer This document is only provided for information purposes and is not intended to provide financial advice and, therefore, does not constitute, nor should it be interpreted as, an offer to sell, exchange or acquire, or an invitation for offers to acquire securities issued by any of the aforementioned companies, or to contract any financial product. Any decision to purchase or invest in securities or contract any financial product must be made solely and exclusively on the basis of the information made available to such effects by the company in relation to each specific matter.The information contained in this document is subject to and should be read in conjunction with all other publicly available information of the issuer. This document contains forward-looking statements that constitute or may constitute “forward-looking statements” (within the meaning of the “safe harbor” provisions of the United States Private Securities Litigation Reform Act of 1995) with respect to intentions, objectives, expectations or estimates as of the date hereof, including those relating to future targets of both a financial and non-financial nature (such as environmental, social or governance (“ESG”) performance targets). Forward-looking statements may be identified by the fact that they do not refer to historical or current facts and include words such as “believe”, “expect”, “estimate”, “project”, “anticipate”, “duty”, “intend”, “likelihood”, “risk”, “VaR”, “purpose”, “commitment”, “goal”, “target” and similar expressions or variations of those expressions. They include, for example, statements regarding future growth rates or the achievement of future targets, including those relating to ESG performance. The information contained in this document reflects our current expectations and targets, which are based on various assumptions, judgments and projections, including non-financial considerations such as those related to sustainability, which may differ from and not be comparable to those used by other companies. Forward-looking statements are not guarantees of future results, and actual results may differ materially from those anticipated in the forward-looking statements as a result of certain risks, uncertainties and other factors. These factors include, but are not limited to, (1) market conditions, macroeconomic factors, domestic and international stock market movements, exchange rates, inflation and interest rates; (2) regulatory and oversight factors, political and governmental guidelines, social and demographic factors; (3) changes in the financial condition, creditworthiness or solvency of our clients, debtors or counterparties, such as changes in default rates, as well as changes in consumer spending, savings and investment behavior, and changes in our credit ratings; (4) competitive pressures and actions we take in response thereto; (5) performance of our IT, operations and control systems and our ability to adapt to technological changes; (6) climate change and the occurrence of natural or man-made disasters, such as an outbreak or escalation of hostilities; and (7) our ability to appropriately address any ESG expectations or obligations (related to our business, management, corporate governance, disclosure or otherwise), and the cost thereof. In the particular case of certain targets related to our ESG performance, such as, decarbonization targets or alignment of our portfolios, the achievement and progress towards such targets will depend to a large extent on the actions of third parties, such as clients, governments and other stakeholders, and may therefore be materially affected by such actions, or lack thereof, as well as by other exogenous factors that do not depend on BBVA (including, but not limited to, new technological developments, regulatory developments, military conflicts, the evolution of climate and energy crises, etc.). Therefore, these targets may be subject to future revisions. The factors mentioned in the preceding paragraphs could cause actual future results to differ substantially from those set forth in the forecasts, intentions, objectives, targets or other forward-looking statements included in this document or in other past or future documents. Accordingly, results, including those related to ESG performance targets, among others, may differ materially from the statements contained in the forward-looking statements. Recipients of this document are cautioned not to place undue reliance on such forward-looking statements. Past performance or growth rates are not indicative of future performance, results or share price (including earnings per share). Nothing in this document should be construed as a forecast of results or future earnings. BBVA does not intend, and undertakes no obligation, to update or revise the contents of this or any other document if there are any changes in the information contained therein, or including the forward-looking statements contained in any such document, as a result of events or circumstances after the date of such document or otherwise except as required by applicable law. This document may contain summarised information or information that has not been audited, and its recipients are invited to consult the documentation and public information filed by BBVA with stock market supervisory bodies, in particular, the prospectuses and periodical information filed with the Spanish Securities Exchange Commission (CNMV) and the Annual Report on Form 20-F and information on Form 6-K that are filed with the US Securities and Exchange Commission. Distribution of this document in other jurisdictions may be prohibited, and recipients into whose possession this document comes shall be solely responsible for informing themselves about, and observing any such restrictions. By accepting this document you agree to be bound by the foregoing restrictions.
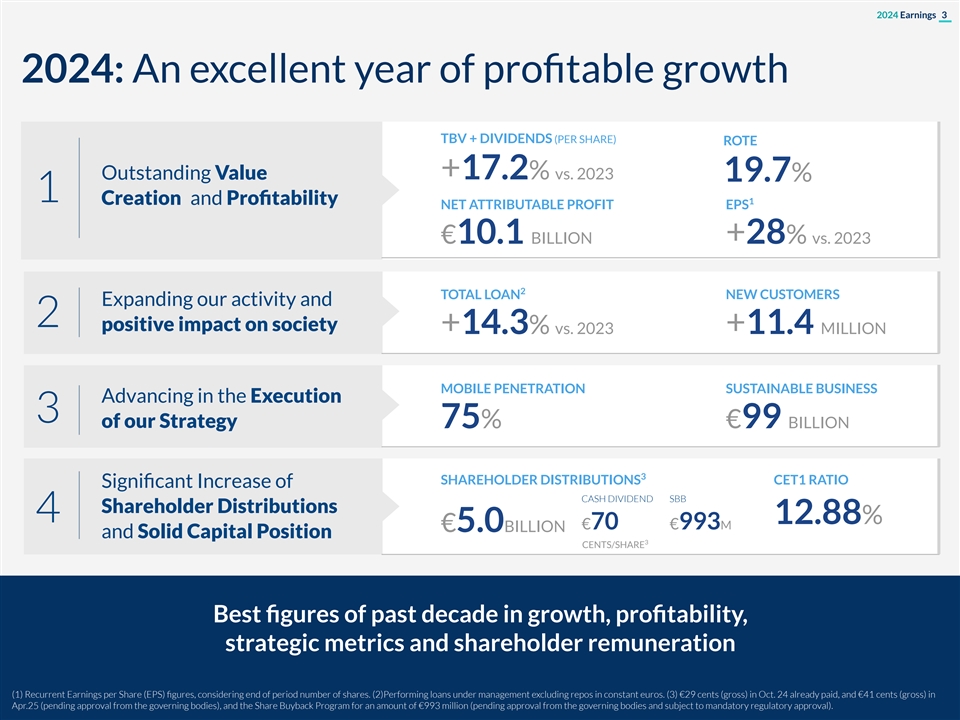
2024 Earnings 3 2024: An excellent year of profitable growth TBV + DIVIDENDS (PER SHARE) ROTE Outstanding Value +17.2% vs. 2023 19.7% 1 1 Creation and Profitability NET ATTRIBUTABLE PROFIT EPS €10.1 BILLION +28% vs. 2023 2 TOTAL LOAN NEW CUSTOMERS Expanding our activity and 2 positive impact on society +14.3% vs. 2023 +11.4 MILLION MOBILE PENETRATION SUSTAINABLE BUSINESS Advancing in the Execution 3 of our Strategy 75% €99 BILLION 3 SHAREHOLDER DISTRIBUTIONS CET1 RATIO Significant Increase of CASH DIVIDEND SBB Shareholder Distributions 4 12.88% €70 €993M €5.0BILLION and Solid Capital Position 3 CENTS/SHARE Best figures of past decade in growth, profitability, strategic metrics and shareholder remuneration (1) Recurrent Earnings per Share (EPS) figures, considering end of period number of shares. (2)Performing loans under management excluding repos in constant euros. (3) €29 cents (gross) in Oct. 24 already paid, and €41 cents (gross) in Apr.25 (pending approval from the governing bodies), and the Share Buyback Program for an amount of €993 million (pending approval from the governing bodies and subject to mandatory regulatory approval).
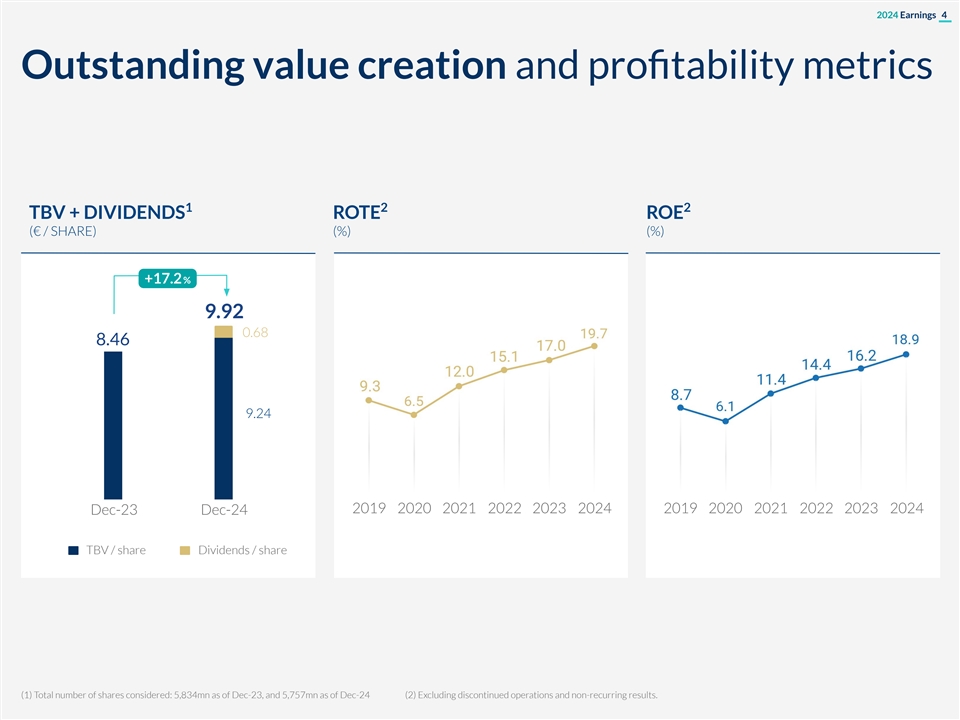
2024 Earnings 4 Outstanding value creation and profitability metrics 1 2 2 TBV + DIVIDENDS ROTE ROE (€ / SHARE) (%) (%) +17.2 % 9.92 0.68 8.46 9.24 2019 2020 2021 2022 2023 2024 2019 2020 2021 2022 2023 2024 Dec-23 Dec-24 TBV / share Dividends / share (1) Total number of shares considered: 5,834mn as of Dec-23, and 5,757mn as of Dec-24 (2) Excluding discontinued operations and non-recurring results.
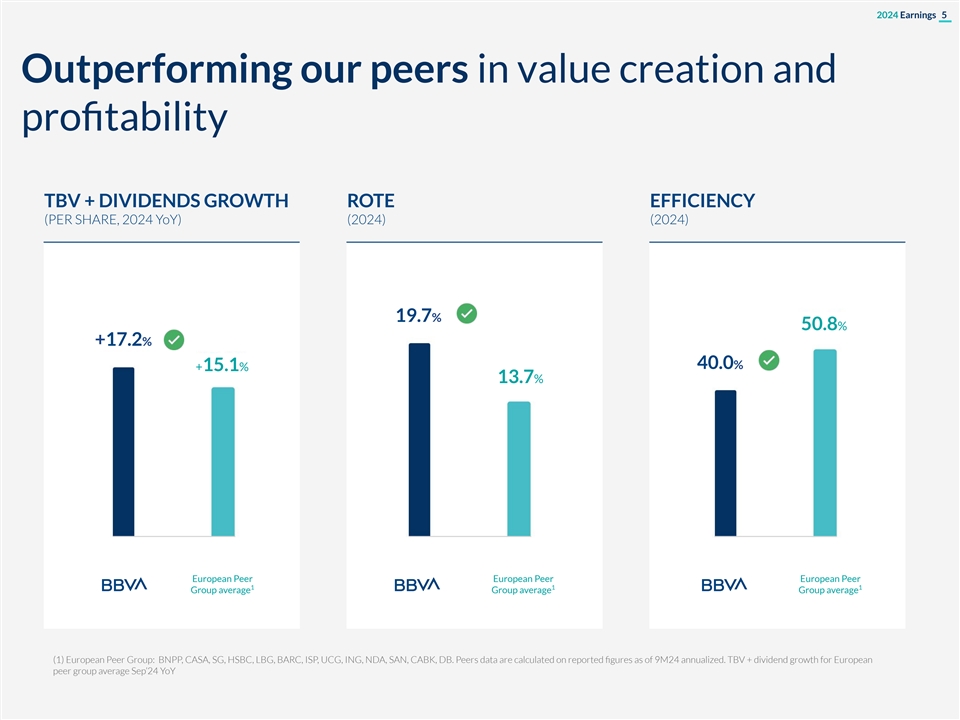
2024 Earnings 5 Outperforming our peers in value creation and profitability TBV + DIVIDENDS GROWTH ROTE EFFICIENCY (PER SHARE, 2024 YoY) (2024) (2024) 19.7% 50.8% +17.2% 40.0% +15.1% 13.7% European Peer European Peer European Peer 1 1 1 Group average Group average Group average (1) European Peer Group: BNPP, CASA, SG, HSBC, LBG, BARC, ISP, UCG, ING, NDA, SAN, CABK, DB. Peers data are calculated on reported figures as of 9M24 annualized. TBV + dividend growth for European peer group average Sep’24 YoY
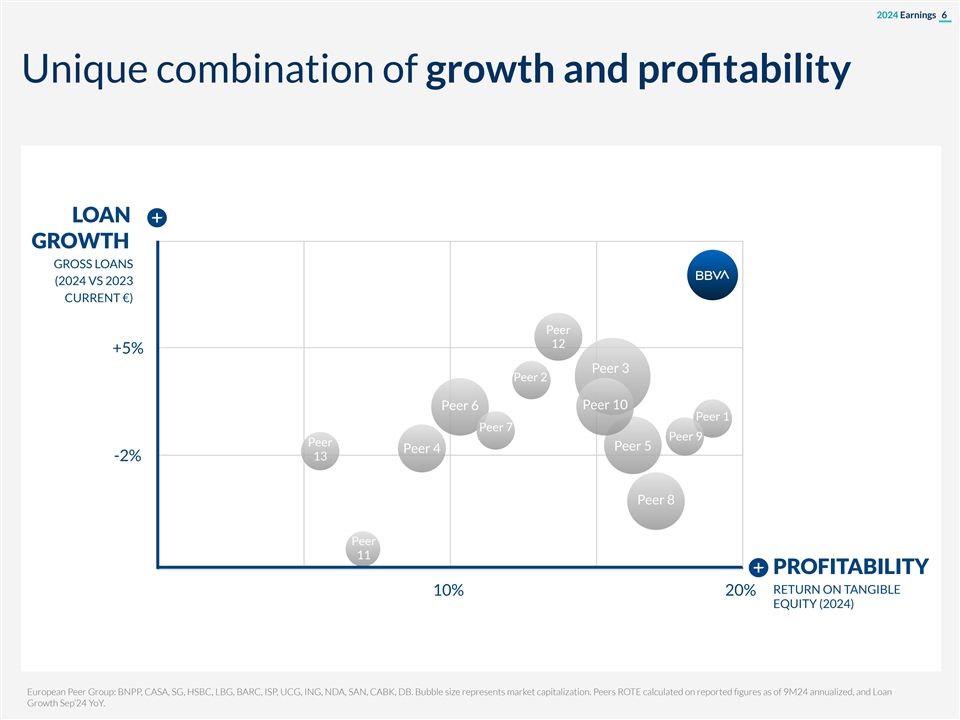
2024 Earnings 6 Unique combination of growth and profitability LOAN GROWTH GROSS LOANS (2024 VS 2023 CURRENT €) Peer 12 +5% Peer 3 Peer 2 Peer 10 Peer 6 Peer 1 Peer 7 Peer 9 Peer Peer 5 Peer 4 -2% 13 Peer 8 Peer 11 PROFITABILITY RETURN ON TANGIBLE 10% 20% EQUITY (2024) European Peer Group: BNPP, CASA, SG, HSBC, LBG, BARC, ISP, UCG, ING, NDA, SAN, CABK, DB. Bubble size represents market capitalization. Peers ROTE calculated on reported figures as of 9M24 annualized, and Loan Growth Sep’24 YoY.
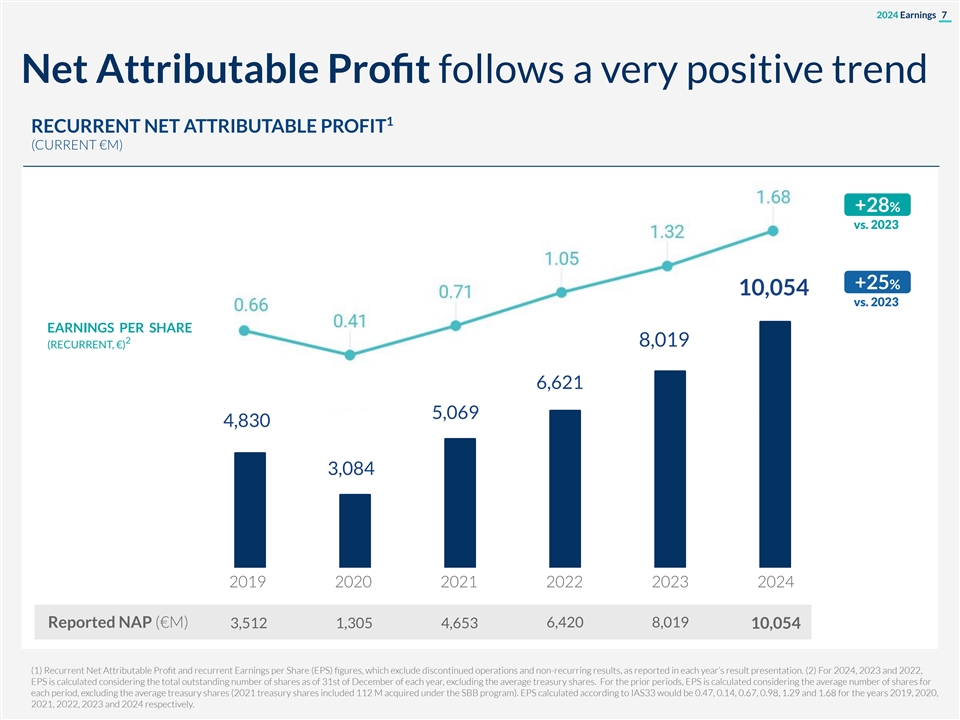
2024 Earnings 7 Net Attributable Profit follows a very positive trend 1 RECURRENT NET ATTRIBUTABLE PROFIT (CURRENT €M) +28% vs. 2023 +25% 10,054 vs. 2023 EARNINGS PER SHARE 2 8,019 (RECURRENT, €) 6,621 5,069 4,830 3,084 2019 2020 2021 2022 2023 2024 Reported NAP (€M) 3,512 1,305 4,653 6,420 8,019 10,054 (1) Recurrent Net Attributable Profit and recurrent Earnings per Share (EPS) figures, which exclude discontinued operations and non-recurring results, as reported in each year’s result presentation. (2) For 2024, 2023 and 2022, EPS is calculated considering the total outstanding number of shares as of 31st of December of each year, excluding the average treasury shares. For the prior periods, EPS is calculated considering the average number of shares for each period, excluding the average treasury shares (2021 treasury shares included 112 M acquired under the SBB program). EPS calculated according to IAS33 would be 0.47, 0.14, 0.67, 0.98, 1.29 and 1.68 for the years 2019, 2020, 2021, 2022, 2023 and 2024 respectively.
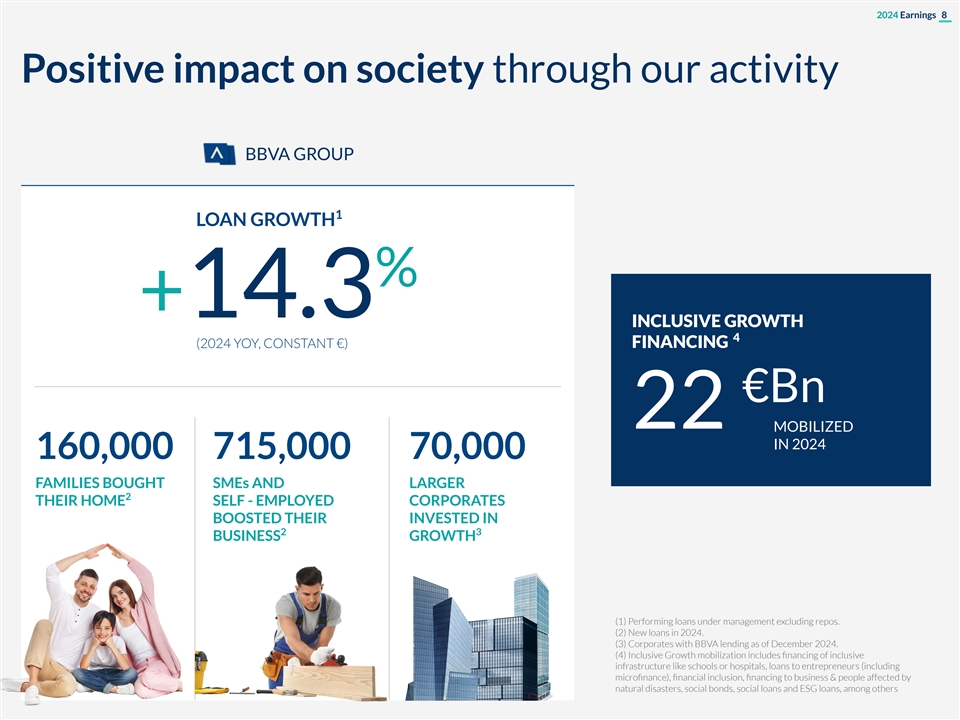
2024 Earnings 8 Positive impact on society through our activity BBVA GROUP 1 LOAN GROWTH % +14.3 INCLUSIVE GROWTH 4 (2024 YOY, CONSTANT €) FINANCING €Bn 22 MOBILIZED IN 2024 160,000 715,000 70,000 FAMILIES BOUGHT SMEs AND LARGER 2 THEIR HOME SELF - EMPLOYED CORPORATES BOOSTED THEIR INVESTED IN 2 3 BUSINESS GROWTH (1) Performing loans under management excluding repos. (2) New loans in 2024. (3) Corporates with BBVA lending as of December 2024. (4) Inclusive Growth mobilization includes financing of inclusive infrastructure like schools or hospitals, loans to entrepreneurs (including microfinance), financial inclusion, financing to business & people affected by natural disasters, social bonds, social loans and ESG loans, among others

2024 Earnings 9 All-time record customer growth driven by digital 1 NEW CUSTOMERS (BBVA GROUP, MILLION; % ACQUISITION THROUGH DIGITAL CHANNELS) DIGITAL 66% TOTAL 21% DIGITAL 2019 2020 2021 2022 2023 2024 ACTIVE 2 52.6 M 77.2 M CLIENTS (1) Gross customer acquisition through own channels for retail segment. Excludes the US business sold to PNC for comparison purposes. (2) Active clients as of December 2018 and 2024.

2024 Earnings 10 Delivering extraordinary customer service supported by our digital strategy 1 MOBILE PENETRATION NPS LEADERSHIP POSITION (PENETRATION OVER TOTAL ACTIVE CUSTOMERS) (NET PROMOTER SCORE) 75% 1 51% SPAIN MEXICO PERU 2019 2024 Top 3 in other countries GLOBAL RETAIL MOBILE APP (DECEMBER 2024) BBVA GROUP x2 vs. 2020 x2.5 vs. 2020 at 437M +10pp NPS LOGINS PER TRANSACTIONS vs. 2019 MONTH PER MONTH (1) Net Promoter Score as a measure of customer satisfaction. Measured among large banks in their respective countries. Argentina ranks fourth.
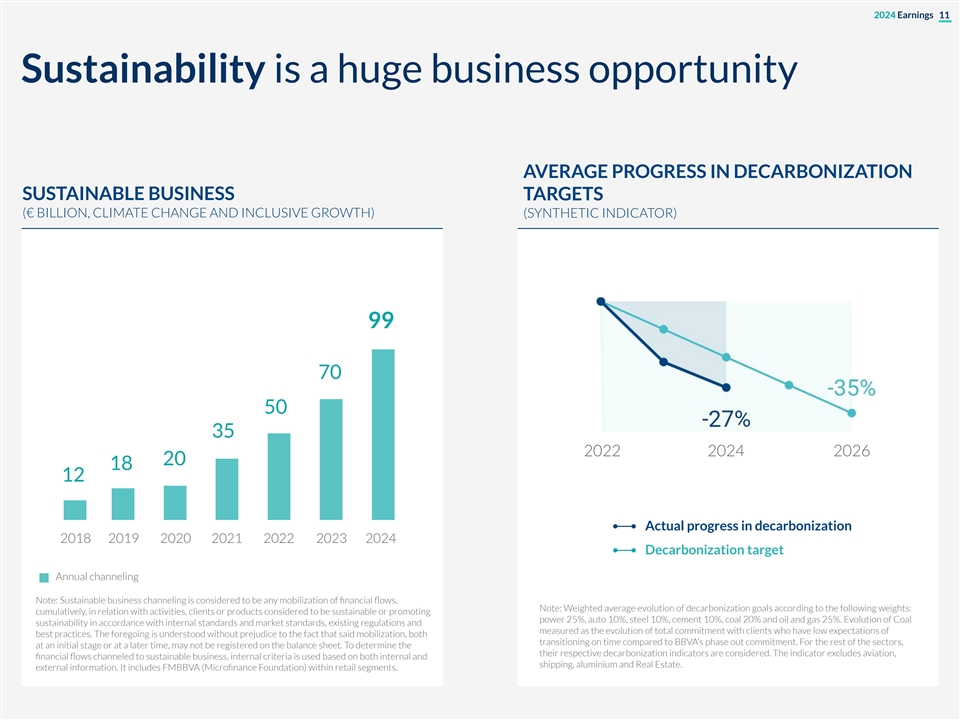
2024 Earnings 11 Sustainability is a huge business opportunity AVERAGE PROGRESS IN DECARBONIZATION SUSTAINABLE BUSINESS TARGETS (€ BILLION, CLIMATE CHANGE AND INCLUSIVE GROWTH) (SYNTHETIC INDICATOR) 99 70 50 35 2022 2024 2026 20 18 12 Actual progress in decarbonization 2018 2019 2020 2021 2022 2023 2024 Decarbonization target Annual channeling Note: Sustainable business channeling is considered to be any mobilization of financial flows, Note: Weighted average evolution of decarbonization goals according to the following weights: cumulatively, in relation with activities, clients or products considered to be sustainable or promoting power 25%, auto 10%, steel 10%, cement 10%, coal 20% and oil and gas 25%. Evolution of Coal sustainability in accordance with internal standards and market standards, existing regulations and measured as the evolution of total commitment with clients who have low expectations of best practices. The foregoing is understood without prejudice to the fact that said mobilization, both transitioning on time compared to BBVA's phase out commitment. For the rest of the sectors, at an initial stage or at a later time, may not be registered on the balance sheet. To determine the their respective decarbonization indicators are considered. The indicator excludes aviation, financial flows channeled to sustainable business, internal criteria is used based on both internal and shipping, aluminium and Real Estate. external information. It includes FMBBVA (Microfinance Foundation) within retail segments.
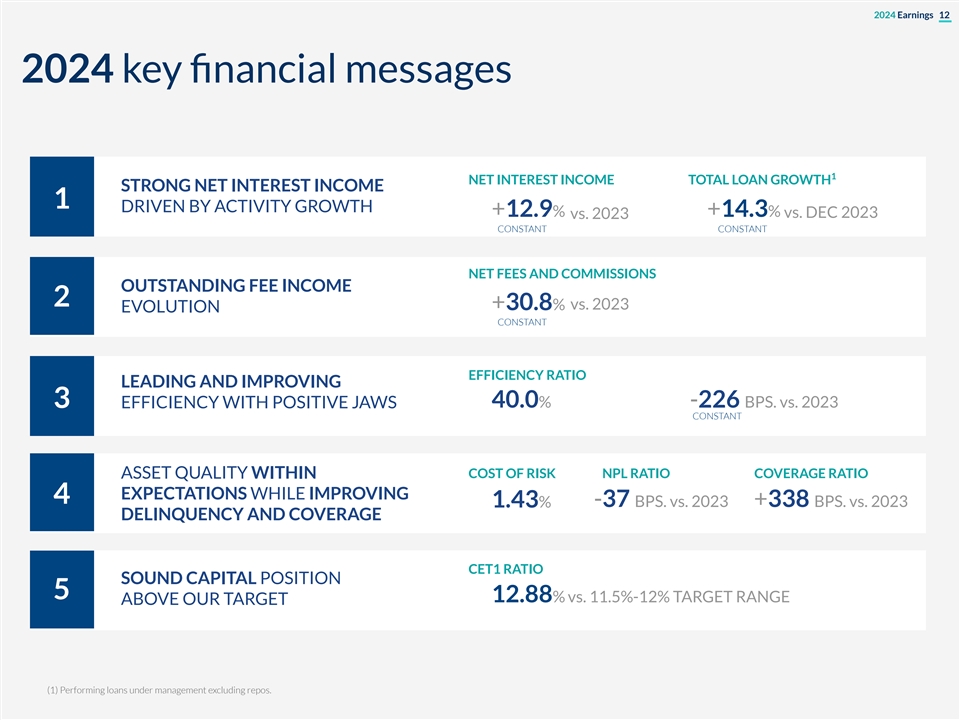
2024 Earnings 12 2024 key financial messages 1 NET INTEREST INCOME TOTAL LOAN GROWTH STRONG NET INTEREST INCOME 1 DRIVEN BY ACTIVITY GROWTH +12.9% +14.3% vs. 2023 vs. DEC 2023 CONSTANT CONSTANT NET FEES AND COMMISSIONS OUTSTANDING FEE INCOME 2 vs. 2023 +30.8% EVOLUTION CONSTANT EFFICIENCY RATIO LEADING AND IMPROVING 3 EFFICIENCY WITH POSITIVE JAWS 40.0% -226 BPS. vs. 2023 CONSTANT ASSET QUALITY WITHIN COST OF RISK NPL RATIO COVERAGE RATIO EXPECTATIONS WHILE IMPROVING 4 -37 BPS. vs. 2023 +338 BPS. vs. 2023 1.43% DELINQUENCY AND COVERAGE CET1 RATIO SOUND CAPITAL POSITION 5 12.88% vs. 11.5%-12% TARGET RANGE ABOVE OUR TARGET (1) Performing loans under management excluding repos.
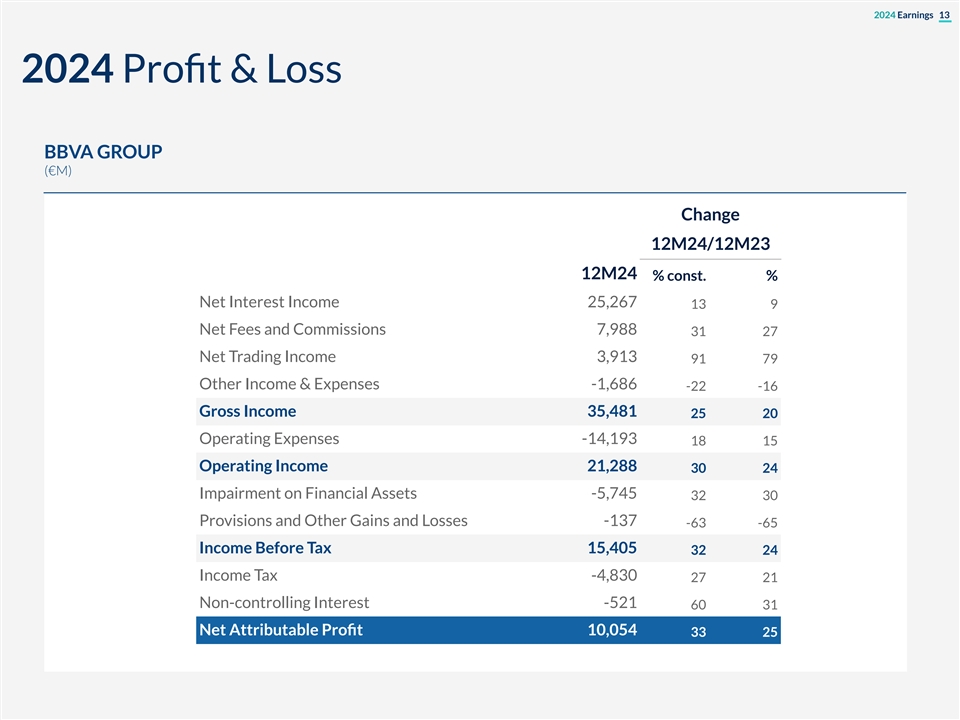
2024 Earnings 13 2024 Profit & Loss BBVA GROUP (€M) Change 12M24/12M23 12M24 % const. % Net Interest Income 25,267 13 9 Net Fees and Commissions 7,988 31 27 Net Trading Income 3,913 91 79 Other Income & Expenses -1,686 -22 -16 Gross Income 35,481 25 20 Operating Expenses -14,193 18 15 Operating Income 21,288 30 24 Impairment on Financial Assets -5,745 32 30 Provisions and Other Gains and Losses -137 -63 -65 Income Before Tax 15,405 32 24 Income Tax -4,830 27 21 Non-controlling Interest -521 60 31 Net Attributable Profit 10,054 33 25
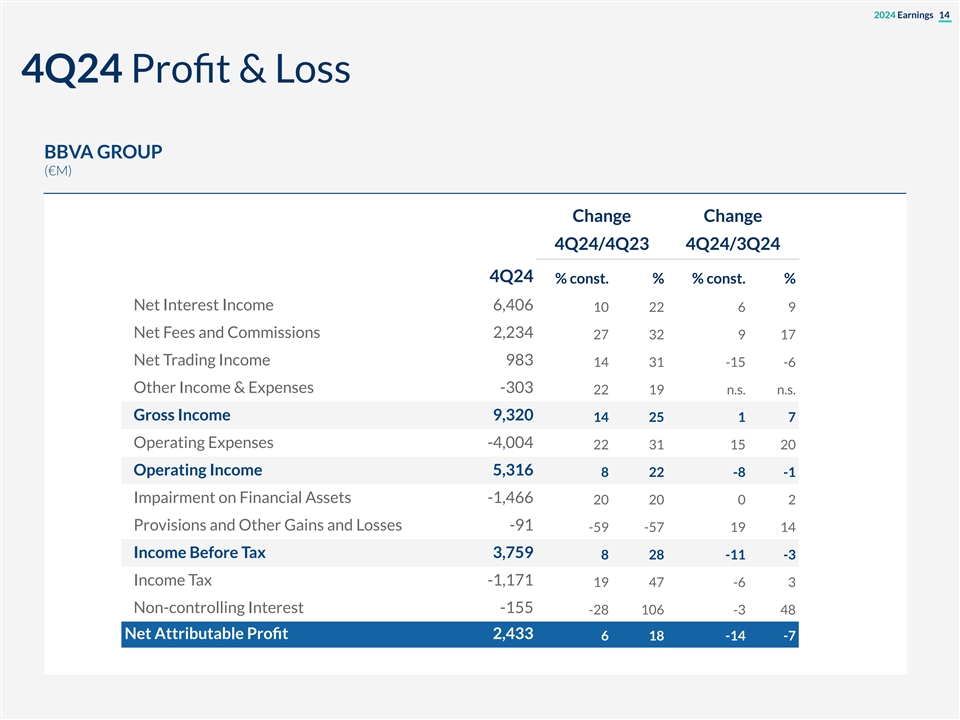
2024 Earnings 14 4Q24 Profit & Loss BBVA GROUP (€M) Change Change 4Q24/4Q23 4Q24/3Q24 4Q24 % const. % % const. % Net Interest Income 6,406 10 22 6 9 Net Fees and Commissions 2,234 27 32 9 17 Net Trading Income 983 14 31 -15 -6 Other Income & Expenses -303 22 19 n.s. n.s. Gross Income 9,320 14 25 1 7 Operating Expenses -4,004 22 31 15 20 Operating Income 5,316 8 22 -8 -1 Impairment on Financial Assets -1,466 20 20 0 2 Provisions and Other Gains and Losses -91 -59 -57 19 14 Income Before Tax 3,759 8 28 -11 -3 Income Tax -1,171 19 47 -6 3 Non-controlling Interest -155 -28 106 -3 48 Net Attributable Profit 2,433 6 18 -14 -7
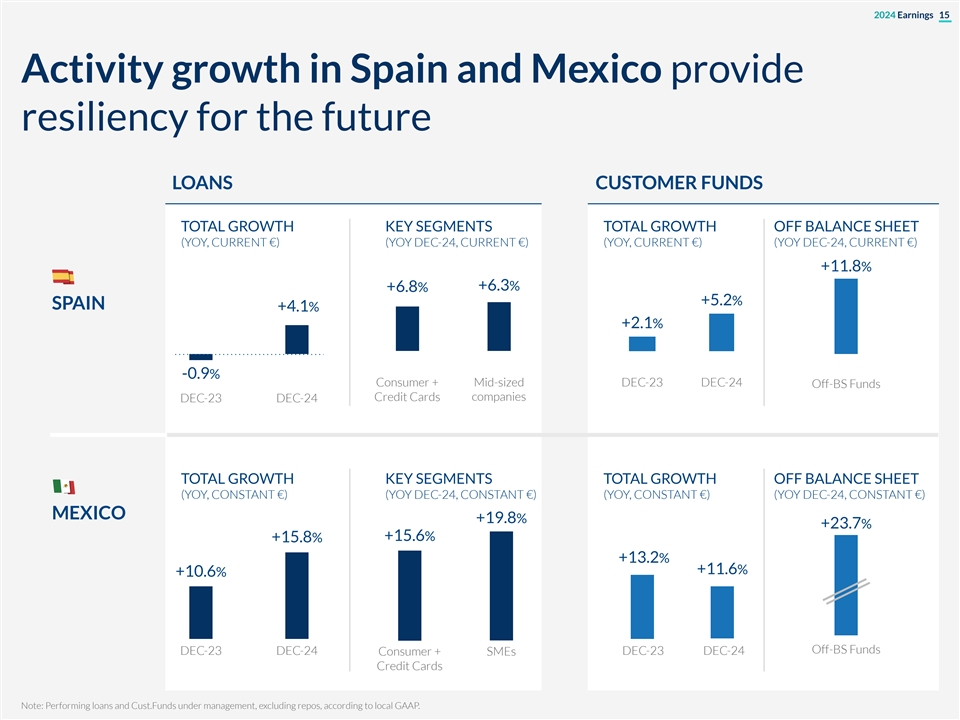
2024 Earnings 15 Activity growth in Spain and Mexico provide resiliency for the future LOANS CUSTOMER FUNDS TOTAL GROWTH KEY SEGMENTS TOTAL GROWTH OFF BALANCE SHEET (YOY, CURRENT €) (YOY DEC-24, CURRENT €) (YOY, CURRENT €) (YOY DEC-24, CURRENT €) +11.8% +6.3% +6.8% +5.2% SPAIN +4.1% +2.1% -0.9% Consumer + Mid-sized DEC-23 DEC-24 Off-BS Funds Credit Cards companies DEC-23 DEC-24 TOTAL GROWTH KEY SEGMENTS TOTAL GROWTH OFF BALANCE SHEET (YOY, CONSTANT €) (YOY DEC-24, CONSTANT €) (YOY, CONSTANT €) (YOY DEC-24, CONSTANT €) MEXICO +19.8% +23.7% +15.6% +15.8% +13.2% +11.6% +10.6% Off-BS Funds DEC-23 DEC-24 DEC-23 DEC-24 Consumer + SMEs Credit Cards Note: Performing loans and Cust.Funds under management, excluding repos, according to local GAAP.
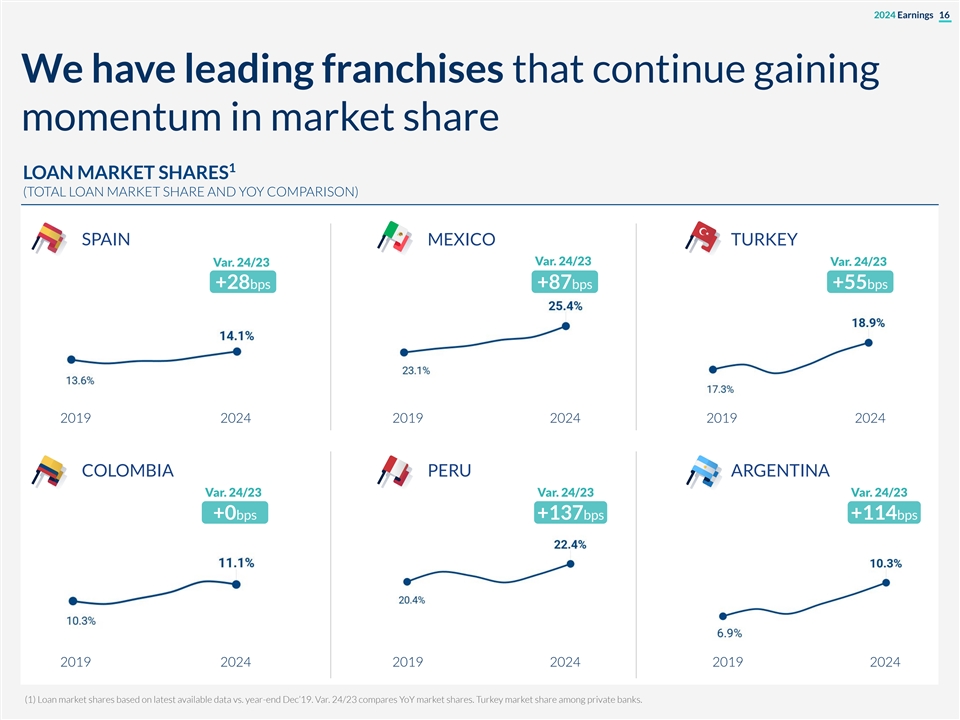
2024 Earnings 16 We have leading franchises that continue gaining momentum in market share 1 LOAN MARKET SHARES (TOTAL LOAN MARKET SHARE AND YOY COMPARISON) SPAIN MEXICO TURKEY Var. 24/23 Var. 24/23 Var. 24/23 +28bps +87bps +55bps 2019 2024 2019 2024 2019 2024 COLOMBIA PERU ARGENTINA Var. 24/23 Var. 24/23 Var. 24/23 +0bps +137bps +114bps 2019 2024 2019 2024 2019 2024 (1) Loan market shares based on latest available data vs. year-end Dec’19. Var. 24/23 compares YoY market shares. Turkey market share among private banks.
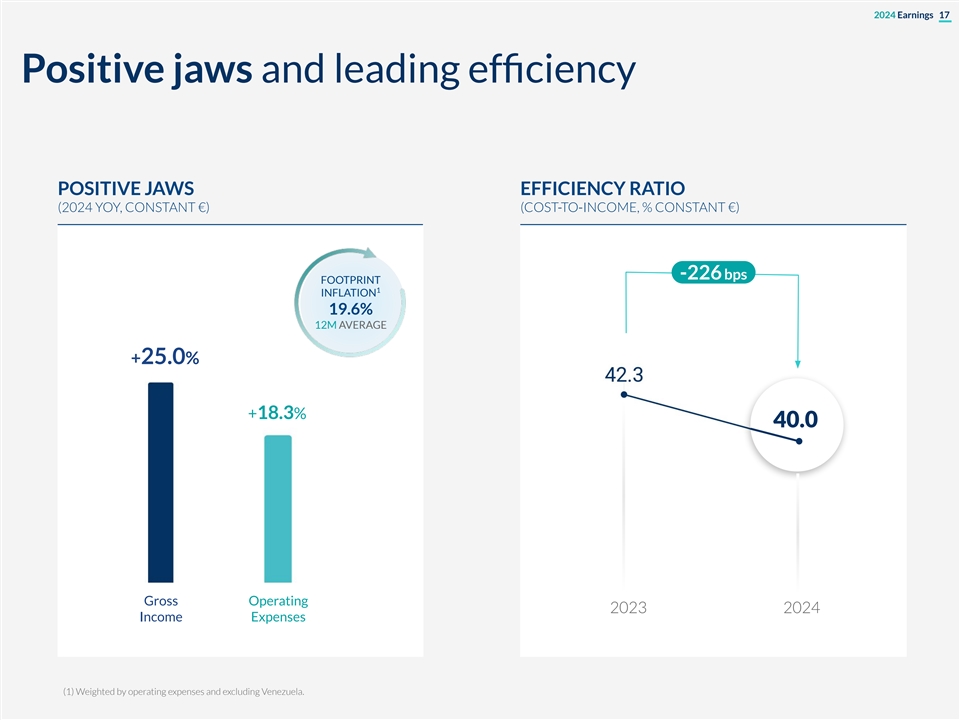
2024 Earnings 17 Positive jaws and leading efficiency POSITIVE JAWS EFFICIENCY RATIO (2024 YOY, CONSTANT €) (COST-TO-INCOME, % CONSTANT €) -226 bps FOOTPRINT 1 INFLATION 19.6% 12M AVERAGE +25.0% +18.3% 40.0 Gross Operating 2023 2024 Income Expenses (1) Weighted by operating expenses and excluding Venezuela.
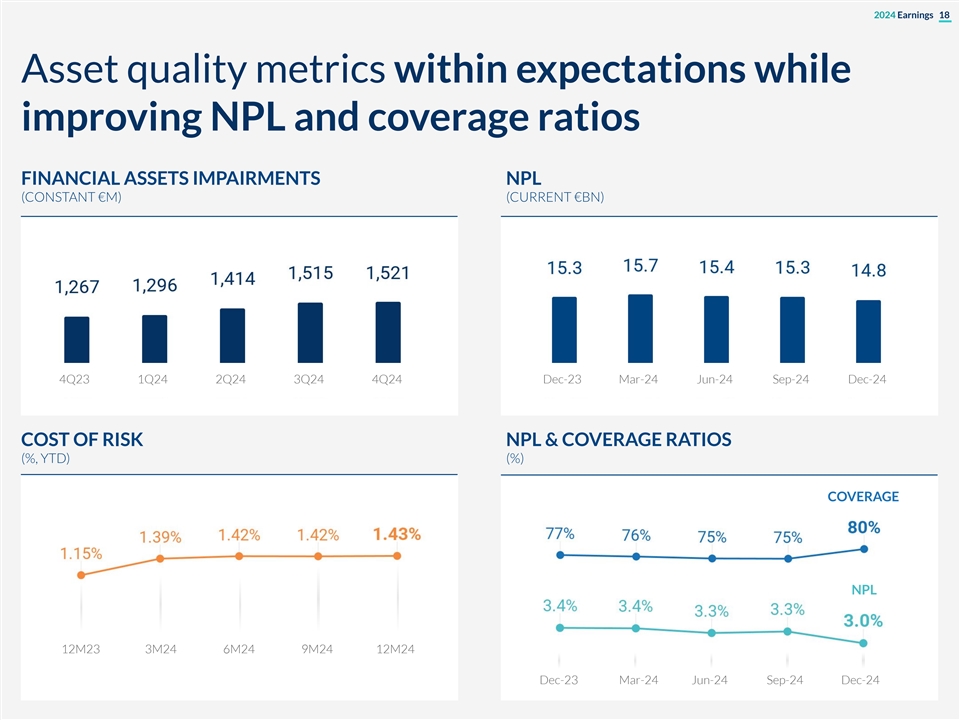
2024 Earnings 18 Asset quality metrics within expectations while improving NPL and coverage ratios FINANCIAL ASSETS IMPAIRMENTS NPL (CONSTANT €M) (CURRENT €BN) 4Q23 1Q24 2Q24 3Q24 4Q24 Dec-23 Mar-24 Jun-24 Sep-24 Dec-24 COST OF RISK NPL & COVERAGE RATIOS (%, YTD) (%) COVERAGE NPL 12M23 3M24 6M24 9M24 12M24 Dec-23 Mar-24 Jun-24 Sep-24 Dec-24
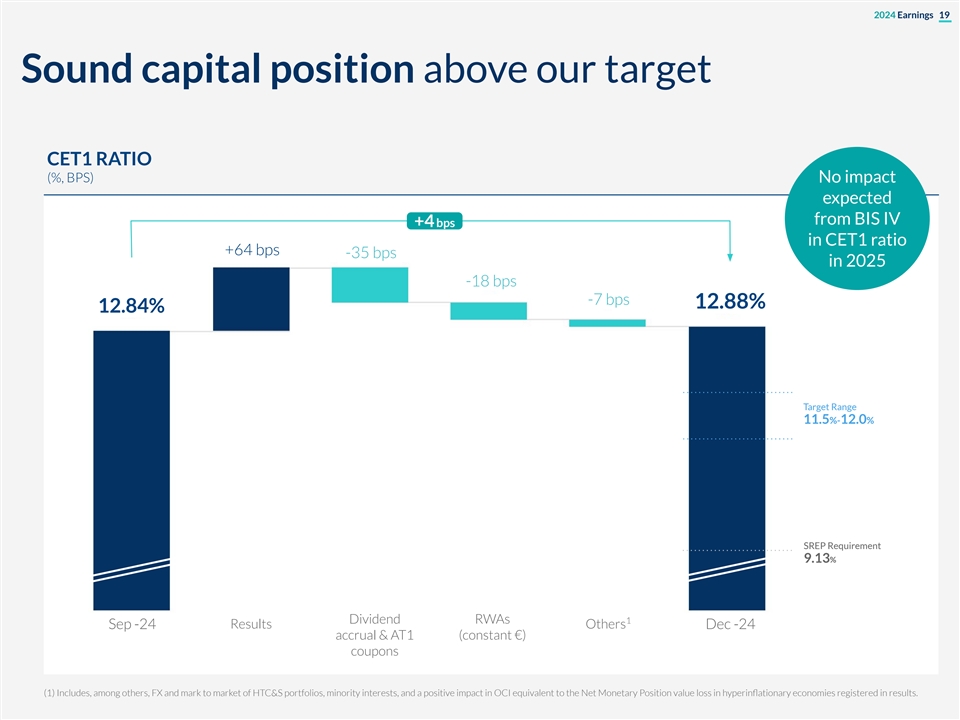
2024 Earnings 19 Sound capital position above our target CET1 RATIO (%, BPS) No impact expected from BIS IV +4 bps in CET1 ratio +64 bps -35 bps in 2025 -18 bps -7 bps 12.88% 12.84% Target Range 11.5%-12.0% SREP Requirement 9.13% Dividend RWAs 1 Sep -24 Results Others Dec -24 accrual & AT1 (constant €) coupons (1) Includes, among others, FX and mark to market of HTC&S portfolios, minority interests, and a positive impact in OCI equivalent to the Net Monetary Position value loss in hyperinflationary economies registered in results.
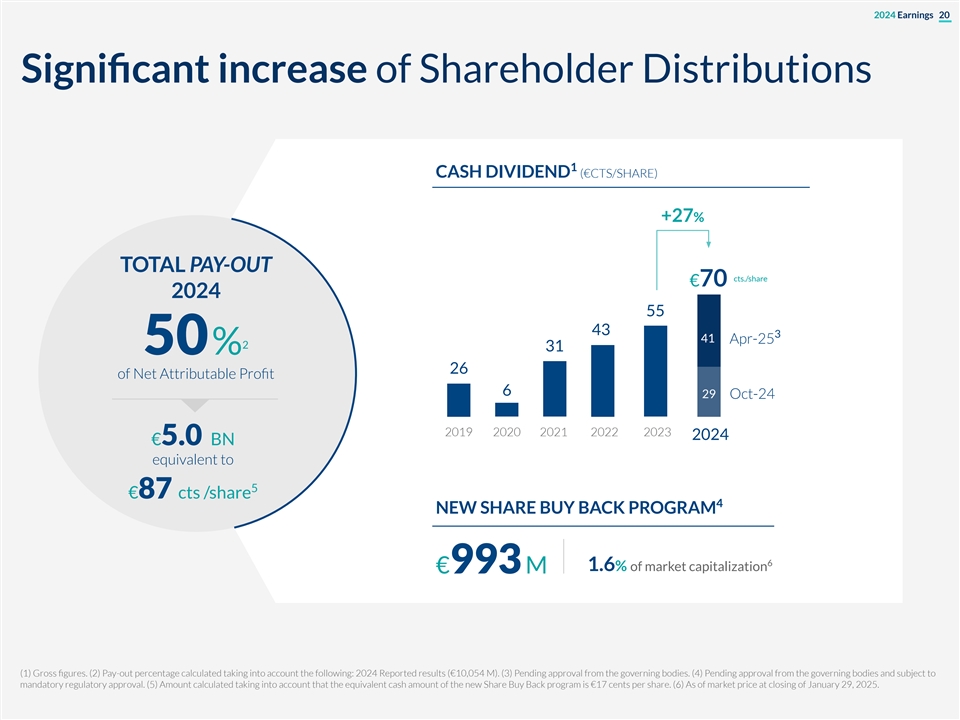
2024 Earnings 20 Significant increase of Shareholder Distributions 1 CASH DIVIDEND (€CTS/SHARE) +27% TOTAL PAY-OUT cts./share €70 2024 55 43 3 41 Apr-25 2 31 50% 26 of Net Attributable Profit 6 29 Oct-24 2019 2020 2021 2022 2023 2024 €5.0 BN equivalent to 5 €87 cts /share 4 NEW SHARE BUY BACK PROGRAM 6 1.6% of market capitalization €993 M (1) Gross figures. (2) Pay-out percentage calculated taking into account the following: 2024 Reported results (€10,054 M). (3) Pending approval from the governing bodies. (4) Pending approval from the governing bodies and subject to mandatory regulatory approval. (5) Amount calculated taking into account that the equivalent cash amount of the new Share Buy Back program is €17 cents per share. (6) As of market price at closing of January 29, 2025.
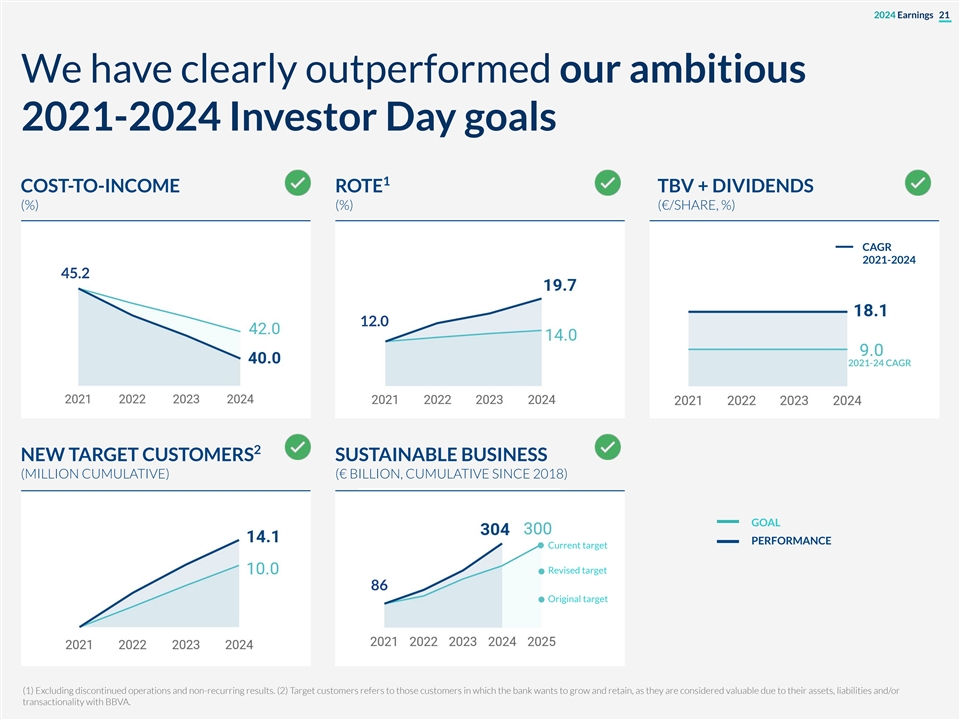
2024 Earnings 21 We have clearly outperformed our ambitious 2021-2024 Investor Day goals 1 COST-TO-INCOME ROTE TBV + DIVIDENDS (%) (%) (€/SHARE, %) CAGR 2021-2024 45.2 12.0 2021-24 CAGR 2 NEW TARGET CUSTOMERS SUSTAINABLE BUSINESS (MILLION CUMULATIVE) (€ BILLION, CUMULATIVE SINCE 2018) GOAL PERFORMANCE Current target Revised target 86 Original target (1) Excluding discontinued operations and non-recurring results. (2) Target customers refers to those customers in which the bank wants to grow and retain, as they are considered valuable due to their assets, liabilities and/or transactionality with BBVA.

2024 Earnings 22 Uses of Capital during 2021-2024 CAPITAL ALLOCATION (CUMULATIVE 21-24. CURRENT € BN) CET1 GENERATION 35.6 Bn 34.2 Bn INVESTING FOR 1 Capital invested for growth 13.2 Bn FUTURE ACCUMULATING CET1 Ratio increase 4.2 Bn EXCESS CAPITAL Dividends 11.9 Bn SHAREHOLDER DISTRIBUTIONS Share Buybacks 6.4 Bn (1) Increasing CET1 consumption for organic growth in constant €: 35 bps in 2021, 101 bps in 2022, 132 bps in 2023, 155 bps in 2024. The number also includes € 1,4 Bn for Turkish minorities and restructuring program.

2024 Earnings 23 New Strategic Priorities 2025-2029 WHAT DOES BBVA STAND FULL COMMITMENT SOUND FOUNDATIONS FOR TO CLIENTS? A NEW TO GROWTH TO DRIVE MEANINGFUL WAVE OF DIFFERENTIATION AND VALUE CREATION IMPACT ACROSS THE BOARD Embed a Radical Boost Sustainability as a Unlock the Potential of AI and Growth Engine Innovation through Data Client Perspective Availability and Next Gen Tech in All We Do Scale up All Enterprise Strengthen Our Empathy, Segments Succeed as a Winning Team Promote a Value and Capital Creation Mindset

2024 Earnings 24 SPAIN Business MEXICO Areas TURKEY SOUTH AMERICA
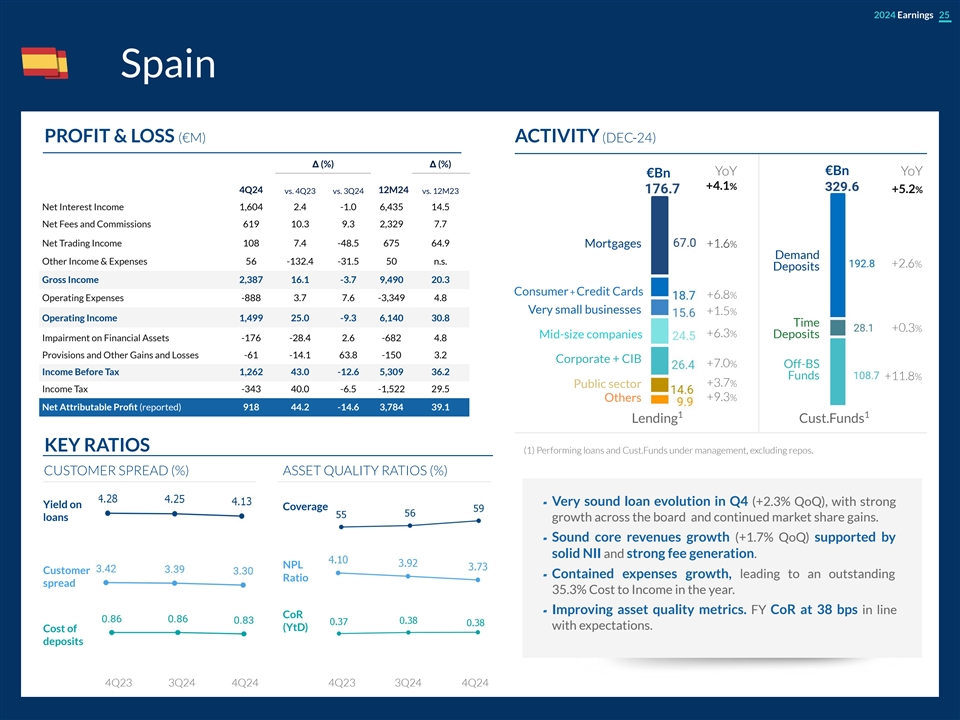
2024 Earnings 25 Spain PROFIT & LOSS (€M) ACTIVITY (DEC-24) Δ (%) Δ (%) YoY €Bn YoY €Bn +4.1% 4Q24 12M24 +5.2% vs. 4Q23 vs. 3Q24 vs. 12M23 Net Interest Income 1,604 2.4 -1.0 6,435 14.5 Net Fees and Commissions 619 10.3 9.3 2,329 7.7 Net Trading Income 108 7.4 -48.5 675 64.9 Mortgages +1.6% Demand Other Income & Expenses 56 -132.4 -31.5 50 n.s. +2.6% Deposits Gross Income 2,387 16.1 -3.7 9,490 20.3 Consumer + Credit Cards +6.8% Operating Expenses -888 3.7 7.6 -3,349 4.8 Very small businesses +1.5% Operating Income 1,499 25.0 -9.3 6,140 30.8 Time +0.3% +6.3% Mid-size companies Deposits Impairment on Financial Assets -176 -28.4 2.6 -682 4.8 Provisions and Other Gains and Losses -61 -14.1 63.8 -150 3.2 Corporate + CIB +7.0% Off-BS Income Before Tax 1,262 43.0 -12.6 5,309 36.2 Funds +11.8% +3.7% Public sector Income Tax -343 40.0 -6.5 -1,522 29.5 Others +9.3% Net Attributable Profit (reported) 918 44.2 -14.6 3,784 39.1 1 1 Lending Cust.Funds KEY RATIOS (1) Performing loans and Cust.Funds under management, excluding repos. CUSTOMER SPREAD (%) ASSET QUALITY RATIOS (%) ▰ Very sound loan evolution in Q4 (+2.3% QoQ), with strong Yield on Coverage loans growth across the board and continued market share gains. ▰ Sound core revenues growth (+1.7% QoQ) supported by solid NII and strong fee generation. NPL Customer ▰ Contained expenses growth, leading to an outstanding Ratio spread 35.3% Cost to Income in the year. ▰ Improving asset quality metrics. FY CoR at 38 bps in line CoR with expectations. Cost of (YtD) deposits 4Q23 3Q24 4Q24 4Q23 3Q24 4Q24
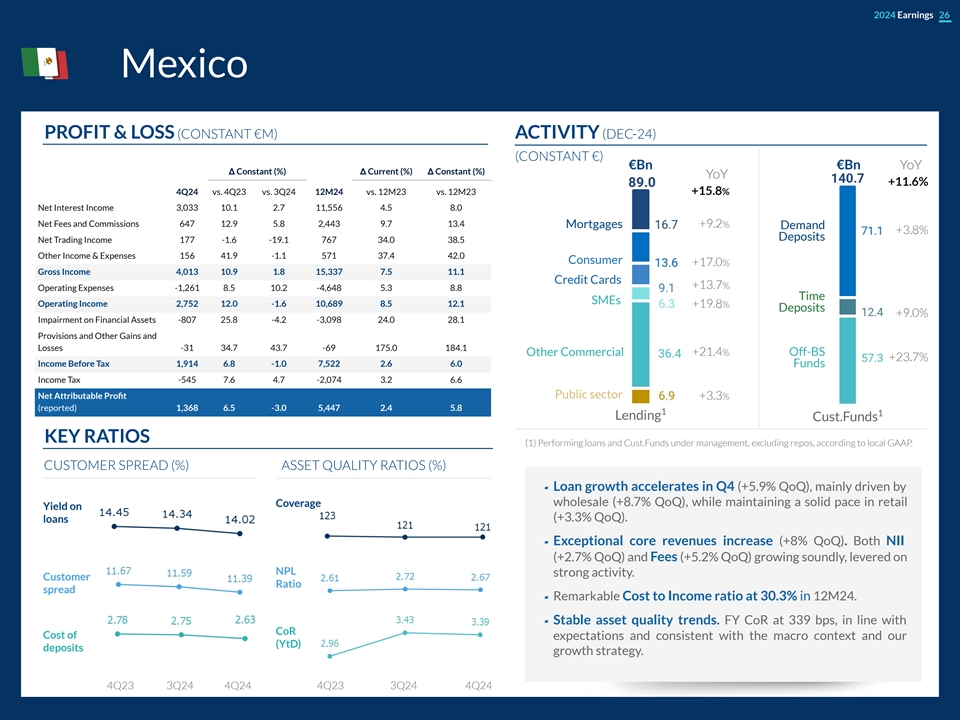
2024 Earnings 26 Mexico PROFIT & LOSS (CONSTANT €M) ACTIVITY (DEC-24) (CONSTANT €) €Bn €Bn YoY Δ Constant (%) Δ Current (%) Δ Constant (%) YoY +11.6% 4Q24 vs. 4Q23 vs. 3Q24 12M24 vs. 12M23 vs. 12M23 +15.8% Net Interest Income 3,033 10.1 2.7 11,556 4.5 8.0 Net Fees and Commissions 647 12.9 5.8 2,443 9.7 13.4 Mortgages +9.2% Demand +3.8% Deposits Net Trading Income 177 -1.6 -19.1 767 34.0 38.5 Other Income & Expenses 156 41.9 -1.1 571 37.4 42.0 Consumer +17.0% Gross Income 4,013 10.9 1.8 15,337 7.5 11.1 Credit Cards +13.7% Operating Expenses -1,261 8.5 10.2 -4,648 5.3 8.8 Time SMEs Operating Income 2,752 12.0 -1.6 10,689 8.5 12.1 +19.8% Deposits +9.0% Impairment on Financial Assets -807 25.8 -4.2 -3,098 24.0 28.1 Provisions and Other Gains and Losses -31 34.7 43.7 -69 175.0 184.1 Other Commercial +21.4% Off-BS +23.7% Income Before Tax 1,914 6.8 -1.0 7,522 2.6 6.0 Funds Income Tax -545 7.6 4.7 -2,074 3.2 6.6 Net Attributable Profit Public sector +3.3% (reported) 1,368 6.5 -3.0 5,447 2.4 5.8 1 1 Lending Cust.Funds KEY RATIOS (1) Performing loans and Cust.Funds under management, excluding repos, according to local GAAP. CUSTOMER SPREAD (%) ASSET QUALITY RATIOS (%) ▰ Loan growth accelerates in Q4 (+5.9% QoQ), mainly driven by Coverage wholesale (+8.7% QoQ), while maintaining a solid pace in retail Yield on (+3.3% QoQ). loans ▰ Exceptional core revenues increase (+8% QoQ). Both NII (+2.7% QoQ) and Fees (+5.2% QoQ) growing soundly, levered on NPL strong activity. Customer Ratio spread ▰ Remarkable Cost to Income ratio at 30.3% in 12M24. ▰ Stable asset quality trends. FY CoR at 339 bps, in line with CoR Cost of expectations and consistent with the macro context and our (YtD) deposits growth strategy. 4Q23 3Q24 4Q24 4Q23 3Q24 4Q24
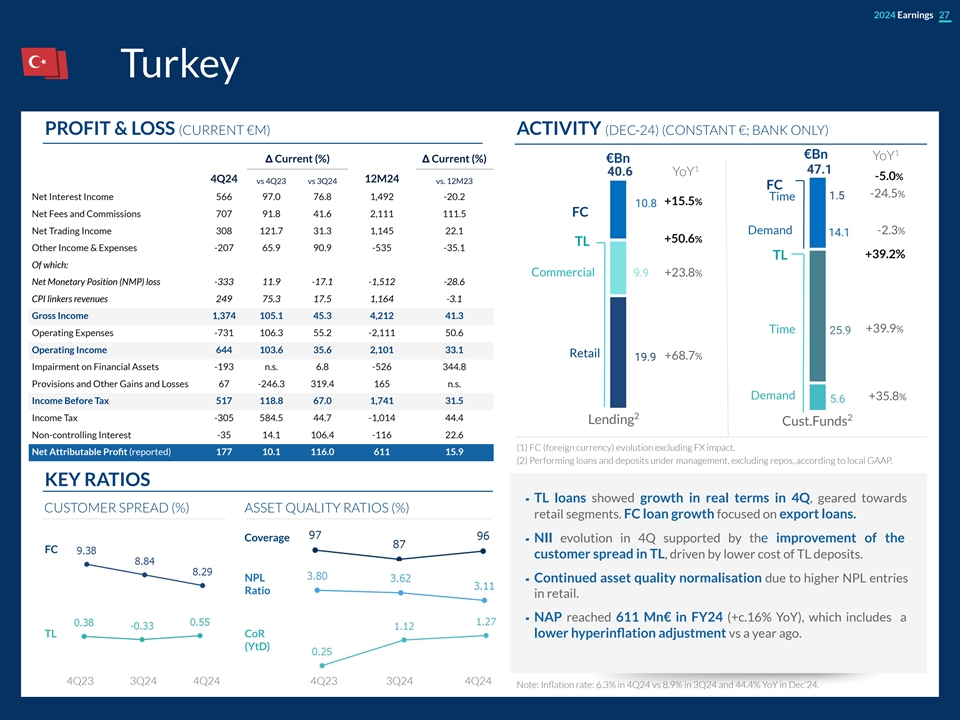
2024 Earnings 27 Turkey PROFIT & LOSS (CURRENT €M) ACTIVITY (DEC-24) (CONSTANT €; BANK ONLY) 1 €Bn YoY Δ Current (%) Δ Current (%) €Bn 1 YoY -5.0% 4Q24 12M24 vs 4Q23 vs 3Q24 vs. 12M23 FC -24.5% Net Interest Income 566 97.0 76.8 1,492 -20.2 Time +15.5% Net Fees and Commissions 707 91.8 41.6 2,111 111.5 FC Net Trading Income 308 121.7 31.3 1,145 22.1 Demand -2.3% +50.6% TL Other Income & Expenses -207 65.9 90.9 -535 -35.1 +39.2% TL Of which: Commercial +23.8% Net Monetary Position (NMP) loss -333 11.9 -17.1 -1,512 -28.6 CPI linkers revenues 249 75.3 17.5 1,164 -3.1 Gross Income 1,374 105.1 45.3 4,212 41.3 Time +39.9% Operating Expenses -731 106.3 55.2 -2,111 50.6 Operating Income 644 103.6 35.6 2,101 33.1 Retail +68.7% Impairment on Financial Assets -193 n.s. 6.8 -526 344.8 Provisions and Other Gains and Losses 67 -246.3 319.4 165 n.s. Demand +35.8% Income Before Tax 517 118.8 67.0 1,741 31.5 2 Income Tax -305 584.5 44.7 -1,014 44.4 2 Lending Cust.Funds Non-controlling Interest -35 14.1 106.4 -116 22.6 (1) FC (foreign currency) evolution excluding FX impact. Net Attributable Profit (reported) 177 10.1 116.0 611 15.9 (2) Performing loans and deposits under management, excluding repos, according to local GAAP. KEY RATIOS ▰ TL loans showed growth in real terms in 4Q, geared towards CUSTOMER SPREAD (%) ASSET QUALITY RATIOS (%) retail segments. FC loan growth focused on export loans. Coverage ▰ NII evolution in 4Q supported by the improvement of the FC customer spread in TL, driven by lower cost of TL deposits. NPL ▰ Continued asset quality normalisation due to higher NPL entries Ratio in retail. ▰ NAP reached 611 Mn€ in FY24 (+c.16% YoY), which includes a TL CoR lower hyperinflation adjustment vs a year ago. (YtD) 4Q23 3Q24 4Q24 4Q23 3Q24 4Q24 Note: Inflation rate: 6.3% in 4Q24 vs 8.9% in 3Q24 and 44.4% YoY in Dec’24.
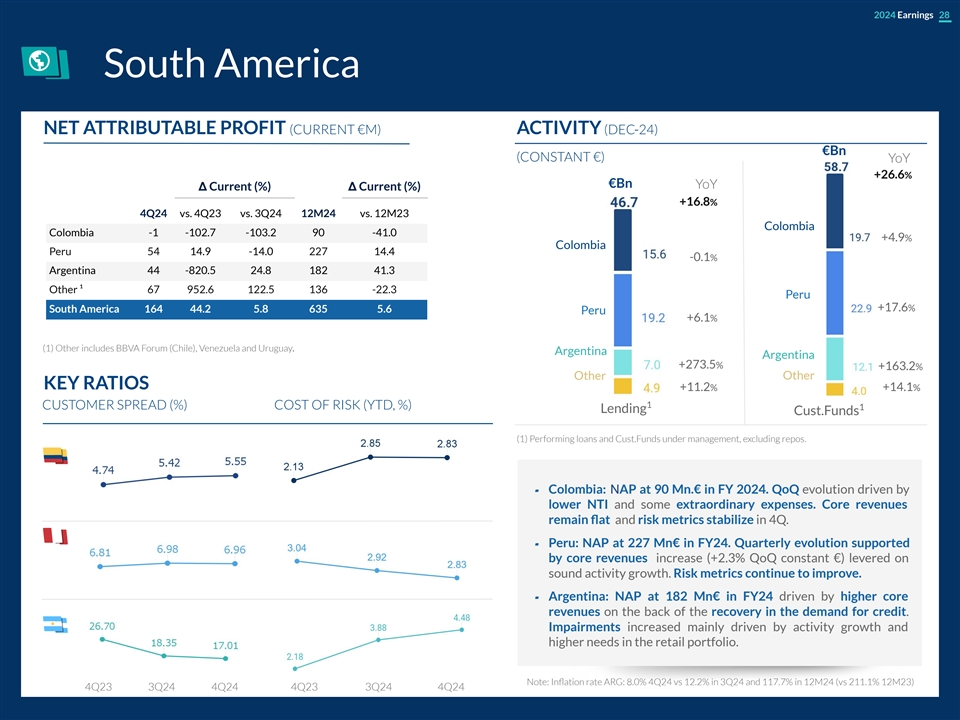
2024 Earnings 28 South America NET ATTRIBUTABLE PROFIT (CURRENT €M) ACTIVITY (DEC-24) €Bn (CONSTANT €) YoY +26.6% €Bn YoY Δ Current (%) Δ Current (%) +16.8% 4Q24 vs. 4Q23 vs. 3Q24 12M24 vs. 12M23 Colombia Colombia -1 -102.7 -103.2 90 -41.0 +4.9% Colombia Peru 54 14.9 -14.0 227 14.4 -0.1% Argentina 44 -820.5 24.8 182 41.3 Other ¹ 67 952.6 122.5 136 -22.3 Peru +17.6% South America 164 44.2 5.8 635 5.6 Peru +6.1% (1) Other includes BBVA Forum (Chile), Venezuela and Uruguay. Argentina Argentina +273.5% +163.2% Other Other KEY RATIOS +14.1% +11.2% 1 CUSTOMER SPREAD (%) COST OF RISK (YTD, %) 1 Lending Cust.Funds (1) Performing loans and Cust.Funds under management, excluding repos. ▰ Colombia: NAP at 90 Mn.€ in FY 2024. QoQ evolution driven by lower NTI and some extraordinary expenses. Core revenues remain flat and risk metrics stabilize in 4Q. ▰ Peru: NAP at 227 Mn€ in FY24. Quarterly evolution supported by core revenues increase (+2.3% QoQ constant €) levered on sound activity growth. Risk metrics continue to improve. ▰ Argentina: NAP at 182 Mn€ in FY24 driven by higher core revenues on the back of the recovery in the demand for credit. Impairments increased mainly driven by activity growth and higher needs in the retail portfolio. Note: Inflation rate ARG: 8.0% 4Q24 vs 12.2% in 3Q24 and 117.7% in 12M24 (vs 211.1% 12M23) 4Q23 3Q24 4Q24 4Q23 3Q24 4Q24

2024 Earnings 29 & 2022 2023 2026 2027 2024 2025 Takeaways Outlook

2024 Earnings 30 2024 Takeaways Significant progress in Delivering exceptional Growing our franchise the execution of our value creation for our with industry-leading strategy centered on stakeholders profitability and innovation, digitization efficiency and sustainability We have clearly Net Attributable Profit Significant Increase outperformed our follows a very positive of Shareholder ambitious 2021-24 trend Distributions strategic plan goals

2024 Earnings 31 2025 Outlook SPAIN MEXICO GROUP Loans: loan growth at low to mid Loans: growth at high single single digit, outperforming the digit market ROTE at high teens, similar to NII: grow slightly below NII: slight decline, supported by activity growth 2024 activity and price management Expenses: growing slightly Fees: low single digit growth below 2024. Efficiency at Efficiency ratio around 40% current levels Expenses: slight growth, less than inflation. Efficiency c.36% CoR at around 350 bps CoR at or slightly below 38 bps SOUTH AMERICA TURKEY Net Profit close to 1 billion €, with CoR: below 270 bps a better second half of the year CoR: around 180 bps Note: Mexico guidance in constant €. Turkey macro assumptions, with the latest BBVA Research estimates, as follows: FX end of period: 48.10 TRY/€, Inflation (end of period): 26,5%, CBRT interest rate (end of period): 31%
2024 Earnings 32 Annex CET1 Sensitivity to market Net Attributable Profit 01 07 impacts evolution CET1 evolution YtD & RWAs by Gross Income breakdown 02 08 business area Book Value of the main P&L Accounts by business unit 03 09 subsidiaries 04 Customer spread by country TBV per share & dividends 10 evolution Stages breakdown by business 05 area MREL 11 ALCO portfolio, NII sensitivity 06 and LCRs & NSFRs Digital metrics 12
2024 Earnings 33 Net Attributable Profit evolution
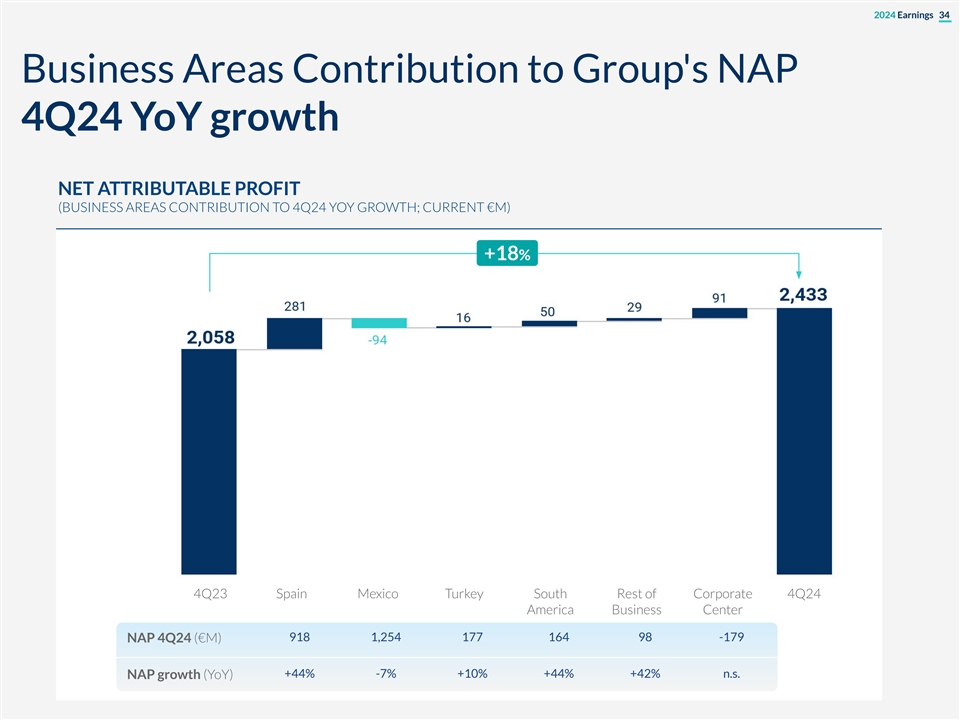
2024 Earnings 34 Business Areas Contribution to Group's NAP 4Q24 YoY growth NET ATTRIBUTABLE PROFIT (BUSINESS AREAS CONTRIBUTION TO 4Q24 YOY GROWTH; CURRENT €M) +18% 4Q23 Spain Mexico Turkey South Rest of Corporate 4Q24 America Business Center 918 1,254 177 164 98 -179 NAP 4Q24 (€M) +44% -7% +10% +44% +42% n.s. NAP growth (YoY)

2024 Earnings 35 Gross Income breakdown
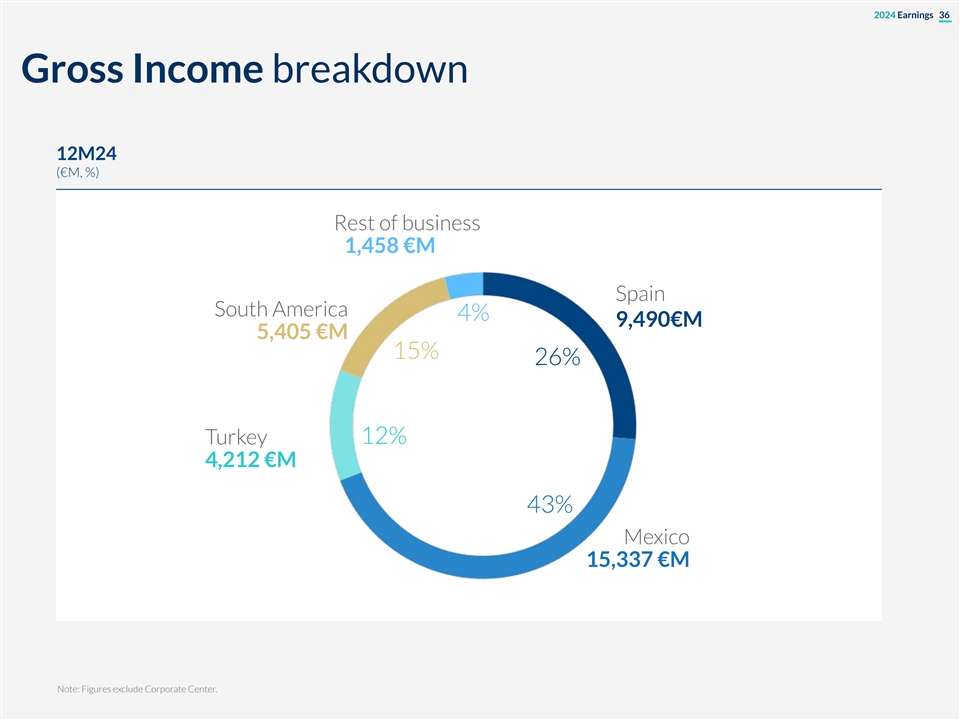
2024 Earnings 36 Gross Income breakdown 12M24 (€M, %) Rest of business 1,458 €M Spain South America 4% 9,490€M 5,405 €M 15% 26% 12% Turkey 4,212 €M 43% Mexico 15,337 €M Note: Figures exclude Corporate Center.

2024 Earnings 37 P&L Accounts by business unit Rest of Business Corporate Center Turkey (hyperinflation adjustment) Argentina (including hyperinflation adjustment) Colombia Peru
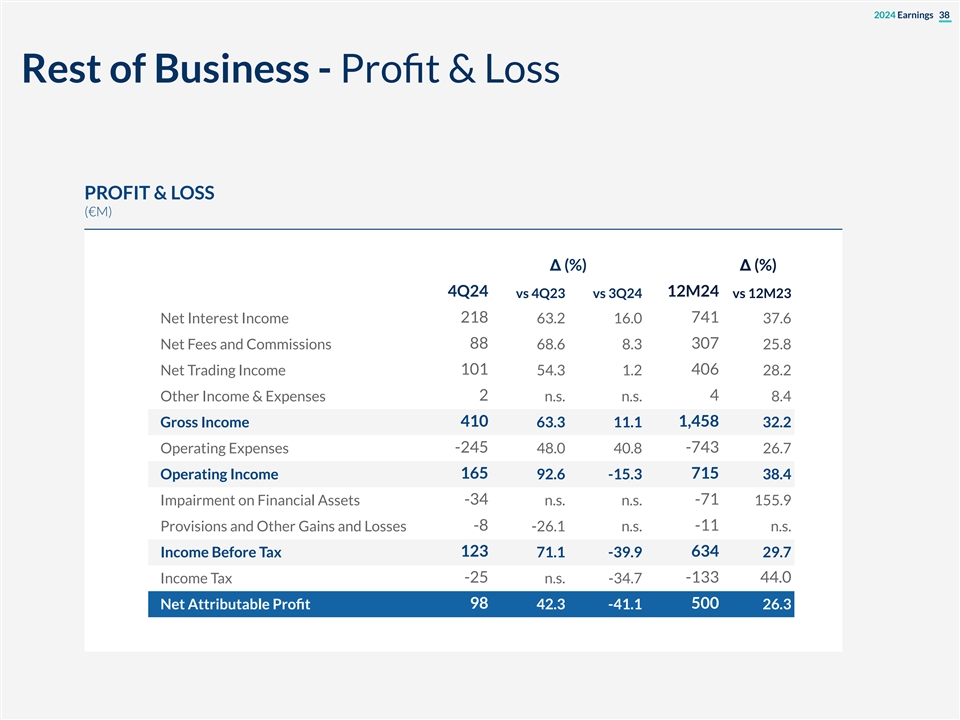
2024 Earnings 38 Rest of Business - Profit & Loss PROFIT & LOSS (€M) Δ (%) Δ (%) 4Q24 12M24 vs 4Q23 vs 3Q24 vs 12M23 218 741 Net Interest Income 63.2 16.0 37.6 Net Fees and Commissions 88 68.6 8.3 307 25.8 101 406 Net Trading Income 54.3 1.2 28.2 Other Income & Expenses 2 n.s. n.s. 4 8.4 410 1,458 Gross Income 63.3 11.1 32.2 Operating Expenses -245 48.0 40.8 -743 26.7 165 715 Operating Income 92.6 -15.3 38.4 Impairment on Financial Assets -34 n.s. n.s. -71 155.9 -8 -11 Provisions and Other Gains and Losses -26.1 n.s. n.s. Income Before Tax 123 71.1 -39.9 634 29.7 -25 -133 44.0 Income Tax n.s. -34.7 Net Attributable Profit 98 42.3 -41.1 500 26.3
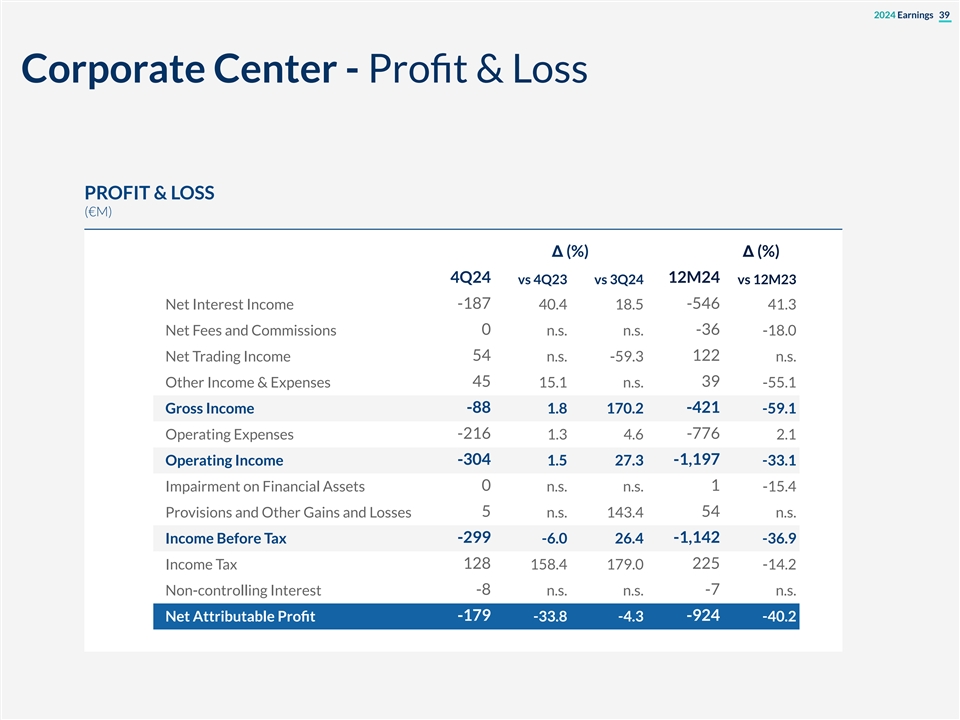
2024 Earnings 39 Corporate Center - Profit & Loss PROFIT & LOSS (€M) Δ (%) Δ (%) 4Q24 12M24 vs 4Q23 vs 3Q24 vs 12M23 Net Interest Income -187 40.4 18.5 -546 41.3 0 -36 Net Fees and Commissions n.s. n.s. -18.0 Net Trading Income 54 n.s. -59.3 122 n.s. 45 39 Other Income & Expenses 15.1 n.s. -55.1 Gross Income -88 1.8 170.2 -421 -59.1 -216 -776 Operating Expenses 1.3 4.6 2.1 Operating Income -304 1.5 27.3 -1,197 -33.1 0 1 Impairment on Financial Assets n.s. n.s. -15.4 Provisions and Other Gains and Losses 5 n.s. 143.4 54 n.s. -299 -1,142 Income Before Tax -6.0 26.4 -36.9 Income Tax 128 158.4 179.0 225 -14.2 -8 -7 Non-controlling Interest n.s. n.s. n.s. Net Attributable Profit -179 -33.8 -4.3 -924 -40.2
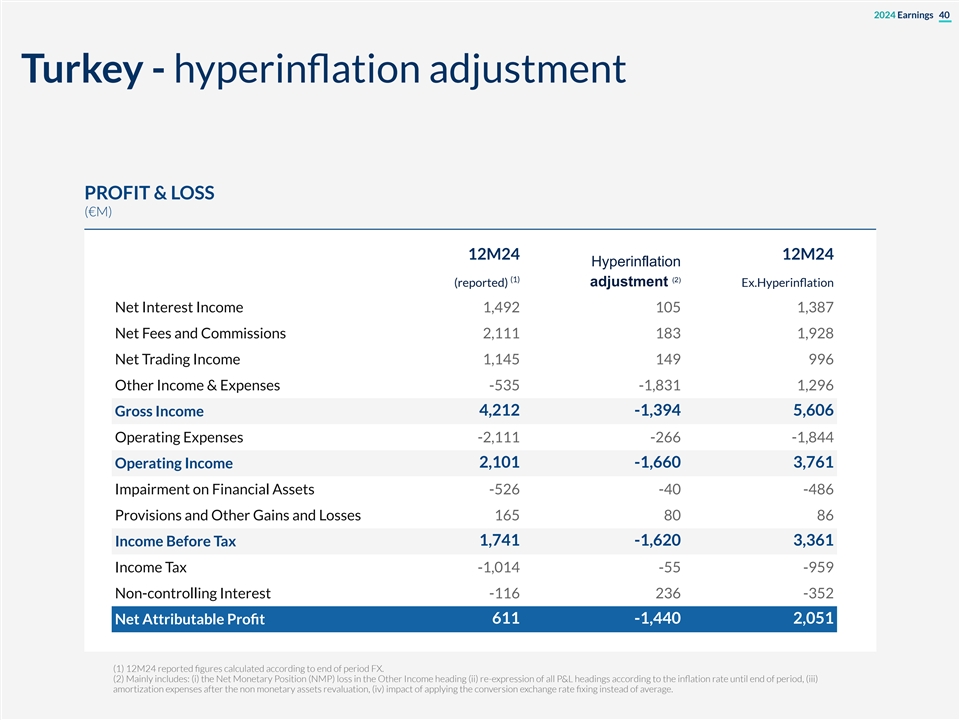
2024 Earnings 40 Turkey - hyperinflation adjustment PROFIT & LOSS (€M) 12M24 12M24 Hyperinflation (1) (2) (reported) adjustment Ex.Hyperinflation Net Interest Income 1,492 105 1,387 Net Fees and Commissions 2,111 183 1,928 Net Trading Income 1,145 149 996 Other Income & Expenses -535 -1,831 1,296 Gross Income 4,212 -1,394 5,606 Operating Expenses -2,111 -266 -1,844 Operating Income 2,101 -1,660 3,761 Impairment on Financial Assets -526 -40 -486 Provisions and Other Gains and Losses 165 80 86 1,741 -1,620 3,361 Income Before Tax Income Tax -1,014 -55 -959 Non-controlling Interest -116 236 -352 Net Attributable Profit 611 -1,440 2,051 (1) 12M24 reported figures calculated according to end of period FX. (2) Mainly includes: (i) the Net Monetary Position (NMP) loss in the Other Income heading (ii) re-expression of all P&L headings according to the inflation rate until end of period, (iii) amortization expenses after the non monetary assets revaluation, (iv) impact of applying the conversion exchange rate fixing instead of average.
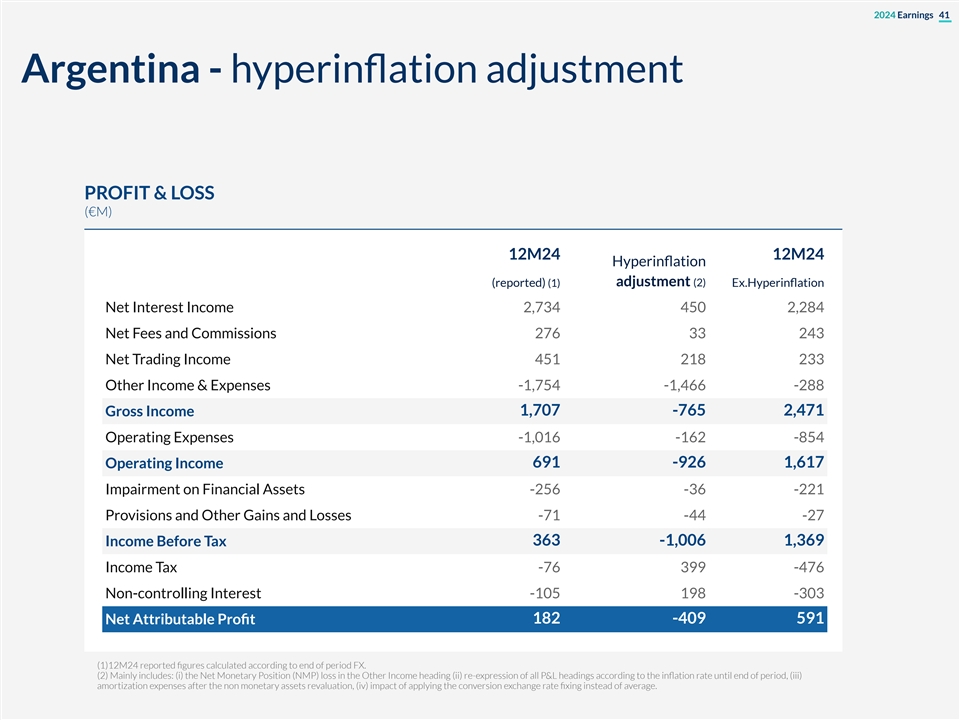
2024 Earnings 41 Argentina - hyperinflation adjustment PROFIT & LOSS (€M) 12M24 12M24 Hyperinflation (reported) (1) adjustment (2) Ex.Hyperinflation Net Interest Income 2,734 450 2,284 Net Fees and Commissions 276 33 243 Net Trading Income 451 218 233 Other Income & Expenses -1,754 -1,466 -288 Gross Income 1,707 -765 2,471 Operating Expenses -1,016 -162 -854 Operating Income 691 -926 1,617 Impairment on Financial Assets -256 -36 -221 Provisions and Other Gains and Losses -71 -44 -27 363 -1,006 1,369 Income Before Tax Income Tax -76 399 -476 Non-controlling Interest -105 198 -303 Net Attributable Profit 182 -409 591 (1)12M24 reported figures calculated according to end of period FX. (2) Mainly includes: (i) the Net Monetary Position (NMP) loss in the Other Income heading (ii) re-expression of all P&L headings according to the inflation rate until end of period, (iii) amortization expenses after the non monetary assets revaluation, (iv) impact of applying the conversion exchange rate fixing instead of average.
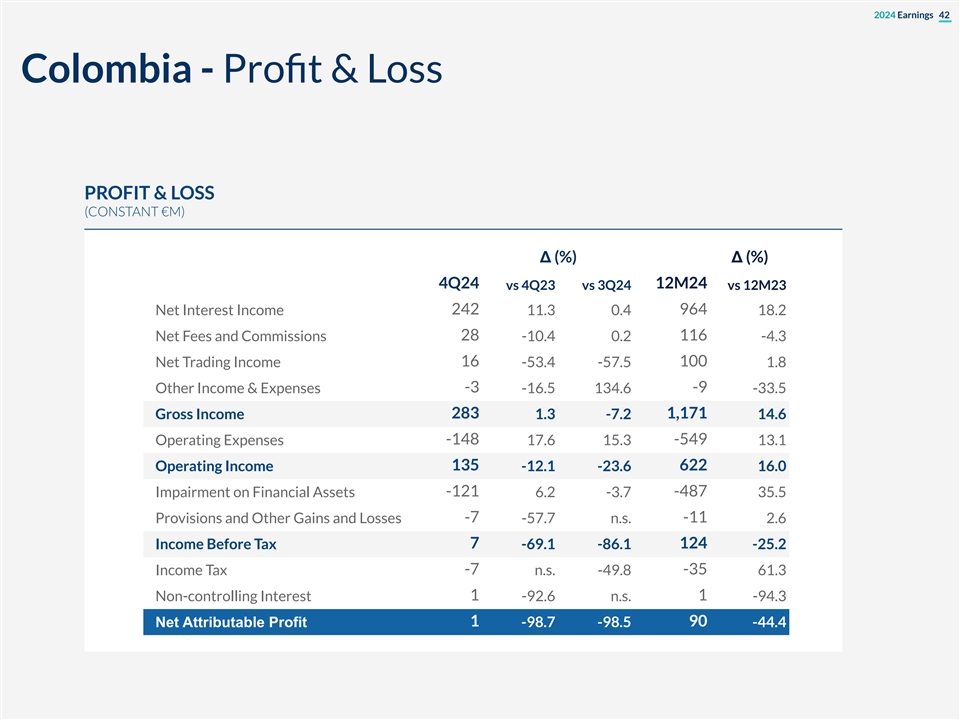
2024 Earnings 42 Colombia - Profit & Loss PROFIT & LOSS (CONSTANT €M) Δ (%) Δ (%) 4Q24 12M24 vs 4Q23 vs 3Q24 vs 12M23 242 964 Net Interest Income 11.3 0.4 18.2 Net Fees and Commissions 28 -10.4 0.2 116 -4.3 16 100 Net Trading Income -53.4 -57.5 1.8 Other Income & Expenses -3 -16.5 134.6 -9 -33.5 283 1,171 Gross Income 1.3 -7.2 14.6 Operating Expenses -148 17.6 15.3 -549 13.1 135 622 Operating Income -12.1 -23.6 16.0 Impairment on Financial Assets -121 6.2 -3.7 -487 35.5 -7 -11 Provisions and Other Gains and Losses -57.7 n.s. 2.6 Income Before Tax 7 -69.1 -86.1 124 -25.2 -7 -35 Income Tax n.s. -49.8 61.3 Non-controlling Interest 1 -92.6 n.s. 1 -94.3 1 90 Net Attributable Profit -98.7 -98.5 -44.4
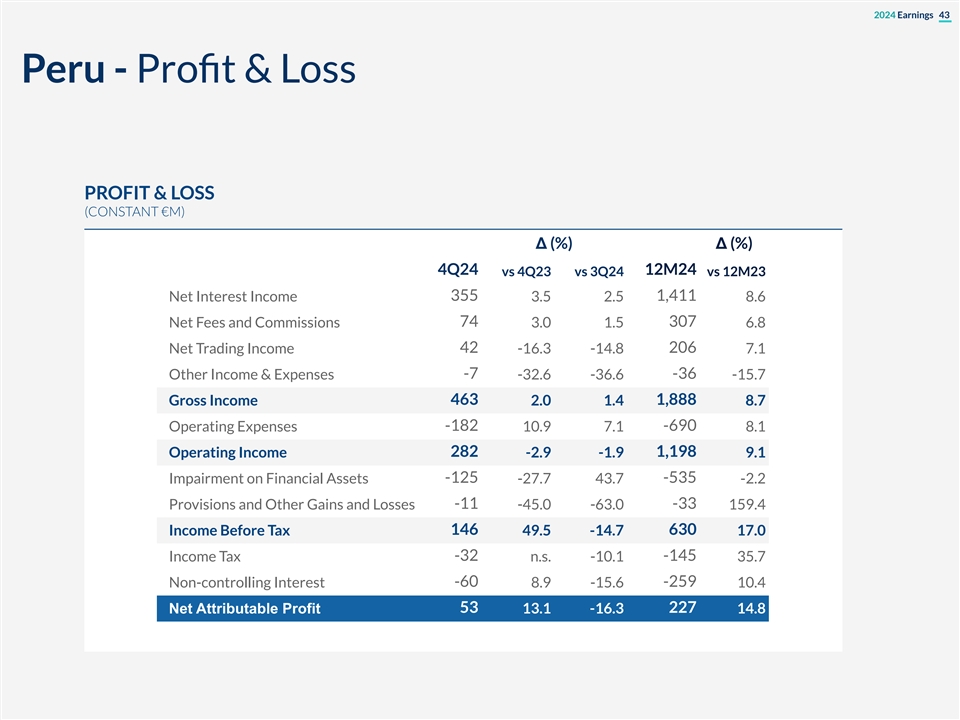
2024 Earnings 43 Peru - Profit & Loss PROFIT & LOSS (CONSTANT €M) Δ (%) Δ (%) 4Q24 12M24 vs 4Q23 vs 3Q24 vs 12M23 Net Interest Income 355 3.5 2.5 1,411 8.6 74 307 Net Fees and Commissions 3.0 1.5 6.8 Net Trading Income 42 -16.3 -14.8 206 7.1 -7 -36 Other Income & Expenses -32.6 -36.6 -15.7 Gross Income 463 2.0 1.4 1,888 8.7 -182 -690 Operating Expenses 10.9 7.1 8.1 Operating Income 282 -2.9 -1.9 1,198 9.1 -125 -535 Impairment on Financial Assets -27.7 43.7 -2.2 Provisions and Other Gains and Losses -11 -45.0 -63.0 -33 159.4 146 630 Income Before Tax 49.5 -14.7 17.0 Income Tax -32 n.s. -10.1 -145 35.7 -60 -259 Non-controlling Interest 8.9 -15.6 10.4 Net Attributable Profit 53 13.1 -16.3 227 14.8

2024 Earnings 44 Customer Spread by country
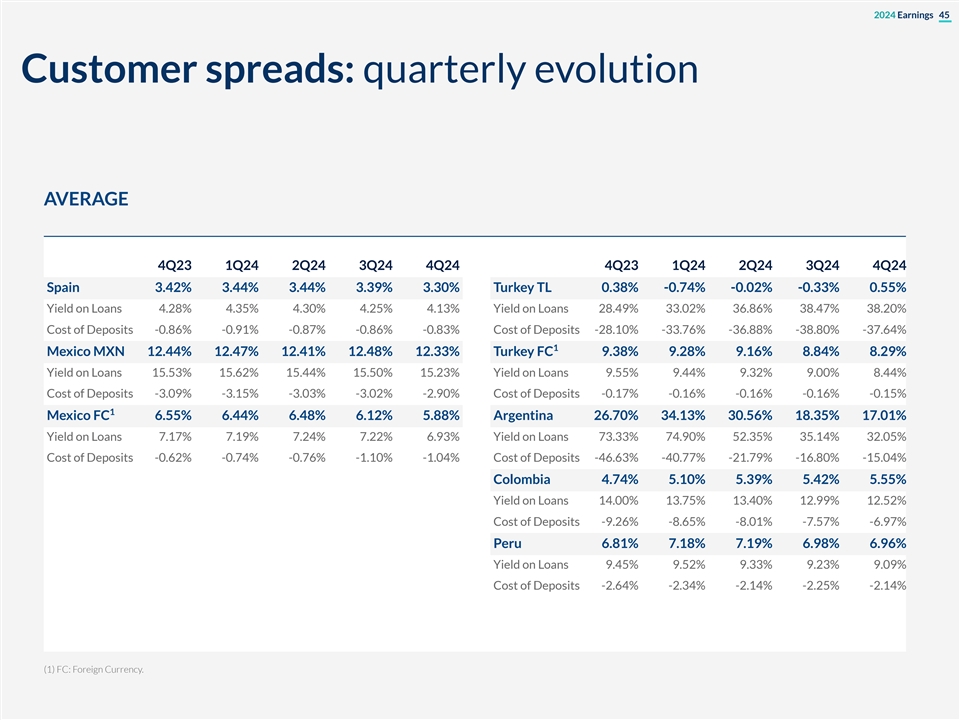
2024 Earnings 45 Customer spreads: quarterly evolution AVERAGE 4Q23 1Q24 2Q24 3Q24 4Q24 4Q23 1Q24 2Q24 3Q24 4Q24 Spain 3.42% 3.44% 3.44% 3.39% 3.30% Turkey TL 0.38% -0.74% -0.02% -0.33% 0.55% Yield on Loans 4.28% 4.35% 4.30% 4.25% 4.13% Yield on Loans 28.49% 33.02% 36.86% 38.47% 38.20% Cost of Deposits -0.86% -0.91% -0.87% -0.86% -0.83% Cost of Deposits -28.10% -33.76% -36.88% -38.80% -37.64% 1 Mexico MXN 12.44% 12.47% 12.41% 12.48% 12.33% Turkey FC 9.38% 9.28% 9.16% 8.84% 8.29% Yield on Loans 15.53% 15.62% 15.44% 15.50% 15.23% Yield on Loans 9.55% 9.44% 9.32% 9.00% 8.44% Cost of Deposits -3.09% -3.15% -3.03% -3.02% -2.90% Cost of Deposits -0.17% -0.16% -0.16% -0.16% -0.15% 1 Mexico FC 6.55% 6.44% 6.48% 6.12% 5.88% Argentina 26.70% 34.13% 30.56% 18.35% 17.01% Yield on Loans 7.17% 7.19% 7.24% 7.22% 6.93% Yield on Loans 73.33% 74.90% 52.35% 35.14% 32.05% Cost of Deposits -0.62% -0.74% -0.76% -1.10% -1.04% Cost of Deposits -46.63% -40.77% -21.79% -16.80% -15.04% Colombia 4.74% 5.10% 5.39% 5.42% 5.55% Yield on Loans 14.00% 13.75% 13.40% 12.99% 12.52% Cost of Deposits -9.26% -8.65% -8.01% -7.57% -6.97% Peru 6.81% 7.18% 7.19% 6.98% 6.96% Yield on Loans 9.45% 9.52% 9.33% 9.23% 9.09% Cost of Deposits -2.64% -2.34% -2.14% -2.25% -2.14% (1) FC: Foreign Currency.
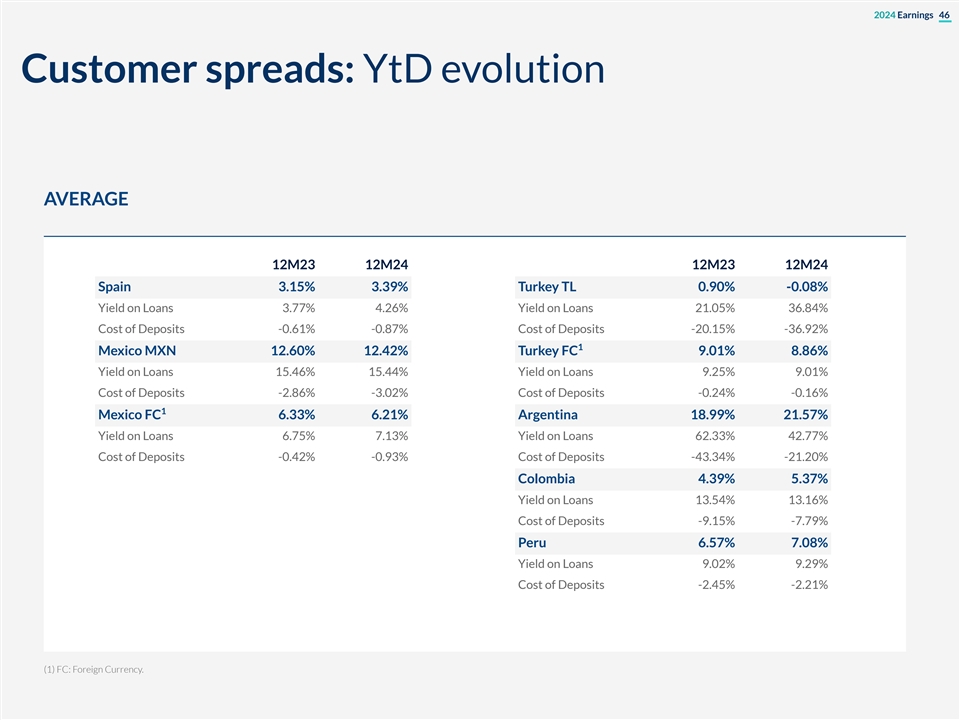
2024 Earnings 46 Customer spreads: YtD evolution AVERAGE 12M23 12M24 12M23 12M24 Spain 3.15% 3.39% Turkey TL 0.90% -0.08% Yield on Loans 3.77% 4.26% Yield on Loans 21.05% 36.84% Cost of Deposits -0.61% -0.87% Cost of Deposits -20.15% -36.92% 1 Mexico MXN 12.60% 12.42% Turkey FC 9.01% 8.86% Yield on Loans 15.46% 15.44% Yield on Loans 9.25% 9.01% Cost of Deposits -2.86% -3.02% Cost of Deposits -0.24% -0.16% 1 Mexico FC 6.33% 6.21% Argentina 18.99% 21.57% Yield on Loans 6.75% 7.13% Yield on Loans 62.33% 42.77% Cost of Deposits -0.42% -0.93% Cost of Deposits -43.34% -21.20% Colombia 4.39% 5.37% Yield on Loans 13.54% 13.16% Cost of Deposits -9.15% -7.79% Peru 6.57% 7.08% Yield on Loans 9.02% 9.29% Cost of Deposits -2.45% -2.21% (1) FC: Foreign Currency.

2024 Earnings 47 Stages breakdown by business areas
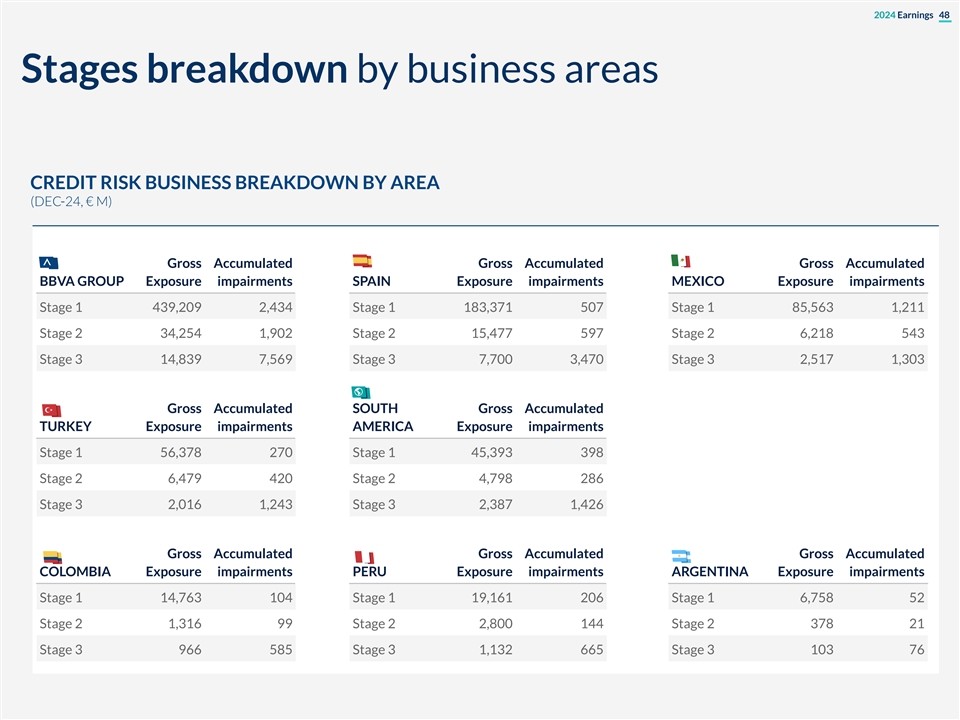
2024 Earnings 48 Stages breakdown by business areas CREDIT RISK BUSINESS BREAKDOWN BY AREA (DEC-24, € M) Gross Accumulated Gross Accumulated Gross Accumulated BBVA GROUP Exposure impairments SPAIN Exposure impairments MEXICO Exposure impairments Stage 1 439,209 2,434 Stage 1 183,371 507 Stage 1 85,563 1,211 Stage 2 34,254 1,902 Stage 2 15,477 597 Stage 2 6,218 543 Stage 3 14,839 7,569 Stage 3 7,700 3,470 Stage 3 2,517 1,303 Gross Accumulated SOUTH Gross Accumulated TURKEY Exposure impairments AMERICA Exposure impairments Stage 1 56,378 270 Stage 1 45,393 398 Stage 2 6,479 420 Stage 2 4,798 286 Stage 3 2,016 1,243 Stage 3 2,387 1,426 Gross Accumulated Gross Accumulated Gross Accumulated COLOMBIA Exposure impairments PERU Exposure impairments ARGENTINA Exposure impairments Stage 1 14,763 104 Stage 1 19,161 206 Stage 1 6,758 52 Stage 2 1,316 99 Stage 2 2,800 144 Stage 2 378 21 Stage 3 966 585 Stage 3 1,132 665 Stage 3 103 76

2024 Earnings 49 ALCO Portfolio, NII Sensitivity and LCRs & NSFRs
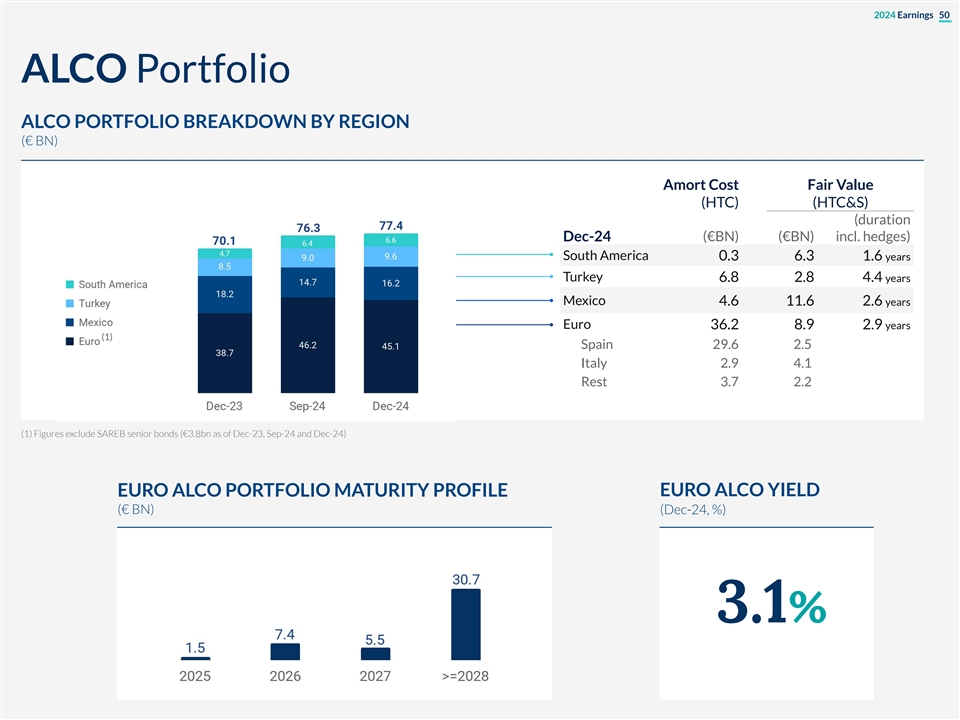
2024 Earnings 50 ALCO Portfolio ALCO PORTFOLIO BREAKDOWN BY REGION (€ BN) Amort Cost Fair Value (HTC) (HTC&S) (duration Dec-24 (€BN) (€BN) incl. hedges) South America 0.3 6.3 1.6 years Turkey 6.8 2.8 4.4 years Mexico 4.6 11.6 2.6 years Euro 36.2 8.9 2.9 years (1) Spain 29.6 2.5 Italy 2.9 4.1 Rest 3.7 2.2 (1) Figures exclude SAREB senior bonds (€3.8bn as of Dec-23, Sep-24 and Dec-24) EURO ALCO YIELD EURO ALCO PORTFOLIO MATURITY PROFILE (€ BN) (Dec-24, %) 3.1%
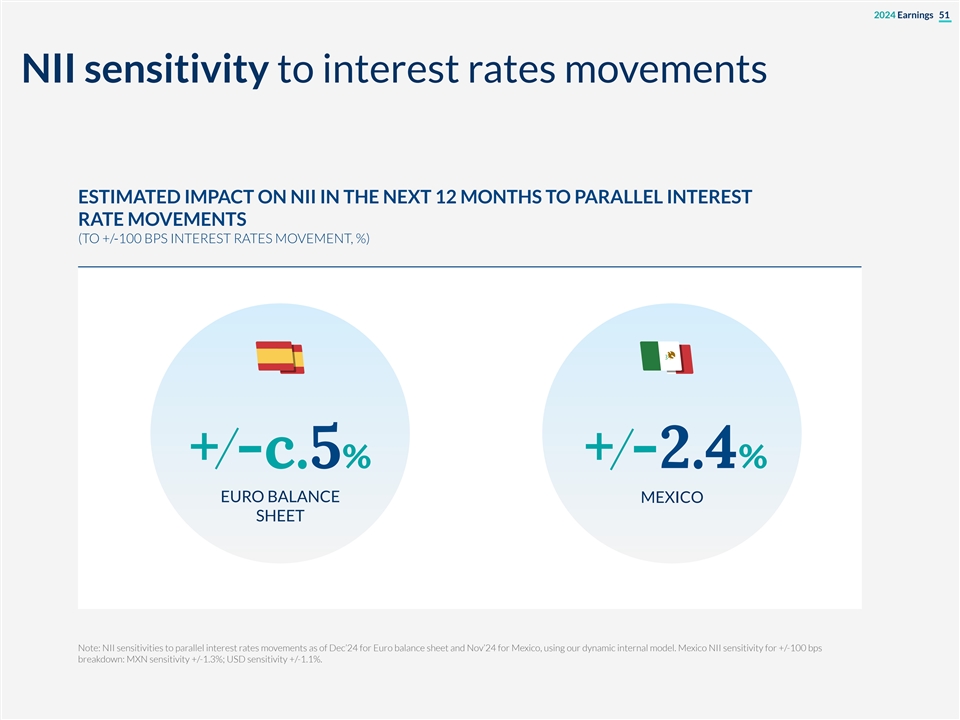
2024 Earnings 51 NII sensitivity to interest rates movements ESTIMATED IMPACT ON NII IN THE NEXT 12 MONTHS TO PARALLEL INTEREST RATE MOVEMENTS (TO +/-100 BPS INTEREST RATES MOVEMENT, %) + -c.5% + -2.4% EURO BALANCE MEXICO SHEET Note: NII sensitivities to parallel interest rates movements as of Dec’24 for Euro balance sheet and Nov’24 for Mexico, using our dynamic internal model. Mexico NII sensitivity for +/-100 bps breakdown: MXN sensitivity +/-1.3%; USD sensitivity +/-1.1%.
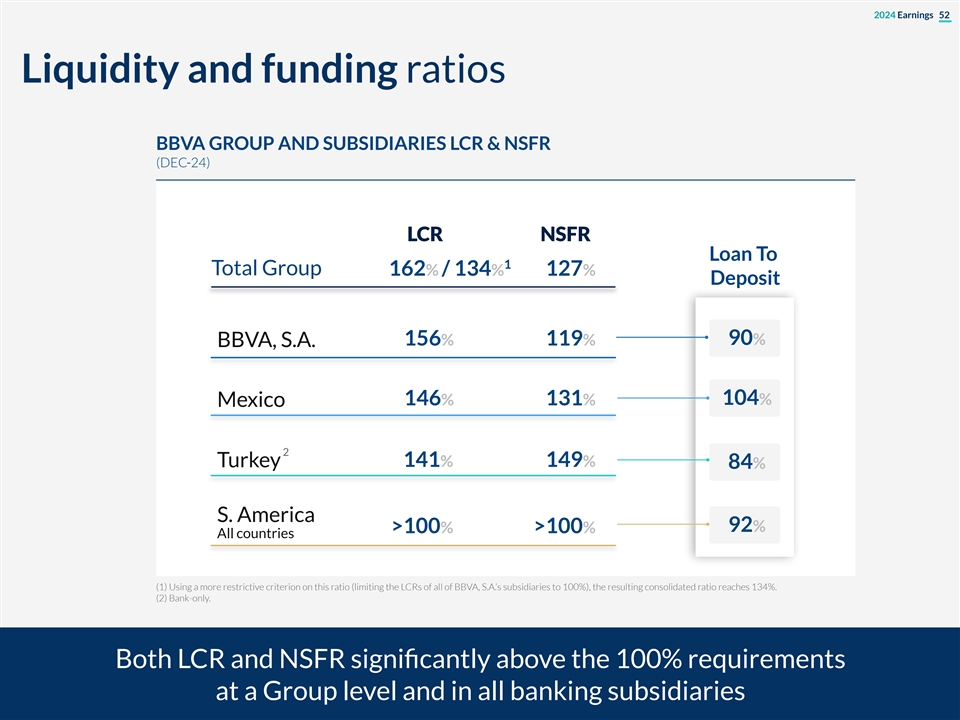
2024 Earnings 52 Liquidity and funding ratios BBVA GROUP AND SUBSIDIARIES LCR & NSFR (DEC-24) LCR NSFR Loan To 1 Total Group 162% / 134% 127% Deposit 156% 119% 90% BBVA, S.A. 146% 131% 104% Mexico 2 141% 149% Turkey 84% S. America 92% >100% >100% All countries (1) Using a more restrictive criterion on this ratio (limiting the LCRs of all of BBVA, S.A.’s subsidiaries to 100%), the resulting consolidated ratio reaches 134%. (2) Bank-only. Both LCR and NSFR significantly above the 100% requirements at a Group level and in all banking subsidiaries
2024 Earnings 53 CET1 Sensitivity to market impacts

2024 Earnings 54 1 CET1 Sensitivity to Market Impacts 2 TO A 10% CURRENCY DEPRECIATION TO A 10% DECLINE IN TELEFONICA’S (DEC-24) SHARE PRICE (DEC-24) MXN -9bps TRY -4bps -2 bps USD +20bps TO +100 BPS MOVEMENT IN THE TO +100 BPS MOVEMENT IN THE MEXICAN SOVEREIGN BOND SPANISH SOVEREIGN BOND (DEC-24) (DEC-24) -6 bps -9 bps th (1) CET1 sensitivity considering the FL capital ratio as of December 31 , 2024 (2) This sensitivity does not include the cost of capital hedges, which are currently estimated at 3 bps per quarter for MXN and 2 bps per quarter for TRY.
2024 Earnings 55 CET1 evolution YtD & RWAs by business area
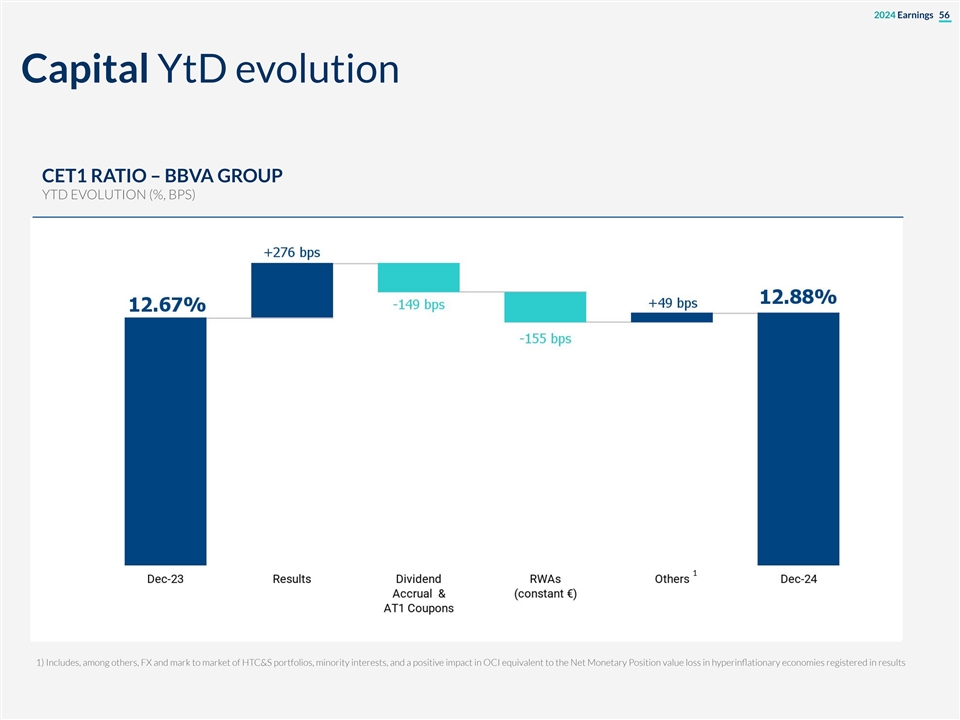
2024 Earnings 56 Capital YtD evolution CET1 RATIO – BBVA GROUP YTD EVOLUTION (%, BPS) 1 1) Includes, among others, FX and mark to market of HTC&S portfolios, minority interests, and a positive impact in OCI equivalent to the Net Monetary Position value loss in hyperinflationary economies registered in results
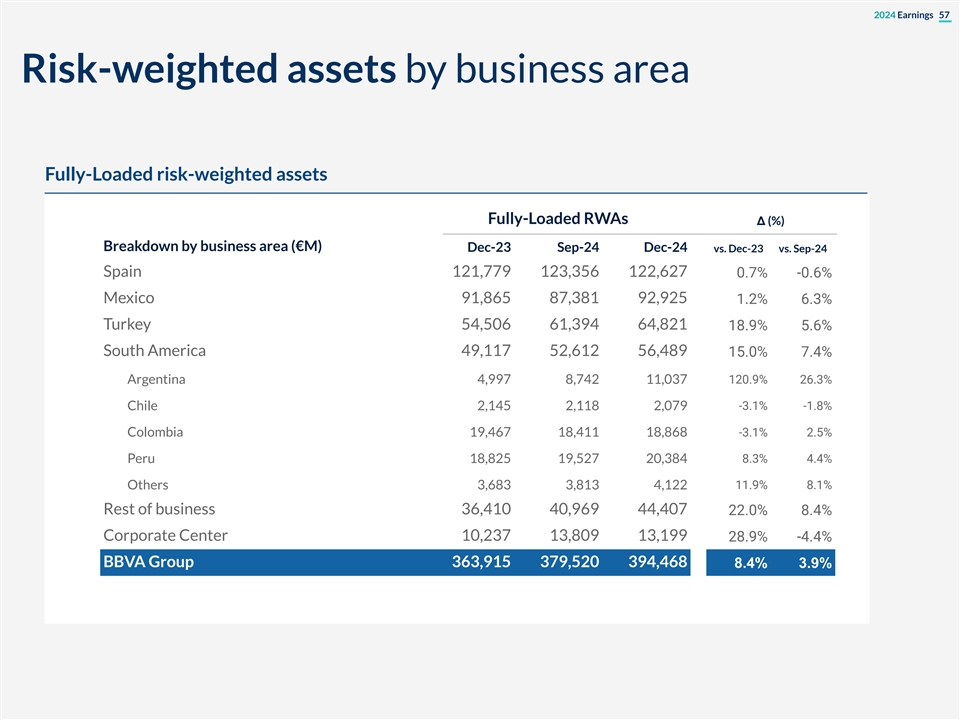
2024 Earnings 57 Risk-weighted assets by business area Fully-Loaded risk-weighted assets Fully-Loaded RWAs Δ (%) Breakdown by business area (€M) Dec-23 Sep-24 Dec-24 vs. Dec-23 vs. Sep-24 Spain 121,779 123,356 122,6270.7%-0.6% Mexico 91,865 87,381 92,9251.2%6.3% Turkey 54,506 61,394 64,821 18.9%5.6% South America 49,117 52,612 56,489 15.0%7.4% Argentina 4,997 8,742 11,037120.9%26.3% Chile 2,145 2,118 2,079-3.1%-1.8% -3.1%2.5% Colombia 19,467 18,411 18,868 Peru 18,825 19,527 20,3848.3%4.4% Others 3,683 3,813 4,12211.9%8.1% Rest of business 36,410 40,969 44,407 22.0%8.4% Corporate Center 10,237 13,809 13,19928.9%-4.4% BBVA Group 363,915 379,520 394,468 8.4% 3.9%

2024 Earnings 58 Book Value of the main subsidiaries
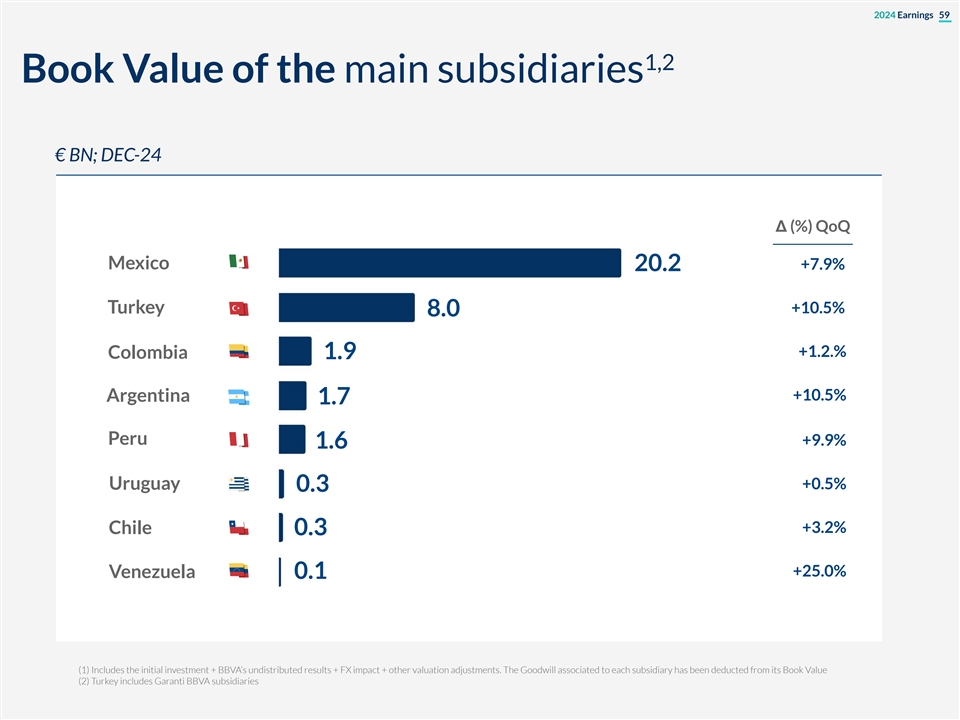
2024 Earnings 59 1,2 Book Value of the main subsidiaries € BN; DEC-24 Δ (%) QoQ Mexico +7.9% 20.2 Turkey +10.5% 8.0 +1.2.% Colombia 1.9 +10.5% Argentina 1.7 Peru +9.9% 1.6 +0.5% Uruguay 0.3 +3.2% Chile 0.3 +25.0% Venezuela 0.1 (1) Includes the initial investment + BBVA’s undistributed results + FX impact + other valuation adjustments. The Goodwill associated to each subsidiary has been deducted from its Book Value (2) Turkey includes Garanti BBVA subsidiaries
2024 Earnings 60 TBV per share & dividends evolution
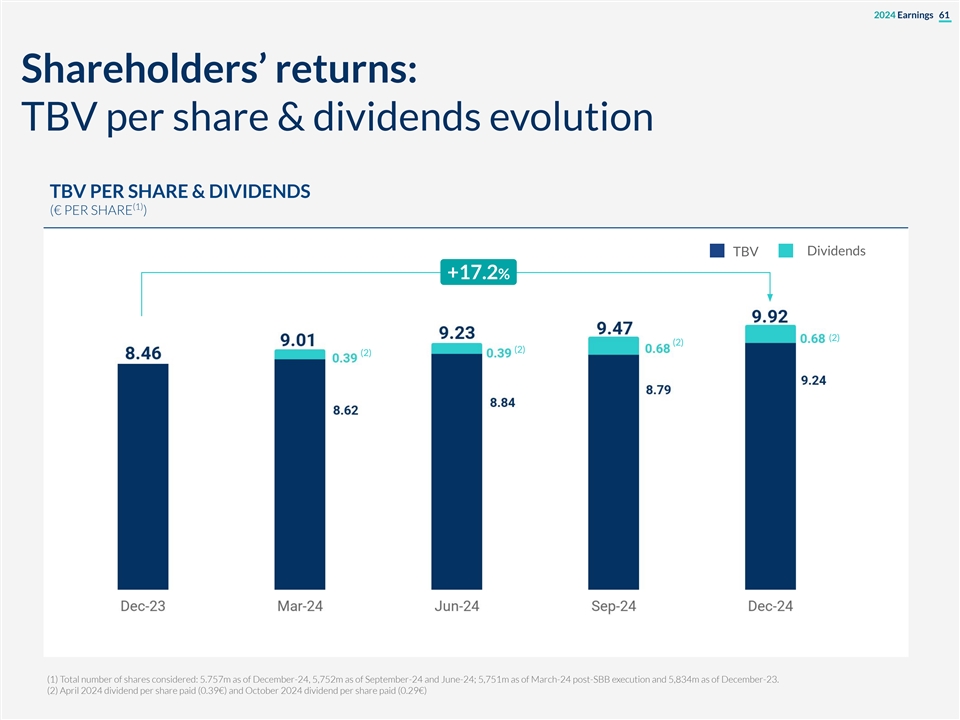
2024 Earnings 61 Shareholders’ returns: TBV per share & dividends evolution TBV PER SHARE & DIVIDENDS (1) (€ PER SHARE ) TBV Dividends +17.2% (2) (2) (2) (2) (1) Total number of shares considered: 5.757m as of December-24, 5,752m as of September-24 and June-24; 5,751m as of March-24 post-SBB execution and 5,834m as of December-23. (2) April 2024 dividend per share paid (0.39€) and October 2024 dividend per share paid (0.29€)

2024 Earnings 62 MREL
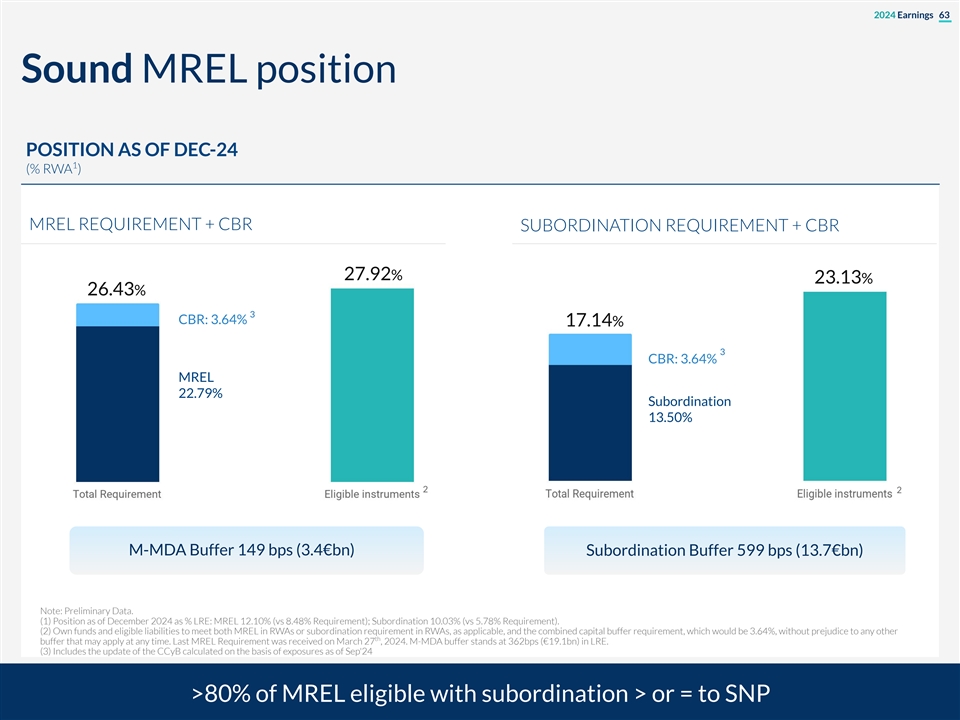
2024 Earnings 63 Sound MREL position POSITION AS OF DEC-24 1 (% RWA ) MREL REQUIREMENT + CBR SUBORDINATION REQUIREMENT + CBR 27.92% 23.13% 26.43% 3 CBR: 3.64% 17.14% 3 CBR: 3.64% MREL 22.79% Subordination 13.50% 2 2 M-MDA Buffer 149 bps (3.4€bn) Subordination Buffer 599 bps (13.7€bn) Note: Preliminary Data. (1) Position as of December 2024 as % LRE: MREL 12.10% (vs 8.48% Requirement); Subordination 10.03% (vs 5.78% Requirement). (2) Own funds and eligible liabilities to meet both MREL in RWAs or subordination requirement in RWAs, as applicable, and the combined capital buffer requirement, which would be 3.64%, without prejudice to any other th buffer that may apply at any time. Last MREL Requirement was received on March 27 , 2024. M-MDA buffer stands at 362bps (€19.1bn) in LRE. (3) Includes the update of the CCyB calculated on the basis of exposures as of Sep'24 >80% of MREL eligible with subordination > or = to SNP
2024 Earnings 64 Digital metrics
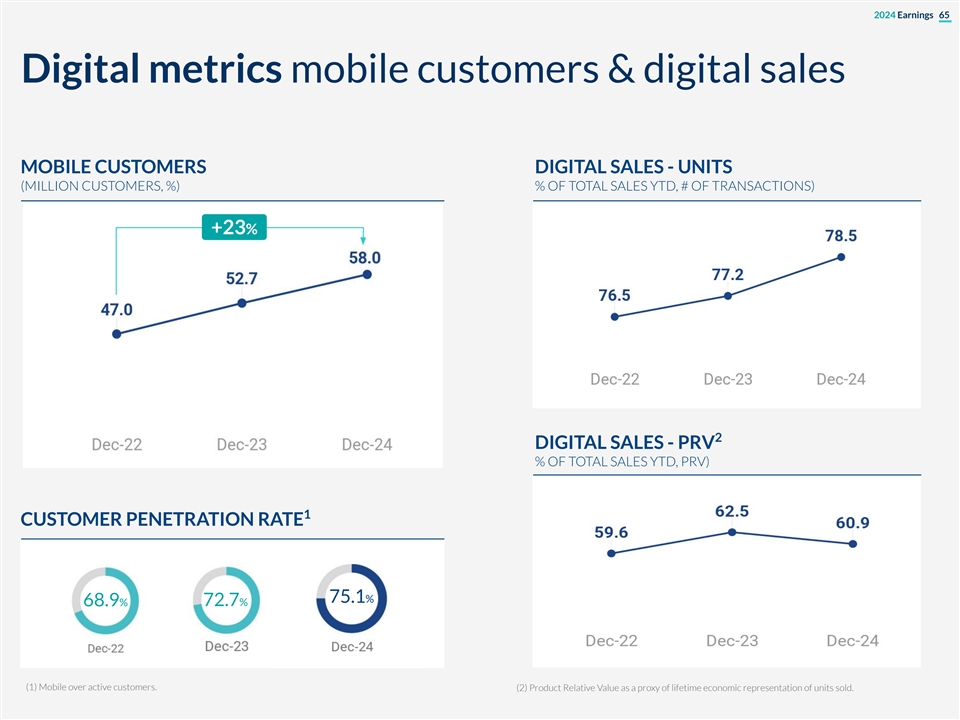
2024 Earnings 65 Digital metrics mobile customers & digital sales MOBILE CUSTOMERS DIGITAL SALES - UNITS (MILLION CUSTOMERS, %) % OF TOTAL SALES YTD, # OF TRANSACTIONS) +23% 2 DIGITAL SALES - PRV % OF TOTAL SALES YTD, PRV) 1 CUSTOMER PENETRATION RATE 75.1% 68.9% 72.7% (1) Mobile over active customers. (2) Product Relative Value as a proxy of lifetime economic representation of units sold.

SIGNATURE
Pursuant to the requirements of the Securities Exchange Act of 1934, the registrant has duly caused this report to be signed on its behalf by the undersigned, thereunto duly authorized.
| Banco Bilbao Vizcaya Argentaria, S.A. | ||||||
| Date: January 30, 2025 | ||||||
| By: /s/ MªÁngeles Peláez Morón | ||||||
| Name: MªÁngeles Peláez Morón | ||||||
| Title: Head of Accounting & Regulatory Reporting | ||||||