UNITED STATES
SECURITIES AND EXCHANGE COMMISSION
Washington, D.C. 20549
FORM N-CSR
CERTIFIED SHAREHOLDER REPORT OF REGISTERED
MANAGEMENT INVESTMENT COMPANIES
| Investment Company Act file number | 811-05685 | |
| Williamsburg Investment Trust |
| (Exact name of registrant as specified in charter) |
| 225 Pictoria Drive, Suite 450 Cincinnati, Ohio | 45246 |
| (Address of principal executive offices) | (Zip code) |
John Chilton, Esq.
| Sullivan & Worcester LLP 1666 K Street, NW Washington, D.C. 20006 |
| (Name and address of agent for service) |
| Registrant's telephone number, including area code: | (513) 587-3400 | |
| Date of fiscal year end: | March 31 | |
| | | |
| Date of reporting period: | September 30, 2023 | |
Form N-CSR is to be used by management investment companies to file reports with the Commission not later than 10 days after the transmission to stockholders of any report that is required to be transmitted to stockholders under Rule 30e-1 under the Investment Company Act of 1940 (17 CFR 270.30e-1). The Commission may use the information provided on Form N-CSR in its regulatory, disclosure review, inspection, and policymaking roles.
A registrant is required to disclose the information specified by Form N-CSR, and the Commission will make this information public. A registrant is not required to respond to the collection of information contained in Form N-CSR unless the Form displays a currently valid Office of Management and Budget ("OMB") control number. Please direct comments concerning the accuracy of the information collection burden estimate and any suggestions for reducing the burden to the Secretary, Securities and Exchange Commission, 450 Fifth Street, NW, Washington, DC 20549-0609. The OMB has reviewed this collection of information under the clearance requirements of 44 U.S.C. § 3507.
Item 1. Reports to Stockholders.
(a)
| | |
| | |
| | |
| | |
| | |
| | |
| | |
| | |
| | |
| | |
 | Davenport Core Leaders Fund (DAVPX) |
| | |
| | Davenport Value & Income Fund (DVIPX) |
| | |
| | Davenport Equity Opportunities Fund (DEOPX) |
| | |
| | Davenport Small Cap Focus Fund (DSCPX) |
| | |
| | Davenport Balanced Income Fund (DBALX) |
| | |
| | |
| | |
| | |
| SEMI-ANNUAL REPORT |
| | |
| | |
September 30, 2023
(Unaudited) |
| | |
| | |
| | |
| | |
| | |
| | |
| | |
| | |
| | |
| | |
| | |
| | |
| | |
| | |
| | |
| | |
| | |
| | |
| | |
| | |
| | |
| | |
| | |
| | |
| | |
| | |
| | |
| | |
| THE DAVENPORT FUNDS |
| LETTER TO SHAREHOLDERS (Unaudited) | September 30, 2023 |
Dear Shareholders,
Stocks seemed to run out of gas in the third quarter. The S&P 500® Index and Russell 2000® Index lost 3.27% and 5.13%, respectively. Most of the losses were concentrated in September, which historically is the worst month of the year for stocks. It wasn’t surprising to see equity markets stall a bit, especially after a surprising first half rally. Even large cap technology stalwarts cooled off as the artificial intelligence (AI) craze seemed to fade. Year-to-date, the S&P 500® Index and Russell 2000® Index finished the period up 13.07% and 2.54%, respectively.
We think there are a few reasons most stocks have recently lost ground. For starters, we’ve begun to see some signs of consumer stress. Consumers comprise about two-thirds of all economic activity. Recent commentary from numerous retailers suggests consumer spending is a little softer. Goldman Sachs recently noted that credit card losses are rising at their fastest pace since the 2008 financial crisis. This clearly indicates the average consumer’s ability to spend and take on extra debt may be more restrained. The pandemic bounce back appears to have run its course, the government moratorium on student loan payments has ended, and inflation still lurks with the cost of everything from olive oil to car insurance moving higher. Of note, CNBC recently highlighted a recent Fed study showing that 80% of Americans have less cash on hand than they did at the start of the pandemic. The positive offset is that unemployment remains very low and the consumer still appears quite healthy in absolute terms.
The next issue is the Federal Reserve (the “Fed”). Inflation has receded from the extremes of last year, but remains stubbornly high. Major inputs such as oil prices and wages are pushing higher. With inflation still high and economic growth still decent, the Fed sees no need to back away from tighter monetary policy and has embraced a “higher for longer” approach to interest rates. At its September meeting, the Fed held its benchmark interest rate at 5.25%-5.5%, which is the highest level in 22 years. Policymakers also indicated one more rate hike would be coming before year-end and talked down the likelihood of rate cuts next year. Another increase would make a total of 12 rate hikes since policy tightening began in early 2022 and would be the fastest pace of tightening on record. Higher rates can have a dampening effect on borrowing, economic activity and asset values. They also increase the allure of bonds and other fixed income instruments, thereby creating stiffer competition for stocks.
Having described a somewhat cautionary narrative, we also note a large swath of stocks are already trading well off their highs and look attractive. Indeed, the performance of the S&P 500® Index, which year-to-date has largely been driven by a handful of stocks, does not reflect the performance of the average stock. Interestingly, the equal-weighted S&P 500® Index, which adjusts for the outsized contribution of the large tech companies that have led the market, is now up only 1.9% year-to-date. Many names have actually been hitting new 52-week lows. For the trading week that ended September 22, 120 stocks on the New York Stock Exchange hit new 52-week highs while 303 hit new lows, while NASDAQ had 161 new highs compared to 750 new lows. Not surprisingly, shares of income-oriented stocks (e.g. REITs and utilities) that are especially sensitive to higher interest rates have been particularly vulnerable. The same goes for shares of businesses that are more economically sensitive or consumer exposed. This tells us equity markets partially reflect the aforementioned interest rate and consumer headwinds.
We recognize the headwinds facing markets, but have continued to find a number of deals for our strategies. In many of these cases, recent price pullbacks have created alluring risk/reward profiles. With the S&P trading at 18x forward earnings estimates, we wouldn’t classify the overall market as being a great deal in the context of the current interest rate environment. This is especially true if higher wages and financing costs eat into those earnings estimates. However, we think we can earn reasonable returns by identifying solid franchises trading for valuations that already discount some duress (the equal-weighted S&P trades closer to 14x earnings). We also note that, while “higher for longer” is the mantra du jour, the worst of Fed tightening may be behind us. Fresh signs of “peak Fed” could once again breathe life into stocks. Finally, we note sentiment indicators currently sound a bearish tone. The CNN “Fear & Greed Index” currently stands at 25 out of 100, putting it in the “fear” zone. As we’ve seen before, widespread negativity can sometimes reverse and lead to market gains.
Please see our fund letters for discussion of specific ideas and investment themes. Thank you for your trust.
Davenport Core Leaders Fund (DAVPX)
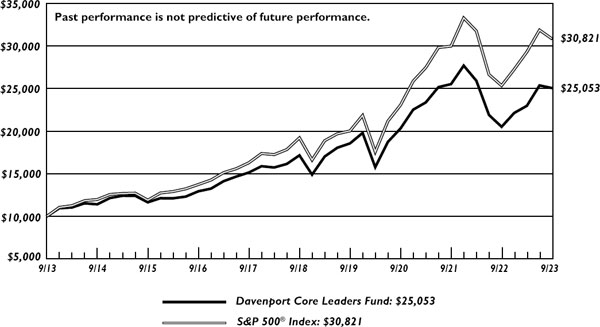
The following chart represents Davenport Core Leaders Fund (DAVPX) performance and the performance of the S&P 500® Index, the Core Leaders Fund’s primary benchmark, for the periods ended September 30, 2023.
| | Q3 2023 | 1 Year | 3 Years* | 5 Years* | 10 Years* | Since
Inception*
1/15/98 |
| Core Leaders Fund (DAVPX) | (1.23%) | 22.16% | 7.25% | 7.86% | 9.62% | 7.24% |
| S&P 500® Index** | (3.27%) | 21.62% | 10.15% | 9.92% | 11.91% | 8.02% |
30-Day SEC Yield: 0.23%; Expense Ratio in current prospectus: 0.87%
Past performance is no guarantee of future results. Investment return and principal value of an investment will fluctuate so that an investor’s shares, when redeemed, may be worth more or less than their original cost. Current performance may be lower or higher than the performance data quoted. Performance data, current to the most recent month-end, may be obtained by calling 1-800-281-3217.
| * | Returns greater than one year are annualized. |
| ** | The S&P 500® Index is comprised of 500 U.S. stocks and is an indicator of the performance of the overall U.S. stock market. An investor cannot invest in an index and its returns are not indicative of the performance of any specific investment. |
The Davenport Core Leaders Fund (DAVPX) declined 1.23% during the third quarter, faring better than the 3.27% decline for the S&P 500® Index. For the calendar year, the Fund is up 13.17%, modestly outpacing the 13.07% gain for the S&P 500®. We are pleased to have made up significant ground relative to the index. More importantly, we remain confident in the Fund’s long-term positioning.
As the technology sector’s outperformance reversed course during the third quarter, our strategy benefitted from stock selection within the group. Positions in Intuit, Inc. (INTU), Alphabet, Inc. (GOOG/L), Adobe, Inc. (ADBE) and Meta Platforms, Inc. (META) all managed to add to year-to-date gains. In addition, underweight stances in large index constituents such as Apple, Inc.
(AAPL) and Microsoft Corporation (MSFT) aided relative results. We added to our position in Microsoft amid weakness, though we remain comfortable with an underweight stance in Apple. Other top contributors included energy names such as EOG Resources, Inc. (EOG) and Pioneer Natural Resources Company (PXD). We exited the latter position amid recent strength in order to re-allocate the funds to better risk/reward opportunities. In addition to Microsoft, two such opportunities included Brookfield Corporation (BN) and Abbott Laboratories (ABT), which were top detractors for the period alongside Martin Marietta Materials, Inc. (MLM) and American Tower Corporation (AMT).
We initiated a position in dominant semiconductor manufacturer NVIDIA Corporation (NVDA) during the quarter. NVIDIA has been a standout performer this year on the back of a transformational shift in data center spend towards accelerated compute technologies and generative AI adoption. NVIDIA’s fundamentals have inflected as the company leverages its leading GPU technology (Graphics Processing Unit) that is key to enabling these new trends. While NVDA is up considerably this year, we note that out year consensus earnings estimates have been revised higher by more than threefold, and the valuation appears more compelling compared to just a few months ago. The company recently delivered an impressive beat and raise earnings report with guidance exceeding the most bullish estimates on the street. However, the stock weakened following the release. While we acknowledge being late to the game with NVIDIA, we believe the muted stock response to an otherwise encouraging quarter created a narrow window of opportunity to initiate a position. The purchase is consistent with our bullish view on the secular growth in artificial intelligence and accelerated computing infrastructure and helps to round out our exposure to the theme. We believe NVIDIA is a durable growth story with a wide moat, great balance sheet, strong cash generation, visionary management team and one of the highest quality pick and shovel plays in the semiconductor space.
While maintaining the stated mandate of “owning a collection of the world’s most established, dominant and durable franchises”, the Fund has leaned a bit more into growth over the past year, resulting in meaningful exposure to powerful themes such as Artificial Intelligence, Cybersecurity, Clean Energy Transition, and Cell & Gene Therapy. As a result, the Fund has benefited from the outperformance of several holdings we emphasized when they were out of favor last year such as Amazon.com (AMZN), Adobe, Inc. (ADBE), Meta Platforms, Inc. (META), and Intuit, Inc. (INTU). While we still think there is room to run in many of these larger holdings, we have been planting seeds for the future with new ideas such as NVIDIA Corporation (NVDA), Vertex Pharmaceuticals, Inc. (VRTX), Palo Alto Networks, Inc. (PANW) and Advanced Micro Devices, Inc. (AMD) and adding to names where we have high long-term conviction that have lagged in the short-term such as Danaher Corporation (DHR), Brookfield Corporation (BN), Walt Disney Company (DIS), and Abbott Laboratories (ABT).
In sum, we are pleased with recent performance, yet remain committed to the continuous process of optimizing the risk/reward profile of the strategy as a whole. As a result, we feel the strategy offers timeliness, quality and significant long-term growth potential.
Recent Purchases:
Abbott Laboratories (ABT) – ABT’s momentum presents an attractive setup going into year-end. Considering ABT’s opportunity for further growth and stock pullback, we thought it was an opportune time to add to the position.
Advanced Micro Devices, Inc. (AMD) – With a broadening suite of products, we believe AMD will align with our bullish thematic view around generative AI and secular growth in data center spend so we elected to initiate a purchase.
Aon, plc (AON) – AON has been a steady value creator over the years and has outperformed the S&P over most time periods. We note that AON has returned significant capital to shareholders via buybacks and plans to remain active near-term. As such, we elected to add to our position.
Brookfield Corporation (BN) – While many of the BN’s assets face challenges, the majority of the real estate portfolio is extremely high quality. We believed investors were overlooking the massive amounts of cash flow this business was generating so we added to our position.
Brookfield Corporation (BN) – Despite a well-received earnings update, the shares are modestly lower from our last add in July. We decided to increase exposure to a proven capital allocator generating strong free cash flow while also trading at a wide discount to its net asset value.
Danaher Corporation (DHR) – With the stock having only modestly rebounded from 2023 lows, we think it is an opportune time to add to the position recognizing that the company may still face several more challenging quarters.
Microsoft Corporation (MSFT) – MSFT has pulled back in recent weeks alongside broader weakness in the technology sector, and valuation has become more compelling for this high-quality compounder. We elected to take advantage of recent weakness in the stock and added to the position.
NVIDIA Corporation (NVDA) – We initiated a position in NVDA and believe the purchase is consistent with our bullish view on the secular growth in artificial intelligence and accelerated computing infrastructure and helps round out our theme.
NVIDIA Corporation (NVDA) – Since our initial purchase, shares of NVDA have pulled back from recent highs, however, our conviction in NVDA’s long-term growth potential is unchanged and we elected to increase our position size.
Palo Alto Networks, Inc. (PANW) – We find PANW’s potential to benefit from secular growth opportunities appealing. Given our views around growth potential, we initiated a position.
UnitedHealth Group, Inc. (UNH) – We feel recent weakness is overdone, resulting in an attractive buying opportunity in a secular grower at a discounted valuation.
Walt Disney Company (DIS) – DIS announced significant cost-cutting efforts. Although challenges remain, we found DIS’s current valuation was compelling and elected to add.
Recent Sales:
Brookfield Asset Management (BAM) – As a reminder, at the end of 2022, Brookfield spun 25% of its asset management entity (BAM) to shareholders, creating two separate entities: BAM and Brookfield Corporation (BN). We elected to sell our position and added more exposure to emphasize BN, which we believe offers the best risk/reward at the moment.
Constellation Brands, Inc. (STZ) – While we remain attracted to STZ and think the company will benefit from sounder capital allocation given activist involvement, we felt we could put the funds to work into more timely situations and sold our position.
Johnson & Johnson (JNJ) – Although we are pleased and consider JNJ a defensive stalwart, we thought relative opportunities in other companies warranted a reallocation of funds and sold our position.
Markel Group, Inc. (MKL) – Although we chipped MKL, we remain confident in their ability to return to double-digit book value growth alongside improved underwriting results, solid MKL Ventures cash flows and attractive investment returns.
Pioneer Natural Resources Company (PXD) – PXD has caught a recent bid alongside the rest of the energy sector. While we are attracted to the company’s quality asset base and capital return policy, we elected to take advantage of recent strength and chipped our position.
Pioneer Natural Resources Company (PXD) – We elected to chip again to take advantage of recent strength and redeploy funds.
Pioneer Natural Resources Company (PXD) – While we appreciate the PXD’s high-quality asset base and cash return policy, we felt the funds could be used in more timely ideas that offer better long-term growth prospects and ultimately elected to sell.
TJX Companies, Inc. (TJX) – TJX has recently benefited from consistent results and the anticipation of a consumer tradedown phenomenon during the back-to school shopping season. Though we think results will be deserving of the stock’s premium multiple, we elected to take some profits and reduce the position size modestly.
Davenport Value & Income Fund (DVIPX)
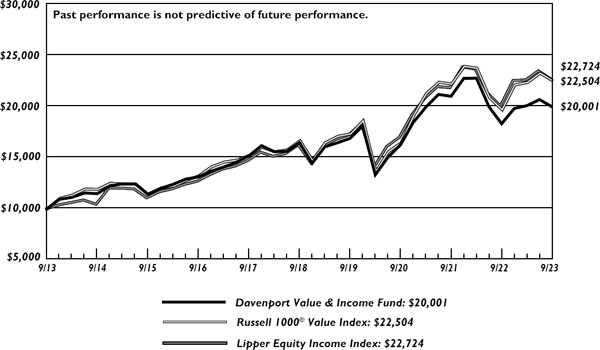
The following chart represents Davenport Value & Income Fund (DVIPX) performance and the performance of the Russell 1000® Value Index, the Fund’s primary benchmark, and the S&P 500® Index for the periods ended September 30, 2023.
| | Q3 2023 | 1 Year | 3 Years* | 5 Years* | 10 Years* | Since
Inception*
12/31/10 |
| Value & Income Fund (DVIPX) | (3.44%) | 8.97% | 7.08% | 3.92% | 7.18% | 8.93% |
| Russell 1000® Value Index** | (3.17%) | 14.44% | 11.05% | 6.23% | 8.45% | 9.55% |
| S&P 500® Index** | (3.27%) | 21.62% | 10.15% | 9.92% | 11.91% | 12.27% |
30-Day SEC Yield: 1.77%; Expense Ratio in current prospectus: 0.88%
Past performance is no guarantee of future results. Investment return and principal value of an investment will fluctuate so that an investor’s shares, when redeemed, may be worth more or less than their original cost. Current performance may be lower or higher than the performance data quoted. Performance data, current to the most recent month-end, may be obtained by calling 1-800-281-3217.
| * | Returns greater than one year are annualized. |
| ** | The Russell 1000® Value Index measures the performance of the Russell 1000 companies with lower price-to-book ratios and lower forecasted growth values. The S&P 500® Index is comprised of 500 U.S. stocks and is an indicator of the performance of the overall U.S. stock market. Standard & Poor’s Financial Services LLC, a division of S&P Global, is the source and owner of the registered trademarks related to the S&P 500® Index. An investor cannot invest in an index and its returns are not indicative of the performance of any specific investment. |
The Davenport Value & Income Fund (DVIPX) declined 3.44% in the third quarter, bringing its year-to-date return to positive 0.78%. This compares to the Fund’s primary benchmark, the Russell 1000® Value Index, which declined 3.17% in the third quarter and is up 1.79% year-to-date. Ongoing interest rate increases and the Fed’s espousing a “higher for longer” mantra weighed on risk assets, as 5%+ “risk-free” rates available in short-term Treasury bills are competing for investors’ capital.
For the second straight quarter, the Fund’s performance was led by Fairfax Financial Holdings Ltd (FRFHF). Insurers such as Fairfax are benefiting from higher interest rates as they reinvest lower-yielding maturing securities from their investment portfolios. That, along with continued robust increases for insurance policies (driven by prior year natural disasters), have enabled insurers to produce impressive growth rates. Fellow insurers Markel Group Corporation (MKL), Chubb Ltd (CB), and Berkshire Hathaway, Inc. (BRK.B) also were among the Fund’s top 10 contributors for the quarter. Beyond insurance, our two Energy holdings, Chevron Corporation (CVX) and Coterra Energy, Inc. (CTRA) benefited from the rise in underlying commodity prices. Crude oil jumped 30% for the quarter, amid continued OPEC production discipline, while natural gas prices lifted almost 9%. Among the Fund’s worst performers for the quarter, we see little commonality: Florida utility NextEra Energy, Inc. (NEE) was worst (Utilities in general performed poorly, as competing yields from Treasury securities pressured valuations), followed by Lamar Advertising Company (LAMR), which cited decelerating advertising demand. United Parcel Service, Inc. (UPS) also declined as its settlement with the Teamsters union creates certainty around its labor situation for the next five years, albeit with some incremental costs to absorb in 2024. McDonald’s Corporation (MCD) fundamental performance remains strong even though its stock price flagged during the quarter. Other detractors included Diageo, plc (DEO) and defense contractor L3Harris Technologies, Inc. (LHX).
Our transactions during the quarter were relatively few, but we believe consistent with Value & Income’s mandate of seeking stocks with depressed valuations and solid dividend income. On the purchase side of the ledger, we added aerospace and defense conglomerate RTX Corporation (RTX), formerly Raytheon, as well as Walt Disney Company (DIS) and Anheuser-Busch InBev S.A./N.V. (BUD). RTX shares got put in the “clearance” aisle, after the company announced that a component in its geared turbofan engine may be failing prematurely, requiring earlier-than-expected replacement. Since announcing this issue, the stock has lost about $30 billion of market value, implying a fairly significant “margin of safety” vs. the estimated $3 billion cost. Meanwhile, the company is in the midst of a $33-35 billion return of capital program through 2025, with share buybacks driving the share count -1.4% year-over-year, while RTX’s dividend is 7% higher than a year ago. Disney needs little introduction, and is working to recover from several media-related snafus, including a carriage dispute with Charter Communications, a recent settlement with the screenwriters’ guild, and a pending resolution of its partial ownership of streaming service Hulu that should bring finality to that overhang. CEO Bob Iger has indicated the company intends to restore its dividend later this year. Meanwhile, shares trade at their lowest level since 2014, even as Disney has good line-of-sight to substantial earnings growth in 2024 and beyond from a multi-billion dollar profitability improvement in its streaming businesses (Disney+, e.g.).
Global brewer Anheuser-Busch has been performing well outside the United States, and now faces easy comparisons within the US as it seeks to claw back market share that Bud Light surrendered from a marketing faux pas earlier this year. The company operates globally and possesses many key brands (Michelob, Stella Artois, Kona, Landshark, ShockTop), so the impact
of a single brand in a single country is relatively modest. To that point, in spite of Bud Light’s well-documented US woes, Anheuser reported total company growth of 7% year-over-year in its most-recent quarter. Shares trade near 15x earnings, and earlier this year the company recently increased its dividend 50%.
In terms of exits during the quarter, we sold Gaming & Leisure Properties, Inc. (GLPI), Crown Castle Inc. (CCI), Cannae Holdings, Inc. (CNNE), and J.M. Smucker Company (SJM). For GLPI, we saw a well-run company that had held up better than most real-estate holdings in a higher interest rate environment. Wireless tower operator Crown Castle’s business is unlikely to grow much in the next couple years, as Sprint/TMobile churn and higher interest rates conspire against it. Further, management indicated that telecom customers’ 5G spending has peaked. The combination of those factors make it unlikely Crown Castle will be able to grow its dividend meaningfully until 2025, at the earliest. Cannae continues to offer intriguing sum-of-the-parts potential, albeit in a non-dividend paying, small-cap security that we’d been gradually pruning. When liquidity presented itself, we exited the balance of our position. Finally, Smucker snatched defeat from the jaws of victory, in our view, when it unexpectedly announced that it would lever up and issue stock to acquire Hostess at a rich valuation (vs. buying back its own stock, which Smucker had been doing heretofore). As the company spends the next few years deleveraging, we suspect dividend growth will be anemic, at best.
In sum, we view our diversified Fund of large, well-established companies trading at reasonable valuations and with good dividend growth provide attractive equity exposure. We are pleased that three of our companies increased their dividends during the quarter, in-sync with their traditional schedule. JPMorgan Chase & Company (JPM) banked a 5% improvement to its quarterly payout, while Philip Morris International, Inc. (PM) provided a 2% fillip, and Keurig Dr. Pepper, Inc. (KDP) brewed up an 8% increase. We calculate the average dividend growth rate for the stocks we own in the Fund at 9% year-over-year.
Recent Purchases:
Anheuser-Busch InBev S.A./N.V. (BUD) – A marketing issue in the company’s largest North American brand led to significant market share losses. These headwinds appear to have been adequately discounted, providing an opportunity to establish a position at a historically low valuation.
Bristol Myers Squibb Company (BMY) – BMY’s newly launched products showed impressive growth, continuing to provide evidence that they should be able to grow through upcoming patent expirations. As such, we elected to add to our position.
Bristol Myers Squibb Company (BMY) – We continue to view BMY as uniquely inexpensive, with an impressive spectrum of already-approved pharmaceuticals to help it bridge the near-term “known-known” patent expiration cliff and elected to add to our position for the second time this quarter.
Fidelity National Financial, Inc. (FNF) – While we appreciate that mortgage refinancing activity may remain soft, the housing market remains strong, commercial mortgage activity appears to be lifting, and interest rates have leveled off. As such, we elected to add to our position.
J.M. Smucker Company (SJM) – We feel SJM improved its financial flexibility and expect SJM to sell its Post shares, and redeploy those proceeds. We consider this profile attractive relative to the stock’s valuation and elected to add to our position.
NextEra Energy, Inc. (NEE) – With NEE shares trading near their lowest level in nearly 5 years, we view shares as incrementally attractive, and took this time to add to our position.
Oracle Corporation (ORCL) – ORCL has been a solid performer this year. Key financial targets were reaffirmed for FY24 and FY26 and believe the long-term thesis on ORCL remains intact. As such, we used this opportunity to increase our position.
RTX Corporation (RTX) – The irony of the stock’s sharp sell-off on the engine recall news, is that it came on the same day that the company reported 13% organic growth for the second quarter, with management raising 2023 revenue and earnings guidance, and backlog having reached a new record ($185 billion, more than two years’ worth of revenue) amid $25B of new orders and a very robust 1.34x book-to-bill result. As such we elect to initiate a 1% position in RTX.
Target Corporation (TGT) – While the health of the consumer remains a near-term question mark, we view TGT as well-positioned to provide value and flex its inventory position when demand strengthens. Given that sales today are ~38% higher than pre-pandemic levels, we elected to add to our position.
Walt Disney Company (DIS) – While the company may continue to face headwinds in the near-term, we think they are more than reflected in the current valuation, with the shares valued at 16.9x and 14.5x calendar 2024 and 2025 earnings estimates, respectively. We think the current valuation offers an attractive risk/reward opportunity in a high-quality business and elect to establish a position.
Recent Sales:
Berkshire Hathaway, Inc. (BRK.B) – With several other insurance/conglomerate holdings in DVIPX, we’ve used recent strength to chip our position. We appreciate that underwriting profitability historically has been cyclical, and we don’t want to over-extrapolate current favorable market conditions.
Cannae Holdings, Inc. (CNNE) – Not much has changed with the CNNE story as the discount to its sum-of-the parts remains at ~50%. CNNE remains a meaningful holding in other portfolios as we expect the discount to close over time (or CNNE to liquidate), however the lack of a dividend and current market cap make it less of a fit and sold our position.
Comcast Corporation (CMCSA) – While CMCSA’s valuation remains undemanding, the year-to-date lift in the stock price enabled us to trim the position size, with the risk/reward appearing somewhat more balanced now than it was entering the year.
Crown Castle, Inc. (CCI) – After having grown its dividend at a compound annual rate of 8.4% since converting to a REIT in 2014, CCI’s dividend is likely to grow at perhaps just 1% annually from 2023-2025. Amid this potentially lengthy valley, we opted to exit our position in CCI.
Deere & Company (DE) – The combination of declining crop prices and higher interest rates may presumably impact the cost of farm equipment. As such, we elect to trim our position size.
Fairfax Financial Holdings Ltd (FRFHF) – We elect to chip our position reflecting the stock’s superior performance: +34% year-to-date, and +55% in the past year.
Gaming and Leisure Properties, Inc. (GLPI) – GLPI had become one of the smallest positions in the portfolio and we decide to exit our remaining holdings.
J.M. Smucker Company (SJM) – SJM appeared to be executing well, but that narrative took a left-hand turn earlier last month, when the company announced it is acquiring Hostess Brands at a valuation more than 50% higher than SJM itself trades at, using a combination of debt and SJM shares. As such, we opted to exit our relatively short-lived position in SJM.
Davenport Equity Opportunities Fund (DEOPX)
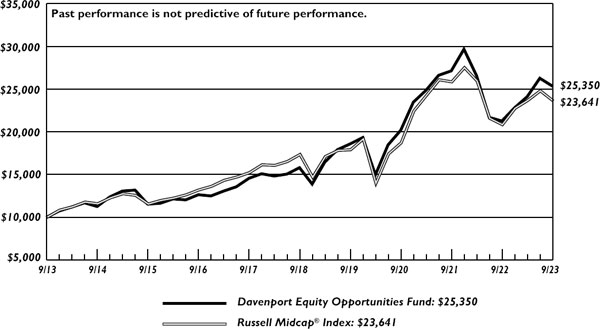
The following chart represents Davenport Equity Opportunities Fund (DEOPX) performance and the performance of the Russell Midcap® Index, the Fund’s primary benchmark, and the S&P 500® Index for the periods ended September 30, 2023.
| | Q3 2023 | 1 Year | 3 Years* | 5 Years* | 10 Years* | Since
Inception*
12/31/10 |
| Equity Opportunities Fund (DEOPX) | (3.52%) | 19.19% | 7.91% | 9.91% | 9.75% | 11.32% |
| Russell Midcap® Index** | (4.68%) | 13.45% | 8.09% | 6.38% | 8.98% | 10.06% |
| S&P 500® Index** | (3.27%) | 21.62% | 10.15% | 9.92% | 11.91% | 12.27% |
30-Day SEC Yield: 0.33%; Expense Ratio in current prospectus: 0.89%
Past performance is no guarantee of future results. Investment return and principal value of an investment will fluctuate so that an investor’s shares, when redeemed, may be worth more or less than their original cost. Current performance may be lower or higher than the performance data quoted. Performance data, current to the most recent month-end, may be obtained by calling 1-800-281-3217.
| * | Returns greater than one year are annualized. |
| ** | The Russell Midcap® Index measures the performance of the 800 smallest companies in the Russell 1000®, which represents approximately 25% of the total market capitalization of the Russell 1000®. The S&P 500® Index is comprised of 500 U.S. stocks and is an indicator of the performance of the overall U.S. stock market. Standard & Poor’s Financial Services LLC, a division of S&P Global, is the source and owner of the registered trademarks related to the S&P 500® Index. An investor cannot invest in an index and its returns are not indicative of the performance of any specific investment. |
The Davenport Equity Opportunities Fund (DEOPX) was down 3.52% during the third quarter, holding in better than the 4.68% decline for the Russell Midcap® Index. For the calendar year, the Fund is up 11.14%, nicely outpacing the 3.91% gain for the Index.
Specialty insurance holdings Fairfax Financial Holdings Ltd. (FRFHF) and Markel Group Corporation (MKL) were among the Fund’s top performers, benefitting from their status as beneficiaries of higher interest rates. In addition to improving investment income, firm insurance pricing should remain a tailwind for these companies that we believe still carry undemanding valuations. Elsewhere, the strategy benefitted from the long awaited approval of the merger between Black Knight, Inc. (BKI) and Intercontinental Exchange, Inc. (ICE). We elected to monetize our position in BKI prior to the consummation of the deal since the stock had appreciated to within a narrow discount to the ultimate takeout value. Key detractors for the period included Xylem, Inc. (XYL), Alight, Inc. (ALIT) and Envois Corporation (ENOV). Envois struggled alongside broader weakness in the healthcare sector related to emerging concerns that
popular weight loss drugs called GLP-1’s could potentially reduce future incidents of orthopedic surgery cases (i.e. lower rates of obesity will result in fewer joint replacement surgeries). We believe this narrative to be far-fetched given the aging population and pent-up demand for elective surgeries. Furthermore we think the company’s recent acquisition of LimaCorporate, a European orthopedics leader, should be meaningfully value-accretive over time. Given recent developments and our ongoing conviction, we elected to use recent weakness to add to the position.
We initiated a position in Allstate Corporation (ALL), one of the largest personal auto and homeowners insurance companies in the United States. After experiencing unprecedented profitability in 2020, auto insurer losses began rising midway through 2021 due to increased driving and inflationary cost pressures. Sustained higher used car prices, car parts, attorney fees, and longer repair times combined to drive loss severity significantly higher. An increase in catastrophe events further weighed on results. These trends resulted in Allstate reported a loss of $1.3B in 2022, its first net loss since 2008. While recent performance has been poor, Allstate is actively implementing significant rate increases across its operations, increasing rates by 16.9% in 2022 and 8.4% since the beginning of 2023. These price increases take time to flow through results as they are implemented when 6-month policies come up for renewal. We believe Allstate is nearing a material inflection point as price increases implemented over the last few quarters begin to positively impact reported results. Additionally, Allstate’s $63B investment portfolio is primarily made up of fixed income securities which stand to benefit from higher interest rates. We believe Allstate could earn between $15 and $20 per share in a normalized operating environment. Applying a through-cycle multiple of 10x PE results in a $150-200 share price, implying a 31.5% - 75.4% return from today’s levels.
We also initiated a position Avantor, Inc. (AVTR), which we view as a “toll booth” business set to benefit from future investment and innovation in the biopharma space. Avantor provides ~6 million products and services to the biopharma, healthcare, and advanced technologies & applied materials industries. With around 85% of revenue recurring and over 40% generated from 15+ year customers, this business has been remarkably stable over time. However, COVID-19 created a significant disruption as volatile order patterns led to rolling inventory challenges. While transitory in nature, these factors weighed on reported results and investor sentiment (destocking represented a ~500 basis point headwind to topline organic growth this year). We believe Avantor is well positioned to rebound from recent challenges as operations normalize, allowing the company to revert back toward its historical formula of mid-single digit topline growth. After a ~40% decline over the last year, shares are trading near their lowest valuation since the company came public, representing a significant discount to larger life science tool and medical supplier peers. Though the next few quarters might be choppy, we see significant upside over time as revenue trends normalize and the valuation recovers to historical ranges.
We are pleased with results to date and believe that recent value-oriented additions to the strategy should add an element of timeliness. As always, we strive to own a collection of high-quality businesses that compound at high rates of return and feel that each of our holdings exhibits these characteristics. Further, we are confident that our willingness to be contrarian and ride out a few near-term headwinds will pay off over the long term.
Recent Purchases:
Allstate Corporation (ALL) – While near-term results have been poor, we believe ALL is nearing a material inflection point as price increases implemented over the last few quarters begin to positively impact reported results. We view the recent underperformance in ALL’s insurance operations as an attractive opportunity and elected to initiate a position.
Avantor, Inc. (AVTR) – AVTR operates, in our view, a traditionally resilient business model, generating significant free cash flow with a high degree of earnings visibility. However, COVID-19 created a significant disruption in an otherwise stable business. We believe AVTR is well positioned to rebound from recent challenges as operations normalize and elected to initiate a position.
Avantor, Inc. (AVTR) – Since establishing our initial position in AVTR, the company appointed a new CFO with a strong background in both investment banking and leadership roles in the life sciences industry. We elected to use cash proceeds from the recent BKI sale to make our position in AVTR more meaningful.
Avantor, Inc. (AVTR) – Though the company’s recent quarterly results did not convey the same degree of optimism as larger comps such as Danaher (DHR) and Thermofisher (TMO), we think AVTR is well positioned to rebound from recent challenges as operations normalize and elected to add to our position a second time.
Enovis Corporation (ENOV) – Despite solid recent results, ENOV has pulled back materially from recent highs alongside broader weakness in the health care sector. We think this provides an opportunity to add to a high quality compounder with an attractive risk/reward setup.
Enovis Corporation (ENOV) – With the shares valued at just 11x 2024 consensus EBITDA estimates compared to 15.6x for medical device peers, we think this is an attractive opportunity to add to our position (for the second time this quarter) and believe the valuation discount should narrow as the Recon segment becomes the biggest driver of the company.
Etsy, Inc. (ETSY) – While the business is going through a choppy patch at present, ETSY has differentiated its brand and offers a niche platform where consumers love the unique/authentic experience of buying non-commoditized wares from artisan sellers. We think this, alongside a large addressable market and secular tailwinds for ecommerce make ETSY a secular grower over time and elected to take the position to 1.5%.
Recent Sales:
Black Knight, Inc. (BKI) – The shares have rallied sharply in response to the announcement of an asset sale agreement between BKI, Intercontinental Exchange and Constellation Software that appears to pave the way for regulatory approval of ICE’s offer to acquire BKI. Given these factors, we elected to use the above average trading liquidity to monetize the position.
Fairfax Financial Holdings Ltd (FRFHF) – Though we elect to take some profits with the stock at fresh all-time highs, FRFHF remains a top position given the company’s strong operating momentum (run rate pre-tax operating earnings of ~$100 per share) and an undemanding valuation (stock trades at 0.85x consensus 2023 BVPS [Book value per share] estimates).
O’Reilly Automotive, Inc. (ORLY) – We remain attracted to the company’s distinct competitive advantages (namely its parts distribution network and superior fulfillment capabilities) and demand drivers (average age of car on the road at record highs), but acknowledge that the shares could take a breather as the company faces tougher comparisons following a period of strong performance and chipped our position.
O’Reilly Automotive, Inc. (ORLY) – Not much has changed since previous chip and we elected to take this time to trim our position again.
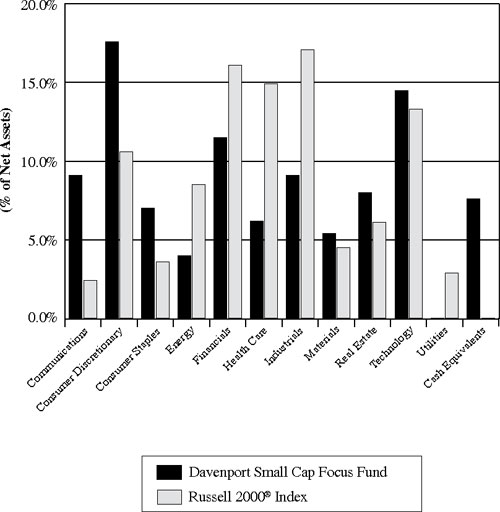
Davenport Small Cap Focus Fund (DSCPX)
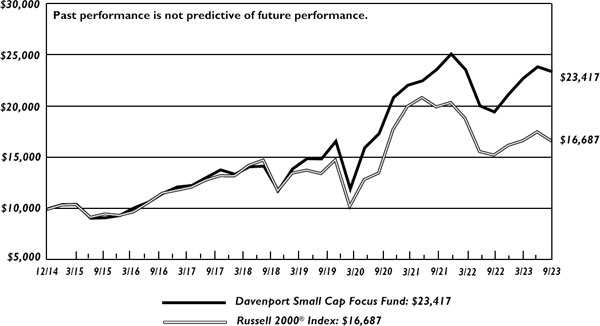
This chart represents Davenport Small Cap Focus Fund (DSCPX) performance and the performance of the Russell 2000® Index, the Small Cap Focus Fund’s primary benchmark, for the periods ended September 30, 2023.
| | Q3 2023 | 1 Year | 3 Year* | 5 Year* | Since
Inception*
12/31/14 |
| Small Cap Focus Fund (DSCPX) | (1.98%) | 20.21% | 10.48% | 10.56% | 10.22% |
| Russell 2000® Index** | (5.13%) | 8.93% | 7.16% | 2.40% | 6.03% |
30-Day SEC Yield: 0.82%; Expense Ratio in current prospectus: 0.91%
Past performance is no guarantee of future results. Investment return and principal value of an investment will fluctuate so that an investor’s shares, when redeemed, may be worth more or less than their original cost. Current performance may be lower or higher than the performance data quoted. Performance data, current to the most recent month-end, may be obtained by calling 1-800-281-3217.
| * | Returns greater than one year are annualized. |
| ** | The Russell 2000® Index measures the performance of the 2,000 smallest companies in the Russell 3000® index, representing approximately 8% of the total market capitalization of the Russell 3000®. An investor cannot invest in an index and its returns are not indicative of the performance of any specific investment. |
The Davenport Small Cap Focus Fund (DSCPX) was down 1.98% during the third quarter, proving more resilient than the 5.13% decline for the Russell 2000® Index. For the calendar year, the Fund is up 10.32%, versus the 2.54% gain for the Index.
The Fund had an eclectic mix of contributors in the third quarter. Canadian natural gas producer Peyto Exploration & Development Corporation (PEYUF) was the Fund’s top performer alongside a strong energy tape. Additionally, the company announced an acquisition of complimentary assets from Repsol, which we believe will be significantly accretive to future production and cash flow per share over time. Health savings account provider HealthEquity, Inc. (HQY) (highlighted last quarter) was another top contributor, reporting strong results and new business wins amid a favorable backdrop of rising interest rates. Other key contributors included NewMarket Corporation (NEU) and Kinsale Capital Group, Inc. (KNSL). Key detractors included Alight, Inc. (ALIT), Lamar Advertising Company (LAMR), Enovis Corporation (ENOV) and Monarch Casino & Resort, Inc. (MCRI). We elected to add to the latter two positions amid weakness. In the case of Monarch, it remains our top position. While the near term is murky given a difficult consumer backdrop, we are attracted to the company’s debt free balance sheet, cheap valuation and attractive capital return policy.
During the quarter we initiated a position in pool and spa supplies retailer Leslie’s, Inc. (LESL). Shares of LESL had declined precipitously from recent highs given several temporary (in our view) headwinds including: an unusual pool season due to poor weather, excess chemicals among homeowners, and a general slowing in more discretionary purchases (i.e. hot tubs and above-ground pools). With close to 1,000 locations throughout the U.S. and 80% of sales tied to maintenance, LESL enjoyed 59 years of consecutive sales growth before the issues in 2023. Put simply, we don’t believe the business is broken and think current levels represent an attractive entry point in the specialty retailer. The pool industry enjoys secular growth drivers such as a growing installed base and pool maintenance is non-discretionary. Additionally, the desire for newer technologies (i.e. automation, robotic vacuum) is driving additional growth. Long-term, LESL should be able to grow sales at a mid-single digit to high-single digit pace and grow EPS in the mid- to high-teens. With the stock trading at <11x normalized earnings, we think our entry point is attractive and are willing to wait for a more normal pool season next year.
We also initiated a position in California Resources Corporation (CRC), one of the largest oil & gas producers in California. While oil and gas companies generally track a difficult to predict underlying commodity, CRC has a number of unique characteristics underpinning its valuation. The company’s oil and gas operations benefit from favorable pricing as California imports roughly 90% of the natural gas and 60% of oil consumed in the state. This “energy island” dynamic allows CRC to realize significantly higher prices than traditional benchmarks during volatile consumption periods. Additionally, CRC is developing a series of carbon capture and sequestration projects in California through its subsidiary Carbon TerraVault. Carbon TerraVault has 25 completed permits submitted to the EPA for Class VI wells and a 51%/49% joint venture partnership with Brookfield Asset Management valued at ~$2B. Carbon capture projects in California benefit from both federal IRS 45Q credits as well as California Low Carbon Fuel Standard (LCFS) credits. CRC believes its carbon capture operations could generate ~$185-200M in EBITDA by 2028. Ultimately, we believe CRC offers an attractive risk reward given the combination of its highly cash generative oil and gas operations and significant exposure to the budding Carbon Capture and Storage industry.
In sum, we are pleased to have performed well during a difficult period for small cap stocks and continue to think the asset class appears timely. While our valuation discipline and emphasis on quality has served us well through a turbulent period, we have not shied away from situations where we believe a contrarian/long term approach can sow the seeds for future outperformance.
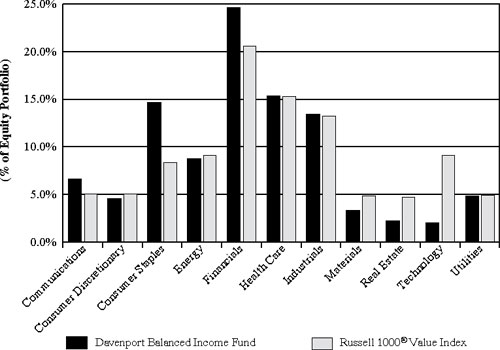
Davenport Balanced Income Fund (DBALX)
The following chart represents Davenport Balanced Income Fund (DBALX) performance and performance of the Fund’s primary benchmark, the Russell 1000® Value Index for the periods ended September 30, 2023.
| | Q3 2023 | 1 Year | 3 Year* | 5 Year* | Since
Inception*
12/31/15 |
| Balanced Income Fund (DBALX) | (2.38%) | 5.40% | 3.83% | 3.03% | 4.56% |
| Russell 1000® Value Index** | (2.21%) | 9.70% | 5.56% | 4.56% | 5.78% |
30-Day SEC Yield: 3.04%; Expense Ratio in current prospectus: 0.94%
Past performance is no guarantee of future results. Investment return and principal value of an investment will fluctuate so that an investor’s shares, when redeemed, may be worth more or less than their original cost. Current performance may be lower or higher than the performance data quoted. Performance data, current to the most recent month-end, may be obtained by calling 1-800-281-3217.
| * | Returns greater than one year are annualized. |
| ** | The Russell 1000® Value Index measures the performance of the Russell 1000 companies with lower price-to-book ratios and lower forecasted growth values |
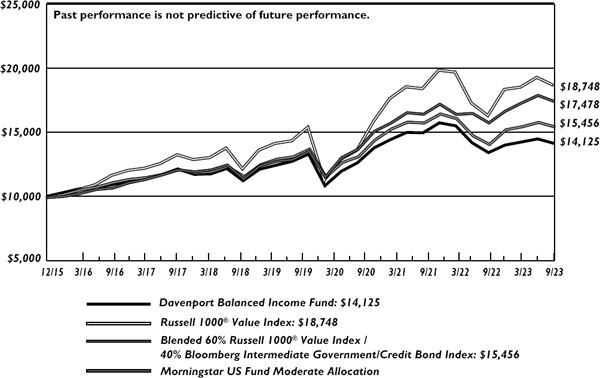
The Davenport Balanced Income Fund (DBALX) decreased 2.38% during the third quarter of 2023 compared to the 2.21% decrease for the blended 60% Russell 1000® Value Index and 40% Bloomberg Intermediate Government/Credit Bond Index. Year-to-date, the Fund is up 0.98% compared to the 1.47% increase for the blended benchmark.
For the second straight quarter, the Fund’s equity performance was led by Fairfax Financial Holdings Ltd. (FRFHF). Insurers such as Fairfax are benefiting from higher interest rates as they reinvest lower-yielding maturing securities from their investment portfolios. That, along with continued robust increases for insurance policies (driven by prior year natural disasters), have enabled insurers to produce impressive growth rates. Fellow insurers Markel Group Corporation (MKL), Chubb Ltd. (CB), and Berkshire Hathaway, Inc. (BRK.B) also were among the Fund’s top contributors for the quarter. Among the Fund’s worst performers for the quarter, we see little commonality: Florida utility NextEra Energy, Inc. (NEE) was worst (Utilities in general performed poorly, as competing yields from Treasury securities pressured valuations), followed by Lamar Advertising Company (LAMR), which cited decelerating advertising demand. United Parcel Service, Inc. (UPS) also declined as its settlement with the Teamsters union creates certainty around its labor situation for the next five years, albeit with some incremental costs to absorb in 2024.
Our transactions during the quarter were relatively few, but we believe consistent with the Fund’s mandate of seeking stocks with depressed valuations and solid dividend income. On the purchase side of the ledger, we added aerospace and defense conglomerate RTX Corporation (RTX), formerly Raytheon, as well as Walt Disney Company (DIS). RTX shares got put in the “clearance” aisle, after the company announced that a component in its geared turbofan engine may be failing prematurely, requiring earlier-than-expected replacement. Since announcing this issue, the stock has lost about $30 billion of market value, implying a fairly significant “margin of safety” vs. the estimated $3 billion cost. Meanwhile, the company is in the midst of a $33-35 billion
return of capital program through 2025, with share buybacks driving the share count -1.4% year-over-year, while RTX’s dividend is 7% higher than a year ago. Disney needs little introduction, and is working to recover from several media-related snafus, including a carriage dispute with Charter Communications, a recent settlement with the screenwriters’ guild, and a pending resolution of its partial ownership of streaming service Hulu that should bring finality to that overhang. CEO Bob Iger has indicated the company intends to restore its dividend later this year. Meanwhile, shares trade at their lowest level since 2014, even as Disney has good line-of-sight to substantial earnings growth in 2024 and beyond from a multi-billion dollar profitability improvement in its streaming businesses.
The Fund’s fixed income allocation includes 29 high quality bonds diversified across nine sectors with the top allocations including U.S. Treasuries (20%), Financials (20%), Energy (12%), Communications (10%), and Consumer Non-Cyclical (6%). The credit quality remains high investment grade (A2/A/A+) with a 5.73% yield-to-worst, 3.92 years effective maturity and a 3.22 years duration versus 2.17 years in Q4 2022.
The third quarter presented opportunities and challenges as yields drifted higher while credit markets felt fragile. Macroeconomic drivers continued to dictate market behavior with investors acutely focused on economic data and monetary policy. The Fed raised its target interest rate range a well telegraphed 25 basis points to 5.25% - 5.5% in July and paused in September. The updated quarterly Summary of Economic Projections (SEP), also known as the dot plots, for September illustrated a Fed belief in economic growth with moderating inflation. During the final week of the quarter, mixed messages emerged from the central bank spanning from hawkish to dovish outlooks that fueled rate volatility. Idiosyncratic and sector level opportunity were subdued in the third quarter with range bound corporate spread movement.
We continued our duration extension strategy in the third quarter. We exited six positions including three short-term Treasuries and three short-term corporates (Boeing 1.433% 2024, BlackRock 3.5% 2024, and Brookfield Finance 4% 2024). We added six new positions to the Fund including two Treasuries (0% 2024 T-bills and 4.75% 2025 T-notes) and four corporates (Bank of Montreal 5.92% 2025, ONEOK 5.55% 2026, Charles Schwab 5.875% 2026, and Waste Management 4.875% 2029). Collectively, yield-to-worst reached 5.73% and duration rose to 3.22 years.
Looking ahead, we believe the Fund’s fixed income portfolio is positioned for the likelihood of persistent inflation above the Fed’s 2% target. The impact of higher for longer interest rates on individual and corporate balance sheets does not happen immediately but with a lag that impacts aggregate economic growth and the potential attractiveness of Treasuries. Structurally, our duration and credit barbell setup offers embedded flexibility to take advantage of attractive yields as well as an evolving yield curve term structure.
In closing, we are continuing to find opportunities in some of the overlooked areas of the market. We think eventually investor attention will shift and our collection of high quality dividend payers/growers should provide solid returns for the equity portion of the Fund. Additionally, our defensive fixed income positioning should continue to provide current income and a volatility buffer in the near-term.
Sincerely,
John P. Ackerly IV, CFA
President, The Davenport Funds
| DAVENPORT CORE LEADERS FUND |
| PERFORMANCE INFORMATION (Unaudited) |
Comparison of the Change in Value of a $10,000 Investment in
Davenport Core Leaders Fund and the S&P 500® Index
| | | |
| | Average Annual Total Returns
(for the periods ended September 30, 2023) | |
| | | |
| | 1 Year | | 5 Years | | 10 Years | |
| Davenport Core Leaders Fund (a) | 22.16% | | 7.86% | | 9.62% | |
| S&P 500® Index | 21.62% | | 9.92% | | 11.91% | |
| | | | | | | |
| (a) | The total returns shown do not reflect the deduction of taxes that a shareholder would pay on Fund distributions or the redemption of Fund shares. |
| DAVENPORT VALUE & INCOME FUND |
| PERFORMANCE INFORMATION (Unaudited) |
Comparison of the Change in Value of a $10,000 Investment in
Davenport Value & Income Fund, the Russell 1000® Value Index
and the Lipper Equity Income Index
| | | |
| Average Annual Total Returns
(for the periods ended September 30, 2023) | |
| | | |
| | 1 Year | | 5 Years | | 10 Years | |
| Davenport Value & Income Fund (a) | 8.97% | | 3.92% | | 7.18% | |
| Russell 1000® Value Index | 14.44% | | 6.23% | | 8.45% | |
| Lipper Equity Income Index | 13.09% | | 6.86% | | 8.55% | |
| | | | | | | |
| (a) | The total returns shown do not reflect the deduction of taxes that a shareholder would pay on Fund distributions or the redemption of Fund shares. |
| DAVENPORT EQUITY OPPORTUNITIES FUND |
| PERFORMANCE INFORMATION (Unaudited) |
Comparison of the Change in Value of a $10,000 Investment in
Davenport Equity Opportunities Fund and the Russell Midcap® Index
| | | |
| | Average Annual Total Returns
(for the periods ended September 30, 2023) | |
| | | |
| | 1 Year | | 5 Years | | 10 Years | |
| Davenport Equity Opportunities Fund (a) | 19.19% | | 9.91% | | 9.75% | |
| Russell Midcap® Index | 13.45% | | 6.38% | | 8.98% | |
| | | | | | | |
| (a) | The total returns shown do not reflect the deduction of taxes that a shareholder would pay on Fund distributions or the redemption of Fund shares. |
| DAVENPORT SMALL CAP FOCUS FUND |
| PERFORMANCE INFORMATION (Unaudited) |
Comparison of the Change in Value of a $10,000 Investment in
Davenport Small Cap Focus Fund and the Russell 2000® Index
| | | |
| | Average Annual Total Returns
(for the periods ended September 30, 2023) | |
| | | |
| | | | | | Since | |
| | 1 Year | | 5 Years | | Inception(b) | |
| Davenport Small Cap Focus Fund (a) | 20.21% | | 10.56% | | 10.22% | |
| Russell 2000® Index | 8.93% | | 2.40% | | 6.03% | |
| | | | | | | |
| (a) | The total returns shown do not reflect the deduction of taxes that a shareholder would pay on Fund distributions or the redemption of Fund shares. |
| (b) | Commencement of operations was December 31, 2014. |
| DAVENPORT BALANCED INCOME FUND |
| PERFORMANCE INFORMATION (Unaudited) |
Comparison of the Change in Value of a $10,000 Investment in Davenport Balanced
Income Fund, the Russell 1000® Value Index, a Blended 60% Russell 1000® Value
Index / 40% Bloomberg Intermediate Government/Credit Bond Index
and the Morningstar US Fund Moderate Allocation
| | | |
| | Average Annual Total Returns
(for the periods ended September 30, 2023) | |
| | | |
| | | | | | Since | |
| | 1 Year | | 5 Years | | Inception(b) | |
| Davenport Balanced Income Fund (a) | 5.40% | | 3.03% | | 4.56% | |
| Russell 1000® Value Index | 14.44% | | 6.23% | | 8.45% | |
| Blended 60% Russell 1000® Value Index /40% Bloomberg Intermediate Government/Credit Bond Index | 9.70% | | 4.56% | | 5.78% | |
| Morningstar US Fund Moderate Allocation | 10.53% | | 6.89% | | 7.47% | |
| | | | | | | |
| (a) | The total returns shown do not reflect the deduction of taxes that a shareholder would pay on Fund distributions or the redemption of Fund shares. |
| (b) | Commencement of operations was December 31, 2015. |
Davenport Balanced Income Fund (the “Fund”) is not sponsored, endorsed, sold or promoted by Morningstar, Inc. or any of its affiliates (all such entities, collectively, “Morningstar Entities”). The Morningstar Entities make no representation or warranty, express or implied, to the owners of the Fund or any member of the public regarding the advisability of investing in equity securities generally or in the Fund in particular or the ability of the Fund to track general equity market performance. THE MORNINGSTAR ENTITIES DO NOT GUARANTEE THE ACCURACY AND/OR THE COMPLETENESS OF THE FUND OR ANY DATA INCLUDED THEREIN AND MORNINGSTAR ENTITIES SHALL HAVE NO LIABILITY FOR ANY ERRORS, OMISSIONS, OR INTERRUPTIONS THEREIN.
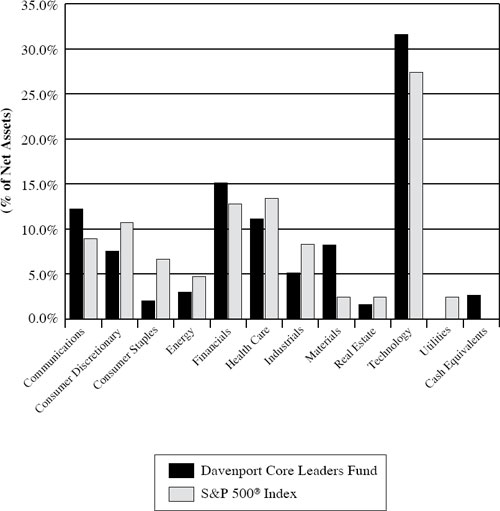
| DAVENPORT CORE LEADERS FUND |
| PORTFOLIO INFORMATION |
| September 30, 2023 (Unaudited) |
Sector Allocation vs. the S&P 500® Index
Top 10 Holdings
| Security Description | % of Net Assets |
| Microsoft Corporation | 4.5% |
| Adobe, Inc. | 4.1% |
| Amazon.com, Inc. | 4.1% |
| Meta Platforms, Inc. - Class A | 3.8% |
| Danaher Corporation | 3.6% |
| Alphabet, Inc. - Classes A and C | 3.5% |
| Brookfield Corporation | 3.3% |
| Markel Group, Inc. | 3.1% |
| Accenture plc - Class A | 3.0% |
| Walt Disney Company (The) | 3.0% |
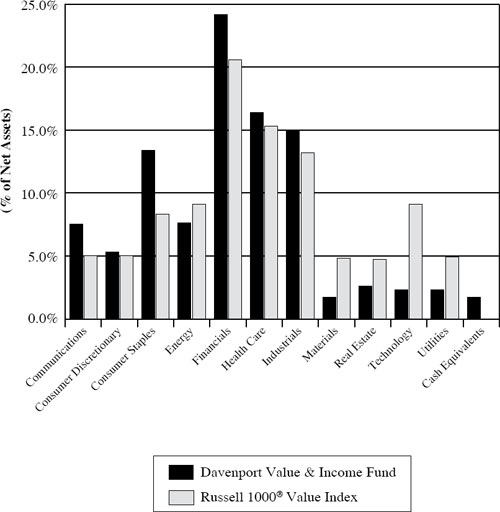
| DAVENPORT VALUE & INCOME FUND |
| PORTFOLIO INFORMATION |
| September 30, 2023 (Unaudited) |
Sector Allocation vs. the Russell 1000® Value Index
Top 10 Holdings
| Security Description | % of Net Assets |
| Fairfax Financial Holdings Ltd. | 4.3% |
| Johnson & Johnson | 4.1% |
| Berkshire Hathaway, Inc. - Class B | 3.6% |
| Markel Group, Inc. | 3.4% |
| Chevron Corporation | 3.3% |
| Comcast Corporation - Class A | 3.2% |
| Watsco, Inc. | 2.9% |
| Alphabet, Inc. - Class A | 2.9% |
| Bristol-Myers Squibb Company | 2.8% |
| McDonald’s Corporation | 2.8% |
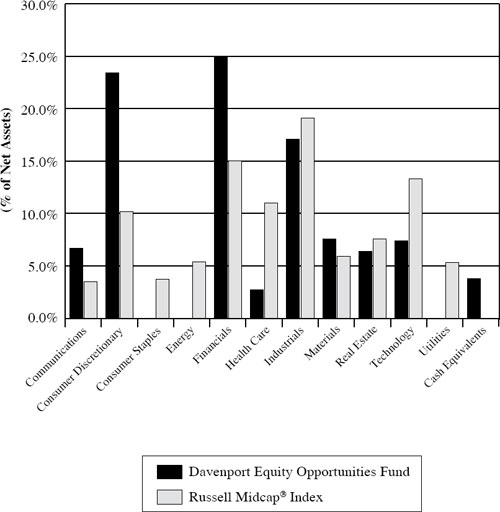
| DAVENPORT EQUITY OPPORTUNITIES FUND |
| PORTFOLIO INFORMATION |
| September 30, 2023 (Unaudited) |
Sector Allocation vs. the Russell Midcap® Index
Top 10 Holdings
| Security Description | % of Net Assets |
| Markel Group, Inc. | 6.8% |
| Fairfax Financial Holdings Ltd. | 6.7% |
| Take-Two Interactive Software, Inc. | 5.8% |
| DraftKings, Inc. - Class A | 4.3% |
| Live Nation Entertainment, Inc. | 4.2% |
| Martin Marietta Materials, Inc. | 4.2% |
| Brookfield Corporation | 4.2% |
| Enovis Corporation | 4.1% |
| Xylem, Inc. | 4.1% |
| Mobileye Global, Inc. - Class A | 3.9% |
| DAVENPORT SMALL CAP FOCUS FUND |
| PORTFOLIO INFORMATION |
| September 30, 2023 (Unaudited) |
Sector Allocation vs. the Russell 2000® Index
Top 10 Holdings
| Security Description | % of Net Assets |
| Monarch Casino & Resort, Inc. | 5.5% |
| Verra Mobility Corporation | 5.2% |
| J & J Snack Foods Corporation | 4.7% |
| Kinsale Capital Group, Inc. | 4.6% |
| Janus International Group, Inc. | 4.4% |
| Stewart Information Services Corporation | 4.2% |
| Enovis Corporation | 4.2% |
| NewMarket Corporation | 3.9% |
| Alight, Inc. - Class A | 3.9% |
| Liberty Latin America Ltd. - Class C | 3.7% |
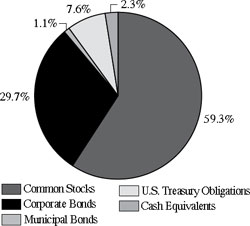
| DAVENPORT BALANCED INCOME FUND |
| PORTFOLIO INFORMATION |
| September 30, 2023 (Unaudited) |
Asset Allocation (% of Net Assets)
| Ten Largest Equity Holdings | % of Net Assets |
| Fairfax Financial Holdings Ltd. | 2.3% |
| Johnson & Johnson | 2.1% |
| Berkshire Hathaway, Inc. - Class B | 1.9% |
| Chevron Corporation | 1.8% |
| Perrigo Company plc | 1.7% |
| Markel Group, Inc. | 1.7% |
| Comcast Corporation - Class A | 1.7% |
| Watsco, Inc. | 1.6% |
| L3Harris Technologies, Inc. | 1.5% |
| United Parcel Service, Inc. - Class B | 1.5% |
Equity Sector Concentration vs. the Russell 1000® Value Index (59.3% of Net Assets)
| Bond Portfolio (38.4% of Net Assets) |
| Number of Fixed-Income Securities | 29 |
| Average Quality | A2/A |
| Effective Maturity | 3.92 yrs. |
| Average Effective Duration | 3.22 yrs. |
| Sector Breakdown | % of Bond
Portfolio |
| Communications | 10.6% |
| Consumer Discretionary | 6.6% |
| Consumer Staples | 6.1% |
| Energy | 12.1% |
| Financials | 20.4% |
| Health Care | 6.4% |
| Industrials | 2.4% |
| Technology | 9.1% |
| Utilities | 3.6% |
| Municipal | 2.9% |
| U.S. Treasury | 19.8% |
| Credit Quality | Composite Quality |
| AAA | 0.0% |
| AA | 25.6% |
| A | 36.0% |
| BBB | 35.6% |
| Not Classified | 2.8% |
| DAVENPORT CORE LEADERS FUND |
| SCHEDULE OF INVESTMENTS |
| September 30, 2023 (Unaudited) |
| COMMON STOCKS — 97.4% | | Shares | | | Value | |
| Communications — 12.2% | | | | | | | | |
| Alphabet, Inc. - Class A (a) | | | 152,184 | | | $ | 19,914,798 | |
| Alphabet, Inc. - Class C (a) | | | 54,011 | | | | 7,121,350 | |
| Electronic Arts, Inc. | | | 122,808 | | | | 14,786,083 | |
| Meta Platforms, Inc. - Class A (a) | | | 99,374 | | | | 29,833,069 | |
| Walt Disney Company (The) (a) | | | 288,548 | | | | 23,386,816 | |
| | | | | | | | 95,042,116 | |
| Consumer Discretionary — 7.5% | | | | | | | | |
| Amazon.com, Inc. (a) | | | 252,107 | | | | 32,047,842 | |
| Home Depot, Inc. (The) | | | 33,721 | | | | 10,189,137 | |
| TJX Companies, Inc. (The) | | | 185,553 | | | | 16,491,951 | |
| | | | | | | | 58,728,930 | |
| Consumer Staples — 2.0% | | | | | | | | |
| Costco Wholesale Corporation | | | 27,728 | | | | 15,665,211 | |
| | | | | | | | | |
| Energy — 3.0% | | | | | | | | |
| EOG Resources, Inc. | | | 181,511 | | | | 23,008,334 | |
| | | | | | | | | |
| Financials — 15.1% | | | | | | | | |
| Aon plc - Class A | | | 58,461 | | | | 18,954,226 | |
| Berkshire Hathaway, Inc. - Class B (a) | | | 65,098 | | | | 22,803,829 | |
| Brookfield Corporation | | | 810,074 | | | | 25,331,014 | |
| Intercontinental Exchange, Inc. | | | 102,761 | | | | 11,305,765 | |
| JPMorgan Chase & Company | | | 100,544 | | | | 14,580,891 | |
| Markel Group, Inc. (a) | | | 16,434 | | | | 24,198,901 | |
| | | | | | | | 117,174,626 | |
| Health Care — 11.1% | | | | | | | | |
| Abbott Laboratories | | | 176,019 | | | | 17,047,440 | |
| Danaher Corporation | | | 113,506 | | | | 28,160,839 | |
| Novo Nordisk A/S - ADR | | | 133,060 | | | | 12,100,476 | |
| UnitedHealth Group, Inc. | | | 41,680 | | | | 21,014,639 | |
| Vertex Pharmaceuticals, Inc. (a) | | | 22,500 | | | | 7,824,150 | |
| | | | | | | | 86,147,544 | |
| Industrials — 5.1% | | | | | | | | |
| Honeywell International, Inc. | | | 83,096 | | | | 15,351,155 | |
| Republic Services, Inc. | | | 77,394 | | | | 11,029,419 | |
| Union Pacific Corporation | | | 65,445 | | | | 13,326,565 | |
| | | | | | | | 39,707,139 | |
| Materials — 8.2% | | | | | | | | |
| Air Products & Chemicals, Inc. | | | 76,240 | | | | 21,606,416 | |
| Martin Marietta Materials, Inc. | | | 55,714 | | | | 22,869,483 | |
| Sherwin-Williams Company (The) | | | 74,351 | | | | 18,963,222 | |
| | | | | | | | 63,439,121 | |
| DAVENPORT CORE LEADERS FUND |
| SCHEDULE OF INVESTMENTS (Continued) |
| COMMON STOCKS — 97.4% (Continued) | | Shares | | | Value | |
| Real Estate — 1.6% | | | | | | | | |
| American Tower Corporation | | | 78,030 | | | $ | 12,832,034 | |
| | | | | | | | | |
| Technology — 31.6% | | | | | | | | |
| Accenture plc - Class A | | | 77,160 | | | | 23,696,608 | |
| Adobe, Inc. (a) | | | 62,967 | | | | 32,106,873 | |
| Advanced Micro Devices, Inc. (a) | | | 106,419 | | | | 10,942,002 | |
| Analog Devices, Inc. | | | 60,210 | | | | 10,542,169 | |
| Apple, Inc. | | | 99,394 | | | | 17,017,247 | |
| Broadcom, Inc. | | | 22,544 | | | | 18,724,595 | |
| Intuit, Inc. | | | 40,741 | | | | 20,816,207 | |
| Mastercard, Inc. - Class A | | | 58,798 | | | | 23,278,716 | |
| Microsoft Corporation | | | 111,175 | | | | 35,103,506 | |
| NVIDIA Corporation | | | 25,724 | | | | 11,189,683 | |
| Palo Alto Networks, Inc. (a) | | | 33,083 | | | | 7,755,978 | |
| ServiceNow, Inc. (a) | | | 29,625 | | | | 16,559,190 | |
| Visa, Inc. - Class A | | | 76,346 | | | | 17,560,343 | |
| | | | | | | | 245,293,117 | |
| | | | | | | | | |
| Total Common Stocks (Cost $500,342,311) | | | | | | $ | 757,038,172 | |
| | | | | | | | | |
| MONEY MARKET FUNDS — 3.1% | | Shares | | | Value | |
| First American Treasury Obligations Fund - Class X, 5.26% (b) (Cost $24,084,381) | | | 24,084,381 | | | $ | 24,084,381 | |
| | | | | | | | | |
| Total Investments at Value — 100.5% (Cost $524,426,692) | | | | | | $ | 781,122,553 | |
| | | | | | | | | |
| Liabilities in Excess of Other Assets — (0.5%) | | | | | | | (4,083,850 | ) |
| | | | | | | | | |
| Net Assets — 100.0% | | | | | | $ | 777,038,703 | |
ADR - American Depositary Receipt.
| (a) | Non-income producing security. |
| (b) | The rate shown is the 7-day effective yield as of September 30, 2023. |
See accompanying notes to financial statements.
| DAVENPORT VALUE & INCOME FUND |
| SCHEDULE OF INVESTMENTS |
| September 30, 2023 (Unaudited) |
| COMMON STOCKS — 98.3% | | Shares | | | Value | |
| Communications — 7.5% | | | | | | | | |
| Alphabet, Inc. - Class A (a) | | | 173,065 | | | $ | 22,647,286 | |
| Comcast Corporation - Class A | | | 558,833 | | | | 24,778,655 | |
| Walt Disney Company (The) (a) | | | 140,690 | | | | 11,402,924 | |
| | | | | | | | 58,828,865 | |
| Consumer Discretionary — 5.3% | | | | | | | | |
| Lowe’s Companies, Inc. | | | 93,313 | | | | 19,394,174 | |
| McDonald’s Corporation | | | 83,188 | | | | 21,915,047 | |
| | | | | | | | 41,309,221 | |
| Consumer Staples — 13.4% | | | | | | | | |
| Anheuser-Busch InBev S.A./N.V. - ADR | | | 213,025 | | | | 11,780,283 | |
| Bunge Ltd. | | | 128,040 | | | | 13,860,330 | |
| Diageo plc - ADR | | | 118,039 | | | | 17,609,058 | |
| Keurig Dr Pepper, Inc. | | | 499,931 | | | | 15,782,822 | |
| Philip Morris International, Inc. | | | 202,763 | | | | 18,771,798 | |
| Target Corporation | | | 105,859 | | | | 11,704,830 | |
| Walmart, Inc. | | | 95,166 | | | | 15,219,898 | |
| | | | | | | | 104,729,019 | |
| Energy — 7.6% | | | | | | | | |
| Chevron Corporation | | | 152,979 | | | | 25,795,319 | |
| Coterra Energy, Inc. | | | 712,573 | | | | 19,275,100 | |
| Enbridge, Inc. | | | 433,180 | | | | 14,377,244 | |
| | | | | | | | 59,447,663 | |
| Financials — 24.2% | | | | | | | | |
| Berkshire Hathaway, Inc. - Class B (a) | | | 79,977 | | | | 28,015,943 | |
| Brookfield Asset Management Ltd. - Class A | | | 433,924 | | | | 14,467,026 | |
| Brookfield Corporation | | | 641,892 | | | | 20,071,963 | |
| Chubb Ltd. | | | 64,576 | | | | 13,443,432 | |
| Fairfax Financial Holdings Ltd. | | | 40,880 | | | | 33,478,676 | |
| Fidelity National Financial, Inc. | | | 455,613 | | | | 18,816,817 | |
| JPMorgan Chase & Company | | | 138,488 | | | | 20,083,530 | |
| Markel Group, Inc. (a) | | | 17,818 | | | | 26,236,827 | |
| Wells Fargo & Company | | | 340,290 | | | | 13,904,249 | |
| | | | | | | | 188,518,463 | |
| Health Care — 16.4% | | | | | | | | |
| Bristol-Myers Squibb Company | | | 378,295 | | | | 21,956,242 | |
| Elevance Health, Inc. | | | 50,279 | | | | 21,892,482 | |
| Johnson & Johnson | | | 206,662 | | | | 32,187,607 | |
| Medtronic plc | | | 265,903 | | | | 20,836,159 | |
| Perrigo Company plc | | | 524,618 | | | | 16,761,545 | |
| Sanofi - ADR | | | 271,069 | | | | 14,540,141 | |
| | | | | | | | 128,174,176 | |
| DAVENPORT VALUE & INCOME FUND |
| SCHEDULE OF INVESTMENTS (Continued) |
| COMMON STOCKS — 98.3% (Continued) | | Shares | | | Value | |
| Industrials — 15.0% | | | | | | | | |
| Deere & Company | | | 28,791 | | | $ | 10,865,147 | |
| L3Harris Technologies, Inc. | | | 123,059 | | | | 21,427,033 | |
| Norfolk Southern Corporation | | | 74,214 | | | | 14,614,963 | |
| RTX Corporation | | | 96,410 | | | | 6,938,628 | |
| TE Connectivity Ltd. | | | 151,609 | | | | 18,728,260 | |
| United Parcel Service, Inc. - Class B | | | 138,010 | | | | 21,511,619 | |
| Watsco, Inc. | | | 60,103 | | | | 22,702,105 | |
| | | | | | | | 116,787,755 | |
| Materials — 1.7% | | | | | | | | |
| Avery Dennison Corporation | | | 70,386 | | | | 12,857,410 | |
| | | | | | | | | |
| Real Estate — 2.6% | | | | | | | | |
| Lamar Advertising Company - Class A | | | 244,472 | | | | 20,406,078 | |
| | | | | | | | | |
| Technology — 2.3% | | | | | | | | |
| Oracle Corporation | | | 167,781 | | | | 17,771,363 | |
| | | | | | | | | |
| Utilities — 2.3% | | | | | | | | |
| NextEra Energy, Inc. | | | 306,392 | | | | 17,553,198 | |
| | | | | | | | | |
| Total Common Stocks (Cost $631,456,745) | | | | | | $ | 766,383,211 | |
| | | | | | | | | |
| MONEY MARKET FUNDS — 1.6% | | Shares | | | Value | |
| First American Treasury Obligations Fund - Class X, 5.26% (b) (Cost $12,853,327) | | | 12,853,327 | | | $ | 12,853,327 | |
| | | | | | | | | |
| Total Investments at Value — 99.9% (Cost $644,310,072) | | | | | | $ | 779,236,538 | |
| | | | | | | | | |
| Other Assets in Excess of Liabilities — 0.1% | | | | | | | 562,299 | |
| | | | | | | | | |
| Net Assets — 100.0% | | | | | | $ | 779,798,837 | |
ADR - American Depositary Receipt.
| (a) | Non-income producing security. |
| (b) | The rate shown is the 7-day effective yield as of September 30, 2023. |
See accompanying notes to financial statements.
| DAVENPORT EQUITY OPPORTUNITIES FUND |
| SCHEDULE OF INVESTMENTS |
| September 30, 2023 (Unaudited) |
| COMMON STOCKS — 96.2% | | Shares | | | Value | |
| Communications — 6.7% | | | | | | | | |
| DISH Network Corporation - Class A (a) | | | 1,175,074 | | | $ | 6,885,933 | |
| Take-Two Interactive Software, Inc. (a) | | | 285,371 | | | | 40,063,235 | |
| | | | | | | | 46,949,168 | |
| Consumer Discretionary — 23.4% | | | | | | | | |
| Cannae Holdings, Inc. (a) | | | 1,018,253 | | | | 18,980,236 | |
| DraftKings, Inc. - Class A (a) | | | 1,026,321 | | | | 30,214,890 | |
| Etsy, Inc. (a) | | | 166,245 | | | | 10,736,102 | |
| Live Nation Entertainment, Inc. (a) | | | 354,332 | | | | 29,423,729 | |
| Mobileye Global, Inc. - Class A (a) | | | 657,103 | | | | 27,302,630 | |
| O’Reilly Automotive, Inc. (a) | | | 28,684 | | | | 26,069,740 | |
| Pool Corporation | | | 56,370 | | | | 20,073,357 | |
| | | | | | | | 162,800,684 | |
| Financials — 24.9% | | | | | | | | |
| Allstate Corporation (The) | | | 128,504 | | | | 14,316,630 | |
| Brookfield Asset Management Ltd. - Class A | | | 450,370 | | | | 15,015,336 | |
| Brookfield Corporation | | | 924,295 | | | | 28,902,705 | |
| Fairfax Financial Holdings Ltd. | | | 57,306 | | | | 46,930,749 | |
| Fidelity National Financial, Inc. | | | 516,896 | | | | 21,347,805 | |
| Markel Group, Inc. (a) | | | 31,953 | | | | 47,050,473 | |
| | | | | | | | 173,563,698 | |
| Health Care — 2.7% | | | | | | | | |
| Avantor, Inc. (a) | | | 881,893 | | | | 18,590,304 | |
| | | | | | | | | |
| Industrials — 17.1% | | | | | | | | |
| Enovis Corporation (a) | | | 542,842 | | | | 28,624,059 | |
| ESAB Corporation | | | 209,524 | | | | 14,712,775 | |
| J.B. Hunt Transport Services, Inc. | | | 110,027 | | | | 20,742,290 | |
| Watsco, Inc. | | | 69,061 | | | | 26,085,721 | |
| Xylem, Inc. | | | 314,023 | | | | 28,585,514 | |
| | | | | | | | 118,750,359 | |
| Materials — 7.6% | | | | | | | | |
| Martin Marietta Materials, Inc. | | | 71,088 | | | | 29,180,202 | |
| Sherwin-Williams Company (The) | | | 91,710 | | | | 23,390,636 | |
| | | | | | | | 52,570,838 | |
| Real Estate — 6.4% | | | | | | | | |
| American Tower Corporation | | | 143,420 | | | | 23,585,419 | |
| Lamar Advertising Company - Class A | | | 248,061 | | | | 20,705,652 | |
| | | | | | | | 44,291,071 | |
| DAVENPORT EQUITY OPPORTUNITIES FUND |
| SCHEDULE OF INVESTMENTS (Continued) |
| COMMON STOCKS — 96.2% (Continued) | | Shares | | | Value | |
| Technology — 7.4% | | | | | | | | |
| Alight, Inc. - Class A (a) | | | 3,087,455 | | | $ | 21,890,056 | |
| Autodesk, Inc. (a) | | | 72,539 | | | | 15,009,044 | |
| PTC, Inc. (a) | | | 105,431 | | | | 14,937,464 | |
| | | | | | | | 51,836,564 | |
| | | | | | | | | |
| Total Common Stocks (Cost $578,045,893) | | | | | | $ | 669,352,686 | |
| | | | | | | | | |
| MONEY MARKET FUNDS — 3.8% | | Shares | | | Value | |
| First American Treasury Obligations Fund - Class X, 5.26% (b) (Cost $26,358,340) | | | 26,358,340 | | | $ | 26,358,340 | |
| | | | | | | | | |
| Total Investments at Value — 100.0% (Cost $604,404,233) | | | | | | $ | 695,711,026 | |
| | | | | | | | | |
| Liabilities in Excess of Other Assets — (0.0%) (c) | | | | | | | (41,345 | ) |
| | | | | | | | | |
| Net Assets — 100.0% | | | | | | $ | 695,669,681 | |
| (a) | Non-income producing security. |
| (b) | The rate shown is the 7-day effective yield as of September 30, 2023. |
| (c) | Percentage rounds to less than 0.1%. |
See accompanying notes to financial statements.
| DAVENPORT SMALL CAP FOCUS FUND |
| SCHEDULE OF INVESTMENTS |
| September 30, 2023 (Unaudited) |
| COMMON STOCKS — 89.6% | | Shares | | | Value | |
| Communications — 9.1% | | | | | | | | |
| Cable One, Inc. | | | 27,251 | | | $ | 16,776,805 | |
| Liberty Latin America Ltd. - Class C (a) | | | 2,975,275 | | | | 24,278,244 | |
| Shenandoah Telecommunications Company | | | 871,793 | | | | 17,967,654 | |
| | | | | | | | 59,022,703 | |
| Consumer Discretionary — 17.6% | | | | | | | | |
| Cannae Holdings, Inc. (a) | | | 1,115,479 | | | | 20,792,528 | |
| DraftKings Inc. - Class A (a) | | | 617,006 | | | | 18,164,657 | |
| Leslie’s, Inc. (a) | | | 3,000,000 | | | | 16,980,000 | |
| Monarch Casino & Resort, Inc. | | | 576,298 | | | | 35,788,106 | |
| OneSpaWorld Holdings Ltd. (a) | | | 1,983,340 | | | | 22,253,075 | |
| | | | | | | | 113,978,366 | |
| Consumer Staples — 7.0% | | | | | | | | |
| J & J Snack Foods Corporation | | | 184,874 | | | | 30,254,630 | |
| Seaboard Corporation | | | 4,035 | | | | 15,143,355 | |
| | | | | | | | 45,397,985 | |
| Energy — 4.0% | | | | | | | | |
| California Resources Corporation | | | 150,000 | | | | 8,401,500 | |
| Peyto Exploration & Development Corporation | | | 1,719,782 | | | | 17,352,601 | |
| | | | | | | | 25,754,101 | |
| Financials — 11.5% | | | | | | | | |
| Diamond Hill Investment Group, Inc. | | | 102,730 | | | | 17,317,196 | |
| Kinsale Capital Group, Inc. | | | 72,834 | | | | 30,162,744 | |
| Stewart Information Services Corporation | | | 622,446 | | | | 27,263,135 | |
| | | | | | | | 74,743,075 | |
| Health Care — 3.4% | | | | | | | | |
| Perrigo Company plc | | | 693,996 | | | | 22,173,172 | |
| | | | | | | | | |
| Industrials — 9.1% | | | | | | | | |
| Enovis Corporation (a) | | | 514,566 | | | | 27,133,065 | |
| ESAB Corporation | | | 320,511 | | | | 22,506,283 | |
| Teekay Tankers Ltd. - Class A | | | 219,292 | | | | 9,129,126 | |
| | | | | | | | 58,768,474 | |
| Materials — 5.4% | | | | | | | | |
| NewMarket Corporation | | | 55,793 | | | | 25,388,047 | |
| Trex Company, Inc. (a) | | | 159,600 | | | | 9,836,148 | |
| | | | | | | | 35,224,195 | |
| Real Estate — 8.0% | | | | | | | | |
| FRP Holdings, Inc. (a) | | | 132,183 | | | | 7,133,917 | |
| Janus International Group, Inc. (a) | | | 2,661,796 | | | | 28,481,217 | |
| Lamar Advertising Company - Class A | | | 197,722 | | | | 16,503,855 | |
| | | | | | | | 52,118,989 | |
| DAVENPORT SMALL CAP FOCUS FUND |
| SCHEDULE OF INVESTMENTS (Continued) |
| COMMON STOCKS — 89.6% (Continued) | | Shares | | | Value | |
| Technology — 14.5% | | | | | | | | |
| Alight, Inc. - Class A (a) | | | 3,552,817 | | | $ | 25,189,473 | |
| DoubleVerify Holdings, Inc. (a) | | | 480,000 | | | | 13,416,000 | |
| HealthEquity, Inc. (a) | | | 300,000 | | | | 21,915,000 | |
| Verra Mobility Corporation (a) | | | 1,787,835 | | | | 33,432,514 | |
| | | | | | | | 93,952,987 | |
| | | | | | | | | |
| Total Common Stocks (Cost $556,319,684) | | | | | | $ | 581,134,047 | |
| | | | | | | | | |
| EXCHANGE-TRADED FUNDS — 2.8% | | Shares | | | Value | |
| ALPS Medical Breakthroughs ETF (a) (Cost $20,662,458) | | | 670,000 | | | $ | 18,238,070 | |
| | | | | | | | | |
| MONEY MARKET FUNDS — 7.7% | | Shares | | | Value | |
| First American Treasury Obligations Fund - Class X, 5.26% (b) (Cost $49,918,523) | | | 49,918,523 | | | $ | 49,918,523 | |
| | | | | | | | | |
| Total Investments at Value — 100.1% (Cost $626,900,665) | | | | | | $ | 649,290,640 | |
| | | | | | | | | |
| Liabilities in Excess of Other Assets — (0.1%) | | | | | | | (592,209 | ) |
| | | | | | | | | |
| Net Assets — 100.0% | | | | | | $ | 648,698,431 | |
| (a) | Non-income producing security. |
| (b) | The rate shown is the 7-day effective yield as of September 30, 2023. |
See accompanying notes to financial statements.
| DAVENPORT BALANCED INCOME FUND |
| SCHEDULE OF INVESTMENTS |
| September 30, 2023 (Unaudited) |
| COMMON STOCKS — 59.3% | | Shares | | | Value | |
| Communications — 3.9% | | | | | | | | |
| Alphabet, Inc. - Class A (a) | | | 23,957 | | | $ | 3,135,013 | |
| Comcast Corporation - Class A | | | 81,516 | | | | 3,614,419 | |
| Walt Disney Company (The) (a) | | | 20,518 | | | | 1,662,984 | |
| | | | | | | | 8,412,416 | |
| Consumer Discretionary — 2.7% | | | | | | | | |
| Lowe’s Companies, Inc. | | | 13,081 | | | | 2,718,755 | |
| McDonald’s Corporation | | | 11,500 | | | | 3,029,560 | |
| | | | | | | | 5,748,315 | |
| Consumer Staples — 8.6% | | | | | | | | |
| Anheuser-Busch InBev S.A./N.V. - ADR | | | 31,531 | | | | 1,743,664 | |
| Bunge Ltd. | | | 18,643 | | | | 2,018,105 | |
| Diageo plc - ADR | | | 16,673 | | | | 2,487,278 | |
| Ingredion, Inc. | | | 13,155 | | | | 1,294,452 | |
| Kenvue, Inc. | | | 108,000 | | | | 2,168,640 | |
| Keurig Dr Pepper, Inc. | | | 75,934 | | | | 2,397,236 | |
| Philip Morris International, Inc. | | | 28,551 | | | | 2,643,251 | |
| Target Corporation | | | 15,566 | | | | 1,721,133 | |
| Walmart, Inc. | | | 13,062 | | | | 2,089,006 | |
| | | | | | | | 18,562,765 | |
| Energy — 5.1% | | | | | | | | |
| Chevron Corporation | | | 23,044 | | | | 3,885,680 | |
| Coterra Energy, Inc. | | | 104,220 | | | | 2,819,151 | |
| Enbridge, Inc. | | | 60,275 | | | | 2,000,527 | |
| Enterprise Products Partners, L.P. | | | 87,000 | | | | 2,381,190 | |
| | | | | | | | 11,086,548 | |
| Financials — 14.6% | | | | | | | | |
| Berkshire Hathaway, Inc. - Class B (a) | | | 11,683 | | | | 4,092,555 | |
| Brookfield Asset Management Ltd. - Class A | | | 63,956 | | | | 2,132,293 | |
| Brookfield Corporation | | | 90,137 | | | | 2,818,584 | |
| Chubb Ltd. | | | 9,796 | | | | 2,039,331 | |
| Diamond Hill Investment Group, Inc. | | | 11,715 | | | | 1,974,798 | |
| Fairfax Financial Holdings Ltd. | | | 5,963 | | | | 4,883,399 | |
| Fidelity National Financial, Inc. | | | 69,045 | | | | 2,851,558 | |
| JPMorgan Chase & Company | | | 19,077 | | | | 2,766,547 | |
| Markel Group, Inc. (a) | | | 2,460 | | | | 3,622,325 | |
| Stewart Information Services Corporation | | | 50,417 | | | | 2,208,265 | |
| Wells Fargo & Company | | | 47,098 | | | | 1,924,424 | |
| | | | | | | | 31,314,079 | |
| Health Care — 9.1% | | | | | | | | |
| Bristol-Myers Squibb Company | | | 54,646 | | | | 3,171,654 | |
| Elevance Health, Inc. | | | 7,333 | | | | 3,192,935 | |
| Johnson & Johnson | | | 28,470 | | | | 4,434,202 | |
| DAVENPORT BALANCED INCOME FUND |
| SCHEDULE OF INVESTMENTS (Continued) |
| COMMON STOCKS — 59.3% (Continued) | | Shares | | | Value | |
| Health Care — 9.1% (Continued) | | | | | | | | |
| Medtronic plc | | | 36,857 | | | $ | 2,888,115 | |
| Perrigo Company plc | | | 116,716 | | | | 3,729,076 | |
| Sanofi - ADR | | | 38,300 | | | | 2,054,412 | |
| | | | | | | | 19,470,394 | |
| Industrials — 8.0% | | | | | | | | |
| Deere & Company | | | 4,232 | | | | 1,597,072 | |
| L3Harris Technologies, Inc. | | | 18,641 | | | | 3,245,771 | |
| Norfolk Southern Corporation | | | 10,378 | | | | 2,043,739 | |
| RTX Corporation | | | 14,063 | | | | 1,012,114 | |
| TE Connectivity Ltd. | | | 20,730 | | | | 2,560,777 | |
| United Parcel Service, Inc. - Class B | | | 20,707 | | | | 3,227,600 | |
| Watsco, Inc. | | | 9,108 | | | | 3,440,274 | |
| | | | | | | | 17,127,347 | |
| Materials — 2.0% | | | | | | | | |
| Avery Dennison Corporation | | | 10,567 | | | | 1,930,274 | |
| NewMarket Corporation | | | 5,100 | | | | 2,320,704 | |
| | | | | | | | 4,250,978 | |
| Real Estate — 1.3% | | | | | | | | |
| Lamar Advertising Company - Class A | | | 33,988 | | | | 2,836,978 | |
| | | | | | | | | |
| Technology — 1.2% | | | | | | | | |
| Oracle Corporation | | | 24,255 | | | | 2,569,090 | |
| | | | | | | | | |
| Utilities — 2.8% | | | | | | | | |
| Brookfield Infrastructure Partners, L.P. | | | 61,867 | | | | 1,818,890 | |
| Brookfield Renewable Partners, L.P. | | | 76,999 | | | | 1,673,958 | |
| NextEra Energy, Inc. | | | 45,043 | | | | 2,580,514 | |
| | | | | | | | 6,073,362 | |
| | | | | | | | | |
| Total Common Stocks (Cost $109,441,060) | | | | | | $ | 127,452,272 | |
| DAVENPORT BALANCED INCOME FUND |
| SCHEDULE OF INVESTMENTS (Continued) |
| FIXED RATE CORPORATE BONDS — 29.7% | | Par Value | | | Value | |
| Communications — 4.1% | | | | | | | | |
| Meta Platforms, Inc., 4.950%, due 05/15/2033 | | $ | 4,990,000 | | | $ | 4,783,671 | |
| Verisign, Inc., 5.250%, due 04/01/2025 | | | 3,950,000 | | | | 3,912,376 | |
| | | | | | | | 8,696,047 | |
| Consumer Discretionary — 2.5% | | | | | | | | |
| Lowe’s Companies, Inc., 4.400%, due 09/08/2025 | | | 1,525,000 | | | | 1,490,943 | |
| Marriott International, Inc., 3.600%, due 04/15/2024 | | | 3,990,000 | | | | 3,940,739 | |
| | | | | | | | 5,431,682 | |
| Consumer Staples — 2.4% | | | | | | | | |
| Phillip Morris International, Inc., 5.375%, due 02/15/2033 | | | 2,995,000 | | | | 2,839,674 | |
| Walgreens Boots Alliance, Inc., 3.800%, due 11/18/2024 | | | 2,245,000 | | | | 2,185,508 | |
| | | | | | | | 5,025,182 | |
| Energy — 4.6% | | | | | | | | |
| Boardwalk Pipelines, L.P., 4.450%, due 07/15/2027 | | | 2,200,000 | | | | 2,072,209 | |
| BP Capital Markets America, 4.812%, due 02/13/2033 | | | 2,990,000 | | | | 2,800,528 | |
| MPLX, L.P., 4.125%, due 03/01/2027 | | | 3,250,000 | | | | 3,075,068 | |
| ONEOK, Inc., 5.550%, due 11/01/2026 | | | 1,995,000 | | | | 1,983,858 | |
| | | | | | | | 9,931,663 | |
| Financials — 7.8% | | | | | | | | |
| American Express Company, 3.375%, due 05/03/2024 | | | 2,995,000 | | | | 2,948,996 | |
| Bank of Montreal, 5.920%, due 09/25/2025 | | | 3,990,000 | | | | 3,984,832 | |
| BlackRock, Inc., 4.750%, due 05/25/2033 | | | 3,000,000 | | | | 2,818,137 | |
| Brookfield Finance, Inc., 4.000%, due 04/01/2024 | | | 530,000 | | | | 524,138 | |
| Charles Schwab Corporation, 5.875%, due 08/24/2026 | | | 3,750,000 | | | | 3,737,926 | |
| Royal Bank of Canada, 5.000%, due 05/02/2033 | | | 3,000,000 | | | | 2,788,548 | |
| | | | | | | | 16,802,577 | |
| Health Care — 2.5% | | | | | | | | |
| Merck & Company, Inc., 4.500%, due 05/17/2033 | | | 2,490,000 | | | | 2,330,959 | |
| Zoetis, Inc., 5.400%, due 11/14/2025 | | | 2,990,000 | | | | 2,977,576 | |
| | | | | | | | 5,308,535 | |
| Industrials — 0.9% | | | | | | | | |
| Waste Management, Inc., 4.875%, due 02/15/2029 | | | 1,995,000 | | | | 1,951,967 | |
| | | | | | | | | |
| Technology — 3.5% | | | | | | | | |
| Apple, Inc., 4.300%, due 05/10/2033 | | | 2,490,000 | | | | 2,351,222 | |
| Fiserv, Inc., 3.200%, due 07/01/2026 | | | 2,325,000 | | | | 2,174,210 | |
| Oracle Corporation, 5.800%, due 11/10/2025 | | | 2,990,000 | | | | 3,001,452 | |
| | | | | | | | 7,526,884 | |
| DAVENPORT BALANCED INCOME FUND |
| SCHEDULE OF INVESTMENTS (Continued) |
| FIXED RATE CORPORATE BONDS — 29.7% (Continued) | | Par Value | | | Value | |
| Utilities — 1.4% | | | | | | | | |
| NextEra Energy Capital Holdings, Inc., 6.051%, due 03/01/2025 | | $ | 2,995,000 | | | $ | 2,999,706 | |
| | | | | | | | | |
| Total Fixed Rate Corporate Bonds (Cost $65,768,915) | | | | | | $ | 63,674,243 | |
| | | | | | | | | |
| MUNICIPAL BONDS — 1.1% | | Par Value | | | Value | |
| Richmond, VA, GO, Public Improvement Bonds, 4.800%, due 03/01/2033 (Cost $2,540,617) | | $ | 2,455,000 | | | $ | 2,361,591 | |
| | | | | | | | | |
| U.S. TREASURY OBLIGATIONS — 7.6% | | Par Value | | | Value | |
| U.S. Treasury Bills — 1.6%(b) | | | | | | | | |
| 5.500%, due 01/25/2024 | | | 3,490,000 | | | $ | 3,430,893 | |
| | | | | | | | | |
| U.S. Treasury Notes — 6.0% | | | | | | | | |
| 1.500%, due 02/29/2024 | | | 1,995,000 | | | | 1,962,893 | |
| 0.250%, due 06/15/2024 | | | 4,500,000 | | | | 4,338,105 | |
| 2.750%, due 06/30/2025 | | | 4,810,000 | | | | 4,618,915 | |
| 4.750%, due 07/31/2025 | | | 2,000,000 | | | | 1,986,797 | |
| | | | | | | | 12,906,710 | |
| | | | | | | | | |
| Total U.S. Treasury Obligations (Cost $16,720,765) | | | | | | $ | 16,337,603 | |
| DAVENPORT BALANCED INCOME FUND |
| SCHEDULE OF INVESTMENTS (Continued) |
| MONEY MARKET FUNDS — 1.3% | | Shares | | | Value | |
| First American Treasury Obligations Fund - Class X, 5.26% (c) (Cost $2,860,993) | | | 2,860,993 | | | $ | 2,860,993 | |
| | | | | | | | | |
| Total Investments at Value — 99.0% (Cost $197,332,350) | | | | | | $ | 212,686,702 | |
| | | | | | | | | |
| Other Assets in Excess of Liabilities — 1.0% | | | | | | | 2,117,286 | |
| | | | | | | | | |
| Net Assets — 100.0% | | | | | | $ | 214,803,988 | |
ADR - American Depositary Receipt.
| (a) | Non-income producing security. |
| (b) | The rate shown is the annualized yield at the time of purchase. |
| (c) | The rate shown is the 7-day effective yield as of September 30, 2023. |
See accompanying notes to financial statements.
| THE DAVENPORT FUNDS |
| STATEMENTS OF ASSETS AND LIABILITIES |
| September 30, 2023 (Unaudited) |
| | | | | | Davenport | | | Davenport | |
| | | Davenport | | | Value & | | | Equity | |
| | | Core Leaders | | | Income | | | Opportunities | |
| | | Fund | | | Fund | | | Fund | |
| ASSETS | | | | | | | | | | | | |
| Investments in securities: | | | | | | | | | | | | |
| At cost | | $ | 524,426,692 | | | $ | 644,310,072 | | | $ | 604,404,233 | |
| At value (Note 2) | | $ | 781,122,553 | | | $ | 779,236,538 | | | $ | 695,711,026 | |
| Cash | | | — | | | | 118,027 | | | | 122,501 | |
| Receivable for capital shares sold | | | 111,370 | | | | 123,610 | | | | 170,196 | |
| Dividends receivable | | | 280,746 | | | | 1,002,888 | | | | 177,770 | |
| Tax reclaims receivable | | | 21,659 | | | | — | | | | — | |
| Other assets | | | 23,934 | | | | 25,889 | | | | 24,664 | |
| TOTAL ASSETS | | | 781,560,262 | | | | 780,506,952 | | | | 696,206,157 | |
| | | | | | | | | | | | | |
| LIABILITIES | | | | | | | | | | | | |
| Payable for capital shares redeemed | | | 75,576 | | | | 138,388 | | | | 29,756 | |
| Payable investment securities purchased | | | 3,879,451 | | | | — | | | | — | |
| Accrued investment advisory fees (Note 4) | | | 493,487 | | | | 496,872 | | | | 436,075 | |
| Payable to administrator (Note 4) | | | 61,280 | | | | 62,790 | | | | 58,840 | |
| Other accrued expenses | | | 11,765 | | | | 10,065 | | | | 11,805 | |
| TOTAL LIABILITIES | | | 4,521,559 | | | | 708,115 | | | | 536,476 | |
| | | | | | | | | | | | | |
| NET ASSETS | | $ | 777,038,703 | | | $ | 779,798,837 | | | $ | 695,669,681 | |
| | | | | | | | | | | | | |
| Net assets consist of: | | | | | | | | | | | | |
| Paid-in capital | | $ | 494,617,516 | | | $ | 666,226,463 | | | $ | 587,351,160 | |
| Accumulated earnings | | | 282,421,187 | | | | 113,572,374 | | | | 108,318,521 | |
| Net assets | | $ | 777,038,703 | | | $ | 779,798,837 | | | $ | 695,669,681 | |
| | | | | | | | | | | | | |
| Shares of beneficial interest outstanding (unlimited number of shares authorized, $0.01 par value) | | | 27,098,046 | | | | 46,719,232 | | | | 34,729,988 | |
| | | | | | | | | | | | | |
| Net asset value, offering price and redemption price per share (Note 2) | | $ | 28.68 | | | $ | 16.69 | | | $ | 20.03 | |
See accompanying notes to financial statements.
| THE DAVENPORT FUNDS |
| STATEMENTS OF ASSETS AND LIABILITIES (Continued) |
| September 30, 2023 (Unaudited) |
| | | Davenport | | | Davenport | |
| | | Small Cap | | | Balanced | |
| | | Focus | | | Income | |
| | | Fund | | | Fund | |
| ASSETS | | | | | | | | |
| Investments in securities: | | | | | | | | |
| At cost | | $ | 626,900,665 | | | $ | 197,332,350 | |
| At value (Note 2) | | $ | 649,290,640 | | | $ | 212,686,702 | |
| Cash | | | — | | | | 41,304 | |
| Receivable for capital shares sold | | | 566,466 | | | | 23,010 | |
| Receivable for investment securities sold | | | — | | | | 1,139,490 | |
| Dividends and interest receivable | | | 613,305 | | | | 1,074,248 | |
| Other assets | | | 25,507 | | | | 19,276 | |
| TOTAL ASSETS | | | 650,495,918 | | | | 214,984,030 | |
| | | | | | | | | |
| LIABILITIES | | | | | | | | |
| Payable for capital shares redeemed | | | 88,780 | | | | 16,671 | |
| Payable investment securities purchased | | | 1,237,420 | | | | — | |
| Accrued investment advisory fees (Note 4) | | | 401,962 | | | | 135,391 | |
| Payable to administrator (Note 4) | | | 55,020 | | | | 21,600 | |
| Other accrued expenses | | | 14,305 | | | | 6,380 | |
| TOTAL LIABILITIES | | | 1,797,487 | | | | 180,042 | |
| | | | | | | | | |
| NET ASSETS | | $ | 648,698,431 | | | $ | 214,803,988 | |
| | | | | | | | | |
| Net assets consist of: | | | | | | | | |
| Paid-in capital | | $ | 619,147,512 | | | $ | 208,892,516 | |
| Accumulated earnings | | | 29,550,919 | | | | 5,911,472 | |
| Net assets | | $ | 648,698,431 | | | $ | 214,803,988 | |
| | | | | | | | | |
| Shares of beneficial interest outstanding (unlimited number of shares authorized, $0.01 par value) | | | 40,498,669 | | | | 18,278,940 | |
| | | | | | | | | |
| Net asset value, offering price and redemption price per share (Note 2) | | $ | 16.02 | | | $ | 11.75 | |
See accompanying notes to financial statements.
| THE DAVENPORT FUNDS |
| STATEMENTS OF OPERATIONS |
| For the Six Months Ended September 30, 2023 (Unaudited) |
| | | | | | Davenport | | | Davenport | |
| | | Davenport | | | Value & | | | Equity | |
| | | Core Leaders | | | Income | | | Opportunities | |
| | | Fund | | | Fund | | | Fund | |
| INVESTMENT INCOME | | | | | | | | | | | | |
| Dividends | | $ | 4,471,530 | | | $ | 10,735,724 | | | $ | 3,834,410 | |
| Foreign withholding taxes on dividends | | | (31,962 | ) | | | (288,568 | ) | | | (69,116 | ) |
| TOTAL INVESTMENT INCOME | | | 4,439,568 | | | | 10,447,156 | | | | 3,765,294 | |
| | | | | | | | | | | | | |
| EXPENSES | | | | | | | | | | | | |
| Investment advisory fees (Note 4) | | | 2,883,391 | | | | 3,047,951 | | | | 2,601,824 | |
| Administration fees (Note 4) | | | 346,180 | | | | 366,035 | | | | 337,975 | |
| Custodian and bank service fees | | | 22,903 | | | | 24,018 | | | | 20,518 | |
| Registration and filing fees | | | 16,993 | | | | 15,275 | | | | 18,499 | |
| Compliance service fees (Note 4) | | | 15,347 | | | | 16,074 | | | | 14,009 | |
| Trustees’ fees and expenses (Note 4) | | | 11,194 | | | | 11,194 | | | | 11,194 | |
| Postage and supplies | | | 15,016 | | | | 8,831 | | | | 8,788 | |
| Audit and tax services fees | | | 8,665 | | | | 8,665 | | | | 8,665 | |
| Insurance expense | | | 6,432 | | | | 7,206 | | | | 5,953 | |
| Legal fees | | | 5,005 | | | | 4,505 | | | | 4,505 | |
| Shareholder reporting expenses | | | 2,978 | | | | 2,968 | | | | 2,968 | |
| Other expenses | | | 5,828 | | | | 6,490 | | | | 6,113 | |
| TOTAL EXPENSES | | | 3,339,932 | | | | 3,519,212 | | | | 3,041,011 | |
| | | | | | | | | | | | | |
| NET INVESTMENT INCOME | | | 1,099,636 | | | | 6,927,944 | | | | 724,283 | |
| | | | | | | | | | | | | |
| REALIZED AND UNREALIZED GAINS (LOSSES) ON INVESTMENTS AND FOREIGN CURRENCIES | | | | | | | | | | | | |
| Net realized gains (losses) from: | | | | | | | | | | | | |
| Investments | | | 25,738,269 | | | | (2,569,936 | ) | | | 16,314,667 | |
| Foreign currency transactions | | | — | | | | (1,447 | ) | | | — | |
| Net change in unrealized appreciation (depreciation) on investments | | | 37,481,089 | | | | (8,782,374 | ) | | | 16,208,732 | |
| NET REALIZED AND UNREALIZED GAINS (LOSSES) ON INVESTMENTS AND FOREIGN CURRENCIES | | | 63,219,358 | | | | (11,353,757 | ) | | | 32,523,399 | |
| | | | | | | | | | | | | |
| NET INCREASE (DECREASE) IN NET ASSETS FROM OPERATIONS | | $ | 64,318,994 | | | $ | (4,425,813 | ) | | $ | 33,247,682 | |
See accompanying notes to financial statements.
| THE DAVENPORT FUNDS |
| STATEMENTS OF OPERATIONS (Continued) |
| For the Six Months Ended September 30, 2023 (Unaudited) |
| | | Davenport | | | Davenport | |
| | | Small Cap | | | Balanced | |
| | | Focus | | | Income | |
| | | Fund | | | Fund | |
| INVESTMENT INCOME | | | | | | | | |
| Dividends | | $ | 5,360,806 | | | $ | 1,946,917 | |
| Foreign withholding taxes on dividends | | | (129,043 | ) | | | (40,606 | ) |
| Interest | | | — | | | | 1,756,253 | |
| TOTAL INVESTMENT INCOME | | | 5,231,763 | | | | 3,662,564 | |
| | | | | | | | | |
| EXPENSES | | | | | | | | |
| Investment advisory fees (Note 4) | | | 2,361,626 | | | | 830,655 | |
| Administration fees (Note 4) | | | 311,582 | | | | 125,629 | |
| Custodian and bank service fees | | | 19,292 | | | | 7,634 | |
| Registration and filing fees | | | 22,286 | | | | 14,022 | |
| Compliance service fees (Note 4) | | | 12,896 | | | | 5,834 | |
| Trustees’ fees and expenses (Note 4) | | | 11,194 | | | | 11,194 | |
| Postage and supplies | | | 8,239 | | | | 5,569 | |
| Audit and tax services fees | | | 8,665 | | | | 9,415 | |
| Insurance expense | | | 5,452 | | | | 2,313 | |
| Legal fees | | | 4,505 | | | | 4,505 | |
| Shareholder reporting expenses | | | 2,945 | | | | 2,978 | |
| Other expenses | | | 6,363 | | | | 8,147 | |
| TOTAL EXPENSES | | | 2,775,045 | | | | 1,027,895 | |
| | | | | | | | | |
| NET INVESTMENT INCOME | | | 2,456,718 | | | | 2,634,669 | |
| | | | | | | | | |
| REALIZED AND UNREALIZED GAINS (LOSSES) ON INVESTMENTS AND FOREIGN CURRENCIES | | | | | | | | |
| Net realized gains (losses) from: | | | | | | | | |
| Investments | | | 7,028,233 | | | | (5,125,045 | ) |
| Foreign currency transactions | | | — | | | | (210 | ) |
| Net change in unrealized appreciation (depreciation) on investments | | | 6,916,994 | | | | 952,844 | |
| NET REALIZED AND UNREALIZED GAINS (LOSSES) ON INVESTMENTS AND FOREIGN CURRENCIES | | | 13,945,227 | | | | (4,172,411 | ) |
| | | | | | | | | |
| NET INCREASE (DECREASE) IN NET ASSETS FROM OPERATIONS | | $ | 16,401,945 | | | $ | (1,537,742 | ) |
See accompanying notes to financial statements.
| DAVENPORT CORE LEADERS FUND |
| STATEMENTS OF CHANGES IN NET ASSETS |
| | | Six Months | | | | |
| | | Ended | | | Year | |
| | | September 30, | | | Ended | |
| | | 2023 | | | March 31, | |
| | | (Unaudited) | | | 2023 | |
| FROM OPERATIONS | | | | | | | | |
| Net investment income | | $ | 1,099,636 | | | $ | 4,821,679 | |
| Net realized gains from investments transactions | | | 25,738,269 | | | | 22,404,942 | |
| Net change in unrealized appreciation (depreciation) on investments | | | 37,481,089 | | | | (124,093,570 | ) |
| Net increase (decrease) in net assets from operations | | | 64,318,994 | | | | (96,866,949 | ) |
| | | | | | | | | |
| DISTRIBUTIONS TO SHAREHOLDERS (Note 2) | | | (23,556,804 | ) | | | (33,421,621 | ) |
| | | | | | | | | |
| FROM CAPITAL SHARE TRANSACTIONS | | | | | | | | |
| Proceeds from shares sold | | | 28,840,630 | | | | 38,523,003 | |
| Net asset value of shares issued in reinvestment of distributions to shareholders | | | 21,898,920 | | | | 31,599,447 | |
| Payments for shares redeemed | | | (31,281,013 | ) | | | (68,665,707 | ) |
| Net increase in net assets from capital share transactions | | | 19,458,537 | | | | 1,456,743 | |
| | | | | | | | | |
| TOTAL INCREASE (DECREASE) IN NET ASSETS | | | 60,220,727 | | | | (128,831,827 | ) |
| | | | | | | | | |
| NET ASSETS | | | | | | | | |
| Beginning of period | | | 716,817,976 | | | | 845,649,803 | |
| End of period | | $ | 777,038,703 | | | $ | 716,817,976 | |
| | | | | | | | | |
| CAPITAL SHARE ACTIVITY | | | | | | | | |
| Shares sold | | | 995,907 | | | | 1,410,655 | |
| Shares reinvested | | | 762,356 | | | | 1,204,906 | |
| Shares redeemed | | | (1,094,782 | ) | | | (2,535,484 | ) |
| Net increase in shares outstanding | | | 663,481 | | | | 80,077 | |
| Shares outstanding at beginning of period | | | 26,434,565 | | | | 26,354,488 | |
| Shares outstanding at end of period | | | 27,098,046 | | | | 26,434,565 | |
See accompanying notes to financial statements.
| DAVENPORT VALUE & INCOME FUND |
| STATEMENTS OF CHANGES IN NET ASSETS |
| | | Six Months | | | | |
| | | Ended | | | Year | |
| | | September 30, | | | Ended | |
| | | 2023 | | | March 31, | |
| | | (Unaudited) | | | 2023 | |
| FROM OPERATIONS | | | | | | | | |
| Net investment income | | $ | 6,927,944 | | | $ | 16,588,979 | |
| Net realized losses from: | | | | | | | | |
| Investments | | | (2,569,936 | ) | | | (14,205,769 | ) |
| Foreign currency transactions | | | (1,447 | ) | | | (8,145 | ) |
| Net change in unrealized appreciation (depreciation) on investments | | | (8,782,374 | ) | | | (110,973,394 | ) |
| Net decrease in net assets from operations | | | (4,425,813 | ) | | | (108,598,329 | ) |
| | | | | | | | | |
| DISTRIBUTIONS TO SHAREHOLDERS (Note 2) | | | (6,323,597 | ) | | | (44,814,541 | ) |
| | | | | | | | | |
| FROM CAPITAL SHARE TRANSACTIONS | | | | | | | | |
| Proceeds from shares sold | | | 21,369,932 | | | | 64,176,770 | |
| Net asset value of shares issued in reinvestment of distributions to shareholders | | | 5,650,756 | | | | 41,332,927 | |
| Payments for shares redeemed | | | (40,402,058 | ) | | | (68,222,589 | ) |
| Net increase (decrease) in net assets from capital share transactions | | | (13,381,370 | ) | | | 37,287,108 | |
| | | | | | | | | |
| TOTAL DECREASE IN NET ASSETS | | | (24,130,780 | ) | | | (116,125,762 | ) |
| | | | | | | | | |
| NET ASSETS | | | | | | | | |
| Beginning of period | | | 803,929,617 | | | | 920,055,379 | |
| End of period | | $ | 779,798,837 | | | $ | 803,929,617 | |
| | | | | | | | | |
| CAPITAL SHARE ACTIVITY | | | | | | | | |
| Shares sold | | | 1,239,697 | | | | 3,639,179 | |
| Shares reinvested | | | 326,196 | | | | 2,406,658 | |
| Shares redeemed | | | (2,353,930 | ) | | | (3,885,746 | ) |
| Net increase (decrease) in shares outstanding | | | (788,037 | ) | | | 2,160,091 | |
| Shares outstanding at beginning of period | | | 47,507,269 | | | | 45,347,178 | |
| Shares outstanding at end of period | | | 46,719,232 | | | | 47,507,269 | |
See accompanying notes to financial statements.
| DAVENPORT EQUITY OPPORTUNITIES FUND |
| STATEMENTS OF CHANGES IN NET ASSETS |
| | | Six Months | | | | |
| | | Ended | | | Year | |
| | | September 30, | | | Ended | |
| | | 2023 | | | March 31, | |
| | | (Unaudited) | | | 2023 | |
| FROM OPERATIONS | | | | | | | | |
| Net investment income | | $ | 724,283 | | | $ | 2,577,584 | |
| Net realized gains from investments transactions | | | 16,314,667 | | | | 28,229,925 | |
| Net change in unrealized appreciation (depreciation) on investments | | | 16,208,732 | | | | (100,269,606 | ) |
| Net increase (decrease) in net assets from operations | | | 33,247,682 | | | | (69,462,097 | ) |
| | | | | | | | | |
| DISTRIBUTIONS TO SHAREHOLDERS (Note 2) | | | (19,564,047 | ) | | | (51,814,659 | ) |
| | | | | | | | | |
| FROM CAPITAL SHARE TRANSACTIONS | | | | | | | | |
| Proceeds from shares sold | | | 31,830,611 | | | | 46,895,501 | |
| Net asset value of shares issued in reinvestment of distributions to shareholders | | | 18,508,066 | | | | 49,644,736 | |
| Payments for shares redeemed | | | (22,218,115 | ) | | | (62,893,747 | ) |
| Net increase in net assets from capital share transactions | | | 28,120,562 | | | | 33,646,490 | |
| | | | | | | | | |
| TOTAL INCREASE (DECREASE) IN NET ASSETS | | | 41,804,197 | | | | (87,630,266 | ) |
| | | | | | | | | |
| NET ASSETS | | | | | | | | |
| Beginning of period | | | 653,865,484 | | | | 741,495,750 | |
| End of period | | $ | 695,669,681 | | | $ | 653,865,484 | |
| | | | | | | | | |
| CAPITAL SHARE ACTIVITY | | | | | | | | |
| Shares sold | | | 1,563,190 | | | | 2,374,908 | |
| Shares reinvested | | | 909,487 | | | | 2,703,999 | |
| Shares redeemed | | | (1,094,909 | ) | | | (3,226,344 | ) |
| Net increase in shares outstanding | | | 1,377,768 | | | | 1,852,563 | |
| Shares outstanding at beginning of period | | | 33,352,220 | | | | 31,499,657 | |
| Shares outstanding at end of period | | | 34,729,988 | | | | 33,352,220 | |
See accompanying notes to financial statements.
| DAVENPORT SMALL CAP FOCUS FUND |
| STATEMENTS OF CHANGES IN NET ASSETS |
| | | Six Months | | | | |
| | | Ended | | | Year | |
| | | September 30, | | | Ended | |
| | | 2023 | | | March 31, | |
| | | (Unaudited) | | | 2023 | |
| FROM OPERATIONS | | | | | | | | |
| Net investment income | | $ | 2,456,718 | | | $ | 5,427,839 | |
| Net realized gains from investments transactions | | | 7,028,233 | | | | 17,628,605 | |
| Net change in unrealized appreciation (depreciation) on investments | | | 6,916,994 | | | | (42,892,149 | ) |
| Net increase (decrease) in net assets from operations | | | 16,401,945 | | | | (19,835,705 | ) |
| | | | | | | | | |
| DISTRIBUTIONS TO SHAREHOLDERS (Note 2) | | | (17,873,527 | ) | | | (36,020,543 | ) |
| | | | | | | | | |
| FROM CAPITAL SHARE TRANSACTIONS | | | | | | | | |
| Proceeds from shares sold | | | 69,912,254 | | | | 92,278,471 | |
| Net asset value of shares issued in reinvestment of distributions to shareholders | | | 16,954,913 | | | | 34,375,030 | |
| Payments for shares redeemed | | | (24,857,118 | ) | | | (70,204,863 | ) |
| Net increase in net assets from capital share transactions | | | 62,010,049 | | | | 56,448,638 | |
| | | | | | | | | |
| TOTAL INCREASE IN NET ASSETS | | | 60,538,467 | | | | 592,390 | |
| | | | | | | | | |
| NET ASSETS | | | | | | | | |
| Beginning of period | | | 588,159,964 | | | | 587,567,574 | |
| End of period | | $ | 648,698,431 | | | $ | 588,159,964 | |
| | | | | | | | | |
| CAPITAL SHARE ACTIVITY | | | | | | | | |
| Shares sold | | | 4,293,012 | | | | 5,901,765 | |
| Shares reinvested | | | 1,049,419 | | | | 2,356,513 | |
| Shares redeemed | | | (1,526,587 | ) | | | (4,487,809 | ) |
| Net increase in shares outstanding | | | 3,815,844 | | | | 3,770,469 | |
| Shares outstanding at beginning of period | | | 36,682,825 | | | | 32,912,356 | |
| Shares outstanding at end of period | | | 40,498,669 | | | | 36,682,825 | |
See accompanying notes to financial statements.
| DAVENPORT BALANCED INCOME FUND |
| STATEMENTS OF CHANGES IN NET ASSETS |
| | | Six Months | | | | |
| | | Ended | | | Year | |
| | | September 30, | | | Ended | |
| | | 2023 | | | March 31, | |
| | | (Unaudited) | | | 2023 | |
| FROM OPERATIONS | | | | | | | | |
| Net investment income | | $ | 2,634,669 | | | $ | 4,186,924 | |
| Net realized losses from: | | | | | | | | |
| Investments | | | (5,125,045 | ) | | | (4,782,134 | ) |
| Foreign currency transactions | | | (210 | ) | | | (1,075 | ) |
| Net change in unrealized appreciation (depreciation) on investments | | | 952,844 | | | | (19,079,430 | ) |
| Net decrease in net assets from operations | | | (1,537,742 | ) | | | (19,675,715 | ) |
| | | | | | | | | |
| DISTRIBUTIONS TO SHAREHOLDERS (Note 2) | | | (2,362,616 | ) | | | (9,515,808 | ) |
| | | | | | | | | |
| FROM CAPITAL SHARE TRANSACTIONS | | | | | | | | |
| Proceeds from shares sold | | | 9,741,398 | | | | 30,313,838 | |
| Net asset value of shares issued in reinvestment of distributions to shareholders | | | 2,147,570 | | | | 8,893,677 | |
| Payments for shares redeemed | | | (11,832,153 | ) | | | (27,627,245 | ) |
| Net increase in net assets from capital share transactions | | | 56,815 | | | | 11,580,270 | |
| | | | | | | | | |
| TOTAL DECREASE IN NET ASSETS | | | (3,843,543 | ) | | | (17,611,253 | ) |
| | | | | | | | | |
| NET ASSETS | | | | | | | | |
| Beginning of period | | | 218,647,531 | | | | 236,258,784 | |
| End of period | | $ | 214,803,988 | | | $ | 218,647,531 | |
| | | | | | | | | |
| CAPITAL SHARE ACTIVITY | | | | | | | | |
| Shares sold | | | 807,594 | | | | 2,463,615 | |
| Shares reinvested | | | 177,900 | | | | 739,617 | |
| Shares redeemed | | | (981,818 | ) | | | (2,281,226 | ) |
| Net increase in shares outstanding | | | 3,676 | | | | 922,006 | |
| Shares outstanding at beginning of period | | | 18,275,264 | | | | 17,353,258 | |
| Shares outstanding at end of period | | | 18,278,940 | | | | 18,275,264 | |
See accompanying notes to financial statements.
| DAVENPORT CORE LEADERS FUND |
| FINANCIAL HIGHLIGHTS |
| |
| Selected Per Share Data and Ratios for a Share Outstanding Throughout Each Period: |
| | | Six Months | | | | | | | | | | | | | | | | |
| | | Ended | | | | | | | | | | | | | | | | |
| | | Sept. 30, | | | Year Ended | | | Year Ended | | | Year Ended | | | Year Ended | | | Year Ended | |
| | | 2023 | | | March 31, | | | March 31, | | | March 31, | | | March 31, | | | March 31, | |
| | | (Unaudited) | | | 2023 | | | 2022 | | | 2021 | | | 2020 | | | 2019 | |
| Net asset value at beginning of period | | $ | 27.12 | | | $ | 32.09 | | | $ | 31.48 | | | $ | 21.48 | | | $ | 23.75 | | | $ | 22.96 | |
| | | | | | | | | | | | | | | | | | | | | | | | | |
| Income (loss) from investment operations: | | | | | | | | | | | | | | | | | | | | | | | | |
| Net investment income | | | 0.04 | | | | 0.18 | | | | 0.01 | | | | 0.05 | | | | 0.14 | | | | 0.11 | |
| Net realized and unrealized gains (losses) on investments | | | 2.42 | | | | (3.88 | ) | | | 3.38 | | | | 10.27 | | | | (1.80 | ) | | | 1.74 | |
| Total from investment operations | | | 2.46 | | | | (3.70 | ) | | | 3.39 | | | | 10.32 | | | | (1.66 | ) | | | 1.85 | |
| | | | | | | | | | | | | | | | | | | | | | | | | |
| Less distributions from: | | | | | | | | | | | | | | | | | | | | | | | | |
| Net investment income | | | (0.04 | ) | | | (0.18 | ) | | | (0.00 | )(a) | | | (0.07 | ) | | | (0.14 | ) | | | (0.11 | ) |
| Net realized gains | | | (0.86 | ) | | | (1.09 | ) | | | (2.78 | ) | | | (0.25 | ) | | | (0.47 | ) | | | (0.95 | ) |
| Total distributions | | | (0.90 | ) | | | (1.27 | ) | | | (2.78 | ) | | | (0.32 | ) | | | (0.61 | ) | | | (1.06 | ) |
| | | | | | | | | | | | | | | | | | | | | | | | | |
| Net asset value at end of period | | $ | 28.68 | | | $ | 27.12 | | | $ | 32.09 | | | $ | 31.48 | | | $ | 21.48 | | | $ | 23.75 | |
| | | | | | | | | | | | | | | | | | | | | | | | | |
| Total return (b) | | | 9.07 | % (c) | | | (11.37 | %) | | | 10.89 | % | | | 48.20 | % | | | (7.36 | %) | | | 8.21 | % |
| | | | | | | | | | | | | | | | | | | | | | | | | |
| Net assets at end of period (000’s) | | $ | 777,039 | | | $ | 716,818 | | | $ | 845,650 | | | $ | 756,050 | | | $ | 486,569 | | | $ | 516,228 | |
| | | | | | | | | | | | | | | | | | | | | | | | | |
| Ratio of total expenses to average net assets | | | 0.87 | % (d) | | | 0.87 | % | | | 0.86 | % | | | 0.87 | % | | | 0.89 | % | | | 0.89 | % |
| | | | | | | | | | | | | | | | | | | | | | | | | |
| Ratio of net investment income to average net assets | | | 0.29 | % (d) | | | 0.66 | % | | | 0.04 | % | | | 0.17 | % | | | 0.55 | % | | | 0.48 | % |
| | | | | | | | | | | | | | | | | | | | | | | | | |
| Portfolio turnover rate | | | 15 | % (c) | | | 19 | % | | | 20 | % | | | 30 | % | | | 12 | % | | | 21 | % |
| (a) | Amount rounds to less than $0.01 per share. |
| (b) | Total return is a measure of the change in value of an investment in the Fund over the periods covered, which assumes any dividends or capital gains distributions are reinvested in shares of the Fund. Returns shown do not reflect the deduction of taxes a shareholder would pay on Fund distributions or the redemption of Fund shares. |
See accompanying notes to financial statements.
| DAVENPORT VALUE & INCOME FUND |
| FINANCIAL HIGHLIGHTS |
| |
| Selected Per Share Data and Ratios for a Share Outstanding Throughout Each Period: |
| | | Six Months | | | | | | | | | | | | | | | | |
| | | Ended | | | | | | | | | | | | | | | | |
| | | Sept. 30, | | | Year Ended | | | Year Ended | | | Year Ended | | | Year Ended | | | Year Ended | |
| | | 2023 | | | March 31, | | | March 31, | | | March 31, | | | March 31, | | | March 31, | |
| | | (Unaudited) | | | 2023 | | | 2022 | | | 2021 | | | 2020 | | | 2019 | |
| Net asset value at beginning of period | | $ | 16.92 | | | $ | 20.29 | | | $ | 18.58 | | | $ | 13.04 | | | $ | 16.38 | | | $ | 16.85 | |
| | | | | | | | | | | | | | | | | | | | | | | | | |
| Income (loss) from investment operations: | | | | | | | | | | | | | | | | | | | | | | | | |
| Net investment income | | | 0.15 | | | | 0.35 | | | | 0.29 | | | | 0.28 | | | | 0.35 | | | | 0.36 | |
| Net realized and unrealized gains (losses) on investments and foreign currencies | | | (0.24 | ) | | | (2.75 | ) | | | 2.32 | | | | 5.98 | | | | (3.00 | ) | | | 0.12 | |
| Total from investment operations | | | (0.09 | ) | | | (2.40 | ) | | | 2.61 | | | | 6.26 | | | | (2.65 | ) | | | 0.48 | |
| | | | | | | | | | | | | | | | | | | | | | | | | |
| Less distributions from: | | | | | | | | | | | | | | | | | | | | | | | | |
| Net investment income | | | (0.14 | ) | | | (0.35 | ) | | | (0.30 | ) | | | (0.27 | ) | | | (0.36 | ) | | | (0.36 | ) |
| Net realized gains | | | — | | | | (0.62 | ) | | | (0.60 | ) | | | (0.45 | ) | | | (0.33 | ) | | | (0.59 | ) |
| Total distributions | | | (0.14 | ) | | | (0.97 | ) | | | (0.90 | ) | | | (0.72 | ) | | | (0.69 | ) | | | (0.95 | ) |
| | | | | | | | | | | | | | | | | | | | | | | | | |
| Net asset value at end of period | | $ | 16.69 | | | $ | 16.92 | | | $ | 20.29 | | | $ | 18.58 | | | $ | 13.04 | | | $ | 16.38 | |
| | | | | | | | | | | | | | | | | | | | | | | | | |
| Total return (a) | | | (0.59 | %) (b) | | | (11.81 | %) | | | 14.24 | % | | | 49.55 | % | | | (16.97 | %) | | | 2.96 | % |
| | | | | | | | | | | | | | | | | | | | | | | | | |
| Net assets at end of period (000’s) | | $ | 779,799 | | | $ | 803,930 | | | $ | 920,055 | | | $ | 789,652 | | | $ | 549,112 | | | $ | 672,954 | |
| | | | | | | | | | | | | | | | | | | | | | | | | |
| Ratio of total expenses to average net assets | | | 0.87 | % (c) | | | 0.87 | % | | | 0.86 | % | | | 0.87 | % | | | 0.88 | % | | | 0.88 | % |
| | | | | | | | | | | | | | | | | | | | | | | | | |
| Ratio of net investment income to average net assets | | | 1.71 | % (c) | | | 2.00 | % | | | 1.46 | % | | | 1.78 | % | | | 2.07 | % | | | 2.21 | % |
| | | | | | | | | | | | | | | | | | | | | | | | | |
| Portfolio turnover rate | | | 17 | % (b) | | | 21 | % | | | 20 | % | | | 34 | % | | | 28 | % | | | 18 | % |
| (a) | Total return is a measure of the change in value of an investment in the Fund over the periods covered, which assumes any dividends or capital gains distributions are reinvested in shares of the Fund. Returns shown do not reflect the deduction of taxes a shareholder would pay on Fund distributions or the redemption of Fund shares. |
See accompanying notes to financial statements.
| DAVENPORT EQUITY OPPORTUNITIES FUND |
| FINANCIAL HIGHLIGHTS |
| |
| Selected Per Share Data and Ratios for a Share Outstanding Throughout Each Period: |
| | | Six Months | | | | | | | | | | | | | | | | |
| | | Ended | | | | | | | | | | | | | | | | |
| | | Sept. 30, | | | Year Ended | | | Year Ended | | | Year Ended | | | Year Ended | | | Year Ended | |
| | | 2023 | | | March 31, | | | March 31, | | | March 31, | | | March 31, | | | March 31, | |
| | | (Unaudited) | | | 2023 | | | 2022 | | | 2021 | | | 2020 | | | 2019 | |
| Net asset value at beginning of period | | $ | 19.60 | | | $ | 23.54 | | | $ | 24.54 | | | $ | 16.56 | | | $ | 18.98 | | | $ | 17.75 | |
| | | | | | | | | | | | | | | | | | | | | | | | | |
| Income (loss) from investment operations: | | | | | | | | | | | | | | | | | | | | | | | | |
| Net investment income (loss) | | | 0.02 | | | | 0.08 | | | | (0.05 | ) | | | (0.03 | ) | | | (0.00 | )(a) | | | (0.02 | ) |
| Net realized and unrealized gains (losses) on investments | | | 0.99 | | | | (2.39 | ) | | | 1.80 | | | | 10.42 | | | | (1.59 | ) | | | 1.91 | |
| Total from investment operations | | | 1.01 | | | | (2.31 | ) | | | 1.75 | | | | 10.39 | | | | (1.59 | ) | | | 1.89 | |
| | | | | | | | | | | | | | | | | | | | | | | | | |
| Less distributions from: | | | | | | | | | | | | | | | | | | | | | | | | |
| Net investment income | | | (0.02 | ) | | | (0.06 | ) | | | — | | | | — | | | | — | | | | — | |
| Net realized gains | | | (0.56 | ) | | | (1.57 | ) | | | (2.75 | ) | | | (2.41 | ) | | | (0.83 | ) | | | (0.66 | ) |
| Total distributions | | | (0.58 | ) | | | (1.63 | ) | | | (2.75 | ) | | | (2.41 | ) | | | (0.83 | ) | | | (0.66 | ) |
| | | | | | | | | | | | | | | | | | | | | | | | | |
| Net asset value at end of period | | $ | 20.03 | | | $ | 19.60 | | | $ | 23.54 | | | $ | 24.54 | | | $ | 16.56 | | | $ | 18.98 | |
| | | | | | | | | | | | | | | | | | | | | | | | | |
| Total return (b) | | | 5.13 | % (c) | | | (9.25 | %) | | | 6.89 | % | | | 66.20 | % | | | (9.13 | %) | | | 11.02 | % |
| | | | | | | | | | | | | | | | | | | | | | | | | |
| Net assets at end of period (000’s) | | $ | 695,670 | | | $ | 653,865 | | | $ | 741,496 | | | $ | 659,114 | | | $ | 385,163 | | | $ | 409,002 | |
| | | | | | | | | | | | | | | | | | | | | | | | | |
| Ratio of total expenses to average net assets | | | 0.88 | % (d) | | | 0.88 | % | | | 0.87 | % | | | 0.88 | % | | | 0.90 | % | | | 0.91 | % |
| | | | | | | | | | | | | | | | | | | | | | | | | |
| Ratio of net investment income (loss) to average net assets | | | 0.21 | % (d) | | | 0.40 | % | | | (0.20 | %) | | | (0.13 | %) | | | (0.02 | %) | | | (0.13 | %) |
| | | | | | | | | | | | | | | | | | | | | | | | | |
| Portfolio turnover rate | | | 8 | % (c) | | | 26 | % | | | 22 | % | | | 31 | % | | | 21 | % | | | 19 | % |
| (a) | Amount rounds to less than $0.01 per share. |
| (b) | Total return is a measure of the change in value of an investment in the Fund over the periods covered, which assumes any dividends or capital gains distributions are reinvested in shares of the Fund. Returns shown do not reflect the deduction of taxes a shareholder would pay on Fund distributions or the redemption of Fund shares. |
See accompanying notes to financial statements.
| DAVENPORT SMALL CAP FOCUS FUND |
| FINANCIAL HIGHLIGHTS |
| |
| Selected Per Share Data and Ratios for a Share Outstanding Throughout Each Period: |
| | | Six Months | | | | | | | | | | | | | | | | |
| | | Ended | | | | | | | | | | | | | | | | |
| | | Sept. 30, | | | Year Ended | | | Year Ended | | | Year Ended | | | Year Ended | | | Year Ended | |
| | | 2023 | | | March 31, | | | March 31, | | | March 31, | | | March 31, | | | March 31, | |
| | | (Unaudited) | | | 2023 | | | 2022 | | | 2021 | | | 2020 | | | 2019 | |
| Net asset value at beginning of period | | $ | 16.03 | | | $ | 17.85 | | | $ | 19.37 | | | $ | 11.14 | | | $ | 13.25 | | | $ | 13.01 | |
| | | | | | | | | | | | | | | | | | | | | | | | | |
| Income (loss) from investment operations: | | | | | | | | | | | | | | | | | | | | | | | | |
| Net investment income (a) | | | 0.06 | | | | 0.15 | | | | 0.11 | | | | 0.04 | | | | 0.05 | | | | 0.06 | |
| Net realized and unrealized gains (losses) on investments | | | 0.40 | | | | (0.90 | ) | | | 1.20 | | | | 9.28 | | | | (1.84 | ) | | | 0.44 | |
| Total from investment operations | | | 0.46 | | | | (0.75 | ) | | | 1.31 | | | | 9.32 | | | | (1.79 | ) | | | 0.50 | |
| | | | | | | | | | | | | | | | | | | | | | | | | |
| Less distributions from: | | | | | | | | | | | | | | | | | | | | | | | | |
| Net investment income | | | (0.06 | ) | | | (0.13 | ) | | | (0.13 | ) | | | (0.20 | ) | | | (0.10 | ) | | | — | |
| Net realized gains | | | (0.41 | ) | | | (0.94 | ) | | | (2.70 | ) | | | (0.89 | ) | | | (0.22 | ) | | | (0.26 | ) |
| Total distributions | | | (0.47 | ) | | | (1.07 | ) | | | (2.83 | ) | | | (1.09 | ) | | | (0.32 | ) | | | (0.26 | ) |
| | | | | | | | | | | | | | | | | | | | | | | | | |
| Net asset value at end of period | | $ | 16.02 | | | $ | 16.03 | | | $ | 17.85 | | | $ | 19.37 | | | $ | 11.14 | | | $ | 13.25 | |
| | | | | | | | | | | | | | | | | | | | | | | | | |
| Total return (b) | | | 2.85 | % (c) | | | (3.56 | %) | | | 6.85 | % | | | 84.84 | % | | | (14.08 | %) | | | 3.90 | % |
| | | | | | | | | | | | | | | | | | | | | | | | | |
| Net assets at end of period (000’s) | | $ | 648,698 | | | $ | 588,160 | | | $ | 587,568 | | | $ | 491,256 | | | $ | 180,077 | | | $ | 152,063 | |
| | | | | | | | | | | | | | | | | | | | | | | | | |
| Ratio of total expenses to average net assets (d) | | | 0.88 | % (e) | | | 0.89 | % | | | 0.88 | % | | | 0.91 | % | | | 0.95 | % | | | 0.97 | % |
| | | | | | | | | | | | | | | | | | | | | | | | | |
| Ratio of net investment income to average net assets (d) | | | 0.78 | % (e) | | | 0.99 | % | | | 0.49 | % | | | 0.12 | % | | | 0.40 | % | | | 0.51 | % |
| | | | | | | | | | | | | | | | | | | | | | | | | |
| Portfolio turnover rate | | | 12 | % (c) | | | 36 | % | | | 44 | % | | | 54 | % | | | 66 | % | | | 60 | % |
| (a) | Recognition of net investment income by the Fund is affected by the timing of declarations of dividends by the underlying investment companies in which the Fund invests. |
| (b) | Total return is a measure of the change in value of an investment in the Fund over the periods covered, which assumes any dividends or capital gains distributions are reinvested in shares of the Fund. Returns shown do not reflect the deduction of taxes a shareholder would pay on Fund distributions or the redemption of Fund shares. |
| (d) | The ratios of expenses and net investment income to average net assets do not reflect the Fund’s proportionate share of expenses of the underlying investment companies in which the Fund invests. |
See accompanying notes to financial statements.
| DAVENPORT BALANCED INCOME FUND |
| FINANCIAL HIGHLIGHTS |
| |
| Selected Per Share Data and Ratios for a Share Outstanding Throughout Each Period: |
| | | Six Months | | | | | | | | | | | | | | | | |
| | | Ended | | | | | | | | | | | | | | | | |
| | | Sept. 30, | | | Year Ended | | | Year Ended | | | Year Ended | | | Year Ended | | | Year Ended | |
| | | 2023 | | | March 31, | | | March 31, | | | March 31, | | | March 31, | | | March 31, | |
| | | (Unaudited) | | | 2023 | | | 2022 | | | 2021 | | | 2020 | | | 2019 | |
| Net asset value at beginning of period | | $ | 11.96 | | | $ | 13.61 | | | $ | 12.85 | | | $ | 9.84 | | | $ | 11.34 | | | $ | 11.28 | |
| | | | | | | | | | | | | | | | | | | | | | | | | |
| Income (loss) from investment operations: | | | | | | | | | | | | | | | | | | | | | | | | |
| Net investment income (a) | | | 0.14 | | | | 0.23 | | | | 0.19 | | | | 0.20 | | | | 0.25 | | | | 0.25 | |
| Net realized and unrealized gains (losses) on investments and foreign currencies | | | (0.22 | ) | | | (1.35 | ) | | | 0.77 | | | | 3.04 | | | | (1.41 | ) | | | 0.12 | |
| Total from investment operations | | | (0.08 | ) | | | (1.12 | ) | | | 0.96 | | | | 3.24 | | | | (1.16 | ) | | | 0.37 | |
| | | | | | | | | | | | | | | | | | | | | | | | | |
| Less distributions from: | | | | | | | | | | | | | | | | | | | | | | | | |
| Net investment income | | | (0.13 | ) | | | (0.22 | ) | | | (0.18 | ) | | | (0.23 | ) | | | (0.23 | ) | | | (0.24 | ) |
| Net realized gains | | | — | | | | (0.31 | ) | | | (0.02 | ) | | | — | | | | (0.08 | ) | | | (0.07 | ) |
| Return of capital | | | — | | | | — | | | | — | | | | — | | | | (0.03 | ) | | | — | |
| Total distributions | | | (0.13 | ) | | | (0.53 | ) | | | (0.20 | ) | | | (0.23 | ) | | | (0.34 | ) | | | (0.31 | ) |
| | | | | | | | | | | | | | | | | | | | | | | | | |
| Net asset value at end of period | | $ | 11.75 | | | $ | 11.96 | | | $ | 13.61 | | | $ | 12.85 | | | $ | 9.84 | | | $ | 11.34 | |
| | | | | | | | | | | | | | | | | | | | | | | | | |
| Total return (b) | | | (0.70 | %) (c) | | | (8.18 | %) | | | 7.50 | % | | | 33.14 | % | | | (10.59 | %) | | | 3.35 | % |
| | | | | | | | | | | | | | | | | | | | | | | | | |
| Net assets at end of period (000’s) | | $ | 214,804 | | | $ | 218,648 | | | $ | 236,259 | | | $ | 193,186 | | | $ | 143,897 | | | $ | 142,199 | |
| | | | | | | | | | | | | | | | | | | | | | | | | |
| Ratio of total expenses to average net assets (d) | | | 0.93 | % (e) | | | 0.93 | % | | | 0.92 | % | | | 0.93 | % | | | 0.95 | % | | | 0.96 | % |
| | | | | | | | | | | | | | | | | | | | | | | | | |
| Ratio of net investment income to average net assets (d) | | | 2.38 | % (e) | | | 1.88 | % | | | 1.42 | % | | | 1.73 | % | | | 2.18 | % | | | 2.28 | % |
| | | | | | | | | | | | | | | | | | | | | | | | | |
| Portfolio turnover rate | | | 28 | % (c) | | | 24 | % | | | 23 | % | | | 29 | % | | | 29 | % | | | 30 | % |
| (a) | Recognition of net investment income by the Fund is affected by the timing of declarations of dividends by the underlying investment companies in which the Fund invests, if any. |
| (b) | Total return is a measure of the change in value of an investment in the Fund over the periods covered, which assumes any dividends or capital gains distributions are reinvested in shares of the Fund. Returns shown do not reflect the deduction of taxes a shareholder would pay on Fund distributions or the redemption of Fund shares. |
| (d) | The ratios of expenses and net investment income to average net assets do not reflect the Fund’s proportionate share of expenses of the underlying investment companies in which the Fund invests, if any. |
See accompanying notes to financial statements.
| THE DAVENPORT FUNDS |
| NOTES TO FINANCIAL STATEMENTS |
| September 30, 2023 (Unaudited) |
1. Organization
Davenport Core Leaders Fund (formerly Davenport Core Fund), Davenport Value & Income Fund, Davenport Equity Opportunities Fund, Davenport Small Cap Focus Fund and Davenport Balanced Income Fund (individually, a “Fund,” and, collectively, the “Funds”) are each a no-load series of the Williamsburg Investment Trust (the “Trust”), an open-end management investment company registered under the Investment Company Act of 1940, as amended (the “1940 Act”). The Trust was organized as a Massachusetts business trust on July 18, 1988. Other series of the Trust are not incorporated in this report.
Davenport Core Leaders Fund’s investment objective is long-term growth of capital.
Davenport Value & Income Fund’s investment objective is to achieve long-term growth while generating current income through dividend payments on portfolio securities.
Davenport Equity Opportunities Fund’s investment objective is long-term capital appreciation.
Davenport Small Cap Focus Fund’s investment objective is long-term capital appreciation.
Davenport Balanced Income Fund’s investment objective is current income and an opportunity for long-term growth.
Davenport Core Leaders Fund, Davenport Value & Income Fund, Davenport Small Cap Focus Fund and Davenport Balanced Income Fund are each classified as a diversified fund. Davenport Equity Opportunities Fund is classified as a non-diversified fund.
2. Significant Accounting Policies
Each Fund follows accounting and reporting guidance under Financial Accounting Standards Board (“FASB”) Accounting Standards Codification Topic 946, “Financial Services – Investment Companies.” The following is a summary of the Funds’ significant accounting policies. The policies are in conformity with accounting principles generally accepted in the United States of America (“GAAP”).
Regulatory update — Tailored Shareholder Reports for Mutual Funds and Exchange-Traded Funds (“ETFs”) – Effective January 24, 2023, the Securities and Exchange Commission (the “SEC”) adopted rule and form amendments to require mutual funds and ETFs to transmit concise and visually engaging streamlined annual and semiannual reports to shareholders that highlight key information. Other information, including financial statements, will no longer appear in a streamlined shareholder report but must be available online, delivered free of charge upon request, and filed on a semiannual basis on Form N-CSR. The rule and form amendments have a compliance date of July 24, 2024. At this time, management is evaluating the impact of these amendments on the shareholder reports for the Funds.
Securities valuation — The Funds’ portfolio securities are valued as of the close of business of the regular session of the New York Stock Exchange (the “NYSE”) (normally 4:00 p.m. Eastern time). Securities traded on a national stock exchange, including common stocks and ETFs if any,
| THE DAVENPORT FUNDS |
| NOTES TO FINANCIAL STATEMENTS (Continued) |
are valued based upon the closing price on the principal exchange where the security is traded, if available, otherwise, at the last quoted bid price. Securities that are quoted by NASDAQ are valued at the NASDAQ Official Closing Price. Investments representing shares of money market funds and other open-end investment companies, other than ETFs, are valued at their net asset value (“NAV”) as reported by such companies. When using a quoted price and when the market is considered active, securities will be classified as Level 1 within the fair value hierarchy (see below).
Fixed income securities, including corporate bonds and U.S. Treasury obligations, are typically valued on the basis of prices provided by an independent pricing service. The prices provided by the pricing service are determined with consideration given to institutional bid and last sale prices and take into account securities prices, yields, maturities, call features, ratings, institutional trading in similar groups of securities, and developments related to specific securities. Given the inputs used by the pricing service, these securities are classified as Level 2 within the fair value hierarchy.
When market quotations are not readily available, if a pricing service cannot provide a price, or if the investment adviser believes the price received from the pricing service is not indicative of fair value, securities will be valued in good faith at fair value as determined by Davenport & Company LLC (the “Adviser”) as the Funds’ valuation designee, in accordance with procedures adopted by the Board of Trustees (the “Board”) pursuant to Rule 2a-5 under the 1940 Act. Under these procedures, the securities will be classified as Level 2 or 3 within the fair value hierarchy, depending on the inputs used. Such methods of fair valuation may include, but are not limited to: multiple of earnings, multiple of book value, discount from market of a similar freely traded security, purchase price of the security, subsequent private transactions in the security or related securities, or a combination of these and other factors.
GAAP establishes a single authoritative definition of fair value, sets out a framework for measuring fair value and requires additional disclosures about fair value measurements.
Various inputs are used in determining the value of the Funds’ investments. These inputs are summarized in the three broad levels listed below:
| ● | Level 1 – quoted prices in active markets for identical securities |
| ● | Level 2 – other significant observable inputs |
| ● | Level 3 – significant unobservable inputs |
The inputs or methodology used for valuing securities are not necessarily an indication of the risks associated with investing in those securities. The inputs used to measure fair value may fall into different levels of the fair value hierarchy. In such cases, for disclosure purposes, the level in the fair value hierarchy within which the fair value measurement falls in its entirety is determined based on the lowest level input that is significant to the fair value measurement.
| THE DAVENPORT FUNDS |
| NOTES TO FINANCIAL STATEMENTS (Continued) |
The following is a summary of the Funds’ investments based on the inputs used to value the investments as of September 30, 2023, by security type:
| Davenport Core Leaders Fund | | Level 1 | | | Level 2 | | | Level 3 | | | Total | |
| Common Stocks | | $ | 757,038,172 | | | $ | — | | | $ | — | | | $ | 757,038,172 | |
| Money Market Funds | | | 24,084,381 | | | | — | | | | — | | | | 24,084,381 | |
| Total | | $ | 781,122,553 | | | $ | — | | | $ | — | | | $ | 781,122,553 | |
| | | | | | | | | | | | | | | | | |
| | | | | | | | | | | | | | | | | |
| Davenport Value & Income Fund | | Level 1 | | | Level 2 | | | Level 3 | | | Total | |
| Common Stocks | | $ | 766,383,211 | | | $ | — | | | $ | — | | | $ | 766,383,211 | |
| Money Market Funds | | | 12,853,327 | | | | — | | | | — | | | | 12,853,327 | |
| Total | | $ | 779,236,538 | | | $ | — | | | $ | — | | | $ | 779,236,538 | |
| | | | | | | | | | | | | | | | | |
| | | | | | | | | | | | | | | | | |
| Davenport Equity Opportunities Fund | | Level 1 | | | Level 2 | | | Level 3 | | | Total | |
| Common Stocks | | $ | 669,352,686 | | | $ | — | | | $ | — | | | $ | 669,352,686 | |
| Money Market Funds | | | 26,358,340 | | | | — | | | | — | | | | 26,358,340 | |
| Total | | $ | 695,711,026 | | | $ | — | | | $ | — | | | $ | 695,711,026 | |
| | | | | | | | | | | | | | | | | |
| | | | | | | | | | | | | | | | | |
| Davenport Small Cap Focus Fund | | Level 1 | | | Level 2 | | | Level 3 | | | Total | |
| Common Stocks | | $ | 581,134,047 | | | $ | — | | | $ | — | | | $ | 581,134,047 | |
| Exchange-Traded Funds | | | 18,238,070 | | | | — | | | | — | | | | 18,238,070 | |
| Money Market Funds | | | 49,918,523 | | | | — | | | | — | | | | 49,918,523 | |
| Total | | $ | 649,290,640 | | | $ | — | | | $ | — | | | $ | 649,290,640 | |
| | | | | | | | | | | | | | | | | |
| | | | | | | | | | | | | | | | | |
| Davenport Balanced Income Fund | | Level 1 | | | Level 2 | | | Level 3 | | | Total | |
| Common Stocks | | $ | 127,452,272 | | | $ | — | | | $ | — | | | $ | 127,452,272 | |
| Fixed Rate Corporate Bonds | | | — | | | | 63,674,243 | | | | — | | | | 63,674,243 | |
| Municipal Bonds | | | — | | | | 2,361,591 | | | | — | | | | 2,361,591 | |
| U.S. Treasury Obligations | | | — | | | | 16,337,603 | | | | — | | | | 16,337,603 | |
| Money Market Funds | | | 2,860,993 | | | | — | | | | — | | | | 2,860,993 | |
| Total | | $ | 130,313,265 | | | $ | 82,373,437 | | | $ | — | | | $ | 212,686,702 | |
| | | | | | | | | | | | | | | | | |
| | | | | | | | | | | | | | | | | |
Refer to each Fund’s Schedule of Investments for a listing of the securities by sector type. There were no Level 3 securities or derivative instruments held by the Funds as of or during the six months ended September 30, 2023.
| THE DAVENPORT FUNDS |
| NOTES TO FINANCIAL STATEMENTS (Continued) |
Foreign currency translation — Investment securities and other assets and liabilities denominated in or expected to settle in foreign currencies, if any, are translated into U.S. dollars based on exchange rates on the following basis:
| A. | The fair values of investment securities and other assets and liabilities are translated as of the close of the NYSE each day. |
| B. | Purchases and sales of investment securities and income and expenses are translated at the rate of exchange prevailing as of 4:00 p.m. Eastern time on the respective date of such transactions. |
| C. | The Funds do not isolate that portion of the results of operations caused by changes in foreign exchange rates on investments from those caused by changes in market prices of securities held. Such fluctuations are included with the net realized and unrealized gains or losses on investments. |
Reported net realized foreign exchange gains or losses arise from 1) purchases and sales of foreign currencies and 2) the difference between the amounts of dividends and foreign withholding taxes recorded on the Fund’s books and the U.S. dollar equivalent of the amounts actually received or paid. Reported net unrealized foreign exchange gains and losses arise from changes in the value of assets and liabilities that result from changes in exchange rates.
Cash — Each Fund’s cash position, if any, is held in a bank account with balances which, at times, may exceed United States federally insured limits set by the amount covered by federal deposit insurance. The Funds maintain these balances with a high quality financial institution and may incur charges on cash overdrafts.
Share valuation — The NAV per share of each Fund is calculated daily by dividing the total value of its assets, less liabilities, by the number of shares outstanding. The offering price and redemption price per share of each Fund is equal to the NAV per share.
Investment income — Interest income is accrued as earned. Discounts and premiums on fixed-income securities are amortized using the effective interest method. Dividend income is recorded on the ex-dividend date. Non-cash dividends included in dividend income, if any, are recorded at the fair market value of the security received. The Funds record distributions received from investments in real estate investment trusts (also known as “REITs”) in excess of income from underlying investments as a reduction of cost of investments and/or realized gain. These amounts are recorded once the issuers provide information about the actual classification of the distributions. Withholding taxes on foreign dividends have been recorded in accordance with the Funds’ understanding of the applicable country’s rules and tax rates.
Investment transactions — Investment transactions are accounted for on trade date for financial reporting purposes. Realized gains and losses on investment securities sold are determined on a specific identification basis.
Common expenses — Common expenses of the Trust are allocated among the Funds and the other series of the Trust based on relative net assets of each series or the nature of the services performed and the relative applicability to each series.
| THE DAVENPORT FUNDS |
| NOTES TO FINANCIAL STATEMENTS (Continued) |
Distributions to shareholders — Dividends arising from net investment income, if any, are declared and paid quarterly to shareholders of Davenport Core Leaders Fund, Davenport Value
& Income Fund, Davenport Small Cap Focus Fund and Davenport Balanced Income Fund; and declared and paid semi-annually to shareholders of Davenport Equity Opportunities Fund. Net realized short-term capital gains, if any, may be distributed throughout the year and net realized long-term capital gains, if any, are distributed at least once each year. The amount of distributions from net investment income and net realized capital gains are determined in accordance with federal income tax regulations, which may differ from GAAP. Dividends and distributions are recorded on the ex-dividend date.
The tax character of distributions paid during the periods ended September 30, 2023 and March 31, 2023 was as follows:
| | | Periods | | Ordinary | | | Long-Term | | | Total | |
| | | Ended | | Income | | | Capital Gains | | | Distributions* | |
| Davenport Core Leaders Fund | | 09/30/23 | | $ | 1,102,926 | | | $ | 22,453,878 | | | $ | 23,556,804 | |
| | | 03/31/23 | | $ | 8,616,867 | | | $ | 24,804,754 | | | $ | 33,421,621 | |
| Davenport Value & Income Fund | | 09/30/23 | | $ | 6,323,597 | | | $ | — | | | $ | 6,323,597 | |
| | | 03/31/23 | | $ | 16,633,912 | | | $ | 28,180,629 | | | $ | 44,814,541 | |
| Davenport Equity Opportunities Fund | | 09/30/23 | | $ | 728,929 | | | $ | 18,835,118 | | | $ | 19,564,047 | |
| | | 03/31/23 | | $ | 6,817,160 | | | $ | 44,997,499 | | | $ | 51,814,659 | |
| Davenport Small Cap Focus Fund | | 09/30/23 | | $ | 2,179,260 | | | $ | 15,694,267 | | | $ | 17,873,527 | |
| | | 03/31/23 | | $ | 4,649,484 | | | $ | 31,371,059 | | | $ | 36,020,543 | |
| Davenport Balanced Income Fund | | 09/30/23 | | $ | 2,362,616 | | | $ | — | | | $ | 2,362,616 | |
| | | 03/31/23 | | $ | 5,034,146 | | | $ | 4,481,662 | | | $ | 9,515,808 | |
| | | | | | | | | | | | | | | |
| * | Total Distributions may not tie to the amounts listed on the Statements of Changes in Net Assets due to reclassifications of the character of the distributions as a result of permanent differences between financial statements and income tax reporting. |
Estimates — The preparation of financial statements in conformity with GAAP requires management to make estimates and assumptions that affect the reported amounts of assets and liabilities and disclosure of contingent assets and liabilities, each as of the date of the financial statements, and the reported amounts of increase (decrease) in net assets from operations during the reporting period. Actual results could differ from those estimates.
Federal income tax — Each Fund has qualified and intends to continue to qualify as a regulated investment company under the Internal Revenue Code of 1986, as amended (the “Code”). Qualification generally will relieve the Funds of liability for federal income taxes to the extent 100% of their net investment income and net realized capital gains are distributed in accordance with the Code.
| THE DAVENPORT FUNDS |
| NOTES TO FINANCIAL STATEMENTS (Continued) |
In order to avoid imposition of the excise tax applicable to regulated investment companies, it is also each Fund’s intention to declare as dividends in each calendar year at least 98% of its net investment income (earned during the calendar year) and 98.2% of its net realized capital gains (earned during the twelve months ended October 31) plus undistributed amounts from prior years.
The following information is computed on a tax basis for each item as of September 30, 2023:
| | | | | | | | | Davenport | |
| | | Davenport | | | Davenport | | | Equity | |
| | | Core Leaders | | | Value & | | | Opportunities | |
| | | Fund | | | Income Fund | | | Fund | |
| Cost of investments | | $ | 524,544,580 | | | $ | 644,366,946 | | | $ | 604,404,233 | |
| Gross unrealized appreciation | | $ | 273,600,956 | | | $ | 166,560,585 | | | $ | 174,208,933 | |
| Gross unrealized depreciation | | | (17,022,983 | ) | | | (31,690,993 | ) | | | (82,902,140 | ) |
| Net unrealized appreciation | | | 256,577,973 | | | | 134,869,592 | | | | 91,306,793 | |
| Accumulated ordinary income | | | 36,096 | | | | 602,900 | | | | 697,760 | |
| Other gains (losses) | | | 25,807,118 | | | | (21,900,118 | ) | | | 16,313,968 | |
| Accumulated earnings | | $ | 282,421,187 | | | $ | 113,572,374 | | | $ | 108,318,521 | |
| | | | | | | | | | | | | |
| | | | | | | | | | | | | |
| | | Davenport | | | Davenport | |
| | | Small Cap | | | Balanced | |
| | | Focus Fund | | | Income Fund | |
| Cost of investments | | $ | 627,166,083 | | | $ | 196,884,475 | |
| Gross unrealized appreciation | | $ | 83,133,307 | | | $ | 24,012,170 | |
| Gross unrealized depreciation | | | (61,008,750 | ) | | | (8,209,943 | ) |
| Net unrealized appreciation | | | 22,124,557 | | | | 15,802,227 | |
| Accumulated ordinary income | | | 399,121 | | | | 271,843 | |
| Other gains (losses) | | | 7,027,241 | | | | (10,162,598 | ) |
| Accumulated earnings | | $ | 29,550,919 | | | $ | 5,911,472 | |
| | | | | | | | | |
The difference between the federal income tax cost of investments and the financial statement cost of investments for Davenport Core Leaders Fund, Davenport Value & Income Fund, Davenport Small Cap Focus Fund and Davenport Balanced Income Fund is due to certain timing differences in the recognition of capital gains and losses under income tax regulations and GAAP. These timing differences are temporary in nature and are due to the tax deferral of losses on wash sales, and adjustments to basis on partnerships.
The Funds recognize the tax benefits or expenses of uncertain tax positions only when the position is “more likely than not” to be sustained assuming examination by tax authorities. Management has reviewed the tax positions taken on Federal income tax returns for each Fund for the current and all open tax years (generally, three years) and has concluded that no provision for unrecognized tax benefits or expenses is required in these financial statements.
| THE DAVENPORT FUNDS |
| NOTES TO FINANCIAL STATEMENTS (Continued) |
The Funds recognize interest and penalties, if any, related to unrecognized tax benefits as income tax expense on the Statements of Operations. During the six months ended September 30, 2023, the Funds did not incur any interest or penalties.
3. Investment Transactions
Investment transactions, other than short-term investments and U.S. government securities, were as follows for the six months ended September 30, 2023:
| | | | | | | | | Davenport | |
| | | Davenport | | | Davenport | | | Equity | |
| | | Core Leaders | | | Value & | | | Opportunities | |
| | | Fund | | | Income Fund | | | Fund | |
| Purchases of investment securities | | $ | 113,004,481 | | | $ | 139,511,785 | | | $ | 71,529,538 | |
| Proceeds from sales of investment securities | | $ | 117,881,475 | | | $ | 137,996,955 | | | $ | 49,367,981 | |
| | | | | | | | | | | | | |
| | | Davenport | | | Davenport | |
| | | Small Cap | | | Balanced | |
| | | Focus Fund | | | Income Fund | |
| Purchases of investment securities | | $ | 125,121,698 | | | $ | 63,502,236 | |
| Proceeds from sales and maturities of investment securities | | $ | 71,903,514 | | | $ | 53,000,369 | |
| | | | | | | | | |
4. Transactions with Related Parties
INVESTMENT ADVISORY AGREEMENTS
Each Fund’s investments are managed by the Adviser under the terms of an Investment Advisory Agreement. Under the Investment Advisory Agreement, each Fund pays the Adviser a fee, which is computed and accrued daily and paid monthly, at an annual rate of 0.75% of its average daily net assets. Certain officers and a Trustee of the Trust are also officers of the Adviser.
A significant portion of the Funds’ investment trades are executed through an affiliated broker-dealer of the Adviser. No commissions are paid by the Funds to the Adviser or the affiliate for these trades.
OTHER SERVICE PROVIDERS
Ultimus Fund Solutions, LLC (“Ultimus”) provides administration, fund accounting, compliance and transfer agent services to the Funds. The Funds pay Ultimus fees in accordance with the agreements for such services. In addition, the Funds pay out-of-pocket expenses including, but not limited to, postage, supplies, and certain costs related to the pricing of the Funds’ portfolio securities. Certain officers of the Trust are also officers of Ultimus, or of Ultimus Fund Distributors, LLC (the “Distributor”), the principal underwriter of each Fund’s shares and an affiliate of Ultimus. The Distributor is compensated by the Adviser (not the Funds) for acting as principal underwriter.
| THE DAVENPORT FUNDS |
| NOTES TO FINANCIAL STATEMENTS (Continued) |
COMPENSATION OF TRUSTEES
Trustees and officers affiliated with the Adviser or Ultimus are not compensated by the Trust for their services. Each Trustee who is not an affiliated person of the Adviser or Ultimus receives from the Trust an annual retainer of $30,000, payable quarterly; a fee of $2,000 for attendance at each meeting of the Board of Trustees (except that such fee is $3,000 for the independent chair); and a fee of $1,000 for attendance at each meeting of any committee of the Board (except that such fee is $1,500 for the committee chair); plus reimbursement of travel and other expenses incurred in attending meetings. Each series of the Trust pays its proportionate share of such fees.
5. Sector Risk
If a Fund has significant investments in the securities of issuers in industries within a particular business sector, any development affecting that sector will have a greater impact on the value of the net assets of the Fund than would be the case if the Fund did not have significant investments in that sector. In addition, this may increase the risk of loss of an investment in the Fund and increase the volatility of the Fund’s NAV per share. From time to time, circumstances may affect a particular sector and the companies within such sector. For instance, economic or market factors, regulation or deregulation, or other developments may negatively impact all companies in a particular sector and therefore the value of a Fund’s portfolio would be adversely affected. As of September 30, 2023, Davenport Core Leaders Fund had 31.6% of the value of its net assets invested in common stocks within the Technology sector.
6. Contingencies and Commitments
The Funds indemnify the Trust’s officers and Trustees for certain liabilities that might arise from the performance of their duties to the Funds. Additionally, in the normal course of business the Funds enter into contracts that contain a variety of representations and warranties and which provide general indemnifications. The Funds’ maximum exposure under these arrangements is unknown, as this would involve future claims that may be made against the Funds that have not yet occurred. However, based on experience, the Funds expect the risk of loss to be remote.
7. Subsequent Events
The Funds are required to recognize in the financial statements the effects of all subsequent events that provide additional evidence about conditions that existed as of the date of the Statements of Assets and Liabilities. For non-recognized subsequent events that must be disclosed to keep the financial statements from being misleading, the Funds are required to disclose the nature of the event as well as an estimate of its financial effect, or a statement that such an estimate cannot be made. Management has evaluated subsequent events through the issuance of these financial statements and has noted no such events.
| THE DAVENPORT FUNDS |
| YOUR FUNDS’ EXPENSES (Unaudited) |
We believe it is important for you to understand the impact of costs on your investment. All mutual funds have operating expenses. As a shareholder of the Funds, you incur ongoing costs, including management fees and other expenses. These ongoing costs, which are deducted from each Fund’s gross income, directly reduce the investment return of the Funds.
A mutual fund’s ongoing costs are expressed as a percentage of its average net assets. This figure is known as the expense ratio. The following examples are intended to help you understand the ongoing costs (in dollars) of investing in the Funds and to compare these costs with the ongoing costs of investing in other mutual funds. The examples below are based on an investment of $1,000 made at the beginning of the period shown and held for the entire period (April 1, 2023 through September 30, 2023).
The table below illustrates each Fund’s ongoing costs in two ways:
Actual fund return – This section helps you to estimate the actual expenses that you paid over the period. The “Ending Account Value” shown is derived from each Fund’s actual return, and the fourth column shows the dollar amount of operating expenses that would have been paid by an investor who started with $1,000 in the Funds. You may use the information here, together with the amount you invested, to estimate the expenses that you paid over the period.
To do so, simply divide your account value by $1,000 (for example, an $8,600 account value divided by $1,000 = 8.6), then multiply the result by the number given for the applicable Fund under the heading “Expenses Paid During Period.”
Hypothetical 5% return – This section is intended to help you compare each Fund’s ongoing costs with those of other mutual funds. It assumes that each Fund had an annual return of 5% before expenses during the period shown, but that the expense ratio is unchanged. In this case, because the return used is not each Fund’s actual return, the results do not apply to your investment. The example is useful in making comparisons because the U.S. Securities and Exchange Commission (the “SEC”) requires all mutual funds to calculate expenses based on a 5% return. You can assess each Fund’s ongoing costs by comparing this hypothetical example with the hypothetical examples that appear in shareholder reports of other funds.
Note that expenses shown in the table are meant to highlight and help you compare ongoing costs only. The Funds do not charge sales loads or redemption fees.
The calculations assume no shares were bought or sold during the period. Your actual costs may have been higher or lower, depending on the amount of your investment and the timing of any purchases or redemptions.
More information about each Fund’s expenses, including historical annual expense ratios, can be found in this report. For additional information on operating expenses and other shareholder costs, please refer to the Funds’ prospectus.
| THE DAVENPORT FUNDS |
| YOUR FUNDS’ EXPENSES (Unaudited) (Continued) |
| | Beginning | Ending | | |
| | Account Value | Account Value | | |
| | April 1, | September 30, | Expense | Expenses Paid |
| | 2023 | 2023 | Ratio(a) | During Period(b) |
| Davenport Core Leaders Fund | | | | |
| Based on Actual Fund Return | $1,000.00 | $1,090.70 | 0.87% | $4.56 |
| Based on Hypothetical 5% Return (before expenses) | $1,000.00 | $1,020.71 | 0.87% | $4.41 |
| Davenport Value & Income Fund | | | | |
| Based on Actual Fund Return | $1,000.00 | $ 994.10 | 0.87% | $4.35 |
| Based on Hypothetical 5% Return (before expenses) | $1,000.00 | $1,020.71 | 0.87% | $4.41 |
| Davenport Equity Opportunities Fund | | | | |
| Based on Actual Fund Return | $1,000.00 | $1,051.30 | 0.88% | $4.53 |
| Based on Hypothetical 5% Return (before expenses) | $1,000.00 | $1,020.66 | 0.88% | $4.46 |
| Davenport Small Cap Focus Fund | | | | |
| Based on Actual Fund Return | $1,000.00 | $1,028.50 | 0.88% | $4.47 |
| Based on Hypothetical 5% Return (before expenses) | $1,000.00 | $1,020.66 | 0.88% | $4.46 |
| Davenport Balanced Income Fund | | | | |
| Based on Actual Fund Return | $1,000.00 | $ 993.00 | 0.93% | $4.65 |
| Based on Hypothetical 5% Return (before expenses) | $1,000.00 | $1,020.41 | 0.93% | $4.71 |
| | | | | |
| (a) | Annualized, based on each Fund’s most recent one-half year expenses. |
| (b) | Expenses are equal to each Fund’s annualized expense ratio multiplied by the average account value over the period, multiplied by 183/365 (to reflect the one-half year period). |
| THE DAVENPORT FUNDS |
| OTHER INFORMATION (Unaudited) |
A description of the policies and procedures that the Funds use to vote proxies relating to portfolio securities is available without charge upon request by calling toll-free 1-800-281-3217, or on the SEC’s website at www.sec.gov. Information regarding how the Funds voted proxies relating to portfolio securities during the most recent 12-month period ended June 30 is also available without charge upon request by calling toll-free 1-800-281-3217, or on the SEC’s website at www.sec.gov.
The Trust files a complete listing of portfolio holdings for each Fund with the SEC as of the end of the first and third quarters of each fiscal year as an exhibit to its reports on Form N-PORT. These filings are available upon request by calling 1-800-281-3217. Furthermore, you may obtain a copy of these filings on the SEC’s website at www.sec.gov.
A complete listing of portfolio holdings for each Fund is updated daily and can be reviewed at the Funds’ website at www.investdavenport.com.
Privacy Notice
| FACTS | WHAT DO THE DAVENPORT FUNDS DO WITH YOUR PERSONAL INFORMATION? |
| | | | |
| Why? | Financial companies choose how they share your personal information. Federal law gives consumers the right to limit some but not all sharing. Federal law also requires us to tell you how we collect, share, and protect your personal information. Please read this notice carefully to understand what we do. |
| | | | |
| What? | The types of personal information we collect and share depend on the product or service you have with us. This information can include: ■ Social Security number ■ Assets ■ Retirement Assets ■ Transaction History ■ Checking Account Information ■ Purchase History ■ Account Balances ■ Account Transactions ■ Wire Transfer Instructions When you are no longer our customer, we continue to share your information as described in this notice. |
| | | | |
| How? | All financial companies need to share your personal information to run their everyday business. In the section below, we list the reasons financial companies can share their customers’ personal information; the reasons The Davenport Funds choose to share; and whether you can limit this sharing. |
| | | | |
| Reasons we can share your personal information | Do The Davenport
Funds share? | Can you limit this
sharing? |
For our everyday business purposes –
Such as to process your transactions, maintain your account(s), respond to court orders and legal investigations, or report to credit bureaus | Yes | No |
For our marketing purposes –
to offer our products and services to you | No | We don’t share |
| For joint marketing with other financial companies | No | We don’t share |
| For our affiliates’ everyday business purposes – information about your creditworthiness | No | We don’t share |
| For nonaffiliates to market to you | No | We don’t share |
| | | | |
| Questions? | Call 1-800-281-3217 |
| | | | | |
| Who we are |
| Who is providing this notice? | Williamsburg Investment Trust Ultimus Fund Distributors, LLC Ultimus Fund Solutions, LLC |
| What we do |
| How do The Davenport Funds protect my personal information? | To protect your personal information from unauthorized access and use, we use security measures that comply with federal law. These measures include computer safeguards and secured files and buildings. Our service providers are held accountable for adhering to strict policies and procedures to prevent any misuse of your nonpublic personal information. |
| How do The Davenport Funds collect my personal information? | We collect your personal information, for example, when you ■ Provide account information ■ Give us your contact information ■ Make deposits or withdrawals from your account ■ Make a wire transfer ■ Tell us where to send the money ■ Tell us who receives the money ■ Show your government-issued ID ■ Show your driver’s license We also collect your personal information from other companies. |
| Why can’t I limit all sharing? | Federal law gives you the right to limit only ■ Sharing for affiliates’ everyday business purposes – information about your creditworthiness ■ Affiliates from using your information to market to you ■ Sharing for nonaffiliates to market to you State laws and individual companies may give you additional rights to limit sharing. |
| | |
| Definitions |
| Affiliates | Companies related by common ownership or control. They can be financial and nonfinancial companies. ■ Davenport & Company LLC, the investment adviser to The Davenport Funds, could be deemed to be an affiliate. |
| Nonaffiliates | Companies not related by common ownership or control. They can be financial and nonfinancial companies ■ The Davenport Funds do not share with nonaffiliates so they can market to you |
| Joint marketing | A formal agreement between nonaffiliated financial companies that together market financial products or services to you. ■ The Davenport Funds don’t jointly market. |
This page intentionally left blank.
| |
| |
| |
| |
| |
| |
| |
| |
| |
| |
| |
| THE DAVENPORT FUNDS |
| |
| Investment Adviser |
| Davenport & Company LLC |
| One James Center |
| 901 East Cary Street |
| Richmond, Virginia 23219-4037 |
| |
| Administrator |
| Ultimus Fund Solutions, LLC |
| P.O. Box 46707 |
| Cincinnati, Ohio 45246-0707 |
| 1-800-281-3217 |
| |
| Custodian |
| U.S. Bank, N.A. |
| 425 Walnut Street |
| Cincinnati, Ohio 45202 |
| |
| Independent Registered Public |
| Accounting Firm |
| Cohen & Company, Ltd. |
| 342 N Water Street, |
| Suite 830 |
| Milwaukee, WI 53202 |
| |
| Legal Counsel |
| Sullivan & Worcester LLP |
| 1666 K Street, N.W. |
| Washington, DC 20006 |
| |
| Board of Trustees |
| Robert S. Harris, Ph.D., Chairman |
| John P. Ackerly, IV |
| George K. Jennison |
| Harris V. Morrissette |
| Elizabeth W. Robertson |
| |
| Officers |
| John P. Ackerly, IV, President |
| Cheryl B. Hatcher, Vice President |
| George L. Smith, III, Vice President |
| |
| |
| |
| |
| |
| |
| |
| |
| Davenport-SAR-23 |
| | | | | |
| | | | |
| | | | | |
| | | | | |
| | | | | |
| | | | | |
| | | | | |
| | | THE | | |
| | | JAMESTOWN | | |
| | | EQUITY FUND | | |
| | | | | |
| | | | | |
| | | | | |
| | | | | |
| | | No-Load Fund | | |
| | | | | |
| | | | | |
| | | | | |
| | | | | |
| | | | | |
| | | | | |
| | | | | |
| | | | | |
| | | | | |
| | | | | |
| | | | | |
| | | SEMI-ANNUAL REPORT | | |
| | | | | |
| | | | | |
| | | | | |
| | | | | |
| | | | | |
| | | | | |
| | | September 30, 2023 | | |
| | | | | |
| | | | | |
| | | | | |
| | | | | |
| | | | | |
| | | | | |
| | | | | |
| | |  | | |
| | | | | |
| | | | | |
| | | Investment Adviser | | |
| | | Lowe, Brockenbrough & Company, Inc. | | |
| | | Richmond, Virginia | | |
| | | | | |
| | | | | |
| | | | | |
| | | | | |
| LETTER TO SHAREHOLDERS | November 2, 2023 |
For the six-month period ended September 30, 2023, The Jamestown Equity Fund (the “Fund”) returned 6.05% compared to 5.18% for the S&P 500® Index. Both sector allocation and stock selection added to relative outperformance in the past six months. The primary driver of the positive contribution from sector selection was the Fund’s underweight in the Utilities and Real Estate sectors that have been hurt as interest rates rose. Negative stock selection in Healthcare, Consumer Staples, and Materials was more than offset by positive selection in the Communications, Consumer Discretionary, and the Technology sectors.
The S&P 500® continued its recovery off of the Fall 2022 lows through July 2023, but has given back some of the rally recently largely due to higher interest rates and geopolitical risks. Over the six-month period ended September 30, 2023, the Bloomberg U.S. Aggregate bond index lost -4.05% as the 10-Year Treasury yield went from 3.47% to 4.57%. Growth oriented equities significantly outperformed over the six months as the Russell 1000® Growth Index returned 9.28% compared to 0.78% for the Russell 1000® Value Index. Another example of the concentrated performance in the large capitalization U.S. equities is the six month return of -1.11% for the equal weighted S&P 500 versus the 5.18% return for the capitalization weighted S&P 500.
There is obviously no way to know for sure where interest rates might have gone in the absence of the Great Recession and the COVID-19 pandemic, but these events unleashed Federal Reserve (the “Fed”) interest rate suppression (zero rates and bond buying) on a scale theretofore unheard of, concluding in yields crashing to historic lows as lockdowns began. We all know what happened next. Cruelly, ironically even, inflation surged as the economic reopening, over-lubricated with extreme monetary and fiscal stimulus, ran headlong into supply chain chaos and labor shortages. The Fed eventually reversed course, but the damage was done. It’s stunning, really—decades of declining yields culminating in a historic collapse, only to be violently reversed. The benign narrative of permanently lower rates has been overthrown.
Helpfully, inflation has come down, but getting from 3% to the stated Fed goal of 2% will be more difficult. Interest rate policy normally works through the labor and housing channels; unfortunately, we have structural shortages of both, making rate increases less potent. Higher rates for longer are now the consensus view.
Interest rates stayed in the 2% to 3% range for almost a decade before collapsing in 2020. That’s a long run, certainly more than long enough to feel normal. But it wasn’t normal. The Fed was suppressing yields. Said another way, they were keeping the cost of debt artificially low, and the U.S. and global economy became acclimated (hopefully not addicted) to the cheap money. We are finally on the other side of that regime, at least until the next calamity. Interest rates will almost certainly find a higher range, and we believe we’re close. Not a lot higher or something else important breaks. And not a lot lower given the trillions in forever-deficits that must now compete for the world’s savings. So, our best guess is the 10-Year yield settles in somewhere between 4% and 5%, about where it was before the Great Recession and the Fed began its rate suppression experiments.
Stocks have two more hurdles to vault before we can rest easy. First, markets will have to see convincing evidence that the Fed’s rate actions are finally slowing the economy and that probably means labor market weakness. And second, they can’t have gone too far and tipped us into recession. We should have an answer in the next few quarters. Stay tuned.
| LETTER TO SHAREHOLDERS | November 2, 2023 |
At the end of September 2023, the Fund was 94.8% invested in a diversified portfolio of equities, while holding 5.2% in cash. The Fund was slightly overweight the Communications , Consumer Staples, Energy and Technology sectors and underweight Consumer Discretionary, Financials, Health Care, Materials, Utility and Real Estate sectors at the end of the six-month period.
| THE JAMESTOWN EQUITY FUND |
| PERFORMANCE INFORMATION (Unaudited) |
Comparison of the Change in Value of a $10,000 Investment in
The Jamestown Equity Fund
and the S&P 500® Index
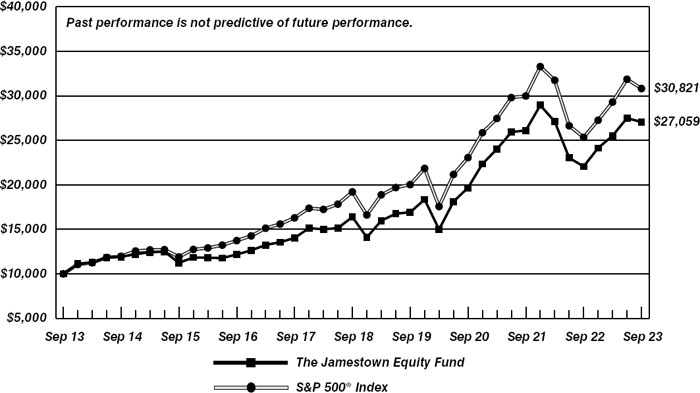
| | | Average Annual Total Returns | |
| | | (for periods ended September 30, 2023) | |
| | | 1 Year | | 5 Years | | 10 Years | |
| | The Jamestown Equity Fund (a) | 22.64% | | 10.55% | | 10.47% | |
| | S&P 500® Index | 21.62% | | 9.92% | | 11.91% | |
| (a) | Total return is a measure of the change in value of an investment in the Fund over the periods covered, which assumes any dividends or capital gains distributions are reinvested in shares of the Fund. Returns shown do not reflect the deduction of taxes a shareholder would pay on Fund distributions or the redemption of Fund shares. |
| THE JAMESTOWN EQUITY FUND |
PORTFOLIO INFORMATION
September 30, 2023 (Unaudited) |
| Asset Allocation (% of Net Assets) |
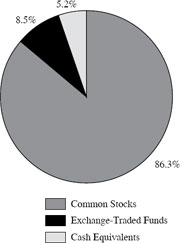
| Ten Largest Equity Holdings | % of
Net Assets |
| Apple, Inc. | 5.6% |
| Microsoft Corporation | 4.6% |
| Meta Platforms, Inc. - Class A | 4.1% |
| Alphabet, Inc. - Class A and C | 3.9% |
| Vangaurd Information Technology ETF | 3.3% |
| Amazon.com, Inc. | 3.0% |
| Chevron Corporation | 2.7% |
| JPMorgan Chase & Company | 2.7% |
| Eaton Corporation plc | 2.5% |
| Broadcom, Inc. | 2.4% |
| Sector Concentration vs. the S&P 500® Index |
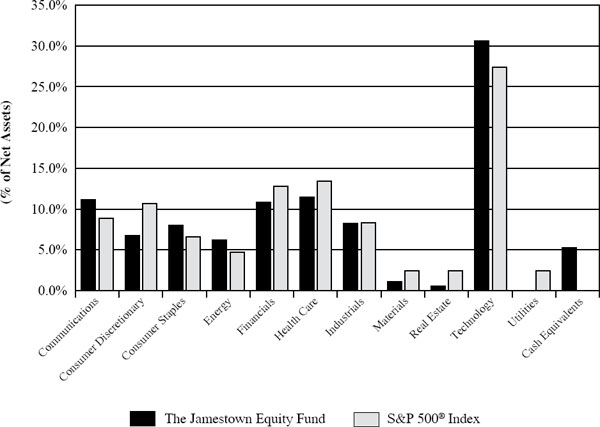
| THE JAMESTOWN EQUITY FUND |
| SCHEDULE OF INVESTMENTS |
| September 30, 2023 (Unaudited) |
| COMMON STOCKS — 86.3% | | Shares | | | Value | |
| Communications — 11.1% | | | | | | | | |
| Alphabet, Inc. - Class A (a) | | | 3,320 | | | $ | 434,455 | |
| Alphabet, Inc. - Class C (a) | | | 10,000 | | | | 1,318,500 | |
| Booking Holdings, Inc. (a) | | | 335 | | | | 1,033,123 | |
| Meta Platforms, Inc. - Class A (a) | | | 6,100 | | | | 1,831,281 | |
| Walt Disney Company (The) (a) | | | 4,300 | | | | 348,515 | |
| | | | | | | | 4,965,874 | |
| Consumer Discretionary — 6.8% | | | | | | | | |
| Amazon.com, Inc. (a) | | | 10,500 | | | | 1,334,760 | |
| Home Depot, Inc. (The) | | | 1,350 | | | | 407,916 | |
| Lowe’s Companies, Inc. | | | 2,300 | | | | 478,032 | |
| TJX Companies, Inc. (The) | | | 9,100 | | | | 808,808 | |
| | | | | | | | 3,029,516 | |
| Consumer Staples — 6.9% | | | | | | | | |
| PepsiCo, Inc. | | | 2,690 | | | | 455,794 | |
| Procter & Gamble Company (The) | | | 5,100 | | | | 743,886 | |
| Target Corporation | | | 4,300 | | | | 475,451 | |
| Unilever plc - ADR | | | 18,505 | | | | 914,147 | |
| Walmart, Inc. | | | 3,000 | | | | 479,790 | |
| | | | | | | | 3,069,068 | |
| Energy — 6.2% | | | | | | | | |
| Chevron Corporation | | | 7,200 | | | | 1,214,064 | |
| Exxon Mobil Corporation | | | 2,250 | | | | 264,555 | |
| Schlumberger Ltd. | | | 11,545 | | | | 673,074 | |
| TotalEnergies SE - ADR | | | 9,500 | | | | 624,720 | |
| | | | | | | | 2,776,413 | |
| Financials — 9.7% | | | | | | | | |
| Ameriprise Financial, Inc. | | | 2,950 | | | | 972,556 | |
| Chubb Ltd. | | | 1,800 | | | | 374,724 | |
| Goldman Sachs Group, Inc. (The) | | | 1,800 | | | | 582,426 | |
| JPMorgan Chase & Company | | | 8,300 | | | | 1,203,666 | |
| Morgan Stanley | | | 7,500 | | | | 612,525 | |
| PNC Financial Services Group, Inc. (The) | | | 4,800 | | | | 589,296 | |
| | | | | | | | 4,335,193 | |
| Health Care — 11.5% | | | | | | | | |
| Amgen, Inc. | | | 1,300 | | | | 349,388 | |
| CVS Health Corporation | | | 8,500 | | | | 593,470 | |
| Elevance Health, Inc. | | | 1,650 | | | | 718,443 | |
| Johnson & Johnson | | | 4,000 | | | | 623,000 | |
| Merck & Company, Inc. | | | 4,000 | | | | 411,800 | |
| Pfizer, Inc. | | | 27,510 | | | | 912,507 | |
| Thermo Fisher Scientific, Inc. | | | 1,400 | | | | 708,638 | |
| THE JAMESTOWN EQUITY FUND |
| SCHEDULE OF INVESTMENTS (Continued) |
| COMMON STOCKS — 86.3% (Continued) | | Shares | | | Value | |
| Health Care — 11.5% (Continued) | | | | | | | | |
| UnitedHealth Group, Inc. | | | 1,600 | | | $ | 806,704 | |
| | | | | | | | 5,123,950 | |
| Industrials — 8.2% | | | | | | | | |
| Eaton Corporation plc | | | 5,300 | | | | 1,130,384 | |
| Lockheed Martin Corporation | | | 825 | | | | 337,392 | |
| Norfolk Southern Corporation | | | 3,400 | | | | 669,562 | |
| RTX Corporation | | | 4,600 | | | | 331,062 | |
| Trane Technologies plc | | | 3,900 | | | | 791,349 | |
| United Parcel Service, Inc. - Class B | | | 2,600 | | | | 405,262 | |
| | | | | | | | 3,665,011 | |
| Materials — 1.0% | | | | | | | | |
| Eastman Chemical Company | | | 6,200 | | | | 475,664 | |
| | | | | | | | | |
| Real Estate — 0.5% | | | | | | | | |
| American Tower Corporation | | | 1,410 | | | | 231,874 | |
| | | | | | | | | |
| Technology — 24.4% | | | | | | | | |
| Adobe, Inc. (a) | | | 1,400 | | | | 713,860 | |
| Apple, Inc. | | | 14,700 | | | | 2,516,787 | |
| Applied Materials, Inc. | | | 5,650 | | | | 782,242 | |
| Broadcom, Inc. | | | 1,300 | | | | 1,079,754 | |
| Cisco Systems, Inc. | | | 17,750 | | | | 954,240 | |
| Microsoft Corporation | | | 6,500 | | | | 2,052,375 | |
| NVIDIA Corporation | | | 2,305 | | | | 1,002,652 | |
| Oracle Corporation | | | 10,000 | | | | 1,059,200 | |
| Visa, Inc. - Class A | | | 3,175 | | | | 730,282 | |
| | | | | | | | 10,891,392 | |
| | | | | | | | | |
| Total Common Stocks (Cost $16,673,320) | | | | | | $ | 38,563,955 | |
| | | | | | | | | |
| EXCHANGE-TRADED FUNDS — 8.5% | | Shares | | | Value | |
| Consumer Staples Select Sector SPDR Fund | | | 7,550 | | | $ | 519,515 | |
| Invesco KBW Bank ETF | | | 12,165 | | | | 487,451 | |
| iShares Expanded Tech-Software Sector ETF | | | 1,630 | | | | 556,254 | |
| iShares Semiconductor ETF | | | 1,600 | | | | 757,840 | |
| Vanguard Information Technology ETF | | | 3,500 | | | | 1,452,150 | |
| Total Exchange-Traded Funds (Cost $1,932,818) | | | | | | $ | 3,773,210 | |
| THE JAMESTOWN EQUITY FUND |
| SCHEDULE OF INVESTMENTS (Continued) |
| MONEY MARKET FUNDS — 5.3% | | Shares | | | Value | |
| Federated Hermes Government Obligations Fund -Institutional Class, 5.20% (b) (Cost $2,363,716) | | | 2,363,716 | | | $ | 2,363,716 | |
| | | | | | | | | |
| Total Investments at Value — 100.1% | | | | | | | | |
| (Cost $20,969,854) | | | | | | $ | 44,700,881 | |
| | | | | | | | | |
| Liabilities in Excess of Other Assets — (0.1%) | | | | | | | (28,581 | ) |
| | | | | | | | | |
| Net Assets — 100.0% | | | | | | $ | 44,672,300 | |
ADR - American Depositary Receipt.
| (a) | Non-income producing security. |
| (b) | The rate shown is the 7-day effective yield as of September 30, 2023. |
See accompanying notes to financial statements.
| THE JAMESTOWN EQUITY FUND |
| STATEMENT OF ASSETS AND LIABILITIES |
| September 30, 2023 (Unaudited) |
| ASSETS | | | | |
| Investments in securities: | | | | |
| At cost | | $ | 20,969,854 | |
| At value (Note 2) | | $ | 44,700,881 | |
| Dividends receivable | | | 36,663 | |
| Other assets | | | 11,523 | |
| TOTAL ASSETS | | | 44,749,067 | |
| | | | | |
| LIABILITIES | | | | |
| Distributions payable | | | 2,197 | |
| Payable for capital shares redeemed | | | 39,789 | |
| Accrued investment advisory fees (Note 4) | | | 24,106 | |
| Payable to administrator (Note 4) | | | 6,000 | |
| Other accrued expenses | | | 4,675 | |
| TOTAL LIABILITIES | | | 76,767 | |
| | | | | |
| NET ASSETS | | $ | 44,672,300 | |
| | | | | |
| Net assets consist of: | | | | |
| Paid-in capital | | $ | 20,741,149 | |
| Accumulated earnings | | | 23,931,151 | |
| Net assets | | $ | 44,672,300 | |
| | | | | |
| Shares of beneficial interest outstanding | | | | |
| (unlimited number of shares authorized, $0.01 par value) | | | 1,683,861 | |
| | | | | |
| Net asset value, offering price and redemption price per share (Note 2) | | $ | 26.53 | |
See accompanying notes to financial statements.
| THE JAMESTOWN EQUITY FUND |
| STATEMENT OF OPERATIONS |
| Six Months Ended September 30, 2023 (Unaudited) |
| INVESTMENT INCOME | | | | |
| Dividends | | $ | 451,947 | |
| Foreign withholding taxes on dividends | | | (4,881 | ) |
| TOTAL INVESTMENT INCOME | | | 447,066 | |
| | | | | |
| EXPENSES | | | | |
| Investment advisory fees (Note 4) | | | 147,050 | |
| Administration fees (Note 4) | | | 30,000 | |
| Trustees’ fees and expenses (Note 4) | | | 11,194 | |
| Audit and tax services fees | | | 8,665 | |
| Registration and filing fees | | | 6,683 | |
| Compliance service fees (Note 4) | | | 6,000 | |
| Legal fees | | | 4,705 | |
| Shareholder reporting expense | | | 4,046 | |
| Custodian and bank service fees | | | 3,716 | |
| Shareholder servicing fees (Note 4) | | | 2,329 | |
| Postage and supplies | | | 1,729 | |
| Insurance expense | | | 706 | |
| Other expenses | | | 4,453 | |
| TOTAL EXPENSES | | | 231,276 | |
| Fees voluntarily waived by the Adviser (Note 4) | | | (16,357 | ) |
| NET EXPENSES | | | 214,919 | |
| | | | | |
| NET INVESTMENT INCOME | | | 232,147 | |
| | | | | |
| REALIZED AND UNREALIZED GAINS ON INVESTMENTS | | | | |
| Net realized gains on investment transactions | | | 265,488 | |
| Net change in unrealized appreciation (depreciation) on investments | | | 2,124,989 | |
| NET REALIZED AND UNREALIZED GAINS ON INVESTMENTS | | | 2,390,477 | |
| | | | | |
| NET INCREASE IN NET ASSETS RESULTING FROM OPERATIONS | | $ | 2,622,624 | |
See accompanying notes to financial statements.
| THE JAMESTOWN EQUITY FUND |
| STATEMENTS OF CHANGES IN NET ASSETS |
| | | Six Months | | | | |
| | | Ended | | | Year | |
| | | Sept. 30, | | | Ended | |
| | | 2023 | | | March 31, | |
| | | (Unaudited) | | | 2023 | |
| FROM OPERATIONS | | | | | | | | |
| Net investment income | | $ | 232,147 | | | $ | 464,146 | |
| Net realized gains on investment transactions | | | 265,488 | | | | 3,251,417 | |
| Net change in unrealized appreciation (depreciation) on investments | | | 2,124,989 | | | | (6,891,866 | ) |
| Net increase (decrease) in net assets resulting from operations | | | 2,622,624 | | | | (3,176,303 | ) |
| | | | | | | | | |
| DISTRIBUTIONS TO SHAREHOLDERS (Note 2) | | | (1,278,275 | ) | | | (5,789,948 | ) |
| | | | | | | | | |
| FROM CAPITAL SHARE TRANSACTIONS | | | | | | | | |
| Proceeds from shares sold | | | 70,426 | | | | 341,376 | |
| Net asset value of shares issued in reinvestment of distributions to shareholders | | | 1,252,087 | | | | 5,648,746 | |
| Payments for shares redeemed | | | (1,073,195 | ) | | | (4,136,511 | ) |
| Net increase in net assets from capital share transactions | | | 249,318 | | | | 1,853,611 | |
| | | | | | | | | |
| TOTAL INCREASE (DECREASE) IN NET ASSETS | | | 1,593,667 | | | | (7,112,640 | ) |
| | | | | | | | | |
| NET ASSETS | | | | | | | | |
| Beginning of period | | | 43,078,633 | | | | 50,191,273 | |
| End of period | | $ | 44,672,300 | | | $ | 43,078,633 | |
| | | | | | | | | |
| CAPITAL SHARE ACTIVITY | | | | | | | | |
| Shares sold | | | 2,717 | | | | 13,459 | |
| Shares reinvested | | | 46,396 | | | | 225,428 | |
| Shares redeemed | | | (39,558 | ) | | | (161,336 | ) |
| Net increase in shares outstanding | | | 9,555 | | | | 77,551 | |
| Shares outstanding, beginning of period | | | 1,674,306 | | | | 1,596,755 | |
| Shares outstanding, end of period | | | 1,683,861 | | | | 1,674,306 | |
See accompanying notes to financial statements.
| THE JAMESTOWN EQUITY FUND |
| FINANCIAL HIGHLIGHTS |
Selected Per Share Data for a Share Outstanding Throughout Each Period:
| | | Six Months | | | | | | | | | | | | | | | | |
| | | Ended | | | | | | | | | | | | | | | | |
| | | Sept. 30, | | | | | | | | | | |
| | | 2023 | | | Years Ended March 31, | |
| | | (Unaudited) | | | 2023 | | | 2022 | | | 2021 | | | 2020 | | | 2019 | |
| Net asset value at beginning of period | | $ | 25.73 | | | $ | 31.43 | | | $ | 28.96 | | | $ | 19.08 | | | $ | 21.79 | | | $ | 22.10 | |
| | | | | | | | | | | | | | | | | | | | | | | | | |
| Income (loss) from investment operations: | | | | | | | | | | | | | | | | | | | | | | | | |
| Net investment income (a) | | | 0.14 | | | | 0.28 | | | | 0.16 | | | | 0.17 | | | | 0.22 | | | | 0.24 | |
| Net realized and unrealized gains (losses) on investments | | | 1.43 | | | | (2.38 | ) | | | 3.57 | | | | 11.05 | | | | (1.35 | ) | | | 1.10 | |
| Total from investment operations | | | 1.57 | | | | (2.10 | ) | | | 3.73 | | | | 11.22 | | | | (1.13 | ) | | | 1.34 | |
| | | | | | | | | | | | | | | | | | | | | | | | | |
| Less distributions from: | | | | | | | | | | | | | | | | | | | | | | | | |
| Net investment income | | | (0.14 | ) | | | (0.28 | ) | | | (0.16 | ) | | | (0.18 | ) | | | (0.22 | ) | | | (0.24 | ) |
| Net realized gains | | | (0.63 | ) | | | (3.32 | ) | | | (1.10 | ) | | | (1.16 | ) | | | (1.36 | ) | | | (1.41 | ) |
| Total distributions | | | (0.77 | ) | | | (3.60 | ) | | | (1.26 | ) | | | (1.34 | ) | | | (1.58 | ) | | | (1.65 | ) |
| | | | | | | | | | | | | | | | | | | | | | | | | |
| Net asset value at end of period | | $ | 26.53 | | | $ | 25.73 | | | $ | 31.43 | | | $ | 28.96 | | | $ | 19.08 | | | $ | 21.79 | |
| | | | | | | | | | | | | | | | | | | | | | | | | |
| Total return (b) | | | 6.05 | % (c) | | | (5.89 | %) | | | 12.91 | % | | | 60.23 | % | | | (6.17 | %) | | | 6.40 | % |
| | | | | | | | | | | | | | | | | | | | | | | | | |
| Net assets at end of period (000’s) | | $ | 44,672 | | | $ | 43,078 | | | $ | 50,191 | | | $ | 47,399 | | | $ | 31,062 | | | $ | 36,658 | |
| | | | | | | | | | | | | | | | | | | | | | | | | |
| Ratio of total expenses to average net assets (d) | | | 1.02 | % (e) | | | 1.04 | % | | | 0.96 | % | | | 1.05 | % | | | 1.08 | % | | | 1.03 | % |
| | | | | | | | | | | | | | | | | | | | | | | | | |
| Ratio of net expenses to average net assets (d)(f) | | | 0.95 | % (e) | | | 0.95 | % | | | 0.95 | % | | | 0.95 | % | | | 0.95 | % | | | 0.95 | % |
| | | | | | | | | | | | | | | | | | | | | | | | | |
| Ratio of net investment income to average net assets (a)(d)(f) | | | 1.03 | % (e) | | | 1.08 | % | | | 0.51 | % | | | 0.70 | % | | | 0.96 | % | | | 1.10 | % |
| | | | | | | | | | | | | | | | | | | | | | | | | |
| Portfolio turnover rate | | | 2 | % (c) | | | 6 | % | | | 8 | % | | | 10 | % | | | 18 | % | | | 18 | % |
| (a) | Recognition of net investment income by the Fund is affected by the timing of the declarations of dividends by the underlying investment companies in which the Fund invests. |
| (b) | Total return is a measure of the change in value of an investment in the Fund over the periods covered, which assumes any dividends or capital gains distributions are reinvested in shares of the Fund. Returns shown do not reflect the deduction of taxes a shareholder would pay on Fund distributions or the redemption of Fund shares. |
| (d) | The ratios of expenses and net investment income to average net assets do not reflect the Fund’s proportionate share of expenses of the underlying investment companies in which the Fund invests. Ratios were also determined based on net expenses after expense reimbursements through a previously directed brokerage arrangement for the years ended March 31, 2020 and 2019. |
| (f) | Ratio was determined after voluntary advisory fee waivers by the Adviser (Note 4). |
See accompanying notes to financial statements.
| THE JAMESTOWN EQUITY FUND |
| NOTES TO FINANCIAL STATEMENTS |
| September 30, 2023 (Unaudited) |
1. Organization
The Jamestown Equity Fund (the “Fund”) is a diversified, no-load series of Williamsburg Investment Trust (the “Trust”), an open-end management investment company registered under the Investment Company Act of 1940, as amended (the “1940 Act”). The Trust was organized as a Massachusetts business trust on July 18, 1988. Other series of the Trust are not included in this report.
The investment objective of the Fund is long-term growth of capital.
2. Significant Accounting Policies
The following is a summary of the Fund’s significant accounting policies. These policies are in conformity with accounting principles generally accepted in the United States of America (“GAAP”). The Fund follows accounting and reporting guidance under Financial Accounting Standards Board Accounting Standards Codification Topic 946, “Financial Services – Investment Companies.”
Regulatory update — Tailored Shareholder Reports for Mutual Funds and Exchange-Traded Funds (“ETFs”) — Effective January 24, 2023, the Securities and Exchange Commission (the “SEC”) adopted rule and form amendments to require mutual funds and ETFs to transmit concise and visually engaging streamlined annual and semiannual reports to shareholders that highlight key information. Other information, including financial statements, will no longer appear in a streamlined shareholder report but must be available online, delivered free of charge upon request, and filed on a semiannual basis on Form N-CSR. The rule and form amendments have a compliance date of July 24, 2024. At this time, management is evaluating the impact of these amendments on the shareholder reports for the Fund.
Securities valuation — The Fund’s portfolio securities are valued as of the close of business of the regular session of the New York Stock Exchange (normally 4:00 p.m., Eastern time). Securities traded on a national stock exchange, including common stocks and exchange-traded funds (“ETFs”), are generally valued based upon the closing price on the principal exchange where the security is traded, if available, otherwise, at the last quoted bid price. Securities that are quoted by NASDAQ are valued at the NASDAQ Official Closing Price. Investments representing shares of other open-end investment companies, other than ETFs but including money market funds, are valued at their net asset value (“NAV”) as reported by such companies. When using a quoted price and when the market is considered active, securities will be classified as Level 1 within the fair value hierarchy (see below).
When market quotations are not readily available, if a pricing service cannot provide a price, or if the investment adviser believes the price received from the pricing service is not indicative of fair value, securities will be valued in good faith at fair value as determined by Lowe, Brockenbrough & Company, Inc., d/b/a Brockenbrough (the “Adviser”), as the Fund’s valuation designee, in accordance with procedures adopted by the Board of Trustees (the “Board”) pursuant to Rule 2a-5 under the 1940 Act. Under these procedures, the securities will be classified as Level 2 or 3 within the fair value hierarchy, depending on the inputs used. Such methods of fair valuation may include,
| THE JAMESTOWN EQUITY FUND |
| NOTES TO FINANCIAL STATEMENTS (Continued) |
but are not limited to: multiple of earnings, multiple of book value, discount from market of a similar freely traded security, purchase price of the security, subsequent private transactions in the security or related securities, or a combination of these and other factors.
GAAP establishes a single authoritative definition of fair value, sets out a framework for measuring fair value and requires additional disclosures about fair value measurements.
Various inputs are used in determining the value of the Fund’s investments. These inputs are summarized in the three broad levels listed below:
| ● | Level 1 – quoted prices in active markets for identical securities |
| ● | Level 2 – other significant observable inputs |
| ● | Level 3 – significant unobservable inputs |
The inputs or methodology used for valuing securities are not necessarily an indication of the risks associated with investing in those securities. The inputs used to measure fair value may fall into different levels of the fair value hierarchy. In such cases, for disclosure purposes, the level in the fair value hierarchy within which the fair value measurement falls in its entirety is determined based on the lowest level input that is significant to the fair value measurement.
The following is a summary of the Fund’s investments based on the inputs used to value the investments as of September 30, 2023, by security type:
| | | Level 1 | | | Level 2 | | | Level 3 | | | Total | |
| Common Stocks | | $ | 38,563,955 | | | $ | — | | | $ | — | | | $ | 38,563,955 | |
| Exchange-Traded Funds | | | 3,773,210 | | | | — | | | | — | | | | 3,773,210 | |
| Money Market Funds | | | 2,363,716 | | | | — | | | | — | | | | 2,363,716 | |
| Total | | $ | 44,700,881 | | | $ | — | | | $ | — | | | $ | 44,700,881 | |
| | | | | | | | | | | | | | | | | |
| | | | | | | | | | | | | | | | | |
Refer to the Fund’s Schedule of Investments for a listing of the common stocks by sector type. There were no Level 3 securities or derivative instruments held by the Fund as of or during the six months ended September 30, 2023.
Share valuation — The NAV per share of the Fund is calculated daily by dividing the total value of its assets, less liabilities, by the number of shares outstanding. The offering price and redemption price per share of the Fund is equal to the NAV per share.
Investment income — Dividend income is recorded on the ex-dividend date. Non-cash dividends included in dividend income, if any, are recorded at the fair market value of the security received. Withholding taxes on foreign dividends received by the Fund, if any, have been recorded in accordance with the Trust’s understanding of the applicable country’s rules and tax rates.
Distributions to shareholders — Dividends arising from net investment income, if any, are declared and paid quarterly to shareholders of the Fund. Net realized short-term capital gains, if any, may be distributed throughout the year and net realized long-term capital gains, if any, are
| THE JAMESTOWN EQUITY FUND |
| NOTES TO FINANCIAL STATEMENTS (Continued) |
distributed at least once each year. The amount of distributions from net investment income and net realized capital gains are determined in accordance with federal income tax regulations, which may differ from GAAP. Dividends and distributions are recorded on the ex-dividend date.
The tax character of distributions paid during the periods ended September 30, 2023 and March 31, 2023 were as follows:
| Periods | | Ordinary | | | Long-Term | | | Total | |
| Ended | | Income | | | Capital Gains | | | Distributions* | |
| 9/30/2023 | | $ | 233,583 | | | $ | 1,044,692 | | | $ | 1,278,275 | |
| 3/31/2023 | | $ | 508,007 | | | $ | 5,280,591 | | | $ | 5,788,598 | |
| * | Total Distributions may not tie to the amounts listed on the Statements of Changes in Net Assets due to reclassifications of the character of the distributions as a result of permanent differences between financial statements and income tax reporting and/or distributions payable amounts. |
Investment transactions — Investment transactions are accounted for on trade date for financial reporting purposes. Realized gains and losses on investment securities sold are determined on a specific identification basis.
Common expenses — Common expenses of the Trust are allocated among the series of the Trust based on relative net assets of each series or the nature of the services performed and the relative applicability to each series.
Estimates — The preparation of financial statements in conformity with GAAP requires management to make estimates and assumptions that affect the reported amounts of assets and liabilities and the disclosure of contingent assets and liabilities, each as of the date of the financial statements, and the reported amounts of increase (decrease) in net assets from operations during the reporting period. Actual results could differ from those estimates.
Federal income tax — The Fund has qualified and intends to continue to qualify as a regulated investment company under the Internal Revenue Code of 1986, as amended (the “Code”). Qualification generally will relieve the Fund of liability for federal income taxes to the extent 100% of its net investment income and net realized capital gains are distributed in accordance with the Code.
In order to avoid imposition of the excise tax applicable to regulated investment companies, it is also the Fund’s intention to declare as dividends in each calendar year at least 98% of its net investment income (earned during the calendar year) and 98.2% of its net realized capital gains (earned during the twelve months ended October 31) plus undistributed amounts from prior years.
| THE JAMESTOWN EQUITY FUND |
| NOTES TO FINANCIAL STATEMENTS (Continued) |
The tax character of accumulated earnings at September 30, 2023 were as follows:
| Tax cost of investments | | $ | 21,033,483 | |
| Gross unrealized appreciation | | $ | 23,929,894 | |
| Gross unrealized depreciation | | | (262,496 | ) |
| Net unrealized appreciation | | | 23,667,398 | |
| Accumulated ordinary income | | | 522 | |
| Other gains | | | 265,428 | |
| Distributions payable | | | (2,197 | ) |
| Accumulated earnings | | $ | 23,931,151 | |
| | | | | |
The difference between the federal income tax cost of investments and the financial statement cost of investments for the Fund is due to certain timing differences in the recognition of capital gains or losses under income tax regulations and GAAP. These “book/tax” differences are temporary in nature and are primarily due to the tax deferral of losses on wash sales.
The Fund recognizes the tax benefits or expenses of uncertain tax positions only when the position is “more likely than not” to be sustained assuming examination by tax authorities. Management has reviewed the tax positions taken on Federal income tax returns for the current and all open tax years (generally three years) of the Fund and has concluded that no provision for unrecognized tax benefits or expenses is required in these financial statements.
The Fund recognizes interest and penalties, if any, related to unrecognized tax benefits as income tax expense on the Statement of Operations. During the six months ended September 30, 2023, the Fund did not incur any interest or penalties.
3. Investment Transactions
Investment transactions, other than short-term investments and U.S. government securities, were as follows for the six months ended September 30, 2023:
| Purchase of investment securities | | $ | 1,344,147 | |
| Proceeds from sales of investment securities | | $ | 1,019,877 | |
| | | | | |
4. Transactions with Related Parties
INVESTMENT ADVISORY AGREEMENT
The Fund’s investments are managed by the Adviser under the terms of an Investment Advisory Agreement. The Fund pays the Adviser a fee, which is computed and accrued daily and paid monthly, at annual rates of 0.65% of its average daily net assets up to $500 million and 0.55% of such assets in excess of $500 million. Certain officers of the Trust are also officers of the Adviser.
| THE JAMESTOWN EQUITY FUND |
| NOTES TO FINANCIAL STATEMENTS (Continued) |
During the six months ended September 30, 2023, the Adviser voluntarily limited the total annual operating expenses of the Fund to 0.95% of average daily net assets; accordingly, the Adviser voluntarily waived $16,357 of its investment advisory fees during the six months ended September 30, 2023. This amount is not subject to recapture in future periods.
OTHER SERVICE PROVIDERS
Ultimus Fund Solutions, LLC (“Ultimus”) provides administration, fund accounting, compliance and transfer agent services to the Fund. The Fund pays Ultimus fees in accordance with the agreements for such services. In addition, the Fund pays out-of-pocket expenses including, but not limited to, postage, supplies, and certain costs related to the pricing of the Fund’s portfolio securities. Certain officers of the Trust are also officers of Ultimus, or of Ultimus Fund Distributors, LLC (the “Distributor”), the principal underwriter of the Fund and an affiliate of Ultimus. The Distributor is compensated by the Adviser (not the Fund) for acting as principal underwriter.
SHAREHOLDER SERVICING PLAN
The Fund has adopted a Shareholder Servicing Plan (the “Plan”), which allows the Fund to make payments to financial organizations (including payments directly to the Adviser and the distributor) for providing account administration and account maintenance services to Fund shareholders. The annual service fee may not exceed an amount equal to 0.25% of the Fund’s average daily net assets. During the six months ended September 30, 2023, the Fund incurred fees of $2,329 under the Plan.
COMPENSATION OF TRUSTEES
Trustees and officers affiliated with the Adviser or Ultimus are not compensated by the Trust for their services. Each Trustee who is not an affiliated person of the Adviser or Ultimus receives from the Trust an annual retainer of $30,000, payable quarterly; a fee of $2,000 for attendance at each meeting of the Board of Trustees (except that such fee is $3,000 for the independent chair); and a fee of $1,000 for attendance at each meeting of any committee of the Board (except that such fee is $1,500 for the committee chair); plus reimbursement of travel and other expenses incurred in attending meetings. Each series of the Trust pays its proportionate share of such fees.
5. Sector Risk
If a Fund has significant investments in the securities of issuers in industries within a particular business sector, any development affecting that sector will have a greater impact on the value of the net assets of the Fund than would be the case if the Fund did not have significant investments in that sector. In addition, this may increase the risk of loss of an investment in the Fund and increase the volatility of the Fund’s NAV per share. From time to time, circumstances may affect a particular sector and companies within such sector. For instance, economic or market factors, regulation or deregulation, or other developments may negatively impact all companies in a particular sector and therefore the value of a Fund’s portfolio would be adversely affected. As of September 30, 2023, the Fund had 30.6% of the value of its net assets invested in common stocks and ETFs within the Technology sector.
| THE JAMESTOWN EQUITY FUND |
| NOTES TO FINANCIAL STATEMENTS (Continued) |
6. Contingencies and Commitments
The Fund indemnifies the Trust’s officers and Trustees for certain liabilities that might arise from the performance of their duties to the Fund. Additionally, in the normal course of business the Fund enters into contracts that contain a variety of representations and warranties and which provide general indemnifications. The Fund’s maximum exposure under these arrangements is unknown, as this would involve future claims that may be made against the Fund that have not yet occurred. However, based on experience, the Trust expects the risk of loss to be remote.
7. Subsequent Events
The Fund is required to recognize in the financial statements the effects of all subsequent events that provide additional evidence about conditions that existed as of the date of the Statement of Assets and Liabilities. For non-recognized subsequent events that must be disclosed to keep the financial statements from being misleading, the Fund is required to disclose the nature of the event as well as an estimate of its financial effect, or a statement that such an estimate cannot be made. Management has evaluated subsequent events through the issuance of these financial statements and has noted no such events.
| THE JAMESTOWN EQUITY FUND |
| ABOUT YOUR FUND’S EXPENSES (Unaudited) |
We believe it is important for you to understand the impact of costs on your investment. All mutual funds have operating expenses. As a shareholder of the Fund, you incur ongoing costs, including management fees and other expenses. The following examples are intended to help you understand your ongoing costs (in dollars) of investing in the Fund and to compare these costs with the ongoing costs of investing in other mutual funds.
A mutual fund’s ongoing costs are expressed as a percentage of its average net assets. This figure is known as the expense ratio. The expenses in the table below are based on an investment of $1,000 made at the beginning of the period shown and held for the entire period (April 1, 2023 through September 30, 2023).
The table below illustrates the Fund’s costs in two ways:
Actual fund return — This section helps you to estimate the actual expenses that you paid over the period. The “Ending Account Value” shown is derived from the Fund’s actual return, and the fourth column shows the dollar amount of operating expenses that would have been paid by an investor who started with $1,000 in the Fund. You may use the information here, together with the amount you invested, to estimate the expenses that you paid over the period.
To do so, simply divide your account value by $1,000 (for example, an $8,600 account value divided by $1,000 = 8.6), then multiply the result by the number given for the Fund under the heading “Expenses Paid During Period.”
Hypothetical 5% return — This section is intended to help you compare the Fund’s ongoing costs with those of other mutual funds. It assumes that the Fund had an annual return of 5% before expenses during the period shown, but that the expense ratio is unchanged. In this case, because the returns used are not the Fund’s actual returns, the results do not apply to your investment. The example is useful in making comparisons because the U.S. Securities and Exchange Commission (the “SEC”) requires all mutual funds to calculate expenses based on a 5% return. You can assess the Fund’s ongoing costs by comparing this hypothetical example with the hypothetical examples that appear in shareholder reports of other funds.
Note that expenses shown in the table are meant to highlight and help you compare ongoing costs only. The Fund does not charge sales loads or redemption fees.
The calculations assume no shares were bought or sold during the period. Your actual costs may have been higher or lower, depending on the amount of your investment and the timing of any purchases or redemptions.
More information about the Fund’s expenses, including annual expense ratios for the prior five fiscal years, can be found in this report. For additional information on operating expenses and other shareholder costs, please refer to the Fund’s prospectus.
| THE JAMESTOWN EQUITY FUND |
| ABOUT YOUR FUND’S EXPENSES (Unaudited) (Continued) |
| | | | | | Ending | | | | | | | |
| | | Beginning | | | Account Value | | | Net | | | Expenses | |
| | | Account Value | | | September 30, | | | Expense | | | Paid During | |
| | | April 1, 2023 | | | 2023 | | | Ratio(a) | | | Period(b) | |
| Based on Actual Fund Return | | $ | 1,000.00 | | | $ | 1,060.50 | | | | 0.95 | % | | $ | 4.91 | |
| Based on Hypothetical 5% Return (before expenses) | | $ | 1,000.00 | | | $ | 1,020.31 | | | | 0.95 | % | | $ | 4.81 | |
| (a) | Annualized, based on the Fund’s most recent one-half year expenses. |
| (b) | Expenses are equal to the Fund’s annualized net expense ratio multiplied by the average account value over the period, multiplied by 183/365 (to reflect the one-half year period). |
| OTHER INFORMATION (Unaudited) |
A description of the policies and procedures that the Fund uses to vote proxies relating to portfolio securities is available without charge upon request by calling toll-free 1-866-738-1126, or on the SEC’s website at www.sec.gov. Information regarding how the Fund voted proxies relating to portfolio securities during the most recent 12-month period ended June 30 is also available without charge upon request by calling toll-free 1-866-738-1126, or on the SEC’s website at www.sec.gov.
The Trust files a complete listing of portfolio holdings of the Fund with the SEC as of the end of the first and third quarters of each fiscal year as an exhibit to its reports on Form N-PORT. The filings are available upon request, by calling 1-866-738-1126. Furthermore, you may obtain a copy of these filings on the SEC’s website at www.sec.gov and on the Fund’s website www.jamestownfunds.com.
| THE JAMESTOWN EQUITY FUND |
| LIQUIDITY RISK MANAGEMENT PROGRAM (Unaudited) |
The Fund has adopted and implemented a written liquidity risk management program as required by Rule 22e-4 (the “Liquidity Rule”) under the Investment Company Act. The program is reasonably designed to assess and manage the Fund’s liquidity risk, taking into consideration, among other factors, the Fund’s investment strategy and the liquidity of its portfolio investments during normal and reasonably foreseeable stressed conditions; its short and long-term cash flow projections; and its cash holdings and access to other funding sources. The Fund’s Board of Trustees approved the appointment of a Liquidity Risk Committee, which includes representatives from Leavell Investment Management, Inc., the Fund’s investment adviser, and Ultimus Fund Solutions, LLC, the Funds’ Administrator. The Liquidity Risk Committee is responsible for the program’s administration and oversight and for reporting to the Board on at least an annual basis regarding the program’s operation and effectiveness. The Liquidity Risk Committee updated its assessment of the Fund’s liquidity risk profile, considering additional data gathered in the 12 months ended May 31, 2023 and the adequacy and effectiveness of the liquidity risk management program’s operations from June 1, 2022 through May 31, 2023 (the “Review Period”) in order to prepare a written report for the Board of Trustees (the “Report”) for consideration at its meeting held on August 15, 2023. During the Review Period, the Fund did not experience unusual stress or disruption to its operations related to purchase and redemption activity. Also, during the Review Period the Fund held adequate levels of cash and highly liquid investments to meet shareholder redemption activities in accordance with applicable requirements. The Report concluded that (i) the Fund’s liquidity risk management program is reasonably designed to prevent violations of the Liquidity Rule and (ii) the Fund’s liquidity risk management program has been effectively implemented.
This page intentionally left blank.
| | | | | | |
| | | | | | |
| | | | | | |
| | | | | | |
| | | | | | |
| | | | | | |
| | | | THE JAMESTOWN EQUITY FUND
www.jamestownfunds.com | | |
| | | | | | |
| | | | Investment Adviser | | |
| | | | | | |
| | | | Lowe, Brockenbrough & Company, Inc. | | |
| | | | d/b/a Brockenbrough | | |
| | | | 1802 Bayberry Court | | |
| | | | Suite 400 | | |
| | | | Richmond, Virginia 23226 | | |
| | | | | | |
| | | | Administrator | | |
| | | | Ultimus Fund Solutions, LLC | | |
| | | | P.O. Box 46707 | | |
| | | | Cincinnati, Ohio 45246-0707 | | |
| | | | (Toll-Free) 1-866-738-1126 | | |
| | | | | | |
| | | | Independent Registered | | |
| | | | Public Accounting Firm | | |
| | | | Cohen & Company, Ltd. | | |
| | | | 342 N. Water Street | | |
| | | | Suite 830 | | |
| | | | Milwaukee, Wisconsin 53202 | | |
| | | | | | |
| | | | Legal Counsel | | |
| | | | Sullivan & Worcester LLP | | |
| | | | 1666 K Street, N.W. | | |
| | | | Washington, DC 20006 | | |
| | | | | | |
| | | | Board of Trustees | | |
| | | | John P. Ackerly, IV | | |
| | | | George K. Jennison | | |
| | | | Robert S. Harris, Ph.D. | | |
| | | | Harris V. Morrissette | | |
| | | | Elizabeth W. Robertson | | |
| | | | | | |
| | | | | | |
| | | | | | |
| | | | | | |
| | | | | | |
| | | | | | |
| | | | | | |
| | | | | | |
| | | | | | |
| | | | Jamestown-SAR-23 | | |
| | | | | | |
| | | | | | |
| | | | | | |
| | | | | | |
| |
| |
| |
| |
| |
| |
| |
| THE |
| GOVERNMENT STREET |
| FUNDS |
| |
| |
| No-Load Mutual Funds |
| |
| Semi-Annual Report |
| September 30, 2023 |
| (Unaudited) |
| |
| |
| |
| |
| |
| |
| |
| |
| |
| |
| |
| |
 |
| |
| |
| |
| |
| |
| |
| |
| |
| |
| |
| |
| |
The Government Street Equity Fund
The Government Street Opportunities Fund |
| |
| |
| LETTER FROM THE PRESIDENT | October 15, 2023 |
Dear Fellow Shareholders:
We are enclosing for your review the Semi-Annual Report of The Government Street Funds for the six months ended September 30, 2023.
The Government Street Equity Fund
The Government Street Equity Fund (the “Fund”) had a 3.39% total return for the six months ended September 30, 2023. By comparison, the S&P 500® Index and the Morningstar Large Blend category returned 5.18% and 3.72%, respectively.
| | Government | S&P 500® | Morningstar |
| | Street Equity | Index | Large Blend |
| 3 Qtr 2023 | -3.43% | -3.27% | -3.21% |
| 2 Qtr 2023 | 7.06% | 8.74% | 7.16% |
| 1 Qtr 2023 | 5.72% | 7.50% | 5.81% |
| 4 Qtr 2022 | 8.73% | 7.56% | 8.33% |
| One Year Ended 9/30/23 | 18.84% | 21.62% | 18.89% |
As can be seen in the chart above, the Fund and the other representative measures of large-capitalization securities experienced modest positive returns for the semi-annual period covered by this report.
The six months ended September 30, the focus of this letter, was dominated by a relative small number of large capitalization growth companies. Depending on whether we incorporated seven or ten companies to calculate the impact, those few companies accounted for 60% to 80% of the positive market return as measured by the S&P 500® Index. The remaining stocks in the aggregate turned in modest or even negative returns.
The third quarter turned in negative results as many stocks capitulated to increasing interest rates resulting from high levels of inflation. Almost all stocks in our universe experienced mild to moderate declines. The Energy Sector of your Fund was up 10.6%, but the decline in the balance of the portfolio resulted in a total decline of -3.43% during the quarter.
Major Fund purchases for the semi-annual period were Berkshire Hathaway “B” (Finance), Meta Platforms (Communication) and Tesla Motors (Consumer Discretion).
Major Fund sales for the semi-annual period were Lowes (Consumer Discretion), Lockheed Martin (Industrial) and Devon Energy (Energy).
The transactions, in total, were allocated along the investment sectors of the Fund with the S&P 500® sectors as guidelines. While your Fund is not invested with a pseudo index approach, the sectors provide an objective comparison for the diversification we believe important for the control of relative risk in your portfolio. Overall, we depend on our own conclusions as to the ultimate security selection and position weightings. Additionally, as a defensive measure, short term money market average reserve of approximately 5% was maintained within the Fund during the six months.
The top 10 holdings in The Government Street Equity Fund as of September 30, 2023 were:
| Security Description | % of Net Assets |
| NVIDIA Corporation | 8.90% |
| JPMorgan Chase & Company | 4.13% |
| Microsoft Corporation | 3.92% |
| Apple, Inc. | 3.50% |
| Alphabet, Inc. Class A & C | 3.47% |
| Bio-Techne Corporation | 2.59% |
| AbbVie, Inc. | 2.51% |
| Lockheed Martin Corporation | 2.39% |
| Honeywell International Corporation | 2.30% |
| Blackstone Group, Inc. | 2.27% |
There were significant individual performances during the six months ended September 30, 2023. The five highest returns, held for the entire six months, as measured by the time weighted rate of return were:
| | 6 Month |
| Security Description | Performance |
| NVIDIA Corporation | 56.63% |
| Tesla Motors, Inc. | 46.58% |
| Meta Platforms, Inc. | 27.73% |
| Alphabet, Inc. Class C | 26.78% |
| Alphabet, Inc. Class A | 25.90% |
The five worst individual performances, held for the six months ended September 30, 2023, as measured by time weighted rate of return for the entire six months were:
| | 6 Month |
| Security Description | Performance |
| GE Healthcare Technologies Company | -16.89% |
| Nike, Inc. Class B | -21.43% |
| Albemarle Corporation | -22.75% |
| Raytheon Technologies Company | -25.55% |
| General Mills, Inc. | -28.24% |
The Fund’s best performing economic sector for the six months was Communication Services, up 28.3%. The worst performing sector was Real Estate, down -13.2%.
Note: The investment performances listed for economic sectors and securities in the two preceding paragraphs are extracted from an in-house independent time weighted rates of return computation by the Addepar portfolio accounting system. The calculations are gross investment returns. Total investment returns are for the twelve months ended September 30, 2023.
The first two paragraphs of the following commentary are modified restatements of previous letters. The current situation is really just an extension of the same cumulative errors of the recent past.
Our past commentaries, for several periods, have focused on the growing Governmental debt burden brought about by what we consider to be irresponsible political spending programs. The upward spiral of the borrowed funds has been accelerated by the unanticipated new factor in the form of the COVID-19 pandemic. While unarguably necessary to offset the dire consequences of many total business shutdowns, the actions of our Congress have raised the debt burden to an excess of $33 trillion, with promise of more to come. The result of the increase has led to the United States, without doubt, solidifying its position currently as the largest debtor nation in the world.
Shortly after the September 30, 2023 close of the period covered by this report, the debt of the United States passed $33 trillion. Along with the interest rate increases, the Federal Reserve was beginning to implement the reduction of their $6 trillion balance sheet accumulation of corporate debt and mortgages. There is little doubt that the Governmental spending of the last decade resulted in the United States becoming the largest debtor nation in the world, producing 8%+ inflation and significant increases in interest rates. While the economic malaise caused by the two Ps, Pandemic and Putin, can be blamed for much, the third P, Politicians, bear an even larger responsibility. Apparently, spending or in many cases giving funds away, has never been more attractive inside the Beltway.
It will take an extended period to reduce the Government-induced excesses out of the system. During the coming periods there will be pockets of success, but volatility and modest gains will be the likely prospect. The Country and capitalism will survive, but it will occur in an environment of uncertainty and hardship for many.
Unfortunately, as we enter a new fiscal year, there are new additional problems for stocks. While, as noted, the past politically induced inflation and interest increases continue, we now have broad application of employee strikes, broader wars, threats of additional war and increasing political dysfunction. The Nation’s almost total political party polarization, growing international financial and military threats, and increasing consumer credit defaults are all contributing to the perception of rising risks in equity markets.
The final consideration can be classified as a positive for investors following the litany of problems listed. Interest rates on money market securities and bonds, in general, now offer a viable alternative to stocks. There is little doubt that the heavy allocation to stocks, for the last decade, will be mitigated by moves to fixed income securities.
The old Dylan song of the sixties, “The Times They Are A-Changin’” can be brought back. History, although there are some differences, does repeat itself.
While we truly hope for a positive development for our fundamental investment future, we continue to focus significant efforts to address the mitigation of risks in the portfolio. As in the past, we continue to broadly diversify the Fund. Your fund currently holds 82 common stocks. Cash equivalent positions are approximately 5% of the total Fund value. The companies invested in your Fund were represented in all of the Global Industry Classification Standard (GICS) sectors.
As of September 30, 2023, the Fund’s net assets were $68.4 million; net asset value per share was $93.00; and the annualized ratio of expenses to net average assets was 0.87%. Portfolio turnover rate was 14% (not annualized). Income dividends of $0.5013 per share and capital gains of $2.0488 per share were distributed to shareholders during the six months ended September 30, 2023.
The Government Street Opportunities Fund
The Government Street Opportunities Fund (the “Fund”), for the six months ended September 30, 2023, produced a total return of 2.18%. By comparison, the S&P 400® Index and the Morningstar Mid Cap Blended Index, used as relative performance benchmarks, produced returns of 0.45% and 0.52%, respectively.
| | Government | | |
| | Street | S&P 400® | Morningstar |
| | Opportunities | Index | Mid Cap Blend |
| 3 Qtr 2023 | -3.98% | -4.20% | -3.90% |
| 2 Qtr 2023 | 6.42% | 4.85% | 4.60% |
| 1 Qtr 2023 | 4.19% | 3.81% | 3.41% |
| 4 Qtr 2022 | 7.93% | 10.78% | 4.67% |
| One Year Ended 9/30/23 | 14.91% | 15.51% | 14.00% |
The mid-capitalization category of individual companies is usually represented by the SPDR S&P Mid Cap 400 ETF Trust, currently ranging from approximately $1.20 billion to $17.65 billion (based on 8/31/2023 Morningstar data) market values. Generally, these companies are considered to have slightly higher risk and return characteristics than the S&P 500 companies, which start at the upper end of the mid-cap values and range in sizes 10 times or greater in terms of capitalization. As you would guess, the mid-cap companies tend to be primarily domestically oriented.
The top 10 holdings in The Government Street Opportunities Fund as of September 30, 2023 were:
| Security Description | % of Net Assets |
| NVIDIA Corporation | 7.11% |
| Celsius Holdings, Inc. | 3.37% |
| Mid-America Apartment Communities, Inc. | 3.16% |
| Gallahger Arthur J & Company | 2.98% |
| Steel Dynamics Corporation | 2.46% |
| Waste Connections, Inc. | 2.31% |
| Brown & Brown, Inc. | 2.28% |
| Vanguard Mid-Cap Value ETF | 2.25% |
| Chemed Corporation | 2.12% |
| Martin Marietta Materials, Inc. | 2.01% |
There were significant individual performances during the six months ended September 30, 2023. The five highest returns, held for the entire six months, as measured by the time weighted rate of return, were:
| | 6 Month |
| Security Description | Performance |
| Martin Marietta Materials, Inc. | 84.64% |
| ResMed, Inc. | 56.63% |
| L3harris Technologies, Inc. | 50.32% |
| CME Group, Inc. | 34.93% |
| Valvoline, Inc. | 28.46% |
The five worst individual performances, held for the entire six months, as measured by time weighted rate of return, were:
| | 6 Month |
| Security Description | Performance |
| Microchip Technology, Inc. | -25.17% |
| Fortrea Holdings, Inc. | -25.36% |
| Waters Corporation | -32.10% |
| nVent Electric plc | -42.86% |
| Graco, Inc. | -54.94% |
The Fund’s best performing economic sector for the 6 months was Consumer Staples, up 3.4%. The second-best sector was Energy, down -6.6%. The worst performing sector was Health Care, down -25.9%.
Note: The investment performances listed for economic sectors and securities in the two preceding paragraphs are extracted from an in-house independent time weighted rates of return computation by the Addepar portfolio accounting system. The calculations are gross investment returns. Total investment returns are for the year ended September 30, 2023.
We believe that mid-cap stocks offer an attractive combination of growth and safety as they have successfully overcome startup challenges yet remain nimble enough to generate stronger growth than large cap stocks. Mid-cap stocks have been able to match the performance of large cap stocks in down markets while exceeding large cap performance in up markets, leading to long-term outperformance.
The strategy to manage risks in the Fund is primarily thru diversification over the eleven economic sectors. The securities which comprise the Fund are represented in each of those sectors according to their perceived investment prospects. Finally, in periods of expected volatility, the Fund will hold higher than normal cash equivalent positions. On September 30, 2023, the cash equivalent position was 4.9%. In all cases, the intent is to manage portfolio’s volatility, which should result in greater compounded returns over time.
It may be interesting for the readers to compare and contrast the Global Industry Classification Standard (GICS) sectors between the larger capitalization SPDR S&P 500 ETF Trust and the lower capitalization SPDR S&P Mid Cap 400 ETF. The approximate weights based on component’s capitalizations change daily but are reasonably stable over short periods. As of September 30, 2023, they are:
| GICS | S&P 500® (proxy) | S&P 400® (proxy) |
| Energy | 4.60% | 6.62% |
| Materials | 2.15% | 5.29% |
| Industrials | 8.14% | 19.98% |
| Consumer Discretionary | 10.63% | 15.59% |
| Consumer Staples | 6.48% | 4.45% |
| Health Care | 13.34% | 8.67% |
| Financials | 12.11% | 13.84% |
| Information Technology | 28.64% | 12.87% |
| Telecommunication Services | 9.17% | 1.53% |
| Utilities | 2.44% | 3.25% |
| Real Estate | 2.31% | 7.91% |
The Government Street Opportunities Fund uses the SPDR S&P Mid Cap 400 ETF sector weights for guidance in its diversification of investment holdings.
As of September 30, 2023, the net assets of the Government Street Opportunities Fund were $61.1 million, and the net asset value per share was $36.39. The turnover rate for the six months was 3% and the total number of holdings was 90 as of September 30, 2023. The net annualized expense ratio for the Fund was 1.04%. Income dividends of $0.0668 per share and capital gains of $0.3863 per share were distributed to shareholders during the six months ended September 30, 2023.
Thank you for your continued confidence in The Government Street Funds. Please call us if we can be of further service to you.
Very truly yours,
Thomas W. Leavell
President
Leavell Investment Management, Inc.
The Government Street Funds
| THE GOVERNMENT STREET EQUITY FUND |
| PORTFOLIO INFORMATION |
| September 30, 2023 (Unaudited) |
Asset Allocation
(% of Net Assets)
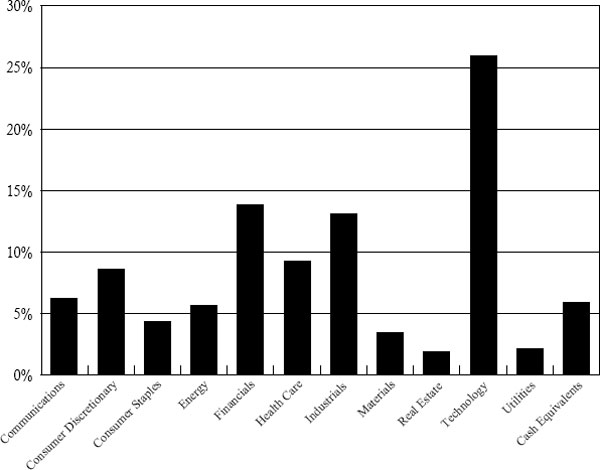
Top 10 Equity Holdings
| Security Description | % of Net Assets |
| NVIDIA Corporation | 8.9% |
| JPMorgan Chase & Company | 4.1% |
| Microsoft Corporation | 3.9% |
| Apple, Inc. | 3.5% |
| Alphabet, Inc. - Class A and C | 3.5% |
| Bio-Techne Corporation | 2.6% |
| AbbVie, Inc. | 2.5% |
| Lockheed Martin Corporation | 2.4% |
| Honeywell International, Inc. | 2.3% |
| Blackstone, Inc. | 2.3% |
| THE GOVERNMENT STREET OPPORTUNITIES FUND |
| PORTFOLIO INFORMATION |
| September 30, 2023 (Unaudited) |
Asset Allocation
(% of Net Assets)
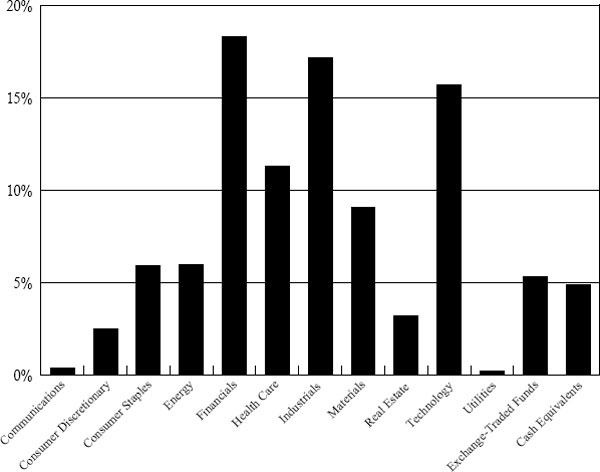
Top 10 Equity Holdings
| Security Description | % of Net Assets |
| NVIDIA Corporation | 7.1% |
| Celsius Holdings, Inc. | 3.4% |
| Mid-America Apartment Communities, Inc. | 3.2% |
| Arthur J. Gallagher & Company | 3.0% |
| Steel Dynamics, Inc. | 2.5% |
| Waste Connections, Inc. | 2.3% |
| Brown & Brown, Inc. | 2.3% |
| Vanguard Mid-Cap Value ETF | 2.2% |
| Chemed Corporation | 2.1% |
| Martin Marietta Materials, Inc. | 2.0% |
| THE GOVERNMENT STREET EQUITY FUND |
| SCHEDULE OF INVESTMENTS |
| September 30, 2023 (Unaudited) |
| COMMON STOCKS — 94.1% | | Shares | | | Value | |
| Communications — 6.2% | | | | | | | | |
| Alphabet, Inc. - Class A (a) | | | 4,700 | | | $ | 615,042 | |
| Alphabet, Inc. - Class C (a) | | | 13,340 | | | | 1,758,879 | |
| Booking Holdings, Inc. (a) | | | 250 | | | | 770,988 | |
| Meta Platforms, Inc. - Class A (a) | | | 3,200 | | | | 960,672 | |
| Uber Technologies, Inc. (a) | | | 3,000 | | | | 137,970 | |
| | | | | | | | 4,243,551 | |
| Consumer Discretionary — 8.6% | | | | | | | | |
| Amazon.com, Inc. (a) | | | 9,500 | | | | 1,207,640 | |
| Home Depot, Inc. (The) | | | 3,500 | | | | 1,057,560 | |
| Lowe’s Companies, Inc. | | | 3,000 | | | | 623,520 | |
| McDonald’s Corporation | | | 5,000 | | | | 1,317,200 | |
| NIKE, Inc. - Class B | | | 3,000 | | | | 286,860 | |
| NVR, Inc. (a) | | | 40 | | | | 238,532 | |
| Tesla, Inc. (a) | | | 3,000 | | | | 750,660 | |
| Tractor Supply Company | | | 2,000 | | | | 406,100 | |
| | | | | | | | 5,888,072 | |
| Consumer Staples — 4.3% | | | | | | | | |
| Coca-Cola Company (The) | | | 3,500 | | | | 195,930 | |
| Colgate-Palmolive Company | | | 2,500 | | | | 177,775 | |
| General Mills, Inc. | | | 2,000 | | | | 127,980 | |
| Kroger Company (The) | | | 10,000 | | | | 447,500 | |
| Procter & Gamble Company (The) | | | 4,000 | | | | 583,440 | |
| Walmart, Inc. | | | 9,000 | | | | 1,439,370 | |
| | | | | | | | 2,971,995 | |
| Energy — 5.6% | | | | | | | | |
| Cheniere Energy, Inc. | | | 6,000 | | | | 995,760 | |
| Chevron Corporation | | | 3,500 | | | | 590,170 | |
| Devon Energy Corporation | | | 8,000 | | | | 381,600 | |
| Marathon Petroleum Corporation | | | 2,600 | | | | 393,484 | |
| ONEOK, Inc. | | | 7,000 | | | | 444,010 | |
| Phillips 66 | | | 5,000 | | | | 600,750 | |
| Shell plc - ADR | | | 6,600 | | | | 424,908 | |
| | | | | | | | 3,830,682 | |
| Financials — 13.8% | | | | | | | | |
| Aflac, Inc. | | | 14,000 | | | | 1,074,500 | |
| Arch Capital Group Ltd. (a) | | | 2,500 | | | | 199,275 | |
| Ares Management Corporation - Class A | | | 5,500 | | | | 565,785 | |
| Berkshire Hathaway, Inc. - Class B (a) | | | 1,500 | | | | 525,450 | |
| Blackstone, Inc. | | | 14,500 | | | | 1,553,530 | |
| Brookfield Corporation | | | 28,000 | | | | 875,560 | |
| Charles Schwab Corporation (The) | | | 9,000 | | | | 494,100 | |
| CME Group, Inc. | | | 3,500 | | | | 700,770 | |
| Intercontinental Exchange, Inc. | | | 1,500 | | | | 165,030 | |
| THE GOVERNMENT STREET EQUITY FUND |
| SCHEDULE OF INVESTMENTS (Continued) |
| COMMON STOCKS — 94.1% (Continued) | | Shares | | | Value | |
| Financials — 13.8% (Continued) | | | | | | | | |
| JPMorgan Chase & Company | | | 19,500 | | | $ | 2,827,890 | |
| Marsh & McLennan Companies, Inc. | | | 2,500 | | | | 475,750 | |
| | | | | | | | 9,457,640 | |
| Health Care — 9.2% | | | | | | | | |
| Abbott Laboratories | | | 9,500 | | | | 920,075 | |
| AbbVie, Inc. | | | 11,500 | | | | 1,714,190 | |
| Bio-Techne Corporation | | | 26,000 | | | | 1,769,820 | |
| CRISPR Therapeutics AG (a) | | | 4,000 | | | | 181,560 | |
| Edwards Lifesciences Corporation (a) | | | 4,800 | | | | 332,544 | |
| GE HealthCare Technologies, Inc. | | | 5,000 | | | | 340,200 | |
| Thermo Fisher Scientific, Inc. | | | 900 | | | | 455,553 | |
| UnitedHealth Group, Inc. | | | 1,100 | | | | 554,609 | |
| | | | | | | | 6,268,551 | |
| Industrials — 13.1% | | | | | | | | |
| Caterpillar, Inc. | | | 1,250 | | | | 341,250 | |
| Deere & Company | | | 500 | | | | 188,690 | |
| Eaton Corporation plc | | | 1,000 | | | | 213,280 | |
| Emerson Electric Company | | | 4,500 | | | | 434,565 | |
| General Dynamics Corporation | | | 3,700 | | | | 817,589 | |
| Honeywell International, Inc. | | | 8,500 | | | | 1,570,290 | |
| Lockheed Martin Corporation | | | 4,000 | | | | 1,635,840 | |
| Parker-Hannifin Corporation | | | 1,300 | | | | 506,376 | |
| Quanta Services, Inc. | | | 4,400 | | | | 823,108 | |
| Rockwell Automation, Inc. | | | 1,100 | | | | 314,457 | |
| RTX Corporation | | | 13,500 | | | | 971,595 | |
| TE Connectivity Ltd. | | | 9,000 | | | | 1,111,770 | |
| | | | | | | | 8,928,810 | |
| Materials — 3.4% | | | | | | | | |
| Albemarle Corporation | | | 4,200 | | | | 714,168 | |
| Corteva, Inc. | | | 4,000 | | | | 204,640 | |
| Freeport-McMoRan, Inc. | | | 25,000 | | | | 932,250 | |
| Linde plc | | | 800 | | | | 297,880 | |
| Nucor Corporation | | | 1,000 | | | | 156,350 | |
| | | | | | | | 2,305,288 | |
| Real Estate — 1.9% | | | | | | | | |
| Mid-America Apartment Communities, Inc. | | | 10,000 | | | | 1,286,500 | |
| | | | | | | | | |
| Technology — 25.9% | | | | | | | | |
| Accenture plc - Class A | | | 4,000 | | | | 1,228,440 | |
| Adobe, Inc. (a) | | | 500 | | | | 254,950 | |
| Apple, Inc. | | | 14,000 | | | | 2,396,940 | |
| ASML Holding N.V. | | | 450 | | | | 264,897 | |
| Mastercard, Inc. - Class A | | | 2,000 | | | | 791,820 | |
| Microsoft Corporation | | | 8,500 | | | | 2,683,875 | |
| THE GOVERNMENT STREET EQUITY FUND |
| SCHEDULE OF INVESTMENTS (Continued) |
| COMMON STOCKS — 94.1% (Continued) | | Shares | | | Value | |
| Technology — 25.9% (Continued) | | | | | | | | |
| NVIDIA Corporation | | | 14,000 | | | $ | 6,089,860 | |
| ON Semiconductor Corporation (a) | | | 4,500 | | | | 418,275 | |
| Oracle Corporation | | | 2,000 | | | | 211,840 | |
| Palantir Technologies, Inc. - Class A (a) | | | 5,000 | | | | 80,000 | |
| Palo Alto Networks, Inc. (a) | | | 500 | | | | 117,220 | |
| QUALCOMM, Inc. | | | 3,000 | | | | 333,180 | |
| Skyworks Solutions, Inc. | | | 8,000 | | | | 788,720 | |
| Texas Instruments, Inc. | | | 5,700 | | | | 906,357 | |
| Visa, Inc. - Class A | | | 5,000 | | | | 1,150,050 | |
| | | | | | | | 17,716,424 | |
| Utilities — 2.1% | | | | | | | | |
| Southern Company (The) | | | 5,500 | | | | 355,960 | |
| WEC Energy Group, Inc. | | | 13,000 | | | | 1,047,150 | |
| | | | | | | | 1,403,110 | |
| | | | | | | | | |
| Total Common Stocks (Cost $29,233,886) | | | | | | $ | 64,300,623 | |
| | | | | | | | | |
| MONEY MARKET FUNDS — 5.6% | | Shares | | | Value | |
| Fidelity Institutional Money Market Government Portfolio - Class I, 5.23% (b) (Cost $3,853,744) | | | 3,853,744 | | | $ | 3,853,744 | |
| | | | | | | | | |
| Total Investments at Value — 99.7% | | | | | | | | |
| (Cost $33,087,630) | | | | | | $ | 68,154,367 | |
| | | | | | | | | |
| Other Assets in Excess of Liabilities — 0.3% | | | | | | | 222,662 | |
| | | | | | | | | |
| Net Assets — 100.0% | | | | | | $ | 68,377,029 | |
ADR - American Depositary Receipt.
| (a) | Non-income producing security. |
| (b) | The rate shown is the 7-day effective yield as of September 30, 2023. |
See accompanying notes to financial statements.
| THE GOVERNMENT STREET OPPORTUNITIES FUND |
| SCHEDULE OF INVESTMENTS |
| September 30, 2023 (Unaudited) |
| COMMON STOCKS — 89.8% | | Shares | | | Value | |
| Communications — 0.4% | | | | | | | | |
| Fox Corporation - Class A | | | 4,000 | | | $ | 124,800 | |
| Sinclair, Inc. | | | 8,000 | | | | 89,760 | |
| | | | | | | | 214,560 | |
| Consumer Discretionary — 2.5% | | | | | | | | |
| Dick’s Sporting Goods, Inc. | | | 1,500 | | | | 162,870 | |
| Gildan Activewear, Inc. | | | 10,000 | | | | 280,100 | |
| Hasbro, Inc. | | | 3,000 | | | | 198,420 | |
| Service Corporation International | | | 13,000 | | | | 742,820 | |
| Toll Brothers, Inc. | | | 2,000 | | | | 147,920 | |
| | | | | | | | 1,532,130 | |
| Consumer Staples — 5.9% | | | | | | | | |
| Bunge Ltd. | | | 3,500 | | | | 378,875 | |
| Celsius Holdings, Inc. (a) | | | 12,000 | | | | 2,059,200 | |
| Church & Dwight Company, Inc. | | | 9,000 | | | | 824,670 | |
| Molson Coors Beverage Company - Class B | | | 5,800 | | | | 368,822 | |
| | | | | | | | 3,631,567 | |
| Energy — 6.0% | | | | | | | | |
| APA Corporation | | | 9,000 | | | | 369,900 | |
| Denbury, Inc. (a) | | | 1,500 | | | | 147,015 | |
| Devon Energy Corporation | | | 10,000 | | | | 477,000 | |
| Enphase Energy, Inc. (a) | | | 6,000 | | | | 720,900 | |
| Marathon Oil Corporation | | | 21,000 | | | | 561,750 | |
| Northern Oil and Gas, Inc. | | | 10,000 | | | | 402,300 | |
| ONEOK, Inc. | | | 3,500 | | | | 222,005 | |
| Par Pacific Holdings, Inc. (a) | | | 1,000 | | | | 35,940 | |
| PBF Energy, Inc. - Class A | | | 9,500 | | | | 508,535 | |
| Targa Resources Corporation | | | 1,750 | | | | 150,010 | |
| Vertex Energy, Inc. (a) | | | 20,000 | | | | 89,000 | |
| | | | | | | | 3,684,355 | |
| Financials — 18.3% | | | | | | | | |
| American Financial Group, Inc. | | | 8,600 | | | | 960,362 | |
| Ares Management Corporation - Class A | | | 7,000 | | | | 720,090 | |
| Arthur J. Gallagher & Company | | | 8,000 | | | | 1,823,440 | |
| B. Riley Financial, Inc. | | | 6,000 | | | | 245,940 | |
| Banco Bilbao Vizcaya Argentaria S.A. - ADR | | | 3,000 | | | | 24,150 | |
| Berkley (W.R.) Corporation | | | 16,762 | | | | 1,064,219 | |
| Brown & Brown, Inc. | | | 20,000 | | | | 1,396,800 | |
| CME Group, Inc. | | | 5,000 | | | | 1,001,100 | |
| Intercontinental Exchange, Inc. | | | 9,000 | | | | 990,180 | |
| Morgan Stanley | | | 9,565 | | | | 781,174 | |
| Nasdaq, Inc. | | | 24,000 | | | | 1,166,160 | |
| Old Republic International Corporation | | | 24,400 | | | | 657,336 | |
| THE GOVERNMENT STREET OPPORTUNITIES FUND |
| SCHEDULE OF INVESTMENTS (Continued) |
| COMMON STOCKS — 89.8% (Continued) | | Shares | | | Value | |
| Financials — 18.3% (Continued) | | | | | | | | |
| Voya Financial, Inc. | | | 5,000 | | | $ | 332,250 | |
| | | | | | | | 11,163,201 | |
| Health Care — 11.3% | | | | | | | | |
| Bio-Rad Laboratories, Inc. - Class A (a) | | | 1,500 | | | | 537,675 | |
| Bio-Techne Corporation | | | 16,000 | | | | 1,089,120 | |
| Centene Corporation (a) | | | 4,000 | | | | 275,520 | |
| Charles River Laboratories International, Inc. (a) | | | 4,500 | | | | 881,910 | |
| Chemed Corporation | | | 2,500 | | | | 1,299,250 | |
| Fortrea Holdings, Inc. (a) | | | 2,574 | | | | 73,591 | |
| GE HealthCare Technologies, Inc. | | | 4,000 | | | | 272,160 | |
| Laboratory Corporation of America Holdings | | | 2,574 | | | | 517,503 | |
| Penumbra, Inc. (a) | | | 2,000 | | | | 483,820 | |
| ResMed, Inc. | | | 1,200 | | | | 177,444 | |
| Teleflex, Inc. | | | 3,950 | | | | 775,819 | |
| Waters Corporation (a) | | | 2,000 | | | | 548,420 | |
| | | | | | | | 6,932,232 | |
| Industrials — 17.2% | | | | | | | | |
| C.H. Robinson Worldwide, Inc. | | | 4,000 | | | | 344,520 | |
| Donaldson Company, Inc. | | | 13,000 | | | | 775,320 | |
| Expeditors International of Washington, Inc. | | | 8,000 | | | | 917,040 | |
| Fastenal Company | | | 18,000 | | | | 983,520 | |
| Graco, Inc. | | | 13,000 | | | | 947,440 | |
| Jacobs Solutions, Inc. | | | 8,475 | | | | 1,156,837 | |
| L3Harris Technologies, Inc. | | | 5,250 | | | | 914,130 | |
| MasTec, Inc. (a) | | | 5,700 | | | | 410,229 | |
| MSC Industrial Direct Company, Inc. - Class A | | | 5,000 | | | | 490,750 | |
| National Instruments Corporation | | | 12,000 | | | | 715,440 | |
| nVent Electric plc | | | 4,200 | | | | 222,558 | |
| Pentair plc | | | 3,200 | | | | 207,200 | |
| Snap-on, Inc. | | | 1,475 | | | | 376,214 | |
| Waste Connections, Inc. | | | 10,500 | | | | 1,410,150 | |
| Woodward, Inc. | | | 5,000 | | | | 621,300 | |
| | | | | | | | 10,492,648 | |
| Materials — 9.1% | | | | | | | | |
| Albemarle Corporation | | | 3,700 | | | | 629,148 | |
| Ashland, Inc. | | | 6,000 | | | | 490,080 | |
| ATI, Inc. (a) | | | 2,200 | | | | 90,530 | |
| CF Industries Holdings, Inc. | | | 3,500 | | | | 300,090 | |
| Livent Corporation (a) | | | 6,500 | | | | 119,665 | |
| Martin Marietta Materials, Inc. | | | 3,000 | | | | 1,231,440 | |
| Packaging Corporation of America | | | 6,000 | | | | 921,300 | |
| Steel Dynamics, Inc. | | | 14,000 | | | | 1,501,080 | |
| Valvoline, Inc. | | | 9,236 | | | | 297,769 | |
| | | | | | | | 5,581,102 | |
| THE GOVERNMENT STREET OPPORTUNITIES FUND |
| SCHEDULE OF INVESTMENTS (Continued) |
| COMMON STOCKS — 89.8% (Continued) | | Shares | | | Value | |
| Real Estate — 3.2% | | | | | | | | |
| Mid-America Apartment Communities, Inc. | | | 15,000 | | | $ | 1,929,750 | |
| | | | | | | | | |
| Technology — 15.7% | | | | | | | | |
| Advanced Micro Devices, Inc. (a) | | | 1,964 | | | | 201,938 | |
| Allegro MicroSystems, Inc. (a) | | | 3,500 | | | | 111,790 | |
| Analog Devices, Inc. | | | 3,671 | | | | 642,755 | |
| ANSYS, Inc. (a) | | | 3,000 | | | | 892,650 | |
| Arrow Electronics, Inc. (a) | | | 9,100 | | | | 1,139,684 | |
| Broadridge Financial Solutions, Inc. | | | 3,500 | | | | 626,675 | |
| InterDigital, Inc. | | | 1,000 | | | | 80,240 | |
| Lam Research Corporation | | | 1,075 | | | | 673,778 | |
| Microchip Technology, Inc. | | | 8,800 | | | | 686,840 | |
| NVIDIA Corporation | | | 10,000 | | | | 4,349,900 | |
| Palantir Technologies, Inc. - Class A (a) | | | 5,000 | | | | 80,000 | |
| Rambus, Inc. (a) | | | 1,500 | | | | 83,685 | |
| StoneCo Ltd. – Class A (a) | | | 1,500 | | | | 16,005 | |
| | | | | | | | 9,585,940 | |
| Utilities — 0.2% | | | | | | | | |
| Atmos Energy Corporation | | | 1,150 | | | | 121,819 | |
| | | | | | | | | |
| Total Common Stocks (Cost $18,440,984) | | | | | | $ | 54,869,304 | |
| | | | | | | | | |
| EXCHANGE-TRADED FUNDS — 5.3% | | Shares | | | Value | |
| Invesco S&P MidCap 400 GARP ETF | | | 8,500 | | | $ | 742,141 | |
| SPDR S&P MidCap 400 ETF | | | 2,500 | | | | 1,141,600 | |
| Vanguard Mid-Cap Value ETF | | | 10,500 | | | | 1,375,080 | |
| Total Exchange-Traded Funds (Cost $3,419,751) | | | | | | $ | 3,258,821 | |
| THE GOVERNMENT STREET OPPORTUNITIES FUND |
| SCHEDULE OF INVESTMENTS (Continued) |
| MONEY MARKET FUNDS — 4.9% | | Shares | | | Value | |
| Fidelity Institutional Money Market Government Portfolio - Class I, 5.23% (b) (Cost $2,992,870) | | | 2,992,870 | | | $ | 2,992,870 | |
| | | | | | | | | |
| Total Investments at Value — 100.0% | | | | | | | | |
| (Cost $24,853,605) | | | | | | $ | 61,120,995 | |
| | | | | | | | | |
| Other Assets in Excess of Liabilities — 0.0% (c) | | | | | | | 16,068 | |
| | | | | | | | | |
| Net Assets — 100.0% | | | | | | $ | 61,137,063 | |
ADR - American Depositary Receipt.
| (a) | Non-income producing security. |
| (b) | The rate shown is the 7-day effective yield as of September 30, 2023. |
| (c) | Percentage rounds to less than 0.1%. |
See accompanying notes to financial statements.
| THE GOVERNMENT STREET FUNDS |
| STATEMENTS OF ASSETS AND LIABILITIES |
| September 30, 2023 (Unaudited) |
| | | The | | | The | |
| | | Government | | | Government | |
| | | Street | | | Street | |
| | | Equity | | | Opportunities | |
| | | Fund | | | Fund | |
| ASSETS | | | | | | | | |
| Investments in securities: | | | | | | | | |
| At cost | | $ | 33,087,630 | | | $ | 24,853,605 | |
| At value (Note 2) | | $ | 68,154,367 | | | $ | 61,120,995 | |
| Receivable for securities sold | | | 640,189 | | | | — | |
| Receivable for capital shares purchased | | | 377 | | | | 758 | |
| Dividends receivable | | | 24,239 | | | | 53,094 | |
| Other assets | | | 13,306 | | | | 14,507 | |
| TOTAL ASSETS | | | 68,832,478 | | | | 61,189,354 | |
| | | | | | | | | |
| LIABILITIES | | | | | | | | |
| Distributions payable | | | 2,132 | | | | — | |
| Payable for securities sold | | | 382,201 | | | | — | |
| Payable for capital shares redeemed | | | 23,430 | | | | 1,570 | |
| Accrued investment advisory fees (Note 4) | | | 34,851 | | | | 38,691 | |
| Payable to administrator (Note 4) | | | 6,470 | | | | 5,780 | |
| Other accrued expenses | | | 6,365 | | | | 6,250 | |
| TOTAL LIABILITIES | | | 455,449 | | | | 52,291 | |
| | | | | | | | | |
| NET ASSETS | | $ | 68,377,029 | | | $ | 61,137,063 | |
| | | | | | | | | |
| Net assets consists of: | | | | | | | | |
| Paid-in capital | | $ | 31,358,744 | | | $ | 24,795,116 | |
| Accumulated earnings | | | 37,018,285 | | | | 36,341,947 | |
| Net assets | | $ | 68,377,029 | | | $ | 61,137,063 | |
| | | | | | | | | |
| Shares of beneficial interest outstanding (unlimited number of shares authorized, $0.01 par value) | | | 735,270 | | | | 1,679,894 | |
| | | | | | | | | |
| Net asset value, offering price and redemption price per share (Note 2) | | $ | 93.00 | | | $ | 36.39 | |
See accompanying notes to financial statements.
| THE GOVERNMENT STREET FUNDS |
| STATEMENTS OF OPERATIONS |
| For the Six Months Ended September 30, 2023 (Unaudited) |
| | | The | | | The | |
| | | Government | | | Government | |
| | | Street | | | Street | |
| | | Equity | | | Opportunities | |
| | | Fund | | | Fund | |
| INVESTMENT INCOME | | | | | | | | |
| Dividends | | $ | 673,209 | | | $ | 539,035 | |
| Foreign withholding taxes on dividends | | | (2,267 | ) | | | (1,800 | ) |
| TOTAL INVESTMENT INCOME | | | 670,942 | | | | 537,235 | |
| | | | | | | | | |
| EXPENSES | | | | | | | | |
| Investment advisory fees (Note 4) | | | 210,690 | | | | 233,841 | |
| Administration fees (Note 4) | | | 35,226 | | | | 31,308 | |
| Shareholder servicing fees (Note 4) | | | 12,626 | | | | 11,600 | |
| Trustees’ fees and expenses (Note 4) | | | 11,194 | | | | 11,194 | |
| Audit and tax services fees | | | 8,665 | | | | 8,665 | |
| Registration and filing fees | | | 7,942 | | | | 8,602 | |
| Legal fees | | | 4,105 | | | | 4,105 | |
| Compliance fees (Note 4) | | | 3,500 | | | | 3,500 | |
| Custodian and bank service fees | | | 3,568 | | | | 3,443 | |
| Shareholder reporting expenses | | | 3,472 | | | | 3,472 | |
| Postage and supplies | | | 1,574 | | | | 1,753 | |
| Other expenses | | | 3,878 | | | | 3,931 | |
| TOTAL EXPENSES | | | 306,440 | | | | 325,414 | |
| | | | | | | | | |
| NET INVESTMENT INCOME | | | 364,502 | | | | 211,821 | |
| | | | | | | | | |
| REALIZED AND UNREALIZED GAINS (LOSSES) ON INVESTMENTS | | | | | | | | |
| Net realized gains (losses) from investments | | | 1,954,585 | | | | (137,148 | ) |
| Net realized gains from in-kind redemptions (Note 2) | | | — | | | | 476,498 | |
| Net change in unrealized appreciation (depreciation) on investments | | | (11,687 | ) | | | 761,490 | |
| NET REALIZED AND UNREALIZED GAINS ON INVESTMENTS | | | 1,942,898 | | | | 1,100,840 | |
| | | | | | | | | |
| NET INCREASE IN NET ASSETS RESULTING FROM OPERATIONS | | $ | 2,307,400 | | | $ | 1,312,661 | |
See accompanying notes to financial statements.
| THE GOVERNMENT STREET EQUITY FUND |
| STATEMENTS OF CHANGES IN NET ASSETS |
| | | Six Months | | | Year | |
| | | Ended | | | Ended | |
| | | Sept. 30, 2023 | | | March 31, | |
| | | (Unaudited) | | | 2023 | |
| FROM OPERATIONS | | | | | | | | |
| Net investment income | | $ | 364,502 | | | $ | 707,584 | |
| Net realized gains from investments | | | 1,954,585 | | | | 2,034,589 | |
| Net realized gains from in-kind redemptions (Note 2) | | | — | | | | 370,072 | |
| Net change in unrealized appreciation (depreciation) on investments | | | (11,687 | ) | | | (9,799,062 | ) |
| Net increase (decrease) in net assets resulting from operations | | | 2,307,400 | | | | (6,686,817 | ) |
| | | | | | | | | |
| DISTRIBUTIONS TO SHAREHOLDERS (Note 2) | | | (1,853,375 | ) | | | (2,156,116 | ) |
| | | | | | | | | |
| FROM CAPITAL SHARE TRANSACTIONS | | | | | | | | |
| Proceeds from shares sold | | | 76,294 | | | | 318,339 | |
| Net asset value of shares issued in reinvestment of distributions to shareholders | | | 1,831,178 | | | | 2,123,213 | |
| Payments for shares redeemed | | | (1,279,779 | ) | | | (2,749,595 | ) |
| Net increase (decrease) in net assets from capital share transactions | | | 627,693 | | | | (308,043 | ) |
| | | | | | | | | |
| TOTAL INCREASE (DECREASE) IN NET ASSETS | | | 1,081,718 | | | | (9,150,976 | ) |
| | | | | | | | | |
| NET ASSETS | | | | | | | | |
| Beginning of period | | | 67,295,311 | | | | 76,446,287 | |
| End of period | | $ | 68,377,029 | | | $ | 67,295,311 | |
| | | | | | | | | |
| CAPITAL SHARE ACTIVITY | | | | | | | | |
| Shares sold | | | 800 | | | | 3,537 | |
| Shares reinvested | | | 19,032 | | | | 24,135 | |
| Shares redeemed | | | (13,312 | ) | | | (29,882 | ) |
| Net increase (decrease) in shares outstanding | | | 6,520 | | | | (2,210 | ) |
| Shares outstanding, beginning of period | | | 728,750 | | | | 730,960 | |
| Shares outstanding, end of period | | | 735,270 | | | | 728,750 | |
See accompanying notes to financial statements.
| THE GOVERNMENT STREET OPPORTUNITIES FUND |
| STATEMENTS OF CHANGES IN NET ASSETS |
| | | Six Months | | | Year | |
| | | Ended | | | Ended | |
| | | Sept. 30, 2023 | | | March 31, | |
| | | (Unaudited) | | | 2023 | |
| FROM OPERATIONS | | | | | | | | |
| Net investment income | | $ | 211,821 | | | $ | 462,409 | |
| Net realized gains (losses) from investments | | | (137,148 | ) | | | 1,548,765 | |
| Net realized gains from in-kind redemptions (Note 2) | | | 476,498 | | | | 281,100 | |
| Net change in unrealized appreciation (depreciation) on investments | | | 761,490 | | | | (5,411,530 | ) |
| Net increase (decrease) in net assets resulting from operations | | | 1,312,661 | | | | (3,119,256 | ) |
| | | | | | | | | |
| DISTRIBUTIONS TO SHAREHOLDERS (Note 2) | | | (756,447 | ) | | | (2,505,818 | ) |
| | | | | | | | | |
| FROM CAPITAL SHARE TRANSACTIONS | | | | | | | | |
| Proceeds from shares sold | | | 617,929 | | | | 1,730,992 | |
| Net asset value of shares issued in reinvestment of distributions to shareholders | | | 747,722 | | | | 2,458,112 | |
| Payments for shares redeemed | | | (1,364,038 | ) | | | (2,397,436 | ) |
| Net increase in net assets from capital share transactions | | | 1,613 | | | | 1,791,668 | |
| | | | | | | | | |
| TOTAL INCREASE (DECREASE) IN NET ASSETS | | | 557,827 | | | | (3,833,406 | ) |
| | | | | | | | | |
| NET ASSETS | | | | | | | | |
| Beginning of period | | | 60,579,236 | | | | 64,412,642 | |
| End of period | | $ | 61,137,063 | | | $ | 60,579,236 | |
| | | | | | | | | |
| CAPITAL SHARE ACTIVITY | | | | | | | | |
| Shares sold | | | 16,608 | | | | 50,213 | |
| Shares reinvested | | | 19,729 | | | | 71,446 | |
| Shares redeemed | | | (37,346 | ) | | | (66,782 | ) |
| Net increase (decrease) in shares outstanding | | | (1,009 | ) | | | 54,877 | |
| Shares outstanding, beginning of period | | | 1,680,903 | | | | 1,626,026 | |
| Shares outstanding, end of period | | | 1,679,894 | | | | 1,680,903 | |
See accompanying notes to financial statements.
| THE GOVERNMENT STREET EQUITY FUND |
| FINANCIAL HIGHLIGHTS |
Selected Per Share Data for a Share Outstanding Throughout Each Period:
| | | Six Months | | | | | | | | | | | | | | | | |
| | | Ended | | | | | | | | | | | | | | | | |
| | | Sept. 30, | | | | | | | | | | | | | | | | |
| | | 2023 | | | Years Ended March 31, | |
| | | (Unaudited) | | | 2023 | | | 2022 | | | 2021 | | | 2020 | | | 2019 | |
| Net asset value at beginning of period | | $ | 92.34 | | | $ | 104.58 | | | $ | 98.83 | | | $ | 68.30 | | | $ | 73.37 | | | $ | 74.60 | |
| | | | | | | | | | | | | | | | | | | | | | | | | |
| Income (loss) from investment operations: | | | | | | | | | | | | | | | | | | | | | | | | |
| Net investment income (a) | | | 0.50 | | | | 0.97 | | | | 0.58 | | | | 0.64 | | | | 0.80 | | | | 0.69 | |
| Net realized and unrealized gains (losses) on investments | | | 2.71 | | | | (10.23 | ) | | | 16.42 | | | | 36.33 | | | | (1.82 | ) | | | 3.37 | |
| Total from investment operations | | | 3.21 | | | | (9.26 | ) | | | 17.00 | | | | 36.97 | | | | (1.02 | ) | | | 4.06 | |
| | | | | | | | | | | | | | | | | | | | | | | | | |
| Less distributions from: | | | | | | | | | | | | | | | | | | | | | | | | |
| Net investment income | | | (0.50 | ) | | | (0.98 | ) | | | (0.58 | ) | | | (0.64 | ) | | | (0.80 | ) | | | (0.68 | ) |
| Net realized gains | | | (2.05 | ) | | | (2.00 | ) | | | (10.67 | ) | | | (5.80 | ) | | | (3.25 | ) | | | (4.61 | ) |
| Total distributions | | | (2.55 | ) | | | (2.98 | ) | | | (11.25 | ) | | | (6.44 | ) | | | (4.05 | ) | | | (5.29 | ) |
| | | | | | | | | | | | | | | | | | | | | | | | | |
| Net asset value at end of period | | $ | 93.00 | | | $ | 92.34 | | | $ | 104.58 | | | $ | 98.83 | | | $ | 68.30 | | | $ | 73.37 | |
| | | | | | | | | | | | | | | | | | | | | | | | | |
| Total return (b) | | | 3.39 | % (c) | | | (8.68 | %) | | | 17.51 | % | | | 55.46 | % | | | (2.04 | %) | | | 5.65 | % |
| | | | | | | | | | | | | | | | | | | | | | | | | |
| Net assets at end of period (000’s) | | $ | 68,377 | | | $ | 67,295 | | | $ | 76,446 | | | $ | 69,948 | | | $ | 49,981 | | | $ | 56,180 | |
| | | | | | | | | | | | | | | | | | | | | | | | | |
| Ratio of total expenses to average net assets (d) | | | 0.87 | % (e) | | | 0.87 | % | | | 0.84 | % | | | 0.86 | % | | | 0.91 | % | | | 0.89 | % |
| | | | | | | | | | | | | | | | | | | | | | | | | |
| Ratio of net investment income to average net assets (d) | | | 1.04 | % (e) | | | 1.07 | % | | | 0.55 | % | | | 0.71 | % | | | 1.01 | % | | | 0.92 | % |
| | | | | | | | | | | | | | | | | | | | | | | | | |
| Portfolio turnover rate | | | 14 | % (c) | | | 14 | % | | | 14 | % | | | 17 | % | | | 14 | % | | | 9 | % |
| (a) | Recognition of net investment income by the Fund is affected by the timing of declarations of dividends by the underlying investment companies in which the Fund invests, if any. |
| (b) | Total return is a measure of the change in value on an investment in the Fund over the periods covered, which assumes any dividends or capital gains distributions are reinvested in shares of the Fund. The returns shown do not reflect the deductions of taxes a shareholder would pay on Fund distributions or the redemption of Fund Shares. |
| (d) | The ratios of expenses and net investment income to average net assets do not reflect the Fund’s proportionate share of expenses of the underlying investment companies in which the Fund invests, if any. |
See accompanying notes to financial statements.
| THE GOVERNMENT STREET OPPORTUNITIES FUND |
| FINANCIAL HIGHLIGHTS |
Selected Per Share Data for a Share Outstanding Throughout Each Period:
| | | Six Months | | | | | | | | | | | | | | | | |
| | | Ended | | | | | | | | | | | | | | | | |
| | | Sept. 30, | | | | | | | | | | | | | | | | |
| | | 2023 | | | Years Ended March 31, | |
| | | (Unaudited) | | | 2023 | | | 2022 | | | 2021 | | | 2020 | | | 2019 | |
| Net asset value at beginning of period | | $ | 36.04 | | | $ | 39.61 | | | $ | 35.73 | | | $ | 23.56 | | | $ | 26.78 | | | $ | 26.64 | |
| | | | | | | | | | | | | | | | | | | | | | | | | |
| Income (loss) from investment operations: | | | | | | | | | | | | | | | | | | | | | | | | |
| Net investment income (a) | | | 0.13 | | | | 0.27 | | | | 0.17 | | | | 0.10 | | | | 0.16 | | | | 0.18 | |
| Net realized and unrealized gains (losses) on investments | | | 0.68 | | | | (2.31 | ) | | | 5.20 | | | | 13.19 | | | | (2.16 | ) | | | 0.90 | |
| Total from investment operations | | | 0.81 | | | | (2.04 | ) | | | 5.37 | | | | 13.29 | | | | (2.00 | ) | | | 1.08 | |
| | | | | | | | | | | | | | | | | | | | | | | | | |
| Less distributions from: | | | | | | | | | | | | | | | | | | | | | | | | |
| Net investment income | | | (0.07 | ) | | | (0.19 | ) | | | (0.18 | ) | | | (0.10 | ) | | | (0.16 | ) | | | (0.14 | ) |
| Net realized gains | | | (0.39 | ) | | | (1.34 | ) | | | (1.31 | ) | | | (1.02 | ) | | | (1.06 | ) | | | (0.80 | ) |
| Total distributions | | | (0.46 | ) | | | (1.53 | ) | | | (1.49 | ) | | | (1.12 | ) | | | (1.22 | ) | | | (0.94 | ) |
| | | | | | | | | | | | | | | | | | | | | | | | | |
| Net asset value at end of period | | $ | 36.39 | | | $ | 36.04 | | | $ | 39.61 | | | $ | 35.73 | | | $ | 23.56 | | | $ | 26.78 | |
| | | | | | | | | | | | | | | | | | | | | | | | | |
| Total return (b) | | | 2.18 | % (c) | | | (4.91 | %) | | | 15.11 | % | | | 57.00 | % | | | (8.18 | %) | | | 4.21 | % |
| | | | | | | | | | | | | | | | | | | | | | | | | |
| Net assets at end of period (000’s) | | $ | 61,137 | | | $ | 60,579 | | | $ | 64,413 | | | $ | 58,288 | | | $ | 39,422 | | | $ | 46,293 | |
| | | | | | | | | | | | | | | | | | | | | | | | | |
| Ratio of total expenses to average net assets (d) | | | 1.04 | % (e) | | | 1.05 | % | | | 1.02 | % | | | 1.07 | % | | | 1.09 | % | | | 1.08 | % |
| | | | | | | | | | | | | | | | | | | | | | | | | |
| Ratio of net investment income to average net assets (d) | | | 0.68 | % (e) | | | 0.78 | % | | | 0.44 | % | | | 0.32 | % | | | 0.57 | % | | | 0.64 | % |
| | | | | | | | | | | | | | | | | | | | | | | | | |
| Portfolio turnover rate | | | 3 | % (c) | | | 9 | % | | | 8 | % | | | 13 | % | | | 2 | % | | | 6 | % |
| (a) | Recognition of net investment income by the Fund is affected by the timing of declarations of dividends by the underlying investment companies in which the Fund invests, if any. |
| (b) | Total return is a measure of the change in value on an investment in the Fund over the periods covered, which assumes any dividends or capital gains distributions are reinvested in shares of the Fund. The returns shown do not reflect the deductions of taxes a shareholder would pay on Fund distributions or the redemption of Fund Shares. |
| (d) | The ratios of expenses and net investment income to average net assets do not reflect the Fund’s proportionate share of expenses of the underlying investment companies in which the Fund invests, if any. |
See accompanying notes to financial statements.
| THE GOVERNMENT STREET FUNDS |
| NOTES TO FINANCIAL STATEMENTS |
| September 30, 2023 (Unaudited) |
1. Organization
The Government Street Equity Fund and The Government Street Opportunities Fund (formerly, The Government Street Mid-Cap Fund) (the “Funds”) are each a diversified, no-load series of the Williamsburg Investment Trust (the “Trust”), an open-end management investment company registered under the Investment Company Act of 1940, as amended (the “1940 Act”). The Trust was organized as a Massachusetts business trust on July 18, 1988. Other series of the Trust are not included in this report.
The investment objective of The Government Street Equity Fund is to seek capital appreciation.
The investment objective of The Government Street Opportunities Fund is to seek capital appreciation.
2. Significant Accounting Policies
Each Fund follows accounting and reporting guidance under Financial Accounting Standards Board Accounting Standards Codification Topic 946, “Financial Services – Investment Companies.” The following is a summary of the Funds’ significant accounting policies. The policies are in conformity with accounting principles generally accepted in the United States of America (“GAAP”).
Regulatory update — Tailored Shareholder Reports for Mutual Funds and Exchange-Traded Funds (“ETFs”) – On January 24, 2023, the Securities and Exchange Commission (the “SEC”) adopted rule and form amendments to require mutual funds and ETFs to transmit concise and visually engaging streamlined annual and semiannual reports to shareholders that highlight key information. Other information, including financial statements, will not appear in a streamlined shareholder report but must be available online, delivered free of charge upon request, and filed on a semiannual basis on Form N-CSR. The rule and form amendments have a compliance date of July 24, 2024. At this time, management is evaluating the impact of these amendments on the shareholder reports for the Funds.
Securities valuation — The Funds’ portfolio securities are valued as of the close of business of the regular session of the New York Stock Exchange (“NYSE”) (normally 4:00 p.m. Eastern time). Securities traded on a national stock exchange, including common stocks and exchange-traded funds (“ETFs”), if any, are valued based upon the closing price on the principal exchange where the security is traded, if available, otherwise, at the last quoted bid price. Securities that are quoted by NASDAQ are valued at the NASDAQ Official Closing Price. Investments representing shares of other open-end investment companies, other than ETFs but including money market
| THE GOVERNMENT STREET FUNDS |
| NOTES TO FINANCIAL STATEMENTS (Continued) |
funds, are valued at their net asset value (“NAV”) as reported by such companies. When using a quoted price and when the market is considered active, securities will be classified as Level 1 within the fair value hierarchy (see below).
When market quotations are not readily available, if a pricing service cannot provide a price, or if the investment adviser believes the price received from the pricing service is not indicative of fair value, securities will be valued in good faith at fair value as determined by Leavell Investment Management, Inc. (the “Adviser”), as the Fund’s valuation designee, in accordance with procedures adopted by the Board of Trustees (the “Board”) pursuant to Rule 2a-5 under the 1940 Act. Under these procedures, the securities will be classified as Level 2 or 3 within the fair value hierarchy, depending on the inputs used. Such methods of fair valuation may include, but are not limited to: multiple of earnings, multiple of book value, discount from market of a similar freely traded security, purchase price of the security, subsequent private transactions in the security or related securities, or a combination of these and other factors. GAAP establishes a single authoritative definition of fair value, sets out a framework for measuring fair value and requires additional disclosures about fair value measurements.
Various inputs are used in determining the value of each Fund’s investments. These inputs are summarized in the three broad levels listed below:
| ● | Level 1 – quoted prices in active markets for identical securities |
| ● | Level 2 – other significant observable inputs |
| ● | Level 3 – significant unobservable inputs |
The inputs or methodology used for valuing securities are not necessarily an indication of the risks associated with investing in those securities. The inputs used to measure fair value may fall into different levels of the fair value hierarchy. In such cases, for disclosure purposes, the level in the fair value hierarchy within which the fair value measurement falls in its entirety is determined based on the lowest level input that is significant to the fair value measurement.
The following is a summary of the Funds’ investments based on the inputs used to value the investments as of September 30, 2023, by asset type:
| The Government Street Equity Fund: | | Level 1 | | | Level 2 | | | Level 3 | | | Total | |
| Common Stocks | | $ | 64,300,623 | | | $ | — | | | $ | — | | | $ | 64,300,623 | |
| Money Market Funds | | | 3,853,744 | | | | — | | | | — | | | | 3,853,744 | |
| Total | | $ | 68,154,367 | | | $ | — | | | $ | — | | | $ | 68,154,367 | |
| | | | | | | | | | | | | | | | | |
| THE GOVERNMENT STREET FUNDS |
| NOTES TO FINANCIAL STATEMENTS (Continued) |
| The Government Street Opportunities Fund: | | Level 1 | | | Level 2 | | | Level 3 | | | Total | |
| Common Stocks | | $ | 54,869,304 | | | $ | — | | | $ | — | | | $ | 54,869,304 | |
| Exchange-Traded Funds | | | 3,258,821 | | | | — | | | | — | | | | 3,258,821 | |
| Money Market Funds | | | 2,992,870 | | | | — | | | | — | | | | 2,992,870 | |
| Total | | $ | 61,120,995 | | | $ | — | | | $ | — | | | $ | 61,120,995 | |
| | | | | | | | | | | | | | | | | |
| | | | | | | | | | | | | | | | | |
Refer to each Fund’s Schedule of Investments for a listing of the common stocks by sector type. There were no Level 3 securities or derivative instruments held by the Funds as of or during the six months ended September 30, 2023.
Share valuation — The NAV per share of each Fund is calculated daily by dividing the total value of its assets, less liabilities, by the number of shares outstanding. The offering price and redemption price per share of each Fund is equal to the NAV per share.
Investment income — Interest income is accrued as earned. Discounts and premiums on fixed-income securities purchased, if any, are amortized using the effective interest method. Dividend income is recorded on the ex-dividend date. Non-cash dividends included in dividend income, if any, are recorded at the fair market value of the security received. Withholding taxes on foreign dividends have been recorded in accordance with the Trust’s understanding of the applicable country’s rules and tax rates.
Distributions to shareholders — Dividends arising from net investment income are declared and paid quarterly to shareholders of The Government Street Equity Fund and declared and paid annually to shareholders of The Government Street Opportunities Fund. Net realized short-term capital gains, if any, may be distributed throughout the year and net realized long-term capital gains, if any, are distributed at least once each year. Dividends and distributions are recorded on the ex-dividend date. The amount of distributions from net investment income and net realized capital gains are determined in accordance with federal income tax regulations, which may differ from GAAP. These “book/tax” differences are either temporary or permanent in nature.
The tax character of distributions paid during the periods ended September 30, 2023 and March 31, 2023 was as follows:
| | | Periods | | Ordinary | | | Long-Term | | | Total | |
| | | Ended | | Income | | | Capital Gains | | | Distributions* | |
| The Government Street Equity Fund | | 09/30/23 | | $ | 365,685 | | | $ | 1,487,690 | | | $ | 1,853,375 | |
| | | 03/31/23 | | $ | 708,660 | | | $ | 1,446,322 | | | $ | 2,154,982 | |
| The Government Street Opportunities Fund | | 09/30/23 | | $ | 111,522 | | | $ | 644,925 | | | $ | 756,447 | |
| | | 03/31/23 | | $ | 326,581 | | | $ | 2,179,237 | | | $ | 2,505,818 | |
| | | | | | | | | | | | | | | |
| * | Total Distributions may not tie to the amounts listed on the Statements of Changes in Net Assets due to reclassifications of the character of the distributions as a result of permanent differences between financial statements and income tax reporting and/or distributions payable amounts. |
| THE GOVERNMENT STREET FUNDS |
| NOTES TO FINANCIAL STATEMENTS (Continued) |
Investment transactions — Investment transactions are accounted for on trade date for financial reporting purposes. Realized gains and losses on investment securities sold are determined on a specific identification basis.
Common expenses — Common expenses of the Trust are allocated among the Funds and the other series of the Trust based on relative net assets of each series or the nature of the services performed and the relative applicability to each series.
Estimates — The preparation of financial statements in conformity with GAAP requires management to make estimates and assumptions that affect the reported amounts of assets and liabilities and the disclosure of contingent assets and liabilities as of the date of the financial statements and the reported amounts of increase (decrease) in net assets from operations during the reporting period. Actual results could differ from those estimates.
Federal income tax — Each Fund has qualified and intends to continue to qualify as a regulated investment company under the Internal Revenue Code of 1986, as amended (the “Code”). Qualification generally will relieve the Funds of liability for federal income taxes to the extent 100% of their net investment income and any net realized capital gains are distributed in accordance with the Code. In order to avoid imposition of the excise tax applicable to regulated investment companies, it is also each Fund’s intention to declare as dividends in each calendar year at least 98% of its net investment income (earned during the calendar year) and 98.2% of its net realized capital gains (earned during the twelve months ended October 31) plus undistributed amounts from prior years.
The following information is computed on a tax basis for each item as of September 30, 2023:
| | | The Government | | | The Government | |
| | | Street Equity | | | Street Opportunities | |
| | | Fund | | | Fund | |
| Cost of investments | | $ | 33,087,630 | | | $ | 24,853,605 | |
| Gross unrealized appreciation | | $ | 35,513,772 | | | $ | 36,937,027 | |
| Gross unrealized depreciation | | | (447,035 | ) | | | (669,637 | ) |
| Net unrealized appreciation | | | 35,066,737 | | | | 36,267,390 | |
| Accumulated ordinary income (loss) | | | (850 | ) | | | 211,749 | |
| Other gains (lossses) | | | 1,954,530 | | | | (137,192 | ) |
| Distributions payable | | | (2,132 | ) | | | — | |
| Total accumulated earnings | | $ | 37,018,285 | | | $ | 36,341,947 | |
| | | | | | | | | |
During the six months ended September 30, 2023, The Government Street Opportunities Fund realized $476,498 of net capital gains resulting from in-kind redemptions (redemptions in which shareholders who redeemed Fund shares receive investment securities held by the Fund rather than cash). The Fund recognizes a gain on in-kind
| THE GOVERNMENT STREET FUNDS |
| NOTES TO FINANCIAL STATEMENTS (Continued) |
redemptions to the extent that the value of the distributed investment securities on the date of redemption exceeds the cost of those investment securities. Such gains are not taxable to the Funds and are not required to be distributed to shareholders. The Fund has reclassified these gains against paid-in capital on the Statements of Assets and Liabilities. Such reclassifications, the result of permanent differences between the financial statement and income tax reporting requirements, had no effect on the Fund’s net assets or NAV per share.
The Funds recognize the tax benefits or expenses of uncertain tax positions only when the position is “more likely than not” to be sustained assuming examination by tax authorities. Management has reviewed the tax positions taken on federal income tax returns for the current and all open tax years (generally, three years) of each Fund and has concluded that no provision for unrecognized tax benefits or expenses is required in these financial statements.
The Funds recognize interest and penalties, if any, related to unrecognized tax benefits as income tax expense on the Statements of Operations. During the six months ended September 30, 2023, the Funds did not incur any interest or penalties.
3. Investment Transactions
Investment transactions, other than short-term investments and U.S. government securities, were as follows for the period ended September 30, 2023:
| | | | | | The Government | |
| | | The Government | | | Street | |
| | | Street Equity | | | Opportunities | |
| | | Fund | | | Fund | |
| Purchases of investment securities | | $ | 10,086,897 | | | $ | 4,846,490 | |
| Proceeds from sales of investment securities | | $ | 8,868,143 | | | $ | 1,545,890 | |
| | | | | | | | | |
| | | | | | | | | |
4. Transactions with Related Parties
INVESTMENT ADVISORY AGREEMENT
Each Fund’s investments are managed by the Adviser under the terms of an Investment Advisory Agreement. The Government Street Equity Fund pays the Adviser a fee, which is computed and accrued daily and paid monthly, at annual rates of 0.60% of its average daily net assets up to $100 million and 0.50% of such assets in excess of $100 million. The Government Street Opportunities Fund pays the Adviser a fee, which is computed and accrued daily and paid monthly, at an annual rate of 0.75% of its average daily net assets.
Certain officers of the Trust are also officers of the Adviser and are not paid by the Funds for serving in such capacities.
| THE GOVERNMENT STREET FUNDS |
| NOTES TO FINANCIAL STATEMENTS (Continued) |
OTHER SERVICE PROVIDERS
Ultimus Fund Solutions, LLC (“Ultimus”) provides administration, fund accounting, compliance and transfer agent services to the Funds. The Funds pay Ultimus fees in accordance with the agreements for such services. In addition, the Funds pay out-of-pocket expenses including, but not limited to, postage, supplies, and certain costs related to the pricing of the Funds’ portfolio securities. Certain officers of the Trust are also officers of Ultimus, or of Ultimus Fund Distributors, LLC (the “Distributor”), the principal underwriter of each Fund’s shares and an affiliate of Ultimus. The Distributor is compensated by the Adviser (not the Funds) for acting as principal underwriter.
SHAREHOLDER SERVICING PLAN
The Funds have adopted a Shareholder Servicing Plan (the “Plan”), which allows each Fund to make payments to financial organizations (including payments directly to the Adviser and the distributor) for providing account administration and account maintenance services to Fund shareholders. The annual service fee may not exceed an amount equal to 0.25% of each Fund’s average daily net assets. During the six months ended September 30, 2023, The Government Street Equity Fund and The Government Street Opportunities Fund incurred fees of $12,626 and $11,600, respectively, under the Plan.
COMPENSATION OF TRUSTEES
Trustees and officers affiliated with the Adviser or Ultimus are not compensated by the Trust for their services. Each Trustee who is not an affiliated person of the Adviser or Ultimus receives from the Trust an annual retainer of $30,000, payable quarterly; a fee of $2,000 for attendance at each meeting of the Board of Trustees (except that such fee is $3,000 for the independent chair); and a fee of $1,000 for attendance at each meeting of any committee of the Board (except that such fee is $1,500 for the committee chair); plus reimbursement of travel and other expenses incurred in attending meetings. Each series of the Trust pays its proportionate share of such fees.
5. Contingencies and Commitments
The Funds indemnify the Trust’s officers and Trustees for certain liabilities that might arise from their performance of their duties to the Funds. Additionally, in the normal course of business the Funds enter into contracts that contain a variety of representations and warranties and which provide general indemnifications. The Funds’ maximum exposure under these arrangements is unknown, as this would involve future claims that may be made against the Funds that have not yet occurred. However, based on experience, the Trust expects the risk of loss to be remote.
| THE GOVERNMENT STREET FUNDS |
| NOTES TO FINANCIAL STATEMENTS (Continued) |
6. Sector Risk
If a Fund has significant investments in the securities of issuers in industries within a particular business sector, any development affecting that sector will have a greater impact on the value of the net assets of the Fund than would be the case if the Fund did not have significant investments in that sector. In addition, this may increase the risk of loss of an investment in the Fund and increase the volatility of the Fund’s NAV per share. From time to time, circumstances may affect a particular sector and companies within such sector. For instance, economic or market factors, regulation or deregulation, or other developments may negatively impact all companies in a particular sector and therefore the value of the Fund’s portfolio would be adversely affected. As of September 30, 2023, the Government Street Equity Fund had 25.9% of its net assets invested in securities within the Technology sector.
7. Subsequent Events
The Funds are required to recognize in the financial statements the effects of all subsequent events that provide additional evidence about conditions that existed as of the date of the Statements of Assets and Liabilities. For non-recognized subsequent events that must be disclosed to keep the financial statements from being misleading, the Funds are required to disclose the nature of the event as well as an estimate of its financial effect, or a statement that such an estimate cannot be made. Management has evaluated subsequent events through the issuance of these financial statements and has noted no such events.
| THE GOVERNMENT STREET FUNDS |
| ABOUT YOUR FUNDS’ EXPENSES (Unaudited) |
We believe it is important for you to understand the impact of costs on your investment. All mutual funds have operating expenses. As a shareholder of the Funds, you incur ongoing costs, including management fees and other expenses. These ongoing costs, which are deducted from each Fund’s gross income, directly reduce the investment returns of the Funds.
A mutual fund’s ongoing costs are expressed as a percentage of its average net assets. This figure is known as the expense ratio. The following examples are intended to help you understand the ongoing costs (in dollars) of investing in the Funds and to compare these costs with the ongoing costs of investing in other mutual funds. The examples below are based on an investment of $1,000 made at the beginning of the period shown and held for the entire period (April 1, 2023 through September 30, 2023).
The table below illustrates each Fund’s ongoing costs in two ways:
Actual fund return – This section helps you to estimate the actual expenses that you paid over the period. The “Ending Account Value” shown is derived from each Fund’s actual return, and the fourth column shows the dollar amount of operating expenses that would have been paid by an investor who started with $1,000 in the Funds. You may use the information here, together with the amount you invested, to estimate the expenses that you paid over the period.
To do so, simply divide your account value by $1,000 (for example, an $8,600 account value divided by $1,000 = 8.6), then multiply the result by the number given for the Funds under the heading “Expenses Paid During Period.”
Hypothetical 5% return – This section is intended to help you compare the Funds’ ongoing costs with those of other mutual funds. It assumes that each Fund had an annual return of 5% before expenses during the period shown, but that the expense ratio is unchanged. In this case, because the returns used are not the Funds’ actual returns, the results do not apply to your investment. The example is useful in making comparisons because the U.S. Securities and Exchange Commission (the “SEC”) requires all mutual funds to calculate expenses based on a 5% return. You can assess each Fund’s ongoing costs by comparing this hypothetical example with the hypothetical examples that appear in shareholder reports of other funds.
Note that expenses shown in the table are meant to highlight and help you compare ongoing costs only. The Funds do not charge sales loads or redemption fees.
The calculations assume no shares were bought or sold during the period. Your actual costs may have been higher or lower, depending on the amount of your investment and the timing of any purchases or redemptions.
| THE GOVERNMENT STREET FUNDS |
| ABOUT YOUR FUNDS’ EXPENSES (Unaudited) |
| (Continued) |
More information about the Funds’ expenses, including historical expense ratios, can be found in this report. For additional information on operating expenses and other shareholder costs, please refer to the Funds’ prospectus.
| | Beginning | Ending | | Expenses |
| | Account Value | Account Value | Expense | Paid During |
| | April 1, 2023 | Sept. 30, 2023 | Ratio(a) | Period(b) |
| The Government Street Equity Fund | | | | |
| Based on Actual Fund Return | $1,000.00 | $1,033.90 | 0.87% | $4.44 |
| Based on Hypothetical 5% Return (before expenses) | $1,000.00 | $1,020.71 | 0.87% | $4.41 |
| The Government Street Opportunities Fund | | | |
| Based on Actual Fund Return | $1,000.00 | $1,021.80 | 1.04% | $5.27 |
| Based on Hypothetical 5% Return (before expenses) | $1,000.00 | $1,019.85 | 1.04% | $5.27 |
| (a) | Annualized, based on each Fund’s most recent one-half year expenses. |
| (b) | Expenses are equal to each Fund’s annualized expense ratio multiplied by the average account value over the period, multiplied by 183/365 (to reflect the one-half year period). |
| THE GOVERNMENT STREET FUNDS |
| OTHER INFORMATION (Unaudited) |
A description of the policies and procedures that the Funds use to vote proxies relating to portfolio securities is available without charge upon request by calling toll-free 1-866-738-1125, or on the SEC’s website at www.sec.gov. Information regarding how the Funds voted proxies relating to portfolio securities during the most recent 12-month period ended June 30 is also available without charge upon request by calling toll-free 1-866-738-1125 or on the SEC’s website at www.sec.gov.
The Trust files a complete listing of portfolio holdings for the Funds with the SEC as of the end of the first and third quarters of each fiscal year as an exhibit to its reports on Form N-PORT. The filings are available upon request, by calling 1-866-738-1125. Furthermore, you may obtain a copy of these filings on the SEC’s website at www.sec.gov and the Funds’ website https://funddocs.filepoint.com/govstreet/.
| THE GOVERNMENT STREET FUNDS |
| LIQUIDITY RISK MANAGEMENT PROGRAM (Unaudited) |
The Funds have adopted and implemented a written liquidity risk management program as required by Rule 22e-4 (the “Liquidity Rule”) under the Investment Company Act. The program is reasonably designed to assess and manage each Fund’s liquidity risk, taking into consideration, among other factors, the Fund’s investment strategy and the liquidity of its portfolio investments during normal and reasonably foreseeable stressed conditions; its short and long-term cash flow projections; and its cash holdings and access to other funding sources. The Funds’ Board of Trustees approved the appointment of a Liquidity Risk Committee, which includes representatives from Leavell Investment Management, Inc., the Funds’ investment adviser, and Ultimus Fund Solutions, LLC, the Funds’ Administrator. The Liquidity Risk Committee is responsible for the program’s administration and oversight and for reporting to the Board on at least an annual basis regarding the program’s operation and effectiveness. The Liquidity Risk Committee updated its assessment of each Fund’s liquidity risk profile, considering additional data gathered in the 12 months ended May 31, 2023 and the adequacy and effectiveness of the liquidity risk management program’s operations from June 1, 2022 through May 31, 2023 (the “Review Period”) in order to prepare a written report for the Board of Trustees (the “Report”) for consideration at its meeting held on August 15, 2023. During the Review Period, neither Fund experienced unusual stress or disruption to its operations related to purchase and redemption activity. Also, during the Review Period the Funds held adequate levels of cash and highly liquid investments to meet shareholder redemption activities in accordance with applicable requirements. The Report concluded that (i) the Funds’ liquidity risk management program is reasonably designed to prevent violations of the Liquidity Rule and (ii) the Funds’ liquidity risk management program has been effectively implemented.
This page intentionally left blank.
| | | | | | | |
| | | | | | | |
| | | | | | | |
| | | | | | | |
| | | | | | | |
| | | | The Government Street Funds | | | |
| | | | | | | |
| | | | | | | |
| | | | No-Load Mutual Funds | | | |
| | | | | | | |
| | | | | | | |
| | | | Investment Adviser Leavell Investment Management, Inc. 210 St. Joseph Street Mobile, AL 36602 Administrator Ultimus Fund Solutions, LLC P.O. Box 46707 Cincinnati, OH 45246-0707 1-866-738-1125 Legal Counsel Sullivan & Worcester LLP 1666 K Street, N.W. Washington, DC 20006 Independent Registered Public Accounting Firm Cohen & Company, Ltd. 342 N Water Street, Suite 830 Milwaukee, WI 53202 Board of Trustees Robert S. Harris, Ph.D., Chairman John P. Ackerly, IV George K. Jennison Harris V. Morrissette Elizabeth W. Robertson Portfolio Manager Thomas W. Leavell, The Government Street Equity Fund The Government Street Opportunities Fund | | | |
| | | | | | | |
| | | | | | | |
| | | | | | | |
| | | | | | | |
| | | | | | | |
| | | | | | | |
| | | | | | | |
| | | | | | | |
| | | | | | | |
| | | | | | | |
| | | | | | | |
| | | | | | | |
| | | | Government Street-SAR-23 | | |
| | | | | | | |
| | | | | | | |
| | | | | | | |
| | | | | | | |
(b) Not applicable
Not required
| Item 3. | Audit Committee Financial Expert. |
Not required
| Item 4. | Principal Accountant Fees and Services. |
Not required
| Item 5. | Audit Committee of Listed Registrants. |
Not applicable
| Item 6. | Schedule of Investments. |
| (a) | Schedule filed with Item 1 |
| Item 7. | Disclosure of Proxy Voting Policies and Procedures for Closed-End Management Investment Companies. |
Not applicable
| Item 8. | Portfolio Managers of Closed-End Management Investment Companies. |
Not applicable
| Item 9. | Purchases of Equity Securities by Closed-End Management Investment Company and Affiliated Purchasers. |
Not applicable
| Item 10. | Submission of Matters to a Vote of Security Holders. |
The registrant’s Governance, Nominating, Compensation and QLCC Committee shall review shareholder recommendations to fill vacancies on the registrant’s board of trustees if such recommendations are submitted in writing, addressed to the Committee at the registrant’s offices and meet any minimum qualifications adopted by the Committee. The Committee may adopt, by resolution, a policy regarding its procedures for considering candidates for the board of trustees, including any recommended by shareholders.
| Item 11. | Controls and Procedures. |
(a) Based on their evaluation of the registrant’s disclosure controls and procedures (as defined in Rule 30a-3(c) under the Investment Company Act of 1940) as of a date within 90 days of the filing date of this report, the registrant’s principal executive officers and principal financial officer have concluded that such disclosure controls and procedures are reasonably designed and are operating effectively to ensure that material information relating to the registrant, including its consolidated subsidiaries, is made known to them by others within those entities, particularly during the period in which this report is being prepared, and that the information required in filings on Form N-CSR is recorded, processed, summarized, and reported on a timely basis.
(b) There were no changes in the registrant’s internal control over financial reporting (as defined in Rule 30a-3(d) under the Investment Company Act of 1940) that occurred during the period covered by this report
that have materially affected, or are reasonably likely to materially affect, the registrant’s internal control over financial reporting.
Item 12. Disclosure of Securities Lending Activities for Closed-End Management Investment Companies.
Not applicable
File the exhibits listed below as part of this Form. Letter or number the exhibits in the sequence indicated.
(a)(1) Any code of ethics, or amendment thereto, that is the subject of the disclosure required by Item 2, to the extent that the registrant intends to satisfy the Item 2 requirements through filing of an exhibit: Not required
(a)(2) A separate certification for each principal executive officer and principal financial officer of the registrant as required by Rule 30a-2(a) under the Act (17 CFR 270.30a-2(a)): Attached hereto
(1) Any written solicitation to purchase securities under Rule 23c-1 under the Act (17 CFR 270.23c-1) sent or given during the period covered by the report by or on behalf of the registrant to 10 or more persons: Not applicable
(2) Change in the registrant’s independent public accountants: Not applicable
(b) Certifications required by Rule 30a-2(b) under the Act (17 CFR 270.30a-2(b)): Attached hereto
Exhibit 99.CERT Certifications required by Rule 30a-2(a) under the Act
Exhibit 99.906CERT Certifications required by Rule 30a-2(b) under the Act
SIGNATURES
Pursuant to the requirements of the Securities Exchange Act of 1934 and the Investment Company Act of 1940, the registrant has duly caused this report to be signed on its behalf by the undersigned, thereunto duly authorized.
| (Registrant) | Williamsburg Investment Trust | | |
| | | | |
| By (Signature and Title)* | /s/ David James | |
| | | David James, Secretary | |
| | | | |
| Date | November 29, 2023 | | |
| | | | |
| Pursuant to the requirements of the Securities Exchange Act of 1934 and the Investment Company Act of 1940, this report has been signed below by the following persons on behalf of the registrant and in the capacities and on the dates indicated. |
| | | | |
| | | | |
| By (Signature and Title)* | /s/ Thomas W. Leavell | |
| | | Thomas W. Leavell, President | |
| | | (The Government Street Equity Fund and The Government Street Opportunities Fund) | |
| | | | |
| Date | November 29, 2023 | | |
| | | | |
| By (Signature and Title)* | /s/ Charles M. Caravati III | |
| | | Charles M. Caravati III, President | |
| | | (The Jamestown Equity Fund) | |
| | | | |
| Date | November 29, 2023 | | |
| | | | |
| By (Signature and Title)* | /s/ John P. Ackerly IV | |
| | | John P. Ackerly IV, President | |
| | | (The Davenport Core Leaders Fund, Davenport Value & Income Fund, Davenport Equity Opportunities Fund, Davenport Small Cap Focus Fund and the Davenport Balanced Income Fund) | |
| | | | |
| Date | November 29, 2023 | | |
| | | | |
| By (Signature and Title)* | /s/ Mark J. Seger | |
| | | Mark J. Seger, Treasurer and Principal Financial Officer | |
| | | | |
| Date | November 29, 2023 | | |
* Print the name and title of each signing officer under his or her signature.