UNITED STATES
SECURITIES AND EXCHANGE COMMISSION
Washington, D.C. 20549
FORM N-CSR
CERTIFIED SHAREHOLDER REPORT OF REGISTERED
MANAGEMENT INVESTMENT COMPANIES
| Investment Company Act file number | 811-05685 | |
| Williamsburg Investment Trust |
| (Exact name of registrant as specified in charter) |
| 225 Pictoria Drive, Suite 450 Cincinnati, Ohio | 45246 |
| (Address of principal executive offices) | (Zip code) |
John Chilton, Esq.
| Sullivan & Worcester LLP 1666 K Street, NW Washington, D.C. 20006 |
| (Name and address of agent for service) |
| Registrant's telephone number, including area code: | (513) 587-3400 | |
| Date of fiscal year end: | March 31 | |
| | | |
| Date of reporting period: | September 30, 2022 | |
Form N-CSR is to be used by management investment companies to file reports with the Commission not later than 10 days after the transmission to stockholders of any report that is required to be transmitted to stockholders under Rule 30e-1 under the Investment Company Act of 1940 (17 CFR 270.30e-1). The Commission may use the information provided on Form N-CSR in its regulatory, disclosure review, inspection, and policymaking roles.
A registrant is required to disclose the information specified by Form N-CSR, and the Commission will make this information public. A registrant is not required to respond to the collection of information contained in Form N-CSR unless the Form displays a currently valid Office of Management and Budget ("OMB") control number. Please direct comments concerning the accuracy of the information collection burden estimate and any suggestions for reducing the burden to the Secretary, Securities and Exchange Commission, 450 Fifth Street, NW, Washington, DC 20549-0609. The OMB has reviewed this collection of information under the clearance requirements of 44 U.S.C. § 3507.
Item 1. Reports to Stockholders.
(a)
| | |
| | |
| | |
| | |
| | |
| | |
| | |
| | |
| | |
| | |
 | Davenport Core Fund (DAVPX) |
| | |
| | Davenport Value & Income Fund (DVIPX) |
| | |
| | Davenport Equity Opportunities Fund (DEOPX) |
| | |
| | Davenport Small Cap Focus Fund (DSCPX) |
| | |
| | Davenport Balanced Income Fund (DBALX) |
| | |
| | |
| | |
| | |
| SEMI-ANNUAL REPORT |
| | |
| | |
| September 30, 2022 |
| (Unaudited) |
| |
| |
| |
| |
| |
| |
| |
| |
| |
| |
| |
| |
| |
| |
| |
| |
| |
| |
| |
| |
| |
| |
| |
| |
| |
| |
| |
| |
| |
| |
| |
| THE DAVENPORT FUNDS |
| LETTER TO SHAREHOLDERS (Unaudited) September 30, 2022 |
Dear Shareholders,
Market action was wild in the third quarter, which turned out to be a tale of two halves. We saw an impressive rally from July through mid-August that coincided with hopes of the Federal Reserve (the “Fed”) backing off restrictive monetary policy. Then, we witnessed a sharp reversal as discouraging inflation data prompted the Fed to become even more resolute in its battle against rising prices. Ultimately, stocks declined for the quarter and returned to their June lows. The S&P 500® Index finished the period down 4.88% and the Russell 2000® Index declined 2.19%. Year-to-date, the S&P and Russell finished September 2022 down 23.87% and 25.10%, respectively.
There’s been little reason to be excited of late. In fact, things have felt downright bleak. Rampant inflation, rising interest rates, restrictive monetary policy and slowing growth clearly aren’t the ideal cocktail for stocks. Fed officials are fixated on quelling inflation with higher interest rates and are clearly willing to risk a recession to do so. They recently raised the benchmark federal funds rate another 0.75% to a range of 3.0-3.25%, which is the highest level since 2008, and indicated they will keep hiking rates well above the current level. Consequently, most prognosticators believe the risk of recession in 2023 is now well above 50%.
When will the Fed relent? To say all eyes are on the Fed would be an understatement. In fact, the gamification of Fed speak seems to have reached new heights. That is, investors are fixated on when the Fed will “pivot” and back off its hawkish stance. This would presumably create a much more favorable backdrop for the economy and stocks. But, this seems likely only when inflation is clearly much more subdued, with the Fed’s target being 2% for the consumer price index (down from over 8% in recent months). In policymakers’ eyes, the potential long-term harm from persistent inflation clearly outweighs the risk of a potential slowdown brought on by their efforts.
In addition to the specter of slowing growth and/or recession, rising interest rates have other consequences. For one, bonds have become a much more viable alternative to stocks. Consider this, a one year treasury bill now yields just over 4.0% versus 0.1% a year ago. It goes without saying that a risk-free rate over 4% offers more formidable competition for investors’ dollars than it did in recent years. It’s also nicely higher than the S&P 500’s current yield of 1.7%. Another major side effect of rising rates is a higher cost of capital for companies. Whether refinancing old debt or raising capital for new opportunities, companies will be paying more for money. This elevates the importance of having manageable debt levels.
All of this has put a gravitational pull on equity valuations and is likely to influence corporate earnings as well. On the former, higher interest rates typically mean lower price-to-earnings (P/E) multiples for stocks. We’ve already seen the S&P’s multiple contract from 21.4x forward earnings at the beginning of 2022 to 15.2x, which compares to the average of 16.2x since 1990. While equity prices have corrected sharply (influencing the numerator of the P/E equation), earnings estimates (the denominator) have been slower to react. The consensus currently calls for roughly 8.0% earnings growth for the S&P 500 next year and this seems too high in light of slowing growth. This suggests the broader market is not quite as cheap as it appears.
Such a backdrop clearly presents a tough environment for us as investors. However, we think some of the “glass half full” language from our last letter, when stocks were around current levels, is still relevant. To paraphrase, we noted that stocks had clearly discounted some pain already and that we were being better compensated for taking risk in many situations. The P/E multiple compression highlighted above is clear evidence of this. We went on to note that investor sentiment seems decidedly negative and that a recession seems to be a foregone conclusion at this point. Since then, the interest rate/policy backdrop for stocks has worsened. But, at some point pervasive pessimism will help the market put in a bottom. It’s often a good time to be a buyer when everyone else seems to have given up.
In sum, we have been expecting to enter an era of more subdued returns following years of easy monetary policy and outsized gains. This year’s drawdown clearly suggests that era is upon us and we aren’t holding our breath for policymakers to come to the rescue. This doesn’t mean, however, that we can’t earn respectable returns following this period of pain, especially as broad market weakness offers us some bargains. Rather than being fixated on Fed speak and other short-term indicators, we are staying very focused on buying businesses that trade at attractive prices, even when considering the risk of slowing growth. Thank you for your trust.
Please see our fund letters for discussion of specific ideas and investment themes.
Davenport Core Fund (DAVPX)
The following chart represents Davenport Core Fund (DAVPX) performance and the performance of the S&P 500® Index, the Core Fund’s primary benchmark, for the periods ended September 30, 2022.
| | | | | | | Since |
| | | | | | | Inception* |
| | Q3 2022 | 1 Year | 3 Years* | 5 Years* | 10 Years* | 1/15/98 |
| Core Fund (DAVPX) | -6.35% | -19.65% | 3.38% | 6.25% | 9.59% | 6.67% |
| S&P 500® Index** | -4.88% | -15.47% | 8.16% | 9.24% | 11.70% | 7.50% |
30-Day SEC Yield: 0.87%; Expense Ratio in current prospectus: 0.86%
Past performance is no guarantee of future results. Investment return and principal value of an investment will fluctuate so that an investor’s shares, when redeemed, may be worth more or less than their original cost. Current performance may be lower or higher than the performance data quoted. Performance data, current to the most recent month-end, may be obtained by calling 1-800-281-3217.
| * | Returns greater than one year are annualized. |
| ** | The S&P 500® Index is comprised of 500 U.S. stocks and is an indicator of the performance of the overall U.S. stock market. An investor cannot invest in an index and its returns are not indicative of the performance of any specific investment. |
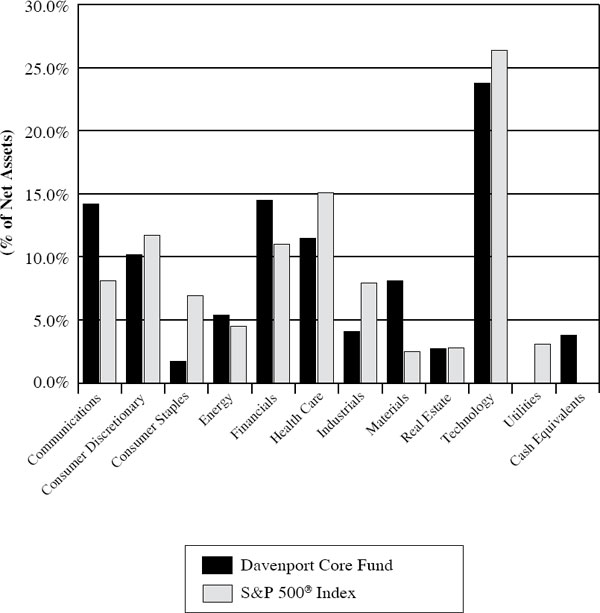
The Davenport Core Fund (DAVPX) decreased 6.35% in the third quarter and is down 25.94% year-to-date. The S&P 500® Index declined 4.88% during the quarter and is down 23.87% year-to-date. On the heels of a dour Q2, the third quarter began with an abrupt rally alongside hopes of peaking inflation and a pivot in Fed policy; however, in mid-August investors’ hopes were dashed as the Fed reiterated the ongoing need for restrictive policy—prompting a sharp decline in equities which continued for the remainder of the quarter.
TJX Companies, Inc. (TJX) was our top contributor to performance in the third quarter. As an off-price/bargain retailer, the current macro environment should benefit TJX as consumers are more price sensitive and looking for deals. At the same time, full-price apparel retailers have seen elevated inventories as consumers are less enthusiastic to spend on bigger ticket apparel, allowing TJX to purchase the excess at significant markdowns and sell it at more competitive prices. After being a large detractor to performance in Q2, Amazon.com, Inc. (AMZN) was our second top contributor to performance in the third quarter. The shares traded significantly higher after the company reported a second quarter that beat consensus estimates and guided to a strong Q3, helping to alleviate fears of continued ecommerce deceleration post-pandemic. Moreover, Amazon’s cloud offering (AWS) continues to see tremendous growth despite concerns around slowing IT spend given the current macro volatility. Lastly, it appears the company is reaching a profitability inflection point as cost pressures abate and new pricing initiatives roll through.
Adobe, Inc. (ADBE) was our biggest detractor to performance during the period, as the stock pulled back significantly following a mixed fiscal Q3 print and fiscal Q4 guide. The company also announced the purchase of Figma, a web-first collaborative design platform, for ~$20 billion in cash and stock. While Figma is an outstanding business that should complement Adobe’s current offerings in the long-term, investors were concerned about the hefty price tag, potential margin dilution, and the timing of the deal given the recessionary environment. We continue to believe Adobe is a fantastic business and is well positioned as an industry leader that should capitalize on the secular themes of digital content creation, digital transformation, and data and analytics. Markel Corp. (MKL) was our second biggest detractor during the quarter, as investors concerns around mark-downs in the company’s investment portfolio overshadowed solid underwriting profitability and the longer-term ability for Markel to take advantage of higher interest rates. We think the stock looks compelling at current levels and feel comfortable holding our position given the favorable underwriting environment.
While declines are never something to celebrate, we do believe the general market weakness of late has created attractive buying opportunities for many high quality companies. As such, we were more transactional towards the end of the quarter. We elected to exit some names where our conviction has waned or were more marginal and reallocated some funds into higher quality, blue chip compounders that more closely align with the Fund’s investment discipline. We sold our positions in Caesars Entertainment, Inc. (CZR) and Sony Group Corp. (SONY). Caesars was arguably a bit more speculative than traditional Core holdings and we continue to be attracted to the company’s Las Vegas casino exposure and sports betting segment. However, the company now faces more headwinds than before. These include: a worsening consumer outlook with an increasing recession probability, and rising interest rates/widening credit spreads which create incremental headwinds for levered entities such as Caesars. Sony was once a strong outperformer for the Fund. The company has transformed from primarily an electronic hardware business to a diversified media conglomerate led by video games, films, and music. That said, Sony still maintains exposure to some hardware segments that are more exposed to macroeconomic fluctuations that could weigh on earnings and the stock price in the near-term. We continue to see upside for the stock, but think it’s become more of a value stock/sum-of-the-parts story.
With some of the proceeds, we added to our positions in Sherwin Williams Co. (SHW) and Martin Marietta Materials, Inc. (MLM), two durable, “cyclical-light,” long-term compounders that have pulled back significantly. Sherwin has struggled amidst fears of a housing collapse. However we think the market is underestimating the potential margin improvement that should come from
lower input costs and SHW’s pricing actions. Similarly, MLM should see solid growth next year even in a recessionary environment, driven by higher volumes, price increases, and improved margins from lower costs. Additionally, Congress passed the Infrastructure Investment and Jobs Act late last year, which increases investment in highway programs by 38% and should provide a nice tailwind for MLM.
In closing, market weakness is discouraging but not completely unsurprising following years of unbridled risk taking and asset values reinforced by near-zero interest rates. That said, we believe the market weakness has presented attractive opportunities that could offer respectable returns. We’ve taken a few initial steps to reposition some of our Funds into high quality bellwethers, and will continue to look for opportunities amid the volatility.
Recent Purchases:
EOG Resources (EOG) - EOG is a large (~$58billion market cap) independent U.S. shale oil & gas producer with large acreage positions in the Eagle Ford and the Permian, as well as a sizeable position in the emerging Powder River Basin. After increasing more than 65% to start the year as oil prices surged, EOG has declined more than 30% over the last month alongside falling oil prices and a broader sell off in the energy sector. We believe this pullback offered an attractive opportunity to increase our energy exposure, and introduce a low cost, world-class operator. EOG, a name we have owned in the past, has been a value creator over time and has a great set of low-cost, low-risk US shale assets. For these reasons, we think the risk/reward profile is incredibly attractive and elect to add this high quality name to the Fund.
Intuit, Inc. (INTU) – INTU is a Mountain View, California based software company that is famous for its TurboTax and QuickBooks applications. We initially purchased the stock in June as growth and technology stocks were particularly out of favor, and elected to establish just a 1% position, allowing us the ability to add exposure should we be a bit early. That initial purchased proved to be quite timely, and the stock reached nearly $500 in August before falling victim to the broader market weakness of late. Ultimately, we believe the company can produce revenue growth in the high teens for the foreseeable future along with continued margin expansion. We believe this presents an attractive opportunity to add to the name and bring the position to a more normal size.
Martin Marietta Materials, Inc. (MLM) – MLM shares have pulled back with the market over the past month and a half and we think represent an attractive opportunity in this high-quality franchise. Looking ahead to 2023 when earnings for many cyclical companies could struggle, MLM should post very solid mid-teens earnings growth driven by higher volumes, price increases, and the margin benefit from lower diesel costs. The pricing story remains the best we’ve seen in decades (if ever) and MLM expects to exit 2022 with aggregates pricing +14.5% YOY(Year-over-year). The stock now trades at ~12.5x EV/EBITDA (Enterprise Value/Earnings Before Interest, Taxes, Depreciation, and Amortization), well below the 15x it has seen over the past couple of years. As investors look to 2023 and focus on companies that can grow earnings, we think MLM shares should benefit.
Meta Platforms, Inc. (META) – Shares of META have been under pressure this year as the company continues to grapple with various headwinds including competition from newer platforms such as TikTok (a short-form video platform), Apple’s privacy changes regarding use of data, and broader macro effects on digital advertising. While these headwinds have certainly
been significant, the company has a strong track record of innovation and adapting their playbook. We believe there will be significant opportunities for the company to capitalize on the metaverse as it comes to fruition over the coming years given META’s large user base, global reach, and existing hardware/software offerings.
Recent Sales:
Caesars Entertainment, Inc. (CZR) - Arguably a little more speculative than traditional Core holdings, we initially purchased a smaller position given the stock’s volatility. We continue to be attracted to the company’s Las Vegas casino exposure and believe the sports betting segment could become a real driver of the business; however, a couple things have changed fundamentally since our purchase. These include: a worsening consumer outlook with an increasing recession probability, and rising interest rates/widening credit spreads creating incremental headwinds for levered entities such as CZR. We think this is an opportunity to “reset” by exiting names that were more marginal in terms of fit, and reallocate some funds into high quality, blue chip compounders that more closely align with the Core Fund’s investment discipline.
Medtronic plc (MDT) – The company faces near-term headwinds including tough comps relative to last year, supply chain issues, soft demand from China, inflationary pressures impacting margins, and decent FX (foreign exchange market) headwinds. That said, heading into 2023 these headwinds should begin to ease and MDT has several new product launches forthcoming. While the aforementioned overhangs should weigh on the stock/valuation in the near-term, we believe management is on the right track to rebuilding momentum via rejuvenated R&D (research and development) efforts and thus believe there is value to be created longer-term. As such, we feel the stock is a more appropriate holding for the Value & Income Fund and elect to sell it here.
Davenport Value & Income Fund (DVIPX)
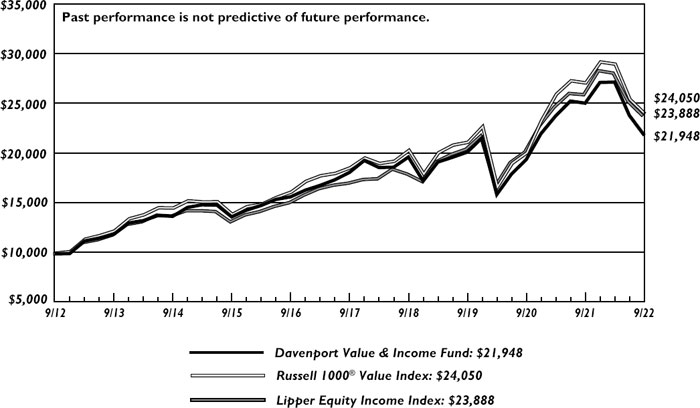
The following chart represents Davenport Value & Income Fund (DVIPX) performance and the performance of the Russell 1000® Value Index, the Fund’s primary benchmark, and the S&P 500® Index for the periods ended September 30, 2022.
| | | | | | | Since |
| | | | | | | Inception* |
| | Q3 2022 | 1 Year | 3 Years* | 5 Years* | 10 Years* | 12/31/10 |
| Value & Income Fund (DVIPX) | -8.29% | -12.76% | 2.75% | 3.83% | 8.18% | 8.93% |
| Russell 1000® Value Index** | -5.62% | -11.36% | 4.36% | 5.29% | 9.17% | 9.14% |
| S&P 500® Index** | -4.88% | -15.47% | 8.16% | 9.24% | 11.70% | 11.51% |
30-Day SEC Yield: 2.25%; Expense Ratio in current prospectus: 0.87%
Past performance is no guarantee of future results. Investment return and principal value of an investment will fluctuate so that an investor’s shares, when redeemed, may be worth more or less than their original cost. Current performance may be lower or higher than the performance data quoted. Performance data, current to the most recent month-end, may be obtained by calling 1-800-281-3217.
| * | Returns greater than one year are annualized. |
| ** | The Russell 1000® Value Index measures the performance of the Russell 1000 companies with lower price-to-book ratios and lower forecasted growth values. The S&P 500® Index is comprised of 500 U.S. stocks and is an indicator of the performance of the overall U.S. stock market. Standard & Poor’s Financial Services LLC, a division of S&P Global, is the source and owner of the registered trademarks related to the S&P 500® Index. An investor cannot invest in an index and its returns are not indicative of the performance of any specific investment. |
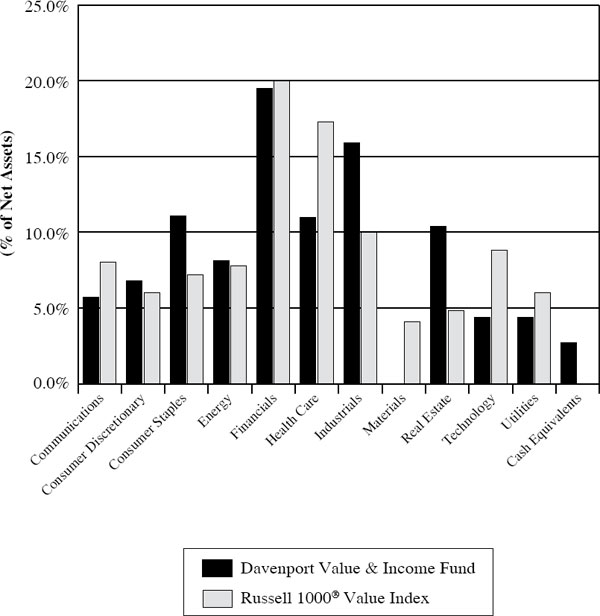
The Davenport Value & Income Fund (DVIPX) declined 8.29% during the third quarter and is now down 19.44% year-to-date. This compares to the Fund’s primary benchmark, the Russell 1000® Value Index, which declined 5.62% during the third quarter and is down 17.75% year-to-date. The S&P 500® Index declined 4.88% in the third quarter and is down 23.87% year-to-date.
The third quarter started off strong for the Fund before a nearly 10% decline in September as increased Fed hawkishness drove interest rates higher and heightened investor concerns about a potential recession. Over the past several months, we had shifted the Fund more towards defensive names, so were frustrated to see some of the more traditional “safe haven” names such as Verizon Communications, Inc. (VZ), Comcast Corp. (CMCSA), and Dominion Energy, Inc. (D) perform poorly. That said, we used the selloff as an opportunity to add to some higher conviction positions at attractive prices.
Performance in the quarter was led by an eclectic mix of names including Watsco, Inc. (WSO), Deere & Company (DE), Lowe’s Companies, Inc. (LOW), Walmart Inc. (WMT), and Cannae Holdings, Inc. (CNNE). Each of these stocks had some company-specific drivers that allowed them to buck the market trend. Key detractors during the quarter include Comcast Corp. (CMCSA), Sony Corp. (SONY), Fairfax Financial Holdings Ltd. (FRFHF), Markel Corp (MKL), and Newmont Corp. (NEM). Comcast shares have struggled as broadband subscribers started to decline, but we think the stock is extremely cheap at a 50% discount to the market multiple and an all-time low P/E. Sony has been hurt by weakness in the Japanese Yen, but trades at a 25% discount to our calculation of the sum-of-the parts. The two insurance companies, FRFHF and MKL, held up very well until September and continue to be outperformers on a year-to-date basis. They remain very cheap and should have nice upside over time. Newmont struggled as the restrictive monetary policy put renewed pressure on metals prices. As we believe it’s likely to take some time before that policy begins to ease, we exited our position in NEM during the quarter.
There were no new positions introduced during the third quarter, so we thought it would be useful to highlight a high-conviction name that we recently added to. NextEra Energy, Inc. (NEE) is the largest publicly-traded utility in the U.S. and one of the biggest renewable power providers in the world. The company’s regulated business (Florida Power & Light) serves as the cash cow used to fund the buildout of the renewable power piece. NextEra has one of the strongest balance sheets in the utilities sector with an A- rating and an overfunded pension plan. The dividend has been growing 10% per year and is expected to continue growing at that rate, based on highly visible growth in both divisions. Management has been excellent at creating value for shareholders and we see this continuing for the foreseeable future. Lastly, the company is a prime beneficiary of the Inflation Reduction Act, which extended wind and solar tax credits. We expect NEE to compound earnings at a 6%-8% rate for the next several years to go along with its 2.1% dividend yield. Also during the quarter, we added to existing positions in Berkshire Hathaway Inc. (BRK.B), QUALCOMM, Inc. (QCOM), Lowe’s Companies, Inc. (LOW), and SL Green Realty Corp. (SLG).
In sum, while we are disappointed that the Fund did not hold up quite as well as we expected in a difficult market environment, we continue to believe the Fund is well positioned and have used market weakness to add to our stable base of dividend growers. Just this year we have seen dividend increases of 31% from Lowe’s, 19% from Bunge, and 9% from Lamar. Over time, we think strong and growing dividends can provide a ballast to returns and help offset inflation.
Recent Purchases:
Berkshire Hathaway (BRK.B) – BRK.B has outperformed the broad market so far this year, but has taken a leg down with the equity market sell-off in June. BRK.B has close to $150B in cash and equivalents on its balance sheet, which we think provides nice optionality either from additional equity investments or shareholder returns. We believe the year-to-date drawdown in the market has improved the risk/reward profile for many attractive long-term investments. While we are certainly not calling the bottom, we think the time is right to incrementally add to stocks.
Lowe’s Companies, Inc. (LOW) – Shares of LOW have been tremendous since our initial purchase in 2020, but have declined 27% year-to-date amidst rising rates and the potential impacts on both the housing market and consumers more broadly. While we may be early in adding to our position, we continue to have a favorable longterm view on repair/remodeling demand as well as the Lowe’s turnaround under CEO Marvin Ellison. The company has used the cash windfall from Covid-driven demand to ramp up a significant capital return program ($12B in buybacks this year alone) to go along with a solid 2.3% dividend yield. In the past five years, Lowe’s has reduced its share count by close to 25%. We also believe much of the bad news is already priced into the stock with it trading at 13x forward earnings, compared to its long-term average of 17x.
NextEra Energy, Inc. (NEE) – NEE is the largest publicly-traded utility in the U.S. and one of the biggest renewable power providers in the world. The company has two main businesses: a regulated utility in Florida (Florida Power & Light) and a renewables division. We are attracted to the company as NEE’s cash cow FPL division, which operates in a favorable regulatory environment, is used to fund the buildout of the renewable power piece. NEE should be able to compound earnings per share (EPS) at a 6%-8% rate for the next several years to go along with its 2.0% dividend yield. As we are seeing today, the stock would be a prime beneficiary of any clean energy legislation from Congress.
QUALCOMM, Inc. (QCOM) – While we acknowledge the global slowdown in overall smartphone demand, much of the weakness year-to-date comes from the low end of the handset market. QCOM over-indexes to the premium tier which has held up better from a unit volume perspective while content gains are also more significant. A global economic slowdown could certainly disrupt the consumer’s appetite for higher ticket electronic devices, however, we expect rising 5G penetration of the overall handset market and content gains to remain multi-year drivers to the QCOM story.
SL Green Realty Corporation (SLG) – SLG is an office Real Estate Office Trust (REIT) primarily exposed to New York City, and has $2B in variable rate debt, making it more vulnerable to rising rates and wider credit spreads. Debt reduction is a focus and should accelerate in late 2023 as a major project will be finished and joint ventured with a partner. Despite rising occupancy, higher interest rates have led to lower Funds From Operations (FFO) estimates for 2023. Shares of SLG trade at a very significant discount to estimates of net asset value of ~$80 per share. While risks are at the higher end of securities we hold in VIP, the risk/reward at current prices seems to be very favorable and we get to receive the 8% dividend yield as the Manhattan office market gradually recovers.
Recent Sales:
Newmont Corporation (NEM) – Our holding period with NEM has been a bit of a rollercoaster over the past two years as the price of gold traded in a wide range between $1,700 and $2,100. More recently, the hawkishness from the Federal Reserve System (FED) has put renewed pressure on metals prices and we believe that it is likely to take some time before we see a true “Fed pivot” that should drive nice gains for gold prices and NEM. Additionally, the company continues to face significant cost pressures that are unlikely to abate in the near term. As such, we elect to sell our position and redeploy the capital into other situations where we believe the risk/reward is more favorable.
United Parcel Service, Inc. (UPS) – Shares of UPS have outperformed the market this year amidst very strong pricing power and a continued business transformation under CEO Carol Tome. While we continue to like the UPS story, the stock had grown to an outsized position and we are a bit cautious about the impact of declining volumes in the face of a slowing economy and continued cost inflation. As such, we elect to trim our position and deploy the proceeds in two names we view as more timely.
Davenport Equity Opportunities Fund (DEOPX)
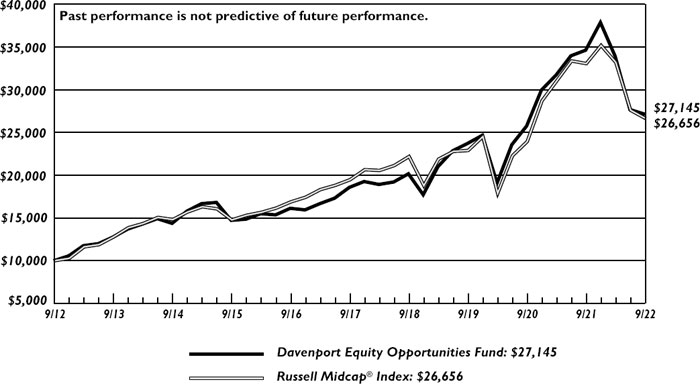
The following chart represents Davenport Equity Opportunities Fund (DEOPX) performance and the performance of the Russell Midcap® Index, the Fund’s primary benchmark, and the S&P 500 Index for the periods ended September 30, 2022.
| | | | | | | Since |
| | | | | | | Inception* |
| | Q3 2022 | 1 Year | 3 Years* | 5 Years* | 10 Years* | 12/31/10 |
| Equity Opportunities Fund (DEOPX) | -1.95% | -21.62% | 4.60% | 7.88% | 10.50% | 10.67% |
| Russell Midcap® Index** | -3.44% | -19.39% | 5.19% | 6.48% | 10.30% | 9.78% |
| S&P 500® Index** | -4.88% | -15.47% | 8.16% | 9.24% | 11.70% | 11.51% |
30-Day SEC Yield: 0.33%; Expense Ratio in current prospectus: 0.88%
Past performance is no guarantee of future results. Investment return and principal value of an investment will fluctuate so that an investor’s shares, when redeemed, may be worth more or less than their original cost. Current performance may be lower or higher than the performance data quoted. Performance data, current to the most recent month-end, may be obtained by calling 1-800-281-3217.
| * | Returns greater than one year are annualized. |
| ** | The Russell Midcap® Index measures the performance of the 800 smallest companies in the Russell 1000, which represents approximately 25% of the total market capitalization of the Russell 1000®. The S&P 500® Index is comprised of 500 U.S. stocks and is an indicator of the performance of the overall U.S. stock market. Standard & Poor’s Financial Services LLC, a division of S&P Global, is the source and owner of the registered trademarks related to the S&P 500® Index. An investor cannot invest in an index and its returns are not indicative of the performance of any specific investment. |
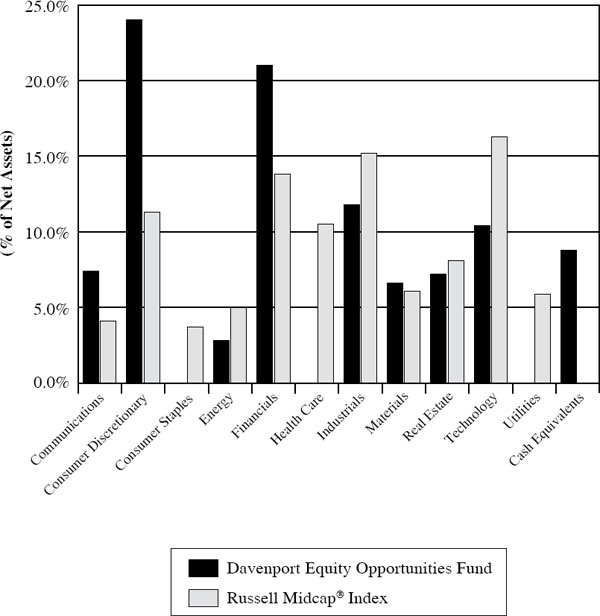
The Davenport Equity Opportunities Fund (DEOPX) declined 1.95% during the third quarter, faring slightly better than the 3.44% decline for the Russell Midcap® Index. While the Fund’s 28.33% year-to-date decline continues to lag the 24.27% decline for the Index, we were pleased to exhibit some relative resilience during the period and continue to take steps we feel position the Fund for future outperformance.
O’Reilly Automotive, Inc. (ORLY), Etsy Inc. (ETSY) and DraftKings, Inc. (DKNG) were the Fund’s top three contributors during the quarter. As a reminder, we added to each in the prior period, taking advantage of what we perceived to be oversold conditions and favorable risk/ reward setups. On the negative side of the ledger, Markel Corp. (MKL), Fairfax Financial Holdings Ltd. (FRFHF) and Dish Network Corp. (DISH) were top detractors for the period. After proving resilient throughout much of the year, Markel and Fairfax succumbed to selling pressure around earnings, where investor concerns around mark-downs in the companies’ investment portfolios seemed to outweigh solid underwriting profitability and longer term ability to take advantage of higher interest rates. Though each has its own unique set of value drivers, we believe both stocks look compelling at current levels and are comfortable with them remaining among our largest positions.
We added exposure to American Tower Corp. (AMT) and Live Nation Entertainment, Inc. (LYV) during the quarter. AMT remains one of the highest return, most durable businesses we follow and should be able to grow at an outsized rate as it benefits from tailwinds such as the domestic 5G upgrade cycle, DISH Networks’ greenfield 5G build, international M&A (mergers & acquisitions) and increased wireless penetration in emerging markets. All told, we believe the business is capable of compounding cash flows at an 8-10% clip with little risk while continuing to grow the dividend at a commensurate rate. Putting it all together, we think the shares can produce a total return in the low double-digits from current levels, which is likely to stand out in a macro environment facing headwinds from higher interest rates and slowing growth. Despite nearly every operating metric at an all-time high and a 2023 artist pipeline as large as the company has seen, shares of Live Nation have retreated nearly 35% this year alongside consumer concerns and broader multiple compression for the market in general. Though an economic slowdown seems unavoidable, we think this is a compelling opportunity to add exposure to a near monopoly operating in an industry with extremely attractive secular growth drivers enabled by music streaming, the “experience economy” and artist’s growing reliance on live events as primary income streams.
We initiated a position in Pool Corp. (POOL), the world’s largest wholesale distributor of swimming pool supplies, equipment, and related products. Put simply, POOL is a best-in-class growth story with high returns on capital, a wide moat at 4x the size of its nearest competitor, a pristine balance sheet with net debt/EBITDA (earnings before interest, taxes, depreciation, and amortization) <1.5x, and strong cash flow with 100% of EPS (earnings per share) converted to free cash flow. This, coupled with a valuation approaching levels last seen during the housing crash, suggests now is a good time to begin building a position in this high-quality compounder. Though concerns around the housing cycle are likely to linger, we note that only 20% of POOL revenues are exposed to new pool construction. While new pool construction may pause, this should free up labor for the large backlog of repair/refurbishments. Additionally, the 60% of the business that is maintenance related should continue to grow (as it did during the financial crisis). Ultimately, we feel the stock’s 45% year-to-date decline goes a long way to discount concerns
around difficult comparisons and a challenging housing environment. Longer term, we think the company can compound earnings in the low-to-mid-teens, which should result in meaningful share price appreciation from current levels.
In sum, we remained active during the quarter, putting funds to work in a number of high quality names that rarely yield buying opportunities. As a result, we feel the Fund offers an element of timeliness, while also remaining flexible through an elevated cash balance of ~7.9%.
Recent Purchases:
Live Nation Entertainment (LYV) – As a reminder, we reintroduced the position to the fund in the fall of 2020 anticipating a significant re-acceleration in results due to the unwinding of lockdowns and substantial pent up demand for live events. Subsequently, we elected to trim the position in 2021 as the stock price surged to new highs. Despite nearly every operating metric at an all-time high and a 2023 artist pipeline as large as the company has seen, the stock has retreated nearly 35% this year alongside consumer concerns and broader multiple compression for the market in general. Though an economic slowdown seems unavoidable, we think this is a compelling opportunity to add exposure to a near monopoly operating in an industry with extremely attractive secular growth drivers.
Pool Corporation (POOL) – POOL is the world’s largest wholesale distributor of swimming pool supplies, equipment, and related products and one of the leading distributors of irrigation and landscape products in the U.S. POOL serves over 120K customers from 416 locations, selling over 200K different products. Roughly 60% of sales are for maintenance of existing pools, 20% are new construction, and 20% are from replacement/refurbishment of aging pools. Put simply, POOL is a best-in-class growth story with a wide moat and long runway, pristine balance sheet, and strong cash flow. This, coupled with a valuation approaching levels last seen during the housing crash, and we think now is a good time to begin building a position in this high-quality compounder.
Take-Two Interactive Software, Inc. (TTWO) – TTWO has been a relative underperformer this year following the company’s announcement to acquire mobile game publisher Zynga in a cash-and-stock deal for ~$12.7bn. The deal closed in late May, and all eyes were on the FY23 (fiscal year) Q1 earnings release and management’s commentary around the Zynga integration and consolidated company outlook. The company highlighted early momentum with the Zynga integration and reiterated expectations for $100mm in annual cost synergies within two years of the deal close as well as longer-term $500mm of annual net bookings opportunities. We think the post-quarter reset and current valuation offers an attractive risk/reward opportunity and elect to add to our position.
Recent Sales:
Align Technology, Inc. (ALGN) – We lament selling into weakness, but we believe the likely deterioration in the company’s near-to-intermediate term outlook justifies a more cautious approach. Though we remain attracted to ALGN’s leading position in a secularly growing category, we are concerned that the discretionary demand profile and high price point of the company’s products may leave results vulnerable during a period of consumer retrenchment. This business checks a lot of the boxes we look for and we may look to revisit it in the future. However, we thought it prudent to harvest the loss and redeploy the funds into a situation with a more optimal risk/reward setup.
Builders FirstSource, Inc. (BLDR) – BLDR is a leading distributor of building materials and related products to homebuilders nationwide. Shares of BLDR have rallied nearly 50% from recent lows as interest rates retreated and the company posted another stellar quarter. While we remain positive on the long-term outlook for housing, we acknowledge that there is likely to be some near-term weakness given affordability concerns. As such, and following the recent run, we think risk/reward is a bit more balanced and elect to take some profits in the name.
Caesars Entertainment, Inc. (CZR) – The stock has been very weak of late and selling at this price is frustrating. However, the tax loss could be valuable for some and a couple things have changed fundamentally. For one, the consumer outlook has clearly darkened with prospects for a recession rising. Two, interest rates have risen and credit spreads have widened, creating an incremental risk for levered entities such as CZR. To be clear, we don’t expect results to collapse or for this to become a distressed situation. In our opinion, results in most markets generally remain strong (especially Vegas) and the company’s digital sports betting business is turning the corner towards profitability. We might re-visit this name in the future, but for now the value of the tax loss and aforementioned headwinds cause us to move on.
Etsy, Inc. (ETSY) – Shares of ETSY have rallied ~40% since we last added to the position in late May. We continue to have a favorable long-term outlook for ETSY and its differentiated brand within the highly competitive e-commerce world, but felt it prudent to take some profits on the recent strength as the risk/reward profile seems more balanced.
Davenport Small Cap Focus Fund (DSCPX)
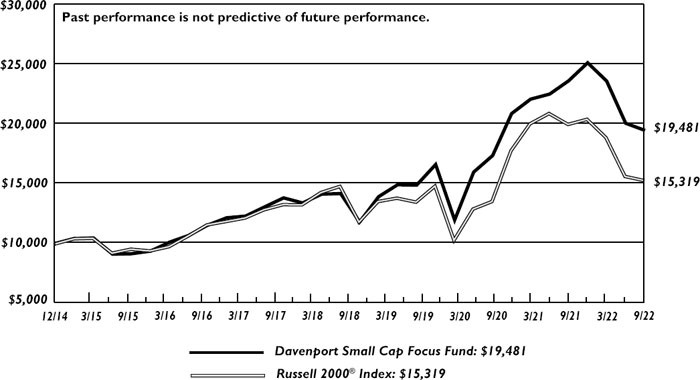
This chart represents Davenport Small Cap Focus Fund (DSCPX) performance and the performance of the Russell 2000® Index, the Small Cap Focus Fund’s primary benchmark, for the periods ended September 30, 2022.
| | | | | | Since |
| | | | | | Inception* |
| | Q3 2022 | 1 Year | 3 Years* | 5 Years* | 12/31/14 |
| Small Cap Focus Fund (DSCPX) | -2.95% | -17.57% | 9.39% | 8.33% | 8.99% |
| Russell 2000® Index** | -2.19% | -23.50% | 4.29% | 3.55% | 5.66% |
30-Day SEC Yield: 0.45%; Expense Ratio in current prospectus: 0.89%
Past performance is no guarantee of future results. Investment return and principal value of an investment will fluctuate so that an investor’s shares, when redeemed, may be worth more or less than their original cost. Current performance may be lower or higher than the performance data quoted. Performance data, current to the most recent month-end, may be obtained by calling 1-800-281-3217.
| * | Returns greater than one year are annualized. |
| ** | The Russell 2000® Index measures the performance of the 2,000 smallest companies in the Russell 3000® Index, representing approximately 8% of the total market capitalization of the Russell 3000. An investor cannot invest in an index and its returns are not indicative of the performance of any specific investment. |
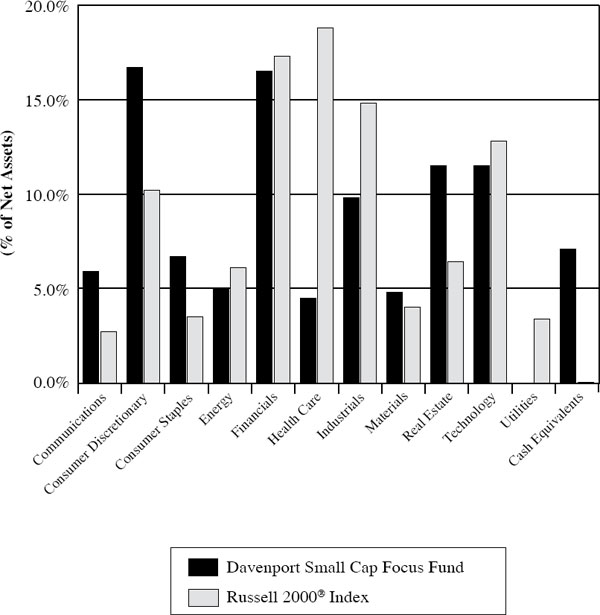
The Davenport Small Cap Focus Fund (DSCPX) declined 2.95% during the third quarter, slightly lagging the 2.19% decline for the Russell 2000® Index. For the year, the Fund is down 22.52%, maintaining a slight edge over the 25.10% decline for the Index.
After highlighting the name in last quarter’s letter, we were pleased to see online sports betting leader DraftKings, Inc. (DKNG) chip in as the Fund’s top contributor. While timing certainly played a part (majority of the position established in May and June), we have been encouraged to see continued industry-wide spending discipline alongside solid top line momentum. Ultimately, we still see significant upside as the company gets closer to profitability. Additionally, the Fund enjoyed strong performance from specialty insurer Kinsale Capital Group, Inc. (KNSL) and HR software provider Alight, Inc. (ALIT). Two of our telecommunications plays, Liberty Latin America Ltd (LILAK) and Shenandoah Telecommunications Co. (SHEN) were both down sharply as the group came under pressure, but we think each has unique value drivers that can help them buck industry trends over time. Newly established holding Peyto Exploration & Development Corp. (PEYUF) got off to a rocky start as the energy sector cooled, but for the reasons highlighted below, we remain constructive on the longer term outlook for capital appreciation and capital return.
While we tend to shy away from commodity producers, we view Peyto Exploration and Development as a high quality company with strong cash generation and a unique value proposition. Peyto is a Canadian natural gas producer with long-lived and low-cost reserves that can benefit not only from rising natural gas prices, but also an increased appreciation of politically secure, lower carbon energy assets. Broadly, we are constructive on the outlook for hydrocarbon prices for the next several years given producer discipline, years of underinvestment, diversion of capital to renewables and regulatory constraints. More specifically, we believe North American natural gas assets are particularly valuable given the commodity’s important role as a “bridge fuel” during the energy transition process. Peyto’s stock has recently lagged behind the performance of other natural gas levered names due to transportation bottleneck issues in the Alberta Province, where its assets reside. Ultimately, we feel investor concerns on this topic are overblown and note that the company’s current cash flow profile should support its dividend (current yield of ~5%) as well as material debt reduction. Furthermore, we look for a substantial distribution increase in 2023 as the company continues to focus on returning capital to shareholders.
We also added to our position in Enovis Corp. (ENOV) during the quarter. Enovis is a medical technology company that was formerly known as Colfax Corp. In April 2022, Colfax separated its welding business (ESAB) and renamed itself Enovis. ENOV has two attractive businesses in a fast growing reconstructive business (shoulder, hip, and knee replacements) and a stable prevention & recovery business (includes braces that athletes wear or aircasts for sprained/broken extremities). Enovis is modeled after Danaher Corp. (DHR), which is famous for its success implementing strategic M&A (mergers & acquisitions) and supplementing deals with its proprietary continuous improvement philosophy. Given the company’s strong portfolio of brands, solid cash generation and low market penetration, we think Enovis can put these principles to work successfully. This confidence is supported by the fact that Danaher founder Mitch Rales will be overseeing this process as the chairman of Enovis’ board. Ultimately, we think ENOV can grow high-single digits over the coming years, which when coupled with significant margin expansion opportunities, should drive double-digit earnings and cash flow growth. Additionally, the company’s net debt free balance sheet should allow Enovis to recycle capital into additional M&A. With the stock trading at a significant discount to peers, we view the valuation as attractive.
In closing, we are pleased with the Fund’s modest resilience and remain encouraged by the opportunities we see to put cash to work. Though we have taken several actions that we believe enhance the risk/reward profile of the Fund as a whole, we still have significant dry powder for
future opportunities via a cash balance of ~7%. Finally, we note that we continue to think the small cap universe appears attractive following years of underperformance and believe our roster of companies is poised to shine in a variety of market backdrops.
Davenport Balanced Income Fund (DBALX)
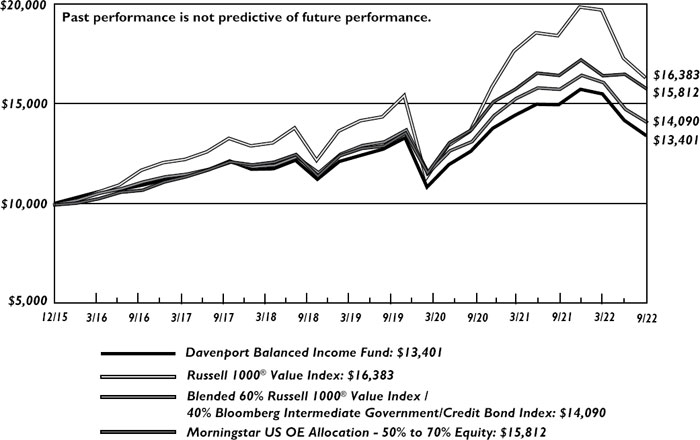
The following chart represents Davenport Balanced Income Fund (DBALX) performance and performance of the Fund’s primary benchmark, the Russell 1000® Value Index for the period ended September 30, 2022.
| | | | | | Since |
| | | | | | Inception* |
| | Q3 2022 | 1 Year | 3 Year* | 5 Year* | 12/31/15 |
| Balanced Income Fund (DBALX) | -5.40% | -10.34% | 1.75% | 2.79% | 4.43% |
| Russell 1000® Value Index** | -4.53% | -10.60% | 2.39% | 3.70% | 5.21% |
30-Day SEC Yield: 2.78%; Expense Ratio in current prospectus: 0.93%
Past performance is no guarantee of future results. Investment return and principal value of an investment will fluctuate so that an investor’s shares, when redeemed, may be worth more or less than their original cost. Current performance may be lower or higher than the performance data quoted. Performance data, current to the most recent month-end, may be obtained by calling 1-800-281-3217.
| * | Returns greater than one year are annualized. |
| ** | The Russell 1000® Value Index measures the performance of the Russell 1000 companies with lower price-to-book ratios and lower forecasted growth values |
The Davenport Balanced Income Fund (DBALX) declined 5.40% during the third quarter of 2022 compared to the 4.53% decline for the blended 60% Russell 1000® Value and 40% Bloomberg Intermediate Government/Credit Index. Year-to-date, the Fund is down 14.75% compared to the 14.41% decrease for the blended benchmark.
After a rocky second quarter, equities began Q3 with an impressive rally alongside hopes of peaking inflation and a pivot in Fed policy. The rebound proved to be short-lived as the Fed reiterated its stance on the need for continued restrictive policy, and equities declined throughout the remainder of the quarter. Growth stocks managed to outperform their value counterparts during the quarter, but large cap value still remains ahead of growth by roughly 13 percentage points for the year. While market declines are never anything to celebrate, we are pleased to see the Fund hold up nicely as we enter the final lap of a volatile year.
The Fund’s equity performance was led by a diverse group of stocks during the quarter, including Watsco, Inc. (WSO) and Cannae Holdings, Inc. (CNNE), with each stock’s returns driven by company-specific factors that allowed them to stand out amid broader weakness. The biggest detractors to equity performance included Comcast Corp. (CMCSA) and Sony Group Corp. (SONY). Comcast has been under fire amid declining broadband subscribers, but shares now trade at an all-time low valuation. Additionally, the company has ramped up capital return and the combination of dividends and stock repurchases now equates to a very attractive ~10% yield to investors. Once a very strong performer for the Fund, Sony is well off its highs due to concerns around the segments more exposed to macroeconomic fluctuations (e.g. image sensors) as well
as weakness in the Japanese Yen. We continue to like the company and the transformation it has made to an entertainment conglomerate, and feel the stock trades at a 25+% discount to our sum-of-the-parts calculation.
While we did not introduce any new equity positions to the Fund during the quarter, we did take advantage of the market volatility to add to some of our existing positions. One name we elected to add to in July was NextEra Energy (NEE), the largest publicly traded utility in the US and a major renewable energy provider. NEE’s regulated business (Florida Power & Light) generates significant cash flow, allowing NextEra to fund the buildout of the renewable power segment. The company has a pristine balance sheet and pays a nice dividend which has grown 10% annually, which we expect to continue going forward given the highly visible growth from both business segments. Other names we added to during the quarter include Berkshire Hathaway, Inc. (BRK.B), QUALCOMM, Inc. (QCOM), and SL Green Realty Corp. (SLG).
The Fund’s fixed income allocation consists of 37 high quality bonds across ten sectors with the top allocations including financials at 19.4%, U.S. Treasuries at 19.4%, consumer non-cyclical at 7.8%, and consumer cyclical at 6.8%. The credit quality of the fixed portion remains high investment grade with an effective maturity of 2.64 years, yield to worst of 4.81%, a duration of 2.26 years, down from 3.44 years at the beginning of the 2022. Our allocation to floating rate notes within the fixed income portion of the Fund decreased to 11.79% from 13.84% at the end of Q2 2022.
During Q3, the Fed raised the Fed funds rate twice taking it from 1.75% to a range of 3.00%-3.25% in the attempt to cool down inflation. This benefits our floating rate positions, as their coupons increase with Fed fund hikes and the respective moves in LIBOR (London Interbank Offered Rate) and SOFR (U.S. Secured Overnight Funding Rate). As the front end of the yield curve has repriced due to Fed’s communicated hawkishness, we have had great opportunities to initiate higher yielding fixed corporate paper and short-term U.S. Treasuries. We initiated positions in Lowes (LOW 4.4 2025) after selling AT&T (T 0.9 2024). In terms of Treasuries, we were able to pick up very attractive yields in the one and two year part of the curve, purchasing these bonds at below par. We continue to look for attractive opportunities in the front-end part of the yield curve and remain conservative until we get clearer economic data and Fed guidance before potentially increasing duration and/or credit risk.
In closing, we are pleased to see our balanced approach to investing provide the volatility buffer as intended. As always, we believe our allocation to dividend-paying, value-oriented equities should position the Fund nicely for long-term capital appreciation. Additionally, our defensive fixed income positioning should continue to provide current income and a volatility buffer in the near-term.
Sincerely,
George L. Smith III, CFA
Chair of the Investment Policy Committee
DAVENPORT CORE FUND
PERFORMANCE INFORMATION (Unaudited)
Comparison of the Change in Value of a $10,000 Investment in
Davenport Core Fund and the S&P 500® Index

| | | Average Annual Total Returns | |
| | | (for periods ended September 30, 2022) | |
| | | | |
| | | 1 Year | | 5 Years | | 10 Years | |
| Davenport Core Fund (a) | | -19.65% | | 6.25% | | 9.59% | |
| S&P 500® Index | | -15.47% | | 9.24% | | 11.70% | |
| (a) | The total returns shown do not reflect the deduction of taxes that a shareholder would pay on Fund distributions or the redemption of Fund shares. |
DAVENPORT VALUE & INCOME FUND
PERFORMANCE INFORMATION (Unaudited)
Comparison of the Change in Value of a $10,000 Investment in
Davenport Value & Income Fund, the Russell 1000® Value Index
and the Lipper Equity Income Index
| | | Average Annual Total Returns | |
| | | (for periods ended September 30, 2022) | |
| | | | |
| | | 1 Year | | 5 Years | | 10 Years | |
| Davenport Value & Income Fund (a) | | -12.76% | | 3.83% | | 8.18% | |
| Russell 1000® Value Index | | -11.36% | | 5.29% | | 9.17% | |
| Lipper Equity Income Index | | -8.18% | | 6.36% | | 9.10% | |
| (a) | The total returns shown do not reflect the deduction of taxes that a shareholder would pay on Fund distributions or the redemption of Fund shares. |
DAVENPORT EQUITY OPPORTUNITIES FUND
PERFORMANCE INFORMATION (Unaudited)
Comparison of the Change in Value of a $10,000 Investment in
Davenport Equity Opportunities Fund and the Russell Midcap® Index
| | | Average Annual Total Returns | |
| | | (for periods ended September 30, 2022) | |
| | | | |
| | | 1 Year | | 5 Years | | 10 Years | |
| Davenport Equity Opportunities Fund (a) | | -21.62% | | 7.88% | | 10.50% | |
| Russell Midcap® Index | | -19.39% | | 6.48% | | 10.30% | |
| (a) | The total returns shown do not reflect the deduction of taxes that a shareholder would pay on Fund distributions or the redemption of Fund shares. |
DAVENPORT SMALL CAP FOCUS FUND
PERFORMANCE INFORMATION (Unaudited)
Comparison of the Change in Value of a $10,000 Investment in
Davenport Small Cap Focus Fund and the Russell 2000® Index
| | | Average Annual Total Returns | |
| | | (for periods ended September 30, 2022) | |
| | | | |
| | | | | | | Since | |
| | | 1 Year | | 5 Years | | Inception(b) | |
| Davenport Small Cap Focus Fund (a) | | -17.57% | | 8.33% | | 8.99% | |
| Russell 2000® Index | | -23.50% | | 3.55% | | 5.66% | |
| (a) | The total returns shown do not reflect the deduction of taxes that a shareholder would pay on Fund distributions or the redemption of Fund shares. |
| (b) | Commencement of operations was December 31, 2014. |
DAVENPORT BALANCED INCOME FUND
PERFORMANCE INFORMATION (Unaudited)
Comparison of the Change in Value of a $10,000 Investment in Davenport Balanced
Income Fund, the Russell 1000® Value Index, a Blended 60% Russell 1000® Value
Index / 40% Bloomberg Intermediate Government/Credit Bond Index
and the Morningstar US OE Allocation – 50% to 70% Equity
| | | Average Annual Total Returns | |
| | | (for periods ended September 30, 2022) | |
| | | | |
| | | | | | | Since | |
| | | 1 Year | | 5 Years | | Inception(b) | |
| Davenport Balanced Income Fund (a) | | -10.34% | | 2.79% | | 4.43% | |
| Russell 1000® Value Index | | -11.36% | | 5.29% | | 7.59% | |
| Blended 60% Russell 1000® Value Index / 40% Bloomberg Intermediate Government/Credit Bond Index | | -10.60% | | 3.70% | | 5.21% | |
| Morningstar US OE Allocation - 50% to 70% Equity | | -4.10% | | 6.10% | | 7.02% | |
| (a) | The total returns shown do not reflect the deduction of taxes that a shareholder would pay on Fund distributions or the redemption of Fund shares. |
| (b) | Commencement of operations was December 31, 2015. |
DAVENPORT CORE FUND
PORTFOLIO INFORMATION
September 30, 2022 (Unaudited)
Sector Allocation vs. the S&P 500® Index
Top Ten Equity Holdings
| Security Description | | % of Net Assets |
| Alphabet, Inc. - Classes A and C | | 4.5% |
| Pioneer Natural Resources Company | | 4.2% |
| Amazon.com, Inc. | | 4.1% |
| Danaher Corporation | | 4.0% |
| Johnson & Johnson | | 3.6% |
| Microsoft Corporation | | 3.5% |
| T-Mobile US, Inc. | | 3.5% |
| Brookfield Asset Management, Inc. - Class A | | 3.4% |
| Markel Corporation | | 3.4% |
| Apple, Inc. | | 3.2% |
DAVENPORT VALUE & INCOME FUND
PORTFOLIO INFORMATION
September 30, 2022 (Unaudited)
Sector Allocation vs. the Russell 1000® Value Index
Top Ten Equity Holdings
| Security Description | | % of Net Assets |
| Johnson & Johnson | | 4.5% |
| Berkshire Hathaway, Inc. - Class B | | 3.6% |
| Brookfield Asset Management, Inc. - Class A | | 3.5% |
| Coterra Energy, Inc. | | 3.5% |
| Fairfax Financial Holdings Ltd. | | 3.4% |
| McDonald’s Corporation | | 3.1% |
| Watsco, Inc. | | 2.9% |
| Lamar Advertising Company - Class A | | 2.7% |
| Markel Corporation | | 2.6% |
| QUALCOMM, Inc. | | 2.4% |
DAVENPORT EQUITY OPPORTUNITIES FUND
PORTFOLIO INFORMATION
September 30, 2022 (Unaudited)
Sector Allocation vs. the Russell Midcap® Index
Top Ten Equity Holdings
| Security Description | | % of Net Assets |
| O’Reilly Automotive, Inc. | | 7.6% |
| Fairfax Financial Holdings Ltd. | | 6.2% |
| Markel Corporation | | 5.9% |
| Brookfield Asset Management, Inc. - Class A | | 5.7% |
| Take-Two Interactive Software, Inc. | | 4.7% |
| Martin Marietta Materials, Inc. | | 3.9% |
| Alight, Inc. - Class A | | 3.8% |
| Black Knight, Inc. | | 3.7% |
| American Tower Corporation | | 3.7% |
| Cannae Holdings, Inc. | | 3.6% |
DAVENPORT SMALL CAP FOCUS FUND
PORTFOLIO INFORMATION
September 30, 2022 (Unaudited)
Sector Allocation vs. the Russell 2000® Index
Top Ten Equity Holdings
| Security Description | | % of Net Assets |
| Monarch Casino & Resort, Inc. | | 6.6% |
| Alight, Inc. - Class A | | 4.8% |
| Cannae Holdings, Inc. | | 4.8% |
| NewMarket Corporation | | 4.8% |
| Perrigo Company plc | | 4.5% |
| Verra Mobility Corporation | | 4.2% |
| J & J Snack Foods Corporation | | 4.1% |
| Kinsale Capital Group, Inc. | | 3.9% |
| Stewart Information Services Corporation | | 3.6% |
| Janus International Group, Inc. | | 3.6% |
DAVENPORT BALANCED INCOME FUND
PORTFOLIO INFORMATION
September 30, 2022 (Unaudited)
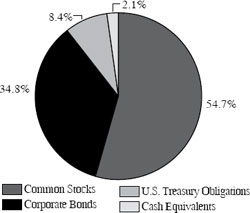
Asset Allocation (% of Net Assets)
| Ten Largest Equity Holdings | | % of Net Assets |
| Johnson & Johnson | | 2.1% |
| Perrigo Company plc | | 1.8% |
| Berkshire Hathaway, Inc. - Class B | | 1.7% |
| Coterra Energy, Inc. | | 1.6% |
| Brookfield Asset Management, Inc. - Class A | | 1.6% |
| Fairfax Financial Holdings Ltd. | | 1.6% |
| McDonald’s Corporation | | 1.4% |
| SL Green Realty Corporation | | 1.4% |
| Watsco, Inc. | | 1.4% |
| Lamar Advertising Company - Class A | | 1.3% |
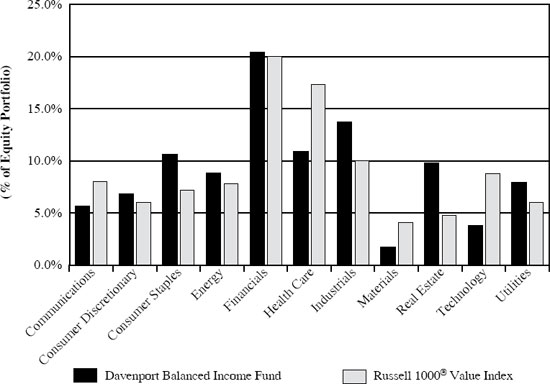
Equity Sector Concentration vs. the Russell 1000® Value Index (54.7% of Net Assets)
| Bond Portfolio (43.2% of Net Assets) | | |
| Number of Fixed-Income Securities | 37 | |
| Average Quality | A+/A | |
| Effective Maturity | 2.64 | yrs. |
| Average Effective Duration | 2.26 | yrs. |
| | | |
| | % of Bond | |
| Sector Breakdown | Portfolio | |
| Communications | 2.7% | |
| Consumer Discretionary | 7.8% | |
| Consumer Staples | 6.8% | |
| Energy | 6.6% | |
| Financials | 19.4% | |
| Health Care | 10.4% | |
| Industrials | 8.3% | |
| Materials | 4.7% | |
| Real Estate | 6.3% | |
| Technology | 4.9% | |
| Utilities | 2.7% | |
| U.S. Treasury | 19.4% | |
| Credit Quality | Composite Quality | |
| AAA | 19.36% | |
| AA | 7.14% | |
| A | 28.29% | |
| BBB | 45.21% | |
| Ba | 0.00% | |
| DAVENPORT CORE FUND |
| SCHEDULE OF INVESTMENTS |
| September 30, 2022 (Unaudited) |
| COMMON STOCKS — 96.2% | | Shares | | | Value | |
| Communications — 14.2% | | | | | | |
| Alphabet, Inc. - Class A (a) | | | 165,800 | | | $ | 15,858,770 | |
| Alphabet, Inc. - Class C (a) | | | 140,720 | | | | 13,530,228 | |
| Booking Holdings, Inc. (a) | | | 5,669 | | | | 9,315,357 | |
| Electronic Arts, Inc. | | | 100,594 | | | | 11,639,732 | |
| Meta Platforms, Inc. - Class A (a) | | | 75,713 | | | | 10,272,740 | |
| T-Mobile US, Inc. (a) | | | 170,429 | | | | 22,866,459 | |
| Walt Disney Company (The) (a) | | | 106,750 | | | | 10,069,728 | |
| | | | | | | | 93,553,014 | |
| Consumer Discretionary — 10.2% | | | | | | | | |
| Amazon.com, Inc. (a) | | | 236,300 | | | | 26,701,900 | |
| CarMax, Inc. (a) | | | 151,983 | | | | 10,033,918 | |
| Home Depot, Inc. (The) | | | 35,678 | | | | 9,844,987 | |
| TJX Companies, Inc. (The) | | | 330,596 | | | | 20,536,624 | |
| | | | | | | | 67,117,429 | |
| Consumer Staples — 1.7% | | | | | | | | |
| Constellation Brands, Inc. - Class A | | | 49,590 | | | | 11,389,831 | |
| | | | | | | | | |
| Energy — 5.4% | | | | | | | | |
| EOG Resources, Inc. | | | 71,335 | | | | 7,970,259 | |
| Pioneer Natural Resources Company | | | 127,162 | | | | 27,534,388 | |
| | | | | | | | 35,504,647 | |
| Financials — 14.5% | | | | | | | | |
| Aon plc - Class A | | | 49,035 | | | | 13,135,006 | |
| Bank of America Corporation | | | 289,355 | | | | 8,738,521 | |
| Berkshire Hathaway, Inc. - Class B (a) | | | 68,270 | | | | 18,229,455 | |
| Brookfield Asset Management, Inc. - Class A | | | 542,090 | | | | 22,166,060 | |
| JPMorgan Chase & Company | | | 104,842 | | | | 10,955,989 | |
| Markel Corporation (a) | | | 20,348 | | | | 22,061,709 | |
| | | | | | | | 95,286,740 | |
| Health Care — 11.5% | | | | | | | | |
| Abbott Laboratories | | | 105,732 | | | | 10,230,628 | |
| Danaher Corporation | | | 101,875 | | | | 26,313,294 | |
| Johnson & Johnson | | | 145,602 | | | | 23,785,543 | |
| UnitedHealth Group, Inc. | | | 30,261 | | | | 15,283,015 | |
| | | | | | | | 75,612,480 | |
| Industrials — 4.1% | | | | | | | | |
| Honeywell International, Inc. | | | 86,581 | | | | 14,456,430 | |
| Union Pacific Corporation | | | 65,908 | | | | 12,840,196 | |
| | | | | | | | 27,296,626 | |
| DAVENPORT CORE FUND |
| SCHEDULE OF INVESTMENTS (Continued) |
| COMMON STOCKS — 96.2% (Continued) | | Shares | | | Value | |
| Materials — 8.1% | | | | | | |
| Air Products & Chemicals, Inc. | | | 81,373 | | | $ | 18,937,938 | |
| Martin Marietta Materials, Inc. | | | 57,973 | | | | 18,672,524 | |
| Sherwin-Williams Company (The) | | | 77,115 | | | | 15,789,296 | |
| | | | | | | | 53,399,758 | |
| Real Estate — 2.7% | | | | | | | | |
| American Tower Corporation | | | 82,369 | | | | 17,684,624 | |
| | | | | | | | | |
| Technology — 23.8% | | | | | | | | |
| Accenture plc - Class A | | | 65,677 | | | | 16,898,692 | |
| Adobe, Inc. (a) | | | 60,470 | | | | 16,641,344 | |
| Apple, Inc. | | | 150,747 | | | | 20,833,236 | |
| Broadcom, Inc. | | | 28,113 | | | | 12,482,453 | |
| Intuit, Inc. | | | 26,985 | | | | 10,451,830 | |
| Mastercard, Inc. - Class A | | | 62,762 | | | | 17,845,747 | |
| Microsoft Corporation | | | 99,418 | | | | 23,154,452 | |
| Moody’s Corporation | | | 37,574 | | | | 9,134,615 | |
| ServiceNow, Inc. (a) | | | 23,684 | | | | 8,943,315 | |
| Sony Group Corporation - ADR | | | 84,425 | | | | 5,407,422 | |
| Visa, Inc. - Class A | | | 81,889 | | | | 14,547,581 | |
| | | | | | | | 156,340,687 | |
| | | | | | | | | |
| Total Common Stocks (Cost $450,156,733) | | | | | | $ | 633,185,836 | |
| | | | | | | | | |
| MONEY MARKET FUNDS — 1.5% | | Shares | | | Value | |
| First American Treasury Obligations Fund - Class Z, 2.83% (b) (Cost $9,864,324) | | | 9,864,324 | | | $ | 9,864,324 | |
| | | | | | | | | |
| Total Investments at Value — 97.7% (Cost $460,021,057) | | | | | | $ | 643,050,160 | |
| | | | | | | | | |
| Other Assets in Excess of Liabilities — 2.3% | | | | | | | 14,846,898 | |
| | | | | | | | | |
| Net Assets — 100.0% | | | | | | $ | 657,897,058 | |
ADR - American Depositary Receipt.
| (a) | Non-income producing security. |
| (b) | The rate shown is the 7-day effective yield as of September 30, 2022. |
See accompanying notes to financial statements.
| DAVENPORT VALUE & INCOME FUND |
| SCHEDULE OF INVESTMENTS |
| September 30, 2022 (Unaudited) |
| COMMON STOCKS — 97.3% | | Shares | | | Value | |
| Communications — 5.7% | | | | | | |
| Alphabet, Inc. - Class A (a) | | | 173,065 | | | $ | 16,553,667 | |
| Comcast Corporation - Class A | | | 529,553 | | | | 15,531,789 | |
| Verizon Communications, Inc. | | | 272,348 | | | | 10,341,054 | |
| | | | | | | | 42,426,510 | |
| Consumer Discretionary — 6.8% | | | | | | | | |
| Cannae Holdings, Inc. (a) | | | 515,540 | | | | 10,651,056 | |
| Lowe’s Companies, Inc. | | | 93,313 | | | | 17,525,115 | |
| McDonald’s Corporation | | | 98,224 | | | | 22,664,206 | |
| | | | | | | | 50,840,377 | |
| Consumer Staples — 11.1% | | | | | | | | |
| Bunge Ltd. | | | 169,735 | | | | 14,015,019 | |
| Diageo plc - ADR | | | 93,450 | | | | 15,868,744 | |
| Kraft Heinz Company (The) | | | 335,010 | | | | 11,172,584 | |
| Philip Morris International, Inc. | | | 202,763 | | | | 16,831,357 | |
| Sysco Corporation | | | 174,159 | | | | 12,314,783 | |
| Walmart, Inc. | | | 95,166 | | | | 12,343,030 | |
| | | | | | | | 82,545,517 | |
| Energy — 8.1% | | | | | | | | |
| Chevron Corporation | | | 125,492 | | | | 18,029,436 | |
| Coterra Energy, Inc. | | | 990,636 | | | | 25,875,412 | |
| Enbridge, Inc. | | | 433,180 | | | | 16,070,978 | |
| | | | | | | | 59,975,826 | |
| Financials — 19.5% | | | | | | | | |
| Berkshire Hathaway, Inc. - Class B (a) | | | 100,068 | | | | 26,720,157 | |
| Brookfield Asset Management, Inc. - Class A | | | 641,892 | | | | 26,246,964 | |
| Capital One Financial Corporation | | | 128,585 | | | | 11,851,680 | |
| Citigroup, Inc. | | | 211,627 | | | | 8,818,497 | |
| Fairfax Financial Holdings Ltd. | | | 54,415 | | | | 24,867,655 | |
| Fidelity National Financial, Inc. | | | 346,344 | | | | 12,537,653 | |
| JPMorgan Chase & Company | | | 138,488 | | | | 14,471,996 | |
| Markel Corporation (a) | | | 17,818 | | | | 19,318,632 | |
| | | | | | | | 144,833,234 | |
| Health Care — 11.0% | | | | | | | | |
| Elevance Health, Inc. | | | 35,226 | | | | 16,001,058 | |
| Johnson & Johnson | | | 206,662 | | | | 33,760,304 | |
| Medtronic plc | | | 207,373 | | | | 16,745,370 | |
| Perrigo Company plc | | | 417,588 | | | | 14,891,188 | |
| | | | | | | | 81,397,920 | |
| Industrials — 15.9% | | | | | | | | |
| 3M Company | | | 113,515 | | | | 12,543,408 | |
| Boeing Company (The) (a) | | | 63,453 | | | | 7,682,889 | |
| Deere & Company | | | 38,997 | | | | 13,020,708 | |
| L3Harris Technologies, Inc. | | | 62,510 | | | | 12,991,453 | |
| DAVENPORT VALUE & INCOME FUND |
| SCHEDULE OF INVESTMENTS (Continued) |
| COMMON STOCKS — 97.3% (Continued) | | Shares | | | Value | |
| Industrials — 15.9% (Continued) | | | | | | | | |
| Norfolk Southern Corporation | | | 74,214 | | | $ | 15,558,965 | |
| TE Connectivity Ltd. | | | 151,609 | | | | 16,731,569 | |
| United Parcel Service, Inc. - Class B | | | 111,010 | | | | 17,932,556 | |
| Watsco, Inc. | | | 83,032 | | | | 21,377,419 | |
| | | | | | | | 117,838,967 | |
| Real Estate — 10.4% | | | | | | | | |
| Crown Castle, Inc. | | | 96,335 | | | | 13,925,224 | |
| Digital Realty Trust, Inc. | | | 108,085 | | | | 10,719,871 | |
| Gaming and Leisure Properties, Inc. | | | 395,013 | | | | 17,475,375 | |
| Lamar Advertising Company - Class A | | | 244,472 | | | | 20,166,495 | |
| SL Green Realty Corporation | | | 376,157 | | | | 15,106,465 | |
| | | | | | | | 77,393,430 | |
| Technology — 4.4% | | | | | | | | |
| QUALCOMM, Inc. | | | 160,725 | | | | 18,158,711 | |
| Sony Group Corporation - ADR | | | 227,700 | | | | 14,584,185 | |
| | | | | | | | 32,742,896 | |
| Utilities — 4.4% | | | | | | | | |
| Dominion Energy, Inc. | | | 234,669 | | | | 16,217,974 | |
| NextEra Energy, Inc. | | | 209,541 | | | | 16,430,110 | |
| | | | | | | | 32,648,084 | |
| | | | | | | | | |
| Total Common Stocks (Cost $662,918,378) | | | | | | $ | 722,642,761 | |
| | | | | | | | | |
| MONEY MARKET FUNDS — 2.6% | | Shares | | | Value | |
| First American Treasury Obligations Fund - Class Z, 2.83% (b) (Cost $19,479,032) | | | 19,479,032 | | | $ | 19,479,032 | |
| | | | | | | | | |
| Total Investments at Value — 99.9% (Cost $682,397,410) | | | | | | $ | 742,121,793 | |
| | | | | | | | | |
| Other Assets in Excess of Liabilities — 0.1% | | | | | | | 516,073 | |
| | | | | | | | | |
| Net Assets — 100.0% | | | | | | $ | 742,637,866 | |
ADR - American Depositary Receipt.
| (a) | Non-income producing security. |
| (b) | The rate shown is the 7-day effective yield as of September 30, 2022. |
See accompanying notes to financial statements.
| DAVENPORT EQUITY OPPORTUNITIES FUND |
| SCHEDULE OF INVESTMENTS |
| September 30, 2022 (Unaudited) |
| COMMON STOCKS — 91.2% | | Shares | | | Value | |
| Communications — 7.4% | | | | | | |
| DISH Network Corporation - Class A (a) | | | 1,175,074 | | | $ | 16,251,273 | |
| Take-Two Interactive Software, Inc. (a) | | | 251,483 | | | | 27,411,647 | |
| | | | | | | | 43,662,920 | |
| Consumer Discretionary — 24.0% | | | | | | | | |
| Builders FirstSource, Inc. (a) | | | 298,707 | | | | 17,599,817 | |
| Cannae Holdings, Inc. (a) | | | 1,018,253 | | | | 21,037,107 | |
| DraftKings Inc. - Class A (a) | | | 1,217,979 | | | | 18,440,202 | |
| Etsy, Inc. (a) | | | 143,448 | | | | 14,363,448 | |
| Live Nation Entertainment, Inc. (a) | | | 209,941 | | | | 15,963,914 | |
| O’Reilly Automotive, Inc. (a) | | | 63,911 | | | | 44,951,802 | |
| Pool Corporation | | | 28,078 | | | | 8,934,700 | |
| | | | | | | | 141,290,990 | |
| Energy — 2.8% | | | | | | | | |
| Coterra Energy, Inc. | | | 623,615 | | | | 16,288,824 | |
| | | | | | | | | |
| Financials — 21.0% | | | | | | | | |
| Brookfield Asset Management, Inc. - Class A | | | 821,483 | | | | 33,590,440 | |
| Fairfax Financial Holdings Ltd. | | | 80,192 | | | | 36,647,744 | |
| Fidelity National Financial, Inc. | | | 516,896 | | | | 18,711,635 | |
| Markel Corporation (a) | | | 31,953 | | | | 34,644,082 | |
| | | | | | | | 123,593,901 | |
| Industrials — 11.8% | | | | | | | | |
| Enovis Corporation (a) | | | 209,524 | | | | 9,652,771 | |
| ESAB Corporation | | | 209,524 | | | | 6,989,720 | |
| Evoqua Water Technologies Corporation (a) | | | 565,052 | | | | 18,686,270 | |
| Watsco, Inc. | | | 72,716 | | | | 18,721,461 | |
| Xylem, Inc. | | | 176,563 | | | | 15,424,544 | |
| | | | | | | | 69,474,766 | |
| Materials — 6.6% | | | | | | | | |
| Martin Marietta Materials, Inc. | | | 71,088 | | | | 22,896,734 | |
| Sherwin-Williams Company (The) | | | 78,506 | | | | 16,074,103 | |
| | | | | | | | 38,970,837 | |
| Real Estate — 7.2% | | | | | | | | |
| American Tower Corporation | | | 102,261 | | | | 21,955,436 | |
| Lamar Advertising Company - Class A | | | 248,061 | | | | 20,462,552 | |
| | | | | | | | 42,417,988 | |
| DAVENPORT EQUITY OPPORTUNITIES FUND |
| SCHEDULE OF INVESTMENTS (Continued) |
| COMMON STOCKS — 91.2% (Continued) | | Shares | | | Value | |
| Technology — 10.4% | | | | | | |
| Alight, Inc. - Class A (a) | | | 3,087,455 | | | $ | 22,631,045 | |
| Autodesk, Inc. (a) | | | 88,206 | | | | 16,476,881 | |
| Black Knight, Inc. (a) | | | 340,534 | | | | 22,042,766 | |
| | | | | | | | 61,150,692 | |
| | | | | | | | | |
| Total Common Stocks (Cost $507,803,876) | | | | | | $ | 536,850,918 | |
| | | | | | | | | |
| MONEY MARKET FUNDS — 8.9% | | Shares | | | Value | |
| First American Treasury Obligations Fund - Class Z, 2.83% (b) (Cost $52,187,075) | | | 52,187,075 | | | $ | 52,187,075 | |
| | | | | | | | | |
| Total Investments at Value — 100.1% (Cost $559,990,951) | | | | | | $ | 589,037,993 | |
| | | | | | | | | |
| Liabilities in Excess of Other Assets — (0.1%) | | | | | | | (572,018 | ) |
| | | | | | | | | |
| Net Assets — 100.0% | | | | | | $ | 588,465,975 | |
| (a) | Non-income producing security. |
| (b) | The rate shown is the 7-day effective yield as of September 30, 2022. |
See accompanying notes to financial statements.
| DAVENPORT SMALL CAP FOCUS FUND |
| SCHEDULE OF INVESTMENTS |
| September 30, 2022 (Unaudited) |
| COMMON STOCKS — 92.9% | | Shares | | | Value | |
| Communications — 5.9% | | | | | | |
| Liberty Latin America Ltd. - Class C (a) | | | 2,563,882 | | | $ | 15,767,874 | |
| Shenandoah Telecommunications Company | | | 796,446 | | | | 13,555,511 | |
| | | | | | | | 29,323,385 | |
| Consumer Discretionary — 16.7% | | | | | | | | |
| Cannae Holdings, Inc. (a) | | | 1,143,964 | | | | 23,634,296 | |
| DraftKings Inc. - Class A (a) | | | 1,100,000 | | | | 16,654,000 | |
| Monarch Casino & Resort, Inc. (a) | | | 585,425 | | | | 32,865,760 | |
| OneSpaWorld Holdings Ltd. (a) | | | 1,168,343 | | | | 9,814,081 | |
| | | | | | | | 82,968,137 | |
| Consumer Staples — 6.7% | | | | | | | | |
| J & J Snack Foods Corporation | | | 155,940 | | | | 20,189,552 | |
| Seaboard Corporation | | | 3,818 | | | | 12,991,356 | |
| | | | | | | | 33,180,908 | |
| Energy — 5.0% | | | | | | | | |
| Archaea Energy, Inc. - Class A (a) | | | 623,447 | | | | 11,228,281 | |
| Peyto Exploration & Development Corporation | | | 1,716,300 | | | | 13,696,074 | |
| | | | | | | | 24,924,355 | |
| Financials — 16.5% | | | | | | | | |
| BRP Group, Inc. - Class A (a) | | | 502,964 | | | | 13,253,101 | |
| Diamond Hill Investment Group, Inc. | | | 94,329 | | | | 15,564,285 | |
| Kinsale Capital Group, Inc. | | | 76,440 | | | | 19,524,305 | |
| Live Oak Bancshares, Inc. | | | 213,431 | | | | 6,530,989 | |
| Stewart Information Services Corporation | | | 410,722 | | | | 17,923,908 | |
| TowneBank | | | 342,158 | | | | 9,180,099 | |
| | | | | | | | 81,976,687 | |
| Health Care — 4.5% | | | | | | | | |
| Perrigo Company plc | | | 623,756 | | | | 22,243,139 | |
| | | | | | | | | |
| Industrials — 9.8% | | | | | | | | |
| Chart Industries, Inc. (a) | | | 95,576 | | | | 17,619,435 | |
| Enovis Corporation (a) | | | 249,158 | | | | 11,478,709 | |
| ESAB Corporation | | | 159,158 | | | | 5,309,511 | |
| Evoqua Water Technologies Corporation (a) | | | 434,783 | | | | 14,378,274 | |
| | | | | | | | 48,785,929 | |
| Materials — 4.8% | | | | | | | | |
| NewMarket Corporation | | | 78,445 | | | | 23,598,609 | |
| | | | | | | | | |
| Real Estate — 11.5% | | | | | | | | |
| FRP Holdings, Inc. (a) | | | 121,491 | | | | 6,604,251 | |
| Janus International Group, Inc. (a) | | | 1,986,787 | | | | 17,722,140 | |
| Lamar Advertising Company - Class A | | | 181,499 | | | | 14,971,852 | |
| DAVENPORT SMALL CAP FOCUS FUND |
| SCHEDULE OF INVESTMENTS (Continued) |
| COMMON STOCKS — 92.9% (Continued) | | Shares | | | Value | |
| Real Estate — 11.5% (Continued) | | | | | | | | |
| Radius Global Infrastructure, Inc. - Class A (a) | | | 320,136 | | | $ | 3,015,681 | |
| SL Green Realty Corporation | | | 359,225 | | | | 14,426,476 | |
| | | | | | | | 56,740,400 | |
| Technology — 11.5% | | | | | | | | |
| Alight, Inc. - Class A (a) | | | 3,261,285 | | | | 23,905,219 | |
| Avid Technology, Inc. (a) | | | 515,394 | | | | 11,988,064 | |
| Verra Mobility Corporation (a) | | | 1,357,496 | | | | 20,864,714 | |
| | | | | | | | 56,757,997 | |
| | | | | | | | | |
| Total Common Stocks (Cost $513,077,870) | | | | | | $ | 460,499,546 | |
| | | | | | | | | |
| MONEY MARKET FUNDS — 7.1% | | Shares | | | Value | |
| First American Treasury Obligations Fund - Class Z, 2.83% (b) (Cost $34,899,579) | | | 34,899,579 | | | $ | 34,899,579 | |
| | | | | | | | | |
| Total Investments at Value — 100.0% (Cost $547,977,449) | | | | | | $ | 495,399,125 | |
| | | | | | | | | |
| Other Assets in Excess of Liabilities — 0.0% (c) | | | | | | | 185,677 | |
| | | | | | | | | |
| Net Assets — 100.0% | | | | | | $ | 495,584,802 | |
| (a) | Non-income producing security. |
| (b) | The rate shown is the 7-day effective yield as of September 30, 2022. |
| (c) | Percentage rounds to less than 0.1%. |
See accompanying notes to financial statements.
| DAVENPORT BALANCED INCOME FUND |
| SCHEDULE OF INVESTMENTS |
| September 30, 2022 (Unaudited) |
| COMMON STOCKS — 54.7% | | Shares | | | Value | |
| Communications — 3.1% | | | | | | | | |
| Alphabet, Inc. - Class A (a) | | | 23,040 | | | $ | 2,203,776 | |
| AT&T, Inc. | | | 50,749 | | | | 778,489 | |
| Comcast Corporation - Class A | | | 69,945 | | | | 2,051,487 | |
| Verizon Communications, Inc. | | | 36,308 | | | | 1,378,615 | |
| | | | | | | | 6,412,367 | |
| Consumer Discretionary — 3.7% | | | | | | | | |
| Cannae Holdings, Inc. (a) | | | 117,411 | | | | 2,425,711 | |
| Lowe’s Companies, Inc. | | | 12,587 | | | | 2,363,965 | |
| McDonald’s Corporation | | | 12,996 | | | | 2,998,697 | |
| | | | | | | | 7,788,373 | |
| Consumer Staples — 5.8% | | | | | | | | |
| Bunge Ltd. | | | 23,009 | | | | 1,899,853 | |
| Diageo plc - ADR | | | 12,545 | | | | 2,130,266 | |
| Ingredion, Inc. | | | 13,155 | | | | 1,059,241 | |
| Kraft Heinz Company (The) | | | 45,515 | | | | 1,517,925 | |
| Philip Morris International, Inc. | | | 27,471 | | | | 2,280,368 | |
| Sysco Corporation | | | 23,135 | | | | 1,635,876 | |
| Walmart, Inc. | | | 12,557 | | | | 1,628,643 | |
| | | | | | | | 12,152,172 | |
| Energy — 4.8% | | | | | | | | |
| Chevron Corporation | | | 16,932 | | | | 2,432,620 | |
| Coterra Energy, Inc. | | | 132,019 | | | | 3,448,336 | |
| Enbridge, Inc. | | | 57,275 | | | | 2,124,903 | |
| Enterprise Products Partners, L.P. | | | 87,000 | | | | 2,068,860 | |
| | | | | | | | 10,074,719 | |
| Financials — 11.2% | | | | | | | | |
| Berkshire Hathaway, Inc. - Class B (a) | | | 13,379 | | | | 3,572,461 | |
| Brookfield Asset Management, Inc. - Class A | | | 84,137 | | | | 3,440,362 | |
| Capital One Financial Corporation | | | 16,976 | | | | 1,564,678 | |
| Citigroup, Inc. | | | 27,793 | | | | 1,158,134 | |
| Diamond Hill Investment Group, Inc. | | | 11,715 | | | | 1,932,975 | |
| Fairfax Financial Holdings Ltd. | | | 7,238 | | | | 3,307,766 | |
| Fidelity National Financial, Inc. | | | 46,907 | | | | 1,698,033 | |
| JPMorgan Chase & Company | | | 18,345 | | | | 1,917,052 | |
| Markel Corporation (a) | | | 2,366 | | | | 2,565,265 | |
| Stewart Information Services Corporation | | | 50,417 | | | | 2,200,198 | |
| | | | | | | | 23,356,924 | |
| Health Care — 6.0% | | | | | | | | |
| Elevance Health, Inc. | | | 4,673 | | | | 2,122,664 | |
| Johnson & Johnson | | | 27,374 | | | | 4,471,817 | |
| Medtronic plc | | | 27,671 | | | | 2,234,433 | |
| Perrigo Company plc | | | 103,191 | | | | 3,679,791 | |
| | | | | | | | 12,508,705 | |
| DAVENPORT BALANCED INCOME FUND |
| SCHEDULE OF INVESTMENTS (Continued) |
| COMMON STOCKS — 54.7% (Continued) | | Shares | | | Value | |
| Industrials — 7.4% | | | | | | |
| 3M Company | | | 15,092 | | | $ | 1,667,666 | |
| Boeing Company (The) (a) | | | 8,332 | | | | 1,008,838 | |
| Deere & Company | | | 5,099 | | | | 1,702,505 | |
| L3Harris Technologies, Inc. | | | 8,270 | | | | 1,718,754 | |
| Norfolk Southern Corporation | | | 9,678 | | | | 2,028,993 | |
| TE Connectivity Ltd. | | | 19,630 | | | | 2,166,367 | |
| United Parcel Service, Inc. - Class B | | | 14,971 | | | | 2,418,415 | |
| Watsco, Inc. | | | 11,245 | | | | 2,895,138 | |
| | | | | | | | 15,606,676 | |
| Materials — 0.9% | | | | | | | | |
| NewMarket Corporation | | | 6,465 | | | | 1,944,866 | |
| | | | | | | | | |
| Real Estate — 5.4% | | | | | | | | |
| Crown Castle, Inc. | | | 12,840 | | | | 1,856,022 | |
| Digital Realty Trust, Inc. | | | 13,709 | | | | 1,359,659 | |
| Gaming and Leisure Properties, Inc. | | | 53,117 | | | | 2,349,896 | |
| Lamar Advertising Company - Class A | | | 32,689 | | | | 2,696,515 | |
| SL Green Realty Corporation | | | 74,437 | | | | 2,989,390 | |
| | | | | | | | 11,251,482 | |
| Technology — 2.1% | | | | | | | | |
| QUALCOMM, Inc. | | | 21,446 | | | | 2,422,969 | |
| Sony Group Corporation - ADR | | | 30,174 | | | | 1,932,645 | |
| | | | | | | | 4,355,614 | |
| Utilities — 4.3% | | | | | | | | |
| Brookfield Infrastructure Partners, L.P. | | | 61,867 | | | | 2,221,025 | |
| Brookfield Renewable Partners, L.P. | | | 76,999 | | | | 2,410,069 | |
| Dominion Energy, Inc. | | | 30,720 | | | | 2,123,059 | |
| NextEra Energy, Inc. | | | 28,278 | | | | 2,217,278 | |
| | | | | | | | 8,971,431 | |
| | | | | | | | | |
| Total Common Stocks (Cost $109,264,583) | | | | | | $ | 114,423,329 | |
| DAVENPORT BALANCED INCOME FUND |
| SCHEDULE OF INVESTMENTS (Continued) |
| FIXED RATE CORPORATE BONDS — 30.2% | | Par Value | | | Value | |
| Communications — 1.2% | | | | | | |
| Walt Disney Company (The), 3.35%, due 03/24/2025 | | $ | 2,505,000 | | | $ | 2,417,219 | |
| | | | | | | | | |
| Consumer Discretionary — 2.8% | | | | | | | | |
| Amazon.com, Inc., 1.00%, due 05/12/2026 | | | 3,250,000 | | | | 2,856,044 | |
| General Motors Financial Company, Inc, 1.50%, due 06/10/2026 | | | 3,425,000 | | | | 2,908,915 | |
| | | | | | | | 5,764,959 | |
| Consumer Staples — 2.9% | | | | | | | | |
| Lowe’s Companies, Inc., 4.40%, due 09/08/2025 | | | 1,525,000 | | | | 1,503,157 | |
| Walgreens Boots Alliance, Inc., 3.80%, due 11/18/2024 | | | 2,245,000 | | | | 2,195,794 | |
| Walmart, Inc., 1.05%, due 09/17/2026 | | | 2,835,000 | | | | 2,474,699 | |
| | | | | | | | 6,173,650 | |
| Energy — 2.9% | | | | | | | | |
| Boardwalk Pipelines, L.P., 4.45%, due 07/15/2027 | | | 2,200,000 | | | | 2,042,408 | |
| Halliburton Company, 3.80%, due 11/15/2025 | | | 937,000 | | | | 902,566 | |
| MPLX, L.P., 4.13%, due 03/01/2027 | | | 3,250,000 | | | | 3,032,598 | |
| | | | | | | | 5,977,572 | |
| Financials — 5.3% | | | | | | | | |
| American Express Company, 3.38%, due 05/03/2024 | | | 2,995,000 | | | | 2,921,055 | |
| BlackRock, Inc., 3.50%, due 03/18/2024 | | | 1,150,000 | | | | 1,133,716 | |
| Brookfield Finance, Inc., 4.00%, due 04/01/2024 | | | 2,000,000 | | | | 1,969,806 | |
| Capital One Financial Corporation, 2.60%, due 05/11/2023 | | | 2,990,000 | | | | 2,955,323 | |
| Citigroup, Inc., 3.30%, due 04/27/2025 | | | 2,250,000 | | | | 2,142,699 | |
| | | | | | | | 11,122,599 | |
| Health Care — 4.5% | | | | | | | | |
| Amgen, Inc., 2.20%, due 02/21/2027 | | | 2,400,000 | | | | 2,131,954 | |
| CVS Health Corporation, 3.00%, due 08/15/2026 | | | 2,600,000 | | | | 2,399,770 | |
| McKesson Corporation, 1.30%, due 08/15/2026 | | | 2,490,000 | | | | 2,151,068 | |
| Stryker Corporation, 1.15%, due 06/15/2025 | | | 2,990,000 | | | | 2,697,587 | |
| | | | | | | | 9,380,379 | |
| Industrials — 2.7% | | | | | | | | |
| Canadian Pacific Railway Ltd., 1.35%, due 12/02/2024 | | | 3,490,000 | | | | 3,228,296 | |
| John Deere Capital Corporation, 2.60%, due 03/07/2024 | | | 2,400,000 | | | | 2,332,883 | |
| | | | | | | | 5,561,179 | |
| Materials — 2.0% | | | | | | | | |
| DowDuPont, Inc., 4.21%, due 11/15/2023 | | | 2,000,000 | | | | 1,987,846 | |
| Sherwin-Williams Company (The), 3.45%, due 06/01/2027 | | | 2,400,000 | | | | 2,204,231 | |
| | | | | | | | 4,192,077 | |
| Real Estate — 2.7% | | | | | | | | |
| American Tower Corporation, 1.45%, due 09/15/2026 | | | 2,990,000 | | | | 2,544,649 | |
| Public Storage, 1.50%, due 11/09/2026 | | | 3,490,000 | | | | 3,089,099 | |
| | | | | | | | 5,633,748 | |
| DAVENPORT BALANCED INCOME FUND |
| SCHEDULE OF INVESTMENTS (Continued) |
| FIXED RATE CORPORATE BONDS — 30.2% (Continued) | | Par Value | | | Value | |
| Technology — 2.1% | | | | | | | | |
| Fiserv, Inc., 3.20%, due 07/01/2026 | | $ | 2,325,000 | | | $ | 2,139,617 | |
| PayPal Holdings, Inc., 2.40%, due 10/01/2024 | | | 2,400,000 | | | | 2,291,414 | |
| | | | | | | | 4,431,031 | |
| Utilities — 1.1% | | | | | | | | |
| Dominion Energy, Inc., 1.45%, due 04/15/2026 | | | 2,740,000 | | | | 2,406,694 | |
| | | | | | | | | |
| Total Fixed Rate Corporate Bonds (Cost $68,939,137) | | | | | | $ | 63,061,107 | |
| | | | | | | | | |
| VARIABLE RATE CORPORATE BONDS (b) — 4.6% | | Par Value | | | Value | |
| Consumer Discretionary — 0.6% | | | | | | | | |
| Starbucks Corporation, 1.767%, (SOFR + 42), due 02/14/2024 | | $ | 1,295,000 | | | $ | 1,287,268 | |
| | | | | | | | | |
| Financials — 3.1% | | | | | | | | |
| Charles Schwab Corporation (The), 2.429%, (SOFR + 50), due 03/18/2024 | | | 3,450,000 | | | | 3,433,649 | |
| Morgan Stanley, 2.119%, (SOFR + 116.5), due 04/17/2025 | | | 2,995,000 | | | | 2,987,512 | |
| | | | | | | | 6,421,161 | |
| Industrials — 0.9% | | | | | | | | |
| John Deere Capital Corporation, 2.220%, (SOFR + 56), due 03/07/2025 | | | 1,990,000 | | | | 1,974,219 | |
| | | | | | | | | |
| Total Variable Rate Corporate Bonds (Cost $9,740,339) | | | | | | $ | 9,682,648 | |
| | | | | | | | | |
| U.S. TREASURY OBLIGATIONS — 8.4% | | Par Value | | | Value | |
| U.S. Treasury Bills — 2.8% (c) | | | | | | | | |
| 3.259%, due 08/10/2023 | | $ | 3,990,000 | | | $ | 3,864,532 | |
| 3.893%, due 09/07/2023 | | | 2,000,000 | | | | 1,927,906 | |
| | | | | | | | 5,792,438 | |
| U.S. Treasury Notes — 5.6% | | | | | | | | |
| 3.282%, due 01/31/2024 (b) | | | 990,000 | | | | 989,925 | |
| 1.500%, due 02/29/2024 | | | 1,995,000 | | | | 1,918,863 | |
| 0.250%, due 06/15/2024 | | | 4,500,000 | | | | 4,203,809 | |
| 2.750%, due 06/30/2025 | | | 4,810,000 | | | | 4,624,552 | |
| | | | | | | | 11,737,149 | |
| | | | | | | | | |
| Total U.S. Treasury Obligations (Cost $18,073,104) | | | | | | $ | 17,529,587 | |
| DAVENPORT BALANCED INCOME FUND |
| SCHEDULE OF INVESTMENTS (Continued) |
| MONEY MARKET FUNDS — 2.0% | | Shares | | | Value | |
| First American Treasury Obligations Fund - Class Z, 2.83% (d) (Cost $4,146,709) | | | 4,146,709 | | | $ | 4,146,709 | |
| | | | | | | | | |
| Total Investments at Value — 99.9% (Cost $210,163,872) | | | | | | $ | 208,843,380 | |
| | | | | | | | | |
| Other Assets in Excess of Liabilities — 0.1% | | | | | | | 280,672 | |
| | | | | | | | | |
| Net Assets — 100.0% | | | | | | $ | 209,124,052 | |
ADR - American Depositary Receipt.
SOFR - Secured Overnight Financing Rate.
| (a) | Non-income producing security. |
| (b) | Variable rate security. Interest rate resets periodically. The rate shown is the effective interest rate as of September 30, 2022. The reference rate and spread (in basis points) are indicated parenthetically. |
| (c) | The rate shown is the annualized yield at the time of purchase. |
| (d) | The rate shown is the 7-day effective yield as of September 30, 2022. |
See accompanying notes to financial statements.
| THE DAVENPORT FUNDS |
| STATEMENTS OF ASSETS AND LIABILITIES |
| September 30, 2022 (Unaudited) |
| | | | | | Davenport | | | Davenport | |
| | | Davenport | | | Value & | | | Equity | |
| | | Core | | | Income | | | Opportunities | |
| | | Fund | | | Fund | | | Fund | |
| ASSETS | | | | | | | | | | | | |
| Investments in securities: | | | | | | | | | | | | |
| At cost | | $ | 460,021,057 | | | $ | 682,397,410 | | | $ | 559,990,951 | |
| At value (Note 2) | | $ | 643,050,160 | | | $ | 742,121,793 | | | $ | 589,037,993 | |
| Cash | | | 10,694,119 | | | | — | | | | — | |
| Receivable for capital shares sold | | | 107,270 | | | | 347,224 | | | | 73,410 | |
| Receivable for investment securities sold | | | 4,723,961 | | | | — | | | | — | |
| Dividends receivable | | | 301,769 | | | | 864,391 | | | | 108,021 | |
| Other assets | | | 23,361 | | | | 25,095 | | | | 23,390 | |
| TOTAL ASSETS | | | 658,900,640 | | | | 743,358,503 | | | | 589,242,814 | |
| | | | | | | | | | | | | |
| LIABILITIES | | | | | | | | | | | | |
| Payable for capital shares redeemed | | | 493,874 | | | | 149,854 | | | | 321,235 | |
| Accrued investment advisory fees (Note 4) | | | 441,782 | | | | 495,647 | | | | 389,142 | |
| Payable to administrator (Note 4) | | | 57,210 | | | | 62,750 | | | | 55,140 | |
| Other accrued expenses and liabilities | | | 10,716 | | | | 12,386 | | | | 11,322 | |
| TOTAL LIABILITIES | | | 1,003,582 | | | | 720,637 | | | | 776,839 | |
| | | | | | | | | | | | | |
| NET ASSETS | | $ | 657,897,058 | | | $ | 742,637,866 | | | $ | 588,465,975 | |
| | | | | | | | | | | | | |
| Net assets consist of: | | | | | | | | | | | | |
| Paid-in capital | | $ | 492,348,112 | | | $ | 674,874,687 | | | $ | 561,328,866 | |
| Accumulated earnings | | | 165,548,946 | | | | 67,763,179 | | | | 27,137,109 | |
| Net assets | | $ | 657,897,058 | | | $ | 742,637,866 | | | $ | 588,465,975 | |
| | | | | | | | | | | | | |
| Shares of beneficial interest outstanding (unlimited number of shares authorized, $0.01 par value) | | | 27,078,042 | | | | 47,214,061 | | | | 33,472,200 | |
| | | | | | | | | | | | | |
| Net asset value, offering price and redemption price per share (Note 2) | | $ | 24.30 | | | $ | 15.73 | | | $ | 17.58 | |
See accompanying notes to financial statements.
THE DAVENPORT FUNDS |
| STATEMENTS OF ASSETS AND LIABILITIES (Continued) |
| September 30, 2022 (Unaudited) |
| | | Davenport | | | Davenport | |
| | | Small Cap | | | Balanced | |
| | | Focus | | | Income | |
| | | Fund | | | Fund | |
| ASSETS | | | | | | | | |
| Investments in securities: | | | | | | | | |
| At cost | | $ | 547,977,449 | | | $ | 210,163,872 | |
| At value (Note 2) | | $ | 495,399,125 | | | $ | 208,843,380 | |
| Receivable for capital shares sold | | | 332,863 | | | | 14,035 | |
| Dividends and interest receivable | | | 592,297 | | | | 656,999 | |
| Other assets | | | 20,837 | | | | 18,482 | |
| TOTAL ASSETS | | | 496,345,122 | | | | 209,532,896 | |
| | | | | | | | | |
| LIABILITIES | | | | | | | | |
| Payable for capital shares redeemed | | | 378,297 | | | | 245,010 | |
| Accrued investment advisory fees (Note 4) | | | 323,570 | | | | 135,461 | |
| Payable to administrator (Note 4) | | | 47,600 | | | | 21,510 | |
| Other accrued expenses | | | 10,853 | | | | 6,863 | |
| TOTAL LIABILITIES | | | 760,320 | | | | 408,844 | |
| | | | | | | | | |
| NET ASSETS | | $ | 495,584,802 | | | $ | 209,124,052 | |
| | | | | | | | | |
| Net assets consist of: | | | | | | | | |
| Paid-in capital | | $ | 543,241,082 | | | $ | 209,286,335 | |
| Accumulated deficit | | | (47,656,280 | ) | | | (162,283 | ) |
| Net assets | | $ | 495,584,802 | | | $ | 209,124,052 | |
| | | | | | | | | |
| Shares of beneficial interest outstanding (unlimited number of shares authorized, $0.01 par value) | | | 35,821,572 | | | | 18,318,978 | |
| | | | | | | | | |
| Net asset value, offering price and redemption price per share (Note 2) | | $ | 13.83 | | | $ | 11.42 | |
See accompanying notes to financial statements.
| THE DAVENPORT FUNDS |
| STATEMENTS OF OPERATIONS |
| For the Six Months Ended September 30, 2022 (Unaudited) |
| | | | | | Davenport | | | Davenport | |
| | | Davenport | | | Value & | | | Equity | |
| | | Core | | | Income | | | Opportunities | |
| | | Fund | | | Fund | | | Fund | |
| INVESTMENT INCOME | | | | | | | | | | | | |
| Dividends | | $ | 5,766,758 | | | $ | 11,403,771 | | | $ | 3,186,115 | |
| Foreign withholding taxes on dividends | | | (31,116 | ) | | | (103,015 | ) | | | (34,502 | ) |
| TOTAL INVESTMENT INCOME | | | 5,735,642 | | | | 11,300,756 | | | | 3,151,613 | |
| | | | | | | | | | | | | |
| EXPENSES | | | | | | | | | | | | |
| Investment advisory fees (Note 4) | | | 2,844,454 | | | | 3,187,940 | | | | 2,471,250 | |
| Administration fees (Note 4) | | | 342,660 | | | | 374,775 | | | | 327,596 | |
| Custodian and bank service fees | | | 20,709 | | | | 23,127 | | | | 18,107 | |
| Registration and filing fees | | | 18,244 | | | | 19,011 | | | | 19,568 | |
| Postage and supplies | | | 14,408 | | | | 15,827 | | | | 15,987 | |
| Compliance service fees (Note 4) | | | 15,277 | | | | 16,870 | | | | 13,526 | |
| Trustees’ fees and expenses (Note 4) | | | 9,233 | | | | 9,233 | | | | 9,233 | |
| Audit and tax services fees | | | 7,750 | | | | 7,750 | | | | 7,750 | |
| Legal fees | | | 7,131 | | | | 7,131 | | | | 7,131 | |
| Insurance expense | | | 6,727 | | | | 7,461 | | | | 6,009 | |
| Shareholder reporting expenses | | | 3,993 | | | | 4,275 | | | | 4,192 | |
| Other expenses | | | 4,678 | | | | 5,073 | | | | 4,726 | |
| TOTAL EXPENSES | | | 3,295,264 | | | | 3,678,473 | | | | 2,905,075 | |
| | | | | | | | | | | | | |
| NET INVESTMENT INCOME | | | 2,440,378 | | | | 7,622,283 | | | | 246,538 | |
| | | | | | | | | | | | | |
| REALIZED AND UNREALIZED GAINS (LOSSES) ON INVESTMENTS AND FOREIGN CURRENCIES | | | | | | | | | | | | |
| Net realized gains (losses) from: | | | | | | | | | | | | |
| Investments | | | (17,620,430 | ) | | | 7,087,025 | | | | (1,598,490 | ) |
| Foreign currency transactions | | | — | | | | 290 | | | | — | |
| Net change in unrealized appreciation (depreciation) on investments | | | (160,279,239 | ) | | | (194,957,851 | ) | | | (146,320,625 | ) |
| NET REALIZED AND UNREALIZED LOSSES ON INVESTMENTS AND FOREIGN CURRENCIES | | | (177,899,669 | ) | | | (187,870,536 | ) | | | (147,919,115 | ) |
| | | | | | | | | | | | | |
| NET DECREASE IN NET ASSETS FROM OPERATIONS | | $ | (175,459,291 | ) | | $ | (180,248,253 | ) | | $ | (147,672,577 | ) |
See accompanying notes to financial statements.
| THE DAVENPORT FUNDS |
| STATEMENTS OF OPERATIONS (Continued) |
| For the Six Months Ended September 30, 2022 (Unaudited) |
| | | Davenport | | | Davenport | |
| | | Small Cap | | | Balanced | |
| | | Focus | | | Income | |
| | | Fund | | | Fund | |
| INVESTMENT INCOME | | | | | | | | |
| Dividends | | $ | 3,005,263 | | | $ | 1,945,830 | |
| Foreign withholding taxes on dividends | | | (21,568 | ) | | | (18,524 | ) |
| Interest | | | — | | | | 902,389 | |
| TOTAL INVESTMENT INCOME | | | 2,983,695 | | | | 2,829,695 | |
| | | | | | | | | |
| EXPENSES | | | | | | | | |
| Investment advisory fees (Note 4) | | | 2,023,245 | | | | 847,754 | |
| Administration fees (Note 4) | | | 280,318 | | | | 127,137 | |
| Registration and filing fees | | | 20,186 | | | | 15,475 | |
| Custodian and bank service fees | | | 15,752 | | | | 7,009 | |
| Postage and supplies | | | 13,691 | | | | 5,313 | |
| Trustees’ fees and expenses (Note 4) | | | 9,233 | | | | 9,233 | |
| Compliance service fees (Note 4) | | | 11,440 | | | | 5,948 | |
| Audit and tax services fees | | | 7,750 | | | | 8,500 | |
| Legal fees | | | 7,131 | | | | 7,131 | |
| Insurance expense | | | 4,771 | | | | 2,279 | |
| Shareholder reporting expenses | | | 3,551 | | | | 2,831 | |
| Other expenses | | | 4,764 | | | | 7,312 | |
| TOTAL EXPENSES | | | 2,401,832 | | | | 1,045,922 | |
| | | | | | | | | |
| NET INVESTMENT INCOME | | | 581,863 | | | | 1,783,773 | |
| | | | | | | | | |
| REALIZED AND UNREALIZED GAINS (LOSSES) ON INVESTMENTS AND FOREIGN CURRENCIES | | | | | | | | |
| Net realized gains from: | | | | | | | | |
| Investments | | | 7,197,621 | | | | 501,212 | |
| Foreign currency transactions | | | — | | | | 40 | |
| Net change in unrealized appreciation (depreciation) on investments | | | (110,943,454 | ) | | | (34,801,430 | ) |
| NET REALIZED AND UNREALIZED LOSSES ON INVESTMENTS AND FOREIGN CURRENCIES | | | (103,745,833 | ) | | | (34,300,178 | ) |
| | | | | | | | | |
| NET DECREASE IN NET ASSETS FROM OPERATIONS | | $ | (103,163,970 | ) | | $ | (32,516,405 | ) |
See accompanying notes to financial statements.
| DAVENPORT CORE FUND |
| STATEMENTS OF CHANGES IN NET ASSETS |
| | | Six Months | | | | |
| | | Ended | | | Year | |
| | | September 30, | | | Ended | |
| | | 2022 | | | March 31, | |
| | | (Unaudited) | | | 2022 | |
| FROM OPERATIONS | | | | | | | | |
| Net investment income | | $ | 2,440,378 | | | $ | 333,130 | |
| Net realized gains (losses) from investment transactions | | | (17,620,430 | ) | | | 67,370,002 | |
| Net change in unrealized appreciation (depreciation) on investments | | | (160,279,239 | ) | | | 14,484,307 | |
| Net increase (decrease) in net assets from operations | | | (175,459,291 | ) | | | 82,187,439 | |
| | | | | | | | | |
| DISTRIBUTIONS TO SHAREHOLDERS (Note 2) | | | (30,939,330 | ) | | | (68,467,730 | ) |
| | | | | | | | | |
| FROM CAPITAL SHARE TRANSACTIONS | | | | | | | | |
| Proceeds from shares sold | | | 18,924,671 | | | | 67,141,323 | |
| Net asset value of shares issued in reinvestment of distributions to shareholders | | | 29,308,660 | | | | 64,819,874 | |
| Payments for shares redeemed | | | (29,587,455 | ) | | | (56,080,855 | ) |
| Net increase in net assets from capital share transactions | | | 18,645,876 | | | | 75,880,342 | |
| | | | | | | | | |
| TOTAL INCREASE (DECREASE) IN NET ASSETS | | | (187,752,745 | ) | | | 89,600,051 | |
| | | | | | | | | |
| NET ASSETS | | | | | | | | |
| Beginning of period | | | 845,649,803 | | | | 756,049,752 | |
| End of period | | $ | 657,897,058 | | | $ | 845,649,803 | |
| | | | | | | | | |
| CAPITAL SHARE ACTIVITY | | | | | | | | |
| Shares sold | | | 668,639 | | | | 2,023,456 | |
| Shares reinvested | | | 1,116,288 | | | | 2,003,986 | |
| Shares redeemed | | | (1,061,373 | ) | | | (1,693,215 | ) |
| Net increase in shares outstanding | | | 723,554 | | | | 2,334,227 | |
| Shares outstanding at beginning of period | | | 26,354,488 | | | | 24,020,261 | |
| Shares outstanding at end of period | | | 27,078,042 | | | | 26,354,488 | |
See accompanying notes to financial statements.
| DAVENPORT VALUE & INCOME FUND |
| STATEMENTS OF CHANGES IN NET ASSETS |
| | | Six Months | | | | |
| | | Ended | | | Year | |
| | | September 30, | | | Ended | |
| | | 2022 | | | March 31, | |
| | | (Unaudited) | | | 2022 | |
| FROM OPERATIONS | | | | | | | | |
| Net investment income | | $ | 7,622,283 | | | $ | 12,685,480 | |
| Net realized gains (losses) from: | | | | | | | | |
| Investments | | | 7,087,025 | | | | 38,935,093 | |
| Foreign currency transactions | | | 290 | | | | (4,099 | ) |
| Net change in unrealized appreciation (depreciation) on investments | | | (194,957,851 | ) | | | 61,409,599 | |
| Net increase (decrease) in net assets from operations | | | (180,248,253 | ) | | | 113,026,073 | |
| | | | | | | | | |
| DISTRIBUTIONS TO SHAREHOLDERS (Note 2) | | | (29,717,400 | ) | | | (38,881,727 | ) |
| | | | | | | | | |
| FROM CAPITAL SHARE TRANSACTIONS | | | | | | | | |
| Proceeds from shares sold | | | 33,858,850 | | | | 77,470,391 | |
| Net asset value of shares issued in reinvestment of distributions to shareholders | | | 27,598,434 | | | | 35,920,894 | |
| Payments for shares redeemed | | | (28,909,144 | ) | | | (57,132,094 | ) |
| Net increase in net assets from capital share transactions | | | 32,548,140 | | | | 56,259,191 | |
| | | | | | | | | |
| TOTAL INCREASE (DECREASE) IN NET ASSETS | | | (177,417,513 | ) | | | 130,403,537 | |
| | | | | | | | | |
| NET ASSETS | | | | | | | | |
| Beginning of period | | | 920,055,379 | | | | 789,651,842 | |
| End of period | | $ | 742,637,866 | | | $ | 920,055,379 | |
| | | | | | | | | |
| CAPITAL SHARE ACTIVITY | | | | | | | | |
| Shares sold | | | 1,853,629 | | | | 3,906,031 | |
| Shares reinvested | | | 1,592,495 | | | | 1,826,825 | |
| Shares redeemed | | | (1,579,241 | ) | | | (2,881,938 | ) |
| Net increase in shares outstanding | | | 1,866,883 | | | | 2,850,918 | |
| Shares outstanding at beginning of period | | | 45,347,178 | | | | 42,496,260 | |
| Shares outstanding at end of period | | | 47,214,061 | | | | 45,347,178 | |
See accompanying notes to financial statements.
| DAVENPORT EQUITY OPPORTUNITIES FUND |
| STATEMENTS OF CHANGES IN NET ASSETS |
| | | Six Months | | | | |
| | | Ended | | | Year | |
| | | September 30, | | | Ended | |
| | | 2022 | | | March 31, | |
| | | (Unaudited) | | | 2022 | |
| FROM OPERATIONS | | | | | | | | |
| Net investment income (loss) | | $ | 246,538 | | | $ | (1,468,762 | ) |
| Net realized gains (losses) from investment transactions | | | (1,598,490 | ) | | | 91,925,124 | |
| Net change in unrealized appreciation (depreciation) on investments | | | (146,320,625 | ) | | | (46,165,311 | ) |
| Net increase (decrease) in net assets from operations | | | (147,672,577 | ) | | | 44,291,051 | |
| | | | | | | | | |
| DISTRIBUTIONS TO SHAREHOLDERS (Note 2) | | | (41,101,956 | ) | | | (77,485,662 | ) |
| | | | | | | | | |
| FROM CAPITAL SHARE TRANSACTIONS | | | | | | | | |
| Proceeds from shares sold | | | 22,823,093 | | | | 84,066,849 | |
| Net asset value of shares issued in reinvestment of distributions to shareholders | | | 39,407,996 | | | | 74,107,221 | |
| Payments for shares redeemed | | | (26,486,331 | ) | | | (42,597,952 | ) |
| Net increase in net assets from capital share transactions | | | 35,744,758 | | | | 115,576,118 | |
| | | | | | | | | |
| TOTAL INCREASE (DECREASE) IN NET ASSETS | | | (153,029,775 | ) | | | 82,381,507 | |
| | | | | | | | | |
| NET ASSETS | | | | | | | | |
| Beginning of period | | | 741,495,750 | | | | 659,114,243 | |
| End of period | | $ | 588,465,975 | | | $ | 741,495,750 | |
| | | | | | | | | |
| CAPITAL SHARE ACTIVITY | | | | | | | | |
| Shares sold | | | 1,128,055 | | | | 3,324,671 | |
| Shares reinvested | | | 2,168,849 | | | | 3,003,498 | |
| Shares redeemed | | | (1,324,361 | ) | | | (1,685,585 | ) |
| Net increase in shares outstanding | | | 1,972,543 | | | | 4,642,584 | |
| Shares outstanding at beginning of period | | | 31,499,657 | | | | 26,857,073 | |
| Shares outstanding at end of period | | | 33,472,200 | | | | 31,499,657 | |
See accompanying notes to financial statements.
| DAVENPORT SMALL CAP FOCUS FUND |
| STATEMENTS OF CHANGES IN NET ASSETS |
| | | Six Months | | | | |
| | | Ended | | | Year | |
| | | September 30, | | | Ended | |
| | | 2022 | | | March 31, | |
| | | (Unaudited) | | | 2022 | |
| FROM OPERATIONS | | | | | | | | |
| Net investment income | | $ | 581,863 | | | $ | 2,702,467 | |
| Net realized gains from investment transactions | | | 7,197,621 | | | | 75,763,509 | |
| Net change in unrealized appreciation (depreciation) on investments | | | (110,943,454 | ) | | | (43,480,747 | ) |
| Net increase (decrease) in net assets from operations | | | (103,163,970 | ) | | | 34,985,229 | |
| | | | | | | | | |
| DISTRIBUTIONS TO SHAREHOLDERS (Note 2) | | | (31,371,059 | ) | | | (78,479,634 | ) |
| | | | | | | | | |
| FROM CAPITAL SHARE TRANSACTIONS | | | | | | | | |
| Proceeds from shares sold | | | 49,070,182 | | | | 120,005,269 | |
| Net asset value of shares issued in reinvestment of distributions to shareholders | | | 29,999,054 | | | | 75,165,724 | |
| Payments for shares redeemed | | | (36,516,979 | ) | | | (55,364,634 | ) |
| Net increase in net assets from capital share transactions | | | 42,552,257 | | | | 139,806,359 | |
| | | | | | | | | |
| TOTAL INCREASE (DECREASE) IN NET ASSETS | | | (91,982,772 | ) | | | 96,311,954 | |
| | | | | | | | | |
| NET ASSETS | | | | | | | | |
| Beginning of period | | | 587,567,574 | | | | 491,255,620 | |
| End of period | | $ | 495,584,802 | | | $ | 587,567,574 | |
| | | | | | | | | |
| CAPITAL SHARE ACTIVITY | | | | | | | | |
| Shares sold | | | 3,154,708 | | | | 6,432,111 | |
| Shares reinvested | | | 2,073,189 | | | | 4,063,842 | |
| Shares redeemed | | | (2,318,681 | ) | | | (2,943,908 | ) |
| Net increase in shares outstanding | | | 2,909,216 | | | | 7,552,045 | |
| Shares outstanding at beginning of period | | | 32,912,356 | | | | 25,360,311 | |
| Shares outstanding at end of period | | | 35,821,572 | | | | 32,912,356 | |
See accompanying notes to financial statements.
| DAVENPORT BALANCED INCOME FUND |
| STATEMENTS OF CHANGES IN NET ASSETS |
| | | Six Months | | | | |
| | | Ended | | | Year | |
| | | September 30, | | | Ended | |
| | | 2022 | | | March 31, | |
| | | (Unaudited) | | | 2022 | |
| FROM OPERATIONS | | | | | | | | |
| Net investment income | | $ | 1,783,773 | | | $ | 3,087,974 | |
| Net realized gains (losses) from: | | | | | | | | |
| Investments | | | 501,212 | | | | 7,678,961 | |
| Foreign currency transactions | | | 40 | | | | (566 | ) |
| Net change in unrealized appreciation (depreciation) on investments | | | (34,801,430 | ) | | | 4,308,416 | |
| Net increase (decrease) in net assets from operations | | | (32,516,405 | ) | | | 15,074,785 | |
| | | | | | | | | |
| DISTRIBUTIONS TO SHAREHOLDERS (Note 2) | | | (6,614,755 | ) | | | (3,301,414 | ) |
| | | | | | | | | |
| FROM CAPITAL SHARE TRANSACTIONS | | | | | | | | |
| Proceeds from shares sold | | | 14,915,497 | | | | 46,064,469 | |
| Net asset value of shares issued in reinvestment of distributions to shareholders | | | 6,214,616 | | | | 3,043,589 | |
| Payments for shares redeemed | | | (9,133,685 | ) | | | (17,808,632 | ) |
| Net increase in net assets from capital share transactions | | | 11,996,428 | | | | 31,299,426 | |
| | | | | | | | | |
| TOTAL INCREASE (DECREASE) IN NET ASSETS | | | (27,134,732 | ) | | | 43,072,797 | |
| | | | | | | | | |
| NET ASSETS | | | | | | | | |
| Beginning of period | | | 236,258,784 | | | | 193,185,987 | |
| End of period | | $ | 209,124,052 | | | $ | 236,258,784 | |
| | | | | | | | | |
| CAPITAL SHARE ACTIVITY | | | | | | | | |
| Shares sold | | | 1,183,430 | | | | 3,411,188 | |
| Shares reinvested | | | 512,812 | | | | 224,285 | |
| Shares redeemed | | | (730,522 | ) | | | (1,320,477 | ) |
| Net increase in shares outstanding | | | 965,720 | | | | 2,314,996 | |
| Shares outstanding at beginning of period | | | 17,353,258 | | | | 15,038,262 | |
| Shares outstanding at end of period | | | 18,318,978 | | | | 17,353,258 | |
See accompanying notes to financial statements.
| DAVENPORT CORE FUND |
| FINANCIAL HIGHLIGHTS |
Selected Per Share Data and Ratios for a Share Outstanding Throughout Each Period:
| | | Six Months | | | | |
| | | Ended | | | | |
| | | Sept. 30, | | | | |
| | | 2022 | | | Years Ended March 31, | |
| | | (Unaudited) | | | 2022 | | | 2021 | | | 2020 | | | 2019 | | | 2018 | |
| Net asset value at beginning of period | | $ | 32.09 | | | $ | 31.48 | | | $ | 21.48 | | | $ | 23.75 | | | $ | 22.96 | | | $ | 21.15 | |
| | | | | | | | | | | | | | | | | | | | | | | | | |
| Income (loss) from investment operations: | | | | | | | | | | | | | | | | | | | | | | | | |
| Net investment income | | | 0.09 | | | | 0.01 | | | | 0.05 | | | | 0.14 | | | | 0.11 | | | | 0.09 | |
| Net realized and unrealized gains (losses) on investments | | | (6.70 | ) | | | 3.38 | | | | 10.27 | | | | (1.80 | ) | | | 1.74 | | | | 2.29 | |
| Total from investment operations | | | (6.61 | ) | | | 3.39 | | | | 10.32 | | | | (1.66 | ) | | | 1.85 | | | | 2.38 | |
| | | | | | | | | | | | | | | | | | | | | | | | | |
| Less distributions from: | | | | | | | | | | | | | | | | | | | | | | | | |
| Net investment income | | | (0.09 | ) | | | (0.00 | ) (a) | | | (0.07 | ) | | | (0.14 | ) | | | (0.11 | ) | | | (0.11 | ) |
| Net realized gains | | | (1.09 | ) | | | (2.78 | ) | | | (0.25 | ) | | | (0.47 | ) | | | (0.95 | ) | | | (0.46 | ) |
| Total distributions | | | (1.18 | ) | | | (2.78 | ) | | | (0.32 | ) | | | (0.61 | ) | | | (1.06 | ) | | | (0.57 | ) |
| | | | | | | | | | | | | | | | | | | | | | | | | |
| Net asset value at end of period | | $ | 24.30 | | | $ | 32.09 | | | $ | 31.48 | | | $ | 21.48 | | | $ | 23.75 | | | $ | 22.96 | |
| | | | | | | | | | | | | | | | | | | | | | | | | |
| Total return (b) | | | (20.87 | %)(c) | | | 10.89 | % | | | 48.20 | % | | | (7.36 | %) | | | 8.21 | % | | | 11.38 | % |
| | | | | | | | | | | | | | | | | | | | | | | | | |
| Net assets at end of period (000’s) | | $ | 657,897 | | | $ | 845,650 | | | $ | 756,050 | | | $ | 486,569 | | | $ | 516,228 | | | $ | 464,919 | |
| | | | | | | | | | | | | | | | | | | | | | | | | |
| Ratio of total expenses to average net assets | | | 0.87 | %(d) | | | 0.86 | % | | | 0.87 | % | | | 0.89 | % | | | 0.89 | % | | | 0.90 | % |
| | | | | | | | | | | | | | | | | | | | | | | | | |
| Ratio of net investment income to average net assets | | | 0.64 | %(d) | | | 0.04 | % | | | 0.17 | % | | | 0.55 | % | | | 0.48 | % | | | 0.41 | % |
| | | | | | | | | | | | | | | | | | | | | | | | | |
| Portfolio turnover rate | | | 5 | %(c) | | | 20 | % | | | 30 | % | | | 12 | % | | | 21 | % | | | 22 | % |
| (a) | Amount rounds to less than $0.01 per share. |
| (b) | Total return is a measure of the change in value of an investment in the Fund over the periods covered, which assumes any dividends or capital gains distributions are reinvested in shares of the Fund. Returns shown do not reflect the deduction of taxes a shareholder would pay on Fund distributions or the redemption of Fund shares. |
See accompanying notes to financial statements.
| DAVENPORT VALUE & INCOME FUND |
| FINANCIAL HIGHLIGHTS |
Selected Per Share Data and Ratios for a Share Outstanding Throughout Each Period:
| | | Six Months | | | | |
| | | Ended | | | | |
| | | Sept. 30, | | | | |
| | | 2022 | | | Years Ended March 31, | |
| | | (Unaudited) | | | 2022 | | | 2021 | | | 2020 | | | 2019 | | | 2018 | |
| Net asset value at beginning of period | | $ | 20.29 | | | $ | 18.58 | | | $ | 13.04 | | | $ | 16.38 | | | $ | 16.85 | | | $ | 15.97 | |
| | | | | | | | | | | | | | | | | | | | | | | | | |
| Income (loss) from investment operations: | | | | | | | | | | | | | | | | | | | | | | | | |
| Net investment income | | | 0.16 | | | | 0.29 | | | | 0.28 | | | | 0.35 | | | | 0.36 | | | | 0.30 | |
| Net realized and unrealized gains (losses) on investments and foreign currencies | | | (4.07 | ) | | | 2.32 | | | | 5.98 | | | | (3.00 | ) | | | 0.12 | | | | 1.39 | |
| Total from investment operations | | | (3.91 | ) | | | 2.61 | | | | 6.26 | | | | (2.65 | ) | | | 0.48 | | | | 1.69 | |
| | | | | | | | | | | | | | | | | | | | | | | | | |
| Less distributions from: | | | | | | | | | | | | | | | | | | | | | | | | |
| Net investment income | | | (0.14 | ) | | | (0.30 | ) | | | (0.27 | ) | | | (0.36 | ) | | | (0.36 | ) | | | (0.30 | ) |
| Net realized gains | | | (0.51 | ) | | | (0.60 | ) | | | (0.45 | ) | | | (0.33 | ) | | | (0.59 | ) | | | (0.51 | ) |
| Total distributions | | | (0.65 | ) | | | (0.90 | ) | | | (0.72 | ) | | | (0.69 | ) | | | (0.95 | ) | | | (0.81 | ) |
| | | | | | | | | | | | | | | | | | | | | | | | | |
| Net asset value at end of period | | $ | 15.73 | | | $ | 20.29 | | | $ | 18.58 | | | $ | 13.04 | | | $ | 16.38 | | | $ | 16.85 | |
| | | | | | | | | | | | | | | | | | | | | | | | | |
| Total return (a) | | | (19.55 | %)(b) | | | 14.24 | % | | | 49.55 | % | | | (16.97 | %) | | | 2.96 | % | | | 10.67 | % |
| | | | | | | | | | | | | | | | | | | | | | | | | |
| Net assets at end of period (000’s) | | $ | 742,638 | | | $ | 920,055 | | | $ | 789,652 | | | $ | 549,112 | | | $ | 672,954 | | | $ | 648,456 | |
| | | | | | | | | | | | | | | | | | | | | | | | | |
| Ratio of total expenses to average net assets | | | 0.87 | %(c) | | | 0.86 | % | | | 0.87 | % | | | 0.88 | % | | | 0.88 | % | | | 0.88 | % |
| | | | | | | | | | | | | | | | | | | | | | | | | |
| Ratio of net investment income to average net assets | | | 1.80 | %(c) | | | 1.46 | % | | | 1.78 | % | | | 2.07 | % | | | 2.21 | % | | | 1.79 | % |
| | | | | | | | | | | | | | | | | | | | | | | | | |
| Portfolio turnover rate | | | 5 | %(b) | | | 20 | % | | | 34 | % | | | 28 | % | | | 18 | % | | | 22 | % |
| (a) | Total return is a measure of the change in value of an investment in the Fund over the periods covered, which assumes any dividends or capital gains distributions are reinvested in shares of the Fund. Returns shown do not reflect the deduction of taxes a shareholder would pay on Fund distributions or the redemption of Fund shares. |
See accompanying notes to financial statements.
| DAVENPORT EQUITY OPPORTUNITIES FUND |
| FINANCIAL HIGHLIGHTS |
Selected Per Share Data and Ratios for a Share Outstanding Throughout Each Period:
| | | Six Months | | | | |
| | | Ended | | | | |
| | | Sept. 30, | | | | |
| | | 2022 | | | Years Ended March 31, | |
| | | (Unaudited) | | | 2022 | | | 2021 | | | 2020 | | | 2019 | | | 2018 | |
| Net asset value at beginning of period | | $ | 23.54 | | | $ | 24.54 | | | $ | 16.56 | | | $ | 18.98 | | | $ | 17.75 | | | $ | 15.64 | |
| | | | | | | | | | | | | | | | | | | | | | | | | |
| Income (loss) from investment operations: | | | | | | | | | | | | | | | | | | | | | | | | |
| Net investment income (loss) | | | 0.01 | | | | (0.05 | ) | | | (0.03 | ) | | | (0.00 | )(a) | | | (0.02 | ) | | | (0.04 | ) |
| Net realized and unrealized gains (losses) on investments | | | (4.66 | ) | | | 1.80 | | | | 10.42 | | | | (1.59 | ) | | | 1.91 | | | | 2.15 | |
| Total from investment operations | | | (4.65 | ) | | | 1.75 | | | | 10.39 | | | | (1.59 | ) | | | 1.89 | | | | 2.11 | |
| | | | | | | | | | | | | | | | | | | | | | | | | |
| Less distributions from: | | | | | | | | | | | | | | | | | | | | | | | | |
| Net realized gains | | | (1.31 | ) | | | (2.75 | ) | | | (2.41 | ) | | | (0.83 | ) | | | (0.66 | ) | | | — | |
| | | | | | | | | | | | | | | | | | | | | | | | | |
| Net asset value at end of period | | $ | 17.58 | | | $ | 23.54 | | | $ | 24.54 | | | $ | 16.56 | | | $ | 18.98 | | | $ | 17.75 | |
| | | | | | | | | | | | | | | | | | | | | | | | | |
| Total return (b) | | | (19.95 | %)(c) | | | 6.89 | % | | | 66.20 | % | | | (9.13 | %) | | | 11.02 | % | | | 13.49 | % |
| | | | | | | | | | | | | | | | | | | | | | | | | |
| Net assets at end of period (000’s) | | $ | 588,466 | | | $ | 741,496 | | | $ | 659,114 | | | $ | 385,163 | | | $ | 409,002 | | | $ | 399,460 | |
| | | | | | | | | | | | | | | | | | | | | | | | | |
| Ratio of total expenses to average net assets | | | 0.88 | %(d) | | | 0.87 | % | | | 0.88 | % | | | 0.90 | % | | | 0.91 | % | | | 0.91 | % |
| | | | | | | | | | | | | | | | | | | | | | | | | |
| Ratio of net investment income (loss) to average net assets | | | 0.07 | %(d) | | | (0.20 | %) | | | (0.13 | %) | | | (0.02 | %) | | | (0.13 | %) | | | (0.23 | %) |
| | | | | | | | | | | | | | | | | | | | | | | | | |
| Portfolio turnover rate | | | 10 | %(c) | | | 22 | % | | | 31 | % | | | 21 | % | | | 19 | % | | | 21 | % |
| (a) | Amount rounds to less than $0.01 per share. |
| (b) | Total return is a measure of the change in value of an investment in the Fund over the periods covered, which assumes any dividends or capital gains distributions are reinvested in shares of the Fund. Returns shown do not reflect the deduction of taxes a shareholder would pay on Fund distributions or the redemption of Fund shares. |
See accompanying notes to financial statements.
| DAVENPORT SMALL CAP FOCUS FUND |
| FINANCIAL HIGHLIGHTS |
Selected Per Share Data and Ratios for a Share Outstanding Throughout Each Period:
| | | Six Months | | | | |
| | | Ended | | | | |
| | | Sept. 30, | | | | |
| | | 2022 | | | Years Ended March 31, | |
| | | (Unaudited) | | | 2022 | | | 2021 | | | 2020 | | | 2019 | | | 2018 | |
| Net asset value at beginning of period | | $ | 17.85 | | | $ | 19.37 | | | $ | 11.14 | | | $ | 13.25 | | | $ | 13.01 | | | $ | 12.13 | |
| | | | | | | | | | | | | | | | | | | | | | | | | |
| Income (loss) from investment operations: | | | | | | | | | | | | | | | | | | | | | | | | |
| Net investment income | | | 0.02 | | | | 0.11 | | | | 0.04 | | | | 0.05 | | | | 0.06 | | | | 0.02 | |
| Net realized and unrealized gains (losses) on investments | | | (3.10 | ) | | | 1.20 | | | | 9.28 | | | | (1.84 | ) | | | 0.44 | | | | 1.22 | |
| Total from investment operations | | | (3.08 | ) | | | 1.31 | | | | 9.32 | | | | (1.79 | ) | | | 0.50 | | | | 1.24 | |
| | | | | | | | | | | | | | | | | | | | | | | | | |
| Less distributions from: | | | | | | | | | | | | | | | | | | | | | | | | |
| Net investment income | | | — | | | | (0.13 | ) | | | (0.20 | ) | | | (0.10 | ) | | | — | | | | — | |
| Net realized gains | | | (0.94 | ) | | | (2.70 | ) | | | (0.89 | ) | | | (0.22 | ) | | | (0.26 | ) | | | (0.36 | ) |
| Total distributions | | | (0.94 | ) | | | (2.83 | ) | | | (1.09 | ) | | | (0.32 | ) | | | (0.26 | ) | | | (0.36 | ) |
| | | | | | | | | | | | | | | | | | | | | | | | | |
| Net asset value at end of period | | $ | 13.83 | | | $ | 17.85 | | | $ | 19.37 | | | $ | 11.14 | | | $ | 13.25 | | | $ | 13.01 | |
| | | | | | | | | | | | | | | | | | | | | | | | | |
| Total return (a) | | | (17.49 | %)(b) | | | 6.85 | % | | | 84.84 | % | | | (14.08 | %) | | | 3.90 | % | | | 10.28 | % |
| | | | | | | | | | | | | | | | | | | | | | | | | |
| Net assets at end of period (000’s) | | $ | 495,585 | | | $ | 587,568 | | | $ | 491,256 | | | $ | 180,077 | | | $ | 152,063 | | | $ | 116,239 | |
| | | | | | | | | | | | | | | | | | | | | | | | | |
| Ratio of total expenses to average net assets | | | 0.89 | %(c) | | | 0.88 | % | | | 0.91 | % | | | 0.95 | % | | | 0.97 | % | | | 1.00 | % |
| | | | | | | | | | | | | | | | | | | | | | | | | |
| Ratio of net investment income to average net assets | | | 0.22 | %(c) | | | 0.49 | % | | | 0.12 | % | | | 0.40 | % | | | 0.51 | % | | | 0.26 | % |
| | | | | | | | | | | | | | | | | | | | | | | | | |
| Portfolio turnover rate | | | 15 | %(b) | | | 44 | % | | | 54 | % | | | 66 | % | | | 60 | % | | | 48 | % |
| (a) | Total return is a measure of the change in value of an investment in the Fund over the periods covered, which assumes any dividends or capital gains distributions are reinvested in shares of the Fund. Returns shown do not reflect the deduction of taxes a shareholder would pay on Fund distributions or the redemption of Fund shares. |
See accompanying notes to financial statements.
| DAVENPORT BALANCED INCOME FUND |
| FINANCIAL HIGHLIGHTS |
Selected Per Share Data and Ratios for a Share Outstanding Throughout Each Period:
| | | Six Months | | | | |
| | | Ended | | | | |
| | | Sept. 30, | | | | |
| | | 2022 | | | Years Ended March 31, | |
| | | (Unaudited) | | | 2022 | | | 2021 | | | 2020 | | | 2019 | | | 2018 | |
| Net asset value at beginning of period | | $ | 13.61 | | | $ | 12.85 | | | $ | 9.84 | | | $ | 11.34 | | | $ | 11.28 | | | $ | 11.02 | |
| | | | | | | | | | | | | | | | | | | | | | | | | |
| Income (loss) from investment operations: | | | | | | | | | | | | | | | | | | | | | | | | |
| Net investment income (a) | | | 0.10 | | | | 0.19 | | | | 0.20 | | | | 0.25 | | | | 0.25 | | | | 0.20 | |
| Net realized and unrealized gains (losses) on investments and foreign currencies | | | (1.92 | ) | | | 0.77 | | | | 3.04 | | | | (1.41 | ) | | | 0.12 | | | | 0.33 | |
| Total from investment operations | | | (1.82 | ) | | | 0.96 | | | | 3.24 | | | | (1.16 | ) | | | 0.37 | | | | 0.53 | |
| | | | | | | | | | | | | | | | | | | | | | | | | |
| Less distributions from: | | | | | | | | | | | | | | | | | | | | | | | | |
| Net investment income | | | (0.08 | ) | | | (0.18 | ) | | | (0.23 | ) | | | (0.23 | ) | | | (0.24 | ) | | | (0.17 | ) |
| Net realized gains | | | (0.29 | ) | | | (0.02 | ) | | | — | | | | (0.08 | ) | | | (0.07 | ) | | | (0.10 | ) |
| Return of capital | | | — | | | | — | | | | — | | | | (0.03 | ) | | | — | | | | — | |
| Total distributions | | | (0.37 | ) | | | (0.20 | ) | | | (0.23 | ) | | | (0.34 | ) | | | (0.31 | ) | | | (0.27 | ) |
| | | | | | | | | | | | | | | | | | | | | | | | | |
| Net asset value at end of period | | $ | 11.42 | | | $ | 13.61 | | | $ | 12.85 | | | $ | 9.84 | | | $ | 11.34 | | | $ | 11.28 | |
| | | | | | | | | | | | | | | | | | | | | | | | | |
| Total return (b) | | | (13.49 | %)(c) | | | 7.50 | % | | | 33.14 | % | | | (10.59 | %) | | | 3.35 | % | | | 4.81 | % |
| | | | | | | | | | | | | | | | | | | | | | | | | |
| Net assets at end of period (000’s) | | $ | 209,124 | | | $ | 236,259 | | | $ | 193,186 | | | $ | 143,897 | | | $ | 142,199 | | | $ | 129,268 | |
| | | | | | | | | | | | | | | | | | | | | | | | | |
| Ratio of total expenses to average net assets (e) | | | 0.93 | %(d) | | | 0.92 | % | | | 0.93 | % | | | 0.95 | % | | | 0.96 | % | | | 0.97 | % |
| | | | | | | | | | | | | | | | | | | | | | | | | |
| Ratio of net investment income to average net assets (a)(e) | | | 1.58 | %(d) | | | 1.42 | % | | | 1.73 | % | | | 2.18 | % | | | 2.28 | % | | | 1.85 | % |
| | | | | | | | | | | | | | | | | | | | | | | | | |
| Portfolio turnover rate | | | 6 | %(c) | | | 23 | % | | | 29 | % | | | 29 | % | | | 30 | % | | | 23 | % |
| (a) | Recognition of net investment income by the Fund is affected by the timing of declarations of dividends by the underlying investment companies, if any, in which the Fund invests. |
| (b) | Total return is a measure of the change in value of an investment in the Fund over the periods covered, which assumes any dividends or capital gains distributions are reinvested in shares of the Fund. Returns shown do not reflect the deduction of taxes a shareholder would pay on Fund distributions or the redemption of Fund shares. |
| (e) | The ratios of expenses and net investment income to average net assets do not reflect the Fund’s proportionate share of expenses of the underlying investment companies, if any, in which the Fund invests. |
See accompanying notes to financial statements.
| THE DAVENPORT FUNDS |
| NOTES TO FINANCIAL STATEMENTS |
| September 30, 2022 (Unaudited) |
1. Organization
Davenport Core Fund, Davenport Value & Income Fund, Davenport Equity Opportunities Fund, Davenport Small Cap Focus Fund and Davenport Balanced Income Fund (individually, a “Fund,” and, collectively, the “Funds”) are each a no-load series of the Williamsburg Investment Trust (the “Trust”), an open-end management investment company registered under the Investment Company Act of 1940, as amended. The Trust was organized as a Massachusetts business trust on July 18, 1988. Other series of the Trust are not incorporated in this report.
Davenport Core Fund’s investment objective is long-term growth of capital.
Davenport Value & Income Fund’s investment objective is to achieve long-term growth while generating current income through dividend payments on portfolio securities.
Davenport Equity Opportunities Fund’s investment objective is long-term capital appreciation.
Davenport Small Cap Focus Fund’s investment objective is long-term capital appreciation.
Davenport Balanced Income Fund’s investment objective is current income and an opportunity for long-term growth.
Davenport Core Fund, Davenport Value & Income Fund, Davenport Small Cap Focus Fund and Davenport Balanced Income Fund are each classified as a diversified fund. Davenport Equity Opportunities Fund is classified as a non-diversified fund.
2. Significant Accounting Policies
Each Fund follows accounting and reporting guidance under Financial Accounting Standards Board (“FASB”) Accounting Standards Codification Topic 946, “Financial Services – Investment Companies.” The following is a summary of the Funds’ significant accounting policies. The policies are in conformity with accounting principles generally accepted in the United States of America (“GAAP”).
New Accounting Pronouncement — In March 2020, the FASB issued Accounting Standards Update No. 2020-04 (“ASU 2020-04”), “Reference Rate Reform (Topic 840): Facilitation of the Effects of Reference Rate Reform on Financial Reporting.” ASU 2020-04 provides entities with guidance to ease the potential accounting burden associated with transitioning away from reference rates (e.g., LIBOR) that are expected to be discontinued. ASU 2020-04 allows, among other things, certain contract modifications to be accounted as a continuation of the existing contract. This ASU was effective upon the issuance and its optional relief can be applied through December 31, 2022. Management is currently assessing the impact of the ASU on the Funds.
Securities valuation — The Funds’ portfolio securities are valued as of the close of business of the regular session of the New York Stock Exchange (the “NYSE”) (normally 4:00 p.m. Eastern time). Securities traded on a national stock exchange, including common stocks and exchange-traded funds (“ETFs”), if any, are valued based upon the closing price on the principal exchange where the security is traded, if available, otherwise, at the last quoted bid price. Securities that are
| THE DAVENPORT FUNDS |
| NOTES TO FINANCIAL STATEMENTS (Continued) |
quoted by NASDAQ are valued at the NASDAQ Official Closing Price. Investments representing shares of money market funds and other open-end investment companies, other than ETFs, are valued at their net asset value (“NAV”) as reported by such companies. When using a quoted price and when the market is considered active, securities will be classified as Level 1 within the fair value hierarchy (see below).
Fixed income securities, including corporate bonds and U.S. Treasury obligations, are typically valued on the basis of prices provided by an independent pricing service. The prices provided by the pricing service are determined with consideration given to institutional bid and last sale prices and take into account securities prices, yields, maturities, call features, ratings, institutional trading in similar groups of securities, and developments related to specific securities. Given the inputs used by the pricing service, these securities are classified as Level 2 within the fair value hierarchy.
When market quotations are not readily available, if a pricing service cannot provide a price, or if the investment adviser believes the price received from the pricing service is not indicative of fair value, securities will be valued in good faith at fair value using methods consistent with procedures adopted by the Board of Trustees and will be classified as Level 2 or 3 within the fair value hierarchy, depending on the inputs used. Such methods of fair valuation may include, but are not limited to: multiple of earnings, multiple of book value, discount from market of a similar freely traded security, purchase price of the security, subsequent private transactions in the security or related securities, or a combination of these and other factors.
GAAP establishes a single authoritative definition of fair value, sets out a framework for measuring fair value and requires additional disclosures about fair value measurements.
Various inputs are used in determining the value of the Funds’ investments. These inputs are summarized in the three broad levels listed below:
| ● | Level 1 – quoted prices in active markets for identical securities |
| ● | Level 2 – other significant observable inputs |
| ● | Level 3 – significant unobservable inputs |
The inputs or methodology used for valuing securities are not necessarily an indication of the risks associated with investing in those securities. The inputs used to measure fair value may fall into different levels of the fair value hierarchy. In such cases, for disclosure purposes, the level in the fair value hierarchy within which the fair value measurement falls in its entirety is determined based on the lowest level input that is significant to the fair value measurement.
| THE DAVENPORT FUNDS |
| NOTES TO FINANCIAL STATEMENTS (Continued) |
The following is a summary of the Funds’ investments based on the inputs used to value the investments as of September 30, 2022, by security type:
| Davenport Core Fund | | Level 1 | | | Level 2 | | | Level 3 | | | Total | |
| Common Stocks | | $ | 633,185,836 | | | $ | — | | | $ | — | | | $ | 633,185,836 | |
| Money Market Funds | | | 9,864,324 | | | | — | | | | — | | | | 9,864,324 | |
| Total | | $ | 643,050,160 | | | $ | — | | | $ | — | | | $ | 643,050,160 | |
| | | | | | | | | | | | | | | | | |
| | | | | | | | | | | | | | | | | |
| Davenport Value & Income Fund | | Level 1 | | | Level 2 | | | Level 3 | | | Total | |
| Common Stocks | | $ | 722,642,761 | | | $ | — | | | $ | — | | | $ | 722,642,761 | |
| Money Market Funds | | | 19,479,032 | | | | — | | | | — | | | | 19,479,032 | |
| Total | | $ | 742,121,793 | | | $ | — | | | $ | — | | | $ | 742,121,793 | |
| | | | | | | | | | | | | | | | | |
| | | | | | | | | | | | | | | | | |
| Davenport Equity Opportunities Fund | | Level 1 | | | Level 2 | | | Level 3 | | | Total | |
| Common Stocks | | $ | 536,850,918 | | | $ | — | | | $ | — | | | $ | 536,850,918 | |
| Money Market Funds | | | 52,187,075 | | | | — | | | | — | | | | 52,187,075 | |
| Total | | $ | 589,037,993 | | | $ | — | | | $ | — | | | $ | 589,037,993 | |
| | | | | | | | | | | | | | | | | |
| | | | | | | | | | | | | | | | | |
| Davenport Small Cap Focus Fund | | Level 1 | | | Level 2 | | | Level 3 | | | Total | |
| Common Stocks | | $ | 460,499,546 | | | $ | — | | | $ | — | | | $ | 543,251,068 | |
| Money Market Funds | | | 34,899,579 | | | | — | | | | — | | | | 34,899,579 | |
| Total | | $ | 495,399,125 | | | $ | — | | | $ | — | | | $ | 495,399,125 | |
| | | | | | | | | | | | | | | | | |
| | | | | | | | | | | | | | | | | |
| Davenport Balanced Income Fund | | Level 1 | | | Level 2 | | | Level 3 | | | Total | |
| Common Stocks | | $ | 114,423,329 | | | $ | — | | | $ | — | | | $ | 114,423,329 | |
| Fixed Rate Corporate Bonds | | | — | | | | 63,061,107 | | | | — | | | | 63,061,107 | |
| Variable Rate Corporate Bonds | | | — | | | | 9,682,648 | | | | — | | | | 9,682,648 | |
| U.S. Treasury Obligations | | | — | | | | 17,529,587 | | | | — | | | | 17,529,587 | |
| Money Market Funds | | | 4,146,709 | | | | — | | | | — | | | | 4,146,709 | |
| Total | | $ | 118,570,038 | | | $ | 90,273,342 | | | $ | — | | | | 208,843,380 | |
| | | | | | | | | | | | | | | | | |
Refer to each Fund’s Schedule of Investments for a listing of the securities by sector type. There were no Level 3 securities or derivative instruments held by the Funds as of or during the six months ended September 30, 2022.
Foreign currency translation — Investment securities and other assets and liabilities denominated in or expected to settle in foreign currencies, if any, are translated into U.S. dollars based on exchange rates on the following basis:
| A. | The fair values of investment securities and other assets and liabilities are translated as of the close of the NYSE each day. |
| THE DAVENPORT FUNDS |
| NOTES TO FINANCIAL STATEMENTS (Continued) |
| B. | Purchases and sales of investment securities and income and expenses are translated at the rate of exchange prevailing as of 4:00 p.m. Eastern time on the respective date of such transactions. |
| C. | The Funds do not isolate that portion of the results of operations caused by changes in foreign exchange rates on investments from those caused by changes in market prices of securities held. Such fluctuations are included with the net realized and unrealized gains or losses on investments. |
Reported net realized foreign exchange gains or losses arise from 1) purchases and sales of foreign currencies and 2) the difference between the amounts of dividends and foreign withholding taxes recorded on the Fund’s books and the U.S. dollar equivalent of the amounts actually received or paid. Reported net unrealized foreign exchange gains and losses arise from changes in the value of assets and liabilities that result from changes in exchange rates.
Cash — Each Fund’s cash position, if any, is held in a bank account with balances which, at times, may exceed United States federally insured limits set by the amount covered by federal deposit insurance. The Funds maintain these balances with a high quality financial institution and may incur charges on cash overdrafts.
Share valuation — The NAV per share of each Fund is calculated daily by dividing the total value of its assets, less liabilities, by the number of shares outstanding. The offering price and redemption price per share of each Fund is equal to the NAV per share.
Investment income — Interest income is accrued as earned. Discounts and premiums on fixed-income securities are amortized using the interest method. Dividend income is recorded on the ex-dividend date. Non-cash dividends included in dividend income, if any, are recorded at the fair market value of the security received. The Funds record distributions received from investments in real estate investment trusts (also known as “REITs”) in excess of income from underlying investments as a reduction of cost of investments and/or realized gain. These amounts are recorded once the issuers provide information about the actual composition of the distributions. Withholding taxes on foreign dividends have been recorded in accordance with the Funds’ understanding of the applicable country’s rules and tax rates.
Investment transactions — Investment transactions are accounted for on trade date for financial reporting purposes. Realized gains and losses on investment securities sold are determined on a specific identification basis.
Common expenses — Common expenses of the Trust are allocated among the Funds and the other series of the Trust based on relative net assets of each series or the nature of the services performed and the relative applicability to each series.
Distributions to shareholders — Dividends arising from net investment income, if any, are declared and paid quarterly to shareholders of Davenport Core Fund, Davenport Value & Income Fund, Davenport Small Cap Focus Fund and Davenport Balanced Income Fund; and declared and paid semi-annually to shareholders of Davenport Equity Opportunities Fund. Net realized short-term capital gains, if any, may be distributed throughout the year and net realized long-term
| THE DAVENPORT FUNDS |
| NOTES TO FINANCIAL STATEMENTS (Continued) |
capital gains, if any, are distributed at least once each year. The amount of distributions from net investment income and net realized capital gains are determined in accordance with federal income tax regulations, which may differ from GAAP. Dividends and distributions are recorded on the ex-dividend date.
The tax character of distributions paid during the periods ended September 30, 2022 and March 31, 2022 was as follows:
| | | Periods | | Ordinary | | | Long-Term | | | Total | |
| | | Ended | | Income | | | Capital Gains | | | Distributions | |
| Davenport Core Fund | | 09/30/22 | | $ | 6,134,576 | | | $ | 24,804,754 | | | $ | 30,939,330 | |
| | | 03/31/22 | | $ | 947,615 | | | $ | 67,520,115 | | | $ | 68,467,730 | |
| Davenport Value & Income Fund | | 09/30/22 | | $ | 6,638,441 | | | $ | 23,078,959 | | | $ | 29,717,400 | |
| | | 03/31/22 | | $ | 18,460,705 | | | $ | 20,421,022 | | | $ | 38,881,727 | |
| Davenport Equity Opportunities Fund | | 09/30/22 | | $ | 4,943,696 | | | $ | 36,158,260 | | | $ | 41,101,956 | |
| | | 03/31/22 | | $ | 4,545,459 | | | $ | 72,940,203 | | | $ | 77,485,662 | |
| Davenport Small Cap Focus Fund | | 09/30/22 | | $ | — | | | $ | 31,371,059 | | | $ | 31,371,059 | |
| | | 03/31/22 | | $ | 36,919,188 | | | $ | 41,560,446 | | | $ | 78,479,634 | |
| Davenport Balanced Income Fund | | 09/30/22 | | $ | 2,529,841 | | | $ | 4,084,914 | | | $ | 6,614,755 | |
| | | 03/31/22 | | $ | 2,938,628 | | | $ | 362,786 | | | $ | 3,301,414 | |
Estimates — The preparation of financial statements in conformity with GAAP requires management to make estimates and assumptions that affect the reported amounts of assets and liabilities and disclosure of contingent assets and liabilities, each as of the date of the financial statements, and the reported amounts of increase (decrease) in net assets from operations during the reporting period. Actual results could differ from those estimates.
Federal income tax — Each Fund has qualified and intends to continue to qualify as a regulated investment company under the Internal Revenue Code of 1986, as amended (the “Code”). Qualification generally will relieve the Funds of liability for federal income taxes to the extent 100% of their net investment income and net realized capital gains are distributed in accordance with the Code.
In order to avoid imposition of the excise tax applicable to regulated investment companies, it is also each Fund’s intention to declare as dividends in each calendar year at least 98% of its net investment income (earned during the calendar year) and 98.2% of its net realized capital gains (earned during the twelve months ended October 31) plus undistributed amounts from prior years.
| THE DAVENPORT FUNDS |
| NOTES TO FINANCIAL STATEMENTS (Continued) |
The following information is computed on a tax basis for each item as of September 30, 2022:
| | | | | | | | | Davenport | |
| | | | | | Davenport | | | Equity | |
| | | Davenport | | | Value & | | | Opportunities | |
| | | Core Fund | | | Income Fund | | | Fund | |
| Cost of investments | | $ | 460,021,057 | | | $ | 682,467,183 | | | $ | 559,990,951 | |
| Gross unrealized appreciation | | $ | 223,797,767 | | | $ | 129,673,933 | | | $ | 109,147,495 | |
| Gross unrealized depreciation | | | (40,768,664 | ) | | | (70,019,323 | ) | | | (80,100,453 | ) |
| Net unrealized appreciation | | | 183,029,103 | | | | 59,654,610 | | | | 29,047,042 | |
| Accumulated ordinary income | | | 142,185 | | | | 1,024,530 | | | | 246,538 | |
| Other gains (losses) | | | (17,622,342 | ) | | | 7,084,039 | | | | (2,156,471 | ) |
| Accumulated earnings | | $ | 165,548,946 | | | $ | 67,763,179 | | | $ | 27,137,109 | |
| | | | | | | | | | | | | |
| | | | | | | | | | | | | |
| | | | | | Davenport | | | Davenport | |
| | | | | | Small Cap | | | Balanced | |
| | | | | | Focus Fund | | | Income Fund | |
| Cost of investments | | | | | | $ | 548,052,391 | | | $ | 209,778,314 | |
| Gross unrealized appreciation | | | | | | $ | 40,043,053 | | | $ | 17,765,844 | |
| Gross unrealized depreciation | | | | | | | (92,696,319 | ) | | | (18,700,778 | ) |
| Net unrealized depreciation | | | | | | | (52,653,266 | ) | | | (934,934 | ) |
| Accumulated ordinary income (loss) | | | | | | | (74,829 | ) | | | 273,443 | |
| Other gains | | | | | | | 5,071,815 | | | | 499,208 | |
| Accumulated deficit | | | | | | $ | (47,656,280 | ) | | $ | (162,283 | ) |
| | | | | | | | | | | | | |
The difference between the federal income tax cost of investments and the financial statement cost of investments for Davenport Value & Income Fund, Davenport Small Cap Focus Fund and Davenport Balanced Income Fund is due to certain timing differences in the recognition of capital gains and losses under income tax regulations and GAAP. These timing differences are temporary in nature and are due to the tax deferral of losses on wash sales, and adjustments to basis on partnerships.
The Funds recognize the tax benefits or expenses of uncertain tax positions only when the position is “more likely than not” to be sustained assuming examination by tax authorities. Management has reviewed the tax positions taken on Federal income tax returns for each Fund for the current and all open tax years (generally, three years) and has concluded that no provision for unrecognized tax benefits or expenses is required in these financial statements.
| THE DAVENPORT FUNDS |
| NOTES TO FINANCIAL STATEMENTS (Continued) |
3. Investment Transactions
Investment transactions, other than short-term investments and U.S. government securities, were as follows for the six months ended September 30, 2022:
| | | | | | | | | Davenport | |
| | | | | | Davenport | | | Equity | |
| | | Davenport | | | Value & | | | Opportunities | |
| | | Core Fund | | | Income Fund | | | Fund | |
| Purchases of investment securities | | $ | 37,426,231 | | | $ | 76,646,584 | | | $ | 63,101,943 | |
| Proceeds from sales of investment securities | | $ | 47,754,311 | | | $ | 39,047,969 | | | $ | 64,843,183 | |
| | | | | | | | | | | | | |
| | | | | | | | | | | | | |
| | | | | | Davenport | | | Davenport | |
| | | | | | Small Cap | | | Balanced | |
| | | | | | Focus Fund | | | Income Fund | |
| Purchases of investment securities | | | | | | $ | 96,333,099 | | | $ | 19,424,345 | |
| Proceeds from sales and maturities of investment securities | | | | | | $ | 75,338,788 | | | $ | 13,590,424 | |
| | | | | | | | | | | | | |
4. Transactions with Related Parties
INVESTMENT ADVISORY AGREEMENTS
Each Fund’s investments are managed by Davenport & Company LLC (the “Adviser”) under the terms of an Investment Advisory Agreement. Under the Investment Advisory Agreement, each Fund pays the Adviser a fee, which is computed and accrued daily and paid monthly, at an annual rate of 0.75% of its average daily net assets. Certain officers and a Trustee of the Trust are also officers of the Adviser.
A significant portion of the Funds’ investment trades are executed through an affiliated broker-dealer of the Adviser. No commissions are paid by the Funds to the Adviser or the affiliate for these trades.
OTHER SERVICE PROVIDERS
Ultimus Fund Solutions, LLC (“Ultimus”) provides administration, fund accounting, compliance and transfer agent services to the Funds. The Funds pay Ultimus fees in accordance with the agreements for such services. In addition, the Funds pay out-of-pocket expenses including, but not limited to, postage, supplies, and certain costs related to the pricing of the Funds’ portfolio securities. Certain officers of the Trust are also officers of Ultimus, or of Ultimus Fund Distributors, LLC (the “Distributor”), the principal underwriter of each Fund’s shares and an affiliate of Ultimus. The Distributor is compensated by the Adviser (not the Funds) for acting as principal underwriter.
| THE DAVENPORT FUNDS |
| NOTES TO FINANCIAL STATEMENTS (Continued) |
COMPENSATION OF TRUSTEES
Trustees and officers affiliated with the Adviser or Ultimus are not compensated by the Trust for their services. Each Trustee who is not an affiliated person of the Adviser or Ultimus receives from the Trust an annual retainer of $30,000, payable quarterly; a fee of $2,000 for attendance at each meeting of the Board of Trustees (except that such fee is $3,000 for the independent chair); and a fee of $1,000 for attendance at each meeting of any committee of the Board (except that such fee is $1,500 for the committee chair); plus reimbursement of travel and other expenses incurred in attending meetings. Each series of the Trust pays its proportionate share of such fees.
5. Sector Risk
If a Fund has significant investments in the securities of issuers in industries within a particular business sector, any development affecting that sector will have a greater impact on the value of the net assets of the Fund than would be the case if the Fund did not have significant investments in that sector. In addition, this may increase the risk of loss of an investment in the Fund and increase the volatility of the Fund’s NAV per share. From time to time, circumstances may affect a particular sector and the companies within such sector. For instance, economic or market factors, regulation or deregulation, or other developments may negatively impact all companies in a particular sector and therefore the value of a Fund’s portfolio would be adversely affected. As of September 30, 2022, none of the Funds had over 25% of their net assets invested in any one sector.
6. Contingencies and Commitments
The Funds indemnify the Trust’s officers and Trustees for certain liabilities that might arise from the performance of their duties to the Funds. Additionally, in the normal course of business the Funds enter into contracts that contain a variety of representations and warranties and which provide general indemnifications. The Funds’ maximum exposure under these arrangements is unknown, as this would involve future claims that may be made against the Funds that have not yet occurred. However, based on experience, the Funds expect the risk of loss to be remote.
7. Subsequent Events
The Funds are required to recognize in the financial statements the effects of all subsequent events that provide additional evidence about conditions that existed as of the date of the Statements of Assets and Liabilities. For non-recognized subsequent events that must be disclosed to keep the financial statements from being misleading, the Funds are required to disclose the nature of the event as well as an estimate of its financial effect, or a statement that such an estimate cannot be made. Management has evaluated subsequent events through the issuance of these financial statements and has noted no such events.
| THE DAVENPORT FUNDS |
| YOUR FUNDS’ EXPENSES (Unaudited) |
We believe it is important for you to understand the impact of costs on your investment. All mutual funds have operating expenses. As a shareholder of the Funds, you incur ongoing costs, including management fees and other expenses. These ongoing costs, which are deducted from each Fund’s gross income, directly reduce the investment return of the Funds.
A mutual fund’s ongoing costs are expressed as a percentage of its average net assets. This figure is known as the expense ratio. The following examples are intended to help you understand the ongoing costs (in dollars) of investing in the Funds and to compare these costs with the ongoing costs of investing in other mutual funds. The examples below are based on an investment of $1,000 made at the beginning of the period shown and held for the entire period (April 1, 2022 through September 30, 2022).
The table below illustrates each Fund’s ongoing costs in two ways:
Actual fund return – This section helps you to estimate the actual expenses that you paid over the period. The “Ending Account Value” shown is derived from each Fund’s actual return, and the fourth column shows the dollar amount of operating expenses that would have been paid by an investor who started with $1,000 in the Funds. You may use the information here, together with the amount you invested, to estimate the expenses that you paid over the period.
To do so, simply divide your account value by $1,000 (for example, an $8,600 account value divided by $1,000 = 8.6), then multiply the result by the number given for the applicable Fund under the heading “Expenses Paid During Period.”
Hypothetical 5% return – This section is intended to help you compare each Fund’s ongoing costs with those of other mutual funds. It assumes that each Fund had an annual return of 5% before expenses during the period shown, but that the expense ratio is unchanged. In this case, because the return used is not each Fund’s actual return, the results do not apply to your investment. The example is useful in making comparisons because the U.S. Securities and Exchange Commission (the “SEC”) requires all mutual funds to calculate expenses based on a 5% return. You can assess each Fund’s ongoing costs by comparing this hypothetical example with the hypothetical examples that appear in shareholder reports of other funds.
Note that expenses shown in the table are meant to highlight and help you compare ongoing costs only. The Funds do not charge sales loads or redemption fees.
The calculations assume no shares were bought or sold during the period. Your actual costs may have been higher or lower, depending on the amount of your investment and the timing of any purchases or redemptions.
More information about each Fund’s expenses, including historical annual expense ratios, can be found in this report. For additional information on operating expenses and other shareholder costs, please refer to the Funds’ prospectus.
| THE DAVENPORT FUNDS |
| YOUR FUNDS’ EXPENSES (Unaudited) (Continued) |
| | | | | | | | | |
| | | Beginning | | Ending | | | | |
| | | Account Value | | Account Value | | | | |
| | | April 1, | | September 30, | | Expense | | Expenses Paid |
| | | 2022 | | 2022 | | Ratio(a) | | During Period(b) |
| | | | | | | | | |
| | | | | | | | | |
| Davenport Core Fund | | | | | | | | |
| | | | | | | | | |
| | | | | | | | | |
| Based on Actual Fund Return | | $1,000.00 | | $791.30 | | 0.87% | | $3.91 |
| Based on Hypothetical 5% Return (before expenses) | | $1,000.00 | | $1,020.71 | | 0.87% | | $4.41 |
| | | | | | | | | |
| | | | | | | | | |
| Davenport Value & Income Fund | | | | | | | | |
| | | | | | | | | |
| | | | | | | | | |
| Based on Actual Fund Return | | $1,000.00 | | $804.50 | | 0.87% | | $3.94 |
| Based on Hypothetical 5% Return (before expenses) | | $1,000.00 | | $1,020.71 | | 0.87% | | $4.41 |
| | | | | | | | | |
| | | | | | | | | |
| Davenport Equity Opportunities Fund | | | | | | | | |
| | | | | | | | | |
| | | | | | | | | |
| Based on Actual Fund Return | | $1,000.00 | | $800.50 | | 0.88% | | $3.97 |
| Based on Hypothetical 5% Return (before expenses) | | $1,000.00 | | $1,020.66 | | 0.88% | | $4.46 |
| | | | | | | | | |
| | | | | | | | | |
| Davenport Small Cap Focus Fund | | | | | | | | |
| | | | | | | | | |
| | | | | | | | | |
| Based on Actual Fund Return | | $1,000.00 | | $825.10 | | 0.89% | | $4.07 |
| Based on Hypothetical 5% Return (before expenses) | | $1,000.00 | | $1,020.61 | | 0.89% | | $4.51 |
| | | | | | | | | |
| | | | | | | | | |
| Davenport Balanced Income Fund | | | | | | | | |
| | | | | | | | | |
| | | | | | | | | |
| Based on Actual Fund Return | | $1,000.00 | | $865.10 | | 0.93% | | $4.35 |
| Based on Hypothetical 5% Return (before expenses) | | $1,000.00 | | $1,020.41 | | 0.93% | | $4.71 |
| | | | | | | | | |
| (a) | Annualized, based on each Fund’s most recent one-half year expenses. |
| (b) | Expenses are equal to each Fund’s annualized expense ratio multiplied by the average account value over the period, multiplied by 183/365 (to reflect the one-half year period). |
| THE DAVENPORT FUNDS |
| OTHER INFORMATION (Unaudited) |
A description of the policies and procedures that the Funds use to vote proxies relating to portfolio securities is available without charge upon request by calling toll-free 1-800-281-3217, or on the SEC’s website at www.sec.gov. Information regarding how the Funds voted proxies relating to portfolio securities during the most recent 12-month period ended June 30 is also available without charge upon request by calling toll-free 1-800-281-3217, or on the SEC’s website at www.sec.gov.
The Trust files a complete listing of portfolio holdings for each Fund with the SEC as of the end of the first and third quarters of each fiscal year as an exhibit to its reports on Form N-PORT. These filings are available upon request by calling 1-800-281-3217. Furthermore, you may obtain a copy of these filings on the SEC’s website at www.sec.gov.
A complete listing of portfolio holdings for each Fund is updated daily and can be reviewed at the Funds’ website at www.investdavenport.com.
Privacy Notice
| FACTS | WHAT DO THE DAVENPORT FUNDS DO WITH YOUR PERSONAL INFORMATION? |
| | | | |
| Why? | Financial companies choose how they share your personal information. Federal law gives consumers the right to limit some but not all sharing. Federal law also requires us to tell you how we collect, share, and protect your personal information. Please read this notice carefully to understand what we do. |
| | | | |
| What? | The types of personal information we collect and share depend on the product or service you have with us. This information can include: ■ Social Security number ■ Assets ■ Retirement Assets ■ Transaction History ■ Checking Account Information ■ Purchase History ■ Account Balances ■ Account Transactions ■ Wire Transfer Instructions When you are no longer our customer, we continue to share your information as described in this notice. |
| | | | |
| How? | All financial companies need to share your personal information to run their everyday business. In the section below, we list the reasons financial companies can share their customers’ personal information; the reasons The Davenport Funds choose to share; and whether you can limit this sharing. |
| | | | |
| Reasons we can share your personal information | Do The Davenport
Funds share? | Can you limit this
sharing? |
For our everyday business purposes –
Such as to process your transactions, maintain your account(s), respond to court orders and legal investigations, or report to credit bureaus | Yes | No |
For our marketing purposes –
to offer our products and services to you | No | We don’t share |
| For joint marketing with other financial companies | No | We don’t share |
| For our affiliates’ everyday business purposes – information about your creditworthiness | No | We don’t share |
| For nonaffiliates to market to you | No | We don’t share |
| | | | |
| Questions? | Call 1-800-281-3217 |
| | | | | |
| Who we are |
| Who is providing this notice? | Williamsburg Investment Trust Ultimus Fund Distributors, LLC Ultimus Fund Solutions, LLC |
| What we do |
| How do The Davenport Funds protect my personal information? | To protect your personal information from unauthorized access and use, we use security measures that comply with federal law. These measures include computer safeguards and secured files and buildings. Our service providers are held accountable for adhering to strict policies and procedures to prevent any misuse of your nonpublic personal information. |
| How do The Davenport Funds collect my personal information? | We collect your personal information, for example, when you ■ Provide account information ■ Give us your contact information ■ Make deposits or withdrawals from your account ■ Make a wire transfer ■ Tell us where to send the money ■ Tell us who receives the money ■ Show your government-issued ID ■ Show your driver’s license We also collect your personal information from other companies. |
| Why can’t I limit all sharing? | Federal law gives you the right to limit only ■ Sharing for affiliates’ everyday business purposes – information about your creditworthiness ■ Affiliates from using your information to market to you ■ Sharing for nonaffiliates to market to you State laws and individual companies may give you additional rights to limit sharing. |
| | |
| Definitions |
| Affiliates | Companies related by common ownership or control. They can be financial and nonfinancial companies. ■ Davenport & Company LLC, the investment adviser to The Davenport Funds, could be deemed to be an affiliate. |
| Nonaffiliates | Companies not related by common ownership or control. They can be financial and nonfinancial companies ■ The Davenport Funds do not share with nonaffiliates so they can market to you |
| Joint marketing | A formal agreement between nonaffiliated financial companies that together market financial products or services to you. ■ The Davenport Funds don’t jointly market. |
This page intentionally left blank.
This page intentionally left blank.
| |
| |
| |
| |
| |
| |
| THE DAVENPORT FUNDS |
| |
| Investment Adviser |
| Davenport & Company LLC |
| One James Center |
| 901 East Cary Street |
| Richmond, Virginia 23219-4037 |
| |
| Administrator |
| Ultimus Fund Solutions, LLC |
| P.O. Box 46707 |
| Cincinnati, Ohio 45246-0707 |
| 1-800-281-3217 |
| |
| Custodian |
| U.S. Bank, N.A. |
| 425 Walnut Street |
| Cincinnati, Ohio 45202 |
| |
| Independent Registered Public |
| Accounting Firm |
| Cohen & Company, Ltd. |
| 342 N Water Street, |
| Suite 830 |
| Milwaukee, WI 53202 |
| |
| Legal Counsel |
| Sullivan & Worcester LLP |
| 1666 K Street, N.W. |
| Washington, DC 20006 |
| |
| Board of Trustees |
| Robert S. Harris, Ph.D., Chairman |
| John P. Ackerly, IV |
| John T. Bruce |
| George K. Jennison |
| Harris V. Morrissette |
| Elizabeth W. Robertson |
| |
| Officers |
| John P. Ackerly, IV, President |
| Cheryl B. Hatcher, Vice President |
| George L. Smith, III, Vice President |
| |
| |
| |
| |
| |
| Davenport-SAR-22 |
| |
| |
| |
| |
| |
| |
 |
| |
| |
|
| |
| |
| Cantor FBP Equity & Dividend Plus Fund |
| Cantor FBP Appreciation & Income Opportunities Fund |
| |
| |
| |
| |
| |
| |
| |
| |
| Semi-Annual Report |
| September 30, 2022 |
| (Unaudited) |
| |
| |
| |
| |
| |
| |
| |
| |
| |
| |
| |
| |
| |
| |
| |
| |
| No-Load Funds |
| |
| |
| |
| |
| Letter to Shareholders | November 3, 2022 |
We are pleased to report on your Funds and their investments for the semi-annual period ended September 30, 2022 and to provide some additional information since we last communicated with you.
Economic and Market Update
2022 has been a difficult year for stock and bond investors, and the most recent quarter was no exception. Stocks ended the quarter at or near their lows and have fallen for three quarters in a row. Fixed income markets were also weak with both markets heavily influenced by inflation and the Federal Reserve’s (the “Fed”) response to it. Optimism abounded during July as expectations that inflation was easing produced a significant rally in stock prices. About half of the year-to-date losses for the S&P 500® were recovered that month. It didn’t last. August’s CPI report, showing persistently high numbers, threw cold water on the rally, and a broad selloff lasted through the end of September.
The old adage “don’t fight the Fed” seems to be playing out true to form in the markets this year. In September, the Federal Open Market Committee announced a 75 basis point increase in the fed funds rate. The committee increased the rate by that same amount in its two previous meetings. Taken together, these moves are the most aggressive rate hikes since 1994. Despite hopeful comments from the Fed about inflation being transitory, rising costs have persisted and even worsened during 2022. Oftentimes, inflation is driven by strong consumer demand as economies get overheated, but this bout with escalating prices appears to be more closely related to global supply chain issues coming out of the pandemic. Energy prices, which had been a major driver of inflation early in 2022, dropped over the summer, with gasoline prices well off peak levels and down 10% for the month of August, giving rise to the expectation that inflation had improved. But declining fuel costs were not enough to offset rising prices for food, shelter and medical expenses. Even excluding more volatile food and energy components, inflation was higher than expected at 0.6% for the month of August and 6.3% year over year. Investors were seemingly caught off guard by this news, and stock prices fell quickly as the reality set in that higher interest rates for an extended period were likely.
It is becoming more and more obvious that attempts to bring down sky-high inflation that harkens back to the 1970s will be challenging. Fed Chairman Jerome Powell has acknowledged that this fight will bring real economic pain to Americans. The good news is that employment levels remain quite strong. It will be important to watch those numbers in the coming quarters. Most analysts now place low odds on Powell being able to facilitate a soft landing that would dampen inflation without causing a recession. It appears to us that the most probable scenario is a mild recession that has either already started or will begin shortly. We would expect to see deteriorating economic indicators heading into 2023 with corporate earnings coming under pressure as a result.
Having painted an underwhelming picture of the economy, one might expect us to have a negative view of the equity markets. That would not be accurate. While we are not market timers, and we acknowledge that stocks could fall further from here, we understand that stocks are a forward-looking asset class. Every stock, every day, is theoretically priced to reflect investor expectations for future fundamentals such as book value, earnings and dividends. Because of this forward discounting, stock prices usually bottom well before fundamental improvement is evident. As investors, one of the most difficult things to ascertain is timing when a stock adequately discounts anticipated negative results and begins to trade on expectations of a recovery. The sharp market rally in October may indicate an inflection point, only time will tell. However, our efforts will be focused on finding opportunities to positon the Funds for the balance of 2022 and for an eventual market recovery.
Cantor FBP Equity & Dividend Plus Fund Review
The Cantor FBP Equity & Dividend Plus Fund returned -15.97% for the semi-annual and -6.44% for the annual period ended September 30, 2022, outpacing the S&P 500® Index which returned -20.20% and -15.47% over the same time periods. The Fund was invested 90.8% equity and 9.2% cash as of September 30, 2022.
Energy and Consumer Staples were the strongest contributors to the Fund’s performance. Individually, Genuine Parts, Kellogg, Merck and Exxon Mobil were the more favorable contributors. Technology and Financials were the weakest contributors, with Paramount, Broadcom, Intel and Hanesbrand dragging down results. Activity in the period included new purchases of Comcast, Skyworks and Target, as well as sales of Compass Minerals, Warner Brothers Discovery and Amdocs.
Cash flow generation from dividends is a primary focus of your Equity & Dividend Plus Fund as well as cash generated from option premiums. The Fund utilizes as part of its investment discipline the use of covered call options as individual securities approach the top of the Adviser’s growth and price expectations. The Fund’s purpose in selling the call option is to generate additional cash flow to the Fund and to hedge the possibility the security may not achieve its price objective. In very strong stock markets, this discipline may limit the upside of the securities where options have been written, but in flat to negative markets, it may provide additional return. During the semi-annual period ended September 30, 2022, the amount of premiums generated from selling covered call options was $184,066.
Cantor FBP Appreciation & Income Opportunities Fund Review
The Cantor FBP Appreciation & Income Opportunities Fund returned -14.91% for the semi-annual and -6.79% for the annual period ended September 30, 2022. The S&P 500® Index returned -20.20% and -15.47%, and the Bloomberg Intermediate U.S. Government/Credit Index returned -5.36% and -10.14% respectively over the same time periods. The Fund was 71.8% equity, 12.9% fixed income and 15.3% cash as of September 30, 2022.
Overall attribution was similar for both Funds and changes in the interest rate environment was a substantial factor. Energy and Consumer Staples were the strongest contributors to the Fund’s performance. Individually, Kellogg, Merck, Devon Energy and ConocoPhillips were the top contribuors. Technology and Financials were the weakest contributors, with Broadcom, Bank of America, JPMorgan and Intel dragging down results. The Fund added positions in BWX Technologies, Comcast, Simon Property Group and Home Depot and eliminated Tyson Foods. The Fund was also active this period adding to its fixed income investments given the higher interest rates across the yield curve.
The Fund does utilize as part of its investment discipline the use of covered call options as individual securities approach the top of the Adviser’s growth and price expectations. The Fund’s purpose in selling the call option is to generate additional income to the Fund and to hedge the possibility the security may not achieve its price objective. In very strong stock markets, this discipline may limit the upside of the securities where options have been written, but in modest to negative markets, it may provide additional return. During the semi-annual period ended September 30, 2022, the amount of premiums generated from selling covered call options was $34,260.
We want to thank you for your continued support and investment in the Cantor Flippin, Bruce & Porter Funds. Please visit our website at www.fbpfunds.com for information on your Funds and the investment philosophy and process we utilize to achieve their investment objectives.
John T. Bruce, CFA
President - Portfolio Manager
November 3, 2022
Data presented reflects past performance, which is no guarantee of future results. Investment results and principal value will fluctuate so that shares, when redeemed, may be worth more or less than their original cost. Due to market volatility, current performance may be higher or lower than the performance shown. Updated performance information, current through the most recent month-end, is available by contacting the Funds at 1-866-738-1127.
This report is submitted for the general information of the shareholders of the Funds. It reflects our views, opinions and portfolio holdings as of the date of this letter. These views are subject to change at any time based upon market or other conditions. For more current information throughout the year please visit www.fbpfunds.com or call the Funds at 1-866-738-1127. This report is not authorized for distribution to prospective investors in the Funds unless accompanied by a current prospectus.
| THE CANTOR FBP MUTUAL FUNDS |
| COMPARATIVE PERFORMANCE CHARTS |
| (Unaudited) |
Performance for each Fund is compared to the most appropriate broad-based index, the S&P 500® Index, an unmanaged index of 500 large common stocks. Each Fund’s performance results are also compared to the Consumer Price Index, a measure of inflation; the Bloomberg Intermediate U.S. Government/Credit Index is also compared for the Cantor FBP Appreciation & Income Opportunities Fund.
Cantor FBP Equity & Dividend Plus Fund
Comparison of the Change in Value of a $10,000 Investment in
Cantor FBP Equity & Dividend Plus Fund, the S&P 500® Index and the Consumer Price Index
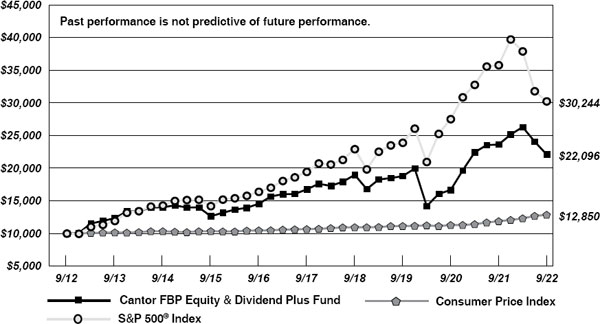
| THE CANTOR FBP MUTUAL FUNDS |
| COMPARATIVE PERFORMANCE CHARTS |
| (Unaudited) (Continued) |
Cantor FBP Appreciation & Income Opportunities Fund
Comparison of the Change in Value of a $10,000 Investment in
Cantor FBP Appreciation & Income Opportunities Fund, the S&P 500® Index,
the Consumer Price Index and the Bloomberg Intermediate U.S. Government/Credit Index
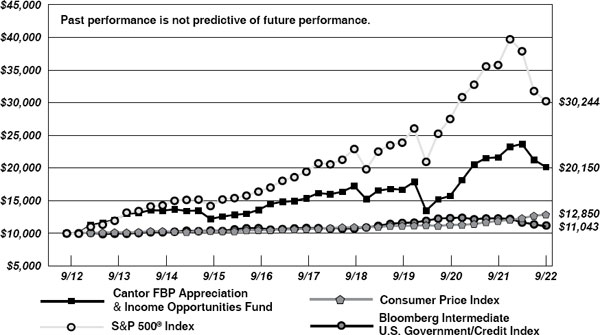
| | | | | |
| | Average Annual Total Returns (for periods ended September 30, 2022) | |
| | | | | |
| | | | 1 Year | | 5 Years | | 10 Years | |
| | Cantor FBP Equity & Dividend Plus Fund (a) | | -6.44% | | 5.69% | | 8.25% | |
| | Cantor FBP Appreciation & Income Opportunities Fund (a) | | -6.79% | | 5.57% | | 7.26% | |
| | S&P 500® Index | | -15.47% | | 9.24% | | 11.70% | |
| | Consumer Price Index | | 8.27% | | 3.82% | | 2.54% | |
| | Bloomberg Intermediate U.S. Government/Credit Index | | -10.14% | | 0.38% | | 1.00% | |
| | | | | | | | | |
| (a) | Total returns are a measure of the change in value of an investment in the Fund over the periods covered, which assumes any dividends or capital gains distributions are reinvested in shares of the Fund. Returns do not reflect the deduction of taxes a shareholder would pay on the Fund’s distributions or the redemption of Fund shares. |
| CANTOR FBP |
| EQUITY & DIVIDEND PLUS FUND |
| PORTFOLIO INFORMATION |
| September 30, 2022 (Unaudited) |
| General Information | | | |
| Net Asset Value Per Share | | $ | 24.23 | |
| Total Net Assets (Millions) | | $ | 28.7 | |
| Current Expense Ratio | | | 1.12% | |
| Portfolio Turnover | | | 7% | |
| Fund Inception Date | | | 7/30/1993 | |
| | | | | | S&P 500® | |
| Stock Characteristics | | Fund | | | Index | |
| Number of Stocks | | | 55 | | | | 500 | |
| Weighted Avg Market Capitalization (Billions) | | $ | 120.6 | | | $ | 503.3 | |
| Price-to-Earnings Ratio (Bloomberg 1 Yr. | | | | | | | | |
| Forecast EPS) | | | 9.4 | | | | 12.3 | |
| Price-to-Book Value | | | 1.9 | | | | 2.2 | |
| Asset Allocation (% of Net Assets) |

Sector Diversification vs. the S&P 500® Index
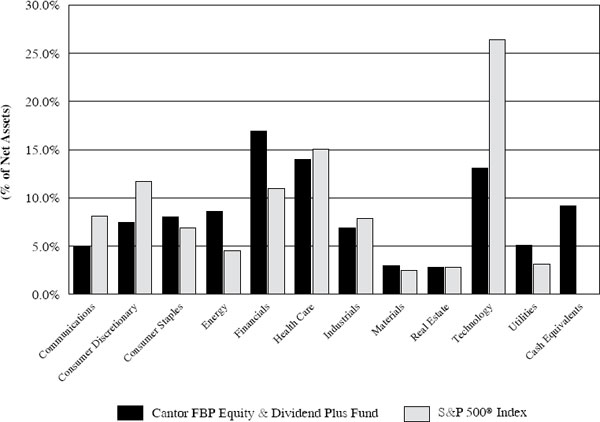
| Ten Largest Equity Holdings | | % of Net Assets |
| CVS Health Corporation | | 3.0% |
| Genuine Parts Company | | 2.9% |
| Merck & Company, Inc. | | 2.8% |
| Broadcom, Inc. | | 2.8% |
| Raytheon Technologies Corporation | | 2.6% |
| International Business Machines Corporation | | 2.6% |
| Exxon Mobil Corporation | | 2.6% |
| Chevron Corporation | | 2.4% |
| Johnson & Johnson | | 2.3% |
| Cisco Systems, Inc. | | 2.0% |
CANTOR FBP
APPRECIATION & INCOME OPPORTUNITIES FUND
PORTFOLIO INFORMATION
September 30, 2022 (Unaudited)
| General Information | | | |
| Net Asset Value Per Share | | $ | 18.26 | |
| Total Net Assets (Millions) | | $ | 29.6 | |
| Current Expense Ratio | | | 1.05 | % |
| Portfolio Turnover | | | 8 | % |
| Fund Inception Date | | | 7/3/1989 | |
| Asset Allocation (% of Net Assets) |
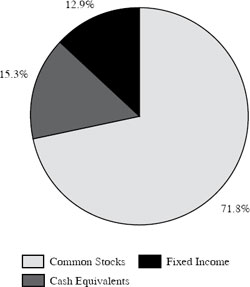
| Common Stock Portfolio (71.8% of Net Assets) |
| Number of Stocks | | | 52 | |
| Weighted Avg Market Capitalization (Billions) | | $ | 274.2 | |
| Price-to-Earnings Ratio (Bloomberg 1 Yr. Forecast EPS) | | | 9.5 | |
| Price-to-Book Value | | | 2.1 | |
| | | | | |
| Five Largest Sectors | | | % of Net Assets | |
| Financials | | | 15.0 | % |
| Technology | | | 13.4 | % |
| Health Care | | | 9.9 | % |
| Energy | | | 7.3 | % |
| Consumer Staples | | | 6.9 | % |
| Ten Largest Equity Holdings | | % of Net Assets |
| JPMorgan Chase & Company | | 2.9% |
| Apple, Inc. | | 2.8% |
| Bank of America Corporation | | 2.8% |
| Broadcom, Inc. | | 2.4% |
| Microsoft Corporation | | 2.4% |
| Shell plc - ADR | | 2.0% |
| CVS Health Corporation | | 1.9% |
| MetLife, Inc. | | 1.8% |
| Merck & Company, Inc. | | 1.8% |
| Devon Energy Corporation | | 1.8% |
| Fixed-Income Portfolio (12.9% of Net Assets) |
| Number of Fixed-Income Securities | | | 8 | |
| Average Quality | | | BAA1 | |
| Average Weighted Maturity | | | 3.7 | yrs. |
| Average Effective Duration | | | 3.3 | yrs. |
| Sector Breakdown | | % of Net Assets |
| U.S. Treasury Obligations | | 1.7% |
| Consumer Staples | | 1.6% |
| Financials | | 3.2% |
| Health Care | | 1.6% |
| Industrials | | 3.3% |
| Utilities | | 1.5% |
| CANTOR FBP |
| EQUITY & DIVIDEND PLUS FUND |
| SCHEDULE OF INVESTMENTS |
| September 30, 2022 (Unaudited) |
| COMMON STOCKS — 90.8% | | Shares | | | Value | |
| Communications — 4.9% | | | | | | | | |
| AT&T, Inc. | | | 24,000 | | | $ | 368,160 | |
| Comcast Corporation - Class A | | | 7,500 | | | | 219,975 | |
| Paramount Global - Class B | | | 19,500 | | | | 371,280 | |
| Verizon Communications, Inc. | | | 12,000 | | | | 455,640 | |
| | | | | | | | 1,415,055 | |
| Consumer Discretionary — 7.5% | | | | | | | | |
| Genuine Parts Company (a) | | | 5,500 | | | | 821,260 | |
| Hanesbrands, Inc. | | | 40,000 | | | | 278,400 | |
| Home Depot, Inc. (The) | | | 1,000 | | | | 275,940 | |
| Kohl’s Corporation | | | 14,000 | | | | 352,100 | |
| Tapestry, Inc. (a) | | | 15,000 | | | | 426,450 | |
| | | | | | | | 2,154,150 | |
| Consumer Staples — 8.0% | | | | | | | | |
| J.M. Smucker Company (The) (a) | | | 2,700 | | | | 371,007 | |
| Kellogg Company (a) | | | 7,000 | | | | 487,620 | |
| Kimberly-Clark Corporation | | | 3,500 | | | | 393,890 | |
| Mondelez International, Inc. - Class A | | | 5,500 | | | | 301,565 | |
| Philip Morris International, Inc. (a) | | | 5,300 | | | | 439,953 | |
| Target Corporation | | | 2,000 | | | | 296,780 | |
| | | | | | | | 2,290,815 | |
| Energy — 8.6% | | | | | | | | |
| Chevron Corporation | | | 4,800 | | | | 689,616 | |
| ConocoPhillips (a) | | | 5,200 | | | | 532,168 | |
| Exxon Mobil Corporation (a) | | | 8,500 | | | | 742,135 | |
| Shell plc - ADR | | | 10,250 | | | | 510,040 | |
| | | | | | | | 2,473,959 | |
| Financials — 16.9% | | | | | | | | |
| Bank of New York Mellon Corporation (The) | | | 6,000 | | | | 231,120 | |
| JPMorgan Chase & Company | | | 5,500 | | | | 574,749 | |
| KeyCorp | | | 30,200 | | | | 483,804 | |
| Lincoln National Corporation | | | 8,500 | | | | 373,235 | |
| M&T Bank Corporation | | | 2,950 | | | | 520,144 | |
| MetLife, Inc. | | | 9,000 | | | | 547,020 | |
| Prudential Financial, Inc. | | | 6,000 | | | | 514,680 | |
| Truist Financial Corporation | | | 11,000 | | | | 478,940 | |
| U.S. Bancorp | | | 14,200 | | | | 572,544 | |
| Wells Fargo & Company | | | 13,500 | | | | 542,970 | |
| | | | | | | | 4,839,206 | |
| Health Care — 14.0% | | | | | | | | |
| Bristol-Myers Squibb Company | | | 7,800 | | | | 554,502 | |
| CVS Health Corporation (a) | | | 9,000 | | | | 858,330 | |
| CANTOR FBP |
| EQUITY & DIVIDEND PLUS FUND |
| SCHEDULE OF INVESTMENTS (Continued) |
| COMMON STOCKS — 90.8% (Continued) | | Shares | | | Value | |
| Health Care — 14.0% (Continued) | | | | | | | | |
| Johnson & Johnson (a) | | | 4,100 | | | $ | 669,776 | |
| Medtronic plc | | | 6,000 | | | | 484,500 | |
| Merck & Company, Inc. (a) | | | 9,400 | | | | 809,528 | |
| Organon & Company | | | 10,500 | | | | 245,700 | |
| Pfizer, Inc. | | | 9,000 | | | | 393,840 | |
| | | | | | | | 4,016,176 | |
| Industrials — 6.9% | | | | | | | | |
| Emerson Electric Company | | | 7,500 | | | | 549,150 | |
| Lockheed Martin Corporation | | | 800 | | | | 309,032 | |
| Raytheon Technologies Corporation | | | 9,200 | | | | 753,112 | |
| Stanley Black & Decker, Inc. | | | 5,000 | | | | 376,050 | |
| | | | | | | | 1,987,344 | |
| Materials — 3.0% | | | | | | | | |
| Dow, Inc. | | | 10,850 | | | | 476,641 | |
| Nucor Corporation (a) | | | 3,500 | | | | 374,465 | |
| | | | | | | | 851,106 | |
| Real Estate — 2.8% | | | | | | | | |
| Simon Property Group, Inc. | | | 5,750 | | | | 516,063 | |
| Ventas, Inc. | | | 6,900 | | | | 277,173 | |
| | | | | | | | 793,236 | |
| Technology — 13.1% | | | | | | | | |
| Broadcom, Inc. | | | 1,800 | | | | 799,218 | |
| Cisco Systems, Inc. | | | 14,500 | | | | 580,000 | |
| Fidelity National Information Services, Inc. | | | 7,000 | | | | 528,990 | |
| HP, Inc. (a) | | | 20,500 | | | | 510,860 | |
| Intel Corporation | | | 13,000 | | | | 335,010 | |
| International Business Machines Corporation | | | 6,250 | | | | 742,563 | |
| Skyworks Solutions, Inc. | | | 3,200 | | | | 272,864 | |
| | | | | | | | 3,769,505 | |
| Utilities — 5.1% | | | | | | | | |
| Atmos Energy Corporation (a) | | | 4,500 | | | | 458,325 | |
| Duke Energy Corporation | | | 2,300 | | | | 213,946 | |
| National Fuel Gas Company | | | 6,000 | | | | 369,300 | |
| PPL Corporation | | | 16,800 | | | | 425,880 | |
| | | | | | | | 1,467,451 | |
| | | | | | | | | |
| Total Common Stocks (Cost $23,219,104) | | | | | | $ | 26,058,003 | |
| CANTOR FBP |
| EQUITY & DIVIDEND PLUS FUND |
| SCHEDULE OF INVESTMENTS (Continued) |
| MONEY MARKET FUNDS — 8.4% | | Shares | | | Value | |
| Fidelity Institutional Money Market Government Portfolio - Class I, 2.73% (b) (Cost $2,417,713) | | | 2,417,713 | | | $ | 2,417,713 | |
| | | | | | | | | |
| Total Investments at Value — 99.2% | | | | | | | | |
| (Cost $25,636,817) | | | | | | $ | 28,475,716 | |
| | | | | | | | | |
| Other Assets in Excess of Liabilities — 0.8% | | | | | | | 225,119 | |
| | | | | | | | | |
| Net Assets — 100.0% | | | | | | $ | 28,700,835 | |
ADR - American Depositary Receipt.
| (a) | Security covers a written call option. |
| (b) | The rate shown is the 7-day effective yield as of September 30, 2022. |
See accompanying notes to financial statements.
| CANTOR FBP |
| EQUITY & DIVIDEND PLUS FUND |
| SCHEDULE OF OPEN OPTION CONTRACTS |
| September 30, 2022 (Unaudited) |
| COVERED WRITTEN | | | | | Notional | | | Strike | | | Expiration | | | Value of | |
| CALL OPTIONS | | Contracts | | | Value | | | Price | | | Date | | | Options | |
| Atmos Energy Corporation | | | 25 | | | $ | 254,625 | | | $ | 120.00 | | | | 10/24/22 | | | $ | 1,375 | |
| ConocoPhillips | | | 15 | | | | 153,510 | | | | 125.00 | | | | 02/18/23 | | | | 6,750 | |
| CVS Health Corporation | | | 30 | | | | 286,110 | | | | 105.00 | | | | 01/23/23 | | | | 8,340 | |
| Exxon Mobil Corporation | | | 15 | | | | 130,965 | | | | 100.00 | | | | 11/21/22 | | | | 1,575 | |
| Genuine Parts Company | | | 28 | | | | 418,096 | | | | 150.00 | | | | 12/19/22 | | | | 24,640 | |
| HP, Inc. | | | 100 | | | | 249,200 | | | | 45.00 | | | | 11/21/22 | | | | 300 | |
| J.M. Smucker Company (The) | | | 27 | | | | 371,007 | | | | 155.00 | | | | 01/23/23 | | | | 6,075 | |
| Johnson & Johnson | | | 20 | | | | 326,720 | | | | 190.00 | | | | 11/21/22 | | | | 300 | |
| Kellogg Company | | | 40 | | | | 278,640 | | | | 80.00 | | | | 12/19/22 | | | | 1,480 | |
| Kellogg Company | | | 30 | | | | 208,980 | | | | 77.50 | | | | 01/23/23 | | | | 3,360 | |
| Merck & Company, Inc. | | | 50 | | | | 430,600 | | | | 95.00 | | | | 10/24/22 | | | | 400 | |
| Nucor Corporation | | | 35 | | | | 374,465 | | | | 145.00 | | | | 01/23/23 | | | | 6,650 | |
| Philip Morris International, Inc. | | | 15 | | | | 124,515 | | | | 105.00 | | | | 01/23/23 | | | | 675 | |
| Tapestry, Inc. | | | 150 | | | | 426,450 | | | | 37.50 | | | | 11/21/22 | | | | 3,300 | |
| Total Covered Written Call Options | | | | | | | | | | | | | | | | | | | | |
| (Premiums received $180,316) | | | | | | $ | 4,033,883 | | | | | | | | | | | $ | 65,220 | |
See accompanying notes to financial statements.
| CANTOR FBP |
| APPRECIATION & INCOME OPPORTUNITIES FUND |
| SCHEDULE OF INVESTMENTS |
| September 30, 2022 (Unaudited) |
| COMMON STOCKS — 71.8% | | Shares | | | Value | |
| Communications — 1.8% | | | | | | |
| Comcast Corporation - Class A | | | 10,000 | | | $ | 293,300 | |
| Paramount Global - Class B | | | 13,000 | | | | 247,520 | |
| | | | | | | | 540,820 | |
| Consumer Discretionary — 4.7% | | | | | | | | |
| Carnival Corporation (a) | | | 5,000 | | | | 35,150 | |
| Ford Motor Company | | | 23,000 | | | | 257,600 | |
| Home Depot, Inc. (The) | | | 1,000 | | | | 275,940 | |
| Kohl’s Corporation | | | 5,000 | | | | 125,750 | |
| Tapestry, Inc. | | | 17,000 | | | | 483,310 | |
| TJX Companies, Inc. (The) | | | 3,500 | | | | 217,420 | |
| | | | | | | | 1,395,170 | |
| Consumer Staples — 6.9% | | | | | | | | |
| Archer-Daniels-Midland Company | | | 4,500 | | | | 362,025 | |
| Dollar Tree, Inc. (a)(b) | | | 2,700 | | | | 367,470 | |
| Kellogg Company | | | 7,000 | | | | 487,620 | |
| Philip Morris International, Inc. | | | 3,000 | | | | 249,030 | |
| Target Corporation | | | 1,500 | | | | 222,585 | |
| Walmart, Inc. | | | 2,800 | | | | 363,160 | |
| | | | | | | | 2,051,890 | |
| Energy — 7.3% | | | | | | | | |
| Chevron Corporation | | | 3,600 | | | | 517,212 | |
| ConocoPhillips | | | 5,000 | | | | 511,700 | |
| Devon Energy Corporation | | | 9,000 | | | | 541,170 | |
| Shell plc - ADR | | | 12,000 | | | | 597,120 | |
| | | | | | | | 2,167,202 | |
| Financials — 15.0% | | | | | | | | |
| Bank of America Corporation | | | 27,000 | | | | 815,400 | |
| Bank of New York Mellon Corporation (The) | | | 6,000 | | | | 231,120 | |
| Capital One Financial Corporation | | | 4,700 | | | | 433,199 | |
| JPMorgan Chase & Company | | | 8,100 | | | | 846,450 | |
| KeyCorp | | | 16,320 | | | | 261,446 | |
| Lincoln National Corporation | | | 8,000 | | | | 351,280 | |
| MetLife, Inc. | | | 9,000 | | | | 547,020 | |
| Travelers Companies, Inc. (The) | | | 3,300 | | | | 505,560 | |
| Wells Fargo & Company | | | 11,000 | | | | 442,420 | |
| | | | | | | | 4,433,895 | |
| Health Care — 9.9% | | | | | | | | |
| Bristol-Myers Squibb Company | | | 6,300 | | | | 447,867 | |
| CVS Health Corporation | | | 6,000 | | | | 572,220 | |
| Johnson & Johnson | | | 3,200 | | | | 522,752 | |
| Merck & Company, Inc. | | | 6,300 | | | | 542,556 | |
| CANTOR FBP |
| APPRECIATION & INCOME OPPORTUNITIES FUND |
| SCHEDULE OF INVESTMENTS (Continued) |
| COMMON STOCKS — 71.8% (Continued) | | Shares | | | Value | |
| Health Care — 9.9% (Continued) | | | | | | | | |
| Organon & Company | | | 13,800 | | | $ | 322,920 | |
| Pfizer, Inc. | | | 12,000 | | | | 525,120 | |
| | | | | | | | 2,933,435 | |
| Industrials — 6.6% | | | | | | | | |
| BWX Technologies, Inc. | | | 5,000 | | | | 251,850 | |
| Eaton Corporation plc | | | 4,000 | | | | 533,440 | |
| FedEx Corporation | | | 2,200 | | | | 326,634 | |
| Quanta Services, Inc. | | | 2,000 | | | | 254,780 | |
| Raytheon Technologies Corporation | | | 3,600 | | | | 294,696 | |
| Trane Technologies plc | | | 2,100 | | | | 304,101 | |
| | | | | | | | 1,965,501 | |
| Materials — 2.6% | | | | | | | | |
| Compass Minerals International, Inc. | | | 5,000 | | | | 192,650 | |
| Freeport-McMoRan, Inc. | | | 5,000 | | | | 136,650 | |
| Nucor Corporation | | | 4,100 | | | | 438,659 | |
| | | | | | | | 767,959 | |
| Real Estate — 1.4% | | | | | | | | |
| Simon Property Group, Inc. | | | 4,500 | | | | 403,875 | |
| | | | | | | | | |
| Technology — 13.4% | | | | | | | | |
| Apple, Inc. | | | 6,000 | | | | 829,200 | |
| Broadcom, Inc. | | | 1,600 | | | | 710,416 | |
| Cisco Systems, Inc. | | | 11,000 | | | | 440,000 | |
| HP, Inc. (b) | | | 21,000 | | | | 523,320 | |
| Intel Corporation | | | 10,500 | | | | 270,585 | |
| International Business Machines Corporation | | | 4,200 | | | | 499,002 | |
| Microsoft Corporation | | | 3,000 | | | | 698,700 | |
| | | | | | | | 3,971,223 | |
| Utilities — 2.2% | | | | | | | | |
| Atmos Energy Corporation | | | 4,000 | | | | 407,400 | |
| PPL Corporation | | | 9,000 | | | | 228,150 | |
| | | | | | | | 635,550 | |
| | | | | | | | | |
| Total Common Stocks (Cost $12,670,494) | | | | | | $ | 21,266,520 | |
| CANTOR FBP |
| APPRECIATION & INCOME OPPORTUNITIES FUND |
| SCHEDULE OF INVESTMENTS (Continued) |
| CORPORATE BONDS — 11.2% | | Par Value | | | Value | |
| Consumer Staples — 1.6% | | | | | | | | |
| Kroger Company, 3.70%, due 08/01/2027 | | $ | 500,000 | | | $ | 471,123 | |
| | | | | | | | | |
| Financials — 3.2% | | | | | | | | |
| American Express Company, 3.40%, due 02/27/2023 | | | 500,000 | | | | 497,885 | |
| PNC Financial Services Group, Inc., 3.45%, due 04/23/2029 | | | 500,000 | | | | 447,379 | |
| | | | | | | | 945,264 | |
| Health Care — 1.6% | | | | | | | | |
| Elevance Health, Inc., 4.10%, due 03/01/2028 | | | 500,000 | | | | 472,823 | |
| | | | | | | | | |
| Industrials — 3.3% | | | | | | | | |
| Hubbell, Inc., 3.35%, due 03/01/2026 | | | 500,000 | | | | 475,410 | |
| Norfolk Southern Corporation, 3.85%, due 01/15/2024 | | | 500,000 | | | | 494,613 | |
| | | | | | | | 970,023 | |
| Utilities — 1.5% | | | | | | | | |
| American Water Capital Corp., 3.75%, due 09/01/2028 | | | 500,000 | | | | 462,330 | |
| | | | | | | | | |
| Total Corporate Bonds (Cost $3,382,584) | | | | | | $ | 3,321,563 | |
| | | | | | | | | |
| U.S. TREASURY OBLIGATIONS — 1.7% | | Par Value | | | Value | |
| U.S. Treasury Notes — 1.7% | | | | | | | | |
| 4.25%, due 09/30/2024 (Cost $500,781) | | $ | 500,000 | | | $ | 500,391 | |
| CANTOR FBP |
| APPRECIATION & INCOME OPPORTUNITIES FUND |
| SCHEDULE OF INVESTMENTS (Continued) |
| MONEY MARKET FUNDS — 18.4% | | Shares | | | Value | |
| Fidelity Institutional Money Market Government Portfolio - Class I, 2.73% (c) | | | 2,732,856 | | | $ | 2,732,856 | |
| First American Government Obligations Fund - Class Z, 2.73% (c) | | | 2,710,419 | | | | 2,710,419 | |
| Total Money Market Funds (Cost $5,443,275) | | | | | | $ | 5,443,275 | |
| | | | | | | | | |
| Total Investments at Value — 103.1% | | | | | | | | |
| (Cost $21,997,134) | | | | | | $ | 30,531,749 | |
| | | | | | | | | |
| Liabilities in Excess of Other Assets — (3.1%) | | | | | | | (920,028 | ) |
| | | | | | | | | |
| Net Assets — 100.0% | | | | | | $ | 29,611,721 | |
ADR - American Depositary Receipt.
| (a) | Non-income producing security. |
| (b) | Security covers a written call option. |
| (c) | The rate shown is the 7-day effective yield as of September 30, 2022. |
See accompanying notes to financial statements.
| CANTOR FBP |
| APPRECIATION & INCOME OPPORTUNITIES FUND |
| SCHEDULE OF OPEN OPTION CONTRACTS |
| September 30, 2022 (Unaudited) |
| COVERED WRITTEN | | | | | Notional | | | Strike | | | Expiration | | | Value of | |
| CALL OPTIONS | | Contracts | | | Value | | | Price | | | Date | | | Options | |
| Dollar Tree, Inc. | | | 27 | | | $ | 367,470 | | | $ | 185.00 | | | | 11/21/22 | | | $ | 621 | |
| HP, Inc. | | | 70 | | | | 174,440 | | | | 45.00 | | | | 11/21/22 | | | | 210 | |
| Total Covered Written Call Options | | | | | | | | | | | | | | | | | | | | |
| (Premiums received $34,260) | | | | | | $ | 541,910 | | | | | | | | | | | $ | 831 | |
See accompanying notes to financial statements.
| THE CANTOR FBP MUTUAL FUNDS |
| STATEMENTS OF ASSETS AND LIABILITIES |
| September 30, 2022 (Unaudited) |
| | | | | | Cantor FBP | |
| | | Cantor FBP | | | Appreciation | |
| | | Equity & | | | & Income | |
| | | Dividend | | | Opportunities | |
| | | Plus Fund | | | Fund | |
| ASSETS | | | | | | | | |
| Investments in securities: | | | | | | | | |
| At cost | | $ | 25,636,817 | | | $ | 21,997,134 | |
| At value (Note 2) | | $ | 28,475,716 | | | $ | 30,531,749 | |
| Receivable for investment securities sold | | | 522,433 | | | | 266,208 | |
| Receivable for capital shares sold | | | 3,490 | | | | — | |
| Dividends and interest receivable | | | 68,315 | | | | 62,274 | |
| Other assets | | | 15,026 | | | | 13,011 | |
| TOTAL ASSETS | | | 29,084,980 | | | | 30,873,242 | |
| | | | | | | | | |
| LIABILITIES | | | | | | | | |
| Written call options, at value (Notes 2 and 5) (premiums received $180,316 and $34,260, respectively) | | | 65,220 | | | | 831 | |
| Distributions payable | | | 4,712 | | | | 15,062 | |
| Payable for capital shares redeemed | | | 16,158 | | | | 19,250 | |
| Payable investment securities purchased | | | 276,492 | | | | 1,203,076 | |
| Accrued investment advisory fees (Note 4) | | | 12,075 | | | | 13,664 | |
| Payable to administrator (Note 4) | | | 5,580 | | | | 5,580 | |
| Other accrued expenses | | | 3,908 | | | | 4,058 | |
| TOTAL LIABILITIES | | | 384,145 | | | | 1,261,521 | |
| | | | | | | | | |
| NET ASSETS | | $ | 28,700,835 | | | $ | 29,611,721 | |
| | | | | | | | | |
| NET ASSETS CONSIST OF: | | | | | | | | |
| Paid-in capital | | $ | 25,234,999 | | | $ | 21,161,848 | |
| Accumulated earnings | | | 3,465,836 | | | | 8,449,873 | |
| Net assets | | $ | 28,700,835 | | | $ | 29,611,721 | |
| | | | | | | | | |
| Shares of beneficial interest outstanding (unlimited number of shares authorized, $0.01 par value) | | | 1,184,361 | | | | 1,621,577 | |
| | | | | | | | | |
| Net asset value, offering price and redemption price per share (Note 2) | | $ | 24.23 | | | $ | 18.26 | |
See accompanying notes to financial statements.
| THE CANTOR FBP MUTUAL FUNDS |
| STATEMENTS OF OPERATIONS |
| For the Six Months Ended September 30, 2022 (Unaudited) |
| | | | | | Cantor FBP | |
| | | Cantor FBP | | | Appreciation | |
| | | Equity & | | | & Income | |
| | | Dividend | | | Opportunities | |
| | | Plus Fund | | | Fund | |
| INVESTMENT INCOME | | | | | | | | |
| Dividends | | $ | 518,919 | | | $ | 385,169 | |
| Interest | | | — | | | | 28,453 | |
| TOTAL INVESTMENT INCOME | | | 518,919 | | | | 413,622 | |
| | | | | | | | | |
| EXPENSES | | | | | | | | |
| Investment advisory fees (Note 4) | | | 111,122 | | | | 115,081 | |
| Administration fees (Note 4) | | | 30,000 | | | | 30,000 | |
| Trustees’ fees and expenses (Note 4) | | | 9,233 | | | | 9,233 | |
| Legal fees | | | 8,840 | | | | 8,840 | |
| Registration and filing fees | | | 9,068 | | | | 8,524 | |
| Audit and tax services fees | | | 8,500 | | | | 8,500 | |
| Shareholder reporting expenses | | | 5,688 | | | | 2,676 | |
| Shareholder servicing fees (Note 4) | | | 6,713 | | | | 1,572 | |
| Custodian and bank service fees | | | 3,587 | | | | 3,587 | |
| Compliance service fees (Note 4) | | | 3,500 | | | | 3,500 | |
| Postage and supplies | | | 2,723 | | | | 1,986 | |
| Insurance expense | | | 540 | | | | 622 | |
| Other expenses | | | 1,966 | | | | 2,240 | |
| TOTAL EXPENSES | | | 201,480 | | | | 196,361 | |
| Fees reduced by the Adviser (Note 4) | | | (23,685 | ) | | | (23,740 | ) |
| NET EXPENSES | | | 177,795 | | | | 172,621 | |
| | | | | | | | | |
| NET INVESTMENT INCOME | | | 341,124 | | | | 241,001 | |
| | | | | | | | | |
| REALIZED AND UNREALIZED GAINS (LOSSES) ON INVESTMENTS AND WRITTEN OPTION CONTRACTS | | | | | | | | |
| Net realized gains (losses) from: | | | | | | | | |
| Investment transactions | | | 200,816 | | | | (148,021 | ) |
| Written option contracts (Note 5) | | | 308,767 | | | | 70,646 | |
| Net change in unrealized appreciation (depreciation) on: | | | | | | | | |
| Investment transactions | | | (6,279,970 | ) | | | (5,357,878 | ) |
| Written option contracts (Note 5) | | | 61,249 | | | | (13,372 | ) |
| NET REALIZED AND UNREALIZED LOSSES ON INVESTMENTS AND WRITTEN OPTION CONTRACTS | | | (5,709,138 | ) | | | (5,448,625 | ) |
| | | | | | | | | |
| NET DECREASE IN NET ASSETS FROM OPERATIONS | | $ | (5,368,014 | ) | | $ | (5,207,624 | ) |
See accompanying notes to financial statements.
| CANTOR FBP |
| EQUITY & DIVIDEND PLUS FUND |
| STATEMENTS OF CHANGES IN NET ASSETS |
| | | Six Months | | | | |
| | | Ended | | | Year Ended | |
| | | Sept. 30, 2022 | | | March 31, | |
| | | (Unaudited) | | | 2022 | |
| FROM OPERATIONS | | | | | | | | |
| Net investment income | | $ | 341,124 | | | $ | 599,689 | |
| Net realized gains from: | | | | | | | | |
| Investment transactions | | | 200,816 | | | | 2,328,708 | |
| Written option contracts (Note 5) | | | 308,767 | | | | 147,353 | |
| Net change in unrealized appreciation (depreciation) on: | | | | | | | | |
| Investment transactions | | | (6,279,970 | ) | | | 1,694,953 | |
| Written option contracts (Note 5) | | | 61,249 | | | | 20,934 | |
| Net increase (decrease) in net assets resulting from operations | | | (5,368,014 | ) | | | 4,791,637 | |
| | | | | | | | | |
| DISTRIBUTIONS TO SHAREHOLDERS (Note 2) | | | (1,570,840 | ) | | | (2,481,311 | ) |
| | | | | | | | | |
| FROM CAPITAL SHARE TRANSACTIONS | | | | | | | | |
| Proceeds from shares sold | | | 3,386,814 | | | | 2,275,948 | |
| Net asset value of shares issued in reinvestment of distributions to shareholders | | | 1,541,157 | | | | 2,433,606 | |
| Payments for shares redeemed | | | (1,903,761 | ) | | | (2,921,872 | ) |
| Net increase in net assets from capital share transactions | | | 3,024,210 | | | | 1,787,682 | |
| | | | | | | | | |
| TOTAL INCREASE (DECREASE) IN NET ASSETS | | | (3,914,644 | ) | | | 4,098,008 | |
| | | | | | | | | |
| NET ASSETS | | | | | | | | |
| Beginning of period | | | 32,615,479 | | | | 28,517,471 | |
| End of period | | $ | 28,700,835 | | | $ | 32,615,479 | |
| | | | | | | | | |
| CAPITAL SHARE ACTIVITY | | | | | | | | |
| Shares sold | | | 119,435 | | | | 76,044 | |
| Shares reinvested | | | 58,680 | | | | 86,021 | |
| Shares redeemed | | | (67,435 | ) | | | (100,027 | ) |
| Net increase in shares outstanding | | | 110,680 | | | | 62,038 | |
| Shares outstanding, beginning of period | | | 1,073,681 | | | | 1,011,643 | |
| Shares outstanding, end of period | | | 1,184,361 | | | | 1,073,681 | |
See accompanying notes to financial statements.
| CANTOR FBP |
| APPRECIATION & INCOME OPPORTUNITIES FUND |
| STATEMENTS OF CHANGES IN NET ASSETS |
| | | Six Months | | | | |
| | | Ended | | | Year Ended | |
| | | Sept. 30, 2022 | | | March 31, | |
| | | (Unaudited) | | | 2022 | |
| FROM OPERATIONS | | | | | | | | |
| Net investment income | | $ | 241,001 | | | $ | 419,149 | |
| Net realized gains (losses) from: | | | | | | | | |
| Investment transactions | | | (148,021 | ) | | | 3,590,346 | |
| Written option contracts (Note 5) | | | 70,646 | | | | 981 | |
| Net change in unrealized appreciation (depreciation) on: | | | | | | | | |
| Investment transactions | | | (5,357,878 | ) | | | 948,659 | |
| Written option contracts (Note 5) | | | (13,372 | ) | | | 91,882 | |
| Net increase (decrease) in net assets resulting from operations | | | (5,207,624 | ) | | | 5,051,017 | |
| | | | | | | | | |
| DISTRIBUTIONS TO SHAREHOLDERS (Note 2) | | | (3,065,275 | ) | | | (1,655,507 | ) |
| | | | | | | | | |
| FROM CAPITAL SHARE TRANSACTIONS | | | | | | | | |
| Proceeds from shares sold | | | 560,112 | | | | 995,004 | |
| Net asset value of shares issued in reinvestment of distributions to shareholders | | | 3,035,340 | | | | 1,615,223 | |
| Payments for shares redeemed | | | (1,003,853 | ) | | | (6,280,307 | ) |
| Net increase (decrease) in net assets from capital share transactions | | | 2,591,599 | | | | (3,670,080 | ) |
| | | | | | | | | |
| TOTAL DECREASE IN NET ASSETS | | | (5,681,300 | ) | | | (274,570 | ) |
| | | | | | | | | |
| NET ASSETS | | | | | | | | |
| Beginning of period | | | 35,293,021 | | | | 35,567,591 | |
| End of period | | $ | 29,611,721 | | | $ | 35,293,021 | |
| | | | | | | | | |
| CAPITAL SHARE ACTIVITY | | | | | | | | |
| Shares sold | | | 28,722 | | | | 43,385 | |
| Shares reinvested | | | 157,170 | | | | 71,739 | |
| Shares redeemed | | | (47,549 | ) | | | (273,230 | ) |
| Net increase (decrease) in shares outstanding | | | 138,343 | | | | (158,106 | ) |
| Shares outstanding, beginning of period | | | 1,483,234 | | | | 1,641,340 | |
| Shares outstanding, end of period | | | 1,621,577 | | | | 1,483,234 | |
See accompanying notes to financial statements.
| CANTOR FBP |
| EQUITY & DIVIDEND PLUS FUND |
| FINANCIAL HIGHLIGHTS |
Selected Per Share Data for a Share Outstanding Throughout Each Period:
| | | Six Months | | | | |
| | | Ended | | | | |
| | | Sept. 30, | | | Years Ended March 31, | |
| | | 2022 | | | | | | | | | | | | | | | | |
| | | (Unaudited) | | | 2022 | | | 2021 | | | 2020 | | | 2019 | | | 2018 | |
| Net asset value at beginning of period | | $ | 30.38 | | | $ | 28.19 | | | $ | 18.28 | | | $ | 25.19 | | | $ | 25.68 | | | $ | 25.96 | |
| | | | | | | | | | | | | | | | | | | | | | | | | |
| Income (loss) from investment operations: | | | | | | | | | | | | | | | | | | | | | | | | |
| Net investment income | | | 0.30 | | | | 0.58 | | | | 0.59 | | | | 0.67 | | | | 0.60 | | | | 0.57 | |
| Net realized and unrealized gains (losses) on investments and written option contracts | | | (5.05 | ) | | | 4.03 | | | | 9.90 | | | | (5.90 | ) | | | 0.83 | | | | 1.38 | |
| Total from investment operations | | | (4.75 | ) | | | 4.61 | | | | 10.49 | | | | (5.23 | ) | | | 1.43 | | | | 1.95 | |
| | | | | | | | | | | | | | | | | | | | | | | | | |
| Less distributions from: | | | | | | | | | | | | | | | | | | | | | | | | |
| Net investment income | | | (0.29 | ) | | | (0.59 | ) | | | (0.58 | ) | | | (0.67 | ) | | | (0.60 | ) | | | (0.57 | ) |
| Net realized gains | | | (1.11 | ) | | | (1.83 | ) | | | — | | | | (1.01 | ) | | | (1.32 | ) | | | (1.66 | ) |
| Total distributions | | | (1.40 | ) | | | (2.42 | ) | | | (0.58 | ) | | | (1.68 | ) | | | (1.92 | ) | | | (2.23 | ) |
| | | | | | | | | | | | | | | | | | | | | | | | | |
| Net asset value at end of period | | $ | 24.23 | | | $ | 30.38 | | | $ | 28.19 | | | $ | 18.28 | | | $ | 25.19 | | | $ | 25.68 | |
| | | | | | | | | | | | | | | | | | | | | | | | | |
| Total return (a) | | | (15.97 | %) (b) | | | 17.23 | % | | | 58.15 | % | | | (22.33 | %) | | | 5.64 | % | | | 7.91 | % |
| | | | | | | | | | | | | | | | | | | | | | | | | |
| Net assets at end of period (000’s) | | $ | 28,701 | | | $ | 32,615 | | | $ | 28,517 | | | $ | 20,919 | | | $ | 28,615 | | | $ | 26,279 | |
| | | | | | | | | | | | | | | | | | | | | | | | | |
| Ratio of total expenses to average net assets | | | 1.27 | % (c) | | | 1.23 | % | | | 1.32 | % | | | 1.25 | % | | | 1.23 | % | | | 1.24 | % |
| | | | | | | | | | | | | | | | | | | | | | | | | |
| Ratio of net expenses to average net assets (d) | | | 1.12 | % (c) | | | 1.12 | % | | | 1.10 | % | | | 1.07 | % | | | 1.07 | % | | | 1.07 | % |
| | | | | | | | | | | | | | | | | | | | | | | | | |
| Ratio of net investment income to average net assets (d) | | | 2.15 | % (c) | | | 1.97 | % | | | 2.53 | % | | | 2.70 | % | | | 2.35 | % | | | 2.19 | % |
| | | | | | | | | | | | | | | | | | | | | | | | | |
| Portfolio turnover rate | | | 7 | % (b) | | | 16 | % | | | 21 | % | | | 38 | % | | | 18 | % | | | 18 | % |
| (a) | Total return is a measure of the change in value of an investment in the Fund over the periods covered, which assumes any dividends or capital gains distributions are reinvested in shares of the Fund. The returns shown do not reflect the deduction of taxes a shareholder would pay on Fund distributions or the redemption of Fund shares. The total returns would have been lower if the Adviser had not waived/reduced advisory fees. |
| (d) | Ratios were determined after advisory fee waivers/reductions by the Adviser. (Note 4). |
See accompanying notes to financial statements.
| CANTOR FBP |
| APPRECIATION & INCOME OPPORTUNITIES FUND |
| FINANCIAL HIGHLIGHTS |
Selected Per Share Data for a Share Outstanding Throughout Each Period:
| | | Six Months | | | | |
| | | Ended | | | | |
| | | Sept. 30, | | | Years Ended March 31, | |
| | | 2022 | | | | | | | | | | | | | | | | |
| | | (Unaudited) | | | 2022 | | | 2021 | | | 2020 | | | 2019 | | | 2018 | |
| | | | | | | | | | | | | | | | | | | | | | | | | |
| Net asset value at beginning of period | | $ | 23.79 | | | $ | 21.67 | | | $ | 14.43 | | | $ | 18.91 | | | $ | 18.99 | | | $ | 18.81 | |
| | | | | | | | | | | | | | | | | | | | | | | | | |
| | | | | | | | | | | | | | | | | | | | | | | | | |
| Income (loss) from investment operations: | | | | | | | | | | | | | | | | | | | | | | | | |
| Net investment income | | | 0.16 | | | | 0.27 | | | | 0.29 | | | | 0.38 | | | | 0.37 | | | | 0.41 | |
| Net realized and unrealized gains (losses) on investments and written option contracts | | | (3.61 | ) | | | 2.94 | | | | 7.24 | | | | (3.65 | ) | | | 0.28 | | | | 1.03 | |
| Total from investment operations | | | (3.45 | ) | | | 3.21 | | | | 7.53 | | | | (3.27 | ) | | | 0.65 | | | | 1.44 | |
| | | | | | | | | | | | | | | | | | | | | | | | | |
| Less distributions from: | | | | | | | | | | | | | | | | | | | | | | | | |
| Net investment income | | | (0.17 | ) | | | (0.29 | ) | | | (0.29 | ) | | | (0.38 | ) | | | (0.37 | ) | | | (0.41 | ) |
| Net realized gains | | | (1.91 | ) | | | (0.80 | ) | | | — | | | | (0.83 | ) | | | (0.36 | ) | | | (0.85 | ) |
| Total distributions | | | (2.08 | ) | | | (1.09 | ) | | | (0.29 | ) | | | (1.21 | ) | | | (0.73 | ) | | | (1.26 | ) |
| | | | | | | | | | | | | | | | | | | | | | | | | |
| Net asset value at end of period | | $ | 18.26 | | | $ | 23.79 | | | $ | 21.67 | | | $ | 14.43 | | | $ | 18.91 | | | $ | 18.99 | |
| | | | | | | | | | | | | | | | | | | | | | | | | |
| Total return (a) | | | (14.91 | %) (b) | | | 15.16 | % | | | 52.63 | % | | | (18.56 | %) | | | 3.44 | % | | | 7.91 | % |
| | | | | | | | | | | | | | | | | | | | | | | | | |
| Net assets at end of period (000’s) | | $ | 29,612 | | | $ | 35,293 | | | $ | 35,568 | | | $ | 25,287 | | | $ | 33,376 | | | $ | 34,614 | |
| | | | | | | | | | | | | | | | | | | | | | | | | |
| Ratio of total expenses to average net assets | | | 1.20 | % (c) | | | 1.14 | % | | | 1.20 | % | | | 1.16 | % | | | 1.12 | % | | | 1.10 | % |
| | | | | | | | | | | | | | | | | | | | | | | | | |
| Ratio of net expenses to average net assets (d) | | | 1.05 | % (c) | | | 1.05 | % | | | 1.03 | % | | | 1.00 | % | | | 1.00 | % | | | 1.00 | % |
| | | | | | | | | | | | | | | | | | | | | | | | | |
| Ratio of net investment income to average net assets (d) | | | 1.47 | % (c) | | | 1.17 | % | | | 1.61 | % | | | 2.03 | % | | | 1.89 | % | | | 2.16 | % |
| | | | | | | | | | | | | | | | | | | | | | | | | |
| Portfolio turnover rate | | | 8 | %(b) | | | 10 | % | | | 11 | % | | | 18 | % | | | 21 | % | | | 10 | % |
| (a) | Total return is a measure of the change in value of an investment in the Fund over the periods covered, which assumes any dividends or capital gains distributions are reinvested in shares of the Fund. The returns shown do not reflect the deduction of taxes a shareholder would pay on Fund distributions or the redemption of Fund shares. The total returns would have been lower if the Adviser had not waived/reduced advisory fees. |
| (d) | Ratios were determined after advisory fee waivers/reductions by the Adviser. (Note 4). |
See accompanying notes to financial statements.
| THE CANTOR FBP MUTUAL FUNDS |
| NOTES TO FINANCIAL STATEMENTS |
| September 30, 2022 (Unaudited) |
1. Organization
Cantor FBP Equity & Dividend Plus Fund and Cantor FBP Appreciation & Income Opportunities Fund (each a “Fund” and collectively the “Funds”) are no-load, diversified series of Williamsburg Investment Trust (the “Trust”), an open-end management investment company registered under the Investment Company Act of 1940, as amended (the “1940 Act”). The Trust was organized as a Massachusetts business trust on July 18, 1988. Other series of the Trust are not included in this report.
The investment objective of Cantor FBP Equity & Dividend Plus Fund is to provide above-average and growing income while also achieving long-term growth of capital.
The investment objectives of Cantor FBP Appreciation & Income Opportunities Fund are long term capital appreciation and current income, assuming a moderate level of investment risk.
2. Significant Accounting Policies
Each Fund follows accounting and reporting guidance under Financial Accounting Standards Board (“FASB”) Accounting Standards Codification Topic 946, “Financial Services – Investment Companies.” The following is a summary of the Funds’ significant accounting policies. These policies are in conformity with accounting principles generally accepted in the United States of America (“GAAP”).
Regulatory update — In October 2020, the Securities and Exchange Commission (the “SEC”) adopted new regulations governing the use of derivatives by registered investment companies (“Rule 18f-4”). The Funds were required to comply with Rule 18f-4 by August 19, 2022. Rule 18f-4 imposes limits on the amount of derivatives a fund can enter into, eliminates the asset segregation framework currently used by funds to comply with Section 18 of the 1940 Act, treats derivatives as senior securities and requires funds whose use of derivatives is more than a limited specified exposure amount to establish and maintain a comprehensive derivatives risk management program and appoint a derivatives risk manager. The Funds have adopted Rule 18f-4 and are currently adhering to the requirements.
Securities valuation — The Funds’ portfolio securities are valued as of the close of business of the regular session of the New York Stock Exchange (normally 4:00 p.m. Eastern time). Securities traded on a national stock exchange, including common stocks and closed-end investment companies, if any, are valued based upon the closing price on the principal exchange where the security is traded, if available, otherwise, at the last quoted bid price. Securities that are quoted by NASDAQ are valued at the NASDAQ Official Closing Price. Covered call options written by the Funds are valued at the last quoted sale price or, in the absence of a sale, at the ask price on the principal exchanges on which they are traded. Investments representing shares of money market funds and other open-end investment companies are valued at their net asset value (“NAV”) as reported by such companies. When using a quoted price and when the market is considered active, securities will be classified as Level 1 within the fair value hierarchy (see below).
Fixed income securities, including U.S. Treasury obligations and corporate bonds, are typically valued on the basis of prices provided by an independent pricing service. The prices provided by the pricing service are determined with consideration given to institutional bid and last sale prices and take into account securities
| THE CANTOR FBP MUTUAL FUNDS |
| NOTES TO FINANCIAL STATEMENTS (Continued) |
prices, yields, maturities, call features, ratings, institutional trading in similar groups of securities, and developments related to specific securities. Given the inputs used by the pricing service, these securities are classified as Level 2 within the fair value hierarchy.
When market quotations are not readily available, if a pricing service cannot provide a price, or if the investment adviser believes the price received from the pricing service is not indicative of fair value, securities will be valued in good faith at fair value using methods consistent with procedures adopted by the Board of Trustees and will be classified as Level 2 or 3 within the fair value hierarchy, depending on the inputs used. Such methods of fair valuation may include, but are not limited to: multiple of earnings, multiple of book value, discount from market of a similar freely traded security, purchase price of the security, subsequent private transactions in the security or related securities, or a combination of these and other factors.
GAAP establishes a single authoritative definition of fair value, sets out a framework for measuring fair value and requires additional disclosures about fair value measurements. Various inputs are used in determining the value of each Fund’s investments. These inputs are summarized in the three broad levels listed below:
| ● | Level 1 – quoted prices in active markets for identical securities |
| ● | Level 2 – other significant observable inputs |
| ● | Level 3 – significant unobservable inputs |
The inputs or methodology used for valuing securities are not necessarily an indication of the risks associated with investing in those securities. The inputs used to measure fair value may fall into different levels of the fair value hierarchy. In such cases, for disclosure purposes, the level in the fair value hierarchy within which the fair value measurement falls in its entirety is determined based on the lowest level input that is significant to the fair value measurement.
The following is a summary of each Fund’s investments and other financial instruments based on the inputs used to value the investments and other financial instruments as of September 30, 2022, by security type:
| Cantor FBP Equity & Dividend Plus Fund | | Level 1 | | | Level 2 | | | Level 3 | | | Total | |
| Investments in Securities: | | | | | | | | | | | | | | | | |
| Common Stocks | | $ | 26,058,003 | | | $ | — | | | $ | — | | | $ | 26,058,003 | |
| Money Market Funds | | | 2,417,713 | | | | — | | | | — | | | | 2,417,713 | |
| Total | | $ | 28,475,716 | | | $ | — | | | $ | — | | | $ | 28,475,716 | |
| | | | | | | | | | | | | | | | | |
| Other Financial Instruments: | | | | | | | | | | | | | | | | |
| Covered Written Call Options | | $ | (50,720 | ) | | $ | (14,500 | ) | | $ | — | | | $ | (65,220 | ) |
| Total | | $ | (50,720 | ) | | $ | (14,500 | ) | | $ | — | | | $ | (65,220 | ) |
| | | | | | | | | | | | | | | | | |
| THE CANTOR FBP MUTUAL FUNDS |
| NOTES TO FINANCIAL STATEMENTS (Continued) |
| Cantor FBP Appreciation & Income Opportunities Fund | | Level 1 | | | Level 2 | | | Level 3 | | | Total | |
| Investments in Securities: | | | | | | | | | | | | | | | | |
| Common Stocks | | $ | 21,266,520 | | | $ | — | | | $ | — | | | $ | 21,266,520 | |
| Corporate Bonds | | | — | | | | 3,321,563 | | | | — | | | | 3,321,563 | |
| U.S. Treasury Obligations | | | — | | | | 500,391 | | | | — | | | | 500,391 | |
| Money Market Funds | | | 5,443,275 | | | | — | | | | — | | | | 5,443,275 | |
| Total | | $ | 26,709,795 | | | $ | 3,821,954 | | | $ | — | | | $ | 30,531,749 | |
| | | | | | | | | | | | | | | | | |
| Other Financial Instruments: | | | | | | | | | | | | | | | | |
| Covered Written Call Options | | $ | — | | | $ | (831 | ) | | $ | — | | | $ | (831 | ) |
| Total | | $ | — | | | $ | (831 | ) | | $ | — | | | $ | (831 | ) |
| | | | | | | | | | | | | | | | | |
Refer to each Fund’s Schedule of Investments for a listing of the common stocks and corporate bonds by sector type. There were no Level 3 investments held by the Funds as of or during the six months ended September 30, 2022.
Share valuation — The NAV per share of each Fund is calculated daily by dividing the total value of its assets, less liabilities, by the number of shares outstanding. The offering price and redemption price per share of each Fund is equal to its NAV per share.
Investment income — Dividend income is recorded on the ex-dividend date. Non-cash dividends included in dividend income, if any, are recorded at the fair market value of the security received. Interest income is accrued as earned. Discounts and premiums on fixed income securities purchased are amortized using the interest method. Withholding taxes, if any, on foreign dividends have been recorded in accordance with the Funds’ understanding of the applicable country’s rules and tax rates.
Distributions to shareholders — Dividends arising from net investment income are declared and paid quarterly to shareholders of each Fund. Net realized short-term capital gains, if any, may be distributed throughout the year and net realized long-term capital gains, if any, are distributed at least once each year. The amount of distributions from net investment income and net realized capital gains are determined in accordance with federal income tax regulations, which may differ from GAAP. These “book/tax” differences are either temporary or permanent in nature. Dividends and distributions are recorded on the ex-dividend date. The tax character of distributions paid during the periods ended September 30, 2022 and March 31, 2022 was as follows:
| | | Period | | Ordinary | | | Long-Term | | | Total | |
| | | Ended | | Income | | | Capital Gains | | | Distributions | |
| Cantor FBP Equity & Dividend Plus Fund | | 09/30/22 | | $ | 345,646 | | | $ | 1,225,194 | | | $ | 1,570,840 | |
| | | 03/31/22 | | $ | 791,326 | | | $ | 1,689,035 | | | $ | 2,480,361 | |
| Cantor FBP Appreciation & Income Opportunities Fund | | 09/30/22 | | $ | 269,473 | | | $ | 2,795,802 | | | $ | 3,065,275 | |
| | | 03/31/22 | | $ | 440,215 | | | $ | 1,215,260 | | | $ | 1,655,475 | |
| THE CANTOR FBP MUTUAL FUNDS |
| NOTES TO FINANCIAL STATEMENTS (Continued) |
Investment transactions — Investment transactions are accounted for on trade date for financial reporting purposes. Realized gains and losses on investments sold are determined on a specific identification basis.
Common expenses — Common expenses of the Trust are allocated among the Funds and the other series of the Trust based on relative net assets of each series or the nature of the services performed and the relative applicability to each series.
Options transactions — When the Funds’ investment adviser believes that individual portfolio investment securities held by the Funds are approaching the top of the adviser’s growth and price expectations, covered call options can be written (sold) against such securities and the Funds will receive a premium in return. The Funds write options only for income generation and hedging purposes and not for speculation. The premiums received from writing the options are recorded as a liability and are subsequently valued daily at the closing prices on their primary exchanges. Premiums received from writing options that expire are treated as realized gains. Premiums received from writing options that are exercised increase the proceeds used to calculate the realized gain or loss on the sale of the underlying security. If a closing purchase transaction is used to terminate a Fund’s obligation on a call option, a gain or loss will be realized, depending upon whether the price of the closing purchase transaction is more or less than the premium previously received on the call option written.
Estimates — The preparation of financial statements in conformity with GAAP requires management to make estimates and assumptions that affect the reported amounts of assets and liabilities and the disclosure of contingent assets and liabilities, each as of the date of the financial statements, and the reported amounts of increase (decrease) in net assets from operation during the reporting period. Actual results could differ from those estimates.
Federal income tax — Each Fund has qualified and intends to continue to qualify as a regulated investment company under the Internal Revenue Code of 1986, as amended (the “Code”). Qualification generally will relieve the Funds of liability for federal income taxes to the extent 100% of their net investment income and any net realized capital gains are distributed in accordance with the Code.
In order to avoid imposition of the excise tax applicable to regulated investment companies, it is also each Fund’s intention to declare as dividends in each calendar year at least 98% of its net investment income (earned during the calendar year) and 98.2% of its net realized capital gains (earned during the twelve months ended October 31) plus undistributed amounts from prior years.
| THE CANTOR FBP MUTUAL FUNDS |
| NOTES TO FINANCIAL STATEMENTS (Continued) |
The following information is computed on a tax basis for each item as of September 30, 2022:
| | | | | | Cantor FBP | |
| | | | | | Appreciation | |
| | | Cantor FBP Equity | | | & Income | |
| | | & Dividend | | | Opportunities | |
| | | Plus Fund | | | Fund | |
| Tax cost of investments and written option contracts | | $ | 25,456,501 | | | $ | 21,957,915 | |
| Gross unrealized appreciation | | $ | 6,030,687 | | | $ | 9,726,579 | |
| Gross unrealized depreciation | | | (3,076,692 | ) | | | (1,153,576 | ) |
| Net unrealized appreciation | | | 2,953,995 | | | | 8,573,003 | |
| Accumulated ordinary income | | | 7,065 | | | | 14,951 | |
| Other gains (losses) | | | 509,488 | | | | (123,019 | ) |
| Distribution payable | | | (4,712 | ) | | | (15,062 | ) |
| Accumulated earnings | | $ | 3,465,836 | | | $ | 8,449,873 | |
| | | | | | | | | |
The difference between the federal income tax cost of investments and the financial statement cost of investments for Cantor FBP Appreciation & Income Opportunities Fund is due to certain differences in the recognition of capital gains and losses under income tax regulations and GAAP. These “book/tax” differences are temporary in nature and are primarily due to differing methods in the amortization of discounts and premiums on fixed income securities.
The Funds recognize the tax benefits or expenses of uncertain tax positions only when the position is “more likely than not” to be sustained assuming examination by tax authorities. Management has reviewed the tax positions taken by each Fund on federal income tax returns for the current and all open tax years (generally, three years) and has concluded that no provision for unrecognized tax benefits or expenses is required in these financial statements.
3. Investment Transactions
Investment transactions, other than short-term investments and U.S. government securities, were as follows for the six months ended September 30, 2022:
| | | | | | Cantor FBP | |
| | | | | | Appreciation | |
| | | Cantor FBP Equity | | | & Income | |
| | | & Dividend | | | Opportunities | |
| | | Plus Fund | | | Fund | |
| Purchases of investment securities | | $ | 3,079,189 | | | $ | 3,792,334 | |
| Proceeds from sales and maturities of investment securities | | $ | 1,900,997 | | | $ | 1,515,292 | |
| | | | | | | | | |
For the six months ended September 30, 2022, cost of purchases and proceeds from maturities of U.S. government long-term securities for Cantor FBP Appreciation & Income Opportunities Fund were $500,781 and $500,000, respectively.
| THE CANTOR FBP MUTUAL FUNDS |
| NOTES TO FINANCIAL STATEMENTS (Continued) |
4. Transactions with Related Parties
INVESTMENT ADVISORY AGREEMENTS
Each Fund’s investments are managed by Cantor Fitzgerald Investment Advisors, L.P. (the “Adviser”) under the terms of an Investment Advisory Agreement. Under the Investment Advisory Agreements, each Fund pays the Adviser a fee, which is computed and accrued daily and paid monthly, at an annual rate of 0.70% of its average daily net assets up to $250 million; 0.65% of the next $250 million of such assets; and 0.50% of such assets in excess of $500 million.
Pursuant to Expense Limitation Agreements (“ELAs”) between each Fund and the Adviser, the Adviser has contractually agreed, until August 1, 2023, to reduce advisory fees and/or reimburse expenses to the extent necessary to limit total annual fund operating expenses (excluding brokerage costs, taxes, interest, Acquired Fund Fees and Expenses and extraordinary expenses) to an amount not exceeding 1.12% and 1.05% of the average daily net assets of Cantor FBP Equity & Dividend Plus Fund and Cantor FBP Appreciation & Income Opportunities Fund, respectively.
Accordingly, during the six months ended September 30, 2022, the Adviser reduced its advisory fees in the amounts of $23,685 and $23,740 for Cantor FBP Equity & Dividend Plus Fund and Cantor FBP Appreciation & Income Opportunities Fund, respectively.
Under the terms of the ELAs, investment advisory fee reductions and expense reimbursements by the Adviser are subject to recoupment by the Adviser for a period of three years after such fees and expenses were incurred, provided the recoupments do not cause total annual fund operating expenses to exceed the lesser of (i) the expense limitation then in effect, if any, or (ii) the expense limitation in effect at the time the expenses to be recouped were incurred. As of September 30, 2022, the Adviser may seek recoupment of investment advisory fee reductions and expense reimbursements no later than the dates as stated below:
| | | | | | Cantor FBP | |
| | | | | | Appreciation | |
| | | Cantor FBP Equity | | | & Income | |
| | | & Dividend | | | Opportunities | |
| | | Plus Fund | | | Fund | |
| March 31, 2023 | | $ | 24,183 | | | $ | 26,429 | |
| March 31, 2024 | | | 52,478 | | | | 49,983 | |
| March 31, 2025 | | | 34,723 | | | | 31,024 | |
| September 30, 2025 | | | 23,685 | | | | 23,740 | |
| Total | | $ | 135,069 | | | $ | 131,176 | |
| | | | | | | | | |
Certain officers and a Trustee of the Trust are also officers of the Adviser.
OTHER SERVICE PROVIDERS
Ultimus Fund Solutions, LLC (“Ultimus”) provides administration, fund accounting, compliance and transfer agent services to the Funds. The Funds pay Ultimus fees in accordance with the agreements for such services. In addition, the Funds pay out-of-pocket expenses including, but not limited to, postage, supplies, and certain costs related to the pricing of the Funds’ portfolio securities. Certain officers of the Trust are
| THE CANTOR FBP MUTUAL FUNDS |
| NOTES TO FINANCIAL STATEMENTS (Continued) |
also officers of Ultimus, or of Ultimus Fund Distributors, LLC (the “Distributor”), the principal underwriter of each Fund’s shares and an affiliate of Ultimus. The Distributor is compensated by the Adviser (not the Funds) for acting as principal underwriter.
SHAREHOLDER SERVICING PLAN
The Funds have adopted a Shareholder Servicing Plan (the “Plan”), which allows each Fund to make payments to financial organizations (including payments directly to the Adviser and the distributor) for providing account administration and account maintenance services to Fund shareholders. The annual service fee may not exceed an amount equal to 0.25% of each Fund’s average daily net assets. During the six months ended September 30, 2022, Cantor FBP Equity & Dividend Plus Fund and Cantor FBP Appreciation & Income Opportunities Fund incurred fees of $6,713 and $1,572, respectively, under the Plan.
COMPENSATION OF TRUSTEES
Trustees and officers affiliated with the Adviser or Ultimus are not compensated by the Trust for their services. Each Trustee who is not an affiliated person of the Adviser or Ultimus receives from the Trust an annual retainer of $30,000, payable quarterly; a fee of $2,000 for attendance at each meeting of the Board of Trustees (except that such fee is $3,000 for the independent chair); and a fee of $1,000 for attendance at each meeting of any committee of the Board (except that such fee is $1,500 for the committee chair); plus reimbursement of travel and other expenses incurred in attending meetings. Each series of the Trust pays its proportionate share of such fees.
| THE CANTOR FBP MUTUAL FUNDS |
| NOTES TO FINANCIAL STATEMENTS (Continued) |
5. Derivatives Transactions
The location on the Statements of Assets and Liabilities of the Funds’ derivative positions as of September 30, 2022 is as follows:
Cantor FBP Equity & Dividend Plus Fund
| | | | | | | | | | Gross Notional | |
| | | | | | | | | | Amount | |
| | | | | | | Fair Value | | | Outstanding | |
| | | | | | | Asset | | | Liability | | | September 30, | |
| Type of Derivative (Risk) | | | Location | | | Derivatives | | | Derivatives | | | 2022 | |
| Call options written (Equity) | | | Written call options, at value | | | $ | — | | | $ | (65,220 | ) | | $ | (4,033,883 | ) |
Cantor FBP Appreciation & Income Opportunities Fund
| | | | | | | | | | Gross Notional | |
| | | | | | | | | | Amount | |
| | | | | | | Fair Value | | | Outstanding | |
| | | | | | | Asset | | | Liability | | | September 30, | |
| Type of Derivative (Risk) | | | Location | | | Derivatives | | | Derivatives | | | 2022 | |
| Call options written (Equity) | | | Written call options, at value | | | $ | — | | | $ | (831 | ) | | $ | (541,910 | ) |
The Funds’ transactions in derivative instruments during the six months ended September 30, 2022 are recorded in the following locations on the Statements of Operations:
Cantor FBP Equity & Dividend Plus Fund
| | | | | | | | | | | | | Change in | |
| | | | | | | Net | | | | | | Unrealized | |
| | | | | | | Realized | | | | | | Appreciation | |
| Type of Derivative (Risk) | | | Location | | | Gains | | | Location | | | (Depreciation) | |
| Call options written (Equity) | | | Net realized gains from written option contracts | | | $ | 308,767 | | | Net change in unrealized appreciation (depreciation) on written option contracts | | | $ | 61,249 | |
Cantor FBP Appreciation & Income Opportunities Fund
| | | | | | | | | | | | | Change in | |
| | | | | | | Net | | | | | | Unrealized | |
| | | | | | | Realized | | | | | | Appreciation | |
| Type of Derivative (Risk) | | | Location | | | Gains | | | Location | | | (Depreciation) | |
| Call options written (Equity) | | | Net realized gains from written option contracts | | | $ | 70,646 | | | Net change in unrealized appreciation (depreciation) on written option contracts | | | $ | (13,372 | ) |
| THE CANTOR FBP MUTUAL FUNDS |
| NOTES TO FINANCIAL STATEMENTS (Continued) |
The average monthly notional amount of written call options during the six months ended September 30, 2022 is $5,798,202 and $1,125,641 for Cantor FBP Equity & Dividend Plus Fund and Cantor FBP Appreciation & Income Opportunities Fund, respectively.
6. Contingencies and Commitments
The Funds indemnify the Trust’s officers and Trustees for certain liabilities that might arise from the performance of their duties to the Funds. Additionally, in the normal course of business the Funds enter into contracts that contain a variety of representations and warranties and which provide general indemnifications. The Funds’ maximum exposure under these arrangements is unknown, as this would involve future claims that may be made against the Funds that have not yet occurred. However, based on experience, the Trust expects the risk of loss to be remote.
7. Subsequent Events
The Funds are required to recognize in the financial statements the effects of all subsequent events that provide additional evidence about conditions that existed as of the date of the Statements of Assets and Liabilities. For non-recognized subsequent events that must be disclosed to keep the financial statements from being misleading, the Funds are required to disclose the nature of the event as well as an estimate of its financial effect, or a statement that such an estimate cannot be made. Management has evaluated subsequent events through the issuance of these financial statements and has noted no such events.
| THE CANTOR FBP MUTUAL FUNDS |
| ABOUT YOUR FUNDS’ EXPENSES (Unaudited) |
We believe it is important for you to understand the impact of costs on your investment. All mutual funds have operating expenses. As a shareholder of a Fund, you incur ongoing costs, including management fees and other operating expenses. These ongoing costs, which are deducted from each Fund’s gross income, directly reduce the investment return of the Funds.
A mutual fund’s ongoing costs are expressed as a percentage of its average net assets. This figure is known as the expense ratio. The following examples are intended to help you understand the ongoing costs (in dollars) of investing in the Funds and to compare these costs with the ongoing costs of investing in other mutual funds. The examples below are based on an investment of $1,000 made at the beginning of the period shown and held for the entire period (April 1, 2022 through September 30, 2022).
The table below illustrates each Fund’s ongoing costs in two ways:
Actual fund return – This section helps you to estimate the actual expenses that you paid over the period. The “Ending Account Value” shown is derived from each Fund’s actual return, and the fourth column shows the dollar amount of operating expenses that would have been paid by an investor who started with $1,000 in the Funds. You may use the information here, together with the amount you invested, to estimate the expenses that you paid over the period.
To do so, simply divide your account value by $1,000 (for example, an $8,600 account value divided by $1,000 = 8.6), then multiply the result by the number given for the Funds under the heading “Expenses Paid During Period.”
Hypothetical 5% return – This section is intended to help you compare the Funds’ ongoing costs with those of other mutual funds. It assumes that each Fund had an annual return of 5% before expenses during the period shown, but that the expense ratio is unchanged. In this case, because the returns used are not the Funds’ actual returns, the results do not apply to your investment. The example is useful in making comparisons because the U.S. Securities and Exchange Commission (the “SEC”) requires all mutual funds to calculate expenses based on a 5% return. You can assess each Fund’s ongoing costs by comparing this hypothetical example with the hypothetical examples that appear in shareholder reports of other funds.
Note that expenses shown in the table are meant to highlight and help you compare ongoing costs only. The Funds do not charge sales loads or redemption fees.
The calculations assume no shares were bought or sold during the period. Your actual costs may have been higher or lower, depending on the amount of your investment and the timing of any purchases or redemptions.
More information about the Funds’ expenses, including annual expense ratios for the past five fiscal years, can be found in this report. For additional information on operating expenses and other shareholder costs, please refer to the Funds’ prospectus.
| THE CANTOR FBP MUTUAL FUNDS |
| ABOUT YOUR FUNDS’ EXPENSES (Unaudited) (Continued) |
| | | | | | | | | |
| | | Beginning | | Ending | | | | Expenses |
| | | Account Value | | Account Value | | Net | | Paid |
| | | April 1, | | September 30, | | Expense | | During |
| | | 2022 | | 2022 | | Ratio(a) | | Period(b) |
| | | | | | | | | |
| | | | | | | | | |
| Cantor FBP Equity & Dividend Plus Fund | | | | | | | | |
| Based on Actual Fund Return | | $1,000.00 | | $840.30 | | 1.12% | | $5.17 |
| Based on Hypothetical 5% Return (before expenses) | | $1,000.00 | | $1,019.45 | | 1.12% | | $5.67 |
| | | | | | | | | |
| | | | | | | | | |
| Cantor FBP Appreciation & Income Opportunities Fund | | | | | | | | |
| Based on Actual Fund Return | | $1,000.00 | | $850.90 | | 1.05% | | $4.87 |
| Based on Hypothetical 5% Return (before expenses) | | $1,000.00 | | $1,019.80 | | 1.05% | | $5.32 |
| | | | | | | | | |
| (a) | Annualized, based on each Fund’s most recent one-half year expenses. |
| (b) | Expenses are equal to each Fund’s annualized net expense ratio multiplied by the average account value over the period, multiplied by 183/365 (to reflect the one-half year period). |
| THE CANTOR FBP MUTUAL FUNDS |
| OTHER INFORMATION (Unaudited) |
The Trust files a complete listing of portfolio holdings for the Funds with the SEC as of the end of the first and third quarters of each fiscal year as an exhibit to its reports on Form N-PORT. The filings are available upon request, by calling 1-866-738-1127. Furthermore, you may obtain a copy of these filings on the SEC’s website at www.sec.gov and the Funds’ website www.fbpfunds.com.
A description of the policies and procedures that the Funds use to determine how to vote proxies relating to portfolio securities is available without charge upon request by calling toll-free 1-866-738-1127, or on the SEC’s website at www.sec.gov. Information regarding how the Funds voted proxies relating to portfolio securities during the most recent 12-month period ended June 30 is also available without charge upon request by calling toll-free 1-866-738-1127, or on the SEC’s website at www.sec.gov.
| THE CANTOR FBP MUTUAL FUNDS |
| LIQUIDITY RISK MANAGEMENT PROGRAM (Unaudited) |
The Funds have adopted and implemented a written liquidity risk management program as required by Rule 22e-4 (the “Liquidity Rule”) under the Investment Company Act. The program is reasonably designed to assess and manage each Fund’s liquidity risk, taking into consideration, among other factors, the Fund’s investment strategy and the liquidity of its portfolio investments during normal and reasonably foreseeable stressed conditions; its short and long-term cash flow projections; and its cash holdings and access to other funding sources. The Funds’ Board of Trustees approved the appointment of a Liquidity Risk Committee, which includes representatives from Cantor Fitzgerald Investment Advisors, L.P., the Funds’ investment adviser, and Ultimus Fund Solutions, LLC, the Funds’ Administrator. The Liquidity Risk Committee is responsible for the program’s administration and oversight and for reporting to the Board on at least an annual basis regarding the program’s operation and effectiveness. The Liquidity Risk Committee updated its assessment of each Fund’s liquidity risk profile, considering additional data gathered in the 12 months ended May 31, 2022 and the adequacy and effectiveness of the liquidity risk management program’s operations from June 1, 2021 through May 31, 2022 (the “Review Period”) in order to prepare a written report for the Board of Trustees (the “Report”) for consideration at its meeting held on August 16, 2022. During the Review Period, neither Fund experienced unusual stress or disruption to its operations related to purchase and redemption activity. Also, during the Review Period the Funds held adequate levels of cash and highly liquid investments to meet shareholder redemption activities in accordance with applicable requirements. The Report concluded that (i) the Funds’ liquidity risk management program is reasonably designed to prevent violations of the Liquidity Rule and (ii) the Funds’ liquidity risk management program has been effectively implemented.
This page intentionally left blank.
This page intentionally left blank.
| | | | | | | | |
| | | | | | | | |
| | | | | | | | |
| | | | | | | | |
| | | | | | | | |
| | | | | | | | |
| | | | | | | | |
| | | | | | | | |
| | | |  | | | |
 | | | | |
| | | | | | | | | |
| | | | | | | | | | |
| | | | | | | | | | |
| | | | Investment Adviser Cantor Fitzgerald Investment Advisors, L.P. 800 Main Street, Second Floor P.O. Box 6138 Lynchburg, Virginia 24505 Toll-Free 1-800-851-3804 www.fbpinc.com Administrator Ultimus Fund Solutions, LLC P.O. Box 46707 Cincinnati, Ohio 45246-0707 Toll-Free 1-866-738-1127 Custodian U.S. Bank, N.A. 425 Walnut Street Cincinnati, Ohio 45202 Independent Registered Public Accounting Firm Cohen & Company, Ltd. 342 N. Water Street, Suite 830 Milwaukee, Wisconsin 53202 | Legal Counsel Sullivan & Worcester LLP 1666 K Street, N.W. Washington, DC 20006 Officers John T. Bruce, President Norman D. Darden, III, Vice President Eileen B. Sebold, Vice President David J. Marshall, Vice President Teresa L. Sanderson, Compliance Officer Trustees Robert S. Harris, Ph.D., Chairman John P. Ackerly, IV John T. Bruce George K. Jennison Harris V. Morrissette Elizabeth W. Robertson | | | |
| | | | | | | | |
| | | | | | | | |
| | | | | | | | |
| | | | | | | | |
| | | | | | | | |
| | | | | | | | |
| | | | | | | | |
| | | | | | | | |
| | | | | | | | |
| | | | | | | | |
| | | | | | | | |
| | | | | | | | |
| | | | | | | | |
| | | | | FBP-SAR-22 | | |
| | | | | | | | |
| | | | | | | | |
| | | | | | | | |
| | | | | | | | |
| | | | | | | | |
| | | |
| | | |
| | | |
| | THE | |
| | GOVERNMENT STREET | |
| | FUNDS | |
| | | |
| | | |
| | No-Load Mutual Funds | |
| | | |
| | Semi-Annual Report | |
| | September 30, 2022 | |
| | (Unaudited) | |
| | | |
| | | |
| | | |
| | | |
| | | |
| | | |
| | | |
| | | |
| |  | |
| | | |
| | | |
| | | |
| | | |
| | | |
| | | |
| | | |
| | | |
| | | |
| | The Government Street Equity Fund | |
| | The Government Street Opportunities Fund | |
| | | |
| | | |
| | | |
| | | |
| | | |
| | | |
| LETTER FROM THE PRESIDENT | October 15, 2022 |
Dear Fellow Shareholders:
We are enclosing for your review the Semi-Annual Reports of The Government Street Funds for the six-months ended September 30, 2022.
The Government Street Equity Fund
The Government Street Equity Fund (the “Fund”) had a negative -20.56% total return for the six-month period ended September 30, 2022. By comparison, the S&P 500® Index and the Morningstar Large Blend category returned -20.20% and -9.66%, respectively.
| | Government | S&P 500® | Morningstar |
| | Street Equity Fund | Index | Large Blend |
| 3 Qtr 2022 | -5.15% | -4.88% | -4.99% |
| 2 Qtr 2022 | -16.25% | -16.10% | -14.89% |
| 1 Qtr 2022 | -4.22% | -4.60% | -5.12% |
| 4 Qtr 2021 | 11.31% | 11.03% | 9.45% |
| Year End 9/30/22 | -15.31% | -15.47% | -16.03% |
As can be seen in the chart above, the Fund and the other representative measures of large-capitalization securities weathered excessive negative returns for the semi-annual period covered by this report.
As can be seen in the chart above, there was only one quarter of positive investment returns in the last year. Though never certain, it appears that the one very positive quarter fit the definition of a short-term rally in the “Bear Market.” Positive hopes seem to have given way to any number (pick your favorite) of economic realities. Political chaos, supply chain bottlenecks, pandemic continuation, fiscal excesses, Federal Reserve policies, negative earnings projection, collapsing growth stock prospects, etc., are all candidates for reason to cause stock declines.
Within the S&P 500®, value stocks performed better than growth stocks by losing only -9.6% versus 21.1%, respectively, for the one-year period ended September 30, 2022.
Within the Government Street Equity Fund, the only economic sector which generated positive returns was Energy at a positive 46.2%. All other sectors were negative, with the Information Technology sector leading the way down at a minus -25.0% for the most recent 12 months.
Major purchases for the semi-annual period were Chevron, Shell plc and Cheniere Energy (Energy Sector), Vanguard Value (Exchange-Traded Fund diversifier) and Goldman Sachs (Finance).
Major sales for the semi-annual period were Comcast “A” (Communications), Apple, NVIDIA and Taiwan Semi Conductor ADR (Information Technology) and Honeywell (Industrials).
The transactions, in total, were allocated along the investment sectors of the Fund with the Standard & Poor’s 500 sectors as guidelines. While the Fund is not invested with a pseudo index approach, the sectors provide an objective comparison for the diversification we believe important for the control of relative risk in your portfolio. Overall, we depend on our own conclusions as to the ultimate security selection and position weightings. Additionally, as a defensive measure, a short term money market reserve of approximately 12% was maintained within the Fund during the period.
The top 10 holdings in The Government Street Equity Fund as of September 30, 2022 were:
| Security Description | % of Net Assets |
| Microsoft Corporation | 3.90% |
| Lockheed Martin Corporation | 3.88% |
| JPMorgan Chase & Company | 3.68% |
| Apple, Inc. | 3.47% |
| Bio-Techne Corporation | 3.33% |
| NVIDIA Corporation | 3.25% |
| Amazon.com, Inc. | 3.22% |
| Alphabet, Inc. – Classes A & C | 2.71% |
| Mid-Amer Apartment Communities, Inc. | 2.60% |
| AbbVie, Inc. | 2.59% |
There were significant individual performances during the six-months ended September 30, 2022. The five highest returns, held for the entire 6 months, as measured by the time weighted rate of return were:
| | 6 Month |
| Security Description | Performance |
| Cheniere Energy, Inc. | 20.19% |
| Albemarle Corporation | 19.98% |
| Devon Energy Corporation | 6.97% |
| Nucor Corporation | 0.90% |
| UnitedHealth Group, Inc. | -0.33% |
The five worst individual performances, held for the six-months ended September 30, 2022, as measured by time weighted rate of return for the entire period were:
| | 6 Month |
| Security Description | Performance |
| Skyworks Solutions, Inc. | -35.14% |
| ASML Holding N.V. | -37.21% |
| Nike, Inc. Class B | -37.83% |
| Freeport-McMoRan, Inc. | -44.57% |
| NVIDIA Corporation | -55.45% |
The Fund’s best performing economic sector for the 6 months was Energy, down -1.90%. The second-best sector was Utilities, down -8.60%. The worst performing sector was Information Technology, down -30.5%.
Note: The investment performances listed for economic sectors and securities in the two preceding paragraphs are extracted from an in-house independent time weighted rates of return computation by the Addepar portfolio accounting system. The calculations are gross investment returns. Total investment returns are for the twelve months ended September 30, 2022.
Our past commentaries, for several periods, have focused on the growing Governmental debt burden brought about by what we consider to be irresponsible political spending programs. The upward spiral of the borrowed funds has been accelerated by the unanticipated new factor in the form of the Covid-19 pandemic. While unarguably necessary to offset the dire consequences of many total business shutdown, the actions of our Congress have raised the debt burden to an excess of $30 trillion, with promise of more to come. The result of the increase has led to the United States, without doubt, solidifying its position currently as the largest debtor nation in the world.
Shortly after the September 30, 2022 close of the period covered by this report, the debt of the United States passed $31 trillion. At the same time, the Federal Reserve was poised for a third consecutive 75 basis point interest increase in the Federal Funds rate. Along with the interest rate increase, the Federal Reserve was beginning to implement the reduction of their $6 trillion balance sheet accumulation of corporate debt and mortgages. There is little doubt that the Governmental spending of the last decade resulted in the United States becoming the largest debtor nation in the world, producing 8%+ inflation and significant increases in interest rates. While the economic malaise caused by the two Ps, Pandemic and Putin, can be blamed for much, the third P, politicians, bear an even larger responsibility. Apparently, spending or in many cases giving funds away, has never been more attractive inside the Beltway.
The destruction of wealth in the past nine months is truly staggering. Personal investment accounts, retirement plans, endowments, charitable funds, etc. have all suffered tremendous declines. Economic dislocations are extensive and will not quickly be reversed. It will take an extended period to wring the Government-induced excesses out of the system. During the coming periods, there will be pockets of success, but volatility and modest gains will be the likely prospect. The Country and capitalism will survive, but it will occur in an environment of uncertainty and hardship for many.
We are seeing a current proclivity of investors to move funds toward value stocks. These types of investments tend to have healthy balance sheets and produce positive cash flows in their enterprises. Growth stocks, the positive engines of the last several years, which focus more on future growth of revenues and subsequent future earnings, are quickly falling behind in relative investment performance. For the current 9 months of the 2022 calendar year, S&P 500 value stocks have out-performed their S&P 500 growth components by over 15 percentage points.
When one category of stocks, growth or value, tend to outperform across various time periods, it is interesting from a current investment point of view. The current movement of business and the economy is towards the digital revolution. This shift, without question, favors growth type securities. As robotics, artificial intelligence, econometrics, renewable energy are all factors focused on the future, their values are
currently being repriced downward. As the old Chinese curse goes, “may you live in interesting times,” should be contemplated for future expectations of successful market areas.
While we truly hope for a positive development for our fundamental investment future, we continue to focus significant efforts to address the mitigation of risks in the portfolio. As in the past, we continue to broadly diversify the Fund. Your fund currently holds 68 common stocks. Cash equivalent positions are approximately 12.3%. The companies invested in your fund were represented in all of the Government’s Industrial Sectors.
As of September 30, 2022, the Fund’s net assets were $59.6 million; net asset value per share was $81.45; and the annualized ratio of expenses to net average assets was 0.87%. Portfolio turnover rate was 5% (not annualized). Income dividends of $0.4560 per share and capital gains of $1.2474 per share were distributed to shareholders during the six-months ended September 30, 2022.
The Government Street Opportunities Fund
The Government Street Opportunities Fund (the “Fund”), as of September 30, 2022, produced a fiscal six-month total return of -15.45%. By comparison, the Standard & Poor’s 400® Index and the Morningstar Mid Cap Blended Index, used as relative performance benchmarks, were -17.50% and -17.17%, respectively.
| | Government | | |
| | Street | | |
| | Opportunities | S&P 400® | Morningstar |
| | Fund | Index | Mid Cap Blend |
| 3 Qtr 2022 | -2.78% | -2.46% | -3.84% |
| 2 Qtr 2022 | -13.03% | -15.42% | -14.27% |
| 1 Qtr 2022 | -5.96% | -4.88% | -5.06% |
| 4 Qtr 2021 | 10.84% | 8.00% | 7.39% |
| Year End 9/30/22 | -11.87% | -15.25% | -15.93% |
The mid-capitalization category of individual companies is usually represented by the SPDR S&P Mid Cap 400 ETF Trust, currently ranging from approximately $1.50 billion to $16.97 billion (based on 8/31/2022 Morningstar data) market values. Generally, these companies are considered to have slightly higher risk and return characteristics than the S&P 500 companies, which start at the upper end of the mid-cap values and range in sizes 10 times or greater in terms of capitalization. As you would guess, the mid-cap companies tend to be primarily domestically oriented.
The top 10 holdings in The Government Street Mid-Cap Fund as of September 30, 2022 were:
| Security Description | % of Net Assets |
| Mid-America Apartment Communities, Inc. | 4.26% |
| Albemarle Corporation | 3.25% |
| Enphase Energy, Inc. | 3.05% |
| Waste Connections, Inc. | 2.60% |
| Gallagher Arthur J & Company | 2.51% |
| Nasdaq, Inc. | 2.49% |
| NVIDIA Corporation | 2.22% |
| Brown & Brown, Inc. | 2.22% |
| Bio-Techne Corporation | 2.08% |
| L3harris Technologies, Inc. | 2.06% |
There were significant individual performances during the six-months ended September 30, 2022. The five highest returns, held for the entire period, as measured by the time weighted rate of return, were:
| | 6 Month |
| Security Description | Performance |
| Celsius Holdings, Inc. | 64.33% |
| Enphase Energy, Inc. | 37.51% |
| Albemarle Corporation | 19.98% |
| Continental Resource, Inc. | 9.93% |
| Devon Energy Corporation | 6.72% |
The five worst individual performances, held for the entire period, as measured by time weighted rate of return, were:
| | 6 Month |
| Security Description | Performance |
| Bio-Techne Corporation | -34.30% |
| Woodward, Inc. | -35.50% |
| Advanced Micro Device, Inc. | -42.05% |
| Teleflex Corporation | -43.07% |
| NVIDIA Corporation | -55.47% |
The Fund’s best performing economic sector for the 6 months was Consumer Staples, up 3.4%. The second-best sector was Energy, down -6.6%. The worst performing sector was Healthcare, down -25.9%.
Note: The investment performances listed for economic sectors and securities in the two preceding paragraphs are extracted from an in-house independent time weighted rates of return computation by the Addepar portfolio accounting system. The calculations are gross investment returns. Total investment returns are for the year ended September 30, 2022.
We believe that mid-cap stocks offer an attractive combination of growth and safety as they have successfully overcome startup challenges yet remain nimble enough to generate stronger growth than large cap stocks. Mid-cap stocks have been able to match the performance of large cap stocks in down markets while exceeding large cap performance in up markets, leading to long-term outperformance.
The strategy to manage risks in the Fund is primarily thru diversification over the eleven economic sectors. The securities which comprise the Fund are represented in each of those sectors according to their perceived investment prospects. Finally, in periods of expected volatility, the Fund will hold higher than normal cash equivalent positions. On September 30, 2022 the cash equivalent position was 12.2%. In all cases, the intent is to manage portfolio’s volatility, which should result in greater compounded returns over time.
It may be interesting for the readers to compare and contrast the Global Industry Classification Standard (GICS) sectors between the larger capitalization SPDR S&P 500 ETF Trust and the lower capitalization SPDR S&P Mid Cap 400 ETF. The approximate weights based on component’s capitalizations change daily but are reasonably stable over short periods. As of September 30, 2022, they are:
| GICS | S&P 500 (proxy) | S&P 400 (proxy) |
| Energy | 5.35% | 4.75% |
| Materials | 2.28% | 6.02% |
| Industrials | 8.44% | 18.38% |
| Consumer Discretionary | 10.94% | 14.16% |
| Consumer Staples | 7.23% | 4.10% |
| Health Care | 15.15% | 10.68% |
| Financials | 13.26% | 15.36% |
| Information Technology | 23.75% | 13.08% |
| Telecommunication Services | 8.06% | 1.69% |
| Utilities | 2.89% | 3.56% |
| Real Estate | 2.66% | 8.23% |
The Government Street Opportunities Fund uses the SPDR S&P Mid Cap 400 ETF sector weights for guidance in its diversification of investment holdings.
As of September 30, 2022, the net assets of the Government Street Opportunities Fund were $54.5 million, and the net asset value per share was $32.54. The turnover rate for the previous six-months was 4% and the total number of holdings was 92 as of September 30, 2022. The net annualized expense ratio for the Fund was 1.06%. Capital gains of $0.9792 per share were distributed to shareholders during the six-months ended September 30, 2022.
Thank you for your continued confidence in The Government Street Funds. Please call us if we can be of further service to you.
Very truly yours,

Thomas W. Leavell
President
Leavell Investment Management, Inc.
The Government Street Funds
| THE GOVERNMENT STREET EQUITY FUND |
| PORTFOLIO INFORMATION |
| September 30, 2022 (Unaudited) |
Asset Allocation
(% of Net Assets)
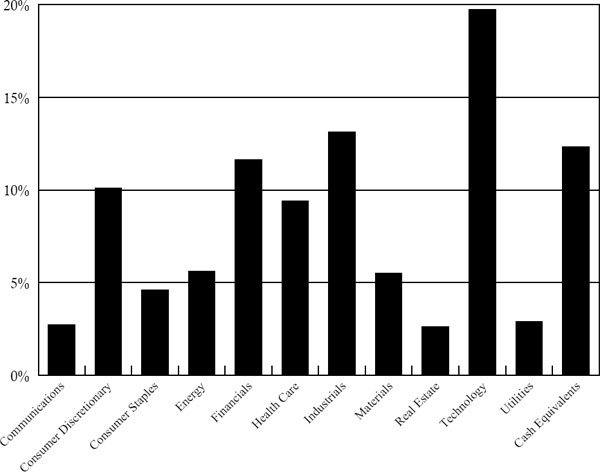
Top Ten Equity Holdings
| Security Description | % of Net Assets |
| Microsoft Corporation | 3.9% |
| Lockheed Martin Corporation | 3.9% |
| JPMorgan Chase & Company | 3.7% |
| Apple, Inc. | 3.5% |
| Bio-Techne Corporation | 3.3% |
| NVIDIA Corporation | 3.3% |
| Amazon.com, Inc. | 3.2% |
| Alphabet, Inc. - Classes A & C | 2.7% |
| Mid-America Apartment Communities, Inc. | 2.6% |
| AbbVie, Inc. | 2.6% |
| THE GOVERNMENT STREET OPPORTUNITIES FUND |
| PORTFOLIO INFORMATION |
| September 30, 2022 (Unaudited) |
Asset Allocation
(% of Net Assets)
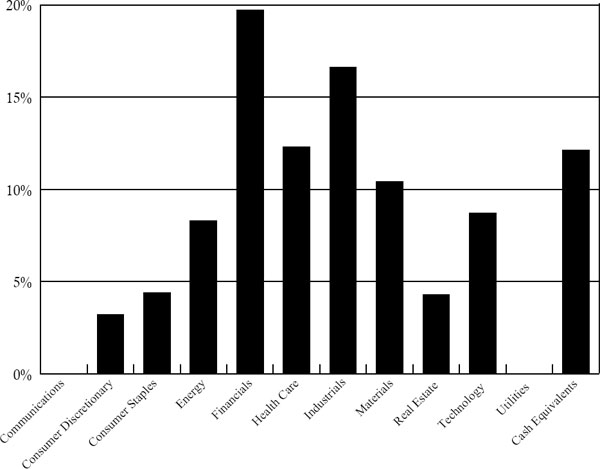
Top Ten Equity Holdings
| Security Description | % of Net Assets |
| Mid-America Apartment Communities, Inc. | 4.3% |
| Albemarle Corporation | 3.2% |
| Enphase Energy, Inc. | 3.1% |
| Waste Connections, Inc. | 2.6% |
| Arthur J. Gallagher & Company | 2.5% |
| Nasdaq, Inc. | 2.5% |
| NVIDIA Corporation | 2.2% |
| Brown & Brown, Inc. | 2.2% |
| Bio-Techne Corporation | 2.1% |
| L3Harris Technologies, Inc. | 2.1% |
| THE GOVERNMENT STREET EQUITY FUND |
| SCHEDULE OF INVESTMENTS |
| September 30, 2022 (Unaudited) |
| COMMON STOCKS — 87.8% | | Shares | | | Value | |
| Communications — 2.7% | | | | | | |
| Alphabet, Inc. - Class A (a) | | | 4,000 | | | $ | 382,600 | |
| Alphabet, Inc. - Class C (a) | | | 12,840 | | | | 1,234,566 | |
| | | | | | | | 1,617,166 | |
| Consumer Discretionary — 10.1% | | | | | | | | |
| Amazon.com, Inc. (a) | | | 17,000 | | | | 1,921,000 | |
| Home Depot, Inc. (The) | | | 5,000 | | | | 1,379,700 | |
| Lowe’s Companies, Inc. | | | 5,500 | | | | 1,032,955 | |
| McDonald’s Corporation | | | 5,000 | | | | 1,153,700 | |
| NIKE, Inc. - Class B | | | 6,500 | | | | 540,280 | |
| | | | | | | | 6,027,635 | |
| Consumer Staples — 4.6% | | | | | | | | |
| Cal-Maine Foods, Inc. | | | 1,000 | | | | 55,590 | |
| Coca-Cola Company (The) | | | 3,500 | | | | 196,070 | |
| Colgate-Palmolive Company | | | 1,500 | | | | 105,375 | |
| Ingles Markets, Inc. - Class A | | | 1,500 | | | | 118,815 | |
| Kroger Company (The) | | | 10,000 | | | | 437,500 | |
| Procter & Gamble Company (The) | | | 4,000 | | | | 505,000 | |
| Walmart, Inc. | | | 10,000 | | | | 1,297,000 | |
| | | | | | | | 2,715,350 | |
| Energy — 5.6% | | | | | | | | |
| APA Corporation | | | 6,000 | | | | 205,140 | |
| Cheniere Energy, Inc. | | | 6,000 | | | | 995,460 | |
| Chevron Corporation | | | 3,500 | | | | 502,845 | |
| Devon Energy Corporation | | | 13,500 | | | | 811,755 | |
| ONEOK, Inc. | | | 7,000 | | | | 358,680 | |
| Phillips 66 | | | 2,000 | | | | 161,440 | |
| Shell plc - ADR | | | 6,600 | | | | 328,416 | |
| | | | | | | | 3,363,736 | |
| Financials — 11.6% | | | | | | | | |
| Aflac, Inc. | | | 16,000 | | | | 899,200 | |
| Ares Management Corporation - Class A | | | 5,000 | | | | 309,750 | |
| Blackstone, Inc. | | | 14,500 | | | | 1,213,650 | |
| Brookfield Asset Management, Inc. - Class A | | | 28,000 | | | | 1,144,920 | |
| CME Group, Inc. | | | 3,500 | | | | 619,955 | |
| Intercontinental Exchange, Inc. | | | 1,500 | | | | 135,525 | |
| JPMorgan Chase & Company | | | 21,000 | | | | 2,194,500 | |
| Marsh & McLennan Companies, Inc. | | | 2,500 | | | | 373,225 | |
| | | | | | | | 6,890,725 | |
| Health Care — 9.4% | | | | | | | | |
| Abbott Laboratories | | | 9,500 | | | | 919,220 | |
| AbbVie, Inc. | | | 11,500 | | | | 1,543,415 | |
| Bio-Techne Corporation | | | 7,000 | | | | 1,988,000 | |
| Edwards Lifesciences Corporation (a) | | | 4,800 | | | | 396,624 | |
| THE GOVERNMENT STREET EQUITY FUND |
| SCHEDULE OF INVESTMENTS (Continued) |
| COMMON STOCKS — 87.8% (Continued) | | Shares | | | Value | |
| Health Care — 9.4% (Continued) | | | | | | | | |
| Thermo Fisher Scientific, Inc. | | | 900 | | | $ | 456,471 | |
| UnitedHealth Group, Inc. | | | 600 | | | | 303,024 | |
| | | | | | | | 5,606,754 | |
| Industrials — 13.1% | | | | | | | | |
| Emerson Electric Company | | | 6,500 | | | | 475,930 | |
| General Dynamics Corporation | | | 5,200 | | | | 1,103,284 | |
| Honeywell International, Inc. | | | 9,000 | | | | 1,502,730 | |
| Lockheed Martin Corporation | | | 6,000 | | | | 2,317,740 | |
| Quanta Services, Inc. | | | 2,500 | | | | 318,475 | |
| Raytheon Technologies Corporation | | | 13,500 | | | | 1,105,110 | |
| TE Connectivity Ltd. | | | 9,000 | | | | 993,240 | |
| | | | | | | | 7,816,509 | |
| Materials — 5.5% | | | | | | | | |
| Albemarle Corporation | | | 5,000 | | | | 1,322,200 | |
| Corteva, Inc. | | | 2,000 | | | | 114,300 | |
| Freeport-McMoRan, Inc. | | | 25,000 | | | | 683,250 | |
| Glencore plc - ADR | | | 25,000 | | | | 262,000 | |
| ICL Group Ltd. | | | 10,000 | | | | 81,800 | |
| International Paper Company | | | 5,000 | | | | 158,500 | |
| Linde plc | | | 1,000 | | | | 269,590 | |
| Mosaic Company (The) | | | 6,000 | | | | 289,980 | |
| Nucor Corporation | | | 1,000 | | | | 106,990 | |
| | | | | | | | 3,288,610 | |
| Real Estate — 2.6% | | | | | | | | |
| Mid-America Apartment Communities, Inc. | | | 10,000 | | | | 1,550,700 | |
| | | | | | | | | |
| Technology — 19.7% | | | | | | | | |
| Accenture plc - Class A | | | 4,500 | | | | 1,157,850 | |
| Apple, Inc. | | | 15,000 | | | | 2,073,000 | |
| ASML Holding N.V. | | | 500 | | | | 207,675 | |
| Mastercard, Inc. - Class A | | | 2,000 | | | | 568,680 | |
| Microsoft Corporation | | | 10,000 | | | | 2,329,000 | |
| NVIDIA Corporation | | | 16,000 | | | | 1,942,240 | |
| ON Semiconductor Corporation (a) | | | 4,000 | | | | 249,320 | |
| QUALCOMM, Inc. | | | 6,000 | | | | 677,880 | |
| Skyworks Solutions, Inc. | | | 8,000 | | | | 682,160 | |
| Texas Instruments, Inc. | | | 6,200 | | | | 959,636 | |
| Visa, Inc. - Class A | | | 5,000 | | | | 888,250 | |
| | | | | | | | 11,735,691 | |
| THE GOVERNMENT STREET EQUITY FUND |
| SCHEDULE OF INVESTMENTS (Continued) |
| COMMON STOCKS — 87.8% (Continued) | | Shares | | | Value | |
| Utilities — 2.9% | | | | | | |
| Constellation Energy Corporation | | | 1,700 | | | $ | 141,423 | |
| NextEra Energy, Inc. | | | 1,100 | | | | 86,251 | |
| NRG Energy, Inc. | | | 2,500 | | | | 95,675 | |
| Southern Company (The) | | | 3,200 | | | | 217,600 | |
| WEC Energy Group, Inc. | | | 13,000 | | | | 1,162,590 | |
| | | | | | | | 1,703,539 | |
| | | | | | | | | |
| Total Common Stocks (Cost $23,879,648) | | | | | | $ | 52,316,415 | |
| | | | | | | | | |
| MONEY MARKET FUNDS — 12.3% | | Shares | | | Value | |
| Fidelity Institutional Money Market Government Portfolio - Class I, 2.73% (b) (Cost $7,337,878) | | | 7,337,878 | | | $ | 7,337,878 | |
| | | | | | | | | |
| Total Investments at Value — 100.1% | | | | | | | | |
| (Cost $31,217,526) | | | | | | $ | 59,654,293 | |
| | | | | | | | | |
| Liabilities in Excess of Other Assets — (0.1%) | | | | | | | (50,456 | ) |
| | | | | | | | | |
| Net Assets — 100.0% | | | | | | $ | 59,603,837 | |
ADR - American Depositary Receipt.
| (a) | Non-income producing security. |
| (b) | The rate shown is the 7-day effective yield as of September 30, 2022. |
See accompanying notes to financial statements.
| THE GOVERNMENT STREET OPPORTUNITIES FUND |
| SCHEDULE OF INVESTMENTS |
| September 30, 2022 (Unaudited) |
| COMMON STOCKS — 87.9% | | Shares | | | Value | |
| Consumer Discretionary — 3.2% | | | | | | | | |
| Gildan Activewear, Inc. | | | 10,000 | | | $ | 282,700 | |
| Hasbro, Inc. | | | 2,500 | | | | 168,550 | |
| NVR, Inc. (a) | | | 135 | | | | 538,256 | |
| Service Corporation International | | | 13,000 | | | | 750,620 | |
| | | | | | | | 1,740,126 | |
| Consumer Staples — 4.4% | | | | | | | | |
| Bunge Ltd. | | | 3,000 | | | | 247,710 | |
| Cal-Maine Foods, Inc. | | | 2,000 | | | | 111,180 | |
| Celsius Holdings, Inc. (a) | | | 12,000 | | | | 1,088,160 | |
| Church & Dwight Company, Inc. | | | 9,000 | | | | 642,960 | |
| Ingles Markets, Inc. - Class A | | | 1,500 | | | | 118,815 | |
| Molson Coors Beverage Company - Class B | | | 4,000 | | | | 191,960 | |
| | | | | | | | 2,400,785 | |
| Energy — 8.3% | | | | | | | | |
| APA Corporation | | | 9,000 | | | | 307,710 | |
| Continental Resources, Inc. | | | 9,000 | | | | 601,290 | |
| Denbury, Inc. (a) | | | 1,500 | | | | 129,390 | |
| Devon Energy Corporation | | | 10,000 | | | | 601,300 | |
| Enphase Energy, Inc. (a) | | | 6,000 | | | | 1,664,820 | |
| Marathon Oil Corporation | | | 21,000 | | | | 474,180 | |
| Northern Oil and Gas, Inc. | | | 5,000 | | | | 137,050 | |
| ONEOK, Inc. | | | 3,500 | | | | 179,340 | |
| Ovintiv, Inc. | | | 6,000 | | | | 276,000 | |
| Targa Resources Corporation | | | 1,750 | | | | 105,595 | |
| Vertex Energy, Inc. (a) | | | 11,500 | | | | 71,645 | |
| | | | | | | | 4,548,320 | |
| Financials — 19.7% | | | | | | | | |
| Alleghany Corporation (a) | | | 1,190 | | | | 998,850 | |
| American Financial Group, Inc. | | | 8,600 | | | | 1,057,198 | |
| Ares Management Corporation - Class A | | | 6,500 | | | | 402,675 | |
| Arthur J. Gallagher & Company | | | 8,000 | | | | 1,369,760 | |
| B. Riley Financial, Inc. | | | 2,500 | | | | 111,300 | |
| Berkley (W.R.) Corporation | | | 16,762 | | | | 1,082,490 | |
| Brown & Brown, Inc. | | | 20,000 | | | | 1,209,600 | |
| CME Group, Inc. | | | 5,000 | | | | 885,650 | |
| Intercontinental Exchange, Inc. | | | 9,000 | | | | 813,150 | |
| Morgan Stanley | | | 8,565 | | | | 676,721 | |
| Nasdaq, Inc. | | | 24,000 | | | | 1,360,320 | |
| Old Republic International Corporation | | | 24,400 | | | | 510,692 | |
| Voya Financial, Inc. | | | 4,000 | | | | 242,000 | |
| | | | | | | | 10,720,406 | |
| Health Care — 12.3% | | | | | | | | |
| Bio-Rad Laboratories, Inc. - Class A (a) | | | 1,500 | | | | 625,710 | |
| THE GOVERNMENT STREET OPPORTUNITIES FUND |
| SCHEDULE OF INVESTMENTS (Continued) |
| COMMON STOCKS — 87.9% (Continued) | | Shares | | | Value | |
| Health Care — 12.3% (Continued) | | | | | | | | |
| Bio-Techne Corporation | | | 4,000 | | | $ | 1,136,000 | |
| Centene Corporation (a) | | | 6,000 | | | | 466,860 | |
| Charles River Laboratories International, Inc. (a) | | | 4,500 | | | | 885,600 | |
| Chemed Corporation | | | 2,500 | | | | 1,091,400 | |
| Laboratory Corporation of America Holdings | | | 2,574 | | | | 527,181 | |
| Penumbra, Inc. (a) | | | 2,000 | | | | 379,200 | |
| ResMed, Inc. | | | 1,200 | | | | 261,960 | |
| Teleflex, Inc. | | | 3,950 | | | | 795,767 | |
| Waters Corporation (a) | | | 2,000 | | | | 539,060 | |
| | | | | | | | 6,708,738 | |
| Industrials — 16.6% | | | | | | | | |
| AMETEK, Inc. | | | 2,350 | | | | 266,513 | |
| C.H. Robinson Worldwide, Inc. | | | 4,000 | | | | 385,240 | |
| Donaldson Company, Inc. | | | 13,000 | | | | 637,130 | |
| Expeditors International of Washington, Inc. | | | 8,000 | | | | 706,480 | |
| Fastenal Company | | | 18,000 | | | | 828,720 | |
| Graco, Inc. | | | 13,000 | | | | 779,350 | |
| Jacobs Solutions, Inc. | | | 8,475 | | | | 919,453 | |
| L3Harris Technologies, Inc. | | | 5,400 | | | | 1,122,282 | |
| MasTec, Inc. (a) | | | 5,700 | | | | 361,950 | |
| MSC Industrial Direct Company, Inc. - Class A | | | 5,000 | | | | 364,050 | |
| National Instruments Corporation | | | 12,000 | | | | 452,880 | |
| nVent Electric plc | | | 2,900 | | | | 91,669 | |
| Pentair plc | | | 2,900 | | | | 117,827 | |
| Snap-on, Inc. | | | 1,475 | | | | 296,991 | |
| Waste Connections, Inc. | | | 10,500 | | | | 1,418,865 | |
| Woodward, Inc. | | | 3,900 | | | | 313,014 | |
| | | | | | | | 9,062,414 | |
| Materials — 10.4% | | | | | | | | |
| Albemarle Corporation | | | 6,700 | | | | 1,771,748 | |
| American Vanguard Corporation | | | 6,000 | | | | 112,200 | |
| Ashland, Inc. | | | 6,000 | | | | 569,820 | |
| ATI, Inc. (a) | | | 2,000 | | | | 53,220 | |
| CF Industries Holdings, Inc. | | | 1,000 | | | | 96,250 | |
| ICL Group Ltd. | | | 17,000 | | | | 139,060 | |
| Livent Corporation (a) | | | 2,000 | | | | 61,300 | |
| Martin Marietta Materials, Inc. | | | 3,000 | | | | 966,270 | |
| Packaging Corporation of America | | | 6,000 | | | | 673,740 | |
| Steel Dynamics, Inc. | | | 14,000 | | | | 993,300 | |
| Valvoline, Inc. | | | 9,236 | | | | 234,040 | |
| | | | | | | | 5,670,948 | |
| Real Estate — 4.3% | | | | | | | | |
| Mid-America Apartment Communities, Inc. | | | 15,000 | | | | 2,326,050 | |
| THE GOVERNMENT STREET OPPORTUNITIES FUND |
| SCHEDULE OF INVESTMENTS (Continued) |
| COMMON STOCKS — 87.9% (Continued) | | Shares | | | Value | |
| Technology — 8.7% | | | | | | | | |
| Advanced Micro Devices, Inc. (a) | | | 1,464 | | | $ | 92,759 | |
| Analog Devices, Inc. | | | 3,671 | | | | 511,517 | |
| ANSYS, Inc. (a) | | | 3,000 | | | | 665,100 | |
| Arrow Electronics, Inc. (a) | | | 9,100 | | | | 838,929 | |
| Broadridge Financial Solutions, Inc. | | | 3,500 | | | | 505,120 | |
| Lam Research Corporation | | | 1,075 | | | | 393,450 | |
| Microchip Technology, Inc. | | | 8,800 | | | | 537,064 | |
| NVIDIA Corporation | | | 10,000 | | | | 1,213,900 | |
| | | | | | | | 4,757,839 | |
| | | | | | | | | |
| Total Common Stocks (Cost $17,457,177) | | | | | | $ | 47,935,626 | |
| | | | | | | | | |
| MONEY MARKET FUNDS — 12.1% | | Shares | | | Value | |
| Fidelity Institutional Money Market Government Portfolio - Class I, 2.73% (b) (Cost $6,603,987) | | | 6,603,987 | | | $ | 6,603,987 | |
| | | | | | | | | |
| Total Investments at Value — 100.0% | | | | | | | | |
| (Cost $24,061,164) | | | | | | $ | 54,539,613 | |
| | | | | | | | | |
| Other Assets in Excess of Liabilities — 0.0% (c) | | | | | | | 5,276 | |
| | | | | | | | | |
| Net Assets — 100.0% | | | | | | $ | 54,544,889 | |
| (a) | Non-income producing security. |
| (b) | The rate shown is the 7-day effective yield as of September 30, 2022. |
| (c) | Percentage rounds to less than 0.1%. |
See accompanying notes to financial statements.
| THE GOVERNMENT STREET FUNDS |
| STATEMENTS OF ASSETS AND LIABILITIES |
| September 30, 2022 (Unaudited) |
| | | The | | | The | |
| | | Government | | | Government | |
| | | Street | | | Street | |
| | | Equity | | | Opportunities | |
| | | Fund | | | Fund | |
| ASSETS | | | | | | | | |
| Investments in securities: | | | | | | | | |
| At cost | | $ | 31,217,526 | | | $ | 24,061,164 | |
| At value (Note 2) | | $ | 59,654,293 | | | $ | 54,539,613 | |
| Receivable for capital shares sold | | | — | | | | 415 | |
| Dividends receivable | | | 20,332 | | | | 37,937 | |
| Other assets | | | 12,465 | | | | 13,373 | |
| TOTAL ASSETS | | | 59,687,090 | | | | 54,591,338 | |
| | | | | | | | | |
| LIABILITIES | | | | | | | | |
| Distributions payable | | | 3,476 | | | | — | |
| Payable for capital shares redeemed | | | 36,801 | | | | — | |
| Accrued investment advisory fees (Note 4) | | | 31,579 | | | | 35,424 | |
| Payable to administrator (Note 4) | | | 5,880 | | | | 5,580 | |
| Other accrued expenses | | | 5,517 | | | | 5,445 | |
| TOTAL LIABILITIES | | | 83,253 | | | | 46,449 | |
| | | | | | | | | |
| NET ASSETS | | $ | 59,603,837 | | | $ | 54,544,889 | |
| | | | | | | | | |
| Net assets consists of: | | | | | | | | |
| Paid-in capital | | $ | 30,623,029 | | | $ | 23,863,457 | |
| Accumulated earnings | | | 28,980,808 | | | | 30,681,432 | |
| Net assets | | $ | 59,603,837 | | | $ | 54,544,889 | |
| | | | | | | | | |
| Shares of beneficial interest outstanding (unlimited number of shares authorized, $0.01 par value) | | | 731,797 | | | | 1,676,471 | |
| | | | | | | | | |
| Net asset value, offering price and redemption price per share (Note 2) | | $ | 81.45 | | | $ | 32.54 | |
See accompanying notes to financial statements.
| THE GOVERNMENT STREET FUNDS |
| STATEMENTS OF OPERATIONS |
| For the Six Months Ended September 30, 2022 (Unaudited) |
| | | The | | | The | |
| | | Government | | | Government | |
| | | Street | | | Street | |
| | | Equity | | | Opportunities | |
| | | Fund | | | Fund | |
| INVESTMENT INCOME | | | | | | | | |
| Dividends | | $ | 626,395 | | | $ | 506,460 | |
| Foreign withholding taxes on dividends | | | (3,878 | ) | | | (2,191 | ) |
| TOTAL INVESTMENT INCOME | | | 622,517 | | | | 504,269 | |
| | | | | | | | | |
| EXPENSES | | | | | | | | |
| Investment advisory fees (Note 4) | | | 202,837 | | | | 221,352 | |
| Administration fees (Note 4) | | | 33,912 | | | | 30,341 | |
| Shareholder servicing fees (Note 4) | | | 10,853 | | | | 9,931 | |
| Trustees’ fees and expenses (Note 4) | | | 9,233 | | | | 9,233 | |
| Legal fees | | | 7,720 | | | | 9,746 | |
| Registration and filing fees | | | 8,300 | | | | 8,409 | |
| Audit and tax services fees | | | 7,750 | | | | 7,750 | |
| Compliance fees (Note 4) | | | 3,500 | | | | 3,500 | |
| Custodian and bank service fees | | | 3,481 | | | | 3,481 | |
| Shareholder reporting expenses | | | 2,507 | | | | 2,779 | |
| Postage and supplies | | | 1,713 | | | | 1,841 | |
| Other expenses | | | 2,897 | | | | 3,026 | |
| TOTAL EXPENSES | | | 294,703 | | | | 311,389 | |
| | | | | | | | | |
| NET INVESTMENT INCOME | | | 327,814 | | | | 192,880 | |
| | | | | | | | | |
| REALIZED AND UNREALIZED GAINS (LOSSES) ON INVESTMENTS | | | | | | | | |
| Net realized gains from investments | | | 546,904 | | | | 333,791 | |
| Net change in unrealized appreciation (depreciation) on investments | | | (16,440,719 | ) | | | (10,438,981 | ) |
| NET REALIZED AND UNREALIZED LOSSES ON INVESTMENTS | | | (15,893,815 | ) | | | (10,105,190 | ) |
| | | | | | | | | |
| NET DECREASE IN NET ASSETS RESULTING FROM OPERATIONS | | $ | (15,566,001 | ) | | $ | (9,912,310 | ) |
See accompanying notes to financial statements.
| THE GOVERNMENT STREET EQUITY FUND |
| STATEMENTS OF CHANGES IN NET ASSETS |
| | | Six Months | | | Year | |
| | | Ended | | | Ended | |
| | | Sept. 30, 2022 | | | March 31, | |
| | | (Unaudited) | | | 2022 | |
| FROM OPERATIONS | | | | | | | | |
| Net investment income | | $ | 327,814 | | | $ | 412,746 | |
| Net realized gains from investments | | | 546,904 | | | | 5,106,081 | |
| Net realized gains from in-kind redemptions (Note 2) | | | — | | | | 1,999,879 | |
| Net change in unrealized appreciation (depreciation) on investments | | | (16,440,719 | ) | | | 4,425,800 | |
| Net increase (decrease) in net assets resulting from operations | | | (15,566,001 | ) | | | 11,944,506 | |
| | | | | | | | | |
| DISTRIBUTIONS TO SHAREHOLDERS (Note 2) | | | (1,230,456 | ) | | | (7,830,507 | ) |
| | | | | | | | | |
| FROM CAPITAL SHARE TRANSACTIONS | | | | | | | | |
| Proceeds from shares sold | | | 89,684 | | | | 187,886 | |
| Net asset value of shares issued in reinvestment of distributions to shareholders | | | 1,210,890 | | | | 7,692,565 | |
| Payments for shares redeemed | | | (1,346,567 | ) | | | (5,496,437 | ) |
| Net increase (decrease) in net assets from capital share transactions | | | (45,993 | ) | | | 2,384,014 | |
| | | | | | | | | |
| TOTAL INCREASE (DECREASE) IN NET ASSETS | | | (16,842,450 | ) | | | 6,498,013 | |
| | | | | | | | | |
| NET ASSETS | | | | | | | | |
| Beginning of period | | | 76,446,287 | | | | 69,948,274 | |
| End of period | | $ | 59,603,837 | | | $ | 76,446,287 | |
| | | | | | | | | |
| CAPITAL SHARE ACTIVITY | | | | | | | | |
| Shares sold | | | 966 | | | | 1,769 | |
| Shares reinvested | | | 14,179 | | | | 73,460 | |
| Shares redeemed | | | (14,308 | ) | | | (52,009 | ) |
| Net increase in shares outstanding | | | 837 | | | | 23,220 | |
| Shares outstanding, beginning of period | | | 730,960 | | | | 707,740 | |
| Shares outstanding, end of period | | | 731,797 | | | | 730,960 | |
See accompanying notes to financial statements.
| THE GOVERNMENT STREET OPPORTUNITIES FUND |
| STATEMENTS OF CHANGES IN NET ASSETS |
| | | Six Months | | | Year | |
| | | Ended | | | Ended | |
| | | Sept. 30, 2022 | | | March 31, | |
| | | (Unaudited) | | | 2022 | |
| FROM OPERATIONS | | | | | | | | |
| Net investment income | | $ | 192,880 | | | $ | 278,275 | |
| Net realized gains from investments | | | 333,791 | | | | 1,832,823 | |
| Net realized gains from in-kind redemptions (Note 2) | | | — | | | | 1,856,180 | |
| Net change in unrealized appreciation (depreciation) on investments | | | (10,438,981 | ) | | | 4,612,711 | |
| Net increase (decrease) in net assets resulting from operations | | | (9,912,310 | ) | | | 8,579,989 | |
| | | | | | | | | |
| DISTRIBUTIONS TO SHAREHOLDERS (Note 2) | | | (1,574,663 | ) | | | (2,370,958 | ) |
| | | | | | | | | |
| FROM CAPITAL SHARE TRANSACTIONS | | | | | | | | |
| Proceeds from shares sold | | | 1,311,495 | | | | 1,467,336 | |
| Net asset value of shares issued in reinvestment of distributions to shareholders | | | 1,542,056 | | | | 2,320,422 | |
| Payments for shares redeemed | | | (1,234,331 | ) | | | (3,872,081 | ) |
| Net increase (decrease) in net assets from capital share transactions | | | 1,619,220 | | | | (84,323 | ) |
| | | | | | | | | |
| TOTAL INCREASE (DECREASE) IN NET ASSETS | | | (9,867,753 | ) | | | 6,124,708 | |
| | | | | | | | | |
| NET ASSETS | | | | | | | | |
| Beginning of period | | | 64,412,642 | | | | 58,287,934 | |
| End of period | | $ | 54,544,889 | | | $ | 64,412,642 | |
| | | | | | | | | |
| CAPITAL SHARE ACTIVITY | | | | | | | | |
| Shares sold | | | 38,467 | | | | 36,359 | |
| Shares reinvested | | | 46,073 | | | | 59,110 | |
| Shares redeemed | | | (34,095 | ) | | | (100,578 | ) |
| Net increase (decrease) in shares outstanding | | | 50,445 | | | | (5,109 | ) |
| Shares outstanding, beginning of period | | | 1,626,026 | | | | 1,631,135 | |
| Shares outstanding, end of period | | | 1,676,471 | | | | 1,626,026 | |
See accompanying notes to financial statements.
| THE GOVERNMENT STREET EQUITY FUND |
| FINANCIAL HIGHLIGHTS |
| | | Selected Per Share Data for a Share Outstanding Throughout Each Period: |
| | | Six Months | | | | | | | | | | | | | | | | |
| | | Ended | | | | | | | | | | | | | | | | |
| | | Sept. 30, | | | | | | | | | | | | | | | | |
| | | 2022 | | | Years Ended March 31, | |
| | | (Unaudited) | | | 2022 | | | 2021 | | | 2020 | | | 2019 | | | 2018 | |
| Net asset value at beginning of period | | $ | 104.58 | | | $ | 98.83 | | | $ | 68.30 | | | $ | 73.37 | | | $ | 74.60 | | | $ | 67.08 | |
| | | | | | | | | | | | | | | | | | | | | | | | | |
| Income (loss) from investment operations: | | | | | | | | | | | | | | | | | | | | | | | | |
| Net investment income | | | 0.45 | | | | 0.58 | | | | 0.64 | | | | 0.80 | | | | 0.69 | | | | 0.66 | |
| Net realized and unrealized gains (losses) on investments | | | (21.87 | ) | | | 16.42 | | | | 36.33 | | | | (1.82 | ) | | | 3.37 | | | | 9.32 | |
| Total from investment operations | | | (21.42 | ) | | | 17.00 | | | | 36.97 | | | | (1.02 | ) | | | 4.06 | | | | 9.98 | |
| | | | | | | | | | | | | | | | | | | | | | | | | |
| Less distributions from: | | | | | | | | | | | | | | | | | | | | | | | | |
| Net investment income | | | (0.46 | ) | | | (0.58 | ) | | | (0.64 | ) | | | (0.80 | ) | | | (0.68 | ) | | | (0.65 | ) |
| Net realized gains | | | (1.25 | ) | | | (10.67 | ) | | | (5.80 | ) | | | (3.25 | ) | | | (4.61 | ) | | | (1.81 | ) |
| Total distributions | | | (1.71 | ) | | | (11.25 | ) | | | (6.44 | ) | | | (4.05 | ) | | | (5.29 | ) | | | (2.46 | ) |
| | | | | | | | | | | | | | | | | | | | | | | | | |
| Net asset value at end of period | | $ | 81.45 | | | $ | 104.58 | | | $ | 98.83 | | | $ | 68.30 | | | $ | 73.37 | | | $ | 74.60 | |
| | | | | | | | | | | | | | | | | | | | | | | | | |
| Total return (a) | | | (20.56 | %) (b) | | | 17.51 | % | | | 55.46 | % | | | (2.04 | %) | | | 5.65 | % | | | 15.08 | % |
| | | | | | | | | | | | | | | | | | | | | | | | | |
| Net assets at end of period (000’s) | | $ | 59,604 | | | $ | 76,446 | | | $ | 69,948 | | | $ | 49,981 | | | $ | 56,180 | | | $ | 62,707 | |
| | | | | | | | | | | | | | | | | | | | | | | | | |
| Ratio of total expenses to average net assets | | | 0.87 | % (c) | | | 0.84 | % | | | 0.86 | % | | | 0.91 | % | | | 0.89 | % | | | 0.88 | % |
| | | | | | | | | | | | | | | | | | | | | | | | | |
| Ratio of net investment income to average net assets | | | 0.97 | % (c) | | | 0.55 | % | | | 0.71 | % | | | 1.01 | % | | | 0.92 | % | | | 0.90 | % |
| | | | | | | | | | | | | | | | | | | | | | | | | |
| Portfolio turnover rate | | | 5 | % (b) | | | 14 | % | | | 17 | % | | | 14 | % | | | 9 | % | | | 13 | % |
| (a) | Total return is a measure of the change in value on an investment in the Fund over the periods covered, which assumes any dividends or capital gains distributions are reinvested in shares of the Fund. The returns shown do not reflect the deductions of taxes a shareholder would pay on Fund distributions or the redemption of Fund Shares. |
See accompanying notes to financial statements.
| THE GOVERNMENT STREET OPPORTUNITIES FUND |
| FINANCIAL HIGHLIGHTS |
| | | Selected Per Share Data for a Share Outstanding Throughout Each Period: |
| | | Six Months | | | | | |
| | | Ended | | | | |
| | | Sept. 30, | | | | |
| | | 2022 | | | Years Ended March 31, | |
| | | (Unaudited) | | | 2022 | | | 2021 | | | 2020 | | | 2019 | | | 2018 | |
| Net asset value at beginning of period | | $ | 39.61 | | | $ | 35.73 | | | $ | 23.56 | | | $ | 26.78 | | | $ | 26.64 | | | $ | 24.42 | |
| | | | | | | | | | | | | | | | | | | | | | | | | |
| Income (loss) from investment operations: | | | | | | | | | | | | | | | | | | | | | | | | |
| Net investment income | | | 0.12 | | | | 0.17 | | | | 0.10 | | | | 0.16 | | | | 0.18 | | | | 0.20 | |
| Net realized and unrealized gains (losses) on investments | | | (6.21 | ) | | | 5.20 | | | | 13.19 | | | | (2.16 | ) | | | 0.90 | | | | 3.32 | |
| Total from investment operations | | | (6.09 | ) | | | 5.37 | | | | 13.29 | | | | (2.00 | ) | | | 1.08 | | | | 3.52 | |
| | | | | | | | | | | | | | | | | | | | | | | | | |
| Less distributions from: | | | | | | | | | | | | | | | | | | | | | | | | |
| Net investment income | | | — | | | | (0.18 | ) | | | (0.10 | ) | | | (0.16 | ) | | | (0.14 | ) | | | (0.20 | ) |
| Net realized gains | | | (0.98 | ) | | | (1.31 | ) | | | (1.02 | ) | | | (1.06 | ) | | | (0.80 | ) | | | (1.10 | ) |
| Total distributions | | | (0.98 | ) | | | (1.49 | ) | | | (1.12 | ) | | | (1.22 | ) | | | (0.94 | ) | | | (1.30 | ) |
| | | | | | | | | | | | | | | | | | | | | | | | | |
| Net asset value at end of period | | $ | 32.54 | | | $ | 39.61 | | | $ | 35.73 | | | $ | 23.56 | | | $ | 26.78 | | | $ | 26.64 | |
| | | | | | | | | | | | | | | | | | | | | | | | | |
| Total return (a) | | | (15.45 | %) (b) | | | 15.11 | % | | | 57.00 | % | | | (8.18 | %) | | | 4.21 | % | | | 14.67 | % |
| | | | | | | | | | | | | | | | | | | | | | | | | |
| Net assets at end of period (000’s) | | $ | 54,545 | | | $ | 64,413 | | | $ | 58,288 | | | $ | 39,422 | | | $ | 46,293 | | | $ | 50,059 | |
| | | | | | | | | | | | | | | | | | | | | | | | | |
| Ratio of total expenses to average net assets | | | 1.06 | % (c) | | | 1.02 | % | | | 1.07 | % | | | 1.09 | % | | | 1.08 | % | | | 1.06 | % |
| | | | | | | | | | | | | | | | | | | | | | | | | |
| Ratio of net investment income to average net assets | | | 0.65 | % (c) | | | 0.44 | % | | | 0.32 | % | | | 0.57 | % | | | 0.64 | % | | | 0.78 | % |
| | | | | | | | | | | | | | | | | | | | | | | | | |
| Portfolio turnover rate | | | 4 | % (b) | | | 8 | % | | | 13 | % | | | 2 | % | | | 6 | % | | | 12 | % |
| (a) | Total return is a measure of the change in value on an investment in the Fund over the periods covered, which assumes any dividends or capital gains distributions are reinvested in shares of the Fund. The returns shown do not reflect the deductions of taxes a shareholder would pay on Fund distributions or the redemption of Fund Shares. |
See accompanying notes to financial statements.
| THE GOVERNMENT STREET FUNDS |
| NOTES TO FINANCIAL STATEMENTS |
| September 30, 2022 (Unaudited) |
1. Organization
The Government Street Equity Fund and The Government Street Opportunities Fund (formerly, The Government Street Mid-Cap Fund) (the “Funds”) are each a diversified, no-load series of the Williamsburg Investment Trust (the “Trust”), an open-end management investment company registered under the Investment Company Act of 1940, as amended (the “1940 Act”). The Trust was organized as a Massachusetts business trust on July 18, 1988. Other series of the Trust are not included in this report.
The investment objective of The Government Street Equity Fund is to seek capital appreciation.
The investment objective of The Government Street Opportunities Fund is to seek capital appreciation.
2. Significant Accounting Policies
Each Fund follows accounting and reporting guidance under Financial Accounting Standards Board Accounting Standards Codification Topic 946, “Financial Services – Investment Companies.” The following is a summary of the Funds’ significant accounting policies. The policies are in conformity with accounting principles generally accepted in the United States of America (“GAAP”).
Securities valuation — The Funds’ portfolio securities are valued as of the close of business of the regular session of the New York Stock Exchange (“NYSE”) (normally 4:00 p.m. Eastern time). Securities traded on a national stock exchange, including common stocks and exchange-traded funds (“ETFs”), if any, are valued based upon the closing price on the principal exchange where the security is traded, if available, otherwise, at the last quoted bid price. Securities that are quoted by NASDAQ are valued at the NASDAQ Official Closing Price. Investments representing shares of other open-end investment companies, other than ETFs but including money market funds, are valued at their net asset value (“NAV”) as reported by such companies. When using a quoted price and when the market is considered active, securities will be classified as Level 1 within the fair value hierarchy (see below).
When market quotations are not readily available, if a pricing service cannot provide a price, or if the investment adviser believes the price received from the pricing service is not indicative of fair value, securities will be valued in good faith at fair value using methods consistent with procedures adopted by the Board of Trustees and will be classified as Level 2 or 3 within the fair value hierarchy, depending on the inputs used. Such methods of fair valuation may include, but are not limited to: multiple of earnings, multiple of book value, discount from market of a similar freely traded security, purchase price of the security, subsequent private transactions in the security
| THE GOVERNMENT STREET FUNDS |
| NOTES TO FINANCIAL STATEMENTS (Continued) |
or related securities, or a combination of these and other factors. GAAP establishes a single authoritative definition of fair value, sets out a framework for measuring fair value and requires additional disclosures about fair value measurements.
Various inputs are used in determining the value of each Fund’s investments. These inputs are summarized in the three broad levels listed below:
| ● | Level 1 – quoted prices in active markets for identical securities |
| ● | Level 2 – other significant observable inputs |
| ● | Level 3 – significant unobservable inputs |
The inputs or methodology used for valuing securities are not necessarily an indication of the risks associated with investing in those securities. The inputs used to measure fair value may fall into different levels of the fair value hierarchy. In such cases, for disclosure purposes, the level in the fair value hierarchy within which the fair value measurement falls in its entirety is determined based on the lowest level input that is significant to the fair value measurement.
The following is a summary of the Funds’ investments based on the inputs used to value the investments as of September 30, 2022, by asset type:
| The Government Street Equity Fund: | | Level 1 | | | Level 2 | | | Level 3 | | | Total | |
| Common Stocks | | $ | 52,316,415 | | | $ | — | | | $ | — | | | $ | 52,316,415 | |
| Money Market Funds | | | 7,337,878 | | | | — | | | | — | | | | 7,337,878 | |
| Total | | $ | 59,654,293 | | | $ | — | | | $ | — | | | $ | 59,654,293 | |
| | | | | | | | | | | | | | | | | |
| | | | | | | | | | | | | | | | | |
| The Government Street Opportunities Fund: | | Level 1 | | | Level 2 | | | Level 3 | | | Total | |
| Common Stocks | | $ | 47,935,626 | | | $ | — | | | $ | — | | | $ | 47,935,626 | |
| Money Market Funds | | | 6,603,987 | | | | — | | | | — | | | | 6,603,987 | |
| Total | | $ | 54,539,613 | | | $ | — | | | $ | — | | | $ | 54,539,613 | |
| | | | | | | | | | | | | | | | | |
Refer to each Fund’s Schedule of Investments for a listing of the common stocks by sector type. There were no Level 3 securities or derivative instruments held by the Funds as of or during the six months ended September 30, 2022.
Share valuation — The NAV per share of each Fund is calculated daily by dividing the total value of its assets, less liabilities, by the number of shares outstanding. The offering price and redemption price per share of each Fund is equal to the NAV per share.
Investment income — Interest income is accrued as earned. Discounts and premiums on fixed-income securities purchased, if any, are amortized using the interest method. Dividend income is recorded on the ex-dividend date. Non-cash dividends included in
| THE GOVERNMENT STREET FUNDS |
| NOTES TO FINANCIAL STATEMENTS (Continued) |
dividend income, if any, are recorded at the fair market value of the security received. Withholding taxes on foreign dividends have been recorded in accordance with the Trust’s understanding of the applicable country’s rules and tax rates.
Distributions to shareholders — Dividends arising from net investment income are declared and paid quarterly to shareholders of The Government Street Equity Fund and declared and paid annually to shareholders of The Government Street Opportunities Fund. Net realized short-term capital gains, if any, may be distributed throughout the year and net realized long-term capital gains, if any, are distributed at least once each year. Dividends and distributions are recorded on the ex-dividend date. The amount of distributions from net investment income and net realized capital gains are determined in accordance with federal income tax regulations, which may differ from GAAP. These “book/tax” differences are either temporary or permanent in nature.
The tax character of distributions paid during the periods ended September 30, 2022 and March 31, 2022 was as follows:
| | | Periods | | Ordinary | | | Long-Term | | | Total | |
| | | Ended | | Income | | | Capital Gains | | | Distributions | |
| The Government Street Equity Fund | | 09/30/22 | | $ | 331,073 | | | $ | 899,383 | | | $ | 1,230,456 | |
| | | 03/31/22 | | $ | 414,011 | | | $ | 7,417,115 | | | $ | 7,831,126 | |
| | | | | | | | | | | | | | | |
| The Government Street Opportunities Fund | | 09/30/22 | | $ | — | | | $ | 1,574,663 | | | $ | 1,574,663 | |
| | | 03/31/22 | | $ | 555,791 | | | $ | 1,815,167 | | | $ | 2,370,958 | |
| | | | | | | | | | | | | | | |
Investment transactions — Investment transactions are accounted for on trade date for financial reporting purposes. Realized gains and losses on investment securities sold are determined on a specific identification basis.
Common expenses — Common expenses of the Trust are allocated among the Funds and the other series of the Trust based on relative net assets of each series or the nature of the services performed and the relative applicability to each series.
Estimates — The preparation of financial statements in conformity with GAAP requires management to make estimates and assumptions that affect the reported amounts of assets and liabilities and the disclosure of contingent assets and liabilities as of the date of the financial statements and the reported amounts of increase (decrease) in net assets from operations during the reporting period. Actual results could differ from those estimates.
Federal income tax — Each Fund has qualified and intends to continue to qualify as a regulated investment company under the Internal Revenue Code of 1986, as amended (the “Code”). Qualification generally will relieve the Funds of liability for federal income taxes to the extent 100% of their net investment income and any net realized capital gains are distributed in accordance with the Code.
| THE GOVERNMENT STREET FUNDS |
| NOTES TO FINANCIAL STATEMENTS (Continued) |
In order to avoid imposition of the excise tax applicable to regulated investment companies, it is also each Fund’s intention to declare as dividends in each calendar year at least 98% of its net investment income (earned during the calendar year) and 98.2% of its net realized capital gains (earned during the twelve months ended October 31) plus undistributed amounts from prior years.
The following information is computed on a tax basis for each item as of September 30, 2022:
| | | The Government | | | The Government | |
| | | Street Equity | | | Street Opportunities | |
| | | Fund | | | Fund | |
| Cost of investments | | $ | 31,217,526 | | | $ | 24,061,164 | |
| Gross unrealized appreciation | | $ | 28,962,863 | | | $ | 30,872,967 | |
| Gross unrealized depreciation | | | (526,096 | ) | | | (394,518 | ) |
| Net unrealized appreciation | | | 28,436,767 | | | | 30,478,449 | |
| Accumulated ordinary income | | | 628 | | | | 168,502 | |
| Other gains | | | 546,889 | | | | 34,481 | |
| Distributions payable | | | (3,476 | ) | | | — | |
| Total accumulated earnings | | $ | 28,980,808 | | | $ | 30,681,432 | |
| | | | | | | | | |
The Funds may recognize a gain on in-kind redemptions, if any, to the extent that the value of the distributed investment securities on the date of redemption exceeds the cost of those investment securities. Such gains are not taxable to the Funds and are not required to be distributed to shareholders. The Funds may reclassify these gains against paid-in capital on the Statements of Assets and Liabilities. Such reclassifications, the result of permanent differences between the financial statement and income tax reporting requirements, has no effect on each Fund’s net assets or NAV per share.
The Funds recognize the tax benefits or expenses of uncertain tax positions only when the position is “more likely than not” to be sustained assuming examination by tax authorities. Management has reviewed the tax positions taken on federal income tax returns for the current and all open tax years (generally, three years) of each Fund and has concluded that no provision for unrecognized tax benefits or expenses is required in these financial statements.
| THE GOVERNMENT STREET FUNDS |
| NOTES TO FINANCIAL STATEMENTS (Continued) |
3. Investment Transactions
Investment transactions, other than short-term investments and U.S. government securities, were as follows for the six months ended September 30, 2022:
| | | | | | The Government | |
| | | The Government | | | Street | |
| | | Street Equity | | | Opportunities | |
| | | Fund | | | Fund | |
| Purchases of investment securities | | $ | 3,277,383 | | | $ | 2,718,547 | |
| Proceeds from sales of investment securities | | $ | 4,303,396 | | | $ | 2,237,461 | |
| | | | | | | | | |
4. Transactions with Related Parties
INVESTMENT ADVISORY AGREEMENT
Each Fund’s investments are managed by Leavell Investment Management, Inc. (the “Adviser”) under the terms of an Investment Advisory Agreement. The Government Street Equity Fund pays the Adviser a fee, which is computed and accrued daily and paid monthly, at annual rates of 0.60% of its average daily net assets up to $100 million and 0.50% of such assets in excess of $100 million. The Government Street Opportunities Fund pays the Adviser a fee, which is computed and accrued daily and paid monthly, at an annual rate of 0.75% of its average daily net assets.
Certain officers of the Trust are also officers of the Adviser.
OTHER SERVICE PROVIDERS
Ultimus Fund Solutions, LLC (“Ultimus”) provides administration, fund accounting, compliance and transfer agent services to the Funds. The Funds pay Ultimus fees in accordance with the agreements for such services. In addition, the Funds pay out-of-pocket expenses including, but not limited to, postage, supplies, and certain costs related to the pricing of the Funds’ portfolio securities. Certain officers of the Trust are also officers of Ultimus, or of Ultimus Fund Distributors, LLC (the “Distributor”), the principal underwriter of each Fund’s shares and an affiliate of Ultimus. The Distributor is compensated by the Adviser (not the Funds) for acting as principal underwriter.
SHAREHOLDER SERVICING PLAN
The Funds have adopted a Shareholder Servicing Plan (the “Plan”), which allows each Fund to make payments to financial organizations (including payments directly to the Adviser and the distributor) for providing account administration and account maintenance services to Fund shareholders. The annual service fee may not exceed an amount equal to 0.25% of each Fund’s average daily net assets. During the six months ended September 30, 2022, The Government Street Equity Fund and The Government Street Opportunities Fund incurred fees of $10,853 and $9,931, respectively, under the Plan.
| THE GOVERNMENT STREET FUNDS |
| NOTES TO FINANCIAL STATEMENTS (Continued) |
COMPENSATION OF TRUSTEES
Trustees and officers affiliated with the Adviser or Ultimus are not compensated by the Trust for their services. Each Trustee who is not an affiliated person of the Adviser or Ultimus receives from the Trust an annual retainer of $30,000, payable quarterly; a fee of $2,000 for attendance at each meeting of the Board of Trustees (except that such fee is $3,000 for the independent chair); and a fee of $1,000 for attendance at each meeting of any committee of the Board (except that such fee is $1,500 for the committee chair); plus reimbursement of travel and other expenses incurred in attending meetings. Each series of the Trust pays its proportionate share of such fees.
5. Contingencies and Commitments
The Funds indemnify the Trust’s officers and Trustees for certain liabilities that might arise from their performance of their duties to the Funds. Additionally, in the normal course of business the Funds enter into contracts that contain a variety of representations and warranties and which provide general indemnifications. The Funds’ maximum exposure under these arrangements is unknown, as this would involve future claims that may be made against the Funds that have not yet occurred. However, based on experience, the Trust expects the risk of loss to be remote.
6. Subsequent Events
The Funds are required to recognize in the financial statements the effects of all subsequent events that provide additional evidence about conditions that existed as of the date of the Statements of Assets and Liabilities. For non-recognized subsequent events that must be disclosed to keep the financial statements from being misleading, the Funds are required to disclose the nature of the event as well as an estimate of its financial effect, or a statement that such an estimate cannot be made. Management has evaluated subsequent events through the issuance of these financial statements and has noted no such events.
| THE GOVERNMENT STREET FUNDS |
| ABOUT YOUR FUNDS’ EXPENSES (Unaudited) |
We believe it is important for you to understand the impact of costs on your investment. All mutual funds have operating expenses. As a shareholder of the Funds, you incur ongoing costs, including management fees and other expenses. These ongoing costs, which are deducted from each Fund’s gross income, directly reduce the investment returns of the Funds.
A mutual fund’s ongoing costs are expressed as a percentage of its average net assets. This figure is known as the expense ratio. The following examples are intended to help you understand the ongoing costs (in dollars) of investing in the Funds and to compare these costs with the ongoing costs of investing in other mutual funds. The examples below are based on an investment of $1,000 made at the beginning of the period shown and held for the entire period (April 1, 2022 through September 30, 2022).
The table below illustrates each Fund’s ongoing costs in two ways:
Actual fund return – This section helps you to estimate the actual expenses that you paid over the period. The “Ending Account Value” shown is derived from each Fund’s actual return, and the fourth column shows the dollar amount of operating expenses that would have been paid by an investor who started with $1,000 in the Funds. You may use the information here, together with the amount you invested, to estimate the expenses that you paid over the period.
To do so, simply divide your account value by $1,000 (for example, an $8,600 account value divided by $1,000 = 8.6), then multiply the result by the number given for the Funds under the heading “Expenses Paid During Period.”
Hypothetical 5% return – This section is intended to help you compare the Funds’ ongoing costs with those of other mutual funds. It assumes that each Fund had an annual return of 5% before expenses during the period shown, but that the expense ratio is unchanged. In this case, because the returns used are not the Funds’ actual returns, the results do not apply to your investment. The example is useful in making comparisons because the U.S. Securities and Exchange Commission (the “SEC”) requires all mutual funds to calculate expenses based on a 5% return. You can assess each Fund’s ongoing costs by comparing this hypothetical example with the hypothetical examples that appear in shareholder reports of other funds.
Note that expenses shown in the table are meant to highlight and help you compare ongoing costs only. The Funds do not charge sales loads or redemption fees.
The calculations assume no shares were bought or sold during the period. Your actual costs may have been higher or lower, depending on the amount of your investment and the timing of any purchases or redemptions.
| THE GOVERNMENT STREET FUNDS |
| ABOUT YOUR FUNDS’ EXPENSES (Unaudited) (Continued) |
More information about the Funds’ expenses, including historical expense ratios, can be found in this report. For additional information on operating expenses and other shareholder costs, please refer to the Funds’ prospectus.
| | Beginning | Ending | | Expenses |
| | Account Value | Account Value | Expense | Paid During |
| | April 1, 2022 | Sept. 30, 2022 | Ratio(a) | Period(b) |
| The Government Street Equity Fund | | | | |
| Based on Actual Fund Return | $1,000.00 | $794.40 | 0.87% | $3.91 |
| Based on Hypothetical 5% Return (before expenses) | $1,000.00 | $1,020.71 | 0.87% | $4.41 |
| | | | | |
| The Government Street Opportunities Fund | | | | |
| Based on Actual Fund Return | $1,000.00 | $845.50 | 1.06% | $4.90 |
| Based on Hypothetical 5% Return (before expenses) | $1,000.00 | $1,019.75 | 1.06% | $5.37 |
| (a) | Annualized, based on each Fund’s most recent one-half year expenses. |
| (b) | Expenses are equal to each Fund’s annualized expense ratio multiplied by the average account value over the period, multiplied by 183/365 (to reflect the one-half year period). |
| THE GOVERNMENT STREET FUNDS |
| OTHER INFORMATION (Unaudited) |
A description of the policies and procedures that the Funds use to vote proxies relating to portfolio securities is available without charge upon request by calling toll-free 1-866-738-1125, or on the SEC’s website at www.sec.gov. Information regarding how the Funds voted proxies relating to portfolio securities during the most recent 12-month period ended June 30 is also available without charge upon request by calling toll-free 1-866-738-1125 or on the SEC’s website at www.sec.gov.
The Trust files a complete listing of portfolio holdings for the Funds with the SEC as of the end of the first and third quarters of each fiscal year as an exhibit to its reports on Form N-PORT. The filings are available upon request, by calling 1-866-738-1125. Furthermore, you may obtain a copy of these filings on the SEC’s website at www.sec.gov and the Funds’ website https://funddocs.filepoint.com/govstreet/.
| THE GOVERNMENT STREET FUNDS |
| LIQUIDITY RISK MANAGEMENT PROGRAM (Unaudited) |
The Funds have adopted and implemented a written liquidity risk management program as required by Rule 22e-4 (the “Liquidity Rule”) under the Investment Company Act. The program is reasonably designed to assess and manage each Fund’s liquidity risk, taking into consideration, among other factors, the Fund’s investment strategy and the liquidity of its portfolio investments during normal and reasonably foreseeable stressed conditions; its short and long-term cash flow projections; and its cash holdings and access to other funding sources. The Funds’ Board of Trustees approved the appointment of a Liquidity Risk Committee, which includes representatives from Leavell Investment Management, Inc., the Funds’ investment adviser, and Ultimus Fund Solutions, LLC, the Funds’ Administrator. The Liquidity Risk Committee is responsible for the program’s administration and oversight and for reporting to the Board on at least an annual basis regarding the program’s operation and effectiveness. The Liquidity Risk Committee updated its assessment of each Fund’s liquidity risk profile, considering additional data gathered in the 12 months ended May 31, 2022 and the adequacy and effectiveness of the liquidity risk management program’s operations from June 1, 2021 through May 31, 2022 (the “Review Period”) in order to prepare a written report for the Board of Trustees (the “Report”) for consideration at its meeting held on August 16, 2022. During the Review Period, neither Fund experienced unusual stress or disruption to its operations related to purchase and redemption activity. Also, during the Review Period the Funds held adequate levels of cash and highly liquid investments to meet shareholder redemption activities in accordance with applicable requirements. The Report concluded that (i) the Funds’ liquidity risk management program is reasonably designed to prevent violations of the Liquidity Rule and (ii) the Funds’ liquidity risk management program has been effectively implemented.
This page intentionally left blank.
This page intentionally left blank.
| | | | | | | |
| | | | | | | |
| | | | | | | |
| | | | | | | |
| | | | | | | |
| | | | | | | |
| | | | | | | |
| | | | | | | |
| | | | | | | |
| | | | The Government Street Funds | | | |
| | | | | | | |
| | | | No-Load Mutual Funds | | | |
| | | | | | | |
| | | | Investment Adviser | | | |
| | | | Leavell Investment Management, Inc. | | | |
| | | | 210 St. Joseph Street | | | |
| | | | Mobile, AL 36602 | | | |
| | | | | | | |
| | | | Administrator | | | |
| | | | Ultimus Fund Solutions, LLC | | | |
| | | | P.O. Box 46707 | | | |
| | | | Cincinnati, OH 45246-0707 | | | |
| | | | 1-866-738-1125 | | | |
| | | | | | | |
| | | | Legal Counsel | | | |
| | | | Sullivan & Worcester LLP | | | |
| | | | 1666 K Street, N.W. | | | |
| | | | Washington, DC 20006 | | | |
| | | | | | | |
| | | | Independent Registered Public Accounting Firm | | | |
| | | | Cohen & Company, Ltd. | | | |
| | | | 342 N Water Street, | | | |
| | | | Suite 830 | | | |
| | | | Milwaukee, WI 53202 | | | |
| | | | | | | |
| | | | Board of Trustees | | | |
| | | | Robert S. Harris, Ph.D., Chairman | | | |
| | | | John P. Ackerly, IV | | | |
| | | | John T. Bruce | | | |
| | | | George K. Jennison | | | |
| | | | Harris V. Morrissette | | | |
| | | | Elizabeth W. Robertson | | | |
| | | | | | | |
| | | | Portfolio Manager | | | |
| | | | Thomas W. Leavell, | | | |
| | | | The Government Street Equity Fund | | | |
| | | | The Government Street Opportunities Fund | | | |
| | | | | | | |
| | | | | | | |
| | | | | | | |
| | | | | | | |
| | | | | | | |
| | | | | | | |
| | | | | | | |
| | | | | | | |
| | | | | | | |
| | | | Government Street-SAR-22 | | |
| | | | | | | |
| | | | | | | |
| | | | | | | |
| | | | | | | |
| | | | | | | |
| | | | | |
| | | | | |
| | | | | |
| | | | | |
| | | | | |
| | | | | |
| | | | | |
| | | THE
JAMESTOWN
EQUITY FUND | | |
| | | | | |
| | | | | |
| | | | | |
| | | | | |
| | | | | |
| | | | | |
| | | | | |
| | | No-Load Fund | | |
| | | | | |
| | | | | |
| | | | | |
| | | | | |
| | | | | |
| | | | | |
| | | | | |
| | | | | |
| | | | | |
| | | SEMI-ANNUAL REPORT | | |
| | | | | |
| | | | | |
| | | | | |
| | | September 30, 2022 | | |
| | | | | |
| | | | | |
| | | | | |
| | | | | |
| | | | | |
| | | | | |
| | | | | |
| | | | | |
| | |  | | |
| | | | | |
| | | Investment Adviser | | |
| | | Lowe, Brockenbrough & Company, Inc. | | |
| | | Richmond, Virginia | | |
| | | | | |
| | | | | |
| | | | | |
| | | | | |
| | | | | |
| | | | | |
| | | | | |
| | | | | |
| | | | | |
| | | | | |
| LETTER TO SHAREHOLDERS | November 3, 2022 |
For the six-month period ending September 30, 2022, The Jamestown Equity Fund (the “Fund”) return of -18.62% compared to -20.20% for the S&P 500® Index. Both sector allocation and stock selection added to relative outperformance in the past six months. The primary driver of the positive contribution from sector selection was the cash the Fund held in a down period for the equity markets. Negative stock selection in Materials, Communications, and Energy were more than offset by positive selection in the Health Care, Financials, and Real Estate sectors.
After seemingly waiting too long to recognize that inflation was not as transitory as they believed, the Federal Reserve and other Central Banks around the world got serious about tightening monetary policy to combat decades-high inflation. The most significant impact on equities during the past six months was valuation compression as investors priced in higher interest rates all along the Treasury curve. Some leading indicators of inflation have begun to moderate, but wage pressure and the cost of home ownership (and the rental equivalent) have proved sticky so far as they typically lag any slowdown in the economy. Those pressures, along with high energy and food prices caused in large part by Russia’s invasion of Ukraine, are leading the Federal Reserve to continue hiking interest rates at an unprecedented pace.
Corporate profits have mostly held up so far during the correction in equity markets, but pressure on earnings and cash flow is likely to appear as the economy slows, especially if higher interest rates push the economy into a recession. Stocks have traditionally been considered inflation pass-throughs, and that looks reaffirmed. Margins have declined a little but are still in the range of the last ten years. This critical factor will determine the resiliency of the markets in the face of an abundance of bad news. Profitability has not only held up but remains robust, and it’s worth noting why. Our markets are no longer headlined by plodding, deeply cyclical businesses. In fact, just the opposite. A sort of cream of global franchises has risen to the top of our large-cap universe. Monopolies might be an overstatement, but it’s close. And they’ve had decades to fine-tune not only their markets but also their costs and internal controls. They are formidable. That’s not to say a recession wouldn’t dent their earnings; it would, but to what degree is an open question. As for the more pedestrian areas of the market, an average recession will produce a significant decline in earnings.
At the recent lows in equity markets, the S&P 500® was down almost 25% from all-time high levels reached early in 2022. Small-capitalization stocks and the technology-led NASDAQ are down even more. This is a fairly typical decline for equity markets in mild recessions, so a lot of the bad news is potentially already priced into markets. However, we still have some concern that a reduction in corporate earnings and cash flows are still in front of us. As such, we are maintaining higher-than-normal levels of cash in the Fund. At the end of September 2022, the Fund had a 10.2% allocation to cash as we look for opportunities to purchase additional high-quality companies trading at reasonable valuations. The greatest sector overweights in the portfolio, relative to benchmark weightings, were in the Industrials, Financials, and Consumer Discretionary sectors, while the largest sector underweights in the Fund were in the Utilities, Technology, and Real Estate sectors.
| THE JAMESTOWN EQUITY FUND |
| PERFORMANCE INFORMATION (Unaudited) |
| Comparison of the Change in Value of a $10,000 Investment in |
| The Jamestown Equity Fund |
| and the S&P 500® Index |
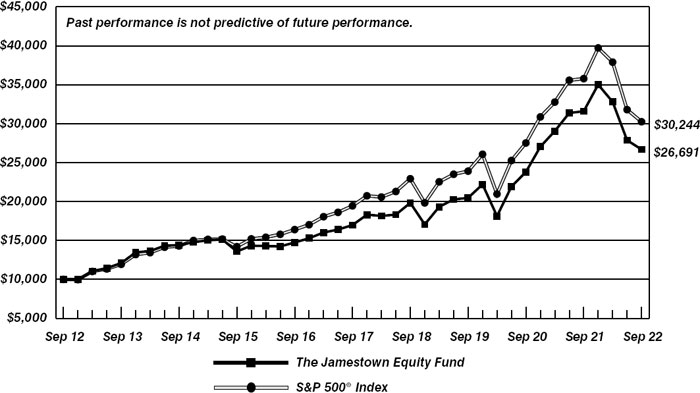
| | | | |
| | | Average Annual Total Returns | |
| | | (for periods ended September 30, 2022) | |
| | | | |
| | | 1 Year | | 5 Years | | 10 Years | |
| | The Jamestown Equity Fund (a) | -15.51% | | 9.47% | | 10.32% | |
| | S&P 500® Index | -15.47% | | 9.24% | | 11.70% | |
| | | | | | | | |
| (a) | Total return is a measure of the change in value of an investment in the Fund over the periods covered, which assumes any dividends or capital gains distributions are reinvested in shares of the Fund. Returns shown do not reflect the deduction of taxes a shareholder would pay on Fund distributions or the redemption of Fund shares. |
THE JAMESTOWN EQUITY FUND PORTFOLIO INFORMATION September 30, 2022 (Unaudited) |
| Asset Allocation (% of Net Assets) |
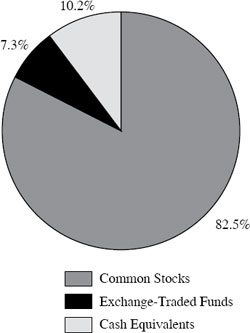
| | % of |
| Ten Largest Equity Holdings | Net Assets |
| Apple, Inc. | 5.5% |
| Microsoft Corporation | 4.0% |
| Alphabet, Inc. - Class A and C | 3.3% |
| Amazon.com, Inc. | 3.1% |
| Vanguard Information Technology ETF | 2.9% |
| Chevron Corporation | 2.7% |
| Meta Platforms, Inc. - Class A | 2.6% |
| JPMorgan Chase & Company | 2.4% |
| Eaton Corporation plc | 2.1% |
| Ameriprise Financial, Inc. | 2.1% |
| Sector Concentration vs. the S&P 500® Index |
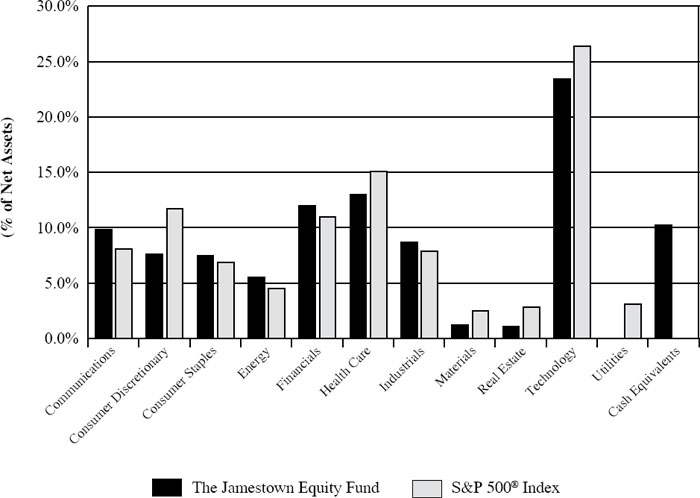
| THE JAMESTOWN EQUITY FUND |
| SCHEDULE OF INVESTMENTS |
| September 30, 2022 (Unaudited) |
| COMMON STOCKS — 82.5% | | Shares | | | Value | |
| Communications — 9.8% | | | | | | |
| Alphabet, Inc. - Class A (a) | | | 3,320 | | | $ | 317,558 | |
| Alphabet, Inc. - Class C (a) | | | 10,000 | | | | 961,500 | |
| Booking Holdings, Inc. (a) | | | 410 | | | | 673,716 | |
| Comcast Corporation - Class A | | | 14,250 | | | | 417,953 | |
| Meta Platforms, Inc. - Class A (a) | | | 7,300 | | | | 990,464 | |
| Walt Disney Company (The) (a) | | | 4,300 | | | | 405,619 | |
| | | | | | | | 3,766,810 | |
| Consumer Discretionary — 7.6% | | | | | | | | |
| Amazon.com, Inc. (a) | | | 10,700 | | | | 1,209,100 | |
| Ford Motor Company | | | 26,500 | | | | 296,800 | |
| Home Depot, Inc. (The) | | | 1,350 | | | | 372,519 | |
| Lowe’s Companies, Inc. | | | 2,300 | | | | 431,963 | |
| TJX Companies, Inc. (The) | | | 10,100 | | | | 627,412 | |
| | | | | | | | 2,937,794 | |
| Consumer Staples — 6.2% | | | | | | | | |
| PepsiCo, Inc. | | | 4,500 | | | | 734,670 | |
| Procter & Gamble Company (The) | | | 5,100 | | | | 643,875 | |
| Target Corporation | | | 4,300 | | | | 638,077 | |
| Walmart, Inc. | | | 3,000 | | | | 389,100 | |
| | | | | | | | 2,405,722 | |
| Energy — 5.5% | | | | | | | | |
| Chevron Corporation | | | 7,200 | | | | 1,034,424 | |
| Exxon Mobil Corporation | | | 2,250 | | | | 196,447 | |
| Schlumberger Ltd. | | | 12,545 | | | | 450,366 | |
| TotalEnergies SE - ADR | | | 9,500 | | | | 441,940 | |
| | | | | | | | 2,123,177 | |
| Financials — 12.0% | | | | | | | | |
| Ameriprise Financial, Inc. | | | 3,250 | | | | 818,837 | |
| Chubb Ltd. | | | 2,000 | | | | 363,760 | |
| Goldman Sachs Group, Inc. (The) | | | 1,800 | | | | 527,490 | |
| JPMorgan Chase & Company | | | 8,800 | | | | 919,600 | |
| Morgan Stanley | | | 7,500 | | | | 592,575 | |
| PNC Financial Services Group, Inc. (The) | | | 4,800 | | | | 717,216 | |
| Truist Financial Corporation | | | 16,000 | | | | 696,640 | |
| | | | | | | | 4,636,118 | |
| Health Care — 13.0% | | | | | | | | |
| Amgen, Inc. | | | 1,300 | | | | 293,020 | |
| CVS Health Corporation | | | 8,500 | | | | 810,645 | |
| Elevance Health, Inc. | | | 1,650 | | | | 749,496 | |
| Johnson & Johnson | | | 4,000 | | | | 653,440 | |
| Merck & Company, Inc. | | | 4,837 | | | | 416,562 | |
| Pfizer, Inc. | | | 13,000 | | | | 568,880 | |
| THE JAMESTOWN EQUITY FUND |
| SCHEDULE OF INVESTMENTS (Continued) |
| COMMON STOCKS — 82.5% (Continued) | | Shares | | | Value | |
| Health Care — 13.0% (Continued) | | | | | | | | |
| Thermo Fisher Scientific, Inc. | | | 1,400 | | | $ | 710,066 | |
| UnitedHealth Group, Inc. | | | 1,600 | | | | 808,064 | |
| | | | | | | | 5,010,173 | |
| Industrials — 8.7% | | | | | | | | |
| Eaton Corporation plc | | | 6,200 | | | | 826,832 | |
| Lockheed Martin Corporation | | | 900 | | | | 347,661 | |
| Norfolk Southern Corporation | | | 3,400 | | | | 712,810 | |
| Raytheon Technologies Corporation | | | 5,000 | | | | 409,300 | |
| Trane Technologies plc | | | 4,100 | | | | 593,721 | |
| United Parcel Service, Inc. - Class B | | | 3,000 | | | | 484,620 | |
| | | | | | | | 3,374,944 | |
| Materials — 1.2% | | | | | | | | |
| Eastman Chemical Company | | | 6,700 | | | | 476,035 | |
| | | | | | | | | |
| Real Estate — 1.1% | | | | | | | | |
| American Tower Corporation | | | 2,000 | | | | 429,400 | |
| | | | | | | | | |
| Technology — 17.4% | | | | | | | | |
| Apple, Inc. | | | 15,500 | | | | 2,142,100 | |
| Applied Materials, Inc. | | | 6,300 | | | | 516,159 | |
| Broadcom, Inc. | | | 1,300 | | | | 577,213 | |
| Cisco Systems, Inc. | | | 17,750 | | | | 710,000 | |
| Microsoft Corporation | | | 6,700 | | | | 1,560,430 | |
| Oracle Corporation | | | 11,000 | | | | 671,770 | |
| Visa, Inc. - Class A | | | 3,175 | | | | 564,039 | |
| | | | | | | | 6,741,711 | |
| | | | | | | | | |
| Total Common Stocks (Cost $16,129,268) | | | | | | $ | 31,901,884 | |
| | | | | | | | | |
| EXCHANGE-TRADED FUNDS — 7.3% | | Shares | | | Value | |
| Consumer Staples Select Sector SPDR Fund | | | 7,550 | | | $ | 503,812 | |
| iShares Expanded Tech-Software Sector ETF | | | 2,700 | | | | 675,351 | |
| iShares Semiconductor ETF | | | 1,600 | | | | 509,968 | |
| Vanguard Information Technology ETF | | | 3,700 | | | | 1,137,269 | |
| Total Exchange-Traded Funds (Cost $1,672,083) | | | | | | $ | 2,826,400 | |
| THE JAMESTOWN EQUITY FUND |
| SCHEDULE OF INVESTMENTS (Continued) |
| MONEY MARKET FUNDS — 10.2% | | Shares | | | Value | |
| Federated Hermes Government Obligations Fund - Institutional Class, 2.82% (b) (Cost $3,948,871) | | | 3,948,871 | | | $ | 3,948,871 | |
| | | | | | | | | |
| Total Investments at Value — 100.0% | | | | | | | | |
| (Cost $21,750,222) | | | | | | $ | 38,677,155 | |
| | | | | | | | | |
| Liabilities in Excess of Other Assets — (0.0%) (c) | | | | | | | (24,792 | ) |
| | | | | | | | | |
| Net Assets — 100.0% | | | | | | $ | 38,652,363 | |
ADR - American Depositary Receipt.
| (a) | Non-income producing security. |
| (b) | The rate shown is the 7-day effective yield as of September 30, 2022. |
| (c) | The percentage rounds to less than 0.1% |
See accompanying notes to financial statements.
| THE JAMESTOWN EQUITY FUND |
| STATEMENT OF ASSETS AND LIABILITIES |
| September 30, 2022 (Unaudited) |
| ASSETS | | | | |
| Investments in securities: | | | | |
| At cost | | $ | 21,750,222 | |
| At value (Note 2) | | $ | 38,677,155 | |
| Cash | | | 2,747 | |
| Dividends receivable | | | 28,341 | |
| Other assets | | | 10,618 | |
| TOTAL ASSETS | | | 38,718,861 | |
| | | | | |
| LIABILITIES | | | | |
| Distributions payable | | | 1,769 | |
| Payable for capital shares redeemed | | | 36,507 | |
| Accrued investment advisory fees (Note 4) | | | 18,079 | |
| Payable to administrator (Note 4) | | | 6,000 | |
| Other accrued expenses | | | 4,143 | |
| TOTAL LIABILITIES | | | 66,498 | |
| | | | | |
| NET ASSETS | | $ | 38,652,363 | |
| | | | | |
| Net assets consist of: | | | | |
| Paid-in capital | | $ | 19,593,495 | |
| Accumulated earnings | | | 19,058,868 | |
| Net assets | | $ | 38,652,363 | |
| | | | | |
| Shares of beneficial interest outstanding (unlimited number of shares authorized, $0.01 par value) | | | 1,639,828 | |
| | | | | |
| Net asset value, offering price and redemption price per share (Note 2) | | $ | 23.57 | |
See accompanying notes to financial statements.
| THE JAMESTOWN EQUITY FUND |
| STATEMENT OF OPERATIONS |
| Six Months Ended September 30, 2022 (Unaudited) |
| INVESTMENT INCOME | | | | |
| Dividends | | $ | 401,033 | |
| Foreign withholding taxes on dividends | | | (1,543 | ) |
| TOTAL INVESTMENT INCOME | | | 399,490 | |
| | | | | |
| EXPENSES | | | | |
| Investment advisory fees (Note 4) | | | 144,387 | |
| Administration fees (Note 4) | | | 30,000 | |
| Trustees’ fees and expenses (Note 4) | | | 9,233 | |
| Audit and tax services fees | | | 7,750 | |
| Registration and filing fees | | | 7,581 | |
| Legal fees | | | 7,055 | |
| Compliance service fees (Note 4) | | | 6,000 | |
| Custodian and bank service fees | | | 3,783 | |
| Shareholder reporting expense | | | 3,320 | |
| Shareholder servicing fees (Note 4) | | | 2,230 | |
| Postage and supplies | | | 2,034 | |
| Insurance expense | | | 724 | |
| Other expenses | | | 3,244 | |
| TOTAL EXPENSES | | | 227,341 | |
| Fees voluntarily waived by the Adviser (Note 4) | | | (16,314 | ) |
| NET EXPENSES | | | 211,027 | |
| | | | | |
| NET INVESTMENT INCOME | | | 188,463 | |
| | | | | |
| REALIZED AND UNREALIZED GAINS (LOSSES) ON INVESTMENTS | | | | |
| Net realized gains on investment transactions | | | 2,196,817 | |
| Net change in unrealized appreciation (depreciation) on investments | | | (11,570,971 | ) |
| NET REALIZED AND UNREALIZED LOSSES ON INVESTMENTS | | | (9,374,154 | ) |
| | | | | |
| NET DECREASE IN NET ASSETS RESULTING FROM OPERATIONS | | $ | (9,185,691 | ) |
See accompanying notes to financial statements.
| THE JAMESTOWN EQUITY FUND |
| STATEMENTS OF CHANGES IN NET ASSETS |
| | | Six Months | | | | |
| | | Ended | | | Year | |
| | | Sept. 30, | | | Ended | |
| | | 2022 | | | March 31, | |
| | | (Unaudited) | | | 2022 | |
| FROM OPERATIONS | | | | | | | | |
| Net investment income | | $ | 188,463 | | | $ | 261,336 | |
| Net realized gains on investment transactions | | | 2,196,817 | | | | 4,239,158 | |
| Net change in unrealized appreciation (depreciation) on investments | | | (11,570,971 | ) | | | 1,661,988 | |
| Net increase (decrease) in net assets resulting from operations | | | (9,185,691 | ) | | | 6,162,482 | |
| | | | | | | | | |
| DISTRIBUTIONS TO SHAREHOLDERS (Note 2) | | | (3,308,494 | ) | | | (2,031,746 | ) |
| | | | | | | | | |
| FROM CAPITAL SHARE TRANSACTIONS | | | | | | | | |
| Proceeds from shares sold | | | 123,374 | | | | 632,455 | |
| Net asset value of shares issued in reinvestment of distributions to shareholders | | | 3,226,589 | | | | 1,946,154 | |
| Payments for shares redeemed | | | (2,394,688 | ) | | | (3,917,381 | ) |
| Net increase (decrease) in net assets from capital share transactions | | | 955,275 | | | | (1,338,772 | ) |
| | | | | | | | | |
| TOTAL INCREASE (DECREASE) IN NET ASSETS | | | (11,538,910 | ) | | | 2,791,964 | |
| | | | | | | | | |
| NET ASSETS | | | | | | | | |
| Beginning of period | | | 50,191,273 | | | | 47,399,309 | |
| End of period | | $ | 38,652,363 | | | $ | 50,191,273 | |
| | | | | | | | | |
| CAPITAL SHARE ACTIVITY | | | | | | | | |
| Shares sold | | | 4,748 | | | | 20,108 | |
| Shares reinvested | | | 130,973 | | | | 61,648 | |
| Shares redeemed | | | (92,648 | ) | | | (121,490 | ) |
| Net increase (decrease) in shares outstanding | | | 43,073 | | | | (39,734 | ) |
| Shares outstanding, beginning of period | | | 1,596,755 | | | | 1,636,489 | |
| Shares outstanding, end of period | | | 1,639,828 | | | | 1,596,755 | |
See accompanying notes to financial statements.
| THE JAMESTOWN EQUITY FUND |
| FINANCIAL HIGHLIGHTS |
| | | Selected Per Share Data for a Share Outstanding Throughout Each Period: | |
| | | Six Months | | | | | | | | | | | | | | | | |
| | | Ended | | | | | | | | | | | | | | | | |
| | | Sept. 30 | | | | |
| | | 2022 | | | Years Ended March 31, | |
| | | (Unaudited) | | | 2022 | | | 2021 | | | 2020 | | | 2019 | | | 2018 | |
| Net asset value at beginning of period | | $ | 31.43 | | | $ | 28.96 | | | $ | 19.08 | | | $ | 21.79 | | | $ | 22.10 | | | $ | 20.89 | |
| | | | | | | | | | | | | | | | | | | | | | | | | |
| Income (loss) from investment operations: | | | | | | | | | | | | | | | | | | | | | | | | |
| Net investment income (a) | | | 0.12 | | | | 0.16 | | | | 0.17 | | | | 0.22 | | | | 0.24 | | | | 0.19 | |
| Net realized and unrealized gains (losses) on investments | | | (5.88 | ) | | | 3.57 | | | | 11.05 | | | | (1.35 | ) | | | 1.10 | | | | 2.51 | |
| Total from investment operations | | | (5.76 | ) | | | 3.73 | | | | 11.22 | | | | (1.13 | ) | | | 1.34 | | | | 2.70 | |
| | | | | | | | | | | | | | | | | | | | | | | | | |
| Less distributions from: | | | | | | | | | | | | | | | | | | | | | | | | |
| Net investment income | | | (0.12 | ) | | | (0.16 | ) | | | (0.18 | ) | | | (0.22 | ) | | | (0.24 | ) | | | (0.19 | ) |
| Net realized gains | | | (1.98 | ) | | | (1.10 | ) | | | (1.16 | ) | | | (1.36 | ) | | | (1.41 | ) | | | (1.30 | ) |
| Total distributions | | | (2.10 | ) | | | (1.26 | ) | | | (1.34 | ) | | | (1.58 | ) | | | (1.65 | ) | | | (1.49 | ) |
| | | | | | | | | | | | | | | | | | | | | | | | | |
| Net asset value at end of period | | $ | 23.57 | | | $ | 31.43 | | | $ | 28.96 | | | $ | 19.08 | | | $ | 21.79 | | | $ | 22.10 | |
| | | | | | | | | | | | | | | | | | | | | | | | | |
| Total return (b) | | | (18.62 | %) (c) | | | 12.91 | % | | | 60.23 | % | | | (6.17 | %) | | | 6.40 | % | | | 13.35 | % |
| | | | | | | | | | | | | | | | | | | | | | | | | |
| Net assets at end of year (000’s) | | $ | 38,652 | | | $ | 50,191 | | | $ | 47,399 | | | $ | 31,062 | | | $ | 36,658 | | | $ | 37,570 | |
| | | | | | | | | | | | | | | | | | | | | | | | | |
| Ratio of total expenses to average net assets (d) | | | 1.02 | % (e) | | | 0.96 | % | | | 1.05 | % | | | 1.08 | % | | | 1.03 | % | | | 1.03 | % |
| | | | | | | | | | | | | | | | | | | | | | | | | |
| Ratio of net expenses to average net assets (d)(f) | | | 0.95 | % (e) | | | 0.95 | % | | | 0.95 | % | | | 0.95 | % | | | 0.95 | % | | | 0.95 | % |
| | | | | | | | | | | | | | | | | | | | | | | | | |
| Ratio of net investment income to average net assets (a)(d)(f) | | | 0.85 | % (e) | | | 0.51 | % | | | 0.70 | % | | | 0.96 | % | | | 1.10 | % | | | 0.87 | % |
| | | | | | | | | | | | | | | | | | | | | | | | | |
| Portfolio turnover rate | | | 1 | % (c) | | | 8 | % | | | 10 | % | | | 18 | % | | | 18 | % | | | 18 | % |
| (a) | Recognition of net investment income by the Fund is affected by the timing of the declarations of dividends by the underlying investment companies in which the Fund invests. |
| (b) | Total return is a measure of the change in value of an investment in the Fund over the periods covered, which assumes any dividends or capital gains distributions are reinvested in shares of the Fund. Returns shown do not reflect the deduction of taxes a shareholder would pay on Fund distributions or the redemption of Fund shares. |
| (d) | The ratios of expenses and net investment income to average net assets do not reflect the Fund’s proportionate share of expenses of the underlying investment companies in which the Fund invests. Ratios were also determined based on net expenses after expense reimbursements through a previously directed brokerage arrangement. |
| (f) | Ratio was determined after voluntary advisory fee waivers by the Adviser and reimbursed expenses (Note 4). |
See accompanying notes to financial statements.
| THE JAMESTOWN EQUITY FUND |
| NOTES TO FINANCIAL STATEMENTS |
| September 30, 2022 (Unaudited) |
1. Organization
The Jamestown Equity Fund (the “Fund”) is a diversified, no-load series of Williamsburg Investment Trust (the “Trust”), an open-end management investment company registered under the Investment Company Act of 1940, as amended (the “1940 Act”). The Trust was organized as a Massachusetts business trust on July 18, 1988. Other series of the Trust are not included in this report.
The investment objective of the Fund is long-term growth of capital.
2. Significant Accounting Policies
The following is a summary of the Fund’s significant accounting policies. These policies are in conformity with accounting principles generally accepted in the United States of America (“GAAP”). The Fund follows accounting and reporting guidance under Financial Accounting Standards Board Accounting Standards Codification Topic 946, “Financial Services – Investment Companies.”
Securities valuation — The Fund’s portfolio securities are valued as of the close of business of the regular session of the New York Stock Exchange (normally 4:00 p.m., Eastern time). Securities traded on a national stock exchange, including common stocks and exchange-traded funds (“ETFs”), are generally valued based upon the closing price on the principal exchange where the security is traded, if available, otherwise, at the last quoted bid price. Securities that are quoted by NASDAQ are valued at the NASDAQ Official Closing Price. Investments representing shares of other open-end investment companies, other than ETFs but including money market funds, are valued at their net asset value (“NAV”) as reported by such companies. When using a quoted price and when the market is considered active, securities will be classified as Level 1 within the fair value hierarchy (see below).
When market quotations are not readily available, if a pricing service cannot provide a price, or if the investment adviser believes the price received from the pricing service is not indicative of fair value, securities will be valued in good faith at fair value using methods consistent with procedures adopted by the Board of Trustees and will be classified as Level 2 or 3 within the fair value hierarchy, depending on the inputs used. Such methods of fair valuation may include, but are not limited to: multiple of earnings, multiple of book value, discount from market of a similar freely traded security, purchase price of the security, subsequent private transactions in the security or related securities, or a combination of these and other factors.
GAAP establishes a single authoritative definition of fair value, sets out a framework for measuring fair value and requires additional disclosures about fair value measurements.
Various inputs are used in determining the value of the Fund’s investments. These inputs are summarized in the three broad levels listed below:
| ● | Level 1 – quoted prices in active markets for identical securities |
| ● | Level 2 – other significant observable inputs |
| ● | Level 3 – significant unobservable inputs |
| THE JAMESTOWN EQUITY FUND |
| NOTES TO FINANCIAL STATEMENTS (Continued) |
The inputs or methodology used for valuing securities are not necessarily an indication of the risks associated with investing in those securities. The inputs used to measure fair value may fall into different levels of the fair value hierarchy. In such cases, for disclosure purposes, the level in the fair value hierarchy within which the fair value measurement falls in its entirety is determined based on the lowest level input that is significant to the fair value measurement.
The following is a summary of the Fund’s investments based on the inputs used to value the investments as of September 30, 2022, by security type:
| | | Level 1 | | | Level 2 | | | Level 3 | | | Total | |
| Common Stocks | | $ | 31,901,884 | | | $ | — | | | $ | — | | | $ | 31,901,884 | |
| Exchange-Traded Funds | | | 2,826,400 | | | | — | | | | — | | | | 2,826,400 | |
| Money Market Funds | | | 3,948,871 | | | | — | | | | — | | | | 3,948,871 | |
| Total | | $ | 38,677,155 | | | $ | — | | | $ | — | | | $ | 38,677,155 | |
| | | | | | | | | | | | | | | | | |
Refer to the Fund’s Schedule of Investments for a listing of the common stocks by sector type. There were no Level 3 securities or derivative instruments held by the Fund as of or during the six months ended September 30, 2022.
Share valuation — The NAV per share of the Fund is calculated daily by dividing the total value of its assets, less liabilities, by the number of shares outstanding. The offering price and redemption price per share of the Fund is equal to the NAV per share.
Investment income — Dividend income is recorded on the ex-dividend date. Non-cash dividends included in dividend income, if any, are recorded at the fair market value of the security received. Withholding taxes on foreign dividends received by the Fund, if any, have been recorded in accordance with the Trust’s understanding of the applicable country’s rules and tax rates.
Distributions to shareholders — Dividends arising from net investment income, if any, are declared and paid quarterly to shareholders of the Fund. Net realized short-term capital gains, if any, may be distributed throughout the year and net realized long-term capital gains, if any, are distributed at least once each year. The amount of distributions from net investment income and net realized capital gains are determined in accordance with federal income tax regulations, which may differ from GAAP. Dividends and distributions are recorded on the ex-dividend date.
The tax character of distributions paid during the periods ended September 30, 2022 and March 31, 2022 was as follows:
| Periods | | Ordinary | | | Long-Term | | | Total | |
| Ended | | Income | | | Capital Gains | | | Distributions | |
| 9/30/2022 | | $ | 234,405 | | | $ | 3,074,089 | | | $ | 3,308,494 | |
| 3/31/2022 | | $ | 288,603 | | | $ | 1,746,016 | | | $ | 2,034,619 | |
Investment transactions — Investment transactions are accounted for on trade date for financial reporting purposes. Realized gains and losses on investment securities sold are determined on a specific identification basis.
| THE JAMESTOWN EQUITY FUND |
| NOTES TO FINANCIAL STATEMENTS (Continued) |
Common expenses — Common expenses of the Trust are allocated among the series of the Trust based on relative net assets of each series or the nature of the services performed and the relative applicability to each series.
Estimates — The preparation of financial statements in conformity with GAAP requires management to make estimates and assumptions that affect the reported amounts of assets and liabilities and the disclosure of contingent assets and liabilities, each as of the date of the financial statements, and the reported amounts of increase (decrease) in net assets from operations during the reporting period. Actual results could differ from those estimates.
Federal income tax — The Fund has qualified and intends to continue to qualify as a regulated investment company under the Internal Revenue Code of 1986, as amended (the “Code”). Qualification generally will relieve the Fund of liability for federal income taxes to the extent 100% of its net investment income and net realized capital gains are distributed in accordance with the Code.
In order to avoid imposition of the excise tax applicable to regulated investment companies, it is also the Fund’s intention to declare as dividends in each calendar year at least 98% of its net investment income (earned during the calendar year) and 98.2% of its net realized capital gains (earned during the twelve months ended October 31) plus undistributed amounts from prior years.
The tax character of accumulated earnings at September 30, 2022 was as follows:
| Tax cost of investments | | $ | 21,813,851 | |
| Gross unrealized appreciation | | $ | 17,883,167 | |
| Gross unrealized depreciation | | | (1,019,863 | ) |
| Net unrealized appreciation | | | 16,863,304 | |
| Accumulated ordinary income | | | 913 | |
| Other gains | | | 2,196,420 | |
| Distributions payable | | | (1,769 | ) |
| Accumulated earnings | | $ | 19,058,868 | |
| | | | | |
The difference between the federal income tax cost of investments and the financial statement cost of investments for the Fund is due to certain timing differences in the recognition of capital gains or losses under income tax regulations and GAAP. These “book/tax” differences are temporary in nature and are primarily due to the tax deferral of losses on wash sales.
The Fund recognizes the tax benefits or expenses of uncertain tax positions only when the position is “more likely than not” to be sustained assuming examination by tax authorities. Management has reviewed the tax positions taken on Federal income tax returns for the current and all open tax years (generally three years) of the Fund and has concluded that no provision for unrecognized tax benefits or expenses is required in these financial statements.
| THE JAMESTOWN EQUITY FUND |
| NOTES TO FINANCIAL STATEMENTS (Continued) |
3. Investment Transactions
Investment transactions, other than short-term investments and U.S. government securities, were as follows for the six months ended September 30, 2022:
| | | | |
| Purchase of investment securities | | $ | 504,336 | |
| Proceeds from sales of investment securities | | $ | 5,000,789 | |
| | | | | |
4. Transactions with Related Parties
INVESTMENT ADVISORY AGREEMENT
The Fund’s investments are managed by Lowe, Brockenbrough & Company, Inc., d/b/a Brockenbrough (the “Adviser”) under the terms of an Investment Advisory Agreement. The Fund pays the Adviser a fee, which is computed and accrued daily and paid monthly, at annual rates of 0.65% of its average daily net assets up to $500 million and 0.55% of such assets in excess of $500 million. Certain officers of the Trust are also officers of the Adviser.
During the six months ended September 30, 2022, the Adviser voluntarily limited the total annual operating expenses of the Fund to 0.95% of average daily net assets; accordingly, the Adviser voluntarily waived $16,314 of its investment advisory fees during the six months ended September 30, 2022. This amount is not subject to recapture in future periods.
OTHER SERVICE PROVIDERS
Ultimus Fund Solutions, LLC (“Ultimus”) provides administration, fund accounting, compliance and transfer agent services to the Fund. The Fund pays Ultimus fees in accordance with the agreements for such services. In addition, the Fund pays out-of-pocket expenses including, but not limited to, postage, supplies, and certain costs related to the pricing of the Fund’s portfolio securities. Certain officers of the Trust are also officers of Ultimus, or of Ultimus Fund Distributors, LLC (the “Distributor”), the principal underwriter of the Fund and an affiliate of Ultimus. The Distributor is compensated by the Adviser (not the Fund) for acting as principal underwriter.
SHAREHOLDER SERVICING PLAN
The Fund has adopted a Shareholder Servicing Plan (the “Plan”), which allows the Fund to make payments to financial organizations (including payments directly to the Adviser and the distributor) for providing account administration and account maintenance services to Fund shareholders. The annual service fee may not exceed an amount equal to 0.25% of the Fund’s average daily net assets. During the six months ended September 30, 2022, the incurred fees of $2,230 under the Plan.
COMPENSATION OF TRUSTEES
Trustees and officers affiliated with the Adviser or Ultimus are not compensated by the Trust for their services. Each Trustee who is not an affiliated person of the Adviser or Ultimus receives from the Trust an annual retainer of $30,000, payable quarterly; a fee of $2,000 for attendance at each meeting of the Board of Trustees (except that such fee is $3,000 for the independent chair);
| THE JAMESTOWN EQUITY FUND |
| NOTES TO FINANCIAL STATEMENTS (Continued) |
and a fee of $1,000 for attendance at each meeting of any committee of the Board (except that such fee is $1,500 for the committee chair); plus reimbursement of travel and other expenses incurred in attending meetings. Each series of the Trust pays its proportionate share of such fees.
5. Sector Risk
If a Fund has significant investments in the securities of issuers in industries within a particular business sector, any development affecting that sector will have a greater impact on the value of the net assets of the Fund than would be the case if the Fund did not have significant investments in that sector. In addition, this may increase the risk of loss of an investment in the Fund and increase the volatility of the Fund’s NAV per share. From time to time, circumstances may affect a particular sector and companies within such sector. For instance, economic or market factors, regulation or deregulation, or other developments may negatively impact all companies in a particular sector and therefore the value of a Fund’s portfolio would be adversely affected. As of September 30, 2022, The Jamestown Equity Fund had 23.4% of the value of its net assets invested in common stocks and ETFs within the Technology sector.
6. Contingencies and Commitments
The Fund indemnifies the Trust’s officers and Trustees for certain liabilities that might arise from the performance of their duties to the Fund. Additionally, in the normal course of business the Fund enters into contracts that contain a variety of representations and warranties and which provide general indemnifications. The Fund’s maximum exposure under these arrangements is unknown, as this would involve future claims that may be made against the Fund that have not yet occurred. However, based on experience, the Trust expects the risk of loss to be remote.
7. Subsequent Events
The Fund is required to recognize in the financial statements the effects of all subsequent events that provide additional evidence about conditions that existed as of the date of the Statement of Assets and Liabilities. For non-recognized subsequent events that must be disclosed to keep the financial statements from being misleading, the Fund is required to disclose the nature of the event as well as an estimate of its financial effect, or a statement that such an estimate cannot be made. Management has evaluated subsequent events through the issuance of these financial statements and has noted no such events.
| THE JAMESTOWN EQUITY FUND |
| ABOUT YOUR FUND’S EXPENSES (Unaudited) |
We believe it is important for you to understand the impact of costs on your investment. All mutual funds have operating expenses. As a shareholder of the Fund, you incur ongoing costs, including management fees and other expenses. The following examples are intended to help you understand your ongoing costs (in dollars) of investing in the Fund and to compare these costs with the ongoing costs of investing in other mutual funds.
A mutual fund’s ongoing costs are expressed as a percentage of its average net assets. This figure is known as the expense ratio. The expenses in the table below are based on an investment of $1,000 made at the beginning of the period shown and held for the entire period (April 1, 2022 through September 30, 2022).
The table below illustrates the Fund’s costs in two ways:
Actual fund return – This section helps you to estimate the actual expenses that you paid over the period. The “Ending Account Value” shown is derived from the Fund’s actual return, and the fourth column shows the dollar amount of operating expenses that would have been paid by an investor who started with $1,000 in the Fund. You may use the information here, together with the amount you invested, to estimate the expenses that you paid over the period.
To do so, simply divide your account value by $1,000 (for example, an $8,600 account value divided by $1,000 = 8.6), then multiply the result by the number given for the Fund under the heading “Expenses Paid During Period.”
Hypothetical 5% return – This section is intended to help you compare the Fund’s ongoing costs with those of other mutual funds. It assumes that the Fund had an annual return of 5% before expenses during the period shown, but that the expense ratio is unchanged. In this case, because the returns used are not the Fund’s actual returns, the results do not apply to your investment. The example is useful in making comparisons because the U.S. Securities and Exchange Commission (the “SEC”) requires all mutual funds to calculate expenses based on a 5% return. You can assess the Fund’s ongoing costs by comparing this hypothetical example with the hypothetical examples that appear in shareholder reports of other funds.
Note that expenses shown in the table are meant to highlight and help you compare ongoing costs only. The Fund does not charge sales loads or redemption fees.
The calculations assume no shares were bought or sold during the period. Your actual costs may have been higher or lower, depending on the amount of your investment and the timing of any purchases or redemptions.
More information about the Fund’s expenses, including annual expense ratios for the prior five fiscal years, can be found in this report. For additional information on operating expenses and other shareholder costs, please refer to the Fund’s prospectus.
| THE JAMESTOWN EQUITY FUND |
| ABOUT YOUR FUND’S EXPENSES (Unaudited) (Continued) |
| | | | | Ending | | | | |
| | | Beginning | | Account Value | | Net | | Expenses |
| | | Account Value | | September 30, | | Expense | | Paid During |
| | | April 1, 2022 | | 2022 | | Ratio(a) | | Period(b) |
| Based on Actual Fund Return | | $1,000.00 | | $ 813.80 | | 0.95% | | $4.32 |
| Based on Hypothetical 5% Return (before expenses) | | $1,000.00 | | $1,020.31 | | 0.95% | | $4.81 |
| (a) | Annualized, based on the Fund’s most recent one-half year expenses. |
| (b) | Expenses are equal to the Fund’s annualized net expense ratio multiplied by the average account value over the period, multiplied by 183/365 (to reflect the one-half year period). |
| OTHER INFORMATION (Unaudited) |
A description of the policies and procedures that the Fund uses to vote proxies relating to portfolio securities is available without charge upon request by calling toll-free 1-866-738-1126, or on the SEC’s website at www.sec.gov. Information regarding how the Fund voted proxies relating to portfolio securities during the most recent 12-month period ended June 30 is also available without charge upon request by calling toll-free 1-866-738-1126, or on the SEC’s website at www.sec.gov.
The Trust files a complete listing of portfolio holdings of the Fund with the SEC as of the end of the first and third quarters of each fiscal year as an exhibit to its reports on Form N-PORT. The filings are available upon request, by calling 1-866-738-1126. Furthermore, you may obtain a copy of these filings on the SEC’s website at www.sec.gov and on the Fund’s website www.jamestownfunds.com.
| THE JAMESTOWN EQUITY FUND |
| LIQUIDITY RISK MANAGEMENT PROGRAM (Unaudited) |
The Fund has adopted and implemented a written liquidity risk management program as required by Rule 22e-4 (the “Liquidity Rule”) under the Investment Company Act. The program is reasonably designed to assess and manage the Fund’s liquidity risk, taking into consideration, among other factors, the Fund’s investment strategy and the liquidity of its portfolio investments during normal and reasonably foreseeable stressed conditions; its short and long-term cash flow projections; and its cash holdings and access to other funding sources. The Fund’s Board of Trustees approved the appointment of a Liquidity Risk Committee, which includes representatives from Lowe, Brockenbrough & Company, Inc., d/b/a Brockenbrough, the Fund’s investment adviser, and Ultimus Fund Solutions, LLC, the Fund’s Administrator. The Liquidity Risk Committee is responsible for the program’s administration and oversight and for reporting to the Board on at least an annual basis regarding the program’s operation and effectiveness. The Liquidity Risk Committee updated its assessment of the Fund’s liquidity risk profile, considering additional data gathered in the 12 months ended May 31, 2022 and the adequacy and effectiveness of the liquidity risk management program’s operations from June 1, 2021 through May 31, 2022 (the “Review Period”) in order to prepare a written report for the Board of Trustees (the “Report”) for consideration at its meeting held on August 16, 2022. During the Review Period, the Fund did not experience unusual stress or disruption to its operations related to purchase and redemption activity. Also, during the Review Period the Fund held adequate levels of cash and highly liquid investments to meet shareholder redemption activities in accordance with applicable requirements. The Report concluded that (i) the Fund’s liquidity risk management program is reasonably designed to prevent violations of the Liquidity Rule and (ii) the Fund’s liquidity risk management program has been effectively implemented.
This page intentionally left blank.
This page intentionally left blank.
This page intentionally left blank.
| | | | | | |
| | | | | | |
| | | | | | |
| | | | | | |
| | | | | | |
| | | | | | |
| | | | THE JAMESTOWN EQUITY FUND | | |
| | | | | | |
| | | | www.jamestownfunds.com | | |
| | | | | | |
| | | | Investment Adviser | | |
| | | | Lowe, Brockenbrough & Company, Inc. | | |
| | | | d/b/a Brockenbrough | | |
| | | | 1802 Bayberry Court | | |
| | | | Suite 400 | | |
| | | | Richmond, Virginia 23226 | | |
| | | | | | |
| | | | Administrator | | |
| | | | Ultimus Fund Solutions, LLC | | |
| | | | P.O. Box 46707 | | |
| | | | Cincinnati, Ohio 45246-0707 | | |
| | | | (Toll-Free) 1-866-738-1126 | | |
| | | | | | |
| | | | Independent Registered | | |
| | | | Public Accounting Firm | | |
| | | | Cohen & Company, Ltd. | | |
| | | | 342 N. Water Street | | |
| | | | Suite 830 | | |
| | | | Milwaukee, Wisconsin 53202 | | |
| | | | | | |
| | | | Legal Counsel | | |
| | | | Sullivan & Worcester LLP | | |
| | | | 1666 K Street, N.W. | | |
| | | | Washington, DC 20006 | | |
| | | | | | |
| | | | Board of Trustees | | |
| | | | John P. Ackerly, IV | | |
| | | | John T. Bruce | | |
| | | | George K. Jennison | | |
| | | | Robert S. Harris, Ph.D. | | |
| | | | Harris V. Morrissette | | |
| | | | Elizabeth W. Robertson | | |
| | | | | | |
| | | | | | |
| | | | | | |
| | | | | | |
| | | | | | |
| | | | | | |
| | | | | | |
| | | | Jamestown-SAR-22 | | |
| | | | | | |
| | | | | | |
| | | | | | |
| | | | | | |
(b) Not applicable
Not required
| Item 3. | Audit Committee Financial Expert. |
Not required
| Item 4. | Principal Accountant Fees and Services. |
Not required
| Item 5. | Audit Committee of Listed Registrants. |
Not applicable
| Item 6. | Schedule of Investments. |
| (a) | Schedule filed with Item 1 |
| Item 7. | Disclosure of Proxy Voting Policies and Procedures for Closed-End Management Investment Companies. |
Not applicable
| Item 8. | Portfolio Managers of Closed-End Management Investment Companies. |
Not applicable
| Item 9. | Purchases of Equity Securities by Closed-End Management Investment Company and Affiliated Purchasers. |
Not applicable
| Item 10. | Submission of Matters to a Vote of Security Holders. |
The registrant’s Governance, Nominating, Compensation and QLCC Committee shall review shareholder recommendations to fill vacancies on the registrant’s board of trustees if such recommendations are submitted in writing, addressed to the Committee at the registrant’s offices and meet any minimum qualifications adopted by the Committee. The Committee may adopt, by resolution, a policy regarding its procedures for considering candidates for the board of trustees, including any recommended by shareholders.
| Item 11. | Controls and Procedures. |
(a) Based on their evaluation of the registrant’s disclosure controls and procedures (as defined in Rule 30a-3(c) under the Investment Company Act of 1940) as of a date within 90 days of the filing date of this report, the registrant’s principal executive officers and principal financial officer have concluded that such disclosure controls and procedures are reasonably designed and are operating effectively to ensure that material information relating to the registrant, including its consolidated subsidiaries, is made known to them by others within those entities, particularly during the period in which this report is being prepared, and that the information required in filings on Form N-CSR is recorded, processed, summarized, and reported on a timely basis.
(b) There were no changes in the registrant’s internal control over financial reporting (as defined in Rule 30a-3(d) under the Investment Company Act of 1940) that occurred during the period covered by this report that have materially affected, or are reasonably likely to materially affect, the registrant’s internal control over financial reporting.
| Item 12. | Disclosure of Securities Lending Activities for Closed-End Management Investment Companies. |
Not applicable
File the exhibits listed below as part of this Form. Letter or number the exhibits in the sequence indicated.
(a)(1) Any code of ethics, or amendment thereto, that is the subject of the disclosure required by Item 2, to the extent that the registrant intends to satisfy the Item 2 requirements through filing of an exhibit: Not required
(a)(2) A separate certification for each principal executive officer and principal financial officer of the registrant as required by Rule 30a-2(a) under the Act (17 CFR 270.30a-2(a)): Attached hereto
(a)(3) Any written solicitation to purchase securities under Rule 23c-1 under the Act (17 CFR 270.23c-1) sent or given during the period covered by the report by or on behalf of the registrant to 10 or more persons: Not applicable
(a)(4) Change in the registrant’s independent public accountants: Not applicable
(b) Certifications required by Rule 30a-2(b) under the Act (17 CFR 270.30a-2(b)): Attached hereto
Exhibit 99.CERT Certifications required by Rule 30a-2(a) under the Act
Exhibit 99.906CERT Certifications required by Rule 30a-2(b) under the Act
SIGNATURES
Pursuant to the requirements of the Securities Exchange Act of 1934 and the Investment Company Act of 1940, the registrant has duly caused this report to be signed on its behalf by the undersigned, thereunto duly authorized.
| (Registrant) | Williamsburg Investment Trust | | |
| | | | |
| By (Signature and Title)* | /s/ David James | |
| | | David James, Secretary | |
| | | | |
| Date | November 28, 2022 | | |
| | | | |
| Pursuant to the requirements of the Securities Exchange Act of 1934 and the Investment Company Act of 1940, this report has been signed below by the following persons on behalf of the registrant and in the capacities and on the dates indicated. |
| | | | |
| By (Signature and Title)* | /s/ John T. Bruce | |
| | | John T. Bruce, President | |
| | | (Cantor FBP Equity & Dividend Plus Fund and Cantor FBP Appreciation & Income Opportunities Fund) | |
| | | | |
| Date | November 28, 2022 | | |
| | | | |
| By (Signature and Title)* | /s/ Thomas W. Leavell | |
| | | Thomas W. Leavell, President | |
| | | (The Government Street Equity Fund and The Government Street Opportunities Fund) | |
| | | | |
| Date | November 28, 2022 | | |
| | | | |
| By (Signature and Title)* | /s/ Charles M. Caravati III | |
| | | Charles M. Caravati III, President | |
| | | (The Jamestown Equity Fund) | |
| | | | |
| Date | November 28, 2022 | | |
| | | | |
| By (Signature and Title)* | /s/ John P. Ackerly IV | |
| | | John P. Ackerly IV, President | |
| | | (The Davenport Core Fund, Davenport Value & Income Fund, Davenport Equity Opportunities Fund, Davenport Small Cap Focus Fund and the Davenport Balanced Income Fund) | |
| | | | |
| Date | November 28, 2022 | | |
| | | | |
| By (Signature and Title)* | /s/ Mark J. Seger | |
| | | Mark J. Seger, Treasurer and Principal Financial Officer | |
| | | | |
| Date | November 28, 2022 | | |
* Print the name and title of each signing officer under his or her signature.