| OMB APPROVAL |
OMB Number: 3235-0570 Expires: August 31, 2020 Estimated average burden hours per response: 20.6 |
UNITED STATES
SECURITIES AND EXCHANGE COMMISSION
Washington, D.C. 20549
FORM N-CSR
CERTIFIED SHAREHOLDER REPORT OF REGISTERED
MANAGEMENT INVESTMENT COMPANIES
| Investment Company Act file number | 811-05685 | |
| Williamsburg Investment Trust |
| (Exact name of registrant as specified in charter) |
| 225 Pictoria Drive, Suite 450 Cincinnati, Ohio | 45246 |
| (Address of principal executive offices) | (Zip code) |
John Chilton, Esq.
| Sullivan & Worcester LLP 1666 K Street, NW Washington, D.C. 20006 |
| (Name and address of agent for service) |
| Registrant's telephone number, including area code: | (513) 587-3400 | |
| Date of fiscal year end: | March 31 | |
| | | |
| Date of reporting period: | September 30, 2019 | |
Form N-CSR is to be used by management investment companies to file reports with the Commission not later than 10 days after the transmission to stockholders of any report that is required to be transmitted to stockholders under Rule 30e-1 under the Investment Company Act of 1940 (17 CFR 270.30e-1). The Commission may use the information provided on Form N-CSR in its regulatory, disclosure review, inspection, and policymaking roles.
A registrant is required to disclose the information specified by Form N-CSR, and the Commission will make this information public. A registrant is not required to respond to the collection of information contained in Form N-CSR unless the Form displays a currently valid Office of Management and Budget ("OMB") control number. Please direct comments concerning the accuracy of the information collection burden estimate and any suggestions for reducing the burden to the Secretary, Securities and Exchange Commission, 450 Fifth Street, NW, Washington, DC 20549-0609. The OMB has reviewed this collection of information under the clearance requirements of 44 U.S.C. § 3507.
| Item 1. | Reports to Stockholders. |
SEMI-ANNUAL REPORT
September 30, 2019
(Unaudited)
Beginning on January 1, 2021, as permitted by regulations adopted by the U.S. Securities and Exchange Commission, paper copies of the Funds’ shareholder reports like this one will no longer be sent by mail, unless you specifically request paper copies of the reports from the Funds or from your financial intermediary, such as a broker-dealer or bank. Instead, the reports will be made available on a website, and you will be notified by mail each time a report is posted and provided with a website link to access the report.
If you already elected to receive shareholder reports electronically, you will not be affected by this change and you need not take any action. You may elect to receive shareholder reports and other communications from the Funds electronically by contacting the Funds at 1-800-281-3217 or, if you own these shares through a financial intermediary, by contacting your financial intermediary.
You may elect to receive all future reports in paper free of charge. You can inform the Funds that you wish to continue receiving paper copies of your shareholder reports by contacting the Funds at 1-800-281-3217. If you own shares through a financial intermediary, you may contact your financial intermediary or follow instructions included with this document to elect to continue to receive paper copies of your shareholder reports. Your election to receive reports in paper will apply to all Funds held with the Fund complex or at your financial intermediary.
THE DAVENPORT FUNDS
LETTER TO SHAREHOLDERS | November 6, 2019 |
Dear Shareholders,
Equity investors experienced a wild ride in the third quarter. After a solid start in July, we witnessed a sharp swoon in August as trade tensions again took center stage. The S&P 500® Index posted declines of nearly 3% on August 5th and August 14th as volatility surged. Fortunately, the damage was mitigated by a late August rally followed by a decent September. In the end, the S&P 500 Index finished the quarter up 1.70% while the Russell 2000® Index was down 2.40%. Year-to-date, the S&P 500 Index and Russell 2000 Index finished the period up 20.55% and 14.18%, respectively.
All of our Funds outperformed their benchmarks during the quarter. While one month typically isn’t worth highlighting, we are also pleased to report our Funds again held up better than their benchmarks in August during market tumult (the same held true during periods of volatility in May). While we never enjoy pullbacks, we do strive to demonstrate less risk than the broader market. On a year-to-date basis, three of our strategies are nicely outperforming their benchmarks, while the other two are lagging.
Slowing economic growth, an intensifying trade war, a partially inverted yield curve and negative interest rates in many parts of the world seem to be suggesting deflationary pressures and/or rising chances of a recession. According to the Wall Street Journal, a recent survey of economists put the odds of a recession at 35%. True to form, the media has latched onto recent volatility to double down on calls for bad outcomes. It often seems the greatest risk is talking ourselves into a recession. For the moment, economic growth actually remains decent as evidenced by 2.0% GDP growth in Q2 and calls for 1.9% growth in Q3.
Economic worries and falling long-term interest rates have renewed pressure on the Federal Reserve (the “Fed”) to lower short-term rates. Indeed, the Fed lowered rates 0.25% at its September meeting and most economists expect one more rate reduction by year end. “Easy” policy could provide support to equities, although we note the Fed has less room than in prior easing cycles. The current fed funds rate is 2% as opposed to 5-6% at the beginning of the last two easing cycles. Put differently, the efficacy of monetary easing may be exhausted at some point.
Then there’s the “TINA” argument. In other words, “there is no alternative” to stocks and other risk assets if looking for decent returns in a world of ultra-low interest rates. Most would certainly rather borrow money than lend it in this cheap money environment. True, low rates should support equity valuations and the market’s current forward price-to-earnings ratio of 16.9x (or an earnings yield of 5.9%) actually looks reasonable in the context of 10-year Treasury rates at 1.7%. However, this argument breaks down if rates are low because they portend a recession.
Where do these contradictory signals leave us? We have no idea what the near term holds and expect trade talks and political chicanery may induce periodic volatility, but we are sticking by our case for more moderate returns in coming years. This seems to be in the early stages of coming to fruition. While markets are up nicely year-to-date, they are essentially flat over the past year.
This type of environment should play to our strengths. We think stock selection could become more critical. At this point in the cycle, being valuation sensitive and watching out for high risk situations may matter more than it has for much of this decade. We are seeing indications of this, as the red-hot initial public offering (IPO) market of Q2 cooled significantly in Q3.
1
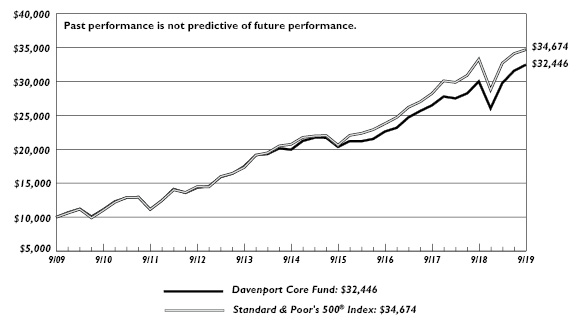
Davenport Core Fund
The following chart represents Davenport Core Fund’s (DAVPX) performance and the performance of the S&P 500 Index*, the Core Fund’s primary benchmark, for the periods ended September 30, 2019.
| Q3
2019 | 1 Year | 3 Years** | 5 Years** | 10 Years** | Since
Inception
1/15/98** | Fiscal
Year 2019
Expense
Ratio |
Core Fund | 2.80% | 8.17% | 12.78% | 10.22% | 12.49% | 7.13% | 0.89% |
S&P 500 Index* | 1.70% | 4.25% | 13.39% | 10.84% | 13.24% | 7.41% | |
30-Day SEC Yield: 0.32%; Expense Ratio in current prospectus: 0.89%
Past performance is no guarantee of future results. Investment return and principal value of an investment will fluctuate so that an investor’s shares, when redeemed, may be worth more or less than their original cost. Current performance may be lower or higher than the performance data quoted. Performance data, current to the most recent month end, may be obtained by calling 1-800-281-3217.
* | The S&P 500 Index is comprised of 500 U.S. stocks and is an indicator of the performance of the overall U.S. stock market. Standard & Poor’s Financial Services LLC, a division of S&P Global, is the source and owner of the registered trademarks related to the S&P 500 Index. An investor cannot invest in an index and its returns are not indicative of the performance of any specific investment. |
** | Returns greater than one year are annualized. |
The Davenport Core Fund (DAVPX) posted another strong quarter in Q3, building on the first half of the year’s strength. The Core Fund returned 2.80%, ahead of the S&P 500® Index’s 1.70% advance. Year-to-date, DAVPX is up 24.63%, versus 20.55% for the S&P 500 Index.
Solid outperformance was driven by individual stock selection. Sherwin-Williams Co. (SHW), Martin Marietta Materials, Inc. (MLM), CVS Health Corp. (CVS), American Tower Corp. (AMT), Brookfield Asset Management, Inc. (BAM) and Markel Corp. (MKL) were all standout performers for us. It was also nice to see a name that we highlighted last quarter, Marathon Petroleum Corp. (MPC), catch a bid as a prominent investor called for a breakup to realize its sum-of-the-parts value. Our underweight stance in the Utilities sector was a drag as defensive stocks continue to perform well, amidst lower interest rates and signs of slowing global growth.
In the banking sector, we sold our position in Citigroup, Inc. (C) and added to our position in JPMorgan Chase & Co. (JPM), in an effort to increase the quality of the Fund. We also purchased two new positions: TJX Companies, Inc. (TJX) and Charles Schwab Corp. (SCHW).
TJX is a leading off-price retailer of clothing, accessories, and home fashions with 4,300 stores under the T.J. Maxx, Marshalls, and HomeGoods brands. We believe that the company will continue to be a winner in the changing retail landscape as customers love bargains and the “treasure hunt” experience at the company’s stores, driving market share gains. TJX leverages an extensive merchandising operation and proprietary inventory management system to maintain a rapidly changing product assortment at significant discounts across its banners. The company has posted positive same store sales growth for 23 consecutive years (only one down year in its 40+ year history) and has ample opportunity to continue to expand its store base. We also believe the stock is somewhat counter cyclical as consumers typically trade down to discount stores in
2
recessions. TJX trades at ~20x forward EPS, slightly above its 5-year average. While we don’t anticipate multiple expansion from here, we believe that the company will continue to compound earnings at a double-digit pace for the foreseeable future. The company has an A+-rated balance sheet and has grown its dividend at a 22% rate over the past five years to a current yield of 1.7%.
Schwab is a multifaceted financial services company in the U.S. with ~$3.5 trillion in total client assets. Lower short-term interest rates have weighed on the stock, and we think have presented an attractive buying opportunity. Organic growth remains strong (more than 100K new accounts have been opened for 28 consecutive months) and capital return is becoming a more important part of the story. The Board has recently taken actions on both the dividend (31% hike, current yield 1.8%) and buyback fronts ($4.0B authorization in January or 8% of current market cap). The current valuation of 14.5x forward EPS is at trough levels over the last two decades and is seven multiple points below its 5-year average of 22.0x. This valuation looks quite attractive considering SCHW’s A-rated balance sheet and 20% returns on equity. Recently, an announcement to eliminate commissions for U.S. ETFs and equities has pressured shares, highlighting the competitive nature of the industry. This should cause revenues to drop by 3-4%. Nevertheless, we view this business as a scale game, and with SCHW’s dominance, we suspect they will be able to regain some of this revenue over time through less visible fee streams and a growing asset base.
In sum, we remain pleased with the Fund’s performance year-to-date and over the past trailing twelve months (which encompasses the aggressive 4Q18 market selloff). We continue to hold a modestly elevated cash balance at 5% of the Fund. We believe the actions taken this quarter are consistent with our aim of continuously improving the Fund’s risk/reward profile. We look forward to reporting back at year end.
The following are transactions performed in the Core Fund for the quarter ended September 30, 2019.
Recent Purchases
Charles Schwab Corporation (SCHW) The prospects for lower short-term interest rates and the recent decline in long-term yields have weighed on the stock and we think have presented an attractive buying opportunity.
JPMorgan Chase & Co. (JPM)JPM offered one of the biggest positive surprises relative to consensus payout expectations. They are a stalwart in the banking industry, with leading investment bank, commercial bank, credit card, retail bank, and asset/wealth management franchises. Thus, we feel the risk/reward profile is favorable and see tremendous value in the company’s capital returns.
TJX Companies, Inc. (TJX)We expect the company to be a winner in the changing retail landscape. We believe the stock is somewhat counter cyclical as consumers typically trade down to discount stores in recessions, thus believing the company may compound earnings at a double-digit pace for the near future.
Recent Sales
Citigroup, Inc. (C) Citi has been a strong performer this year and continues to offer attractive capital returns following the recent Comprehensive Capital Analysis and Review (CCAR) results. Proceeds from the sale are being redeployed into two more growth-oriented issues.
3
Halliburton Company (HAL)We had forecasted that U.S. oil production would rebound from depressed levels last winter. Instead, oil prices have continued to languish and producers have continued to drop rigs, focusing on free cash flow. We find it difficult to see a path of sustained improvement for the oil services sector.
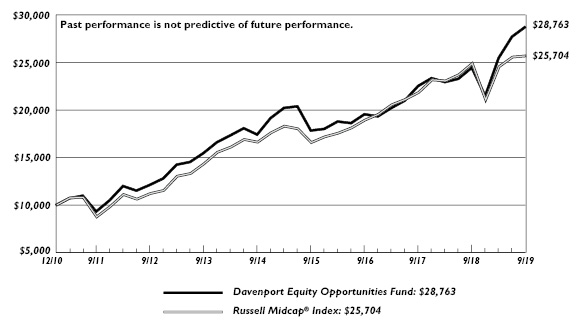
Davenport Equity Opportunities Fund
The following chart represents Davenport Equity Opportunities Fund (DEOPX) performance and the performance of the Russell Midcap® Index*, the Fund’s primary benchmark, and the S&P 500 Index* for the periods ended September 30, 2019.
| Q3
2019 | 1 Year | 3 Years** | 5 Years** | Since
Inception
12/31/10** | Fiscal
Year 2019
Expense
Ratio |
Equity Opportunities Fund | 3.75% | 17.60% | 13.72% | 10.54% | 12.84% | 0.91% |
Russell Midcap Index | 0.48% | 3.19% | 10.69% | 9.10% | 11.40% | |
S&P 500 Index* | 1.70% | 4.25% | 13.39% | 10.84% | 12.68% | |
30-Day SEC Yield: -0.19%; Expense Ratio in current prospectus: 0.91%
Past performance is no guarantee of future results. Investment return and principal value of an investment will fluctuate so that an investor’s shares, when redeemed, may be worth more or less than their original cost. Current performance may be lower or higher than the performance data quoted. Performance data, current to the most recent month end, may be obtained by calling 1-800-281-3217.
* | The Russell Midcap® Index measures the performance of the 800 smallest companies in the Russell 1000, which represent approximately 25% of the total market capitalization of the Russell 1000®. Frank Russell Company is the source and owner of the trademarks, service marks, and copyrights related to the Russell Indexes. Russell® is a trademark of Frank Russell Company. The S&P 500 Index is comprised of 500 U.S. stocks and is an indicator of the performance of the overall U.S. stock market. Standard & Poor’s Financial Services LLC, a division of S&P Global, is the source and owner of the registered trademarks related to the S&P 500 Index. An investor cannot invest in an index and its returns are not indicative of the performance of any specific investment. |
** | Returns greater than one year are annualized. |
The Davenport Equity Opportunities Fund (DEOPX) showed continued solid performance during the third quarter, advancing 3.75% versus the 0.48% for the Russell Mid Cap® Index. Year-to-date, the Fund is up 33.86%, nicely outpacing the Russell Midcap’s® 21.93% advance.
The Fund’s top contributor for the quarter was Sherwin-Williams Co. (SHW), which advanced roughly 20% on the heels of better-than-expected results, driven by an inflection in the margin profile of the business. We are encouraged to see the company’s pricing efforts finally catch up to volatile raw material costs and remain optimistic regarding the Valspar integration and renewed balance sheet flexibility. Brookfield Asset Management, Inc. (BAM), American Tower Corp. (AMT) and Martin Marietta Materials, Inc. (MLM) were also top contributors during the quarter. Following a strong response to quarterly results, we elected to chip our position in MLM. While we remain attracted to the company’s competitive moat, pricing power and visible demand profile, the position had become outsized relative to a more balanced risk/reward profile.
4
Key detractors during the period included a few top performers from the first half of the year. Autodesk, Inc. (ADSK), DISH Network Corp. (DISH) and MercadoLibre, Inc. (MELI) all took a “breather.” In the case of MELI, we were fortunate to reduce our position slightly with the stock near all-time highs, thus softening the blow of a late quarter drawdown. As was the case last quarter, Fairfax Financial Holdings Ltd. (FRFHF) continued to struggle during the period. While frustrated with the stock’s performance, we added to the position given the belief that a discount to book value is unwarranted for a company that is generating positive underwriting results, has conservative investment posturing and has recently instituted a meaningful share repurchase program.
We added to our position in water infrastructure company Xylem, Inc. (XYL), during the quarter. We liken XYL to a water ETF given the company’s exposure across many parts of the water cycle with products such as pumps, valves, treatment and testing equipment, controls and systems, and metering equipment. This business mix leaves Xylem well positioned to help tackle global issues such as water scarcity and infrastructure inefficiencies. Put simply, the company is bringing technology to a historically conservative and slow-to-adapt industry in need of a significant technological overhaul. We believe XYL will deliver on targets of 4-6% annual organic growth and 200-300 bps of margin expansion. With roughly $3.5 billion available for capital deployment into activities such as acquisitions and buybacks, we believe earnings can compound in the mid-teens for the foreseeable future. This algorithm could result in ~$5.00+ in EPS power in coming years, which we believe should drive the stock price meaningfully higher.
We also bought a position in Etsy, Inc. (ETSY), an online marketplace focused on handmade or vintage items and craft supplies. Founded in 2004, Etsy has built up a platform of 40 million active buyers and 2 million active sellers. Consumers desire the unique, authentic goods found on Etsy’s marketplace, and Etsy also benefits from the multi-decade shift to e-commerce. Etsy went public in 2015 and struggled in the public markets for its first two years, leading to a management transition. New management has been well received as they were able to expand margins and reaccelerate growth. However, the stock recently pulled back as management laid out long-term growth targets that underwhelmed expectations. We think this presented an attractive buying opportunity and consider management targets to be conservative as 1) they imply a significant deceleration in growth, 2) they do not incorporate further take rate expansion (peers are in the 10-15% take-rate range vs. ETSY at 5% -- take rate refers to the royalty rate that Etsy charges for goods sold on its marketplace), and 3) management’s target of 30%+ EBITDA margins are well below the high-30%s margins that have been achieved by peers such as eBay, Inc. (EBAY). Marketplace business models generate excellent free cash flow (in excess of net income) and Etsy has a modest net cash position on the balance sheet. Etsy is on the path to becoming a consistent high quality compounder, and we think free cash flow growth could approach 50% per annum over the next several years.
In closing, we are happy to report strong absolute and relative returns while continuing to emphasize quality and capital preservation. Though we hope the next three quarters resemble the prior three, we continue to position the Fund for a more moderate return environment.
5
The following are transactions performed in the Equity Opportunities Fund for the quarter ended September 30, 2019.
Recent Purchases
Etsy, Inc. (ETSY)ETSY went public in 2015 and struggled in the public markets for its first two years, leading to a management transition. With new management, expanded margins and reaccelerated growth, the stock had a massive run in the subsequent two years but has pulled back approximately 25% from its highs earlier this year. We believe this pullback was a buying opportunity that has the potential to generate consistent compounding growth going forward.
Fairfax Financial Holdings Ltd. (FRFHF) At current levels, FRFHF trades right on top of the FactSet consensus Q2 book value per share estimate of $463. We feel this may limit downside given the conservative nature of both the valuation of investments. We appreciate the defensiveness the stock should exhibit should market conditions deteriorate.
O’Reilly Automotive, Inc. (ORLY)The company appears poised to enter a period of easier sales comparisons, more favorable driving conditions (i.e. lower gas prices) and a more favorable age profile of the car park (6-10 year old vehicles set to make up a greater percentage of vehicles on the road).
Watsco, Inc. (WSO)While the stock has rallied from lows to start the year, shares have weakened recently in response to Q2 results. We believe recent management commentary and market development provide support for optimism. With the stock trading at the lower end of its historical valuation range, and considering the company’s rock solid balance sheet and attractive dividend, we felt the risk/reward looked attractive.
Xylem, Inc. (XYL)With multiple adds to XYL this quarter, our rationale is supported by the following: XYL has been a good performer since our initial purchase in May 2017. More recently, the stock has traded sideways as the company pushed out their 2020 operating margin targets. The explanation was having more investment opportunities to improve and grow the business than they originally expected. With a plethora of mergers and acquisitions roll up opportunities, a strong management team, and a solid balance sheet, we decided to bulk up our position in the stock.
Recent Sales
American Woodmark Corporation (AMWD)The stock is up 48% year to date and up 14% since the recent low a little over a week ago. Moreover, given the lower liquidity profile of the stock, we elected to sell the position on strength and redeploy the Fund into more favorable opportunities.
Martin Marietta Materials, Inc. (MLM)Shares of MLM are making new highs following a very solid 2Q report where the company beat Street expectations and raised guidance for FY2019. We remain very optimistic about the near- and long-term outlook for MLM as demand across the company’s footprint is accelerating. We decided to take some profits while maintaining MLM as a top-10 position in the portfolio (4.6% of the portfolio).
MercadoLibre, Inc. (MELI)While we remain attracted to the company’s attractive business model, massive growth opportunity and accelerating alternative business channels (i.e. payments), we feel the current valuation reflects a more balanced risk/reward profile.
6
Zoetis, Inc. (ZTS)The stock is up nearly 150% since our initial purchase, having tacked on an additional 34% since we last trimmed the position in November of 2018. While we remain excited about the growth backdrop for the industry and the company’s leadership position within it, we feel the valuation warrants taking some profits at this time.
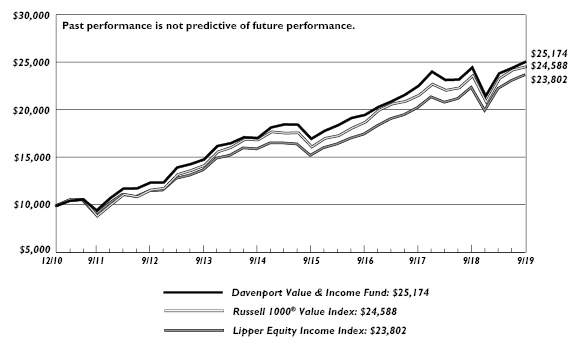
Davenport Value & Income Fund
The following chart represents Davenport Value & Income Fund (DVIPX) performance and the performance of the Russell 1000 Value Index*, the Value & Income Fund’s primary benchmark, the S&P 500 Index and the Lipper Equity Income Index for the periods ended September 30, 2019.
| Q3
2019 | 1 Year | 3 Years** | 5 Years** | Since
Inception
12/31/10** | Fiscal
Year 2019
Expense
Ratio |
Value & Income Fund | 2.63% | 2.52% | 8.76% | 8.00% | 11.13% | 0.88% |
Russell 1000 Value Index | 1.36% | 4.00% | 9.43% | 7.79% | 10.83% | |
S&P 500 Index* | 1.70% | 4.25% | 13.39% | 10.84% | 12.68% | |
Lipper Equity Income Index* | 2.58% | 5.88% | 10.66% | 8.26% | 10.42% | |
30-Day SEC Yield: 1.67%; Expense Ratio in current prospectus: 0.89%
Past performance is no guarantee of future results. Investment return and principal value of an investment will fluctuate so that an investor’s shares, when redeemed, may be worth more or less than their original cost. Current performance may be lower or higher than the performance data quoted. Performance data, current to the most recent month end, may be obtained by calling 1-800-281-3217.
* | The S&P 500 Index is comprised of 500 U.S. stocks and is an indicator of the performance of the overall U.S. stock market. Standard & Poor’s Financial Services LLC, a division of S&P Global, is the source and owner of the registered trademarks related to the S&P 500 Index. The Lipper Equity Income Index is an unmanaged index of the 30 largest Funds in the Lipper Equity Income Fund category. The Russell 1000® Value Index measures the performance of the Russell 1000 companies with lower price-to-book ratios and lower forecasted growth values. An investor cannot invest in an index and its returns are not indicative of the performance of any specific investment. |
** | Returns greater than one year are annualized. |
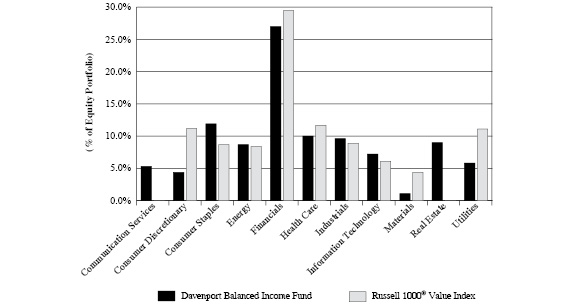
The Davenport Value & Income Fund (DVIPX) enjoyed a strong third quarter, increasing 2.63% and outperforming its primary benchmark, the Russell 1000® Value Index, which increased 1.36%. On a year-to-date basis, the Fund has increased 16.83% compared to the Russell 1000 Index, which has increased 17.81%. The S&P 500® Index increased 1.70% in the third quarter and is up 20.55% so far in 2019.
Health Care and Financial stocks were the key contributors to performance during the quarter. Our patience with Bristol-Myers Squibb Co. (BMY) and CVS Health Corp. (CVS) paid off as both stocks rallied nicely. BMY made progress towards closing its acquisition of Celgene Corp. (CELG) and CVS received welcome news from a federal judge that he would not block its acquisition of Aetna. Financials were led by stalwarts Brookfield Asset Management, Inc. (BAM) and Fidelity National Financial, Inc. (FNF), two of our larger positions. BAM continues to benefit from inflows into the alternative/real asset class and FNF was helped by lower mortgage rates, which stimulated refinancing and purchase demand.
7
Once again, our key detractors were an eclectic mix. Fairfax Financial Holdings Ltd. (FRFHF) continued to struggle but is trading at a discount to book value, which we think is too cheap given its solid insurance franchise and new share repurchase plan. Oil giant Royal Dutch Shell PLC (RDS.B) declined amid lower oil prices. Lastly, Johnson & Johnson (JNJ) declined as investor concerns over its potential liability in talc and opioid lawsuits increased. We think these risks are manageable for JNJ given its size and AAA-rated balance sheet.
In tandem with our expectation of more moderate returns going forward, our transactions were an effort to improve the defensive nature of the Fund and move capital from more growth-oriented situations to ideas where we saw long-term value opportunities at attractive prices. We chipped positions in Microsoft Corp. (MSFT) and Cisco Systems, Inc. (CSCO) and initiated a position in Wells Fargo & Co. (WFC). We also chipped Merck & Co., Inc. (MRK) and Citigroup, Inc. (C) and moved the proceeds into a new position in Berkshire Hathaway, Inc. (BRK.B).
Wells Fargo has been in the penalty box following various scandals that have led to multiple CEO departures. We felt the negative headlines were fully reflected in the stock price at less than 10x earnings and with a dividend yield close to 4.5%. We view WFC as an attractive long-term value situation based on the company’s strong balance sheet, impressive franchise, strong capital return and potential future profitability as it emerges from its current regulatory challenges. Subsequent to our purchase, WFC announced that it had hired Charlie Scharf as its new CEO. Mr. Scharf was a long-time veteran at JPMorgan Chase & Co. (JPM) and the stock reacted positively to the announcement given his past experience and general reputation within the industry.
Berkshire Hathaway has grown book value per share at a 9% compound annual growth rate (CAGR) over the past 20 years and this figure actually understates true economic returns, as it does not capture the growth in value of wholly-owned companies in Berkshire’s portfolio. Despite the solid returns, BRK.B’s price to book value has fallen to 1.25x, the low end of its multi-year range, which we believe could lead to an increase in share repurchases in the coming years. The company has an AA-rated balance sheet with $122 billion in cash. Given the balance sheet, excess free cash generation and track record of capital allocation in rougher economic times, we think BRK.B shares are likely to act defensively in a sustained market selloff. Ultimately, we see a lot of value in this diverse collection of businesses and don’t think the market is giving BRK.B enough credit from the optionality of all the excess cash sitting on the balance sheet and coming in the door.
In summary, we are pleased with the Fund’s performance during the third quarter, especially as it held up well during the dramatic market selloff in August. The Fund’s yield of 3.1% continues to provide attractive current income and we think recent transactions have improved the defensive characteristics of the Fund.
Recent Purchases
Berkshire Hathaway, Inc. (BRK.B) BRK.B does not pay a dividend. BRK’B has grown book value per share at a 9% compound annual growth rate over the past twenty years. We see a lot of value in this diverse collection of businesses and do not think the market is giving BRK.B enough credit for all the excess cash coming in the door.
Norfolk Southern Corporation (NSC)Norfolk Southern is one of a handful of Class I railroads in North America. The cost to move goods is substantially lower via rail than truck due to exponentially better efficiency. A strategy termed “Precision Railroading” by Hunter Harrison,
8
a deceased former railway executive, entails keeping the trains constantly moving and limiting time sitting in the yards, increasing efficiencies dramatically. This has resulted in a boost of profitability for the railroads who have adopted this strategy. Given the blueprint for this strategy has been laid out and executed multiple times at this point, and a similar asset base, we believe NSC will ultimately succeed in its shift to precision railroad.
Wells Fargo & Company (WFC) WFC has been in the penalty box following various scandals that have led to multiple CEO departures. We feel the negative headlines are fully reflected in the current stock price. Moreover, we believe the concern surrounding the potential for interest rate cuts factored into the current share price.
Recent Sales
Cisco Systems, Inc. (CSCO)CSCO has been a strong performer year-to-date, returning over 30%. With signs of tightening demand across the IT infrastructure universe and the name representing larger than typical portfolio weights, we elected to take some profits on the recent strength.
Citigroup, Inc. (C)Citigroup’s share price is flat over the past two years, as the lower interest rate environment weighs on profit potential, and economic challenges abroad have also posed an issue (roughly half of C’s revenues are outside North America).
Merck & Co, Inc. (MRK)MRK has been a standout performer for the portfolio over the past year and a half, as its immunoncology drug Keytruda has become a preferred method of treating lung cancer. In addition to rising sales, the price to earnings ratio has also expanded significantly.
Microsoft Corporation (MSFT)MSFT has been a strong performer year-to-date, returning over 35%. With signs of tightening demand across the IT infrastructure universe and the name representing larger than typical portfolio weights, we elected to take some profits on the recent strength.
PPG Industries, Inc (PPG)Absent an acceleration in global growth, we think upside from here would come from the company using its balance sheet by either committing to significant capital return, or pursuing large-scale mergers & acquisitions. We think this scenario could play out and ultimately elected to sell the position.
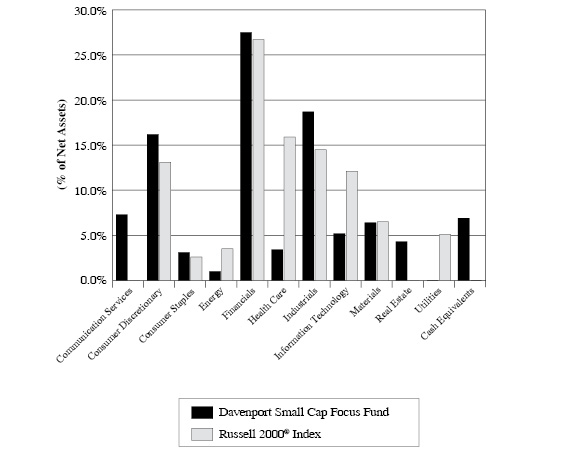
Davenport Small Cap Focus Fund
The following chart represents performance of the Davenport Small Cap Focus Fund (DSCPX) and the performance of the Fund’s primary benchmark, the Russell 2000 Index*, for the periods ended September 30, 2019.
| Q3
2019 | 1 Year | 3 Year | Since
Inception
12/31/14** | Fiscal
Year 2019
Expense
Ratio |
Small Cap Focus Fund | -0.21% | 5.01% | 11.77% | 8.74% | 0.97% |
Russell 2000 Index* | -2.40% | -8.89% | 8.23% | 6.54% | |
30-Day SEC Yield: 0.05%; Expense Ratio in current prospectus: 0.98%
9
Past performance is no guarantee of future results. Investment return and principal value of an investment will fluctuate so that an investor’s shares, when redeemed, may be worth more or less than their original cost. Current performance may be lower or higher than the performance data quoted. Performance data, current to the most recent month end, may be obtained by calling 1-800-281-3217.
* | The Russell 2000® Index measures the performance of the 2,000 smallest companies in the Russell 3000® index, representing approximately 8% of the total market capitalization of the Russell 3000. Frank Russell Company is the source and owner of the trademarks, service marks, and copyrights related to the Russell Indexes. Russell® is a trademark of Frank Russell Company. An investor cannot invest in an index and its returns are not indicative of the performance of any specific investment. |
** | Returns greater than one year are annualized. |
The Davenport Small Cap Focus Fund (DSCPX) proved relatively resilient during the third quarter. Though the Fund’s return was down slightly of 0.21% for the period, this outpaced the 2.40% decline for the Russell 2000® Index. Year to date, the strategy is up 26.23% versus 14.18% for the Russell 2000 Index.
While our Fund has outperformed, we point out that small-cap equities in general continue to underperform larger cap peers. In fact, the Russell 2000 Index has underperformed both the S&P 500® Index and the Russell Mid Cap® Index on a 1, 3, 5 and 10-year basis and the relative valuation gap between small and large cap indices is wider than long-term averages (suggesting small-caps are cheap). While attempting to time an inflection in this trend has not been fruitful as of late, we feel the asset class affords an element of timeliness and believe our strategy offers a high quality way to participate.
Water services provider Evoqua Water Technologies Corp. (AQUA) and building products distributor Builders FirstSource, Inc. (BLDR) were top performers during the quarter. We added to both of these names during periods of distress at the beginning of the year and have been pleased to see them recover nicely. We were also pleased to have early success with Switch, Inc. (SWCH) and Colfax Corp. (CFX), two names we highlighted in last quarter’s letter. Leading pet insurer, Trupanion, Inc. (TRUP) was the top detractor for the period, suffering a meaningful decline in response to an analyst downgrade. We are disappointed in the stock’s reaction; however, we maintain a high degree of conviction in the growth opportunity for pet insurance (~2% penetration in the U.S. versus 25% in the U.K.), value proposition that TRUP provides to its customers and the ultimate cash generation potential of this business. Furthermore, we believe the company has executed well and continue to support management’s decision to redeploy excess cash flow into new customer acquisitions given the attractive returns that result (30-40% IRRs on pet acquisition spend).
We added to Seaboard Corp. (SEB), a position we have held for some time but have yet to discuss in this medium. SEB is a holding company based in Merriam, Kansas with operations focused on global agribusiness, commodity trading and transportation. Though the company’s asset mix is diverse and far flung (SEB employs 25,000 worldwide across 45 nations), the key value drivers are its protein production assets. More specifically, SEB is one of the largest producers and processors of pork in the U.S., with additional exposure to turkey production via its partial ownership interest in Butterball LLC. While we have always been attracted to the company’s exposure to the global protein theme, recent developments in China and to ongoing company specific factors make the shares timely, in our opinion. China (with annual consumption of 122 billion pounds of pork) is dealing with a devastating outbreak of African Swine Fever, forcing
10
domestic producers to cull herds. According to the Wall Street Journal, China’s pork production could fall by as much as 35.7 billion pounds in 2019 – almost double the amount of pork traded globally in a year. This is already having a dramatic impact on local pricing, which should leak into U.S. markets as international capacity is used up. Interestingly, this is coming at a time when SEB is bringing on new capacity, thus increasing the company’s ability to deliver into a tight market. While earnings have been volatile and unpredictable on a short-term basis, the company’s history of long-term value creation is quite consistent. In light of the developments discussed above, we believe Seaboard could earn us a blue ribbon.
In sum, we are pleased with recent returns and the Fund’s resilience during market turmoil. In addition, we are excited about the relative value proposition of the asset class. We also note that the end of this year marks the 5th anniversary of the Fund. We are pleased with our returns since inception and look to build on this success over the next five years.
Davenport Balanced Income Fund
The following chart represents Davenport Balanced Income Fund (DBALX) performance, and performance of the Fund’s primary benchmark, the Russell 1000® Value Index, along with the Morningstar Allocation 50-70% Equity Index, and the blended 60% Russell 1000® Value Index / 40% Bloomberg Barclays Intermediate Government /Credit Bond Index for the period ended September 30, 2019.
| Q3
2018 | 1 Year | Since
Inception
12/31/15** | Fiscal
Year 2019
Expense
Ratio |
Balanced Income Fund | 2.46% | 4.56% | 6.63% | 0.96% |
Russell 1000® Value* | 1.36% | 4.00% | 10.24% | |
Morningstar Allocation 50-70% Equity* | 0.93% | 3.37% | 7.13% | |
60% Russell 1000® Value/40% BBIGC | 1.41% | 6.11% | 7.52% | |
30-Day SEC Yield: 1.69%; Expense Ratio in current prospectus: 0.96%
Past performance is no guarantee of future results. Investment return and principal value of an investment will fluctuate so that an investor’s shares, when redeemed, may be worth more or less than their original cost. Current performance may be lower or higher than the performance data quoted. Performance data, current to the most recent month end, may be obtained by calling 1-800-281-3217.
* | The Russell 1000® Value Index measures the performance of the Russell 1000 companies with lower price-to-book ratios and lower forecasted growth values. The Morningstar US OE Allocation 50-70% Equity Index is composed of Funds which seek to provide both income and capital appreciation by investing in multiple asset classes, including stocks, bonds, and cash. These portfolios are dominated by domestic holdings and have equity exposure between 50% and 70%. The blended 60% Russell 1000 Value/40% Bloomberg Barclay’s Intermediate Government/Credit (BBIGC) Index is included as an additional comparative index because it is representative of a balanced portfolio consisting of 60% equity and 40% fixed income securities. The BBIGC measures the non-securitized component of the U.S. Aggregate Index. It includes investment grade, U.S. dollar-denominated, fixed-rate Treasuries, government-related and corporate rate securities. Intermediate maturity bonds include bonds with maturities of 1 to 9.999 years. An investor cannot invest in an index and its returns are not indicative of the performance of any specific investment. |
** | Returns greater than one year are annualized. |
11
The Davenport Balanced Income Fund (DBALX) increased 2.46% in the third quarter, outpacing the 1.36% increase for the Russell 1000® Value Index and the 1.70% increase for the S&P 500® Index. The blended index of 60% Russell 1000 Value Index/ 40% Bloomberg Barclays Intermediate Government Credit® Index was up 1.41% for the quarter. Year to date (YTD), DBALX has returned 13.48% compared to 17.81% for the Russell 1000® Value, 20.55% for the S&P 500 Index and 13.38% for the blended 60/40 index.
Financial stocks were again the top contributors to performance this quarter, with Blackstone Group, Inc. (BX), Brookfield Asset Management, Inc. (BAM), and Fidelity National Financial, Inc. (FNF) leading the pack. FNF benefited from lower mortgage rates, which helped spur refinancing and purchase demand, while BAM continues to see strong inflows into the alternative asset classes. Blackstone performed well following its July conversion to a C-Corp, and we used this strength to exit the position as we felt its valuation had become a bit stretched. Our biggest detractors to performance included Royal Dutch Shell PLC (RDS’B) and Fairfax Financial Holdings Ltd. (FRFHF). RDS’B fell victim to lower oil prices and FRFHF shares have struggled to recover following second quarter earnings. FRFHF shares are trading at discount to book value, which we believe is too cheap given the company’s solid insurance franchise and new share repurchase plan.
During the quarter, we elected to initiate a position in Nordstrom, Inc. (JWN), a leading fashion specialty retailer offering apparel, shoes, cosmetics and accessories for women, men, and children. At the time of our purchase, the shares were down over 55% from their twelve-month high primarily due to concerns surrounding the general retailing environment as well as weaker than expected earnings and guidance. We feel these concerns are overblown; moreover, JWN has a strong brand name and a well-earned reputation for quality and customer service. We felt the shares had been de-risked and offered an opportunity to purchase the stock at a compelling valuation and 5% dividend yield.
The bond market continued to chug along in the third quarter of 2019. Amid weaker than expected global economic data coupled with global central bank easing, safe haven assets continued to produce positive returns. While the Federal Reserve initiated its accommodative monetary policy stance with two rate cuts during Q3, yields around the globe continued to drop (prices rose). By August there were around $17 trillion sovereign bonds with negative yields. Investors continue to be attracted to the U.S. market, where one can attain positive yielding debt while providing a hedge to equity markets during bouts of volatility.
The 2-yr Treasury fell 13bps to 1.624%, while rates on the 10-yr and 30-yr Treasury dropped 34bps (1.67%) and 42bps (2.11%) respectively. The Bloomberg Barclays Intermediate Government/ Credit Index continued to perform well, adding 1.37% in Q3 taking its YTD return to 6.41%. The Bloomberg Barclays US FRN <5yr Index remained positive in Q3 up 0.78% bringing its YTD return to 3.21%.
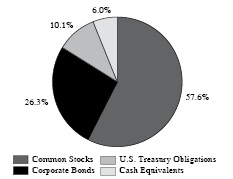
The bond allocation of the Balanced Fund consists of 32 high-quality bonds across eight sectors with the top allocations to U.S. governments at 27.8%, Financials at 19.7%, and Energy at 16.0%. The fixed income portion of DBALX has an effective maturity of 4.2 years and a duration of 3.5 years. During the quarter, we continued to reduce our floating rate exposure by selling one of our Treasury floating rate notes and allowing a couple corporate floating rate notes (FRNs) to mature, bringing our exposure to 21.46% from 24.94% in Q2. FRNs still provide a good yield to duration ratio, but with the Fed cutting rates and future cuts being priced into the market, we
12
feel that 3-month LIBOR (London Inter-bank Offered Rate) has more risk to the downside. We also took advantage of the high activity in the corporate new issue market initiating positions in PayPal Holdings and Fiserv, while exiting our General Motors position. We continue to see value in Treasuries on pullbacks and our Treasury exposure remains around 27%.
The recent market volatility has been a good reminder of the value in a balanced approach. Value-based equity has been out of favor in recent years; however, we finally saw it return to glory in the last month of the quarter as political discord and trade negotiations led to increased market volatility. Given these uncertainties, we believe our allocation to value-based equities and defensive positioning in fixed income may provide a volatility buffer in the near future, while also providing income and potential for long-term capital appreciation.
Sincerely,
John P. Ackerly IV, CFA
President, The Davenport Funds
13
DAVENPORT CORE FUND
PERFORMANCE INFORMATION (Unaudited)
Comparison of the Change in Value of a $10,000 Investment in
Davenport Core Fund and the Standard & Poor’s 500® Index
| | Average Annual Total Returns
(for periods ended September 30, 2019) | |
| | 1 Year | 5 Years | 10 Years | |
Davenport Core Fund(a) | 8.17% | 10.22% | 12.49% | |
Standard & Poor’s 500® Index | 4.25% | 10.84% | 13.24% | |
(a) | The total returns shown do not reflect the deduction of taxes that a shareholder would pay on Fund distributions or the redemption of Fund shares. |
14
DAVENPORT VALUE & INCOME FUND
PERFORMANCE INFORMATION (Unaudited)
Comparison of the Change in Value of a $10,000 Investment in
Davenport Value & Income Fund, the Russell 1000® Value Index
and the Lipper Equity Income Index
| | Average Annual Total Returns
(for periods ended September 30, 2019) | |
| | 1 Year | 5 Years | Since
Inception(b) | |
Davenport Value & Income Fund(a) | 2.52% | 8.00% | 11.13% | |
Russell 1000® Value Index | 4.00% | 7.79% | 10.83% | |
Lipper Equity Income Index | 5.88% | 8.26% | 10.42% | |
(a) | The total returns shown do not reflect the deduction of taxes that a shareholder would pay on Fund distributions or the redemption of Fund shares. |
(b) | Commencement of operations was December 31, 2010. |
15
DAVENPORT EQUITY OPPORTUNITIES FUND
PERFORMANCE INFORMATION (Unaudited)
Comparison of the Change in Value of a $10,000 Investment in
Davenport Equity Opportunities Fund and the Russell Midcap® Index
| | Average Annual Total Returns
(for periods ended September 30, 2019) | |
| | 1 Year | 5 Years | Since
Inception(b) | |
Davenport Equity Opportunities Fund(a) | 17.60% | 10.54% | 12.84% | |
Russell Midcap® Index | 3.19% | 9.10% | 11.40% | |
(a) | The total returns shown do not reflect the deduction of taxes that a shareholder would pay on Fund distributions or the redemption of Fund shares. |
(b) | Commencement of operations was December 31, 2010. |
16
DAVENPORT SMALL CAP FOCUS FUND
PERFORMANCE INFORMATION (Unaudited)
Comparison of the Change in Value of a $10,000 Investment in
Davenport Small Cap Focus Fund and the Russell 2000® Index

| | Average Annual Total Returns
(for periods ended September 30, 2019) | |
| | 1 Year | 3 Years | Since
Inception(b) | |
Davenport Small Cap Focus Fund(a) | 5.01% | 11.77% | 8.74% | |
Russell 2000® Index | (8.89%) | 8.23% | 6.54% | |
(a) | The total returns shown do not reflect the deduction of taxes that a shareholder would pay on Fund distributions or the redemption of Fund shares. |
(b) | Commencement of operations was December 31, 2014. |
17
DAVENPORT BALANCED INCOME FUND
PERFORMANCE INFORMATION (Unaudited)
Comparison of the Change in Value of a $10,000 Investment in Davenport Balanced
Income Fund, the Russell 1000® Value Index, a Blended 60% Russell 1000® Value
Index / 40% Bloomberg Barclays Intermediate Government/Credit Bond Index
and the Morningstar US OE Allocation — 50% to 70% Equity
| | Average Annual Total Returns
(for periods ended September 30, 2019) | |
| | 1 Year | 3 Years | Since
Inception(b) | |
Davenport Balanced Income Fund(a) | 4.56% | 5.96% | 6.63% | |
Russell 1000® Value Index | 4.00% | 9.43% | 10.24% | |
Blended 60% Russell 1000® ValueIndex / 40% Bloomberg Barclays Intermediate Government/Credit Bond Index | 6.11% | 6.79% | 7.52% | |
Morningstar US OE Allocation - 50% to 70% Equity | 3.37% | 6.79% | 7.13% | |
(a) | The total returns shown do not reflect the deduction of taxes that a shareholder would pay on Fund distributions or the redemption of Fund shares. |
(b) | Commencement of operations was December 31, 2015. |
18
DAVENPORT CORE FUND
PORTFOLIO INFORMATION
September 30, 2019 (Unaudited)
Sector Allocation vs. the Standard & Poor’s 500® Index
Top Ten Equity Holdings
Security Description | % of Net Assets |
American Tower Corporation | 4.1% |
Danaher Corporation | 3.5% |
Brookfield Asset Management, Inc. - Class A | 3.5% |
Markel Corporation | 3.2% |
Accenture plc - Class A | 3.2% |
Adobe, Inc. | 3.1% |
Berkshire Hathaway, Inc. - Class B | 3.0% |
CarMax, Inc. | 2.8% |
Visa, Inc. - Class A | 2.8% |
Mastercard, Inc. - Class A | 2.8% |
19
DAVENPORT VALUE & INCOME FUND
PORTFOLIO INFORMATION
September 30, 2019 (Unaudited)
Sector Allocation vs. the Russell 1000® Value Index
Top Ten Equity Holdings
Security Description | % of Net Assets |
Brookfield Asset Management, Inc. - Class A | 3.5% |
Fidelity National Financial, Inc. | 3.4% |
JPMorgan Chase & Company | 3.1% |
Markel Corporation | 2.9% |
Johnson & Johnson | 2.8% |
Anheuser-Busch InBev S.A./N.V. - ADR | 2.7% |
Royal Dutch Shell plc - Class B - ADR | 2.7% |
Bristol-Myers Squibb Company | 2.6% |
Watsco, Inc. | 2.6% |
Dominion Energy, Inc. | 2.6% |
20
DAVENPORT EQUITY OPPORTUNITIES FUND
PORTFOLIO INFORMATION
September 30, 2019 (Unaudited)
Sector Allocation vs. the Russell Midcap® Index
Top Ten Equity Holdings
Security Description | % of Net Assets |
Brookfield Asset Management, Inc. - Class A | 6.4% |
American Tower Corporation | 6.4% |
Fairfax Financial Holdings Ltd. | 5.3% |
Markel Corporation | 5.3% |
Sherwin-Williams Company (The) | 5.1% |
CarMax, Inc. | 5.0% |
Martin Marietta Materials, Inc. | 5.0% |
Live Nation Entertainment, Inc. | 4.6% |
DISH Network Corporation - Class A | 4.5% |
Fidelity National Financial, Inc. | 4.1% |
21
DAVENPORT SMALL CAP FOCUS FUND
PORTFOLIO INFORMATION
September 30, 2019 (Unaudited)
Sector Allocation vs. the Russell 2000® Index
Top Ten Equity Holdings
Security Description | % of Net Assets |
Colfax Corporation | 4.7% |
OneSpaWorld Holdings Ltd. | 4.5% |
Diamond Hill Investment Group, Inc. | 4.3% |
Cannae Holdings, Inc. | 4.3% |
Evoqua Water Technologies Corporation | 4.0% |
Monarch Casino & Resort, Inc. | 3.6% |
Kinsale Capital Group, Inc. | 3.4% |
Watsco, Inc. | 3.4% |
Black Knight, Inc. | 3.2% |
Seaboard Corporation | 3.1% |
22
DAVENPORT BALANCED INCOME FUND
PORTFOLIO INFORMATION
September 30, 2019 (Unaudited)
Asset Allocation (% of Net Assets) | | Ten Largest Equity Holdings | % of Net Assets |
| | Brookfield Asset Management, Inc. - Class A | 1.8% |
Fidelity National Financial, Inc. | 1.7% |
JPMorgan Chase & Company | 1.6% |
Markel Corporation | 1.5% |
Johnson & Johnson | 1.4% |
Dominion Energy, Inc. | 1.4% |
Royal Dutch Shell plc - Class B - ADR | 1.4% |
Watsco, Inc. | 1.4% |
Anheuser-Busch InBev S.A./N.V. - ADR | 1.4% |
Bristol-Myers Squibb Company | 1.3% |
| |
Equity Sector Concentration vs. the Russell 1000 Value Index (57.6% of Net Assets) |
Bond Portfolio (36.4% of Net Assets) | | Credit Quality | Composite Quality |
Number of Fixed-Income Securities | 32 | | AAA | 28.6% |
Average Quality | A+/A1 | | AA | 3.7% |
Effective Maturity | 4.2 yrs. | | A | 43.4% |
Average Effective Duration | 3.5 yrs. | | BBB | 24.3% |
| | | | Ba | 0.0% |
Sector Breakdown | % of Corporate
Bond Portfolio |
Communication Services | 1.7% |
Consumer Discretionary | —% |
Consumer Staples | 12.7% |
Energy | 16.0% |
Financials | 19.7% |
Health Care | 4.1% |
Industrials | 8.1% |
Information Technology | 5.4% |
Materials | 4.5% |
Utilities | —% |
U.S. Treasury | 27.8% |
23
DAVENPORT CORE FUND
SCHEDULE OF INVESTMENTS
September 30, 2019 (Unaudited) |
COMMON STOCKS — 95.8% | | Shares | | | Value | |
Communication Services — 6.7% | | | | | | | | |
Alphabet, Inc. - Class A(a) | | | 7,961 | | | $ | 9,721,496 | |
Alphabet, Inc. - Class C(a) | | | 6,941 | | | | 8,461,079 | |
Liberty Broadband Corporation - Series C(a) | | | 103,475 | | | | 10,830,728 | |
Walt Disney Company (The) | | | 69,634 | | | | 9,074,703 | |
| | | | | | | | 38,088,006 | |
Consumer Discretionary — 11.4% | | | | | | | | |
Alibaba Group Holding Ltd. - ADR(a) | | | 40,475 | | | | 6,768,634 | |
Amazon.com, Inc.(a) | | | 6,395 | | | | 11,101,145 | |
CarMax, Inc.(a) | | | 181,587 | | | | 15,979,656 | |
Home Depot, Inc. (The) | | | 56,232 | | | | 13,046,949 | |
NIKE, Inc. - Class B | | | 94,083 | | | | 8,836,275 | |
TJX Companies, Inc. (The) | | | 151,810 | | | | 8,461,889 | |
| | | | | | | | 64,194,548 | |
Consumer Staples — 7.8% | | | | | | | | |
Anheuser-Busch InBev S.A./N.V. - ADR | | | 144,921 | | | | 13,789,233 | |
Mondelēz International, Inc. - Class A | | | 154,758 | | | | 8,561,213 | |
Nestlé S.A. - ADR | | | 121,554 | | | | 13,176,454 | |
PepsiCo, Inc. | | | 62,225 | | | | 8,531,047 | |
| | | | | | | | 44,057,947 | |
Energy — 4.9% | | | | | | | | |
Chevron Corporation | | | 67,744 | | | | 8,034,438 | |
EOG Resources, Inc. | | | 95,470 | | | | 7,085,783 | |
Marathon Petroleum Corporation | | | 204,933 | | | | 12,449,680 | |
| | | | | | | | 27,569,901 | |
Financials — 18.0% | | | | | | | | |
Berkshire Hathaway, Inc. - Class B(a) | | | 82,053 | | | | 17,068,665 | |
Brookfield Asset Management, Inc. - Class A | | | 368,478 | | | | 19,562,497 | |
Capital One Financial Corporation | | | 150,286 | | | | 13,673,020 | |
Charles Schwab Corporation (The) | | | 207,471 | | | | 8,678,512 | |
CME Group, Inc. | | | 52,565 | | | | 11,109,087 | |
JPMorgan Chase & Company | | | 116,788 | | | | 13,744,780 | |
Markel Corporation(a) | | | 15,355 | | | | 18,148,075 | |
| | | | | | | | 101,984,636 | |
Health Care — 11.0% | | | | | | | | |
Becton, Dickinson and Company | | | 43,084 | | | | 10,898,529 | |
CVS Health Corporation | | | 130,146 | | | | 8,208,308 | |
Danaher Corporation | | | 135,736 | | | | 19,604,350 | |
Johnson & Johnson | | | 97,740 | | | | 12,645,601 | |
Merck & Company, Inc. | | | 130,354 | | | | 10,973,200 | |
| | | | | | | | 62,329,988 | |
24
DAVENPORT CORE FUND
SCHEDULE OF INVESTMENTS (Continued) |
COMMON STOCKS — 95.8% (Continued) | | Shares | | | Value | |
Industrials — 6.1% | | | | | | | | |
FedEx Corporation | | | 54,807 | | | $ | 7,978,255 | |
General Dynamics Corporation | | | 41,578 | | | | 7,597,548 | |
Honeywell International, Inc. | | | 49,524 | | | | 8,379,461 | |
Union Pacific Corporation | | | 65,235 | | | | 10,566,765 | |
| | | | | | | | 34,522,029 | |
Information Technology — 16.8% | | | | | | | | |
Accenture plc - Class A | | | 93,234 | | | | 17,933,560 | |
Adobe, Inc.(a) | | | 62,835 | | | | 17,358,169 | |
Apple, Inc. | | | 43,769 | | | | 9,802,943 | |
Broadcom, Inc. | | | 29,532 | | | | 8,152,899 | |
Mastercard, Inc. - Class A | | | 58,230 | | | | 15,813,521 | |
Microsoft Corporation | | | 73,568 | | | | 10,228,159 | |
Visa, Inc. - Class A | | | 92,686 | | | | 15,942,919 | |
| | | | | | | | 95,232,170 | |
Materials — 9.0% | | | | | | | | |
Air Products & Chemicals, Inc. | | | 37,095 | | | | 8,229,897 | |
Ecolab, Inc. | | | 42,886 | | | | 8,493,143 | |
Martin Marietta Materials, Inc. | | | 40,356 | | | | 11,061,580 | |
Sherwin-Williams Company (The) | | | 25,365 | | | | 13,947,452 | |
Vulcan Materials Company | | | 59,065 | | | | 8,932,991 | |
| | | | | | | | 50,665,063 | |
Real Estate — 4.1% | | | | | | | | |
American Tower Corporation | | | 105,272 | | | | 23,278,797 | |
| | | | | | | | | |
Total Common Stocks (Cost $326,822,066) | | | | | | $ | 541,923,085 | |
|
MONEY MARKET FUNDS — 1.4% | | Shares | | | Value | |
First American Treasury Obligations Fund - Class Z, 1.85%(b) (Cost $8,160,239) | | | 8,160,239 | | | $ | 8,160,239 | |
| | | | | | | | | |
Total Investments at Value — 97.2% (Cost $334,982,305) | | | | | | $ | 550,083,324 | |
| | | | | | | | | |
Other Assets in Excess of Liabilities — 2.8% | | | | | | | 15,780,806 | |
| | | | | | | | | |
Net Assets — 100.0% | | | | | | $ | 565,864,130 | |
ADR - American Depositary Receipt.
(a) | Non-income producing security. |
(b) | The rate shown is the 7-day effective yield as of September 30, 2019. |
See accompanying notes to financial statements.
25
DAVENPORT VALUE & INCOME FUND
SCHEDULE OF INVESTMENTS
September 30, 2019 (Unaudited) |
COMMON STOCKS — 94.4% | | Shares | | | Value | |
Communication Services — 3.8% | | | | | | | | |
Comcast Corporation - Class A | | | 350,355 | | | $ | 15,794,003 | |
Verizon Communications, Inc. | | | 183,215 | | | | 11,058,858 | |
| | | | | | | | 26,852,861 | |
Consumer Discretionary — 3.2% | | | | | | | | |
Carnival Corporation | | | 272,801 | | | | 11,924,132 | |
Las Vegas Sands Corporation | | | 175,890 | | | | 10,159,406 | |
| | | | | | | | 22,083,538 | |
Consumer Staples — 11.4% | | | | | | | | |
Altria Group, Inc. | | | 178,636 | | | | 7,306,212 | |
Anheuser-Busch InBev S.A./N.V. - ADR | | | 198,915 | | | | 18,926,762 | |
Diageo plc - ADR | | | 90,780 | | | | 14,844,346 | |
Mondelēz International, Inc. - Class A | | | 246,890 | | | | 13,657,955 | |
PepsiCo, Inc. | | | 96,805 | | | | 13,271,965 | |
Philip Morris International, Inc. | | | 155,720 | | | | 11,823,820 | |
| | | | | | | | 79,831,060 | |
Energy — 8.7% | | | | | | | | |
Chevron Corporation | | | 68,366 | | | | 8,108,207 | |
Enbridge, Inc. | | | 301,622 | | | | 10,580,900 | |
Exxon Mobil Corporation | | | 85,975 | | | | 6,070,695 | |
Marathon Petroleum Corporation | | | 288,265 | | | | 17,512,099 | |
Royal Dutch Shell plc - Class B - ADR | | | 313,175 | | | | 18,759,182 | |
| | | | | | | | 61,031,083 | |
Financials — 25.8% | | | | | | | | |
Allstate Corporation (The) | | | 110,620 | | | | 12,022,181 | |
Bank of America Corporation | | | 355,000 | | | | 10,355,350 | |
Berkshire Hathaway, Inc. - Class B(a) | | | 68,234 | | | | 14,194,037 | |
Brookfield Asset Management, Inc. - Class A | | | 467,865 | | | | 24,838,953 | |
Capital One Financial Corporation | | | 180,355 | | | | 16,408,698 | |
Citigroup, Inc. | | | 157,450 | | | | 10,876,646 | |
Fairfax Financial Holdings Ltd. | | | 34,059 | | | | 15,019,338 | |
Fidelity National Financial, Inc. | | | 532,110 | | | | 23,631,005 | |
JPMorgan Chase & Company | | | 186,385 | | | | 21,935,651 | |
Markel Corporation(a) | | | 16,890 | | | | 19,962,291 | |
Wells Fargo & Company | | | 219,359 | | | | 11,064,468 | |
| | | | | | | | 180,308,618 | |
Health Care — 11.3% | | | | | | | | |
Bristol-Myers Squibb Company | | | 364,437 | | | | 18,480,600 | |
CVS Health Corporation | | | 232,380 | | | | 14,656,207 | |
Johnson & Johnson | | | 151,165 | | | | 19,557,728 | |
Medtronic plc | | | 122,070 | | | | 13,259,243 | |
Merck & Company, Inc. | | | 158,157 | | | | 13,313,656 | |
| | | | | | | | 79,267,434 | |
26
DAVENPORT VALUE & INCOME FUND
SCHEDULE OF INVESTMENTS (Continued) |
COMMON STOCKS — 94.4% (Continued) | | Shares | | | Value | |
Industrials — 10.8% | | | | | | | | |
3M Company | | | 43,445 | | | $ | 7,142,358 | |
Delta Air Lines, Inc. | | | 248,415 | | | | 14,308,704 | |
Eaton Corporation plc | | | 171,192 | | | | 14,234,615 | |
Norfolk Southern Corporation | | | 55,813 | | | | 10,027,364 | |
United Parcel Service, Inc. - Class B | | | 93,520 | | | | 11,205,566 | |
Watsco, Inc. | | | 109,050 | | | | 18,449,079 | |
| | | | | | | | 75,367,686 | |
Information Technology — 8.2% | | | | | | | | |
Cisco Systems, Inc. | | | 310,012 | | | | 15,317,693 | |
Intel Corporation | | | 230,160 | | | | 11,860,145 | |
Microsoft Corporation | | | 121,814 | | | | 16,935,800 | |
TE Connectivity Ltd. | | | 145,775 | | | | 13,583,315 | |
| | | | | | | | 57,696,953 | |
Materials — 1.3% | | | | | | | | |
Dow, Inc. | | | 183,351 | | | | 8,736,675 | |
| | | | | | | | | |
Real Estate — 7.3% | | | | | | | | |
Crown Castle International Corporation | | | 94,335 | | | | 13,113,508 | |
Gaming and Leisure Properties, Inc. | | | 269,164 | | | | 10,292,831 | |
Lamar Advertising Company - Class A | | | 189,120 | | | | 15,494,602 | |
W.P. Carey, Inc. | | | 139,374 | | | | 12,473,973 | |
| | | | | | | | 51,374,914 | |
Utilities — 2.6% | | | | | | | | |
Dominion Energy, Inc. | | | 225,465 | | | | 18,271,684 | |
| | | | | | | | | |
Total Common Stocks (Cost $534,547,981) | | | | | | $ | 660,822,506 | |
|
MONEY MARKET FUNDS — 5.5% | | Shares | | | Value | |
First American Treasury Obligations Fund - Class Z, 1.85%(b) (Cost $38,407,418) | | | 38,407,418 | | | $ | 38,407,418 | |
| | | | | | | | | |
Total Investments at Value — 99.9%(Cost $572,955,399) | | | | | | $ | 699,229,924 | |
| | | | | | | | | |
Other Assets in Excess of Liabilities — 0.1% | | | | | | | 830,082 | |
| | | | | | | | | |
Net Assets — 100.0% | | | | | | $ | 700,060,006 | |
ADR - American Depositary Receipt.
(a) | Non-income producing security. |
(b) | The rate shown is the 7-day effective yield as of September 30, 2019. |
See accompanying notes to financial statements.
27
DAVENPORT EQUITY OPPORTUNITIES FUND
SCHEDULE OF INVESTMENTS
September 30, 2019 (Unaudited) |
COMMON STOCKS — 96.9% | | Shares | | | Value | |
Communication Services — 17.0% | | | | | | | | |
DISH Network Corporation - Class A(a) | | | 637,889 | | | $ | 21,732,878 | |
Liberty Broadband Corporation - Series C(a) | | | 177,921 | | | | 18,622,991 | |
Live Nation Entertainment, Inc.(a) | | | 335,044 | | | | 22,226,819 | |
Take-Two Interactive Software, Inc.(a) | | | 153,871 | | | | 19,286,191 | |
| | | | | | | | 81,868,879 | |
Consumer Discretionary — 15.5% | | | | | | | | |
CarMax, Inc.(a) | | | 274,842 | | | | 24,186,096 | |
Dollar Tree, Inc.(a) | | | 123,435 | | | | 14,091,340 | |
Etsy, Inc.(a) | | | 193,757 | | | | 10,947,270 | |
MercadoLibre, Inc.(a) | | | 23,941 | | | | 13,196,997 | |
O’Reilly Automotive, Inc.(a) | | | 31,100 | | | | 12,393,661 | |
| | | | | | | | 74,815,364 | |
Financials — 27.3% | | | | | | | | |
Brookfield Asset Management, Inc. - Class A | | | 584,462 | | | | 31,029,087 | |
Capital One Financial Corporation | | | 185,970 | | | | 16,919,551 | |
Cboe Global Markets, Inc. | | | 110,758 | | | | 12,727,202 | |
Fairfax Financial Holdings Ltd. | | | 58,431 | | | | 25,766,902 | |
Fidelity National Financial, Inc. | | | 447,444 | | | | 19,870,988 | |
Markel Corporation(a) | | | 21,493 | | | | 25,402,577 | |
| | | | | | | | 131,716,307 | |
Health Care — 3.1% | | | | | | | | |
Zoetis, Inc. | | | 120,976 | | | | 15,072,400 | |
| | | | | | | | | |
Industrials — 7.5% | | | | | | | | |
Watsco, Inc. | | | 107,276 | | | | 18,148,954 | |
Xylem, Inc. | | | 224,492 | | | | 17,874,053 | |
| | | | | | | | 36,023,007 | |
Information Technology — 10.0% | | | | | | | | |
Autodesk, Inc.(a) | | | 107,467 | | | | 15,872,876 | |
Black Knight, Inc.(a) | | | 252,917 | | | | 15,443,112 | |
Intuit, Inc. | | | 64,192 | | | | 17,071,220 | |
| | | | | | | | 48,387,208 | |
Materials — 10.1% | | | | | | | | |
Martin Marietta Materials, Inc. | | | 87,873 | | | | 24,085,989 | |
Sherwin-Williams Company (The) | | | 44,220 | | | | 24,315,252 | |
| | | | | | | | 48,401,241 | |
Real Estate — 6.4% | | | | | | | | |
American Tower Corporation | | | 138,206 | | | | 30,561,493 | |
| | | | | | | | | |
Total Common Stocks (Cost $322,257,988) | | | | | | $ | 466,845,899 | |
28
DAVENPORT EQUITY OPPORTUNITIES FUND
SCHEDULE OF INVESTMENTS (Continued) |
MONEY MARKET FUNDS — 3.1% | | Shares | | | Value | |
First American Treasury Obligations Fund - Class Z, 1.85%(b) (Cost $14,856,555) | | | 14,856,555 | | | $ | 14,856,555 | |
| | | | | | | | | |
Total Investments at Value — 100.0%(Cost $337,114,543) | | | | | | $ | 481,702,454 | |
| | | | | | | | | |
Other Assets in Excess of Liabilities — 0.0%(c) | | | | | | | 91,269 | |
| | | | | | | | | |
Net Assets — 100.0% | | | | | | $ | 481,793,723 | |
(a) | Non-income producing security. |
(b) | The rate shown is the 7-day effective yield as of September 30, 2019. |
(c) | Percentage rounds to less than 0.1%. |
See accompanying notes to financial statements.
29
DAVENPORT SMALL CAP FOCUS FUND
SCHEDULE OF INVESTMENTS
September 30, 2019 (Unaudited) |
COMMON STOCKS — 93.1% | | Shares | | | Value | |
Communication Services — 7.3% | | | | | | | | |
Cable One, Inc. | | | 3,538 | | | $ | 4,439,129 | |
Shenandoah Telecommunications Company | | | 169,855 | | | | 5,396,293 | |
Sinclair Broadcast Group, Inc. - Class A | | | 85,000 | | | | 3,632,900 | |
| | | | | | | | 13,468,322 | |
Consumer Discretionary — 16.2% | | | | | | | | |
Drive Shack, Inc.(a) | | | 706,490 | | | | 3,044,972 | |
Eldorado Resorts, Inc.(a) | | | 134,381 | | | | 5,357,770 | |
Etsy, Inc.(a) | | | 68,969 | | | | 3,896,749 | |
Monarch Casino & Resort, Inc.(a) | | | 161,068 | | | | 6,714,925 | |
Pool Corporation | | | 20,461 | | | | 4,126,984 | |
Red Rock Resorts, Inc. - Class A | | | 134,899 | | | | 2,739,124 | |
Six Flags Entertainment Corporation | | | 80,000 | | | | 4,063,200 | |
| | | | | | | | 29,943,724 | |
Consumer Staples — 3.1% | | | | | | | | |
Seaboard Corporation | | | 1,309 | | | | 5,726,875 | |
| | | | | | | | | |
Energy — 1.0% | | | | | | | | |
CONSOL Coal Resources, L.P. | | | 135,800 | | | | 1,833,300 | |
| | | | | | | | | |
Financials — 27.5% | | | | | | | | |
Cannae Holdings, Inc.(a) | | | 291,482 | | | | 8,007,011 | |
Cohen & Steers, Inc. | | | 80,350 | | | | 4,413,625 | |
Diamond Hill Investment Group, Inc. | | | 57,977 | | | | 8,008,363 | |
Kinsale Capital Group, Inc. | | | 60,151 | | | | 6,214,200 | |
OneSpaWorld Holdings Ltd.(a) | | | 531,932 | | | | 8,260,904 | |
Stewart Information Services Corporation | | | 140,000 | | | | 5,430,600 | |
TowneBank | | | 192,278 | | | | 5,346,290 | |
Trupanion, Inc.(a) | | | 198,813 | | | | 5,053,826 | |
| | | | | | | | 50,734,819 | |
Health Care — 3.4% | | | | | | | | |
Heska Corporation(a) | | | 42,666 | | | | 3,023,739 | |
Teladoc Health, Inc.(a) | | | 48,273 | | | | 3,269,048 | |
| | | | | | | | 6,292,787 | |
Industrials — 18.7% | | | | | | | | |
Builders FirstSource, Inc.(a) | | | 220,886 | | | | 4,544,729 | |
Casella Waste Systems, Inc. - Class A(a) | | | 109,921 | | | | 4,720,008 | |
Colfax Corporation(a) | | | 300,000 | | | | 8,718,000 | |
Evoqua Water Technologies Corporation(a) | | | 432,576 | | | | 7,362,443 | |
SiteOne Landscape Supply, Inc.(a) | | | 40,242 | | | | 2,978,713 | |
Watsco, Inc. | | | 36,593 | | | | 6,190,804 | |
| | | | | | | | 34,514,697 | |
30
DAVENPORT SMALL CAP FOCUS FUND
SCHEDULE OF INVESTMENTS (Continued) |
COMMON STOCKS — 93.1% (Continued) | | Shares | | | Value | |
Information Technology — 5.2% | | | | | | | | |
Black Knight, Inc.(a) | | | 97,867 | | | $ | 5,975,759 | |
Switch, Inc. - Class A | | | 235,195 | | | | 3,673,746 | |
| | | | | | | | 9,649,505 | |
Materials — 6.4% | | | | | | | | |
Fortuna Silver Mines, Inc.(a) | | | 930,300 | | | | 2,874,627 | |
MAG Silver Corporation(a) | | | 438,831 | | | | 4,655,997 | |
NewMarket Corporation | | | 9,191 | | | | 4,338,979 | |
| | | | | | | | 11,869,603 | |
Real Estate — 4.3% | | | | | | | | |
FRP Holdings, Inc.(a) | | | 55,603 | | | | 2,670,056 | |
Lamar Advertising Company - Class A | | | 63,300 | | | | 5,186,169 | |
| | | | | | | | 7,856,225 | |
| | | | | | | | | |
Total Common Stocks (Cost $146,719,369) | | | | | | $ | 171,889,857 | |
|
MONEY MARKET FUNDS — 6.4% | | Shares | | | Value | |
First American Treasury Obligations Fund - Class Z, 1.85%(b) (Cost $11,830,357) | | | 11,830,357 | | | $ | 11,830,357 | |
| | | | | | | | | |
Total Investments at Value — 99.5% (Cost $158,549,726) | | | | | | $ | 183,720,214 | |
| | | | | | | | | |
Other Assets in Excess of Liabilities — 0.5% | | | | | | | 886,321 | |
| | | | | | | | | |
Net Assets — 100.0% | | | | | | $ | 184,606,535 | |
(a) | Non-income producing security. |
(b) | The rate shown is the 7-day effective yield as of September 30, 2019. |
See accompanying notes to financial statements.
31
DAVENPORT BALANCED INCOME FUND
SCHEDULE OF INVESTMENTS
September 30, 2019 (Unaudited) |
COMMON STOCKS — 57.6% | | Shares | | | Value | |
Communication Services — 3.1% | | | | | | | | |
AT&T, Inc. | | | 42,400 | | | $ | 1,604,416 | |
Comcast Corporation - Class A | | | 41,880 | | | | 1,887,950 | |
Verizon Communications, Inc. | | | 21,190 | | | | 1,279,029 | |
| | | | | | | | 4,771,395 | |
Consumer Discretionary — 2.5% | | | | | | | | |
Carnival Corporation | | | 31,560 | | | | 1,379,488 | |
Las Vegas Sands Corporation | | | 20,380 | | | | 1,177,149 | |
Nordstrom, Inc. | | | 42,335 | | | | 1,425,419 | |
| | | | | | | | 3,982,056 | |
Consumer Staples — 6.9% | | | | | | | | |
Altria Group, Inc. | | | 20,565 | | | | 841,108 | |
Anheuser-Busch InBev S.A./N.V. - ADR | | | 22,325 | | | | 2,124,224 | |
Diageo plc - ADR | | | 10,400 | | | | 1,700,608 | |
Ingredion, Inc. | | | 10,231 | | | | 836,282 | |
Mondelēz International, Inc. - Class A | | | 28,255 | | | | 1,563,067 | |
PepsiCo, Inc. | | | 11,200 | | | | 1,535,520 | |
Philip Morris International, Inc. | | | 18,275 | | | | 1,387,621 | |
Universal Corporation | | | 14,230 | | | | 779,946 | |
| | | | | | | | 10,768,376 | |
Energy — 5.0% | | | | | | | | |
Chevron Corporation | | | 7,910 | | | | 938,126 | |
Enbridge, Inc. | | | 34,808 | | | | 1,221,065 | |
Exxon Mobil Corporation | | | 9,960 | | | | 703,276 | |
Marathon Petroleum Corporation | | | 32,998 | | | | 2,004,628 | |
MPLX, L.P. | | | 30,425 | | | | 852,204 | |
Royal Dutch Shell plc - Class B - ADR | | | 36,150 | | | | 2,165,385 | |
| | | | | | | | 7,884,684 | |
Financials — 15.6% | | | | | | | | |
Allstate Corporation (The) | | | 13,225 | | | | 1,437,293 | |
Bank of America Corporation | | | 41,400 | | | | 1,207,638 | |
Berkshire Hathaway, Inc. - Class B(a) | | | 7,680 | | | | 1,597,593 | |
Brookfield Asset Management, Inc. - Class A | | | 53,770 | | | | 2,854,649 | |
Capital One Financial Corporation | | | 20,810 | | | | 1,893,294 | |
Citigroup, Inc. | | | 17,708 | | | | 1,223,269 | |
Diamond Hill Investment Group, Inc. | | | 8,837 | | | | 1,220,655 | |
Fairfax Financial Holdings Ltd. | | | 3,740 | | | | 1,649,265 | |
Fidelity National Financial, Inc. | | | 61,060 | | | | 2,711,675 | |
JPMorgan Chase & Company | | | 21,565 | | | | 2,537,985 | |
Lazard Ltd. - Class A | | | 34,100 | | | | 1,193,500 | |
Markel Corporation(a) | | | 1,967 | | | | 2,324,797 | |
MetLife, Inc. | | | 27,870 | | | | 1,314,349 | |
Wells Fargo & Company | | | 25,191 | | | | 1,270,634 | |
| | | | | | | | 24,436,596 | |
32
DAVENPORT BALANCED INCOME FUND
SCHEDULE OF INVESTMENTS (Continued) |
COMMON STOCKS — 57.6% (Continued) | | Shares | | | Value | |
Health Care — 5.8% | | | | | | | | |
Bristol-Myers Squibb Company | | | 41,180 | | | $ | 2,088,238 | |
CVS Health Corporation | | | 26,585 | | | | 1,676,716 | |
Johnson & Johnson | | | 17,485 | | | | 2,262,209 | |
Medtronic plc | | | 14,125 | | | | 1,534,258 | |
Merck & Company, Inc. | | | 17,817 | | | | 1,499,835 | |
| | | | | | | | 9,061,256 | |
Industrials — 5.5% | | | | | | | | |
3M Company | | | 5,010 | | | | 823,644 | |
Delta Air Lines, Inc. | | | 28,700 | | | | 1,653,120 | |
Eaton Corporation plc | | | 19,760 | | | | 1,643,044 | |
Norfolk Southern Corporation | | | 6,325 | | | | 1,136,349 | |
United Parcel Service, Inc. - Class B | | | 10,795 | | | | 1,293,457 | |
Watsco, Inc. | | | 12,605 | | | | 2,132,514 | |
| | | | | | | | 8,682,128 | |
Information Technology — 4.1% | | | | | | | | |
Cisco Systems, Inc. | | | 34,541 | | | | 1,706,671 | |
Intel Corporation | | | 25,140 | | | | 1,295,464 | |
Microsoft Corporation | | | 13,778 | | | | 1,915,555 | |
TE Connectivity Ltd. | | | 16,710 | | | | 1,557,038 | |
| | | | | | | | 6,474,728 | |
Materials — 0.6% | | | | | | | | |
Dow, Inc. | | | 20,090 | | | | 957,289 | |
| | | | | | | | | |
Real Estate — 5.2% | | | | | | | | |
Brookfield Property Partners, L.P. | | | 62,920 | | | | 1,277,276 | |
Crown Castle International Corporation | | | 10,795 | | | | 1,500,613 | |
Gaming and Leisure Properties, Inc. | | | 31,155 | | | | 1,191,367 | |
Lamar Advertising Company - Class A | | | 21,880 | | | | 1,792,628 | |
Tanger Factory Outlet Centers, Inc. | | | 56,140 | | | | 869,047 | |
W.P. Carey, Inc. | | | 16,275 | | | | 1,456,613 | |
| | | | | | | | 8,087,544 | |
Utilities — 3.3% | | | | | | | | |
Brookfield Infrastructure Partners, L.P. | | | 30,685 | | | | 1,522,283 | |
Brookfield Renewable Partners, L.P. | | | 37,660 | | | | 1,529,749 | |
Dominion Energy, Inc. | | | 26,770 | | | | 2,169,441 | |
| | | | | | | | 5,221,473 | |
| | | | | | | | | |
Total Common Stocks (Cost $81,663,938) | | | | | | $ | 90,327,525 | |
33
DAVENPORT BALANCED INCOME FUND
SCHEDULE OF INVESTMENTS (Continued) |
FIXED RATE CORPORATE BONDS — 18.3% | | Par Value | | | Value | |
Consumer Staples — 3.9% | | | | | | | | |
Altria Group, Inc., 4.75%, due 05/05/2021 | | $ | 1,500,000 | | | $ | 1,559,622 | |
J.M. Smucker Company (The), 3.50%, due 10/15/2021 | | | 1,500,000 | | | | 1,535,119 | |
PepsiCo, Inc., 2.75%, due 03/05/2022 | | | 1,200,000 | | | | 1,229,037 | |
Sysco Corporation, 2.60%, due 10/01/2020 | | | 1,700,000 | | | | 1,707,870 | |
| | | | | | | | 6,031,648 | |
Energy — 4.7% | | | | | | | | |
Boardwalk Pipelines, L.P., 4.45%, due 07/15/2027 | | | 1,250,000 | | | | 1,286,172 | |
Halliburton Company, 3.80%, due 11/15/2025 | | | 2,325,000 | | | | 2,462,694 | |
MPLX, L.P., 4.125%, due 03/01/2027 | | | 1,750,000 | | | | 1,845,513 | |
Occidental Petroleum Corporation, 3.50%, due 06/15/2025 | | | 1,750,000 | | | | 1,799,196 | |
| | | | | | | | 7,393,575 | |
Financials — 3.2% | | | | | | | | |
BlackRock, Inc., 3.50%, due 03/18/2024 | | | 1,150,000 | | | | 1,227,994 | |
Citigroup, Inc., 3.30%, due 04/27/2025 | | | 2,250,000 | | | | 2,353,194 | |
Fiserv, Inc., 3.20%, due 07/01/2026 | | | 1,400,000 | | | | 1,448,853 | |
| | | | | | | | 5,030,041 | |
Health Care — 0.8% | | | | | | | | |
AbbVie, Inc., 2.50%, due 05/14/2020 | | | 1,300,000 | | | | 1,302,954 | |
| | | | | | | | | |
Industrials — 2.9% | | | | | | | | |
Boing Company (The), 2.70%, due 02/01/2027 | | | 1,395,000 | | | | 1,418,578 | |
General Dynamics Corporation, 3.375%, due 05/15/2023 | | | 1,750,000 | | | | 1,831,135 | |
John Deere Capital Corporation, 2.60%, due 03/07/2024 | | | 1,325,000 | | | | 1,352,011 | |
| | | | | | | | 4,601,724 | |
Information Technology — 2.0% | | | | | | | | |
Oracle Corporation, 3.625%, due 07/15/2023 | | | 1,500,000 | | | | 1,583,848 | |
PayPal Holdings, Inc., 2.40%, due 10/01/2024 | | | 1,500,000 | | | | 1,508,132 | |
| | | | | | | | 3,091,980 | |
Materials — 0.8% | | | | | | | | |
Sherwin-Williams Company (The), 3.45%, due 06/01/2027 | | | 1,225,000 | | | | 1,281,132 | |
| | | | | | | | | |
Total Fixed Rate Corporate Bonds(Cost $28,162,197) | | | | | | $ | 28,733,054 | |
|
VARIABLE RATE CORPORATE BONDS(b) — 8.0% | | Par Value | | | Value | |
Communication Services — 0.6% | | | | | | | | |
AT&T, Inc., 3.034% (3MO LIBOR + 93), due 06/30/2020 | | $ | 950,000 | | | $ | 954,825 | |
| | | | | | | | | |
Consumer Staples — 0.8% | | | | | | | | |
Campbell Soup Company, 2.748% (3MO LIBOR + 63), due 03/15/2021 | | | 1,250,000 | | | | 1,249,688 | |
34
DAVENPORT BALANCED INCOME FUND
SCHEDULE OF INVESTMENTS (Continued) |
VARIABLE RATE CORPORATE BONDS(b) — 8.0%
(Continued) | | Par Value | | | Value | |
Energy — 1.1% | | | | | | | | |
ConocoPhillips Company, 3.058% (3MO LIBOR + 90), due 05/15/2022 | | $ | 1,750,000 | | | $ | 1,770,788 | |
| | | | | | | | | |
Financials — 4.0% | | | | | | | | |
BP Capital Markets plc, 2.814% (3MO LIBOR + 65), due 09/19/2022 | | | 1,750,000 | | | | 1,754,568 | |
Goldman Sachs Group, Inc., 3.328% (3MO LIBOR + 117), due 11/15/2021 | | | 2,000,000 | | | | 2,015,332 | |
JPMorgan Chase & Company, 3.618% (3MO LIBOR + 148), due 03/01/2021 | | | 1,500,000 | | | | 1,522,741 | |
Wells Fargo & Company, 3.112% (3MO LIBOR + 101), due 12/07/2020 | | | 929,000 | | | | 937,546 | |
| | | | | | | | 6,230,187 | |
Health Care — 0.7% | | | | | | | | |
CVS Health Corporation, 2.732% (3MO LIBOR + 63), due 03/09/2020 | | | 1,015,000 | | | | 1,017,004 | |
| | | | | | | | | |
Materials — 0.8% | | | | | | | | |
Vulcan Materials Company, 2.782% (3MO LIBOR + 65), due 03/01/2021 | | | 1,275,000 | | | | 1,276,054 | |
| | | | | | | | | |
Total Variable Rate Corporate Bonds (Cost $12,492,939) | | | | | | $ | 12,498,546 | |
|
U.S. TREASURY OBLIGATIONS — 10.1% | | Par Value | | | Value | |
U.S. Treasury Notes — 10.1% | | | | | | | | |
1.914%, (3MO USTMMR) due 01/31/2020(b) | | $ | 1,250,000 | | | $ | 1,249,447 | |
3.625%, due 02/15/2021 | | | 1,450,000 | | | | 1,486,647 | |
3.125%, due 05/15/2021 | | | 2,750,000 | | | | 2,810,693 | |
2.75%, due 06/30/2025 | | | 4,810,000 | | | | 5,111,940 | |
2.875%, due 08/15/2028 | | | 4,785,000 | | | | 5,261,257 | |
Total U.S. Treasury Obligations(Cost $15,107,305) | | | | | | $ | 15,919,984 | |
35
DAVENPORT BALANCED INCOME FUND
SCHEDULE OF INVESTMENTS (Continued) |
MONEY MARKET FUNDS — 5.6% | | Shares | | | Value | |
First American Treasury Obligations Fund - Class Z, 1.85%(c) (Cost $8,733,433) | | | 8,733,433 | | | $ | 8,733,433 | |
| | | | | | | | | |
Total Investments at Value — 99.6% (Cost $146,159,812) | | | | | | $ | 156,212,542 | |
| | | | | | | | | |
Other Assets in Excess of Liabilities — 0.4% | | | | | | | 572,929 | |
| | | | | | | | | |
Net Assets — 100.0% | | | | | | $ | 156,785,471 | |
ADR - American Depositary Receipt.
LIBOR - London Interbank Offered Rate.
USTMMR - U.S. Treasury Money Market Rate.
(a) | Non-income producing security. |
(b) | Variable rate security. Interest rate resets periodically. The rate shown is the effective interest rate as of September 30, 2019. The reference rate and spread (in basis points) are indicated parenthetically. |
(c) | The rate shown is the 7-day effective yield as of September 30, 2019. |
See accompanying notes to financial statements.
36
THE DAVENPORT FUNDS
STATEMENTS OF ASSETS AND LIABILITIES
September 30, 2019 (Unaudited) |
| | Davenport
Core
Fund | | | Davenport
Value &
Income
Fund | | | Davenport
Equity
Opportunities
Fund | |
ASSETS | | | | | | | | | | | | |
Investments in securities: | | | | | | | | | | | | |
At cost | | $ | 334,982,305 | | | $ | 572,955,399 | | | $ | 337,114,543 | |
At value (Note 2) | | $ | 550,083,324 | | | $ | 699,229,924 | | | $ | 481,702,454 | |
Cash | | | 15,538,404 | | | | 63,630 | | | | 79,047 | |
Receivable for capital shares sold | | | 331,987 | | | | 459,914 | | | | 274,505 | |
Dividends receivable | | | 428,370 | | | | 1,004,690 | | | | 165,109 | |
Other assets | | | 22,904 | | | | 26,042 | | | | 22,715 | |
TOTAL ASSETS | | | 566,404,989 | | | | 700,784,200 | | | | 482,243,830 | |
| | | | | | | | | | | | | |
LIABILITIES | | | | | | | | | | | | |
Payable for capital shares redeemed | | | 133,114 | | | | 228,518 | | | | 98,896 | |
Accrued investment advisory fees (Note 4) | | | 349,045 | | | | 428,011 | | | | 294,251 | |
Payable to administrator (Note 4) | | | 50,210 | | | | 58,570 | | | | 46,160 | |
Other accrued expenses | | | 8,490 | | | | 9,095 | | | | 10,800 | |
TOTAL LIABILITIES | | | 540,859 | | | | 724,194 | | | | 450,107 | |
| | | | | | | | | | | | | |
NET ASSETS | | $ | 565,864,130 | | | $ | 700,060,006 | | | $ | 481,793,723 | |
| | | | | | | | | | | | | |
Net assets consist of: | | | | | | | | | | | | |
Paid-in capital | | $ | 341,445,028 | | | $ | 560,682,045 | | | $ | 331,722,589 | |
Accumulated earnings | | | 224,419,102 | | | | 139,377,961 | | | | 150,071,134 | |
Net assets | | $ | 565,864,130 | | | $ | 700,060,006 | | | $ | 481,793,723 | |
| | | | | | | | | | | | | |
Shares of beneficial interest outstanding (unlimited number of shares authorized, $0.01 par value) | | | 22,002,032 | | | | 41,111,182 | | | | 23,216,804 | |
| | | | | | | | | | | | | |
Net asset value, offering price and redemption price per share (Note 2) | | $ | 25.72 | | | $ | 17.03 | | | $ | 20.75 | |
See accompanying notes to financial statements.
37
THE DAVENPORT FUNDS
STATEMENTS OF ASSETS AND LIABILITIES (Continued)
September 30, 2019 (Unaudited) |
| | Davenport
Small Cap
Focus
Fund | | | Davenport
Balanced
Income
Fund | |
ASSETS | | | | | | | | |
Investments in securities: | | | | | | | | |
At cost | | $ | 158,549,726 | | | $ | 146,159,812 | |
At value (Note 2) | | $ | 183,720,214 | | | $ | 156,212,542 | |
Cash | | | — | | | | 30,560 | |
Receivable for capital shares sold | | | 219,219 | | | | 130,931 | |
Receivable for investment securities sold | | | 735,019 | | | | — | |
Dividends and interest receivable | | | 68,693 | | | | 547,318 | |
Other assets | | | 18,993 | | | | 17,935 | |
TOTAL ASSETS | | | 184,762,138 | | | | 156,939,286 | |
| | | | | | | | | |
LIABILITIES | | | | | | | | |
Payable for capital shares redeemed | | | 13,926 | | | | 35,453 | |
Accrued investment advisory fees (Note 4) | | | 113,692 | | | | 95,207 | |
Payable to administrator (Note 4) | | | 20,980 | | | | 16,590 | |
Other accrued expenses | | | 7,005 | | | | 6,565 | |
TOTAL LIABILITIES | | | 155,603 | | | | 153,815 | |
| | | | | | | | | |
NET ASSETS | | $ | 184,606,535 | | | $ | 156,785,471 | |
| | | | | | | | | |
Net assets consist of: | | | | | | | | |
Paid-in capital | | $ | 158,671,163 | | | $ | 144,476,221 | |
Accumulated earnings | | | 25,935,372 | | | | 12,309,250 | |
Net assets | | $ | 184,606,535 | | | $ | 156,785,471 | |
| | | | | | | | | |
Shares of beneficial interest outstanding (unlimited number of shares authorized, $0.01 par value) | | | 13,102,599 | | | | 13,293,996 | |
| | | | | | | | | |
Net asset value, offering price and redemption price per share (Note 2) | | $ | 14.09 | | | $ | 11.79 | |
See accompanying notes to financial statements.
38
THE DAVENPORT FUNDS
STATEMENTS OF OPERATIONS
Six Months Ended September 30, 2019 (Unaudited) |
| | Davenport
Core
Fund | | | Davenport
Value &
Income
Fund | | | Davenport
Equity
Opportunities
Fund | |
INVESTMENT INCOME | | | | | | | | | | | | |
Dividends | | $ | 4,106,567 | | | $ | 10,438,354 | | | $ | 1,903,276 | |
Foreign withholding taxes on dividends | | | (99,674 | ) | | | (118,592 | ) | | | (27,899 | ) |
TOTAL INVESTMENT INCOME | | | 4,006,893 | | | | 10,319,762 | | | | 1,875,377 | |
| | | | | | | | | | | | | |
EXPENSES | | | | | | | | | | | | |
Investment advisory fees (Note 4) | | | 2,050,680 | | | | 2,573,652 | | | | 1,685,094 | |
Administration fees (Note 4) | | | 285,527 | | | | 336,582 | | | | 256,831 | |
Registration and filing fees | | | 19,211 | | | | 19,504 | | | | 22,853 | |
Custodian and bank service fees | | | 17,402 | | | | 21,514 | | | | 14,581 | |
Compliance service fees (Note 4) | | | 14,557 | | | | 17,670 | | | | 12,417 | |
Postage and supplies | | | 7,710 | | | | 9,370 | | | | 7,791 | |
Audit and tax services fees | | | 7,750 | | | | 7,750 | | | | 7,750 | |
Trustees’ fees and expenses (Note 4) | | | 7,465 | | | | 7,465 | | | | 7,465 | |
Insurance expense | | | 5,448 | | | | 7,018 | | | | 4,465 | |
Printing of shareholder reports | | | 3,539 | | | | 4,563 | | | | 3,654 | |
Legal fees | | | 3,320 | | | | 3,320 | | | | 3,320 | |
Other expenses | | | 5,150 | | | | 6,459 | | | | 4,530 | |
TOTAL EXPENSES | | | 2,427,759 | | | | 3,014,867 | | | | 2,030,751 | |
| | | | | | | | | | | | | |
NET INVESTMENT INCOME (LOSS) | | | 1,579,134 | | | | 7,304,895 | | | | (155,374 | ) |
| | | | | | | | | | | | | |
REALIZED AND UNREALIZED GAINS (LOSSES) ON INVESTMENTS AND FOREIGN CURRENCIES | | | | | | | | | | | | |
Net realized gains (losses) from: | | | | | | | | | | | | |
Investments | | | 9,244,508 | | | | 12,721,011 | | | | 5,640,664 | |
Foreign currency transactions (Note 2) | | | — | | | | (410 | ) | | | — | |
Net change in unrealized appreciation (depreciation) on investments | | | 35,835,766 | | | | 14,572,622 | | | | 47,773,258 | |
NET REALIZED AND UNREALIZED GAINS ON INVESTMENTS AND FOREIGN CURRENCIES | | | 45,080,274 | | | | 27,293,223 | | | | 53,413,922 | |
| | | | | | | | | | | | | |
NET INCREASE IN NET ASSETSFROM OPERATIONS | | $ | 46,659,408 | | | $ | 34,598,118 | | | $ | 53,258,548 | |
See accompanying notes to financial statements.
39
THE DAVENPORT FUNDS
STATEMENTS OF OPERATIONS (Continued)
Six Months Ended September 30, 2019 (Unaudited) |
| | Davenport
Small Cap
Focus
Fund | | | Davenport
Balanced
Income
Fund | |
INVESTMENT INCOME | | | | | | | | |
Dividends | | $ | 1,101,705 | | | $ | 1,579,257 | |
Foreign withholding taxes on dividends | | | — | | | | (23,462 | ) |
Interest | | | — | | | | 773,629 | |
TOTAL INVESTMENT INCOME | | | 1,101,705 | | | | 2,329,424 | |
| | | | | | | | | |
EXPENSES | | | | | | | | |
Investment advisory fees (Note 4) | | | 644,873 | | | | 556,344 | |
Administration fees (Note 4) | | | 114,384 | | | | 92,066 | |
Registration and filing fees | | | 20,518 | | | | 18,014 | |
Audit and tax services fees | | | 7,750 | | | | 8,500 | |
Trustees’ fees and expenses (Note 4) | | | 7,465 | | | | 7,465 | |
Custodian and bank service fees | | | 8,056 | | | | 4,994 | |
Compliance service fees (Note 4) | | | 6,099 | | | | 5,537 | |
Postage and supplies | | | 4,187 | | | | 2,650 | |
Legal fees | | | 3,320 | | | | 3,320 | |
Insurance expense | | | 1,902 | | | | 1,812 | |
Printing of shareholder reports | | | 1,804 | | | | 1,319 | |
Other expenses | | | 3,278 | | | | 6,349 | |
TOTAL EXPENSES | | | 823,636 | | | | 708,370 | |
| | | | | | | | | |
NET INVESTMENT INCOME | | | 278,069 | | | | 1,621,054 | |
| | | | | | | | | |
REALIZED AND UNREALIZED GAINS (LOSSES) ON INVESTMENTS AND FOREIGN CURRENCIES | | | | | | | | |
Net realized gains (losses) from: | | | | | | | | |
Investments | | | 891,122 | | | | 2,491,951 | |
Foreign currency transactions (Note 2) | | | — | | | | (47 | ) |
Net change in unrealized appreciation (depreciation) on investments | | | 9,923,468 | | | | 3,411,463 | |
NET REALIZED AND UNREALIZED GAINS ON INVESTMENTS AND FOREIGN CURRENCIES | | | 10,814,590 | | | | 5,903,367 | |
| | | | | | | | | |
NET INCREASE IN NET ASSETS FROM OPERATIONS | | $ | 11,092,659 | | | $ | 7,524,421 | |
See accompanying notes to financial statements.
40
DAVENPORT CORE FUND
STATEMENTS OF CHANGES IN NET ASSETS |
| | Six Months
Ended
September 30,
2019
(Unaudited) | | | Year
Ended
March 31,
2019 | |
FROM OPERATIONS | | | | | | | | |
Net investment income | | $ | 1,579,134 | | | $ | 2,357,447 | |
Net realized gains from investment transactions | | | 9,244,508 | | | | 5,883,146 | |
Net change in unrealized appreciation (depreciation) on investments | | | 35,835,766 | | | | 30,629,890 | |
Net increase in net assets from operations | | | 46,659,408 | | | | 38,870,483 | |
| | | | | | | | | |
DISTRIBUTIONS TO SHAREHOLDERS (Note 2) | | | (3,642,914 | ) | | | (21,768,874 | ) |
| | | | | | | | | |
FROM CAPITAL SHARE TRANSACTIONS | | | | | | | | |
Proceeds from shares sold | | | 22,413,346 | | | | 47,157,117 | |
Net asset value of shares issued in reinvestment of distributions to shareholders | | | 3,446,140 | | | | 20,895,848 | |
Payments for shares redeemed | | | (19,239,690 | ) | | | (33,846,129 | ) |
Net increase in net assets from capital share transactions | | | 6,619,796 | | | | 34,206,836 | |
| | | | | | | | | |
TOTAL INCREASE IN NET ASSETS | | | 49,636,290 | | | | 51,308,445 | |
| | | | | | | | | |
NET ASSETS | | | | | | | | |
Beginning of period | | | 516,227,840 | | | | 464,919,395 | |
End of period | | $ | 565,864,130 | | | $ | 516,227,840 | |
| | | | | | | | | |
CAPITAL SHARE ACTIVITY | | | | | | | | |
Shares sold | | | 900,176 | | | | 2,058,367 | |
Shares reinvested | | | 139,531 | | | | 905,013 | |
Shares redeemed | | | (773,141 | ) | | | (1,479,544 | ) |
Net increase in shares outstanding | | | 266,566 | | | | 1,483,836 | |
Shares outstanding at beginning of period | | | 21,735,466 | | | | 20,251,630 | |
Shares outstanding at end of period | | | 22,002,032 | | | | 21,735,466 | |
See accompanying notes to financial statements.
41
DAVENPORT VALUE & INCOME FUND
STATEMENTS OF CHANGES IN NET ASSETS |
| | Six Months
Ended
September 30,
2019
(Unaudited) | | | Year
Ended
March 31,
2019 | |
FROM OPERATIONS | | | | | | | | |
Net investment income | | $ | 7,304,895 | | | $ | 14,460,384 | |
Net realized gains (losses) from: | | | | | | | | |
Investments | | | 12,721,011 | | | | 9,004,922 | |
Foreign currency transactions | | | (410 | ) | | | (2,897 | ) |
Net change in unrealized appreciation (depreciation) on investments | | | 14,572,622 | | | | (4,227,734 | ) |
Net increase in net assets from operations | | | 34,598,118 | | | | 19,234,675 | |
| | | | | | | | | |
DISTRIBUTIONS TO SHAREHOLDERS (Note 2) | | | (8,078,245 | ) | | | (37,478,575 | ) |
| | | | | | | | | |
FROM CAPITAL SHARE TRANSACTIONS | | | | | | | | |
Proceeds from shares sold | | | 25,482,045 | | | | 68,940,134 | |
Net asset value of shares issued in reinvestment of distributions to shareholders | | | 7,240,730 | | | | 34,718,152 | |
Payments for shares redeemed | | | (32,136,992 | ) | | | (60,915,857 | ) |
Net increase in net assets from capital share transactions | | | 585,783 | | | | 42,742,429 | |
| | | | | | | | | |
TOTAL INCREASE IN NET ASSETS | | | 27,105,656 | | | | 24,498,529 | |
| | | | | | | | | |
NET ASSETS | | | | | | | | |
Beginning of period | | | 672,954,350 | | | | 648,455,821 | |
End of period | | $ | 700,060,006 | | | $ | 672,954,350 | |
| | | | | | | | | |
CAPITAL SHARE ACTIVITY | | | | | | | | |
Shares sold | | | 1,530,077 | | | | 4,212,521 | |
Shares reinvested | | | 432,606 | | | | 2,115,148 | |
Shares redeemed | | | (1,930,960 | ) | | | (3,725,345 | ) |
Net increase in shares outstanding | | | 31,723 | | | | 2,602,324 | |
Shares outstanding at beginning of period | | | 41,079,459 | | | | 38,477,135 | |
Shares outstanding at end of period | | | 41,111,182 | | | | 41,079,459 | |
See accompanying notes to financial statements.
42
DAVENPORT EQUITY OPPORTUNITIES FUND
STATEMENTS OF CHANGES IN NET ASSETS |
| | Six Months
Ended
September 30,
2019
(Unaudited) | | | Year
Ended
March 31,
2019 | |
FROM OPERATIONS | | | | | | | | |
Net investment loss | | $ | (155,374 | ) | | $ | (517,031 | ) |
Net realized gains from investment transactions | | | 5,640,664 | | | | 30,117,103 | |
Net change in unrealized appreciation (depreciation) on investments | | | 47,773,258 | | | | 11,629,631 | |
Net increase in net assets from operations | | | 53,258,548 | | | | 41,229,703 | |
| | | | | | | | | |
DISTRIBUTIONS TO SHAREHOLDERS (Note 2) | | | (14,123,596 | ) | | | (13,919,524 | ) |
| | | | | | | | | |
FROM CAPITAL SHARE TRANSACTIONS | | | | | | | | |
Proceeds from shares sold | | | 37,354,504 | | | | 26,095,613 | |
Net asset value of shares issued in reinvestment of distributions to shareholders | | | 13,642,857 | | | | 13,397,687 | |
Payments for shares redeemed | | | (17,340,977 | ) | | | (57,260,845 | ) |
Net increase (decrease) in net assets from capital share transactions | | | 33,656,384 | | | | (17,767,545 | ) |
| | | | | | | | | |
TOTAL INCREASE IN NET ASSETS | | | 72,791,336 | | | | 9,542,634 | |
| | | | | | | | | |
NET ASSETS | | | | | | | | |
Beginning of period | | | 409,002,387 | | | | 399,459,753 | |
End of period | | $ | 481,793,723 | | | $ | 409,002,387 | |
| | | | | | | | | |
CAPITAL SHARE ACTIVITY | | | | | | | | |
Shares sold | | | 1,842,895 | | | | 1,463,115 | |
Shares reinvested | | | 689,381 | | | | 778,031 | |
Shares redeemed | | | (860,123 | ) | | | (3,194,984 | ) |
Net increase (decrease) in shares outstanding | | | 1,672,153 | | | | (953,838 | ) |
Shares outstanding at beginning of period | | | 21,544,651 | | | | 22,498,489 | |
Shares outstanding at end of period | | | 23,216,804 | | | | 21,544,651 | |
See accompanying notes to financial statements.
43
DAVENPORT SMALL CAP FOCUS FUND
STATEMENTS OF CHANGES IN NET ASSETS |
| | Six Months
Ended
September 30,
2019
(Unaudited) | | | Year
Ended
March 31,
2019 | |
FROM OPERATIONS | | | | | | | | |
Net investment income | | $ | 278,069 | | | $ | 730,910 | |
Net realized gains from investment transactions | | | 891,122 | | | | 1,144,874 | |
Net change in unrealized appreciation (depreciation) on investments | | | 9,923,468 | | | | 1,274,066 | |
Net increase in net assets from operations | | | 11,092,659 | | | | 3,149,850 | |
| | | | | | | | | |
DISTRIBUTIONS TO SHAREHOLDERS (Note 2) | | | (1,035,544 | ) | | | (2,926,287 | ) |
| | | | | | | | | |
FROM CAPITAL SHARE TRANSACTIONS | | | | | | | | |
Proceeds from shares sold | | | 30,413,932 | | | | 58,704,586 | |
Net asset value of shares issued in reinvestment of distributions to shareholders | | | 998,430 | | | | 2,851,040 | |
Payments for shares redeemed | | | (8,925,831 | ) | | | (25,955,030 | ) |
Net increase in net assets from capital share transactions | | | 22,486,531 | | | | 35,600,596 | |
| | | | | | | | | |
TOTAL INCREASE IN NET ASSETS | | | 32,543,646 | | | | 35,824,159 | |
| | | | | | | | | |
NET ASSETS | | | | | | | | |
Beginning of period | | | 152,062,889 | | | | 116,238,730 | |
End of period | | $ | 184,606,535 | | | $ | 152,062,889 | |
| | | | | | | | | |
CAPITAL SHARE ACTIVITY | | | | | | | | |
Shares sold | | | 2,195,621 | | | | 4,406,141 | |
Shares reinvested | | | 72,878 | | | | 219,280 | |
Shares redeemed | | | (642,384 | ) | | | (2,086,572 | ) |
Net increase in shares outstanding | | | 1,626,115 | | | | 2,538,849 | |
Shares outstanding at beginning of period | | | 11,476,484 | | | | 8,937,635 | |
Shares outstanding at end of period | | | 13,102,599 | | | | 11,476,484 | |
See accompanying notes to financial statements.
44
DAVENPORT BALANCED INCOME FUND
STATEMENTS OF CHANGES IN NET ASSETS |
| | Six Months
Ended
September 30,
2019
(Unaudited) | | | Year
Ended
March 31,
2019 | |
FROM OPERATIONS | | | | | | | | |
Net investment income | | $ | 1,621,054 | | | $ | 3,093,736 | |
Net realized gains (losses) from: | | | | | | | | |
Investments | | | 2,491,951 | | | | (936,430 | ) |
Foreign currency transactions | | | (47 | ) | | | (310 | ) |
Net change in unrealized appreciation (depreciation) on investments | | | 3,411,463 | | | | 2,249,651 | |
Net increase in net assets from operations | | | 7,524,421 | | | | 4,406,647 | |
| | | | | | | | | |
DISTRIBUTIONS TO SHAREHOLDERS (Note 2) | | | (1,626,050 | ) | | | (3,736,702 | ) |
| | | | | | | | | |
FROM CAPITAL SHARE TRANSACTIONS | | | | | | | | |
Proceeds from shares sold | | | 14,221,070 | | | | 27,209,013 | |
Net asset value of shares issued in reinvestment of distributions to shareholders | | | 1,503,072 | | | | 3,497,522 | |
Payments for shares redeemed | | | (7,036,344 | ) | | | (18,444,828 | ) |
Net increase in net assets from capital share transactions | | | 8,687,798 | | | | 12,261,707 | |
| | | | | | | | | |
TOTAL INCREASE IN NET ASSETS | | | 14,586,169 | | | | 12,931,652 | |
| | | | | | | | | |
NET ASSETS | | | | | | | | |
Beginning of period | | | 142,199,302 | | | | 129,267,650 | |
End of period | | $ | 156,785,471 | | | $ | 142,199,302 | |
| | | | | | | | | |
CAPITAL SHARE ACTIVITY | | | | | | | | |
Shares sold | | | 1,230,003 | | | | 2,422,911 | |
Shares reinvested | | | 129,677 | | | | 312,892 | |
Shares redeemed | | | (609,616 | ) | | | (1,655,625 | ) |
Net increase in shares outstanding | | | 750,064 | | | | 1,080,178 | |
Shares outstanding at beginning of period | | | 12,543,932 | | | | 11,463,754 | |
Shares outstanding at end of period | | | 13,293,996 | | | | 12,543,932 | |
See accompanying notes to financial statements.
45
DAVENPORT CORE FUND
FINANCIAL HIGHLIGHTS |
Selected Per Share Data and Ratios for a Share Outstanding Throughout Each Period |
| | | Six Months
Ended
Sept. 30, | | |
Years Ended March 31,
| |
| | 2019
(Unaudited) | | | 2019 | | | 2018 | | | 2017 | | | 2016 | | | 2015 | |
Net asset value at beginning of period | | $ | 23.75 | | | $ | 22.96 | | | $ | 21.15 | | | $ | 18.78 | | | $ | 20.02 | | | $ | 19.30 | |
| | | | | | | | | | | | | | | | | | | | | | | | | |
Income (loss) from investment operations: | | | | | | | | | | | | | | | | | | | | | | | | |
Net investment income | | | 0.07 | | | | 0.11 | | | | 0.09 | | | | 0.11 | | | | 0.11 | | | | 0.10 | |
Net realized and unrealized gains (losses) on investments | | | 2.07 | | | | 1.74 | | | | 2.29 | | | | 2.92 | | | | (0.56 | ) | | | 2.20 | |
Total from investment operations | | | 2.14 | | | | 1.85 | | | | 2.38 | | | | 3.03 | | | | (0.45 | ) | | | 2.30 | |
| | | | | | | | | | | | | | | | | | | | | | | | | |
Less distributions: | | | | | | | | | | | | | | | | | | | | | | | | |
From net investment income | | | (0.07 | ) | | | (0.11 | ) | | | (0.11 | ) | | | (0.10 | ) | | | (0.11 | ) | | | (0.10 | ) |
From net realized gains | | | (0.10 | ) | | | (0.95 | ) | | | (0.46 | ) | | | (0.56 | ) | | | (0.68 | ) | | | (1.48 | ) |
Total distributions | | | (0.17 | ) | | | (1.06 | ) | | | (0.57 | ) | | | (0.66 | ) | | | (0.79 | ) | | | (1.58 | ) |
| | | | | | | | | | | | | | | | | | | | | | | | | |
Net asset value at end of period | | $ | 25.72 | | | $ | 23.75 | | | $ | 22.95 | | | $ | 21.15 | | | $ | 18.78 | | | $ | 20.02 | |
| | | | | | | | | | | | | | | | | | | | | | | | | |
Total return(a) | | | 9.03 | %(b) | | | 8.21 | % | | | 11.38 | % | | | 16.56 | % | | | (2.39 | %) | | | 12.42 | % |
| | | | | | | | | | | | | | | | | | | | | | | | | |
Net assets at end of period (000’s) | | $ | 565,864 | | | $ | 516,228 | | | $ | 464,919 | | | $ | 399,432 | | | $ | 337,229 | | | $ | 330,687 | |
| | | | | | | | | | | | | | | | | | | | | | | | | |
Ratio of total expenses to average net assets | | | 0.89 | %(c) | | | 0.89 | % | | | 0.90 | % | | | 0.90 | % | | | 0.92 | % | | | 0.93 | % |
| | | | | | | | | | | | | | | | | | | | | | | | | |
Ratio of net investment income to average net assets | | | 0.58 | %(c) | | | 0.48 | % | | | 0.41 | % | | | 0.56 | % | | | 0.56 | % | | | 0.49 | % |
| | | | | | | | | | | | | | | | | | | | | | | | | |
Portfolio turnover rate | | | 6 | %(b) | | | 21 | % | | | 22 | % | | | 23 | % | | | 23 | % | | | 21 | % |
(a) | Total return is a measure of the change in value of an investment in the Fund over the periods covered, which assumes any dividends or capital gains distributions are reinvested in shares of the Fund. Returns shown do not reflect the deduction of taxes a shareholder would pay on Fund distributions or the redemption of Fund shares. |
See accompanying notes to financial statements.
46
DAVENPORT VALUE & INCOME FUND
FINANCIAL HIGHLIGHTS |
Selected Per Share Data and Ratios for a Share Outstanding Throughout Each Period |
| | | Six Months
Ended
Sept. 30, | | |
Years Ended March 31,
| |
| | 2019
(Unaudited) | | | 2019 | | | 2018 | | | 2017 | | | 2016 | | | 2015 | |
Net asset value at beginning of period | | $ | 16.38 | | | $ | 16.85 | | | $ | 15.97 | | | $ | 14.40 | | | $ | 15.46 | | | $ | 14.71 | |
| | | | | | | | | | | | | | | | | | | | | | | | | |
Income (loss) from investment operations: | | | | | | | | | | | | | | | | | | | | | | | | |
Net investment income | | | 0.18 | | | | 0.36 | | | | 0.30 | | | | 0.30 | | | | 0.29 | | | | 0.25 | |
Net realized and unrealized gains (losses) on investments and foreign currencies | | | 0.67 | | | | 0.12 | | | | 1.39 | | | | 1.64 | | | | (0.36 | ) | | | 1.45 | |
Total from investment operations | | | 0.85 | | | | 0.48 | | | | 1.69 | | | | 1.94 | | | | (0.07 | ) | | | 1.70 | |
| | | | | | | | | | | | | | | | | | | | | | | | | |
Less distributions: | | | | | | | | | | | | | | | | | | | | | | | | |
From net investment income | | | (0.18 | ) | | | (0.36 | ) | | | (0.30 | ) | | | (0.31 | ) | | | (0.29 | ) | | | (0.25 | ) |
From net realized gains | | | (0.02 | ) | | | (0.59 | ) | | | (0.51 | ) | | | (0.06 | ) | | | (0.70 | ) | | | (0.70 | ) |
Total distributions | | | (0.20 | ) | | | (0.95 | ) | | | (0.81 | ) | | | (0.37 | ) | | | (0.99 | ) | | | (0.95 | ) |
| | | | | | | | | | | | | | | | | | | | | | | | | |
Net asset value at end of period | | $ | 17.03 | | | $ | 16.38 | | | $ | 16.85 | | | $ | 15.97 | | | $ | 14.40 | | | $ | 15.46 | |
| | | | | | | | | | | | | | | | | | | | | | | | | |
Total return(a) | | | 5.20 | %(b) | | | 2.96 | % | | | 10.67 | % | | | 13.60 | % | | | (0.46 | %) | | | 11.92 | % |
| | | | | | | | | | | | | | | | | | | | | | | | | |
Net assets at end of period (000’s) | | $ | 700,060 | | | $ | 672,954 | | | $ | 648,456 | | | $ | 561,995 | | | $ | 450,447 | | | $ | 407,777 | |
| | | | | | | | | | | | | | | | | | | | | | | | | |
Ratio of total expenses to average net assets | | | 0.88 | %(c) | | | 0.88 | % | | | 0.88 | % | | | 0.89 | % | | | 0.91 | % | | | 0.92 | % |
| | | | | | | | | | | | | | | | | | | | | | | | | |
Ratio of net investment income to average net assets | | | 2.13 | %(c) | | | 2.21 | % | | | 1.79 | % | | | 1.96 | % | | | 2.03 | % | | | 1.66 | % |
| | | | | | | | | | | | | | | | | | | | | | | | | |
Portfolio turnover rate | | | 10 | %(b) | | | 18 | % | | | 22 | % | | | 26 | % | | | 25 | % | | | 23 | % |
(a) | Total return is a measure of the change in value of an investment in the Fund over the periods covered, which assumes any dividends or capital gains distributions are reinvested in shares of the Fund. Returns shown do not reflect the deduction of taxes a shareholder would pay on Fund distributions or the redemption of Fund shares. |
See accompanying notes to financial statements.
47
DAVENPORT EQUITY OPPORTUNITIES FUND
FINANCIAL HIGHLIGHTS |
Selected Per Share Data and Ratios for a Share Outstanding Throughout Each Period |
| | | Six Months
Ended
Sept. 30, | | |
Years Ended March 31,
| |
| | 2019
(Unaudited) | | | 2019 | | | 2018 | | | 2017 | | | 2016 | | | 2015 | |
Net asset value at beginning of period | | $ | 18.98 | | | $ | 17.75 | | | $ | 15.64 | | | $ | 14.73 | | | $ | 16.61 | | | $ | 15.91 | |
| | | | | | | | | | | | | | | | | | | | | | | | | |
Income (loss) from investment operations: | | | | | | | | | | | | | | | | | | | | | | | | |
Net investment income (loss) | | | (0.01 | ) | | | (0.02 | ) | | | (0.04 | ) | | | 0.00 | (a) | | | 0.00 | (a) | | | 0.04 | |
Net realized and unrealized gains (losses) on investments | | | 2.43 | | | | 1.91 | | | | 2.15 | | | | 1.10 | | | | (1.14 | ) | | | 2.42 | |
Total from investment operations | | | 2.42 | | | | 1.89 | | | | 2.11 | | | | 1.10 | | | | (1.14 | ) | | | 2.46 | |
| | | | | | | | | | | | | | | | | | | | | | | | | |
Less distributions: | | | | | | | | | | | | | | | | | | | | | | | | |
From net investment income | | | — | | | | — | | | | — | | | | — | | | | (0.01 | ) | | | (0.26 | ) |
From net realized gains | | | (0.65 | ) | | | (0.66 | ) | | | — | | | | (0.19 | ) | | | (0.73 | ) | | | (1.50 | ) |
Total distributions | | | (0.65 | ) | | | (0.66 | ) | | | — | | | | (0.19 | ) | | | (0.74 | ) | | | (1.76 | ) |
| | | | | | | | | | | | | | | | | | | | | | | | | |
Net asset value at end of period | | $ | 20.75 | | | $ | 18.98 | | | $ | 17.75 | | | $ | 15.64 | | | $ | 14.73 | | | $ | 16.61 | |
| | | | | | | | | | | | | | | | | | | | | | | | | |
Total return(b) | | | 12.91 | %(c) | | | 11.02 | % | | | 13.49 | % | | | 7.57 | % | | | (7.07 | %) | | | 16.67 | % |
| | | | | | | | | | | | | | | | | | | | | | | | | |
Net assets at end of period (000’s) | | $ | 481,794 | | | $ | 409,002 | | | $ | 399,460 | | | $ | 351,754 | | | $ | 316,788 | | | $ | 277,703 | |
| | | | | | | | | | | | | | | | | | | | | | | | | |
Ratio of total expenses to average net assets | | | 0.90 | %(d) | | | 0.91 | % | | | 0.91 | % | | | 0.92 | % | | | 0.93 | % | | | 0.96 | % |
| | | | | | | | | | | | | | | | | | | | | | | | | |
Ratio of net investment income (loss) to average net assets | | | (0.07 | %)(d) | | | (0.13 | %) | | | (0.23 | %) | | | 0.00 | %(e) | | | 0.02 | % | | | 0.33 | % |
| | | | | | | | | | | | | | | | | | | | | | | | | |
Portfolio turnover rate | | | 7 | %(c) | | | 19 | % | | | 21 | % | | | 23 | % | | | 29 | % | | | 31 | % |
(a) | Amount rounds to less than $0.01 per share. |
(b) | Total return is a measure of the change in value of an investment in the Fund over the periods covered, which assumes any dividends or capital gains distributions are reinvested in shares of the Fund. Returns shown do not reflect the deduction of taxes a shareholder would pay on Fund distributions or the redemption of Fund shares. |
(e) | Amount rounds to less than 0.01%. |
See accompanying notes to financial statements.
48
DAVENPORT SMALL CAP FOCUS FUND
FINANCIAL HIGHLIGHTS |
Selected Per Share Data and Ratios for a Share Outstanding Throughout Each Period |
| | Six Months
Ended
Sept. 30,
2019
(Unaudited) | | | Year
Ended
March 31,
2019 | | | Year
Ended
March 31,
2018 | | | Year
Ended
March 31,
2017 | | | Year
Ended
March 31,
2016 | | | Period
Ended
March 31,
2015(a) | |
Net asset value at beginning of period | | $ | 13.25 | | | $ | 13.01 | | | $ | 12.13 | | | $ | 9.34 | | | $ | 10.41 | | | $ | 10.00 | |
| | | | | | | | | | | | | | | | | | | | | | | | | |
Income (loss) from investment operations: | | | | | | | | | | | | | | | | | | | | | | | | |
Net investment income (loss) | | | 0.02 | | | | 0.06 | | | | 0.02 | | | | 0.02 | | | | 0.01 | | | | (0.01 | ) |
Net realized and unrealized gains (losses) on investments | | | 0.90 | | | | 0.44 | | | | 1.22 | | | | 2.77 | | | | (1.07 | ) | | | 0.42 | |
Total from investment operations | | | 0.92 | | | | 0.50 | | | | 1.24 | | | | 2.79 | | | | (1.06 | ) | | | 0.41 | |
| | | | | | | | | | | | | | | | | | | | | | | | | |
Less distributions: | | | | | | | | | | | | | | | | | | | | | | | | |
From net investment income | | | (0.06 | ) | | | — | | | | — | | | | — | | | | — | | | | — | |
From net realized gains | | | (0.02 | ) | | | (0.26 | ) | | | (0.36 | ) | | | — | | | | (0.01 | ) | | | — | |
Total distributions | | | (0.08 | ) | | | (0.26 | ) | | | (0.36 | ) | | | — | | | | (0.01 | ) | | | — | |
| | | | | | | | | | | | | | | | | | | | | | | | | |
Net asset value at end of period | | $ | 14.09 | | | $ | 13.25 | | | $ | 13.01 | | | $ | 12.13 | | | $ | 9.34 | | | $ | 10.41 | |
| | | | | | | | | | | | | | | | | | | | | | | | | |
Total return(b) | | | 6.98 | %(c) | | | 3.90 | % | | | 10.28 | % | | | 29.87 | % | | | (10.19 | %) | | | 4.10 | %(c) |
| | | | | | | | | | | | | | | | | | | | | | | | | |
Net assets at end of period (000’s) | | $ | 184,607 | | | $ | 152,063 | | | $ | 116,239 | | | $ | 74,946 | | | $ | 39,636 | | | $ | 31,291 | |
| | | | | | | | | | | | | | | | | | | | | | | | | |
Ratio of total expenses to average net assets | | | 0.96 | %(d) | | | 0.97 | % | | | 1.00 | % | | | 1.06 | % | | | 1.15 | % | | | 1.25 | %(d)(e) |
| | | | | | | | | | | | | | | | | | | | | | | | | |
Ratio of net investment income (loss) to average net assets | | | 0.32 | %(d) | | | 0.51 | % | | | 0.26 | % | | | 0.09 | % | | | 0.14 | % | | | (0.30 | %)(d)(f) |
| | | | | | | | | | | | | | | | | | | | | | | | | |
Portfolio turnover rate | | | 19 | %(c) | | | 60 | % | | | 48 | % | | | 37 | % | | | 48 | % | | | 15 | %(c) |
(a) | Represents the period from commencement of operations (December 31, 2014) through March 31, 2015. |
(b) | Total return is a measure of the change in value of an investment in the Fund over the periods covered, which assumes any dividends or capital gains distributions are reinvested in shares of the Fund. Returns shown do not reflect the deduction of taxes a shareholder would pay on Fund distributions or the redemption of Fund shares. |
(e) | Absent advisory fee reductions, the ratio of total expenses to average net assets would have been 1.42%(d) for the period ended March 31, 2015. |
(f) | Ratio was determined after advisory fee reduction. |
See accompanying notes to financial statements.
49
DAVENPORT BALANCED INCOME FUND
FINANCIAL HIGHLIGHTS |
Selected Per Share Data and Ratios for a Share Outstanding Throughout Each Period |
| | Six Months
Ended
Sept. 30,
2019
(Unaudited) | | | Year
Ended
March 31,
2019 | | | Year
Ended
March 31,
2018 | | | Year
Ended
March 31,
2017 | | | Period
Ended
March 31,
2016(a) | |
Net asset value at beginning of period | | $ | 11.34 | | | $ | 11.28 | | | $ | 11.02 | | | $ | 10.27 | | | $ | 10.00 | |
| | | | | | | | | | | | | | | | | | | | | |
Income from investment operations: | | | | | | | | | | | | | | | | | | | | |
Net investment income | | | 0.12 | | | | 0.25 | | | | 0.20 | | | | 0.14 | | | | 0.03 | |
Net realized and unrealized gains on investments and foreign currencies | | | 0.46 | | | | 0.12 | | | | 0.33 | | | | 0.74 | | | | 0.26 | |
Total from investment operations | | | 0.58 | | | | 0.37 | | | | 0.53 | | | | 0.88 | | | | 0.29 | |
| | | | | | | | | | | | | | | | | | | | | |
Less distributions: | | | | | | | | | | | | | | | | | | | | |
From net investment income | | | (0.13 | ) | | | (0.24 | ) | | | (0.17 | ) | | | (0.13 | ) | | | (0.02 | ) |
From net realized gains | | | — | | | | (0.07 | ) | | | (0.10 | ) | | | — | | | | — | |
Total distributions | | | (0.13 | ) | | | (0.31 | ) | | | (0.27 | ) | | | (0.13 | ) | | | (0.02 | ) |
| | | | | | | | | | | | | | | | | | | | | |
Net asset value at end of period | | $ | 11.79 | | | $ | 11.34 | | | $ | 11.28 | | | $ | 11.02 | | | $ | 10.27 | |
| | | | | | | | | | | | | | | | | | | | | |
Total return(b) | | | 5.11 | %(c) | | | 3.35 | % | | | 4.81 | % | | | 8.59 | % | | | 2.90 | %(c) |
| | | | | | | | | | | | | | | | | | | | | |
Net assets at end of period (000’s) | | $ | 156,785 | | | $ | 142,199 | | | $ | 129,268 | | | $ | 83,419 | | | $ | 17,885 | |
| | | | | | | | | | | | | | | | | | | | | |
Ratio of total expenses to average net assets | | | 0.95 | %(d) | | | 0.96 | % | | | 0.97 | % | | | 1.13 | %(e) | | | 1.25 | %(d)(f) |
| | | | | | | | | | | | | | | | | | | | | |
Ratio of net investment income to average net assets | | | 2.18 | %(d) | | | 2.28 | % | | | 1.85 | % | | | 1.55 | % | | | 1.65 | %(d)(g) |
| | | | | | | | | | | | | | | | | | | | | |
Portfolio turnover rate | | | 13 | %(c) | | | 30 | % | | | 23 | % | | | 16 | % | | | 7 | %(c) |
(a) | Represents the period from commencement of operations (December 31, 2015) through March 31, 2016. |
(b) | Total return is a measure of the change in value of an investment in the Fund over the periods covered, which assumes any dividends or capital gains distributions are reinvested in shares of the Fund. Returns shown do not reflect the deduction of taxes a shareholder would pay on Fund distributions or the redemption of Fund shares. |
(e) | Absent advisory fee reductions and expense reimbursements recouped by the Adviser, the ratio of total expenses to average net assets would have been 1.08% for the year ended March 31, 2017. |
(f) | Absent advisory fee reductions and expense reimbursements, the ratio of total expenses to average net assets would have been 2.25%(d) for the period ended March 31, 2016 (Note 4). |
(g) | Ratio was determined after advisory fee reduction and expense reimbursements. |
See accompanying notes to financial statements.
50
THE DAVENPORT FUNDS
NOTES TO FINANCIAL STATEMENTS
September 30, 2019 (Unaudited)
1. Organization
Davenport Core Fund, Davenport Value & Income Fund, Davenport Equity Opportunities Fund, Davenport Small Cap Focus Fund and Davenport Balanced Income Fund (individually, a “Fund,” and, collectively, the “Funds”) are each a no-load series of the Williamsburg Investment Trust (the “Trust”), an open-end management investment company registered under the Investment Company Act of 1940, as amended. The Trust was organized as a Massachusetts business trust on July 18, 1988. Other series of the Trust are not incorporated in this report.
Davenport Core Fund’s investment objective is long term growth of capital.
Davenport Value & Income Fund’s investment objective is to achieve long term growth while generating current income through dividend payments on portfolio securities.
Davenport Equity Opportunities Fund’s investment objective is long term capital appreciation.
Davenport Small Cap Focus Fund’s investment objective is long term capital appreciation.
Davenport Balanced Income Fund’s investment objective is current income and an opportunity for long term growth.
Davenport Core Fund, Davenport Value & Income Fund, Davenport Small Cap Focus Fund and Davenport Balanced Income Fund are each classified as a diversified fund. Davenport Equity Opportunities Fund is classified as a non-diversified fund.
2. Significant Accounting Policies
Each Fund follows accounting and reporting guidance under Financial Accounting Standards Board Accounting Standards Codification Topic 946, “Financial Services – Investment Companies.” The following is a summary of the Funds’ significant accounting policies. The policies are in conformity with accounting principles generally accepted in the United States of America (“GAAP”).
Securities valuation — The Funds’ portfolio securities are valued as of the close of business of the regular session of the New York Stock Exchange (the “NYSE”) (normally 4:00 p.m. Eastern time). Securities traded on a national stock exchange, including common stocks and exchange-traded funds (“ETFs”), are valued based upon the closing price on the principal exchange where the security is traded, if available, otherwise, at the last quoted bid price. Securities that are quoted by NASDAQ are valued at the NASDAQ Official Closing Price. Investments representing shares of money market funds and other open-end investment companies, other than ETFs, are valued at their net asset value (“NAV”) as reported by such companies. When using a quoted price and when the market is considered active, securities will be classified as Level 1 within the fair value hierarchy (see below).
Fixed income securities, including corporate bonds and U.S. Treasury obligations, are typically valued on the basis of prices provided by an independent pricing service. The prices provided by the pricing service are determined with consideration given to institutional bid and last sale
51
THE DAVENPORT FUNDS
NOTES TO FINANCIAL STATEMENTS (Continued)
prices and take into account securities prices, yields, maturities, call features, ratings, institutional trading in similar groups of securities, and developments related to specific securities. Given the inputs used by the pricing service, these securities are classified as Level 2 within the fair value hierarchy.
When market quotations are not readily available, if a pricing service cannot provide a price, or if the investment adviser believes the price received from the pricing service is not indicative of market value, securities will be valued in good faith at fair value using methods consistent with procedures adopted by the Board of Trustees and will be classified as Level 2 or 3 within the fair value hierarchy, depending on the inputs used. Such methods of fair valuation may include, but are not limited to: multiple of earnings, multiple of book value, discount from market of a similar freely traded security, purchase price of the security, subsequent private transactions in the security or related securities, or a combination of these and other factors.
GAAP establishes a single authoritative definition of fair value, sets out a framework for measuring fair value and requires additional disclosures about fair value measurements.
Various inputs are used in determining the value of the Funds’ investments. These inputs are summarized in the three broad levels listed below:
| | ● | Level 1 – quoted prices in active markets for identical securities |
| | ● | Level 2 – other significant observable inputs |
| | ● | Level 3 – significant unobservable inputs |
The inputs or methodology used for valuing securities are not necessarily an indication of the risks associated with investing in those securities. The inputs used to measure fair value may fall into different levels of the fair value hierarchy. In such cases, for disclosure purposes, the level in the fair value hierarchy within which the fair value measurement falls in its entirety is determined based on the lowest level input that is significant to the fair value measurement.
The following is a summary of the inputs used to value the Funds’ investments as of September 30, 2019, by security type:
Davenport Core Fund | | Level 1 | | | Level 2 | | | Level 3 | | | Total | |
Common Stocks | | $ | 541,923,085 | | | $ | — | | | $ | — | | | $ | 541,923,085 | |
Money Market Funds | | | 8,160,239 | | | | — | | | | — | | | | 8,160,239 | |
Total | | $ | 550,083,324 | | | $ | — | | | $ | — | | | $ | 550,083,324 | |
Davenport Value & Income Fund | | Level 1 | | | Level 2 | | | Level 3 | | | Total | |
Common Stocks | | $ | 660,822,506 | | | $ | — | | | $ | — | | | $ | 660,822,506 | |
Money Market Funds | | | 38,407,418 | | | | — | | | | — | | | | 38,407,418 | |
Total | | $ | 699,229,924 | | | $ | — | | | $ | — | | | $ | 699,229,924 | |
52
THE DAVENPORT FUNDS
NOTES TO FINANCIAL STATEMENTS (Continued)
Davenport Equity Opportunities Fund | | Level 1 | | | Level 2 | | | Level 3 | | | Total | |
Common Stocks | | $ | 466,845,899 | | | $ | — | | | $ | — | | | $ | 466,845,899 | |
Money Market Funds | | | 14,856,555 | | | | — | | | | — | | | | 14,856,555 | |
Total | | $ | 481,702,454 | | | $ | — | | | $ | — | | | $ | 481,702,454 | |
Davenport Small Cap Focus Fund | | Level 1 | | | Level 2 | | | Level 3 | | | Total | |
Common Stocks | | $ | 171,889,857 | | | $ | — | | | $ | — | | | $ | 171,889,857 | |
Money Market Funds | | | 11,830,357 | | | | — | | | | — | | | | 11,830,357 | |
Total | | $ | 183,720,214 | | | $ | — | | | $ | — | | | $ | 183,720,214 | |
Davenport Balanced Income Fund | | Level 1 | | | Level 2 | | | Level 3 | | | Total | |
Common Stocks | | $ | 90,327,525 | | | $ | — | | | $ | — | | | $ | 90,327,525 | |
Fixed Rate Corporate Bonds | | | — | | | | 28,733,054 | | | | — | | | | 28,733,054 | |
Variable Rate Corporate Bonds | | | — | | | | 12,498,546 | | | | — | | | | 12,498,546 | |
U.S. Treasury Obligations | | | — | | | | 15,919,984 | | | | — | | | | 15,919,984 | |
Money Market Funds | | | 8,733,433 | | | | — | | | | — | | | | 8,733,433 | |
Total | | $ | 99,060,958 | | | $ | 57,151,584 | | | $ | — | | | $ | 156,212,542 | |
Refer to each Fund’s Schedule of Investments for a listing of the securities by sector type. There were no Level 3 securities or derivative instruments held by the Funds as of or during the six months ended September 30, 2019.
Foreign currency translation — Investment securities and other assets and liabilities denominated in or expected to settle in foreign currencies, if any, are translated into U.S. dollars based on exchange rates on the following basis:
| | A. | The fair values of investment securities and other assets and liabilities are translated as of the close of the NYSE each day. |
| | B. | Purchases and sales of investment securities and income and expenses are translated at the rate of exchange prevailing as of 4:00 p.m. Eastern time on the respective date of such transactions. |
| | C. | The Funds do not isolate that portion of the results of operations caused by changes in foreign exchange rates on investments from those caused by changes in market prices of securities held. Such fluctuations are included with the net realized and unrealized gains or losses on investments. |
Reported net realized foreign exchange gains or losses arise from 1) purchases and sales of foreign currencies and 2) the difference between the amounts of dividends and foreign withholding taxes recorded on the Fund’s books and the U.S. dollar equivalent of the amounts actually received or paid. Reported net unrealized foreign exchange gains and losses arise from changes in the value of assets and liabilities that result from changes in exchange rates.
53
THE DAVENPORT FUNDS
NOTES TO FINANCIAL STATEMENTS (Continued)
Share valuation — The NAV per share of each Fund is calculated daily by dividing the total value of its assets, less liabilities, by the number of shares outstanding. The offering price and redemption price per share of each Fund is equal to the NAV per share.
Investment income — Interest income is accrued as earned. Discounts and premiums on fixed-income securities are amortized using the interest method. Dividend income is recorded on the ex-dividend date. The Funds record distributions received from investments in real estate investment trusts (also known as “REITs”) in excess of income from underlying investments as a reduction of cost of investments and/or realized gain. These amounts are recorded once the issuers provide information about the actual composition of the distributions. Withholding taxes on foreign dividends have been recorded in accordance with the Funds’ understanding of the applicable country’s rules and tax rates.
Investment transactions — Investment transactions are accounted for on trade date for financial reporting purposes. Realized gains and losses on investment securities sold are determined on a specific identification basis.
Common expenses — Common expenses of the Trust are allocated among the Funds and the other series of the Trust based on relative net assets of each series or the nature of the services performed and the relative applicability to each series.
Distributions to shareholders — Dividends arising from net investment income, if any, are declared and paid quarterly to shareholders of Davenport Core Fund, Davenport Value & Income Fund, Davenport Small Cap Focus Fund and Davenport Balanced Income Fund; and declared and paid semi-annually to shareholders of Davenport Equity Opportunities Fund. Net realized short-term capital gains, if any, may be distributed throughout the year and net realized long-term capital gains, if any, are distributed at least once each year. The amount of distributions from net investment income and net realized capital gains are determined in accordance with federal income tax regulations, which may differ from GAAP. Dividends and distributions are recorded on the ex-dividend date.
The tax character of distributions paid during the periods ended September 30, 2019 and March 31, 2019 was as follows:
| Period
Ended | | Ordinary
Income | | | Long-Term
Capital Gains | | | Total
Distributions | |
Davenport Core Fund | 09/30/19 | | $ | 1,574,400 | | | $ | 2,068,514 | | | $ | 3,642,914 | |
| | 03/31/19 | | $ | 2,257,754 | | | $ | 19,511,120 | | | $ | 21,768,874 | |
Davenport Value & Income Fund | 09/30/19 | | $ | 7,137,398 | | | $ | 940,847 | | | $ | 8,078,245 | |
| | 03/31/19 | | $ | 14,871,389 | | | $ | 22,607,186 | | | $ | 37,478,575 | |
Davenport Equity Opportunities Fund | 09/30/19 | | $ | — | | | $ | 14,123,596 | | | $ | 14,123,596 | |
| | 03/31/19 | | $ | — | | | $ | 13,919,524 | | | $ | 13,919,524 | |
Davenport Small Cap Focus Fund | 09/30/19 | | $ | 793,501 | | | $ | 242,043 | | | $ | 1,035,544 | |
| | 03/31/19 | | $ | — | | | $ | 2,926,287 | | | $ | 2,926,287 | |
Davenport Balanced Income Fund | 09/30/19 | | $ | 1,626,050 | | | $ | — | | | $ | 1,626,050 | |
| | 03/31/19 | | $ | 3,133,775 | | | $ | 602,927 | | | $ | 3,736,702 | |
54
THE DAVENPORT FUNDS
NOTES TO FINANCIAL STATEMENTS (Continued)
Estimates — The preparation of financial statements in conformity with GAAP requires management to make estimates and assumptions that affect the reported amounts of assets and liabilities and disclosure of contingent assets and liabilities as of the date of the financial statements and the reported amounts of income and expenses during the reporting period. Actual results could differ from those estimates.
Federal income tax — Each Fund has qualified and intends to continue to qualify as a regulated investment company under the Internal Revenue Code of 1986, as amended (the “Code”). Qualification generally will relieve the Funds of liability for federal income taxes to the extent 100% of their net investment income and net realized capital gains are distributed in accordance with the Code.
In order to avoid imposition of the excise tax applicable to regulated investment companies, it is also each Fund’s intention to declare as dividends in each calendar year at least 98% of its net investment income (earned during the calendar year) and 98.2% of its net realized capital gains (earned during the twelve months ended October 31) plus undistributed amounts from prior years.
The following information is computed on a tax basis for each item as of September 30, 2019:
| | Davenport
Core Fund | | | Davenport
Value &
Income Fund | | | Davenport
Equity
Opportunities
Fund | |
Cost of portfolio investments | | $ | 334,994,782 | | | $ | 572,955,399 | | | $ | 337,115,218 | |
Gross unrealized appreciation | | $ | 223,605,581 | | | $ | 142,837,562 | | | $ | 155,056,998 | |
Gross unrealized depreciation | | | (8,517,039 | ) | | | (16,563,037 | ) | | | (10,469,762 | ) |
Net unrealized appreciation | | | 215,088,542 | | | | 126,274,525 | | | | 144,587,236 | |
Accumulated ordinary income (loss) | | | 86,565 | | | | 384,402 | | | | (155,374 | ) |
Accumulated capital and other gains | | | 9,243,995 | | | | 12,719,034 | | | | 5,639,272 | |
Accumulated earnings | | $ | 224,419,102 | | | $ | 139,377,961 | | | $ | 150,071,134 | |
| | Davenport
Small Cap
Focus Fund | | | Davenport
Balanced
Income Fund | |
Cost of portfolio investments | | $ | 159,296,674 | | | $ | 145,960,020 | |
Gross unrealized appreciation | | $ | 33,680,325 | | | $ | 14,139,254 | |
Gross unrealized depreciation | | | (9,256,785 | ) | | | (3,886,732 | ) |
Net unrealized appreciation | | | 24,423,540 | | | | 10,252,522 | |
Accumulated ordinary income | | | 453,259 | | | | 303,197 | |
Capital loss carryforwards | | | — | | | | (361,568 | ) |
Accumulated capital and other gains | | | 1,058,573 | | | | 2,115,099 | |
Accumulated earnings | | $ | 25,935,372 | | | $ | 12,309,250 | |
55
THE DAVENPORT FUNDS
NOTES TO FINANCIAL STATEMENTS (Continued)
The difference between the federal income tax cost of portfolio investments and the financial statement cost of portfolio investments for each Fund, except Davenport Value & Income Fund, is due to certain timing differences in the recognition of capital gains and losses under income tax regulations and GAAP. These timing differences are temporary in nature and are due to the tax deferral of losses on wash sales and adjustments to basis on publicly traded partnerships and passive foreign investment companies.
As of March 31, 2019, Davenport Balanced Income Fund had a short-term capital loss carryforward of $361,568 for federal income tax purposes, which may be carried forward indefinitely. This capital loss carryforward is available to offset net realized capital gains in the current and future years, thereby reducing future taxable gains distributions.
The Funds recognize the tax benefits or expenses of uncertain tax positions only when the position is “more likely than not” to be sustained assuming examination by tax authorities. Management has reviewed the tax positions taken on Federal income tax returns for each Fund for the current and all open tax years (generally, three years) and has concluded that no provision for unrecognized tax benefits or expenses is required in these financial statements.
3. Investment Transactions
Investment transactions, other than short-term investments and U.S. government securities, were as follows for the six months ended September 30, 2019:
| | Davenport
Core Fund | | | Davenport
Value &
Income Fund | | | Davenport
Equity
Opportunities
Fund | |
Purchases of investment securities | | $ | 35,546,838 | | | $ | 71,573,290 | | | $ | 55,628,689 | |
Proceeds from sales and maturities of investment securities | | $ | 33,357,211 | | | $ | 65,559,938 | | | $ | 29,444,225 | |
| | Davenport
Small Cap
Focus Fund | | | Davenport
Balanced
Income Fund | |
Purchases of investment securities | | $ | 55,875,245 | | | $ | 21,867,607 | |
Proceeds from sales and maturities of investment securities | | $ | 30,431,221 | | | $ | 15,350,621 | |
4. Transactions with Related Parties
INVESTMENT ADVISORY AGREEMENTS
Each Fund’s investments are managed by Davenport & Company LLC (the “Adviser”) under the terms of an Investment Advisory Agreement. Under the Investment Advisory Agreement, each Fund pays the Adviser a fee, which is computed and accrued daily and paid monthly, at an annual rate of 0.75% of its average daily net assets. Certain officers and a Trustee of the Trust are also officers of the Adviser.
56
THE DAVENPORT FUNDS
NOTES TO FINANCIAL STATEMENTS (Continued)
With respect to Davenport Small Cap Focus Fund and Davenport Balanced Income Fund, the Adviser had agreed, until August 1, 2019, to reduce its investment advisory fees and to reimburse other operating expenses to the extent necessary to limit total annual operating expenses (excluding acquired fund fees and expenses) of each such Fund to an amount not exceeding 1.25% of average daily net assets. Any such fee reductions by the Adviser, or payments by the Adviser of expenses which are a Fund’s obligation, were subject to repayment by the Funds for a period of three years from the end of the fiscal year when such fee reductions or expense reimbursements occurred, provided a Fund was able to affect such repayment and remain in compliance with the undertaking by the Adviser to limit expenses of the Fund. During the six months ended September 30, 2019, the Adviser was not required to reduce its advisory fees for Davenport Small Cap Focus Fund or Davenport Balanced Income Fund. As of September 30, 2019, the Adviser has recouped all prior fee reductions or expense reimbursements from Davenport Small Cap Focus Fund and Davenport Balanced Income Fund.
A significant portion of the Funds’ investment trades are executed through an affiliated broker-dealer of the Adviser. No commissions are paid by the Funds to the Adviser or the affiliate for these trades.
OTHER SERVICE PROVIDERS
Ultimus Fund Solutions, LLC (“Ultimus”) provides administration, fund accounting, compliance and transfer agent services to the Funds. The Funds pay Ultimus fees in accordance with the agreements for such services. In addition, the Funds pay out-of-pocket expenses including, but not limited to, postage, supplies, and costs of pricing the Funds’ portfolio securities. Certain officers of the Trust are also officers of Ultimus, or of Ultimus Fund Distributors, LLC (the “Distributor”), the principal underwriter of each Fund’s shares and an affiliate of Ultimus. The Distributor is compensated by the Adviser (not the Funds) for acting as principal underwriter.
COMPENSATION OF TRUSTEES
Trustees and officers affiliated with the Adviser or Ultimus are not compensated by the Trust for their services. Each Trustee who is not an affiliated person of the Adviser or Ultimus receives from the Trust an annual retainer of $20,000, payable quarterly; a fee of $2,000 for attendance at each meeting of the Board of Trustees (except that such fee is $3,000 for the independent chair); and a fee of $1,000 for attendance at each meeting of any committee of the Board (except that such fee is $1,500 for the committee chair); plus reimbursement of travel and other expenses incurred in attending meetings. Each Fund pays its proportionate share of such fees along with the other series of the Trust.
5. Sector Risk
If a Fund has significant investments in the securities of issuers in industries within a particular business sector, any development affecting that sector will have a greater impact on the value of the net assets of the Fund than would be the case if the Fund did not have significant investments in that sector. In addition, this may increase the risk of loss of an investment in the Fund and increase the volatility of the Fund’s NAV per share. From time to time, circumstances may
57
THE DAVENPORT FUNDS
NOTES TO FINANCIAL STATEMENTS (Continued)
affect a particular sector and the companies within such sector. For instance, economic or market factors, regulation or deregulation, or other developments may negatively impact all companies in a particular sector and therefore the value of a Fund’s portfolio would be adversely affected. As of September 30, 2019, Davenport Value & Income Fund, Davenport Equity Opportunities Fund and Davenport Small Cap Focus Fund had 25.8%, 27.3% and 27.5%, respectfully, of the value of their net assets invested in common stocks within the Financials sector.
6. Contingencies and Commitments
The Funds indemnify the Trust’s officers and Trustees for certain liabilities that might arise from the performance of their duties to the Funds. Additionally, in the normal course of business the Funds enter into contracts that contain a variety of representations and warranties and which provide general indemnifications. The Funds’ maximum exposure under these arrangements is unknown, as this would involve future claims that may be made against the Funds that have not yet occurred. However, based on experience, the Funds expect the risk of loss to be remote.
7. Subsequent Events
The Funds are required to recognize in the financial statements the effects of all subsequent events that provide additional evidence about conditions that existed as of the date of the Statements of Assets and Liabilities. For non-recognized subsequent events that must be disclosed to keep the financial statements from being misleading, the Funds are required to disclose the nature of the event as well as an estimate of its financial effect, or a statement that such an estimate cannot be made. Management has evaluated subsequent events through the issuance of these financial statements and has noted no such events.
58
THE DAVENPORT FUNDS
YOUR FUNDS’ EXPENSES (Unaudited)
We believe it is important for you to understand the impact of costs on your investment. All mutual funds have operating expenses. As a shareholder of the Funds, you incur ongoing costs, including management fees and other expenses. These ongoing costs, which are deducted from each Fund’s gross income, directly reduce the investment return of the Funds.
A mutual fund’s ongoing costs are expressed as a percentage of its average net assets. This figure is known as the expense ratio. The following examples are intended to help you understand the ongoing costs (in dollars) of investing in the Funds and to compare these costs with the ongoing costs of investing in other mutual funds. The examples below are based on an investment of $1,000 made at the beginning of the period shown and held for the entire period (April 1, 2019 and held through September 30, 2019).
The table below illustrates each Fund’s ongoing costs in two ways:
Actual fund return – This section helps you to estimate the actual expenses that you paid over the period. The “Ending Account Value” shown is derived from each Fund’s actual return, and the fourth column shows the dollar amount of operating expenses that would have been paid by an investor who started with $1,000 in the Funds. You may use the information here, together with the amount you invested, to estimate the expenses that you paid over the period.
To do so, simply divide your account value by $1,000 (for example, an $8,600 account value divided by $1,000 = 8.6), then multiply the result by the number given for the applicable Fund under the heading “Expenses Paid During Period.”
Hypothetical 5% return – This section is intended to help you compare each Fund’s ongoing costs with those of other mutual funds. It assumes that each Fund had an annual return of 5% before expenses during the period shown, but that the expense ratio is unchanged. In this case, because the return used is not each Fund’s actual return, the results do not apply to your investment. The example is useful in making comparisons because the U.S. Securities and Exchange Commission (the “SEC”) requires all mutual funds to calculate expenses based on a 5% return. You can assess each Fund’s ongoing costs by comparing this hypothetical example with the hypothetical examples that appear in shareholder reports of other funds.
Note that expenses shown in the table are meant to highlight and help you compare ongoing costs only. The Funds do not charge sales loads or redemption fees.
The calculations assume no shares were bought or sold during the period. Your actual costs may have been higher or lower, depending on the amount of your investment and the timing of any purchases or redemptions.
More information about each Fund’s expenses, including historical annual expense ratios, can be found in this report. For additional information on operating expenses and other shareholder costs, please refer to the Funds’ prospectus.
59
THE DAVENPORT FUNDS
YOUR FUNDS’ EXPENSES (Unaudited) (Continued)
| Beginning
Account Value
April 1,
2019 | Ending
Account Value
September 30,
2019 | Expense
Ratio(a) | Expenses Paid
During Period(b) |
Davenport Core Fund | | | | |
Based on Actual Fund Return | $1,000.00 | $1,090.30 | 0.89% | $4.66 |
Based on Hypothetical 5% Return (before expenses) | $1,000.00 | $1,020.61 | 0.89% | $4.51 |
Davenport Value & Income Fund |
Based on Actual Fund Return | $1,000.00 | $1,052.00 | 0.88% | $4.53 |
Based on Hypothetical 5% Return (before expenses) | $1,000.00 | $1,020.66 | 0.88% | $4.46 |
Davenport Equity Opportunities Fund |
Based on Actual Fund Return | $1,000.00 | $1,129.10 | 0.90% | $4.80 |
Based on Hypothetical 5% Return (before expenses) | $1,000.00 | $1,020.56 | 0.90% | $4.56 |
Davenport Small Cap Focus Fund |
Based on Actual Fund Return | $1,000.00 | $1,069.80 | 0.96% | $4.98 |
Based on Hypothetical 5% Return (before expenses) | $1,000.00 | $1,020.26 | 0.96% | $4.86 |
Davenport Balanced Income Fund |
Based on Actual Fund Return | $1,000.00 | $1,051.10 | 0.95% | $4.88 |
Based on Hypothetical 5% Return (before expenses) | $1,000.00 | $1,020.31 | 0.95% | $4.81 |
(a) | Annualized, based on each Fund’s most recent one-half year expenses. |
(b) | Expenses are equal to each Fund’s annualized expense ratio multiplied by the average account value over the period, multiplied by 183/365 (to reflect the one-half year period). |
60
THE DAVENPORT FUNDS
OTHER INFORMATION (Unaudited) |
A description of the policies and procedures that the Funds use to vote proxies relating to portfolio securities is available without charge upon request by calling toll-free 1-800-281-3217, or on the SEC’s website at www.sec.gov. Information regarding how the Funds voted proxies relating to portfolio securities during the most recent 12-month period ended June 30 is also available without charge upon request by calling toll-free 1-800-281-3217, or on the SEC’s website at www.sec.gov.
The Trust files a complete listing of portfolio holdings for each Fund with the SEC as of the end of the first and third quarters of each fiscal year on Form N-Q or as an exhibit to its reports on Form N-Q’s successor form, Form N-PORT. These filings are available upon request by calling 1-800-281-3217. Furthermore, you may obtain a copy of these filings on the SEC’s website at www.sec.gov.
A complete listing of portfolio holdings for each Fund is updated daily and can be reviewed at the Funds’ website at www.investdavenport.com.
61
This page intentionally left blank.
Privacy Notice |
FACTS | WHAT DO THE DAVENPORT FUNDS DO WITH YOUR PERSONAL INFORMATION? |
| | | | |
Why? | Financial companies choose how they share your personal information. Federal law gives consumers the right to limit some but not all sharing. Federal law also requires us to tell you how we collect, share, and protect your personal information. Please read this notice carefully to understand what we do. |
| | | | |
What? | The types of personal information we collect and share depend on the product or service you have with us. This information can include: ■ Social Security number ■ Assets ■ Retirement Assets ■ Transaction History ■ Checking Account Information ■ Purchase History ■ Account Balances ■ Account Transactions ■ Wire Transfer Instructions When you areno longer our customer, we continue to share your information as described in this notice. |
| | | | |
How? | All financial companies need to share your personal information to run their everyday business. In the section below, we list the reasons financial companies can share their customers’ personal information; the reasons The Davenport Funds choose to share; and whether you can limit this sharing. |
| | | | |
Reasons we can share your personal information | Do The Davenport Funds share? | Can you limit this sharing? |
For our everyday business purposes –
Such as to process your transactions, maintain your account(s), respond to court orders and legal investigations, or report to credit bureaus | Yes | No |
For our marketing purposes –
to offer our products and services to you | No | We don’t share |
For joint marketing with other financial companies | No | We don’t share |
For our affiliates’ everyday business purposes –information about your creditworthiness | No | We don’t share |
For nonaffiliates to market to you | No | We don’t share |
| | | | |
Questions? | Call 1-800-281-3217 |
Who we are |
Who is providing this notice? | Williamsburg Investment Trust Ultimus Fund Distributors, LLC Ultimus Fund Solutions, LLC |
What we do |
How do The Davenport Funds protect my personal information? | To protect your personal information from unauthorized access and use, we use security measures that comply with federal law. These measures include computer safeguards and secured files and buildings. Our service providers are held accountable for adhering to strict policies and procedures to prevent any misuse of your nonpublic personal information. |
How do The Davenport Funds collect my personal information? | We collect your personal information, for example, when you ■ Provide account information ■ Give us your contact information ■ Make deposits or withdrawals from your account ■ Make a wire transfer ■ Tell us where to send the money ■ Tell us who receives the money ■ Show your government-issued ID ■ Show your driver’s license We also collect your personal information from other companies. |
Why can’t I limit all sharing? | Federal law gives you the right to limit only ■ Sharing for affiliates’ everyday business purposes – information about your creditworthiness ■ Affiliates from using your information to market to you ■ Sharing for nonaffiliates to market to you State laws and individual companies may give you additional rights to limit sharing. |
| | |
Definitions |
Affiliates | Companies related by common ownership or control. They can be financial and nonfinancial companies. ■Davenport & Company LLC, the investment adviser to The Davenport Funds, could be deemed to be an affiliate. |
Nonaffiliates | Companies not related by common ownership or control. They can be financial and nonfinancial companies ■The Davenport Funds do not share with nonaffiliates so they can market to you |
Joint marketing | A formal agreement between nonaffiliated financial companies that together market financial products or services to you. ■The Davenport Funds don’t jointly market. |
THE DAVENPORT FUNDS
Investment Adviser
Davenport & Company LLC
One James Center
901 East Cary Street
Richmond, Virginia 23219-4037
Administrator
Ultimus Fund Solutions, LLC
P.O. Box 46707
Cincinnati, Ohio 45246-0707
1-800-281-3217
Custodian
U.S. Bank, N.A.
425 Walnut Street
Cincinnati, Ohio 45202
Independent Registered Public
AccountingFirm
Cohen & Company, Ltd.
1350 Euclid Avenue
Suite 800
Cleveland, Ohio 44115
LegalCounsel
Sullivan & Worcester LLP
1666 K Street, N.W.
Washington, DC 20006
Board of Trustees
Robert S. Harris, Ph.D., Chairman
John P. Ackerly, IV
John T. Bruce
George K. Jennison
Harris V. Morrissette
Elizabeth W. Robertson
Officers
John P. Ackerly, IV, President
George L. Smith, III, Vice President

One James Center
901 East Cary Street
Richmond, VA 23219
Davenport & Company LLC
Member: NYSE ● SIPC
Toll Free: (800) 846-6666
www.investdavenport.com

FBP Equity & Dividend Plus Fund
FBP Appreciation & Income Opportunities Fund
Semi-Annual Report
September 30, 2019
(Unaudited)
No-Load Funds
Beginning on January 1, 2021, as permitted by regulations adopted by the U.S. Securities and Exchange Commission, paper copies of the Funds’ shareholder reports like this one will no longer be sent by mail, unless you specifically request paper copies of the reports from the Funds or from your financial intermediary, such as a broker-dealer or bank. Instead, the reports will be made available on a website, and you will be notified by mail each time a report is posted and provided with a website link to access the report.
If you have already elected to receive shareholder reports electronically, you will not be affected by this change and you need not take any action. You may elect to receive shareholder reports and other communications from the Funds electronically by contacting the Funds at 1-866-738-1127 or, if you own these shares through a financial intermediary, by contacting your financial intermediary.
You may elect to receive all future reports in paper free of charge. You can inform the Funds that you wish to continue receiving paper copies of your shareholder reports by contacting the Funds at 1-866-738-1127. If you own shares through a financial intermediary, you may contact your financial intermediary or follow instructions included with this document to elect to continue to receive paper copies of your shareholder reports. Your election to receive reports in paper will apply to all Funds held with the Fund complex or at your financial intermediary.
Letter to Shareholders | November 5, 2019 |
We are pleased to report on your Funds and their investments for the six-month period ended September 30, 2019, and to provide some additional information since we last communicated with you.
Economic and Market Update
Increasing fears of slowing economic growth spread through financial markets during the past six months. The U.S. consumer has remained quite healthy and has been the backbone of this extended recovery. Manufacturing, on the other hand, has been slowing due to uncertainty created by continuing trade confrontations, especially with China. U.S. GDP growth slowed to around 2% over the summer. While this growth may seem lackluster, economic growth domestically is among the highest in the developed world. The EU continues to suffer from very slow growth, and some analysts are now forecasting growth of less than 1% for this year. With continuing Brexit delays and uncertainty, the economic backdrop in both the U.K. and Europe will likely remain subdued for several more quarters. In light of slowing growth, central banks around the world have stepped up efforts to stimulate their economies. Negative interest rates are now commonplace across Europe and in Japan. After three years and several rate hikes, the U.S. Federal Reserve (the “Fed’) joined the accommodation ranks and has now lowered the fed funds rate three times in recent months. While some may accuse the Fed of succumbing to public pressure and criticism from President Trump to lower rates, the Fed appears to be simply responding to the reality that growth has slowed and acknowledging that it may have overdone the rate increases late last year. In other words, it decided a mid-course correction was in order.
The shape of the U.S. Treasury yield curve has been a major discussion point recently. As has been widely reported, yield curve inversions, in which 2-year bond yields are higher than 10-year yields, have been a fairly accurate leading indicator of a recession. A modest inversion did occur earlier this year, but it proved to be temporary. Early this month, the U.S. ISM Manufacturing Purchasing Managers Index came in at 47.8%, the lowest level in ten years. Numbers below 50% indicate contraction, giving further evidence of slowing economic conditions. Given that the U.S. economy is more service oriented today and much less reliant on manufacturing than in the past, the ISM report is perhaps not as concerning as it might have been years ago. As is usually the case, not every economic indicator is flashing caution. The unemployment rate is at a level not seen in more than 50 years and wage growth remains strong. Corporate bond yield spreads continue to fall within the average range, indicating that bond investors are not overly concerned about credit risk.
On and off since 2015, U.S. stock market performance has been led by the so-called FAANG stocks, fast-growing, technology-oriented companies. Late last year, more defensive sectors including Consumer Staples, REITs (Real Estate Investment Trusts) and Utilities joined FAANG in leading the market. This narrow leadership made benchmark comparisons challenging, especially for diversified funds with more economic exposure. In early September, there was a significant change, with investors rotating funds into value-oriented stocks and industries. More attractively valued sectors such as Energy, Consumer Discretionary, Financials and Industrials performed markedly better during that stretch. Certainly, it is too soon to call the FAANG trade dead, but the rotation was a welcome sight for your Funds as the underlying investments have a value bias. The wide divergence in performance and valuation of growth versus value contributed to the short-term reversal as well as very early indicators pointing to a bottoming in earnings expectations and economic conditions.
1
FBP Equity & Dividend Plus Fund Review
The FBP Equity & Dividend Plus Fund returned 2.82% for the semi-annual period and -1.05% for the annual period ended September 30, 2019. The S&P 500 Index returned 6.08% and 4.25% over the same periods. The Fund was invested 94.0% equity and 6.0% cash as of September 30, 2019.
The Fund’s results were helped this period by holdings in Financials, Consumer Staples, Communication Services and REIT’s, and results were held back by weakness in Energy, Materials and Consumer Discretionary. Individual outperformers were Hershey, Target, Western Union, and AT&T. Occidental Petroleum, Schlumberger and Kohl’s most negatively affected returns. If there was a common thread among these companies, it was cautionary management commentary about future earnings prospects rather than current sales or earnings shortfalls. During the period, we added Bristol-Myers Squibb, Molson Coors, Philip Morris International and Simon Property Group to the Fund. Bristol announced plans to acquire Celgene, an integrated global biopharmaceutical company, If finalized this merger would create, in our opinion, a leading biopharma company with especially strong exposure to the oncology market. Molson Coors is one of the world’s largest brewing companies, with major brands such as Miller Lite, Coors Light and Blue Moon. Philip Morris International has historically paid an above average dividend and in the advisers opinion, is trading at an attractive valuation. Simon Property Group is a well-managed REIT with a 5.5% dividend yield and historically has raised the dividend as cash flow from operations has grown. Several stocks were called away (sold) after strong price performance. Procter & Gamble, Coca-Cola, Hershey and Apple were all eliminated from the Fund at elevated valuations through call option exercises and stock sales. The Fund also moved its investment in DowDuPont to Dow, Inc, improving the dividend cash flow. We also sold Nordstrom following a disappointing earnings report. We lost confidence in the management team following the death of the prior CEO.
The Fund is well diversified across all eleven economic sectors and is structured to benefit as the economy grows. The Fund seeks to invest in companies that provide above average and growing dividends and uses covered call options to enhance the cash flow to the Fund.
The Fund does utilize as part of its investment discipline the use of covered call options as individual securities approach the top of the Adviser’s growth and price expectations. The Fund’s purpose in selling the call options is to generate additional cash flow to the Fund and to hedge the possibility the security may not achieve its price objective. In very strong stock markets, this discipline may limit the upside of the securities where options have been written, but in flat to negative markets, it may provide additional return. During the six months ended September 30, 2019, the amount of premiums generated from selling covered call options was $180,688.
FBP Appreciation & Income Opportunities Fund Review
The FBP Appreciation & Income Opportunities Fund returned 0.94% for the semi-annual period and -3.12% for the annual period ended September 30, 2019. The S&P 500 Index returned 6.08% and 4.25%, and the Bloomberg Barclays Intermediate U.S. Government/Credit Index returned 3.99% and 8.17% over the same periods. The Fund was 76.7% equity, 16.7% fixed income and 6.6% cash as of September 30, 2019.
Financials, Information Technology and Consumer Staples helped the Fund’s results this period. Materials, Energy, and Consumer Discretionary were the weaker sectors. Top contributors to returns were JPMorgan Chase, Apple, Microsoft and Target. Occidental Petroleum, Halliburton, Tapestry and Kohl’s most negatively affected returns. During the period, we added new positions in Bristol-Myers Squibb and Philip Morris International, as well as additions to Compass Minerals, Kohl’s and Kellogg. Bristol announced plans to acquire Celgene, an integrated global biopharmaceutical company, If finalized this merger would create, in our opinion, a leading biopharma company with especially strong exposure to the oncology market. Philip
2
Morris International has historically paid an above average dividend and in the advisers opinion, is trading at an attractive valuation. We reduced Ingersoll Rand, Travelers, Microsoft, JPMorgan Chase and Target, all following nice gains for the Fund.
The Fund does utilize as part of its investment discipline the use of covered call options as individual securities approach the top of the Adviser’s growth and price expectations. The Fund’s purpose in selling the call options is to generate additional income to the Fund and to hedge the possibility the security may not achieve its price objective. In very strong stock markets, this discipline may limit the upside of the securities where options have been written, but in modest to negative markets, it may provide additional return. During the six months ended September 30, 2019, the amount of premiums generated from selling covered call options was $86,703.
We want to thank you for your continued support and investment in the Flippin, Bruce & Porter Funds. Please visit our website at www.fbpfunds.com for information on your Funds and the investment philosophy and process we utilize to achieve their investment objectives.

John T. Bruce, CFA
President - Portfolio Manager
November 5, 2019
Data presented reflects past performance, which is no guarantee of future results. Investment results and principal value will fluctuate so that shares, when redeemed, may be worth more or less than their original cost. Due to market volatility, current performance may be higher or lower than the performance shown. Updated performance information, current through the most recent month-end, is available by contacting the Funds at 1-866-738-1127.
This report is submitted for the general information of the shareholders of the Funds. It reflects our views, opinions and portfolio holdings as of the date of this letter. These views are subject to change at any time based upon market or other conditions. For more current information throughout the year please visit www.fbpfunds.com or call the Funds at 1-866-738-1127. This report is not authorized for distribution to prospective investors in the Funds unless accompanied by a current prospectus.
3
THE FLIPPIN, BRUCE & PORTER FUNDS
COMPARATIVE PERFORMANCE CHARTS
(Unaudited)
Performance for each Fund is compared to the most appropriate broad-based index, the Standard and Poor’s 500® Index, an unmanaged index of 500 large common stocks. Each Fund’s performance results are also compared to the Consumer Price Index, a measure of inflation; the Bloomberg Barclays Intermediate U.S. Government/Credit Index is also compared for the FBP Appreciation & Income Opportunities Fund.
FBP Equity & Dividend Plus Fund
Comparison of the Change in Value of a $10,000 Investment in FBP Equity & Dividend Plus Fund, the Standard & Poor’s 500®Index and the Consumer Price Index
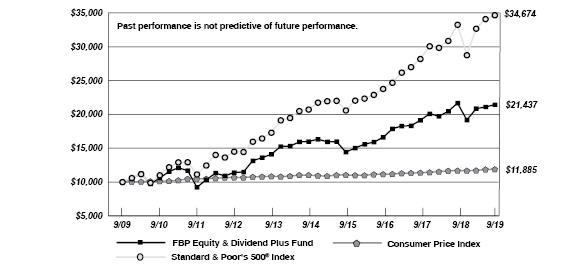
4
THE FLIPPIN, BRUCE & PORTER FUNDS
COMPARATIVE PERFORMANCE CHARTS
(Unaudited) (Continued)
FBP Appreciation & Income Opportunities Fund
Comparison of the Change in Value of a $10,000 Investment in FBP Appreciation & Income Opportunities Fund, the Standard & Poor’s 500® Index, the Consumer Price Index and the Bloomberg Barclays Intermediate U.S. Government/Credit Index
Average Annual Total Returns (for periods ended September 30, 2019) |
| 1 Year | 5 Years | 10 Years | |
FBP Equity & Dividend Plus Fund(a) | (1.05%) | 6.02% | 7.92% | |
FBP Appreciation & Income Opportunities Fund(a) | (3.12%) | 4.39% | 6.90% | |
Standard & Poor’s 500® Index | 4.25% | 10.84% | 13.24% | |
Consumer Price Index | 1.75% | 1.52% | 1.74% | |
Bloomberg Barclays Intermediate U.S. Government/Credit Index | 8.17% | 2.68% | 3.05% | |
(a) | Total returns are a measure of the change in value of an investment in the Fund over the periods covered, which assumes any dividends or capital gains distributions are reinvested in shares of the Fund. Returns do not reflect the deduction of taxes a shareholder would pay on the Fund’s distributions or the redemption of Fund shares. |
5
FBP EQUITY & DIVIDEND PLUS FUND
PORTFOLIO INFORMATION
September 30, 2019 (Unaudited)
General Information | | | |
Net Asset Value Per Share | | $ | 25.41 | |
Total Net Assets (Millions) | | $ | 28.1 | |
Current Expense Ratio | | | 1.07 | % |
Portfolio Turnover | | | 14 | % |
Fund Inception Date | | | 7/30/1993 | |
Stock Characteristics | | Fund | | | S&P 500®
Index | |
Number of Stocks | | | 53 | | | | 500 | |
Weighted Avg Market Capitalization ( Billions ) | | | 119.2 | | | | 249.6 | |
Price-to-Earnings Ratio (Bloomberg 1 Yr. Forecast EPS) | | | 12.2 | | | | 16.9 | |
Price-to-Book Value | | | 1.7 | | | | 3.4 | |
Asset Allocation (% of Net Assets) |
|
Sector Diversification vs. the S&P 500® Index |

Ten Largest Equity Holdings | % of Net Assets |
International Business Machines Corporation | 3.2% |
Target Corporation | 3.0% |
BB&T Corporation | 2.9% |
Merck & Company, Inc. | 2.8% |
U.S. Bancorp | 2.8% |
United Parcel Service, Inc. - Class B | 2.8% |
AT&T, Inc. | 2.7% |
JPMorgan Chase & Company | 2.7% |
FirstEnergy Corporation | 2.6% |
Broadcom, Inc. | 2.6% |
6
FBP APPRECIATION & INCOME OPPORTUNITIES FUND
PORTFOLIO INFORMATION
September 30, 2019 (Unaudited)
General Information |
Net Asset Value Per Share | | $ | 18.61 | |
Total Net Assets (Millions) | | $ | 32.1 | |
Current Expense Ratio | | | 1.00 | % |
Portfolio Turnover | | | 8 | % |
Fund Inception Date | | | 7/3/1989 | |
Asset Allocation (% of Net Assets) |

|
Common Stock Portfolio (76.7% of Net Assets) |
Number of Stocks | | | 54 | |
Weighted Avg Market Capitalization (Billions) | | | 107.1 | |
Price-to-Earnings Ratio (Bloomberg 1 Yr. Forecast EPS) | | | 12.0 | |
Price-to-Book Value | | | 1.5 | |
Ten Largest Equity Holdings | % of Net Assets |
JPMorgan Chase & Company | 3.7% |
Bank of America Corporation | 3.5% |
Apple, Inc. | 2.7% |
Cisco Systems, Inc. | 2.6% |
International Business Machines Corporation | 2.4% |
Lincoln National Corporation | 2.3% |
Microsoft Corporation | 2.2% |
Merck & Company, Inc. | 2.1% |
Broadcom, Inc. | 2.1% |
Royal Dutch Shell plc - Class B - ADR | 1.9% |
Five Largest Sectors | % of Net Assets |
Financials | 17.2% |
Information Technology | 15.2% |
Health Care | 8.7% |
Consumer Discretionary | 7.4% |
Energy | 7.2% |
Fixed-Income Portfolio (16.7% of Net Assets) |
| Number of Fixed-Income Securities | 10 |
| Average Quality | BBB+ |
| Average Weighted Maturity | 2.1 yrs. |
| Average Effective Duration | 7.8 yrs. |
Sector Breakdown | % of Net Assets |
U.S. Government Agency Obligations | 1.6% |
Consumer Staples | 1.5% |
Energy | 1.6% |
Financials | 6.4% |
Industrials | 4.0% |
Utilities | 1.6% |
7
FBP EQUITY & DIVIDEND PLUS FUND
SCHEDULE OF INVESTMENTS
September 30, 2019 (Unaudited) |
| COMMON STOCKS — 94.0% | | Shares | | | Value | |
| Communication Services — 3.8% | | | | | | | | |
| AT&T, Inc. | | | 20,300 | | | $ | 768,152 | |
| CenturyLink, Inc. | | | 24,000 | | | | 299,520 | |
| | | | | | | | 1,067,672 | |
| Consumer Discretionary — 10.0% | | | | | | | | |
| Carnival Corporation | | | 11,100 | | | | 485,181 | |
| Ford Motor Company | | | 35,000 | | | | 320,600 | |
| Kohl’s Corporation | | | 11,000 | | | | 546,260 | |
| Tapestry, Inc. | | | 11,300 | | | | 294,365 | |
Target Corporation(a) | | | 8,000 | | | | 855,280 | |
Williams-Sonoma, Inc.(a) | | | 4,600 | | | | 312,708 | |
| | | | | | | | 2,814,394 | |
| Consumer Staples — 7.8% | | | | | | | | |
| Kellogg Company | | | 9,500 | | | | 611,325 | |
| Molson Coors Brewing Company - Class B | | | 7,600 | | | | 437,000 | |
PepsiCo, Inc.(a) | | | 2,200 | | | | 301,620 | |
| Philip Morris International, Inc. | | | 5,300 | | | | 402,429 | |
Walmart, Inc.(a) | | | 3,700 | | | | 439,116 | |
| | | | | | | | 2,191,490 | |
| Energy — 9.1% | | | | | | | | |
| Chevron Corporation | | | 4,800 | | | | 569,280 | |
| Exxon Mobil Corporation | | | 8,400 | | | | 593,124 | |
| Occidental Petroleum Corporation | | | 9,300 | | | | 413,571 | |
| Royal Dutch Shell plc - Class B - ADR | | | 9,500 | | | | 569,050 | |
| Schlumberger Ltd. | | | 11,800 | | | | 403,206 | |
| | | | | | | | 2,548,231 | |
| Financials — 18.0% | | | | | | | | |
| BB&T Corporation | | | 15,500 | | | | 827,235 | |
| JPMorgan Chase & Company | | | 6,500 | | | | 764,985 | |
| KeyCorp | | | 34,200 | | | | 610,128 | |
| MetLife, Inc. | | | 10,200 | | | | 481,032 | |
| People’s United Financial, Inc. | | | 25,000 | | | | 390,875 | |
| Prudential Financial, Inc. | | | 6,000 | | | | 539,700 | |
U.S. Bancorp(a) | | | 14,200 | | | | 785,828 | |
Wells Fargo & Company(a) | | | 13,000 | | | | 655,720 | |
| | | | | | | | 5,055,503 | |
| Health Care — 9.9% | | | | | | | | |
Amgen, Inc.(a) | | | 1,400 | | | | 270,914 | |
| Bristol-Myers Squibb Company | | | 5,800 | | | | 294,118 | |
| CVS Health Corporation | | | 7,300 | | | | 460,411 | |
| Johnson & Johnson | | | 2,600 | | | | 336,388 | |
Merck & Company, Inc.(a) | | | 9,400 | | | | 791,292 | |
| Pfizer, Inc. | | | 17,000 | | | | 610,810 | |
| | | | | | | | 2,763,933 | |
8
FBP EQUITY & DIVIDEND PLUS FUND
SCHEDULE OF INVESTMENTS (Continued) |
| COMMON STOCKS — 94.0% (Continued) | | Shares | | | Value | |
| Industrials — 6.8% | | | | | | |
| Eaton Corporation plc | | | 6,800 | | | $ | 565,420 | |
Emerson Electric Company(a) | | | 4,000 | | | | 267,440 | |
United Parcel Service, Inc. - Class B(a) | | | 6,500 | | | | 778,830 | |
United Technologies Corporation(a) | | | 2,200 | | | | 300,344 | |
| | | | | | | | 1,912,034 | |
| Information Technology — 15.7% | | | | | | | | |
| Broadcom, Inc. | | | 2,600 | | | | 717,782 | |
| Cisco Systems, Inc. | | | 8,500 | | | | 419,985 | |
HP, Inc.(a) | | | 27,500 | | | | 520,300 | |
| Intel Corporation | | | 11,000 | | | | 566,830 | |
| International Business Machines Corporation | | | 6,100 | | | | 887,062 | |
Microsoft Corporation(a) | | | 2,700 | | | | 375,381 | |
| Nokia Corporation - ADR | | | 50,000 | | | | 253,000 | |
Western Union Company (The)(a) | | | 28,000 | | | | 648,760 | |
| | | | | | | | 4,389,100 | |
| Materials — 4.9% | | | | | | | | |
| Compass Minerals International, Inc. | | | 7,500 | | | | 423,675 | |
| Dow, Inc. | | | 10,600 | | | | 505,090 | |
| Nucor Corporation | | | 9,000 | | | | 458,190 | |
| | | | | | | | 1,386,955 | |
| Real Estate — 3.3% | | | | | | | | |
Public Storage(a) | | | 1,500 | | | | 367,905 | |
| Simon Property Group, Inc. | | | 2,500 | | | | 389,125 | |
Ventas, Inc.(a) | | | 2,400 | | | | 175,272 | |
| | | | | | | | 932,302 | |
| Utilities — 4.7% | | | | | | | | |
| Dominion Energy, Inc. | | | 4,000 | | | | 324,160 | |
FirstEnergy Corporation(a) | | | 15,000 | | | | 723,450 | |
| PPL Corporation | | | 8,500 | | | | 267,665 | |
| | | | | | | | 1,315,275 | |
| | | | | | | | | |
Total Common Stocks (Cost $21,677,382) | | | | | | $ | 26,376,889 | |
9
FBP EQUITY & DIVIDEND PLUS FUND
SCHEDULE OF INVESTMENTS (Continued) |
| MONEY MARKET FUNDS — 6.6% | | Shares | | | Value | |
Fidelity Institutional Money Market Government Portfolio - Class I, 1.86%(b) (Cost $1,844,004) | | | 1,844,004 | | | $ | 1,844,004 | |
| | | | | | | | | |
Total Investments at Value — 100.6%(Cost $23,521,386) | | | | | | $ | 28,220,893 | |
| | | | | | | | | |
| Liabilities in Excess of Other Assets — (0.6%) | | | | | | | (169,842 | ) |
| | | | | | | | | |
| Net Assets — 100.0% | | | | | | $ | 28,051,051 | |
ADR - American Depositary Receipt. |
(a) | Security covers a written call option. |
(b) | The rate shown is the 7-day effective yield as of September 30, 2019. |
See accompanying notes to financial statements. |
10
FBP EQUITY & DIVIDEND PLUS FUND
SCHEDULE OF OPEN OPTION CONTRACTS
September 30, 2019 (Unaudited) |
COVERED WRITTEN
CALL OPTIONS | | Contracts | | | Notional
Value | | | Strike
Price | | Expiration
Date | | Value of
Options | |
Amgen, Inc. | | | 14 | | | $ | 270,914 | | | $ | 220.00 | | 01/17/20 | | $ | 1,890 | |
Emerson Electric Company | | | 40 | | | | 267,440 | | | | 72.50 | | 03/20/20 | | | 7,800 | |
FirstEnergy Corporation | | | 84 | | | | 405,132 | | | | 43.00 | | 10/18/19 | | | 46,200 | |
HP, Inc. | | | 140 | | | | 264,880 | | | | 20.00 | | 02/21/20 | | | 12,320 | |
Merck & Company, Inc. | | | 38 | | | | 319,884 | | | | 85.00 | | 11/15/19 | | | 8,626 | |
Merck & Company, Inc. | | | 28 | | | | 235,704 | | | | 90.00 | | 01/17/20 | | | 3,780 | |
Microsoft Corporation | | | 27 | | | | 375,381 | | | | 120.00 | | 10/18/19 | | | 50,220 | |
PepsiCo, Inc. | | | 22 | | | | 301,620 | | | | 130.00 | | 10/18/19 | | | 17,160 | |
Public Storage | | | 15 | | | | 367,905 | | | | 250.00 | | 12/20/19 | | | 11,100 | |
Target Corporation | | | 37 | | | | 395,567 | | | | 85.00 | | 10/18/19 | | | 82,214 | |
Target Corporation | | | 43 | | | | 459,713 | | | | 87.50 | | 01/17/20 | | | 88,795 | |
U.S. Bancorp | | | 40 | | | | 221,360 | | | | 57.50 | | 01/17/20 | | | 5,520 | |
United Parcel Service, Inc. – Class B | | | 12 | | | | 143,784 | | | | 125.00 | | 01/17/20 | | | 4,320 | |
United Technologies Corporation | | | 22 | | | | 300,344 | | | | 145.00 | | 11/15/19 | | | 3,278 | |
Ventas, Inc. | | | 24 | | | | 175,272 | | | | 67.50 | | 11/15/19 | | | 15,840 | |
Walmart, Inc. | | | 37 | | | | 439,116 | | | | 115.00 | | 01/17/20 | | | 27,195 | |
Wells Fargo & Company | | | 65 | | | | 327,860 | | | | 55.00 | | 04/17/20 | | | 10,010 | |
Western Union Company (The) | | | 145 | | | | 335,965 | | | | 21.00 | | 11/15/19 | | | 34,075 | |
Western Union Company (The) | | | 135 | | | | 312,795 | | | | 25.00 | | 02/21/20 | | | 6,750 | |
Williams Sonoma, Inc. | | | 46 | | | | 312,708 | | | | 67.50 | | 11/15/19 | | | 15,180 | |
Total Covered Written Call Options(Premiums received $188,693) | | $ | 6,233,344 | | | | | | | | $ | 452,273 | |
See accompanying notes to financial statements. |
11
FBP APPRECIATION & INCOME OPPORTUNITIES FUND
SCHEDULE OF INVESTMENTS
September 30, 2019 (Unaudited) |
| COMMON STOCKS — 76.7% | | Shares | | | Value | |
| Communication Services — 2.9% | | | | | | | | |
| AT&T, Inc. | | | 8,000 | | | $ | 302,720 | |
| CBS Corporation - Class B | | | 9,500 | | | | 383,515 | |
| CenturyLink, Inc. | | | 20,000 | | | | 249,600 | |
| | | | | | | | 935,835 | |
| Consumer Discretionary — 7.4% | | | | | | | | |
Bloomin’ Brands, Inc.(a) | | | 13,000 | | | | 246,090 | |
| Carnival Corporation | | | 8,500 | | | | 371,535 | |
| Ford Motor Company | | | 30,000 | | | | 274,800 | |
| Kohl’s Corporation | | | 10,000 | | | | 496,600 | |
| Tapestry, Inc. | | | 17,000 | | | | 442,850 | |
Target Corporation(a) | | | 5,000 | | | | 534,550 | |
| | | | | | | | 2,366,425 | |
| Consumer Staples — 5.2% | | | | | | | | |
| Kellogg Company | | | 8,500 | | | | 546,975 | |
PepsiCo, Inc.(a) | | | 2,500 | | | | 342,750 | |
| Philip Morris International, Inc. | | | 3,300 | | | | 250,569 | |
Walmart, Inc.(a) | | | 4,500 | | | | 534,060 | |
| | | | | | | | 1,674,354 | |
| Energy — 7.2% | | | | | | | | |
| Chevron Corporation | | | 4,000 | | | | 474,400 | |
| ConocoPhillips | | | 6,000 | | | | 341,880 | |
| Devon Energy Corporation | | | 12,100 | | | | 291,126 | |
| Halliburton Company | | | 13,000 | | | | 245,050 | |
| Occidental Petroleum Corporation | | | 8,500 | | | | 377,995 | |
| Royal Dutch Shell plc - Class B - ADR | | | 10,000 | | | | 599,000 | |
| | | | | | | | 2,329,451 | |
| Financials — 17.2% | | | | | | | | |
| Bank of America Corporation | | | 38,000 | | | | 1,108,460 | |
| Bank of New York Mellon Corporation (The) | | | 12,000 | | | | 542,520 | |
| Capital One Financial Corporation | | | 6,000 | | | | 545,880 | |
| JPMorgan Chase & Company | | | 10,000 | | | | 1,176,900 | |
| KeyCorp | | | 16,320 | | | | 291,149 | |
| Lincoln National Corporation | | | 12,500 | | | | 754,000 | |
| MetLife, Inc. | | | 12,000 | | | | 565,920 | |
| Travelers Companies, Inc. (The) | | | 3,600 | | | | 535,284 | |
| | | | | | | | 5,520,113 | |
| Health Care — 8.7% | | | | | | | | |
Amgen, Inc.(a) | | | 2,000 | | | | 387,020 | |
| Bristol-Myers Squibb Company | | | 5,000 | | | | 253,550 | |
| CVS Health Corporation | | | 7,500 | | | | 473,025 | |
| Johnson & Johnson | | | 4,000 | | | | 517,520 | |
Merck & Company, Inc.(a) | | | 8,000 | | | | 673,440 | |
| Pfizer, Inc. | | | 13,500 | | | | 485,055 | |
| | | | | | | | 2,789,610 | |
12
FBP APPRECIATION & INCOME OPPORTUNITIES FUND
SCHEDULE OF INVESTMENTS (Continued) |
| COMMON STOCKS — 76.7% (Continued) | | Shares | | | Value | |
| Industrials — 6.1% | | | | | | |
| Eaton Corporation plc | | | 6,500 | | | $ | 540,475 | |
| FedEx Corporation | | | 2,200 | | | | 320,254 | |
| General Electric Company | | | 25,000 | | | | 223,500 | |
| Ingersoll-Rand plc | | | 2,400 | | | | 295,704 | |
United Technologies Corporation(a) | | | 4,200 | | | | 573,384 | |
| | | | | | | | 1,953,317 | |
| Information Technology — 15.2% | | | | | | | | |
Apple, Inc.(a) | | | 3,900 | | | | 873,483 | |
| Broadcom, Inc. | | | 2,400 | | | | 662,568 | |
| Cisco Systems, Inc. | | | 17,000 | | | | 839,970 | |
HP, Inc.(a) | | | 20,000 | | | | 378,400 | |
| International Business Machines Corporation | | | 5,200 | | | | 756,184 | |
| Microsoft Corporation | | | 5,000 | | | | 695,150 | |
| Nokia Corporation - ADR | | | 87,000 | | | | 440,220 | |
| Western Union Company (The) | | | 10,000 | | | | 231,700 | |
| | | | | | | | 4,877,675 | |
| Materials — 2.8% | | | | | | | | |
| Compass Minerals International, Inc. | | | 6,000 | | | | 338,940 | |
| Freeport-McMoRan, Inc. | | | 11,000 | | | | 105,270 | |
| Mosaic Company (The) | | | 11,000 | | | | 225,500 | |
| Nucor Corporation | | | 4,500 | | | | 229,095 | |
| | | | | | | | 898,805 | |
| Real Estate — 1.1% | | | | | | | | |
| Simon Property Group, Inc. | | | 2,200 | | | | 342,430 | |
| | | | | | | | | |
| Utilities — 2.9% | | | | | | | | |
| Dominion Energy, Inc. | | | 4,000 | | | | 324,160 | |
FirstEnergy Corporation(a) | | | 7,000 | | | | 337,610 | |
| PPL Corporation | | | 9,000 | | | | 283,410 | |
| | | | | | | | 945,180 | |
| | | | | | | | | |
Total Common Stocks (Cost $16,899,163) | | | | | | $ | 24,633,195 | |
| U.S. GOVERNMENT AGENCY OBLIGATIONS — 1.6% | | Par Value | | | Value | |
| Federal National Mortgage Association — 1.6% | | | | | | | | |
| 1.20%, due 07/17/2020 (Cost $500,000) | | $ | 500,000 | | | $ | 497,161 | |
13
FBP APPRECIATION & INCOME OPPORTUNITIES FUND
SCHEDULE OF INVESTMENTS (Continued) |
| CORPORATE BONDS — 15.1% | | Par Value | | | Value | |
| Consumer Staples — 1.5% | | | | | | | | |
| Kroger Company (The), 2.60%, due 02/01/2021 | | $ | 500,000 | | | $ | 501,834 | |
| | | | | | | | | |
| Energy — 1.6% | | | | | | | | |
| Pioneer Natural Resources Company, 3.95%, due 07/15/2022 | | | 500,000 | | | | 520,387 | |
| | | | | | | | | |
| Financials — 6.4% | | | | | | | | |
| American Express Company, 3.40%, due 02/27/2023 | | | 500,000 | | | | 519,188 | |
| Citigroup, Inc., 2.90%, due 12/08/2021 | | | 500,000 | | | | 507,377 | |
| Unum Group, 3.00%, due 05/15/2021 | | | 500,000 | | | | 507,568 | |
| Wells Fargo & Company, 3.50%, due 03/08/2022 | | | 500,000 | | | | 515,935 | |
| | | | | | | | 2,050,068 | |
| Industrials — 4.0% | | | | | | | | |
| Norfolk Southern Corporation, 3.85%, due 01/15/2024 | | | 500,000 | | | | 532,832 | |
| Ryder System, Inc., 2.50%, due 05/11/2020 | | | 750,000 | | | | 751,289 | |
| | | | | | | | 1,284,121 | |
| Utilities — 1.6% | | | | | | | | |
| PSEG Power, LLC, 3.00%, due 06/15/2021 | | | 500,000 | | | | 505,094 | |
| | | | | | | | | |
Total Corporate Bonds (Cost $4,748,759) | | | | | | $ | 4,861,504 | |
| MONEY MARKET FUNDS — 7.0% | | Shares | | | Value | |
Fidelity Institutional Money Market Government Portfolio - Class I, 1.86%(b) (Cost $2,256,679) | | | 2,256,679 | | | $ | 2,256,679 | |
| | | | | | | | | |
Total Investments at Value — 100.4%(Cost $24,404,601) | | | | | | $ | 32,248,539 | |
| | | | | | | | | |
| Liabilities in Excess of Other Assets — (0.4%) | | | | | | | (129,363 | ) |
| | | | | | | | | |
| Net Assets — 100.0% | | | | | | $ | 32,119,176 | |
ADR- American Depositary Receipt. |
(a) | Security covers a written call option. |
(b) | The rate shown is the 7-day effective yield as of September 30, 2019. |
See accompanying notes to financial statements. |
14
FBP APPRECIATION & INCOME OPPORTUNITIES FUND
SCHEDULE OF OPEN OPTION CONTRACTS
September 30, 2019 (Unaudited) |
COVERED WRITTEN
CALL OPTIONS | | Contracts | | | Notional
Value | | | Strike
Price | | Expiration
Date | | Value of
Options | |
Amgen, Inc. | | | 12 | | | $ | 232,212 | | | $ | 220.00 | | 01/17/20 | | $ | 1,620 | |
Apple, Inc. | | | 10 | | | | 223,970 | | | | 210.00 | | 10/18/19 | | | 15,220 | |
Bloomin’ Brands, Inc. | | | 50 | | | | 94,650 | | | | 20.00 | | 01/17/20 | | | 6,000 | |
FirstEnergy Corporation | | | 40 | | | | 192,920 | | | | 43.00 | | 10/18/19 | | | 22,000 | |
FirstEnergy Corporation | | | 30 | | | | 144,690 | | | | 45.00 | | 01/17/20 | | | 11,700 | |
HP, Inc. | | | 100 | | | | 189,200 | | | | 20.00 | | 02/21/20 | | | 8,800 | |
Merck & Company, Inc. | | | 27 | | | | 227,286 | | | | 90.00 | | 11/15/19 | | | 1,485 | |
PepsiCo, Inc. | | | 25 | | | | 342,750 | | | | 130.00 | | 10/18/19 | | | 19,500 | |
Target Corporation | | | 30 | | | | 320,730 | | | | 87.50 | | 01/17/20 | | | 61,950 | |
United Technologies Corporation | | | 20 | | | | 273,040 | | | | 145.00 | | 11/15/19 | | | 2,980 | |
Walmart, Inc. | | | 15 | | | | 178,020 | | | | 115.00 | | 01/17/20 | | | 11,025 | |
Total Covered Written Call Options(Premiums received $76,383) | | $ | 2,419,468 | | | | | | | | $ | 162,280 | |
See accompanying notes to financial statements. |
15
THE FLIPPIN, BRUCE & PORTER FUNDS
STATEMENTS OF ASSETS AND LIABILITIES
September 30, 2019 (Unaudited) |
| | FBP Equity
& Dividend
Plus Fund | | | FBP
Appreciation
& Income
Opportunities
Fund | |
ASSETS | | | | | | | | |
Investments in securities: | | | | | | | | |
At cost | | $ | 23,521,386 | | | $ | 24,404,601 | |
At value (Note 2) | | $ | 28,220,893 | | | $ | 32,248,539 | |
Cash | | | — | | | | 1,272 | |
Receivable for investment securities sold | | | 250,439 | | | | — | |
Dividends and interest receivable | | | 54,217 | | | | 73,970 | |
Receivable for capital shares sold | | | 2,626 | | | | 500 | |
Other assets | | | 13,093 | | | | 13,025 | |
TOTAL ASSETS | | | 28,541,268 | | | | 32,337,306 | |
| | | | | | | | | |
LIABILITIES | | | | | | | | |
Written call options, at value (Notes 2 and 5) (premiums received $188,693 and $76,383, respectively) | | | 452,273 | | | | 162,280 | |
Distributions payable | | | 3,204 | | | | 14,284 | |
Payable for capital shares redeemed | | | 13,005 | | | | 16,435 | |
Accrued investment advisory fees (Note 4) | | | 12,900 | | | | 15,921 | |
Payable to administrator (Note 4) | | | 5,700 | | | | 5,700 | |
Other accrued expenses | | | 3,135 | | | | 3,510 | |
TOTAL LIABILITIES | | | 490,217 | | | | 218,130 | |
| | | | | | | | | |
NET ASSETS | | $ | 28,051,051 | | | $ | 32,119,176 | |
| | | | | | | | | |
NET ASSETS CONSIST OF: | | | | | | | | |
Paid-in capital | | $ | 22,483,639 | | | $ | 23,609,594 | |
Accumulated earnings | | | 5,567,412 | | | | 8,509,582 | |
Net assets | | $ | 28,051,051 | | | $ | 32,119,176 | |
| | | | | | | | | |
Shares of beneficial interest outstanding (unlimited number of shares authorized, $0.01 par value) | | | 1,104,098 | | | | 1,725,737 | |
| | | | | | | | | |
Net asset value, offering price and redemption price per share (Note 2) | | $ | 25.41 | | | $ | 18.61 | |
See accompanying notes to financial statements. |
16
THE FLIPPIN, BRUCE & PORTER FUNDS
STATEMENTS OF OPERATIONS
For the Six Months Ended September 30, 2019 (Unaudited) |
| | FBP Equity
& Dividend
Plus Fund | | | FBP
Appreciation
& Income
Opportunities
Fund | |
INVESTMENT INCOME | | | | | | | | |
Dividends | | $ | 529,043 | | | $ | 421,530 | |
Foreign withholding taxes on dividends | | | — | | | | (1,797 | ) |
Interest | | | — | | | | 84,072 | |
TOTAL INVESTMENT INCOME | | | 529,043 | | | | 503,805 | |
| | | | | | | | | |
EXPENSES | | | | | | | | |
Investment advisory fees (Note 4) | | | 99,375 | | | | 114,722 | |
Administration fees (Note 4) | | | 30,000 | | | | 30,000 | |
Audit and tax services fees | | | 8,500 | | | | 8,500 | |
Registration and filing fees | | | 8,081 | | | | 7,796 | |
Trustees’ fees and expenses (Note 4) | | | 7,465 | | | | 7,465 | |
Compliance service fees (Note 4) | | | 4,200 | | | | 4,200 | |
Custodian and bank service fees | | | 4,115 | | | | 3,332 | |
Legal fees | | | 3,320 | | | | 3,320 | |
Printing of shareholder reports | | | 3,793 | | | | 2,141 | |
Postage and supplies | | | 2,875 | | | | 1,784 | |
Account maintenance fees | | | 677 | | | | 1,375 | |
Insurance expense | | | 556 | | | | 600 | |
Other expenses | | | 3,603 | | | | 4,249 | |
TOTAL EXPENSES | | | 176,560 | | | | 189,484 | |
Fees waived by the Adviser (Note 4) | | | (24,658 | ) | | | (25,595 | ) |
NET EXPENSES | | | 151,902 | | | | 163,889 | |
| | | | | | | | | |
NET INVESTMENT INCOME | | | 377,141 | | | | 339,916 | |
| | | | | | | | | |
REALIZED AND UNREALIZED GAINS (LOSSES) ON INVESTMENTS AND WRITTEN OPTION CONTRACTS | | | | | | | | |
Net realized gains from: | | | | | | | | |
Investment transactions | | | 1,013,850 | | | | 760,098 | |
Written option contracts (Note 5) | | | 118,194 | | | | 10,020 | |
Net change in unrealized appreciation (depreciation) on: | | | | | | | | |
Investment transactions | | | (535,255 | ) | | | (702,111 | ) |
Written option contracts (Note 5) | | | (206,982 | ) | | | (85,897 | ) |
NET REALIZED AND UNREALIZED GAINS (LOSSES) ON INVESTMENTS AND WRITTEN OPTION CONTRACTS | | | 389,807 | | | | (17,890 | ) |
| | | | | | | | | |
NET INCREASE IN NET ASSETS FROM OPERATIONS | | $ | 766,948 | | | $ | 322,026 | |
See accompanying notes to financial statements. |
17
FBP EQUITY & DIVIDEND PLUS FUND
STATEMENTS OF CHANGES IN NET ASSETS |
| | Six Months
Ended
Sept. 30, 2019
(Unaudited) | | | Year Ended
March 31,
2019 | |
FROM OPERATIONS | | | | | | | | |
Net investment income | | $ | 377,141 | | | $ | 660,905 | |
Net realized gains from: | | | | | | | | |
Investment transactions | | | 1,013,850 | | | | 746,525 | |
Written option contracts (Note 5) | | | 118,194 | | | | 125,606 | |
Net change in unrealized appreciation (depreciation) on: | | | | | | | | |
Investment transactions | | | (535,255 | ) | | | (104,656 | ) |
Written option contracts (Note 5) | | | (206,982 | ) | | | (15,297 | ) |
Net increase in net assets resulting from operations | | | 766,948 | | | | 1,413,083 | |
| | | | | | | | | |
DISTRIBUTIONS TO SHAREHOLDERS (Note 2) | | | (540,779 | ) | | | (2,062,656 | ) |
| | | | | | | | | |
FROM CAPITAL SHARE TRANSACTIONS | | | | | | | | |
Proceeds from shares sold | | | 155,191 | | | | 3,064,232 | |
Net asset value of shares issued in reinvestment of distributions to shareholders | | | 531,897 | | | | 2,041,105 | |
Payments for shares redeemed | | | (1,476,960 | ) | | | (2,119,514 | ) |
Net increase (decrease) in net assets from capital share transactions | | | (789,872 | ) | | | 2,985,823 | |
| | | | | | | | | |
TOTAL INCREASE (DECREASE) IN NET ASSETS | | | (563,703 | ) | | | 2,336,250 | |
| | | | | | | | | |
NET ASSETS | | | | | | | | |
Beginning of period | | | 28,614,754 | | | | 26,278,504 | |
End of period | | $ | 28,051,051 | | | $ | 28,614,754 | |
| | | | | | | | | |
CAPITAL SHARE ACTIVITY | | | | | | | | |
Shares sold | | | 6,147 | | | | 116,050 | |
Shares reinvested | | | 21,050 | | | | 79,830 | |
Shares redeemed | | | (58,898 | ) | | | (83,445 | ) |
Net increase (decrease) in shares outstanding | | | (31,701 | ) | | | 112,435 | |
Shares outstanding, beginning of period | | | 1,135,799 | | | | 1,023,364 | |
Shares outstanding, end of period | | | 1,104,098 | | | | 1,135,799 | |
See accompanying notes to financial statements. |
18
FBP APPRECIATION & INCOME OPPORTUNITIES FUND
STATEMENTS OF CHANGES IN NET ASSETS |
| | Six Months
Ended
Sept. 30, 2019
(Unaudited) | | | Year Ended
March 31,
2019 | |
FROM OPERATIONS | | | | | | | | |
Net investment income | | $ | 339,916 | | | $ | 657,651 | |
Net realized gains (losses) from: | | | | | | | | |
Investment transactions | | | 760,098 | | | | 1,239,712 | |
Written option contracts (Note 5) | | | 10,020 | | | | (52,718 | ) |
Net change in unrealized appreciation (depreciation) on: | | | | | | | | |
Investment transactions | | | (702,111 | ) | | | (756,448 | ) |
Written option contracts (Note 5) | | | (85,897 | ) | | | 80,889 | |
Net increase in net assets resulting from operations | | | 322,026 | | | | 1,169,086 | |
| | | | | | | | | |
DISTRIBUTIONS TO SHAREHOLDERS (Note 2) | | | (824,649 | ) | | | (1,299,655 | ) |
| | | | | | | | | |
FROM CAPITAL SHARE TRANSACTIONS | | | | | | | | |
Proceeds from shares sold | | | 58,047 | | | | 859,694 | |
Net asset value of shares issued in reinvestment of distributions to shareholders | | | 789,422 | | | | 1,237,225 | |
Payments for shares redeemed | | | (1,602,080 | ) | | | (3,204,096 | ) |
Net decrease in net assets from capital share transactions | | | (754,611 | ) | | | (1,107,177 | ) |
| | | | | | | | | |
TOTAL DECREASE IN NET ASSETS | | | (1,257,234 | ) | | | (1,237,746 | ) |
| | | | | | | | | |
NET ASSETS | | | | | | | | |
Beginning of period | | | 33,376,410 | | | | 34,614,156 | |
End of period | | $ | 32,119,176 | | | $ | 33,376,410 | |
| | | | | | | | | |
CAPITAL SHARE ACTIVITY | | | | | | | | |
Shares sold | | | 3,080 | | | | 44,797 | |
Shares reinvested | | | 42,045 | | | | 64,997 | |
Shares redeemed | | | (84,415 | ) | | | (167,520 | ) |
Net decrease in shares outstanding | | | (39,290 | ) | | | (57,726 | ) |
Shares outstanding, beginning of period | | | 1,765,027 | | | | 1,822,753 | |
Shares outstanding, end of period | | | 1,725,737 | | | | 1,765,027 | |
See accompanying notes to financial statements. |
19
FBP EQUITY & DIVIDEND PLUS FUND
FINANCIAL HIGHLIGHTS |
Selected Per Share Data for a Share Outstanding Throughout Each Period |
| | | Six Months
Ended
Sept. 30, | | | Years Ended March 31, | |
| | 2019
(Unaudited) | | | 2019 | | | 2018 | | | 2017 | | | 2016 | | | 2015 | |
Net asset value at beginning of period | | $ | 25.19 | | | $ | 25.68 | | | $ | 25.96 | | | $ | 22.65 | | | $ | 24.89 | | | $ | 24.78 | |
| | | | | | | | | | | | | | | | | | | | | | | | | |
Income (loss) from investment operations: | | | | | | | | | | | | | | | | | | | | | | | | |
Net investment income | | | 0.34 | | | | 0.60 | | | | 0.57 | | | | 0.50 | | | | 0.61 | | | | 0.50 | |
Net realized and unrealized gains (losses) on investments | | | 0.36 | | | | 0.83 | | | | 1.38 | | | | 3.37 | | | | (1.21 | ) | | | 0.57 | |
Total from investment operations | | | 0.70 | | | | 1.43 | | | | 1.95 | | | | 3.87 | | | | (0.60 | ) | | | 1.07 | |
| | | | | | | | | | | | | | | | | | | | | | | | | |
Less distributions: | | | | | | | | | | | | | | | | | | | | | | | | |
From net investment income | | | (0.34 | ) | | | (0.60 | ) | | | (0.57 | ) | | | (0.50 | ) | | | (0.61 | ) | | | (0.51 | ) |
From net realized gains | | | (0.14 | ) | | | (1.32 | ) | | | (1.66 | ) | | | (0.06 | ) | | | (1.03 | ) | | | (0.45 | ) |
Total distributions | | | (0.48 | ) | | | (1.92 | ) | | | (2.23 | ) | | | (0.56 | ) | | | (1.64 | ) | | | (0.96 | ) |
| | | | | | | | | | | | | | | | | | | | | | | | | |
Net asset value at end of period | | $ | 25.41 | | | $ | 25.19 | | | $ | 25.68 | | | $ | 25.96 | | | $ | 22.65 | | | $ | 24.89 | |
| | | | | | | | | | | | | | | | | | | | | | | | �� | |
Total return(a) | | | 2.82 | %(b) | | | 5.64 | % | | | 7.91 | % | | | 17.29 | % | | | (2.31 | %) | | | 4.23 | % |
| | | | | | | | | | | | | | | | | | | | | | | | | |
Net assets at end of period (000’s) | | $ | 28,051 | | | $ | 28,615 | | | $ | 26,279 | | | $ | 27,415 | | | $ | 24,764 | | | $ | 28,782 | |
| | | | | | | | | | | | | | | | | | | | | | | | | |
Ratio of total expenses to average net assets | | | 1.24 | %(c) | | | 1.23 | % | | | 1.24 | % | | | 1.25 | % | | | 1.19 | % | | | 1.17 | % |
| | | | | | | | | | | | | | | | | | | | | | | | | |
Ratio of net expenses to average net assets(d) | | | 1.07 | %(c) | | | 1.07 | % | | | 1.07 | % | | | 1.07 | % | | | 1.07 | % | | | 1.07 | % |
| | | | | | | | | | | | | | | | | | | | | | | | | |
Ratio of net investment income to average net assets(d) | | | 2.66 | %(c) | | | 2.35 | % | | | 2.19 | % | | | 2.07 | % | | | 2.60 | % | | | 1.98 | % |
| | | | | | | | | | | | | | | | | | | | | | | | | |
Portfolio turnover rate | | | 14 | %(b) | | | 18 | % | | | 18 | % | | | 19 | % | | | 21 | % | | | 19 | % |
(a) | Total return is a measure of the change in value of an investment in the Fund over the periods covered, which assumes any dividends or capital gains distributions are reinvested in shares of the Fund. The returns shown do not reflect the deduction of taxes a shareholder would pay on Fund distributions or the redemption of Fund shares. The total returns would have been lower if the Adviser had not waived advisory fees. |
(b) | Not annualized. |
(c) | Annualized. |
(d) | Ratios were determined after advisory fee waivers by the Adviser (Note 4). |
See accompanying notes to financial statements. |
20
FBP APPRECIATION & INCOME OPPORTUNITIES FUND
FINANCIAL HIGHLIGHTS |
Selected Per Share Data for a Share Outstanding Throughout Each Period |
| | | Six Months
Ended
Sept. 30, | | | Years Ended March 31, | |
| | 2019
(Unaudited) | | | 2019 | | | 2018 | | | 2017 | | | 2016 | | | 2015 | |
Net asset value at beginning of period | | $ | 18.91 | | | $ | 18.99 | | | $ | 18.81 | | | $ | 16.55 | | | $ | 18.53 | | | $ | 18.97 | |
| | | | | | | | | | | | | | | | | | | | | | | | | |
Income (loss) from investment operations: | | | | | | | | | | | | | | | | | | | | | | | | |
Net investment income | | | 0.20 | | | | 0.37 | | | | 0.41 | | | | 0.28 | | | | 0.31 | | | | 0.26 | |
Net realized and unrealized gains (losses) on investments | | | (0.02 | ) | | | 0.28 | | | | 1.03 | | | | 2.28 | | | | (1.11 | ) | | | 0.19 | |
Total from investment operations | | | 0.18 | | | | 0.65 | | | | 1.44 | | | | 2.56 | | | | (0.80 | ) | | | 0.45 | |
| | | | | | | | | | | | | | | | | | | | | | | | | |
Less distributions: | | | | | | | | | | | | | | | | | | | | | | | | |
From net investment income | | | (0.20 | ) | | | (0.37 | ) | | | (0.41 | ) | | | (0.28 | ) | | | (0.32 | ) | | | (0.26 | ) |
From net realized gains | | | (0.28 | ) | | | (0.36 | ) | | | (0.85 | ) | | | (0.02 | ) | | | (0.86 | ) | | | (0.63 | ) |
Total distributions | | | (0.48 | ) | | | (0.73 | ) | | | (1.26 | ) | | | (0.30 | ) | | | (1.18 | ) | | | (0.89 | ) |
| | | | | | | | | | | | | | | | | | | | | | | | | |
Net asset value at end of period | | $ | 18.61 | | | $ | 18.91 | | | $ | 18.99 | | | $ | 18.81 | | | $ | 16.55 | | | $ | 18.53 | |
| | | | | | | | | | | | | | | | | | | | | | | | | |
Total return(a) | | | 0.94 | %(b) | | | 3.44 | % | | | 7.91 | % | | | 15.58 | % | | | (4.48 | %) | | | 2.36 | % |
| | | | | | | | | | | | | | | | | | | | | | | | | |
Net assets at end of period (000’s) | | $ | 32,119 | | | $ | 33,376 | | | $ | 34,614 | | | $ | 34,069 | | | $ | 31,669 | | | $ | 38,991 | |
| | | | | | | | | | | | | | | | | | | | | | | | | |
Ratio of total expenses to average net assets | | | 1.16 | %(c) | | | 1.12 | % | | | 1.10 | % | | | 1.12 | % | | | 1.05 | % | | | 1.04 | % |
| | | | | | | | | | | | | | | | | | | | | | | | | |
Ratio of net expenses to average net assets(d) | | | 1.00 | %(c) | | | 1.00 | % | | | 1.00 | % | | | 1.00 | % | | | 1.00 | % | | | 1.00 | % |
| | | | | | | | | | | | | | | | | | | | | | | | | |
Ratio of net investment income to average net assets(d) | | | 2.07 | %(c) | | | 1.89 | % | | | 2.16 | % | | | 1.57 | % | | | 1.75 | % | | | 1.36 | % |
| | | | | | | | | | | | | | | | | | | | | | | | | |
Portfolio turnover rate | | | 8 | %(b) | | | 21 | % | | | 10 | % | | | 18 | % | | | 23 | % | | | 12 | % |
(a) | Total return is a measure of the change in value of an investment in the Fund over the periods covered, which assumes any dividends or capital gains distributions are reinvested in shares of the Fund. The returns shown do not reflect the deduction of taxes a shareholder would pay on Fund distributions or the redemption of Fund shares. The total returns would have been lower if the Adviser had not waived advisory fees. |
(b) | Not annualized. |
(c) | Annualized. |
(d) | Ratios were determined after advisory fee waivers by the Adviser (Note 4). |
See accompanying notes to financial statements. |
21
THE FLIPPIN, BRUCE & PORTER FUNDS
NOTES TO FINANCIAL STATEMENTS
September 30, 2019 (Unaudited) |
1. Organization
FBP Equity & Dividend Plus Fund and FBP Appreciation & Income Opportunities Fund (each a “Fund” and collectively the “Funds”) are no-load, diversified series of Williamsburg Investment Trust (the “Trust”), an open-end management investment company registered under the Investment Company Act of 1940, as amended (the “1940 Act”). The Trust was organized as a Massachusetts business trust on July 18, 1988. Other series of the Trust are not included in this report.
FBP Equity & Dividend Plus Fund seeks to provide above-average and growing income while also achieving long-term growth of capital.
FBP Appreciation & Income Opportunities Fund seeks long term capital appreciation and current income, assuming a moderate level of investment risk.
2. Significant Accounting Policies
Each Fund follows accounting and reporting guidance under Financial Accounting Standards Board (“FASB”) Accounting Standards Codification Topic 946, “Financial Services – Investment Companies.” The following is a summary of the Funds’ significant accounting policies. These policies are in conformity with accounting principles generally accepted in the United States of America (“GAAP”).
New accounting pronouncement — In March 2017, FASB issued Accounting Standards Update No. 2017-08 (“ASU 2017-08”), “Receivables – Nonrefundable Fees and Other Costs (Subtopic 310-20): Premium Amortization on Purchased Callable Debt Securities.” ASU 2017-08 shortens the amortization period for certain callable debt securities, held at a premium, to be amortized to the earliest call date. ASU 2017-08 does not require an accounting change for securities held at a discount, which continues to accrete to maturity. ASU 2017-08 is effective for fiscal years and interim periods within those fiscal years beginning after December 15, 2018. The Funds are complying with ASU 2017-08 effective with these financial statements.
Securities valuation — The Funds’ portfolio securities are valued as of the close of business of the regular session of the New York Stock Exchange (normally 4:00 p.m. Eastern time). Securities traded on a national stock exchange, including common stocks and closed-end investment companies, if any, are valued based upon the closing price on the principal exchange where the security is traded, if available, otherwise, at the last quoted bid price. Securities that are quoted by NASDAQ are valued at the NASDAQ Official Closing Price. Covered call options written by the Funds are valued at the last quoted sale price or, in the absence of a sale, at the ask price on the principal exchanges on which they are traded. Investments representing shares of money market funds and other open-end investment companies are valued at their net asset value (“NAV”) as reported by such companies. When using a quoted price and when the market is considered active, securities will be classified as Level 1 within the fair value hierarchy (see below).
Fixed income securities, including U.S. government agency obligations and corporate bonds, are typically valued on the basis of prices provided by an independent pricing service. The prices provided by the pricing service are determined with consideration given to institutional bid and last sale prices and take into account
22
THE FLIPPIN, BRUCE & PORTER FUNDS
NOTES TO FINANCIAL STATEMENTS (Continued) |
securities prices, yields, maturities, call features, ratings, institutional trading in similar groups of securities, and developments related to specific securities. Given the inputs used by the pricing service, these securities are classified as Level 2 within the fair value hierarchy.
When market quotations are not readily available, if a pricing service cannot provide a price, or if the investment adviser believes the price received from the pricing service is not indicative of market value, securities will be valued in good faith at fair value using methods consistent with procedures adopted by the Board of Trustees and will be classified as Level 2 or 3 within the fair value hierarchy, depending on the inputs used. Such methods of fair valuation may include, but are not limited to: multiple of earnings, multiple of book value, discount from market of a similar freely traded security, purchase price of the security, subsequent private transactions in the security or related securities, or a combination of these and other factors.
GAAP establishes a single authoritative definition of fair value, sets out a framework for measuring fair value and requires additional disclosures about fair value measurements. Various inputs are used in determining the value of each Fund’s investments. These inputs are summarized in the three broad levels listed below:
● | Level 1 – quoted prices in active markets for identical securities |
● | Level 2 – other significant observable inputs |
● | Level 3 – significant unobservable inputs |
The inputs or methodology used for valuing securities are not necessarily an indication of the risks associated with investing in those securities. The inputs used to measure fair value may fall into different levels of the fair value hierarchy. In such cases, for disclosure purposes, the level in the fair value hierarchy within which the fair value measurement falls in its entirety is determined based on the lowest level input that is significant to the fair value measurement.
The following is a summary of the inputs used to value each Fund’s investments and other financial instruments as of September 30, 2019, by security type:
FBP Equity & Dividend Plus Fund | | Level 1 | | | Level 2 | | | Level 3 | | | Total | |
Investments in Securities: | | | | | | | | | | | | | | | | |
Common Stocks | | $ | 26,376,889 | | | $ | — | | | $ | — | | | $ | 26,376,889 | |
Money Market Funds | | | 1,844,004 | | | | — | | | | — | | | | 1,844,004 | |
Total | | $ | 28,220,893 | | | $ | — | | | $ | — | | | $ | 28,220,893 | |
| | | | | | | | | | | | | | | | | |
Other Financial Instruments: | | | | | | | | | | | | | | | | |
Covered Written Call Options | | $ | (452,273 | ) | | $ | — | | | $ | — | | | $ | (452,273 | ) |
Total | | $ | (452,273 | ) | | $ | — | | | $ | — | | | $ | (452,273 | ) |
23
THE FLIPPIN, BRUCE & PORTER FUNDS
NOTES TO FINANCIAL STATEMENTS (Continued) |
FBP Appreciation & Income
Opportunities Fund | | Level 1 | | | Level 2 | | | Level 3 | | | Total | |
Investments in Securities: | | | | | | | | | | | | | | | | |
Common Stocks | | $ | 24,633,195 | | | $ | — | | | $ | — | | | $ | 24,633,195 | |
U.S. Government Agency Obligations | | | — | | | | 497,161 | | | | — | | | | 497,161 | |
Corporate Bonds | | | — | | | | 4,861,504 | | | | — | | | | 4,861,504 | |
Money Market Funds | | | 2,256,679 | | | | — | | | | — | | | | 2,256,679 | |
Total | | $ | 26,889,874 | | | $ | 5,358,665 | | | $ | — | | | $ | 32,248,539 | |
| | | | | | | | | | | | | | | | | |
Other Financial Instruments: | | | | | | | | | | | | | | | | |
Covered Written Call Options | | $ | (162,280 | ) | | $ | — | | | $ | — | | | $ | (162,280 | ) |
Total | | $ | (162,280 | ) | | $ | — | | | $ | — | | | $ | (162,280 | ) |
Refer to each Fund’s Schedule of Investments for a listing of the common stocks and corporate bonds by sector type. There were no Level 3 investments held by the Funds as of or during the six months ended September 30, 2019.
Share valuation — The NAV per share of each Fund is calculated daily by dividing the total value of its assets, less liabilities, by the number of shares outstanding. The offering price and redemption price per share of each Fund is equal to its NAV per share.
Investment income — Interest income is accrued as earned. Dividend income is recorded on the ex-dividend date. Discounts and premiums on fixed income securities purchased are amortized using the interest method. Withholding taxes on foreign dividends have been recorded in accordance with the Funds’ understanding of the applicable country’s rules and tax rates.
Distributions to shareholders — Dividends arising from net investment income are declared and paid quarterly to shareholders of each Fund. Net realized short-term capital gains, if any, may be distributed throughout the year and net realized long-term capital gains, if any, are distributed at least once each year. The amount of distributions from net investment income and net realized capital gains are determined in accordance with federal income tax regulations, which may differ from GAAP. These “book/tax” differences are either temporary or permanent in nature. Dividends and distributions are recorded on the ex-dividend date. The tax character of distributions paid during the periods ended September 30, 2019 and March 31, 2019 was as follows:
| Period
Ended | | Ordinary
Income | | | Long-Term
Capital Gains | | | Total
Distributions | |
FBP Equity & Dividend Plus Fund | 09/30/19 | | $ | 455,711 | | | $ | 85,068 | | | $ | 540,779 | |
| | 03/31/19 | | $ | 676,801 | | | $ | 1,385,855 | | | $ | 2,062,656 | |
FBP Appreciation & Income | 09/30/19 | | $ | 348,303 | | | $ | 476,346 | | | $ | 824,649 | |
Opportunities Fund | 03/31/19 | | $ | 650,647 | | | $ | 649,008 | | | $ | 1,299,655 | |
Investment transactions — Investment transactions are accounted for on trade date for financial reporting purposes. Realized gains and losses on investments sold are determined on a specific identification basis.
24
THE FLIPPIN, BRUCE & PORTER FUNDS
NOTES TO FINANCIAL STATEMENTS (Continued) |
Common expenses — Common expenses of the Trust are allocated among the Funds and the other series of the Trust based on relative net assets of each series or the nature of the services performed and the relative applicability to each series.
Options transactions — When the Funds’ investment adviser believes that individual portfolio investment securities held by the Funds are approaching the top of the adviser’s growth and price expectations, covered call options can be written (sold) against such securities and the Funds will receive a premium in return. The Funds write options only for income generation and hedging purposes and not for speculation. The premiums received from writing the options are recorded as a liability and are subsequently valued daily at the closing prices on their primary exchanges. Premiums received from writing options that expire are treated as realized gains. Premiums received from writing options that are exercised increase the proceeds used to calculate the realized gain or loss on the sale of the underlying security. If a closing purchase transaction is used to terminate a Fund’s obligation on a call option, a gain or loss will be realized, depending upon whether the price of the closing purchase transaction is more or less than the premium previously received on the call option written.
Estimates — The preparation of financial statements in conformity with GAAP requires management to make estimates and assumptions that affect the reported amounts of assets and liabilities and the disclosure of contingent assets and liabilities as of the date of the financial statements and the reported amounts of income and expenses during the reporting period. Actual results could differ from those estimates.
Federal income tax — Each Fund has qualified and intends to continue to qualify as a regulated investment company under the Internal Revenue Code of 1986, as amended (the “Code”). Qualification generally will relieve the Funds of liability for federal income taxes to the extent 100% of their net investment income and any net realized capital gains are distributed in accordance with the Code.
In order to avoid imposition of the excise tax applicable to regulated investment companies, it is also each Fund’s intention to declare as dividends in each calendar year at least 98% of its net investment income (earned during the calendar year) and 98.2% of its net realized capital gains (earned during the twelve months ended October 31) plus undistributed amounts from prior years.
The following information is computed on a tax basis for each item as of September 30, 2019:
| | FBP Equity
& Dividend
Plus Fund | | | FBP Appreciation
& Income
Opportunities
Fund | |
Tax cost of portfolio investments and written option contracts | | $ | 23,332,693 | | | $ | 24,364,447 | |
Gross unrealized appreciation | | $ | 5,974,109 | | | $ | 8,880,239 | |
Gross unrealized depreciation | | | (1,538,182 | ) | | | (1,158,427 | ) |
Net unrealized appreciation | | | 4,435,926 | | | | 7,721,812 | |
Accumulated ordinary income | | | 2,820 | | | | 13,121 | |
Accumulated other gains | | | 1,131,869 | | | | 788,933 | |
Distributions payable | | | (3,204 | ) | | | (14,284 | ) |
Accumulated distributable earnings | | $ | 5,567,412 | | | $ | 8,509,582 | |
25
THE FLIPPIN, BRUCE & PORTER FUNDS
NOTES TO FINANCIAL STATEMENTS (Continued) |
The difference between the federal income tax cost of portfolio investments and the financial statement cost of portfolio investments for FBP Appreciation & Income Opportunities Fund is due to certain differences in the recognition of capital gains and losses under income tax regulations and GAAP. These “book/tax” differences are temporary in nature and are primarily due to losses deferred due to wash sales and differing methods in the amortization of discounts and premiums on fixed income securities.
The Funds recognize the tax benefits or expenses of uncertain tax positions only when the position is “more likely than not” to be sustained assuming examination by tax authorities. Management has reviewed the tax positions taken by each Fund on federal income tax returns for the current and all open tax years (generally, three years) and has concluded that no provision for unrecognized tax benefits or expenses is required in these financial statements.
3. Investment Transactions
Investment transactions, other than short-term investments and U.S. government securities, were as follows for the six months ended September 30, 2019:
| | FBP Equity
& Dividend
Plus Fund | | | FBP Appreciation
& Income
Opportunities
Fund | |
Purchases of investment securities | | $ | 3,701,218 | | | $ | 2,257,751 | |
Proceeds from sales and maturities of investment securities | | $ | 3,951,790 | | | $ | 2,773,890 | |
4. Transactions with Related Parties
INVESTMENT ADVISORY AGREEMENTS
Each Fund’s investments are managed by Flippin, Bruce & Porter, Inc. (the “Adviser”) under the terms of an Investment Advisory Agreement. Under the Investment Advisory Agreements, each Fund pays the Adviser a fee, which is computed and accrued daily and paid monthly, at an annual rate of 0.70% of its average daily net assets up to $250 million; 0.65% of the next $250 million of such assets; and 0.50% of such assets in excess of $500 million.
Effective August 1, 2019, pursuant to Expense Limitation Agreements (“ELAs”) between each Fund and the Adviser, the Adviser has contractually agreed, until August 1, 2020, to reduce advisory fees and/or reimburse other expenses to the extent necessary to limit total annual fund operating expenses (excluding brokerage costs, taxes, interest, acquired fund fees and extraordinary expenses) to an amount not exceeding 1.07% and 1.00% of the average daily net assets of FBP Equity & Dividend Plus Fund and FBP Appreciation & Income Opportunities Fund, respectively. Accordingly, during the two months ended September 30, 2019, the Adviser reduced its advisory fees in the amounts of $7,245 and $6,838 for FBP Equity & Dividend Plus Fund and FBP Appreciation & Income Opportunities Fund, respectively.
Under the terms of the ELAs, investment advisory fee reductions and expense reimbursements by the Adviser are subject to recoupment by the Adviser for a period of three years after such fees and expenses were incurred, provided the recoupments do not cause total annual fund operating expenses to exceed the
26
THE FLIPPIN, BRUCE & PORTER FUNDS
NOTES TO FINANCIAL STATEMENTS (Continued) |
lesser of (i) the expense limitation then in effect, if any, or (ii) the expense limitation in effect at the time the expenses to be recouped were incurred. As of September 30, 2019, the Adviser may seek recoupment of investment advisory fee reductions and expense reimbursements no later than the dates as stated below:
| | FBP Equity
& Dividend
Plus Fund | | | FBP Appreciation
& Income
Opportunities
Fund | |
September 30, 2022 | | $ | 7,245 | | | $ | 6,838 | |
Total | | $ | 7,245 | | | $ | 6,838 | |
Prior to August 1, 2019, the Adviser voluntarily limited the total annual operating expenses of FBP Equity & Dividend Plus Fund and FBP Appreciation & Income Opportunities Fund to 1.07% and 1.00%, respectively, of average net assets; accordingly, the Adviser voluntarily waived $17,413 and $18,757 of its investment advisory fees from FBP Equity & Dividend Plus Fund and FBP Appreciation & Income Opportunities Fund, respectively. These amounts are not subject to recapture in future periods.
Certain officers and a Trustee of the Trust are also officers of the Adviser.
OTHER SERVICE PROVIDERS
Ultimus Fund Solutions, LLC (“Ultimus”) provides administration, fund accounting, compliance and transfer agent services to the Funds. The Funds pay Ultimus fees in accordance with the agreements for such services. In addition, the Funds pay out-of-pocket expenses including, but not limited to, postage, supplies, and costs of pricing the Funds’ portfolio securities. Certain officers of the Trust are also officers of Ultimus, or of Ultimus Fund Distributors, LLC (the “Distributor”), the principal underwriter of each Fund’s shares and an affiliate of Ultimus. The Distributor is compensated by the Adviser (not the Funds) for acting as principal underwriter.
COMPENSATION OF TRUSTEES
Trustees and officers affiliated with the Adviser or Ultimus are not compensated by the Trust for their services. Each Trustee who is not an affiliated person of the Adviser or Ultimus receives from the Trust an annual retainer of $20,000, payable quarterly; a fee of $2,000 for attendance at each meeting of the Board of Trustees (except that such fee is $3,000 for the independent chair); and a fee of $1,000 for attendance at each meeting of any committee of the Board (except that such fee is $1,500 for the committee chair); plus reimbursement of travel and other expenses incurred in attending meetings. Each Fund pays its proportionate share of such fees along with the other series of the Trust.
27
THE FLIPPIN, BRUCE & PORTER FUNDS
NOTES TO FINANCIAL STATEMENTS (Continued) |
5. Derivatives Transactions
The location on the Statements of Assets and Liabilities of the Funds’ derivative positions as of September 30, 2019 is as follows:
FBP Equity & Dividend Plus Fund
| | | |
Fair Value
| | | Gross Notional
Amount
Outstanding | |
Type of Derivative (Risk) | Location | | Asset
Derivatives | | | Liability
Derivatives | | | September 30,
2019 | |
Call options written (Equity) | Written call options, at value | | $ | — | | | $ | (452,273 | ) | | $ | (6,233,344 | ) |
FBP Appreciation & Income Opportunities Fund
| | | |
Fair Value
| | | Gross Notional
Amount
Outstanding | |
Type of Derivative (Risk) | Location | | Asset
Derivatives | | | Liability
Derivatives | | | September 30,
2019 | |
Call options written (Equity) | Written call options, at value | | $ | — | | | $ | (162,280 | ) | | $ | (2,419,468 | ) |
The Funds’ transactions in derivative instruments during the six months ended September 30, 2019 are recorded in the following locations on the Statements of Operations:
FBP Equity & Dividend Plus Fund
Type of Derivative (Risk) | Location | | Net
Realized
Gains | | Location | | Change in
Unrealized
Appreciation
(Depreciation) | |
Call options written (Equity) | Net realized gains from written option contracts | | $ | 118,194 | | Net change in unrealized appreciation (depreciation) on written option contracts | | $ | (206,982 | ) |
FBP Appreciation & Income Opportunities Fund
Type of Derivative (Risk) | Location | | Net
Realized
Gains | | Location | | Change in
Unrealized
Appreciation
(Depreciation) | |
Call options written (Equity) | Net realized gains from written option contracts | | $ | 10,020 | | Net change in unrealized appreciation (depreciation) on written option contracts | | $ | (85,897 | ) |
28
THE FLIPPIN, BRUCE & PORTER FUNDS
NOTES TO FINANCIAL STATEMENTS (Continued) |
The average monthly notional amount of written call options during the six months ended September 30, 2019 is $6,872,132 and $1,847,341 for FBP Equity & Dividend Plus Fund and FBP Appreciation & Income Opportunities Fund, respectively.
6. Contingencies and Commitments
The Funds indemnify the Trust’s officers and Trustees for certain liabilities that might arise from the performance of their duties to the Funds. Additionally, in the normal course of business the Funds enter into contracts that contain a variety of representations and warranties and which provide general indemnifications. The Funds’ maximum exposure under these arrangements is unknown, as this would involve future claims that may be made against the Funds that have not yet occurred. However, based on experience, the Trust expects the risk of loss to be remote.
7. Subsequent Events
The Funds are required to recognize in the financial statements the effects of all subsequent events that provide additional evidence about conditions that existed as of the date of the Statements of Assets and Liabilities. For non-recognized subsequent events that must be disclosed to keep the financial statements from being misleading, the Funds are required to disclose the nature of the event as well as an estimate of its financial effect, or a statement that such an estimate cannot be made. Management has evaluated subsequent events through the issuance of these financial statements and has noted no such events.
29
THE FLIPPIN, BRUCE & PORTER FUNDS
ABOUT YOUR FUNDS’ EXPENSES (Unaudited) |
We believe it is important for you to understand the impact of costs on your investment. All mutual funds have operating expenses. As a shareholder of a Fund, you incur ongoing costs, including management fees and other operating expenses. These ongoing costs, which are deducted from each Fund’s gross income, directly reduce the investment return of the Funds.
A mutual fund’s ongoing costs are expressed as a percentage of its average net assets. This figure is known as the expense ratio. The following examples are intended to help you understand the ongoing costs (in dollars) of investing in the Funds and to compare these costs with the ongoing costs of investing in other mutual funds. The examples below are based on an investment of $1,000 made at the beginning of the period shown and held for the entire period (April 1, 2019 through September 30, 2019).
The table below illustrates each Fund’s ongoing costs in two ways:
Actual fund return – This section helps you to estimate the actual expenses that you paid over the period. The “Ending Account Value” shown is derived from each Fund’s actual return, and the fourth column shows the dollar amount of operating expenses that would have been paid by an investor who started with $1,000 in the Funds. You may use the information here, together with the amount you invested, to estimate the expenses that you paid over the period.
To do so, simply divide your account value by $1,000 (for example, an $8,600 account value divided by $1,000 = 8.6), then multiply the result by the number given for the Funds under the heading “Expenses Paid During Period.”
Hypothetical 5% return – This section is intended to help you compare the Funds’ ongoing costs with those of other mutual funds. It assumes that each Fund had an annual return of 5% before expenses during the period shown, but that the expense ratio is unchanged. In this case, because the returns used are not the Funds’ actual returns, the results do not apply to your investment. The example is useful in making comparisons because the U.S. Securities and Exchange Commission (the “SEC”) requires all mutual funds to calculate expenses based on a 5% return. You can assess each Fund’s ongoing costs by comparing this hypothetical example with the hypothetical examples that appear in shareholder reports of other funds.
Note that expenses shown in the table are meant to highlight and help you compare ongoing costs only. The Funds do not charge sales loads or redemption fees.
The calculations assume no shares were bought or sold during the period. Your actual costs may have been higher or lower, depending on the amount of your investment and the timing of any purchases or redemptions.
More information about the Funds’ expenses, including annual expense ratios for the past five fiscal years, can be found in this report. For additional information on operating expenses and other shareholder costs, please refer to the Funds’ prospectus.
30
THE FLIPPIN, BRUCE & PORTER FUNDS
ABOUT YOUR FUNDS’ EXPENSES (Unaudited) (Continued) |
| Beginning
Account Value
April 1,
2019 | Ending
Account Value
September 30,
2019 | Net
Expense
Ratio(a) | Expenses
Paid
During
Period(b) |
FBP Equity & Dividend Plus Fund | | | |
Based on Actual Fund Return | $1,000.00 | $1,028.20 | 1.07% | $5.44 |
Based on Hypothetical 5% Return (before expenses) | $1,000.00 | $1,019.70 | 1.07% | $5.42 |
FBP Appreciation & Income Opportunities Fund | | | |
Based on Actual Fund Return | $1,000.00 | $1,009.40 | 1.00% | $5.04 |
Based on Hypothetical 5% Return (before expenses) | $1,000.00 | $1,020.05 | 1.00% | $5.06 |
(a) | Annualized, based on each Fund’s most recent one-half year expenses. |
(b) | Expenses are equal to each Fund’s annualized net expense ratio multiplied by the average account value over the period, multiplied by 183/365 (to reflect the one-half year period). |
31
THE FLIPPIN, BRUCE & PORTER FUNDS
OTHER INFORMATION (Unaudited) |
The Trust files a complete listing of portfolio holdings for the Funds with the SEC as of the end of the first and third quarters of each fiscal year on Form N-Q. The filings are available upon request, by calling 1-866-738-1127. Furthermore, you may obtain a copy of these filings on the SEC’s website at www.sec.gov.
A description of the policies and procedures that the Funds use to determine how to vote proxies relating to portfolio securities is available without charge upon request by calling toll-free 1-800-327-9375, or on the SEC’s website at www.sec.gov. Information regarding how the Funds voted proxies relating to portfolio securities during the most recent 12-month period ended June 30 is also available without charge upon request by calling toll-free 1-866-738-1127, or on the SEC’s website at www.sec.gov.
32

Investment Adviser Flippin, Bruce & Porter, Inc. 800 Main Street, Second Floor P.O. Box 6138 Lynchburg, Virginia 24505 Toll-Free 1-800-851-3804 www.fbpfunds.com Administrator Ultimus Fund Solutions, LLC P.O. Box 46707 Cincinnati, Ohio 45246-0707 Toll-Free 1-866-738-1127 Custodian U.S. Bank, N.A. 425 Walnut Street Cincinnati, Ohio 45202 Independent Registered
Public Accounting Firm Cohen & Company, Ltd.
1350 Euclid Avenue, Suite 800 Cleveland, Ohio 44115 | Legal Counsel Sullivan & Worcester LLP 1666 K Street, N.W. Washington, DC 20006 Officers John T. Bruce, President and Portfolio Manager Norman D. Darden, III,
Vice President John H. Hanna, IV, Vice President
David J. Marshall, Vice President Trustees Robert S. Harris, Ph.D., Chairman John P. Ackerly, IV John T. Bruce George K. Jennison Harris V. Morrissette Elizabeth W. Robertson |
34
THE GOVERNMENT STREET FUNDS No-Load Mutual Funds Semi-Annual Report
September 30, 2019
(Unaudited) |

|
The Government Street Equity Fund The Government Street Mid-Cap Fund |
Beginning on January 1, 2021, as permitted by regulations adopted by the U.S. Securities and Exchange Commission, paper copies of the Funds’ shareholder reports like this one will no longer be sent by mail, unless you specifically request paper copies of the reports from the Funds or from your financial intermediary, such as a broker-dealer or bank. Instead, the reports will be made available on a website, and you will be notified by mail each time a report is posted and provided with a website link to access the report.
If you already elected to receive shareholder reports electronically, you will not be affected by this change and you need not take any action. You may elect to receive shareholder reports and other communications from the Funds electronically by contacting the Funds at 1-866-738-1125 or, if you own these shares through a financial intermediary, by contacting your financial intermediary.
You may elect to receive all future reports in paper free of charge. You can inform the Funds that you wish to continue receiving paper copies of your shareholder reports by contacting the Funds at 1-866-738-1125. If you own shares through a financial intermediary, you may contact your financial intermediary or follow instructions included with this document to elect to continue to receive paper copies of your shareholder reports. Your election to receive reports in paper will apply to all Funds held with the Fund complex or at your financial intermediary.
LETTER FROM THE PRESIDENT | October 17, 2019 |
Dear Fellow Shareholders:
We are enclosing for your review the Semi-Annual Reports of The Government Street Funds for the period ended September 30, 2019.
The Government Street Equity Fund
The Government Street Equity Fund (the “Fund”) had a positive 9.21% total return for the six-month period ended September 30, 2019. By comparison, the S&P 500® Index and the Morningstar Large Blend categories returned 6.08% and 5.32%, respectively.
| Government
Street Equity | S&P 500 | Morningstar
Large Blend |
3 Qtr 2019 | 3.54% | 1.70% | 1.45% |
2 Qtr 2019 | 5.48% | 4.30% | 3.81% |
1 Qtr 2019 | 11.58% | 13.65% | 12.94% |
4 Qtr 2018 | -14.60% | -13.52% | -13.53% |
Year ended 9/30/19 | 4.07% | 4.25% | 2.85% |
As can be seen in the chart, your Fund and the other representative measures of large-capitalization securities enjoyed modest positive returns for the same annual period covered by this report.
The first fiscal quarter of 2019 impacted the entire year in a significant negative fashion. December of 2018 was the worst-performing one month period since 1931. The negative performance was attributable primarily to the fourth Federal Reserve interest increase in the year against substantial resistance by economists and investors. As the Fed reversed its tightening and relaxed its perspective, the balance of the fiscal year has seen marked, if volatile, positive improvement.
Within the S&P 500, value stocks outperformed growth stocks for the twelve months, by 5.6% to 3.2%, respectively.
At the same time, other areas of domestic markets faltered. The S&P Mid Capitalization 400 Index and the Russell 2000 Index (small capitalization index) turned in negative results of -2.5% and -8.9%, respectively, for the year ended September 30, 2019. International Markets represented by MSCI EAFE Index (large capitalization developed countries index) and the MSCI Emerging Markets Index continued to struggle with returns of -1.3% and -2.0%, respectively, for the same period.
Major purchases for the period were Bristol Myers (Health Care) and Dominion Resources, Inc. (Utilities).
Major sales for the period were Henry Schein, Inc. and Centene (Health Care), Valero Energy and Marathon Petroleum (Energy) and Vanguard Mid-Cap ETF (Mid Cap).
The transactions, in total, were distributed along the investment sectors of your Fund with the Standard & Poor’s 500 sectors as guidelines. While your Fund is not invested with a pseudo index approach, the sectors provide an objective comparison
1
for the diversification we believe important for the control of relative risk in your portfolio. Overall we depend on our own conclusions as to the ultimate security selection and position weightings.
The top 10 holdings in The Government Street Equity Fund as of September 30, 2019 were:
Security Description | % of Net Assets |
JPMorgan Chase & Company | 5.05% |
Lockheed Martin Corporation | 5.01% |
Apple, Inc. | 4.99% |
Visa, Inc. – Class A | 3.30% |
Comcast Corporation – Class A | 3.25% |
Intercontenental Exchange, Inc. | 3.16% |
United Technologies Corporation | 3.16% |
Bio-Techne Corporation | 3.02% |
Honeywell International, Inc. | 2.90% |
CME Group, Inc. | 2.72% |
There were significant individual performances during the twelve months ended September 30, 2019. The five highest returns, held for the entire 12 months, as measured by the time weighted rate of return were:
Security Description | 1 Year
Performance |
WEC Emergy Group, Inc. | 46.57% |
Mid-America Apartment Communities, Inc. | 34.49% |
McDonald’s Corporation | 31.44% |
Comcast Corporation – Class A | 29.91% |
Wal-Mart Stores, Inc. | 29.03% |
The five worst individual performances, held for the twelve months ended September 30, 2019, as measured by time weighted rate of return for the entire period were:
Security Description | 1 Year
Performance |
Amazon.com, Inc. | -13.33% |
AbbVie, Inc. | -15.49% |
Pfizer, Inc. | -15.66% |
Pioneer Natural Resources Company | -27.20% |
NVIDIA Corporation | -37.80% |
The Fund’s best performing economic sector for the 12 months was Utilities, up 37.49%. The second-best sector was Real Estate up 34.49%. The worst performing sector was Energy down -29.59%.
Note: The investment performances listed for economic sectors and securities in the two preceding paragraphs are extracted from an in-house independent time weighted rates of return computation by the Addepar portfolio accounting system. The calculations are gross investment returns. Total investment returns are for the twelve months ended September 30, 2019.
2
Many of the following comments are drawn from previous newsletters but continue to reflect our current thoughts on the future investment prospects.
We believe that continued upward movement of markets and economies worldwide are highly dependent on Governments getting their financial balance sheets in order. There has been unparalleled deficit spending around the world. Those economies not directly participating in the credit shortfalls will be indirectly impacted by lower import/export activities brought on by a significant debt imposed slowdown. This will occur domestically and internationally as economies have become more highly correlated in their economic cycles.
In response to this perceived scenario, risk management takes precedent over return pursuits in the near term. We believe your Fund remains invested to capture returns, but highly diversified to mitigate the risks associated with that position. We believe that the future transition to a sound economic scenario will determine the continuation of current positive performances. We are not totally convinced of that outcome. Rising debt levels around the world along with estimates of $17 trillion of borrowings with negative interest rates place investors in uncharted territory.
While significant risks exist, we continue to believe that investors have potential for one of the greatest investment environments for generations. There are over 7 billion people in the world today (USA population is approximately 325 million). Many of these potential consumers are moving into middle class ranks. In our opinion, the demand for goods and services for the future is tremendous. Remember that, in our own economy, approximately 60% of GDP is tied to consumers. Domestically we are experiencing wage growth and unemployement rates that are the most favorable in years. With the business advantages that the USA enjoys in manufacturing know-how, technology, intellectual content, productivity, and numerous other characteristics, if the U.S. Government will provide a competitive framework for operating, the benefits could be the best ever. We just need Government policies that continue to foster growth in profits and wages domestically and internationally. We believe that tax rate reduction (specifically corporate rates) and reduced regulatory burdens are an important first step.
There are many additional moving parts in our economy and exogenous factors such as the geopolitical instabilities that will always cause uneven effects. However, it is our thought that keeping our fiscal house in order is basic to all considerations. The irresponsible spending activities of our Government continue to unnerve us. It remains to be seen if the economy can overcome the negative influence of Government policies and have a successful impact on market values. We see Government debt as being the single greatest threat to the future of our country.
As of September 30, 2019, the Fund’s net assets were $58.2 million; net asset value per share was $78.71; and the annualized ratio of expenses to net average assets was 0.91%. Portfolio turnover rate was 4% (not annualized). Income dividends of $0.3900 per share and capital gains of $0.9900 per share were distributed to shareholders during the six months ended September 30, 2019.
3
The Government Street Mid-Cap Fund
The Government Street Mid-Cap Fund (the “Fund”), as of September 30, 2019, produced a fiscal six-month total return of 7.84%. By comparison, the Standard & Poor’s 400® Index and the Morningstar Mid Cap Blended Index, used as relative performance benchmarks, were -2.96% and -1.51%, respectively.
The mid-capitalization category of individual companies is usually represented by the Standard & Poor’s 400 ranging from approximately $1.1 billion to $10.0 billion market values. Generally, these companies are considered to have slightly higher risk and return characteristics than the S&P 500 companies, which start at the upper end of the mid-cap values and range in sizes 10 times or greater in terms of capitalization. As you would guess, mid-cap companies tend to be primarily domestically oriented.
Your Fund has a slightly different range of capitalizations than the S&P 400. Upper and lower limits for Fund purchase consideration are $11.7 billion and $894 million, respectively. There are two provisions that allow the makeup of the Fund to exceed those limits. To the extent securities originally purchased within the limits have grown to greater capitalizations they may be retained without limitation. Secondly, the Fund manager has latitude to purchase and hold up to 20% of the Fund’s value outside the limitations.
It should be noted that your Fund has initiated positions directly into International investments thru individual stock purchases. These investments meet the same capitalization constraints as domestic security holdings. This global approach is being done to provide additional diversification of the portfolio’s risk component and to address attractive potential return areas. The approach falls within the allowed exceptions previously cited and are expected to improve the compounded investment return over time.
The top 10 holdings in The Government Street Mid-Cap Fund as of September 30, 2019 were:
Security Description | % of Net Assets |
Mid-America Apartment Communities, Inc. | 4.10% |
Teleflex, Inc. | 2.82% |
L3Harris Technologies, Inc. | 2.81% |
Chemed Corporation | 2.63% |
Vanguard Mid-Cap ETF | 2.59% |
CME Group, Inc. | 2.55% |
Nasdaq, Inc. | 2.30% |
Intercontinental Exchange, Inc. | 2.13% |
Bio-Techne Corporation | 2.06% |
Waste Connections, Inc. | 2.03% |
An exchange-traded fund (“ETF”) represents a significant holding in the Fund. The Vanguard Mid-Cap ETF is constituted differently but covers the capitalization ranges mentioned earlier. Since the mid-cap universe contains a much greater number of companies than its larger index counterparts, we like to broaden your portfolio’s exposure across the range to govern risk control through diversification.
4
There were significant individual performances during the twelve months ended September 30, 2019. The five highest returns, held for the entire period, as measured by the time weighted rate of return, were:
Security Description | 1 Year
Performance |
Lam Research Corporation | 56.79% |
Martin Marietta Materials, Inc. | 52.05% |
NVR, Inc. | 50.45% |
Tech Data Corporation | 45.65% |
Okta, Inc. | 39.94% |
The five worst individual performances, held for the entire period, as measured by time weighted rate of return, were:
Security Description | 1 Year
Performance |
Albemarle Corporation | -28.98% |
Steel Dynamics, Inc. | -32.12% |
InterDigital, Inc. | -33.06% |
NVIDIA Corporation | -37.80% |
Centene Corporation | -40.33% |
The Fund’s best performing economic sector for the 12 months was Real Estate, up 34.5%. The second-best sector was Utilities, up 15.97%. The worst performing sector was Energy, down -22.4%.
Note: The investment performances listed for economic sectors and securities in the two preceding paragraphs are extracted from an in-house independent time weighted rates of return computation by the Addepar portfolio accounting system. The calculations are gross investment returns. Total investment returns are for the year ended September 30, 2019.
We believe that mid-cap stocks offer an attractive combination of growth and safety as they have successfully overcome startup challenges yet remain nimble enough to generate stronger growth than large cap stocks. Mid-cap stocks have been able to match the performance of large cap stocks in down markets while exceeding large cap performance in up markets, leading to long-term outperformance.
5
It may be interesting for the readers to compare and contrast the Global Industry Classification Standard (GICS) sectors between the larger capitalization S&P 500 and the lower capitalization S&P 400. The approximate weights based on component’s capitalizations change daily but are reasonably stable over short periods. As of September 30, 2019, they are:
GICS | S&P 500 | S&P 400 |
Energy | 4.44% | 3.95% |
Materials | 2.73% | 4.22% |
Industrials | 11.24% | 14.16% |
Consumer Discretionary | 11.95% | 13.92% |
Consumer Staples | 8.07% | 5.37% |
Health Care | 13.55% | 9.04% |
Financials | 16.57% | 12.83% |
Information Technology | 23.66% | 17.42% |
Telecommunication Services | 2.85% | 0.94% |
Utilities | 3.52% | 7.09% |
Real Estate | 3.24% | 11.03% |
The Government Street Mid Cap Fund uses the S&P 400 sector weights for guidance in its diversification of investment holdings.
As of September 30, 2019, the net assets of the Government Street Mid Cap Fund were $47.5 million, and the net asset value per share was $28.35. The turnover rate for the six months was 2%, and the total number of holdings was 84 as of September 30, 2019. The net annualized expense ratio for the Fund was 1.10%.
Thank you for your continued confidence in The Government Street Funds. Please call us if we can be of further service to you.
Very truly yours,

Thomas W. Leavell
President
Leavell Investment Management, Inc.
The Government Street Funds
6
THE GOVERNMENT STREET EQUITY FUND PORTFOLIO INFORMATION
September 30, 2019 (Unaudited)
Asset Allocation
(% of Net Assets)

Top Ten Equity Holdings
Security Description | % of Net Assets |
JPMorgan Chase & Company | 5.1% |
Lockheed Martin Corporation | 5.0% |
Apple, Inc. | 5.0% |
Visa, Inc. - Class A | 3.3% |
Comcast Corporation - Class A | 3.3% |
Intercontinental Exchange, Inc. | 3.2% |
United Technologies Corporation | 3.2% |
Bio-Techne Corporation | 3.0% |
Honeywell International, Inc. | 2.9% |
CME Group, Inc. | 2.7% |
7
THE GOVERNMENT STREET MID-CAP FUND PORTFOLIO INFORMATION
September 30, 2019 (Unaudited)
Asset Allocation
(% of Net Assets)
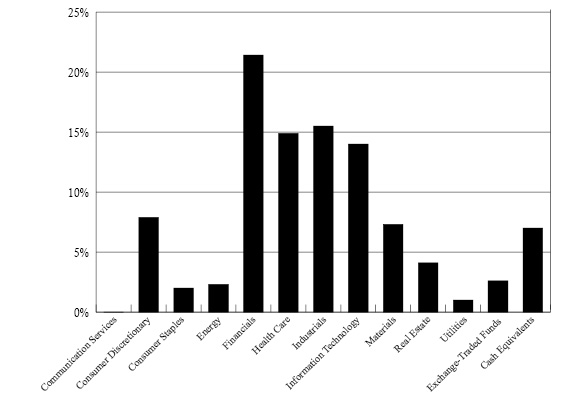
Top Ten Equity Holdings
Security Description | % of Net Assets |
Mid-America Apartment Communities, Inc. | 4.1% |
Teleflex, Inc. | 2.8% |
L3Harris Technologies, Inc. | 2.8% |
Chemed Corporation | 2.6% |
Vanguard Mid-Cap ETF | 2.6% |
CME Group, Inc. | 2.5% |
Nasdaq, Inc. | 2.3% |
Intercontinental Exchange, Inc. | 2.1% |
Bio-Techne Corporation | 2.1% |
Waste Connections, Inc. | 2.0% |
8
THE GOVERNMENT STREET EQUITY FUND
SCHEDULE OF INVESTMENTS
September 30, 2019 (Unaudited) |
COMMON STOCKS— 95.2% | | Shares | | | Value | |
Communication Services — 8.2% | | | | | | | | |
Alphabet, Inc. - Class A(a) | | | 800 | | | $ | 976,912 | |
Alphabet, Inc. - Class C(a) | | | 1,067 | | | | 1,300,673 | |
China Telecom Corporation Ltd. - ADR | | | 5,000 | | | | 227,850 | |
Comcast Corporation - Class A | | | 42,000 | | | | 1,893,360 | |
Tencent Holdings Ltd. - ADR | | | 9,000 | | | | 374,670 | |
| | | | | | | | 4,773,465 | |
Consumer Discretionary — 9.2% | | | | | | | | |
Alibaba Group Holding Ltd. - ADR(a) | | | 2,700 | | | | 451,521 | |
Amazon.com, Inc.(a) | | | 550 | | | | 954,751 | |
Home Depot, Inc. (The) | | | 5,500 | | | | 1,276,110 | |
Lowe’s Companies, Inc. | | | 6,000 | | | | 659,760 | |
McDonald’s Corporation | | | 5,000 | | | | 1,073,550 | |
NIKE, Inc. - Class B | | | 10,000 | | | | 939,200 | |
| | | | | | | | 5,354,892 | |
Consumer Staples — 6.5% | | | | | | | | |
Clorox Company (The) | | | 1,000 | | | | 151,870 | |
Coca-Cola Company (The) | | | 12,000 | | | | 653,280 | |
Costco Wholesale Corporation | | | 500 | | | | 144,055 | |
McCormick & Company, Inc. | | | 6,000 | | | | 937,800 | |
Procter & Gamble Company (The) | | | 2,000 | | | | 248,760 | |
Sysco Corporation | | | 2,000 | | | | 158,800 | |
Walmart, Inc. | | | 12,500 | | | | 1,483,500 | |
| | | | | | | | 3,778,065 | |
Energy — 0.9% | | | | | | | | |
Pioneer Natural Resources Company | | | 4,000 | | | | 503,080 | |
| | | | | | | | | |
Financials — 16.1% | | | | | | | | |
Aflac, Inc. | | | 23,130 | | | | 1,210,162 | |
BB&T Corporation | | | 8,000 | | | | 426,960 | |
Brookfield Asset Management, Inc. - Class A | | | 24,000 | | | | 1,274,160 | |
CME Group, Inc. | | | 7,500 | | | | 1,585,050 | |
Intercontinental Exchange, Inc. | | | 20,000 | | | | 1,845,400 | |
JPMorgan Chase & Company | | | 25,000 | | | | 2,942,250 | |
U.S. Bancorp | | | 2,000 | | | | 110,680 | |
| | | | | | | | 9,394,662 | |
Health Care — 8.2% | | | | | | | | |
Abbott Laboratories | | | 9,500 | | | | 794,865 | |
AbbVie, Inc. | | | 11,500 | | | | 870,780 | |
Bio-Techne Corporation | | | 9,000 | | | | 1,761,030 | |
Bristol-Myers Squibb Company | | | 9,000 | | | | 456,390 | |
Pfizer, Inc. | | | 24,000 | | | | 862,320 | |
| | | | | | | | 4,745,385 | |
9
THE GOVERNMENT STREET EQUITY FUND
SCHEDULE OF INVESTMENTS (Continued) |
COMMON STOCKS— 95.2% (Continued) | | Shares | | | Value | |
Industrials — 14.2% | | | | | | | | |
Emerson Electric Company | | | 13,000 | | | $ | 869,180 | |
General Dynamics Corporation | | | 5,200 | | | | 950,196 | |
Honeywell International, Inc. | | | 10,000 | | | | 1,692,000 | |
Lockheed Martin Corporation | | | 7,500 | | | | 2,925,450 | |
United Technologies Corporation | | | 13,500 | | | | 1,843,020 | |
| | | | | | | | 8,279,846 | |
Information Technology — 21.9% | | | | | | | | |
Accenture plc - Class A | | | 6,650 | | | | 1,279,128 | |
Apple, Inc. | | | 13,000 | | | | 2,911,610 | |
Mastercard, Inc. - Class A | | | 2,000 | | | | 543,140 | |
Micron Technology, Inc.(a) | | | 6,000 | | | | 257,100 | |
Microsoft Corporation | | | 11,000 | | | | 1,529,330 | |
NVIDIA Corporation | | | 8,650 | | | | 1,505,705 | |
QUALCOMM, Inc. | | | 6,000 | | | | 457,680 | |
Skyworks Solutions, Inc. | | | 9,000 | | | | 713,250 | |
TE Connectivity Ltd. | | | 9,000 | | | | 838,620 | |
Texas Instruments, Inc. | | | 6,200 | | | | 801,288 | |
Visa, Inc. - Class A | | | 11,200 | | | | 1,926,512 | |
| | | | | | | | 12,763,363 | |
Materials — 3.0% | | | | | | | | |
Corteva, Inc. | | | 3,666 | | | | 102,648 | |
DuPont de Nemours, Inc. | | | 3,666 | | | | 261,422 | |
Ecolab, Inc. | | | 6,000 | | | | 1,188,240 | |
Wheaton Precious Metals Corporation | | | 7,000 | | | | 183,680 | |
| | | | | | | | 1,735,990 | |
Real Estate — 2.5% | | | | | | | | |
Mid-America Apartment Communities, Inc. | | | 11,394 | | | | 1,481,334 | |
| | | | | | | | | |
Utilities — 4.5% | | | | | | | | |
Dominion Energy, Inc. | | | 6,000 | | | | 486,240 | |
Duke Energy Corporation | | | 8,250 | | | | 790,845 | |
WEC Energy Group, Inc. | | | 14,000 | | | | 1,331,400 | |
| | | | | | | | 2,608,485 | |
| | | | | | | | | |
Total Common Stocks(Cost $25,178,109) | | | | | | $ | 55,418,567 | |
10
THE GOVERNMENT STREET EQUITY FUND
SCHEDULE OF INVESTMENTS (Continued) |
MONEY MARKET FUNDS — 5.0% | | Shares | | | Value | |
Fidelity Institutional Money Market Government Portfolio - Class I, 1.86%(b) (Cost $2,918,364) | | | 2,918,364 | | | $ | 2,918,364 | |
| | | | | | | | | |
Total Investments at Value — 100.2%(Cost $28,096,473) | | | | | | $ | 58,336,931 | |
| | | | | | | | | |
Liabilities in Excess of Other Assets— (0.2%) | | | | | | | (95,545 | ) |
| | | | | | | | | |
Net Assets — 100.0% | | | | | | $ | 58,241,386 | |
ADR - American Depositary Receipt. |
(a) | Non-income producing security. |
(b) | The rate shown is the 7-day effective yield as of September 30, 2019. |
See accompanying notes to financial statements. |
11
THE GOVERNMENT STREET MID-CAP FUND
SCHEDULE OF INVESTMENTS
September 30, 2019 (Unaudited) |
COMMON STOCKS — 90.4% | | Shares | | | Value | |
Consumer Discretionary — 7.9% | | | | | | | | |
Cracker Barrel Old Country Store, Inc. | | | 1,500 | | | $ | 243,975 | |
Gildan Activewear, Inc. | | | 13,400 | | | | 475,700 | |
Hasbro, Inc. | | | 5,000 | | | | 593,450 | |
Kontoor Brands, Inc. | | | 1,671 | | | | 58,652 | |
Melco Resorts & Entertainment Ltd. - ADR | | | 5,000 | | | | 97,050 | |
NVR, Inc.(a) | | | 100 | | | | 371,735 | |
Ollie’s Bargain Outlet Holdings, Inc.(a) | | | 2,500 | | | | 146,600 | |
Service Corporation International | | | 16,200 | | | | 774,522 | |
Tempur Sealy International, Inc.(a) | | | 3,000 | | | | 231,600 | |
Tiffany & Company | | | 3,475 | | | | 321,889 | |
VF Corporation | | | 4,700 | | | | 418,253 | |
| | | | | | | | 3,733,426 | |
Consumer Staples — 2.0% | | | | | | | | |
Church & Dwight Company, Inc. | | | 9,000 | | | | 677,160 | |
Energizer Holdings, Inc. | | | 5,000 | | | | 217,900 | |
Hain Celestial Group, Inc. (The)(a) | | | 3,000 | | | | 64,425 | |
| | | | | | | | 959,485 | |
Energy — 2.3% | | | | | | | | |
Diamondback Energy, Inc. | | | 966 | | | | 86,853 | |
Marathon Petroleum Corporation | | | 2,830 | | | | 171,923 | |
ONEOK, Inc. | | | 11,000 | | | | 810,590 | |
| | | | | | | | 1,069,366 | |
Financials — 21.4% | | | | | | | | |
Alleghany Corporation(a) | | | 865 | | | | 690,062 | |
American Financial Group, Inc. | | | 7,600 | | | | 819,660 | |
Ares Management Corporation - Class A | | | 2,750 | | | | 73,728 | |
Arthur J. Gallagher & Company | | | 9,250 | | | | 828,523 | |
Bank of Hawaii Corporation | | | 4,000 | | | | 343,720 | |
Berkley (W.R.) Corporation | | | 11,175 | | | | 807,170 | |
Brown & Brown, Inc. | | | 20,000 | | | | 721,200 | |
CME Group, Inc. | | | 5,735 | | | | 1,212,035 | |
Cullen/Frost Bankers, Inc. | | | 8,000 | | | | 708,400 | |
Eaton Vance Corporation | | | 13,000 | | | | 584,090 | |
Intercontinental Exchange, Inc. | | | 11,000 | | | | 1,014,970 | |
Nasdaq, Inc. | | | 11,000 | | | | 1,092,850 | |
Old Republic International Corporation | | | 24,400 | | | | 575,108 | |
SEI Investments Company | | | 10,500 | | | | 622,177 | |
Voya Financial, Inc. | | | 1,500 | | | | 81,660 | |
| | | | | | | | 10,175,353 | |
12
THE GOVERNMENT STREET MID-CAP FUND
SCHEDULE OF INVESTMENTS (Continued) |
COMMON STOCKS — 90.4% (Continued) | | Shares | | | Value | |
Health Care — 14.9% | | | | | | | | |
Bio-Rad Laboratories, Inc. - Class A(a) | | | 1,700 | | | $ | 565,658 | |
Bio-Techne Corporation | | | 5,000 | | | | 978,350 | |
Centene Corporation(a) | | | 6,000 | | | | 259,560 | |
Charles River Laboratories International, Inc.(a) | | | 4,500 | | | | 595,665 | |
Chemed Corporation | | | 3,000 | | | | 1,252,710 | |
Computer Programs & Systems, Inc. | | | 2,000 | | | | 45,220 | |
Laboratory Corporation of America Holdings(a) | | | 2,574 | | | | 432,432 | |
Penumbra, Inc.(a) | | | 2,500 | | | | 336,225 | |
ResMed, Inc. | | | 6,000 | | | | 810,660 | |
Teleflex, Inc. | | | 3,950 | | | | 1,342,013 | |
Waters Corporation(a) | | | 2,000 | | | | 446,460 | |
| | | | | | | | 7,064,953 | |
Industrials — 15.5% | | | | | | | | |
AMETEK, Inc. | | | 2,350 | | | | 215,777 | |
C.H. Robinson Worldwide, Inc. | | | 4,000 | | | | 339,120 | |
Donaldson Company, Inc. | | | 13,000 | | | | 677,040 | |
Expeditors International of Washington, Inc. | | | 8,000 | | | | 594,320 | |
Fastenal Company | | | 20,000 | | | | 653,400 | |
Graco, Inc. | | | 13,000 | | | | 598,520 | |
Jacobs Engineering Group, Inc. | | | 6,475 | | | | 592,463 | |
L3Harris Technologies, Inc. | | | 6,400 | | | | 1,335,296 | |
MasTec, Inc.(a) | | | 2,000 | | | | 129,860 | |
MSC Industrial Direct Company, Inc. - Class A | | | 6,000 | | | | 435,180 | |
nVent Electric plc | | | 2,900 | | | | 63,916 | |
Pentair plc | | | 2,900 | | | | 109,620 | |
Snap-on, Inc. | | | 1,475 | | | | 230,896 | |
Waste Connections, Inc. | | | 10,500 | | | | 966,000 | |
Woodward, Inc. | | | 4,150 | | | | 447,494 | |
| | | | | | | | 7,388,902 | |
Information Technology — 14.0% | | | | | | | | |
Analog Devices, Inc. | | | 3,671 | | | | 410,161 | |
ANSYS, Inc.(a) | | | 3,500 | | | | 774,760 | |
Arrow Electronics, Inc.(a) | | | 10,100 | | | | 753,258 | |
Broadridge Financial Solutions, Inc. | | | 3,500 | | | | 435,505 | |
InterDigital, Inc. | | | 1,200 | | | | 62,964 | |
Lam Research Corporation | | | 4,000 | | | | 924,440 | |
Microchip Technology, Inc. | | | 6,000 | | | | 557,460 | |
National Instruments Corporation | | | 12,000 | | | | 503,880 | |
NVIDIA Corporation | | | 5,000 | | | | 870,350 | |
Okta, Inc.(a) | | | 3,500 | | | | 344,610 | |
Tech Data Corporation(a) | | | 3,500 | | | | 364,840 | |
Xilinx, Inc. | | | 7,000 | | | | 671,300 | |
| | | | | | | | 6,673,528 | |
13
THE GOVERNMENT STREET MID-CAP FUND
SCHEDULE OF INVESTMENTS (Continued) |
COMMON STOCKS — 90.4% (Continued) | | Shares | | | Value | |
Materials — 7.3% | | | | | | | | |
Albemarle Corporation | | | 6,700 | | | $ | 465,784 | |
Ashland Global Holdings, Inc. | | | 6,000 | | | | 462,300 | |
Berry Global Group, Inc.(a) | | | 5,000 | | | | 196,350 | |
Graphic Packaging Holding Company | | | 10,000 | | | | 147,500 | |
Martin Marietta Materials, Inc. | | | 3,000 | | | | 822,300 | |
Packaging Corporation of America | | | 6,000 | | | | 636,600 | |
Scotts Miracle-Gro Company (The) | | | 2,000 | | | | 203,640 | |
Steel Dynamics, Inc. | | | 12,000 | | | | 357,600 | |
Valvoline, Inc. | | | 8,236 | | | | 181,439 | |
| | | | | | | | 3,473,513 | |
Real Estate — 4.1% | | | | | | | | |
Mid-America Apartment Communities, Inc. | | | 15,000 | | | | 1,950,150 | |
| | | | | | | | | |
Utilities — 1.0% | | | | | | | | |
ONE Gas, Inc. | | | 3,500 | | | | 336,385 | |
UGI Corporation | | | 3,038 | | | | 152,720 | |
| | | | | | | | 489,105 | |
| | | | | | | | | |
Total Common Stocks (Cost $17,955,559) | | | | | | $ | 42,977,781 | |
|
| EXCHANGE-TRADED FUNDS — 2.6% | | | Shares | | | | Value | |
| Vanguard Mid-Cap ETF (Cost $541,413) | | | 7,350 | | | $ | 1,231,860 | |
MONEY MARKET FUNDS — 7.0% | | Shares | | | Value | |
Fidelity Institutional Money Market Government Portfolio - Class I, 1.86%(b) (Cost $3,340,482) | | | 3,340,482 | | | $ | 3,340,482 | |
| | | | | | | | | |
Total Investments at Value — 100.0%(Cost $21,837,454) | | | | | | $ | 47,550,123 | |
| | | | | | | | | |
Liabilities in Excess of Other Assets— (0.0%)(c) | | | | | | | (1,551 | ) |
| | | | | | | | | |
Net Assets — 100.0% | | | | | | $ | 47,548,572 | |
ADR - American Depositary Receipt. |
(a) | Non-income producing security. |
(b) | The rate shown is the 7-day effective yield as of September 30, 2019. |
(c) | Percentage rounds to less than 0.1%. |
See accompanying notes to financial statements. |
14
THE GOVERNMENT STREET FUNDS
STATEMENTS OF ASSETS AND LIABILITIES
September 30, 2019 (Unaudited) |
| | The
Government
Street
Equity
Fund | | | The
Government
Street
Mid-Cap
Fund | |
ASSETS | | | | | | | | |
Investments in securities: | | | | | | | | |
At cost | | $ | 28,096,473 | | | $ | 21,837,454 | |
At value (Note 2) | | $ | 58,336,931 | | | $ | 47,550,123 | |
Cash | | | 3,264 | | | | — | |
Receivable for capital shares sold | | | — | | | | 100 | |
Dividends receivable | | | 14,734 | | | | 25,911 | |
Other assets | | | 12,282 | | | | 13,105 | |
TOTAL ASSETS | | | 58,367,211 | | | | 47,589,239 | |
| | | | | | | | | |
LIABILITIES | | | | | | | | |
Distributions payable | | | 3,647 | | | | — | |
Payable for capital shares redeemed | | | 80,635 | | | | — | |
Accrued investment advisory fees (Note 4) | | | 28,763 | | | | 29,277 | |
Payable to administrator (Note 4) | | | 7,070 | | | | 6,120 | |
Other accrued expenses | | | 5,710 | | | | 5,270 | |
TOTAL LIABILITIES | | | 125,825 | | | | 40,667 | |
| | | | | | | | | |
NET ASSETS | | $ | 58,241,386 | | | $ | 47,548,572 | |
| | | | | | | | | |
Net assets consist of: | | | | | | | | |
Paid-in capital | | $ | 26,949,398 | | | $ | 21,171,850 | |
Accumulated earnings | | | 31,291,988 | | | | 26,376,722 | |
Net assets | | $ | 58,241,386 | | | $ | 47,548,572 | |
| | | | | | | | | |
Shares of beneficial interest outstanding (unlimited number of shares authorized, $0.01 par value) | | | 739,947 | | | | 1,677,426 | |
| | | | | | | | | |
Net asset value, offering price and redemption price per share (Note 2) | | $ | 78.71 | | | $ | 28.35 | |
See accompanying notes to financial statements. |
15
THE GOVERNMENT STREET FUNDS
STATEMENTS OF OPERATIONS
For the Six Months Ended September 30, 2019 (Unaudited) |
| | The
Government
Street
Equity
Fund | | | The
Government
Street
Mid-Cap
Fund | |
INVESTMENT INCOME | | | | | | | | |
Dividends | | $ | 540,751 | | | $ | 388,116 | |
Foreign withholding taxes on dividends | | | (2,180 | ) | | | (1,183 | ) |
TOTAL INVESTMENT INCOME | | | 538,571 | | | | 386,933 | |
| | | | | | | | | |
EXPENSES | | | | | | | | |
Investment advisory fees (Note 4) | | | 172,893 | | | | 177,073 | |
Administration fees (Note 4) | | | 38,244 | | | | 32,660 | |
Account maintenance fees | | | 8,811 | | | | 7,991 | |
Audit and tax services fees | | | 7,750 | | | | 7,750 | |
Registration and filing fees | | | 7,851 | | | | 7,122 | |
Trustees’ fees and expenses (Note 4) | | | 7,465 | | | | 7,465 | |
Compliance fees (Note 4) | | | 4,335 | | | | 4,291 | |
Legal fees | | | 3,320 | | | | 3,320 | |
Custodian and bank service fees | | | 3,451 | | | | 2,996 | |
Printing of shareholder reports | | | 2,543 | | | | 2,862 | |
Postage and supplies | | | 1,607 | | | | 1,661 | |
Pricing costs | | | 1,238 | | | | 994 | |
Other expenses | | | 3,591 | | | | 3,352 | |
TOTAL EXPENSES | | | 263,099 | | | | 259,537 | |
| | | | | | | | | |
NET INVESTMENT INCOME | | | 275,472 | | | | 127,396 | |
| | | | | | | | | |
REALIZED AND UNREALIZED GAINS ON INVESTMENTS | | | | | | | | |
Net realized gains from investments | | | 1,056,190 | | | | 465,617 | |
Net realized gains from in-kind redemptions (Note 2) | | | 613,781 | | | | 235,652 | |
Net change in unrealized appreciation (depreciation) on investments | | | 3,102,910 | | | | 2,712,596 | |
NET REALIZED AND UNREALIZED GAINS ON INVESTMENTS | | | 4,772,881 | | | | 3,413,865 | |
| | | | | | | | | |
NET INCREASE IN NET ASSETS RESULTING FROM OPERATIONS | | $ | 5,048,353 | | | $ | 3,541,261 | |
See accompanying notes to financial statements. |
16
THE GOVERNMENT STREET EQUITY FUND
STATEMENTS OF CHANGES IN NET ASSETS |
| | Six Months
Ended
Sept. 30, 2019
(Unaudited) | | | Year
Ended
March 31,
2019 | |
FROM OPERATIONS | | | | | | | | |
Net investment income | | $ | 275,472 | | | $ | 548,406 | |
Net realized gains from investments | | | 1,056,190 | | | | 2,732,000 | |
Net realized gains from in-kind redemptions (Note 2) | | | 613,781 | | | | 2,034,125 | |
Net change in unrealized appreciation (depreciation) on investments | | | 3,102,910 | | | | (2,134,565 | ) |
Net increase in net assets resulting from operations | | | 5,048,353 | | | | 3,179,966 | |
| | | | | | | | | |
DISTRIBUTIONS TO SHAREHOLDERS (Note 2) | | | (1,025,598 | ) | | | (4,266,778 | ) |
| | | | | | | | | |
FROM CAPITAL SHARE TRANSACTIONS | | | | | | | | |
Proceeds from shares sold | | | 127,200 | | | | 359,836 | |
Net asset value of shares issued in reinvestment of distributions to shareholders | | | 996,025 | | | | 4,106,733 | |
Payments for shares redeemed | | | (3,084,242 | ) | | | (9,906,669 | ) |
Net decrease in net assets from capital share transactions | | | (1,961,017 | ) | | | (5,440,100 | ) |
| | | | | | | | | |
TOTAL INCREASE (DECREASE) IN NET ASSETS | | | 2,061,738 | | | | (6,526,912 | ) |
| | | | | | | | | |
NET ASSETS | | | | | | | | |
Beginning of period | | | 56,179,648 | | | | 62,706,560 | |
End of period | | $ | 58,241,386 | | | $ | 56,179,648 | |
| | | | | | | | | |
CAPITAL SHARE ACTIVITY | | | | | | | | |
Shares sold | | | 1,658 | | | | 4,813 | |
Shares reinvested | | | 13,020 | | | | 56,406 | |
Shares redeemed | | | (40,409 | ) | | | (136,134 | ) |
Net decrease in shares outstanding | | | (25,731 | ) | | | (74,915 | ) |
Shares outstanding, beginning of period | | | 765,678 | | | | 840,593 | |
Shares outstanding, end of period | | | 739,947 | | | | 765,678 | |
See accompanying notes to financial statements. |
17
THE GOVERNMENT STREET MID-CAP FUND
STATEMENTS OF CHANGES IN NET ASSETS |
| | Six Months
Ended
Sept. 30, 2019
(Unaudited) | | | Year
Ended
March 31,
2019 | |
FROM OPERATIONS | | | | | | | | |
Net investment income | | $ | 127,396 | | | $ | 306,757 | |
Net realized gains from investments | | | 465,617 | | | | 1,398,108 | |
Net realized gains from in-kind redemptions (Note 2) | | | 235,652 | | | | 2,097,878 | |
Net change in unrealized appreciation (depreciation) on investments | | | 2,712,596 | | | | (1,849,158 | ) |
Net increase in net assets resulting from operations | | | 3,541,261 | | | | 1,953,585 | |
| | | | | | | | | |
DISTRIBUTIONS TO SHAREHOLDERS (Note 2) | | | (872,456 | ) | | | (1,714,010 | ) |
| | | | | | | | | |
FROM CAPITAL SHARE TRANSACTIONS | | | | | | | | |
Proceeds from shares sold | | | 101,486 | | | | 1,300,844 | |
Net asset value of shares issued in reinvestment of distributions to shareholders | | | 850,512 | | | | 1,647,714 | |
Payments for shares redeemed | | | (2,365,541 | ) | | | (6,953,800 | ) |
Net decrease in net assets from capital share transactions | | | (1,413,543 | ) | | | (4,005,242 | ) |
| | | | | | | | | |
TOTAL INCREASE (DECREASE) IN NET ASSETS | | | 1,255,262 | | | | (3,765,667 | ) |
| | | | | | | | | |
NET ASSETS | | | | | | | | |
Beginning of period | | | 46,293,310 | | | | 50,058,977 | |
End of period | | $ | 47,548,572 | | | $ | 46,293,310 | |
| | | | | | | | | |
CAPITAL SHARE ACTIVITY | | | | | | | | |
Shares sold | | | 3,636 | | | | 48,280 | |
Shares reinvested | | | 30,738 | | | | 63,397 | |
Shares redeemed | | | (85,907 | ) | | | (261,760 | ) |
Net decrease in shares outstanding | | | (51,533 | ) | | | (150,083 | ) |
Shares outstanding, beginning of period | | | 1,728,959 | | | | 1,879,042 | |
Shares outstanding, end of period | | | 1,677,426 | | | | 1,728,959 | |
See accompanying notes to financial statements. |
18
THE GOVERNMENT STREET EQUITY FUND
FINANCIAL HIGHLIGHTS |
Selected Per Share Data for a Share Outstanding Throughout Each Period: |
| | Six Months
Ended
Sept. 30,
2019 | | | Years Ended March 31, | |
| | (Unaudited) | | | 2019 | | | 2018 | | | 2017 | | | 2016 | | | 2015 | |
Net asset value at beginning of period | | $ | 73.37 | | | $ | 74.60 | | | $ | 67.08 | | | $ | 61.72 | | | $ | 65.95 | | | $ | 62.78 | |
| | | | | | | | | | | | | | | | | | | | | | | | | |
Income (loss) from investment operations: | | | | | | | | | | | | | | | | | | | | | | | | |
Net investment income | | | 0.37 | | | | 0.69 | | | | 0.66 | | | | 0.68 | | | | 0.61 | | | | 0.67 | |
Net realized and unrealized gains (losses) on investments and foreign currencies | | | 6.35 | | | | 3.37 | | | | 9.32 | | | | 6.76 | | | | (2.17 | ) | | | 6.55 | |
Total from investment operations | | | 6.72 | | | | 4.06 | | | | 9.98 | | | | 7.44 | | | | (1.56 | ) | | | 7.22 | |
| | | | | | | | | | | | | | | | | | | | | | | | | |
Less distributions: | | | | | | | | | | | | | | | | | | | | | | | | |
From net investment income | | | (0.39 | ) | | | (0.68 | ) | | | (0.65 | ) | | | (0.68 | ) | | | (0.64 | ) | | | (0.64 | ) |
From net realized gains | | | (0.99 | ) | | | (4.61 | ) | | | (1.81 | ) | | | (1.40 | ) | | | (2.03 | ) | | | (3.41 | ) |
Total distributions | | | (1.38 | ) | | | (5.29 | ) | | | (2.46 | ) | | | (2.08 | ) | | | (2.67 | ) | | | (4.05 | ) |
| | | | | | | | | | | | | | | | | | | | | | | | | |
Net asset value at end of period | | $ | 78.71 | | | $ | 73.37 | | | $ | 74.60 | | | $ | 67.08 | | | $ | 61.72 | | | $ | 65.95 | |
| | | | | | | | | | | | | | | | | | | | | | | | | |
Total return(a) | | | 9.21 | %(b) | | | 5.65 | % | | | 15.08 | % | | | 12.32 | % | | | (2.46 | %) | | | 11.87 | % |
| | | | | | | | | | | | | | | | | | | | | | | | | |
Net assets at end of period (000’s) | | $ | 58,241 | | | $ | 56,180 | | | $ | 62,707 | | | $ | 65,407 | | | $ | 80,307 | | | $ | 93,778 | |
| | | | | | | | | | | | | | | | | | | | | | | | | |
Ratio of total expenses to average net assets | | | 0.91 | %(c) | | | 0.89 | % | | | 0.88 | % | | | 0.87 | % | | | 0.85 | % | | | 0.84 | % |
| | | | | | | | | | | | | | | | | | | | | | | | | |
Ratio of net investment income to average net assets | | | 0.96 | %(c) | | | 0.92 | % | | | 0.90 | % | | | 1.03 | % | | | 0.95 | % | | | 1.02 | % |
| | | | | | | | | | | | | | | | | | | | | | | | | |
Portfolio turnover rate | | | 4 | %(b) | | | 9 | % | | | 13 | % | | | 20 | % | | | 17 | % | | | 26 | % |
(a) | Total return is a measure of the change in value of an investment in the Fund over the periods covered, which assumes any dividends or capital gains distributions are reinvested in shares of the Fund. The returns shown do not reflect the deduction of taxes a shareholder would pay on Fund distributions or the redemption of Fund shares. |
(b) | Not Annualized. |
(c) | Annualized. |
See accompanying notes to financial statements. |
19
THE GOVERNMENT STREET MID-CAP FUND
FINANCIAL HIGHLIGHTS |
Selected Per Share Data for a Share Outstanding Throughout Each Period: |
| | Six Months
Ended
Sept. 30,
2019 | | | Years Ended March 31, | |
| | (Unaudited) | | | 2019 | | | 2018 | | | 2017 | | | 2016 | | | 2015 | |
Net asset value at beginning of period | | $ | 26.78 | | | $ | 26.64 | | | $ | 24.42 | | | $ | 21.95 | | | $ | 22.96 | | | $ | 21.68 | |
| | | | | | | | | | | | | | | | | | | | | | | | | |
Income from investment operations: | | | | | | | | | | | | | | | | | | | | | | | | |
Net investment income | | | 0.08 | | | | 0.18 | | | | 0.20 | | | | 0.16 | | | | 0.10 | | | | 0.10 | |
Net realized and unrealized gains on investments | | | 2.01 | | | | 0.90 | | | | 3.32 | | | | 3.36 | | | | 0.11 | | | | 2.02 | |
Total from investment operations | | | 2.09 | | | | 1.08 | | | | 3.52 | | | | 3.52 | | | | 0.21 | | | | 2.12 | |
| | | | | | | | | | | | | | | | | | | | | | | | | |
Less distributions: | | | | | | | | | | | | | | | | | | | | | | | | |
From net investment income | | | (0.04 | ) | | | (0.14 | ) | | | (0.20 | ) | | | (0.14 | ) | | | (0.10 | ) | | | (0.07 | ) |
From net realized gains | | | (0.48 | ) | | | (0.80 | ) | | | (1.10 | ) | | | (0.91 | ) | | | (1.12 | ) | | | (0.77 | ) |
Total distributions | | | (0.52 | ) | | | (0.94 | ) | | | (1.30 | ) | | | (1.05 | ) | | | (1.22 | ) | | | (0.84 | ) |
| | | | | | | | | | | | | | | | | | | | | | | | | |
Net asset value at end of period | | $ | 28.35 | | | $ | 26.78 | | | $ | 26.64 | | | $ | 24.42 | | | $ | 21.95 | | | $ | 22.96 | |
| | | | | | | | | | | | | | | | | | | | | | | | | |
Total return(a) | | | 7.84 | %(b) | | | 4.21 | % | | | 14.67 | % | | | 16.44 | % | | | 1.04 | % | | | 10.14 | % |
| | | | | | | | | | | | | | | | | | | | | | | | | |
Net assets at end of period (000’s) | | $ | 47,549 | | | $ | 46,293 | | | $ | 50,059 | | | $ | 48,540 | | | $ | 48,547 | | | $ | 51,898 | |
| | | | | | | | | | | | | | | | | | | | | | | | | |
Ratio of total expenses to average net assets | | | 1.10 | %(c) | | | 1.08 | % | | | 1.06 | % | | | 1.07 | % | | | 1.07 | % | | | 1.05 | % |
| | | | | | | | | | | | | | | | | | | | | | | | | |
Ratio of net investment income to average net assets | | | 0.54 | %(c) | | | 0.64 | % | | | 0.78 | % | | | 0.66 | % | | | 0.46 | % | | | 0.47 | % |
| | | | | | | | | | | | | | | | | | | | | | | | | |
Portfolio turnover rate | | | 2 | %(b) | | | 6 | % | | | 12 | % | | | 14 | % | | | 20 | % | | | 16 | % |
(a) | Total return is a measure of the change in value of an investment in the Fund over the periods covered, which assumes any dividends or capital gains distributions are reinvested in shares of the Fund. The returns shown do not reflect the deduction of taxes a shareholder would pay on Fund distributions or the redemption of Fund shares. |
(b) | Not Annualized. |
(c) | Annualized. |
See accompanying notes to financial statements. |
20
THE GOVERNMENT STREET FUNDS
NOTES TO FINANCIAL STATEMENTS
September 30, 2019 (Unaudited)
1. Organization
The Government Street Equity Fund and The Government Street Mid-Cap Fund (the “Funds”) are each a diversified, no-load series of the Williamsburg Investment Trust (the “Trust”), an open-end management investment company registered under the Investment Company Act of 1940, as amended (the “1940 Act”). The Trust was organized as a Massachusetts business trust on July 18, 1988. Other series of the Trust are not included in this report.
The Government Street Equity Fund’s investment objective is to seek capital appreciation.
The Government Street Mid-Cap Fund’s investment objective is to seek capital appreciation.
2. Significant Accounting Policies
Each Fund follows accounting and reporting guidance under Financial Accounting Standards Board Accounting Standards Codification Topic 946, “Financial Services – Investment Companies.” The following is a summary of the Funds’ significant accounting policies. The policies are in conformity with accounting principles generally accepted in the United States of America (“GAAP”).
Securities valuation — The Funds’ portfolio securities are valued as of the close of business of the regular session of the New York Stock Exchange (“NYSE”) (normally 4:00 p.m. Eastern time). Securities traded on a national stock exchange, including common stocks and exchange-traded funds (“ETFs”), are valued based upon the closing price on the principal exchange where the security is traded, if available, otherwise, at the last quoted bid price. Securities that are quoted by NASDAQ are valued at the NASDAQ Official Closing Price. Investments representing shares of other open-end investment companies, other than ETFs but including money market funds, are valued at their net asset value (“NAV”) as reported by such companies. When using a quoted price and when the market is considered active, securities will be classified as Level 1 within the fair value hierarchy (see below).
When market quotations are not readily available, if a pricing service cannot provide a price, or if the investment adviser believes the price received from the pricing service is not indicative of market value, securities will be valued in good faith at fair value using methods consistent with procedures adopted by the Board of Trustees and will be classified as Level 2 or 3 within the fair value hierarchy, depending on the inputs used. Such methods of fair valuation may include, but are not limited to: multiple of earnings, multiple of book value, discount from market of a similar freely traded security, purchase price of the security, subsequent private transactions in the security or related securities, or a combination of these and other factors.
21
THE GOVERNMENT STREET FUNDS
NOTES TO FINANCIAL STATEMENTS (Continued)
GAAP establishes a single authoritative definition of fair value, sets out a framework for measuring fair value and requires additional disclosures about fair value measurements.
Various inputs are used in determining the value of each Fund’s investments. These inputs are summarized in the three broad levels listed below:
● | Level 1 – quoted prices in active markets for identical securities |
● | Level 2 – other significant observable inputs |
● | Level 3 – significant unobservable inputs |
The inputs or methodology used for valuing securities are not necessarily an indication of the risks associated with investing in those securities. The inputs used to measure fair value may fall into different levels of the fair value hierarchy. In such cases, for disclosure purposes, the level in the fair value hierarchy within which the fair value measurement falls in its entirety is determined based on the lowest level input that is significant to the fair value measurement.
The following is a summary of the inputs used to value each Fund’s investments as of September 30, 2019, by security type:
The Government Street Equity Fund: | | Level 1 | | | Level 2 | | | Level 3 | | | Total | |
Common Stocks | | $ | 55,418,567 | | | $ | — | | | $ | — | | | $ | 55,418,567 | |
Money Market Funds | | | 2,918,364 | | | | — | | | | — | | | | 2,918,364 | |
Total | | $ | 58,336,931 | | | $ | — | | | $ | — | | | $ | 58,336,931 | |
The Government Street Mid-Cap Fund: | | Level 1 | | | Level 2 | | | Level 3 | | | Total | |
Common Stocks | | $ | 42,977,781 | | | $ | — | | | $ | — | | | $ | 42,977,781 | |
Exchange-Traded Funds | | | 1,231,860 | | | | — | | | | — | | | | 1,231,860 | |
Money Market Funds | | | 3,340,482 | | | | — | | | | — | | | | 3,340,482 | |
Total | | $ | 47,550,123 | | | $ | — | | | $ | — | | | $ | 47,550,123 | |
Refer to each Fund’s Schedule of Investments for a listing of the common stocks by sector type. There were no Level 3 securities or derivative instruments held by the Funds as of or during the six months ended September 30, 2019.
Foreign currency translation — Investment securities and other assets and liabilities denominated in or expected to settle in foreign currencies, if any, are translated into U.S. dollars based on exchange rates on the following basis:
A. | The fair values of investment securities and other assets and liabilities are translated as of the close of the NYSE each day. |
22
THE GOVERNMENT STREET FUNDS
NOTES TO FINANCIAL STATEMENTS (Continued)
B. | Purchases and sales of investment securities and income and expenses are translated at the rate of exchange prevailing as of 4:00 p.m. Eastern time on the respective date of such transactions. |
C. | The Fund does not isolate that portion of the results of operations caused by changes in foreign exchange rates on investments from those caused by changes in market prices of investment securities held. Such fluctuations are included with the net realized and unrealized gains or losses on investments. |
Reported net realized foreign exchange gains or losses arise from 1) purchases and sales of foreign currencies and 2) the difference between the amounts of dividends and foreign withholding taxes recorded on a Fund’s books and the U.S. dollar equivalent of the amounts actually received or paid. Reported net unrealized foreign exchange gains and losses arise from changes in the value of assets and liabilities that result from changes in exchange rates.
Share valuation — The NAV per share of each Fund is calculated daily by dividing the total value of its assets, less liabilities, by the number of shares outstanding. The offering price and redemption price per share of each Fund is equal to the NAV per share.
Investment income — Interest income is accrued as earned. Discounts and premiums on fixed-income securities purchased, if any, are amortized using the interest method. Dividend income is recorded on the ex-dividend date. Withholding taxes on foreign dividends have been recorded in accordance with the Trust’s understanding of the applicable country’s rules and tax rates.
Distributions to shareholders — Dividends arising from net investment income are declared and paid quarterly to shareholders of The Government Street Equity Fund and declared and paid annually to shareholders of The Government Street Mid-Cap Fund. Net realized short-term capital gains, if any, may be distributed throughout the year and net realized long-term capital gains, if any, are distributed at least once each year. Dividends and distributions are recorded on the ex-dividend date. The amount of distributions from net investment income and net realized capital gains are determined in accordance with federal income tax regulations, which may differ from GAAP. These “book/tax” differences are either temporary or permanent in nature.
The tax character of distributions paid during the periods ended September 30, 2019 and March 31, 2019 was as follows:
| | Periods
Ended | | | Ordinary
Income | | | Long-Term
Capital Gains | | | Total
Distributions | |
The Government Street Equity Fund | | | 09/30/19 | | | $ | 286,867 | | | $ | 738,731 | | | $ | 1,025,598 | |
| | | | 03/31/19 | | | $ | 543,217 | | | $ | 3,723,561 | | | $ | 4,266,778 | |
The Government Street Mid-Cap Fund | | | 09/30/19 | | | $ | 62,511 | | | $ | 809,945 | | | $ | 872,456 | |
| | | | 03/31/19 | | | $ | 335,646 | | | $ | 1,378,364 | | | $ | 1,714,010 | |
23
THE GOVERNMENT STREET FUNDS
NOTES TO FINANCIAL STATEMENTS (Continued)
Investment transactions — Investment transactions are accounted for on trade date for financial reporting purposes. Realized gains and losses on investment securities sold are determined on a specific identification basis.
Common expenses— Common expenses of the Trust are allocated among the Funds and the other series of the Trust based on relative net assets of each series or the nature of the services performed and the relative applicability to each series.
Estimates — The preparation of financial statements in conformity with GAAP requires management to make estimates and assumptions that affect the reported amounts of assets and liabilities and the disclosure of contingent assets and liabilities as of the date of the financial statements and the reported amounts of income and expenses during the reporting period. Actual results could differ from those estimates.
Federal income tax — Each Fund has qualified and intends to continue to qualify as a regulated investment company under the Internal Revenue Code of 1986, as amended (the “Code”). Qualification generally will relieve the Funds of liability for federal income taxes to the extent 100% of their net investment income and any net realized capital gains are distributed in accordance with the Code.
In order to avoid imposition of the excise tax applicable to regulated investment companies, it is also each Fund’s intention to declare as dividends in each calendar year at least 98% of its net investment income (earned during the calendar year) and 98.2% of its net realized capital gains (earned during the twelve months ended October 31) plus undistributed amounts from prior years.
The following information is computed on a tax basis for each item as of September 30, 2019:
| | The Government
Street Equity
Fund | | | The Government
Street Mid-Cap
Fund | |
Cost of portfolio investments | | $ | 28,096,473 | | | $ | 21,837,454 | |
Gross unrealized appreciation | | $ | 30,476,843 | | | $ | 26,086,329 | |
Gross unrealized depreciation | | | (236,385 | ) | | | (373,660 | ) |
Net unrealized appreciation | | | 30,240,458 | | | | 25,712,669 | |
Accumulated (distributions in excess of) ordinary income | | | (973 | ) | | | 198,703 | |
Accumulated capital and other gains | | | 1,056,150 | | | | 465,350 | |
Distributions payable | | | (3,647 | ) | | | — | |
Total accumulated earnings | | $ | 31,291,988 | | | $ | 26,376,722 | |
During the six months ended September 30, 2019, The Government Street Equity Fund and The Government Street Mid-Cap Fund realized $613,781 and $235,652, respectively, of net capital gains resulting from in-kind redemptions (redemptions in which shareholders who redeemed Fund shares received investment securities held by
24
THE GOVERNMENT STREET FUNDS
NOTES TO FINANCIAL STATEMENTS (Continued)
the Fund rather than cash). The Funds recognize a gain on in-kind redemptions to the extent that the value of the distributed investment securities on the date of redemption exceeds the cost of those investment securities. Such gains are not taxable to the Funds and are not required to be distributed to shareholders. The Funds have reclassified these gains against paid-in capital on the Statements of Assets and Liabilities. Such reclassifications, the result of permanent differences between the financial statement and income tax reporting requirements, had no effect on each Fund’s net assets or NAV per share.
The Funds recognize the tax benefits or expenses of uncertain tax positions only when the position is “more likely than not” to be sustained assuming examination by tax authorities. Management has reviewed the tax positions taken on federal income tax returns for the current and all open tax years (generally, three years) of each Fund and has concluded that no provision for unrecognized tax benefits or expenses is required in these financial statements.
3. Investment Transactions
Investment transactions, other than short-term investments and U.S. government securities, were as follows for the six months ended September 30, 2019:
| | The Government
Street Equity
Fund | | | The Government
Street Mid-Cap
Fund | |
Purchases of investment securities | | $ | 2,246,603 | | | $ | 892,979 | |
Proceeds from sales of investment securities | | $ | 5,445,235 | | | $ | 3,434,240 | |
4. Transactions with Related Parties
INVESTMENT ADVISORY AGREEMENT
Each Fund’s investments are managed by Leavell Investment Management, Inc. (the “Adviser”) under the terms of an Investment Advisory Agreement. The Government Street Equity Fund pays the Adviser a fee, which is computed and accrued daily and paid monthly, at annual rates of 0.60% of its average daily net assets up to $100 million and 0.50% of such assets in excess of $100 million. The Government Street Mid-Cap Fund pays the Adviser a fee, which is computed and accrued daily and paid monthly, at an annual rate of 0.75% of its average daily net assets.
Certain officers of the Trust are also officers of the Adviser.
OTHER SERVICE PROVIDERS
Ultimus Fund Solutions, LLC (“Ultimus”) provides administration, fund accounting, compliance and transfer agent services to the Funds. The Funds pay Ultimus fees in accordance with the agreements for such services. In addition, the Funds pay out-of-pocket expenses including, but not limited to, postage, supplies, and costs of pricing the
25
THE GOVERNMENT STREET FUNDS
NOTES TO FINANCIAL STATEMENTS (Continued)
Funds’ portfolio securities. Certain officers of the Trust are also officers of Ultimus, or of Ultimus Fund Distributors, LLC (the “Distributor”), the principal underwriter of each Fund’s shares and an affiliate of Ultimus. The Distributor is compensated by the Adviser (not the Funds) for acting as principal underwriter.
COMPENSATION OF TRUSTEES
Trustees and officers affiliated with the Adviser or Ultimus are not compensated by the Trust for their services. Each Trustee who is not an affiliated person of the Adviser or Ultimus receives from the Trust an annual retainer of $20,000, payable quarterly; a fee of $2,000 for attendance at each meeting of the Board of Trustees (except that such fee is $3,000 for the independent chair); and a fee of $1,000 for attendance at each meeting of any committee of the Board (except that such fee is $1,500 for the committee chair); plus reimbursement of travel and other expenses incurred in attending meetings. Each series of the Trust pays its proportionate share of such fees.
5. Contingencies and Commitments
The Funds indemnify the Trust’s officers and Trustees for certain liabilities that might arise from their performance of their duties to the Funds. Additionally, in the normal course of business the Funds enter into contracts that contain a variety of representations and warranties and which provide general indemnifications. The Funds’ maximum exposure under these arrangements is unknown, as this would involve future claims that may be made against the Funds that have not yet occurred. However, based on experience, the Trust expects the risk of loss to be remote.
6. Subsequent Events
The Funds are required to recognize in the financial statements the effects of all subsequent events that provide additional evidence about conditions that existed as of the date of the Statements of Assets and Liabilities. For non-recognized subsequent events that must be disclosed to keep the financial statements from being misleading, the Funds are required to disclose the nature of the event as well as an estimate of its financial effect, or a statement that such an estimate cannot be made. Management has evaluated subsequent events through the issuance of these financial statements and has noted no such events.
26
THE GOVERNMENT STREET FUNDS
ABOUT YOUR FUNDS’ EXPENSES (Unaudited)
We believe it is important for you to understand the impact of costs on your investment. All mutual funds have operating expenses. As a shareholder of the Funds, you incur ongoing costs, including management fees and other expenses. These ongoing costs, which are deducted from each Fund’s gross income, directly reduce the investment returns of the Funds.
A mutual fund’s ongoing costs are expressed as a percentage of its average net assets. This figure is known as the expense ratio. The following examples are intended to help you understand the ongoing costs (in dollars) of investing in the Funds and to compare these costs with the ongoing costs of investing in other mutual funds. The examples below are based on an investment of $1,000 made at the beginning of the period shown and held for the entire period (April 1, 2019 through September 30, 2019).
The table below illustrates each Fund’s ongoing costs in two ways:
Actual fund return – This section helps you to estimate the actual expenses that you paid over the period. The “Ending Account Value” shown is derived from each Fund’s actual return, and the fourth column shows the dollar amount of operating expenses that would have been paid by an investor who started with $1,000 in the Funds. You may use the information here, together with the amount you invested, to estimate the expenses that you paid over the period.
To do so, simply divide your account value by $1,000 (for example, an $8,600 account value divided by $1,000 = 8.6), then multiply the result by the number given for the Funds under the heading “Expenses Paid During Period.”
Hypothetical 5% return – This section is intended to help you compare the Funds’ ongoing costs with those of other mutual funds. It assumes that each Fund had an annual return of 5% before expenses during the period shown, but that the expense ratio is unchanged. In this case, because the returns used are not the Funds’ actual returns, the results do not apply to your investment. The example is useful in making comparisons because the U.S. Securities and Exchange Commission (the “SEC”) requires all mutual funds to calculate expenses based on a 5% return. You can assess each Fund’s ongoing costs by comparing this hypothetical example with the hypothetical examples that appear in shareholder reports of other funds.
Note that expenses shown in the table are meant to highlight and help you compare ongoing costs only. The Funds do not charge sales loads or redemption fees.
The calculations assume no shares were bought or sold during the period. Your actual costs may have been higher or lower, depending on the amount of your investment and the timing of any purchases or redemptions.
27
THE GOVERNMENT STREET FUNDS
ABOUT YOUR FUNDS’ EXPENSES (Unaudited) (Continued)
More information about the Funds’ expenses, including historical expense ratios, can be found in this report. For additional information on operating expenses and other shareholder costs, please refer to the Funds’ prospectus.
| | Beginning
Account Value
April 1, 2019 | Ending
Account Value
Sept. 30, 2019 | Expense
Ratio(a) | Expenses
Paid During
Period(b) |
The Government Street Equity Fund |
Based on Actual Fund Return | $1,000.00 | $1,092.10 | 0.91% | $4.77 |
Based on Hypothetical 5% Return (before expenses) | $1,000.00 | $1,020.51 | 0.91% | $4.61 |
The Government Street Mid-Cap Fund |
Based on Actual Fund Return | $1,000.00 | $1,078.40 | 1.10% | $5.73 |
Based on Hypothetical 5% Return (before expenses) | $1,000.00 | $1,019.55 | 1.10% | $5.57 |
(a) | Annualized, based on each Fund’s most recent one-half year expenses. |
(b) | Expenses are equal to each Fund’s annualized expense ratio multiplied by the average account value over the period, multiplied by 183/365 (to reflect the one-half year period). |
28
THE GOVERNMENT STREET FUNDS
OTHER INFORMATION (Unaudited)
A description of the policies and procedures that the Funds use to vote proxies relating to portfolio securities is available without charge upon request by calling toll-free 1-866-738-1125, or on the SEC’s website at www.sec.gov. Information regarding how the Funds voted proxies relating to portfolio securities during the most recent 12-month period ended June 30 is also available without charge upon request by calling toll-free 1-866-738-1125 or on the SEC’s website at www.sec.gov.
The Trust files a complete listing of portfolio holdings for the Funds with the SEC as of the end of the first and third quarters of each fiscal year on Form N-Q. The filings are available upon request, by calling 1-866-738-1125. Furthermore, you may obtain a copy of these filings on the SEC’s website at www.sec.gov.
29
The Government Street Funds
No-Load Mutual Funds
Investment Adviser
Leavell Investment Management, Inc.
210 St. Joseph Street
Mobile, AL 36602
Administrator
Ultimus Fund Solutions, LLC
P.O. Box 46707
Cincinnati, OH 45246-0707
1-866-738-1125
Legal Counsel
Sullivan & Worcester LLP
1666 K Street, N.W.
Washington, DC 20006
Independent Registered Public Accounting Firm
Cohen & Company, Ltd.
1350 Euclid Avenue
Suite 800
Cleveland, Ohio 44115
Board of Trustees
Robert S. Harris, Ph.D., Chairman
John P. Ackerly, IV
John T. Bruce
George K. Jennison
Harris V. Morrissette
Elizabeth W. Robertson
Portfolio Manager
Thomas W. Leavell,
The Government Street Equity Fund
The Government Street Mid-Cap Fund
THE
JAMESTOWN
EQUITY FUND
No-Load Fund
SEMI-ANNUAL REPORT
September 30, 2019
(Unaudited)
Investment Adviser
Lowe, Brockenbrough & Company, Inc.
Richmond, Virginia
Beginning on January 1, 2021, as permitted by regulations adopted by the U.S. Securities and Exchange Commission, paper copies of the Fund’s shareholder reports like this one will no longer be sent by mail, unless you specifically request paper copies of the reports from the Fund or from your financial intermediary, such as a broker-dealer or bank. Instead, the reports will be made available on a website, and you will be notified by mail each time a report is posted and provided with a website link to access the report.
If you already elected to receive shareholder reports electronically, you will not be affected by this change and you need not take any action. You may elect to receive shareholder reports and other communications from the Fund electronically by contacting the Fund at 1-866-738-1126 or, if you own these shares through a financial intermediary, by contacting your financial intermediary.
You may elect to receive all future reports in paper free of charge. You can inform the Fund that you wish to continue receiving paper copies of your shareholder reports by contacting the Fund at 1-866-738-1126. If you own shares through a financial intermediary, you may contact your financial intermediary or follow instructions included with this document to elect to continue to receive paper copies of your shareholder reports. Your election to receive reports in paper will apply to all Funds held with the Fund complex or at your financial intermediary.
LETTER TO SHAREHOLDERS | November 4, 2019 |
The Jamestown Equity Fund
For the six-month period ended September 30, 2019, The Jamestown Equity Fund (the “Fund”) rose 5.96% compared to 6.08% for the S&P 500 Index. The equity market continued to march forward with a little volatility over the past six months. Investors have shrugged off geopolitical concerns and discord in Washington as the U.S. economy remains resilient, while international economies have slowed. The global slowdown has led to slower earnings growth. However, investors have looked through the slowdown as central banks have been actively cutting interest rates to help stimulate growth.
Four Democratic presidential debates, an impeachment inquiry, Hong Kong protests, China trade talks and increasing military activity in the Middle East were all in the news the third quarter. In addition, the Federal Reserve (the “Fed”) cut interest rates twice, acknowledging the expectation of slower U.S. economic growth. Bonds prices continued to rally with yields nearing 2016 lows. As of September 30th, the Treasury yield curve was inverted, with short-term yields greater than long-term yields. This condition usually is followed by cuts in short-term interest rates, as the central bank eases monetary policy.
With the Fed’s pivot to easing, the bond market is priced for further rate cuts by the end of the year. Inflation expectations remain muted with the Consumer Price Index dipping below 2.0% and the Core CPI (ex food and energy) showing no signs of accelerating. The inflation rate has fallen short of the Fed’s target for several years.
��
The labor market appears healthy. U.S. non-farm payrolls continue to expand and the unemployment rate fell to 3.5%, the lowest level since December 1969. The Institute for Supply Management PMI survey showed that activity in the manufacturing sector has stagnated, validating fears of a slowdown. The ISM Non-manufacturing survey continues to show growth for the month, but at a slower rate than August. Overall, the economy grew for the 125th consecutive month. Most macroeconomic indicators that we track have weakened in recent months but are still not indicating an imminent recession.
Currently, the S&P 500 forward 12-month price-to-earnings ratio is 16.8x versus the 25-year average of 16.2x, modestly overvalued but fair given the low interest rate environment. Free cash flow yield, perhaps a better measure of value, is hovering around its long-term average.
The large outperformance of growth stocks compared to value stocks moderated during the past six months as the Russell 1000 Growth Index rose 6.20% compared to 5.25% for the Russell 1000 Value Index. At the end of September 2019, the greatest sector overweights in the portfolio, relative to benchmark weightings, were in the Consumer Discretionary, Financials, and Industrials sectors. The largest sector underweights in the Fund remain in the Utilities, Health Care, Consumer Staples, and the newly broadened Communications Services sectors.
1
THE JAMESTOWN EQUITY FUND
PERFORMANCE INFORMATION (Unaudited)
Comparison of the Change in Value of a $10,000 Investment in
The Jamestown Equity Fund
and the Standard & Poor’s 500® Index
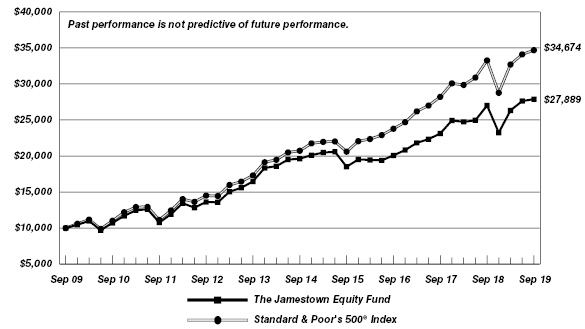
| | Average Annual Total Returns
(for periods ended September 30, 2019) | |
| | 1 Year | 5 Years | 10 Years | |
The Jamestown Equity Fund(a) | 3.25% | 7.27% | 10.80% | |
Standard & Poor’s 500® Index | 4.25% | 10.84% | 13.24% | |
(a) | Total return is a measure of the change in value of an investment in the Fund over the periods covered, which assumes any dividends or capital gains distributions are reinvested in shares of the Fund. Returns shown do not reflect the deduction of taxes a shareholder would pay on Fund distributions or the redemption of Fund shares. |
2
THE JAMESTOWN EQUITY FUND
PORTFOLIO INFORMATION
September 30, 2019 (Unaudited)
Asset Allocation (% of Net Assets)
|

|
Ten Largest Equity Holdings | % of
Net Assets |
Apple, Inc. | 3.9% |
Amazon.com, Inc. | 3.3% |
Microsoft Corporation | 3.2% |
JPMorgan Chase & Company | 3.0% |
Cisco Systems, Inc. | 2.9% |
Thermo Fisher Scientific, Inc. | 2.4% |
Vanguard Information Technology ETF | 2.3% |
Lowe’s Companies, Inc. | 2.2% |
Merck & Company, Inc. | 2.2% |
United Technologies Corporation | 2.1% |
Sector Concentration vs. the S&P 500® Index |

3
THE JAMESTOWN EQUITY FUND
SCHEDULE OF INVESTMENTS
September 30, 2019 (Unaudited) |
COMMON STOCKS — 82.2% | | Shares | | | Value | |
Communication Services — 5.7% | | | | | | | | |
Alphabet, Inc. - Class A(a) | | | 500 | | | $ | 610,570 | |
Alphabet, Inc. - Class C(a) | | | 600 | | | | 731,400 | |
Comcast Corporation - Class A | | | 16,900 | | | | 761,852 | |
| | | | | | | | 2,103,822 | |
Consumer Discretionary — 13.0% | | | | | | | | |
Amazon.com, Inc.(a) | | | 700 | | | | 1,215,137 | |
Booking Holdings, Inc.(a) | | | 390 | | | | 765,418 | |
Dollar Tree, Inc.(a) | | | 6,300 | | | | 719,208 | |
Home Depot, Inc. (The) | | | 2,500 | | | | 580,050 | |
Lowe’s Companies, Inc. | | | 7,300 | | | | 802,708 | |
TJX Companies, Inc. (The) | | | 13,000 | | | | 724,620 | |
| | | | | | | | 4,807,141 | |
Consumer Staples — 3.1% | | | | | | | | |
J.M. Smucker Company (The) | | | 300 | | | | 33,006 | |
PepsiCo, Inc. | | | 5,500 | | | | 754,050 | |
Walmart, Inc. | | | 3,200 | | | | 379,776 | |
| | | | | | | | 1,166,832 | |
Energy — 4.8% | | | | | | | | |
Chevron Corporation | | | 6,400 | | | | 759,040 | |
Exxon Mobil Corporation | | | 5,000 | | | | 353,050 | |
Total S.A. - ADR | | | 12,700 | | | | 660,400 | |
| | | | | | | | 1,772,490 | |
Financials — 15.3% | | | | | | | | |
Ameriprise Financial, Inc. | | | 5,000 | | | | 735,500 | |
Chubb Ltd. | | | 2,500 | | | | 403,600 | |
Discover Financial Services | | | 9,000 | | | | 729,810 | |
Goldman Sachs Group, Inc. (The) | | | 3,500 | | | | 725,305 | |
JPMorgan Chase & Company | | | 9,500 | | | | 1,118,055 | |
KeyCorp | | | 35,000 | | | | 624,400 | |
Morgan Stanley | | | 15,000 | | | | 640,050 | |
PNC Financial Services Group, Inc. (The) | | | 5,000 | | | | 700,800 | |
| | | | | | | | 5,677,520 | |
Health Care — 11.1% | | | | �� | | | | |
Amgen, Inc. | | | 2,300 | | | | 445,073 | |
Anthem, Inc. | | | 2,000 | | | | 480,200 | |
Gilead Sciences, Inc. | | | 8,000 | | | | 507,040 | |
Merck & Company, Inc. | | | 9,500 | | | | 799,710 | |
Pfizer, Inc. | | | 15,000 | | | | 538,950 | |
Thermo Fisher Scientific, Inc. | | | 3,000 | | | | 873,810 | |
UnitedHealth Group, Inc. | | | 2,155 | | | | 468,325 | |
| | | | | | | | 4,113,108 | |
4
THE JAMESTOWN EQUITY FUND
SCHEDULE OF INVESTMENTS (Continued) |
COMMON STOCKS — 82.2% (Continued) | | Shares | | | Value | |
Industrials — 11.0% | | | | | | | | |
Boeing Company (The) | | | 1,435 | | | $ | 545,975 | |
Delta Air Lines, Inc. | | | 12,700 | | | | 731,520 | |
Eaton Corporation plc | | | 8,000 | | | | 665,200 | |
Ingersoll-Rand plc | | | 5,585 | | | | 688,128 | |
Norfolk Southern Corporation | | | 3,655 | | | | 656,657 | |
United Technologies Corporation | | | 5,800 | | | | 791,816 | |
| | | | | | | | 4,079,296 | |
Information Technology — 14.7% | | | | | | | | |
Apple, Inc. | | | 6,500 | | | | 1,455,805 | |
Cisco Systems, Inc. | | | 21,500 | | | | 1,062,315 | |
Intel Corporation | | | 7,035 | | | | 362,513 | |
Microsoft Corporation | | | 8,500 | | | | 1,181,755 | |
Oracle Corporation | | | 12,700 | | | | 698,881 | |
Visa, Inc. - Class A | | | 4,000 | | | | 688,040 | |
| | | | | | | | 5,449,309 | |
Materials — 1.5% | | | | | | | | |
Eastman Chemical Company | | | 7,500 | | | | 553,725 | |
| | | | | | | | | |
Real Estate — 2.0% | | | | | | | | |
American Tower Corporation | | | 3,360 | | | | 742,997 | |
| | | | | | | | | |
Total Common Stocks (Cost $15,511,915) | | | | | | $ | 30,466,240 | |
|
EXCHANGE-TRADED FUNDS — 12.8% | | Shares | | | Value | |
Communication Services Select Sector SPDR Fund | | | 14,925 | | | $ | 739,086 | |
Consumer Staples Select Sector SPDR Fund | | | 9,250 | | | | 568,135 | |
iShares Expanded Tech-Software Sector ETF | | | 3,485 | | | | 738,402 | |
iShares PHLX Semiconductor ETF | | | 1,885 | | | | 398,508 | |
SPDR Portfolio S&P 500 Growth ETF | | | 18,355 | | | | 713,826 | |
Vanguard Information Technology ETF | | | 4,000 | | | | 862,200 | |
Vanguard S&P 500 ETF | | | 2,700 | | | | 736,020 | |
Total Exchange-Traded Funds(Cost $4,064,036) | | | | | | $ | 4,756,177 | |
5
THE JAMESTOWN EQUITY FUND
SCHEDULE OF INVESTMENTS (Continued) |
MONEY MARKET FUNDS — 5.1% | | Shares | | | Value | |
Federated Government Obligations Fund - Institutional Class, 1.85%(b) (Cost $1,900,607) | | | 1,900,607 | | | $ | 1,900,607 | |
| | | | | | | | | |
Total Investments at Value — 100.1% (Cost $21,476,558) | | | | | | $ | 37,123,024 | |
| | | | | | | | | |
Liabilities in Excess of Other Assets — (0.1%) | | | | | | | (23,366 | ) |
| | | | | | | | | |
Net Assets — 100.0% | | | | | | $ | 37,099,658 | |
ADR - American Depositary Receipt. |
(a) | Non-income producing security. |
(b) | The rate shown is the 7-day effective yield as of September 30, 2019. |
See accompanying notes to financial statements. |
6
THE JAMESTOWN EQUITY FUND
STATEMENT OF ASSETS AND LIABILITIES
September 30, 2019 (Unaudited) |
ASSETS | | | | |
Investments in securities: | | | | |
At cost | | $ | 21,476,558 | |
At value (Note 2) | | $ | 37,123,024 | |
Cash | | | 2,960 | |
Receivable for capital shares sold | | | 880 | |
Dividends receivable | | | 33,167 | |
Other assets | | | 10,115 | |
TOTAL ASSETS | | | 37,170,146 | |
| | | | | |
LIABILITIES | | | | |
Distributions payable | | | 6,647 | |
Payable for capital shares redeemed | | | 35,934 | |
Accrued investment advisory fees (Note 4) | | | 18,022 | |
Payable to administrator (Note 4) | | | 6,250 | |
Other accrued expenses | | | 3,635 | |
TOTAL LIABILITIES | | | 70,488 | |
| | | | | |
NET ASSETS | | $ | 37,099,658 | |
| | | | | |
Net assets consist of: | | | | |
Paid-in capital | | $ | 20,248,844 | |
Accumulated earnings | | | 16,850,814 | |
Net assets | | $ | 37,099,658 | |
| | | | | |
Shares of beneficial interest outstanding (unlimited number of shares authorized, $0.01 par value) | | | 1,654,947 | |
| | | | | |
Net asset value, offering price and redemption price per share (Note 2) | | $ | 22.42 | |
See accompanying notes to financial statements. |
7
THE JAMESTOWN EQUITY FUND
STATEMENT OF OPERATIONS
Six Months Ended September 30, 2019 (Unaudited) |
INVESTMENT INCOME | | | | |
Dividends | | $ | 378,222 | |
Foreign withholding taxes on dividends | | | (3,213 | ) |
TOTAL INVESTMENT INCOME | | | 375,009 | |
| | | | | |
EXPENSES | | | | |
Investment advisory fees (Note 4) | | | 121,233 | |
Administration fees (Note 4) | | | 30,000 | |
Audit and tax services fees | | | 7,750 | |
Compliance service fees (Note 4) | | | 7,500 | |
Trustees’ fees and expenses (Note 4) | | | 7,465 | |
Registration and filing fees | | | 6,998 | |
Custodian and bank service fees | | | 4,310 | |
Printing of shareholder reports | | | 3,808 | |
Legal fees | | | 3,320 | |
Postage and supplies | | | 2,180 | |
Account maintenance fees | | | 2,100 | |
Insurance expense | | | 679 | |
Pricing costs | | | 643 | |
Other expenses | | | 3,572 | |
TOTAL EXPENSES | | | 201,558 | |
Fees voluntarily waived by the Adviser (Note 4) | | | (21,372 | ) |
Expenses reimbursed through a directed brokerage arrangement (Note 5) | | | (3,000 | ) |
NET EXPENSES | | | 177,186 | |
| | | | | |
NET INVESTMENT INCOME | | | 197,823 | |
| | | | | |
REALIZED AND UNREALIZED GAINS ON INVESTMENTS | | | | |
Net realized gains on investment transactions | | | 1,281,759 | |
Net change in unrealized appreciation (depreciation) on investments | | | 660,352 | |
NET REALIZED AND UNREALIZED GAINS ON INVESTMENTS | | | 1,942,111 | |
| | | | | |
NET INCREASE IN NET ASSETS RESULTING FROM OPERATIONS | | $ | 2,139,934 | |
See accompanying notes to financial statements. |
8
THE JAMESTOWN EQUITY FUND
STATEMENTS OF CHANGES IN NET ASSETS |
| | Six Months
Ended
Sept. 30,
2019
(Unaudited) | | | Year
Ended
March 31,
2019 | |
FROM OPERATIONS | | | | | | | | |
Net investment income | | $ | 197,823 | | | $ | 405,868 | |
Net realized gains on investment transactions | | | 1,281,759 | | | | 1,457,217 | |
Net change in unrealized appreciation (depreciation) on investments | | | 660,352 | | | | 421,385 | |
Net increase in net assets resulting from operations | | | 2,139,934 | | | | 2,284,470 | |
| | | | | | | | | |
DISTRIBUTIONS TO SHAREHOLDERS (Note 2) | | | (1,092,826 | ) | | | (2,769,053 | ) |
| | | | | | | | | |
FROM CAPITAL SHARE TRANSACTIONS | | | | | | | | |
Proceeds from shares sold | | | 180,866 | | | | 297,049 | |
Net asset value of shares issued in reinvestment of distributions to shareholders | | | 1,021,468 | | | | 2,603,952 | |
Payments for shares redeemed | | | (1,807,698 | ) | | | (3,328,402 | ) |
Net decrease in net assets from capital share transactions | | | (605,364 | ) | | | (427,401 | ) |
| | | | | | | | | |
TOTAL INCREASE (DECREASE) IN NET ASSETS | | | 441,744 | | | | (911,984 | ) |
| | | | | | | | | |
NET ASSETS | | | | | | | | |
Beginning of period | | | 36,657,914 | | | | 37,569,898 | |
End of period | | $ | 37,099,658 | | | $ | 36,657,914 | |
| | | | | | | | | |
CAPITAL SHARE ACTIVITY | | | | | | | | |
Shares sold | | | 7,971 | | | | 13,911 | |
Shares reinvested | | | 45,859 | | | | 122,969 | |
Shares redeemed | | | (81,027 | ) | | | (154,992 | ) |
Net decrease in shares outstanding | | | (27,197 | ) | | | (18,112 | ) |
Shares outstanding, beginning of period | | | 1,682,144 | | | | 1,700,256 | |
Shares outstanding, end of period | | | 1,654,947 | | | | 1,682,144 | |
See accompanying notes to financial statements. |
9
THE JAMESTOWN EQUITY FUND
FINANCIAL HIGHLIGHTS |
Selected Per Share Data for a Share Outstanding Throughout Each Period: |
| | Six Months
Ended
Sept. 30, | | | Years Ended March 31, | |
| | 2019
(Unaudited) | | | 2019 | | | 2018 | | | 2017 | | | 2016 | | | 2015 | |
Net asset value at beginning of period | | $ | 21.79 | | | $ | 22.10 | | | $ | 20.89 | | | $ | 19.57 | | | $ | 21.91 | | | $ | 22.47 | |
| | | | | | | | | | | | | | | | | | | | | | | | | |
Income (loss) from investment operations: | | | | | | | | | | | | | | | | | | | | | | | | |
Net investment income | | | 0.12 | | | | 0.24 | | | | 0.19 | | | | 0.19 | | | | 0.16 | | | | 0.16 | |
Net realized and unrealized gains (losses) on investments | | | 1.17 | | | | 1.10 | | | | 2.51 | | | | 2.12 | | | | (1.18 | ) | | | 1.96 | |
Total from investment operations | | | 1.29 | | | | 1.34 | | | | 2.70 | | | | 2.31 | | | | (1.02 | ) | | | 2.12 | |
| | | | | | | | | | | | | | | | | | | | | | | | | |
Less distributions: | | | | | | | | | | | | | | | | | | | | | | | | |
From net investment income | | | (0.12 | ) | | | (0.24 | ) | | | (0.19 | ) | | | (0.20 | ) | | | (0.16 | ) | | | (0.16 | ) |
From net realized gains | | | (0.54 | ) | | | (1.41 | ) | | | (1.30 | ) | | | (0.79 | ) | | | (1.16 | ) | | | (2.52 | ) |
Total distributions | | | (0.66 | ) | | | (1.65 | ) | | | (1.49 | ) | | | (0.99 | ) | | | (1.32 | ) | | | (2.68 | ) |
| | | | | | | | | | | | | | | | | | | | | | | | | |
Net asset value at end of period | | $ | 22.42 | | | $ | 21.79 | | | $ | 22.10 | | | $ | 20.89 | | | $ | 19.57 | | | $ | 21.91 | |
| | | | | | | | | | | | | | | | | | | | | | | | | |
Total return(a) | | | 5.96 | %(b) | | | 6.40 | % | | | 13.35 | % | | | 12.14 | % | | | (4.96 | %) | | | 10.14 | % |
| | | | | | | | | | | | | | | | | | | | | | | | | |
Net assets at end of period (000’s) | | $ | 37,100 | | | $ | 36,658 | | | $ | 37,570 | | | $ | 37,460 | | | $ | 37,682 | | | $ | 29,596 | |
| | | | | | | | | | | | | | | | | | | | | | | | | |
Ratio of total expenses to average net assets | | | 1.06 | %(c) | | | 1.03 | % | | | 1.03 | % | | | 1.03 | % | | | 1.03 | % | | | 1.09 | % |
| | | | | | | | | | | | | | | | | | | | | | | | | |
Ratio of net expenses to average net assets(d)(e) | | | 0.95 | %(c) | | | 0.95 | % | | | 0.95 | % | | | 0.95 | % | | | 1.00 | % | | | 1.05 | % |
| | | | | | | | | | | | | | | | | | | | | | | | | |
Ratio of net investment income to average net assets(d)(e) | | | 1.08 | %(c) | | | 1.10 | % | | | 0.87 | % | | | 0.96 | % | | | 0.82 | % | | | 0.71 | % |
| | | | | | | | | | | | | | | | | | | | | | | | | |
Portfolio turnover rate | | | 4 | %(b) | | | 18 | % | | | 18 | % | | | 27 | % | | | 50 | % | | | 29 | % |
(a) | Total return is a measure of the change in value of an investment in the Fund over the periods covered, which assumes any dividends or capital gains distributions are reinvested in shares of the Fund. Returns shown do not reflect the deduction of taxes a shareholder would pay on Fund distributions or the redemption of Fund shares. |
(b) | Not annualized. |
(c) | Annualized. |
(d) | Ratios were determined based on net expenses after expense reimbursements through a directed brokerage arrangement (Note 5). |
(e) | Ratio was determined after voluntary advisory fee waivers by the Adviser and reimbursed expenses (Notes 4 and 5). |
See accompanying notes to financial statements. |
10
THE JAMESTOWN EQUITY FUND
NOTES TO FINANCIAL STATEMENTS
September 30, 2019 (Unaudited)
1. Organization
The Jamestown Equity Fund (the “Fund”) is a diversified, no-load series of Williamsburg Investment Trust (the “Trust”), an open-end management investment company registered under the Investment Company Act of 1940, as amended (the “1940 Act”). The Trust was organized as a Massachusetts business trust on July 18, 1988. Other series of the Trust are not included in this report.
The Fund’s investment objective is long-term growth of capital.
2. Significant Accounting Policies
The Fund follows accounting and reporting guidance under Financial Accounting Standards Board Accounting Standards Codification Topic 946, “Financial Services – Investment Companies.” The following is a summary of the Fund’s significant accounting policies. These policies are in conformity with accounting principles generally accepted in the United States of America (“GAAP”).
Securities valuation — The Fund’s portfolio securities are valued as of the close of business of the regular session of the New York Stock Exchange (normally 4:00 p.m., Eastern time). Securities traded on a national stock exchange, including common stocks and exchange-traded funds (“ETFs”), are generally valued based upon the closing price on the principal exchange where the security is traded, if available, otherwise, at the last quoted bid price. Securities that are quoted by NASDAQ are valued at the NASDAQ Official Closing Price. Investments representing shares of other open-end investment companies, other than ETFs but including money market funds, are valued at their net asset value (“NAV”) as reported by such companies. When using a quoted price and when the market is considered active, securities will be classified as Level 1 within the fair value hierarchy (see below).
When market quotations are not readily available, if a pricing service cannot provide a price, or if the investment adviser believes the price received from the pricing service is not indicative of market value, securities will be valued in good faith at fair value using methods consistent with procedures adopted by the Board of Trustees and will be classified as Level 2 or 3 within the fair value hierarchy, depending on the inputs used. Such methods of fair valuation may include, but are not limited to: multiple of earnings, multiple of book value, discount from market of a similar freely traded security, purchase price of the security, subsequent private transactions in the security or related securities, or a combination of these and other factors.
GAAP establishes a single authoritative definition of fair value, sets out a framework for measuring fair value and requires additional disclosures about fair value measurements.
Various inputs are used in determining the value of the Fund’s investments. These inputs are summarized in the three broad levels listed below:
● | Level 1 – quoted prices in active markets for identical securities |
● | Level 2 – other significant observable inputs |
11
THE JAMESTOWN EQUITY FUND
NOTES TO FINANCIAL STATEMENTS (Continued)
● | Level 3 – significant unobservable inputs |
The inputs or methodology used for valuing securities are not necessarily an indication of the risks associated with investing in those securities. The inputs used to measure fair value may fall into different levels of the fair value hierarchy. In such cases, for disclosure purposes, the level in the fair value hierarchy within which the fair value measurement falls in its entirety is determined based on the lowest level input that is significant to the fair value measurement.
The following is a summary of the inputs used to value the Fund’s investments as of September 30, 2019, by security type:
The Jamestown Equity Fund | | Level 1 | | | Level 2 | | | Level 3 | | | Total | |
Common Stocks | | $ | 30,466,240 | | | $ | — | | | $ | — | | | $ | 30,466,240 | |
Exchange-Traded Funds | | | 4,756,177 | | | | — | | | | — | | | | 4,756,177 | |
Money Market Funds | | | 1,900,607 | | | | — | | | | — | | | | 1,900,607 | |
Total | | $ | 37,123,024 | | | $ | — | | | $ | — | | | $ | 37,123,024 | |
Refer to the Fund’s Schedule of Investments for a listing of the common stocks by sector type. There were no Level 3 securities or derivative instruments held by the Fund as of or during the six months ended September 30, 2019.
Share valuation — The NAV per share of the Fund is calculated daily by dividing the total value of its assets, less liabilities, by the number of shares outstanding. The offering price and redemption price per share of the Fund is equal to the NAV per share.
Investment income — Dividend income is recorded on the ex-dividend date. Withholding taxes on foreign dividends received by the Fund, if any, have been recorded in accordance with the Trust’s understanding of the applicable country’s rules and tax rates.
Distributions to shareholders — Dividends arising from net investment income, if any, are declared and paid quarterly to shareholders of the Fund. Net realized short-term capital gains, if any, may be distributed throughout the year and net realized long-term capital gains, if any, are distributed at least once each year. The amount of distributions from net investment income and net realized capital gains are determined in accordance with federal income tax regulations, which may differ from GAAP. Dividends and distributions are recorded on the ex-dividend date.
The tax character of distributions paid during the periods ended September 30, 2019 and March 31, 2019 was as follows:
Periods
Ended | | Ordinary
Income | | | Long-Term
Capital Gains | | | Total
Distributions | |
9/30/2019 | | $ | 204,096 | | | $ | 888,730 | | | $ | 1,092,826 | |
3/31/2019 | | $ | 415,079 | | | $ | 2,353,974 | | | $ | 2,769,053 | |
12
THE JAMESTOWN EQUITY FUND
NOTES TO FINANCIAL STATEMENTS (Continued)
Investment transactions — Investment transactions are accounted for on trade date for financial reporting purposes. Realized gains and losses on investment securities sold are determined on a specific identification basis.
Common expenses— Common expenses of the Trust are allocated among the series of the Trust based on relative net assets of each series or the nature of the services performed and the relative applicability to each series.
Estimates — The preparation of financial statements in conformity with GAAP requires management to make estimates and assumptions that affect the reported amounts of assets and liabilities and the disclosure of contingent assets and liabilities as of the date of the financial statements and the reported amounts of income and expenses during the reporting period. Actual results could differ from those estimates.
Federal income tax — The Fund has qualified and intends to continue to qualify as a regulated investment company under the Internal Revenue Code of 1986, as amended (the “Code”). Qualification generally will relieve the Fund of liability for federal income taxes to the extent 100% of its net investment income and net realized capital gains are distributed in accordance with the Code.
In order to avoid imposition of the excise tax applicable to regulated investment companies, it is also the Fund’s intention to declare as dividends in each calendar year at least 98% of its net investment income (earned during the calendar year) and 98.2% of its net realized capital gains (earned during the twelve months ended October 31) plus undistributed amounts from prior years.
The tax character of accumulated earnings at September 30, 2019 was as follows:
Tax cost of portfolio investments | | $ | 21,541,383 | |
Gross unrealized appreciation | | $ | 15,810,468 | |
Gross unrealized depreciation | | | (228,827 | ) |
Net unrealized appreciation | | | 15,581,641 | |
Accumulated ordinary income | | | 3,945 | |
Other gains | | | 1,271,875 | |
Distributions payable | | | (6,647 | ) |
Accumulated earnings | | $ | 16,850,814 | |
The difference between the federal income tax cost of portfolio investments and the financial statement cost of portfolio investments for the Fund is due to certain timing differences in the recognition of capital gains or losses under income tax regulations and GAAP. These “book/tax” differences are temporary in nature and are primarily due to the tax deferral of losses on wash sales.
13
THE JAMESTOWN EQUITY FUND
NOTES TO FINANCIAL STATEMENTS (Continued)
The Fund recognizes the tax benefits or expenses of uncertain tax positions only when the position is “more likely than not” to be sustained assuming examination by tax authorities. Management has reviewed the tax positions taken on Federal income tax returns for the current and all open tax years (generally, three years) of the Fund and has concluded that no provision for unrecognized tax benefits or expenses is required in these financial statements.
3. Investment Transactions
Investment transactions, other than short-term investments and U.S. government securities, were as follows for the six months ended September 30, 2019:
Purchase of investment securities | | $ | 1,550,227 | |
Proceeds from sales of investment securities | | $ | 4,430,803 | |
4. Transactions with Related Parties
INVESTMENT ADVISORY AGREEMENTS
The Fund’s investments are managed by Lowe, Brockenbrough & Company, Inc. (the “Adviser”) under the terms of an Investment Advisory Agreement. The Fund pays the Adviser a fee, which is computed and accrued daily and paid monthly, at annual rates of 0.65% of its average daily net assets up to $500 million and 0.55% of such assets in excess of $500 million. Certain officers of the Trust are also officers of the Adviser.
During the six months ended September 30, 2019, the Adviser voluntarily limited the total annual operating expenses of the Fund to 0.95% of average daily net assets; accordingly, the Adviser voluntarily waived $21,372 of its investment advisory fees during the six months ended September 30, 2019. This amount is not subject to recapture in future periods.
OTHER SERVICE PROVIDERS
Ultimus Fund Solutions, LLC (“Ultimus”) provides administration, fund accounting, compliance and transfer agent services to the Fund. The Fund pays Ultimus fees in accordance with the agreements for such services. Certain officers of the Trust are also officers of Ultimus, or of Ultimus Fund Distributors, LLC (the “Distributor”), the principal underwriter of the Fund and an affiliate of Ultimus. The Distributor is compensated by the Adviser (not the Fund) for acting as principal underwriter.
COMPENSATION OF TRUSTEES
Trustees and officers affiliated with the Adviser or Ultimus are not compensated by the Trust for their services. Each Trustee who is not an affiliated person of the Adviser or Ultimus receives from the Trust an annual retainer of $20,000, payable quarterly; a fee of $2,000 for attendance at each meeting of the Board of Trustees (except that such fee is $3,000 for the independent chair); and a fee of $1,000 for attendance at each meeting of any committee of the Board (except that such fee is $1,500 for the committee chair); plus reimbursement of travel and other expenses incurred in attending meetings. Each series of the Trust pays its proportionate share of such fees.
14
THE JAMESTOWN EQUITY FUND
NOTES TO FINANCIAL STATEMENTS (Continued)
5. Brokerage Arrangement
In order to reduce the total operating expenses of the Fund, a portion of the Fund’s operating expenses have been paid through an arrangement with a third-party broker-dealer who is compensated through commission trades. Payment of expenses by the broker-dealer is based on a percentage of commissions earned. Expenses reimbursed through the brokerage arrangement totaled $3,000 for the six months ended September 30, 2019.
6. Contingencies and Commitments
The Fund indemnifies the Trust’s officers and Trustees for certain liabilities that might arise from the performance of their duties to the Fund. Additionally, in the normal course of business the Fund enters into contracts that contain a variety of representations and warranties and which provide general indemnifications. The Fund’s maximum exposure under these arrangements is unknown, as this would involve future claims that may be made against the Fund that have not yet occurred. However, based on experience, the Trust expects the risk of loss to be remote.
7. Subsequent Events
The Fund is required to recognize in the financial statements the effects of all subsequent events that provide additional evidence about conditions that existed as of the date of the Statement of Assets and Liabilities. For non-recognized subsequent events that must be disclosed to keep the financial statements from being misleading, the Fund is required to disclose the nature of the event as well as an estimate of its financial effect, or a statement that such an estimate cannot be made. Management has evaluated subsequent events through the issuance of these financial statements and has noted no such events.
15
THE JAMESTOWN EQUITY FUND
ABOUT YOUR FUND’S EXPENSES (Unaudited)
We believe it is important for you to understand the impact of costs on your investment. All mutual funds have operating expenses. As a shareholder of the Fund, you incur ongoing costs, including management fees and other expenses. The following examples are intended to help you understand your ongoing costs (in dollars) of investing in the Fund and to compare these costs with the ongoing costs of investing in other mutual funds.
A mutual fund’s ongoing costs are expressed as a percentage of its average net assets. This figure is known as the expense ratio. The expenses in the table below are based on an investment of $1,000 made at the beginning of the period shown and held for the entire period (April 1, 2019 through September 30, 2019).
The table below illustrates the Fund’s costs in two ways:
Actual fund return – This section helps you to estimate the actual expenses that you paid over the period. The “Ending Account Value” shown is derived from the Fund’s actual return, and the fourth column shows the dollar amount of operating expenses that would have been paid by an investor who started with $1,000 in the Fund. You may use the information here, together with the amount you invested, to estimate the expenses that you paid over the period.
To do so, simply divide your account value by $1,000 (for example, an $8,600 account value divided by $1,000 = 8.6), then multiply the result by the number given for the Fund under the heading “Expenses Paid During Period.”
Hypothetical 5% return – This section is intended to help you compare the Fund’s ongoing costs with those of other mutual funds. It assumes that the Fund had an annual return of 5% before expenses during the period shown, but that the expense ratio is unchanged. In this case, because the returns used are not the Fund’s actual returns, the results do not apply to your investment. The example is useful in making comparisons because the U.S. Securities and Exchange Commission (the “SEC”) requires all mutual funds to calculate expenses based on a 5% return. You can assess the Fund’s ongoing costs by comparing this hypothetical example with the hypothetical examples that appear in shareholder reports of other funds.
Note that expenses shown in the table are meant to highlight and help you compare ongoing costs only. The Fund does not charge sales loads or redemption fees.
The calculations assume no shares were bought or sold during the period. Your actual costs may have been higher or lower, depending on the amount of your investment and the timing of any purchases or redemptions.
More information about the Fund’s expenses, including annual expense ratios for the prior five fiscal years, can be found in this report. For additional information on operating expenses and other shareholder costs, please refer to the Fund’s prospectus.
16
THE JAMESTOWN EQUITY FUND
ABOUT YOUR FUND’S EXPENSES (Unaudited) (Continued)
| | Beginning
Account Value
April 1, 2019 | Ending
Account Value
September 30,
2019 | Net
Expense
Ratio(a) | Expenses
Paid During
Period(b) |
Based on Actual Fund Return | $1,000.00 | $1,059.60 | 0.95% | $4.90 |
Based on Hypothetical 5% Return (before expenses) | $1,000.00 | $1,020.31 | 0.95% | $4.81 |
(a) | Annualized, based on the Fund’s most recent one-half year expenses. |
(b) | Expenses are equal to the Fund’s annualized net expense ratio multiplied by the average account value over the period, muliplied by 183/365 (to reflect the one-half year period). |
OTHER INFORMATION (Unaudited)
A description of the policies and procedures that the Fund uses to vote proxies relating to portfolio securities is available without charge upon request by calling toll-free 1-866-738-1126, or on the SEC’s website at www.sec.gov. Information regarding how the Fund voted proxies relating to portfolio securities during the most recent 12-month period ended June 30 is also available without charge upon request by calling toll-free 1-866-738-1126, or on the SEC’s website at www.sec.gov.
The Trust files a complete listing of portfolio holdings of the Fund with the SEC as of the end of the first and third quarters of each fiscal year on Form N-Q. The filings are available upon request, by calling 1-866-738-1126. Furthermore, you may obtain a copy of these filings on the SEC’s website at www.sec.gov.
17
THE JAMESTOWN EQUITY FUND
www.jamestownfunds.com
Investment Adviser
Lowe, Brockenbrough & Company, Inc.
1802 Bayberry Court
Suite 400
Richmond, Virginia 23226
Administrator
Ultimus Fund Solutions, LLC
P.O. Box 46707
Cincinnati, Ohio 45246-0707
(Toll-Free) 1-866-738-1126
Independent Registered
Public Accounting Firm
Cohen & Company, Ltd.
1350 Euclid Avenue
Suite 800
Cleveland, Ohio 44115
Legal Counsel
Sullivan & Worcester LLP
1666 K Street, N.W.
Washington, DC 20006
Board of Trustees
John P. Ackerly, IV
John T. Bruce
George K. Jennison
Robert S. Harris, Ph.D.
Harris V. Morrissette
Elizabeth W. Robertson
Not required
| Item 3. | Audit Committee Financial Expert. |
Not required
| Item 4. | Principal Accountant Fees and Services. |
Not required
| Item 5. | Audit Committee of Listed Registrants. |
Not applicable
| Item 6. | Schedule of Investments. |
| (a) | Schedule filed with Item 1 |
| Item 7. | Disclosure of Proxy Voting Policies and Procedures for Closed-End Management Investment Companies. |
Not applicable
| Item 8. | Portfolio Managers of Closed-End Management Investment Companies. |
Not applicable
| Item 9. | Purchases of Equity Securities by Closed-End Management Investment Company and Affiliated Purchasers. |
Not applicable
| Item 10. | Submission of Matters to a Vote of Security Holders. |
The registrant’s Governance, Nominating, Compensation and QLCC Committee shall review shareholder recommendations to fill vacancies on the registrant’s board of trustees if such recommendations are submitted in writing, addressed to the Committee at the registrant’s offices and meet any minimum qualifications adopted by the Committee. The Committee may adopt, by resolution, a policy regarding its procedures for considering candidates for the board of trustees, including any recommended by shareholders.
| Item 11. | Controls and Procedures. |
(a) Based on their evaluation of the registrant’s disclosure controls and procedures (as defined in Rule 30a-3(c) under the Investment Company Act of 1940) as of a date within 90 days of the filing date of this report, the registrant’s principal executive officers and principal financial officer have concluded that such disclosure controls and procedures are reasonably designed and are operating effectively to ensure that material information relating to the registrant, including its consolidated subsidiaries, is made known to them by others within those entities, particularly during the period in which this report is being prepared, and that the information required in filings on Form N-CSR is recorded, processed, summarized, and reported on a timely basis.
(b) There were no changes in the registrant’s internal control over financial reporting (as defined in Rule 30a-3(d) under the Investment Company Act of 1940) that occurred during the second fiscal quarter of the period covered by this report that have materially affected, or are reasonably likely to materially affect, the registrant’s internal control over financial reporting.
| Item 12. | Disclosure of Securities Lending Activities for Closed-End Management Investment Companies. |
Not applicable
File the exhibits listed below as part of this Form. Letter or number the exhibits in the sequence indicated.
(a)(1) Any code of ethics, or amendment thereto, that is the subject of the disclosure required by Item 2, to the extent that the registrant intends to satisfy the Item 2 requirements through filing of an exhibit: Not required
(a)(2) A separate certification for each principal executive officer and principal financial officer of the registrant as required by Rule 30a-2(a) under the Act (17 CFR 270.30a-2(a)): Attached hereto
(a)(3) Any written solicitation to purchase securities under Rule 23c-1 under the Act (17 CFR 270.23c-1) sent or given during the period covered by the report by or on behalf of the registrant to 10 or more persons: Not applicable
(a)(4) Change in the registrant’s independent public accountants: Not applicable
(b) Certifications required by Rule 30a-2(b) under the Act (17 CFR 270.30a-2(b)): Attached hereto
| Exhibit 99.CERT | Certifications required by Rule 30a-2(a) under the Act |
| | |
| Exhibit 99.906CERT | Certifications required by Rule 30a-2(b) under the Act |
SIGNATURES
Pursuant to the requirements of the Securities Exchange Act of 1934 and the Investment Company Act of 1940, the registrant has duly caused this report to be signed on its behalf by the undersigned, thereunto duly authorized.
| (Registrant) | Williamsburg Investment Trust | |
| | | | |
| By (Signature and Title)* | /s/ David James | |
| | | David James, Secretary | |
| | | | |
| Date | November 26, 2019 | | |
| | | | |
| Pursuant to the requirements of the Securities Exchange Act of 1934 and the Investment Company Act of 1940, this report has been signed below by the following persons on behalf of the registrant and in the capacities and on the dates indicated. |
| | | | |
| By (Signature and Title)* | /s/ John T. Bruce | |
| | | John T. Bruce, President | |
| | | (FBP Equity & Dividend Plus Fund and FBP Appreciation & Income Opportunities Fund) | |
| | | | |
| Date | November 26, 2019 | | |
| | | | |
| By (Signature and Title)* | /s/ Thomas W. Leavell | |
| | | Thomas W. Leavell, President | |
| | | (The Government Street Equity Fund and The Government Street Mid-Cap Fund) | |
| | | | |
| Date | November 26, 2019 | | |
| | | | |
| By (Signature and Title)* | /s/ Charles M. Caravati III | |
| | | Charles M. Caravati III, President | |
| | | (The Jamestown Equity Fund) | |
| | | | |
| Date | November 26, 2019 | | |
| | | | |
| By (Signature and Title)* | /s/ John P. Ackerly IV | |
| | | John P. Ackerly IV, President | |
| | | (The Davenport Core Fund, Davenport Value & Income Fund, Davenport Equity Opportunities Fund, Davenport Small Cap Focus Fund and the Davenport Balanced Income Fund) | |
| | | | |
| Date | November 26, 2019 | | |
| | | | |
| By (Signature and Title)* | /s/ Mark J. Seger | |
| | | Mark J. Seger, Treasurer and Principal Financial Officer | |
| | | | |
| Date | November 26, 2019 | | |
* Print the name and title of each signing officer under his or her signature.