| OMB APPROVAL |
OMB Number: 3235-0570 Expires: August 31, 2020 Estimated average burden hours per response: 20.6 |
UNITED STATES
SECURITIES AND EXCHANGE COMMISSION
Washington, D.C. 20549
FORM N-CSR
CERTIFIED SHAREHOLDER REPORT OF REGISTERED
MANAGEMENT INVESTMENT COMPANIES
| Investment Company Act file number | 811-05685 | |
| Williamsburg Investment Trust |
| (Exact name of registrant as specified in charter) |
| 225 Pictoria Drive, Suite 450 Cincinnati, Ohio | 45246 |
| (Address of principal executive offices) | (Zip code) |
John Chilton, Esq.
| Sullivan & Worcester LLP 1666 K Street, NW Washington, D.C. 20006 |
| (Name and address of agent for service) |
| Registrant's telephone number, including area code: | (513) 587-3400 | |
| Date of fiscal year end: | March 31 | |
| | | |
| Date of reporting period: | September 30, 2017 | |
Form N-CSR is to be used by management investment companies to file reports with the Commission not later than 10 days after the transmission to stockholders of any report that is required to be transmitted to stockholders under Rule 30e-1 under the Investment Company Act of 1940 (17 CFR 270.30e-1). The Commission may use the information provided on Form N-CSR in its regulatory, disclosure review, inspection, and policymaking roles.
A registrant is required to disclose the information specified by Form N-CSR, and the Commission will make this information public. A registrant is not required to respond to the collection of information contained in Form N-CSR unless the Form displays a currently valid Office of Management and Budget ("OMB") control number. Please direct comments concerning the accuracy of the information collection burden estimate and any suggestions for reducing the burden to the Secretary, Securities and Exchange Commission, 450 Fifth Street, NW, Washington, DC 20549-0609. The OMB has reviewed this collection of information under the clearance requirements of 44 U.S.C. § 3507.
Item 1. Reports to Stockholders.
SEMI-ANNUAL REPORT September 30, 2017
(Unaudited) |
THE DAVENPORT FUNDS
LETTER TO SHAREHOLDERS | November 15, 2017 |
The market posted another quarter of solid gains in Q3, with the S&P 500 Index up 4.48% and the Russell 2000® Index advancing 5.67%. Year to date returns are an impressive 14.24% and 10.94%, respectively. The Dow Jones Industrial Average finished the quarter with eight consecutive quarters of gains, its longest positive streak in twenty years. The market continues to shrug off fears, which have recently included rising tensions with North Korea, two powerful hurricanes, and continued gridlock in Washington, DC.
The key driver behind the market’s advance has been impressive earnings growth, which has emerged from negative territory as recently as mid-2016 to around 10% year-over-year currently. Broadly, this is due to several factors, including modest top-line growth, efficiency gains on the expense side, and shareholder-friendly capital allocation in the form of stock buybacks. Adding to this backdrop is a weaker U.S. dollar, benefiting multi-nationals, and the energy and financials sectors coming off easy comparisons from a year ago.
The “goldilocks” environment—where economic expansion is neither too strong nor too weak—remains in place for equities. The economy continues to grow slowly, keeping inflation contained. Gross domestic product (GDP) is just strong enough to allow the Federal Reserve to tighten monetary policy in a measured way, without disrupting expectations of continued economic improvement. However, in recent months, we have seen the “reflation” trade re-emerge with improvement in economic data.
In a reflation scenario, economic growth heats up, stoking inflation and wage gains and disproportionately benefiting “old economy” sectors. While we are seeing the green shoots of reflation, it has yet to take hold more broadly. Building materials is an area that could benefit from this scenario, especially with the increase in renovations and housing formations that were delayed in the wake of the Great Recession. We have continued to invest in this industry.
Growth stocks have thrived under the current goldilocks environment, as investors have been willing to pay increasing premiums for the handful of companies that can post strong top-line growth in spite of the tepid broader economy. If reflation were to take hold, it would likely provide a shot in the arm to value stocks, which investors have shunned due to their uninspiring relative growth rates. While we have a balanced mix of growth and value across our funds, we remain quite valuation-sensitive and thus may stand to benefit from a reflation scenario.
The market is increasingly paying attention to the machinations in Washington regarding a tax package. The current administration’s efficacy has been weak, evidenced by the failure on healthcare reform, but the pressure to succeed has ratcheted up as we are now just a year out from mid-term elections. While stocks appear to have priced in a small amount of success on tax cuts towards the end of the quarter, Washington remains a wild card for the market.
Volatility remains extremely low. The market appears a bit complacent, and we do not want to be lulled into a false sense of security. While the market has posted strong returns so far this year, we remain cautiously optimistic going into year end, which is a historically favorable period for equity returns. While valuations remain slightly above their long-term averages, they do not strike us as unreasonable in the current low interest rate world.
1
Please see our fund letters for discussion of specific ideas and investment themes. Thank you for your trust.
Davenport Core Fund (DAVPX)
The Core Fund posted another strong gain this quarter, advancing 3.25%, versus the S&P 500 Index’s 4.48% advance. Year to date, the Core Fund is up 14.27%, in line with the S&P 500’s 14.24% gain. We remain pleased with the Fund’s ability to keep up with the broader index in such a strong market this year.
The bulk of our underperformance this quarter was due to declines in the shares of AmerisourceBergen (ABC) and Allergan (AGN) in Health Care, Southwest Airlines (LUV) in Industrials, and Martin Marietta (MLM) in Materials. Uncertainties around drug pricing and competition continue to weigh on Health Care names ABC and AGN. Southwest sold off fears of capacity creep, but profitability remains impressive. We added to our position in MLM, as shares had sold off due to weather, a seasonal lull in the business, and concerns around Washington’s ability to pass an infrastructure plan. We took the opportunity to increase the position as the underlying fundamentals of the construction industry remain positive and we continue to have confidence in the long-term opportunity for MLM to double its cash flow by 2020.
Continuing on a theme from last quarter’s sale of JM Smucker (SJM) in Consumer Staples, this quarter we sold Hormel (HRL). While we continue to have respect for the long-term track record of the company, management is having a tough time fixing the ailing turkey segment, and industry pressures appear to be intensifying. U.S. consumers are increasingly favoring fresher offerings such as those found around the edges of grocery stores, at the expense of packaged food companies like HRL whose products often sit in the middle aisles. This dynamic along with intense grocer competition is placing significant pricing pressure on branded package foods, who are discounting in an effort to maintain share. Ultimately, these trends are feeding down to slower profit growth, prompting us to search for a better opportunity elsewhere.
To that end, we purchased a new position in Sherwin Williams (SHW). Founded in 1866 and boasting an impressive track record, Sherwin is a vertically-integrated coatings company. Sherwin’s largest segment is also its most attractive: selling paint primarily to professional painting contractors, which have been taking share from “DIYers” for decades. Paint typically accounts for just 10% of a contractor’s operating costs, with the remainder devoted to labor. This cost imbalance incentivizes contractors to invest in high quality paint to cut down on labor (e.g. less coats applied, shorter curing times, etc.), and gives SHW tremendous pricing power with its dominant market share. Layering on the cost-cutting opportunities from the recent acquisition of Valspar, we believe we may see earnings power increases of up to $20 per share by the end of the decade. Since our purchase, SHW has updated its long-term financial targets at an analyst day, further bolstering our confidence in the name.
As mentioned above, we are pleased with the Fund’s ability to keep up in such a strong market, despite being significantly underweight in the hot Information Technology sector. Our actions in the quarter were designed to further improve the risk-reward of the Fund as we head into the final quarter of the year, and we remain excited about finding new investment opportunities such as SHW.
2
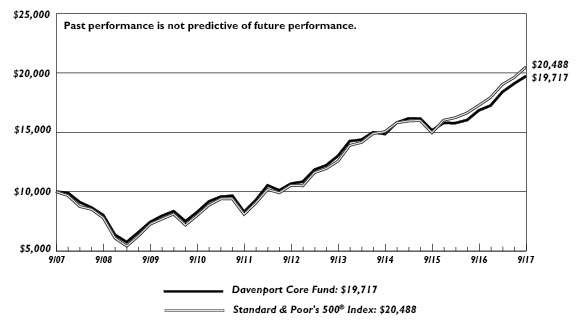
The following chart represents Davenport Core Fund (DAVPX) performance and the performance of the S&P 500 Index, the Core Fund’s primary benchmark, for the periods ended September 30, 2017.
| | Q3 2017 | YTD 2017 | 1 Year | 3 Years* | 5 Years* | 10 Years* | Since Inception* 1/15/98 |
| Core Fund (DAVPX) | 3.25% | 14.27% | 17.04% | 9.90% | 13.04% | 7.02% | 6.78% |
| S&P 500 Index** | 4.48% | 14.24% | 18.61% | 10.81% | 14.22% | 7.44% | 7.07% |
30-Day SEC Yield: 0.35%; Expense Ratio in current prospectus: 0.90%
Past performance is no guarantee of future results. Investment return and principal value of an investment will fluctuate so that an investor’s shares, when redeemed, may be worth more or less than their original cost. Current performance may be lower or higher than the performance data quoted. Performance data, current to the most recent month end, may be obtained by calling 1-800-281-3217.
| * | Returns greater than one year are annualized. |
| ** | The S&P 500 Index is comprised of 500 U.S. stocks and is an indicator of the performance of the overall U.S. stock market. An investor cannot invest in an index and its returns are not indicative of the performance of any specific investment. |
Recent Purchases
Chevron Corporation (CVX)—Given the deterioration in investor sentiment, combined with a modestly improving fundamental outlook for oil, we felt that it was a decent time to add exposure to the Energy sector.
Martin Marietta Materials, Inc. (MLM)—We added to our position in MLM, as we think the underlying fundamentals of the construction industry remain positive and we continue to have confidence in the long-term opportunity for the company.
Sherwin-Williams Company (SHW)—We elected to initiate a position in SHW, the largest coatings company in the U.S. and one of the top three globally.
Recent Sales
Applied Materials, Inc. (AMAT)—While we continue to view AMAT as an enabler and beneficiary of a more connected world, we felt it prudent to take some profits while also dialing back our technology exposure after significant fund flow momentum.
Hormel Foods Corporation (HRL)—We remain concerned about shifting consumer preferences away from the “center aisle” as well as the likelihood that food deflation will creep its way up the supply chain. Additionally, we had a short-term loss in HRL, which should offset some gains taken earlier in the year.
Davenport Value & Income Fund (DVIPX)
The Value & Income Fund had a solid third quarter with a 4.28% gain, and is now up 10.92% year to date (YTD). This compares favorably to the Russell 1000® Value Index, which was up 3.12% in Q3 and 7.92% YTD, and the Lipper Equity Income Index, which was up 3.82% and 10.35% respectively. The S&P 500 Index was up 4.48% in Q3 and 14.24% YTD.
3
Boeing (BA) was our top-performing stock, increasing nearly 30% in the quarter. Investors have become believers in the cash flow generation story, near-term trends in the business have improved and estimates have moved higher. While we continue to like the outlook for Boeing, we thought it prudent to book some profits on the recent spike and chipped our position. Health Care was our biggest contributing sector, led by a strong move in Bristol-Myers Squibb (BMY). We also saw positive contributions from the Consumer Discretionary and Energy sectors.
The key detractor in the quarter was Altria (MO). Altria was hit by an announcement from the Federal Drug Administration, which is reviewing tobacco and nicotine regulations. The uncertainty caused by this announcement led the entire sector to sell off. Altria has been through this heightened scrutiny many times before, and note the company has been adept at navigating changes in the past. With a 4.2% dividend yield, we feel comfortable with our position in the name.
Our Real Estate Investment Trust (REIT) holdings were also a detractor in the quarter, including shares of Lamar Advertising (LAMR). We took advantage of the weakness to add to our position. Lamar is the leader in outdoor advertising (billboards), and we are attracted to the company’s earnings visibility, solid (and growing) dividend, and well-located assets. Additionally, we think the increasing digitalization of billboards will be a secular tailwind for LAMR. The stock currently yields 4.6% and trades at a discount to other REITs.
We initiated a new position in TE Connectivity (TEL), a global leader in the design and manufacturing of connector and sensor solutions serving a variety of end markets. With more than 500,000 SKUs, TE’s products are highly engineered and mission critical. Key end markets include automotive, industrial equipment, aerospace and defense, data, and devices. TE has undergone significant portfolio transformation over the past five years, focusing on products designed for “harsh environments” (extreme temperatures, pressures, etc.) which are more specialized and garner higher margins.
We see three primary long-term secular growth drivers for TE. The first is in autos where cars are becoming safer, greener, and more connected. Hybrid/electrical cars have more than 1.5x the connector content of a normal vehicle. In total, TE is growing its automotive content 4% - 6% per year. The second is factory automation, where smart factories are leading to ~3% content growth per year. Lastly is the increase in connected devices, whether cars, the “Internet of Things,” smart appliances, aircraft, etc. TE estimates that these devices will grow from 8 billion today to 20 billion in 2020. In total, we believe these factors may help TE grow its earnings and dividend on an annual basis. To fund the purchase of TE, we decided to sell our position in Time Warner (TWX), which is being acquired by AT&T (T).
We remain pleased with the Value & Income Fund’s results, especially in a year where, market-wide, growth stocks have dramatically outperformed value stocks. We continue to strive to find attractive ideas at reasonable prices with above-average dividend yields.
4
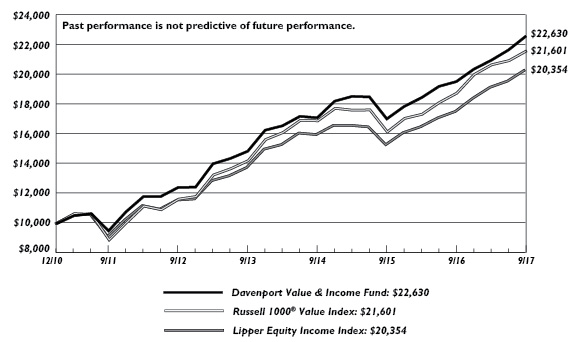
The following chart represents Davenport Value & Income Fund (DVIPX) performance and the performance of the Russell 1000® Value Index, the Fund’s primary benchmark, and the S&P 500 and Lipper Equity Income Indices for the periods ended September 30, 2017.
| | Q3 2017 | YTD 2017 | 1 Year | 3 Years* | 5 Years* | Since Inception* 12/31/10 |
| Value & Income Fund (DVIPX) | 4.28% | 10.92% | 15.64% | 9.72% | 12.71% | 12.87% |
Russell 1000® Value Index** | 3.12% | 7.92% | 15.12% | 8.53% | 13.20% | 12.09% |
| S&P 500 Index** | 4.48% | 14.24% | 18.61% | 10.81% | 14.22% | 13.22% |
| Lipper Equity Income Index** | 3.82% | 10.35% | 15.90% | 8.34% | 11.91% | 11.10% |
30-Day SEC Yield: 1.73%; Expense Ratio in current prospectus: 0.89%
Past performance is no guarantee of future results. Investment return and principal value of an investment will fluctuate so that an investor’s shares, when redeemed, may be worth more or less than their original cost. Current performance may be lower or higher than the performance data quoted. Performance data, current to the most recent month end, may be obtained by calling 1-800-281-3217.
| * | Returns greater than one year are annualized. |
| ** | The Russell 1000® Value Index measures the performance of the Russell 1000 companies with lower price-to-book ratios and lower forecasted growth values. Frank Russell Company is the source and owner of the trademarks, service marks, and copyrights related to the Russell Indexes. Russell® is a trademark of Frank Russell Company. The S&P 500 Index is comprised of 500 U.S. stocks and is an indicator of the performance of the overall U.S. stock market. The Lipper Equity Income Index is an unmanaged index of the 30 largest funds in the Lipper Equity Income fund category. An investor cannot invest in an index and its returns are not indicative of the performance of any specific investment. |
Recent Purchases
iShares MSCI Europe Financials ETF (EUFN)—European financial returns have been weak due to low (and negative) interest rates, a relatively weak economy, and onerous regulations; however, the European economy appears to be strengthening and yields are beginning to rise. As the European economy improves and rates rise, banks should be major beneficiaries.
Lamar Advertising Company (LAMR)—As shares of LAMR pulled back slightly since our chip in February, we decided to increase our position in this high-quality name. We are attracted to the company’s earnings visibility, solid (and growing) dividend, and well-located assets.
TE Connectivity Ltd. (TEL)—We initiated a position in this $28 billion global leader in the design and manufacturing of connector and sensor solutions. The company dates back 75 years and spun off from Tyco in 2007.
Recent Sales
Boeing Company (BA)—Management continues to expect gradual improvement in operating margins through the decade and backlog continues to grow (despite investor fears of a peaking cycle). We continue to like BA, but we thought it prudent to book some profits in light of the recent spike.
5
Time Warner, Inc. (TWX)—As a reminder, we sold AT&T (T) last October on news of the TWX acquisition, as we were skeptical of the strategic benefits. With the company looking more fully valued at this time and speculation the deal could be in jeopardy, we decided to move on and redeploy the proceeds into opportunities exhibiting a better risk reward profile.
Davenport Equity Opportunities Fund (DEOPX)
The Equity Opportunities Fund posted solid third quarter results. The Fund gained 7.33% as compared to a 3.47% gain for the Russell Midcap® Index. This brought our year to date gain to 16.51%, nicely ahead of the Russell Midcap at 11.74% as well as the S&P 500 Index at 14.24%. We started the year thinking a number of our holdings looked timely. It took some patience, but recent results indicate this was indeed the case.
Consumer stocks have been particularly friendly to us of late. During the quarter, Live Nation Entertainment (LYV), CarMax (KMX) and Dollar Tree (DLTR) were our top contributors. LYV has been a steady performer as concert attendance has reached new records and the company’s advertising and ticketing businesses have grown. KMX and DLTR, on the other hand, have faced a healthy dose of investor skepticism for much of the year. In both cases, it has paid to exercise patience. KMX doubters were fixated on deteriorating loan performance and new competition. The company’s recent strong results, which indicate healthy same-store sales growth and credit metrics, have disproved these fears. DLTR shares had been pressured by sluggish results at acquired Family Dollar stores and the heightened threat of Amazon (AMZN). More recently, flagship Dollar Tree locations have turned in better than expected results and Family Dollar is showing some signs of improvement. As far as Amazon goes, we recognize its impact on Main Street retail; however, we believe this threat has been vastly overstated.
This leads us to a new position: auto parts retailer O’Reilly Automotive (ORLY). We know this company well and have enjoyed past success with it, driven by robust same-store sales growth (a function of both market share gains and the rising age of cars on the road), significant profit margin expansion, and stock buy-backs. This year, the stock has pulled back sharply as the company lowered near-term growth expectations due to cyclical headwinds (mainly mild winter weather and more difficult comparisons) and investors fixated on the potential threat of Amazon aggressively entering auto parts retail. Even after recovering somewhat, the stock’s valuation stands at 16x next year’s earnings estimate versus 25x just 12 months ago. We think the shares adequately reflect prevailing risks and view this as an attractive price for a best-in-class operator. We look for growth to re-accelerate next year. There has been scant evidence of AMZN taking meaningful share from the incumbents and the top selling auto items on Amazon have very little overlap with ORLY. Furthermore, car parts require immediate availability and many parts require professional assistance. We suppose Amazon could buy its way into the industry with a splashy acquisition, but that’s a risk we’ll accept at ORLY’s current valuation.
Our worst performers for the quarter were Martin Marietta Materials (MLM) and DISH Network (DISH). Shares of construction aggregates producer MLM declined following weather-plagued Q2 results and less optimism surrounding Washington’s ability to pass infrastructure legislation. In our view, weather problems only defer shipments and the construction cycle remains in the early innings. We remain attracted to the aggregates industry given tremendous barriers to entry and consistent pricing power. Therefore, we have added to our position on recent weakness.
6
DISH has been a controversial story. We are still attracted to the company’s giant trove of wireless spectrum. Demand for finite spectrum continues to rise alongside increasing wireless data and video consumption. However, DISH’s plan for the spectrum remains unclear. This uncertainty has flummoxed investors and weighed on the stock. We believe the spectrum’s value will continue to rise (perhaps substantially) and trust the company will make the right decision to maximize shareholder returns. We recently added to our position on weakness.
All told, we are pleased with recent results, especially when considering our relatively light exposure to “hot” areas such as technology. While we’ve enjoyed strong performance this year, we continue to think many of our holdings are timely and may possess attractive upside. This is particularly true for the names above that we’ve added to recently. While they may face headwinds or uncertainty in the near-term, they are run by shrewd capital allocators who have compounded investor wealth at above-average rates for many years.
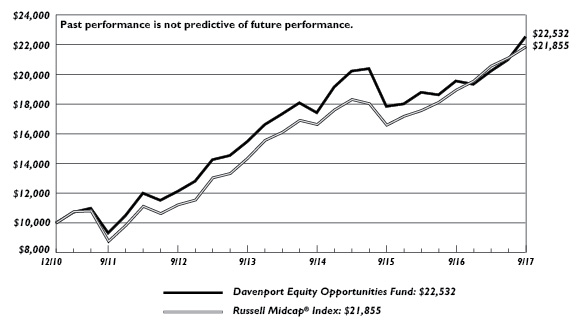
The following chart represents Davenport Equity Opportunities Fund (DEOPX) performance and the performance of the Russell Midcap® Index, the Fund’s primary benchmark, and the S&P 500 Index for the periods ended September 30, 2017.
| | Q3 2017 | YTD 2017 | 1 Year | 3 Years* | 5 Years* | Since Inception* 12/31/10 |
| Equity Opportunities Fund (DEOPX) | 7.33% | 16.51% | 15.20% | 8.94% | 13.19% | 12.79% |
Russell Midcap® Index** | 3.47% | 11.74% | 15.32% | 9.54% | 14.26% | 12.28% |
| S&P 500 Index** | 4.48% | 14.24% | 18.61% | 10.81% | 14.22% | 13.22% |
Expense Ratio in current prospectus: 0.92%
Past performance is no guarantee of future results. Investment return and principal value of an investment will fluctuate so that an investor’s shares, when redeemed, may be worth more or less than their original cost. Current performance may be lower or higher than the performance data quoted. Performance data, current to the most recent month end, may be obtained by calling 1-800-281-3217.
| * | Returns greater than one year are annualized. |
| ** | The Russell Midcap® Index measures the performance of the 800 smallest companies in the Russell 1000, which represent approximately 25% of the total market capitalization of the Russell 1000®. Frank Russell Company is the source and owner of the trademarks, service marks, and copyrights related to the Russell Indexes. Russell® is a trademark of Frank Russell Company. The S&P 500 Index is comprised of 500 U.S. stocks and is an indicator of the performance of the overall U.S. stock market. An investor cannot invest in an index and its returns are not indicative of the performance of any specific investment. |
Recent Purchases
DISH Network Corporation (DISH)—We continue to be focused on the value of the company’s vast spectrum of holdings. All indicators (rising wireless data usage, mobile video, Verizon (VZ) running short on spectrum in some markets, new iPhone features etc.) point to spectrum rising in value.
Martin Marietta Materials, Inc. (MLM)—While weather can have a near-term impact on quarterly results, we think the underlying fundamentals of the construction industry remain positive, and any movement on a federal infrastructure bill would be icing on the cake.
7
O’Reilly Automotive, Inc. (ORLY)—We believe the key issues behind the recent stock-price decline are company specific. Moreover, ORLY has already reported earnings for the same period and issued guidance contrary to what this report suggests.
TripAdvisor, Inc. (TRIP)—If the company shows progress on its goal of becoming the best one-stop shop to both research travel and book everything from hotels to attractions, the upside could be very meaningful.
Recent Sales
Church and Dwight Company, Inc. (CHD)—CHD has been a big stock over time and is one of the more innovative companies in the consumer products arena; however, we think we may see pricing pressure as competition intensifies and Wal-Mart, Amazon, etc. put pressure on packaged goods providers.
Live Nation Entertainment, Inc. (LYV)—Despite our confidence in the company’s long-term growth opportunity, barriers to entry and recent acceleration in revenue and profitability, we recently reduced the position to make room for a new idea.
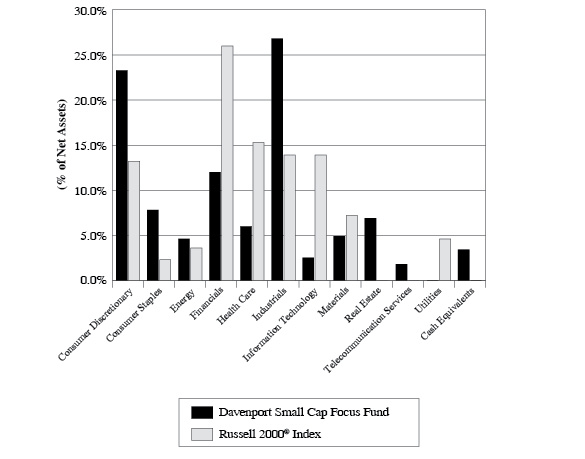
Davenport Small Cap Focus Fund (DSCPX)
The Davenport Small Cap Focus Fund advanced 6.27% during the third quarter, outpacing the 5.67% return for the Russell 2000® Index. On a year to date basis, the Fund is up 13.32%, relative to the 10.94% gain for the Russell 2000 Index.
Following two straight quarters of underperformance relative to large caps, small cap stocks outperformed in Q3 as the reflation trade garnered some momentum and optimism surrounding tax reform benefited the domestically oriented small cap indices. On a year to date basis, the technology sector (led by semiconductors) and health care sector (led by biotechnology) have comprised a meaningful share of market gains. While being underweight in these areas has served as a headwind to more relative performance, we are pleased with the Fund’s ability to outperform in these conditions.
Gaming stocks Monarch Casino (MCRI) and Eldorado Resorts (ERI) were key contributors for the quarter. Each is showing strong growth and exposure in some of the best markets in the country (Reno, NV and Black Hawk, Co). Despite logging gains of 53% and 57%, respectively on a year to date basis, we think there may be more upside for the stocks given improving results and rising takeout potential. Each company has very heavy inside ownership (fitting our owner-operator bias), so we can rest assured management has our best interests at heart. Speaking of owner-operators, leading pet insurance provider Trupanion (TRUP), which we highlighted last quarter, was a key contributor during the period. As a reminder, CEO Darryl Rawlings owns more than 10% of the shares outstanding and is focused on creating value on a per share basis. We remain confident that Trupanion’s unique approach to growth and underwriting may allow the company to garner more than its fair share of a rapidly growing and underpenetrated market.
The return of the aforementioned “reflation” trade gave a lift to building product and materials names such as American Woodmark Holdings (AMWD), Builders FirstSource (BLDR) and recently purchased Summit Materials (SUM). While the devastation caused by hurricanes Harvey and Irma will result in disruption to Q3 results, investors have looked past the near term
8
implications and are emphasizing the demand lift from the necessary rebuilding efforts. This phenomenon has also benefited the trucking sector where holdings in Marten Transport (MRTN) and Knight-Swift Transportation (KNX) have surged to new highs.
We have recently been adding to our position in KNX, as we believe both market dynamics and company specific factors may combine to elevate the earnings power of the franchise well beyond prior peak levels. From an industry perspective, the hurricane rebuilding efforts have added incremental demand to freight markets that were already showing signs of tightness heading into the all-important “peak” holiday season. Furthermore, we believe the electronic logging of driver hours at the beginning of 2018 will serve to tighten capacity further. On top of this, the company just closed on its merger with Swift Transportation (SWFT), which doubles the company’s size and gives Knight’s best in class management team an opportunity to leverage fixed costs on a much larger asset base while also improving legacy Swift’s below-average margin profile.
To close, we are encouraged by the Fund’s recent performance, and we remain committed to finding compelling ideas. Furthermore, we believe the asset class may continue to see momentum as “reflation” remains in vogue. While we are underweight some of the market’s “hottest” areas, we are encouraged by our relative results and remain focused on producing compelling risk-adjusted returns without chasing momentum.
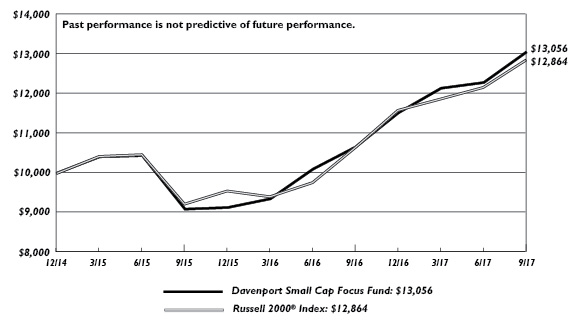
The following chart represents Davenport Small Cap Focus Fund (DSCPX) performance and the performance of the Russell 2000® Index, the Small Cap Focus Fund’s primary benchmark, for the periods ended September 30, 2017.
| | Q3 2017 | YTD 2017 | 1 Year | Since Inception* 12/31/14 |
| Small Cap Focus Fund (DSCPX) | 6.27% | 13.32% | 22.47% | 10.19% |
Russell 2000® Index** | 5.67% | 10.94% | 20.74% | 9.60% |
30-Day SEC Yield: 0.06%; Expense Ratio in current prospectus: 1.06%
Past performance is no guarantee of future results. Investment return and principal value of an investment will fluctuate so that an investor’s shares, when redeemed, may be worth more or less than their original cost. Current performance may be lower or higher than the performance data quoted. Performance data, current to the most recent month end, may be obtained by calling 1-800-281-3217.
| * | Returns greater than one year are annualized. |
| ** | The Russell 2000® Index measures the performance of the 2,000 smallest companies in the Russell 3000 Index, measures the performance of the 3,000 largest U.S. companies based on total market capitalization, which represents approximately 98% of the investable U.S. equity market. Frank Russell Company is the source and owner of the trademarks, service marks, and copyrights related to the Russell Indexes. Russell® is a trademark of Frank Russell Company. An investor cannot invest in an index and its returns are not indicative of the performance of any specific investment. |
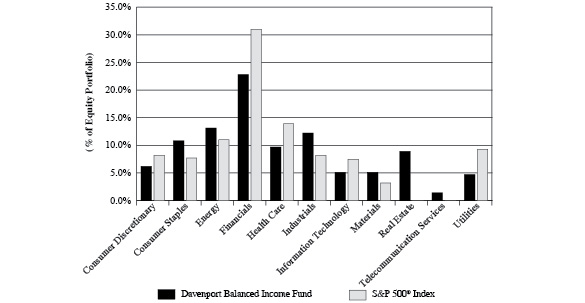
Davenport Balanced Income Fund (DBALX)
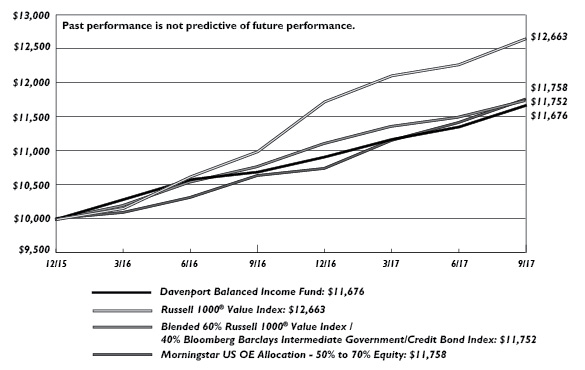
The Davenport Balanced Income Fund gained 2.81% in the quarter, versus a 3.12% increase for the Russell 1000® Value and 3.02% for the Morningstar US OE Allocation 50-70% Equity Index. Year to date, the fund was up 6.97%, compared to the Russell’s 7.92% and the Morningstar US
9
OE’s 9.51%%. The Fund performed well relative to the blended 60% Russell 1000 Value and 40% Bloomberg Barclays Intermediate Government/Credit Index returns of 2.12% and 5.69% for the quarter and year to date, respectively.
The equity portion of the Fund performed well during the quarter with Health Care leading the sector performance, driven by strong returns from Bristol-Myers Squibb (BMY) and Gilead (GILD). Additionally, our largest contribution came from Boeing (BA), which increased 30% during the quarter as near-term business trends have improved and earnings estimates have moved higher. Real estate was our weakest sector, with Lamar Advertising (LAMR) and Tanger Factory Outlet (SKT) the leading detractors. Despite the recent weakness we still favor the sector from a long-term perspective and chose to add to our position in Lamar.
During the quarter, we initiated a position in Blackstone Group (BX), the largest and most diversified of the alternative asset managers, focused in four segments: real estate, credit, private equity, and hedge funds. The company has been a fundraising machine, and recently has begun expanding into two additional segments: infrastructure and long-only Master Limited Partnerships (MLPs). Alternative investments have gained share versus traditional investments, and we believe Blackstone’s product innovation, fund-raising track record, and large global distribution could fuel faster growth in assets under management. The company pays a $2.29 dividend (about a 6.9% yield) based on trailing twelve-month distributions. Furthermore, the firm boasts a strong management team with a large vested interest, giving us additional confidence for the future of the stock. Given the favorable outlook and potential catalysts, we elected to initiate a position on the heels of a recent pullback.
The bond market treaded water during the recent quarter as investors looked for indications of what the next Federal Reserve move might be. Chair Janet Yellen said the Federal Reserve would start reducing their $4.5 trillion in assets in the fall, and anticipates raising rates at their December meeting. She considers the economy to be in good shape and expects the rate of inflation, which remains low, will gradually rise. Her view of a solid economy was reinforced with the last quarter GDP growth at 3.1%, and inflation remains around 1.5%.
Ten-year U.S. Treasury yields, the global benchmark, were unchanged for the quarter, closing at 2.33%. The 3-month Treasury bill yield was 1.1% vs. 1.0%, 2 Year notes were 1.5% vs 1.4%. Rates for the year tell a different story with short term Treasury rates up by 0.6%, 2 Years up 0.3%, and 1 Year lower by 0.1%.
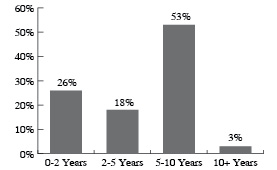
Our bond structure remains defensive, consistent with a conservative bias in what continues to be a low rate environment. The portfolio consists of 41 high quality corporate rate issues spread across 8 economic sectors with the top allocation of Financials at 30.4%, Consumer Staples at 19.4%, and 14.2% to Health Care. A new position in Capital One was initiated during the quarter. The bond portfolio is “A” rated, on average, has an average coupon of 3.2%, an effective maturity of 4.6 years, and a duration of 3.52 years.
We are pleased with our performance this quarter given the continued outperformance of growth strategies, and see value in a balanced approach as we continue through uncertain market conditions. Our allocation to more cyclical equities and defensive positioning in the bond portion of the portfolio may continue providing a volatility buffer in the near future, while focusing on current income and long-term capital appreciation.
10
The following chart represents Davenport Balanced Income Fund (DBALX) performance and performance of the Fund’s primary benchmark, the Russell 1000® Value Index, along with the Morningstar US OE Allocation 50-70% Index and the blended 60% Russell 1000® Value Index / 40% Bloomberg Barclays Intermediate Government /Credit Bond Index for the period ended September 30, 2017.
| | Q3 2017 | YTD 2017 | 1 Year | Since Inception* 12/31/15 |
| Balanced Income Fund (DBALX) | 2.81% | 6.97% | 9.20% | 9.26% |
Russell 1000® Value** | 3.12% | 7.92% | 15.12% | 14.44% |
| Morningstar US OE Allocation 50-70% Equity** | 3.02% | 9.51% | 10.59% | 9.71% |
60% Russell 1000® Value/40% BBIGC | 2.12% | 5.69% | 9.16% | 9.68% |
30-Day SEC Yield: 1.68% Expense Ratio in current prospectus: 1.13%
Past performance is no guarantee of future results. Investment return and principal value of an investment will fluctuate so that an investor’s shares, when redeemed, may be worth more or less than their original cost. Current performance may be lower or higher than the performance data quoted. Performance data, current to the most recent month end, may be obtained by calling 1-800-281-3217.
| * | Returns greater than one year are annualized. |
| ** | The Russell 1000® Value Index measures the performance of the Russell 1000 companies with lower price-to-book ratios and lower forecasted growth values. The Morningstar US OE Allocation 50-70% Equity Index is composed of funds which seek to provide both income and capital appreciation by investing in multiple asset classes, including stocks, bonds, and cash. These portfolios are dominated by domestic holdings and have equity exposure between 50% and 70%. The blended 60% Russell 1000 Value/40% Bloomberg Barclay’s Intermediate Government/Credit (BBIGC) Index is included as an additional comparative index because it is representative of a balanced portfolio consisting of 60% equity and 40% fixed income securities. The BBIGC measures the non-securitized component of the U.S. Aggregate Index. It includes investment grade, U.S. dollar-denominated, fixed-rate Treasuries, government-related and corporate rate securities. Intermediate maturity bonds include bonds with maturities of 1 to 9.999 years. An investor cannot invest in an index and its returns are not indicative of the performance of any specific investment. |
11
DAVENPORT CORE FUND
PERFORMANCE INFORMATION (Unaudited)
Comparison of the Change in Value of a $10,000 Investment in
Davenport Core Fund and the Standard & Poor’s 500® Index
| | Average Annual Total Returns
(for periods ended September 30, 2017) |
| | 1 Year | 5 Years | 10 Years |
Davenport Core Fund(a) | 17.04% | 13.04% | 7.02% |
Standard & Poor’s 500® Index | 18.61% | 14.22% | 7.44% |
(a) | The total returns shown do not reflect the deduction of taxes that a shareholder would pay on Fund distributions or the redemption of Fund shares. |
12
DAVENPORT VALUE & INCOME FUND
PERFORMANCE INFORMATION (Unaudited)
Comparison of the Change in Value of a $10,000 Investment in
Davenport Value & Income Fund, the Russell 1000® Value Index
and the Lipper Equity Income Index
| | Average Annual Total Returns
(for periods ended September 30, 2017) |
| | 1 Year | 5 Years | Since
Inception(b) |
Davenport Value & Income Fund(a) | 15.64% | 12.71% | 12.87% |
Russell 1000® Value Index | 15.12% | 13.20% | 12.09% |
| Lipper Equity Income Index | 15.90% | 11.91% | 11.10% |
(a) | The total returns shown do not reflect the deduction of taxes that a shareholder would pay on Fund distributions or the redemption of Fund shares. |
(b) | Commencement of operations was December 31, 2010. |
13
DAVENPORT EQUITY OPPORTUNITIES FUND
PERFORMANCE INFORMATION (Unaudited)
Comparison of the Change in Value of a $10,000 Investment in
Davenport Equity Opportunities Fund and the Russell Midcap® Index
| | Average Annual Total Returns
(for periods ended September 30, 2017) |
| | 1 Year | 5 Years | Since
Inception(b) |
Davenport Equity Opportunities Fund(a) | 15.20% | 13.19% | 12.79% |
Russell Midcap® Index | 15.32% | 14.26% | 12.28% |
(a) | The total returns shown do not reflect the deduction of taxes that a shareholder would pay on Fund distributions or the redemption of Fund shares. |
(b) | Commencement of operations was December 31, 2010. |
14
DAVENPORT SMALL CAP FOCUS FUND
PERFORMANCE INFORMATION (Unaudited)
Comparison of the Change in Value of a $10,000 Investment in
Davenport Small Cap Focus Fund and the Russell 2000® Index
| | Average Annual Total Returns
(for periods ended September 30, 2017) |
| | 1 Year | Since Inception(b) |
Davenport Small Cap Focus Fund(a) | 22.47% | 10.19% |
Russell 2000® Index | 20.74% | 9.60% |
(a) | The total returns shown do not reflect the deduction of taxes that a shareholder would pay on Fund distributions or the redemption of Fund shares. |
(b) | Commencement of operations was December 31, 2014. |
15
DAVENPORT BALANCED INCOME FUND
PERFORMANCE INFORMATION (Unaudited)
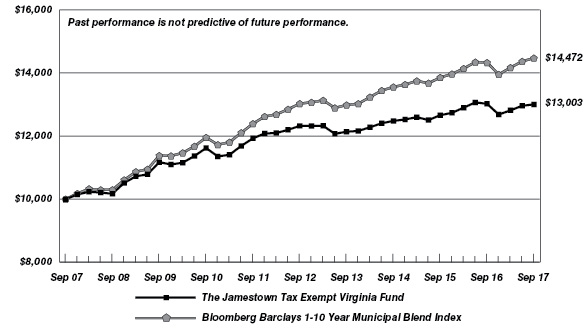
Comparison of the Change in Value of a $10,000 Investment in Davenport Balanced
Income Fund, the Russell 1000® Value Index, a Blended 60% Russell 1000® Value
Index / 40% Bloomberg Barclays Intermediate Government/Credit Bond Index
and the Morningstar US OE Allocation - 50% to 70% Equity
| | Average Annual Total Returns
(for periods ended September 30, 2017) |
| | 1 Year | Since Inception(b) |
Davenport Balanced Income Fund(a) | 9.20% | 9.26% |
Russell 1000® Value Index | 15.12% | 14.44% |
Blended 60% Russell 1000® Value Index / 40% Bloomberg Barclays Intermediate Government/Credit Bond Index | 9.03% | 9.66% |
| Morningstar US OE Allocation - 50% to 70% Equity | 10.59% | 9.71% |
(a) | The total returns shown do not reflect the deduction of taxes that a shareholder would pay on Fund distributions or the redemption of Fund shares. |
(b) | Commencement of operations was December 31, 2015. |
16
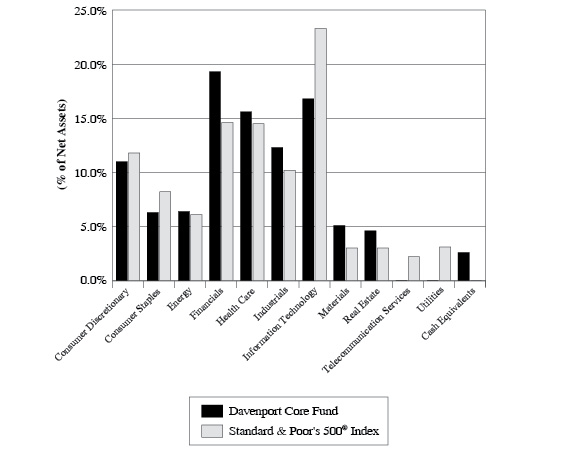
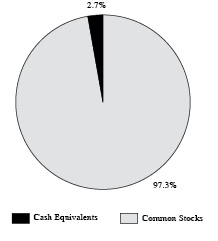
DAVENPORT CORE FUND
PORTFOLIO INFORMATION
September 30, 2017 (Unaudited)
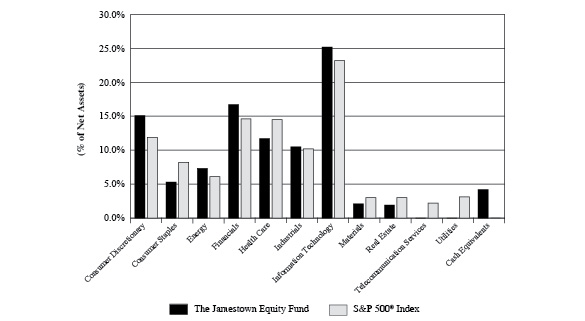
Sector Allocation vs. the Standard & Poor’s 500® Index
Top Ten Equity Holdings
| Security Description | % of Net Assets |
| Markel Corporation | 3.6% |
| Brookfield Asset Management, Inc. - Class A | 3.3% |
| Visa, Inc. - Class A | 3.3% |
| Capital One Financial Corporation | 3.2% |
| American Tower Corporation | 3.1% |
| Citigroup, Inc. | 3.0% |
| Johnson & Johnson | 2.8% |
| Berkshire Hathaway, Inc. - Class B | 2.7% |
| Accenture plc - Class A | 2.7% |
| CarMax, Inc. | 2.6% |
17
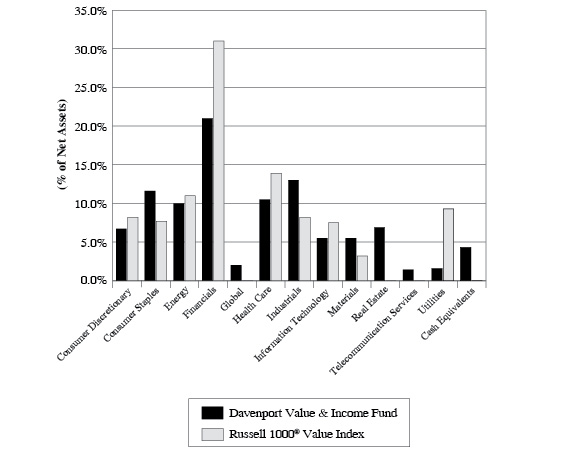
DAVENPORT VALUE & INCOME FUND
PORTFOLIO INFORMATION
September 30, 2017 (Unaudited)
Sector Allocation vs. the Russell 1000® Value Index
Top Ten Equity Holdings
| Security Description | % of Net Assets |
| FNF Group | 3.3% |
| Johnson & Johnson | 3.1% |
| Citigroup, Inc. | 2.9% |
| Capital One Financial Corporation | 2.9% |
| Markel Corporation | 2.9% |
| JPMorgan Chase & Company | 2.8% |
| Watsco, Inc. | 2.7% |
| Royal Dutch Shell plc - Class B - ADR | 2.6% |
| Diageo plc - ADR | 2.4% |
| Merck & Company, Inc. | 2.3% |
18
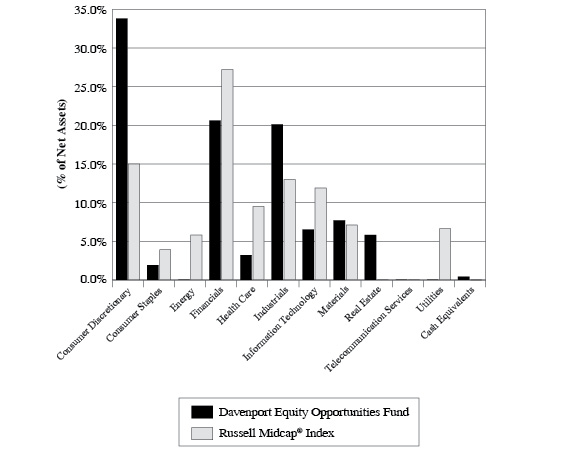
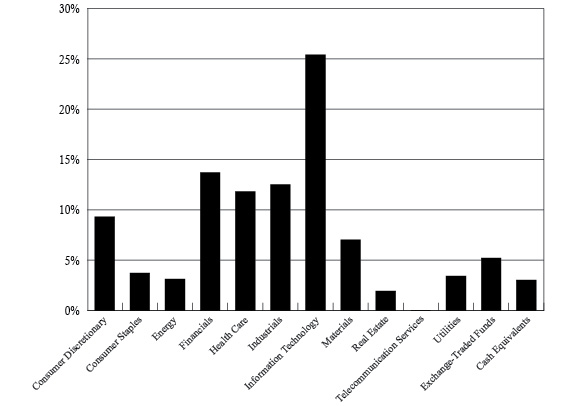
DAVENPORT EQUITY OPPORTUNITIES FUND
PORTFOLIO INFORMATION
September 30, 2017 (Unaudited)
Sector Allocation vs. the Russell Midcap® Index
Top Ten Equity Holdings
| Security Description | % of Net Assets |
| CarMax, Inc. | 6.1% |
| Colfax Corporation | 6.0% |
| WABCO Holdings, Inc. | 5.8% |
| American Tower Corporation | 5.8% |
| Brookfield Asset Management, Inc. - Class A | 5.5% |
| Dollar Tree, Inc. | 5.3% |
| Capital One Financial Corporation | 5.1% |
| DISH Network Corporation - Class A | 4.9% |
| Live Nation Entertainment, Inc. | 4.8% |
| Markel Corporation | 4.4% |
19
DAVENPORT SMALL CAP FOCUS FUND
PORTFOLIO INFORMATION
September 30, 2017 (Unaudited)
Sector Allocation vs. the Russell 2000® Index
Top Ten Equity Holdings
| Security Description | % of Net Assets |
| Monarch Casino & Resort, Inc. | 5.1% |
| American Woodmark Corporation | 3.3% |
| Genesee & Wyoming, Inc. - Class A | 3.1% |
| Liberty TripAdvisor Holdings, Inc. - Series A | 3.0% |
| Colfax Corporation | 3.0% |
| Live Nation Entertainment, Inc. | 3.0% |
| TowneBank | 3.0% |
| FRP Holdings, Inc. | 2.8% |
| Seaboard Corporation | 2.8% |
| Kinsale Capital Group, Inc. | 2.8% |
20
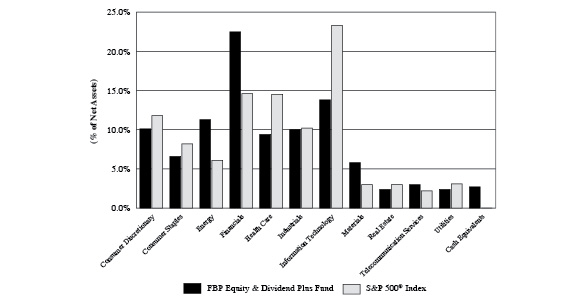
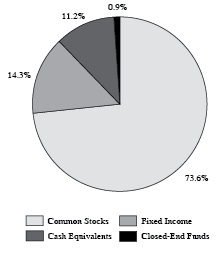
DAVENPORT BALANCED INCOME FUND
PORTFOLIO INFORMATION
September 30, 2017 (Unaudited)
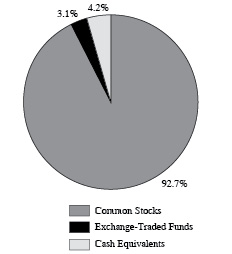
| Asset Allocation (% of Net Assets) | | Ten Largest Equity Holdings | % of Net Assets |
| | FNF Group | 1.7% |
| Johnson & Johnson | 1.7% |
| Citigroup, Inc. | 1.6% |
| Capital One Financial Corporation | 1.5% |
| Markel Corporation | 1.5% |
| JPMorgan Chase & Company | 1.5% |
| Watsco, Inc. | 1.4% |
| Royal Dutch Shell plc - Class B - ADR | 1.4% |
| Diageo plc - ADR | 1.3% |
| Merck & Company, Inc. | 1.2% |
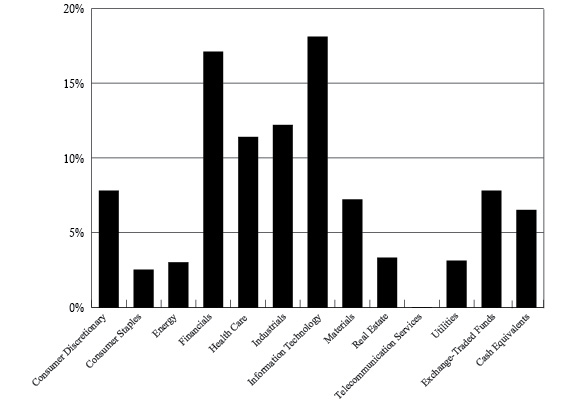
| Equity Sector Concentration vs. the Russell 1000 Value Index (57.2% of Net Assets) |
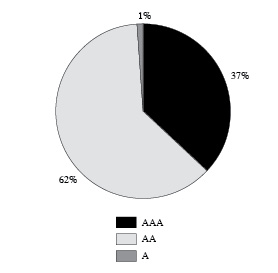
| Corporate Bond Portfolio (36.8% of Net Assets) | | Credit Quality | Composite Quality |
| Number of Fixed-Income Securities | 41 | | AAA | 0.0% |
| Average Quality | A | | AA | 17.8% |
| Effective Maturity | 4.6 yrs | | A | 60.6% |
| Average Effective Duration | 3.5 yrs | | BBB | 21.6% |
| Sector Breakdown | % of Corporate
Bond Portfolio |
| Consumer Discretionary | 8.6% |
| Consumer Staples | 19.4% |
| Energy | 6.5% |
| Financials | 30.4% |
| Health Care | 14.2% |
| Industrials | 7.3% |
| Information Technology | 7.6% |
| Telecommunication Services | 6.0% |
21
DAVENPORT CORE FUND
SCHEDULE OF INVESTMENTS
September 30, 2017 (Unaudited) |
| COMMON STOCKS — 94.1% | | Shares | | | Value | |
| Consumer Discretionary — 11.0% | | | | | | |
Amazon.com, Inc. (a) | | | 5,958 | | | $ | 5,727,723 | |
CarMax, Inc. (a) | | | 148,968 | | | | 11,293,264 | |
Liberty Broadband Corporation - Series C (a) | | | 54,649 | | | | 5,208,050 | |
Liberty SiriusXM - Series C (a) | | | 141,684 | | | | 5,932,309 | |
| NIKE, Inc. - Class B | | | 115,837 | | | | 6,006,149 | |
Priceline Group, Inc. (The) (a) | | | 4,726 | | | | 8,652,455 | |
| Walt Disney Company (The) | | | 55,331 | | | | 5,453,977 | |
| | | | | | | | 48,273,927 | |
| Consumer Staples — 6.3% | | | | | | | | |
| Anheuser-Busch InBev S.A./N.V. - ADR | | | 42,895 | | | | 5,117,373 | |
| Mondelēz International, Inc. - Class A | | | 146,710 | | | | 5,965,229 | |
| Nestlé S.A. - ADR | | | 117,457 | | | | 9,867,563 | |
| PepsiCo, Inc. | | | 58,966 | | | | 6,570,581 | |
| | | | | | | | 27,520,746 | |
| Energy — 6.4% | | | | | | | | |
| Chevron Corporation | | | 66,037 | | | | 7,759,347 | |
| Exxon Mobil Corporation | | | 75,578 | | | | 6,195,884 | |
| Marathon Petroleum Corporation | | | 139,408 | | | | 7,818,001 | |
| Schlumberger Ltd. | | | 90,110 | | | | 6,286,074 | |
| | | | | | | | 28,059,306 | |
| Financials — 19.3% | | | | | | | | |
Berkshire Hathaway, Inc. - Class B (a) | | | 65,366 | | | | 11,982,895 | |
| Brookfield Asset Management, Inc. - Class A | | | 354,654 | | | | 14,647,210 | |
| Capital One Financial Corporation | | | 164,589 | | | | 13,934,105 | |
| Citigroup, Inc. | | | 182,362 | | | | 13,265,012 | |
| CME Group, Inc. | | | 49,857 | | | | 6,764,598 | |
| JPMorgan Chase & Company | | | 88,652 | | | | 8,467,152 | |
Markel Corporation (a) | | | 14,638 | | | | 15,633,091 | |
| | | | | | | | 84,694,063 | |
| Health Care — 13.9% | | | | | | | | |
| Allergan plc | | | 27,057 | | | | 5,545,332 | |
AmerisourceBergen Corporation (a) | | | 92,875 | | | | 7,685,406 | |
| Amgen, Inc. | | | 31,781 | | | | 5,925,567 | |
Celgene Corporation (a) | | | 73,658 | | | | 10,740,810 | |
| Danaher Corporation | | | 128,757 | | | | 11,044,775 | |
| Johnson & Johnson | | | 94,987 | | | | 12,349,260 | |
| Merck & Company, Inc. | | | 123,720 | | | | 7,921,792 | |
| | | | | | | | 61,212,942 | |
| Industrials — 10.7% | | | | | | | | |
| FedEx Corporation | | | 43,851 | | | | 9,891,908 | |
| General Dynamics Corporation | | | 39,439 | | | | 8,107,870 | |
| General Electric Company | | | 235,961 | | | | 5,705,537 | |
| Johnson Controls International plc | | | 137,394 | | | | 5,535,604 | |
22
DAVENPORT CORE FUND
SCHEDULE OF INVESTMENTS (Continued) |
| COMMON STOCKS — 94.1% (Continued) | | Shares | | | Value | |
| Industrials — 10.7% (Continued) | | | | | | |
| Southwest Airlines Company | | | 153,531 | | | $ | 8,594,665 | |
| Union Pacific Corporation | | | 79,079 | | | | 9,170,792 | |
| | | | | | | | 47,006,376 | |
| Information Technology — 16.8% | | | | | | | | |
| Accenture plc - Class A | | | 88,461 | | | | 11,948,427 | |
Adobe Systems, Inc. (a) | | | 74,614 | | | | 11,130,917 | |
Alphabet, Inc. - Class A (a) | | | 7,625 | | | | 7,424,615 | |
Alphabet, Inc. - Class C (a) | | | 6,677 | | | | 6,403,977 | |
| Apple, Inc. | | | 40,822 | | | | 6,291,487 | |
Facebook, Inc. - Class A (a) | | | 49,977 | | | | 8,539,570 | |
| MasterCard, Inc. - Class A | | | 55,275 | | | | 7,804,830 | |
| Visa, Inc. - Class A | | | 137,296 | | | | 14,449,031 | |
| | | | | | | | 73,992,854 | |
| Materials — 5.1% | | | | | | | | |
| Ecolab, Inc. | | | 62,069 | | | | 7,982,694 | |
| Martin Marietta Materials, Inc. | | | 38,301 | | | | 7,898,815 | |
| Sherwin-Williams Company (The) | | | 18,912 | | | | 6,771,253 | |
| | | | | | | | 22,652,762 | |
| Real Estate — 4.6% | | | | | | | | |
| American Tower Corporation | | | 100,937 | | | | 13,796,069 | |
| Weyerhaeuser Company | | | 188,445 | | | | 6,412,784 | |
| | | | | | | | 20,208,853 | |
| | | | | | | | | |
Total Common Stocks (Cost $270,704,253) | | | | | | $ | 413,621,829 | |
| EXCHANGE-TRADED FUNDS — 3.3% | | Shares | | | Value | |
| iShares Nasdaq Biotechnology ETF | | | 21,667 | | | $ | 7,227,895 | |
| iShares U.S. Home Construction ETF | | | 195,909 | | | | 7,158,515 | |
Total Exchange-Traded Funds (Cost $11,551,628) | | | | | | $ | 14,386,410 | |
23
DAVENPORT CORE FUND
SCHEDULE OF INVESTMENTS (Continued) |
| MONEY MARKET FUNDS — 1.4% | | Shares | | | Value | |
First American Treasury Obligations Fund - Class Z, 0.89% (b) (Cost $6,359,738) | | | 6,359,738 | | | $ | 6,359,738 | |
| | | | | | | | | |
Total Investments at Value — 98.8% (Cost $288,615,619) | | | | | | $ | 434,367,977 | |
| | | | | | | | | |
Other Assets in Excess of Liabilities — 1.2% | | | | | | | 5,204,456 | |
| | | | | | | | | |
Net Assets — 100.0% | | | | | | $ | 439,572,433 | |
ADR - American Depositary Receipt.
(a) | Non-income producing security. |
(b) | The rate shown is the 7-day effective yield as of September 30, 2017. |
See accompanying notes to financial statements.
24
DAVENPORT VALUE & INCOME FUND
SCHEDULE OF INVESTMENTS
September 30, 2017 (Unaudited) |
| COMMON STOCKS — 92.2% | | Shares | | | Value | |
| Consumer Discretionary — 6.7% | | | | | | |
| Carnival Corporation | | | 148,080 | | | $ | 9,561,526 | |
| General Motors Company | | | 228,245 | | | | 9,216,533 | |
| McDonald's Corporation | | | 57,545 | | | | 9,016,151 | |
| VF Corporation | | | 208,655 | | | | 13,264,198 | |
| | | | | | | | 41,058,408 | |
| Consumer Staples — 11.6% | | | | | | | | |
| Altria Group, Inc. | | | 117,356 | | | | 7,442,718 | |
| Anheuser-Busch InBev S.A./N.V. - ADR | | | 69,160 | | | | 8,250,788 | |
| Coca-Cola Company (The) | | | 244,370 | | | | 10,999,094 | |
| CVS Health Corporation | | | 127,010 | | | | 10,328,453 | |
| Diageo plc - ADR | | | 113,550 | | | | 15,003,361 | |
| PepsiCo, Inc. | | | 94,130 | | | | 10,488,906 | |
| Philip Morris International, Inc. | | | 77,790 | | | | 8,635,468 | |
| | | | | | | | 71,148,788 | |
| Energy — 10.0% | | | | | | | | |
| Chevron Corporation | | | 66,591 | | | | 7,824,443 | |
| Enbridge, Inc. | | | 204,967 | | | | 8,575,819 | |
| Exxon Mobil Corporation | | | 83,650 | | | | 6,857,627 | |
| Marathon Petroleum Corporation | | | 164,220 | | | | 9,209,458 | |
| Occidental Petroleum Corporation | | | 198,435 | | | | 12,741,511 | |
| Royal Dutch Shell plc - Class B - ADR | | | 257,370 | | | | 16,095,920 | |
| | | | | | | | 61,304,778 | |
| Financials — 19.5% | | | | | | | | |
| Capital One Financial Corporation | | | 210,865 | | | | 17,851,831 | |
| Citigroup, Inc. | | | 245,705 | | | | 17,872,582 | |
| Fairfax Financial Holdings Ltd. | | | 17,428 | | | | 9,045,132 | |
| FNF Group | | | 423,995 | | | | 20,122,803 | |
| JPMorgan Chase & Company | | | 180,760 | | | | 17,264,387 | |
Markel Corporation (a) | | | 16,460 | | | | 17,578,951 | |
| Synchrony Financial | | | 311,220 | | | | 9,663,381 | |
| Wells Fargo & Company | | | 194,575 | | | | 10,730,811 | |
| | | | | | | | 120,129,878 | |
| Health Care — 10.5% | | | | | | | | |
| AmerisourceBergen Corporation | | | 94,740 | | | | 7,839,735 | |
| Bristol-Myers Squibb Company | | | 220,115 | | | | 14,030,130 | |
| Gilead Sciences, Inc. | | | 112,490 | | | | 9,113,940 | |
| Johnson & Johnson | | | 146,950 | | | | 19,104,969 | |
| Merck & Company, Inc. | | | 221,450 | | | | 14,179,444 | |
| | | | | | | | 64,268,218 | |
| Industrials — 13.0% | | | | | | | | |
| 3M Company | | | 59,090 | | | | 12,402,991 | |
| Boeing Company (The) | | | 47,296 | | | | 12,023,116 | |
| Delta Air Lines, Inc. | | | 166,395 | | | | 8,023,567 | |
25
DAVENPORT VALUE & INCOME FUND
SCHEDULE OF INVESTMENTS (Continued) |
| COMMON STOCKS — 92.2% (Continued) | | Shares | | | Value | |
| Industrials — 13.0% (Continued) | | | | | | |
| Eaton Corporation plc | | | 122,597 | | | $ | 9,414,224 | |
| General Electric Company | | | 419,370 | | | | 10,140,367 | |
| Illinois Tool Works, Inc. | | | 79,025 | | | | 11,692,539 | |
| Watsco, Inc. | | | 102,250 | | | | 16,469,407 | |
| | | | | | | | 80,166,211 | |
| Information Technology — 5.5% | | | | | | | | |
| Cisco Systems, Inc. | | | 364,930 | | | | 12,272,596 | |
| Microsoft Corporation | | | 167,708 | | | | 12,492,569 | |
| TE Connectivity Ltd. | | | 110,945 | | | | 9,215,091 | |
| | | | | | | | 33,980,256 | |
| Materials — 5.5% | | | | | | | | |
| International Paper Company | | | 193,705 | | | | 11,006,318 | |
| Potash Corporation of Saskatchewan, Inc. | | | 502,915 | | | | 9,676,085 | |
| PPG Industries, Inc. | | | 119,510 | | | | 12,985,956 | |
| | | | | | | | 33,668,359 | |
| Real Estate — 6.9% | | | | | | | | |
| Equity LifeStyle Properties, Inc. | | | 98,445 | | | | 8,375,700 | |
| Gaming and Leisure Properties, Inc. | | | 260,109 | | | | 9,595,421 | |
| Lamar Advertising Company - Class A | | | 187,120 | | | | 12,823,334 | |
| W.P. Carey, Inc. | | | 176,649 | | | | 11,904,376 | |
| | | | | | | | 42,698,831 | |
| Telecommunication Services — 1.4% | | | | | | | | |
| Verizon Communications, Inc. | | | 178,085 | | | | 8,813,427 | |
| | | | | | | | | |
| Utilities — 1.6% | | | | | | | | |
| Dominion Energy, Inc. | | | 125,780 | | | | 9,676,255 | |
| | | | | | | | | |
Total Common Stocks (Cost $444,065,035) | | | | | | $ | 566,913,409 | |
| EXCHANGE-TRADED FUNDS — 3.5% | | Shares | | | Value | |
| iShares MSCI Europe Financials ETF | | | 392,175 | | | $ | 9,208,269 | |
| Vanguard FTSE Emerging Markets ETF | | | 281,530 | | | | 12,266,262 | |
Total Exchange-Traded Funds (Cost $20,404,667) | | | | | | $ | 21,474,531 | |
26
DAVENPORT VALUE & INCOME FUND
SCHEDULE OF INVESTMENTS (Continued) |
| MONEY MARKET FUNDS — 4.2% | | Shares | | | Value | |
First American Treasury Obligations Fund - Class Z, 0.89% (b) (Cost $25,764,042) | | | 25,764,042 | | | $ | 25,764,042 | |
| | | | | | | | | |
Total Investments at Value — 99.9% (Cost $490,233,744) | | | | | | $ | 614,151,982 | |
| | | | | | | | | |
Other Assets in Excess of Liabilities — 0.1% | | | | | | | 893,025 | |
| | | | | | | | | |
Net Assets — 100.0% | | | | | | $ | 615,045,007 | |
ADR - American Depositary Receipt.
(a) | Non-income producing security. |
(b) | The rate shown is the 7-day effective yield as of September 30, 2017. |
See accompanying notes to financial statements.
27
DAVENPORT EQUITY OPPORTUNITIES FUND
SCHEDULE OF INVESTMENTS
September 30, 2017 (Unaudited) |
| COMMON STOCKS — 99.6% | | Shares | | | Value | |
| Consumer Discretionary — 33.8% | | | | | | |
CarMax, Inc. (a) | | | 310,535 | | | $ | 23,541,659 | |
DISH Network Corporation - Class A (a) | | | 349,230 | | | | 18,938,743 | |
Dollar Tree, Inc. (a) | | | 238,271 | | | | 20,686,688 | |
Liberty Broadband Corporation - Series C (a) | | | 120,340 | | | | 11,468,402 | |
Live Nation Entertainment, Inc. (a) | | | 430,244 | | | | 18,737,126 | |
LKQ Corporation (a) | | | 346,986 | | | | 12,488,026 | |
O'Reilly Automotive, Inc. (a) | | | 48,175 | | | | 10,375,450 | |
TripAdvisor, Inc. (a) | | | 365,425 | | | | 14,810,675 | |
| | | | | | | | 131,046,769 | |
| Consumer Staples — 1.9% | | | | | | | | |
| Church & Dwight Company, Inc. | | | 152,715 | | | | 7,399,042 | |
| | | | | | | | | |
| Financials — 20.6% | | | | | | | | |
| Brookfield Asset Management, Inc. - Class A | | | 516,652 | | | | 21,337,728 | |
| Capital One Financial Corporation | | | 232,174 | | | | 19,655,851 | |
| Fairfax Financial Holdings Ltd. | | | 15,805 | | | | 8,202,795 | |
| FNF Group | | | 283,975 | | | | 13,477,453 | |
Markel Corporation (a) | | | 16,067 | | | | 17,159,235 | |
| | | | | | | | 79,833,062 | |
| Health Care — 3.2% | | | | | | | | |
| Zoetis, Inc. | | | 192,150 | | | | 12,251,484 | |
| | | | | | | | | |
| Industrials — 20.1% | | | | | | | | |
Colfax Corporation (a) | | | 563,071 | | | | 23,446,276 | |
Genesee & Wyoming, Inc. - Class A (a) | | | 200,395 | | | | 14,831,234 | |
WABCO Holdings, Inc. (a) | | | 151,975 | | | | 22,492,300 | |
| Watsco, Inc. | | | 50,820 | | | | 8,185,577 | |
| Xylem, Inc. | | | 141,385 | | | | 8,854,943 | |
| | | | | | | | 77,810,330 | |
| Information Technology — 6.5% | | | | | | | | |
Black Knight Financial Services, Inc. - Class A (a) | | | 93,425 | | | | 4,021,946 | |
| Intuit, Inc. | | | 114,694 | | | | 16,302,605 | |
| MercadoLibre, Inc. | | | 19,416 | | | | 5,027,385 | |
| | | | | | | | 25,351,936 | |
| Materials — 7.7% | | | | | | | | |
| Martin Marietta Materials, Inc. | | | 65,890 | | | | 13,588,494 | |
| Sherwin-Williams Company (The) | | | 45,620 | | | | 16,333,785 | |
| | | | | | | | 29,922,279 | |
| Real Estate — 5.8% | | | | | | | | |
| American Tower Corporation | | | 164,410 | | | | 22,471,559 | |
| | | | | | | | | |
Total Common Stocks (Cost $307,898,014) | | | | | | $ | 386,086,461 | |
28
DAVENPORT EQUITY OPPORTUNITIES FUND
SCHEDULE OF INVESTMENTS (Continued) |
| MONEY MARKET FUNDS — 0.5% | | Shares | | | Value | |
First American Treasury Obligations Fund - Class Z, 0.89% (b) (Cost $1,894,056) | | | 1,894,056 | | | $ | 1,894,056 | |
| | | | | | | | | |
Total Investments at Value — 100.1% (Cost $309,792,070) | | | | | | $ | 387,980,517 | |
| | | | | | | | | |
Liabilities in Excess of Other Assets — (0.1%) | | | | | | | (156,910 | ) |
| | | | | | | | | |
Net Assets — 100.0% | | | | | | $ | 387,823,607 | |
(a) | Non-income producing security. |
(b) | The rate shown is the 7-day effective yield as of September 30, 2017. |
See accompanying notes to financial statements.
29
DAVENPORT SMALL CAP FOCUS FUND
SCHEDULE OF INVESTMENTS
September 30, 2017 (Unaudited) |
| COMMON STOCKS — 96.6% | | Shares | | | Value | |
| Consumer Discretionary — 23.3% | | | | | | |
| Cable One, Inc. | | | 2,914 | | | $ | 2,104,258 | |
| Core-Mark Holding Company, Inc. | | | 64,066 | | | | 2,059,081 | |
Eldorado Resorts, Inc. (a) | | | 66,454 | | | | 1,704,545 | |
Etsy, Inc. (a) | | | 40,000 | | | | 675,200 | |
Liberty TripAdvisor Holdings, Inc. - Series A (a) | | | 222,196 | | | | 2,744,121 | |
Live Nation Entertainment, Inc. (a) | | | 62,321 | | | | 2,714,079 | |
Monarch Casino & Resort, Inc. (a) | | | 118,330 | | | | 4,677,585 | |
| Pool Corporation | | | 15,900 | | | | 1,719,903 | |
| Red Rock Resorts, Inc. - Class A | | | 75,000 | | | | 1,737,000 | |
Unifi, Inc. (a) | | | 29,887 | | | | 1,064,874 | |
| | | | | | | | 21,200,646 | |
| Consumer Staples — 7.8% | | | | | | | | |
Boston Beer Company, Inc. (The) - Class A (a) | | | 13,871 | | | | 2,166,650 | |
| Seaboard Corporation | | | 557 | | | | 2,509,285 | |
| Snyder's-Lance, Inc. | | | 63,722 | | | | 2,430,357 | |
| | | | | | | | 7,106,292 | |
| Energy — 4.6% | | | | | | | | |
| Alliance Holdings GP, L.P. | | | 67,974 | | | | 1,890,357 | |
| CNX Coal Resources, L.P. | | | 18,415 | | | | 272,542 | |
| Dominion Midstream Partners, L.P. | | | 39,215 | | | | 1,254,880 | |
Navigator Holdings Ltd. (a) | | | 65,381 | | | | 725,729 | |
| | | | | | | | 4,143,508 | |
| Financials — 12.0% | | | | | | | | |
| Cohen & Steers, Inc. | | | 59,875 | | | | 2,364,464 | |
| Diamond Hill Investment Group, Inc. | | | 8,428 | | | | 1,789,686 | |
| Kinsale Capital Group, Inc. | | | 58,062 | | | | 2,506,536 | |
PRA Group, Inc. (a) | | | 55,000 | | | | 1,575,750 | |
| TowneBank | | | 81,001 | | | | 2,713,533 | |
| | | | | | | | 10,949,969 | |
| Health Care — 6.0% | | | | | | | | |
Aratana Therapeutics, Inc. (a) | | | 154,000 | | | | 944,020 | |
Heska Corporation (a) | | | 15,610 | | | | 1,375,085 | |
Trupanion, Inc. (a) | | | 86,000 | | | | 2,271,260 | |
VWR Corporation (a) | | | 24,764 | | | | 819,936 | |
| | | | | | | | 5,410,301 | |
| Industrials — 26.8% | | | | | | | | |
| AMERCO | | | 2,689 | | | | 1,008,106 | |
American Woodmark Corporation (a) | | | 31,384 | | | | 3,020,710 | |
Builders FirstSource, Inc. (a) | | | 121,118 | | | | 2,178,913 | |
Colfax Corporation (a) | | | 65,468 | | | | 2,726,088 | |
Genesee & Wyoming, Inc. - Class A (a) | | | 37,968 | | | | 2,810,012 | |
Knight-Swift Transportation Holdings, Inc. (a) | | | 55,508 | | | | 2,306,357 | |
| Marten Transport Ltd. | | | 90,551 | | | | 1,860,823 | |
30
DAVENPORT SMALL CAP FOCUS FUND
SCHEDULE OF INVESTMENTS (Continued) |
| COMMON STOCKS — 96.6% (Continued) | | Shares | | | Value | |
| Industrials — 26.8% (Continued) | | | | | | |
Mistras Group, Inc. (a) | | | 86,419 | | | $ | 1,771,589 | |
NOW, Inc. (a) | | | 110,000 | | | | 1,519,100 | |
On Assignment, Inc. (a) | | | 23,987 | | | | 1,287,622 | |
WABCO Holdings, Inc. (a) | | | 14,019 | | | | 2,074,812 | |
| Watsco, Inc. | | | 11,340 | | | | 1,826,534 | |
| | | | | | | | 24,390,666 | |
| Information Technology — 2.5% | | | | | | | | |
Black Knight Financial Services, Inc. - Class A (a) | | | 51,652 | | | | 2,223,619 | |
| | | | | | | | | |
| Materials — 4.9% | | | | | | | | |
MAG Silver Corporation (a) | | | 157,005 | | | | 1,763,166 | |
| NewMarket Corporation | | | 2,637 | | | | 1,122,703 | |
Summit Materials, Inc. - Class A (a) | | | 50,100 | | | | 1,604,703 | |
| | | | | | | | 4,490,572 | |
| Real Estate — 6.9% | | | | | | | | |
FRP Holdings, Inc. (a) | | | 56,852 | | | | 2,572,553 | |
| Lamar Advertising Company - Class A | | | 36,278 | | | | 2,486,132 | |
| Outfront Media, Inc. | | | 48,774 | | | | 1,228,129 | |
| | | | | | | | 6,286,814 | |
| Telecommunication Services — 1.8% | | | | | | | | |
| Shenandoah Telecommunications Company | | | 42,760 | | | | 1,590,672 | |
| | | | | | | | | |
Total Common Stocks (Cost $72,691,080) | | | | | | $ | 87,793,059 | |
| MONEY MARKET FUNDS — 3.1% | | Shares | | | Value | |
First American Treasury Obligations Fund - Class Z, 0.89% (b) (Cost $2,857,748) | | | 2,857,748 | | | $ | 2,857,748 | |
| | | | | | | | | |
Total Investments at Value — 99.7% (Cost $75,548,828) | | | | | | $ | 90,650,807 | |
| | | | | | | | | |
Other Assets in Excess of Liabilities — 0.3% | | | | | | | 266,502 | |
| | | | | | | | | |
Net Assets — 100.0% | | | | | | $ | 90,917,309 | |
(a) | Non-income producing security. |
(b) | The rate shown is the 7-day effective yield as of September 30, 2017. |
See accompanying notes to financial statements.
31
DAVENPORT BALANCED INCOME FUND
SCHEDULE OF INVESTMENTS
September 30, 2017 (Unaudited) |
| COMMON STOCKS — 57.2% | | Shares | | | Value | |
| Consumer Discretionary — 3.6% | | | | | | |
| Carnival Corporation | | | 13,790 | | | $ | 890,421 | |
| General Motors Company | | | 21,245 | | | | 857,873 | |
| McDonald's Corporation | | | 5,360 | | | | 839,805 | |
| VF Corporation | | | 19,390 | | | | 1,232,622 | |
| | | | | | | | 3,820,721 | |
| Consumer Staples — 6.2% | | | | | | | | |
| Altria Group, Inc. | | | 10,925 | | | | 692,864 | |
| Anheuser-Busch InBev S.A./N.V. - ADR | | | 6,430 | | | | 767,099 | |
| Coca-Cola Company (The) | | | 22,745 | | | | 1,023,752 | |
| CVS Health Corporation | | | 11,800 | | | | 959,576 | |
| Diageo plc - ADR | | | 10,570 | | | | 1,396,614 | |
| PepsiCo, Inc. | | | 8,755 | | | | 975,570 | |
| Philip Morris International, Inc. | | | 7,225 | | | | 802,047 | |
| | | | | | | | 6,617,522 | |
| Energy — 7.5% | | | | | | | | |
| Alliance Resource Partners, L.P. | | | 37,580 | | | | 727,173 | |
| Chevron Corporation | | | 6,180 | | | | 726,150 | |
| Dominion Energy Midstream Partners, L.P. | | | 26,290 | | | | 841,280 | |
| Enbridge, Inc. | | | 19,083 | | | | 798,433 | |
| Exxon Mobil Corporation | | | 7,785 | | | | 638,214 | |
| Marathon Petroleum Corporation | | | 15,345 | | | | 860,548 | |
| MPLX, L.P. | | | 22,750 | | | | 796,477 | |
| Occidental Petroleum Corporation | | | 18,475 | | | | 1,186,280 | |
| Royal Dutch Shell plc - Class B - ADR | | | 23,595 | | | | 1,475,631 | |
| | | | | | | | 8,050,186 | |
| Financials — 13.0% | | | | | | | | |
| Blackstone Group, L.P. (The) | | | 30,070 | | | | 1,003,436 | |
| Capital One Financial Corporation | | | 19,630 | | | | 1,661,876 | |
| Citigroup, Inc. | | | 22,875 | | | | 1,663,927 | |
| Cohen & Steers, Inc. | | | 22,045 | | | | 870,557 | |
| Fairfax Financial Holdings Ltd. | | | 1,635 | | | | 848,565 | |
| FNF Group | | | 39,470 | | | | 1,873,246 | |
| JPMorgan Chase & Company | | | 16,890 | | | | 1,613,164 | |
| Lazard Ltd. - Class A | | | 20,230 | | | | 914,801 | |
Markel Corporation (a) | | | 1,542 | | | | 1,646,825 | |
| Synchrony Financial | | | 28,535 | | | | 886,012 | |
| Wells Fargo & Company | | | 18,050 | | | | 995,457 | |
| | | | | | | | 13,977,866 | |
| Health Care — 5.6% | | | | | | | | |
| AmerisourceBergen Corporation | | | 8,685 | | | | 718,684 | |
| Bristol-Myers Squibb Company | | | 20,500 | | | | 1,306,670 | |
| Gilead Sciences, Inc. | | | 10,430 | | | | 845,038 | |
| Johnson & Johnson | | | 13,680 | | | | 1,778,537 | |
32
DAVENPORT BALANCED INCOME FUND
SCHEDULE OF INVESTMENTS (Continued) |
| COMMON STOCKS — 57.2% (Continued) | | Shares | | | Value | |
| Health Care — 5.6% (Continued) | | | | | | |
| Merck & Company, Inc. | | | 20,620 | | | $ | 1,320,299 | |
| | | | | | | | 5,969,228 | |
| Industrials — 6.9% | | | | | | | | |
| 3M Company | | | 5,495 | | | | 1,153,400 | |
| Boeing Company (The) | | | 4,360 | | | | 1,108,356 | |
| Delta Air Lines, Inc. | | | 15,435 | | | | 744,276 | |
| Eaton Corporation plc | | | 11,420 | | | | 876,942 | |
| General Electric Company | | | 39,035 | | | | 943,866 | |
| Illinois Tool Works, Inc. | | | 7,350 | | | | 1,087,506 | |
| Watsco, Inc. | | | 9,520 | | | | 1,533,386 | |
| | | | | | | | 7,447,732 | |
| Information Technology — 2.9% | | | | | | | | |
| Cisco Systems, Inc. | | | 33,490 | | | | 1,126,269 | |
| Microsoft Corporation | | | 15,610 | | | | 1,162,789 | |
| TE Connectivity Ltd. | | | 10,305 | | | | 855,933 | |
| | | | | | | | 3,144,991 | |
| Materials — 2.9% | | | | | | | | |
| International Paper Company | | | 18,030 | | | | 1,024,465 | |
| Potash Corporation of Saskatchewan, Inc. | | | 46,810 | | | | 900,624 | |
| PPG Industries, Inc. | | | 11,130 | | | | 1,209,386 | |
| | | | | | | | 3,134,475 | |
| Real Estate — 5.1% | | | | | | | | |
| Equity LifeStyle Properties, Inc. | | | 9,165 | | | | 779,758 | |
| Gaming and Leisure Properties, Inc. | | | 24,365 | | | | 898,825 | |
| Lamar Advertising Company - Class A | | | 17,355 | | | | 1,189,338 | |
| Outfront Media, Inc. | | | 31,770 | | | | 799,969 | |
| Tanger Factory Outlet Centers, Inc. | | | 28,745 | | | | 701,953 | |
| W.P. Carey, Inc. | | | 16,450 | | | | 1,108,565 | |
| | | | | | | | 5,478,408 | |
| Telecommunication Services — 0.8% | | | | | | | | |
| Verizon Communications, Inc. | | | 16,580 | | | | 820,544 | |
| | | | | | | | | |
| Utilities — 2.7% | | | | | | | | |
| Brookfield Infrastructure Partners, L.P. | | | 23,275 | | | | 1,004,083 | |
| Brookfield Renewable Partners, L.P. | | | 28,660 | | | | 960,683 | |
| Dominion Energy, Inc. | | | 11,720 | | | | 901,620 | |
| | | | | | | | 2,866,386 | |
| | | | | | | | | |
Total Common Stocks (Cost $54,669,303) | | | | | | $ | 61,328,059 | |
33
DAVENPORT BALANCED INCOME FUND
SCHEDULE OF INVESTMENTS (Continued) |
| FIXED RATE CORPORATE BONDS — 26.6% | | Par Value | | | Value | |
| Consumer Discretionary — 3.2% | | | | | | |
| Amazon.com, Inc., 3.30%, due 12/05/2021 | | $ | 1,500,000 | | | $ | 1,563,295 | |
| Ford Motor Company, 4.346%, due 12/08/2026 | | | 1,250,000 | | | | 1,299,470 | |
| Home Depot, Inc. (The), 4.40%, due 04/01/2021 | | | 500,000 | | | | 536,718 | |
| | | | | | | | 3,399,483 | |
| Consumer Staples — 7.1% | | | | | | | | |
| Altria Group, Inc., 4.75%, due 05/05/2021 | | | 600,000 | | | | 650,320 | |
| Anheuser-Busch InBev S.A./N.V., 3.30%, due 02/01/2023 | | | 1,300,000 | | | | 1,347,807 | |
| CVS Health Corporation, 3.875%, due 07/20/2025 | | | 1,300,000 | | | | 1,355,916 | |
| J.M. Smucker Company (The), 3.50%, due 10/15/2021 | | | 1,500,000 | | | | 1,558,623 | |
| PepsiCo, Inc., 2.75%, due 03/05/2022 | | | 1,450,000 | | | | 1,486,711 | |
| Sysco Corporation, 2.60%, due 10/01/2020 | | | 1,250,000 | | | | 1,268,389 | |
| | | | | | | | 7,667,766 | |
| Energy — 2.4% | | | | | | | | |
| MPLX, L.P., 4.125%, due 03/01/2027 | | | 1,250,000 | | | | 1,272,722 | |
| Occidental Petroleum Corporation, 3.50%, due 06/15/2025 | | | 1,250,000 | | | | 1,279,317 | |
| | | | | | | | 2,552,039 | |
| Financials — 3.6% | | | | | | | | |
| Bank of America Corporation, 2.65%, due 04/01/2019 | | | 550,000 | | | | 554,950 | |
| BlackRock, Inc., 3.50%, due 03/18/2024 | | | 950,000 | | | | 993,520 | |
| Capital One Financial Corporation, 2.50%, due 05/12/2020 | | | 1,000,000 | | | | 1,004,656 | |
| General Motors Financial Company, 5.25%, due 03/01/2026 | | | 1,250,000 | | | | 1,356,945 | |
| | | | | | | | 3,910,071 | |
| Health Care — 3.8% | | | | | | | | |
| AbbVie, Inc., 2.50%, due 05/14/2020 | | | 1,300,000 | | | | 1,315,577 | |
| Becton Dickinson & Company, 3.25%, due 11/12/2020 | | | 1,250,000 | | | | 1,283,768 | |
| Express Scripts Holding Company, 3.00%, due 07/15/2023 | | | 1,500,000 | | | | 1,501,803 | |
| | | | | | | | 4,101,148 | |
| Industrials — 2.7% | | | | | | | | |
| Burlington Northern Santa Fe, LLC, 4.70%, due 10/01/2019 | | | 350,000 | | | | 369,640 | |
| Deere & Company, 4.375%, due 10/16/2019 | | | 500,000 | | | | 525,529 | |
| General Electric Capital Corporation, 4.65%, due 10/17/2021 | | | 1,000,000 | | | | 1,095,066 | |
| United Technologies Corporation, 4.50%, due 04/15/2020 | | | 850,000 | | | | 902,335 | |
| | | | | | | | 2,892,570 | |
| Information Technology — 2.2% | | | | | | | | |
| Apple, Inc., 3.20%, due 05/13/2025 | | | 1,000,000 | | | | 1,026,820 | |
| Applied Materials, Inc., 3.30%, due 04/01/2027 | | | 750,000 | | | | 763,891 | |
| Oracle Corporation, 3.625%, due 07/15/2023 | | | 500,000 | | | | 531,700 | |
| | | | | | | | 2,322,411 | |
34
DAVENPORT BALANCED INCOME FUND
SCHEDULE OF INVESTMENTS (Continued) |
| FIXED RATE CORPORATE BONDS — 26.6% (Continued) | | Par Value | | | Value | |
| Telecommunication Services — 1.6% | | | | | | |
| AT&T, Inc., 3.40%, due 08/14/2024 | | $ | 1,000,000 | | | $ | 1,001,557 | |
| Verizon Communications, Inc., | | | | | | | | |
| 3.00%, due 11/1/2021 | | | 500,000 | | | | 510,261 | |
| 3.50%, due 11/1/2021 | | | 200,000 | | | | 207,971 | |
| | | | | | | | 1,719,789 | |
| | | | | | | | | |
Total Fixed Rate Corporate Bonds (Cost $28,533,366) | | | | | | $ | 28,565,277 | |
VARIABLE RATE CORPORATE BONDS (b) — 10.2% | | Par Value | | | Value | |
| Financials — 7.6% | | | | | | |
| American Express Credit Corporation, 2.092% (3MO LIBOR + 78), due 11/05/2018 | | $ | 1,250,000 | | | $ | 1,259,963 | |
| Bank of New York Mellon (The), 1.871% (3MO LIBOR + 56), due 08/01/2018 | | | 400,000 | | | | 401,819 | |
| BP Capital Markets plc, 1.974% (3MO LIBOR +65), due 09/19/2022 | | | 1,000,000 | | | | 1,005,533 | |
| Goldman Sachs Group, Inc., 2.485% (3MO LIBOR + 117), due 11/15/2021 | | | 945,000 | | | | 957,965 | |
| JPMorgan Chase & Company, 2.796% (3MO LIBOR + 148), due 03/01/2021 | | | 1,500,000 | | | | 1,548,000 | |
| Morgan Stanley, 2.109% (3MO LIBOR + 80), due 02/14/2020 | | | 1,250,000 | | | | 1,256,361 | |
| Royal Bank of Canada, 1.851% (3MO LIBOR + 54), due 07/30/2018 | | | 471,000 | | | | 472,671 | |
| Toronto-Dominion Bank (The), 2.153% (3MO LIBOR + 84), due 01/22/2019 | | | 500,000 | | | | 504,391 | |
| Wells Fargo & Company, 2.327% (3MO LIBOR + 101), due 12/07/2020 | | | 679,000 | | | | 691,778 | |
| | | | | | | | 8,098,481 | |
| Health Care — 1.4% | | | | | | | | |
| Amgen, Inc., 1.915% (3MO LIBOR + 60), due 05/22/2019 | | | 1,500,000 | | | | 1,510,548 | |
| | | | | | | | | |
| Information Technology — 0.6% | | | | | | | | |
| Cisco Systems, Inc., 1.665% (3MO LIBOR + 34), due 09/20/2019 | | | 670,000 | | | | 673,947 | |
35
DAVENPORT BALANCED INCOME FUND
SCHEDULE OF INVESTMENTS (Continued) |
VARIABLE RATE CORPORATE BONDS (b) — 10.2% (Continued) | | Shares | | | Value | |
| Telecommunication Services — 0.6% | | | | | | |
| AT&T, Inc., 2.263% (3MO LIBOR + 93), due 06/30/2020 | | | 450,000 | | | $ | 456,093 | |
| Verizon Communications, Inc., 3.069% (3MO LIBOR + 175), due 09/14/2018 | | | 200,000 | | | | 203,136 | |
| | | | | | | | 659,229 | |
| | | | | | | | | |
Total Variable Rate Corporate Bonds (Cost $10,904,420) | | | | | | $ | 10,942,205 | |
| EXCHANGE-TRADED FUNDS — 1.8% | | Shares | | | Value | |
| iShares MSCI Europe Financials ETF | | | 36,020 | | | $ | 845,750 | |
| Vanguard FTSE Emerging Markets ETF | | | 25,985 | | | | 1,132,166 | |
Total Exchange-Traded Funds (Cost $1,879,541) | | | | | | $ | 1,977,916 | |
| MONEY MARKET FUNDS — 3.8% | | Shares | | | Value | |
First American Treasury Obligations Fund - Class Z, 0.89% (c) (Cost $4,062,058) | | | 4,062,058 | | | $ | 4,062,058 | |
| | | | | | | | | |
Total Investments at Value — 99.6% (Cost $100,048,688) | | | | | | $ | 106,875,515 | |
| | | | | | | | | |
Other Assets in Excess of Liabilities — 0.4% | | | | | | | 431,328 | |
| | | | | | | | | |
Net Assets — 100.0% | | | | | | $ | 107,306,843 | |
ADR - American Depositary Receipt.
LIBOR - London Interbank Offered Rate.
(a) | Non-income producing security. |
(b) | Variable rate securities. The rates shown are the effective interest rates as of September 30, 2017. The benchmark on which the rate is calculated is shown parenthetically. |
(c) | The rate shown is the 7-day effective yield as of September 30, 2017. |
See accompanying notes to financial statements.
36
THE DAVENPORT FUNDS
STATEMENTS OF ASSETS AND LIABILITIES
September 30, 2017 (Unaudited) |
| | | Davenport Core
Fund | | | Davenport Value & Income
Fund | | | Davenport Equity Opportunities Fund | |
| ASSETS | | | | | | | | | |
| Investments in securities: | | | | | | | | | |
| At cost | | $ | 288,615,619 | | | $ | 490,233,744 | | | $ | 309,792,070 | |
| At value (Note 2) | | $ | 434,367,977 | | | $ | 614,151,982 | | | $ | 387,980,517 | |
| Cash | | | 4,967,311 | | | | — | | | | 61,482 | |
| Dividends receivable | | | 381,258 | | | | 1,185,046 | | | | 112,989 | |
| Receivable for capital shares sold | | | 255,575 | | | | 285,418 | | | | 264,454 | |
| Other assets | | | 43,252 | | | | 25,846 | | | | 23,513 | |
| TOTAL ASSETS | | | 440,015,373 | | | | 615,648,292 | | | | 388,442,955 | |
| | | | | | | | | | | | | |
| LIABILITIES | | | | | | | | | | | | |
| Payable for capital shares redeemed | | | 124,626 | | | | 152,967 | | | | 323,917 | |
| Accrued investment advisory fees (Note 4) | | | 268,774 | | | | 373,171 | | | | 235,748 | |
| Payable to administrator (Note 4) | | | 42,200 | | | | 53,800 | | | | 39,750 | |
| Other accrued expenses and liabilities | | | 7,340 | | | | 23,347 | | | | 19,933 | |
| TOTAL LIABILITIES | | | 442,940 | | | | 603,285 | | | | 619,348 | |
| | | | | | | | | | | | | |
NET ASSETS | | $ | 439,572,433 | | | $ | 615,045,007 | | | $ | 387,823,607 | |
| | | | | | | | | | | | | |
| Net assets consist of: | | | | | | | | | | | | |
| Paid-in capital | | $ | 289,119,182 | | | $ | 483,918,142 | | | $ | 312,935,558 | |
| Accumulated net investment income (loss) | | | 12,398 | | | | 326,341 | | | | (439,422 | ) |
| Accumulated net realized gains (losses) from investment transactions | | | 4,688,495 | | | | 6,882,286 | | | | (2,860,976 | ) |
| Net unrealized appreciation on investments | | | 145,752,358 | | | | 123,918,238 | | | | 78,188,447 | |
| Net assets | | $ | 439,572,433 | | | $ | 615,045,007 | | | $ | 387,823,607 | |
| | | | | | | | | | | | | |
| Shares of beneficial interest outstanding (unlimited number of shares authorized, $0.01 par value) | | | 19,757,172 | | | | 36,562,654 | | | | 22,253,630 | |
| | | | | | | | | | | | | |
| Net asset value, offering price and redemption price per share (Note 2) | | $ | 22.25 | | | $ | 16.82 | | | $ | 17.43 | |
See accompanying notes to financial statements.
37
THE DAVENPORT FUNDS
STATEMENTS OF ASSETS AND LIABILITIES (Continued)
September 30, 2017 (Unaudited) |
| | | Davenport Small Cap Focus
Fund | | | Davenport Balanced Income
Fund | |
| ASSETS | | | | | | |
| Investments in securities: | | | | | | |
| At cost | | $ | 75,548,828 | | | $ | 100,048,688 | |
| At value (Note 2) | | $ | 90,650,807 | | | $ | 106,875,515 | |
| Cash | | | — | | | | 12,571 | |
| Dividends and interest receivable | | | 17,085 | | | | 444,487 | |
| Receivable for investment securities sold | | | 245,563 | | | | 913,392 | |
| Receivable for capital shares sold | | | 229,038 | | | | 296,900 | |
| Other assets | | | 23,160 | | | | 17,570 | |
| TOTAL ASSETS | | | 91,165,653 | | | | 108,560,435 | |
| | | | | | | | | |
| LIABILITIES | | | | | | | | |
| Payable for investment securities purchased | | | 175,975 | | | | 961,452 | |
| Payable for capital shares redeemed | | | 5,000 | | | | 209,095 | |
| Accrued investment advisory fees (Note 4) | | | 53,434 | | | | 65,098 | |
| Payable to administrator (Note 4) | | | 11,050 | | | | 11,800 | |
| Other accrued expenses and liabilities | | | 2,885 | | | | 6,147 | |
| TOTAL LIABILITIES | | | 248,344 | | | | 1,253,592 | |
| | | | | | | | | |
NET ASSETS | | $ | 90,917,309 | | | $ | 107,306,843 | |
| | | | | | | | | |
| Net assets consist of: | | | | | | | | |
| Paid-in capital | | $ | 75,492,904 | | | $ | 99,989,552 | |
| Accumulated net investment income | | | 87,093 | | | | 121,183 | |
| Accumulated net realized gains from investment transactions | | | 235,333 | | | | 369,281 | |
| Net unrealized appreciation on investments | | | 15,101,979 | | | | 6,826,827 | |
| Net assets | | $ | 90,917,309 | | | $ | 107,306,843 | |
| | | | | | | | | |
| Shares of beneficial interest outstanding (unlimited number of shares authorized, $0.01 par value) | | | 7,059,083 | | | | 9,439,872 | |
| | | | | | | | | |
| Net asset value, offering price and redemption price per share (Note 2) | | $ | 12.88 | | | $ | 11.37 | |
See accompanying notes to financial statements.
38
THE DAVENPORT FUNDS
STATEMENTS OF OPERATIONS
Six Months Ended September 30, 2017 (Unaudited) |
| | Davenport
Core
Fund | | | Davenport Value & Income
Fund | | | Davenport Equity Opportunities Fund | |
| INVESTMENT INCOME | | | | | | | | | |
| Dividends | | $ | 3,123,288 | | | $ | 8,411,356 | | | $ | 1,343,933 | |
| Foreign withholding taxes on dividends | | | (69,040 | ) | | | (66,751 | ) | | | (29,164 | ) |
| TOTAL INVESTMENT INCOME | | | 3,054,248 | | | | 8,344,605 | | | | 1,314,769 | |
| | | | | | | | | | | | | |
| EXPENSES | | | | | | | | | | | | |
| Investment advisory fees (Note 4) | | | 1,583,675 | | | | 2,199,642 | | | | 1,379,669 | |
| Administration fees (Note 4) | | | 237,684 | | | | 304,769 | | | | 224,244 | |
| Custodian and bank service fees | | | 14,400 | | | | 19,287 | | | | 12,228 | |
| Compliance service fees (Note 4) | | | 13,034 | | | | 17,240 | | | | 11,608 | |
| Professional fees | | | 10,768 | | | | 10,768 | | | | 10,768 | |
| Printing of shareholder reports | | | 6,091 | | | | 7,188 | | | | 6,792 | |
| Postage and supplies | | | 5,611 | | | | 6,537 | | | | 6,446 | |
| Trustees’ fees and expenses (Note 4) | | | 4,982 | | | | 4,982 | | | | 4,982 | |
| Other expenses | | | 2,981 | | | | 39,766 | | | | 35,656 | |
| TOTAL EXPENSES | | | 1,879,226 | | | | 2,610,179 | | | | 1,692,393 | |
| | | | | | | | | | | | | |
NET INVESTMENT INCOME (LOSS) | | | 1,175,022 | | | | 5,734,426 | | | | (377,624 | ) |
| | | | | | | | | | | | | |
| REALIZED AND UNREALIZED GAINS ON INVESTMENTS | | | | | | | | | | | | |
| Net realized gains from investment transactions | | | 4,702,376 | | | | 6,883,674 | | | | 5,405,833 | |
| Net change in unrealized appreciation (depreciation) on investments | | | 23,431,571 | | | | 31,540,804 | | | | 34,894,338 | |
NET REALIZED AND UNREALIZED GAINS ON INVESTMENTS | | | 28,133,947 | | | | 38,424,478 | | | | 40,300,171 | |
| | | | | | | | | | | | |
NET INCREASE IN NET ASSETS FROM OPERATIONS | | $ | 29,308,969 | | | $ | 44,158,904 | | | $ | 39,922,547 | |
See accompanying notes to financial statements.
39
THE DAVENPORT FUNDS
STATEMENTS OF OPERATIONS (Continued)
Six Months Ended September 30, 2017 (Unaudited) |
| | | Davenport Small Cap Focus
Fund | | | Davenport Balanced Income
Fund | |
| INVESTMENT INCOME | | | | | | |
| Dividends | | $ | 424,957 | | | $ | 950,997 | |
| Foreign withholding taxes on dividends | | | (1,063 | ) | | | (6,768 | ) |
| Interest | | | — | | | | 421,522 | |
| TOTAL INVESTMENT INCOME | | | 423,894 | | | | 1,365,751 | |
| | | | | | | | | |
| EXPENSES | | | | | | | | |
| Investment advisory fees (Note 4) | | | 306,785 | | | | 363,574 | |
| Administration fees (Note 4) | | | 59,935 | | | | 62,161 | |
| Professional fees | | | 10,768 | | | | 11,518 | |
| Trustees’ fees and expenses (Note 4) | | | 4,982 | | | | 4,982 | |
| Compliance service fees (Note 4) | | | 4,341 | | | | 4,708 | |
| Custodian and bank service fees | | | 4,218 | | | | 4,696 | |
| Printing of shareholder reports | | | 3,294 | | | | 3,165 | |
| Postage and supplies | | | 2,783 | | | | 1,948 | |
| Other expenses | | | 11,940 | | | | 20,618 | |
| TOTAL EXPENSES | | | 409,046 | | | | 477,370 | |
| | | | | | | | | |
NET INVESTMENT INCOME | | | 14,848 | | | | 888,381 | |
| | | | | | | | | |
| REALIZED AND UNREALIZED GAINS ON INVESTMENTS | | | | | | | | |
| Net realized gains from investment transactions | | | 319,578 | | | | 370,007 | |
| Net change in unrealized appreciation (depreciation) on investments | | | 5,921,724 | | | | 3,164,606 | |
NET REALIZED AND UNREALIZED GAINS ON INVESTMENTS | | | 6,241,302 | | | | 3,534,613 | |
| | | | | | | | |
NET INCREASE IN NET ASSETS FROM OPERATIONS | | $ | 6,256,150 | | | $ | 4,422,994 | |
See accompanying notes to financial statements.
40
DAVENPORT CORE FUND
STATEMENTS OF CHANGES IN NET ASSETS |
| | | Six Months
Ended
September 30,
2017
(Unaudited) | | | Year
Ended
March 31,
2017 | |
| FROM OPERATIONS | | | | | | |
| Net investment income | | $ | 1,175,022 | | | $ | 2,026,335 | |
| Net realized gains from investment transactions | | | 4,702,376 | | | | 12,476,423 | |
| Net change in unrealized appreciation (depreciation) on investments | | | 23,431,571 | | | | 41,702,580 | |
| Net increase in net assets from operations | | | 29,308,969 | | | | 56,205,338 | |
| | | | | | | | | |
| DISTRIBUTIONS TO SHAREHOLDERS (Note 2) | | | | | | | | |
| From net investment income | | | (1,379,638 | ) | | | (1,831,251 | ) |
| From net realized gains from investment transactions | | | (6,519,646 | ) | | | (10,298,009 | ) |
| Decrease in net assets from distributions to shareholders | | | (7,899,284 | ) | | | (12,129,260 | ) |
| | | | | | | | | |
| FROM CAPITAL SHARE TRANSACTIONS | | | | | | | | |
| Proceeds from shares sold | | | 26,715,464 | | | | 39,405,923 | |
| Net asset value of shares issued in reinvestment of distributions to shareholders | | | 7,569,409 | | | | 11,675,046 | |
| Payments for shares redeemed | | | (15,554,178 | ) | | | (32,954,445 | ) |
| Net increase in net assets from capital share transactions | | | 18,730,695 | | | | 18,126,524 | |
| | | | | | | | | |
TOTAL INCREASE IN NET ASSETS | | | 40,140,380 | | | | 62,202,602 | |
| | | | | | | | | |
| NET ASSETS | | | | | | | | |
| Beginning of period | | | 399,432,053 | | | | 337,229,451 | |
| End of period | | $ | 439,572,433 | | | $ | 399,432,053 | |
| | | | | | | | | |
ACCUMULATED NET INVESTMENT INCOME | | $ | 12,398 | | | $ | 217,014 | |
| | | | | | | | | |
| CAPITAL SHARE ACTIVITY | | | | | | | | |
| Shares sold | | | 1,237,055 | | | | 1,984,210 | |
| Shares reinvested | | | 352,735 | | | | 608,762 | |
| Shares redeemed | | | (716,561 | ) | | | (1,663,594 | ) |
| Net increase in shares outstanding | | | 873,229 | | | | 929,378 | |
| Shares outstanding at beginning of period | | | 18,883,943 | | | | 17,954,565 | |
| Shares outstanding at end of period | | | 19,757,172 | | | | 18,883,943 | |
See accompanying notes to financial statements.
41
DAVENPORT VALUE & INCOME FUND
STATEMENTS OF CHANGES IN NET ASSETS |
| | | Six Months
Ended
September 30,
2017
(Unaudited) | | | Year
Ended
March 31,
2017 | |
| FROM OPERATIONS | | | | | | |
| Net investment income | | $ | 5,734,426 | | | $ | 9,982,919 | |
| Net realized gains from investment transactions | | | 6,883,674 | | | | 16,183,568 | |
| Net change in unrealized appreciation (depreciation) on investments | | | 31,540,804 | | | | 38,662,873 | |
| Net increase in net assets from operations | | | 44,158,904 | | | | 64,829,360 | |
| | | | | | | | | |
| DISTRIBUTIONS TO SHAREHOLDERS (Note 2) | | | | | | | | |
| From net investment income | | | (5,514,952 | ) | | | (10,351,557 | ) |
| From net realized gains from investment transactions | | | (7,889,954 | ) | | | (2,019,752 | ) |
| Decrease in net assets from distributions to shareholders | | | (13,404,906 | ) | | | (12,371,309 | ) |
| | | | | | | | | |
| FROM CAPITAL SHARE TRANSACTIONS | | | | | | | | |
| Proceeds from shares sold | | | 33,981,922 | | | | 93,632,084 | |
| Net asset value of shares issued in reinvestment of distributions to shareholders | | | 12,410,692 | | | | 11,182,949 | |
| Payments for shares redeemed | | | (24,097,025 | ) | | | (45,724,605 | ) |
| Net increase in net assets from capital share transactions | | | 22,295,589 | | | | 59,090,428 | |
| | | | | | | | | |
TOTAL INCREASE IN NET ASSETS | | | 53,049,587 | | | | 111,548,479 | |
| | | | | | | | |
| NET ASSETS | | | | | | | | |
| Beginning of period | | | 561,995,420 | | | | 450,446,941 | |
| End of period | | $ | 615,045,007 | | | $ | 561,995,420 | |
| | | | | | | | | |
ACCUMULATED NET INVESTMENT INCOME | | $ | 326,341 | | | $ | 106,867 | |
| | | | | | | | | |
| CAPITAL SHARE ACTIVITY | | | | | | | | |
| Shares sold | | | 2,093,844 | | | | 6,158,551 | |
| Shares reinvested | | | 763,869 | | | | 732,233 | |
| Shares redeemed | | | (1,481,964 | ) | | | (2,988,790 | ) |
| Net increase in shares outstanding | | | 1,375,749 | | | | 3,901,994 | |
| Shares outstanding at beginning of period | | | 35,186,905 | | | | 31,284,911 | |
| Shares outstanding at end of period | | | 36,562,654 | | | | 35,186,905 | |
See accompanying notes to financial statements.
42
DAVENPORT EQUITY OPPORTUNITIES FUND
STATEMENTS OF CHANGES IN NET ASSETS |
| | | Six Months
Ended
September 30,
2017
(Unaudited) | | | Year
Ended
March 31,
2017 | |
| FROM OPERATIONS | | | | | | |
| Net investment income (loss) | | $ | (377,624 | ) | | $ | 11,025 | |
| Net realized gains (losses) from investment transactions | | | 5,405,833 | | | | (7,505,581 | ) |
| Net change in unrealized appreciation (depreciation) on investments | | | 34,894,338 | | | | 32,069,088 | |
| Net increase in net assets from operations | | | 39,922,547 | | | | 24,574,532 | |
| | | | | | | | | |
| DISTRIBUTIONS TO SHAREHOLDERS (Note 2) | | | | | | | | |
| From net realized gains from investment transactions | | | — | | | | (4,091,481 | ) |
| | | | | | | | | |
| FROM CAPITAL SHARE TRANSACTIONS | | | | | | | | |
| Proceeds from shares sold | | | 17,209,330 | | | | 44,607,738 | |
| Net asset value of shares issued in reinvestment of distributions to shareholders | | | — | | | | 3,934,296 | |
| Payments for shares redeemed | | | (21,062,000 | ) | | | (34,059,381 | ) |
| Net increase (decrease) in net assets from capital share transactions | | | (3,852,670 | ) | | | 14,482,653 | |
| | | | | | | | | |
TOTAL INCREASE IN NET ASSETS | | | 36,069,877 | | | | 34,965,704 | |
| | | | | | | | |
| NET ASSETS | | | | | | | | |
| Beginning of period | | | 351,753,730 | | | | 316,788,026 | |
| End of period | | $ | 387,823,607 | | | $ | 351,753,730 | |
| | | | | | | | | |
ACCUMULATED NET INVESTMENT LOSS | | $ | (439,422 | ) | | $ | (61,798 | ) |
| | | | | | | | | |
| CAPITAL SHARE ACTIVITY | | | | | | | | |
| Shares sold | | | 1,055,575 | | | | 2,965,904 | |
| Shares reinvested | | | — | | | | 273,025 | |
| Shares redeemed | | | (1,287,600 | ) | | | (2,258,343 | ) |
| Net increase (decrease) in shares outstanding | | | (232,025 | ) | | | 980,586 | |
| Shares outstanding at beginning of period | | | 22,485,655 | | | | 21,505,069 | |
| Shares outstanding at end of period | | | 22,253,630 | | | | 22,485,655 | |
See accompanying notes to financial statements.
43
DAVENPORT SMALL CAP FOCUS FUND
STATEMENTS OF CHANGES IN NET ASSETS |
| | | Six Months
Ended
September 30,
2017
(Unaudited) | | | Year
Ended
March 31,
2017 | |
| FROM OPERATIONS | | | | | | |
| Net investment income | | $ | 14,848 | | | $ | 48,148 | |
| Net realized gains from investment transactions | | | 319,578 | | | | 3,550,036 | |
| Net change in unrealized appreciation (depreciation) on investments | | | 5,921,724 | | | | 10,113,696 | |
| Net increase in net assets from operations | | | 6,256,150 | | | | 13,711,880 | |
| | | | | | | | | |
| DISTRIBUTIONS TO SHAREHOLDERS (Note 2) | | | | | | | | |
| From net realized gains from investment transactions | | | (1,026,499 | ) | | | — | |
| | | | | | | | | |
| FROM CAPITAL SHARE TRANSACTIONS | | | | | | | | |
| Proceeds from shares sold | | | 12,345,709 | | | | 25,623,926 | |
| Net asset value of shares issued in reinvestment of distributions to shareholders | | | 1,000,642 | | | | — | |
| Payments for shares redeemed | | | (2,605,037 | ) | | | (4,025,524 | ) |
| Net increase in net assets from capital share transactions | | | 10,741,314 | | | | 21,598,402 | |
| | | | | | | | | |
TOTAL INCREASE IN NET ASSETS | | | 15,970,965 | | | | 35,310,282 | |
| | | | | | | | | |
| NET ASSETS | | | | | | | | |
| Beginning of period | | | 74,946,344 | | | | 39,636,062 | |
| End of period | | $ | 90,917,309 | | | $ | 74,946,344 | |
| | | | | | | | | |
ACCUMULATED NET INVESTMENT INCOME | | $ | 87,093 | | | $ | 72,245 | |
| | | | | | | | |
| CAPITAL SHARE ACTIVITY | | | | | | | | |
| Shares sold | | | 1,013,246 | | | | 2,310,823 | |
| Shares reinvested | | | 82,493 | | | | — | |
| Shares redeemed | | | (214,848 | ) | | | (378,052 | ) |
| Net increase in shares outstanding | | | 880,891 | | | | 1,932,771 | |
| Shares outstanding at beginning of period | | | 6,178,192 | | | | 4,245,421 | |
| Shares outstanding at end of period | | | 7,059,083 | | | | 6,178,192 | |
See accompanying notes to financial statements.
44
DAVENPORT BALANCED INCOME FUND
STATEMENTS OF CHANGES IN NET ASSETS |
| | | Six Months
Ended
September 30,
2017
(Unaudited) | | | Year
Ended
March 31,
2017 | |
| FROM OPERATIONS | | | | | | |
| Net investment income | | $ | 888,381 | | | $ | 776,273 | |
| Net realized gains from investment transactions | | | 370,007 | | | | 406,386 | |
| Net change in unrealized appreciation (depreciation) on investments | | | 3,164,606 | | | | 3,029,684 | |
| Net increase in net assets from operations | | | 4,422,994 | | | | 4,212,343 | |
| | | | | | | | | |
| DISTRIBUTIONS TO SHAREHOLDERS (Note 2) | | | | | | | | |
| From net investment income | | | (866,343 | ) | | | (669,199 | ) |
| From net realized gains from investment transactions | | | (392,851 | ) | | | — | |
| Decrease in net assets from distributions to shareholders | | | (1,259,194 | ) | | | (669,199 | ) |
| | | | | | | | | |
| FROM CAPITAL SHARE TRANSACTIONS | | | | | | | | |
| Proceeds from shares sold | | | 25,102,633 | | | | 67,653,140 | |
| Net asset value of shares issued in reinvestment of distributions to shareholders | | | 1,177,262 | | | | 615,079 | |
| Payments for shares redeemed | | | (5,555,484 | ) | | | (6,278,207 | ) |
| Net increase in net assets from capital share transactions | | | 20,724,411 | | | | 61,990,012 | |
| | | | | | | | | |
TOTAL INCREASE IN NET ASSETS | | | 23,888,211 | | | | 65,533,156 | |
| | | | | | | | | |
| NET ASSETS | | | | | | | | |
| Beginning of period | | | 83,418,632 | | | | 17,885,476 | |
| End of period | | $ | 107,306,843 | | | $ | 83,418,632 | |
| | | | | | | | | |
ACCUMULATED NET INVESTMENT INCOME | | $ | 121,183 | | | $ | 99,145 | |
| | | | | | | | | |
| CAPITAL SHARE ACTIVITY | | | | | | | | |
| Shares sold | | | 2,259,532 | | | | 6,359,948 | |
| Shares reinvested | | | 105,398 | | | | 57,130 | |
| Shares redeemed | | | (498,086 | ) | | | (585,286 | ) |
| Net increase in shares outstanding | | | 1,866,844 | | | | 5,831,792 | |
| Shares outstanding at beginning of period | | | 7,573,028 | | | | 1,741,236 | |
| Shares outstanding at end of period | | | 9,439,872 | | | | 7,573,028 | |
See accompanying notes to financial statements.
45
DAVENPORT CORE FUND
FINANCIAL HIGHLIGHTS |
| Selected Per Share Data and Ratios for a Share Outstanding Throughout Each Period |
| | Six Months
Ended Sept. 30, | | | Years Ended March 31, | |
| | | 2017(Unaudited) | | | 2017 | | | 2016 | | | 2015 | | | 2014 | | | 2013 | |
| Net asset value at beginning of period | | $ | 21.15 | | | $ | 18.78 | | | $ | 20.02 | | | $ | 19.30 | | | $ | 16.75 | | | $ | 15.00 | |
| | | | | | | | | | | | | | | | | | | | | | | | | |
| Income (loss) from investment operations: | | | | | | | | | | | | | | | | | | | | | | | | |
| Net investment income | | | 0.06 | | | | 0.11 | | | | 0.11 | | | | 0.10 | | | | 0.12 | | | | 0.11 | |
| Net realized and unrealized gains (losses) on investments | | | 1.45 | | | | 2.92 | | | | (0.56 | ) | | | 2.20 | | | | 3.39 | | | | 1.75 | |
| Total from investment operations | | | 1.51 | | | | 3.03 | | | | (0.45 | ) | | | 2.30 | | | | 3.51 | | | | 1.86 | |
| | | | | | | | | | | | | | | | | | | | | | | | | |
| Less distributions: | | | | | | | | | | | | | | | | | | | | | | | | |
| Dividends from net investment income | | | (0.07 | ) | | | (0.10 | ) | | | (0.11 | ) | | | (0.10 | ) | | | (0.12 | ) | | | (0.11 | ) |
| Distributions from net realized gains | | | (0.34 | ) | | | (0.56 | ) | | | (0.68 | ) | | | (1.48 | ) | | | (0.84 | ) | | | — | |
| Total distributions | | | (0.41 | ) | | | (0.66 | ) | | | (0.79 | ) | | | (1.58 | ) | | | (0.96 | ) | | | (0.11 | ) |
| | | | | | | | | | | | | | | | | | | | | | | | | |
| Net asset value at end of period | | $ | 22.25 | | | $ | 21.15 | | | $ | 18.78 | | | $ | 20.02 | | | $ | 19.30 | | | $ | 16.75 | |
| | | | | | | | | | | | | | | | | | | | | | | | | |
Total return (a) | | | 7.20 | %(b) | | | 16.56 | % | | | (2.39 | %) | | | 12.42 | % | | | 21.32 | % | | | 12.47 | % |
| | | | | | | | | | | | | | | | | | | | | | | | | |
| Net assets at end of period (000’s) | | $ | 439,572 | | | $ | 399,432 | | | $ | 337,229 | | | $ | 330,687 | | | $ | 281,231 | | | $ | 210,899 | |
| | | | | | | | | | | | | | | | | | | | | | | | | |
| Ratio of total expenses to average net assets | | | 0.89 | %(c) | | | 0.90 | % | | | 0.92 | % | | | 0.93 | % | | | 0.94 | % | | | 0.95 | % |
| | | | | | | | | | | | | | | | | | | | | | | | | |
| Ratio of net investment income to average net assets | | | 0.56 | %(c) | | | 0.56 | % | | | 0.56 | % | | | 0.49 | % | | | 0.64 | % | | | 0.71 | % |
| | | | | | | | | | | | | | | | | | | | | | | | | |
| Portfolio turnover rate | | | 7 | %(b) | | | 23 | % | | | 23 | % | | | 21 | % | | | 29 | % | | | 26 | % |
(a) | Total return is a measure of the change in value of an investment in the Fund over the periods covered, which assumes any dividends or capital gains distributions are reinvested in shares of the Fund. Returns shown do not reflect the deduction of taxes a shareholder would pay on Fund distributions or the redemption of Fund shares. |
See accompanying notes to financial statements.
46
DAVENPORT VALUE & INCOME FUND
FINANCIAL HIGHLIGHTS |
| Selected Per Share Data and Ratios for a Share Outstanding Throughout Each Period |
| | Six Months
Ended Sept. 30, | | | Years Ended March 31, | |
| | | 2017(Unaudited) | | | 2017 | | | 2016 | | | 2015 | | | 2014 | | | 2013 | |
| Net asset value at beginning of period | | $ | 15.97 | | | $ | 14.40 | | | $ | 15.46 | | | $ | 14.71 | | | $ | 13.18 | | | $ | 11.51 | |
| | | | | | | | | | | | | | | | | | | | | | | | | |
| Income (loss) from investment operations: | | | | | | | | | | | | | | | | | | | | | | | | |
| Net investment income | | | 0.16 | | | | 0.30 | | | | 0.29 | | | | 0.25 | | | | 0.30 | | | | 0.28 | |
| Net realized and unrealized gains (losses) on investments | | | 1.06 | | | | 1.64 | | | | (0.36 | ) | | | 1.45 | | | | 2.04 | | | | 1.81 | |
| Total from investment operations | | | 1.22 | | | | 1.94 | | | | (0.07 | ) | | | 1.70 | | | | 2.34 | | | | 2.09 | |
| | | | | | | | | | | | | | | | | | | | | | | | |
| Less distributions: | | | | | | | | | | | | | | | | | | | | | | | | |
| Dividends from net investment income | | | (0.15 | ) | | | (0.31 | ) | | | (0.29 | ) | | | (0.25 | ) | | | (0.29 | ) | | | (0.27 | ) |
| Distributions from net realized gains | | | (0.22 | ) | | | (0.06 | ) | | | (0.70 | ) | | | (0.70 | ) | | | (0.52 | ) | | | (0.15 | ) |
| Total distributions | | | (0.37 | ) | | | (0.37 | ) | | | (0.99 | ) | | | (0.95 | ) | | | (0.81 | ) | | | (0.42 | ) |
| | | | | | | | | | | | | | | | | | | | | | | | | |
| Net asset value at end of period | | $ | 16.82 | | | $ | 15.97 | | | $ | 14.40 | | | $ | 15.46 | | | $ | 14.71 | | | $ | 13.18 | |
| | | | | | | | | | | | | | | | | | | | | | | | | |
Total return (a) | | | 7.76 | %(b) | | | 13.60 | % | | | (0.46 | %) | | | 11.92 | % | | | 18.25 | % | | | 18.69 | % |
| | | | | | | | | | | | | | | | | | | | | | | | | |
| Net assets at end of period (000’s) | | $ | 615,045 | | | $ | 561,995 | | | $ | 450,447 | | | $ | 407,777 | | | $ | 304,288 | | | $ | 196,890 | |
| | | | | | | | | | | | | | | | | | | | | | | | | |
| Ratio of total expenses to average net assets | | | 0.89 | %(c) | | | 0.89 | % | | | 0.91 | % | | | 0.92 | % | | | 0.94 | % | | | 0.96 | % |
| | | | | | | | | | | | | | | | | | | | | | | | |
| Ratio of net investment income to average net assets | | | 1.95 | %(c) | | | 1.96 | % | | | 2.03 | % | | | 1.66 | % | | | 2.22 | % | | | 2.37 | % |
| | | | | | | | | | | | | | | | | | | | | | | | |
| Portfolio turnover rate | | | 8 | %(b) | | | 26 | % | | | 25 | % | | | 23 | % | | | 32 | % | | | 29 | % |
(a) | Total return is a measure of the change in value of an investment in the Fund over the periods covered, which assumes any dividends or capital gains distributions are reinvested in shares of the Fund. Returns shown do not reflect the deduction of taxes a shareholder would pay on Fund distributions or the redemption of Fund shares. |
See accompanying notes to financial statements.
47
DAVENPORT EQUITY OPPORTUNITIES FUND
FINANCIAL HIGHLIGHTS |
| Selected Per Share Data and Ratios for a Share Outstanding Throughout Each Period |
| | Six Months
Ended
Sept. 30, | | | Years Ended March 31, | |
| | | 2017
(Unaudited) | | | 2017 | | | 2016 | | | 2015 | | | 2014 | | | 2013 | |
| Net asset value at beginning of period | | $ | 15.64 | | | $ | 14.73 | | | $ | 16.61 | | | $ | 15.91 | | | $ | 13.86 | | | $ | 11.96 | |
| | | | | | | | | | | | | | | | | | | | | | | | | |
| Income (loss) from investment operations: | | | | | | | | | | | | | | | | | | | | | | | | |
| Net investment income (loss) | | | (0.02 | ) | | | 0.00 | (a) | | | 0.00 | (a) | | | 0.04 | | | | 0.24 | | | | 0.03 | |
| Net realized and unrealized gains (losses) on investments | | | 1.81 | | | | 1.10 | | | | (1.14 | ) | | | 2.42 | | | | 2.65 | | | | 2.17 | |
| Total from investment operations | | | 1.79 | | | | 1.10 | | | | (1.14 | ) | | | 2.46 | | | | 2.89 | | | | 2.20 | |
| | | | | | | | | | | | | | | | | | | | | | | | | |
| Less distributions: | | | | | | | | | | | | | | | | | | | | | | | | |
| Dividends from net investment income | | | — | | | | — | | | | (0.01 | ) | | | (0.26 | ) | | | (0.02 | ) | | | (0.02 | ) |
| Distributions from net realized gains | | | — | | | | (0.19 | ) | | | (0.73 | ) | | | (1.50 | ) | | | (0.82 | ) | | | (0.28 | ) |
| Total distributions | | | — | | | | (0.19 | ) | | | (0.74 | ) | | | (1.76 | ) | | | (0.84 | ) | | | (0.30 | ) |
| | | | | | | | | | | | | | | | | | | | | | | | | |
| Net asset value at end of period | | $ | 17.43 | | | $ | 15.64 | | | $ | 14.73 | | | $ | 16.61 | | | $ | 15.91 | | | $ | 13.86 | |
| | | | | | | | | | | | | | | | | | | | | | | | | |
Total return (b) | | | 11.44 | %(c) | | | 7.57 | % | | | (7.07 | %) | | | 16.67 | % | | | 21.57 | % | | | 18.77 | % |
| | | | | | | | | | | | | | | | | | | | | | | | | |
| Net assets at end of period (000’s) | | $ | 387,824 | | | $ | 351,754 | | | $ | 316,788 | | | $ | 277,703 | | | $ | 174,489 | | | $ | 102,679 | |
| | | | | | | | | | | | | | | | | | | | | | | | | |
| Ratio of total expenses to average net assets | | | 0.92 | %(d) | | | 0.92 | % | | | 0.93 | % | | | 0.96 | % | | | 0.97 | % | | | 1.01 | % |
| | | | | | | | | | | | | | | | | | | | | | | | | |
| Ratio of net investment income (loss) to average net assets | | | (0.21 | %)(d) | | | 0.00 | %(e) | | | 0.02 | % | | | 0.33 | % | | | 1.96 | % | | | 0.23 | % |
| | | | | | | | | | | | | | | | | | | | | | | | | |
| Portfolio turnover rate | | | 9 | %(c) | | | 23 | % | | | 29 | % | | | 31 | % | | | 49 | % | | | 41 | % |
(a) | Amount rounds to less than $0.01 per share. |
(b) | Total return is a measure of the change in value of an investment in the Fund over the periods covered, which assumes any dividends or capital gains distributions are reinvested in shares of the Fund. Returns shown do not reflect the deduction of taxes a shareholder would pay on Fund distributions or the redemption of Fund shares. |
(e) | Amount rounds to less than 0.01%. |
See accompanying notes to financial statements.
48
DAVENPORT SMALL CAP FOCUS FUND
FINANCIAL HIGHLIGHTS |
| Selected Per Share Data and Ratios for a Share Outstanding Throughout Each Period |
| | | Six Months
Ended
Sept. 30,
2017
(Unaudited) | | | Year
Ended March 31, 2017 | | | Year
Ended March 31, 2016 | | | Period
Ended
March 31,
2015 (a) | |
| Net asset value at beginning of period | | $ | 12.13 | | | $ | 9.34 | | | $ | 10.41 | | | $ | 10.00 | |
| | | | | | | | | | | | | | | | | |
| Income (loss) from investment operations: | | | | | | | | | | | | | | | | |
| Net investment income (loss) | | | 0.00 | (b) | | | 0.02 | | | | 0.01 | | | | (0.01 | ) |
| Net realized and unrealized gains (losses) on investments | | | 0.90 | | | | 2.77 | | | | (1.07 | ) | | | 0.42 | |
| Total from investment operations | | | 0.90 | | | | 2.79 | | | | (1.06 | ) | | | 0.41 | |
| | | | | | | | | | | | | | | | | |
| Less distributions: | | | | | | | | | | | | | | | | |
| Distributions from net realized gains | | | (0.15 | ) | | | — | | | | (0.01 | ) | | | — | |
| | | | | | | | | | | | | | | | | |
| Net asset value at end of period | | $ | 12.88 | | | $ | 12.13 | | | $ | 9.34 | | | $ | 10.41 | |
| | | | | | | | | | | | | | | | | |
Total return (c) | | | 7.53 | %(d) | | | 29.87 | % | | | (10.19 | %) | | | 4.10 | %(d) |
| | | | | | | | | | | | | | | | | |
| Net assets at end of period (000’s) | | $ | 90,917 | | | $ | 74,946 | | | $ | 39,636 | | | $ | 31,291 | |
| | | | | | | | | | | | | | | | | |
| Ratio of net expenses to average net assets | | | 1.00 | %(e) | | | 1.06 | % | | | 1.15 | % | | | 1.25 | %(e)(f) |
| | | | | | | | | | | | | | | | | |
| Ratio of net investment income (loss) to average net assets | | | 0.04 | %(e) | | | 0.09 | % | | | 0.14 | % | | | (0.30 | %)(e)(g) |
| | | | | | | | | | | | | | | | | |
| Portfolio turnover rate | | | 15 | %(d) | | | 37 | % | | | 48 | % | | | 15 | %(d) |
(a) | Represents the period from commencement of operations (December 31, 2014) through March 31, 2015. |
(b) | Amount rounds to less than $0.01 per share. |
(c) | Total return is a measure of the change in value of an investment in the Fund over the periods covered, which assumes any dividends or capital gains distributions are reinvested in shares of the Fund. Returns shown do not reflect the deduction of taxes a shareholder would pay on Fund distributions or the redemption of Fund shares. |
(f) | Absent advisory fee reductions, the ratio of total expenses to average net assets would have been 1.42%(e) for the period ended March 31, 2015 (Note 4). |
(g) | Ratio was determined after advisory fee reductions. |
See accompanying notes to financial statements.
49
DAVENPORT BALANCED INCOME FUND
FINANCIAL HIGHLIGHTS |
| Selected Per Share Data and Ratios for a Share Outstanding Throughout Each Period |
| | | Six Months
Ended
Sept. 30,
2017
(Unaudited) | | | Year
Ended
March 31, 2017 | | | Period
Ended
March 31,
2016 (a) | |
| Net asset value at beginning of period | | $ | 11.02 | | | $ | 10.27 | | | $ | 10.00 | |
| | | | | | | | | | | | | |
| Income from investment operations: | | | | | | | | | | | | |
| Net investment income | | | 0.10 | | | | 0.14 | | | | 0.03 | |
| Net realized and unrealized gains on investments | | | 0.40 | | | | 0.74 | | | | 0.26 | |
| Total from investment operations | | | 0.50 | | | | 0.88 | | | | 0.29 | |
| | | | | | | | | | | | |
| Less distributions: | | | | | | | | | | | | |
| Dividends from net investment income | | | (0.10 | ) | | | (0.13 | ) | | | (0.02 | ) |
| Distributions from net realized gains | | | (0.05 | ) | | | — | | | | — | |
| Total distributions | | | (0.15 | ) | | | (0.13 | ) | | | (0.02 | ) |
| | | | | | | | | | | | | |
| Net asset value at end of period | | $ | 11.37 | | | $ | 11.02 | | | $ | 10.27 | |
| | | | | | | | | | | | | |
Total return (b) | | | 4.49 | %(c) | | | 8.59 | % | | | 2.90 | %(c) |
| | | | | | | | | | | | | |
| Net assets at end of period (000’s) | | $ | 107,307 | | | $ | 83,419 | | | $ | 17,885 | |
| | | | | | | | | | | | | |
| Ratio of net expenses to average net assets | | | 0.98 | %(e) | | | 1.13 | %(d) | | | 1.25 | %(e)(f) |
| | | | | | | | | | | | | |
| Ratio of net investment income to average net assets | | | 1.83 | %(e) | | | 1.55 | % | | | 1.65 | %(e)(g) |
| | | | | | | | | | | | | |
| Portfolio turnover rate | | | 10 | %(c) | | | 16 | % | | | 7 | %(c) |
(a) | Represents the period from commencement of operations (December 31, 2015) through March 31, 2016. |
(b) | Total return is a measure of the change in value of an investment in the Fund over the periods covered, which assumes any dividends or capital gains distributions are reinvested in shares of the Fund. Returns shown do not reflect the deduction of taxes a shareholder would pay on Fund distributions or the redemption of Fund shares. |
(d) | Absent advisory fee reductions recouped by the Adviser, the ratio of net expenses to average net assets would have been 1.08% for the year ended March 31, 2017 (Note 4). |
(f) | Absent advisory fee reductions and expense reimbursements, the ratio of total expenses to average net assets would have been 2.25%(e) for the period ended March 31, 2016 (Note 4). |
(g) | Ratio was determined after advisory fee reductions and expense reimbursements. |
See accompanying notes to financial statements.
50
THE DAVENPORT FUNDS
NOTES TO FINANCIAL STATEMENTS
September 30, 2017 (Unaudited)
1. Organization
Davenport Core Fund, Davenport Value & Income Fund, Davenport Equity Opportunities Fund, Davenport Small Cap Focus Fund and Davenport Balanced Income Fund (individually, a “Fund,” and, collectively, the “Funds”) are each a no-load series of the Williamsburg Investment Trust (the “Trust”), an open-end management investment company registered under the Investment Company Act of 1940, as amended. The Trust was organized as a Massachusetts business trust on July 18, 1988. Other series of the Trust are not incorporated in this report. Davenport Core Fund began operations on January 15, 1998. Davenport Value & Income Fund and Davenport Equity Opportunities Fund each began operations on December 31, 2010. Davenport Small Cap Focus Fund began operations on December 31, 2014. Davenport Balanced Income Fund began operations on December 31, 2015.
Davenport Core Fund’s investment objective is long term growth of capital.
Davenport Value & Income Fund’s investment objective is to achieve long term growth while generating current income through dividend payments on portfolio securities.
Davenport Equity Opportunities Fund’s investment objective is long term capital appreciation.
Davenport Small Cap Focus Fund’s investment objective is long term capital appreciation.
Davenport Balanced Income Fund’s investment objective is current income and an opportunity for long term growth.
Davenport Core Fund, Davenport Value & Income Fund and Davenport Balanced Income Fund are each classified as a diversified fund. Davenport Equity Opportunities Fund and Davenport Small Cap Focus Fund are each classified as a non-diversified fund.
2. Significant Accounting Policies
In October 2016, the U.S. Securities and Exchange Commission (the “SEC”) adopted amendments to Regulation S-X, which impact financial statement presentation, particularly the presentation of derivative investments. The Funds have adopted these amendments, which were effective August 1, 2017, with these financial statements.
Each Fund follows accounting and reporting guidance under Financial Accounting Standards Board Accounting Standards Codification Topic 946, “Financial Services – Investment Companies.” The following is a summary of the Funds’ significant accounting policies. The policies are in conformity with accounting principles generally accepted in the United States of America (“GAAP”).
Securities valuation — The Funds’ portfolio securities are valued as of the close of business of the regular session of the New York Stock Exchange (normally 4:00 p.m., Eastern time). Securities traded on a national stock exchange, including common stocks and exchange-traded funds, are valued based upon the closing price on the principal exchange where the security is traded, if available, otherwise, at the last quoted bid price. Securities that are quoted by NASDAQ
51
THE DAVENPORT FUNDS
NOTES TO FINANCIAL STATEMENTS (Continued)
are valued at the NASDAQ Official Closing Price. Investments representing shares of other open-end investment companies, including money market funds, are valued at their net asset value (“NAV”) as reported by such companies. When using a quoted price and when the market is considered active, securities will be classified as Level 1 within the fair value hierarchy.
Fixed income securities, including corporate bonds, are typically valued on the basis of prices provided by an independent pricing service. The prices provided by the pricing service are determined with consideration given to institutional bid and last sale prices and take into account securities prices, yields, maturities, call features, ratings, institutional trading in similar groups of securities, and developments related to specific securities. Given the inputs used by the pricing service, these securities are classified as Level 2 within the fair value hierarchy.
When market quotations are not readily available, if a pricing service cannot provide a price, or the investment adviser believes the price received from the pricing service is not indicative of market value, securities will be valued in good faith at fair value using methods consistent with procedures adopted by the Board of Trustees and will be classified as Level 2 or 3 within the fair value hierarchy (see below), depending on the inputs used. Such methods of fair valuation may include, but are not limited to: multiple of earnings, multiple of book value, discount from market of a similar freely traded security, purchase price of the security, subsequent private transactions in the security or related securities, or a combination of these and other factors.
GAAP establishes a single authoritative definition of fair value, sets out a framework for measuring fair value and requires additional disclosures about fair value measurements.
Various inputs are used in determining the value of the Funds’ investments. These inputs are summarized in the three broad levels listed below:
● Level 1 – quoted prices in active markets for identical securities
● Level 2 – other significant observable inputs
● Level 3 – significant unobservable inputs
The inputs or methodology used for valuing securities are not necessarily an indication of the risks associated with investing in those securities. The inputs used to measure fair value may fall into different levels of the fair value hierarchy. In such cases, for disclosure purposes, the level in the fair value hierarchy within which the fair value measurement falls in its entirety is determined based on the lowest level input that is significant to the fair value measurement.
The following is a summary of the inputs used to value the Funds’ investments as of September 30, 2017, by security type:
| Davenport Core Fund | | Level 1 | | | Level 2 | | | Level 3 | | | Total | |
| Common Stocks | | $ | 413,621,829 | | | $ | — | | | $ | — | | | $ | 413,621,829 | |
| Exchange-Traded Funds | | | 14,386,410 | | | | — | | | | — | | | | 14,386,410 | |
| Money Market Funds | | | 6,359,738 | | | | — | | | | — | | | | 6,359,738 | |
| Total | | $ | 434,367,977 | | | $ | — | | | $ | — | | | $ | 434,367,977 | |
52
THE DAVENPORT FUNDS
NOTES TO FINANCIAL STATEMENTS (Continued)
| Davenport Value & Income Fund | | Level 1 | | | Level 2 | | | Level 3 | | | Total | |
| Common Stocks | | $ | 566,913,409 | | | $ | — | | | $ | — | | | $ | 566,913,409 | |
| Exchange-Traded Funds | | | 21,474,531 | | | | — | | | | — | | | | 21,474,531 | |
| Money Market Funds | | | 25,764,042 | | | | — | | | | — | | | | 25,764,042 | |
| Total | | $ | 614,151,982 | | | $ | — | | | $ | — | | | $ | 614,151,982 | |
| Davenport Equity Opportunities Fund | | Level 1 | | | Level 2 | | | Level 3 | | | Total | |
| Common Stocks | | $ | 386,086,461 | | | $ | — | | | $ | — | | | $ | 386,086,461 | |
| Money Market Funds | | | 1,894,056 | | | | — | | | | — | | | | 1,894,056 | |
| Total | | $ | 387,980,517 | | | $ | — | | | $ | — | | | $ | 387,980,517 | |
| Davenport Small Cap Focus Fund | | Level 1 | | | Level 2 | | | Level 3 | | | Total | |
| Common Stocks | | $ | 87,793,059 | | | $ | — | | | $ | — | | | $ | 87,793,059 | |
| Money Market Funds | | | 2,857,748 | | | | — | | | | — | | | | 2,857,748 | |
| Total | | $ | 90,650,807 | | | $ | — | | | $ | — | | | $ | 90,650,807 | |
| Davenport Balanced Income Fund | | Level 1 | | | Level 2 | | | Level 3 | | | Total | |
| Common Stocks | | $ | 61,328,059 | | | $ | — | | | $ | — | | | $ | 61,328,059 | |
| Fixed Rate Corporate Bonds | | | — | | | | 28,565,277 | | | | — | | | | 28,565,277 | |
| Variable Rate Corporate Bonds | | | — | | | | 10,942,205 | | | | — | | | | 10,942,205 | |
| Exchange-Traded Funds | | | 1,977,916 | | | | — | | | | — | | | | 1,977,916 | |
| Money Market Funds | | | 4,062,058 | | | | — | | | | — | | | | 4,062,058 | |
| Total | | $ | 67,368,033 | | | $ | 39,507,482 | | | $ | — | | | $ | 106,875,515 | |
Refer to each Fund’s Schedule of Investments for a listing of the securities by sector type. As of September 30, 2017, the Funds did not have any transfers into or out of any Level. There were no Level 3 securities or derivative instruments held by the Funds as of September 30, 2017. It is the Funds’ policy to recognize transfers into or out of any Level at the end of the reporting period.
Share valuation — The NAV per share of each Fund is calculated daily by dividing the total value of its assets, less liabilities, by the number of shares outstanding. The offering price and redemption price per share of each Fund is equal to the NAV per share.
Investment income — Interest income is accrued as earned. Discounts and premiums on fixed-income securities are amortized using the interest method. Dividend income is recorded on the ex-dividend date. Withholding taxes on foreign dividends have been recorded in accordance with the Funds’ understanding of the applicable country’s rules and tax rates.
Investment transactions — Investment transactions are accounted for on trade date for financial reporting purposes. Realized gains and losses on securities sold are determined on a specific identification basis.
53
THE DAVENPORT FUNDS
NOTES TO FINANCIAL STATEMENTS (Continued)
Common expenses — Common expenses of the Trust are allocated among the series of the Trust based on relative net assets of each series or the nature of the services performed and the relative applicability to each series.
Distributions to shareholders — Dividends arising from net investment income, if any, are declared and paid quarterly to shareholders of Davenport Core Fund, Davenport Value & Income Fund, Davenport Small Cap Focus Fund and Davenport Balanced Income Fund; and declared and paid semi-annually to shareholders of Davenport Equity Opportunities Fund. Net realized short-term capital gains, if any, may be distributed throughout the year and net realized long-term capital gains, if any, are distributed at least once each year. The amount of distributions from net investment income and net realized capital gains are determined in accordance with federal income tax regulations, which may differ from GAAP. Dividends and distributions are recorded on the ex-dividend date.
The tax character of distributions paid during the periods ended September 30, 2017 and March 31, 2017 was as follows:
| Period
Ended | Ordinary
Income | Long-Term
Capital Gains | Total
Distributions |
| Davenport Core Fund | 09/30/17 | $ 1,379,638 | $ 6,519,646 | $ 7,899,284 |
| | 03/31/17 | $ 1,831,251 | $ 10,298,009 | $ 12,129,260 |
| Davenport Value & Income Fund | 09/30/17 | $ 5,514,952 | $ 7,889,954 | $ 13,404,906 |
| | 03/31/17 | $ 10,351,557 | $ 2,019,752 | $ 12,371,309 |
| Davenport Equity Opportunities Fund | 09/30/17 | $ — | $ — | $ — |
| | 03/31/17 | $ 56 | $ 4,091,425 | $ 4,091,481 |
| Davenport Small Cap Focus Fund | 09/30/17 | $ — | $ 1,026,499 | $ 1,026,499 |
| | 03/31/17 | $ — | $ — | $ — |
| Davenport Balanced Income Fund | 09/30/17 | $ 1,156,898 | $ 102,296 | $ 1,259,194 |
| | 03/31/17 | $ 669,199 | $ — | $ 669,199 |
Estimates — The preparation of financial statements in conformity with GAAP requires management to make estimates and assumptions that affect the reported amounts of assets and liabilities and disclosure of contingent assets and liabilities as of the date of the financial statements and the reported amounts of income and expenses during the reporting period. Actual results could differ from those estimates.
Federal income tax — Each Fund has qualified and intends to continue to qualify as a regulated investment company under the Internal Revenue Code of 1986, as amended (the “Code”). Qualification generally will relieve the Funds of liability for federal income taxes to the extent 100% of their net investment income and net realized capital gains are distributed in accordance with the Code.
54
THE DAVENPORT FUNDS
NOTES TO FINANCIAL STATEMENTS (Continued)
In order to avoid imposition of the excise tax applicable to regulated investment companies, it is also each Fund’s intention to declare as dividends in each calendar year at least 98% of its net investment income (earned during the calendar year) and 98.2% of its net realized capital gains (earned during the twelve months ended October 31) plus undistributed amounts from prior years.
The following information is computed on a tax basis for each item as of September 30, 2017:
| | | Davenport Core Fund | | | Davenport Value & Income Fund | | | Davenport Equity Opportunities Fund | |
| Cost of portfolio investments | | $ | 288,628,097 | | | $ | 490,233,744 | | | $ | 309,792,745 | |
| Gross unrealized appreciation | | $ | 150,448,506 | | | $ | 132,682,826 | | | $ | 90,637,382 | |
| Gross unrealized depreciation | | | (4,708,626 | ) | | | (8,764,588 | ) | | | (12,449,610 | ) |
| Net unrealized appreciation | | | 145,739,880 | | | | 123,918,238 | | | | 78,187,772 | |
| Capital loss carryforwards | | | — | | | | — | | | | (8,266,134 | ) |
| Accumulated ordinary income (loss) | | | 12,398 | | | | 326,341 | | | | (439,422 | ) |
| Accumulated capital and other gains | | | 4,700,973 | | | | 6,882,286 | | | | 5,405,833 | |
| Total accumulated earnings | | $ | 150,453,251 | | | $ | 131,126,865 | | | $ | 74,888,049 | |
| | | Davenport Small Cap Focus Fund | | | Davenport Balanced Income Fund | |
| Cost of portfolio investments | | $ | 75,505,054 | | | $ | 99,957,001 | |
| Gross unrealized appreciation | | $ | 18,393,727 | | | $ | 8,052,890 | |
| Gross unrealized depreciation | | | (3,247,974 | ) | | | (1,134,376 | ) |
| Net unrealized appreciation | | | 15,145,753 | | | | 6,918,514 | |
| Accumulated ordinary income (loss) | | | (56,104 | ) | | | 29,496 | |
| Accumulated capital and other gains | | | 334,756 | | | | 369,281 | |
| Total accumulated earnings | | $ | 15,424,405 | | | $ | 7,317,291 | |
The difference between the federal income tax cost of portfolio investments and the financial statement cost for each Fund is due to certain timing differences in the recognition of capital gains and losses under income tax regulations and GAAP. These timing differences are temporary in nature and are due to the tax deferral of losses on wash sales and adjustments to basis on publicly traded partnerships and passive foreign investment companies.
As of March 31, 2017, Davenport Equity Opportunities Fund had a short-term capital loss carryforward of $1,822,659 and a long-term capital loss carryforward of $6,443,475, for federal income tax purposes, which may be carried forward indefinitely. These capital loss carryforwards are available to offset net realized capital gains in the current and future years, thereby reducing future taxable gains distributions.
55
THE DAVENPORT FUNDS
NOTES TO FINANCIAL STATEMENTS (Continued)
The Funds recognize the tax benefits or expenses of uncertain tax positions only when the position is “more likely than not” to be sustained assuming examination by tax authorities. Management has reviewed the tax positions taken on Federal income tax returns for the current and all applicable open tax years (tax years ended March 31, 2014 through March 31, 2017) of each Fund and has concluded that no provision for unrecognized tax benefits or expenses is required in these financial statements.
3. Investment Transactions
Investment transactions, other than short-term investments and U.S. government securities, were as follows for the six months ended September 30, 2017:
| | | Davenport
Core Fund | | | Davenport
Value &
Income Fund | | | Davenport Equity Opportunities Fund | |
| Purchases of investment securities | | $ | 36,370,573 | | | $ | 59,575,506 | | | $ | 35,629,730 | |
| Proceeds from sales and maturities of investment securities | | $ | 28,883,838 | | | $ | 45,668,251 | | | $ | 34,025,387 | |
| | | Davenport Small Cap Focus Fund | | | Davenport Balanced Income Fund | |
| Purchases of investment securities | | $ | 20,117,352 | | | $ | 29,163,993 | |
| Proceeds from sales and maturities of investment securities | | $ | 11,802,430 | | | $ | 9,226,779 | |
4. Transactions with Related Parties
INVESTMENT ADVISORY AGREEMENTS
Each Fund’s investments are managed by Davenport & Company LLC (the “Adviser”) under the terms of an Investment Advisory Agreement. Under the Investment Advisory Agreement, each Fund pays the Adviser a fee, which is computed and accrued daily and paid monthly, at an annual rate of 0.75% of its average daily net assets. Certain officers and a Trustee of the Trust are also officers of the Adviser.
With respect to Davenport Small Cap Focus Fund and Davenport Balanced Income Fund, the Adviser has agreed, until August 1, 2018, to reduce its investment advisory fees and to reimburse other operating expenses to the extent necessary to limit total annual operating expenses (excluding acquired fund fees and expenses) of each such Fund to an amount not exceeding 1.25% of average daily net assets. Any such fee reductions by the Adviser, or payments by the Adviser of expenses which are a Fund’s obligation, are subject to repayment by the Funds for a period of three years from the end of the fiscal year when such fee reductions or expense reimbursements occurred, provided a Fund is able to effect such repayment and remain in compliance with the
56
THE DAVENPORT FUNDS
NOTES TO FINANCIAL STATEMENTS (Continued)
undertaking by the Adviser to limit expenses of the Fund. During the six months ended September 30, 2017, the Adviser was not required to reduce its advisory fees for Davenport Small Cap Focus Fund or Davenport Balanced Income Fund.
OTHER SERVICE PROVIDERS
Ultimus Fund Solutions, LLC (“Ultimus”) provides administration, fund accounting, compliance and transfer agent services to the Funds. The Funds pay Ultimus fees in accordance with the agreements for such services. In addition, the Funds pay out-of-pocket expenses including, but not limited to, postage, supplies, and costs of pricing the Funds’ portfolio securities. Certain officers of the Trust are also officers of Ultimus, or of Ultimus Fund Distributors, LLC (the “Distributor”), the principal underwriter of each Fund’s shares and an affiliate of Ultimus. The Distributor is compensated by the Adviser (not the Funds) for acting as principal underwriter.
COMPENSATION OF TRUSTEES
Trustees and officers affiliated with an investment adviser to the Trust or Ultimus are not compensated by the Trust for their services. Each Trustee who is not an affiliated person of an investment adviser or Ultimus receives from the Trust an annual retainer of $15,000, payable quarterly; a fee of $1,500 for attendance at each meeting of the Board of Trustees (except that such fee is $2,500 for the independent chair); and a fee of $1,000 for attendance at each meeting of any committee of the Board (except that such fee is $1,500 for the committee chair); plus reimbursement of travel and other expenses incurred in attending meetings. Each series of the Trust pays its proportionate share of such fees.
5. Sector Risk
If a Fund has significant investments in the securities of issuers in industries within a particular sector, any development affecting that sector will have a greater impact on the value of the net assets of the Fund than would be the case if the Fund did not have significant investments in that sector. In addition, this may increase the risk of loss of an investment in the Fund and increase the volatility of the Fund’s NAV per share. From time to time, circumstances may affect a particular sector and the companies within such sector. For instance, economic or market factors, regulation or deregulation, or other developments may negatively impact all companies in a particular sector and therefore the value of a Fund’s portfolio would be adversely affected. As of September 30, 2017, Davenport Equity Opportunities Fund had 33.8% of the value of its net assets invested in stocks within the Consumer Discretionary sector and Davenport Small Cap Focus Fund had 26.8% of the value of its net assets invested in stocks within the Industrials sector.
6. Contingencies and Commitments
The Funds indemnify the Trust’s officers and Trustees for certain liabilities that might arise from the performance of their duties to the Funds. Additionally, in the normal course of business the Funds enter into contracts that contain a variety of representations and warranties and which
57
THE DAVENPORT FUNDS
NOTES TO FINANCIAL STATEMENTS (Continued)
provide general indemnifications. The Funds’ maximum exposure under these arrangements is unknown, as this would involve future claims that may be made against the Funds that have not yet occurred. However, based on experience, the Funds expect the risk of loss to be remote.
7. Subsequent Events
The Funds are required to recognize in the financial statements the effects of all subsequent events that provide additional evidence about conditions that existed as of the date of the Statements of Assets and Liabilities. For non-recognized subsequent events that must be disclosed to keep the financial statements from being misleading, the Funds are required to disclose the nature of the event as well as an estimate of its financial effect, or a statement that such an estimate cannot be made. Management has evaluated subsequent events through the issuance of these financial statements and has noted no such events.
58
THE DAVENPORT FUNDS
YOUR FUNDS’ EXPENSES (Unaudited)
We believe it is important for you to understand the impact of costs on your investment. All mutual funds have operating expenses. As a shareholder of the Funds, you incur ongoing costs, including management fees and other expenses. These ongoing costs, which are deducted from each Fund’s gross income, directly reduce the investment return of the Funds.
A mutual fund’s ongoing costs are expressed as a percentage of its average net assets. This figure is known as the expense ratio. The following examples are intended to help you understand the ongoing costs (in dollars) of investing in the Funds and to compare these costs with the ongoing costs of investing in other mutual funds. The examples below are based on an investment of $1,000 made at the beginning of the period shown and held for the entire period (April 1, 2017 and held through September 30, 2017).
The table below illustrates each Fund’s ongoing costs in two ways:
Actual fund return – This section helps you to estimate the actual expenses that you paid over the period. The “Ending Account Value” shown is derived from each Fund’s actual return, and the fourth column shows the dollar amount of operating expenses that would have been paid by an investor who started with $1,000 in the Funds. You may use the information here, together with the amount you invested, to estimate the expenses that you paid over the period.
To do so, simply divide your account value by $1,000 (for example, an $8,600 account value divided by $1,000 = 8.6), then multiply the result by the number given for the applicable Fund under the heading “Expenses Paid During Period.”
Hypothetical 5% return – This section is intended to help you compare each Fund’s ongoing costs with those of other mutual funds. It assumes that each Fund had an annual return of 5% before expenses during the period shown, but that the expense ratio is unchanged. In this case, because the return used is not each Fund’s actual return, the results do not apply to your investment. The example is useful in making comparisons because the SEC requires all mutual funds to calculate expenses based on a 5% return. You can assess each Fund’s ongoing costs by comparing this hypothetical example with the hypothetical examples that appear in shareholder reports of other funds.
Note that expenses shown in the table are meant to highlight and help you compare ongoing costs only. The Funds do not charge sales loads or redemption fees.
The calculations assume no shares were bought or sold during the period. Your actual costs may have been higher or lower, depending on the amount of your investment and the timing of any purchases or redemptions.
More information about each Fund’s expenses, including historical annual expense ratios, can be found in this report. For additional information on operating expenses and other shareholder costs, please refer to the Funds’ prospectus.
59
THE DAVENPORT FUNDS
YOUR FUNDS’ EXPENSES (Unaudited) (Continued)
| Beginning
Account Value
April 1,
2017 | Ending
Account Value
September 30,
2017 | Expense
Ratio(a) | Expenses Paid
During Period(b) |
| Davenport Core Fund | | | | |
| Based on Actual Fund Return | $1,000.00 | $1,072.00 | 0.89% | $4.62 |
| Based on Hypothetical 5% Return (before expenses) | $1,000.00 | $1,020.61 | 0.89% | $4.51 |
| Davenport Value & Income Fund | | | | |
| Based on Actual Fund Return | $1,000.00 | $1,077.60 | 0.89% | $4.64 |
| Based on Hypothetical 5% Return (before expenses) | $1,000.00 | $1,020.61 | 0.89% | $4.51 |
| Davenport Equity Opportunities Fund |
| Based on Actual Fund Return | $1,000.00 | $1,114.40 | 0.92% | $4.88 |
| Based on Hypothetical 5% Return (before expenses) | $1,000.00 | $1,020.46 | 0.92% | $4.66 |
| Davenport Small Cap Focus Fund |
| Based on Actual Fund Return | $1,000.00 | $1,075.30 | 1.00% | $5.20 |
| Based on Hypothetical 5% Return (before expenses) | $1,000.00 | $1,020.05 | 1.00% | $5.06 |
| Davenport Balanced Income Fund |
| Based on Actual Fund Return | $1,000.00 | $1,044.90 | 0.98% | $5.02 |
| Based on Hypothetical 5% Return (before expenses) | $1,000.00 | $1,020.16 | 0.98% | $4.96 |
(a) | Annualized, based on the Fund’s most recent one-half year expenses. |
(b) | Expenses are equal to the Fund’s annualized expense ratio multiplied by the average account value over the period, multiplied by 183/365 (to reflect the one-half year period). |
60
THE DAVENPORT FUNDS
OTHER INFORMATION (Unaudited) |
A description of the policies and procedures that the Funds use to vote proxies relating to portfolio securities is available without charge upon request by calling toll-free 1-800-281-3217, or on the SEC’s website at http://www.sec.gov. Information regarding how the Funds voted proxies relating to portfolio securities during the most recent 12-month period ended June 30 is also available without charge upon request by calling toll-free 1-800-281-3217, or on the SEC’s website at http://www.sec.gov.
The Trust files a complete listing of portfolio holdings for each Fund with the SEC as of the end of the first and third quarters of each fiscal year on Form N-Q. These filings are available upon request by calling 1-800-281-3217. Furthermore, you may obtain a copy of these filings on the SEC’s website at http://www.sec.gov. The Trust’s Forms N-Q may also be reviewed and copied at the SEC’s Public Reference Room in Washington, DC, and information on the operation of the Public Reference Room may be obtained by calling 1-800-SEC-0330.
A complete listing of portfolio holdings for each Fund is updated daily and can be reviewed at the Funds’ website at http://www.investdavenport.com.
61
| FACTS | WHAT DO THE DAVENPORT FUNDS DO WITH YOUR PERSONAL INFORMATION? |
| | | | |
| Why? | Financial companies choose how they share your personal information. Federal law gives consumers the right to limit some but not all sharing. Federal law also requires us to tell you how we collect, share, and protect your personal information. Please read this notice carefully to understand what we do. |
| | | | |
| What? | The types of personal information we collect and share depend on the product or service you have with us. This information can include: ■ Social Security number ■ Assets ■ Retirement Assets ■ Transaction History ■ Checking Account Information ■ Purchase History ■ Account Balances ■ Account Transactions ■ Wire Transfer Instructions When you are no longer our customer, we continue to share your information as described in this notice. |
| | | | |
| How? | All financial companies need to share your personal information to run their everyday business. In the section below, we list the reasons financial companies can share their customers’ personal information; the reasons The Davenport Funds choose to share; and whether you can limit this sharing. |
| | | | |
| Reasons we can share your personal information | Do The Davenport Funds share? | Can you limit this sharing? |
For our everyday business purposes –
Such as to process your transactions, maintain your account(s), respond to court orders and legal investigations, or report to credit bureaus | Yes | No |
For our marketing purposes –
to offer our products and services to you | No | We don’t share |
| For joint marketing with other financial companies | No | We don’t share |
For our affiliates’ everyday business purposes – information about your creditworthiness | No | We don’t share |
| For nonaffiliates to market to you | No | We don’t share |
| | | | |
| Questions? | Call 1-800-281-3217 |
62
| Who we are |
| Who is providing this notice? | Williamsburg Investment Trust Ultimus Fund Distributors, LLC Ultimus Fund Solutions, LLC |
| What we do |
| How do The Davenport Funds protect my personal information? | To protect your personal information from unauthorized access and use, we use security measures that comply with federal law. These measures include computer safeguards and secured files and buildings. Our service providers are held accountable for adhering to strict policies and procedures to prevent any misuse of your nonpublic personal information. |
| How do The Davenport Funds collect my personal information? | We collect your personal information, for example, when you ■ Provide account information ■ Give us your contact information ■ Make deposits or withdrawals from your account ■ Make a wire transfer ■ Tell us where to send the money ■ Tell us who receives the money ■ Show your government-issued ID ■ Show your driver’s license We also collect your personal information from other companies. |
| Why can’t I limit all sharing? | Federal law gives you the right to limit only ■ Sharing for affiliates’ everyday business purposes – information about your creditworthiness ■ Affiliates from using your information to market to you ■ Sharing for nonaffiliates to market to you State laws and individual companies may give you additional rights to limit sharing. |
| | |
| Definitions |
| Affiliates | Companies related by common ownership or control. They can be financial and nonfinancial companies. ■ Davenport & Company LLC, the investment adviser to The Davenport Funds, could be deemed to be an affiliate. |
| Nonaffiliates | Companies not related by common ownership or control. They can be financial and nonfinancial companies ■ The Davenport Funds do not share with nonaffiliates so they can market to you |
| Joint marketing | A formal agreement between nonaffiliated financial companies that together market financial products or services to you. ■ The Davenport Funds don’t jointly market. |
63
This page intentionally left blank.
| THE DAVENPORT FUNDS Investment Adviser
Davenport & Company LLC
One James Center
901 East Cary Street
Richmond, Virginia 23219-4037 Administrator
Ultimus Fund Solutions, LLC
P.O. Box 46707
Cincinnati, Ohio 45246-0707
1-800-281-3217 Custodian
U.S. Bank, N.A.
425 Walnut Street
Cincinnati, Ohio 45202 Independent Registered Public
Accounting Firm
Cohen & Company, Ltd.
1350 Euclid Avenue
Suite 800
Cleveland, Ohio 44115 Legal Counsel
Sullivan & Worcester LLP
1666 K Street, N.W.
Washington, DC 20006 Board of Trustees
Robert S. Harris, Ph.D., Chairman
John P. Ackerly, IV
John T. Bruce
George K. Jennison
Harris V. Morrissette
Elizabeth W. Robertson Officers
John P. Ackerly, IV, President
George L. Smith, III, Vice President
| |
One James Center
901 East Cary Street
Richmond, VA 23219
Davenport & Company LLC
Member: NYSE ● SIPC
Toll Free: (800) 846-6666
www.investdavenport.com
FBP Equity & Dividend Plus Fund FBP Appreciation & Income Opportunities Fund Semi-Annual Report September 30, 2017 (Unaudited) No-Load Funds |
| Letter to Shareholders | November 16, 2017 |
We are pleased to report on your Funds and their investments for the six-month period ended September 30, 2017 and to provide some additional information since we last communicated with you.
Economic and Market Update
This most recent quarter ended with the S&P 500 Index, the Dow Jones Industrial Average Index, and the Nasdaq Composite all at record-high levels. It marked the eighth consecutive quarterly gain for the S&P 500, which has only experienced one down quarter since the end of 2012. Solid earnings and steady economic growth provided fuel for the strong equity returns. During the advance, markets seemed to shrug off escalating tensions over North Korea’s nuclear tests and to look beyond the economic impact of a series of major hurricanes that hit the U.S. mainland and Puerto Rico. Additionally, markets appeared unfazed as the pro-growth agenda championed by the Trump Administration hit some speed bumps. Despite these issues, investors remain favorably disposed toward stocks as global economic conditions steadily improve.
On a calendar basis, real GDP for the second quarter was reported at a 3% annual rate, a significant uptick from first quarter’s 1.2% rate. We were surprised at the announced 3.1% growth for the third quarter, as we expected something lower given the impact of Hurricanes Harvey and Irma. Consumer spending and manufacturing data for August were spotty, but business sentiment remained quite high.
In a statement following its September 2017 meeting, the Federal Open Market Committee (the “Fed”) announced it would begin to reduce fixed income security holdings on its balance sheet that were acquired in an attempt to stimulate the economy after the 2008-2009 recession. Removing this so-called “quantitative easing” stimulus has long been discussed by the Fed, but is now happening. Further increases to the federal funds rate are also possible in the coming quarters. The Fed believes these steps are necessary to return to a more normal interest rate environment (i.e., higher than current levels), but we expect further actions will be dependent on whether the economy continues to advance at a reasonable pace.
So far in calendar year 2017, market leadership has been concentrated in a small number of very large, mostly technology-related stocks, and these stocks continued to lead the way during the past six months. Returns for the three months ended September 30 showed signs of broadening with ten of the eleven sectors generating positive numbers for the period.
FBP Equity & Dividend Plus Fund Review
The FBP Equity & Dividend Plus Fund returned 4.60% for the semi-annual period and 15.22% for the 12-month period ended September 30, 2017. Over the same periods, the S&P 500 Index returned 7.71% and 18.61% while the Russell 1000 Value Index returned 4.50% and 15.12%. The Fund portfolio held 97.3% in equity and 2.7% cash at the quarter end. While the absolute returns are very good for the periods, they do lag the growth oriented S&P 500 Index and are in line with the more value based Russell Index. For the semi-annual period, the Consumer Discretionary and Energy sectors were the most positive contributors to results. Kohl’s (+17.9%) and Philips (+31.5) were the best contributors. Information Technology and Industrials were the weakest contributors, with IBM (-14.9%) and GE (-17.4%) being the laggards individually.
We initiated new positions in Schlumberger, Compass Minerals, Nucor, and Williams Sonoma during the period. Schlumberger is the world’s largest and most diversified energy services company. With an above average yield of 3%, we believe it offers attractive long-term total return potential. Compass
1
Minerals is a major provider of road salt and specialty fertilizer for the agricultural industry. The company experienced a production disruption at one of its salt mines causing its stock price to fall sharply, which we used as an opportunity to buy the stock. Nucor, which was previously owned by the Fund, is a major U.S. steel producer that should benefit from improving economic conditions. We believe its earnings power in this cycle is well above previous peak levels. Williams-Sonoma is a leading seller of housewares and furnishings primarily through its Williams-Sonoma, Pottery Barn and West Elm channels. Investor pessimism regarding the entire retail sector resulted in weak share prices for many companies, including Williams-Sonoma. With more than half its revenues generated online, we believe the stock offers above-average growth potential. The company also has a strong balance sheet as well as an attractive and growing dividend. We also took advantage of share price weakness to add to holdings in AT&T, LyondellBasell Industries, UPS and Nordstrom. Staples was eliminated from the Fund as all shares of its stock were acquired by private equity investors in an all-cash deal. The Fund also reduced the weightings in Microsoft and Philips after very nice gains.
The Fund does utilize as part of its investment discipline the use of covered call options as individual securities approach the top of the Adviser’s growth and price expectations. The Fund’s purpose in selling the call option is to generate additional cash flow to the Fund and to hedge the possibility the security may not achieve its price objective. In very strong stock markets, this discipline may limit the upside of the securities where options have been written, but in flat to negative markets, it may provide additional return. For the semi-annual period ended September 30, 2017, the amount of premiums generated from selling covered call options was $184,953.
The Fund is well diversified across all eleven economic sectors and is structured to benefit as the economy grows. The Fund seeks to invest in companies that provide above average and growing dividends and uses covered call options to enhance the cash flow to the Fund.
FBP Appreciation & Income Opportunities Fund Review
The FBP Appreciation & Income Opportunities Fund returned 3.70% for the semi-annual period and 13.23% for the 12-month period ended September 30, 2017. The S&P 500 Index returned 7.71% and 18.61% while the Bloomberg Barclays Intermediate U.S. Government/Credit Index returned 1.55% and 0.23% over the same periods. The Fund held 74.5% equity, 14.3% fixed income and 11.2% cash as of September 30, 2017. For the semi-annual period, the Consumer Staples and Consumer Discretionary sectors provided the largest contribution to results. Kohl’s (+17.9%) and Philips (+31.5) were the top contributors. Information Technology and Industrials were the weakest contributors, with IBM (-14.9%) and Bloomin’ Brands (-10.0%) being the laggards individually.
During the period we did increase our exposure to Target and Kohl’s on price weakness. Retail stocks in general have lagged significantly this year in the wake of sluggish same-store sales results and fears of online competition. While we acknowledge that the retail landscape is shifting, we continue to believe there is a place for certain traditional brick-and-mortar locations. With dividend yields at approximately 5%, we believe each offers above average return potential in the coming quarters. Nucor, a major U.S. steel producer, was also added to the Fund. The company should benefit from continuing economic growth, and we expect its earnings power in this cycle to be well above previous peak levels. In other activity, both Microsoft and Philips reported strong earnings gains in the quarter, and their stock prices spiked. We reduced our weightings in those holdings as a result. Bank of America was trimmed as a result of very strong price performance and as it had become a large weighting in the Fund. Dupont was sold through exercise of calls options following nice gains. And Staples was eliminated as all shares of its stock were acquired by private equity investors.
2
The Fund does utilize as part of its investment discipline the use of covered call options as individual securities approach the top of the Adviser’s growth and price expectations. The Fund’s purpose in selling the call option is to generate additional cash flow to the Fund and to hedge the possibility the security may not achieve its price objective. In very strong stock markets, this discipline may limit the upside of the securities where options have been written, but in flat to negative markets, it may provide additional return. For the semi-annual period ended September 30, 2017, the amount of premiums generated from selling covered call options was $21,852.
Looking Ahead
Stocks have been in a strong uptrend since before the election, continuing the bull market that started over eight years ago. Slow but steady economic growth in the U.S. and around the world, coupled with very low interest rates, provided the broad support to sustain and extend the market. Valuation seems elevated with the market trading at nearly 18 times estimated earnings. These valuations can be justified, however, given the current environment of very low interest rates and consistently growing corporate earnings. At some point, we would expect a modest stock market correction, which would be viewed as a normal and healthy part of a long-term bull market. Both the timing and depth of the pullback are extremely difficult to predict, but we believe it would create attractive investment opportunities.
We want to thank you for your continued support and investment in the Flippin, Bruce & Porter Funds. Please visit our website at www.fbpfunds.com for information on your Funds and the investment philosophy and process we utilize to achieve their investment objectives.
John T. Bruce, CFA
President - Portfolio Manager
November 16, 2017
Data presented reflects past performance, which is no guarantee of future results. Investment results and principal value will fluctuate so that shares, when redeemed, may be worth more or less than their original cost. Due to market volatility, current performance may be higher or lower than the performance shown. Updated performance information, current through the most recent month-end, is available by contacting the Funds at 1-866-738-1127.
This report is submitted for the general information of the shareholders of the Funds. It reflects our views, opinions and portfolio holdings as of the date of this letter. These views are subject to change at any time based upon market or other conditions. For more current information throughout the year please visit www.fbpfunds.com or call the Funds at 1-866-738-1127. This report is not authorized for distribution to prospective investors in the Funds unless accompanied by a current prospectus.
3
THE FLIPPIN, BRUCE & PORTER FUNDS
COMPARATIVE PERFORMANCE CHARTS
(Unaudited)
Performance for each Fund is compared to the most appropriate broad-based index, the Standard and Poor’s 500® Index, an unmanaged index of 500 large common stocks. Results are also compared to the Consumer Price Index, a measure of inflation.
FBP Equity & Dividend Plus Fund
Comparison of the Change in Value of a $10,000 Investment in FBP Equity & Dividend Plus Fund,
the Standard & Poor’s 500® Index and the Consumer Price Index
4
THE FLIPPIN, BRUCE & PORTER FUNDS
COMPARATIVE PERFORMANCE CHARTS
(Unaudited) (Continued)
FBP Appreciation & Income Opportunities Fund
Comparison of the Change in Value of a $10,000 Investment in FBP Appreciation & Income
Opportunities Fund, the Standard & Poor’s 500® Index and the Consumer Price Index
Average Annual Total Returns (for periods ended September 30, 2017) |
| | 1 Year | 5 Years | 10 Years |
FBP Equity & Dividend Plus Fund(a) | 15.22% | 10.87% | 2.64% |
FBP Appreciation & Income Opportunities Fund(a) | 13.23% | 8.98% | 3.84% |
Standard & Poor’s 500® Index | 18.61% | 14.22% | 7.44% |
| Consumer Price Index | 1.93% | 1.28% | 1.67% |
(a) | Total returns are a measure of the change in value of an investment in the Funds over the periods covered, which assumes any dividends or capital gains distributions are reinvested in shares of the Funds. Returns do not reflect the deduction of taxes a shareholder would pay on the Funds’ distributions or the redemption of Fund shares. |
5
FBP EQUITY & DIVIDEND PLUS FUND
PORTFOLIO INFORMATION
September 30, 2017 (Unaudited)
| General Information | | | |
| Net Asset Value Per Share | | $ | 25.65 | |
| Total Net Assets (Millions) | | $ | 27.2 | |
| Current Expense Ratio | | | 1.07 | % |
| Portfolio Turnover | | | 4 | % |
| Fund Inception Date | | 7/30/1993 | |
| Stock Characteristics | | Fund | | | S&P 500® Index | |
| Number of Stocks | | | 54 | | | | 500 | |
| Weighted Avg Market Capitalization (Billions) | | $ | 140.6 | | | $ | 178.6 | |
| Price-to-Earnings Ratio (Bloomberg 1 Yr. Forecast EPS) | | | 14.6 | | | | 17.8 | |
| Price-to-Book Value | | | 2.2 | | | | 3.2 | |
| Asset Allocation (% of Net Assets) |
|
Sector Diversification vs. the S&P 500® Index |
| Ten Largest Equity Holdings | % of Net Assets |
| JPMorgan Chase & Company | 4.2% |
| Procter & Gamble Company (The) | 3.0% |
| Apple, Inc. | 2.9% |
| U.S. Bancorp | 2.8% |
| KeyCorp | 2.8% |
| BB&T Corporation | 2.7% |
| Wells Fargo & Company | 2.6% |
| Pfizer, Inc. | 2.5% |
| Cisco Systems, Inc. | 2.5% |
| International Business Machines Corporation | 2.4% |
6
FBP APPRECIATION & INCOME OPPORTUNITIES FUND
PORTFOLIO INFORMATION
September 30, 2017 (Unaudited)
| General Information | |
| Net Asset Value Per Share | | $ | 18.89 | |
| Total Net Assets (Millions) | | $ | 33.8 | |
| Current Expense Ratio | | | 1.00 | % |
| Portfolio Turnover | | | 3 | % |
| Fund Inception Date | | 7/3/1989 | |
| Asset Allocation (% of Net Assets) |
|
| Common Stock Portfolio (73.6% of Net Assets) |
| Number of Stocks | | | 48 | |
| Weighted Avg Market Capitalization (Billions) | | $ | 153.5 | |
| Price-to-Earnings Ratio (Bloomberg 1 Yr. Forecast EPS) | | | 14.0 | |
| Price-to-Book Value | | | 2.0 | |
| Ten Largest Equity Holdings | % of Net Assets |
| Apple, Inc. | 3.6% |
| JPMorgan Chase & Company | 3.4% |
| Bank of America Corporation | 3.4% |
| Lincoln National Corporation | 3.0% |
| Cisco Systems, Inc. | 2.7% |
| MetLife, Inc. | 2.3% |
| Microsoft Corporation | 2.2% |
| Bank of New York Mellon Corporation (The) | 2.1% |
| Pfizer, Inc. | 2.1% |
| Kohl's Corporation | 2.0% |
| Five Largest Sectors | % of Net Assets |
| Financials | 18.7% |
| Information Technology | 14.5% |
| Energy | 8.8% |
| Consumer Discretionary | 7.9% |
| Health Care | 6.8% |
| Fixed-Income Portfolio (14.3% of Net Assets) |
| Number of Fixed-Income Securities | 9 |
| Average Quality | BBB+ |
| Average Weighted Maturity | 3.3 yrs. |
| Average Effective Duration | 3.1 yrs. |
| Sector Breakdown | % of Net Assets |
| U.S. Government & Agency Obligations | 1.5% |
| Consumer Discretionary | 1.5% |
| Energy | 3.1% |
| Financials | 4.5% |
| Industrials | 2.2% |
| Utilities | 1.5% |
7
FBP EQUITY & DIVIDEND PLUS FUND
SCHEDULE OF INVESTMENTS
September 30, 2017 (Unaudited) |
| COMMON STOCKS — 97.3% | | Shares | | | Value | |
| Consumer Discretionary — 10.1% | | | | | | |
Coach, Inc. (a) | | | 11,000 | | | $ | 443,080 | |
| Ford Motor Company | | | 39,000 | | | | 466,830 | |
| Kohl's Corporation | | | 13,000 | | | | 593,450 | |
Nordstrom, Inc. (a) | | | 8,900 | | | | 419,635 | |
| Target Corporation | | | 9,500 | | | | 560,595 | |
| Williams-Sonoma, Inc. | | | 5,500 | | | | 274,230 | |
| | | | | | | | 2,757,820 | |
| Consumer Staples — 6.6% | | | | | | | | |
Coca-Cola Company (The) (a) | | | 6,000 | | | | 270,060 | |
| CVS Health Corporation | | | 5,000 | | | | 406,600 | |
Procter & Gamble Company (The) (a) | | | 9,000 | | | | 818,820 | |
| Wal-Mart Stores, Inc. | | | 3,700 | | | | 289,118 | |
| | | | | | | | 1,784,598 | |
| Energy — 11.3% | | | | | | | | |
Chevron Corporation (a) | | | 4,800 | | | | 564,000 | |
| ConocoPhillips | | | 12,000 | | | | 600,600 | |
| Exxon Mobil Corporation | | | 4,500 | | | | 368,910 | |
| Occidental Petroleum Corporation | | | 8,300 | | | | 532,943 | |
| Royal Dutch Shell plc - Class B - ADR | | | 9,500 | | | | 594,130 | |
| Schlumberger Ltd. | | | 5,700 | | | | 397,632 | |
| | | | | | | | 3,058,215 | |
| Financials — 22.5% | | | | | | | | |
| BB&T Corporation | | | 15,500 | | | | 727,570 | |
| JPMorgan Chase & Company | | | 12,000 | | | | 1,146,120 | |
KeyCorp (a) | | | 39,940 | | | | 751,671 | |
Manulife Financial Corporation (a) | | | 20,000 | | | | 405,800 | |
| MetLife, Inc. | | | 10,200 | | | | 529,890 | |
| People's United Financial, Inc. | | | 25,000 | | | | 453,500 | |
Prudential Financial, Inc. (a) | | | 6,000 | | | | 637,920 | |
U.S. Bancorp (a) | | | 14,200 | | | | 760,978 | |
| Wells Fargo & Company | | | 13,000 | | | | 716,950 | |
| | | | | | | | 6,130,399 | |
| Health Care — 9.4% | | | | | | | | |
Amgen, Inc. (a) | | | 2,400 | | | | 447,480 | |
| Eli Lilly & Company | | | 5,500 | | | | 470,470 | |
| Johnson & Johnson | | | 2,600 | | | | 338,026 | |
Koninklijke Philips N.V. (a) | | | 6,379 | | | | 262,815 | |
Merck & Company, Inc. (a) | | | 5,400 | | | | 345,762 | |
| Pfizer, Inc. | | | 19,000 | | | | 678,300 | |
| | | | | | | | 2,542,853 | |
8
FBP EQUITY & DIVIDEND PLUS FUND
SCHEDULE OF INVESTMENTS (Continued) |
| COMMON STOCKS — 97.3% (Continued) | | Shares | | | Value | |
| Industrials — 10.0% | | | | | | |
Eaton Corporation plc (a) | | | 8,000 | | | $ | 614,320 | |
Emerson Electric Company (a) | | | 10,000 | | | | 628,400 | |
| General Electric Company | | | 20,800 | | | | 502,944 | |
United Parcel Service, Inc. - Class B (a) | | | 3,600 | | | | 432,324 | |
United Technologies Corporation (a) | | | 4,700 | | | | 545,576 | |
| | | | | | | | 2,723,564 | |
| Information Technology — 13.8% | | | | | | | | |
Apple, Inc. (a) | | | 5,200 | | | | 801,424 | |
| Cisco Systems, Inc. | | | 20,000 | | | | 672,600 | |
HP, Inc. (a) | | | 30,000 | | | | 598,800 | |
| Intel Corporation | | | 11,000 | | | | 418,880 | |
| International Business Machines Corporation | | | 4,500 | | | | 652,860 | |
| Microsoft Corporation | | | 4,500 | | | | 335,205 | |
| Western Union Company (The) | | | 14,000 | | | | 268,800 | |
| | | | | | | | 3,748,569 | |
| Materials — 5.8% | | | | | | | | |
| Compass Minerals International, Inc. | | | 4,100 | | | | 266,090 | |
LyondellBasell Industries N.V. - Class A (a) | | | 6,100 | | | | 604,205 | |
| Mosaic Company (The) | | | 9,000 | | | | 194,310 | |
| Nucor Corporation | | | 4,600 | | | | 257,784 | |
Rio Tinto plc - ADR (a) | | | 5,600 | | | | 264,264 | |
| | | | | | | | 1,586,653 | |
| Real Estate — 2.4% | | | | | | | | |
| Public Storage | | | 1,200 | | | | 256,788 | |
Ventas, Inc. (a) | | | 6,000 | | | | 390,780 | |
| | | | | | | | 647,568 | |
| Telecommunication Services — 3.0% | | | | | | | | |
| AT&T, Inc. | | | 12,800 | | | | 501,376 | |
| CenturyLink, Inc. | | | 17,000 | | | | 321,300 | |
| | | | | | | | 822,676 | |
| Utilities — 2.4% | | | | | | | | |
| FirstEnergy Corporation | | | 15,000 | | | | 462,450 | |
PPL Corporation (a) | | | 5,000 | | | | 189,750 | |
| | | | | | | | 652,200 | |
| | | | | | | | | |
Total Common Stocks (Cost $20,320,156) | | | | | | $ | 26,455,115 | |
9
FBP EQUITY & DIVIDEND PLUS FUND
SCHEDULE OF INVESTMENTS (Continued) |
| MONEY MARKET FUNDS — 3.4% | | Shares | | | Value | |
Fidelity Institutional Money Market Government Portfolio - Class I, 0.91% (b) (Cost $936,726) | | | 936,726 | | | $ | 936,726 | |
| | | | | | | | | |
Total Investments at Value — 100.7% (Cost $21,256,882) | | | | | | $ | 27,391,841 | |
| | | | | | | | | |
| Liabilities in Excess of Other Assets — (0.7%) | | | | | | | (187,354 | ) |
| | | | | | | | | |
| Net Assets — 100.0% | | | | | | $ | 27,204,487 | |
| ADR - American Depositary Receipt. |
| |
(a) | Security covers a written call option. |
| | |
(b) | The rate shown is the 7-day effective yield as of September 30, 2017. |
| | |
| See accompanying notes to financial statements. |
10
FBP EQUITY & DIVIDEND PLUS FUND
SCHEDULE OF OPEN OPTION CONTRACTS
September 30, 2017 (Unaudited) |
COVERED WRITTEN CALL OPTIONS | | Contracts | | | Notional
Value | | | Strike
Price | | Expiration
Date | | Value of
Options | |
| Amgen, Inc. | | | 10 | | | $ | 186,450 | | | $ | 195.00 | | 01/19/18 | | $ | 4,550 | |
| Apple, Inc. | | | 15 | | | | 231,180 | | | | 150.00 | | 10/20/17 | | | 7,950 | |
| Apple, Inc. | | | 15 | | | | 231,180 | | | | 165.00 | | 12/15/17 | | | 3,750 | |
| Chevron Corporation | | | 20 | | | | 235,000 | | | | 115.00 | | 03/16/18 | | | 11,800 | |
| Coach, Inc | | | 45 | | | | 181,260 | | | | 45.00 | | 02/16/18 | | | 4,680 | |
| Coca-Cola Company (The) | | | 60 | | | | 270,060 | | | | 47.00 | | 01/19/18 | | | 2,160 | |
| Eaton Corporation plc | | | 35 | | | | 268,765 | | | | 80.00 | | 10/20/17 | | | 595 | |
| Emerson Electric Company | | | 50 | | | | 314,200 | | | | 65.00 | | 03/16/18 | | | 9,250 | |
| HP, Inc. | | | 150 | | | | 299,400 | | | | 20.00 | | 11/17/17 | | | 8,250 | |
| KeyCorp | | | 200 | | | | 376,400 | | | | 20.00 | | 01/19/18 | | | 8,800 | |
| Koninklijke Philips N.V. | | | 63 | | | | 259,560 | | | | 35.00 | | 10/20/17 | | | 40,950 | |
| LyondellBasell Industries N.V. - Class A | | | 30 | | | | 297,150 | | | | 97.50 | | 03/16/18 | | | 19,800 | |
| Manulife Financial Corporation | | | 200 | | | | 405,800 | | | | 19.00 | | 12/15/17 | | | 34,000 | |
| Merck & Company, Inc. | | | 24 | | | | 153,672 | | | | 67.50 | | 04/20/18 | | | 3,480 | |
| Nordstrom, Inc. | | | 63 | | | | 297,045 | | | | 55.00 | | 10/20/17 | | | 441 | |
| PPL Corporation | | | 50 | | | | 189,750 | | | | 39.00 | | 10/20/17 | | | 500 | |
| Procter & Gamble Company (The) | | | 45 | | | | 409,410 | | | | 92.50 | | 12/15/17 | | | 5,400 | |
| Procter & Gamble Company (The) | | | 45 | | | | 409,410 | | | | 95.00 | | 04/20/18 | | | 6,930 | |
| Prudential Financial, Inc. | | | 25 | | | | 265,800 | | | | 120.00 | | 03/16/18 | | | 3,500 | |
| Rio Tinto plc - ADR | | | 56 | | | | 264,264 | | | | 47.50 | | 12/15/17 | | | 11,760 | |
| U.S. Bancorp | | | 70 | | | | 375,130 | | | | 55.00 | | 03/16/18 | | | 12,530 | |
| United Parcel Service, Inc. - Class B | | | 16 | | | | 192,144 | | | | 120.00 | | 04/20/18 | | | 8,320 | |
| United Technologies Corporation | | | 25 | | | | 290,200 | | | | 125.00 | | 01/19/18 | | | 2,450 | |
| Ventas, Inc. | | | 30 | | | | 195,390 | | | | 70.00 | | 11/17/17 | | | 570 | |
Total Covered Written Call Options (Premiums $218,847) | | | $ | 6,598,620 | | | | | | | | $ | 212,416 | |
| ADR - American Depositary Receipt. |
| |
| The average notional amount of written call options during the six months ended September 30, 2017 is $4,215,893 (Note 5). |
| |
| See accompanying notes to financial statements. |
11
FBP APPRECIATION & INCOME OPPORTUNITIES FUND
SCHEDULE OF INVESTMENTS
September 30, 2017 (Unaudited) |
| COMMON STOCKS — 73.6% | | Shares | | | Value | |
| Consumer Discretionary — 7.9% | | | | | | |
| Bloomin’ Brands, Inc. | | | 29,000 | | | $ | 510,400 | |
| Coach, Inc. | | | 11,000 | | | | 443,080 | |
| Ford Motor Company | | | 40,000 | | | | 478,800 | |
| Kohl's Corporation | | | 15,000 | | | | 684,750 | |
| Target Corporation | | | 9,500 | | | | 560,595 | |
| | | | | | | | 2,677,625 | |
| Consumer Staples — 3.6% | | | | | | | | |
| CVS Health Corporation | | | 4,800 | | | | 390,336 | |
| PepsiCo, Inc. | | | 2,500 | | | | 278,575 | |
| Wal-Mart Stores, Inc. | | | 7,000 | | | | 546,980 | |
| | | | | | | | 1,215,891 | |
| Energy — 8.8% | | | | | | | | |
| Baker Hughes, a GE Company | | | 8,000 | | | | 292,960 | |
| Chevron Corporation | | | 5,000 | | | | 587,500 | |
| ConocoPhillips | | | 11,000 | | | | 550,550 | |
| Devon Energy Corporation | | | 11,000 | | | | 403,810 | |
| Occidental Petroleum Corporation | | | 8,200 | | | | 526,522 | |
| Royal Dutch Shell plc - Class B - ADR | | | 10,000 | | | | 625,400 | |
| | | | | | | | 2,986,742 | |
| Financials — 18.7% | | | | | | | | |
| Bank of America Corporation | | | 45,000 | | | | 1,140,300 | |
| Bank of New York Mellon Corporation (The) | | | 13,500 | | | | 715,770 | |
| Capital One Financial Corporation | | | 6,000 | | | | 507,960 | |
| JPMorgan Chase & Company | | | 12,000 | | | | 1,146,120 | |
| KeyCorp | | | 16,320 | | | | 307,142 | |
| Lincoln National Corporation | | | 14,000 | | | | 1,028,720 | |
| MetLife, Inc. | | | 15,000 | | | | 779,250 | |
| Travelers Companies, Inc. (The) | | | 5,500 | | | | 673,860 | |
| | | | | | | | 6,299,122 | |
| Health Care — 6.8% | | | | | | | | |
| Eli Lilly & Company | | | 6,000 | | | | 513,240 | |
| Johnson & Johnson | | | 2,000 | | | | 260,020 | |
| Koninklijke Philips N.V. | | | 7,000 | | | | 288,400 | |
| Merck & Company, Inc. | | | 8,000 | | | | 512,240 | |
| Pfizer, Inc. | | | 20,000 | | | | 714,000 | |
| | | | | | | | 2,287,900 | |
| Industrials — 6.6% | | | | | | | | |
| Eaton Corporation plc | | | 7,200 | | | | 552,888 | |
| FedEx Corporation | | | 1,700 | | | | 383,486 | |
| General Electric Company | | | 17,000 | | | | 411,060 | |
| Ingersoll-Rand plc | | | 4,700 | | | | 419,099 | |
| United Technologies Corporation | | | 4,200 | | | | 487,536 | |
| | | | | | | | 2,254,069 | |
12
FBP APPRECIATION & INCOME OPPORTUNITIES FUND
SCHEDULE OF INVESTMENTS (Continued) |
| COMMON STOCKS — 73.6% (Continued) | | Shares | | | Value | |
| Information Technology — 14.5% | | | | | | |
Apple, Inc. (a) | | | 7,800 | | | $ | 1,202,136 | |
| Cisco Systems, Inc. | | | 27,000 | | | | 908,010 | |
HP, Inc. (a) | | | 20,000 | | | | 399,200 | |
| International Business Machines Corporation | | | 4,500 | | | | 652,860 | |
| Microsoft Corporation | | | 10,000 | | | | 744,900 | |
| Nokia Corporation - ADR | | | 67,000 | | | | 400,660 | |
| Western Union Company (The) | | | 30,000 | | | | 576,000 | |
| | | | | | | | 4,883,766 | |
| Materials — 2.8% | | | | | | | | |
Freeport-McMoRan, Inc. (b) | | | 11,000 | | | | 154,440 | |
| Mosaic Company (The) | | | 8,000 | | | | 172,720 | |
| Nucor Corporation | | | 4,500 | | | | 252,180 | |
Rio Tinto plc - ADR (a) | | | 8,000 | | | | 377,520 | |
| | | | | | | | 956,860 | |
| Real Estate — 0.9% | | | | | | | | |
| Ventas, Inc. | | | 4,500 | | | | 293,085 | |
| | | | | | | | | |
| Telecommunication Services — 1.8% | | | | | | | | |
| AT&T, Inc. | | | 8,000 | | | | 313,360 | |
| CenturyLink, Inc. | | | 15,000 | | | | 283,500 | |
| | | | | | | | 596,860 | |
| Utilities — 1.2% | | | | | | | | |
| FirstEnergy Corporation | | | 8,000 | | | | 246,640 | |
| PPL Corporation | | | 4,000 | | | | 151,800 | |
| | | | | | | | 398,440 | |
| | | | | | | | | |
Total Common Stocks (Cost $16,731,341) | | | | | | $ | 24,850,360 | |
| U.S. GOVERNMENT & AGENCY OBLIGATIONS — 1.5% | | Par Value | | | Value | |
| Federal National Mortgage Association — 1.5% | | | | | | |
| 1.20%, due 07/17/2020 (Cost $500,000) | | $ | 500,000 | | | $ | 489,758 | |
13
FBP APPRECIATION & INCOME OPPORTUNITIES FUND
SCHEDULE OF INVESTMENTS (Continued) |
| CORPORATE BONDS — 12.8% | | Par Value | | | Value | |
| Consumer Discretionary — 1.5% | | | | | | |
| Mattel, Inc., 2.35%, due 05/06/2019 | | $ | 500,000 | | | $ | 501,128 | |
| | | | | | | | | |
| Energy — 3.1% | | | | | | | | |
| Dominion Resources, Inc., 2.50%, due 12/01/2019 | | | 500,000 | | | | 504,287 | |
| Pioneer Natural Resources Company, 3.95%, due 07/15/2022 | | | 500,000 | | | | 525,418 | |
| | | | | | | | 1,029,705 | |
| Financials — 4.5% | | | | | | | | |
| Citigroup, Inc., 2.90%, due 12/08/2021 | | | 500,000 | | | | 506,160 | |
| Unum Group, 3.00%, due 05/15/2021 | | | 500,000 | | | | 506,688 | |
| Wells Fargo & Company, 3.50%, due 03/08/2022 | | | 500,000 | | | | 519,317 | |
| | | | | | | | 1,532,165 | |
| Industrials — 2.2% | | | | | | | | |
| Ryder System, Inc., 2.50%, due 05/11/2020 | | | 750,000 | | | | 757,429 | |
| | | | | | | | | |
| Utilities — 1.5% | | | | | | | | |
| PSEG Power LLC, 3.00%, due 06/15/2021 | | | 500,000 | | | | 509,144 | |
| | | | | | | | | |
Total Corporate Bonds (Cost $4,262,984) | | | | | | $ | 4,329,571 | |
| CLOSED-END FUNDS — 0.9% | | Shares | | | Value | |
| Prudential Short Duration High Yield Fund, Inc. (Cost $291,069) | | | 20,000 | | | $ | 305,200 | |
14
FBP APPRECIATION & INCOME OPPORTUNITIES FUND
SCHEDULE OF INVESTMENTS (Continued) |
| MONEY MARKET FUNDS — 11.2% | | Shares | | | Value | |
Fidelity Institutional Money Market Government Portfolio - Class I, 0.91% (c) | | | 3,242,387 | | | $ | 3,242,387 | |
First American Government Obligations Fund - Class Z, 0.89% (c) | | | 545,197 | | | | 545,197 | |
Total Money Market Funds (Cost $3,787,584) | | | | | | $ | 3,787,584 | |
| | | | | | | | | |
Total Investments at Value — 100.0% (Cost $25,572,978) | | | | | | $ | 33,762,473 | |
| | | | | | | | | |
Liabilities in Excess of Other Assets — (0.0%) (d) | | | | | | | (3,715 | ) |
| | | | | | | | | |
| Net Assets — 100.0% | | | | | | $ | 33,758,758 | |
| ADR - American Depositary Receipt. |
| |
(a) | Security covers a written call option. |
| | |
(b) | Non-income producing security. |
| | |
(c) | The rate shown is the 7-day effective yield as of September 30, 2017. |
| | |
(d) | Percentage rounds to less than 0.1%. |
| | |
| See accompanying notes to financial statements. |
15
FBP APPRECIATION & INCOME OPPORTUNITIES FUND
SCHEDULE OF OPEN OPTION CONTRACTS
September 30, 2017 (Unaudited) |
COVERED WRITTEN CALL OPTIONS | | Contracts | | | Notional
Value | | | Strike
Price | | Expiration
Date | | Value of
Options | |
| Apple, Inc. | | | 16 | | | $ | 246,592 | | | $ | 165.00 | | 01/19/18 | | $ | 6,000 | |
| HP, Inc. | | | 60 | | | | 119,760 | | | | 20.00 | | 11/17/17 | | | 3,300 | |
| Rio Tinto plc - ADR | | | 35 | | | | 165,165 | | | | 47.50 | | 12/15/17 | | | 7,350 | |
Total Covered Written Call Options (Premiums $21,852) | | | $ | 531,517 | | | | | | | | $ | 16,650 | |
| ADR - American Depositary Receipt. |
| |
| The average notional amount of written call options during the six months ended September 30, 2017 is $634,271 (Note 5). |
| |
| See accompanying notes to financial statements. |
16
THE FLIPPIN, BRUCE & PORTER FUNDS
STATEMENTS OF ASSETS AND LIABILITIES
September 30, 2017 (Unaudited) |
| | | FBP Equity
& Dividend
Plus Fund | | | FBP
Appreciation
& Income
Opportunities
Fund | |
| ASSETS | | | | | | |
| Investments in securities: | | | | | | |
| At cost | | $ | 21,256,882 | | | $ | 25,572,978 | |
| At value (Note 2) | | $ | 27,391,841 | | | $ | 33,762,473 | |
| Cash | | | — | | | | 2,115 | |
| Dividends and interest receivable | | | 35,430 | | | | 66,231 | |
| Receivable for capital shares sold | | | 2,530 | | | | — | |
| Other assets | | | 13,458 | | | | 11,744 | |
| TOTAL ASSETS | | | 27,443,259 | | | | 33,842,563 | |
| | | | | | | | | |
| LIABILITIES | | | | | | | | |
| Written call options, at value (Notes 2 and 5) (premiums received $218,847 and $21,852, respectively) | | | 212,416 | | | | 16,650 | |
| Distributions payable | | | 2,676 | | | | 22,772 | |
| Payable for capital shares redeemed | | | 5,572 | | | | 20,668 | |
| Accrued investment advisory fees (Note 4) | | | 10,408 | | | | 15,787 | |
| Payable to administrator (Note 4) | | | 5,700 | | | | 5,700 | |
| Other accrued expenses and liabilities | | | 2,000 | | | | 2,228 | |
| TOTAL LIABILITIES | | | 238,772 | | | | 83,805 | |
| | | | | | | | | |
| NET ASSETS | | $ | 27,204,487 | | | $ | 33,758,758 | |
| | | | | | | | | |
| Net assets consist of: | | | | | | | | |
| Paid-in capital | | $ | 20,762,364 | | | $ | 24,791,758 | |
| Accumulated distributions in excess of net investment income | | | (3,663 | ) | | | (12,399 | ) |
| Accumulated net realized gains from investment transactions and written option contracts | | | 304,396 | | | | 784,702 | |
| Net unrealized appreciation on: | | | | | | | | |
| Investments | | | 6,134,959 | | | | 8,189,495 | |
| Written option contracts | | | 6,431 | | | | 5,202 | |
| Net assets | | $ | 27,204,487 | | | $ | 33,758,758 | |
| | | | | | | | | |
| Shares of beneficial interest outstanding (unlimited number of shares authorized, $0.01 par value) | | | 1,060,649 | | | | 1,786,682 | |
| | | | | | | | | |
| Net asset value, offering price and redemption price per share (Note 2) | | $ | 25.65 | | | $ | 18.89 | |
| See accompanying notes to financial statements. |
17
THE FLIPPIN, BRUCE & PORTER FUNDS
STATEMENTS OF OPERATIONS
Six Months Ended September 30, 2017 (Unaudited) |
| | | FBP Equity
& Dividend
Plus Fund | | | FBP Appreciation
& Income
Opportunities
Fund | |
| INVESTMENT INCOME | | | | | | |
| Dividends | | $ | 437,472 | | | $ | 563,341 | |
| Foreign withholding taxes on dividends | | | (1,853 | ) | | | (4,140 | ) |
| Interest | | | — | | | | 60,242 | |
| TOTAL INVESTMENT INCOME | | | 435,619 | | | | 619,443 | |
| | | | | | | | | |
| EXPENSES | | | | | | | | |
| Investment advisory fees (Note 4) | | | 92,899 | | | | 117,909 | |
| Administration fees (Note 4) | | | 30,000 | | | | 30,000 | |
| Professional fees | | | 11,518 | | | | 11,518 | |
| Registration and filing fees | | | 5,890 | | | | 4,427 | |
| Trustees’ fees and expenses (Note 4) | | | 4,982 | | | | 4,982 | |
| Compliance service fees (Note 4) | | | 4,200 | | | | 4,200 | |
| Printing of shareholder reports | | | 4,357 | | | | 2,786 | |
| Custodian and bank service fees | | | 3,642 | | | | 3,362 | |
| Postage and supplies | | | 3,260 | | | | 2,121 | |
| Insurance expense | | | 566 | | | | 640 | |
| Other expenses | | | 3,750 | | | | 5,150 | |
| TOTAL EXPENSES | | | 165,064 | | | | 187,095 | |
| Fees voluntarily waived by the Adviser (Note 4) | | | (23,062 | ) | | | (18,653 | ) |
| NET EXPENSES | | | 142,002 | | | | 168,442 | |
| | | | | | | | | |
| NET INVESTMENT INCOME | | | 293,617 | | | | 451,001 | |
| | | | | | | | | |
| REALIZED AND UNREALIZED GAINS (LOSSES) ON INVESTMENTS | | | | | | | | |
| Net realized gains from: | | | | | | | | |
| Investment transactions | | | 254,179 | | | | 739,458 | |
| Written option contracts (Note 5) | | | 106,071 | | | | 45,361 | |
| Net change in unrealized appreciation (depreciation) on: | | | | | | | | |
| Investments | | | 564,909 | | | | (17,242 | ) |
| Written option contracts (Note 5) | | | (29,467 | ) | | | 2,531 | |
| NET REALIZED AND UNREALIZED GAINS ON INVESTMENTS | | | 895,692 | | | | 770,108 | |
| | | | | | | | |
| NET INCREASE IN NET ASSETS FROM OPERATIONS | | $ | 1,189,309 | | | $ | 1,221,109 | |
| See accompanying notes to financial statements. |
18
FBP EQUITY & DIVIDEND PLUS FUND
STATEMENTS OF CHANGES IN NET ASSETS |
| | | Six Months
Ended
Sept. 30, 2017
(Unaudited) | | | Year Ended
March 31,
2017 | |
| FROM OPERATIONS | | | | | | |
| Net investment income | | $ | 293,617 | | | $ | 535,532 | |
| Net realized gains (losses) from: | | | | | | | | |
| Investment transactions | | | 254,179 | | | | 1,606,222 | |
| Written option contracts (Note 5) | | | 106,071 | | | | (15,969 | ) |
| Net change in unrealized appreciation (depreciation) on: | | | | | | | | |
| Investments | | | 564,909 | | | | 1,920,752 | |
| Written option contracts (Note 5) | | | (29,467 | ) | | | 81,002 | |
| Net increase in net assets from operations | | | 1,189,309 | | | | 4,127,539 | |
| | | | | | | | | |
| DISTRIBUTIONS TO SHAREHOLDERS (Note 2) | | | | | | | | |
| From net investment income | | | (299,983 | ) | | | (534,664 | ) |
| From net realized gains from investment transactions | | | (1,181,883 | ) | | | (65,593 | ) |
| Decrease in net assets from distributions to shareholders | | | (1,481,866 | ) | | | (600,257 | ) |
| | | | | | | | | |
| FROM CAPITAL SHARE TRANSACTIONS | | | | | | | | |
| Proceeds from shares sold | | | 259,352 | | | | 823,184 | |
| Net asset value of shares issued in reinvestment of distributions to shareholders | | | 1,457,336 | | | | 589,831 | |
| Payments for shares redeemed | | | (1,634,362 | ) | | | (2,289,634 | ) |
| Net increase (decrease) in net assets from capital share transactions | | | 82,326 | | | | (876,619 | ) |
| | | | | | | | | |
| TOTAL INCREASE (DECREASE) IN NET ASSETS | | | (210,231 | ) | | | 2,650,663 | |
| | | | | | | | | |
| NET ASSETS | | | | | | | | |
| Beginning of period | | | 27,414,718 | | | | 24,764,055 | |
| End of period | | $ | 27,204,487 | | | $ | 27,414,718 | |
| | | | | | | | | |
| ACCUMULATED (DISTRIBUTION IN EXCESS OF) NET INVESTMENT INCOME | | $ | (3,663 | ) | | $ | 2,703 | |
| | | | | | | | | |
| CAPITAL SHARE ACTIVITY | | | | | | | | |
| Shares sold | | | 10,202 | | | | 33,608 | |
| Shares reinvested | | | 58,782 | | | | 24,107 | |
| Shares redeemed | | | (64,325 | ) | | | (95,151 | ) |
| Net increase (decrease) in shares outstanding | | | 4,659 | | | | (37,436 | ) |
| Shares outstanding, beginning of period | | | 1,055,990 | | | | 1,093,426 | |
| Shares outstanding, end of period | | | 1,060,649 | | | | 1,055,990 | |
| See accompanying notes to financial statements. |
19
FBP APPRECIATION & INCOME OPPORTUNITIES FUND
STATEMENTS OF CHANGES IN NET ASSETS |
| | | Six Months
Ended
Sept. 30, 2017
(Unaudited) | | | Year Ended
March 31,
2017 | |
| FROM OPERATIONS | | | | | | |
| Net investment income | | $ | 451,001 | | | $ | 514,941 | |
| Net realized gains from: | | | | | | | | |
| Investment transactions | | | 739,458 | | | | 925,796 | |
| Written option contracts (Note 5) | | | 45,361 | | | | 1,635 | |
| Net change in unrealized appreciation (depreciation) on: | | | | | | | | |
| Investments | | | (17,242 | ) | | | 3,253,840 | |
| Written option contracts (Note 5) | | | 2,531 | | | | 17,747 | |
| Net increase in net assets from operations | | | 1,221,109 | | | | 4,713,959 | |
| | | | | | | | | |
| DISTRIBUTIONS TO SHAREHOLDERS (Note 2) | | | | | | | | |
| From net investment income | | | (462,908 | ) | | | (522,350 | ) |
| From net realized gains from investment transactions | | | (602,462 | ) | | | (30,246 | ) |
| Decrease in net assets from distributions to shareholders | | | (1,065,370 | ) | | | (552,596 | ) |
| | | | | | | | | |
| FROM CAPITAL SHARE TRANSACTIONS | | | | | | | | |
| Proceeds from shares sold | | | 111,746 | | | | 1,579,250 | |
| Net asset value of shares issued in reinvestment of distributions to shareholders | | | 1,023,269 | | | | 513,848 | |
| Payments for shares redeemed | | | (1,600,765 | ) | | | (3,854,197 | ) |
| Net decrease in net assets from capital share transactions | | | (465,750 | ) | | | (1,761,099 | ) |
| | | | | | | | | |
| TOTAL INCREASE (DECREASE) IN NET ASSETS | | | (310,011 | ) | | | 2,400,264 | |
| | | | | | | | | |
| NET ASSETS | | | | | | | | |
| Beginning of period | | | 34,068,769 | | | | 31,668,505 | |
| End of period | | $ | 33,758,758 | | | $ | 34,068,769 | |
| | | | | | | | | |
| ACCUMULATED DISTRIBUTIONS IN EXCESS OF NET INVESTMENT INCOME | | $ | (12,399 | ) | | $ | (492 | ) |
| | | | | | | | | |
| CAPITAL SHARE ACTIVITY | | | | | | | | |
| Shares sold | | | 5,960 | | | | 85,200 | |
| Shares reinvested | | | 54,937 | | | | 28,901 | |
| Shares redeemed | | | (84,986 | ) | | | (216,526 | ) |
| Net decrease in shares outstanding | | | (24,089 | ) | | | (102,425 | ) |
| Shares outstanding, beginning of period | | | 1,810,771 | | | | 1,913,196 | |
| Shares outstanding, end of period | | | 1,786,682 | | | | 1,810,771 | |
| See accompanying notes to financial statements. |
20
FBP EQUITY & DIVIDEND PLUS FUND
FINANCIAL HIGHLIGHTS |
| Selected Per Share Data and Ratios for a Share Outstanding Throughout Each Period |
| | | Six Months
Ended
Sept. 30,
2017
(Unaudited) | | | Years Ended March 31, | |
| | | 2017 | | | | 2016 | | | | 2015 | | | | 2014 | | | | 2013 | |
| Net asset value at beginning of period | | $ | 25.96 | | | $ | 22.65 | | | $ | 24.89 | | | $ | 24.78 | | | $ | 21.67 | | | $ | 19.10 | |
| | | | | | | | | | | | | | | | | | | | | | | | | |
| Income (loss) from investment operations: | | | | | | | | | | | | | | | | | | | | | | | | |
| Net investment income | | | 0.28 | | | | 0.50 | | | | 0.61 | | | | 0.50 | | | | 0.42 | | | | 0.47 | |
| Net realized and unrealized gains (losses) on investments | | | 0.86 | | | | 3.37 | | | | (1.21 | ) | | | 0.57 | | | | 3.11 | | | | 2.56 | |
| Total from investment operations | | | 1.14 | | | | 3.87 | | | | (0.60 | ) | | | 1.07 | | | | 3.53 | | | | 3.03 | |
| | | | | | | | | | | | | | | | | | | | | | | | | |
| Less distributions: | | | | | | | | | | | | | | | | | | | | | | | | |
| Dividends from net investment income | | | (0.29 | ) | | | (0.50 | ) | | | (0.61 | ) | | | (0.51 | ) | | | (0.42 | ) | | | (0.46 | ) |
| Distributions from net realized gains | | | (1.16 | ) | | | (0.06 | ) | | | (1.03 | ) | | | (0.45 | ) | | | — | | | | — | |
| Total distributions | | | (1.45 | ) | | | (0.56 | ) | | | (1.64 | ) | | | (0.96 | ) | | | (0.42 | ) | | | (0.46 | ) |
| | | | | | | | | | | | | | | | | | | | | | | | | |
| Net asset value at end of period | | $ | 25.65 | | | $ | 25.96 | | | $ | 22.65 | | | $ | 24.89 | | | $ | 24.78 | | | $ | 21.67 | |
| | | | | | | | | | | | | | | | | | | | | | | | | |
Total return (a) | | | 4.60 | %(b) | | | 17.29 | % | | | (2.31 | %) | | | 4.23 | % | | | 16.40 | % | | | 16.19 | % |
| | | | | | | | | | | | | | | | | | | | | | | | | |
| Net assets at end of period (000’s) | | $ | 27,204 | | | $ | 27,415 | | | $ | 24,764 | | | $ | 28,782 | | | $ | 27,794 | | | $ | 22,570 | |
| | | | | | | | | | | | | | | | | | | | | | | | | |
| Ratio of total expenses to average net assets | | | 1.24 | %(c) | | | 1.25 | % | | | 1.19 | % | | | 1.17 | % | | | 1.21 | % | | | 1.29 | % |
| | | | | | | | | | | | | | | | | | | | | | | | | |
Ratio of net expenses to average net assets (d) | | | 1.07 | %(c) | | | 1.07 | % | | | 1.07 | % | | | 1.07 | % | | | 1.07 | % | | | 1.07 | % |
| | | | | | | | | | | | | | | | | | | | | | | | | |
Ratio of net investment income to average net assets (d) | | | 2.21 | %(c) | | | 2.07 | % | | | 2.60 | % | | | 1.98 | % | | | 1.82 | % | | | 2.40 | % |
| | | | | | | | | | | | | | | | | | | | | | | | | |
| Portfolio turnover rate | | | 4 | %(b) | | | 19 | % | | | 21 | % | | | 19 | % | | | 24 | % | | | 32 | % |
(a) | Total return is a measure of the change in value of an investment in the Fund over the periods covered, which assumes any dividends or capital gains distributions are reinvested in shares of the Fund. Returns shown do not reflect the deduction of taxes a shareholder would pay on Fund distributions or the redemption of Fund shares. |
| | |
(b) | Not annualized. |
| | |
(c) | Annualized. |
| | |
(d) | Ratios were determined after voluntary advisory fee waivers by the Adviser (Note 4). |
| | |
| See accompanying notes to financial statements. |
21
FBP APPRECIATION & INCOME OPPORTUNITIES FUND
FINANCIAL HIGHLIGHTS |
| Selected Per Share Data and Ratios for a Share Outstanding Throughout Each Period |
| | | Six Months
Ended
Sept. 30,
2017
(Unaudited) | | | Years Ended March 31, | |
| | | | 2017 | | | | 2016 | | | | 2015 | | | | 2014 | | | | 2013 | |
| Net asset value at beginning of period | | $ | 18.81 | | | $ | 16.55 | | | $ | 18.53 | | | $ | 18.97 | | | $ | 17.16 | | | $ | 15.85 | |
| | | | | | | | | | | | | | | | | | | | | | | | | |
| Income (loss) from investment operations: | | | | | | | | | | | | | | | | | | | | | | | | |
| Net investment income | | | 0.26 | | | | 0.28 | | | | 0.31 | | | | 0.26 | | | | 0.25 | | | | 0.29 | |
| Net realized and unrealized gains (losses) on investments | | | 0.42 | | | | 2.28 | | | | (1.11 | ) | | | 0.19 | | | | 2.50 | | | | 1.61 | |
| Total from investment operations | | | 0.68 | | | | 2.56 | | | | (0.80 | ) | | | 0.45 | | | | 2.75 | | | | 1.90 | |
| | | | | | | | | | | | | | | | | | | | | | | | | |
| Less distributions: | | | | | | | | | | | | | | | | | | | | | | | | |
| Dividends from net investment income | | | (0.26 | ) | | | (0.28 | ) | | | (0.32 | ) | | | (0.26 | ) | | | (0.26 | ) | | | (0.30 | ) |
| Distributions from net realized gains | | | (0.34 | ) | | | (0.02 | ) | | | (0.86 | ) | | | (0.63 | ) | | | (0.68 | ) | | | (0.29 | ) |
| Total distributions | | | (0.60 | ) | | | (0.30 | ) | | | (1.18 | ) | | | (0.89 | ) | | | (0.94 | ) | | | (0.59 | ) |
| | | | | | | | | | | | | | | | | | | | | | | | | |
| Net asset value at end of period | | $ | 18.89 | | | $ | 18.81 | | | $ | 16.55 | | | $ | 18.53 | | | $ | 18.97 | | | $ | 17.16 | |
| | | | | | | | | | | | | | | | | | | | | | | | | |
Total return (a) | | | 3.70 | %(b) | | | 15.58 | % | | | (4.48 | %) | | | 2.36 | % | | | 16.50 | % | | | 12.51 | % |
| | | | | | | | | | | | | | | | | | | | | | | | | |
| Net assets at end of period (000’s) | | $ | 33,759 | | | $ | 34,069 | | | $ | 31,669 | | | $ | 38,991 | | | $ | 39,951 | | | $ | 36,825 | |
| | | | | | | | | | | | | | | | | | | | | | | | | |
| Ratio of total expenses to average net assets | | | 1.11 | %(c) | | | 1.12 | % | | | 1.05 | % | | | 1.04 | % | | | 1.03 | % | | | 1.06 | % |
| | | | | | | | | | | | | | | | | | | | | | | | | |
Ratio of net expenses to average net assets (d) | | | 1.00 | %(c) | | | 1.00 | % | | | 1.00 | % | | | 1.00 | % | | | 1.00 | % | | | 1.00 | % |
| | | | | | | | | | | | | | | | | | | | | | | | | |
Ratio of net investment income to average net assets (d) | | | 2.68 | %(c) | | | 1.57 | % | | | 1.75 | % | | | 1.36 | % | | | 1.36 | % | | | 1.83 | % |
| | | | | | | | | | | | | | | | | | | | | | | | | |
| Portfolio turnover rate | | | 3 | %(b) | | | 18 | % | | | 23 | % | | | 12 | % | | | 10 | % | | | 15 | % |
(a) | Total return is a measure of the change in value of an investment in the Fund over the periods covered, which assumes any dividends or capital gains distributions are reinvested in shares of the Fund. Returns shown do not reflect the deduction of taxes a shareholder would pay on Fund distributions or the redemption of Fund shares. |
| | |
(b) | Not annualized. |
| | |
(c) | Annualized. |
| | |
(d) | Ratios were determined after voluntary advisory fee waivers by the Adviser (Note 4). |
| | |
| See accompanying notes to financial statements. |
22
THE FLIPPIN, BRUCE & PORTER FUNDS
NOTES TO FINANCIAL STATEMENTS
September 30, 2017 (Unaudited) |
1. Organization
FBP Equity & Dividend Plus Fund and FBP Appreciation & Income Opportunities Fund (the “Funds”) are no-load, diversified series of Williamsburg Investment Trust (the “Trust”), an open-end management investment company registered under the Investment Company Act of 1940, as amended. The Trust was organized as a Massachusetts business trust on July 18, 1988. Other series of the Trust are not included in this report.
FBP Equity & Dividend Plus Fund seeks to provide above-average and growing income while also achieving long-term growth of capital.
FBP Appreciation & Income Opportunities Fund seeks long term capital appreciation and current income, assuming a moderate level of investment risk.
2. Significant Accounting Policies
In October 2016, the U.S. Securities and Exchange Commission (the “SEC”) adopted amendments to Regulation S-X, which impact financial statement presentation, particularly the presentation of derivative investments. The Funds have adopted these amendments, which were effective August 1, 2017, with these financial statements.
Each Fund follows accounting and reporting guidance under Financial Accounting Standards Board Accounting Standards Codification Topic 946, “Financial Services – Investment Companies.” The following is a summary of the Funds’ significant accounting policies. These policies are in conformity with accounting principles generally accepted in the United States of America (“GAAP”).
Securities valuation — The Funds’ portfolio securities are valued as of the close of business of the regular session of the New York Stock Exchange (normally 4:00 p.m., Eastern time). Securities traded on a national stock exchange, including common stocks and closed-end investment companies, are valued based upon the closing price on the principal exchange where the security is traded, if available, otherwise, at the last quoted bid price. Securities that are quoted by NASDAQ are valued at the NASDAQ Official Closing Price. Covered call options written by the Funds are valued at the last quoted sale price or, in the absence of a sale, at the ask price on the principal exchanges on which they are traded. Investments representing shares of other open-end investment companies, including money market funds, are valued at their net asset value (“NAV”) as reported by such companies. When using a quoted price and when the market is considered active, securities will be classified as Level 1 within the fair value hierarchy.
Fixed income securities, including U.S. government and agency obligations and corporate bonds, are typically valued on the basis of prices provided by an independent pricing service. The prices provided by the pricing service are determined with consideration given to institutional bid and last sale prices and take into account securities prices, yields, maturities, call features, ratings, institutional trading in similar groups of securities, and developments related to specific securities. Given the inputs used by the pricing service, these securities are classified as Level 2 within the fair value hierarchy.
23
THE FLIPPIN, BRUCE & PORTER FUNDS
NOTES TO FINANCIAL STATEMENTS (Continued) |
When market quotations are not readily available, if a pricing service cannot provide a price, or the investment adviser believes the price received from the pricing service is not indicative of market value, securities will be valued in good faith at fair value using methods consistent with procedures adopted by the Board of Trustees and will be classified as Level 2 or 3 within the fair value hierarchy (see below), depending on the inputs used. Such methods of fair valuation may include, but are not limited to: multiple of earnings, multiple of book value, discount from market of a similar freely traded security, purchase price of the security, subsequent private transactions in the security or related securities, or a combination of these and other factors.
GAAP establishes a single authoritative definition of fair value, sets out a framework for measuring fair value and requires additional disclosures about fair value measurements. Various inputs are used in determining the value of each Fund’s investments. These inputs are summarized in the three broad levels listed below:
| ● | Level 1 – quoted prices in active markets for identical securities |
| ● | Level 2 – other significant observable inputs |
| ● | Level 3 – significant unobservable inputs |
The inputs or methodology used for valuing securities are not necessarily an indication of the risks associated with investing in those securities. The inputs used to measure fair value may fall into different levels of the fair value hierarchy. In such cases, for disclosure purposes, the level in the fair value hierarchy within which the fair value measurement falls in its entirety is determined based on the lowest level input that is significant to the fair value measurement.
The following is a summary of the inputs used to value each Fund’s investments and other financial instruments as of September 30, 2017, by security type:
| FBP Equity & Dividend Plus Fund | | Level 1 | | | Level 2 | | | Level 3 | | | Total | |
| Investments in Securities: | | | | | | | | | | | | |
| Common Stocks | | $ | 26,455,115 | | | $ | — | | | $ | — | | | $ | 26,455,115 | |
| Money Market Funds | | | 936,726 | | | | — | | | | — | | | | 936,726 | |
| Total | | $ | 27,391,841 | | | $ | — | | | $ | — | | | $ | 27,391,841 | |
| | | | | | | | | | | | | | | | | |
| Other Financial Instruments: | | | | | | | | | | | | | | | | |
| Written Call Options | | $ | (212,416 | ) | | $ | — | | | $ | — | | | $ | (212,416 | ) |
| Total | | $ | (212,416 | ) | | $ | — | | | $ | — | | | $ | (212,416 | ) |
24
THE FLIPPIN, BRUCE & PORTER FUNDS
NOTES TO FINANCIAL STATEMENTS (Continued) |
| FBP Appreciation & Income Opportunities Fund | | Level 1 | | | Level 2 | | | Level 3 | | | Total | |
| Investments in Securities: | | | | | | | | | | | | |
| Common Stocks | | $ | 24,850,360 | | | $ | — | | | $ | — | | | $ | 24,850,360 | |
| U.S. Government & Agency Obligations | | | — | | | | 489,758 | | | | — | | | | 489,758 | |
| Corporate Bonds | | | — | | | | 4,329,571 | | | | — | | | | 4,329,571 | |
| Closed-End Funds | | | 305,200 | | | | — | | | | — | | | | 305,200 | |
| Money Market Funds | | | 3,787,584 | | | | — | | | | — | | | | 3,787,584 | |
| Total | | $ | 28,943,144 | | | $ | 4,819,329 | | | $ | — | | | $ | 33,762,473 | |
| | | | | | | | | | | | | | | | | |
| Other Financial Instruments: | | | | | | | | | | | | | | | | |
| Written Call Options | | $ | (16,650 | ) | | $ | — | | | $ | — | | | $ | (16,650 | ) |
| Total | | $ | (16,650 | ) | | $ | — | | | $ | — | | | $ | (16,650 | ) |
Refer to each Fund’s Schedule of Investments for a listing of the common stocks and corporate bonds by sector type. As of September 30, 2017, the Funds did not have any transfers into or out of any Level. There were no Level 3 securities held by the Funds as of September 30, 2017. It is the Funds’ policy to recognize transfers into or out of any Level at the end of the reporting period.
Share valuation — The NAV per share of each Fund is calculated daily by dividing the total value of its assets, less liabilities, by the number of shares outstanding. The offering price and redemption price per share of each Fund is equal to its NAV per share.
Investment income — Interest income is accrued as earned. Dividend income is recorded on the ex-dividend date. Discounts and premiums on fixed income securities purchased are amortized using the interest method. Withholding taxes on foreign dividends have been recorded in accordance with the Trust’s understanding of the applicable country’s rules and tax rates.
Distributions to shareholders — Dividends arising from net investment income are declared and paid quarterly to shareholders of each Fund. Net realized short-term capital gains, if any, may be distributed throughout the year and net realized long-term capital gains, if any, are distributed at least once each year. The amount of distributions from net investment income and net realized capital gains are determined in accordance with federal income tax regulations, which may differ from GAAP. These “book/tax” differences are either temporary or permanent in nature. Dividends and distributions are recorded on the ex-dividend date. The tax character of distributions paid during the periods ended September 30, 2017 and March 31, 2017 was as follows:
| | Period
Ended | Ordinary Income | Long-Term Capital Gains | Total Distributions |
| FBP Equity & Dividend Plus Fund | 9/30/2017 | $ 299,983 | $ 1,181,883 | $ 1,481,866 |
| | 3/31/2017 | $ 576,357 | $ 23,900 | $ 600,257 |
| FBP Appreciation & Income Opportunities Fund | 9/30/2017 | $ 492,697 | $ 572,673 | $ 1,065,370 |
| | 3/31/2017 | $ 552,596 | $ — | $ 552,596 |
25
THE FLIPPIN, BRUCE & PORTER FUNDS
NOTES TO FINANCIAL STATEMENTS (Continued) |
Investment transactions — Investment transactions are accounted for on trade date for financial reporting purposes. Realized gains and losses on securities sold are determined on a specific identification basis.
Common expenses — Common expenses of the Trust are allocated among the series of the Trust based on relative net assets of each series or the nature of the services performed and the relative applicability to each series.
Options transactions — When the Funds’ investment adviser believes that individual portfolio securities held by the Funds are approaching the top of the adviser’s growth and price expectations, covered call options can be written (sold) against such securities and the Funds will receive a premium in return. The Funds write options only for income generation and hedging purposes and not for speculation. The premiums received from writing the options are recorded as a liability and are subsequently valued daily at the closing prices on their primary exchanges. Premiums received from writing options that expire are treated as realized gains. Premiums received from writing options that are exercised increase the proceeds used to calculate the realized gain or loss on the sale of the underlying security. If a closing purchase transaction is used to terminate a Fund’s obligation on a call option, a gain or loss will be realized, depending upon whether the price of the closing purchase transaction is more or less than the premium previously received on the call option written.
Estimates — The preparation of financial statements in conformity with GAAP requires management to make estimates and assumptions that affect the reported amounts of assets and liabilities and the disclosure of contingent assets and liabilities as of the date of the financial statements and the reported amounts of income and expenses during the reporting period. Actual results could differ from those estimates.
Federal income tax — Each Fund has qualified and intends to continue to qualify as a regulated investment company under the Internal Revenue Code of 1986, as amended (the “Code”). Qualification generally will relieve the Funds of liability for federal income taxes to the extent 100% of their net investment income and any net realized capital gains are distributed in accordance with the Code.
In order to avoid imposition of the excise tax applicable to regulated investment companies, it is also each Fund’s intention to declare as dividends in each calendar year at least 98% of its net investment income (earned during the calendar year) and 98.2% of its net realized capital gains (earned during the twelve months ended October 31) plus undistributed amounts from prior years.
26
THE FLIPPIN, BRUCE & PORTER FUNDS
NOTES TO FINANCIAL STATEMENTS (Continued) |
The following information is computed on a tax basis for each item as of September 30, 2017:
| | | FBP Equity
& Dividend
Plus Fund | | | FBP Appreciation & Income Opportunities
Fund | |
| Cost of portfolio investments and written option contracts | | $ | 21,038,035 | | | $ | 25,553,417 | |
| Gross unrealized appreciation | | $ | 6,861,116 | | | $ | 9,038,967 | |
| Gross unrealized depreciation | | | (719,726 | ) | | | (846,561 | ) |
| Net unrealized appreciation | | | 6,141,390 | | | | 8,192,406 | |
| Accumulated ordinary income (loss) | | | (987 | ) | | | 12,664 | |
| Accumulated capital and other gains | | | 304,396 | | | | 784,702 | |
| Distributions payable | | | (2,676 | ) | | | (22,772 | ) |
| Accumulated distibutable earnings | | $ | 6,442,123 | | | $ | 8,967,000 | |
The difference between the federal income tax cost of portfolio investments and the financial statement cost of portfolio investments for FBP Appreciation & Income Opportunities Fund is due to certain differences in the recognition of capital gains and losses under income tax regulations and GAAP. These “book/tax” differences are temporary in nature and are primarily due to differing methods in the amortization of discounts and premiums on fixed income securities.
The Funds recognize the tax benefits or expenses of uncertain tax positions only when the position is “more likely than not” to be sustained assuming examination by tax authorities. Management has reviewed the tax positions taken by each Fund on federal income tax returns for the current and all open tax years (tax years ended March 31, 2014 through March 31, 2017) and has concluded that no provision for unrecognized tax benefits or expenses is required in these financial statements.
3. Investment Transactions
Investment transactions, other than short-term investments and U.S. government securities, were as follows for the six months ended September 30, 2017:
| | | FBP Equity
& Dividend
Plus Fund | | | FBP Appreciation & Income Opportunities
Fund | |
| Purchases of investment securities | | $ | 1,802,832 | | | $ | 878,274 | |
| Proceeds from sales and maturities of investment securities | | $ | 880,683 | | | $ | 2,465,451 | |
27
THE FLIPPIN, BRUCE & PORTER FUNDS
NOTES TO FINANCIAL STATEMENTS (Continued) |
4. Transactions with Related Parties
INVESTMENT ADVISORY AGREEMENTS
Each Fund’s investments are managed by Flippin, Bruce & Porter, Inc. (the “Adviser”) under the terms of an Investment Advisory Agreement. Under the Investment Advisory Agreements, each Fund pays the Adviser a fee, which is computed and accrued daily and paid monthly, at an annual rate of 0.70% of its average daily net assets up to $250 million; 0.65% of the next $250 million of such assets; and 0.50% of such assets in excess of $500 million.
During the six months ended September 30, 2017, the Adviser voluntarily waived $23,062 and $18,653 of its investment advisory fees from FBP Equity & Dividend Plus Fund and FBP Appreciation & Income Opportunities Fund, respectively. These amounts are not subject to recapture in future periods.
Certain officers and a Trustee of the Trust are also officers of the Adviser.
OTHER SERVICE PROVIDERS
Ultimus Fund Solutions, LLC (“Ultimus”) provides administration, fund accounting, compliance and transfer agent services to the Funds. The Funds pay Ultimus fees in accordance with the agreements for such services. In addition, the Funds pay out-of-pocket expenses including, but not limited to, postage, supplies, and costs of pricing the Funds’ portfolio securities. Certain officers of the Trust are also officers of Ultimus, or of Ultimus Fund Distributors, LLC (the “Distributor”), the principal underwriter of each Fund’s shares and an affiliate of Ultimus. The Distributor is compensated by the Adviser (not the Funds) for acting as principal underwriter.
COMPENSATION OF TRUSTEES
Trustees and officers affiliated with the Adviser or Ultimus are not compensated by the Trust for their services. Each Trustee who is not an affiliated person of the Adviser or Ultimus receives from the Trust an annual retainer of $15,000, payable quarterly; a fee of $1,500 for attendance at each meeting of the Board of Trustees (except that such fee is $2,500 for the independent chair); and a fee of $1,000 for attendance at each meeting of any committee of the Board (except that such fee is $1,500 for the committee chair); plus reimbursement of travel and other expenses incurred in attending meetings. Each series of the Trust pays its proportionate share of such fees.
28
THE FLIPPIN, BRUCE & PORTER FUNDS
NOTES TO FINANCIAL STATEMENTS (Continued) |
5. Derivatives Transactions
Transactions in call option contracts written by the Funds during the six months ended September 30, 2017 were as follows:
| | |
FBP Equity &
Dividend Plus Fund | | | FBP Appreciation
& Income
Opportunities Fund | |
| | | Option Contracts | | | Option Premiums | | | Option Contracts | | | Option Premiums | |
| Options outstanding at beginning of period | | | 1,080 | | | $ | 162,846 | | | | 370 | | | $ | 61,881 | |
| Options written | | | 1,204 | | | | 184,953 | | | | 111 | | | | 21,852 | |
| Options cancelled in a closing purchase transaction | | | (25 | ) | | | (3,724 | ) | | | (40 | ) | | | (4,678 | ) |
| Options expired | | | (812 | ) | | | (102,898 | ) | | | (290 | ) | | | (40,925 | ) |
| Options exercised | | | (105 | ) | | | (22,330 | ) | | | (40 | ) | | | (16,278 | ) |
| Options outstanding at end of period | | | 1,342 | | | $ | 218,847 | | | | 111 | | | $ | 21,852 | |
The location in the Statements of Assets and Liabilities of the Funds’ derivative positions is as follows:
FBP Equity & Dividend Plus Fund
| | | | Fair Value | | | | |
| Type of Derivative (Risk) | Location | | Asset Derivatives | | | Liability Derivatives | | | Gross Notional Amount Outstanding September 30, 2017 | |
| Call options written (Equity) | Written call options, at value | | $ | — | | | $ | (212,416 | ) | | $ | (6,598,620 | ) |
FBP Appreciation & Income Opportunities Fund
| | | | Fair Value | | | | |
| Type of Derivative (Risk) | Location | | Asset
Derivatives | | | Liability
Derivatives | | | Gross Notional Amount Outstanding September 30, 2017 | |
| Call options written (Equity) | Written call options, at value | | $ | — | | | $ | (16,650 | ) | | $ | (531,517 | ) |
29
THE FLIPPIN, BRUCE & PORTER FUNDS
NOTES TO FINANCIAL STATEMENTS (Continued) |
The Funds’ transactions in derivative instruments during the six months ended September 30, 2017 are recorded in the following location in the Statements of Operations:
FBP Equity & Dividend Plus Fund
| Type of Derivative (Risk) | Location | Net
Realized
Gains | Location | Change in Unrealized Appreciation (Depreciation) |
| Call options written (Equity) | Net realized gains from written option contracts | $ 106,071 | Net change in unrealized appreciation (depreciation) on written option contracts | $ (29,467) |
FBP Appreciation & Income Opportunities Fund
| Type of Derivative (Risk) | Location | Net
Realized
Gains | Location | Change in Unrealized Appreciation (Depreciation) |
| Call options written (Equity) | Net realized gains from written option contracts | $ 45,361 | Net change in unrealized appreciation (depreciation) on written option contracts | $ 2,531 |
6. Contingencies and Commitments
The Funds indemnify the Trust’s officers and Trustees for certain liabilities that might arise from the performance of their duties to the Funds. Additionally, in the normal course of business the Funds enter into contracts that contain a variety of representations and warranties and which provide general indemnifications. The Funds’ maximum exposure under these arrangements is unknown, as this would involve future claims that may be made against the Funds that have not yet occurred. However, based on experience, the Funds expect the risk of loss to be remote.
7. Subsequent Events
The Funds are required to recognize in the financial statements the effects of all subsequent events that provide additional evidence about conditions that existed as of the date of the Statements of Assets and Liabilities. For non-recognized subsequent events that must be disclosed to keep the financial statements from being misleading, the Funds are required to disclose the nature of the event as well as an estimate of its financial effect, or a statement that such an estimate cannot be made. Management has evaluated subsequent events through the issuance of these financial statements and has noted no such events.
30
THE FLIPPIN, BRUCE & PORTER FUNDS
ABOUT YOUR FUNDS’ EXPENSES (Unaudited) |
We believe it is important for you to understand the impact of costs on your investment. All mutual funds have operating expenses. As a shareholder of the Funds, you incur ongoing costs, including management fees and other operating expenses. These ongoing costs, which are deducted from each Fund’s gross income, directly reduce the investment return of the Funds.
A mutual fund’s ongoing costs are expressed as a percentage of its average net assets. This figure is known as the expense ratio. The following examples are intended to help you understand the ongoing costs (in dollars) of investing in the Funds and to compare these costs with the ongoing costs of investing in other mutual funds. The examples below are based on an investment of $1,000 made at the beginning of the period shown and held for the entire period (April 1, 2017 through September 30, 2017).
The table below illustrates each Fund’s ongoing costs in two ways:
Actual fund return – This section helps you to estimate the actual expenses that you paid over the period. The “Ending Account Value” shown is derived from each Fund’s actual return, and the fourth column shows the dollar amount of operating expenses that would have been paid by an investor who started with $1,000 in the Funds. You may use the information here, together with the amount you invested, to estimate the expenses that you paid over the period.
To do so, simply divide your account value by $1,000 (for example, an $8,600 account value divided by $1,000 = 8.6), then multiply the result by the number given for the Funds under the heading “Expenses Paid During Period.”
Hypothetical 5% return – This section is intended to help you compare the Funds’ ongoing costs with those of other mutual funds. It assumes that each Fund had an annual return of 5% before expenses during the period shown, but that the expense ratio is unchanged. In this case, because the returns used are not the Funds’ actual returns, the results do not apply to your investment. The example is useful in making comparisons because the SEC requires all mutual funds to calculate expenses based on a 5% return. You can assess each Fund’s ongoing costs by comparing this hypothetical example with the hypothetical examples that appear in shareholder reports of other funds.
Note that expenses shown in the table are meant to highlight and help you compare ongoing costs only. The Funds do not charge sales loads or redemption fees.
The calculations assume no shares were bought or sold during the period. Your actual costs may have been higher or lower, depending on the amount of your investment and the timing of any purchases or redemptions.
More information about the Funds’ expenses, including annual expense ratios for the past five fiscal years, can be found in this report. For additional information on operating expenses and other shareholder costs, please refer to the Funds’ prospectus.
31
THE FLIPPIN, BRUCE & PORTER FUNDS
ABOUT YOUR FUNDS’ EXPENSES (Unaudited) (Continued) |
| Beginning
Account Value
April 1,
2017 | Ending
Account Value
September 30,
2017 | Net
Expense Ratio(a) | Expenses Paid
During Period(b) |
| FBP Equity & Dividend Plus Fund | | | |
| Based on Actual Fund Return | $1,000.00 | $1,046.00 | 1.07% | $5.49 |
| Based on Hypothetical 5% Return (before expenses) | $1,000.00 | $1,019.70 | 1.07% | $5.42 |
| FBP Appreciation & Income Opportunities Fund | | | |
| Based on Actual Fund Return | $1,000.00 | $1,037.00 | 1.00% | $5.11 |
| Based on Hypothetical 5% Return (before expenses) | $1,000.00 | $1,020.05 | 1.00% | $5.06 |
(a) | Annualized, based on the Fund’s most recent one-half year expenses. |
| | |
(b) | Expenses are equal to the Fund’s net expense ratio multiplied by the average account value over the period, multiplied by 183/365 (to reflect the one-half year period). |
32
THE FLIPPIN, BRUCE & PORTER FUNDS
OTHER INFORMATION (Unaudited) |
The Trust files a complete listing of portfolio holdings for the Funds with the SEC as of the end of the first and third quarters of each fiscal year on Form N-Q. The filings are available upon request, by calling 1-800-327-9375. Furthermore, you may obtain a copy of these filings on the SEC’s website at http://www.sec.gov. The Trust’s Forms N-Q may also be reviewed and copied at the SEC’s Public Reference Room in Washington, DC, and information on the operation of the Public Reference Room may be obtained by calling 1-800-SEC-0330.
A description of the policies and procedures that the Funds use to determine how to vote proxies relating to portfolio securities is available without charge upon request by calling toll-free 1-800-327-9375, or on the SEC’s website at http://www.sec.gov. Information regarding how the Funds voted proxies relating to portfolio securities during the most recent 12-month period ended June 30 is also available without charge upon request by calling toll-free 1-800-327-9375, or on the SEC’s website at http://www.sec.gov.
33
|
| Investment Adviser Flippin, Bruce & Porter, Inc. 800 Main Street, Second Floor P.O. Box 6138 Lynchburg, Virginia 24505 Toll-Free 1-800-851-3804 www.fbpfunds.com Administrator Ultimus Fund Solutions, LLC P.O. Box 46707 Cincinnati, Ohio 45246-0707 Toll-Free 1-866-738-1127 Custodian U.S. Bank, N.A. 425 Walnut Street Cincinnati, Ohio 45202 Independent Registered
Public Accounting Firm Cohen & Company, Ltd.
1350 Euclid Avenue, Suite 800 Cleveland, Ohio 44115 | Legal Counsel Sullivan & Worcester LLP 1666 K Street, N.W. Washington, DC 20006 Officers John T. Bruce, President and Portfolio Manager John H. Hanna, IV, Vice President
David J. Marshall, Vice President R. Gregory Porter, III,
Vice President Trustees Robert S. Harris, Ph.D., Chairman John P. Ackerly, IV John T. Bruce George K. Jennison Harris V. Morrissette Elizabeth W. Robertson | |
34
THE GOVERNMENT STREET FUNDS No-Load Mutual Funds Semi-Annual Report
September 30, 2017
(Unaudited) |
The Government Street Equity Fund The Government Street Mid-Cap Fund The Alabama Tax Free Bond Fund |
| LETTER FROM THE PRESIDENT | November 2017 |
Dear Fellow Shareholders:
We are enclosing for your review the unaudited Semi-Annual Report of The Government Street Funds for the period ended September 30, 2017.
The Government Street Equity Fund
The Government Street Equity Fund had a positive 9.36% total return for the 6 month period ended September 30, 2017. By comparison, the S&P 500® Index and the Morningstar Large Blend categories returned 7.71% and 7.23%, respectively.
| Government
Street Equity | S&P 500 | Morningstar
Large Blend |
| 3rd Qtr. 2017 | 5.31% | 4.48% | 4.19% |
| 2nd Qtr. 2017 | 3.85% | 3.09% | 2.92% |
| 1st Qtr. 2017 | 5.83% | 6.07% | 5.57% |
| 4th Qtr. 2016 | 1.71% | 3.82% | 3.86% |
| Year ended 9/30/17 | 17.71% | 18.61% | 17.57% |
The U.S. market delivered strong returns in the third calendar quarter, extending its winning streak to eight consecutive quarters and a remarkable 18 out of the last 19 quarters. The S&P 500 Index closed at an all-time high, gaining 4.5%. But foreign markets did even better, led by emerging markets, which surged 7.9%. European stocks were also very strong performers, gaining 6.2%. More broadly, developed international stocks rose 5.6%. For the third consecutive quarter, the U.S. dollar depreciated against foreign currencies, boosting dollar-based investor returns in those markets.
Within the U.S. market, larger-cap growth stocks—technology stocks in particular—continued their year-to-date dominance over smaller-cap and value stocks, a sharp reversal from what we saw last year. Larger-cap growth stocks are up more than 20% this year, while smaller-cap value stocks have gained 5.6%. The Vanguard 500 is up 14.1% for the year, while the iShares Russell 2000 ETF has gained 11% (helped by a 6.3% surge in September). Looking at industry sectors, energy stocks had a big rebound in September (up 10%) as oil prices rose above $50. But for year-to-date, the sector is still down 6.6%, while technology and health care have soared 27% and 20%, respectively.
We are generally positive on the investment environment, but we believe that less than full investment exposure is prudent. To that end, we continue to maintain money market investments with an anticipated 5% average position for the near future.
The excellent performance of your fund in the past two quarters was widely distributed across the portfolio’s investments. However, the technology sector must be singled out for commentary. It returned, across all its holdings, a total time weighted return of 31.2%. Nvidia, with its high tech, artificial intelligence software was up 68.3%. Facebook, the social media company, followed with a positive 48.6% result. There were numerous results, in the holdings, of mid 20 to high 30 percent performances.
1
The old adage “A rising tide lifts all ships” was certainly applicable in the six month period. That is, all except energy which turned in negative performance for the period.
Major purchases for the period were Packaging Corporation of America (Materials sector), United Parcel Service, Inc. (Industrials sector), NVR, Inc. (Consumer Discretionary sector) and Centene Corporation (Health Care sector). Additionally, investments directly into International holdings were made through Schwab’s Emerging Markets Equity ETF and Vanguard’s FTSE Emerging Markets ETF.
Major sales for the period were Intel (Information Technology sector), Gilead (Health Care sector), O’Reilly Automotive (Consumer Discretionary sector), Ross Stores (Consumer Discretionary sector), Exxon Mobil Corp. (Energy sector) and ATT (Telecommunication Services sector).
The transactions, in total, were distributed along the investment sectors of your fund with the Standard & Poor’s 500 sectors as guidelines. While your fund is not invested with a pseudo index approach, the sectors provide an objective comparison for the diversification we believe important for the control of relative risk in your portfolio. Overall we depend on our own conclusions as to the ultimate security selection and position weightings.
The top 10 holdings in The Government Street Equity Fund as of September 30, 2017 were:
| Security Description | % of Net Assets |
| Apple, Inc. | 5.11% |
| JPMorgan Chase & Company | 4.36% |
| Vanguard Mid-Cap ETF | 4.03% |
| Lockheed Martin Corporation | 3.67% |
| NVIDIA Corporation | 3.24% |
| Fidelity Institutional Money Market Government Portfolio – Class I | 3.16% |
| Visa, Inc. – Class A | 3.10% |
| Comcast Corporation – Class A | 2.49% |
| United Technologies Corporation | 2.47% |
| General Dynamics Corporation | 2.40% |
Exchange-traded funds (“ETFs”) have continued a prominent role in the Fund’s investment holdings, as evidenced by 1 of the top 10 holdings. Each ETF represents a composite holding of an extensive number of securities that have some common characteristic.
As an example, the Vanguard Mid-Cap ETF represents an investment in over 450 individual securities that meet Vanguard’s definition of mid capitalization corporate equities. The inclusion of this one security in the portfolio provided the Fund with broad diversification that would be impossible to achieve individually in a fund with the total value of The Government Street Equity Fund. The ability to achieve diversification utilizing ETF’s has allowed us an opportunity for risk control that would be otherwise unattainable.
2
There were significant individual performances during the twelve months ended September 30, 2017. The five highest returns, held for the entire 12 months, as measured by the time weighted rate of return were:
| Security Description | 1 Year Performance |
| NVIDIA Corporation | 162.50% |
| Western Digital Corporation | 51.47% |
| Albemarle Corporation | 47.01% |
| JPMorgan Chase & Company | 46.87% |
| AbbVie, Inc. | 46.34% |
The five worst individual performances, held for the twelve months ended September 30, 2017, as measured by time weighted rate of return for the entire period were:
| Security Description | 1 Year Performance |
| Mondelēz International, Inc. – Class A | -6.14% |
| Kraft Heinz Company (The) | -10.91% |
| Cardinal Health, Inc. | -11.97% |
| Amgen, Inc. | -12.64% |
| Pioneer Natural Resources Company | -20.49% |
The Fund’s best performing economic sector for the 12 months was Information Technology, up 37.9%. The second-best sector was Financials up 30.1%. The worst performing sector was Energy down -10.6%.
Note: The investment performances listed for economic sectors and securities in the two preceding paragraphs are extracted from an in-house independent time weighted rates of return computation by the Addepar portfolio accounting system. The calculations are gross investment returns. Total investment returns are for the twelve months ended September 30, 2017.
The following comments are drawn from previous newsletters, but continue to reflect our current thoughts on the future investment prospects.
We believe that continued upward movement of markets and economies worldwide are highly dependent on Governments getting their financial balance sheets in order. There has been unparalleled deficit spending around the world. Those economies not directly participating in the credit shortfalls will be indirectly impacted by lower import/export activities brought on by significant debt imposed slowdown. This will occur domestically and internationally as economies have become more highly correlated in their economic cycles.
In response to this perceived scenario; risk management takes precedent over return pursuits in the near term. We believe your fund remains invested to capture returns, but highly diversified to mitigate the risks associated with that position. We believe that the future transition to a sound economic scenario will determine the continuation of current positive performances. We are not totally convinced of that outcome.
3
While significant risks exist, we continue to believe that investors have potential for one of the greatest investment environments for generations. There are over 7 billion people in the world today (USA population is approximately 325 million). Many of these potential consumers are moving into middle class ranks. In our opinion, the demand for goods and services for the future is tremendous. Remember that, in our own economy, approximately 60% of GDP is tied to consumers. With the business advantages that the USA enjoys in manufacturing know how, technology, intellectual content, productivity, and numerous other characteristics, if the U.S. Government will provide a competitive framework for operating, the benefits could be the best ever. We just need Government policies that foster growth in profits and wages domestically and internationally.
There are many additional moving parts in our economy and exogenous factors such as the geopolitical instabilities that will always cause uneven effects. However, it is our thought that keeping our fiscal house in order is basic to all considerations. The irresponsible spending activities of our Government continue to unnerve us. It remains to be seen if the economy can overcome the negative influence of Government policies and have a successful impact on market values.
As of September 30, 2017, the Fund’s net assets were $63.3 million; net asset value per share was $71.99; and the ratio of expenses to net average assets was 0.87%. Portfolio turnover rate was 5%. Income dividends of $0.3229 per share and capital gains of $0.9861 per share were distributed to shareholders during the six months ended September 30, 2017.
The Government Street Mid-Cap Fund
The Government Street Mid-Cap Fund, as of September 30, 2017, produced a fiscal 6 month total return of 7.74%. By comparison the Standard & Poor’s 400® Index and the Morningstar Mid Cap Blended Index, used as relative performance benchmarks, were positive 5.26% and 5.57%, respectively.
The mid-capitalization category of individual companies is usually represented by the Standard & Poor’s 400 ranging from approximately $1.1 billion to $10.0 billion market values. Generally, these companies are considered to have slightly higher risk and return characteristics than the S&P 500 companies, which start at the upper end of the mid cap values and range in sizes 10 times or greater in terms of capitalization. As you would guess, the mid-cap companies tend to be primarily domestically oriented.
Your Fund has a slightly different range of capitalizations than the S&P 400. Upper and lower limits for Fund purchase consideration are $11.7 billion and $894 million, respectively. There are 2 provisions that allow the makeup of the Fund to exceed those limits. To the extent securities originally purchased within the limits have grown to greater capitalizations they may be retained without limitation. Secondly, the Fund manager has latitude to purchase and hold up to 20% of the Fund’s value outside the limitations.
It should be noted that your Fund has begun taking positions directly into International investments through the purchase of Schwab International Small-Cap Equity ETF and Vanguard FTSE All-World ex-US Small-Cap ETF. The holdings in these funds align closely with the capitalization parameters of the domestic investments
4
in the balance of your portfolio’s investments. This is being done to provide additional diversification of the portfolio’s risk component and to address attractive potential return areas. The approach falls within the allowed exceptions previously cited and are expected to improve the compounded investment return over time.
The top 10 holdings in The Government Street Mid-Cap Fund as of September 30, 2017 were:
| Security Description | % of Net Assets |
| Fidelity Institutional Money Market Government – Class I | 6.59% |
| Lam Research Corporation | 3.43% |
| Mid-America Apartment Communities, Inc. | 3.30% |
| NVIDIA Corporation | 2.39% |
| Vanguard Mid-Cap ETF | 2.38% |
| Guggenheim Mid-Cap Core ETF | 2.34% |
| Teleflex, Inc . | 2.24% |
| Albemarle Corporation | 1.88% |
| Graco, Inc. | 1.78% |
| Nasdaq, Inc. | 1.76% |
Exchange-traded funds represent significant holdings in the Fund. Vanguard and Guggenheim mid-caps are all constituted differently, but cover the capitalization ranges mentioned earlier. Since the mid-cap universe contains a much greater number of companies than its larger index counterparts, we like to broaden your portfolios exposure across the range to govern risk control through diversification.
There were significant individual performances during the twelve months ended September 30, 2017. The five highest returns, held for the entire period, as measured by the time weighted rate of return, were:
| Security Description | 1 Year Performance |
| NVIDIA Corporation | 161.88% |
| Lam Research Corporation | 97.98% |
| Graco, Inc. | 69.65% |
| Albemarle Corporation | 61.35% |
| National Instruments Corporation | 52.07% |
The five worst individual performances, held for the entire period, as measured by time weighted rate of return, were:
| Security Description | 1 Year Performance |
| Stericycle, Inc. | -10.63% |
| Oil States International, Inc. | -19.17% |
| J.M. Smucker Company (The) | -20.57% |
| SCANA Corporation | -30.35% |
| Ashland Global Holdings, Inc. | -41.67% |
5
The Fund’s best performing economic sector for the 12 months was Information Technology, up 45.60%. The second-best sector was Materials, up 29.10%. The worst performing sector was Consumer Staples, down -8.50%.
Note: The investment performances listed for economic sectors and securities in the two preceding paragraphs are extracted from an in-house independent time weighted rates of return computation by the Addepar portfolio accounting system. The calculations are gross investment returns. Total investment returns are for the year ended September 30, 2017.
We believe that mid cap stocks offer an attractive combination of growth and safety as they have successfully overcome startup challenges yet remain nimble enough to generate stronger growth than large cap stocks. Mid cap stocks have been able to match the performance of large cap stocks in down markets while exceeding large cap performance in up markets, leading to long-term outperformance.
It may be interesting for the readers to compare and contrast the Global Industry Classification Standard (GICS) sectors between the larger capitalization S&P 500 and the lower capitalization S&P 400. The approximate weights based on component’s capitalizations change daily, but are reasonably stable over short periods. As of October 26, 2017 they are:
| GICS | S&P 500 | S&P 400 |
| Energy | 6.09% | 3.81% |
| Materials | 2.98% | 7.37% |
| Industrial | 10.23% | 15.78% |
| Consumer Discretionary | 11.85% | 11.66% |
| Consumer Staples | 8.23% | 3.74% |
| Health Care | 14.51% | 7.79% |
| Financials | 14.60% | 16.97% |
| Information Technology | 23.23% | 17.76% |
| Telecommunication Services | 2.17% | 0.20% |
| Utilities | 3.12% | 5.58% |
| Real Estate | 2.92% | 9.33% |
The Government Street Mid-Cap Fund uses the S&P 400 sector weights for guidance in its diversification of investment holdings.
As of September 30, 2017, the net assets of the Government Street Mid-Cap Fund were $48.6 million and the net asset value per share was $25.81. The turnover rate for the previous six months was 6% and the total number of holdings was 88 as of September 30, 2017. The net expense ratio for the Fund was 1.06%.
The Alabama Tax Free Bond Fund
Federal Reserve policies and geopolitical events continued to be the primary factors affecting fixed income markets as the third quarter of 2017 drew to a close. Bond prices spiked higher in early September, with the benchmark 10-year Treasury yield (which moves inversely to bond prices) bottoming at 2.06% on a confluence of flight-to-safety fears around tensions with North Korea, catastrophic hurricanes
6
in Texas and Florida, and a potential U.S. debt crisis and the associated threat of a government shutdown. Fears waned as September ended and the yield on the 10-year Treasury shot up to 2.30%, close to where it was at the end of the second quarter.
The U.S. Federal Reserve continues to very gradually tighten monetary policy. As expected at its September 19 meeting, the Fed left the federal funds rate unchanged at a range of 1% to 1.25%, but it kept a potential December, 2017 rate hike on the table and detailed its plan to begin shrinking its $4.5 trillion (quantitative easing) portfolio of Treasury and mortgage-backed bonds. Starting in October the Fed will allow $10 billion worth of bonds to mature and roll off their balance sheet each month, increasing the total roll off by $10 billion each quarter until it reaches $50 billion per month. The financial markets took the Fed announcements in stride.
Market conditions have been generally favorable for investors in municipal bonds. Continued healthy demand accompanied by a decline in new issuance has provided support for municipal bond prices. Supply has been reduced by a sharp decline in the amount of refundings. Income tax revenues on a state and local government level have continued to improve, as have ad valorem tax revenues. Looking forward, fiscal policy changes and revisions to the income tax code will likely impact fixed income securities to some degree. There remains a great deal of uncertainty at this point as to what the final tax package will look like so it is difficult to forecast what the impact will be for bond prices.
The Alabama Tax Free Bond Fund remains invested in high quality short to intermediate term bonds. More than 95% of the portfolio is invested in bonds rated A, AA or AAA by Moody’s or Standard & Poor’s rating agencies. The duration remains at the short end of the targeted range. As of September 30, 2017, the duration was 3.2 years and the average maturity was 3.5 years, up from 3.1 years at the end of March 2017.
Municipal bonds generally posted modest positive returns during the past six months. The total return for The Alabama Tax Free Bond Fund for the six months ended September 30, 2017 was 0.88%. For the same period, the Bloomberg Barclays 3-Year Municipal Bond Index had a return of 1.07% and the Bloomberg Barclays 7-Year Municipal Bond Index returned 2.72%. The net assets of the Fund as of September 30, 2017 were $26,139,207 and the net asset value per share was $10.37. The ratio of net investment income to average net assets during the six months was 1.17% and the net expense ratio was 0.65%.
Thank you for your continued confidence in The Government Street Funds. Please call us if we can be of further service to you.
Very truly yours,
Thomas W. Leavell
President
Leavell Investment Management, Inc.
The Government Street Funds
7
Data presented reflects past performance, which is no guarantee of future results. Investment results and principal value will fluctuate so that shares, when redeemed, may be worth more or less than their original cost. Due to market volatility, current performance may be higher or lower than the performance shown.
This report is submitted for the general information of the shareholders of the Funds. The report is not authorized for distribution to prospective investors in the Funds unless it is accompanied by a current prospectus.
This report reflects our views, opinions and portfolio holdings as of September 30, 2017, the end of the reporting period. These views are subject to change at any time based upon market or other conditions. For more current information throughout the year please visit www.leavellinvestments.com.
8
THE GOVERNMENT STREET EQUITY FUND PORTFOLIO INFORMATION
September 30, 2017 (Unaudited)
Asset Allocation
(% of Net Assets)
Top Ten Equity Holdings
| Security Description | % of Net Assets |
| Apple, Inc. | 5.1% |
| JPMorgan Chase & Company | 4.4% |
| Vanguard Mid-Cap ETF | 4.0% |
| Lockheed Martin Corporation | 3.7% |
| NVIDIA Corporation | 3.2% |
| Visa, Inc. - Class A | 3.1% |
| Comcast Corporation - Class A | 2.5% |
| United Technologies Corporation | 2.5% |
| General Dynamics Corporation | 2.4% |
| Honeywell International, Inc. | 2.2% |
9
THE GOVERNMENT STREET MID-CAP FUND PORTFOLIO INFORMATION
September 30, 2017 (Unaudited)
Asset Allocation
(% of Net Assets)
Top Ten Equity Holdings
| Security Description | % of Net Assets |
| Lam Research Corporation | 3.4% |
| Mid-America Apartment Communities, Inc. | 3.3% |
| NVIDIA Corporation | 2.4% |
| Vanguard Mid-Cap ETF | 2.4% |
| Guggenheim Mid-Cap Core ETF | 2.3% |
| Teleflex, Inc. | 2.2% |
| Albemarle Corporation | 1.9% |
| Graco, Inc. | 1.8% |
| Nasdaq, Inc. | 1.8% |
| Arrow Electronics, Inc. | 1.7% |
10
THE ALABAMA TAX FREE BOND FUND
PORTFOLIO INFORMATION
September 30, 2017 (Unaudited)
Asset Allocation
(% of Net Assets)
| Distribution by Rating |
| Rating | | % of Holdings |
| AAA | | 9.5% |
| AA | | 70.6% |
| A | | 3.8% |
| Not Rated | | 16.1% |
11
THE GOVERNMENT STREET EQUITY FUND
SCHEDULE OF INVESTMENTS
September 30, 2017 (Unaudited) |
| COMMON STOCKS — 91.8% | | Shares | | | Value | |
| Consumer Discretionary — 9.3% | | | | | | |
| BorgWarner, Inc. | | | 8,000 | | | $ | 409,840 | |
| Comcast Corporation - Class A | | | 41,000 | | | | 1,577,680 | |
| Home Depot, Inc. (The) | | | 6,500 | | | | 1,063,140 | |
JD.com, Inc. - ADR (a) | | | 5,000 | | | | 191,000 | |
| Lowe's Companies, Inc. | | | 8,000 | | | | 639,520 | |
| McDonald's Corporation | | | 5,000 | | | | 783,400 | |
| NIKE, Inc. - Class B | | | 13,900 | | | | 720,715 | |
NVR, Inc. (a) | | | 100 | | | | 285,500 | |
| Vail Resorts, Inc. | | | 1,000 | | | | 228,120 | |
| | | | | | | | 5,898,915 | |
| Consumer Staples — 3.7% | | | | | | | | |
| Coca-Cola Company (The) | | | 12,000 | | | | 540,120 | |
| Kraft Heinz Company (The) | | | 1,378 | | | | 106,864 | |
| McCormick & Company, Inc. | | | 7,000 | | | | 718,480 | |
| Mondelēz International, Inc. - Class A | | | 10,736 | | | | 436,526 | |
| Procter & Gamble Company (The) | | | 6,000 | | | | 545,880 | |
| | | | | | | | 2,347,870 | |
| Energy — 3.1% | | | | | | | | |
| Enbridge, Inc. | | | 20,664 | | | | 864,582 | |
| Pioneer Natural Resources Company | | | 7,500 | | | | 1,106,550 | |
| | | | | | | | 1,971,132 | |
| Financials — 13.7% | | | | | | | | |
| Aflac, Inc. | | | 11,565 | | | | 941,275 | |
Berkshire Hathaway, Inc. - Class B (a) | | | 4,000 | | | | 733,280 | |
| Brookfield Asset Management, Inc. - Class A | | | 33,500 | | | | 1,383,550 | |
| CME Group, Inc. | | | 8,500 | | | | 1,153,280 | |
| Intercontinental Exchange, Inc. | | | 20,000 | | | | 1,374,000 | |
| JPMorgan Chase & Company | | | 29,000 | | | | 2,769,790 | |
| Toronto-Dominion Bank (The) | | | 6,000 | | | | 337,620 | |
| | | | | | | | 8,692,795 | |
| Health Care — 11.8% | | | | | | | | |
| Abbott Laboratories | | | 9,000 | | | | 480,240 | |
| AbbVie, Inc. | | | 11,500 | | | | 1,021,890 | |
| Amgen, Inc. | | | 2,000 | | | | 372,900 | |
| Bio-Techne Corporation | | | 9,000 | | | | 1,088,010 | |
| Cardinal Health, Inc. | | | 10,000 | | | | 669,200 | |
Centene Corporation (a) | | | 7,000 | | | | 677,390 | |
Cerner Corporation (a) | | | 8,000 | | | | 570,560 | |
Henry Schein, Inc. (a) | | | 9,000 | | | | 737,910 | |
| Merck & Company, Inc. | | | 9,000 | | | | 576,270 | |
| Pfizer, Inc. | | | 27,000 | | | | 963,900 | |
12
THE GOVERNMENT STREET EQUITY FUND
SCHEDULE OF INVESTMENTS (Continued) |
| COMMON STOCKS — 91.8% (Continued) | | Shares | | | Value | |
| Health Care — 11.8% (Continued) | | | | | | |
Regeneron Pharmaceuticals, Inc. (a) | | | 670 | | | $ | 299,570 | |
| | | | | | | | 7,457,840 | |
| Industrials — 12.5% | | | | | | | | |
| Emerson Electric Company | | | 13,000 | | | | 816,920 | |
| General Dynamics Corporation | | | 7,400 | | | | 1,521,292 | |
| Honeywell International, Inc. | | | 10,000 | | | | 1,417,400 | |
| Lockheed Martin Corporation | | | 7,500 | | | | 2,327,175 | |
| United Parcel Service, Inc. - Class B | | | 2,000 | | | | 240,180 | |
| United Technologies Corporation | | | 13,500 | | | | 1,567,080 | |
| | | | | | | | 7,890,047 | |
| Information Technology — 25.4% | | | | | | | | |
| Accenture plc - Class A | | | 9,500 | | | | 1,283,165 | |
Alphabet, Inc. - Class A (a) | | | 800 | | | | 778,976 | |
Alphabet, Inc. - Class C (a) | | | 1,302 | | | | 1,248,761 | |
| Apple, Inc. | | | 21,045 | | | | 3,243,456 | |
| Automatic Data Processing, Inc. | | | 4,500 | | | | 491,940 | |
Facebook, Inc. - Class A (a) | | | 5,300 | | | | 905,611 | |
| MasterCard, Inc. - Class A | | | 1,350 | | | | 190,620 | |
| Microsoft Corporation | | | 11,000 | | | | 819,390 | |
| NVIDIA Corporation | | | 11,500 | | | | 2,055,855 | |
| TE Connectivity Ltd. | | | 12,000 | | | | 996,720 | |
| Tencent Holdings Ltd. - ADR | | | 6,000 | | | | 263,490 | |
| Texas Instruments, Inc. | | | 12,000 | | | | 1,075,680 | |
| Visa, Inc. - Class A | | | 18,700 | | | | 1,967,988 | |
| Western Digital Corporation | | | 9,000 | | | | 777,600 | |
| | | | | | | | 16,099,252 | |
| Materials — 7.0% | | | | | | | | |
| Albemarle Corporation | | | 8,000 | | | | 1,090,480 | |
| DowDuPont, Inc. | | | 11,000 | | | | 761,530 | |
| Ecolab, Inc. | | | 6,000 | | | | 771,660 | |
| Packaging Corporation of America | | | 2,000 | | | | 229,360 | |
| Praxair, Inc. | | | 5,000 | | | | 698,700 | |
| Vulcan Materials Company | | | 7,000 | | | | 837,200 | |
| | | | | | | | 4,388,930 | |
| Real Estate — 1.9% | | | | | | | | |
| Mid-America Apartment Communities, Inc. | | | 11,394 | | | | 1,217,791 | |
| | | | | | | | | |
| Utilities — 3.4% | | | | | | | | |
| Duke Energy Corporation | | | 8,250 | | | | 692,340 | |
| Southern Company (The) | | | 12,000 | | | | 589,680 | |
| WEC Energy Group, Inc. | | | 14,000 | | | | 878,920 | |
| | | | | | | | 2,160,940 | |
| | | | | | | | | |
Total Common Stocks (Cost $30,616,767) | | | | | | $ | 58,125,512 | |
13
THE GOVERNMENT STREET EQUITY FUND
SCHEDULE OF INVESTMENTS (Continued) |
| EXCHANGE-TRADED FUNDS — 5.2% | | Shares | | | Value | |
| Schwab Emerging Markets Equity ETF | | | 13,500 | | | $ | 363,285 | |
| Vanguard FTSE Emerging Markets ETF | | | 8,500 | | | | 370,345 | |
| Vanguard Mid-Cap ETF | | | 17,350 | | | | 2,550,450 | |
Total Exchange-Traded Funds (Cost $1,675,450) | | | | | | $ | 3,284,080 | |
| MONEY MARKET FUNDS — 3.2% | | Shares | | | Value | |
Fidelity Institutional Money Market Government Portfolio - Class I, 0.91% (b) (Cost $2,005,476) | | | 2,005,476 | | | $ | 2,005,476 | |
| | | | | | | | | |
Total Investments at Value — 100.2% (Cost $34,297,693) | | | | | | $ | 63,415,068 | |
| | | | | | | | | |
| Liabilities in Excess of Other Assets — (0.2%) | | | | | | | (95,910 | ) |
| | | | | | | | | |
| Net Assets — 100.0% | | | | | | $ | 63,319,158 | |
| ADR - American Depositary Receipt. |
| |
(a) | Non-income producing security. |
| | |
(b) | The rate shown is the 7-day effective yield as of September 30, 2017. |
| | |
| See accompanying notes to financial statements. |
14
THE GOVERNMENT STREET MID-CAP FUND
SCHEDULE OF INVESTMENTS
September 30, 2017 (Unaudited) |
| COMMON STOCKS — 85.7% | | Shares | | | Value | |
| Consumer Discretionary — 7.8% | | | | | | |
| Cracker Barrel Old Country Store, Inc. | | | 1,500 | | | $ | 227,430 | |
| Gildan Activewear, Inc. | | | 13,400 | | | | 419,152 | |
| Hasbro, Inc. | | | 7,000 | | | | 683,690 | |
| Leggett & Platt, Inc. | | | 7,000 | | | | 334,110 | |
NVR, Inc. (a) | | | 200 | | | | 571,000 | |
| Service Corporation International | | | 17,200 | | | | 593,400 | |
| Tiffany & Company | | | 3,475 | | | | 318,936 | |
| Vail Resorts, Inc. | | | 1,500 | | | | 342,180 | |
| VF Corporation | | | 4,700 | | | | 298,779 | |
| | | | | | | | 3,788,677 | |
| Consumer Staples — 2.5% | | | | | | | | |
| Church & Dwight Company, Inc. | | | 9,000 | | | | 436,050 | |
| Energizer Holdings, Inc. | | | 5,000 | | | | 230,250 | |
| J.M. Smucker Company (The) | | | 2,500 | | | | 262,325 | |
| Tyson Foods, Inc. - Class A | | | 4,000 | | | | 281,800 | |
| | | | | | | | 1,210,425 | |
| Energy — 3.0% | | | | | | | | |
| Andeavor | | | 1,740 | | | | 179,481 | |
Oil States International, Inc. (a) | | | 7,000 | | | | 177,450 | |
| ONEOK, Inc. | | | 11,000 | | | | 609,510 | |
| Patterson-UTI Energy, Inc. | | | 24,000 | | | | 502,560 | |
| | | | | | | | 1,469,001 | |
| Financials — 17.1% | | | | | | | | |
Alleghany Corporation (a) | | | 865 | | | | 479,219 | |
| American Financial Group, Inc. | | | 7,600 | | | | 786,220 | |
| Arthur J. Gallagher & Company | | | 9,250 | | | | 569,337 | |
| Axis Capital Holdings Ltd. | | | 5,000 | | | | 286,550 | |
| Bank of Hawaii Corporation | | | 4,000 | | | | 333,440 | |
| Berkley (W.R.) Corporation | | | 7,450 | | | | 497,213 | |
| Brown & Brown, Inc. | | | 10,000 | | | | 481,900 | |
| CME Group, Inc. | | | 5,735 | | | | 778,125 | |
| Cullen/Frost Bankers, Inc. | | | 4,000 | | | | 379,680 | |
| Eaton Vance Corporation | | | 12,000 | | | | 592,440 | |
| Intercontinental Exchange, Inc. | | | 11,000 | | | | 755,700 | |
| Nasdaq, Inc. | | | 11,000 | | | | 853,270 | |
| Old Republic International Corporation | | | 24,400 | | | | 480,436 | |
| ProAssurance Corporation | | | 7,000 | | | | 382,550 | |
| SEI Investments Company | | | 10,500 | | | | 641,130 | |
| | | | | | | | 8,297,210 | |
| Health Care — 11.4% | | | | | | | | |
Bio-Rad Laboratories, Inc. - Class A (a) | | | 1,300 | | | | 288,886 | |
| Bio-Techne Corporation | | | 5,000 | | | | 604,450 | |
15
THE GOVERNMENT STREET MID-CAP FUND
SCHEDULE OF INVESTMENTS (Continued) |
| COMMON STOCKS — 85.7% (Continued) | | Shares | | | Value | |
| Health Care — 11.4% (Continued) | | | | | | |
Centene Corporation (a) | | | 6,000 | | | $ | 580,620 | |
Charles River Laboratories International, Inc. (a) | | | 4,500 | | | | 486,090 | |
| Chemed Corporation | | | 3,000 | | | | 606,150 | |
| Computer Programs & Systems, Inc. | | | 3,000 | | | | 88,650 | |
Henry Schein, Inc. (a) | | | 7,000 | | | | 573,930 | |
Laboratory Corporation of America Holdings (a) | | | 2,574 | | | | 388,597 | |
| ResMed, Inc. | | | 6,000 | | | | 461,760 | |
| Teleflex, Inc. | | | 4,500 | | | | 1,088,865 | |
Waters Corporation (a) | | | 2,000 | | | | 359,040 | |
| | | | | | | | 5,527,038 | |
| Industrials — 12.2% | | | | | | | | |
| AMETEK, Inc. | | | 1,350 | | | | 89,154 | |
| C.H. Robinson Worldwide, Inc. | | | 3,000 | | | | 228,300 | |
| Deluxe Corporation | | | 3,000 | | | | 218,880 | |
| Donaldson Company, Inc. | | | 13,000 | | | | 597,220 | |
| Expeditors International of Washington, Inc. | | | 8,000 | | | | 478,880 | |
| Fastenal Company | | | 10,000 | | | | 455,800 | |
| Graco, Inc. | | | 7,000 | | | | 865,830 | |
| Jacobs Engineering Group, Inc. | | | 5,475 | | | | 319,028 | |
| L3 Technologies, Inc. | | | 3,000 | | | | 565,290 | |
| MSC Industrial Direct Company, Inc. - Class A | | | 6,000 | | | | 453,420 | |
| Pentair plc | | | 2,900 | | | | 197,084 | |
| Snap-on, Inc. | | | 1,475 | | | | 219,790 | |
Stericycle, Inc. (a) | | | 2,400 | | | | 171,888 | |
| Waste Connections, Inc. | | | 10,500 | | | | 734,580 | |
| Woodward, Inc. | | | 4,150 | | | | 322,081 | |
| | | | | | | | 5,917,225 | |
| Information Technology — 18.1% | | | | | | | | |
| Analog Devices, Inc. | | | 3,671 | | | | 316,330 | |
ANSYS, Inc. (a) | | | 3,500 | | | | 429,555 | |
Arrow Electronics, Inc. (a) | | | 10,100 | | | | 812,141 | |
| Broadridge Financial Solutions, Inc. | | | 3,500 | | | | 282,870 | |
| DST Systems, Inc. | | | 10,200 | | | | 559,776 | |
| Harris Corporation | | | 6,000 | | | | 790,080 | |
| Jack Henry & Associates, Inc. | | | 7,700 | | | | 791,483 | |
| Lam Research Corporation | | | 9,000 | | | | 1,665,360 | |
| Microchip Technology, Inc. | | | 6,000 | | | | 538,680 | |
| National Instruments Corporation | | | 12,000 | | | | 506,040 | |
| NVIDIA Corporation | | | 6,500 | | | | 1,162,005 | |
Tech Data Corporation (a) | | | 3,500 | | | | 310,975 | |
| Western Digital Corporation | | | 1,693 | | | | 146,275 | |
| Xilinx, Inc. | | | 7,000 | | | | 495,810 | |
| | | | | | | | 8,807,380 | |
16
THE GOVERNMENT STREET MID-CAP FUND
SCHEDULE OF INVESTMENTS (Continued) |
| COMMON STOCKS — 85.7% (Continued) | | Shares | | | Value | |
| Materials — 7.2% | | | | | | |
| Albemarle Corporation | | | 6,700 | | | $ | 913,277 | |
| Ashland Global Holdings, Inc. | | | 4,500 | | | | 294,255 | |
| Martin Marietta Materials, Inc. | | | 3,000 | | | | 618,690 | |
| Packaging Corporation of America | | | 7,000 | | | | 802,760 | |
| Scotts Miracle-Gro Company (The) | | | 2,500 | | | | 243,350 | |
| Steel Dynamics, Inc. | | | 12,000 | | | | 413,640 | |
| Valvoline, Inc. | | | 8,236 | | | | 193,134 | |
| | | | | | | | 3,479,106 | |
| Real Estate — 3.3% | | | | | | | | |
| Mid-America Apartment Communities, Inc. | | | 15,000 | | | | 1,603,200 | |
| | | | | | | | | |
| Utilities — 3.1% | | | | | | | | |
| AmeriGas Partners, L.P. | | | 6,500 | | | | 292,110 | |
| ONE Gas, Inc. | | | 500 | | | | 36,820 | |
| SCANA Corporation | | | 8,530 | | | | 413,620 | |
| Vectren Corporation | | | 11,600 | | | | 762,932 | |
| | | | | | | | 1,505,482 | |
| | | | | | | | | |
Total Common Stocks (Cost $19,484,743) | | | | | | $ | 41,604,744 | |
| EXCHANGE-TRADED FUNDS — 7.8% | | Shares | | | Value | |
| Guggenheim Mid-Cap Core ETF | | | 18,100 | | | $ | 1,138,128 | |
| Schwab International Small-Cap Equity ETF | | | 19,000 | | | | 680,580 | |
| Vanguard FTSE All-World ex-US Small-Cap ETF | | | 7,000 | | | | 804,510 | |
| Vanguard Mid-Cap ETF | | | 7,850 | | | | 1,153,950 | |
Total Exchange-Traded Funds (Cost $2,620,896) | | | | | | $ | 3,777,168 | |
17
THE GOVERNMENT STREET MID-CAP FUND
SCHEDULE OF INVESTMENTS (Continued) |
| MONEY MARKET FUNDS — 6.6% | | Shares | | | Value | |
Fidelity Institutional Money Market Government Portfolio - Class I, 0.91% (b) (Cost $3,202,032) | | | 3,202,032 | | | $ | 3,202,032 | |
| | | | | | | | | |
Total Investments at Value — 100.1% (Cost $25,307,671) | | | | | | $ | 48,583,944 | |
| | | | | | | | | |
| Liabilities in Excess of Other Assets — (0.1%) | | | | | | | (28,379 | ) |
| | | | | | | | | |
| Net Assets — 100.0% | | | | | | $ | 48,555,565 | |
(a) | Non-income producing security. |
| | |
(b) | The rate shown is the 7-day effective yield as of September 30, 2017. |
| | |
| See accompanying notes to financial statements. |
18
THE ALABAMA TAX FREE BOND FUND
SCHEDULE OF INVESTMENTS
September 30, 2017 (Unaudited) |
| ALABAMA FIXED RATE REVENUE AND GENERAL OBLIGATION (GO) BONDS — 96.9% | | Par Value | | | Value | |
| Alabama Drinking Water Financing Auth., Series A, Rev., | | | | | | |
| 3.00%, due 08/15/2019 | | $ | 530,000 | | | $ | 549,016 | |
| Alabama State Public School & College Auth., Capital Improvements, Rev., | | | | | | | | |
| 5.00%, due 12/01/2017 | | | 470,000 | | | | 473,407 | |
| Alabama State Public School & College Auth., Capital Improvements, Series A, Rev., | | | | | | | | |
| 3.75%, due 02/01/2018 | | | 190,000 | | | | 191,826 | |
| 3.75%, due 02/01/2018 | | | 10,000 | | | | 10,093 | |
| Alabama State Public School & College Auth., Capital Improvements, Series D, Rev., | | | | | | | | |
| 2.00%, due 09/01/2018 | | | 565,000 | | | | 570,294 | |
| Alabama State, Series A, GO, | | | | | | | | |
| 5.00%, due 08/01/2023 | | | 400,000 | | | | 476,256 | |
| 5.00%, due 08/01/2024 | | | 500,000 | | | | 606,030 | |
| Athens, AL, Electric Rev., Warrants, | | | | | | | | |
| 3.00%, due 06/01/2019 | | | 375,000 | | | | 385,718 | |
| Athens, AL, GO, Warrants, | | | | | | | | |
| 4.00%, due 09/01/2018 | | | 300,000 | | | | 308,043 | |
| 5.00%, due 04/01/2024 | | | 500,000 | | | | 590,910 | |
| Athens, AL, Water & Sewer Rev., | | | | | | | | |
| 3.50%, due 05/01/2023 | | | 350,000 | | | | 380,534 | |
| Auburn University, AL, General Fee Rev., | | | | | | | | |
| 5.00%, due 06/01/2018 | | | 315,000 | | | | 323,524 | |
| 5.00%, due 06/01/2020 | | | 350,000 | | | | 385,402 | |
| 5.00%, due 06/01/2021 | | | 200,000 | | | | 226,730 | |
| Auburn, AL, Refunding & Capital Improvements, Series B, GO, Warrants, | | | | | | | | |
| 4.00%, due 08/01/2018 | | | 200,000 | | | | 204,762 | |
| Auburn, AL, School, Series A, GO, Warrants, | | | | | | | | |
| 5.00%, due 08/01/2018 | | | 500,000 | | | | 516,710 | |
| Baldwin Co., AL, GO, Warrants, | | | | | | | | |
| 4.00%, due 06/01/2019 | | | 200,000 | | | | 209,598 | |
| Birmingham, AL, Waterworks Board, Water Rev., | | | | | | | | |
| 3.625%, due 07/01/2018 | | | 250,000 | | | | 254,943 | |
| Calera, AL, GO, Warrants, | | | | | | | | |
| 3.00%, due 12/01/2017 | | | 410,000 | | | | 411,365 | |
| Chambers Co., AL, Gasoline Tax Anticipation, Rev., Warrants, | | | | | | | | |
| 2.00%, due 11/01/2019 | | | 290,000 | | | | 290,165 | |
19
THE ALABAMA TAX FREE BOND FUND
SCHEDULE OF INVESTMENTS (Continued) |
| ALABAMA FIXED RATE REVENUE AND GENERAL OBLIGATION (GO) BONDS — 96.9% (Continued) | | Par Value | | | Value | |
| Cullman, AL, Board of Education Special Tax School Warrants, Rev., | | | | | | |
| 2.00%, due 03/01/2023 | | $ | 325,000 | | | $ | 328,725 | |
| Daphne, AL, GO, Warrants, | | | | | | | | |
| 2.10%, due 04/01/2023 | | | 400,000 | | | | 405,592 | |
| Decatur, AL, Sewer Rev., Warrants, | | | | | | | | |
| 3.00%, due 08/15/2019 | | | 500,000 | | | | 516,375 | |
| Elmore Co., AL, GO, Warrants, | | | | | | | | |
| 5.00%, due 10/01/2022 | | | 415,000 | | | | 479,047 | |
| Florence, AL, GO, Warrants, | | | | | | | | |
| 4.00%, due 08/01/2018 | | | 575,000 | | | | 589,099 | |
| Foley, AL, Utilities Board, Rev., | | | | | | | | |
| 4.00%, due 11/01/2018 | | | 710,000 | | | | 732,379 | |
| 4.00%, due 11/01/2019 | | | 225,000 | | | | 237,780 | |
| Hoover City, AL, Board of Education, Special Tax School Warrants, | | | | | | | | |
| 4.00%, due 02/15/2020 | | | 470,000 | | | | 499,897 | |
| Huntsville, AL, GO, Refunding and Capital Improvement Warrants, | | | | | | | | |
| 4.00%, due 09/01/2018 | | | 500,000 | | | | 513,810 | |
| Huntsville, AL, Series A, GO, Warrants, | | | | | | | | |
| 5.00%, due 05/01/2024 | | | 665,000 | | | | 801,398 | |
| Huntsville, AL, Series C, GO, School Warrants, | | | | | | | | |
| 5.00%, due 11/01/2023 | | | 400,000 | | | | 478,592 | |
| Huntsville, AL, Series C, GO, Warrants, | | | | | | | | |
| 4.00%, due 05/01/2022 | | | 500,000 | | | | 556,965 | |
| Huntsville, AL, Series E, GO, Warrants, | | | | | | | | |
| 5.00%, due 11/01/2022 | | | 240,000 | | | | 280,788 | |
| 5.00%, due 11/01/2024 | | | 265,000 | | | | 321,058 | |
| Lee Co., AL, Board of Education Warrants, Revenue, | | | | | | | | |
| 4.00%, due 02/01/2025 | | | 500,000 | | | | 566,400 | |
| Limestone Co., AL, Board of Education, Special Tax Warrants, | | | | | | | | |
| 3.00%, due 11/01/2019 | | | 560,000 | | | | 577,086 | |
| Macon Co., AL, GO, Warrants, | | | | | | | | |
| 4.25%, due 10/01/2027, | | | | | | | | |
| Prerefunded 10/01/2017 @ 100 | | | 200,000 | | | | 200,040 | |
| Madison Co., AL, Board of Education, Rev., Tax Anticipation Warrants, | | | | | | | | |
| 2.00%, due 09/01/2019 | | | 220,000 | | | | 222,941 | |
| Madison Co., AL, GO, School Warrants, | | | | | | | | |
| 5.00%, due 03/01/2025 | | | 500,000 | | | | 602,875 | |
20
THE ALABAMA TAX FREE BOND FUND
SCHEDULE OF INVESTMENTS (Continued) |
| ALABAMA FIXED RATE REVENUE AND GENERAL OBLIGATION (GO) BONDS — 96.9% (Continued) | | Par Value | | | Value | |
| Madison Co., AL, GO, Warrants, | | | | | | |
| 4.00%, due 09/01/2021 | | $ | 465,000 | | | $ | 509,482 | |
| Madison Co., AL, Water & Wastewater Board, Rev., | | | | | | | | |
| 3.00%, due 12/01/2019 | | | 430,000 | | | | 447,626 | |
| Mobile Co., AL, GO, Refunding, | | | | | | | | |
| 5.00%, due 06/01/2023 | | | 520,000 | | | | 612,175 | |
| Mobile, AL, Board of School Commissioners, GO, Warrants, | | | | | | | | |
| 5.00%, due 03/01/2025 | | | 250,000 | | | | 298,773 | |
| Montgomery, AL, GO, Warrants, | | | | | | | | |
| 2.50%, due 04/01/2021 | | | 500,000 | | | | 502,610 | |
| Montgomery, Al, Series A, Go, Warrants | | | | | | | | |
| 5.00%, due 02/01/2024 | | | 220,000 | | | | 238,643 | |
| Morgan Co., AL, Board of Education, Capital Outlay Warrants, Rev., | | | | | | | | |
| 4.00%, due 03/01/2019 | | | 165,000 | | | | 171,798 | |
| Mountain Brook, AL, City Board of Education, GO, Warrants, | | | | | | | | |
| 3.00%, due 03/01/2020 | | | 300,000 | | | | 313,170 | |
| North Alabama Gas District, Rev., | | | | | | | | |
| 3.00%, due 06/01/2020 | | | 420,000 | | | | 423,935 | |
| Northport, AL, GO, Warrants, | | | | | | | | |
| 3.00%, due 09/01/2024 | | | 385,000 | | | | 409,933 | |
| Opelika, AL, GO, Warrants, | | | | | | | | |
| 2.00%, due 11/01/2017 | | | 275,000 | | | | 275,242 | |
| Opelika, AL, Utilities Board, Series B, Rev., | | | | | | | | |
| 3.00%, due 06/01/2018 | | | 215,000 | | | | 217,900 | |
| Orange Beach, AL, GO, Warrants, | | | | | | | | |
| 4.00%, due 02/01/2018 | | | 200,000 | | | | 201,968 | |
| Prattville, AL, GO, Warrants, | | | | | | | | |
| 5.00%, due 11/01/2022 | | | 400,000 | | | | 464,396 | |
| Russellville, AL, Rev., | | | | | | | | |
| 3.00%, due 03/01/2025 | | | 475,000 | | | | 495,240 | |
| Shelby Co., AL, Special Tax, School Warrants, | | | | | | | | |
| 3.00%, due 02/01/2023 | | | 300,000 | | | | 318,240 | |
| Sylacauga, AL, Utilities Board, Rev., | | | | | | | | |
| 3.00%, due 05/01/2021 | | | 310,000 | | | | 327,078 | |
| Trussville, AL, GO, | | | | | | | | |
| 5.00%, due 10/01/2019 | | | 400,000 | | | | 430,736 | |
| Tuscaloosa, AL, Series B, GO, Warrants, | | | | | | | | |
| 4.00%, due 01/01/2020 | | | 500,000 | | | | 531,400 | |
21
THE ALABAMA TAX FREE BOND FUND
SCHEDULE OF INVESTMENTS (Continued) |
| ALABAMA FIXED RATE REVENUE AND GENERAL OBLIGATION (GO) BONDS — 96.9% (Continued) | | Par Value | | | Value | |
| Vestavia Hills, AL, GO, Warrants, | | | | | | |
| 4.00%, due 02/01/2018 | | $ | 515,000 | | | $ | 519,944 | |
| 4.00%, due 02/01/2021 | | | 500,000 | | | | 542,110 | |
| 4.00%, due 02/01/2025 | | | 500,000 | | | | 566,035 | |
| Vestavia Hills, AL, Series A, GO, Warrants, | | | | | | | | |
| 3.00%, due 02/01/2018 | | | 240,000 | | | | 241,594 | |
| | | | | | | | | |
Total Alabama Fixed Rate Revenue and General Obligation (GO) Bonds (Cost $25,171,428) | | | | | | $ | 25,336,201 | |
| MONEY MARKET FUNDS — 2.3% | | Shares | | | Value | |
Federated Government Obligations Fund - Institutional Class, 0.89% (a) (Cost $588,485) | | | 588,485 | | | $ | 588,485 | |
| | | | | | | | | |
Total Investments at Value — 99.2% (Cost $25,759,913) | | | | | | $ | 25,924,686 | |
| | | | | | | | | |
| Other Assets in Excess of Liabilities — 0.8% | | | | | | | 214,521 | |
| | | | | | | | | |
| Net Assets — 100.0% | | | | | | $ | 26,139,207 | |
(a) | The rate shown is the 7-day effective yield as of September 30, 2017. |
| | |
| See accompanying notes to financial statements. |
22
THE GOVERNMENT STREET FUNDS
STATEMENTS OF ASSETS AND LIABILITIES
September 30, 2017 (Unaudited) |
| | | Government Street
Equity
Fund | | | Government
Street
Mid-Cap
Fund | | | Alabama
Tax Free
Bond
Fund | |
| ASSETS | | | | | | | | | |
| Investments in securities: | | | | | | | | | |
| At cost | | $ | 34,297,693 | | | $ | 25,307,671 | | | $ | 25,759,913 | |
| At value (Note 2) | | $ | 63,415,068 | | | $ | 48,583,944 | | | $ | 25,924,686 | |
| Cash | | | 3,986 | | | | — | | | | — | |
| Dividends and interest receivable | | | 46,871 | | | | 33,561 | | | | 237,055 | |
| Receivable for capital shares sold | | | 1,541 | | | | 985 | | | | — | |
| Other assets | | | 12,131 | | | | 11,146 | | | | 10,773 | |
| TOTAL ASSETS | | | 63,479,597 | | | | 48,629,636 | | | | 26,172,514 | |
| | | | | | | | | | | | | |
| LIABILITIES | | | | | | | | | | | | |
| Distributions payable | | | 5,816 | | | | — | | | | 527 | |
| Payable for capital shares redeemed | | | 80,186 | | | | — | | | | 19,912 | |
| Accrued investment advisory fees (Note 4) | | | 64,304 | | | | 65,284 | | | | 2,533 | |
| Payable to administrator (Note 4) | | | 7,450 | | | | 6,025 | | | | 5,575 | |
| Other accrued expenses | | | 2,683 | | | | 2,762 | | | | 4,760 | |
| TOTAL LIABILITIES | | | 160,439 | | | | 74,071 | | | | 33,307 | |
| | | | | | | | | | | | | |
| NET ASSETS | | $ | 63,319,158 | | | $ | 48,555,565 | | | $ | 26,139,207 | |
| | | | | | | | | | | | | |
| Net assets consist of: | | | | | | | | | | | | |
| Paid-in capital | | $ | 33,508,354 | | | $ | 23,911,835 | | | $ | 26,032,378 | |
| Accumulated (distributions in excess of) net investment income | | | (2,134 | ) | | | 161,595 | | | | — | |
| Accumulated net realized gains (losses) from investment transactions | | | 695,563 | | | | 1,205,862 | | | | (57,944 | ) |
| Net unrealized appreciation on investments | | | 29,117,375 | | | | 23,276,273 | | | | 164,773 | |
| | | | | | | | | | | | | |
| Net assets | | $ | 63,319,158 | | | $ | 48,555,565 | | | $ | 26,139,207 | |
| | | | | | | | | | | | | |
| Shares of beneficial interest outstanding (unlimited number of shares authorized, $0.01 par value) | | | 879,571 | | | | 1,881,559 | | | | 2,520,769 | |
| | | | | | | | | | | | | |
| Net asset value, offering price and redemption price per share (Note 2) | | $ | 71.99 | | | $ | 25.81 | | | $ | 10.37 | |
| See accompanying notes to financial statements. |
23
THE GOVERNMENT STREET FUNDS
STATEMENTS OF OPERATIONS
Six Months Ended September 30, 2017 (Unaudited) |
| | | Government
Street
Equity
Fund | | | Government
Street
Mid-Cap
Fund | | | Alabama
Tax Free
Bond
Fund | |
| INVESTMENT INCOME | | | | | | | | | |
| Dividends | | $ | 576,267 | | | $ | 392,683 | | | $ | 5,301 | |
| Foreign withholding taxes on dividends | | | (5,644 | ) | | | (859 | ) | | | — | |
| Interest | | | — | | | | — | | | | 235,928 | |
| TOTAL INVESTMENT INCOME | | | 570,623 | | | | 391,824 | | | | 241,229 | |
| | | | | | | | | | | | | |
| EXPENSES | | | | | | | | | | | | |
| Investment advisory fees (Note 4) | | | 192,023 | | | | 178,111 | | | | 46,446 | |
| Administration fees (Note 4) | | | 41,454 | | | | 32,799 | | | | 30,000 | |
| Professional fees | | | 10,768 | | | | 10,768 | | | | 11,518 | |
| Account maintenance fees | | | 9,728 | | | | 7,263 | | | | 3,322 | |
| Trustees’ fees and expenses (Note 4) | | | 4,982 | | | | 4,982 | | | | 4,982 | |
| Registration and filing fees | | | 4,694 | | | | 4,529 | | | | 3,713 | |
| Compliance fees (Note 4) | | | 3,973 | | | | 3,764 | | | | 3,445 | |
| Custodian and bank service fees | | | 3,652 | | | | 2,987 | | | | 2,325 | |
| Printing of shareholder reports | | | 3,690 | | | | 2,724 | | | | 1,760 | |
| Pricing costs | | | 822 | | | | 1,036 | | | | 5,758 | |
| Postage and supplies | | | 2,375 | | | | 1,958 | | | | 1,337 | |
| Other expenses | | | 737 | | | | 1,935 | | | | 2,307 | |
| TOTAL EXPENSES | | | 278,898 | | | | 252,856 | | | | 116,913 | |
| Fees voluntarily waived by the Adviser (Note 4) | | | — | | | | — | | | | (30,656 | ) |
| NET EXPENSES | | | 278,898 | | | | 252,856 | | | | 86,257 | |
| | | | | | | | | | | | | |
| NET INVESTMENT INCOME | | | 291,725 | | | | 138,968 | | | | 154,972 | |
| | | | | | | | | | | | | |
| REALIZED AND UNREALIZED GAINS ON INVESTMENTS | | | | | | | | | | | | |
| Net realized gains from investment transactions | | | 695,602 | | | | 1,205,884 | | | | 3,545 | |
| Net realized gains from in-kind redemptions (Note 2) | | | 2,068,539 | | | | 1,426,398 | | | | — | |
| Net change in unrealized appreciation (depreciation) on investments | | | 2,660,821 | | | | 748,706 | | | | 75,674 | |
| NET REALIZED AND UNREALIZED GAINS ON INVESTMENTS | | | 5,424,962 | | | | 3,380,988 | | | | 79,219 | |
| | | | | | | | | | | | | |
| NET INCREASE IN NET ASSETS FROM OPERATIONS | | $ | 5,716,687 | | | $ | 3,519,956 | | | $ | 234,191 | |
| See accompanying notes to financial statements. |
24
THE GOVERNMENT STREET FUNDS
STATEMENTS OF CHANGES IN NET ASSETS |
| | Government Street
Equity Fund | | | Government Street
Mid-Cap Fund | |
| | | Six Months
Ended
Sept. 30,
2017
(Unaudited) | | | Year
Ended
March 31,
2017 | | | Six Months
Ended
Sept. 30,
2017
(Unaudited) | | | Year
Ended
March 31,
2017 | |
| FROM OPERATIONS | | | | | | | | | | | | |
| Net investment income | | $ | 291,725 | | | $ | 732,201 | | | $ | 138,968 | | | $ | 309,384 | |
| Net realized gains from investment transactions | | | 695,602 | | | | 1,862,279 | | | | 1,205,884 | | | | 2,283,935 | |
| Net realized gains from in-kind redemptions (Note 2) | | | 2,068,539 | | | | 10,343,370 | | | | 1,426,398 | | | | 3,182,906 | |
| Net change in unrealized appreciation (depreciation) on investments | | | 2,660,821 | | | | (5,131,632 | ) | | | 748,706 | | | | 1,368,966 | |
| Net increase in net assets from operations | | | 5,716,687 | | | | 7,806,218 | | | | 3,519,956 | | | | 7,145,191 | |
| | | | | | | | | | | | | | | | | |
| DISTRIBUTIONS TO SHAREHOLDERS (Note 2) | | | | | | | | | | | | | | | | |
| From net investment income | | | (290,042 | ) | | | (739,136 | ) | | | (48,927 | ) | | | (274,923 | ) |
| From net realized capital gains on investment transactions | | | (903,384 | ) | | | (1,531,140 | ) | | | (860,285 | ) | | | (1,814,748 | ) |
| Decrease in net assets from distributions to shareholders | | | (1,193,426 | ) | | | (2,270,276 | ) | | | (909,212 | ) | | | (2,089,671 | ) |
| | | | | | | | | | | | | | | | | |
| FROM CAPITAL SHARE TRANSACTIONS | | | | | | | | | | | | | | | | |
| Proceeds from shares sold | | | 178,094 | | | | 886,334 | | | | 238,858 | | | | 1,887,134 | |
| Net asset value of shares issued in reinvestment of distributions to shareholders | | | 1,143,428 | | | | 2,225,420 | | | | 873,540 | | | | 2,043,991 | |
| Payments for shares redeemed | | | (7,932,937 | ) | | | (23,547,269 | ) | | | (3,707,655 | ) | | | (8,993,493 | ) |
| Net decrease in net assets from capital share transactions | | | (6,611,415 | ) | | | (20,435,515 | ) | | | (2,595,257 | ) | | | (5,062,368 | ) |
| | | | | | | | | | | | | | | | | |
| TOTAL INCREASE (DECREASE) IN NET ASSETS | | | (2,088,154 | ) | | | (14,899,573 | ) | | | 15,487 | | | | (6,848 | ) |
| | | | | | | | | | | | | | | | | |
| NET ASSETS | | | | | | | | | | | | | | | | |
| Beginning of period | | | 65,407,312 | | | | 80,306,885 | | | | 48,540,078 | | | | 48,546,926 | |
| End of period | | $ | 63,319,158 | | | $ | 65,407,312 | | | $ | 48,555,565 | | | $ | 48,540,078 | |
| | | | | | | | | | | | | | | | | |
| ACCUMULATED (DISTRIBUTIONS IN EXCESS OF) NET INVESTMENT INCOME | | $ | (2,134 | ) | | $ | (3,817 | ) | | $ | 161,595 | | | $ | 71,554 | |
| | | | | | | | | | | | | | | | | |
| CAPITAL SHARE ACTIVITY | | | | | | | | | | | | | | | | |
| Shares sold | | | 2,579 | | | | 14,017 | | | | 9,547 | | | | 81,656 | |
| Shares reinvested | | | 16,598 | | | | 35,450 | | | | 35,181 | | | | 90,190 | |
| Shares redeemed | | | (114,739 | ) | | | (375,543 | ) | | | (150,885 | ) | | | (396,115 | ) |
| Net decrease in shares outstanding | | | (95,562 | ) | | | (326,076 | ) | | | (106,157 | ) | | | (224,269 | ) |
| Shares outstanding, beginning of period | | | 975,133 | | | | 1,301,209 | | | | 1,987,716 | | | | 2,211,985 | |
| Shares outstanding, end of period | | | 879,571 | | | | 975,133 | | | | 1,881,559 | | | | 1,987,716 | |
| See accompanying notes to financial statements. |
25
THE GOVERNMENT STREET FUNDS
STATEMENTS OF CHANGES IN NET ASSETS (Continued) |
| | Alabama Tax Free
Bond Fund | |
| | | Six Months
Ended
Sept. 30,
2017
(Unaudited) | | | Year
Ended
March 31,
2017 | |
| FROM OPERATIONS | | | | | | |
| Net investment income | | $ | 154,972 | | | $ | 342,231 | |
| Net realized gains from investment transactions | | | 3,545 | | | | 97 | |
| Net change in unrealized appreciation (depreciation) on investments | | | 75,674 | | | | (417,234 | ) |
| Net increase (decrease) in net assets from operations | | | 234,191 | | | | (74,906 | ) |
| | | | | | | | | |
| DISTRIBUTIONS TO SHAREHOLDERS (Note 2) | | | | | | | | |
| From net investment income | | | (154,972 | ) | | | (342,231 | ) |
| | | | | | | | | |
| FROM CAPITAL SHARE TRANSACTIONS | | | | | | | | |
| Proceeds from shares sold | | | 9,243 | | | | 822,818 | |
| Net asset value of shares issued in reinvestment of distributions to shareholders | | | 145,669 | | | | 322,063 | |
| Payments for shares redeemed | | | (777,871 | ) | | | (2,908,873 | ) |
| Net decrease in net assets from capital share transactions | | | (622,959 | ) | | | (1,763,992 | ) |
| | | | | | | | | |
| TOTAL DECREASE IN NET ASSETS | | | (543,740 | ) | | | (2,181,129 | ) |
| | | | | | | | | |
| NET ASSETS | | | | | | | | |
| Beginning of period | | | 26,682,947 | | | | 28,864,076 | |
| End of period | | $ | 26,139,207 | | | $ | 26,682,947 | |
| | | | | | | | | |
| ACCUMULATED NET INVESTMENT INCOME | | $ | — | | | $ | — | |
| | | | | | | | | |
| CAPITAL SHARE ACTIVITY | | | | | | | | |
| Shares sold | | | 887 | | | | 78,870 | |
| Shares reinvested | | | 14,016 | | | | 30,911 | |
| Shares redeemed | | | (74,833 | ) | | | (279,772 | ) |
| Net decrease in shares outstanding | | | (59,930 | ) | | | (169,991 | ) |
| Shares outstanding, beginning of period | | | 2,580,699 | | | | 2,750,690 | |
| Shares outstanding, end of period | | | 2,520,769 | | | | 2,580,699 | |
| See accompanying notes to financial statements. |
26
THE GOVERNMENT STREET EQUITY FUND
FINANCIAL HIGHLIGHTS |
Selected Per Share Data and Ratios for a Share Outstanding Throughout Each Period
| | | Six Months
Ended
Sept. 30, | | | Years Ended March 31, | |
| | | 2017
(Unaudited) | | | 2017 | | | 2016 | | | 2015 | | | 2014 | | | 2013 | |
| Net asset value at beginning of period | | $ | 67.08 | | | $ | 61.72 | | | $ | 65.95 | | | $ | 62.78 | | | $ | 53.61 | | | $ | 50.42 | |
| | | | | | | | | | | | | | | | | | | | | | | | | |
| Income (loss) from investment operations: | | | | | | | | | | | | | | | | | | | | | | | | |
| Net investment income | | | 0.32 | | | | 0.68 | | | | 0.61 | | | | 0.67 | | | | 0.62 | | | | 0.64 | |
| Net realized and unrealized gains (losses) on investments | | | 5.90 | | | | 6.76 | | | | (2.17 | ) | | | 6.55 | | | | 9.17 | | | | 4.21 | |
| Total from investment operations | | | 6.22 | | | | 7.44 | | | | (1.56 | ) | | | 7.22 | | | | 9.79 | | | | 4.85 | |
| | | | | | | | | | | | | | | | | | | | | | | | | |
| Less distributions: | | | | | | | | | | | | | | | | | | | | | | �� | | |
| Dividends from net investment income | | | (0.32 | ) | | | (0.68 | ) | | | (0.64 | ) | | | (0.64 | ) | | | (0.61 | ) | | | (0.64 | ) |
| Distributions from net realized gains | | | (0.99 | ) | | | (1.40 | ) | | | (2.03 | ) | | | (3.41 | ) | | | (0.01 | ) | | | (1.02 | ) |
| Total distributions | | | (1.31 | ) | | | (2.08 | ) | | | (2.67 | ) | | | (4.05 | ) | | | (0.62 | ) | | | (1.66 | ) |
| | | | | | | | | | | | | | | | | | | | | | | | | |
| Net asset value at end of period | | $ | 71.99 | | | $ | 67.08 | | | $ | 61.72 | | | $ | 65.95 | | | $ | 62.78 | | | $ | 53.61 | |
| | | | | | | | | | | | | | | | | | | | | | | | | |
Total return (a) | | | 9.36 | %(b) | | | 12.32 | % | | | (2.46 | %) | | | 11.87 | % | | | 18.34 | % | | | 9.93 | % |
| | | | | | | | | | | | | | | | | | | | | | | | | |
| Net assets at end of period (000’s) | | $ | 63,319 | | | $ | 65,407 | | | $ | 80,307 | | | $ | 93,778 | | | $ | 94,287 | | | $ | 81,689 | |
| | | | | | | | | | | | | | | | | | | | | | | | | |
| Ratio of total expenses to average net assets | | | 0.87 | %(c) | | | 0.87 | % | | | 0.85 | % | | | 0.84 | % | | | 0.84 | % | | | 0.85 | % |
| | | | | | | | | | | | | | | | | | | | | | | | | |
| Ratio of net investment income to average net assets | | | 0.91 | %(c) | | | 1.03 | % | | | 0.95 | % | | | 1.02 | % | | | 1.06 | % | | | 1.29 | % |
| | | | | | | | | | | | | | | | | | | | | | | | | |
| Portfolio turnover rate | | | 5 | %(b) | | | 20 | % | | | 17 | % | | | 26 | % | | | 36 | % | | | 38 | % |
(a) | Total return is a measure of the change in value of an investment in the Fund over the periods covered, which assumes any dividends or capital gains distributions are reinvested in shares of the Fund. Returns shown do not reflect the deduction of taxes a shareholder would pay on Fund distributions or the redemption of Fund shares. |
| | |
(b) | Not annualized. |
| | |
(c) | Annualized. |
| | |
| See accompanying notes to financial statements. |
27
THE GOVERNMENT STREET MID-CAP FUND
FINANCIAL HIGHLIGHTS |
Selected Per Share Data and Ratios for a Share Outstanding Throughout Each Period
| | | Six Months
Ended
Sept. 30, | | | Years Ended March 31, | |
| | | 2017
(Unaudited) | | | 2017 | | | 2016 | | | 2015 | | | 2014 | | | 2013 | |
| Net asset value at beginning of period | | $ | 24.42 | | | $ | 21.95 | | | $ | 22.96 | | | $ | 21.68 | | | $ | 18.26 | | | $ | 16.26 | |
| | | | | | | | | | | | | | | | | | | | | | | | | |
| Income from investment operations: | | | | | | | | | | | | | | | | | | | | | | | | |
| Net investment income | | | 0.08 | | | | 0.16 | | | | 0.10 | | | | 0.10 | | | | 0.09 | | | | 0.10 | |
| Net realized and unrealized gains on investments | | | 1.79 | | | | 3.36 | | | | 0.11 | | | | 2.02 | | | | 3.46 | | | | 2.05 | |
| Total from investment operations | | | 1.87 | | | | 3.52 | | | | 0.21 | | | | 2.12 | | | | 3.55 | | | | 2.15 | |
| | | | | | | | | | | | | | | | | | | | | | | | | |
| Less distributions: | | | | | | | | | | | | | | | | | | | | | | | | |
| Dividends from net investment income | | | (0.03 | ) | | | (0.14 | ) | | | (0.10 | ) | | | (0.07 | ) | | | (0.11 | ) | | | (0.11 | ) |
| Distributions from net realized gains | | | (0.45 | ) | | | (0.91 | ) | | | (1.12 | ) | | | (0.77 | ) | | | (0.02 | ) | | | (0.04 | ) |
| Total distributions | | | (0.48 | ) | | | (1.05 | ) | | | (1.22 | ) | | | (0.84 | ) | | | (0.13 | ) | | | (0.15 | ) |
| | | | | | | | | | | | | | | | | | | | | | | | | |
| Net asset value at end of period | | $ | 25.81 | | | $ | 24.42 | | | $ | 21.95 | | | $ | 22.96 | | | $ | 21.68 | | | $ | 18.26 | |
| | | | | | | | | | | | | | | | | | | | | | | | | |
Total return (a) | | | 7.74 | %(b) | | | 16.44 | % | | | 1.04 | % | | | 10.14 | % | | | 19.43 | % | | | 13.35 | % |
| | | | | | | | | | | | | | | | | | | | | | | | | |
| Net assets at end of period (000’s) | | $ | 48,556 | | | $ | 48,540 | | | $ | 48,547 | | | $ | 51,898 | | | $ | 54,875 | | | $ | 45,918 | |
| | | | | | | | | | | | | | | | | | | | | | | | | |
| Ratio of total expenses to average net assets | | | 1.06 | %(c) | | | 1.07 | % | | | 1.07 | % | | | 1.05 | % | | | 1.06 | % | | | 1.08 | % |
| | | | | | | | | | | | | | | | | | | | | | | | | |
| Ratio of net investment income to average net assets | | | 0.59 | %(c) | | | 0.66 | % | | | 0.46 | % | | | 0.47 | % | | | 0.43 | % | | | 0.63 | % |
| | | | | | | | | | | | | | | | | | | | | | | | | |
| Portfolio turnover rate | | | 6 | %(b) | | | 14 | % | | | 20 | % | | | 16 | % | | | 10 | % | | | 12 | % |
(a) | Total return is a measure of the change in value of an investment in the Fund over the periods covered, which assumes any dividends or capital gains distributions are reinvested in shares of the Fund. Returns shown do not reflect the deduction of taxes a shareholder would pay on Fund distributions or the redemption of Fund shares. |
| | |
(b) | Not annualized. |
| | |
(c) | Annualized. |
| | |
| See accompanying notes to financial statements. |
28
THE ALABAMA TAX FREE BOND FUND
FINANCIAL HIGHLIGHTS |
Selected Per Share Data and Ratios for a Share Outstanding Throughout Each Period
| | | Six Months
Ended
Sept. 30, | | | Years Ended March 31, | |
| | | 2017
(Unaudited) | | | 2017 | | | 2016 | | | 2015 | | | 2014 | | | 2013 | |
| Net asset value at beginning of period | | $ | 10.34 | | | $ | 10.49 | | | $ | 10.49 | | | $ | 10.51 | | | $ | 10.63 | | | $ | 10.64 | |
| | | | | | | | | | | | | | | | | | | | | | | | | |
| Income (loss) from investment operations: | | | | | | | | | | | | | | | | | | | | | | | | |
| Net investment income | | | 0.06 | | | | 0.13 | | | | 0.13 | | | | 0.14 | | | | 0.15 | | | | 0.18 | |
| Net realized and unrealized gains (losses) on investments | | | 0.03 | | | | (0.15 | ) | | | 0.00 | (a) | | | (0.02 | ) | | | (0.12 | ) | | | (0.01 | ) |
| Total from investment operations | | | 0.09 | | | | (0.02 | ) | | | 0.13 | | | | 0.12 | | | | 0.03 | | | | 0.17 | |
| | | | | | | | | | | | | | | | | | | | | | | | | |
| Less dividends from net investment income | | | (0.06 | ) | | | (0.13 | ) | | | (0.13 | ) | | | (0.14 | ) | | | (0.15 | ) | | | (0.18 | ) |
| | | | | | | | | | | | | | | | | | | | | | | | | |
| Net asset value at end of period | | $ | 10.37 | | | $ | 10.34 | | | $ | 10.49 | | | $ | 10.49 | | | $ | 10.51 | | | $ | 10.63 | |
| | | | | | | | | | | | | | | | | | | | | | | | | |
Total return (b) | | | 0.88 | %(c) | | | (0.21 | %) | | | 1.28 | % | | | 1.14 | % | | | 0.28 | % | | | 1.64 | % |
| | | | | | | | | | | | | | | | | | | | | | | | | |
| Net assets at end of period (000’s) | | $ | 26,139 | | | $ | 26,683 | | | $ | 28,864 | | | $ | 29,969 | | | $ | 32,630 | | | $ | 33,265 | |
| | | | | | | | | | | | | | | | | | | | | | | | | |
| Ratio of total expenses to average net assets | | | 0.88 | %(d) | | | 0.86 | % | | | 0.82 | % | | | 0.79 | % | | | 0.76 | % | | | 0.76 | % |
| | | | | | | | | | | | | | | | | | | | | | | | | |
Ratio of net expenses to average net assets (e) | | | 0.65 | %(d) | | | 0.65 | % | | | 0.65 | % | | | 0.65 | % | | | 0.65 | % | | | 0.65 | % |
| | | | | | | | | | | | | | | | | | | | | | | | | |
Ratio of net investment income to average net assets (e) | | | 1.17 | %(d) | | | 1.23 | % | | | 1.27 | % | | | 1.32 | % | | | 1.41 | % | | | 1.70 | % |
| | | | | | | | | | | | | | | | | | | | | | | | | |
| Portfolio turnover rate | | | 13 | %(c) | | | 12 | % | | | 13 | % | | | 6 | % | | | 10 | % | | | 7 | % |
(a) | Amount rounds to less than $0.01 per share. |
| | |
(b) | Total return is a measure of the change in value of an investment in the Fund over the periods covered, which assumes any dividends or capital gains distributions are reinvested in shares of the Fund. Returns shown do not reflect the deduction of taxes a shareholder would pay on Fund distributions or the redemption of Fund shares. |
| | |
(c) | Not annualized. |
| | |
(d) | Annualized. |
| | |
(e) | Ratios were determined after voluntary advisory fee waivers by the Adviser (Note 4). |
| | |
| See accompanying notes to financial statements. |
29
THE GOVERNMENT STREET FUNDS
NOTES TO FINANCIAL STATEMENTS
September 30, 2017 (Unaudited)
1. Organization
The Government Street Equity Fund, The Government Street Mid-Cap Fund and The Alabama Tax Free Bond Fund (the “Funds”) are each a no-load series of the Williamsburg Investment Trust (the “Trust”), an open-end management investment company registered under the Investment Company Act of 1940, as amended. The Government Street Equity Fund and The Government Street Mid-Cap Fund are each a diversified fund and The Alabama Tax Free Bond Fund is a non-diversified fund. The Trust was organized as a Massachusetts business trust on July 18, 1988. Other series of the Trust are not included in this report.
The Government Street Equity Fund’s investment objective is to seek capital appreciation.
The Government Street Mid-Cap Fund’s investment objective is to seek capital appreciation.
The Alabama Tax Free Bond Fund’s investment objectives are to provide current income exempt from federal income taxes and from the personal income taxes of Alabama and to preserve capital.
2. Significant Accounting Policies
In October 2016, the U.S. Securities and Exchange Commission (the “SEC”) adopted amendments to Regulation S-X, which impact financial statement presentation, particularly the presentation of derivative investments. The Funds have adopted these amendments, which were effective August 1, 2017, with these financial statements.
Each Fund follows accounting and reporting guidance under Financial Accounting Standards Board Accounting Standards Codification Topic 946, “Financial Services – Investment Companies.” The following is a summary of the Funds’ significant accounting policies. The policies are in conformity with accounting principles generally accepted in the United States of America (“GAAP”).
Securities valuation — The Funds’ portfolio securities are valued as of the close of business of the regular session of the New York Stock Exchange (normally 4:00 p.m., Eastern time). Securities traded on a national stock exchange, including common stocks and exchange-traded funds, are valued based upon the closing price on the principal exchange where the security is traded, if available, otherwise, at the last quoted bid price. Securities that are quoted by NASDAQ are valued at the NASDAQ Official Closing Price. Investments representing shares of other open-end investment companies, including money market funds, are valued at their net asset value (“NAV”) as reported by such companies. When using a quoted price and when the market is considered active, securities will be classified as Level 1 within the fair value hierarchy.
30
THE GOVERNMENT STREET FUNDS
NOTES TO FINANCIAL STATEMENTS (Continued)
Fixed income securities, including municipal bonds, are typically valued on the basis of prices provided by an independent pricing service. The prices provided by the pricing service are determined with consideration given to institutional bid and last sale prices and take into account securities prices, yields, maturities, call features, ratings, institutional trading in similar groups of securities, and developments related to specific securities. Given the inputs used by the pricing service, these securities are classified as Level 2 within the fair value hierarchy.
When market quotations are not readily available, if a pricing service cannot provide a price, or the investment adviser believes the price received from the pricing service is not indicative of market value, securities will be valued in good faith at fair value using methods consistent with procedures adopted by the Board of Trustees and will be classified as Level 2 or 3 within the fair value hierarchy (see below), depending on the inputs used. Such methods of fair valuation may include, but are not limited to: multiple of earnings, multiple of book value, discount from market of a similar freely traded security, purchase price of the security, subsequent private transactions in the security or related securities, or a combination of these and other factors.
GAAP establishes a single authoritative definition of fair value, sets out a framework for measuring fair value and requires additional disclosures about fair value measurements.
Various inputs are used in determining the value of each Fund’s investments. These inputs are summarized in the three broad levels listed below:
| ● | Level 1 – quoted prices in active markets for identical securities |
| ● | Level 2 – other significant observable inputs |
| ● | Level 3 – significant unobservable inputs |
The inputs or methodology used for valuing securities are not necessarily an indication of the risks associated with investing in those securities. The inputs used to measure fair value may fall into different levels of the fair value hierarchy. In such cases, for disclosure purposes, the level in the fair value hierarchy within which the fair value measurement falls in its entirety is determined based on the lowest level input that is significant to the fair value measurement.
The following is a summary of the inputs used to value each Fund’s investments as of September 30, 2017, by security type:
| The Government Street Equity Fund | | Level 1 | | | Level 2 | | | Level 3 | | | Total | |
| Common Stocks | | $ | 58,125,512 | | | $ | — | | | $ | — | | | $ | 58,125,512 | |
| Exchange-Traded Funds | | | 3,284,080 | | | | — | | | | — | | | | 3,284,080 | |
| Money Market Funds | | | 2,005,476 | | | | — | | | | — | | | | 2,005,476 | |
| Total | | $ | 63,415,068 | | | $ | — | | | $ | — | | | $ | 63,415,068 | |
31
THE GOVERNMENT STREET FUNDS
NOTES TO FINANCIAL STATEMENTS (Continued)
| The Government Street Mid-Cap Fund: | | Level 1 | | | Level 2 | | | Level 3 | | | Total | |
| Common Stocks | | $ | 41,604,744 | | | $ | — | | | $ | — | | | $ | 41,604,744 | |
| Exchange-Traded Funds | | | 3,777,168 | | | | — | | | | — | | | | 3,777,168 | |
| Money Market Funds | | | 3,202,032 | | | | — | | | | — | | | | 3,202,032 | |
| Total | | $ | 48,583,944 | | | $ | — | | | $ | — | | | $ | 48,583,944 | |
| The Alabama Tax Free Bond Fund: | | Level 1 | | | Level 2 | | | Level 3 | | | Total | |
| Revenue and General Obligation Municipal Bonds | | $ | — | | | $ | 25,336,201 | | | $ | — | | | $ | 25,336,201 | |
| Money Market Funds | | | 588,485 | | | | — | | | | — | | | | 588,485 | |
| Total | | $ | 588,485 | | | $ | 25,336,201 | | | $ | — | | | $ | 25,924,686 | |
Refer to The Government Street Equity Fund’s and The Government Street Mid-Cap Fund’s Schedules of Investments for a listing of the common stocks by sector type. As of September 30, 2017, the Funds did not have any transfers into or out of any Level. There were no Level 3 securities or derivative instruments held by the Funds as of September 30, 2017. It is the Funds’ policy to recognize transfers into or out of any Level at the end of the reporting period.
Share valuation — The NAV per share of each Fund is calculated daily by dividing the total value of its assets, less liabilities, by the number of shares outstanding. The offering price and redemption price per share of each Fund is equal to the NAV per share.
Investment income — Interest income is accrued as earned. Discounts and premiums on fixed-income securities purchased are amortized using the interest method. Dividend income is recorded on the ex-dividend date. Withholding taxes on foreign dividends for The Government Street Equity Fund and The Government Street Mid-Cap Fund have been recorded in accordance with the Trust’s understanding of the appropriate country’s rules and tax rates.
Distributions to shareholders — Dividends arising from net investment income are declared and paid quarterly to shareholders of The Government Street Equity Fund; declared and paid annually to shareholders of The Government Street Mid-Cap Fund; and declared daily and paid monthly to shareholders of The Alabama Tax Free Bond Fund. Net realized short-term capital gains, if any, may be distributed throughout the year and net realized long-term capital gains, if any, are distributed at least once each year. Dividends and distributions are recorded on the ex-dividend date. The amount of distributions from net investment income and net realized capital gains are determined in accordance with federal income tax regulations, which may differ from GAAP. These “book/tax” differences are either temporary or permanent in nature.
32
THE GOVERNMENT STREET FUNDS
NOTES TO FINANCIAL STATEMENTS (Continued)
The tax character of distributions paid during the periods ended September 30, 2017 and March 31, 2017 was as follows:
| Period
Ended | Ordinary Income | Exempt- Interest Dividends | Long-Term Capital Gains | Total Distributions |
| The Government Street Equity Fund | 09/30/17 | $ 396,953 | $ — | $ 796,473 | $ 1,193,426 |
| | 03/31/17 | $ 739,136 | $ — | $ 1,531,140 | $ 2,270,276 |
| The Government Street Mid-Cap Fund | 09/30/17 | $ 48,927 | $ — | $ 860,285 | $ 909,212 |
| | 03/31/17 | $ 274,923 | $ — | $ 1,814,748 | $ 2,089,671 |
| The Alabama Tax Free Bond Fund | 09/30/17 | $ — | $ 154,972 | $ — | $ 154,972 |
| | 03/31/17 | $ — | $ 342,231 | $ — | $ 342,231 |
Investment transactions — Investment transactions are accounted for on trade date for financial reporting purposes. Realized gains and losses on securities sold are determined on a specific identification basis.
Common expenses — Common expenses of the Trust are allocated among the series of the Trust based on relative net assets of each series or the nature of the services performed and the relative applicability to each series.
Estimates — The preparation of financial statements in conformity with GAAP requires management to make estimates and assumptions that affect the reported amounts of assets and liabilities and the disclosure of contingent assets and liabilities as of the date of the financial statements and the reported amounts of income and expenses during the reporting period. Actual results could differ from those estimates.
Federal income tax — Each Fund has qualified and intends to continue to qualify as a regulated investment company under the Internal Revenue Code of 1986, as amended (the “Code”). Qualification generally will relieve the Funds of liability for federal income taxes to the extent 100% of their net investment income and any net realized capital gains are distributed in accordance with the Code.
In order to avoid imposition of the excise tax applicable to regulated investment companies, it is also each Fund’s intention to declare as dividends in each calendar year at least 98% of its net investment income (earned during the calendar year) and 98.2% of its net realized capital gains (earned during the twelve months ended October 31) plus undistributed amounts from prior years.
33
THE GOVERNMENT STREET FUNDS
NOTES TO FINANCIAL STATEMENTS (Continued)
The following information is computed on a tax basis for each item as of September 30, 2017:
| | | The Government
Street Equity
Fund | | | The Government
Street Mid-Cap
Fund | | | The Alabama
Tax Free Bond
Fund | |
| Cost of portfolio investments | | $ | 34,297,693 | | | $ | 25,284,883 | | | $ | 25,759,913 | |
| Gross unrealized appreciation | | $ | 29,177,138 | | | $ | 23,445,729 | | | $ | 209,562 | |
| Gross unrealized depreciation | | | (59,763 | ) | | | (146,668 | ) | | | (44,789 | ) |
| Net unrealized appreciation | | | 29,117,375 | | | | 23,299,061 | | | | 164,773 | |
| Capital loss carryforwards | | | — | | | | — | | | | (61,489 | ) |
| Accumulated ordinary income | | | 3,644 | | | | 138,807 | | | | — | |
| Accumulated capital and other gains | | | 695,601 | | | | 1,205,862 | | | | 4,072 | |
| Distributions payable | | | (5,816 | ) | | | — | | | | (527 | ) |
| Total accumulated earnings | | $ | 29,810,804 | | | $ | 24,643,730 | | | $ | 106,829 | |
The difference between the federal income tax cost of portfolio investments and the financial statement cost of portfolio investments for The Government Street Mid-Cap Fund is due to certain timing differences in the recognition of capital gains or losses under income tax regulations and GAAP. These “book/tax” differences are temporary in nature and are primarily due to adjustments to basis on publicly traded partnerships.
As of March 31, 2017, The Alabama Tax Free Bond Fund had a short-term capital loss carryforward for federal income tax purposes of $24,704 and a long-term capital loss carryforward for federal income tax purposes of $36,785, both of which may be carried forward indefinitely. These capital loss carryforwards are available to offset realized capital gains in the current and future years, thereby reducing future taxable gains distributions.
During the six months ended September 30, 2017, The Government Street Equity Fund and The Government Street Mid-Cap Fund realized $2,068,539 and $1,426,398, respectively, of net capital gains resulting from in-kind redemptions (redemptions in which shareholders who redeemed Fund shares received securities held by the Fund rather than cash). The Funds recognize a gain on in-kind redemptions to the extent that the value of the distributed securities on the date of redemption exceeds the cost of those securities. Such gains are not taxable to the Funds and are not required to be distributed to shareholders. The Funds have reclassified these amounts against paid-in capital on the Statements of Assets and Liabilities. Such reclassifications, the result of permanent differences between the financial statement and income tax reporting requirements, have no effect on each Fund’s net assets or NAV per share.
34
THE GOVERNMENT STREET FUNDS
NOTES TO FINANCIAL STATEMENTS (Continued)
The Funds recognize the tax benefits or expenses of uncertain tax positions only when the position is “more likely than not” to be sustained assuming examination by tax authorities. Management has reviewed the tax positions taken on federal income tax returns for the current and all open tax years (tax years ended March 31, 2014 through March 31, 2017) of each Fund and has concluded that no provision for unrecognized tax benefits or expenses is required in these financial statements.
3. Investment Transactions
Investment transactions, other than short-term investments and U.S. government securities, were as follows for the six months ended September 30, 2017:
| | | The Government
Street Equity
Fund | | | The Government
Street Mid-Cap
Fund | | | The Alabama
Tax Free Bond
Fund | |
| Purchases of investment securities | | $ | 2,782,410 | | | $ | 2,661,832 | | | $ | 3,398,161 | |
| Proceeds from sales and maturities of investment securities | | $ | 7,963,432 | | | $ | 6,054,948 | | | $ | 3,981,066 | |
4. Transactions with Related Parties
INVESTMENT ADVISORY AGREEMENT
Each Fund’s investments are managed by Leavell Investment Management, Inc. (the “Adviser”) under the terms of an Investment Advisory Agreement. The Government Street Equity Fund pays the Adviser a fee, which is computed and accrued daily and paid monthly, at annual rates of 0.60% of its average daily net assets up to $100 million and 0.50% of such assets in excess of $100 million. The Government Street Mid-Cap Fund pays the Adviser a fee, which is computed and accrued daily and paid monthly, at an annual rate of 0.75% of its average daily net assets. The Alabama Tax Free Bond Fund pays the Adviser a fee, which is computed and accrued daily and paid monthly, at annual rates of 0.35% of its average daily net assets up to $100 million and 0.25% of such assets in excess of $100 million.
During the six months ended September 30, 2017, the Adviser voluntarily limited the total annual operating expenses of The Alabama Tax Free Bond Fund to 0.65% of the Fund’s average daily net assets. Accordingly, the Adviser waived $30,656 of its investment advisory fees from The Alabama Tax Free Bond Fund during the six months ended September 30, 2017. This amount is not subject to recapture in future periods.
Certain officers of the Trust are also officers of the Adviser.
35
THE GOVERNMENT STREET FUNDS
NOTES TO FINANCIAL STATEMENTS (Continued)
OTHER SERVICE PROVIDERS
Ultimus Fund Solutions, LLC (“Ultimus”) provides administration, fund accounting, compliance and transfer agent services to the Funds. The Funds pay Ultimus fees in accordance with the agreements for such services. In addition, the Funds pay out-of-pocket expenses including, but not limited to, postage, supplies, and costs of pricing the Funds’ portfolio securities. Certain officers of the Trust are also officers of Ultimus, or of Ultimus Fund Distributors, LLC (the “Distributor”), the principal underwriter of each Fund’s shares and an affiliate of Ultimus. The Distributor is compensated by the Adviser (not the Funds) for acting as principal underwriter.
COMPENSATION OF TRUSTEES
Trustees and officers affiliated with the Adviser or Ultimus are not compensated by the Trust for their services. Each Trustee who is not an affiliated person of the Adviser or Ultimus receives from the Trust an annual retainer of $15,000, payable quarterly; a fee of $1,500 for attendance at each meeting of the Board of Trustees (except that such fee is $2,500 for the independent chair); and a fee of $1,000 for attendance at each meeting of any committee of the Board (except that such fee is $1,500 for the committee chair); plus reimbursement of travel and other expenses incurred in attending meetings. Each series of the Trust pays its proportionate share of such fees.
5. Contingencies and Commitments
The Funds indemnify the Trust’s officers and Trustees for certain liabilities that might arise from their performance of their duties to the Funds. Additionally, in the normal course of business the Funds enter into contracts that contain a variety of representations and warranties and which provide general indemnifications. The Funds’ maximum exposure under these arrangements is unknown, as this would involve future claims that may be made against the Funds that have not yet occurred. However, based on experience, the Funds expect the risk of loss to be remote.
6. Sector Risk
If a Fund has significant investments in the securities of issuers in industries within a particular sector, any development affecting that sector will have a greater impact on the value of the net assets of the Fund than would be the case if the Fund did not have significant investments in that sector. In addition, this may increase the risk of loss of an investment in the Fund and increase the volatility of the Fund’s net asset value per share. From time to time, circumstances may affect a particular sector and the companies within such sector. For instance, economic or market factors, regulation or deregulation, and technological or other developments may negatively impact all companies in a particular sector and therefore the value of a Fund’s portfolio will be adversely affected. As of September 30, 2017, the Government Street Equity Fund had 25.4% of the value of its net assets invested in stocks within the Information Technology sector.
36
THE GOVERNMENT STREET FUNDS
NOTES TO FINANCIAL STATEMENTS (Continued)
7. Concentration of Credit Risk
The Alabama Tax Free Bond Fund invests primarily in debt instruments of municipal issuers in the state of Alabama. The issuers’ abilities to meet their obligations may be affected by economic developments in the state or its region, as well as disruptions in the credit markets and the economy, generally.
8. Subsequent Events
The Funds are required to recognize in the financial statements the effects of all subsequent events that provide additional evidence about conditions that existed as of the date of the Statements of Assets and Liabilities. For non-recognized subsequent events that must be disclosed to keep the financial statements from being misleading, the Funds are required to disclose the nature of the event as well as an estimate of its financial effect, or a statement that such an estimate cannot be made. Management has evaluated subsequent events through the issuance of these financial statements and has noted no such events.
37
THE GOVERNMENT STREET FUNDS
ABOUT YOUR FUNDS’ EXPENSES (Unaudited)
We believe it is important for you to understand the impact of costs on your investment. All mutual funds have operating expenses. As a shareholder of the Funds, you incur ongoing costs, including management fees and other expenses. These ongoing costs, which are deducted from each Fund’s gross income, directly reduce the investment returns of the Funds.
A mutual fund’s ongoing costs are expressed as a percentage of its average net assets. This figure is known as the expense ratio. The following examples are intended to help you understand the ongoing costs (in dollars) of investing in the Funds and to compare these costs with the ongoing costs of investing in other mutual funds. The examples below are based on an investment of $1,000 made at the beginning of the period shown and held for the entire period (April 1, 2017 through September 30, 2017).
The table below illustrates each Fund’s ongoing costs in two ways:
Actual fund return – This section helps you to estimate the actual expenses that you paid over the period. The “Ending Account Value” shown is derived from each Fund’s actual return, and the fourth column shows the dollar amount of operating expenses that would have been paid by an investor who started with $1,000 in the Funds. You may use the information here, together with the amount you invested, to estimate the expenses that you paid over the period.
To do so, simply divide your account value by $1,000 (for example, an $8,600 account value divided by $1,000 = 8.6), then multiply the result by the number given for the Funds under the heading “Expenses Paid During Period.”
Hypothetical 5% return – This section is intended to help you compare the Funds’ ongoing costs with those of other mutual funds. It assumes that each Fund had an annual return of 5% before expenses during the period shown, but that the expense ratio is unchanged. In this case, because the returns used are not the Funds’ actual returns, the results do not apply to your investment. The example is useful in making comparisons because the SEC requires all mutual funds to calculate expenses based on a 5% return. You can assess each Fund’s ongoing costs by comparing this hypothetical example with the hypothetical examples that appear in shareholder reports of other funds.
Note that expenses shown in the table are meant to highlight and help you compare ongoing costs only. The Funds do not charge sales loads or redemption fees.
The calculations assume no shares were bought or sold during the period. Your actual costs may have been higher or lower, depending on the amount of your investment and the timing of any purchases or redemptions.
38
THE GOVERNMENT STREET FUNDS
ABOUT YOUR FUNDS’ EXPENSES (Unaudited) (Continued)
More information about the Funds’ expenses, including historical expense ratios, can be found in this report. For additional information on operating expenses and other shareholder costs, please refer to the Funds’ prospectus.
| | Beginning
Account Value
April 1, 2017 | Ending
Account Value
Sept. 30, 2017 | Net
Expense
Ratio(a) | Expenses
Paid During
Period(b) |
| The Government Street Equity Fund |
| Based on Actual Fund Return | $ 1,000.00 | $ 1,093.60 | 0.87% | $4.57 |
| Based on Hypothetical 5% Return (before expenses) | $ 1,000.00 | $ 1,020.71 | 0.87% | $4.41 |
| The Government Street Mid-Cap Fund |
| Based on Actual Fund Return | $ 1,000.00 | $ 1,077.40 | 1.06% | $5.52 |
| Based on Hypothetical 5% Return (before expenses) | $ 1,000.00 | $ 1,019.75 | 1.06% | $5.37 |
| The Alabama Tax Free Bond Fund |
| Based on Actual Fund Return | $ 1,000.00 | $ 1,008.80 | 0.65% | $3.27 |
| Based on Hypothetical 5% Return (before expenses) | $ 1,000.00 | $ 1,021.81 | 0.65% | $3.29 |
(a) | Annualized, based on the Fund’s most recent one-half year expenses. |
| | |
(b) | Expenses are equal to the Funds’ annualized net expense ratio multiplied by the average account value over the period, multiplied by 183/365 (to reflect the one-half year period). |
39
THE GOVERNMENT STREET FUNDS
OTHER INFORMATION (Unaudited)
A description of the policies and procedures that the Funds use to vote proxies relating to portfolio securities is available without charge upon request by calling toll-free 1-866-738-1125, or on the SEC’s website at http://www.sec.gov. Information regarding how the Funds voted proxies relating to portfolio securities during the most recent 12-month period ended June 30 is also available without charge upon request by calling toll-free 1-866-738-1125 or on the SEC’s website at http://www.sec.gov.
The Trust files a complete listing of portfolio holdings for the Funds with the SEC as of the end of the first and third quarters of each fiscal year on Form N-Q. The filings are available upon request, by calling 1-866-738-1125. Furthermore, you may obtain a copy of these filings on the SEC’s website at http://www.sec.gov. The Trust’s Forms N-Q may also be reviewed and copied at the SEC’s Public Reference Room in Washington, DC, and information on the operation of the Public Reference Room may be obtained by calling 1-800-SEC-0330.
40
This page intentionally left blank.
The Government Street Funds
No-Load Mutual Funds |
| | | |
| | Investment Adviser Leavell Investment Management, Inc. 210 St. Joseph Street Mobile, AL 36602 Administrator Ultimus Fund Solutions, LLC P.O. Box 46707 Cincinnati, OH 45246-0707 1-866-738-1125 Legal Counsel Sullivan & Worcester LLP 1666 K Street, N.W. Washington, DC 20006 Independent Registered Public Accounting Firm Cohen & Company, Ltd. 1350 Euclid Avenue Suite 800 Cleveland, Ohio 44115 Board of Trustees Robert S. Harris, Ph.D., Chairman John P. Ackerly, IV John T. Bruce George K. Jennison Harris V. Morrissette Elizabeth W. Robertson Portfolio Managers Thomas W. Leavell, The Government Street Equity Fund The Government Street Mid-Cap Fund Timothy S. Healey, The Alabama Tax Free Bond Fund | |
THE
JAMESTOWN
FUNDS No-Load Funds The Jamestown Equity Fund
The Jamestown Tax Exempt Virginia Fund SEMI-ANNUAL REPORT September 30, 2017
(Unaudited) Investment Adviser Lowe, Brockenbrough & Company, Inc. Richmond, Virginia |
| LETTER TO SHAREHOLDERS | November 14, 2017 |
The Jamestown Equity Fund
For the six-month period ended September 30, 2017, The Jamestown Equity Fund rose 5.96% compared to 7.71% for the S&P 500 Index. The equity market continued to march forward with little downside volatility in the past six months. Investors have shrugged off geopolitical concerns and discord in Washington as global economies have grown faster than expected this year. The U.S. GDP grew over 3% in both of the past two quarters, while Europe and Japan are growing faster than they have since the early days of the recovery from the financial crisis. At the same time global growth has surprised to the upside, global inflation has surprised to the downside allowing the Federal Reserve to raise interest rates slowly. Central banks in Europe and Japan are continuing their quantitative easing programs.
Earnings on the S&P 500 companies have responded to the faster global growth, a weaker U.S. dollar, and a recovery in energy prices to post double digit increases in both of the past two quarters. Investors are closely watching Washington to see if Congress passes a tax reform package. The centerpiece of the proposed tax act is a cut in the corporate tax rate to 20%. This would certainly boost earnings if passed. We continue to believe that earnings growth will be the primary driver if equity prices are going to continue to rise given somewhat elevated valuations. The S&P 500 currently trades at over 17X forecasted earnings for 2018. This valuation is elevated compared to the average of slightly over 15X earnings in the past 10 years. Valuations are supported by the current low levels of inflation interest rates.
We do expect to see volatility in equity prices increase as investors look for better earnings growth, while facing the likelihood that the Federal Reserve will continue to raise interest rates later this year and slowly let their bond holdings run off of their balance sheet. Higher interest rates are likely to pressure valuation levels going forward. The Federal Reserve raised short-term rates by a quarter percentage point in June, its third rate increase since December 2016. The central bank also announced it will allow its bond holdings to decrease by $10 billion per month, a small amount relative to its $4.5 trillion balance sheet.
The Fund lagged the S&P 500’s return primarily due to the drag from holding some cash in a rising market and stock selection. The Information Technology and Industrials sectors were the most challenging sectors for stock selection as our holdings did not fully keep up with the strong performance generated across these two sectors. Strong stock selection in the Financials and Consumer Discretionary sectors partially offset this impact as did being underweight in the Utilities, Consumer Staples and Real Estate sectors.
At the end of September 2017, the greatest sector overweights in the portfolio, relative to benchmark weightings, were in the Consumer Discretionary, Financials, Energy and Information Technology sectors. The largest sector underweights in the Fund remain in the Utilities, Real Estate and Consumer Staples sectors.
1
The Jamestown Tax Exempt Virginia Fund
For the six-month period ended September 30, 2017, The Jamestown Tax Exempt Virginia Fund (the “Fund”) returned 1.47%. By comparison, the Bloomberg Barclays 1-10 Year Municipal Blend Index returned 2.13%. The Fund remains conservatively positioned with regard to interest rate risk and credit quality. At the end of the period, the Fund’s 30-day SEC yield was 1.38%, which is a taxable equivalent yield of 2.44% for investors subject to the maximum 43.4% federal income tax bracket.
U.S. economic growth improved as real GDP expanded at a 3.0% pace during the six-month period. The labor market has essentially reached full employment and there are now more job openings than job seekers. Wage growth has been tepid. Inflation remains low but the risk of deflation has diminished. The Federal Reserve remains on its path of gradually normalizing interest rates. It raised short-term rates by a quarter percentage point in June, its third rate increase since December 2016. The central bank also announced it will allow its bond holdings to decrease by $10 billion per month, a small amount relative to its $4.5 trillion balance sheet, with the pace to accelerate next year.
The 10-year U.S. Treasury note stayed in a narrow range during the period, ending the period with a yield of 2.33%. Yields climbed about 25 basis points on shorter maturities, which are more sensitive to Fed interest rate hikes. Municipal bonds outperformed Treasuries, with tax-exempt yields falling on intermediate maturities. The AAA scale at the 5-year maturity declined 20 basis points to 1.35%, while the 10-year maturity fell 25 basis points to 2.00%, according to Municipal Market Data. The yield on the 1-year maturity rose 8 basis points to 0.94%.
Stable demand for tax-exempt income was evident in steady mutual fund inflows that have supported the market this year. Despite the weakness in September, municipals generated modest returns in the six-month period. Total returns were greatest in 10-year and longer maturities, which have led in performance since January as the yield curve has flattened. Municipal supply increased in September after several months of subdued issuance. Credit spreads remained historically narrow, with many of the weakest credits paradoxically leading the market in performance. Tax-exempt valuations were expensive at the end of the period, as indicated by low yield ratios in short and intermediate maturities. Absolute yields were near the lows since the November 2016 election. The municipal market does not seem to be particularly worried about the chances of lower income tax rates, which if enacted, would reduce the value of tax-exempt income.
The Fund’s performance lagged that of its benchmark. Duration, yield curve positioning, and sector distributions were little changed during the period. The Fund’s allocation to shorter maturity bonds and cash equivalents detracted from performance relative to the benchmark. Bonds in the 7 to10 year maturity range led in performance. At September 30, 2017, the Fund’s average stated maturity was 5.8 years, and the effective duration was 4.0 years, slightly longer than at the start of the period. The average credit quality of the Fund remains higher than that of the benchmark and was also a factor in the underperformance because spreads compressed between higher quality issuers and lower quality issuers during the period.
This report reflects our views, opinions and portfolio holdings as of September 30, 2017, the end of the reporting period. These views are subject to change at any time based upon market or other conditions. The Funds are distributed by Ultimus Fund Distributors, LLC.
2
THE JAMESTOWN EQUITY FUND
PERFORMANCE INFORMATION (Unaudited)
Comparison of the Change in Value of a $10,000 Investment in
The Jamestown Equity Fund
and the Standard & Poor’s 500® Index
| | Average Annual Total Returns
(for periods ended September 30, 2017) |
| | 1 Year | 5 Years | 10 Years |
The Jamestown Equity Fund(a) | 15.18% | 11.16% | 5.36% |
Standard & Poor’s 500® Index | 18.61% | 14.22% | 7.44% |
(a) | Total return is a measure of the change in value of an investment in the Fund over the periods covered, which assumes any dividends or capital gains distributions are reinvested in shares of the Fund. Returns shown do not reflect the deduction of taxes a shareholder would pay on Fund distributions or the redemption of Fund shares. |
3
THE JAMESTOWN TAX EXEMPT VIRGINIA FUND
PERFORMANCE INFORMATION (Unaudited)
Comparison of the Change in Value of a $10,000 Investment in
The Jamestown Tax Exempt Virginia Fund
and the Bloomberg Barclays 1-10 Year Municipal Blend Index*
| | Average Annual Total Returns
(for periods ended September 30, 2017) |
| | 1 Year | 5 Years | 10 Years |
The Jamestown Tax Exempt Virginia Fund(a) | (0.15%) | 1.08% | 2.66% |
| Bloomberg Barclays 1-10 Year Municipal Blend Index | 1.00% | 2.12% | 3.77% |
| * | The Bloomberg Barclays 1-10 Year Municipal Blend Index is an unmanaged, market value-weighted index which covers the short and intermediate components of the U.S. investment-grade tax-exempt bond market. |
| | |
(a) | Total return is a measure of the change in value of an investment in the Fund over the periods covered, which assumes any dividends or capital gains distributions are reinvested in shares of the Fund. Returns shown do not reflect the deduction of taxes a shareholder would pay on Fund distributions or the redemption of Fund shares. |
4
THE JAMESTOWN EQUITY FUND
PORTFOLIO INFORMATION
September 30, 2017 (Unaudited)
| Asset Allocation (% of Net Assets) | | Ten Largest Equity Holdings | % of
Net Assets |
| | Apple, Inc. | 3.9% |
| JPMorgan Chase & Company | 3.2% |
| Discover Financial Services | 2.7% |
| Alphabet, Inc. - Class C | 2.6% |
| Alphabet, Inc. - Class A | 2.5% |
| Chevron Corporation | 2.5% |
| Thermo Fisher Scientific, Inc. | 2.2% |
| Vanguard Information Technology ETF | 2.2% |
| Ameriprise Financial, Inc. | 2.2% |
| PNC Financial Services Group, Inc. (The) | 2.2% |
Sector Concentration vs. the S&P 500® Index |
5
THE JAMESTOWN TAX EXEMPT VIRGINIA FUND
PORTFOLIO INFORMATION
September 30, 2017 (Unaudited)
Characteristics
(Portfolio) | | Maturity Breakdown
(% of Bonds) |
| 30-day SEC Yield | 1.38% | | |
| Tax-Equivalent Yield* | 2.44% | |
| Weighted Average Maturity (years) | 5.8 | |
| Weighted Average Duration (years) | 4.0 | |
| Average Quality | AA | |
| Number of Issues | 61 | |
| * Assumes a maximum 43.4% federal tax rate. | |
| Credit Quality (% of Bonds) | | Sector Diversification (% of Bonds) |
| | |
6
THE JAMESTOWN EQUITY FUND
SCHEDULE OF INVESTMENTS
September 30, 2017 (Unaudited) |
| COMMON STOCKS — 92.7% | | Shares | | | Value | |
| Consumer Discretionary — 15.1% | | | | | | |
Amazon.com, Inc. (a) | | | 750 | | | $ | 721,012 | |
| BorgWarner, Inc. | | | 10,955 | | | | 561,225 | |
| Comcast Corporation - Class A | | | 18,500 | | | | 711,880 | |
Dollar Tree, Inc. (a) | | | 7,200 | | | | 625,104 | |
| Home Depot, Inc. (The) | | | 3,355 | | | | 548,744 | |
| Lennar Corporation - Class A | | | 13,000 | | | | 686,400 | |
| Lowe's Companies, Inc. | | | 9,150 | | | | 731,451 | |
Priceline Group, Inc. (The) (a) | | | 300 | | | | 549,246 | |
| TJX Companies, Inc. (The) | | | 7,150 | | | | 527,169 | |
| | | | | | | | 5,662,231 | |
| Consumer Staples — 4.4% | | | | | | | | |
| J.M. Smucker Company (The) | | | 2,800 | | | | 293,804 | |
| PepsiCo, Inc. | | | 6,000 | | | | 668,580 | |
| Wal-Mart Stores, Inc. | | | 9,000 | | | | 703,260 | |
| | | | | | | | 1,665,644 | |
| Energy — 7.3% | | | | | | | | |
| Chevron Corporation | | | 8,000 | | | | 940,000 | |
| Exxon Mobil Corporation | | | 6,300 | | | | 516,474 | |
| Hess Corporation | | | 12,500 | | | | 586,125 | |
| Total S.A. - ADR | | | 12,655 | | | | 677,296 | |
| | | | | | | | 2,719,895 | |
| Financials — 16.7% | | | | | | | | |
| Ameriprise Financial, Inc. | | | 5,500 | | | | 816,805 | |
| Chubb Ltd. | | | 2,500 | | | | 356,375 | |
| Discover Financial Services | | | 15,500 | | | | 999,440 | |
| Invesco Ltd. | | | 17,500 | | | | 613,200 | |
| JPMorgan Chase & Company | | | 12,500 | | | | 1,193,875 | |
| KeyCorp | | | 38,055 | | | | 716,195 | |
| Morgan Stanley | | | 16,000 | | | | 770,720 | |
| PNC Financial Services Group, Inc. (The) | | | 6,000 | | | | 808,620 | |
| | | | | | | | 6,275,230 | |
| Health Care — 11.7% | | | | | | | | |
| Aetna, Inc. | | | 4,510 | | | | 717,135 | |
| Allergan plc | | | 2,700 | | | | 553,365 | |
| Amgen, Inc. | | | 2,500 | | | | 466,125 | |
| McKesson Corporation | | | 2,600 | | | | 399,386 | |
| Merck & Company, Inc. | | | 11,000 | | | | 704,330 | |
| Thermo Fisher Scientific, Inc. | | | 4,400 | | | | 832,480 | |
| UnitedHealth Group, Inc. | | | 3,650 | | | | 714,853 | |
| | | | | | | | 4,387,674 | |
7
THE JAMESTOWN EQUITY FUND
SCHEDULE OF INVESTMENTS (Continued) |
| COMMON STOCKS — 92.7% (Continued) | | Shares | | | Value | |
| Industrials — 10.5% | | | | | | |
| Delta Air Lines, Inc. | | | 15,100 | | | $ | 728,122 | |
| Eaton Corporation plc | | | 9,660 | | | | 741,791 | |
| General Electric Company | | | 22,700 | | | | 548,886 | |
| Nielsen Holdings plc | | | 13,000 | | | | 538,850 | |
| Norfolk Southern Corporation | | | 5,000 | | | | 661,200 | |
| United Technologies Corporation | | | 6,300 | | | | 731,304 | |
| | | | | | | | 3,950,153 | |
| Information Technology — 23.0% | | | | | | | | |
Alphabet, Inc. - Class A (a) | | | 975 | | | | 949,377 | |
Alphabet, Inc. - Class C (a) | | | 1,000 | | | | 959,110 | |
| Apple, Inc. | | | 9,500 | | | | 1,464,140 | |
| Cisco Systems, Inc. | | | 23,500 | | | | 790,305 | |
eBay, Inc. (a) | | | 11,800 | | | | 453,828 | |
| Intel Corporation | | | 19,500 | | | | 742,560 | |
| International Business Machines Corporation | | | 2,500 | | | | 362,700 | |
| Microsoft Corporation | | | 10,000 | | | | 744,900 | |
| Oracle Corporation | | | 15,800 | | | | 763,930 | |
| QUALCOMM, Inc. | | | 12,100 | | | | 627,264 | |
| TE Connectivity Ltd. | | | 9,000 | | | | 747,540 | |
| | | | | | | | 8,605,654 | |
| Materials — 2.1% | | | | | | | | |
| Eastman Chemical Company | | | 8,695 | | | | 786,810 | |
| | | | | | | | | |
| Real Estate — 1.9% | | | | | | | | |
| American Tower Corporation | | | 5,220 | | | | 713,470 | |
| | | | | | | | | |
Total Common Stocks (Cost $20,930,214) | | | | | | $ | 34,766,761 | |
| EXCHANGE-TRADED FUNDS — 3.1% | | Shares | | | Value | |
Consumer Staples Select Sector SPDR® Fund (The) | | | 6,450 | | | $ | 348,171 | |
| Vanguard Information Technology ETF | | | 5,400 | | | | 820,746 | |
Total Exchange-Traded Funds (Cost $991,884) | | | | | | $ | 1,168,917 | |
8
THE JAMESTOWN EQUITY FUND
SCHEDULE OF INVESTMENTS (Continued) |
| MONEY MARKET FUNDS — 4.5% | | Shares | | | Value | |
Federated Government Obligations Fund - Institutional Class, 0.89% (b) (Cost $1,703,604) | | | 1,703,604 | | | $ | 1,703,604 | |
| | | | | | | | | |
Total Investments at Value — 100.3% (Cost $23,625,702) | | | | | | $ | 37,639,282 | |
| | | | | | | | | |
Liabilities in Excess of Other Assets — (0.3%) | | | | | | | (129,947 | ) |
| | | | | | | | | |
| Net Assets — 100.0% | | | | | | $ | 37,509,335 | |
| ADR - American Depositary Receipt. |
| |
(a) | Non-income producing security. |
| | |
(b) | The rate shown is the 7-day effective yield as of September 30, 2017. |
| | |
| See accompanying notes to financial statements. |
9
THE JAMESTOWN TAX EXEMPT VIRGINIA FUND
SCHEDULE OF INVESTMENTS
September 30, 2017 (Unaudited) |
| VIRGINIA REVENUE AND GENERAL OBLIGATION (GO) BONDS — 93.7% | | Par Value | | | Value | |
| Albemarle Co., Virginia, Economic Dev. Authority, Revenue, | | | | | | |
| 5.00%, due 06/01/2026 | | $ | 350,000 | | | $ | 431,648 | |
| Chesterfield Co., Virginia, GO, | | | | | | | | |
| 5.00%, due 01/01/2024 | | | 250,000 | | | | 286,605 | |
| 5.00%, due 01/01/2025 | | | 460,000 | | | | 551,223 | |
| 4.00%, due 01/01/2030 | | | 400,000 | | | | 454,600 | |
| City of Norfolk, Virginia, Series A, GO, | | | | | | | | |
| 5.00%, due 10/01/2026 | | | 200,000 | | | | 247,550 | |
| City of Winchester, Virginia, GO, | | | | | | | | |
| 5.00%, due 09/01/2027 | | | 125,000 | | | | 149,841 | |
| 4.00%, due 09/01/2029 | | | 250,000 | | | | 286,313 | |
| Fairfax Co., Virginia, Economic Dev., Revenue, | | | | | | | | |
0.979%, due 12/01/2033 (a) | | | 350,000 | | | | 350,000 | |
0.92%, due 12/01/2033 (a) | | | 350,000 | | | | 350,000 | |
| Fairfax Co., Virginia, Industrial Dev. Authority, Revenue, | | | | | | | | |
| 5.00%, due 05/15/2022, | | | | | | | | |
| prerefunded 05/15/2019 @ 100 | | | 750,000 | | | | 798,652 | |
| Fairfax Co., Virginia, Sewer, Revenue, | | | | | | | | |
| 4.50%, due 07/15/2030, | | | | | | | | |
| prerefunded 07/15/2021 @ 100 | | | 250,000 | | | | 280,477 | |
| Fairfax Co., Virginia, Water, Revenue, | | | | | | | | |
| 5.00%, due 04/01/2027 | | | 500,000 | | | | 575,620 | |
| Hampton Roads Sanitation District, Virginia, Wastewater, Revenue, | | | | | | | | |
| 5.00%, due 07/01/2026 | | | 500,000 | | | | 602,400 | |
| Hampton Roads Sanitation District, Virginia, Wastewater, Series A, Revenue, | | | | | | | | |
| 5.00%, due 01/01/2027, | | | | | | | | |
| prerefunded 01/01/2021 @ 100 | | | 400,000 | | | | 449,472 | |
| Hampton, Virginia, GO, | | | | | | | | |
| 5.00%, due 04/01/2025 | | | 500,000 | | | | 579,220 | |
| Harrisonburg, Virginia, GO, | | | | | | | | |
| 5.00%, due 07/15/2022 | | | 350,000 | | | | 408,145 | |
| Henrico Co., Virginia, Public Improvements, GO, | | | | | | | | |
| 5.00%, due 08/01/2027 | | | 350,000 | | | | 440,412 | |
| Henrico Co., Virginia, Water & Sewer, Revenue, | | | | | | | | |
| 5.00%, due 05/01/2020, | | | | | | | | |
| prerefunded 05/01/2019 @ 100 | | | 350,000 | | | | 372,277 | |
| 5.00%, due 05/01/2022, | | | | | | | | |
| prerefunded 05/01/2019 @ 100 | | | 430,000 | | | | 457,370 | |
10
THE JAMESTOWN TAX EXEMPT VIRGINIA FUND
SCHEDULE OF INVESTMENTS (Continued) |
| VIRGINIA REVENUE AND GENERAL OBLIGATION (GO) BONDS — 93.7% (Continued) | | Par Value | | | Value | |
| James City, Virginia, Water & Sewer, Revenue, | | | | | | |
| 5.00%, due 01/15/2026 | | $ | 250,000 | | | $ | 306,955 | |
| Louisa, Virginia, Industrial Dev. Authority, Poll Control Revenue, | | | | | | | | |
| 2.15%, due 11/01/2035 | | | 200,000 | | | | 203,452 | |
| Lynchburg, Virginia, GO, | | | | | | | | |
| 5.00%, due 08/01/2024 | | | 310,000 | | | | 376,951 | |
| Lynchburg, Virginia, Public Improvement, Series A, GO, | | | | | | | | |
| 5.00%, due 08/01/2019 | | | 625,000 | | | | 671,144 | |
| Manassas, Virginia, Public Improvement, Series D, GO, | | | | | | | | |
| 5.00%, due 07/01/2019 | | | 250,000 | | | | 267,582 | |
| Newport News, Virginia, GO, | | | | | | | | |
| 5.00%, due 07/15/2025 | | | 350,000 | | | | 429,398 | |
| Northern Virginia Transportation Authority, Special Tax, Revenue, | | | | | | | | |
| 5.00%, due 06/01/2026 | | | 400,000 | | | | 479,480 | |
| Portsmouth, Virginia, Series D, GO, | | | | | | | | |
| 4.00%, due 12/01/2017 | | | 215,000 | | | | 216,189 | |
| Prince William Co., Virginia, Lease Participation Certificates, | | | | | | | | |
| 5.00%, due 10/01/2020 | | | 500,000 | | | | 552,330 | |
| Rappahannock, Virginia, Regional Jail Authority, Revenue, | | | | | | | | |
| 5.00%, due 10/01/2024 | | | 300,000 | | | | 360,894 | |
| Richmond, Virginia, Public Utility, Revenue, | | | | | | | | |
| 4.00%, due 01/15/2018 | | | 400,000 | | | | 403,640 | |
| Roanoke, Virginia, Public Improvement, Series A, GO, | | | | | | | | |
| 5.00%, due 07/15/2025 | | | 400,000 | | | | 473,844 | |
| Spotsylvania Co., Virginia, Economic Dev. Authority, Revenue, | | | | | | | | |
| 5.00%, due 06/01/2021 | | | 300,000 | | | | 339,171 | |
| Spotsylvania Co., Virginia, GO, | | | | | | | | |
| 5.00%, due 01/15/2023 | | | 400,000 | | | | 471,788 | |
| Stafford Co., Virginia, Public Improvement, GO, | | | | | | | | |
| 5.00%, due 08/01/2026 | | | 375,000 | | | | 459,034 | |
| Suffolk, Virginia, Public Improvement, GO, | | | | | | | | |
| 5.00%, due 02/01/2022 | | | 400,000 | | | | 462,384 | |
| Suffolk, Virginia, Public Improvement, Series A, GO, | | | | | | | | |
| 4.00%, due 08/01/2018 | | | 250,000 | | | | 256,445 | |
| Upper Occoquan, Virginia, Sewer Authority, Revenue, | | | | | | | | |
| 5.15%, due 07/01/2020 | | | 160,000 | | | | 171,026 | |
| 5.00%, due 07/01/2027 | | | 350,000 | | | | 426,909 | |
| Virginia Beach, Virginia, Dev. Authority, Series A, Revenue, | | | | | | | | |
| 5.00%, due 11/01/2020 | | | 300,000 | | | | 335,010 | |
11
THE JAMESTOWN TAX EXEMPT VIRGINIA FUND
SCHEDULE OF INVESTMENTS (Continued) |
| VIRGINIA REVENUE AND GENERAL OBLIGATION (GO) BONDS — 93.7% (Continued) | | Par Value | | | Value | |
| Virginia Beach, Virginia, GO, | | | | | | |
| 5.00%, due 03/01/2023 | | $ | 300,000 | | | $ | 354,489 | |
| Virginia Beach, Virginia, Public Improvement, GO, | | | | | | | | |
| 5.00%, due 06/01/2021, | | | | | | | | |
| prerefunded 06/01/2019 @ 100 | | | 250,000 | | | | 266,748 | |
| Virginia Beach, Virginia, Public Improvement, Series A, GO, | | | | | | | | |
| 4.00%, due 04/01/2027 | | | 205,000 | | | | 223,669 | |
| Virginia Biotechnology Research Partnership Authority, Lease Revenue, | | | | | | | | |
| 5.00%, due 09/01/2020 | | | 500,000 | | | | 554,135 | |
| Virginia College Building Authority, Educational Facilities, Revenue, | | | | | | | | |
| 5.00%, due 03/01/2019 | | | 250,000 | | | | 263,975 | |
| 4.00%, due 09/01/2026 | | | 500,000 | | | | 551,500 | |
| Virginia Commonwealth Transportation Board, Federal Grant Anticipation Notes, Revenue, | | | | | | | | |
| 5.00%, due 03/15/2025 | | | 500,000 | | | | 586,440 | |
| Virginia Commonwealth Transportation Board, Federal Grant Anticipation Notes, Series A, Revenue, | | | | | | | | |
| 5.00%, due 03/15/2023 | | | 500,000 | | | | 577,765 | |
| Virginia Small Business Financing Authority, Healthcare Facilities, Revenue, | | | | | | | | |
| 5.00%, due 11/01/2017 | | | 250,000 | | | | 250,918 | |
| Virginia State Commonwealth Transportation Board, Federal Grant Anticipation Notes, Revenue, | | | | | | | | |
| 5.00%, due 03/15/2025 | | | 375,000 | | | | 456,206 | |
| Virginia State Housing Dev. Authority, Revenue, | | | | | | | | |
| 3.05%, due 07/01/2021 | | | 200,000 | | | | 210,826 | |
| Virginia State Public School Authority, Revenue, | | | | | | | | |
| 5.00%, due 08/01/2023 | | | 500,000 | | | | 582,520 | |
| 5.00%, due 07/15/2026 | | | 300,000 | | | | 356,184 | |
| Virginia State Public School Authority, Series B-1, Revenue, | | | | | | | | |
| 5.00%, due 08/01/2018 | | | 500,000 | | | | 516,835 | |
| Virginia State Resources Authority, Clean Water, Revenue, | | | | | | | | |
| 5.00%, due 10/01/2021, | | | | | | | | |
| prerefunded 10/01/2019 @ 100 | | | 500,000 | | | | 539,145 | |
| Virginia State Resources Authority, Infrastructure, Revenue, | | | | | | | | |
| 5.00%, due 11/01/2024, | | | | | | | | |
| prerefunded 11/01/2018 @ 100 | | | 405,000 | | | | 422,917 | |
| 5.00%, due 11/01/2024, | | | | | | | | |
| prerefunded 11/01/2018 @ 100 | | | 35,000 | | | | 36,548 | |
| 5.00%, due 11/01/2024 | | | 60,000 | | | | 62,545 | |
12
THE JAMESTOWN TAX EXEMPT VIRGINIA FUND
SCHEDULE OF INVESTMENTS (Continued) |
| VIRGINIA REVENUE AND GENERAL OBLIGATION (GO) BONDS — 93.7% (Continued) | | Par Value | | | Value | |
| Virginia State Resources Authority, Infrastructure, Series B, Revenue, | | | | | | |
| 5.00%, due 11/01/2024 | | $ | 150,000 | | | $ | 176,256 | |
| Washington Co., Virginia, Revenue, | | | | | | | | |
| 4.00%, due 12/01/2025 | | | 350,000 | | | | 400,323 | |
| Western Virginia Regional Jail Authority, Revenue, | | | | | | | | |
| 5.00%, due 12/01/2023 | | | 250,000 | | | | 296,033 | |
| | | | | | | | | |
Total Virginia Revenue and General Obligation (GO) Bonds (Cost $22,810,202) | | | | | | $ | 23,421,428 | |
| WASHINGTON, D.C. REVENUE BONDS — 2.1% | | Par Value | | | Value | |
| Metropolitan Washington Airports Authority, Series C, Revenue, | | | | | | |
| 5.00%, due 10/01/2022 (Cost $501,439) | | $ | 500,000 | | | $ | 519,215 | |
| EXCHANGE-TRADED FUNDS — 1.3% | | Shares | | | Value | |
| VanEck Vectors AMT-Free Intermediate Municipal Index ETF (Cost $347,250) | | | 14,000 | | | $ | 336,700 | |
| MONEY MARKET FUNDS — 2.8% | | Shares | | | Value | |
Federated Government Obligations Fund - Institutional Class, 0.89% (b) (Cost $690,985) | | | 690,985 | | | $ | 690,985 | |
| | | | | | | | | |
Total Investments at Value — 99.9% (Cost $24,349,876) | | | | | | $ | 24,968,328 | |
| | | | | | | | | |
| Other Assets in Excess of Liabilities — 0.1% | | | | | | | 23,020 | |
| | | | | | | | | |
Net Assets — 100.0% | | | | | | $ | 24,991,348 | |
(a) | Variable rate security. The weekly rate for each succeeding interest period during a weekly rate mode shall be established by the respective remarketing agents on the business day preceding the first day of such interest period and shall be the lowest rate of interest which will, in the sole judgement of the respective remarketing agents having due regard for prevailing financial market conditions, permit the bonds to be remarketed at par on the first day of such interest period. |
| | |
(b) | The rate shown is the 7-day effective yield as of September 30, 2017. |
| | |
| See accompanying notes to financial statements. |
13
THE JAMESTOWN FUNDS
STATEMENTS OF ASSETS AND LIABILITIES
September 30, 2017 (Unaudited) |
| | | The Jamestown
Equity
Fund | | | The
Jamestown
Tax Exempt
Virginia
Fund | |
| ASSETS | | | | | | |
| Investments in securities: | | | | | | |
| At cost | | $ | 23,625,702 | | | $ | 24,349,876 | |
| At value (Note 2) | | $ | 37,639,282 | | | $ | 24,968,328 | |
| Dividends and interest receivable | | | 34,047 | | | | 269,487 | |
| Receivable for capital shares sold | | | — | | | | 40,000 | |
| Receivable for investment securities sold | | | — | | | | 121,451 | |
| Other assets | | | 9,939 | | | | 9,505 | |
| TOTAL ASSETS | | | 37,683,268 | | | | 25,408,771 | |
| | | | | | | | | |
| LIABILITIES | | | | | | | | |
| Distributions payable | | | 5,699 | | | | 775 | |
| Payable for capital shares redeemed | | | 142,773 | | | | 29,880 | |
| Payable for investment securities purchased | | | — | | | | 376,403 | |
| Accrued investment advisory fees (Note 4) | | | 18,327 | | | | 2,481 | |
| Payable to administrator (Note 4) | | | 5,700 | | | | 5,700 | |
| Other accrued expenses | | | 1,434 | | | | 2,184 | |
| TOTAL LIABILITIES | | | 173,933 | | | | 417,423 | |
| | | | | | | | |
| NET ASSETS | | $ | 37,509,335 | | | $ | 24,991,348 | |
| | | | | | | | | |
| Net assets consist of: | | | | | | | | |
| Paid-in capital | | $ | 22,540,721 | | | $ | 24,367,579 | |
| Accumulated (distributions in excess of) net investment income | | | (4,043 | ) | | | — | |
| Accumulated net realized gains from investment transactions | | | 959,077 | | | | 5,317 | |
| Net unrealized appreciation on investments | | | 14,013,580 | | | | 618,452 | |
| Net assets | | $ | 37,509,335 | | | $ | 24,991,348 | |
| | | | | | | | |
| Shares of beneficial interest outstanding (unlimited number of shares authorized, $0.01 par value) | | | 1,756,332 | | | | 2,494,690 | |
| | | | | | | | |
| Net asset value, offering price and redemption price per share (Note 2) | | $ | 21.36 | | | $ | 10.02 | |
| See accompanying notes to financial statements. |
14
THE JAMESTOWN FUNDS
STATEMENTS OF OPERATIONS
Six Months Ended September 30, 2017 (Unaudited) |
| | | The Jamestown Equity
Fund | | | The Jamestown Tax Exempt Virginia
Fund | |
| INVESTMENT INCOME | | | | | | |
| Dividends | | $ | 381,192 | | | $ | 8,295 | |
| Foreign withholding taxes on dividends | | | (3,769 | ) | | | — | |
| Interest | | | — | | | | 295,323 | |
| TOTAL INVESTMENT INCOME | | | 377,423 | | | | 303,618 | |
| | | | | | | | | |
| EXPENSES | | | | | | | | |
| Investment advisory fees (Note 4) | | | 121,760 | | | | 50,611 | |
| Administration fees (Note 4) | | | 30,000 | | | | 30,000 | |
| Professional fees | | | 10,768 | | | | 11,518 | |
| Trustees’ fees and expenses (Note 4) | | | 4,982 | | | | 4,982 | |
| Compliance service fees (Note 4) | | | 4,200 | | | | 4,200 | |
| Printing of shareholder reports | | | 4,988 | | | | 1,619 | |
| Custodian and bank service fees | | | 3,607 | | | | 2,721 | |
| Pricing costs | | | 610 | | | | 5,513 | |
| Registration and filing fees | | | 3,948 | | | | 2,024 | |
| Account maintenance fees | | | 2,387 | | | | 3,575 | |
| Postage and supplies | | | 3,174 | | | | 1,371 | |
| Other expenses | | | 2,899 | | | | 4,597 | |
| TOTAL EXPENSES | | | 193,323 | | | | 122,731 | |
| Fees voluntarily waived by the Adviser (Note 4) | | | (9,366 | ) | | | (35,427 | ) |
| Expenses reimbursed through a directed brokerage arrangement (Note 5) | | | (6,000 | ) | | | — | |
| NET EXPENSES | | | 177,957 | | | | 87,304 | |
| | | | | | | | | |
| NET INVESTMENT INCOME | | | 199,466 | | | | 216,314 | |
| | | | | | | | |
| REALIZED AND UNREALIZED GAINS ON INVESTMENTS | | | | | | | | |
| Net realized gains on investment transactions | | | 1,035,209 | | | | 8,369 | |
| Net change in unrealized appreciation (depreciation) on investments | | | 920,729 | | | | 147,677 | |
NET REALIZED AND UNREALIZED GAINS ON INVESTMENTS | | | 1,955,938 | | | | 156,046 | |
| | | | | | | | |
NET INCREASE IN NET ASSETS FROM OPERATIONS | | $ | 2,155,404 | | | $ | 372,360 | |
| See accompanying notes to financial statements. |
15
THE JAMESTOWN EQUITY FUND
STATEMENTS OF CHANGES IN NET ASSETS |
| | | Six Months
Ended
Sept. 30, 2017
(Unaudited) | | | Year
Ended
March 31, 2017 | |
| FROM OPERATIONS | | | | | | |
| Net investment income | | $ | 199,466 | | | $ | 357,284 | |
| Net realized gains on investment transactions | | | 1,035,209 | | | | 2,455,790 | |
| Net change in unrealized appreciation (depreciation) on investments | | | 920,729 | | | | 1,444,898 | |
| Net increase in net assets from operations | | | 2,155,404 | | | | 4,257,972 | |
| | | | | | | | | |
| DISTRIBUTIONS TO SHAREHOLDERS (Note 2) | | | | | | | | |
| From net investment income | | | (205,334 | ) | | | (365,171 | ) |
| From net realized gains from investment transactions | | | (1,119,213 | ) | | | (1,430,817 | ) |
| Decrease in net assets from distributions to shareholders | | | (1,324,547 | ) | | | (1,795,988 | ) |
| | | | | | | | | |
| FROM CAPITAL SHARE TRANSACTIONS | | | | | | | | |
| Proceeds from shares sold | | | 152,303 | | | | 452,515 | |
| Net asset value of shares issued in reinvestment of distributions to shareholders | | | 1,251,863 | | | | 1,689,646 | |
| Payments for shares redeemed | | | (2,185,256 | ) | | | (4,826,314 | ) |
| Net decrease in net assets from capital share transactions | | | (781,090 | ) | | | (2,684,153 | ) |
| | | | | | | | | |
| TOTAL INCREASE (DECREASE) IN NET ASSETS | | | 49,767 | | | | (222,169 | ) |
| | | | | | | | | |
| NET ASSETS | | | | | | | | |
| Beginning of period | | | 37,459,568 | | | | 37,681,737 | |
| End of period | | $ | 37,509,335 | | | $ | 37,459,568 | |
| | | | | | | | | |
| ACCUMULATED (DISTRIBUTIONS IN EXCESS OF) NET INVESTMENT INCOME | | $ | (4,043 | ) | | $ | 1,825 | |
| | | | | | | | | |
| CAPITAL SHARE ACTIVITY | | | | | | | | |
| Shares sold | | | 7,253 | | | | 22,627 | |
| Shares reinvested | | | 60,357 | | | | 85,744 | |
| Shares redeemed | | | (104,440 | ) | | | (240,820 | ) |
| Net decrease in shares outstanding | | | (36,830 | ) | | | (132,449 | ) |
| Shares outstanding, beginning of period | | | 1,793,162 | | | | 1,925,611 | |
| Shares outstanding, end of period | | | 1,756,332 | | | | 1,793,162 | |
| See accompanying notes to financial statements. |
16
THE JAMESTOWN TAX EXEMPT VIRGINIA FUND
STATEMENTS OF CHANGES IN NET ASSETS |
| | | Six Months
Ended
Sept. 30, 2017
(Unaudited) | | | Year
Ended
March 31, 2017 | |
| FROM OPERATIONS | | | | | | |
| Net investment income | | $ | 216,314 | | | $ | 462,616 | |
| Net realized gains on investment transactions | | | 8,369 | | | | 6,214 | |
| Capital gain distributions from regulated investment companies | | | — | | | | 629 | |
| Net change in unrealized appreciation (depreciation) on investments | | | 147,677 | | | | (659,062 | ) |
| Net increase (decrease) in net assets from operations | | | 372,360 | | | | (189,603 | ) |
| | | | | | | | | |
| DISTRIBUTIONS TO SHAREHOLDERS (Note 2) | | | | | | | | |
| From net investment income | | | (216,314 | ) | | | (462,616 | ) |
| | | | | | | | | |
| FROM CAPITAL SHARE TRANSACTIONS | | | | | | | | |
| Proceeds from shares sold | | | 568,000 | | | | 1,884,458 | |
| Net asset value of shares issued in reinvestment of distributions to shareholders | | | 203,569 | | | | 417,898 | |
| Payments for shares redeemed | | | (1,136,999 | ) | | | (2,096,136 | ) |
| Net increase (decrease) in net assets from capital share transactions | | | (365,430 | ) | | | 206,220 | |
| | | | | | | | | |
| TOTAL DECREASE IN NET ASSETS | | | (209,384 | ) | | | (445,999 | ) |
| | | | | | | | | |
| NET ASSETS | | | | | | | | |
| Beginning of period | | | 25,200,732 | | | | 25,646,731 | |
| End of period | | $ | 24,991,348 | | | $ | 25,200,732 | |
| | | | | | | | | |
| ACCUMULATED NET INVESTMENT INCOME | | $ | — | | | $ | — | |
| | | | | | | | | |
| CAPITAL SHARE ACTIVITY | | | | | | | | |
| Shares sold | | | 56,570 | | | | 186,315 | |
| Shares reinvested | | | 20,262 | | | | 41,367 | |
| Shares redeemed | | | (112,983 | ) | | | (209,390 | ) |
| Net increase (decrease) in shares outstanding | | | (36,151 | ) | | | 18,292 | |
| Shares outstanding, beginning of period | | | 2,530,841 | | | | 2,512,549 | |
| Shares outstanding, end of period | | | 2,494,690 | | | | 2,530,841 | |
| See accompanying notes to financial statements. |
17
THE JAMESTOWN EQUITY FUND
FINANCIAL HIGHLIGHTS |
| Selected Per Share Data and Ratios for a Share Outstanding Throughout Each Period |
| | Six Months
Ended
Sept. 30,
2017
(Unaudited) | | | Years Ended March 31, | |
| | | 2017 | | | | 2016 | | | | 2015 | | | | 2014 | | | | 2013 | |
| Net asset value at beginning of period | | $ | 20.89 | | | $ | 19.57 | | | $ | 21.91 | | | $ | 22.47 | | | $ | 19.60 | | | $ | 17.73 | |
| | | | | | | | | | | | | | | | | | | | | | | | | |
| Income (loss) from investment operations: | | | | | | | | | | | | | | | | | | | | | | | | |
| Net investment income | | | 0.11 | | | | 0.19 | | | | 0.16 | | | | 0.16 | | | | 0.15 | | | | 0.15 | |
| Net realized and unrealized gains (losses) on investments | | | 1.11 | | | | 2.12 | | | | (1.18 | ) | | | 1.96 | | | | 4.30 | | | | 1.93 | |
| Total from investment operations | | | 1.22 | | | | 2.31 | | | | (1.02 | ) | | | 2.12 | | | | 4.45 | | | | 2.08 | |
| | | | | | | | | | | | | | | | | | | | | | | | | |
| Less distributions: | | | | | | | | | | | | | | | | | | | | | | | | |
| Dividends from net investment income | | | (0.12 | ) | | | (0.20 | ) | | | (0.16 | ) | | | (0.16 | ) | | | (0.15 | ) | | | (0.15 | ) |
| Distributions from net realized gains | | | (0.63 | ) | | | (0.79 | ) | | | (1.16 | ) | | | (2.52 | ) | | | (1.43 | ) | | | (0.06 | ) |
| Total distributions | | | (0.75 | ) | | | (0.99 | ) | | | (1.32 | ) | | | (2.68 | ) | | | (1.58 | ) | | | (0.21 | ) |
| | | | | | | | | | | | | | | | | | | | | | | | | |
| Net asset value at end of period | | $ | 21.36 | | | $ | 20.89 | | | $ | 19.57 | | | $ | 21.91 | | | $ | 22.47 | | | $ | 19.60 | |
| | | | | | | | | | | | | | | | | | | | | | | | | |
Total return (a) | | | 5.96 | %(b) | | | 12.14 | % | | | (4.96 | %) | | | 10.14 | % | | | 23.55 | % | | | 11.84 | % |
| | | | | | | | | | | | | | | | | | | | | | | | | |
| Net assets at end of period (000’s) | | $ | 37,509 | | | $ | 37,460 | | | $ | 37,682 | | | $ | 29,596 | | | $ | 30,746 | | | $ | 28,316 | |
| | | | | | | | | | | | | | | | | | | | | | | | | |
| Ratio of total expenses to average net assets | | | 1.03 | %(c) | | | 1.03 | % | | | 1.03 | % | | | 1.09 | % | | | 1.07 | % | | | 1.11 | % |
| | | | | | | | | | | | | | | | | | | | | | | | | |
Ratio of net expenses to average net assets (d) | | | 0.95 | %(c)(e) | | | 0.95 | %(e) | | | 1.00 | % | | | 1.05 | % | | | 1.03 | % | | | 1.06 | % |
| | | | | | | | | | | | | | | | | | | | | | | | | |
Ratio of net investment income to average net assets (d) | | | 1.06 | %(c)(e) | | | 0.96 | %(e) | | | 0.82 | % | | | 0.71 | % | | | 0.72 | % | | | 0.81 | % |
| | | | | | | | | | | | | | | | | | | | | | | | | |
| Portfolio turnover rate | | | 12 | %(b) | | | 27 | % | | | 50 | % | | | 29 | % | | | 21 | % | | | 28 | % |
(a) | Total return is a measure of the change in value of an investment in the Fund over the periods covered, which assumes any dividends or realized capital gains distributions are reinvested in shares of the Fund. Returns do not reflect the deduction of taxes a shareholder would pay on Fund distributions or the redemption of Fund shares. |
| | |
(b) | Not annualized. |
| | |
(c) | Annualized. |
| | |
(d) | Ratios were determined based on net expenses after expense reimbursements through a directed brokerage arrangement (Note 5). |
| | |
(e) | Ratio was determined after voluntary advisory fee waivers by the Adviser (Note 4). |
| | |
| See accompanying notes to financial statements. |
18
THE JAMESTOWN TAX EXEMPT VIRGINIA FUND
FINANCIAL HIGHLIGHTS |
| Selected Per Share Data and Ratios for a Share Outstanding Throughout Each Period |
| | | Six Months
Ended
Sept. 30,
2017
(Unaudited) | | | Years Ended March 31, | |
| | | 2017 | | | | 2016 | | | | 2015 | | | | 2014 | | | | 2013 | |
| Net asset value at beginning of period | | $ | 9.96 | | | $ | 10.21 | | | $ | 10.18 | | | $ | 10.16 | | | $ | 10.47 | | | $ | 10.57 | |
| | | | | | | | | | | | | | | | | | | | | | | | | |
| Income (loss) from investment operations: | | | | | | | | | | | | | | | | | | | | | | | | |
| Net investment income | | | 0.09 | | | | 0.18 | | | | 0.21 | | | | 0.24 | | | | 0.26 | | | | 0.26 | |
| Net realized and unrealized gains (losses) on investments | | | 0.06 | | | | (0.25 | ) | | | 0.03 | | | | 0.02 | | | | (0.30 | ) | | | (0.06 | ) |
| Total from investment operations | | | 0.15 | | | | (0.07 | ) | | | 0.24 | | | | 0.26 | | | | (0.04 | ) | | | 0.20 | |
| | | | | | | | | | | | | | | | | | | | | | | | | |
| Less distributions: | | | | | | | | | | | | | | | | | | | | | | | | |
| Dividends from net investment income | | | (0.09 | ) | | | (0.18 | ) | | | (0.21 | ) | | | (0.24 | ) | | | (0.26 | ) | | | (0.27 | ) |
| Distributions from net realized gains | | | — | | | | — | | | | — | | | | — | | | | (0.01 | ) | | | (0.03 | ) |
| Total distributions | | | (0.09 | ) | | | (0.18 | ) | | | (0.21 | ) | | | (0.24 | ) | | | (0.27 | ) | | | (0.30 | ) |
| | | | | | | | | | | | | | | | | | | | | | | | | |
| Net asset value at end of period | | $ | 10.02 | | | $ | 9.96 | | | $ | 10.21 | | | $ | 10.18 | | | $ | 10.16 | | | $ | 10.47 | |
| | | | | | | | | | | | | | | | | | | | | | | | | |
Total return (a) | | | 1.47 | %(b) | | | (0.66 | %) | | | 2.40 | % | | | 2.61 | % | | | (0.37 | %) | | | 1.88 | % |
| | | | | | | | | | | | | | | | | | | | | | | | | |
| Net assets at end of period (000’s) | | $ | 24,991 | | | $ | 25,201 | | | $ | 25,647 | | | $ | 26,695 | | | $ | 26,284 | | | $ | 27,782 | |
| | | | | | | | | | | | | | | | | | | | | | | | | |
| Ratio of total expenses to average net assets | | | 0.97 | %(c) | | | 0.94 | % | | | 0.90 | % | | | 0.88 | % | | | 0.88 | % | | | 0.76 | % |
| | | | | | | | | | | | | | | | | | | | | | | | | |
Ratio of net expenses to average net assets (d) | | | 0.69 | %(c) | | | 0.69 | % | | | 0.69 | % | | | 0.69 | % | | | 0.69 | % | | | 0.69 | % |
| | | | | | | | | | | | | | | | | | | | | | | | | |
Ratio of net investment income to average net assets (d) | | | 1.71 | %(c) | | | 1.82 | % | | | 2.08 | % | | | 2.38 | % | | | 2.59 | % | | | 2.50 | % |
| | | | | | | | | | | | | | | | | | | | | | | | | |
| Portfolio turnover rate | | | 4 | %(b) | | | 13 | % | | | 11 | % | | | 16 | % | | | 1 | % | | | 15 | % |
(a) | Total return is a measure of the change in value of an investment in the Fund over the periods covered, which assumes any dividends or realized capital gains distributions are reinvested in shares of the Fund. Returns do not reflect the deduction of taxes a shareholder would pay on Fund distributions or the redemption of Fund shares. |
| | |
(b) | Not annualized. |
| | |
(c) | Annualized. |
| | |
(d) | Ratios were determined after voluntary advisory fee waivers by the Adviser (Note 4). |
| | |
| See accompanying notes to financial statements. |
19
THE JAMESTOWN FUNDS
NOTES TO FINANCIAL STATEMENTS
September 30, 2017 (Unaudited)
1. Organization
The Jamestown Equity Fund and The Jamestown Tax Exempt Virginia Fund (individually, a “Fund,” and, collectively, the “Funds”) are each a no-load series of Williamsburg Investment Trust (the “Trust”), an open-end management investment company registered under the Investment Company Act of 1940, as amended. The Jamestown Equity Fund is a diversified fund and The Jamestown Tax Exempt Virginia Fund is a non-diversified fund. The Trust was organized as a Massachusetts business trust on July 18, 1988. Other series of the Trust are not included in this report.
The Jamestown Equity Fund’s investment objective is long-term growth of capital.
The Jamestown Tax Exempt Virginia Fund’s investment objectives are to provide current income exempt from federal income taxes and from the personal income taxes of Virginia, to preserve capital, to limit credit risk and to take advantage of opportunities to increase and enhance the value of a shareholder’s investment.
2. Significant Accounting Policies
In October 2016, the U.S. Securities and Exchange Commission (the “SEC”) adopted amendments to Regulation S-X, which impact financial statement presentation, particularly the presentation of derivative investments. The Funds have adopted these amendments, which were effective August 1, 2017, with these financial statements.
Each Fund follows accounting and reporting guidance under Financial Accounting Standards Board Accounting Standards Codification Topic 946, “Financial Services – Investment Companies.” The following is a summary of the Funds’ significant accounting policies. These policies are in conformity with accounting principles generally accepted in the United States of America (“GAAP”).
Securities valuation — The Funds’ portfolio securities are valued as of the close of business of the regular session of the New York Stock Exchange (normally 4:00 p.m., Eastern time). Securities traded on a national stock exchange, including common stocks and exchange-traded funds, are generally valued based upon the closing price on the principal exchange where the security is traded, if available, otherwise, at the last quoted bid price. Securities that are quoted by NASDAQ are valued at the NASDAQ Official Closing Price. Investments representing shares of other open-end investment companies, including money market funds, are valued at their net asset value (“NAV”) as reported by such companies. When using a quoted price and when the market is considered active, securities will be classified as Level 1 within the fair value hierarchy.
Fixed income securities, including municipal bonds, are typically valued on the basis of prices provided by an independent pricing service. The prices provided by the pricing service are determined with consideration given to institutional bid and last sale prices and take into account securities prices, yields, maturities, call features, ratings, institutional trading in similar groups of securities, and developments related to specific securities. Given the inputs used by the pricing service, these securities are classified as Level 2 within the fair value hierarchy.
20
THE JAMESTOWN FUNDS
NOTES TO FINANCIAL STATEMENTS (Continued)
When market quotations are not readily available, if a pricing service cannot provide a price, or the investment adviser believes the price received from the pricing service is not indicative of market value, securities will be valued in good faith at fair value using methods consistent with procedures adopted by the Board of Trustees and will be classified as Level 2 or 3 within the fair value hierarchy (see below), depending on the inputs used. Such methods of fair valuation may include, but are not limited to: multiple of earnings, multiple of book value, discount from market of a similar freely traded security, purchase price of the security, subsequent private transactions in the security or related securities, or a combination of these and other factors.
GAAP establishes a single authoritative definition of fair value, sets out a framework for measuring fair value and requires additional disclosures about fair value measurements.
Various inputs are used in determining the value of each Fund’s investments. These inputs are summarized in the three broad levels listed below:
| ● | Level 1 – quoted prices in active markets for identical securities |
| ● | Level 2 – other significant observable inputs |
| ● | Level 3 – significant unobservable inputs |
The inputs or methodology used for valuing securities are not necessarily an indication of the risks associated with investing in those securities. The inputs used to measure fair value may fall into different levels of the fair value hierarchy. In such cases, for disclosure purposes, the level in the fair value hierarchy within which the fair value measurement falls in its entirety is determined based on the lowest level input that is significant to the fair value measurement.
The following is a summary of the inputs used to value each Fund’s investments as of September 30, 2017, by security type:
| The Jamestown Equity Fund | | Level 1 | | | Level 2 | | | Level 3 | | | Total | |
| Common Stocks | | $ | 34,766,761 | | | $ | — | | | $ | — | | | $ | 34,766,761 | |
| Exchange-Traded Funds | | | 1,168,917 | | | | — | | | | — | | | | 1,168,917 | |
| Money Market Funds | | | 1,703,604 | | | | — | | | | — | | | | 1,703,604 | |
| Total | | $ | 37,639,282 | | | $ | — | | | $ | — | | | $ | 37,639,282 | |
| The Jamestown Tax Exempt Virginia Fund | | Level 1 | | | Level 2 | | | Level 3 | | | Total | |
| Revenue and General Obligation Municipal Bonds | | $ | — | | | $ | 23,940,643 | | | $ | — | | | $ | 23,940,643 | |
| Exchange-Traded Funds | | | 336,700 | | | | — | | | | — | | | | 336,700 | |
| Money Market Funds | | | 690,985 | | | | — | | | | — | | | | 690,985 | |
| Total | | $ | 1,027,685 | | | $ | 23,940,643 | | | $ | — | | | $ | 24,968,328 | |
21
THE JAMESTOWN FUNDS
NOTES TO FINANCIAL STATEMENTS (Continued)
Refer to The Jamestown Equity Fund’s Schedule of Investments for a listing of the common stocks by sector type. As of September 30, 2017, the Funds did not have any transfers into or out of any Level. There were no Level 3 securities or derivative instruments held by the Funds as of September 30, 2017. It is the Funds’ policy to recognize transfers into or out of any Level at the end of the reporting period.
Share valuation — The NAV per share of each Fund is calculated daily by dividing the total value of its assets, less liabilities, by the number of shares outstanding. The offering price and redemption price per share of each Fund is equal to the NAV per share.
Investment income — Interest income is accrued as earned. Discounts and premiums on fixed income securities purchased are amortized using the interest method. Dividend income is recorded on the ex-dividend date. Withholding taxes on foreign dividends received by The Jamestown Equity Fund, if any, have been recorded in accordance with the Trust’s understanding of the applicable country’s rules and tax rates.
Distributions to shareholders — Dividends arising from net investment income, if any, are declared and paid quarterly to shareholders of The Jamestown Equity Fund. Dividends arising from net investment income are declared daily and paid monthly to shareholders of The Jamestown Tax Exempt Virginia Fund. Net realized short-term capital gains, if any, may be distributed throughout the year and net realized long-term capital gains, if any, are distributed at least once each year. The amount of distributions from net investment income and net realized capital gains are determined in accordance with federal income tax regulations, which may differ from GAAP. These “book/tax” differences are permanent in nature and are primarily due to differing treatments of net short-term capital gains. Dividends and distributions are recorded on the ex-dividend date.
The tax character of distributions paid during the periods ended September 30, 2017 and March 31, 2017 was as follows:
| Periods Ended | Ordinary Income | Long-Term Capital Gains | Exempt-Interest Dividends | Total Distributions |
| The Jamestown Equity Fund | 9/30/2017 | $ 205,334 | $ 1,119,213 | $ — | $ 1,324,547 |
| | 3/31/2017 | $ 365,171 | $ 1,430,817 | $ — | $ 1,795,988 |
| The Jamestown Tax Exempt Virginia Fund | 9/30/2017 | $ — | $ — | $ 216,314 | $ 216,314 |
| | 3/31/2017 | $ — | $ — | $ 462,616 | $ 462,616 |
Investment transactions — Investment transactions are accounted for on trade date for financial reporting purposes. Realized gains and losses on securities sold are determined on a specific identification basis.
Common expenses — Common expenses of the Trust are allocated among the series of the Trust based on relative net assets of each series or the nature of the services performed and the relative applicability to each series.
22
THE JAMESTOWN FUNDS
NOTES TO FINANCIAL STATEMENTS (Continued)
Estimates — The preparation of financial statements in conformity with GAAP requires management to make estimates and assumptions that affect the reported amounts of assets and liabilities and the disclosure of contingent assets and liabilities as of the date of the financial statements and the reported amounts of income and expenses during the reporting period. Actual results could differ from those estimates.
Federal income tax — Each Fund has qualified and intends to continue to qualify as a regulated investment company under the Internal Revenue Code of 1986, as amended (the “Code”). Qualification generally will relieve the Funds of liability for federal income taxes to the extent 100% of their net investment income and net realized capital gains are distributed in accordance with the Code.
In order to avoid imposition of the excise tax applicable to regulated investment companies, it is also each Fund’s intention to declare as dividends in each calendar year at least 98% of its net investment income (earned during the calendar year) and 98.2% of its net realized capital gains (earned during the twelve months ended October 31) plus undistributed amounts from prior years.
The tax character of accumulated earnings at September 30, 2017 was as follows:
| | | The Jamestown Equity Fund | | | The Jamestown Tax Exempt Virginia Fund | |
| Tax cost of portfolio investments | | $ | 23,701,741 | | | $ | 24,349,876 | |
| Gross unrealized appreciation | | $ | 14,177,590 | | | $ | 646,391 | |
| Gross unrealized depreciation | | | (240,049 | ) | | | (27,939 | ) |
| Net unrealized appreciation | | | 13,937,541 | | | | 618,452 | |
| Accumulated ordinary income | | | 1,656 | | | | — | |
| Accumulated tax exempt income | | | — | | | | 775 | |
| Capital loss carryforwards | | | — | | | | (3,052 | ) |
| Accumulated capital and other gains | | | 1,035,116 | | | | 8,369 | |
| Distributions payable | | | (5,699 | ) | | | (775 | ) |
| Accumulated earnings | | $ | 14,968,614 | | | $ | 623,769 | |
The difference between the federal income tax cost of portfolio investments and the financial statement cost for The Jamestown Equity Fund is due to certain timing differences in the recognition of capital gains or losses under income tax regulations and GAAP. These “book/tax” differences are temporary in nature and are primarily due to the tax deferral of losses on wash sales.
As of March 31, 2017, The Jamestown Tax Exempt Virginia Fund had a long-term capital loss carryforward of $3,052 for federal income tax purposes. This capital loss carryforward, which does not expire, may be utilized in the current and future years to offset net realized capital gains, if any, prior to distributing such gains to shareholders.
23
THE JAMESTOWN FUNDS
NOTES TO FINANCIAL STATEMENTS (Continued)
The Funds recognize the tax benefits or expenses of uncertain tax positions only when the position is “more likely than not” to be sustained assuming examination by tax authorities. Management has reviewed the tax positions taken on Federal income tax returns for the current and all open tax years (tax years ended March 31, 2014 through March 31, 2017) of each Fund and has concluded that no provision for unrecognized tax benefits or expenses is required in these financial statements.
3. Investment Transactions
Investment transactions, other than short-term investments and U.S. government securities, were as follows for the period ended September 30, 2017:
| | | The Jamestown Equity Fund | | | The Jamestown Tax Exempt Virginia Fund | |
| Purchase of investment securities | | $ | 4,155,448 | | | $ | 1,556,414 | |
| Proceeds from sales and maturities of investment securities | | $ | 4,428,965 | | | $ | 983,983 | |
4. Transactions with Related Parties
INVESTMENT ADVISORY AGREEMENTS
Each Fund’s investments are managed by Lowe, Brockenbrough & Company, Inc. (the “Adviser”) under the terms of an Investment Advisory Agreement. The Jamestown Equity Fund pays the Adviser a fee, which is computed and accrued daily and paid monthly, at annual rates of 0.65% of its average daily net assets up to $500 million and 0.55% of such assets in excess of $500 million. The Jamestown Tax Exempt Virginia Fund pays the Adviser a fee, which is computed and accrued daily and paid monthly, at annual rates of 0.40% of its average daily net assets up to $250 million, 0.35% of the next $250 million of such assets and 0.30% of such assets in excess of $500 million. Certain officers of the Trust are also officers of the Adviser.
During the six months ended September 30, 2017, the Adviser voluntarily limited the total annual operating expenses of The Jamestown Equity Fund and The Jamestown Tax Exempt Virginia Fund to 0.95% and 0.69%, respectively, of each Fund’s average daily net assets; accordingly, the Adviser voluntarily waived $9,366 and $35,427 of its investment advisory fees during the six months ended September 30, 2017 for The Jamestown Equity Fund and The Jamestown Tax Exempt Virginia Fund, respectively. These amounts are not subject to recapture in future periods.
OTHER SERVICE PROVIDERS
Ultimus Fund Solutions, LLC (“Ultimus”) provides administration, fund accounting, compliance and transfer agent services to the Funds. The Funds pay Ultimus fees in accordance with the agreements for such services. Certain officers of the Trust are also officers of Ultimus, or of Ultimus Fund Distributors, LLC (the “Distributor”), the principal underwriter of the Funds and an affiliate of Ultimus. The Distributor is compensated by the Adviser (not the Funds) for acting as principal underwriter.
24
THE JAMESTOWN FUNDS
NOTES TO FINANCIAL STATEMENTS (Continued)
COMPENSATION OF TRUSTEES
Trustees and officers affiliated with the Adviser or Ultimus are not compensated by the Trust for their services. Each Trustee who is not an affiliated person of the Adviser or Ultimus receives from the Trust an annual retainer of $15,000, payable quarterly; a fee of $1,500 for attendance at each meeting of the Board of Trustees (except that such fee is $2,500 for the independent chair); and $1,000 for attendance at each meeting of any committee of the Board (except that such fee is $1,500 for the committee chair); plus reimbursement of travel and other expenses incurred in attending meetings. Each series of the Trust pays its proportionate share of such fees.
5. Brokerage Arrangement
In order to reduce the total operating expenses of The Jamestown Equity Fund, a portion of the Fund’s operating expenses have been paid through an arrangement with a third-party broker-dealer who is compensated through commission trades. Payment of expenses by the broker-dealer is based on a percentage of commissions earned. Expenses reimbursed through the brokerage arrangement totaled $6,000 for The Jamestown Equity Fund for the six months ended September 30, 2017.
6. Contingencies and Commitments
The Funds indemnify the Trust’s officers and Trustees for certain liabilities that might arise from the performance of their duties to the Funds. Additionally, in the normal course of business the Funds enter into contracts that contain a variety of representations and warranties and which provide general indemnifications. The Funds’ maximum exposure under these arrangements is unknown, as this would involve future claims that may be made against the Funds that have not yet occurred. However, based on experience, the Trust expects the risk of loss to be remote.
7. Sector Risk
If a Fund has significant investments in the securities of issuers in industries within a particular sector, any development affecting that sector will have a greater impact on the value of the net assets of the Fund than would be the case if the Fund did not have significant investments in that sector. In addition, this may increase the risk of loss of an investment in the Fund and increase the volatility of the Fund’s NAV per share. From time to time, circumstances may affect a particular sector and the companies within such sector. For instance, economic or market factors, regulation or deregulation, or other developments may negatively impact all companies in a particular sector and therefore the value of the Fund’s portfolio would be adversely affected. As of September 30, 2017, The Jamestown Equity Fund had 25.2% of the value of its net assets invested in stocks and exchange-traded funds within the Information Technology sector.
25
THE JAMESTOWN FUNDS
NOTES TO FINANCIAL STATEMENTS (Continued)
8. Concentration of Credit Risk
The Jamestown Tax Exempt Virginia Fund invests primarily in debt instruments of municipal issuers in the Commonwealth of Virginia. The issuers’ abilities to meet their obligations may be affected by economic developments in the Commonwealth or its region, as well as disruptions in the credit markets and the economy, generally.
9. Subsequent Events
The Funds are required to recognize in the financial statements the effects of all subsequent events that provide additional evidence about conditions that existed as of the date of the Statements of Assets and Liabilities. For non-recognized subsequent events that must be disclosed to keep the financial statements from being misleading, the Funds are required to disclose the nature of the event as well as an estimate of its financial effect, or a statement that such an estimate cannot be made. Management has evaluated subsequent events through the issuance of these financial statements and has noted no such events.
26
THE JAMESTOWN FUNDS
ABOUT YOUR FUNDS’ EXPENSES (Unaudited)
We believe it is important for you to understand the impact of costs on your investment. All mutual funds have operating expenses. As a shareholder of the Funds, you incur ongoing costs, including management fees and other expenses. The following examples are intended to help you understand your ongoing costs (in dollars) of investing in the Funds and to compare these costs with the ongoing costs of investing in other mutual funds.
A mutual fund’s ongoing costs are expressed as a percentage of its average net assets. This figure is known as the expense ratio. The expenses in the table below are based on an investment of $1,000 made at the beginning of the period shown and held for the entire period (April 1, 2017 through September 30, 2017).
The table below illustrates each Fund’s costs in two ways:
Actual fund return – This section helps you to estimate the actual expenses that you paid over the period. The “Ending Account Value” shown is derived from each Fund’s actual return, and the fourth column shows the dollar amount of operating expenses that would have been paid by an investor who started with $1,000 in the Funds. You may use the information here, together with the amount you invested, to estimate the expenses that you paid over the period.
To do so, simply divide your account value by $1,000 (for example, an $8,600 account value divided by $1,000 = 8.6), then multiply the result by the number given for the Funds under the heading “Expenses Paid During Period.”
Hypothetical 5% return – This section is intended to help you compare each Fund’s ongoing costs with those of other mutual funds. It assumes that each Fund had an annual return of 5% before expenses during the period shown, but that the expense ratio is unchanged. In this case, because the returns used are not the Funds’ actual returns, the results do not apply to your investment. The example is useful in making comparisons because the SEC requires all mutual funds to calculate expenses based on a 5% return. You can assess each Fund’s ongoing costs by comparing this hypothetical example with the hypothetical examples that appear in shareholder reports of other funds.
Note that expenses shown in the table are meant to highlight and help you compare ongoing costs only. The Funds do not charge sales loads or redemption fees.
The calculations assume no shares were bought or sold during the period. Your actual costs may have been higher or lower, depending on the amount of your investment and the timing of any purchases or redemptions.
More information about the Funds’ expenses, including annual expense ratios for the prior five fiscal years, can be found in this report. For additional information on operating expenses and other shareholder costs, please refer to the Funds’ prospectus.
27
THE JAMESTOWN FUNDS
ABOUT YOUR FUNDS’ EXPENSES (Unaudited) (Continued)
| | Beginning
Account Value
April 1, 2017 | Ending
Account Value
September 30, 2017 | Net
Expense Ratio(a) | Expenses Paid During Period(b) |
| The Jamestown Equity Fund |
| Based on Actual Fund Return | $1,000.00 | $1,059.60 | 0.95% | $4.90 |
| Based on Hypothetical 5% Return (before expenses) | $1,000.00 | $1,020.31 | 0.95% | $4.81 |
| The Jamestown Tax Exempt Virginia Fund |
| Based on Actual Fund Return | $1,000.00 | $1,014.70 | 0.69% | $3.48 |
| Based on Hypothetical 5% Return (before expenses) | $1,000.00 | $1,021.61 | 0.69% | $3.50 |
(a) | Annualized, based on the Fund's most recent one-half year expenses. |
| | |
(b) | Expenses are equal to each Fund’s annualized net expense ratio multiplied by the average account value over the period, multiplied by 183/365 (to reflect the one-half year period). |
28
THE JAMESTOWN FUNDS
OTHER INFORMATION (Unaudited)
A description of the policies and procedures that the Funds use to vote proxies relating to portfolio securities is available without charge upon request by calling toll-free 1-866-738-1126, or on the SEC’s website at http://www.sec.gov. Information regarding how the Funds voted proxies relating to portfolio securities during the most recent 12-month period ended June 30 is also available without charge upon request by calling toll-free 1-866-738-1126, or on the SEC’s website at http://www.sec.gov.
The Trust files a complete listing of portfolio holdings of the Funds with the SEC as of the end of the first and third quarters of each fiscal year on Form N-Q. The filings are available upon request, by calling 1-866-738-1126. Furthermore, you may obtain a copy of these filings on the SEC’s website at http://www.sec.gov. The Trust’s Forms N-Q may also be reviewed and copied at the SEC’s Public Reference Room in Washington, DC, and information on the operation of the Public Reference Room may be obtained by calling 1-800-SEC-0330.
29
| THE JAMESTOWN FUNDS www.jamestownfunds.com Investment Adviser Lowe, Brockenbrough & Company, Inc. 1802 Bayberry Court Suite 400 Richmond, Virginia 23226 Administrator Ultimus Fund Solutions, LLC P.O. Box 46707 Cincinnati, Ohio 45246-0707 (Toll-Free) 1-866-738-1126 Independent Registered
Public Accounting Firm Cohen & Company, Ltd. 1350 Euclid Avenue Suite 800 Cleveland, Ohio 44115 Legal Counsel Sullivan & Worcester LLP 1666 K Street, N.W. Washington, DC 20006 Board of Trustees John P. Ackerly, IV John T. Bruce George K. Jennison Robert S. Harris, Ph.D. Harris V. Morrissette Elizabeth W. Robertson | |
Not required
| Item 3. | Audit Committee Financial Expert. |
Not required
| Item 4. | Principal Accountant Fees and Services. |
Not required
| Item 5. | Audit Committee of Listed Registrants. |
Not applicable
| Item 6. | Schedule of Investments. |
| (a) | Not applicable [schedule filed with Item 1] |
| Item 7. | Disclosure of Proxy Voting Policies and Procedures for Closed-End Management Investment Companies. |
Not applicable
| Item 8. | Portfolio Managers of Closed-End Management Investment Companies. |
Not applicable
| Item 9. | Purchases of Equity Securities by Closed-End Management Investment Company and Affiliated Purchasers. |
Not applicable
| Item 10. | Submission of Matters to a Vote of Security Holders. |
The registrant’s Nominating Committee shall review shareholder recommendations to fill vacancies on the registrant’s board of trustees if such recommendations are submitted in writing, addressed to the Committee at the registrant’s offices and meet any minimum qualifications adopted by the Committee. The Committee may adopt, by resolution, a policy regarding its procedures for considering candidates for the board of trustees, including any recommended by shareholders.
| Item 11. | Controls and Procedures. |
(a) Based on their evaluation of the registrant’s disclosure controls and procedures (as defined in Rule 30a-3(c) under the Investment Company Act of 1940) as of a date within 90 days of the filing date of this report, the registrant’s principal executive officers and principal financial officer have concluded that such disclosure controls and procedures are reasonably designed and are operating effectively to ensure that material information relating to the registrant, including its consolidated subsidiaries, is made known to them by others within those entities, particularly during the period in which this report is being prepared, and that the information required in filings on Form N-CSR is recorded, processed, summarized, and reported on a timely basis.
(b) There were no changes in the registrant’s internal control over financial reporting (as defined in Rule 30a-3(d) under the Investment Company Act of 1940) that occurred during the second fiscal quarter of the period covered by this report that have materially affected, or are reasonably likely to materially affect, the registrant’s internal control over financial reporting.
| Item 12. | Disclosure of Securities Lending Activities for Closed-End Management Investment Companies. |
Not applicable
File the exhibits listed below as part of this Form. Letter or number the exhibits in the sequence indicated.
(a)(1) Any code of ethics, or amendment thereto, that is the subject of the disclosure required by Item 2, to the extent that the registrant intends to satisfy the Item 2 requirements through filing of an exhibit: Not required
(a)(2) A separate certification for each principal executive officer and principal financial officer of the registrant as required by Rule 30a-2(a) under the Act (17 CFR 270.30a-2(a)): Attached hereto
(a)(3) Any written solicitation to purchase securities under Rule 23c-1 under the Act (17 CFR 270.23c-1) sent or given during the period covered by the report by or on behalf of the registrant to 10 or more persons: Not applicable
(a)(4) Change in the registrant’s independent public accountants: Not applicable
(b) Certifications required by Rule 30a-2(b) under the Act (17 CFR 270.30a-2(b)): Attached hereto
| Exhibit 99.CERT | Certifications required by Rule 30a-2(a) under the Act |
| | |
| Exhibit 99.906CERT | Certifications required by Rule 30a-2(b) under the Act |
SIGNATURES
Pursuant to the requirements of the Securities Exchange Act of 1934 and the Investment Company Act of 1940, the registrant has duly caused this report to be signed on its behalf by the undersigned, thereunto duly authorized.
| (Registrant) | Williamsburg Investment Trust | | |
| | | | |
| By (Signature and Title)* | /s/ Bo J. Howell | |
| | | Bo J. Howell, Secretary | |
| | | | |
| Date | December 8, 2017 | | |
| | | | |
| Pursuant to the requirements of the Securities Exchange Act of 1934 and the Investment Company Act of 1940, this report has been signed below by the following persons on behalf of the registrant and in the capacities and on the dates indicated. |
| | | | |
| By (Signature and Title)* | /s/ John T. Bruce | |
| | | John T. Bruce, President | |
| | | (FBP Equity & Dividend Plus Fund and FBP Appreciation & Income Opportunities Fund) | |
| | | | |
| Date | December 8, 2017 | | |
| | | | |
| By (Signature and Title)* | /s/ Thomas W. Leavell | |
| | | Thomas W. Leavell, President | |
| | | (The Government Street Equity Fund, The Government Street Mid-Cap Fund and The Alabama Tax Free Bond Fund) | |
| | | | |
| Date | December 8, 2017 | | |
| | | | |
| By (Signature and Title)* | /s/ Charles M. Caravati III | |
| | | Charles M. Caravati III, President | |
| | | (The Jamestown Equity Fund) | |
| | | | |
| Date | December 8, 2017 | | |
| | | | |
| By (Signature and Title)* | /s/ Joseph A. Jennings III | |
| | | Joseph A. Jennings III, President | |
| | | (The Jamestown Tax Exempt Virginia Fund) | |
| | | | |
| Date | December 8, 2017 | | |
| | | | |
| By (Signature and Title)* | /s/ John P. Ackerly IV | |
| | | John P. Ackerly IV, President | |
| | | (The Davenport Core Fund, Davenport Value & Income Fund, Davenport Equity Opportunities Fund, Davenport Small Cap Focus Fund and the Davenport Balanced Income Fund) | |
| | | | |
| Date | December 8, 2017 | | |
| | | | |
| By (Signature and Title)* | /s/ Mark J. Seger | |
| | | Mark J. Seger, Treasurer and Principal Financial Officer | |
| | | | |
| Date | December 8, 2017 | | |
| * | Print the name and title of each signing officer under his or her signature. |