| OMB APPROVAL |
OMB Number: 3235-0570 Expires: January 31, 2017 Estimated average burden hours per response: 20.6 |
UNITED STATES
SECURITIES AND EXCHANGE COMMISSION
Washington, D.C. 20549
FORM N-CSR
CERTIFIED SHAREHOLDER REPORT OF REGISTERED
MANAGEMENT INVESTMENT COMPANIES
| Investment Company Act file number | 811-05685 | |
| Williamsburg Investment Trust |
| (Exact name of registrant as specified in charter) |
| 225 Pictoria Drive, Suite 450 Cincinnati, Ohio | 45246 |
| (Address of principal executive offices) | (Zip code) |
W. Lee H. Dunham, Esq.
| Sullivan & Worcester LLP One Post Office Square Boston, Massachusetts 02109 |
| (Name and address of agent for service) |
| Registrant's telephone number, including area code: | (513) 587-3400 | |
| Date of fiscal year end: | March 31 | |
| | | |
| Date of reporting period: | September 30, 2015 | |
Form N-CSR is to be used by management investment companies to file reports with the Commission not later than 10 days after the transmission to stockholders of any report that is required to be transmitted to stockholders under Rule 30e-1 under the Investment Company Act of 1940 (17 CFR 270.30e-1). The Commission may use the information provided on Form N-CSR in its regulatory, disclosure review, inspection, and policymaking roles.
A registrant is required to disclose the information specified by Form N-CSR, and the Commission will make this information public. A registrant is not required to respond to the collection of information contained in Form N-CSR unless the Form displays a currently valid Office of Management and Budget ("OMB") control number. Please direct comments concerning the accuracy of the information collection burden estimate and any suggestions for reducing the burden to the Secretary, Securities and Exchange Commission, 450 Fifth Street, NW, Washington, DC 20549-0609. The OMB has reviewed this collection of information under the clearance requirements of 44 U.S.C. § 3507.
| Item 1. | Reports to Stockholders. |

SEMI-ANNUAL REPORT September 30, 2015
(Unaudited) |
THE DAVENPORT FUNDS
LETTER TO SHAREHOLDERS | November 3, 2015 |
Dear Shareholders,
Equity markets experienced a significant selloff during the third quarter. The S&P 500 Index (“S&P 500”) declined 6.44% while the Russell 2000 Index (“Russell”) was down 11.92%. Year-to-date, domestic equity markets ended the period firmly in negative territory with the S&P 500 and Russell down 5.29% and 7.73%, respectively. The S&P 500 was over 10% off its recent high. While one down quarter doesn’t necessarily come as a surprise, recent volatility has been unsettling nonetheless. Many stocks are down much more than the indices would lead one to believe, with shares of more cyclical companies exhibiting pronounced weakness.
So why the sharp pullback? For one, we think there may have been some buyer exhaustion after a period of extended gains. We had not seen a 10% correction in nearly four years and have witnessed extraordinary gains off the 2009 lows. The primary trigger, however, has been signs of global economic strain. Many economies outside the U.S. appear to be slowing and signaling a threat of deflation. This is best evidenced by plummeting commodity prices. China has been at the epicenter of this story with decelerating GDP growth and a recent stock market implosion. Unfortunately, these signs of “global cooling” have emerged just as our Federal Reserve (the “Fed”) is attempting to raise interest rates for the first time in a decade, thereby creating concern that “tighter” monetary policy could be ill-timed.
We also think the domestic economy may need time to catch up to the stock market. From 2012-2014, U.S. GDP growth averaged roughly 2% and earnings growth for the S&P 500 averaged approximately 5.5%. Meanwhile, the total return for the S&P 500 averaged nearly 21%. Such returns were clearly driven more by an upward “re-rating” (i.e. valuation expansion) than profit improvement; hence, it makes sense for the market to bide time while we wait for more meaningful economic and earnings growth. It doesn’t appear as though growth this year will provide the fuel, with GDP expected to grow 2.5% in 2015 and S&P 500 earnings actually expected to decline slightly.
So what will the Fed do? This is still a subject of intense debate after the Fed decided to once again delay raising rates at its mid-September meeting. On one hand, the domestic economy is no longer in crisis mode; hence, zero percent interest rate policy seems unwarranted. On the other hand, interest rate hikes normally occur alongside accelerating economic growth and inflation. Nominal GDP is expanding at roughly half the pace it was when the 2004-2006 rate increase cycle commenced. Not to mention corporate profits are barely growing, commodity prices have collapsed and the rest of the world looks to be slowing. While a 25 basis point (0.25%) hike appears imminent, we expect the Fed will refrain from going too far too fast, and we look for accommodative monetary policy to persist. Of note, we also point out that markets have historically traded higher a year after the first rate hike.
In addition to Fed policy remaining supportive, there are some other positives to consider. For one, the U.S. consumer appears healthy. The job market continues to improve, home prices have recovered to a large extent, fuel prices are cheaper and consumer debt levels are down markedly from pre-crisis levels. These factors should allow for improving consumer demand for goods and services. Two, stock valuations are not unreasonable. At 15.2x earnings estimates for next year,
1
the S&P 500 is more richly valued than a couple years ago, but not far above historical averages despite ultra-low interest rates. Lastly, we note that investor sentiment doesn’t appear overly positive. Famed investor Sir John Templeton once said: “Bull markets are born on pessimism, grow on skepticism, mature on optimism and die on euphoria.” We are having a hard time finding investors who feel euphoric at the moment, which leads us to believe we may continue to “climb a wall of worry.”
All told, we think it’s sensible for the market to take a timeout as prior years’ returns seem to have borrowed from the future a bit. We don’t know what the near term will bring, but are sticking to our view that returns in coming years will be more moderate. That said, we don’t perceive there to be a stock market “bubble” given prevailing valuations and sentiment and are finding some attractively valued companies in the wake of recent weakness.
Please read on for a discussion of fund themes and ideas. We thank you for your trust and look forward to reporting back to you.
Davenport Core Fund
The following chart represents Davenport Core Fund (the “Core Fund”) performance and the performance of the S&P 500 Index*, the Core Fund’s primary benchmark, for the periods ended September 30, 2015.
| Q3 2015 | 1 Year | 3 Years** | 5 Years** | 10 Years** | Since Inception** 1/15/98 | Fiscal Year 2015 Expense Ratio |
Core Fund | -6.20% | 2.06% | 12.38% | 12.84% | 7.17% | 5.99% | 0.93% |
S&P 500 Index* | -6.44% | -0.61% | 12.40% | 13.34% | 6.80% | 6.00% | — |
30-Day SEC Yield: 0.63%
Past performance is no guarantee of future results. Investment return and principal value of an investment will fluctuate so that an investor’s shares, when redeemed, may be worth more or less than their original cost. Current performance may be lower or higher than the performance data quoted. Performance data, current to the most recent month end, may be obtained by calling 1-800-281-3217.
* | The S&P 500 Index is comprised of 500 U.S. stocks and is an indicator of the performance of the overall U.S. stock market. An investor cannot invest in an index and its returns are not indicative of the performance of any specific investment. |
The Core Fund fell by 6.20% in the third quarter, holding up a little better than the S&P 500 Index’s 6.44% decline. The quarter’s weakness has dragged year-to-date returns into negative territory, with the fund down 4.14%, outpacing the 5.29% decline in the S&P 500. While certainly a challenging quarter for investors of all stripes, we are pleased with the fund’s relative resilience.
As mentioned above, the market has increasingly narrowed, further favoring growth stocks that have already been “working.” Our ownership of growth names such as Google (GOOG), Priceline (PCLN), Amazon (AMZN), Starbucks (SBUX) and Visa (V) all fall into this camp and benefitted performance during the quarter. During the quarter, Baxter International (BAX) spun off its biopharmaceutical business Baxalta (BXLT). We elected to sell our legacy BAX position
2
and use the proceeds to add to Baxalta (BXLT) given its modest valuation and higher growth profile, with a promising pipeline of new products in targeting hemophilia and oncology. Shortly thereafter, the stock made a 10%+ one day move after Shire PLC announced a takeover offer. We elected to sell BXLT as this announcement brought forward gains, and we saw downside risk if the transaction was unable to close, as has been the case with other announced transactions in the health care sector recently. Importantly, while we were able to participate in the upside for high quality growth names, we sidestepped some of the carnage in more aggressive momentum names in the healthcare/biotechnology and information technology sectors. We didn’t entirely escape the selloff, however, with key detractors Capital One (COF) and Brookfield Asset Management (BAM) in the financials sector and Range Resources (RRC) and Schlumberger (SLB) in the energy sector, with the former negatively impacted by the Fed’s choice to wait on a rate hike and the latter continuing to suffer alongside commodity prices.
We took advantage of volatility in the quarter to further strengthen the quality and risk-adjusted return profile of the Core Fund. In some cases, this meant bottom fishing in depressed sectors, and in other cases, this meant adding to strong companies with reasonable valuations. The ability for a company to weather more difficult times and participate in economic upside, should it occur, was a common thread among investments that we initiated or added to. We moved away from companies attempting to execute a turnaround in what is proving to be an increasingly difficult economic environment. This approach can be illustrated through our transactions in cyclical stocks during the quarter: we sold United Technologies (UTX), a company undergoing management changes and upheaval in business lines, and added to Union Pacific Corporation (UNP), Schlumberger (SLB) and ExxonMobil (XOM), all companies that earn some of the highest returns on capital in their sector, that are well positioned to strengthen their economic moats during this down cycle and ultimately emerge stronger on the other side, while generating free cash flow for investors in the meantime.
During the quarter, we also chose to add to high quality names that aren’t as far off from their highs as the aforementioned stocks. Danaher (DHR) and Visa (V) are two examples. Danaher’s capital allocation track record is unmatched in the industrial sector, and we added to the position ahead of its split into two companies by the end of 2016. We think both pieces will be attractive investments, as the life sciences & technology piece benefits from a high organic growth rate and the industrial business should be able to continue its rollup strategy with more needle-moving transactions, given the smaller capital base. Turning to Visa, we continue to view its business model as one of the best in the world. Combine this with double-digit growth rates in payment volumes and we think the stock’s premium multiple is justified.
Ultimately, we like the Core Fund’s positioning at present. The Fund has a strong roster of companies, many of which are capable of generating organic growth even in a difficult macroeconomic environment. The remainder of the Fund is balanced with businesses that have seen their share prices cut along with growth prospects, and could offer a meaningful snap back should economic growth pick up. We think this combination continues to set up an attractive risk/reward profile for the Fund in the currently volatile investment landscape.
The following are transactions performed in the Core Fund for the quarter ended September 30, 2015.
3
Recent Purchases
Baxalta, Inc. (BXLT) After Baxter International (BAX) elected to split into two companies, we elected to sell our legacy BAX position and use the proceeds to add to Baxalta (BXLT) given its modest valuation and higher growth profile, with a promising pipeline of new products in targeting hemophilia and oncology.
Danaher Corporation (DHR) With a capital allocation track record unmatched in the industrial sector, we added to the position ahead of its split into two companies anticipated by the end of 2016.
Exxon Mobil Corporation (XOM) Following broad based energy sector weakness, we elected to add to XOM due to the defensive qualities of the business, strong balance sheet and solid dividend yield.
Johnson & Johnson (JNJ) Based on balance sheet, yield and below market multiple, we elected to add to JNJ as the share price weakened alongside the broader market.
Liberty Broadband Corporation (LBRDK) We added to our position feeling the company is well positioned to participate in the consolidation of the cable industry through its 26% stake in Charter Communications.
Merck & Company, Inc. (MRK) Following a strong Q2 which reaffirmed our outlook for this company, we added to the position on weakness as the product pipeline and business prospects continue to look favorable.
Schlumberger Ltd. (SLB) We added to SLB on general market weakness, as this company appears to be navigating the current down-cycle in energy and looks poised to emerge stronger on the other side.
The Priceline Group, Inc. (PCLN) With Euro zone and Chinese market concerns weighing on the stock, we added to this dominant franchise which continues to provide a great long term growth opportunity.
Union Pacific Corporation (UNP) With the transport sector under considerable pressure, we purchased UNP due to its significant competitive advantages and compelling long term outlook.
Visa, Inc. (V) We added to V as it trades at a very reasonable multiple while operating one of the best business models in the world. Payment volumes continue to grow at double digit rates.
Recent Sales
Alcoa, Inc. (AA) With significant exposure to a weakening commodity sector alongside our view that a rebound in aluminum prices may already be ‘in’ the stock, we elected to move out of AA at this time.
Baxalta, Inc. (BXLT) We elected to sell the stock after a 10%+ one day move after Shire PLC announced a takeover offer. This announcement brought forward gains, and we saw downside risk if the transaction was unable to close, as has been the case with other announced transactions in the healthcare sector recently.
Baxter International, Inc. (BAX) We sold Baxter after it spun off its crown jewel Baxalta (BXLT). The remaining Baxter is a lower-growth biosciences and medical products company, with less upside potential, in our view.
4
General Motors Company (GM) Given recent weakness in the stock and our concerns the domestic auto cycle may be peaking, we sold the position and deployed funds into opportunities with a better risk return profile.
QUALCOMM, Inc. (QCOM) Facing customer losses and royalty rate headwinds, we chose to sell this relatively small position in the portfolio in favor of situations showing a better long term outlook.
United Technologies Corporation (UTX) Faced with internal management issues and a challenging industrial backdrop, we elected to sell and move proceeds to higher conviction ideas.
Davenport Value & Income Fund
The following chart represents Davenport Value & Income Fund (the “Value & Income Fund”) performance and the performance of the S&P 500 Index, the Value & Income Fund’s primary benchmark, and the Lipper Equity Income Index for the periods ended September 30, 2015.
| Q3 2015 | 1 Year | 3 Years** | Since Inception** 12/31/2010 | Fiscal
Year 2015 Expense Ratio |
Value & Income Fund | -7.97% | -0.45% | 11.09% | 11.90% | 0.95% |
S&P 500 Index* | -6.44% | -0.61% | 12.40% | 11.67% | — |
Lipper Equity Income Index* | -7.25% | -4.24% | 9.74% | 9.41% | — |
30-Day SEC Yield: 2.73%
Past performance is no guarantee of future results. Investment return and principal value of an investment will fluctuate so that an investor’s shares, when redeemed, may be worth more or less than their original cost. Current performance may be lower or higher than the performance data quoted. Performance data, current to the most recent month end, may be obtained by calling 1-800-281-3217.
* | The S&P 500 Index is comprised of 500 U.S. stocks and is an indicator of the performance of the overall U.S. stock market. The Lipper Equity Income Index is an unmanaged index of the 30 largest funds in the Lipper Equity Income fund category. An investor cannot invest in an index and its returns are not indicative of the performance of any specific investment. |
The Value & Income Fund declined 7.97% during the third quarter, lagging the 6.44% decline for the S&P 500 and the 7.25% decline for the Lipper Equity Income Index. Year-to-date as of September 30, 2015, the Value & Income Fund is down 6.54%, relative to the declines of the 5.29% for the S&P 500 and the 7.83% for the Lipper Equity Income Index. After struggling to start the year, income oriented equities dug in somewhat as global growth concerns pushed out investor expectations regarding the timing of an eventual interest rate hike from the Federal Reserve. What did not change, however, was the continued outperformance of growth stocks versus value stocks, which have struggled mightily since the beginning of the year.
Manufactured housing REITS, Sun Communities (SUI) and Equity Lifestyle Holdings (ELS), were two of the Value & Income Fund’s top performers during the quarter. In addition to benefitting from a shift in interest rate expectations mentioned above, these two companies stand out versus the rest of the REIT sector due to recent momentum in operating results, which reflect
5
their above average growth potential, pricing power and favorable demographic tailwinds. Other key contributors included Altria (MO) and Dominion (D), each of which has a strong history of dividend increases and predictable cash flows. The Fund’s biggest detractor during the quarter was Las Vegas Sands (LVS), which weakened alongside heightened investor angst surrounding declining Macau revenue. The financials sector was also a source of weakness as bank holdings such as JPMorgan (JPM) and Capital One Financial (COF), both of which should be beneficiaries of higher interest rates, reacted to yet another delay in the “lift-off” decision from the Fed. Though near term action has been disappointing, we continue to believe the banking sector looks attractive given solid balance sheets, improving profitability and cheap valuations.
The Value & Income Fund’s underweight stance in the energy sector has been a significant contributor to relative performance since the price of crude oil began its slide in mid-2014. Following a slight rebound in Q2, crude prices fell to new lows during the third quarter and many stocks in the sector followed suit. Though the industry continues to face clear challenges on both the supply and demand sides of the equation, we believe weakness in the sector has created some attractive opportunities. While we remain underweight, we have begun to add exposure to the energy space. On one hand, we added to defensive holdings such as Occidental Petroleum (OXY) and Exxon Mobil (XOM), which can use their strong balance sheets to maintain their dividends (yields of 4.5% and 3.9%, respectively) and make opportunistic acquisitions if weakness persists. On the other hand, we initiated a position in independent power producer NRG Energy (NRG). Though admittedly more of an aggressive play given the company’s leverage, we note free cash flow at NRG should ramp dramatically in coming years as capital expenditures fall off, enabling debt repayment, increases to the dividend (yields 3.9%) and share repurchases. Finally, we note the company could see significant upside in the event natural gas prices increase given the fact that power prices are tied to natural gas. Ultimately, we felt the risk/reward profile was compelling.
We elected to add to our position in Lamar Advertising (LAMR) during the quarter. LAMR has been a solid performer since our initial purchase, however, the company had recently come under pressure after Q2 results showed a slowdown in organic revenue trends. Of particular concern for investors was a decline in “same board” revenue trends on digital boards, which appear to be in a digestion phase after significant new builds in prior years. While new supply of digital boards may take a little time to absorb, we do not feel this is the beginning of a trend and note that the company remains on track to deliver the 10% Funds from Operations (growth it originally forecasted at the beginning of the year. Furthermore, pricing has picked up across the industry and key verticals such as real estate are improving. We point out that billboards generate fairly stable growth and prodigious amounts of free cash flow given modest capital requirements. They are also much less vulnerable to secular trends (i.e. “cord-cutting”) that currently haunt the cable and TV advertising industries. Ultimately, we felt recent weakness provided an attractive opportunity to gain exposure to a steady business with a growing dividend (yields 5.3%) and attractive reinvestment opportunities.
In summary, Q3 returns were a bit disappointing, but we are still comfortable with where we stand on a year- to-date basis. Moreover, we feel that recent actions taken amid significant volatility have improved the risk/reward profile of the entire Value & Income Fund. Though we have begun to lean against the wind in the depressed energy sector following significant declines, our primary focus remains on quality businesses with attractive payouts that can grow. Given this mix, we feel confident in the Value & Income Fund’s ability to deliver an element of defensiveness and income (yield is 3.5%), while also participating in potential market upside.
6
The following are transactions performed in the Value & Income Fund for the quarter ended September 30, 2015.
Recent Purchases
Exxon Mobil Corporation (XOM) We added to the name on weakness as the defensive qualities of the business, strong balance sheet and solid dividend yield should prove to be supportive in the time ahead.
Kinder Morgan, Inc. (KMI) The stock sold off alongside the broader energy sector, and we chose to add to the name given its critical infrastructure assets backed by long term contracts with producers and consumers.
Lamar Advertising Company (LAMR) With a growing dividend yield and attractive reinvestment opportunities, we added to LAMR, which looks to be entering a digestion phase following its digital board build out.
Las Vegas Sands Corporation (LVS) We added to our position following the stock’s resiliency to worse than expected numbers out of Macau and our belief that gaming numbers appear to be bottoming.
NRG Energy, Inc. (NRG) With natural gas and wholesale power prices on the decline, we felt this was an opportune time to buy shares of the nation’s largest competitive power generation company.
Occidental Petroleum Corporation (OXY) Given the share repurchase program, high quality balance sheet and solid dividend yield, we elected to add to this name which has traded in tandem with the Exploration & Production sector.
Regions Financial Corporation (RF) Improving profitability, a shareholder focus and large portfolio of variable rate loans led us to purchase this company, which is well positioned for an eventual rate hike.
Recent Sales
Chemours Company (CC) A recent spin out of DuPont, we elected to sell Chemours Co given its limited liquidity, business prospects and small position size in the portfolio.
Deutsche X-trackers Harvest CSI 300 China A-Shares ETF (ASHR) Following a period of solid performance, we sold our position due to increasing volatility in the shares and belief that the valuation tailwind is largely behind us.
iShares China Large- Cap ETF (FXI) A strong performer since inception, recent deteriorating economic visibility and increased government intervention led us to sell the position and move to the sidelines.
Markel Corporation (MKL) With the stock up nearly 30% YTD and trading near all time highs, we elected to chip and reallocate proceeds to more timely situations from a risk/reward perspective.
Waddell & Reed Financial, Inc. (WDR) We sold the stock as fund outflows have remained a significant factor in the wake of manager turnover and underperformance of its flagship Asset Strategy Fund.
7
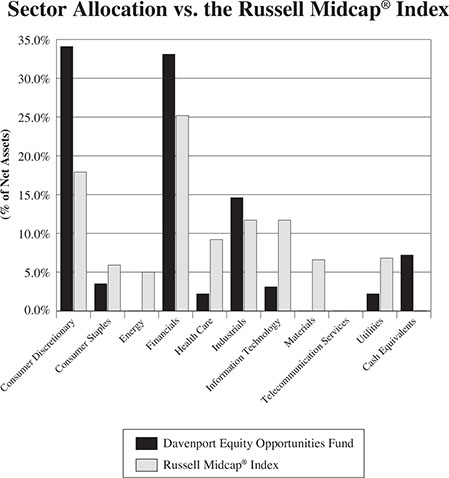
Davenport Equity Opportunities Fund
The following chart represents Davenport Equity Opportunities Fund (the “Equity Opportunities Fund”) performance and the performance of the Russell Midcap Index, the Fund’s primary benchmark, and the S&P 500 Index for the periods ended September 30, 2015.
| Q3 2015 | 1 Year | 3 Years** | Since Inception** 12/31/2010 | Fiscal
Year 2015 Expense Ratio |
Equity Opportunities Fund | -12.47% | 2.43% | 13.75% | 12.98% | 1.02% |
Russell Midcap Index* | -8.01% | -0.25% | 13.91% | 11.25% | — |
S&P 500 Index* | -6.44% | -0.61% | 12.40% | 11.67% | — |
30-Day SEC Yield: 0.32%
Past performance is no guarantee of future results. Investment return and principal value of an investment will fluctuate so that an investor’s shares, when redeemed, may be worth more or less than their original cost. Current performance may be lower or higher than the performance data quoted. Performance data, current to the most recent month end, may be obtained by calling 1-800-281-3217.
* | The Russell Midcap Index measures the performance of the 800 smallest companies in the Russell 1000, which represent approximately 25% of the total market capitalization of the Russell 1000. The S&P 500 Index is comprised of 500 U.S. stocks and is an indicator of the performance of the overall U.S. stock market. An investor cannot invest in an index and its returns are not indicative of the performance of any specific investment. |
The Equity Opportunities Fund experienced a challenging third quarter. The Fund declined 12.47% as compared to losses of 8.01% and 6.44%, respectively, for the Russell Midcap Index (“Russell Midcap”) and S&P 500. Year-to-date, the Fund ended the period down 6.81% versus declines of 5.84% and 5.29% for the Russell Midcap and S&P 500. A period of relative underperformance wasn’t totally surprising after three consecutive quarters of relative gains, but was still frustrating. Unfortunately, a handful of positions conspired against us with above-average declines. Over time, we have demonstrated better returns during tougher market environments. While this wasn’t the case recently, we don’t put too much emphasis on one quarter’s results.
Colfax (CFX) and Discovery Communications (DISCK) were our biggest drags during the quarter. Shares of both companies have appeared bottomless with relentless declines. In the case of Colfax, which traded in the low $70s just over a year ago and is now roughly $30/share, the company is plagued by exposure to both emerging markets and customers in the downtrodden energy sector. Its welding business also appears to be losing share as management implements an operational turnaround. Admittedly, we feel a bit silly for building this position too early in the face of stiff headwinds and a deteriorating earnings outlook. However, at current prices the stock’s risk/reward profile seems very attractive and upside could be significant if earnings just stabilize.
In terms of Discovery, which is currently our largest position, the shares continue to be haunted by fears of “cord-cutting.” Put simply, “cord-cutting” is the concept of people abandoning traditional cable/TV in favor of alternatives like Netflix, Hulu and Amazon Prime. Talk of the looming demise of leading cable networks seems greatly exaggerated and the anti-media trade is overwhelmingly popular right now. At its recent investor day, management reiterated its domestic media business
8
would continue to grow even in tougher times due to rising affiliate fees (payments from cable and satellite TV operators) and a rising share of total advertising dollars. Furthermore, the company projects high-single digit revenue growth from its international business, which is now roughly 50% of revenue. All told, management expects to generate double-digit free cash flow growth over the next few years and to produce $10 billion of excess capital that could be used for acquisitions, content investment or share buybacks. We are particularly excited about Discovery’s investment in foreign sports content and opportunity to create the “ESPN of Europe”. Given the company’s growth profile and investment opportunities, we have a hard time understanding the stock’s depressed valuation.
We added to both of these positions in the face of extremely negative sentiment. As we’ve noted in the past, part of our modus operandi is to buy good businesses at attractive prices. This oftentimes means buying shares of companies facing well-documented headwinds. We aren’t “value” investors per se, but are drawn to stocks that are depressed and therefore appear to offer above-average long-term returns. This approach has been unrewarding of late as investors have fled anything with headwinds and crowded into the few stocks that are working. Unfortunately, anything that has looked “cheap” has only become cheaper in following weeks/months as Wall Street has become increasingly myopic. We think investors are currently taking excess risk by paying too much of a premium for momentum stories. In the meantime, we continue to build positions in durable companies that have fallen out of favor.
Continuing that theme, we’ve also established a new position in Genesee & Wyoming (GWR), which is a short line railroad operator. Shares of GWR have retreated from a high of $105 to a recent price in the low $60s as investors fret about the company’s exposure to commodity markets. Indeed, part of its business is transporting commodities like coal and iron ore that have seen softening demand. While we generally aren’t attracted to commodity companies given unpredictable results and sometimes inferior returns on capital, this is a high quality business model that has been deemed guilty by association. Even with volumes depressed, the company could earn roughly $4.00/share, and incremental earnings on improved volumes could be substantial. We also note GWR has better free cash flow dynamics than Class I rail operators given lower capital requirements and has a sizeable acquisition opportunity due to an abundance of independently owned short line railroads. Given these factors and its wide competitive moat (the threat of new railroads is minimal), GWR has traditionally commanded a premium multiple. After its recent swoon, the stock appears to offer a compelling value.
In closing, we would have liked to have held up better during the third quarter. Over time, we hope to generate above-average returns and dampen risk by focusing on timely purchases and companies that can manage through challenging economic cycles. While Q3 performance was disappointing, many of our top holdings seem to now offer very attractive risk/reward profiles and we are excited to be adding to these names. Hence, we think the Fund’s overall timeliness and risk/reward profile is the best it’s been in recent memory.
9
The following are transactions performed in the Equity Opportunities Fund for the quarter ended September 30, 2015.
Recent Purchases
Capital One Financial Corporation (COF) Given a number of one-time items which led Q2 results below expectations, we took the ‘longer view’ and added to our position at what we consider attractive levels.
Colfax Corporation (CFX) We added to our position in this well managed entity as shares have come under significant pressure alongside currency headwinds and weakness in key end-markets such as oil and gas.
Discovery Communications, Inc. (DISCK) We elected to add to shares in this name, which had weakened substantially alongside a broader shift in investor sentiment within the space.
Dollar Tree, Inc. (DLTR) A lack of near term guidance surrounding the recent Family Dollar acquisition led to weakness in the shares (an over-reaction in our view), which we used to add to the position.
Genesee & Wyoming, Inc. (GWR) Shares in the nation’s largest short line railroad operator are well off their highs as demand and volumes are down for bulk commodities, presenting an attractive entry point.
Hanesbrands, Inc. (HBI) Recent one-time events put downward pressure on the stock, providing an opportunity to increase our position in this well managed, shareholder friendly company.
Las Vegas Sands Corporation (LVS) We initiated a position during the quarter in this global developer of resort properties across Asia and the United States.
NRG Energy, Inc. (NRG) We elected to add to this name as supply demand factors have weighed on the company and the energy/utility sector as a whole, moving the shares into favorable risk-reward territory.
Recent Sales
Alcoa, Inc. (AA) With significant exposure to a weakening commodity sector alongside our view that a rebound in aluminum prices may already be ‘in’ the stock, we elected to move out of AA at this time.
Cabela’s, Inc. (CAB) While the company’s strong brand should lead to growth of the store-base, ongoing competitive pressures and management’s underestimation of these trends led us to exit the position.
Markel Corporation (MKL) The epitome of a long-term compounding growth situation, we chipped this core holding due to recent strength in the shares (up ~30% YTD at time of sale) and resulting size in the portfolio.
Morgan Stanley China A Share Fund, Inc. (CAF) With increased Chinese government intervention and resulting volatility in the shares, we elected to chip on two occasions and ultimately sell this name during the quarter.
Penn National Gaming, Inc. (PENN) We elected to chip this position on strength and move to more favorable risk return opportunities as regional gaming trends have improved along with investor sentiment.
10
Davenport Small Cap Focus Fund
The following chart represents Davenport Small Cap Focus Fund (the “Small Cap Focus Fund”) performance and the performance of the Russell 2000 Index, the Small Cap Focus Fund’s primary benchmark, for the periods ended September 30, 2015.
| Q3 2015 | Since Inception** 12/31/2014 | Fiscal
Year 2015 Gross Expense Ratio | Fiscal
Year 2015 Net Expense Ratio |
Small Cap Focus Fund | -12.94% | -9.11% | 1.44% | 1.27%1 |
Russell 2000 Index* | -11.92% | -7.73% | — | — |
Past performance is no guarantee of future results. Investment return and principal value of an investment will fluctuate so that an investor’s shares, when redeemed, may be worth more or less than their original cost. Current performance may be lower or higher than the performance data quoted. Performance data, current to the most recent month end, may be obtained by calling 1-800-281-3217.
* | The Russell 2000 Index measures the performance of the 2000 smallest companies in the Russell 3000 Index, which represents approximately 8% of the total market. An investor cannot invest in an index and its returns are not indicative of the performance of any specific investment. |
1 | Davenport & Company LLC (the “Advisor”) has contractually agreed, until August 1, 2016, to reduce Management Fees and to reimburse Other Expenses to the extent necessary to limit Total Annual Fund Operating Expenses (excluding Acquired Fund Fees and Expenses) to an amount not exceeding 1.25% of the Fund’s average daily net assets. Total Annual Fund Operating Expenses exclude brokerage costs, taxes, interest, costs to organize the Fund and extraordinary expenses. For additional details please request a prospectus. |
The Davenport Small Cap Focus Fund (DSCPX) struggled alongside broader market weakness during the third quarter, posting a 12.94% decline versus an 11.92% slide for the Russell 2000 Index. Year- to- date, the strategy is down 9.11%, relative to the 7.73% decline for the Russell 2000. Small capitalization stocks have significantly underperformed large caps year-to-date, as evidenced by the S&P 500’s more manageable decline of 5.29%. As such, we believe valuations are much more reasonable across the asset class and note that the Fund’s domestic bias should serve as a buffer against many of the issues plaguing the global economy.
Commodity and commodity-related stocks have been our primary detractors. Such stocks don’t comprise a huge portion of the Fund, but having moderate exposure to a few names suffering steep declines has been a problem. Over time, we expect to generally be underweight commodities and materials as we don’t like being dependent on commodity prices and often question the long-term returns on capital for these businesses. However, the group was broadly out of favor as we started the year (and started the Small Cap Focus Fund) and appeared to offer some value. Unfortunately, commodity/commodity-related stocks have continued their fall and we were clearly early to a few names.
We’ve recently emphasized some companies that aren’t commodity producers, but have been found guilty by association. One example is Genesee & Wyoming (GWR), which is a short line railroad operator. Shares of GWR have retreated from a high of $105 to a recent price in the mid $60s as investors fret about the company’s exposure to commodity markets. Indeed, part of its business is transporting commodities like coal and iron ore that have seen softening demand. Even with volumes depressed, the company could earn roughly $4.00/share, and incremental
11
earnings on improved volumes could be substantial. We also note GWR has better free cash flow dynamics than Class I rail operators given lower capital requirements and has a sizeable acquisition opportunity due to an abundance of independently owned short line railroads. Given these factors and its wide competitive moat (the threat of new railroads is minimal), GWR has traditionally commanded a premium multiple. After its recent swoon, the stock appears to offer a compelling value.
Significant exposure to the consumer sector has generally helped performance this year. We’ve continued to add to a few consumer stocks that seem to have the potential for years of compounding growth. One instance is Monarch Casino & Resort (MCRI). Monarch is a little known casino operator with a flagship property based in Reno, Nevada. With no new casino supply and a flourishing local economy, we expect MCRI’s property to generate solid results for years to come. What’s more, the company has purchased a second property in Black Hawk, CO and is in the midst of a sizeable expansion. Black Hawk caters to the under-penetrated Denver market and we believe this project will generate attractive returns on capital. At current prices, the stock looks very cheap relative to potential free cash flow generation in a couple years. We also point out that CEO John Farahi currently owns 17% of the company and clearly has substantial “skin in the game.”
In the health care arena, we’ve been adding to animal hospital and reference lab operator, VCA Antech (WOOF). The animal health industry is experiencing significant growth due to rising pet ownership rates, the “humanization of pets” and the emergence of specialty medicine and diagnostics. Both the hospital and reference lab businesses sport strong organic growth rates (mid-single digits) and boast very attractive incremental margins (~15% and 60+% respectively). Over its 30 year history, WOOF has acquired significant scale in this business allowing the company to recycle its strong cash generation into accretive acquisitions and share repurchases. This combination of organic growth, operating leverage and capital allocation should lead to relatively predictable high teens EPS growth over the next few years.
In our opinion, the most exciting aspect of small cap investing is the potential to find uncommon value in companies that are off the beaten path. We feel like we are currently finding such names and “stocking the pond” with companies that seem to have very good risk/reward profiles. You won’t hear about these companies at cocktail parties or on Fast Money, but they could deliver us solid returns over the next few years.
We thank you for your trust and look forward to reporting back as we proceed through the year.
Sincerely,
John P. Ackerly, IV
President, The Davenport Funds
12
DAVENPORT CORE FUND
PERFORMANCE INFORMATION (Unaudited)

| | Average Annual Total Returns(a)
(for periods ended September 30, 2015) |
| | 1 Year | 5 Years | 10 Years |
Davenport Core Fund | 2.06% | 12.84% | 7.17% |
Standard & Poor’s 500® Index | (0.61%) | 13.34% | 6.80% |
(a) | The total returns shown do not reflect the deduction of taxes that a shareholder would pay on Fund distributions or the redemption of Fund shares. |
13
DAVENPORT VALUE & INCOME FUND
PERFORMANCE INFORMATION (Unaudited)

| | Average Annual Total Returns(a)
(for periods ended September 30, 2015) |
| | 1 Year | Since Inception(b) |
Davenport Value & Income Fund | (0.45%) | 11.90% |
Standard & Poor’s 500® Index | (0.61%) | 11.67% |
Lipper Equity Income Index | (4.25%) | 9.41% |
(a) | The total returns shown do not reflect the deduction of taxes that a shareholder would pay on Fund distributions or the redemption of Fund shares. |
(b) | Commencement of operations was December 31, 2010. |
14
DAVENPORT EQUITY OPPORTUNITIES FUND
PERFORMANCE INFORMATION (Unaudited)

| | Average Annual Total Returns(a)
(for periods ended September 30, 2015) |
| | 1 Year | Since Inception(b) |
Davenport Equity Opportunities Fund | 2.43% | 12.98% |
Russell Midcap® Index | (0.25%) | 11.25% |
(a) | The total returns shown do not reflect the deduction of taxes that a shareholder would pay on Fund distributions or the redemption of Fund shares. |
(b) | Commencement of operations was December 31, 2010. |
15
DAVENPORT SMALL CAP FOCUS FUND
PERFORMANCE INFORMATION (Unaudited)

| | Total Returns(a)
(for period ended September 30, 2015) |
| | Since Inception(b) |
Davenport Small Cap Focus Fund | (9.11%) |
Russell 2000® Index | (7.73%) |
(a) | The total return shown does not reflect the deduction of taxes that a shareholder would pay on Fund distributions or the redemption of Fund shares. |
(b) | Commencement of operations was December 31, 2014. |
16
DAVENPORT CORE FUND
PORTFOLIO INFORMATION
September 30, 2015 (Unaudited)
Top Ten Equity Holdings
Security Description | % of Net Assets |
Markel Corporation | 3.4% |
Brookfield Asset Management, Inc. - Class A | 3.3% |
Danaher Corporation | 3.2% |
Capital One Financial Corporation | 2.9% |
American Tower Corporation | 2.6% |
Citigroup, Inc. | 2.6% |
Nestlé SA - ADR | 2.6% |
Accenture plc - Class A | 2.5% |
CarMax, Inc. | 2.5% |
Berkshire Hathaway, Inc. - Class B | 2.5% |
17
DAVENPORT VALUE & INCOME FUND
PORTFOLIO INFORMATION
September 30, 2015 (Unaudited)

Top Ten Equity Holdings
Security Description | % of Net Assets |
Markel Corporation | 2.9% |
JPMorgan Chase & Company | 2.8% |
Capital One Financial Corporation | 2.7% |
Wells Fargo & Company | 2.7% |
SPDR EURO STOXX 50 ETF | 2.7% |
W.P. Carey, Inc. | 2.7% |
Watsco, Inc. | 2.6% |
Johnson & Johnson | 2.4% |
Equity LifeStyle Porperties, Inc. | 2.3% |
General Electric Company | 2.3% |
18
DAVENPORT EQUITY OPPORTUNITIES FUND
PORTFOLIO INFORMATION
September 30, 2015 (Unaudited)
Top Ten Equity Holdings
Security Description | % of Net Assets |
Markel Corporation | 5.7% |
Discovery Communications, Inc. - Series C | 5.5% |
Capital One Financial Corporation | 5.3% |
Brookfield Asset Management, Inc. - Class A | 5.1% |
Gaming and Leisure Properties, Inc. | 5.1% |
CarMax, Inc. | 4.2% |
American Tower Corporation | 4.1% |
Colfax Corporation | 3.9% |
Dollar Tree, Inc. | 3.8% |
Amazon.com, Inc. | 3.6% |
19
DAVENPORT SMALL CAP FOCUS FUND
PORTFOLIO INFORMATION
September 30, 2015 (Unaudited)

Top Ten Equity Holdings
Security Description | % of Net Assets |
Stewart Information Services Corporation | 3.4% |
Monarch Casino & Resort, Inc. | 3.3% |
Boston Beer Company, Inc. (The) - Class A | 3.2% |
VWR Corporation | 3.0% |
Genesee & Wyoming, Inc. - Class A | 2.9% |
Encore Capital Group, Inc. | 2.9% |
Outfront Media, Inc. | 2.8% |
Liberty Broadband Corporation - Series C | 2.8% |
Live Nation Entertainment, Inc. | 2.8% |
TowneBank | 2.7% |
20
DAVENPORT CORE FUND
SCHEDULE OF INVESTMENTS
September 30, 2015 (Unaudited) | |
COMMON STOCKS — 94.1% | | Shares | | | Value | |
Consumer Discretionary — 16.8% | | | | | | |
Amazon.com, Inc. (a) | | | 13,525 | | | $ | 6,923,312 | |
CarMax, Inc. (a) | | | 135,754 | | | | 8,052,927 | |
DISH Network Corporation - Class A (a) | | | 68,710 | | | | 4,008,542 | |
Liberty Broadband Corporation - Series A (a) | | | 10,584 | | | | 544,441 | |
Liberty Broadband Corporation - Series C (a) | | | 49,854 | | | | 2,551,029 | |
Liberty Media Corporation - Series A (a) | | | 42,337 | | | | 1,512,278 | |
Liberty Media Corporation - Series C (a) | | | 131,829 | | | | 4,542,827 | |
Priceline Group, Inc. (The) (a) | | | 5,692 | | | | 7,040,207 | |
PVH Corporation | | | 65,338 | | | | 6,660,556 | |
Starbucks Corporation | | | 108,705 | | | | 6,178,792 | |
Walt Disney Company (The) | | | 51,531 | | | | 5,266,468 | |
| | | | | | | | 53,281,379 | |
Consumer Staples — 10.8% | | | | | | | | |
Anheuser-Busch InBev SA/NV - ADR | | | 39,920 | | | | 4,244,294 | |
Hershey Company (The) | | | 48,065 | | | | 4,416,212 | |
J.M. Smucker Company (The) | | | 56,957 | | | | 6,498,224 | |
Mondelēz International, Inc. - Class A | | | 135,520 | | | | 5,674,222 | |
Nestlé SA - ADR | | | 108,802 | | | | 8,186,263 | |
PepsiCo, Inc. | | | 54,796 | | | | 5,167,263 | |
| | | | | | | | 34,186,478 | |
Energy — 5.9% | | | | | | | | |
Chevron Corporation | | | 42,157 | | | | 3,325,344 | |
Exxon Mobil Corporation | | | 86,462 | | | | 6,428,450 | |
Range Resources Corporation | | | 96,407 | | | | 3,096,593 | |
Schlumberger Ltd. | | | 83,140 | | | | 5,734,166 | |
| | | | | | | | 18,584,553 | |
Financials — 23.6% | | | | | | | | |
American Tower Corporation (b) | | | 93,792 | | | | 8,251,820 | |
Berkshire Hathaway, Inc. - Class B (a) | | | 60,361 | | | | 7,871,074 | |
Brookfield Asset Management, Inc. - Class A | | | 329,959 | | | | 10,373,911 | |
Capital One Financial Corporation | | | 127,036 | | | | 9,212,651 | |
Citigroup, Inc. | | | 165,742 | | | | 8,222,461 | |
CME Group, Inc. | | | 81,011 | | | | 7,512,960 | |
JPMorgan Chase & Company | | | 114,578 | | | | 6,985,821 | |
Markel Corporation (a) | | | 13,588 | | | | 10,895,674 | |
Wells Fargo & Company | | | 111,829 | | | | 5,742,419 | |
| | | | | | | | 75,068,791 | |
Health Care — 13.4% | | | | | | | | |
AmerisourceBergen Corporation | | | 66,695 | | | | 6,335,358 | |
Amgen, Inc. | | | 29,511 | | | | 4,081,962 | |
Anthem, Inc. | | | 28,788 | | | | 4,030,320 | |
Celgene Corporation (a) | | | 66,513 | | | | 7,194,711 | |
Express Scripts Holding Company (a) | | | 55,426 | | | | 4,487,289 | |
21
DAVENPORT CORE FUND
SCHEDULE OF INVESTMENTS (Continued) | |
COMMON STOCKS — 94.1% (Continued) | | Shares | | | Value | |
Health Care — 13.4% (Continued) | | | | | | |
Johnson & Johnson | | | 72,113 | | | $ | 6,731,749 | |
Merck & Company, Inc. | | | 112,855 | | | | 5,573,908 | |
Valeant Pharmaceuticals International, Inc. (a) | | | 23,787 | | | | 4,243,125 | |
| | | | | | | | 42,678,422 | |
Industrials — 10.3% | | | | | | | | |
American Airlines Group, Inc. | | | 135,720 | | | | 5,270,008 | |
Cummins, Inc. | | | 28,709 | | | | 3,117,223 | |
Danaher Corporation | | | 118,422 | | | | 10,090,739 | |
General Electric Company | | | 156,250 | | | | 3,940,625 | |
Parker-Hannifin Corporation | | | 40,430 | | | | 3,933,839 | |
Union Pacific Corporation | | | 72,299 | | | | 6,391,954 | |
| | | | | | | | 32,744,388 | |
Information Technology — 10.7% | | | | | | | | |
Accenture plc - Class A | | | 82,336 | | | | 8,090,335 | |
Apple, Inc. | | | 52,695 | | | | 5,812,258 | |
Cisco Systems, Inc. | | | 173,988 | | | | 4,567,185 | |
Google, Inc. - Class A (a) | | | 7,045 | | | | 4,497,317 | |
Google, Inc. - Class C (a) | | | 6,387 | | | | 3,885,979 | |
Visa, Inc. - Class A | | | 103,926 | | | | 7,239,485 | |
| | | | | | | | 34,092,559 | |
Materials — 2.6% | | | | | | | | |
Monsanto Company | | | 49,140 | | | | 4,193,607 | |
Praxair, Inc. | | | 40,658 | | | | 4,141,424 | |
| | | | | | | | 8,335,031 | |
| | | | | | | | | |
Total Common Stocks (Cost $230,715,873) | | | | | | $ | 298,971,601 | |
MONEY MARKET FUNDS — 1.8% | | Shares | | | Value | |
First American Treasury Obligations Fund - Class Z, 0.00% (c) (Cost $5,895,704) | | | 5,895,704 | | | $ | 5,895,704 | |
| | | | | | | | | |
Total Investments at Value — 95.9% (Cost $236,611,580) | | | | | | $ | 304,867,305 | |
| | | | | | | | | |
Other Assets in Excess of Liabilities — 4.1% | | | | | | | 12,940,066 | |
| | | | | | | | | |
Net Assets — 100.0% | | | | | | $ | 317,807,371 | |
ADR - American Depositary Receipt.
(a) | Non-income producing security. |
(b) | Real estate investment trust (REIT). |
(c) | The rate shown is the 7-day effective yield as of September 30, 2015. |
See accompanying notes to financial statements.
22
DAVENPORT VALUE & INCOME FUND
SCHEDULE OF INVESTMENTS
September 30, 2015 (Unaudited) | |
COMMON STOCKS — 93.4% | | Shares | | | Value | |
Consumer Discretionary — 8.0% | | | | | | |
Las Vegas Sands Corporation | | | 155,800 | | | $ | 5,915,726 | |
McDonald's Corporation | | | 89,705 | | | | 8,838,633 | |
Ralph Lauren Corporation | | | 47,255 | | | | 5,583,651 | |
Six Flags Entertainment Corporation | | | 147,600 | | | | 6,757,128 | |
Time Warner, Inc. | | | 74,765 | | | | 5,140,094 | |
| | | | | | | | 32,235,232 | |
Consumer Staples — 15.7% | | | | | | | | |
Altria Group, Inc. | | | 130,026 | | | | 7,073,415 | |
Anheuser-Busch InBev SA/NV - ADR | | | 60,295 | | | | 6,410,565 | |
Archer-Daniels-Midland Company | | | 152,590 | | | | 6,324,856 | |
Coca-Cola Company (The) | | | 213,350 | | | | 8,559,602 | |
Diageo plc - ADR | | | 71,485 | | | | 7,705,368 | |
PepsiCo, Inc. | | | 82,120 | | | | 7,743,916 | |
Philip Morris International, Inc. | | | 97,380 | | | | 7,725,155 | |
Procter & Gamble Company (The) | | | 81,845 | | | | 5,887,929 | |
Wal-Mart Stores, Inc. | | | 88,967 | | | | 5,768,620 | |
| | | | | | | | 63,199,426 | |
Energy — 6.6% | | | | | | | | |
Chevron Corporation | | | 58,171 | | | | 4,588,528 | |
Exxon Mobil Corporation | | | 100,510 | | | | 7,472,918 | |
Kinder Morgan, Inc. | | | 219,195 | | | | 6,067,318 | |
Occidental Petroleum Corporation | | | 124,365 | | | | 8,226,745 | |
| | | | | | | | 26,355,509 | |
Financials — 28.7% | | | | | | | | |
Capital One Financial Corporation | | | 152,035 | | | | 11,025,578 | |
Citigroup, Inc. | | | 160,730 | | | | 7,973,816 | |
Equity LifeStyle Properties, Inc. (b) | | | 157,955 | | | | 9,251,425 | |
FNF Group | | | 240,445 | | | | 8,528,584 | |
Gaming and Leisure Properties, Inc. (b) | | | 301,649 | | | | 8,958,975 | |
JPMorgan Chase & Company | | | 186,070 | | | | 11,344,688 | |
Lamar Advertising Company - Class A (b) | | | 156,540 | | | | 8,168,257 | |
Markel Corporation (a) | | | 14,529 | | | | 11,650,224 | |
Regions Financial Corporation | | | 848,530 | | | | 7,645,255 | |
Sun Communities, Inc. (b) | | | 127,805 | | | | 8,660,067 | |
W.P. Carey, Inc. (b) | | | 189,304 | | | | 10,943,664 | |
Wells Fargo & Company | | | 213,815 | | | | 10,979,400 | |
| | | | | | | | 115,129,933 | |
Health Care — 8.4% | | | | | | | | |
Johnson & Johnson | | | 103,945 | | | | 9,703,266 | |
Merck & Company, Inc. | | | 144,640 | | | | 7,143,770 | |
Sanofi - ADR | | | 168,960 | | | | 8,020,531 | |
Teva Pharmaceutical Industries Ltd. - ADR | | | 156,290 | | | | 8,824,133 | |
| | | | | | | | 33,691,700 | |
23
DAVENPORT VALUE & INCOME FUND
SCHEDULE OF INVESTMENTS (Continued) | |
COMMON STOCKS — 93.4% (Continued) | | Shares | | | Value | |
Industrials — 11.2% | | | | | | |
3M Company | | | 51,695 | | | $ | 7,328,800 | |
Eaton Corporation plc | | | 106,907 | | | | 5,484,329 | |
General Electric Company | | | 366,035 | | | | 9,231,403 | |
Illinois Tool Works, Inc. | | | 68,990 | | | | 5,678,567 | |
Raytheon Company | | | 59,836 | | | | 6,537,681 | |
Watsco, Inc. | | | 89,245 | | | | 10,573,748 | |
| | | | | | | | 44,834,528 | |
Information Technology — 3.2% | | | | | | | | |
Cisco Systems, Inc. | | | 236,840 | | | | 6,217,050 | |
Microsoft Corporation | | | 146,393 | | | | 6,479,354 | |
| | | | | | | | 12,696,404 | |
Materials — 5.1% | | | | | | | | |
E.I. du Pont de Nemours and Company | | | 93,680 | | | | 4,515,376 | |
Eastman Chemical Company | | | 124,015 | | | | 8,026,251 | |
Nucor Corporation | | | 113,845 | | | | 4,274,880 | |
Potash Corporation of Saskatchewan, Inc. | | | 177,930 | | | | 3,656,461 | |
| | | | | | | | 20,472,968 | |
Telecommunication Services — 3.4% | | | | | | | | |
TELUS Corporation | | | 225,560 | | | | 7,114,162 | |
Verizon Communications, Inc. | | | 155,460 | | | | 6,764,065 | |
| | | | | | | | 13,878,227 | |
Utilities — 3.1% | | | | | | | | |
Dominion Resources, Inc. | | | 109,775 | | | | 7,725,965 | |
NRG Energy, Inc. | | | 309,025 | | | | 4,589,021 | |
| | | | | | | | 12,314,986 | |
| | | | | | | | | |
Total Common Stocks (Cost $357,636,014) | | | | | | $ | 374,808,913 | |
EXCHANGE-TRADED FUNDS — 2.7% | | Shares | | | Value | |
SPDR EURO STOXX 50 ETF (Cost $11,296,518) | | | 323,770 | | | $ | 10,959,614 | |
24
DAVENPORT VALUE & INCOME FUND
SCHEDULE OF INVESTMENTS (Continued) | |
MONEY MARKET FUNDS — 2.9% | | Shares | | | Value | |
First American Treasury Obligations Fund - Class Z, 0.00% (c) (Cost $11,585,942) | | | 11,585,942 | | | $ | 11,585,942 | |
| | | | | | | | | |
Total Investments at Value — 99.0% (Cost $380,518,474) | | | | | | $ | 397,354,469 | |
| | | | | | | | | |
Other Assets in Excess of Liabilities — 1.0% | | | | | | | 4,056,079 | |
| | | | | | | | | |
Net Assets — 100.0% | | | | | | $ | 401,410,548 | |
ADR - American Depositary Receipt.
(a) | Non-income producing security. |
(b) | Real estate investment trust (REIT). |
(c) | The rate shown is the 7-day effective yield as of September 30, 2015. |
See accompanying notes to financial statements.
25
DAVENPORT EQUITY OPPORTUNITIES FUND
SCHEDULE OF INVESTMENTS
September 30, 2015 (Unaudited) | |
COMMON STOCKS — 92.8% | | Shares | | | Value | |
Consumer Discretionary — 34.1% | | | | | | |
Amazon.com, Inc. (a) | | | 20,240 | | | $ | 10,360,654 | |
CarMax, Inc. (a) | | | 204,210 | | | | 12,113,737 | |
Discovery Communications, Inc. - Series A (a) | | | 116,935 | | | | 3,043,818 | |
Discovery Communications, Inc. - Series C (a) | | | 665,066 | | | | 16,154,453 | |
Dollar Tree, Inc. (a) | | | 165,766 | | | | 11,049,962 | |
Hanesbrands, Inc. | | | 353,445 | | | | 10,228,698 | |
Las Vegas Sands Corporation | | | 119,918 | | | | 4,553,287 | |
Liberty Broadband Corporation - Series C (a) | | | 191,090 | | | | 9,778,075 | |
Live Nation Entertainment, Inc. (a) | | | 311,200 | | | | 7,481,248 | |
LKQ Corporation (a) | | | 319,691 | | | | 9,066,437 | |
Penn National Gaming, Inc. (a) | | | 338,457 | | | | 5,679,308 | |
| | | | | | | | 99,509,677 | |
Consumer Staples — 3.5% | | | | | | | | |
Church & Dwight Company, Inc. | | | 122,335 | | | | 10,263,907 | |
| | | | | | | | | |
Financials — 33.1% | | | | | | | | |
American Tower Corporation (b) | | | 137,155 | | | | 12,066,897 | |
Brookfield Asset Management, Inc. - Class A | | | 476,012 | | | | 14,965,817 | |
Capital One Financial Corporation | | | 212,249 | | | | 15,392,297 | |
Fairfax Financial Holdings Ltd. | | | 18,913 | | | | 8,616,385 | |
FNF Group | | | 162,250 | | | | 5,755,007 | |
Gaming and Leisure Properties, Inc. (b) | | | 500,089 | | | | 14,852,643 | |
Markel Corporation (a) | | | 20,802 | | | | 16,680,292 | |
PRA Group, Inc. (a) | | | 156,355 | | | | 8,274,307 | |
| | | | | | | | 96,603,645 | |
Health Care — 2.2% | | | | | | | | |
Henry Schein, Inc. (a) | | | 48,615 | | | | 6,452,183 | |
| | | | | | | | | |
Industrials — 14.6% | | | | | | | | |
American Airlines Group, Inc. | | | 207,510 | | | | 8,057,613 | |
Colfax Corporation (a) | | | 379,201 | | | | 11,341,902 | |
Genesee & Wyoming, Inc. - Class A (a) | | | 137,195 | | | | 8,105,481 | |
WABCO Holdings, Inc. (a) | | | 89,615 | | | | 9,394,340 | |
Watsco, Inc. | | | 48,740 | | | | 5,774,715 | |
| | | | | | | | 42,674,051 | |
Information Technology — 3.1% | | | | | | | | |
Intuit, Inc. | | | 101,350 | | | | 8,994,813 | |
| | | | | | | | | |
Utilities — 2.2% | | | | | | | | |
NRG Energy, Inc. | | | 428,105 | | | | 6,357,359 | |
| | | | | | | | | |
Total Common Stocks (Cost $271,057,784) | | | | | | $ | 270,855,635 | |
26
DAVENPORT EQUITY OPPORTUNITIES FUND
SCHEDULE OF INVESTMENTS (Continued) | |
MONEY MARKET FUNDS — 2.8% | | Shares | | | Value | |
First American Treasury Obligations Fund - Class Z, 0.00% (c) (Cost $8,151,436) | | | 8,151,436 | | | $ | 8,151,436 | |
| | | | | | | | | |
Total Investments at Value — 95.6% (Cost $279,209,220) | | | | | | $ | 279,007,071 | |
| | | | | | | | | |
Other Assets in Excess of Liabilities — 4.4% | | | | | | | 12,773,937 | |
| | | | | | | | | |
Net Assets — 100.0% | | | | | | $ | 291,781,008 | |
(a) | Non-income producing security. |
(b) | Real estate investment trust (REIT). |
(c) | The rate shown is the 7-day effective yield as of September 30, 2015. |
See accompanying notes to financial statements.
27
DAVENPORT SMALL CAP FOCUS FUND
SCHEDULE OF INVESTMENTS
September 30, 2015 (Unaudited) | |
COMMON STOCKS — 91.3% | | Shares | | | Value | |
Consumer Discretionary — 22.2% | | | | | | |
Cable One, Inc. (a) | | | 1,500 | | | $ | 629,130 | |
Core-Mark Holding Company, Inc. | | | 16,071 | | | | 1,051,847 | |
J. Alexander's Holdings, Inc. (a) | | | 8,382 | | | | 83,569 | |
Liberty Broadband Corporation - Series C (a) | | | 21,918 | | | | 1,121,544 | |
Lions Gate Entertainment Corporation | | | 24,000 | | | | 883,200 | |
Live Nation Entertainment, Inc. (a) | | | 46,179 | | | | 1,110,143 | |
Monarch Casino & Resort, Inc. (a) | | | 73,778 | | | | 1,325,791 | |
Pinnacle Entertainment, Inc. (a) | | | 20,256 | | | | 685,463 | |
Pool Corporation | | | 11,457 | | | | 828,341 | |
Scripps Networks Interactive, Inc. - Class A | | | 16,500 | | | | 811,635 | |
Unifi, Inc. (a) | | | 11,107 | | | | 331,100 | |
| | | | | | | | 8,861,763 | |
Consumer Staples — 7.2% | | | | | | | | |
Boston Beer Company, Inc. (The) - Class A (a) | | | 6,100 | | | | 1,284,721 | |
Seaboard Corporation (a) | | | 275 | | | | 846,725 | |
Snyder's-Lance, Inc. | | | 21,617 | | | | 729,141 | |
| | | | | | | | 2,860,587 | |
Energy — 8.8% | | | | | | | | |
CNX Coal Resources LP (a) | | | 55,500 | | | | 624,375 | |
Fission Uranium Corporation (a) | | | 241,484 | | | | 114,898 | |
Peyto Exploration & Development Corporation | | | 42,051 | | | | 874,241 | |
Sunoco LP | | | 23,652 | | | | 800,620 | |
Westmoreland Coal Company (a) | | | 76,047 | | | | 1,071,502 | |
| | | | | | | | 3,485,636 | |
Financials — 22.3% | | | | | | | | |
Diamond Hill Investment Group, Inc. | | | 3,644 | | | | 677,930 | |
Encore Capital Group, Inc. (a) | | | 31,579 | | | | 1,168,423 | |
FNFV Group (a) | | | 48,530 | | | | 568,772 | |
FRP Holdings, Inc. (a) | | | 21,893 | | | | 659,855 | |
Gaming and Leisure Properties, Inc. (b) | | | 26,198 | | | | 778,081 | |
Lamar Advertising Company - Class A | | | 14,500 | | | | 756,610 | |
Outfront Media, Inc.(b) | | | 54,289 | | | | 1,129,211 | |
PRA Group, Inc. (a) | | | 13,302 | | | | 703,942 | |
Stewart Information Services Corporation | | | 33,529 | | | | 1,371,671 | |
TowneBank | | | 57,359 | | | | 1,081,217 | |
| | | | | | | | 8,895,712 | |
Health Care — 5.3% | | | | | | | | |
VCA, Inc. (a) | | | 17,155 | | | | 903,211 | |
VWR Corporation (a) | | | 46,361 | | | | 1,191,014 | |
| | | | | | | | 2,094,225 | |
Industrials — 14.4% | | | | | | | | |
Colfax Corporation (a) | | | 35,014 | | | | 1,047,269 | |
Covenant Transportation Group, Inc. - Class A (a) | | | 45,557 | | | | 818,659 | |
28
DAVENPORT SMALL CAP FOCUS FUND
SCHEDULE OF INVESTMENTS (Continued) | |
COMMON STOCKS — 91.3% (Continued) | | Shares | | | Value | |
Industrials — 14.4% (Continued) | | | | | | |
Genesee & Wyoming, Inc. - Class A (a) | | | 19,870 | | | $ | 1,173,920 | |
Marten Transport Ltd. | | | 55,178 | | | | 892,228 | |
Mistras Group, Inc. (a) | | | 63,033 | | | | 809,974 | |
Watsco, Inc. | | | 8,558 | | | | 1,013,952 | |
| | | | | | | | 5,756,002 | |
Information Technology — 3.4% | | | | | | | | |
Black Knight Financial Services, Inc. - Class A (a) | | | 21,000 | | | | 683,550 | |
EchoStar Corporation - Class A (a) | | | 15,559 | | | | 669,504 | |
| | | | | | | | 1,353,054 | |
Materials — 3.3% | | | | | | | | |
Fortuna Silver Mines, Inc. (a) | | | 385,580 | | | | 840,564 | |
NewMarket Corporation | | | 1,336 | | | | 476,952 | |
| | | | | | | | 1,317,516 | |
Telecommunication Services — 2.3% | | | | | | | | |
Iridium Communications, Inc. (a) | | | 79,227 | | | | 487,246 | |
United States Cellular Corporation (a) | | | 12,236 | | | | 433,522 | |
| | | | | | | | 920,768 | |
Utilities — 2.1% | | | | | | | | |
Dynegy, Inc. (a) | | | 39,753 | | | | 821,694 | |
| | | | | | | | | |
Total Common Stocks (Cost $40,799,130) | | | | | | $ | 36,366,957 | |
MONEY MARKET FUNDS — 8.6% | | Shares | | | Value | |
First American Treasury Obligations Fund - Class Z, 0.00% (c) (Cost $3,432,577) | | | 3,432,577 | | | $ | 3,432,577 | |
| | | | | | | | | |
Total Investments at Value — 99.9% (Cost $44,231,707) | | | | | | $ | 39,799,534 | |
| | | | | | | | | |
Other Assets in Excess of Liabilities — 0.1% | | | | | | | 40,881 | |
| | | | | | | | | |
Net Assets — 100.0% | | | | | | $ | 39,840,415 | |
(a) | Non-income producing security. |
(b) | Real estate investment trust (REIT). |
(c) | The rate shown is the 7-day effective yield as of September 30, 2015. |
See accompanying notes to financial statements.
29
THE DAVENPORT FUNDS
STATEMENTS OF ASSETS AND LIABILITIES
September 30, 2015 (Unaudited) | |
| | Davenport
Core
Fund | | | Davenport Value & Income
Fund | |
ASSETS | | | | | | |
Investments in securities: | | | | | | |
At acquisition cost | | $ | 236,611,580 | | | $ | 380,518,474 | |
At market value (Note 2) | | $ | 304,867,305 | | | $ | 397,354,469 | |
Cash | | | 12,967,423 | | | | 2,136,424 | |
Dividends receivable | | | 199,767 | | | | 1,229,773 | |
Receivable for capital shares sold | | | 209,892 | | | | 1,369,266 | |
Other assets | | | 25,854 | | | | 29,443 | |
TOTAL ASSETS | | | 318,270,241 | | | | 402,119,375 | |
| | | | | | | | | |
LIABILITIES | | | | | | | | |
Payable for capital shares redeemed | | | 222,439 | | | | 407,704 | |
Accrued investment advisory fees (Note 4) | | | 199,978 | | | | 249,516 | |
Payable to administrator (Note 4) | | | 34,450 | | | | 41,500 | |
Other accrued expenses | | | 6,003 | | | | 10,107 | |
TOTAL LIABILITIES | | | 462,870 | | | | 708,827 | |
| | | | | | | | | |
NET ASSETS | | $ | 317,807,371 | | | $ | 401,410,548 | |
| | | | | | | | | |
Net assets consist of: | | | | | | | | |
Paid-in capital | | $ | 239,598,276 | | | $ | 375,069,110 | |
Accumulated net investment income | | | 28,331 | | | | 373,779 | |
Accumulated net realized gains from security transactions | | | 9,925,039 | | | | 9,131,664 | |
Net unrealized appreciation on investments | | | 68,255,725 | | | | 16,835,995 | |
Net assets | | $ | 317,807,371 | | | $ | 401,410,548 | |
| | | | | | | | | |
Shares of beneficial interest outstanding (unlimited number of shares authorized, $0.01 par value) | | | 17,290,384 | | | | 29,336,310 | |
| | | | | | | | | |
Net asset value, offering price and redemption price per share (Note 2) | | $ | 18.38 | | | $ | 13.68 | |
See accompanying notes to financial statements.
30
THE DAVENPORT FUNDS
STATEMENTS OF ASSETS AND LIABILITIES (Continued)
September 30, 2015 (Unaudited) | |
| | Davenport Equity Opportunities Fund | | | Davenport Small Cap Focus
Fund | |
ASSETS | | | | | | |
Investments in securities: | | | | | | |
At acquisition cost | | $ | 279,209,220 | | | $ | 44,231,707 | |
At market value (Note 2) | | $ | 279,007,071 | | | $ | 39,799,534 | |
Cash | | | 12,626,377 | | | | — | |
Dividends receivable | | | 63,091 | | | | 13,859 | |
Receivable for capital shares sold | | | 372,299 | | | | 93,500 | |
Other assets | | | 25,738 | | | | 17,970 | |
TOTAL ASSETS | | | 292,094,576 | | | | 39,924,863 | |
| | | | | | | | | |
LIABILITIES | | | | | | | | |
Payable for investment securities purchased | | | — | | | | 8,625 | |
Payable for capital shares redeemed | | | 83,562 | | | | 41,204 | |
Accrued investment advisory fees (Note 4) | | | 185,125 | | | | 25,483 | |
Payable to administrator (Note 4) | | | 33,500 | | | | 6,200 | |
Other accrued expenses and liabilities | | | 11,381 | | | | 2,936 | |
TOTAL LIABILITIES | | | 313,568 | | | | 84,448 | |
| | | | | | | | | |
NET ASSETS | | $ | 291,781,008 | | | $ | 39,840,415 | |
| | | | | | | | | |
Net assets consist of: | | | | | | | | |
Paid-in capital | | $ | 284,112,714 | | | $ | 44,404,476 | |
Accumulated net investment income (loss) | | | 100,506 | | | | (34,864 | ) |
Accumulated net realized gains (losses) from security transactions | | | 7,769,937 | | | | (97,024 | ) |
Net unrealized depreciation on investments | | | (202,149 | ) | | | (4,432,173 | ) |
Net assets | | $ | 291,781,008 | | | $ | 39,840,415 | |
| | | | | | | | | |
Shares of beneficial interest outstanding (unlimited number of shares authorized, $0.01 par value) | | | 20,270,237 | | | | 4,387,612 | |
| | | | | | | | | |
Net asset value, offering price and redemption price per share (Note 2) | | $ | 14.39 | | | $ | 9.08 | |
See accompanying notes to financial statements.
31
THE DAVENPORT FUNDS
STATEMENTS OF OPERATIONS
Six Months Ended September 30, 2015 (Unaudited) | |
| | Davenport
Core
Fund | | | Davenport Value & Income
Fund | |
INVESTMENT INCOME | | | | | | |
Dividends | | $ | 2,513,064 | | | $ | 6,585,531 | |
Foreign withholding taxes on dividends | | | (51,282 | ) | | | (165,202 | ) |
TOTAL INVESTMENT INCOME | | | 2,461,782 | | | | 6,420,329 | |
| | | | | | | | | |
EXPENSES | | | | | | | | |
Investment advisory fees (Note 4) | | | 1,264,359 | | | | 1,587,538 | |
Administration fees (Note 4) | | | 200,212 | | | | 242,542 | |
Registration and filing fees | | | 13,526 | | | | 18,368 | |
Compliance service fees (Note 4) | | | 13,051 | | | | 15,727 | |
Custodian and bank service fees | | | 12,371 | | | | 16,019 | |
Professional fees | | | 12,668 | | | | 13,718 | |
Printing of shareholder reports | | | 6,440 | | | | 7,542 | |
Insurance expense | | | 5,382 | | | | 6,548 | |
Trustees’ fees and expenses (Note 4) | | | 5,120 | | | | 5,120 | |
Postage and supplies | | | 3,250 | | | | 3,568 | |
Other expenses | | | 4,567 | | | | 4,398 | |
TOTAL EXPENSES | | | 1,540,946 | | | | 1,921,088 | |
| | | | | | | | | |
NET INVESTMENT INCOME | | | 920,836 | | | | 4,499,241 | |
| | | | | | | | | |
REALIZED AND UNREALIZED GAINS (LOSSES) ON INVESTMENTS | | | | | | | | |
Net realized gains from security transactions | | | 9,937,866 | | | | 9,132,233 | |
Net change in unrealized appreciation/depreciation on investments | | | (31,875,342 | ) | | | (49,235,001 | ) |
| | | | | | | | | |
NET REALIZED AND UNREALIZED LOSSES ON INVESTMENTS | | | (21,937,476 | ) | | | (40,102,768 | ) |
| | | | | | | | | |
NET DECREASE IN NET ASSETS FROM OPERATIONS | | $ | (21,016,640 | ) | | $ | (35,603,527 | ) |
See accompanying notes to financial statements.
32
THE DAVENPORT FUNDS
STATEMENTS OF OPERATIONS (Continued)
Six Months Ended September 30, 2015 (Unaudited) | |
| | Davenport Equity Opportunities Fund | | | Davenport Small Cap Focus
Fund | |
INVESTMENT INCOME | | | | | | |
Dividends | | $ | 1,537,593 | | | $ | 196,035 | |
Foreign withholding taxes on dividends | | | (16,506 | ) | | | (4,721 | ) |
TOTAL INVESTMENT INCOME | | | 1,521,087 | | | | 191,314 | |
| | | | | | | | | |
EXPENSES | | | | | | | | |
Investment advisory fees (Note 4) | | | 1,147,955 | | | | 158,871 | (a) |
Administration fees (Note 4) | | | 191,553 | | | | 32,816 | |
Registration and filing fees | | | 19,510 | | | | 11,986 | |
Professional fees | | | 11,978 | | | | 8,578 | |
Custodian and bank service fees | | | 12,486 | | | | 4,075 | |
Compliance service fees (Note 4) | | | 12,156 | | | | 3,731 | |
Trustees’ fees and expenses (Note 4) | | | 5,120 | | | | 5,120 | |
Printing of shareholder reports | | | 6,571 | | | | 2,884 | |
Insurance expense | | | 4,707 | | | | 744 | |
Postage and supplies | | | 3,651 | | | | 1,790 | |
Other expenses | | | 4,894 | | | | 2,410 | |
TOTAL EXPENSES | | | 1,420,581 | | | | 233,005 | |
| | | | | | | | | |
NET INVESTMENT INCOME (LOSS) | | | 100,506 | | | | (41,691 | ) |
| | | | | | | | | |
REALIZED AND UNREALIZED GAINS
(LOSSES) ON INVESTMENTS | | | | | | | | |
Net realized gains (losses) from security transactions | | | 7,770,631 | | | | (97,008 | ) |
Net change in unrealized appreciation/depreciation on investments | | | (46,679,240 | ) | | | (5,567,101 | ) |
| | | | | | | | | |
NET REALIZED AND UNREALIZED LOSSES ON INVESTMENTS | | | (38,908,609 | ) | | | (5,664,109 | ) |
| | | | | | | | | |
NET DECREASE IN NET ASSETS FROM OPERATIONS | | $ | (38,808,103 | ) | | $ | (5,705,800 | ) |
(a) | Includes previously waived investment advisory fees recouped by the Adviser of $10,744 (Note 4). |
See accompanying notes to financial statements.
33
DAVENPORT CORE FUND
STATEMENTS OF CHANGES IN NET ASSETS | |
| | Six Months
Ended
September 30,
2015
(Unaudited) | | | Year
Ended
March 31,
2015 | |
FROM OPERATIONS | | | | | | |
Net investment income | | $ | 920,836 | | | $ | 1,488,043 | |
Net realized gains from security transactions | | | 9,937,866 | | | | 14,551,320 | |
Net change in unrealized appreciation/depreciation on investments | | | (31,875,342 | ) | | | 19,717,017 | |
Net increase (decrease) in net assets from operations | | | (21,016,640 | ) | | | 35,756,380 | |
| | | | | | | | | |
DISTRIBUTIONS TO SHAREHOLDERS (Note 2) | | | | | | | | |
From net investment income | | | (892,505 | ) | | | (1,509,705 | ) |
From net realized gains from security transactions | | | (6,233,547 | ) | | | (22,409,339 | ) |
Decrease in net assets from distributions to shareholders | | | (7,126,052 | ) | | | (23,919,044 | ) |
| | | | | | | | | |
FROM CAPITAL SHARE TRANSACTIONS | | | | | | | | |
Proceeds from shares sold | | | 20,586,323 | | | | 43,532,772 | |
Net asset value of shares issued in reinvestment of distributions to shareholders | | | 6,895,742 | | | | 23,153,291 | |
Payments for shares redeemed | | | (12,218,656 | ) | | | (29,067,963 | ) |
Net increase in net assets from capital share transactions | | | 15,263,409 | | | | 37,618,100 | |
| | | | | | | | | |
TOTAL INCREASE (DECREASE) IN NET ASSETS | | | (12,879,283 | ) | | | 49,455,436 | |
| | | | | | | | | |
NET ASSETS | | | | | | | | |
Beginning of period | | | 330,686,654 | | | | 281,231,218 | |
End of period | | $ | 317,807,371 | | | $ | 330,686,654 | |
| | | | | | | | | |
ACCUMULATED NET INVESTMENT INCOME | | $ | 28,331 | | | $ | — | |
| | | | | | | | | |
CAPITAL SHARE ACTIVITY | | | | | | | | |
Shares sold | | | 1,036,004 | | | | 2,233,700 | |
Shares reinvested | | | 347,892 | | | | 1,207,808 | |
Shares redeemed | | | (612,755 | ) | | | (1,495,763 | ) |
Net increase in shares outstanding | | | 771,141 | | | | 1,945,745 | |
Shares outstanding at beginning of period | | | 16,519,243 | | | | 14,573,498 | |
Shares outstanding at end of period | | | 17,290,384 | | | | 16,519,243 | |
See accompanying notes to financial statements.
34
DAVENPORT VALUE & INCOME FUND
STATEMENTS OF CHANGES IN NET ASSETS | |
| | Six Months
Ended
September 30,
2015
(Unaudited) | | | Year
Ended
March 31,
2015 | |
FROM OPERATIONS | | | | | | |
Net investment income | | $ | 4,499,241 | | | $ | 5,877,403 | |
Net realized gains from security transactions | | | 9,132,233 | | | | 18,731,719 | |
Net change in unrealized appreciation/depreciation on investments | | | (49,235,001 | ) | | | 14,874,206 | |
Net increase (decrease) in net assets from operations | | | (35,603,527 | ) | | | 39,483,328 | |
| | | | | | | | | |
DISTRIBUTIONS TO SHAREHOLDERS (Note 2) | | | | | | | | |
From net investment income | | | (4,379,582 | ) | | | (5,878,113 | ) |
From net realized gains from security transactions | | | (11,144,935 | ) | | | (15,874,061 | ) |
Decrease in net assets from distributions to shareholders | | | (15,524,517 | ) | | | (21,752,174 | ) |
| | | | | | | | | |
FROM CAPITAL SHARE TRANSACTIONS | | | | | | | | |
Proceeds from shares sold | | | 44,496,126 | | | | 93,258,289 | |
Net asset value of shares issued in reinvestment of distributions to shareholders | | | 14,368,942 | | | | 20,026,663 | |
Payments for shares redeemed | | | (14,103,272 | ) | | | (27,526,918 | ) |
Net increase in net assets from capital share transactions | | | 44,761,796 | | | | 85,758,034 | |
| | | | | | | | | |
TOTAL INCREASE (DECREASE) IN NET ASSETS | | | (6,366,248 | ) | | | 103,489,188 | |
| | | | | | | | | |
NET ASSETS | | | | | | | | |
Beginning of period | | | 407,776,796 | | | | 304,287,608 | |
End of period | | $ | 401,410,548 | | | $ | 407,776,796 | |
| | | | | | | | | |
ACCUMULATED NET INVESTMENT INCOME | | $ | 373,779 | | | $ | 254,321 | |
| | | | | | | | | |
CAPITAL SHARE ACTIVITY | | | | | | | | |
Shares sold | | | 2,933,664 | | | | 6,192,254 | |
Shares reinvested | | | 961,488 | | | | 1,332,807 | |
Shares redeemed | | | (941,343 | ) | | | (1,830,740 | ) |
Net increase in shares outstanding | | | 2,953,809 | | | | 5,694,321 | |
Shares outstanding at beginning of period | | | 26,382,501 | | | | 20,688,180 | |
Shares outstanding at end of period | | | 29,336,310 | | | | 26,382,501 | |
See accompanying notes to financial statements.
35
DAVENPORT EQUITY OPPORTUNITIES FUND
STATEMENTS OF CHANGES IN NET ASSETS | |
| | Six Months
Ended
September 30,
2015
(Unaudited) | | | Year
Ended
March 31,
2015 | |
FROM OPERATIONS | | | | | | |
Net investment income | | $ | 100,506 | | | $ | 730,888 | |
Net realized gains from security transactions | | | 7,770,631 | | | | 15,756,298 | |
Net change in unrealized appreciation/depreciation on investments | | | (46,679,240 | ) | | | 18,256,256 | |
Net increase (decrease) in net assets from operations | | | (38,808,103 | ) | | | 34,743,442 | |
| | | | | | | | | |
DISTRIBUTIONS TO SHAREHOLDERS | | | | | | | | |
From net investment income | | | — | | | | (3,196,404 | ) |
From net realized gains from security transactions | | | (5,709,533 | ) | | | (18,954,387 | ) |
Decrease in net assets from distributions to shareholders | | | (5,709,533 | ) | | | (22,150,791 | ) |
| | | | | | | | | |
FROM CAPITAL SHARE TRANSACTIONS | | | | | | | | |
Proceeds from shares sold | | | 64,761,005 | | | | 86,334,585 | |
Net asset value of shares issued in reinvestment of distributions to shareholders | | | 5,471,673 | | | | 21,241,419 | |
Payments for shares redeemed | | | (11,637,516 | ) | | | (16,954,232 | ) |
Net increase in net assets from capital share transactions | | | 58,595,162 | | | | 90,621,772 | |
| | | | | | | | | |
TOTAL INCREASE IN NET ASSETS | | | 14,077,526 | | | | 103,214,423 | |
| | | | | | | | | |
NET ASSETS | | | | | | | | |
Beginning of period | | | 277,703,482 | | | | 174,489,059 | |
End of period | | $ | 291,781,008 | | | $ | 277,703,482 | |
| | | | | | | | | |
ACCUMULATED NET INVESTMENT INCOME | | $ | 100,506 | | | $ | — | |
| | | | | | | | | |
CAPITAL SHARE ACTIVITY | | | | | | | | |
Shares sold | | | 3,951,583 | | | | 5,452,269 | |
Shares reinvested | | | 330,016 | | | | 1,376,196 | |
Shares redeemed | | | (732,918 | ) | | | (1,074,814 | ) |
Net increase in shares outstanding | | | 3,548,681 | | | | 5,753,651 | |
Shares outstanding at beginning of period | | | 16,721,556 | | | | 10,967,905 | |
Shares outstanding at end of period | | | 20,270,237 | | | | 16,721,556 | |
See accompanying notes to financial statements.
36
DAVENPORT SMALL CAP FOCUS FUND
STATEMENTS OF CHANGES IN NET ASSETS | |
| | Six Months
Ended
September 30,
2015
(Unaudited) | | | Period
Ended
March 31,
2015 (a) | |
FROM OPERATIONS | | | | | | |
Net investment loss | | $ | (41,691 | ) | | $ | (18,535 | ) |
Net realized gains (losses) from security transactions | | | (97,008 | ) | | | 63,308 | |
Net change in unrealized appreciation/depreciation on investments | | | (5,567,101 | ) | | | 1,134,928 | |
Net increase (decrease) in net assets from operations | | | (5,705,800 | ) | | | 1,179,701 | |
| | | | | | | | | |
DISTRIBUTIONS TO SHAREHOLDERS | | | | | | | | |
From net realized gains from security transactions | | | (37,962 | ) | | | — | |
| | | | | | | | | |
FROM CAPITAL SHARE TRANSACTIONS | | | | | | | | |
Proceeds from shares sold | | | 16,912,586 | | | | 30,137,020 | |
Net asset value of shares issued in reinvestment of distributions to shareholders | | | 36,932 | | | | — | |
Payments for shares redeemed | | | (2,656,716 | ) | | | (25,346 | ) |
Net increase in net assets from capital share transactions | | | 14,292,802 | | | | 30,111,674 | |
| | | | | | | | | |
TOTAL INCREASE IN NET ASSETS | | | 8,549,040 | | | | 31,291,375 | |
| | | | | | | | | |
NET ASSETS | | | | | | | | |
Beginning of period | | | 31,291,375 | | | | — | |
End of period | | $ | 39,840,415 | | | $ | 31,291,375 | |
| | | | | | | | | |
ACCUMULATED NET INVESTMENT INCOME (LOSS) | | $ | (34,864 | ) | | $ | 6,827 | |
| | | | | | | | | |
CAPITAL SHARE ACTIVITY | | | | | | | | |
Shares sold | | | 1,645,657 | | | | 3,008,657 | |
Shares reinvested | | | 3,504 | | | | — | |
Shares redeemed | | | (267,681 | ) | | | (2,525 | ) |
Net increase in shares outstanding | | | 1,381,480 | | | | 3,006,132 | |
Shares outstanding at beginning of period | | | 3,006,132 | | | | — | |
Shares outstanding at end of period | | | 4,387,612 | | | | 3,006,132 | |
(a) | Represents the period from the commencement of operations (December 31, 2014) through March 31, 2015. |
See accompanying notes to financial statements.
37
DAVENPORT CORE FUND
FINANCIAL HIGHLIGHTS | |
Selected Per Share Data and Ratios for a Share Outstanding Throughout Each Period | |
| | Six Months Ended Sept. 30, 2015(Unaudited) | | | Years Ended March 31, | |
| | | 2015 | | | | 2014 | | | | 2013 | | | | 2012 | | | | 2011 | |
Net asset value at beginning of period | | $ | 20.02 | | | $ | 19.30 | | | $ | 16.75 | | | $ | 15.00 | | | $ | 13.73 | | | $ | 12.05 | |
| | | | | | | | | | | | | | | | | | | | | | | | | |
Income (loss) from investment operations: | | | | | | | | | | | | | | | | | | | | | | | | |
Net investment income | | | 0.05 | | | | 0.10 | | | | 0.12 | | | | 0.11 | | | | 0.09 | | | | 0.07 | |
Net realized and unrealized gains (losses) on investments | | | (1.27 | ) | | | 2.20 | | | | 3.39 | | | | 1.75 | | | | 1.27 | | | | 1.68 | |
Total from investment operations | | | (1.22 | ) | | | 2.30 | | | | 3.51 | | | | 1.86 | | | | 1.36 | | | | 1.75 | |
| | | | | | | | | | | | | | | | | | | | | | | | | |
Less distributions: | | | | | | | | | | | | | | | | | | | | | | | | |
Dividends from net investment income | | | (0.05 | ) | | | (0.10 | ) | | | (0.12 | ) | | | (0.11 | ) | | | (0.09 | ) | | | (0.07 | ) |
Distributions from net realized gains | | | (0.37 | ) | | | (1.48 | ) | | | (0.84 | ) | | | — | | | | — | | | | — | |
Total distributions | | | (0.42 | ) | | | (1.58 | ) | | | (0.96 | ) | | | (0.11 | ) | | | (0.09 | ) | | | (0.07 | ) |
| | | | | | | | | | | | | | | | | | | | | | | | | |
Net asset value at end of period | | $ | 18.38 | | | $ | 20.02 | | | $ | 19.30 | | | $ | 16.75 | | | $ | 15.00 | | | $ | 13.73 | |
| | | | | | | | | | | | | | | | | | | | | | | | | |
Total return (a) | | | (6.21 | %)(b) | | | 12.42 | % | | | 21.32 | % | | | 12.47 | % | | | 9.99 | % | | | 14.61 | % |
| | | | | | | | | | | | | | | | | | | | | | | | | |
Net assets at end of period (000’s) | | $ | 317,807 | | | $ | 330,687 | | | $ | 281,231 | | | $ | 210,899 | | | $ | 174,898 | | | $ | 159,894 | |
| | | | | | | | | | | | | | | | | | | | | | | | | |
Ratio of total expenses to
average net assets | | | 0.91 | %(c) | | | 0.93 | % | | | 0.94 | % | | | 0.95 | % | | | 0.96 | % | | | 0.99 | % |
| | | | | | | | | | | | | | | | | | | | | | | | | |
Ratio of net investment income to
average net assets | | | 0.55 | %(c) | | | 0.49 | % | | | 0.64 | % | | | 0.71 | % | | | 0.66 | % | | | 0.58 | % |
| | | | | | | | | | | | | | | | | | | | | | | | | |
Portfolio turnover rate | | | 12 | %(b) | | | 21 | % | | | 29 | % | | | 26 | % | | | 19 | % | | | 34 | % |
(a) | Total return is a measure of the change in value of an investment in the Fund over the periods covered, which assumes any dividends or capital gains distributions are reinvested in shares of the Fund. Returns shown do not reflect the deduction of taxes a shareholder would pay on Fund distributions or the redemption of Fund shares. |
See accompanying notes to financial statements.
38
DAVENPORT VALUE & INCOME FUND
FINANCIAL HIGHLIGHTS | |
Selected Per Share Data and Ratios for a Share Outstanding Throughout Each Period | |
| | Six Months Ended
Sept. 30, 2015 (Unaudited) | | | Years Ended March 31, | | | Period
Ended
March 31, 2011 (a) | |
| | | 2015 | | | | 2014 | | | | 2013 | | | | 2012 | |
Net asset value at beginning of period | | $ | 15.46 | | | $ | 14.71 | | | $ | 13.18 | | | $ | 11.51 | | | $ | 10.50 | | | $ | 10.00 | |
| | | | | | | | | | | | | | | | | | | | | | | | | |
Income (loss) from investment operations: | | | | | | | | | | | | | | | | | | | | | | | | |
Net investment income | | | 0.16 | | | | 0.25 | | | | 0.30 | | | | 0.28 | | | | 0.23 | | | | 0.04 | |
Net realized and unrealized gains (losses) on investments | | | (1.37 | ) | | | 1.45 | | | | 2.04 | | | | 1.81 | | | | 1.02 | | | | 0.49 | |
Total from investment operations | | | (1.21 | ) | | | 1.70 | | | | 2.34 | | | | 2.09 | | | | 1.25 | | | | 0.53 | |
| | | | | | | | | | | | | | | | | | | | | | | | | |
Less distributions: | | | | | | | | | | | | | | | | | | | | | | | | |
Dividends from net investment income | | | (0.16 | ) | | | (0.25 | ) | | | (0.29 | ) | | | (0.27 | ) | | | (0.23 | ) | | | (0.03 | ) |
Distributions from net realized gains | | | (0.41 | ) | | | (0.70 | ) | | | (0.52 | ) | | | (0.15 | ) | | | (0.01 | ) | | | — | |
Total distributions | | | (0.57 | ) | | | (0.95 | ) | | | (0.81 | ) | | | (0.42 | ) | | | (0.24 | ) | | | (0.03 | ) |
| | | | | | | | | | | | | | | | | | | | | | | | | |
Net asset value at end of period | | $ | 13.68 | | | $ | 15.46 | | | $ | 14.71 | | | $ | 13.18 | | | $ | 11.51 | | | $ | 10.50 | |
| | | | | | | | | | | | | | | | | | | | | | | | | |
Total return (b) | | | (8.16% | )(c) | | | 11.92 | % | | | 18.25 | % | | | 18.69 | % | | | 12.23 | % | | | 5.35 | %(c) |
| | | | | | | | | | | | | | | | | | | | | | | | | |
Net assets at end of period (000’s) | | $ | 401,411 | | | $ | 407,777 | | | $ | 304,288 | | | $ | 196,890 | | | $ | 98,757 | | | $ | 48,831 | |
| | | | | | | | | | | | | | | | | | | | | | | | | |
Ratio of total expenses to
average net assets | | | 0.91 | %(d) | | | 0.92 | % | | | 0.94 | % | | | 0.96 | % | | | 1.04 | % | | | 1.25 | %(d) |
| | | | | | | | | | | | | | | | | | | | | | | | | |
Ratio of net investment income to
average net assets | | | 2.13 | %(d) | | | 1.66 | % | | | 2.22 | % | | | 2.37 | % | | | 2.30 | % | | | 1.99 | %(d) |
| | | | | | | | | | | | | | | | | | | | | | | | | |
Portfolio turnover rate | | | 13 | %(c) | | | 23 | % | | | 32 | % | | | 29 | % | | | 27 | % | | | 10 | %(c) |
(a) | Represents the period from commencement of operations (December 31, 2010) through March 31, 2011. |
(b) | Total return is a measure of the change in value of an investment in the Fund over the periods covered, which assumes any dividends or capital gains distributions are reinvested in shares of the Fund. Returns shown do not reflect the deduction of taxes a shareholder would pay on Fund distributions or the redemption of Fund shares. |
See accompanying notes to financial statements.
39
DAVENPORT EQUITY OPPORTUNITIES FUND
FINANCIAL HIGHLIGHTS | |
Selected Per Share Data and Ratios for a Share Outstanding Throughout Each Period | |
| | Six Months
Ended
Sept. 30,
2015
(Unaudited) | | | Years Ended March 31, | | | Period
Ended
March 31,
2011 (a) | |
| | | 2015 | | | | 2014 | | | | 2013 | | | | 2012 | |
Net asset value at beginning of period | | $ | 16.61 | | | $ | 15.91 | | | $ | 13.86 | | | $ | 11.96 | | | $ | 10.72 | | | $ | 10.00 | |
| | | | | | | | | | | | | | | | | | | | | | | | | |
Income (loss) from investment operations: | | | | | | | | | | | | | | | | | | | | | | | | |
Net investment income (loss) | | | 0.01 | | | | 0.04 | | | | 0.24 | | | | 0.03 | | | | (0.02 | ) | | | (0.01 | ) |
Net realized and unrealized gains (losses) on investments | | | (1.92 | ) | | | 2.42 | | | | 2.65 | | | | 2.17 | | | | 1.30 | | | | 0.73 | |
Total from investment operations | | | (1.91 | ) | | | 2.46 | | | | 2.89 | | | | 2.20 | | | | 1.28 | | | | 0.72 | |
| | | | | | | | | | | | | | | | | | | | | | | | | |
Less distributions: | | | | | | | | | | | | | | | | | | | | | | | | |
Dividends from net investment income | | | — | | | | (0.26 | ) | | | (0.02 | ) | | | (0.02 | ) | | | — | | | | — | |
Distributions from net realized gains | | | (0.31 | ) | | | (1.50 | ) | | | (0.82 | ) | | | (0.28 | ) | | | (0.04 | ) | | | — | |
Total distributions | | | (0.31 | ) | | | (1.76 | ) | | | (0.84 | ) | | | (0.30 | ) | | | (0.04 | ) | | | — | |
| | | | | | | | | | | | | | | | | | | | | | | | | |
Net asset value at end of period | | $ | 14.39 | | | $ | 16.61 | | | $ | 15.91 | | | $ | 13.86 | | | $ | 11.96 | | | $ | 10.72 | |
| | | | | | | | | | | | | | | | | | | | | | | | | |
Total return (b) | | | (11.75 | %)(c) | | | 16.67 | % | | | 21.57 | % | | | 18.77 | % | | | 12.00 | % | | | 7.20 | %(c) |
| | | | | | | | | | | | | | | | | | | | | | | | | |
Net assets at end of period (000’s) | | $ | 291,781 | | | $ | 277,703 | | | $ | 174,489 | | | $ | 102,679 | | | $ | 59,135 | | | $ | 34,375 | |
| | | | | | | | | | | | | | | | | | | | | | | | | |
Ratio of total expenses to
average net assets | | | 0.93 | %(d) | | | 0.96 | % | | | 0.97 | % | | | 1.01 | % | | | 1.10 | % | | | 1.25 | %(d) |
| | | | | | | | | | | | | | | | | | | | | | | | | |
Ratio of net investment income
(loss) to average net assets | | | 0.07 | %(d) | | | 0.33 | % | | | 1.96 | % | | | 0.23 | % | | | (0.22 | %) | | | (0.40 | %)(d) |
| | | | | | | | | | | | | | | | | | | | | | | | | |
Portfolio turnover rate | | | 20 | %(c) | | | 31 | % | | | 49 | % | | | 41 | % | | | 35 | % | | | 6 | %(c) |
(a) | Represents the period from commencement of operations (December 31, 2010) through March 31, 2011. |
(b) | Total return is a measure of the change in value of an investment in the Fund over the periods covered, which assumes any dividends or capital gains distributions are reinvested in shares of the Fund. Returns shown do not reflect the deduction of taxes a shareholder would pay on Fund distributions or the redemption of Fund shares. |
See accompanying notes to financial statements.
40
DAVENPORT SMALL CAP FOCUS FUND
FINANCIAL HIGHLIGHTS | |
Selected Per Share Data and Ratios for a Share Outstanding Throughout Each Period | |
| | Six Months
Ended
Sept. 30,
2015
(Unaudited) | | | Period
Ended
March 31,
2015 (a) | |
Net asset value at beginning of period | | $ | 10.41 | | | $ | 10.00 | |
| | | | | | | | | |
Income (loss) from investment operations: | | | | | | | | |
Net investment loss | | | (0.01 | ) | | | (0.01 | ) |
Net realized and unrealized gains (losses) on investments | | | (1.31 | ) | | | 0.42 | |
Total from investment operations | | | (1.32 | ) | | | 0.41 | |
| | | | | | | | | |
Less distributions: | | | | | | | | |
Distributions from net realized gains | | | (0.01 | ) | | | — | |
| | | | | | | | | |
Net asset value at end of period | | $ | 9.08 | | | $ | 10.41 | |
| | | | | | | | | |
Total return (b) | | | (12.69% | )(c) | | | 4.10 | %(c) |
| | | | | | | | | |
Net assets at end of period (000’s) | | $ | 39,840 | | | $ | 31,291 | |
| | | | | | | | | |
Ratio of total expenses to average net assets | | | 1.18 | %(d) | | | 1.42 | %(d) |
| | | | | | | | | |
Ratio of net expenses to average net assets | | | 1.18 | %(d) | | | 1.25 | %(d)(e) |
| | | | | | | | | |
Ratio of net investment loss to average net assets | | | (0.21 | %)(d) | | | (0.30 | %)(d)(e) |
| | | | | | | | | |
Portfolio turnover rate | | | 27 | %(c) | | | 15 | %(c) |
(a) | Represents the period from commencement of operations (December 31, 2014) through March 31, 2015. |
(b) | Total return is a measure of the change in value of an investment in the Fund over the periods covered, which assumes any dividends or capital gains distributions are reinvested in shares of the Fund. The returns shown do not reflect the deduction of taxes a shareholder would pay on Fund distributions or the redemption of Fund shares. |
(e) | Ratio was determined after advisory fee reductions (Note 4). |
See accompanying notes to financial statements.
41
THE DAVENPORT FUNDS
NOTES TO FINANCIAL STATEMENTS
September 30, 2015 (Unaudited)
1. Organization
Davenport Core Fund, Davenport Value & Income Fund, Davenport Equity Opportunities Fund and Davenport Small Cap Focus Fund (individually, a “Fund,” and, collectively, the “Funds”) are each a no-load series of the Williamsburg Investment Trust (the “Trust”), an open-end management investment company registered under the Investment Company Act of 1940. The Trust was organized as a Massachusetts business trust on July 18, 1988. Other series of the Trust are not incorporated in this report. Davenport Core Fund began operations on January 15, 1998. Davenport Value & Income Fund and Davenport Equity Opportunities Fund each began operations on December 31, 2010. Davenport Small Cap Focus Fund began operations on December 31, 2014.
Davenport Core Fund’s investment objective is long term growth of capital.
Davenport Value & Income Fund’s investment objective is to achieve long term growth while generating current income through dividend payments on portfolio securities.
Davenport Equity Opportunities Fund’s investment objective is long term capital appreciation.
Davenport Small Cap Focus Fund’s investment objective is long term capital appreciation.
Davenport Core Fund and Davenport Value & Income Fund are each classified as a diversified fund. Davenport Equity Opportunities Fund and Davenport Small Cap Focus Fund are each classified as a non-diversified fund.
2. Significant Accounting Policies
As an investment company, as defined in Financial Accounting Standards Board (“FASB”) Accounting Standards Update 2013-08, the Funds follow accounting and reporting guidance under FASB Accounting Standards Codification Topic 946, “Financial Services – Investment Companies.” The following is a summary of the Funds’ significant accounting policies. The policies are in conformity with accounting principles generally accepted in the United States of America (“GAAP”).
Securities valuation — The Funds’ portfolio securities are valued as of the close of business of the regular session of the New York Stock Exchange (normally 4:00 p.m., Eastern time). Securities traded on a national stock exchange are valued based upon the closing price on the principal exchange where the security is traded, if available, otherwise, at the last quoted bid price. Securities which are quoted by NASDAQ are valued at the NASDAQ Official Closing Price. Investments representing shares of other investment companies are valued at their net asset value as reported by such companies.
42
THE DAVENPORT FUNDS
NOTES TO FINANCIAL STATEMENTS (Continued)
Fixed income securities are typically valued on the basis of prices provided by an independent pricing service. The prices provided by the pricing service are determined with consideration given to institutional bid and last sale prices and take into account securities prices, yields, maturities, call features, ratings, institutional trading in similar groups of securities and developments related to specific securities.
When market quotations are not readily available, if a pricing service cannot provide a price or the investment adviser believes the price received from the pricing service is not indicative of market value, securities will be valued in good faith at fair value using methods consistent with procedures adopted by the Board of Trustees and will be classified as Level 2 or 3 within the fair value hierarchy (see below), depending on the inputs used. Such methods of fair valuation may include, but are not limited to: multiple of earnings, multiple of book value, discount from market of a similar freely traded security, purchase price of the security, subsequent private transactions in the security or related securities, or a combination of these and other factors.
GAAP establishes a single authoritative definition of fair value, sets out a framework for measuring fair value and requires additional disclosures about fair value measurements.
Various inputs are used in determining the value of the Funds’ investments. These inputs are summarized in the three broad levels listed below:
● Level 1 – quoted prices in active markets for identical securities
● Level 2 – other significant observable inputs
● Level 3 – significant unobservable inputs
The inputs or methodology used for valuing securities are not necessarily an indication of the risks associated with investing in those securities. The inputs used to measure fair value may fall into different levels of the fair value hierarchy. In such cases, for disclosure purposes, the level in the fair value hierarchy within which the fair value measurement falls in its entirety is determined based on the lowest level input that is significant to the fair value measurement.
The following is a summary of the inputs used to value the Funds’ investments as of September 30, 2015 by security type:
Davenport Core Fund | | Level 1 | | | Level 2 | | | Level 3 | | | Total | |
Common Stocks | | $ | 298,971,601 | | | $ | — | | | $ | — | | | $ | 298,971,601 | |
Money Market Funds | | | 5,895,704 | | | | — | | | | — | | | | 5,895,704 | |
Total | | $ | 304,867,305 | | | $ | — | | | $ | — | | | $ | 304,867,305 | |
Davenport Value & Income Fund | | Level 1 | | | Level 2 | | | Level 3 | | | Total | |
Common Stocks | | $ | 374,808,913 | | | $ | — | | | $ | — | | | $ | 374,808,913 | |
Exchange-Traded Funds | | | 10,959,614 | | | | — | | | | — | | | | 10,959,614 | |
Money Market Funds | | | 11,585,942 | | | | — | | | | — | | | | 11,585,942 | |
Total | | $ | 397,354,469 | | | $ | — | | | $ | — | | | $ | 397,354,469 | |
43
THE DAVENPORT FUNDS
NOTES TO FINANCIAL STATEMENTS (Continued)
Davenport Equity Opportunities Fund | | Level 1 | | | Level 2 | | | Level 3 | | | Total | |
Common Stocks | | $ | 270,855,635 | | | $ | — | | | $ | — | | | $ | 270,855,635 | |
Money Market Funds | | | 8,151,436 | | | | — | | | | — | | | | 8,151,436 | |
Total | | $ | 279,007,071 | | | $ | — | | | $ | — | | | $ | 279,007,071 | |
Davenport Small Cap Focus Fund | | Level 1 | | | Level 2 | | | Level 3 | | | Total | |
Common Stocks | | $ | 36,366,957 | | | $ | — | | | $ | — | | | $ | 36,366,957 | |
Money Market Funds | | | 3,432,577 | | | | — | | | | — | | | | 3,432,577 | |
Total | | $ | 39,799,534 | | | $ | — | | | $ | — | | | $ | 39,799,534 | |
Refer to each Fund’s Schedule of Investments for a listing of the securities by sector type. As of September 30, 2015, the Funds did not have any transfers into and out of any Level. There were no Level 2 or Level 3 securities or derivative instruments held by the Funds as of September 30, 2015. It is the Funds’ policy to recognize transfers into and out of any Level at the end of the reporting period.
Share valuation — The net asset value per share of each Fund is calculated daily by dividing the total value of its assets, less liabilities, by the number of shares outstanding. The offering price and redemption price per share of each Fund is equal to the net asset value per share.
Investment income — Interest income is accrued as earned. Dividend income is recorded on the ex-dividend date. Discounts and premiums on fixed-income securities are amortized using the interest method.
Security transactions — Security transactions are accounted for on trade date for financial reporting purposes. Gains and losses on securities sold are determined on a specific identification basis.
Common expenses — Common expenses of the Trust are allocated among the series of the Trust based on relative net assets of each series or the nature of the services performed and the relative applicability to each series.
Distributions to shareholders — Dividends arising from net investment income, if any, are declared and paid quarterly to shareholders of Davenport Core Fund, Davenport Value & Income Fund and Davenport Small Cap Focus Fund; and declared and paid semi-annually to shareholders of Davenport Equity Opportunities Fund. Net realized short-term capital gains, if any, may be distributed throughout the year and net realized long-term capital gains, if any, are distributed at least once each year. The amount of distributions from net investment income and net realized gains are determined in accordance with federal income tax regulations which may differ from GAAP. Dividends and distributions are recorded on the ex-dividend date.
44
THE DAVENPORT FUNDS
NOTES TO FINANCIAL STATEMENTS (Continued)
The tax character of distributions paid during the periods ended September 30, 2015 and March 31, 2015 is as follows:
| Period
Ended | | Ordinary
Income | | | Long-Term
Capital Gains | | | Total
Distributions | |
Davenport Core Fund | 9/30/15 | | $ | 892,505 | | | $ | 6,233,547 | | | $ | 7,126,052 | |
| | 3/31/15 | | $ | 2,802,392 | | | $ | 21,116,652 | | | $ | 23,919,044 | |
Davenport Value & Income Fund | 9/30/15 | | $ | 4,826,579 | | | $ | 10,697,938 | | | $ | 15,524,517 | |
| | 3/31/15 | | $ | 7,486,896 | | | $ | 14,265,278 | | | $ | 21,752,174 | |
Davenport Equity Opportunities Fund | 9/30/15 | | $ | 346,144 | | | $ | 5,363,389 | | | $ | 5,709,533 | |
| | 3/31/15 | | $ | 10,493,395 | | | $ | 11,657,396 | | | $ | 22,150,791 | |
Davenport Small Cap Focus Fund | 9/30/15 | | $ | 37,962 | | | $ | — | | | $ | 37,962 | |
| | 3/31/15 | | $ | — | | | $ | — | | | $ | — | |
Estimates — The preparation of financial statements in conformity with GAAP requires management to make estimates and assumptions that affect the reported amounts of assets and liabilities and disclosure of contingent assets and liabilities as of the date of the financial statements and the reported amounts of income and expenses during the reporting period. Actual results could differ from those estimates.
Federal income tax — Each Fund has qualified and intends to continue to qualify as a regulated investment company under the Internal Revenue Code of 1986 (the “Code”). Qualification generally will relieve the Funds of liability for federal income taxes to the extent 100% of their net investment income and net realized capital gains are distributed in accordance with the Code. Accordingly, no provision for income tax has been made.
In order to avoid imposition of the excise tax applicable to regulated investment companies, it is also each Fund’s intention to declare as dividends in each calendar year at least 98% of its net investment income (earned during the calendar year) and 98.2% of its net realized capital gains (earned during the twelve months ended October 31) plus undistributed amounts from prior years.
45
THE DAVENPORT FUNDS
NOTES TO FINANCIAL STATEMENTS (Continued)
The following information is computed on a tax basis for each item as of September 30, 2015:
| | Davenport
Core Fund | | | Davenport
Value &
Income Fund | | | Davenport
Equity
Opportunities
Fund | | | Davenport
Small Cap Focus
Fund | |
Cost of portfolio investments | | $ | 236,624,058 | | | $ | 380,541,488 | | | $ | 279,209,894 | | | $ | 44,222,240 | |
Gross unrealized appreciation | | $ | 82,325,323 | | | $ | 47,517,281 | | | $ | 33,541,050 | | | $ | 1,202,968 | |
Gross unrealized depreciation | | | (14,082,076 | ) | | | (30,704,300 | ) | | | (33,743,873 | ) | | | (5,625,674 | ) |
Net unrealized appreciation
(depreciation) | | | 68,243,247 | | | | 16,812,981 | | | | (202,823 | ) | | | (4,422,706 | ) |
Accumulated ordinary income (loss) | | | 28,331 | | | | 396,586 | | | | 100,506 | | | | (44,331 | ) |
Other capital gains (losses) | | | 9,937,517 | | | | 9,131,871 | | | | 7,770,611 | | | | (97,024 | ) |
Accumulated earnings (deficit) | | $ | 78,209,095 | | | $ | 26,341,438 | | | $ | 7,668,294 | | | $ | (4,564,061 | ) |
The difference between the federal income tax cost of portfolio investments and the financial statement cost for each Fund is due to certain timing differences in the recognition of capital gains and losses under income tax regulations and GAAP. These timing differences are temporary in nature and are due to the tax deferral of losses on wash sales and/or adjustments to basis on publicly traded partnerships.
During the six month ended September 30, 2015, Davenport Value & Income Fund has reclassified $201 of distributions in excess of net realized gains against accumulated net investment income on the Statement of Assets and Liabilities. Such reclassification, the result of permanent differences between the financial statement and income tax reporting requirements, has no effect on the Fund’s net assets or net asset value per share.
The Funds recognize the tax benefits or expenses of uncertain tax positions only when the position is “more likely than not” to be sustained assuming examination by tax authorities. Management has reviewed the tax positions taken on Federal income tax returns for the current and all applicable open tax years (tax years ended March 31, 2012 through March 31, 2015) of each Fund and has concluded that no provision for unrecognized tax benefits or expenses is required in these financial statements.
46
THE DAVENPORT FUNDS
NOTES TO FINANCIAL STATEMENTS (Continued)
3. Investment Transactions
Investment transactions, other than short-term investments and U.S. government securities, were as follows for the six months ended September 30, 2015:
| | Davenport
Core Fund | | | Davenport
Value &
Income Fund | | | Davenport Equity Opportunities Fund | | | Davenport
Small Cap
Focus Fund | |
Purchases of investment securities | | $ | 42,444,909 | | | $ | 82,193,389 | | | $ | 99,129,679 | | | $ | 24,934,535 | |
Proceeds from sales and maturities of investment securities | | $ | 38,929,272 | | | $ | 51,998,451 | | | $ | 58,143,010 | | | $ | 9,246,864 | |
4. Transactions with Related Parties
INVESTMENT ADVISORY AGREEMENTS
Each Fund’s investments are managed by Davenport & Company LLC (the “Adviser”) under the terms of an Investment Advisory Agreement. Under the Investment Advisory Agreement, each Fund pays the Adviser a fee, which is computed and accrued daily and paid monthly, at an annual rate of .75% on its average daily net assets. Certain officers of the Trust are also officers of the Adviser.
The Adviser has agreed, until August 1, 2016, to reduce its investment advisory fees and to reimburse other operating expenses to the extent necessary to limit total annual fund operating expenses (excluding acquired fund fees and expenses) of Davenport Small Cap Focus Fund to an amount not exceeding 1.25% of the Fund’s average daily net assets. Any such fee reductions by the Adviser, or payments by the Adviser of expenses which are Davenport Small Cap Focus Fund’s obligation, are subject to repayment by the Fund for a period of three years from the end of the fiscal year when such fee reductions or reimbursements occurred, provided the Fund is able to effect such repayment and remain in compliance with the undertaking by the Adviser to limit expenses of the Fund. During the six months ended September 30, 2015, the Adviser recouped from Davenport Small Cap Focus Fund $10,744 of previous fee reductions. As of September 30, 2015, all advisory fee reductions and expense reimbursements have been repaid to the Adviser by Davenport Small Cap Focus Fund.
OTHER SERVICE PROVIDERS
Ultimus Fund Solutions, LLC (“Ultimus”) provides fund administration, fund accounting, compliance and transfer agent services to the Funds. The Funds pay Ultimus fees in accordance with the agreements for such services. In addition, the Funds pay out-of-pocket expenses including, but not limited to, postage, supplies, and costs of pricing the Funds’ portfolio securities. Certain officers of the Trust are also officers of Ultimus, or of Ultimus Fund Distributors, LLC (the “Distributor”), the principal underwriter of each Fund’s shares and an affiliate of Ultimus. The Distributor is compensated by the Adviser (not the Funds) for acting as principal underwriter.
47
THE DAVENPORT FUNDS
NOTES TO FINANCIAL STATEMENTS (Continued)
COMPENSATION OF TRUSTEES
Trustees and officers affiliated with an investment adviser to the Trust or Ultimus are not compensated by the Trust for their services. Each Trustee who is not an affiliated person of an investment adviser or Ultimus receives from the Trust an annual retainer of $12,000, payable quarterly; a fee of $1,500 for attendance at each meeting of the Board of Trustees (except that such fee is $2,500 for the independent chairman); and a fee of $1,000 for attendance at each meeting of any committee of the Board (except that such fee is $1,500 for the committee chairman); plus reimbursement of travel and other expenses incurred in attending meetings.
5. Sector Risk
If a Fund has significant investments in the securities of issuers in industries within a particular sector, any development affecting that sector will have a greater impact on the value of the net assets of the Fund than would be the case if the Fund did not have significant investments in that sector. In addition, this may increase the risk of loss of an investment in the Fund and increase the volatility of the Fund’s net asset value per share. From time to time, circumstances may affect a particular sector and the companies within such sector. For instance, economic or market factors, regulation or deregulation, or other developments may negatively impact all companies in a particular sector and therefore the value of a Fund’s portfolio would be adversely affected. As of September 30, 2015, Davenport Value & Income Fund had 28.7% of the value of its net assets invested in stocks within the Financials sector and Davenport Equity Opportunities Fund had 34.1% and 33.1% of the value of its net assets invested in stocks within the Consumer Discretionary sector and Financials sector, respectively.
6. Contingencies and Commitments
The Funds indemnify the Trust’s officers and Trustees for certain liabilities that might arise from their performance of their duties to the Funds. Additionally, in the normal course of business the Funds enter into contracts that contain a variety of representations and warranties and which provide general indemnifications. The Funds’ maximum exposure under these arrangements is unknown, as this would involve future claims that may be made against the Funds that have not yet occurred. However, based on experience, the Funds expect the risk of loss to be remote.
7. Subsequent Events
The Funds are required to recognize in the financial statements the effects of all subsequent events that provide additional evidence about conditions that existed as of the date of the Statements of Assets and Liabilities. For non-recognized subsequent events that must be disclosed to keep the financial statements from being misleading, the Funds are required to disclose the nature of the event as well as an estimate of its financial effect, or a statement that such an estimate cannot be made. Management has evaluated subsequent events through the issuance of these financial statements and has noted no such events.
48
THE DAVENPORT FUNDS
YOUR FUNDS’ EXPENSES (Unaudited)
We believe it is important for you to understand the impact of costs on your investment. All mutual funds have operating expenses. As a shareholder of the Funds, you incur ongoing costs, including management fees and other expenses. These ongoing costs, which are deducted from each Fund’s gross income, directly reduce the investment return of the Funds.
A mutual fund’s ongoing costs are expressed as a percentage of its average net assets. This figure is known as the expense ratio. The following examples are intended to help you understand the ongoing costs (in dollars) of investing in the Funds and to compare these costs with the ongoing costs of investing in other mutual funds. The examples below are based on an investment of $1,000 made at the beginning of the period shown and held for the entire period (April 1, 2015 through September 30, 2015).
The table below illustrates each Fund’s ongoing costs in two ways:
Actual fund return – This section helps you to estimate the actual expenses that you paid over the period. The “Ending Account Value” shown is derived from each Fund’s actual return, and the third column shows the dollar amount of operating expenses that would have been paid by an investor who started with $1,000 in the Funds. You may use the information here, together with the amount you invested, to estimate the expenses that you paid over the period.
To do so, simply divide your account value by $1,000 (for example, an $8,600 account value divided by $1,000 = 8.6), then multiply the result by the number given for the Funds under the heading “Expenses Paid During Period.”
Hypothetical 5% return – This section is intended to help you compare each Fund’s ongoing costs with those of other mutual funds. It assumes that each Fund had an annual return of 5% before expenses during the period shown, but that the expense ratio is unchanged. In this case, because the return used is not each Fund’s actual return, the results do not apply to your investment. The example is useful in making comparisons because the Securities and Exchange Commission (“SEC”) requires all mutual funds to calculate expenses based on a 5% return. You can assess each Fund’s ongoing costs by comparing this hypothetical example with the hypothetical examples that appear in shareholder reports of other funds.
Note that expenses shown in the table are meant to highlight and help you compare ongoing costs only. The Funds do not charge sales loads or redemption fees.
The calculations assume no shares were bought or sold during the period. Your actual costs may have been higher or lower, depending on the amount of your investment and the timing of any purchases or redemptions.
49
THE DAVENPORT FUNDS
YOUR FUNDS’ EXPENSES (Unaudited) (Continued)
More information about each Fund’s expenses, including historical annual expense ratios, can be found in this report. For additional information on operating expenses and other shareholder costs, please refer to the Funds’ prospectus.
| Beginning
Account Value
April 1, 2015 | Ending
Account Value
Sept. 30, 2015 | Net Expense
Ratio(a) | Expenses Paid
During Period(b) |
Davenport Core Fund | | | | |
Based on Actual Fund Return | $1,000.00 | $937.90 | 0.91% | $4.42 |
Based on Hypothetical 5% Return (before expenses) | $1,000.00 | $1,020.51 | 0.91% | $4.61 |
Davenport Value & Income Fund | | | | |
Based on Actual Fund Return | $1,000.00 | $918.40 | 0.91% | $4.38 |
Based on Hypothetical 5% Return (before expenses) | $1,000.00 | $1,020.51 | 0.91% | $4.61 |
Davenport Equity Opportunities Fund | | | |
Based on Actual Fund Return | $1,000.00 | $882.50 | 0.93% | $4.39 |
Based on Hypothetical 5% Return (before expenses) | $1,000.00 | $1,020.41 | 0.93% | $4.71 |
Davenport Small Cap Focus Fund |
Based on Actual Fund Return | $1,000.00 | $873.10 | 1.18% | $5.54 |
Based on Hypothetical 5% Return (before expenses) | $1,000.00 | $1,019.15 | 1.18% | $5.97 |
(a) | Annualized, based on the Fund’s most recent one-half year expenses. |
(b) | Expenses are equal to the Fund’s annualized expense ratio multiplied by the average account value over the period, multiplied by 183/365 (to reflect the one-half year period). |
50
THE DAVENPORT FUNDS
OTHER INFORMATION (Unaudited) |
A description of the policies and procedures that the Funds use to vote proxies relating to portfolio securities is available without charge upon request by calling toll-free 1-800-281-3217, or on the SEC’s website at http://www.sec.gov. Information regarding how the Funds voted proxies relating to portfolio securities during the most recent 12-month period ended June 30 is also available without charge upon request by calling toll-free 1-800-281-3217, or on the SEC’s website at http://www.sec.gov.
The Trust files a complete listing of portfolio holdings for the Funds with the SEC as of the end of the first and third quarters of each fiscal year on Form N-Q. These filings are available upon request by calling 1-800-281-3217. Furthermore, you may obtain a copy of these filings on the SEC’s website at http://www.sec.gov. The Trust’s Forms N-Q may also be reviewed and copied at the SEC’s Public Reference Room in Washington, DC, and information on the operation of the Public Reference Room may be obtained by calling 1-800-SEC-0330.
A complete listing of portfolio holdings for the Funds is updated daily and can be reviewed at the Funds’ website at http://www.investdavenport.com.
51
DAVENPORT SMALL CAP FOCUS FUND
DISCLOSURE REGARDING APPROVAL OF
INVESTMENT ADVISORY AGREEMENT (Unaudited)
The Board of Trustees, including the Independent Trustees voting separately, reviewed and approved the Investment Advisory Agreement with the Adviser on behalf of Davenport Small Cap Focus Fund (the “Small Cap Fund”) at an in-person meeting held on October 7, 2014. The Trustees were advised by independent counsel of their fiduciary obligations in approving the Investment Advisory Agreement and the Trustees requested such information from the Adviser as they deemed reasonably necessary to evaluate the terms of the Investment Advisory Agreement and whether the Agreement is in the best interests of the Small Cap Fund.
The Trustees reviewed the investment objective and principal investment strategies of the Small Cap Fund. The Trustees considered the research and portfolio management process for the Small Cap Fund and noted that the Adviser will utilize strategies similar to those that are currently being applied in its existing products, but that the Fund’s overall portfolio will be highly differentiated from the Adviser’s other product offerings. The Trustees considered the security selection process for the Small Cap Fund and noted that the Fund will not be limited to a particular investment style (i.e., “growth” or “value”), but will have the ability to invest in stocks that are believed to be undervalued, as well as stocks with above average long-term earnings growth potential. The Trustees reviewed the background, education and experience of Messrs. George L. Smith, III, CFA and Christopher G. Pearson, CFA, who will manage the Small Cap Fund on a day-to-day basis, subject to the oversight of the Adviser’s Investment Policy Committee.
The Trustees were provided with copies of the proposed Investment Advisory Agreement for the Small Cap Fund and reviewed the services to be provided by the Adviser and the responsibilities of the Adviser under such Agreement. The Adviser proposed that the advisory fee for the Small Cap Fund be 0.75% per annum of its average daily net assets, and the Trustees noted that this is the same advisory fee rate paid by Davenport Core Fund, Davenport Value & Income Fund and Davenport Equity Opportunities Fund.
The Trustees evaluated and discussed the background, duties and responsibilities of the members of the Adviser’s Investment Policy Committee and other personnel who will perform services for the Small Cap Fund; the financial condition of the Adviser as of July 31, 2014 and its insurance coverage; the Adviser’s projected profitability from the Investment Advisory Agreement; the proposed advisory fees for the Small Cap Fund as compared to similarly managed mutual funds; the Small Cap Fund’s projected expense ratio as compared to similarly managed mutual funds; the Adviser’s plans for marketing and distributing shares of the Small Cap Fund; and the indirect benefits that the Adviser expects to receive as a result of the Investment Advisory Agreement. The Trustees discussed the nature, extent and quality of the services to be provided by the Adviser and noted that they are familiar with the Adviser’s qualifications and responsibilities as a mutual fund investment manager and that the Adviser has established a history of care and consistency in its investment approach. The Trustees were mindful that the investment processes that will be used by the Adviser in managing the Small Cap Fund will incorporate some of the processes that Davenport has successfully used to manage other Davenport Funds and separately managed
52
DAVENPORT SMALL CAP FOCUS FUND
DISCLOSURE REGARDING APPROVAL OF
INVESTMENT ADVISORY AGREEMENT (Unaudited)
(Continued)
accounts. Having reviewed detailed information about the investment processes for the Small Cap Fund, the Board concluded that it was satisfied with the nature, extent and quality of the investment advisory services that will be provided by the Adviser to the Small Cap Fund.
After considering the comparative information regarding advisory fees and expense ratios for the Morningstar universe of small capitalization funds, it was the consensus of the Trustees that the proposed investment advisory fee and projected total expense ratio for the Small Cap Fund are reasonable as compared to the average fees and expense ratios of similarly situated funds. The Board concluded that the proposed advisory fee for the Small Cap Fund is reasonable in relation to the nature of the investment programs and the level of services to be provided by the Adviser.
No single factor was considered in isolation or to be determinative to the decision of the Trustees to approve the Investment Advisory Agreement. Rather, the Trustees concluded, in light of a weighing and balancing of all factors considered, that approval of the Investment Advisory Agreement would be in the best interests of the Small Cap Fund.
53
FACTS | WHAT DO THE DAVENPORT FUNDS DO WITH YOUR PERSONAL INFORMATION? |
| | | | |
Why? | Financial companies choose how they share your personal information. Federal law gives consumers the right to limit some but not all sharing. Federal law also requires us to tell you how we collect, share, and protect your personal information. Please read this notice carefully to understand what we do. |
| | | | |
What? | The types of personal information we collect and share depend on the product or service you have with us. This information can include: ■ Social Security number ■ Assets ■ Retirement Assets ■ Transaction History ■ Checking Account Information ■ Purchase History ■ Account Balances ■ Account Transactions ■ Wire Transfer Instructions When you are no longer our customer, we continue to share your information as described in this notice. |
| | | | |
How? | All financial companies need to share your personal information to run their everyday business. In the section below, we list the reasons financial companies can share their customers’ personal information; the reasons The Davenport Funds choose to share; and whether you can limit this sharing. |
| | | | |
Reasons we can share your personal information | Do The Davenport Funds share? | Can you limit this sharing? |
For our everyday business purposes – Such as to process your transactions, maintain your account(s), respond to court orders and legal investigations, or report to credit bureaus | Yes | No |
For our marketing purposes – to offer our products and services to you | No | We don’t share |
For joint marketing with other financial companies | No | We don’t share |
For our affiliates’ everyday business purposes – information about your creditworthiness | No | We don’t share |
For nonaffiliates to market to you | No | We don’t share |
| | | | |
Questions? | Call 1-800-281-3217 |
54
Who we are |
Who is providing this notice? | Williamsburg Investment Trust Ultimus Fund Distributors, LLC Ultimus Fund Solutions, LLC |
What we do |
How do The Davenport Funds protect my personal information? | To protect your personal information from unauthorized access and use, we use security measures that comply with federal law. These measures include computer safeguards and secured files and buildings. Our service providers are held accountable for adhering to strict policies and procedures to prevent any misuse of your nonpublic personal information. |
How do The Davenport Funds collect my personal information? | We collect your personal information, for example, when you ■ Provide account information ■ Give us your contact information ■ Make deposits or withdrawals from your account ■ Make a wire transfer ■ Tell us where to send the money ■ Tell us who receives the money ■ Show your government-issued ID ■ Show your driver’s license We also collect your personal information from other companies. |
Why can’t I limit all sharing? | Federal law gives you the right to limit only ■ Sharing for affiliates’ everyday business purposes – information about your creditworthiness ■ Affiliates from using your information to market to you ■ Sharing for nonaffiliates to market to you State laws and individual companies may give you additional rights to limit sharing. |
| | |
Definitions |
Affiliates | Companies related by common ownership or control. They can be financial and nonfinancial companies. ■ Davenport & Company LLC, the investment adviser to The Davenport Funds, could be deemed to be an affiliate. |
Nonaffiliates | Companies not related by common ownership or control. They can be financial and nonfinancial companies ■ The Davenport Funds do not share with nonaffiliates so they can market to you |
Joint marketing | A formal agreement between nonaffiliated financial companies that together market financial products or services to you. ■ The Davenport Funds don’t jointly market. |
55
This page intentionally left blank.
| | THE DAVENPORT FUNDS Investment Adviser
Davenport & Company LLC
One James Center
901 East Cary Street
Richmond, Virginia 23219-4037 Administrator
Ultimus Fund Solutions, LLC
P.O. Box 46707
Cincinnati, Ohio 45246-0707
1-800-281-3217 Custodian
US Bank NA
425 Walnut Street
Cincinnati, Ohio 45202 Independent Registered Public
Accounting Firm
Ernst & Young LLP
1900 Scripps Center
312 Walnut Street
Cincinnati, Ohio 45202 Legal Counsel
Sullivan & Worcester LLP
One Post Office Square
Boston, Massachusetts 02109 Board of Trustees
Robert S. Harris, Ph.D., Chairman
John P. Ackerly, IV
John T. Bruce
George K. Jennison
Harris V. Morrissette
Elizabeth W. Robertson Officers
John P. Ackerly, IV, President
George L. Smith, III, Vice President | |

One James Center
901 East Cary Street
Richmond, VA 23219
Davenport & Company LLC
Member: NYSE ● SIPC
Toll Free: (800) 846-6666
www.investdavenport.com

FBP Equity & Dividend Plus Fund FBP Appreciation & Income Opportunities Fund Semi-Annual Report September 30, 2015 (Unaudited) No-Load Funds |
Letter to Shareholders | October 30, 2015 |
Enclosed is your report on the Flippin, Bruce & Porter Funds and their investments for the semi-annual period ended September 30, 2015.
Economic and Market Update
The equity markets experienced a price correction both in the United States and around the world since we last reported to you, with the majority of the downward move occurring in August, followed by additional weakness as September ended. For the semi-annual period, the return of the S&P 500 Index was -6.18% and the return of the Russell 1000 Value Index was -8.30%. Even with this weakness, the U.S. markets performed much better than those around the world. The MSCI Indexes for Japan, China and Brazil were down -9.23%, -17.90% and -28.90%, respectively. In addition to the downtrend, stock market volatility was markedly higher, especially in August when the market slide began.
A number of factors contributed to the increased volatility and market downturn. First and foremost, economic growth around the world has been weak and that ignited global recession fears. Europe’s economy has stagnated at a mere 1% growth rate, and GDP in Japan is negative. The most significant factor has been slowing economic growth in China. Slower worldwide growth has led to price weakness across almost all commodities. Economic growth in the U.S. has continued to show relative strength with second quarter real GDP revised upward to 3.9%; however, we expect lower numbers when third quarter estimates are released. Contrary to investor expectations, the Federal Reserve (the “Fed”) elected to postpone an interest rate hike primarily due to international market instability and volatility. This decision contributed to the stock market correction as increased uncertainty made investors ponder if the Fed delay was due to signs of pending domestic economic weakness. We expect that since the U.S. is primarily a consumer driven economy, lower energy and commodity prices should begin to provide a positive stimulus to economic growth. Fed officials in their October statement pointed to “solid” growth rates in consumer spending and business investment and improvements in housing as bright spots in recent economic reports. Furthermore, there continues to be an effort by other countries to expand growth through very accommodative monetary and fiscal stimulus. Therefore, evidence continues to suggest that we are in an extended phase of very slow GDP expansion, both in the U.S. and abroad, and that fears of a global economic meltdown are overblown.
Corporate earnings continued to contract during the quarter. Most of the contraction can be attributed to sharp earnings declines for energy and commodity related companies. Additionally, multinational companies across all sectors have been struggling to cope with earnings headwinds created by the strong dollar and very slow global growth. This has led to lowered earnings expectations such that 2015 estimates are now mostly unchanged from 2014. Valuation levels for stocks have been in an uptrend for the last few years, topping out at approximately 17 times earnings for the S&P 500 earlier this year. At that level, there was little margin for error built into investor expectations. When it became clear that earnings were weakening, then a market correction was the natural result. As earnings expectations and valuations moved lower, the risk/reward trade-off became much more favorable. While it is never enjoyable to see the market selloff, the price weakness did provide an opportunity for the Funds to acquire several companies as their equity prices became depressed and dividend yields were elevated.
Now that we are in the fourth quarter of the year, investors will begin looking into 2016 to decide where best to position portfolios. If energy and commodity prices are past their troughs, as we believe, and headwinds from currency will be less severe, then the downturn in earnings from these industries will moderate and a
1
base for future earnings growth will be established. Industrials, Energy and Materials would benefit from a pickup in global growth as well as Financials, which will get an earnings lift from higher interest rates. We believe both Funds are well positioned for this potential economic improvement.
FBP Equity & Dividend Plus Fund Review
The FBP Equity & Dividend Plus Fund returned – 9.60% for the semi-annual period ended September 30, 2015, trailing the -6.18% return of the S&P 500 Index. Dividend-focused strategies have trailed momentum and growth-oriented strategies this year as market leadership has been narrowly concentrated in biotechnology and a few internet-related technology companies, and the Fund’s performance reflected those trends. Financials were the bright spot this semi-annual period for the Fund, with First Niagara Financial and People’s United Financial providing a lift. Weakness in Consumer Discretionary names, particularly Kohl’s and Staples, held back the Fund’s returns. The Information Technology and Materials sectors were also weak.
The Fund was invested 97.9% in common stocks and 2.1% in cash equivalents as of September 30. Cash levels declined as we took advantage of price weakness over the period to purchase a number of new companies for the Fund. U.S. Bancorp is one of the strongest banking institutions in the United States, and we believe it will be a beneficiary of the anticipated rising interest rate cycle. Wal-Mart’s dividend yield is at the highest level since 2011, and we believe new management’s actions, combined with the economic tailwinds from lower energy prices and rising consumer sentiment, should improve financial performance going forward. Concerning Ford, we believe its new product lineup, attractive dividend yield and capital discipline bode well for long term total return prospects. We also added United Technologies, UPS, Coach, Exxon and Ventas to the portfolio during the market pullback this most recent quarter. Each of these companies is a leader in its respective industry, trading at attractive valuations relative to its historic levels and sporting well above-average dividend yields.
Additional portfolio activity during the quarter included the elimination of the remaining holdings in ConAgra Foods and Avery Dennison, as each of those stocks generated outsized equity returns this year and their valuation levels became stretched.
While the Fund has lagged in this environment, we are confident that the appeal of investing in companies with attractive and growing dividend streams will reward Fund shareholders in the long term. The Fund is trading at just over 12 times projected earnings, an attractive discount to the 15 times projected earnings for the S&P 500 Index
FBP Appreciation & Income Opportunities Fund
The FBP Appreciation & Income Opportunities Fund returned – 9.11% for the semi-annual period ended September 30, 2015. The S&P 500 Index returned -6.18% and the Barclays U. S. Government/Credit Index returned -0.92% over the same time period. Value focused strategies have trailed momentum and growth-oriented strategies this year as market leadership has been narrowly concentrated in biotechnology and a few internet-related technology companies, and the Fund’s performance reflected those trends. Financials and Utilities were the bright spots in the period, with JPMorgan and First Niagara Financial doing particularly well. Microsoft and Sealed Air also added to results. Weakness in Energy, Materials and Consumer Discretionary stocks was the largest factor contributing to the Fund’s underperformance.
2
The Fund was invested 78.6% in common stocks, 7.8% in fixed income securities and 13.6% in cash equivalents as of September 30, 2015. The equities in the Fund are trading at just over 12 times projected earnings, an attractive discount to the 15 times projected earnings for the S&P 500 Index. The fixed income portion of the Fund remains defensively positioned in investment grade bonds with an average effective duration of just three years.
Over this most recent period we took advantage of price weakness to purchase a number of new companies for the Fund and to add to others. We believe this enhances the appreciation potential of the Fund, while also increasing the cash flow generation from a higher stream of dividends. We established new positions in EMC Corp. and Ford Motor Co. EMC, a dominant player in electronic storage and server virtualization (through its 80% ownership in VMWare), is in an enviable competitive position as cloud based platforms continue to grow. Trading at only 14 times forecasted earnings, in our opinion the stock was attractive. Concerning Ford, we believe its new product lineup, attractive dividend yield and capital discipline will drive the stock higher. The Fund also made purchases of Coach, Federal Express, Ventas and United Technologies which provide exposure to well-respected leaders in their industries and which were acquired at what we believe to be very attractive prices. Additionally, ownership was increased in IBM, Wal-Mart, Kohl’s and Eaton. Avery Dennison and Sealed Air were eliminated from the Fund during the period, while the Fund’s positions in Target and First Niagara Financial were reduced following very nice gains.
We want to thank you for your continued support and investment in the Flippin, Bruce & Porter Funds.

John T. Bruce, CFA
President - Portfolio Manager
October 28, 2015
Data presented reflects past performance, which is no guarantee of future results. Investment results and principal value will fluctuate so that shares, when redeemed, may be worth more or less than their original cost. Due to market volatility, current performance may be higher or lower than the performance shown. Updated performance information, current through the most recent month-end, is available by contacting the Funds at 1-866-738-1127.
This report is submitted for the general information of the shareholders of the Funds. It reflects our views, opinions and portfolio holdings as of the date of this letter. These views are subject to change at any time based upon market or other conditions. For more current information throughout the year please visit www.fbpfunds.com or call the Funds at 1-866-738-1127. This report is not authorized for distribution to prospective investors in the Funds unless accompanied by a current prospectus.
3
THE FLIPPIN, BRUCE & PORTER FUNDS
COMPARATIVE PERFORMANCE CHARTS
(Unaudited)
Performance for each Fund is compared to the most appropriate broad-based index, the Standard and Poor’s 500® Index, an unmanaged index of 500 large common stocks. Results are also compared to the Consumer Price Index, a measure of inflation.
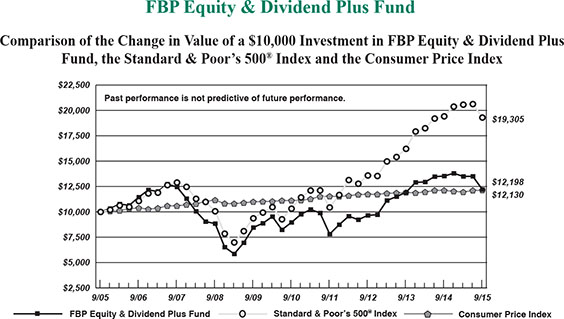
4
THE FLIPPIN, BRUCE & PORTER FUNDS
COMPARATIVE PERFORMANCE CHARTS
(Unaudited) (Continued)
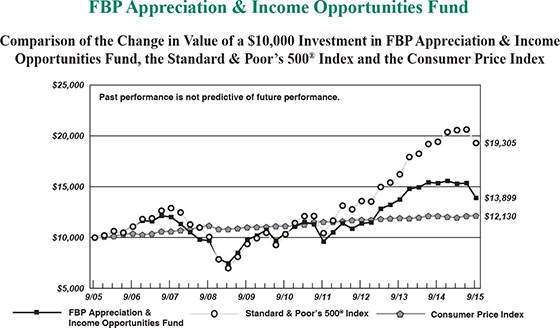
Average Annual Total Returns(a) (for periods ended September 30, 2015) |
| 1 Year | 5 Years | 10 Years |
FBP Equity & Dividend Plus Fund | (9.83%) | 6.37% | 2.01% |
FBP Appreciation & Income Opportunities Fund | (9.44%) | 5.94% | 3.35% |
Standard & Poor’s 500® Index | (0.61%) | 13.34% | 6.80% |
Consumer Price Index | 0.18% | 1.77% | 1.95% |
(a) | Total returns are a measure of the change in value of an investment in the Funds over the periods covered, which assumes any dividends or capital gains distributions are reinvested in shares of the Funds. Returns do not reflect the deduction of taxes a shareholder would pay on the Funds’ distributions or the redemption of Fund shares. |
5
FBP EQUITY & DIVIDEND PLUS FUND
PORTFOLIO INFORMATION
September 30, 2015 (Unaudited)
General Information | |
Net Asset Value Per Share | $22.10 |
Total Net Assets (Millions) | $24.3 |
Current Expense Ratio | 1.07% |
Portfolio Turnover | 13% |
Fund Inception Date | 7/30/1993 |
Stock Characteristics | Fund | S&P 500® Index |
Number of Stocks | 51 | 500 |
Weighted Avg Market Capitalization (Billions) | $119.2 | $127.9 |
Price-to-Earnings Ratio (Bloomberg 1 Yr. Forecast EPS) | 12.2 | 15.2 |
Price-to-Book Value | 1.7 | 2.6 |
Asset Allocation (% of Net Assets) |
|
Sector Diversification vs. the S&P 500® Index |

Ten Largest Equity Holdings | % of Net Assets |
JPMorgan Chase & Company | 4.3% |
Cisco Systems, Inc. | 3.5% |
Procter & Gamble Company (The) | 3.0% |
General Electric Company | 2.8% |
Western Union Company (The) | 2.8% |
Apple, Inc. | 2.8% |
Coca-Cola Company (The) | 2.6% |
Merck & Company, Inc. | 2.6% |
Pfizer, Inc. | 2.6% |
FirstEnergy Corporation | 2.5% |
6
FBP APPRECIATION & INCOME OPPORTUNITIES FUND
PORTFOLIO INFORMATION
September 30, 2015 (Unaudited)
General Information |
Net Asset Value Per Share | $16.19 |
Total Net Assets (Millions) | $32.7 |
Current Expense Ratio | 1.00% |
Portfolio Turnover | 12% |
Fund Inception Date | 7/3/1989 |
Asset Allocation (% of Net Assets) |
|
Common Stock Portfolio (78.6% of Net Assets) |
Number of Stocks | 59 |
Weighted Avg Market Capitalization (Billions) | $107.1 |
Price-to-Earnings Ratio (Bloomberg 1 Yr. Forecast EPS) | 12.0 |
Price-to-Book Value | 1.5 |
Ten Largest Equity Holdings | % of Net Assets |
Bank of America Corporation | 3.3% |
Cisco Systems, Inc. | 3.2% |
MetLife, Inc. | 2.9% |
Pfizer, Inc. | 2.7% |
Johnson & Johnson | 2.6% |
Lincoln National Corporation | 2.5% |
Microsoft Corporation | 2.3% |
JPMorgan Chase & Company | 2.2% |
Merck & Company, Inc. | 2.1% |
Travelers Companies, Inc. (The) | 2.0% |
Five Largest Sectors | % of Net Assets |
Financials | 20.1% |
Information Technology | 13.7% |
Energy | 8.8% |
Industrials | 7.6% |
Health Care | 7.4% |
Fixed-Income Portfolio (7.8% of Net Assets) |
Number of Fixed-Income Securities | 5 |
Average Quality | BBB+ |
Average Weighted Maturity | 3.2 yrs. |
Average Effective Duration | 3.0 yrs. |
Sector Breakdown | % of Net Assets |
Consumer Discretionary | 1.5% |
Energy | 1.5% |
Financials | 1.6% |
Industrials | 2.3% |
Municipal Bonds | 0.9% |
7
FBP EQUITY & DIVIDEND PLUS FUND
SCHEDULE OF INVESTMENTS
September 30, 2015 (Unaudited) | |
COMMON STOCKS — 97.9% | | Shares | | | Value | |
Consumer Discretionary — 7.5% | | | | | | |
Best Buy Company, Inc. (a) | | | 11,000 | | | $ | 408,320 | |
Coach, Inc. | | | 7,100 | | | | 205,403 | |
Ford Motor Company | | | 34,400 | | | | 466,808 | |
Kohl's Corporation | | | 8,000 | | | | 370,480 | |
Staples, Inc. | | | 31,000 | | | | 363,630 | |
| | | | | | | | 1,814,641 | |
Consumer Staples — 9.8% | | | | | | | | |
Coca-Cola Company (The) (a) | | | 16,000 | | | | 641,920 | |
PepsiCo, Inc. (a) | | | 4,800 | | | | 452,640 | |
Procter & Gamble Company (The) | | | 10,000 | | | | 719,400 | |
Wal-Mart Stores, Inc. | | | 8,700 | | | | 564,108 | |
| | | | | | | | 2,378,068 | |
Energy — 10.8% | | | | | | | | |
Chevron Corporation | | | 6,300 | | | | 496,944 | |
ConocoPhillips | | | 12,200 | | | | 585,112 | |
Exxon Mobil Corporation | | | 3,500 | | | | 260,225 | |
Noble Corporation plc | | | 28,800 | | | | 314,208 | |
Occidental Petroleum Corporation | | | 5,900 | | | | 390,285 | |
Royal Dutch Shell plc - Class A - ADR | | | 12,000 | | | | 568,680 | |
| | | | | | | | 2,615,454 | |
Financials — 19.6% | | | | | | | | |
BB&T Corporation | | | 10,000 | | | | 356,000 | |
First Niagara Financial Group, Inc. | | | 28,000 | | | | 285,880 | |
HSBC Holdings plc - ADR | | | 13,400 | | | | 507,592 | |
JPMorgan Chase & Company | | | 17,000 | | | | 1,036,490 | |
Manulife Financial Corporation | | | 20,000 | | | | 309,600 | |
MetLife, Inc. | | | 11,200 | | | | 528,080 | |
People's United Financial, Inc. | | | 25,000 | | | | 393,250 | |
Prudential Financial, Inc. | | | 6,900 | | | | 525,849 | |
U.S. Bancorp | | | 14,200 | | | | 582,342 | |
Ventas, Inc. | | | 4,000 | | | | 224,240 | |
| | | | | | | | 4,749,323 | |
Health Care — 7.2% | | | | | | | | |
Johnson & Johnson | | | 5,200 | | | | 485,420 | |
Merck & Company, Inc. | | | 12,800 | | | | 632,192 | |
Pfizer, Inc. | | | 20,000 | | | | 628,200 | |
| | | | | | | | 1,745,812 | |
Industrials — 11.5% | | | | | | | | |
Eaton Corporation plc | | | 8,000 | | | | 410,400 | |
Emerson Electric Company (a) | | | 10,600 | | | | 468,202 | |
General Electric Company | | | 27,000 | | | | 680,940 | |
Koninklijke Philips N.V. | | | 11,000 | | | | 258,060 | |
R.R. Donnelley & Sons Company (a) | | | 36,400 | | | | 529,984 | |
8
FBP EQUITY & DIVIDEND PLUS FUND
SCHEDULE OF INVESTMENTS (Continued) | |
COMMON STOCKS — 97.9% (Continued) | | Shares | | | Value | |
Industrials — 11.5% (Continued) | | | | | | |
United Parcel Service, Inc. - Class B | | | 2,600 | | | $ | 256,594 | |
United Technologies Corporation | | | 2,000 | | | | 177,980 | |
| | | | | | | | 2,782,160 | |
Information Technology — 17.7% | | | | | | | | |
Apple, Inc. | | | 6,100 | | | | 672,830 | |
Applied Materials, Inc. (a) | | | 15,000 | | | | 220,350 | |
Cisco Systems, Inc. (a) | | | 32,000 | | | | 840,000 | |
Hewlett-Packard Company | | | 19,500 | | | | 499,395 | |
Intel Corporation (a) | | | 10,000 | | | | 301,400 | |
International Business Machines Corporation | | | 3,700 | | | | 536,389 | |
Microsoft Corporation (a) | | | 12,500 | | | | 553,250 | |
Western Union Company (The) (a) | | | 37,000 | | | | 679,320 | |
| | | | | | | | 4,302,934 | |
Materials — 5.3% | | | | | | | | |
E.I. du Pont de Nemours and Company | | | 2,500 | | | | 120,500 | |
Nucor Corporation | | | 10,000 | | | | 375,500 | |
Potash Corporation of Saskatchewan, Inc. | | | 18,000 | | | | 369,900 | |
Rio Tinto plc - ADR | | | 12,600 | | | | 426,132 | |
| | | | | | | | 1,292,032 | |
Telecommunication Services — 4.0% | | | | | | | | |
AT&T, Inc. | | | 18,000 | | | | 586,440 | |
CenturyLink, Inc. | | | 15,500 | | | | 389,360 | |
| | | | | | | | 975,800 | |
Utilities — 4.5% | | | | | | | | |
FirstEnergy Corporation | | | 19,000 | | | | 594,890 | |
PPL Corporation (a) | | | 15,300 | | | | 503,217 | |
| | | | | | | | 1,098,107 | |
| | | | | | | | | |
Total Common Stocks (Cost $21,715,130) | | | | | | $ | 23,754,331 | |
9
FBP EQUITY & DIVIDEND PLUS FUND
SCHEDULE OF INVESTMENTS (Continued) |
MONEY MARKET FUNDS — 3.2% | | Shares | | | Value | |
Fidelity Institutional Money Market Government Portfolio - Class I, 0.01% (b) (Cost $764,855) | | | 764,855 | | | $ | 764,855 | |
| | | | | | | | | |
Total Investments at Value — 101.1% (Cost $22,479,985) | | | | | | $ | 24,519,186 | |
| | | | | | | | | |
Liabilities in Excess of Other Assets — (1.1%) | | | | | | | (253,727 | ) |
| | | | | | | | | |
Net Assets — 100.0% | | | | | | $ | 24,265,459 | |
ADR - American Depositary Receipt. |
(a) | Security covers a written call option. |
(b) | The rate shown is the 7-day effective yield as of September 30, 2015. |
See accompanying notes to financial statements. |
10
FBP EQUITY & DIVIDEND PLUS FUND
SCHEDULE OF OPEN OPTION CONTRACTS
September 30, 2015 (Unaudited) | |
WRITTEN COVERED CALL OPTIONS | | Option
Contracts | | | Value of
Options | | | Premiums
Received | |
Applied Materials, Inc., | | | | | | | | | |
01/15/2016 at $22 | | | 150 | | | $ | 300 | | | $ | 15,294 | |
Best Buy Company, Inc., | | | | | | | | | | | | |
03/18/2016 at $37 | | | 110 | | | | 37,950 | | | | 21,665 | |
Cisco Systems, Inc., | | | | | | | | | | | | |
04/15/2016 at $30 | | | 100 | | | | 4,300 | | | | 13,195 | |
Coca-Cola Company (The), | | | | | | | | | | | | |
02/19/2016 at $41 | | | 90 | | | | 10,440 | | | | 9,806 | |
Emerson Electric Company, | | | | | | | | | | | | |
01/15/2016 at $65 | | | 50 | | | | 250 | | | | 6,848 | |
Intel Corporation, | | | | | | | | | | | | |
01/15/2016 at $37 | | | 100 | | | | 1,000 | | | | 10,696 | |
Microsoft Corporation, | | | | | | | | | | | | |
01/15/2016 at $49 | | | 65 | | | | 3,380 | | | | 8,707 | |
PepsiCo, Inc., | | | | | | | | | | | | |
01/15/2016 at $105 | | | 48 | | | | 1,680 | | | | 5,710 | |
PPL Corporation, | | | | | | | | | | | | |
01/15/2016 at $34 | | | 90 | | | | 5,400 | | | | 6,979 | |
R.R. Donnelley & Sons Company, | | | | | | | | | | | | |
01/15/2016 at $20 | | | 156 | | | | 1,560 | | | | 7,325 | |
Western Union Company (The), | | | | | | | | | | | | |
11/20/2015 at $21 | | | 150 | | | | 2,250 | | | | 13,794 | |
| | | | | | | $ | 68,510 | | | $ | 120,019 | |
See accompanying notes to financial statements. |
11
FBP APPRECIATION & INCOME OPPORTUNITIES FUND
SCHEDULE OF INVESTMENTS
September 30, 2015 (Unaudited) | |
COMMON STOCKS — 78.6% | | Shares | | | Value | |
Consumer Discretionary — 6.4% | | | | | | |
Best Buy Company, Inc. (a) | | | 10,000 | | | $ | 371,200 | |
Coach, Inc. | | | 8,000 | | | | 231,440 | |
Ford Motor Company | | | 34,000 | | | | 461,380 | |
Kohl's Corporation | | | 9,000 | | | | 416,790 | |
Staples, Inc. | | | 35,000 | | | | 410,550 | |
Target Corporation | | | 2,500 | | | | 196,650 | |
| | | | | | | | 2,088,010 | |
Consumer Staples — 5.3% | | | | | | | | |
Avon Products, Inc. | | | 48,000 | | | | 156,000 | |
CVS Caremark Corporation | | | 3,800 | | | | 366,624 | |
PepsiCo, Inc. | | | 3,200 | | | | 301,760 | |
Procter & Gamble Company (The) | | | 4,500 | | | | 323,730 | |
Wal-Mart Stores, Inc. | | | 9,000 | | | | 583,560 | |
| | | | | | | | 1,731,674 | |
Energy — 8.8% | | | | | | | | |
Baker Hughes, Inc. | | | 4,500 | | | | 234,180 | |
Chevron Corporation | | | 5,000 | | | | 394,400 | |
ConocoPhillips | | | 12,500 | | | | 599,500 | |
Devon Energy Corporation | | | 12,000 | | | | 445,080 | |
Noble Corporation plc | | | 25,500 | | | | 278,205 | |
Occidental Petroleum Corporation | | | 5,200 | | | | 343,980 | |
Royal Dutch Shell plc - Class A - ADR | | | 11,000 | | | | 521,290 | |
Transocean Ltd. | | | 5,000 | | | | 64,600 | |
| | | | | | | | 2,881,235 | |
Financials — 20.1% | | | | | | | | |
Bank of America Corporation | | | 69,000 | | | | 1,075,020 | |
Bank of New York Mellon Corporation (The) | | | 13,500 | | | | 528,525 | |
Capital One Financial Corporation | | | 5,000 | | | | 362,600 | |
Comerica, Inc. | | | 7,000 | | | | 287,700 | |
First Niagara Financial Group, Inc. | | | 24,000 | | | | 245,040 | |
JPMorgan Chase & Company | | | 12,000 | | | | 731,640 | |
Lincoln National Corporation | | | 17,500 | | | | 830,550 | |
Manulife Financial Corporation | | | 24,000 | | | | 371,520 | |
MetLife, Inc. | | | 20,000 | | | | 943,000 | |
People's United Financial, Inc. | | | 18,000 | | | | 283,140 | |
Travelers Companies, Inc. (The) | | | 6,500 | | | | 646,945 | |
Ventas, Inc. | | | 4,500 | | | | 252,270 | |
| | | | | | | | 6,557,950 | |
Health Care — 7.4% | | | | | | | | |
Johnson & Johnson | | | 9,100 | | | | 849,485 | |
Merck & Company, Inc. | | | 14,000 | | | | 691,460 | |
Pfizer, Inc. | | | 28,000 | | | | 879,480 | |
| | | | | | | | 2,420,425 | |
12
FBP APPRECIATION & INCOME OPPORTUNITIES FUND
SCHEDULE OF INVESTMENTS (Continued) |
COMMON STOCKS — 78.6% (Continued) | | Shares | | | Value | |
Industrials — 7.6% | | | | | | |
Eaton Corporation plc | | | 8,000 | | | $ | 410,400 | |
FedEx Corporation | | | 1,700 | | | | 244,766 | |
General Electric Company | | | 17,000 | | | | 428,740 | |
Ingersoll-Rand plc | | | 4,700 | | | | 238,619 | |
Koninklijke Philips N.V. | | | 16,025 | | | | 375,946 | |
Norfolk Southern Corporation | | | 3,000 | | | | 229,200 | |
R.R. Donnelley & Sons Company | | | 23,000 | | | | 334,880 | |
United Technologies Corporation | | | 2,500 | | | | 222,475 | |
| | | | | | | | 2,485,026 | |
Information Technology — 13.7% | | | | | | | | |
Apple, Inc. (a) | | | 5,600 | | | | 617,680 | |
Cisco Systems, Inc. | | | 40,000 | | | | 1,050,000 | |
EMC Corporation | | | 10,000 | | | | 241,600 | |
Hewlett-Packard Company | | | 16,000 | | | | 409,760 | |
Intel Corporation | | | 7,000 | | | | 210,980 | |
International Business Machines Corporation | | | 4,000 | | | | 579,880 | |
Microsoft Corporation | | | 17,000 | | | | 752,420 | |
Western Union Company (The) | | | 34,000 | | | | 624,240 | |
| | | | | | | | 4,486,560 | |
Materials — 4.5% | | | | | | | | |
E.I. du Pont de Nemours and Company | | | 8,000 | | | | 385,600 | |
Freeport-McMoRan, Inc. | | | 25,000 | | | | 242,250 | |
Mosaic Company (The) | | | 6,000 | | | | 186,660 | |
Nucor Corporation | | | 8,000 | | | | 300,400 | |
Rio Tinto plc - ADR | | | 11,000 | | | | 372,020 | |
| | | | | | | | 1,486,930 | |
Telecommunication Services — 2.6% | | | | | | | | |
AT&T, Inc. | | | 15,000 | | | | 488,700 | |
CenturyLink, Inc. | | | 14,000 | | | | 351,680 | |
| | | | | | | | 840,380 | |
Utilities — 2.2% | | | | | | | | |
FirstEnergy Corporation | | | 8,000 | | | | 250,480 | |
PPL Corporation | | | 14,000 | | | | 460,460 | |
| | | | | | | | 710,940 | |
| | | | | | | | | |
Total Common Stocks (Cost $21,350,298) | | | | | | $ | 25,689,130 | |
13
FBP APPRECIATION & INCOME OPPORTUNITIES FUND
SCHEDULE OF INVESTMENTS (Continued) |
CORPORATE BONDS — 6.9% | | Par Value | | | Value | |
Consumer Discretionary — 1.5% | | | | | | |
Mattel, Inc., 2.35%, due 05/06/2019 | | $ | 500,000 | | | $ | 499,677 | |
| | | | | | | | | |
Energy — 1.5% | | | | | | | | |
Dominion Resources, Inc., 2.50%, due 12/01/2019 | | | 500,000 | | | | 503,083 | |
| | | | | | | | | |
Financials — 1.6% | | | | | | | | |
Prudential Financial, Inc., 3.00%, due 05/12/2016 | | | 500,000 | | | | 506,100 | |
| | | | | | | | | |
Industrials — 2.3% | | | | | | | | |
Ryder System, Inc., 2.50%, due 05/11/2020 | | | 750,000 | | | | 744,713 | |
| | | | | | | | | |
Total Corporate Bonds (Cost $2,254,362) | | | | | | $ | 2,253,573 | |
MUNICIPAL BONDS — 0.9% | | Par Value | | | Value | |
Wise Co., Virginia, Industrial Dev. Authority, Revenue, 1.70%, due 02/01/2017 (Cost $299,486) | | $ | 300,000 | | | $ | 300,003 | |
MONEY MARKET FUNDS — 14.4% | | Shares | | | Value | |
Fidelity Institutional Money Market Government Portfolio - Class I, 0.01% (b) | | | 3,137,704 | | | $ | 3,137,704 | |
First American Government Obligations Fund - Class Z, 0.01% (b) | | | 1,556,770 | | | | 1,556,770 | |
Total Money Market Funds (Cost $4,694,474) | | | | | | $ | 4,694,474 | |
| | | | | | | | | |
Total Investments at Value — 100.8% (Cost $28,598,620) | | | | | | $ | 32,937,180 | |
| | | | | | | | | |
Liabilities in Excess of Other Assets — (0.8%) | | | | | | | (260,690 | ) |
| | | | | | | | | |
Net Assets — 100.0% | | | | | | $ | 32,676,490 | |
ADR - American Depositary Receipt. |
(a) | Security covers a written call option. |
(b) | The rate shown is the 7-day effective yield as of September 30, 2015. |
See accompanying notes to financial statements. |
14
FBP APPRECIATION & INCOME OPPORTUNITIES FUND
SCHEDULE OF OPEN OPTION CONTRACTS
September 30, 2015 (Unaudited) | |
WRITTEN COVERED CALL OPTIONS | | Option Contracts | | | Value of
Options | | | Premiums Received | |
Apple, Inc., | | | | | | | | | |
01/15/2016 at $145 | | | 20 | | | $ | 760 | | | $ | 8,339 | |
Best Buy Company, Inc., | | | | | | | | | | | | |
03/18/2016 at $37 | | | 100 | | | | 34,500 | | | | 19,695 | |
| | | | | | | $ | 35,260 | | | $ | 28,034 | |
See accompanying notes to financial statements. |
15
THE FLIPPIN, BRUCE & PORTER FUNDS
STATEMENTS OF ASSETS AND LIABILITIES
September 30, 2015 (Unaudited) | |
| | FBP Equity
& Dividend
Plus Fund | | | FBP
Appreciation
& Income
Opportunities
Fund | |
ASSETS | | | | | | |
Investments in securities: | | | | | | |
At acquisition cost | | $ | 22,479,985 | | | $ | 28,598,620 | |
At value (Note 2) | | $ | 24,519,186 | | | $ | 32,937,180 | |
Cash | | | — | | | | 1,363 | |
Dividends and interest receivable | | | 49,857 | | | | 57,177 | |
Receivable for securities sold | | | — | | | | 49,279 | |
Receivable for capital shares sold | | | 2,200 | | | | — | |
Other assets | | | 5,816 | | | | 3,524 | |
TOTAL ASSETS | | | 24,577,059 | | | | 33,048,523 | |
| | | | | | | | | |
LIABILITIES | | | | | | | | |
Covered call options, at value (Notes 2 and 5) (premiums received $120,019 and $28,034, respectively) | | | 68,510 | | | | 35,260 | |
Distributions payable | | | 3,087 | | | | 10,674 | |
Payable for securities purchased | | | 210,228 | | | | 281,573 | |
Payable for capital shares redeemed | | | 7,337 | | | | 15,334 | |
Accrued investment advisory fees (Note 4) | | | 8,948 | | | | 15,622 | |
Payable to administrator (Note 4) | | | 5,700 | | | | 5,700 | |
Other accrued expenses | | | 7,790 | | | | 7,870 | |
TOTAL LIABILITIES | | | 311,600 | | | | 372,033 | |
| | | | | | | | | |
NET ASSETS | | $ | 24,265,459 | | | $ | 32,676,490 | |
| | | | | | | | | |
Net assets consist of: | | | | | | | | |
Paid-in capital | | $ | 21,144,024 | | | $ | 27,758,908 | |
Accumulated (distributions in excess of) net investment income | | | 119 | | | | (11,672 | ) |
Accumulated net realized gains from security transactions | | | 1,030,606 | | | | 597,920 | |
Net unrealized appreciation (depreciation) on: | | | | | | | | |
Investments | | | 2,039,201 | | | | 4,338,560 | |
Option contracts | | | 51,509 | | | | (7,226 | ) |
Net assets | | $ | 24,265,459 | | | $ | 32,676,490 | |
| | | | | | | | | |
Shares of beneficial interest outstanding (unlimited number of shares authorized, $0.01 par value) | | | 1,097,888 | | | | 2,017,756 | |
| | | | | | | | | |
Net asset value, offering price and redemption price per share (Note 2) | | $ | 22.10 | | | $ | 16.19 | |
See accompanying notes to financial statements. |
16
THE FLIPPIN, BRUCE & PORTER FUNDS
STATEMENTS OF OPERATIONS
Six Months Ended September 30, 2015 (Unaudited) | |
| | FBP Equity
& Dividend
Plus Fund | | | FBP Appreciation
& Income
Opportunities
Fund | |
INVESTMENT INCOME | | | | | | |
Dividends | | $ | 491,363 | | | $ | 443,646 | |
Foreign withholding taxes on dividends | | | (6,236 | ) | | | (4,062 | ) |
Interest | | | — | | | | 32,102 | |
TOTAL INVESTMENT INCOME | | | 485,127 | | | | 471,686 | |
| | | | | | | | | |
EXPENSES | | | | | | | | |
Investment advisory fees (Note 4) | | | 97,132 | | | | 130,783 | |
Administration fees (Note 4) | | | 30,000 | | | | 30,000 | |
Professional fees | | | 11,178 | | | | 10,763 | |
Registration and filing fees | | | 6,027 | | | | 4,329 | |
Trustees’ fees and expenses (Note 4) | | | 5,120 | | | | 5,120 | |
Compliance service fees (Note 4) | | | 4,200 | | | | 4,200 | |
Printing of shareholder reports | | | 4,710 | | | | 2,957 | |
Custodian and bank service fees | | | 3,857 | | | | 3,805 | |
Postage and supplies | | | 2,697 | | | | 2,047 | |
Insurance expense | | | 679 | | | | 866 | |
Other expenses | | | 3,618 | | | | 3,675 | |
TOTAL EXPENSES | | | 169,218 | | | | 198,545 | |
Fees voluntarily waived by the Adviser (Note 4) | | | (20,746 | ) | | | (11,712 | ) |
NET EXPENSES | | | 148,472 | | | | 186,833 | |
| | | | | | | | | |
NET INVESTMENT INCOME | | | 336,655 | | | | 284,853 | |
| | | | | | | | | |
REALIZED AND UNREALIZED GAINS (LOSSES) ON INVESTMENTS | | | | | | | | |
Net realized gains from: | | | | | | | | |
Security transactions | | | 962,464 | | | | 517,642 | |
Option contracts (Note 5) | | | 68,252 | | | | 80,332 | |
Net realized gains from in-kind redemptions (Note 2) | | | — | | | | 1,077,346 | |
Net change in unrealized appreciation/depreciation on: | | | | | | | | |
Investments | | | (4,092,625 | ) | | | (5,254,558 | ) |
Option contracts (Note 5) | | | 129,970 | | | | 18,081 | |
| | | | | | | | | |
NET REALIZED AND UNREALIZED LOSSES ON INVESTMENTS | | | (2,931,939 | ) | | | (3,561,157 | ) |
| | | | | | | | | |
NET DECREASE IN NET ASSETS FROM OPERATIONS | | $ | (2,595,284 | ) | | $ | (3,276,304 | ) |
See accompanying notes to financial statements. |
17
FBP EQUITY & DIVIDEND PLUS FUND
STATEMENTS OF CHANGES IN NET ASSETS | |
| | Six Months Ended
Sept. 30, 2015 (Unaudited) | | | Year Ended
March 31,
2015 | |
FROM OPERATIONS | | | | | | |
Net investment income | | $ | 336,655 | | | $ | 584,102 | |
Net realized gains from: | | | | | | | | |
Security transactions | | | 962,464 | | | | 811,457 | |
Option contracts (Note 5) | | | 68,252 | | | | 21,232 | |
Net change in unrealized appreciation/depreciation on: | | | | | | | | |
Investments | | | (4,092,625 | ) | | | (177,321 | ) |
Option contracts (Note 5) | | | 129,970 | | | | (28,993 | ) |
Net increase (decrease) in net assets from operations | | | (2,595,284 | ) | | | 1,210,477 | |
| | | | | | | | | |
DISTRIBUTIONS TO SHAREHOLDERS | | | | | | | | |
From net investment income | | | (338,118 | ) | | | (587,146 | ) |
From net realized gains from security transactions | | | (137,902 | ) | | | (518,508 | ) |
Decrease in net assets from distributions to shareholders | | | (476,020 | ) | | | (1,105,654 | ) |
| | | | | | | | | |
FROM CAPITAL SHARE TRANSACTIONS | | | | | | | | |
Proceeds from shares sold | | | 307,762 | | | | 2,990,599 | |
Net asset value of shares issued in reinvestment of distributions to shareholders | | | 468,463 | | | | 1,079,702 | |
Payments for shares redeemed | | | (2,221,356 | ) | | | (3,187,091 | ) |
Net increase (decrease) in net assets from capital share transactions | | | (1,445,131 | ) | | | 883,210 | |
| | | | | | | | | |
TOTAL INCREASE (DECREASE) IN NET ASSETS | | | (4,516,435 | ) | | | 988,033 | |
| | | | | | | | | |
NET ASSETS | | | | | | | | |
Beginning of period | | | 28,781,894 | | | | 27,793,861 | |
End of period | | $ | 24,265,459 | | | $ | 28,781,894 | |
| | | | | | | | | |
ACCUMULATED NET INVESTMENT INCOME | | $ | 119 | | | $ | 1,582 | |
| | | | | | | | | |
CAPITAL SHARE ACTIVITY | | | | | | | | |
Shares sold | | | 12,558 | | | | 117,967 | |
Shares reinvested | | | 19,832 | | | | 42,203 | |
Shares redeemed | | | (90,658 | ) | | | (125,668 | ) |
Net increase (decrease) in shares outstanding | | | (58,268 | ) | | | 34,502 | |
Shares outstanding, beginning of period | | | 1,156,156 | | | | 1,121,654 | |
Shares outstanding, end of period | | | 1,097,888 | | | | 1,156,156 | |
See accompanying notes to financial statements. |
18
FBP APPRECIATION & INCOME OPPORTUNITIES FUND
STATEMENTS OF CHANGES IN NET ASSETS | |
| | Six Months Ended
Sept. 30, 2015 (Unaudited) | | | Year Ended
March 31,
2015 | |
FROM OPERATIONS | | | | | | |
Net investment income | | $ | 284,853 | | | $ | 546,791 | |
Net realized gains (losses) from: | | | | | | | | |
Security transactions | | | 517,642 | | | | 1,667,644 | |
Option contracts (Note 5) | | | 80,332 | | | | (13,048 | ) |
Net realized gains from in-kind redemptions (Note 2) | | | 1,077,346 | | | | — | |
Net change in unrealized appreciation/depreciation on: | | | | | | | | |
Investments | | | (5,254,558 | ) | | | (1,283,661 | ) |
Option contracts (Note 5) | | | 18,081 | | | | 34,663 | |
Net increase (decrease) in net assets from operations | | | (3,276,304 | ) | | | 952,389 | |
| | | | | | | | | |
DISTRIBUTIONS TO SHAREHOLDERS | | | | | | | | |
From net investment income | | | (312,518 | ) | | | (553,302 | ) |
From net realized gains from security transactions | | | (1,142,354 | ) | | | (1,338,239 | ) |
Decrease in net assets from distributions to shareholders | | | (1,454,872 | ) | | | (1,891,541 | ) |
| | | | | | | | | |
FROM CAPITAL SHARE TRANSACTIONS | | | | | | | | |
Proceeds from shares sold | | | 515,392 | | | | 1,229,570 | |
Net asset value of shares issued in reinvestment of distributions to shareholders | | | 1,376,777 | | | | 1,747,129 | |
Payments for shares redeemed | | | (3,475,189 | ) | | | (2,997,545 | ) |
Net decrease in net assets from capital share transactions | | | (1,583,020 | ) | | | (20,846 | ) |
| | | | | | | | | |
TOTAL DECREASE IN NET ASSETS | | | (6,314,196 | ) | | | (959,998 | ) |
| | | | | | | | | |
NET ASSETS | | | | | | | | |
Beginning of period | | | 38,990,686 | | | | 39,950,684 | |
End of period | | $ | 32,676,490 | | | $ | 38,990,686 | |
| | | | | | | | | |
UNDISTRIBUTED (DISTRIBUTIONS IN EXCESS OF) NET INVESTMENT INCOME | | $ | (11,672 | ) | | $ | 15,993 | |
| | | | | | | | | |
CAPITAL SHARE ACTIVITY | | | | | | | | |
Shares sold | | | 28,722 | | | | 64,403 | |
Shares reinvested | | | 77,483 | | | | 91,891 | |
Shares redeemed | | | (193,056 | ) | | | (157,941 | ) |
Net decrease in shares outstanding | | | (86,851 | ) | | | (1,647 | ) |
Shares outstanding, beginning of period | | | 2,104,607 | | | | 2,106,254 | |
Shares outstanding, end of period | | | 2,017,756 | | | | 2,104,607 | |
See accompanying notes to financial statements. |
19
FBP EQUITY & DIVIDEND PLUS FUND
FINANCIAL HIGHLIGHTS | |
Selected Per Share Data and Ratios for a Share Outstanding Throughout Each Period | |
| | | Six Months Ended
Sept. 30,
2015 (Unaudited) | | |
Years Ended March 31,
| |
| | | 2015 | | | | 2014 | | | | 2013 | | | | 2012 | | | | 2011 | |
Net asset value at
beginning of period | | $ | 24.89 | | | $ | 24.78 | | | $ | 21.67 | | | $ | 19.10 | | | $ | 20.70 | | | $ | 19.42 | |
| | | | | | | | | | | | | | | | | | | | | | | | | |
Income (loss) from
investment operations: | | | | | | | | | | | | | | | | | | | | | | | | |
Net investment income | | | 0.30 | | | | 0.50 | | | | 0.42 | | | | 0.47 | | | | 0.23 | | | | 0.15 | |
Net realized and unrealized gains (losses) on investments | | | (2.67 | ) | | | 0.57 | | | | 3.11 | | | | 2.56 | | | | (1.59 | ) | | | 1.27 | |
Total from investment operations | | | (2.37 | ) | | | 1.07 | | | | 3.53 | | | | 3.03 | | | | (1.36 | ) | | | 1.42 | |
| | | | | | | | | | | | | | | | | | | | | | | | | |
Less distributions: | | | | | | | | | | | | | | | | | | | | | | | | |
Dividends from net
investment income | | | (0.30 | ) | | | (0.51 | ) | | | (0.42 | ) | | | (0.46 | ) | | | (0.24 | ) | | | (0.14 | ) |
Distributions from net
realized gains | | | (0.12 | ) | | | (0.45 | ) | | | — | | | | — | | | | — | | | | — | |
Total distributions | | | (0.42 | ) | | | (0.96 | ) | | | (0.42 | ) | | | (0.46 | ) | | | (0.24 | ) | | | (0.14 | ) |
| | | | | | | | | | | | | | | | | | | | | | | | | |
Net asset value at end of period | | $ | 22.10 | | | $ | 24.89 | | | $ | 24.78 | | | $ | 21.67 | | | $ | 19.10 | | | $ | 20.70 | |
| | | | | | | | | | | | | | | | | | | | | | | | | |
Total return (a) | | | (9.60 | %)(b) | | | 4.23 | % | | | 16.40 | % | | | 16.19 | % | | | (6.49 | %) | | | 7.40 | % |
| | | | | | | | | | | | | | | | | | | | | | | | | |
Net assets at end of period (000’s) | | $ | 24,265 | | | $ | 28,782 | | | $ | 27,794 | | | $ | 22,570 | | | $ | 23,194 | | | $ | 27,407 | |
| | | | | | | | | | | | | | | | | | | | | | | | | |
Ratio of total expenses to
average net assets | | | 1.22 | %(c) | | | 1.17 | % | | | 1.21 | % | | | 1.29 | % | | | 1.29 | % | | | 1.19 | % |
| | | | | | | | | | | | | | | | | | | | | | | | | |
Ratio of net expenses to
average net assets (d) | | | 1.07 | %(c) | | | 1.07 | % | | | 1.07 | % | | | 1.07 | % | | | 1.07 | % | | | 1.07 | % |
| | | | | | | | | | | | | | | | | | | | | | | | | |
Ratio of net investment income to average net assets (d) | | | 2.43 | %(c) | | | 1.98 | % | | | 1.82 | % | | | 2.40 | % | | | 1.24 | % | | | 0.78 | % |
| | | | | | | | | | | | | | | | | | | | | | | | | |
Portfolio turnover rate | | | 13 | %(b) | | | 19 | % | | | 24 | % | | | 32 | % | | | 46 | % | | | 25 | % |
(a) | Total return is a measure of the change in value of an investment in the Fund over the periods covered, which assumes any dividends or capital gains distributions are reinvested in shares of the Fund. Returns shown do not reflect the deduction of taxes a shareholder would pay on Fund distributions or the redemption of Fund shares. |
(d) | Ratios were determined after voluntary advisory fee waivers by the Adviser (Note 4). |
See accompanying notes to financial statements. |
20
FBP APPRECIATION & INCOME OPPORTUNITIES FUND
FINANCIAL HIGHLIGHTS | |
Selected Per Share Data and Ratios for a Share Outstanding Throughout Each Period | |
| | | Six Months Ended
Sept. 30,
2015 (Unaudited) | | |
Years Ended March 31,
| |
| | | 2015 | | | | 2014 | | | | 2013 | | | | 2012 | | | | 2011 | |
Net asset value at
beginning of period | | $ | 18.53 | | | $ | 18.97 | | | $ | 17.16 | | | $ | 15.85 | | | $ | 16.35 | | | $ | 15.49 | |
| | | | | | | | | | | | | | | | | | | | | | | | | |
Income (loss) from
investment operations: | | | | | | | | | | | | | | | | | | | | | | | | |
Net investment income | | | 0.14 | | | | 0.26 | | | | 0.25 | | | | 0.29 | | | | 0.26 | | | | 0.24 | |
Net realized and unrealized gains (losses) on investments | | | (1.77 | ) | | | 0.19 | | | | 2.50 | | | | 1.61 | | | | (0.46 | ) | | | 0.88 | |
Total from investment operations | | | (1.63 | ) | | | 0.45 | | | | 2.75 | | | | 1.90 | | | | (0.20 | ) | | | 1.12 | |
| | | | | | | | | | | | | | | | | | | | | | | | | |
Less distributions: | | | | | | | | | | | | | | | | | | | | | | | | |
Dividends from net
investment income | | | (0.15 | ) | | | (0.26 | ) | | | (0.26 | ) | | | (0.30 | ) | | | (0.30 | ) | | | (0.26 | ) |
Distributions from net
realized gains | | | (0.56 | ) | | | (0.63 | ) | | | (0.68 | ) | | | (0.29 | ) | | | — | | | | — | |
Total distributions | | | (0.71 | ) | | | (0.89 | ) | | | (0.94 | ) | | | (0.59 | ) | | | (0.30 | ) | | | (0.26 | ) |
| | | | | | | | | | | | | | | | | | | | | | | | | |
Net asset value at end of period | | $ | 16.19 | | | $ | 18.53 | | | $ | 18.97 | | | $ | 17.16 | | | $ | 15.85 | | | $ | 16.35 | |
| | | | | | | | | | | | | | | | | | | | | | | | | |
Total return (a) | | | (9.11 | %)(b) | | | 2.36 | % | | | 16.50 | % | | | 12.51 | % | | | (1.13 | %) | | | 7.35 | % |
| | | | | | | | | | | | | | | | | | | | | | | | | |
Net assets at end of period (000’s) | | $ | 32,676 | | | $ | 38,991 | | | $ | 39,951 | | | $ | 36,825 | | | $ | 39,520 | | | $ | 46,406 | |
| | | | | | | | | | | | | | | | | | | | | | | | | |
Ratio of total expenses to
average net assets | | | 1.06 | %(c) | | | 1.04 | % | | | 1.03 | % | | | 1.06 | % | | | 1.06 | % | | | 1.03 | % |
| | | | | | | | | | | | | | | | | | | | | | | | | |
Ratio of net expenses to
average net assets (d) | | | 1.00 | %(c) | | | 1.00 | % | | | 1.00 | % | | | 1.00 | % | | | 1.00 | % | | | 1.00 | % |
| | | | | | | | | | | | | | | | | | | | | | | | | |
Ratio of net investment income to average net assets (d) | | | 1.66 | %(c) | | | 1.36 | % | | | 1.36 | % | | | 1.83 | % | | | 1.71 | % | | | 1.59 | % |
| | | | | | | | | | | | | | | | | | | | | | | | | |
Portfolio turnover rate | | | 12 | %(b) | | | 12 | % | | | 10 | % | | | 15 | % | | | 17 | % | | | 24 | % |
(a) | Total return is a measure of the change in value of an investment in the Fund over the periods covered, which assumes any dividends or capital gains distributions are reinvested in shares of the Fund. Returns shown do not reflect the deduction of taxes a shareholder would pay on Fund distributions or the redemption of Fund shares. |
(d) | Ratios were determined after voluntary advisory fee waivers by the Adviser (Note 4). |
See accompanying notes to financial statements. |
21
THE FLIPPIN, BRUCE & PORTER FUNDS
NOTES TO FINANCIAL STATEMENTS
September 30, 2015 (Unaudited) |
1. Organization
FBP Equity & Dividend Plus Fund and FBP Appreciation & Income Opportunities Fund (the “Funds”) are no-load, diversified series of Williamsburg Investment Trust (the “Trust”), an open-end management investment company registered under the Investment Company Act of 1940. The Trust was organized as a Massachusetts business trust on July 18, 1988. Other series of the Trust are not included in this report.
FBP Equity & Dividend Plus Fund seeks to provide above-average and growing income while also achieving long-term growth of capital.
FBP Appreciation & Income Opportunities Fund seeks long term capital appreciation and current income, assuming a moderate level of investment risk.
2. Significant Accounting Policies
As an investment company, as defined in Financial Accounting Standards Board (“FASB”) Accounting Standards Update 2013-08, the Funds follow accounting and reporting guidance under FASB Accounting Standards Codification Topic 946, “Financial Services – Investment Companies.” The following is a summary of the Funds’ significant accounting policies. These policies are in conformity with accounting principles generally accepted in the United States of America (“GAAP”).
Securities valuation — The Funds’ portfolio securities are valued as of the close of business of the regular session of the New York Stock Exchange (normally 4:00 p.m., Eastern time). Securities traded on a national stock exchange are valued based upon the closing price on the principal exchange where the security is traded, if available, otherwise, at the last quoted bid price. Securities which are quoted by NASDAQ are valued at the NASDAQ Official Closing Price. Covered call options written by the Funds are valued at the last quoted sale price or, in the absence of a sale, at the ask price on the principal exchanges on which they are traded. Investments representing shares of other investment companies are valued at their net asset value as reported by such companies.
Fixed income securities are typically valued on the basis of prices provided by an independent pricing service. The prices provided by the pricing service are determined with consideration given to institutional bid and last sale prices and take into account securities prices, yields, maturities, call features, ratings, institutional trading in similar groups of securities and developments related to specific securities.
When market quotations are not readily available, if a pricing service cannot provide a price or the investment adviser believes the price received from the pricing service is not indicative of market value, securities will be valued in good faith at fair value using methods consistent with procedures adopted by the Board of Trustees and will be classified as Level 2 or 3 within the fair value hierarchy (see below), depending on the inputs used. Such methods of fair valuation may include, but are not limited to: multiple of earnings, multiple of book value, discount from market of a similar freely traded security, purchase price of the security, subsequent private transactions in the security or related securities, or a combination of these and other factors.
22
THE FLIPPIN, BRUCE & PORTER FUNDS
NOTES TO FINANCIAL STATEMENTS (Continued) |
GAAP establishes a single authoritative definition of fair value, sets out a framework for measuring fair value and requires additional disclosures about fair value measurements. Various inputs are used in determining the value of each Fund’s investments. These inputs are summarized in the three broad levels listed below:
● | Level 1 – quoted prices in active markets for identical securities |
● | Level 2 – other significant observable inputs |
● | Level 3 – significant unobservable inputs |
Fixed income securities, including corporate bonds and municipal bonds, held by FBP Appreciation & Income Opportunities Fund are classified as Level 2 since the values for such securities are based on prices provided by an independent pricing service that utilizes various “other significant observable inputs” including bid and ask quotations, prices of similar securities and interest rates, among other factors.
The inputs or methodology used for valuing securities are not necessarily an indication of the risks associated with investing in those securities. The inputs used to measure fair value may fall into different levels of the fair value hierarchy. In such cases, for disclosure purposes, the level in the fair value hierarchy within which the fair value measurement falls in its entirety is determined based on the lowest level input that is significant to the fair value measurement.
The following is a summary of the inputs used to value each Fund’s investments and other financial instruments as of September 30, 2015 by security type:
FBP Equity & Dividend Plus Fund | | Level 1 | | | Level 2 | | | Level 3 | | | Total | |
Investments in Securities: | | | | | | | | | | | | |
Common Stocks | | $ | 23,754,331 | | | $ | — | | | $ | — | | | $ | 23,754,331 | |
Money Market Funds | | | 764,855 | | | | — | | | | — | | | | 764,855 | |
Total | | $ | 24,519,186 | | | $ | — | | | $ | — | | | $ | 24,519,186 | |
| | | | | | | | | | | | | | | | | |
Other Financial Instruments: | | | | | | | | | | | | | | | | |
Written Covered Call Options | | $ | (68,510 | ) | | $ | — | | | $ | — | | | $ | (68,510 | ) |
Total | | $ | (68,510 | ) | | $ | — | | | $ | — | | | $ | (68,510 | ) |
FBP Appreciation & Income Opportunities Fund | | Level 1 | | | Level 2 | | | Level 3 | | | Total | |
Investments in Securities: | | | | | | | | | | | | |
Common Stocks | | $ | 25,689,130 | | | $ | — | | | $ | — | | | $ | 25,689,130 | |
Corporate Bonds | | | — | | | | 2,253,573 | | | | — | | | | 2,253,573 | |
Municipal Bonds | | | — | | | | 300,003 | | | | — | | | | 300,003 | |
Money Market Funds | | | 4,694,474 | | | | — | | | | — | | | | 4,694,474 | |
Total | | $ | 30,383,604 | | | $ | 2,553,576 | | | $ | — | | | $ | 32,937,180 | |
| | | | | | | | | | | | | | | | | |
Other Financial Instruments: | | | | | | | | | | | | | | | | |
Written Covered Call Options | | $ | (35,260 | ) | | $ | — | | | $ | — | | | $ | (35,260 | ) |
Total | | $ | (35,260 | ) | | $ | — | | | $ | — | | | $ | (35,260 | ) |
23
THE FLIPPIN, BRUCE & PORTER FUNDS
NOTES TO FINANCIAL STATEMENTS (Continued) |
Refer to each Fund’s Schedule of Investments for a listing of the common stocks and corporate bonds by sector type. As of September 30, 2015, the Funds did not have any transfers into and out of any Level. There were no Level 3 securities held by the Funds as of September 30, 2015. It is the Funds’ policy to recognize transfers into and out of any Level at the end of the reporting period.
Share valuation — The net asset value per share of each Fund is calculated daily by dividing the total value of its assets, less liabilities, by the number of shares outstanding. The offering price and redemption price per share of each Fund is equal to its net asset value per share.
Investment income — Interest income is accrued as earned. Dividend income is recorded on the ex-dividend date. Discounts and premiums on fixed income securities purchased are amortized using the interest method.
Distributions to shareholders — Dividends arising from net investment income are declared and paid quarterly to shareholders of each Fund. Net realized short-term capital gains, if any, may be distributed throughout the year and net realized long-term capital gains, if any, are distributed at least once each year. The amount of distributions from net investment income and net realized capital gains are determined in accordance with federal income tax regulations, which may differ from GAAP. These “book/tax” differences are either temporary or permanent in nature. Dividends and distributions are recorded on the ex-dividend date. The tax character of distributions paid during the periods ended September 30, 2015 and March 31, 2015 was as follows:
| Period
Ended | | Ordinary Income | | | Long-Term Capital Gains | | | Total Distributions | |
FBP Equity & Dividend Plus Fund | 9/30/2015 | | $ | 338,118 | | | $ | 137,902 | | | $ | 476,020 | |
| | 3/31/2015 | | $ | 587,146 | | | $ | 518,508 | | | $ | 1,105,654 | |
FBP Appreciation & Income Opportunities Fund | 9/30/2015 | | $ | 312,518 | | | $ | 1,142,354 | | | $ | 1,454,872 | |
| | 3/31/2015 | | $ | 553,302 | | | $ | 1,338,239 | | | $ | 1,891,541 | |
Security transactions — Security transactions are accounted for on trade date for financial reporting purposes. Gains and losses on securities sold are determined on a specific identification basis.
Common expenses — Common expenses of the Trust are allocated among the series of the Trust based on relative net assets of each series or the nature of the services performed and the relative applicability to each series.
Options transactions — When the Funds’ investment adviser believes that individual portfolio securities held by the Funds are approaching the top of the adviser’s growth and price expectations, covered call options may be written (sold) against such securities and the Funds will receive a premium in return. The Funds write options only for income generation and hedging purposes and not for speculation. The premiums received from writing the options are recorded as a liability and are subsequently valued daily at the closing prices on their primary exchanges. Premiums received from writing options which expire are treated as realized gains. Premiums received from writing options which are exercised increase the proceeds used to calculate the realized gain or loss on the sale of the security. If a closing purchase transaction is used to terminate a Fund’s obligation on a call option, a gain or loss will be realized, depending upon whether the price of the closing purchase transaction is more or less than the premium previously received on the call option written.
24
THE FLIPPIN, BRUCE & PORTER FUNDS
NOTES TO FINANCIAL STATEMENTS (Continued) |
The Funds may also purchase put options on stock indices. By purchasing a put option on a stock index, a Fund could hedge the risk of a general market decline. The value of the put option would be expected to rise as a result of a market decline and thus could offset all or a portion of losses resulting from declines in the prices of individual securities held by a Fund. However, option premiums tend to decrease over time as the expiration date nears. Therefore, because of the cost of the option (in the form of premium and transaction costs), a Fund would suffer a loss on the put option if prices do not decline, or do not decline sufficiently, to offset the deterioration in the value of the option premium. Premiums paid for buying options that expire are treated as realized losses. Premiums paid from buying options which are exercised decrease the proceeds used to calculate the realized gain or loss on the exercise of the options.
Estimates — The preparation of financial statements in conformity with GAAP requires management to make estimates and assumptions that affect the reported amounts of assets and liabilities and the disclosure of contingent assets and liabilities as of the date of the financial statements and the reported amounts of income and expenses during the reporting period. Actual results could differ from those estimates.
Federal income tax — Each Fund has qualified and intends to continue to qualify as a regulated investment company under the Internal Revenue Code of 1986 (the “Code”). Qualification generally will relieve the Funds of liability for federal income taxes to the extent 100% of their net investment income and any net realized capital gains are distributed in accordance with the Code. Accordingly, no provision for income tax has been made.
In order to avoid imposition of the excise tax applicable to regulated investment companies, it is also each Fund’s intention to declare as dividends in each calendar year at least 98% of its net investment income (earned during the calendar year) and 98.2% of its net realized capital gains (earned during the twelve months ended October 31) plus undistributed amounts from prior years.
The following information is computed on a tax basis for each item as of September 30, 2015:
| | FBP Equity
& Dividend
Plus Fund | | | FBP Appreciation & Income Opportunities
Fund | |
Tax cost of portfolio investments | | $ | 22,479,985 | | | $ | 28,611,330 | |
Gross unrealized appreciation | | $ | 3,961,206 | | | $ | 6,862,928 | |
Gross unrealized depreciation | | | (1,922,005 | ) | | | (2,537,078 | ) |
Net unrealized appreciation on investments | | | 2,039,201 | | | | 4,325,850 | |
Net unrealized appreciation (depreciation) on option contracts | | | 51,509 | | | | (7,226 | ) |
Undistributed ordinary income | | | 3,206 | | | | 11,712 | |
Other gains | | | 1,030,606 | | | | 597,920 | |
Other temporary differences | | | (3,087 | ) | | | (10,674 | ) |
Accumulated earnings | | $ | 3,121,435 | | | $ | 4,917,582 | |
As of September 30, 2015, the tax cost of written options for FBP Equity & Dividend Plus Fund and FBP Appreciation & Income Opportunities Fund is $120,019 and $28,034, respectively.
25
THE FLIPPIN, BRUCE & PORTER FUNDS
NOTES TO FINANCIAL STATEMENTS (Continued) |
The difference between the federal income tax cost of portfolio investments and the financial statement cost for FBP Appreciation & Income Opportunities Fund is due to certain differences in the recognition of capital gains and losses under income tax regulations and GAAP. These “book/tax” differences are temporary in nature and are primarily due to differing methods in the amortization of discounts and premiums on fixed income securities.
During the six months ended September 30, 2015, FBP Appreciation & Income Opportunities Fund realized $1,077,346 of net capital gains resulting from in-kind redemptions (redemptions in which shareholders who redeemed Fund shares received securities held by the Fund rather than cash). The Fund recognizes a gain on in-kind redemptions to the extent that the value of the distributed securities on the date of redemption exceeds the cost of those securities. Such gains are not taxable to the Fund and are not required to be distributed to shareholders. The Fund has reclassified this amount against paid-in capital on the Statement of Assets and Liabilities. Such reclassification, the result of permanent differences between the financial statement and income tax reporting requirements, has no effect on the Fund’s net assets or net asset value per share.
The Funds recognize the tax benefits or expenses of uncertain tax positions only when the position is “more likely than not” to be sustained assuming examination by tax authorities. Management has reviewed the tax positions taken on federal income tax returns for the current and all open tax years (tax years ended March 31, 2012 through March 31, 2015) of each Fund and has concluded that no provision for unrecognized tax benefits or expenses is required in these financial statements.
3. Investment Transactions
Investment transactions, other than short-term investments and U.S. government securities, were as follows for the six months ended September 30, 2015:
| | FBP Equity
& Dividend
Plus Fund | | | FBP Appreciation & Income Opportunities
Fund | |
Purchases of investment securities | | $ | 3,750,589 | | | $ | 4,414,015 | |
Proceeds from sales and maturities of investment securities | | $ | 3,312,499 | | | $ | 3,640,385 | |
4. Transactions with Related Parties
INVESTMENT ADVISORY AGREEMENTS
Each Fund’s investments are managed by Flippin, Bruce & Porter, Inc. (the “Adviser”) under the terms of an Investment Advisory Agreement. Under the Investment Advisory Agreements, each Fund pays the Adviser a fee, which is computed and accrued daily and paid monthly, at an annual rate of .70% of its average daily net assets up to $250 million; .65% of the next $250 million of such assets; and .50% of such assets in excess of $500 million.
During the six months ended September 30, 2015, the Adviser voluntarily waived $20,746 and $11,712 of its investment advisory fees from FBP Equity & Dividend Plus Fund and FBP Appreciation & Income Opportunities Fund, respectively.
26
THE FLIPPIN, BRUCE & PORTER FUNDS
NOTES TO FINANCIAL STATEMENTS (Continued) |
Certain officers of the Trust are also officers of the Adviser.
OTHER SERVICE PROVIDERS
Ultimus Fund Solutions, LLC (“Ultimus”) provides fund administration, fund accounting, compliance and transfer agent services to the Funds. The Funds pay Ultimus fees in accordance with the agreements for such services. In addition, the Funds pay out-of-pocket expenses including, but not limited to, postage, supplies, and costs of pricing the Funds’ portfolio securities. Certain officers of the Trust are also officers of Ultimus, or of Ultimus Fund Distributors, LLC (the “Distributor”), the principal underwriter of each Fund’s shares and an affiliate of Ultimus. The Distributor is compensated by the Adviser (not the Funds) for acting as principal underwriter.
COMPENSATION OF TRUSTEES
Trustees and officers affiliated with the Adviser or Ultimus are not compensated by the Trust for their services. Each Trustee who is not an affiliated person of the Adviser or Ultimus receives from the Trust an annual retainer of $12,000, payable quarterly; a fee of $1,500 for attendance at each meeting of the Board of Trustees (except that such fee is $2,500 for the independent chariman); and a fee of $1,000 for attendance at each meeting of any committee of the Board (except that such fee is $1,500 for the committee chairman); plus reimbursement of travel and other expenses incurred in attending meetings. Each Fund pays its proportionate share of such fees.
5. Derivatives Transactions
Transactions in covered call option contracts written by the Funds during the six months ended September 30, 2015 were as follows:
| | |
FBP Equity &
Dividend
Plus Fund | | | FBP Appreciation
& Income
Opportunities Fund | |
| | Option Contracts | | | Option Premiums | | | Option Contracts | | | Option Premiums | |
Options outstanding at beginning of period | | | 1,539 | | | $ | 293,687 | | | | 633 | | | $ | 147,548 | |
Options written | | | 1,051 | | | | 123,145 | | | | 120 | | | | 28,034 | |
Options cancelled in a closing purchase transaction | | | (700 | ) | | | (140,125 | ) | | | (273 | ) | | | (66,819 | ) |
Options expired | | | (562 | ) | | | (106,935 | ) | | | (275 | ) | | | (61,813 | ) |
Options exercised | | | (219 | ) | | | (49,753 | ) | | | (85 | ) | | | (18,916 | ) |
Options outstanding at end of period | | | 1,109 | | | $ | 120,019 | | | | 120 | | | $ | 28,034 | |
27
THE FLIPPIN, BRUCE & PORTER FUNDS
NOTES TO FINANCIAL STATEMENTS (Continued) |
The location in the Statements of Assets and Liabilities of the Funds’ derivative positions is as follows:
FBP Equity & Dividend Plus Fund
| | | |
Fair Value
| | | | |
Type of Derivative | Location | | Asset Derivatives | | | Liability Derivatives | | | Gross Notional Amount Outstanding September 30,
2015 | |
Covered call options written | Covered call options, at value | | | — | | | $ | (68,510 | ) | | $ | (3,313,376 | ) |
FBP Appreciation & Income Opportunities Fund
| | | |
Fair Value
| | | | |
Type of Derivative | Location | | Asset
Derivatives | | | Liability
Derivatives | | | Gross Notional Amount Outstanding Septmber 30,
2015 | |
Covered call options written | Covered call options, at value | | | — | | | $ | (35,260 | ) | | $ | (591,800 | ) |
The average monthly notional amount of option contracts written during the six months ended September 30, 2015 was $3,823,893 and $1,277,874 for FBP Equity & Dividend Plus Fund and FBP Appreciation & Income Opportunities Fund, respectively.
Transactions in derivative instruments during the six months ended September 30, 2015 by the Funds are recorded in the following location in the Statements of Operations:
FBP Equity & Dividend Plus Fund
Type of Derivative | Location | | Net
Realized
Gains (Losses) | | Location | | Change in Unrealized Appreciation (Depreciation) | |
Covered call options written | Net realized gains from option contracts | | $ | 68,252 | | Net change in unrealized appreciation/depreciation on option contracts | | $ | 129,970 | |
FBP Appreciation & Income Opportunities Fund
Type of Derivative | Location | | Net
Realized
Gains (Losses) | | Location | | Change in Unrealized Appreciation (Depreciation) | |
Covered call options written | Net realized gains from option contracts | | $ | 80,332 | | Net change in unrealized appreciation/depreciation on option contracts | | $ | 18,081 | |
28
THE FLIPPIN, BRUCE & PORTER FUNDS
NOTES TO FINANCIAL STATEMENTS (Continued) |
6. Contingencies and Commitments
The Funds indemnify the Trust’s officers and Trustees for certain liabilities that might arise from their performance of their duties to the Funds. Additionally, in the normal course of business the Funds enter into contracts that contain a variety of representations and warranties and which provide general indemnifications. The Funds’ maximum exposure under these arrangements is unknown, as this would involve future claims that may be made against the Funds that have not yet occurred. However, based on experience, the Funds expect the risk of loss to be remote.
7. Subsequent Events
The Funds are required to recognize in the financial statements the effects of all subsequent events that provide additional evidence about conditions that existed as of the date of the Statements of Assets and Liabilities. For non-recognized subsequent events that must be disclosed to keep the financial statements from being misleading, the Funds are required to disclose the nature of the event as well as an estimate of its financial effect, or a statement that such an estimate cannot be made. Management has evaluated subsequent events through the issuance of these financial statements and has noted no such events.
29
THE FLIPPIN, BRUCE & PORTER FUNDS
ABOUT YOUR FUNDS’ EXPENSES (Unaudited) |
We believe it is important for you to understand the impact of costs on your investment. All mutual funds have operating expenses. As a shareholder of the Funds, you incur ongoing costs, including management fees and other operating expenses. These ongoing costs, which are deducted from each Fund’s gross income, directly reduce the investment return of the Funds.
A mutual fund’s ongoing costs are expressed as a percentage of its average net assets. This figure is known as the expense ratio. The following examples are intended to help you understand the ongoing costs (in dollars) of investing in the Funds and to compare these costs with the ongoing costs of investing in other mutual funds. The examples below are based on an investment of $1,000 made at the beginning of the period shown and held for the entire period (April 1, 2015 through September 30, 2015).
The table below illustrates each Fund’s ongoing costs in two ways:
Actual fund return – This section helps you to estimate the actual expenses that you paid over the period. The “Ending Account Value” shown is derived from each Fund’s actual return, and the third column shows the dollar amount of operating expenses that would have been paid by an investor who started with $1,000 in the Funds. You may use the information here, together with the amount you invested, to estimate the expenses that you paid over the period.
To do so, simply divide your account value by $1,000 (for example, an $8,600 account value divided by $1,000 = 8.6), then multiply the result by the number given for the Funds under the heading “Expenses Paid During Period.”
Hypothetical 5% return – This section is intended to help you compare the Funds’ ongoing costs with those of other mutual funds. It assumes that each Fund had an annual return of 5% before expenses during the period shown, but that the expense ratio is unchanged. In this case, because the returns used are not the Funds’ actual returns, the results do not apply to your investment. The example is useful in making comparisons because the Securities and Exchange Commission (“SEC”) requires all mutual funds to calculate expenses based on a 5% return. You can assess each Fund’s ongoing costs by comparing this hypothetical example with the hypothetical examples that appear in shareholder reports of other funds.
Note that expenses shown in the table are meant to highlight and help you compare ongoing costs only. The Funds do not charge sales loads or redemption fees.
The calculations assume no shares were bought or sold during the period. Your actual costs may have been higher or lower, depending on the amount of your investment and the timing of any purchases or redemptions.
More information about the Funds’ expenses, including annual expense ratios for the past five fiscal years, can be found in this report. For additional information on operating expenses and other shareholder costs, please refer to the Funds’ prospectus.
30
THE FLIPPIN, BRUCE & PORTER FUNDS
ABOUT YOUR FUNDS’ EXPENSES (Unaudited) (Continued) |
| Beginning
Account Value
April 1,
2015 | Ending
Account Value
September 30,
2015 | Net
Expense Ratio(a) | Expenses Paid
During Period(b) |
FBP Equity & Dividend Plus Fund | | | |
Based on Actual Fund Return | $1,000.00 | $904.00 | 1.07% | $5.11 |
Based on Hypothetical 5% Return (before expenses) | $1,000.00 | $1,019.70 | 1.07% | $5.42 |
FBP Appreciation & Income Opportunities Fund | | | |
Based on Actual Fund Return | $1,000.00 | $ 908.90 | 1.00% | $4.79 |
Based on Hypothetical 5% Return (before expenses) | $1,000.00 | $1,020.05 | 1.00% | $5.06 |
(a) | Annualized, based on the Fund’s most recent one-half year expenses. |
(b) | Expenses are equal to the Fund’s annualized expense ratio multiplied by the average account value over the period, multiplied by 183/365 (to reflect the one-half year period). |
OTHER INFORMATION (Unaudited)
The Trust files a complete listing of portfolio holdings for the Funds with the SEC as of the end of the first and third quarters of each fiscal year on Form N-Q. The filings are available upon request, by calling 1-800-327-9375. Furthermore, you may obtain a copy of these filings on the SEC’s website at http://www.sec.gov. The Trust’s Forms N-Q may also be reviewed and copied at the SEC’s Public Reference Room in Washington, DC, and information on the operation of the Public Reference Room may be obtained by calling 1-800-SEC-0330.
A description of the policies and procedures that the Funds use to determine how to vote proxies relating to portfolio securities is available without charge upon request by calling toll-free 1-800-327-9375, or on the SEC’s website at http://www.sec.gov. Information regarding how the Funds voted proxies relating to portfolio securities during the most recent 12-month period ended June 30 is also available without charge upon request by calling toll-free 1-800-327-9375, or on the SEC’s website at http://www.sec.gov.
31
This page intentionally left blank.
This page intentionally left blank.
|
Investment Adviser Flippin, Bruce & Porter, Inc. 800 Main Street, Second Floor P.O. Box 6138 Lynchburg, Virginia 24505 Toll-Free 1-800-327-9375 www.fbpfunds.com Administrator Ultimus Fund Solutions, LLC P.O. Box 46707 Cincinnati, Ohio 45246-0707 Toll-Free 1-866-738-1127 Custodian US Bank NA 425 Walnut Street Cincinnati, Ohio 45202 Independent Registered
Public Accounting Firm Ernst & Young LLP 1900 Scripps Center 312 Walnut Street Cincinnati, Ohio 45202 | Legal Counsel Sullivan & Worcester LLP One Post Office Square Boston, Massachusetts 02109 Officers John T. Bruce, President and Portfolio Manager John H. Hanna, IV, Vice President
David J. Marshall, Vice President R. Gregory Porter, III,
Vice President Trustees Robert S. Harris, Ph.D., Chairman John P. Ackerly, IV John T. Bruce George K. Jennison Harris V. Morrissette Elizabeth W. Robertson |
THE GOVERNMENT STREET FUNDS No-Load Mutual Funds Semi-Annual Report
September 30, 2015
(Unaudited) |
The Government Street Equity Fund The Government Street Mid-Cap Fund The Alabama Tax Free Bond Fund |
LETTER FROM THE PRESIDENT | October 2015 |
Dear Fellow Shareholders:
We are enclosing for your review the Semi-Annual Report of The Government Street Funds for the six months ended September 30, 2015.
The Government Street Equity Fund
The Government Street Equity Fund had a negative return of -6.87% for the semi-annual fiscal period ended September 30, 2015. By comparison, the S&P 500 Index (the “S&P 500”) and the Morningstar Large Cap Blend Equity category were down -6.18% and -6.68%, respectively.
Negative market performance was felt across all economic categories. Additionally, global markets turned extremely negative to reinforce and contribute to domestic sentiments. Large international markets, proxied by the MSCI EAFE Index, were down -9.68%. Emerging markets, which contain China, Russia, India and Brazil as major participants, as proxied by the MSCI EAFE EM Index, were down -17.33%. Disruptions were widespread as falling energy prices, high global debt, earnings declines and geopolitical uncertainty converged. There was really no place to hide except cash, which has, of course, zero returns.
On a relative basis, the large capitalization domestic market was not a bad place to be invested. However, most large capitalization companies have exposure to the global markets. It is estimated that approximately 60% of the S&P 500’s earnings are tied to global business results. If artificially suppressed interest rates and quantitative earnings do not result in improved business conditions, we are of the opinion that future investment returns will be negatively challenged.
As we proceed, we will continue to invest in what we believe are high quality companies that have great prospects in normal times. If the current downturn is a correction, we believe the results of such actions will be positive and felt relatively quickly. If the downturn is more rooted in longer economic problems, we are of the opinion the positive results will be pushed further into the future. In any event, we believe that diversification across a portfolio of quality stocks and consistent application will work to the benefit of shareholders. Stay the course.
The top 10 holdings in The Government Street Equity Fund as of September 30, 2015 were:
Security Description | % of Net Assets |
Apple, Inc. | 5.6% |
Vanguard Mid-Cap ETF | 3.9% |
Visa, Inc. - Class A | 3.7% |
Walt Disney Company (The) | 3.2% |
MasterCard, Inc. - Class A | 3.0% |
General Dynamics Corporation | 2.3% |
JPMorgan Chase & Company | 2.1% |
Comcast Corporation - Class A | 2.1% |
Allergan plc | 2.0% |
Gilead Sciences, Inc. | 2.0% |
1
The significant positive individual performances held for the entire six month period as measured by the internal rate of return were:
Security Description | Return |
AGL Resources, Inc. | 25.20% |
NIKE, Inc. - Class B | 21.97% |
Mondelez International Inc. - Class A | 16.94% |
Google, Inc. - Class A | 15.08% |
Adobe Systems, Inc. | 11.20% |
Altria Group, Inc. | 10.99% |
The 5 worst individual performances of securities held for the entire six months measured by the internal rate of return were:
Security Description | Return |
United Technologies Corporation | -23.08% |
Norfolk Southern Corporation | -24.73% |
Pioneer Natural Resources Company | -25.59% |
Yahoo!, Inc. | -34.94% |
Micron Technology, Inc. | -44.42% |
The positive returns in the Fund within any economic group were minimal for the semiannual fiscal period. Only 2 sectors, Utilities and Consumer Staples, turned in positive aggregate results. Utilities were up 5.47% while Consumer Staples had a 1.92% positive return. In both instances, merger announcements accounted for the overall upward results. Southern Co. announced a plan to acquire AGL Resources and Kraft Foods merged with Heinz Co.
The negative results, in the economic groups, came from the expected sources. Energy led with a -16.45% return for the semiannual period. Industrials and Materials followed with -11.31% and -11.11%, respectively.
Note: The investment performances listed for economic sectors and securities in the preceding paragraphs are extracted from an in-house independent internal rate of return computation by the Advent Axys portfolio accounting system. The calculations are gross investment returns.
There were few positive results to be found. Obviously, the important question of whether the results were a much overdue correction or the beginning of a new recessionary period surfaced.
As of September 30, 2015, the Fund’s net assets were $79,941,444 and the net asset value per share was $59.93. The portfolio turnover rate for the semi-annual fiscal period was 4%. The Fund’s expense ratio was 0.85%. The twelve month total return was -1.52%.
The Government Street Mid-Cap Fund
The Government Street Mid-Cap Fund produced a semiannual fiscal period return, ended September 30, 2015, of -7.14%. The Fund’s benchmark, the S&P Mid Cap 400, produced a -9.47% result during the same period. Both the benchmark and your Fund are intended to reflect the results of participating in investments that are
2
classified as mid cap companies. Your managers consider mid cap companies to be a great opportunity for future growth. They generally are large enough to have moved beyond the financial and business difficulties of small corporations, but have prospects to grow into the upper tiers of American companies.
Your Fund’s investments are impacted by the same general economic environment as the larger, complimentary S&P 500 Index. As such, the reader should refer to The Government Street Equity Fund’s commentary for additional color on the markets.
The top 10 holdings in The Government Street Mid Cap Fund as of September 30, 2015 were:
Security Description | % of Net Assets |
Vanguard Mid-Cap ETF | 3.4% |
Guggenheim Mid-Cap Core ETF | 2.7% |
Mid-America Apartment Communities, Inc. | 2.3% |
iShares NASDQ Biotechnology ETF | 2.0% |
Hormel Foods Corporation | 1.7% |
Church & Dwight Company, Inc. | 1.6% |
Snap-on, Inc. | 1.4% |
Jack Henry & Associates, Inc. | 1.4% |
O’Reilly Automotive, Inc. | 1.3% |
Jarden Corporation | 1.3% |
The three Exchange Traded Funds (ETFs) are index type of investments that provide broad diversification and are used primarily to reduce the risk of the overall portfolio. The investments are highly liquid and can readily provide funds for individual security purchases or to meet any cash needs without disrupting overall diversification or significantly affecting overall portfolio returns.
The most significant positive individual performances of securities held for the entire six month period as measured by the internal rate of return were:
Security Description | Return |
HCC Insurance Holdings, Inc. | 38.00% |
Cameron International Corporation | 35.90% |
AGL Resources, Inc. | 25.20% |
Panera Bread Company - Class A | 19.13% |
O’Reilly Automotive, Inc. | 15.54% |
The 5 worst individual performances of securities held for the entire six months measured by the internal rate of return were:
Security Description | Return |
Donaldson Company, Inc. | -24.71% |
Potlatch Corporation | -26.36% |
ResMed, Inc. | -28.46% |
ONEOK, Inc. | -30.74% |
WESCO International, Inc. | -33.51% |
3
The Fund had two economic sectors in the six month period with positive results. The Financials sector was up 2.47% and the Consumer Staples sector turned in 2.38%. On the downside, the Materials sector led at -12.77%. It was followed by the Industrials sector at -11.90%.
Note: The investment performances listed for economic sectors and securities in the preceding paragraphs are extracted from an in-house independent internal rate of return computation by the Advent Axys portfolio accounting system. The calculations are gross investment returns.
As of September 30, 2015, the net assets of The Government Street Mid-Cap Fund were $44,680,918 and the net asset value per share was $20.59. The portfolio turnover rate for the semi-annual fiscal period was 6%. The Fund’s expense ratio was 1.07%. The twelve month total return was 1.74%.
The Alabama Tax Free Bond Fund
The Federal Reserve (the “Fed”) decision as to when to begin the process of raising interest rates continues to be the primary focus of fixed income investors. The Fed has clearly stated that the decision to raise rates for the first time in six years will be dependent upon financial data. There remains, however, a great deal of uncertainty about how the Fed will interpret such data. The Fed generally wants to avoid making any moves that would result in market volatility so it has done all it can do to telegraph its intentions.
The Fed decided not to raise the federal funds rate at its latest meeting in September. The Fed stated that “recent global economic and financial developments may restrain economic activity somewhat and are likely to put further downward pressure on inflation in the near term.” In her press conference, Fed Chair Janet Yellen pointed specifically to the recent developments in China and emerging markets as factors that gave the Fed pause. She also noted the “tightening of financial conditions” due to the stock market declines, a stronger dollar, and wider credit spreads since the Fed’s last meeting. In addition, the Fed’s preferred measure of inflation is still well below its 2% target, at 1.3% year over year. On the positive side, the Fed highlighted the continued strengthening of the U.S. labor market, with unemployment down to 5.1%. However, wage growth remains restrained (e.g. average hourly earnings growth remains around 2.2% year over year) Thirteen out of the seventeen Fed policymakers indicated that they expect to raise rates at least once this year, with six of the thirteen expressing a preference for two rate hikes.
There is general consensus that, in and of itself, a 25 basis point increase in the federal funds rate (from its current level near zero) will not move the economic needle or snuff out economic growth, no matter how weak it may be. And few believe that the Fed’s first move – whether made in October or December, or next January or March – will make a fundamental economic difference. The pace and magnitude of subsequent rate hikes are much more important than the timing of the first rate hike.
Municipal bonds posted modest positive returns during the past six months. The total return of The Alabama Tax Free Bond Fund for the six months ended September 30, 2015 was 0.56%. For the same period, the Barclays Capital 3-Year Municipal Bond Index had a return of 0.78% and the Barclays Capital 7-Year Municipal Bond Index
4
returned 0.86%. The total return for the twelve month period for the Fund was 0.73%. The Alabama Tax Free Bond Fund has a generally defensive portfolio of high quality and short duration bonds. More than 98% of the portfolio is rated A, AA or AAA by Moody’s or Standard & Poor’s rating agencies. The duration of the portfolio as of September 30, 2015 was 2.8 years, identical to the duration at the end of the prior fiscal year. The Fund’s weighted average maturity was 3.1 years, the same as the average maturity at the end of the prior fiscal year.
The net assets of the Fund as of September 30, 2015 were $29,034,836 and the net asset value per share was $10.48. The ratio of net investment income to average net assets during the six months was 1.30% and the ratio of net expenses to average net assets was 0.65%.
Thank you for your continued confidence in The Government Street Funds. Please call us if we can be of further service to you.
Very truly yours,

Thomas W. Leavell
President
Leavell Investment Management, Inc.
The Government Street Funds
Data presented reflects past performance, which is no guarantee of future results. Investment results and principal value will fluctuate so that shares, when redeemed, may be worth more or less than their original cost. Due to market volatility, current performance may be higher or lower than the performance shown.
This report is submitted for the general information of the shareholders of the Funds. The report is not authorized for distribution to prospective investors in the Funds unless it is accompanied by a current prospectus.
This report reflects our views, opinions and portfolio holdings as of September 30, 2015, the end of the reporting period. These views are subject to change at any time based upon market or other conditions. For more current information throughout the year please visit www.leavellinvestments.com.
5
THE GOVERNMENT STREET EQUITY FUND PORTFOLIO INFORMATION
September 30, 2015 (Unaudited)
Asset Allocation
(% of Net Assets)
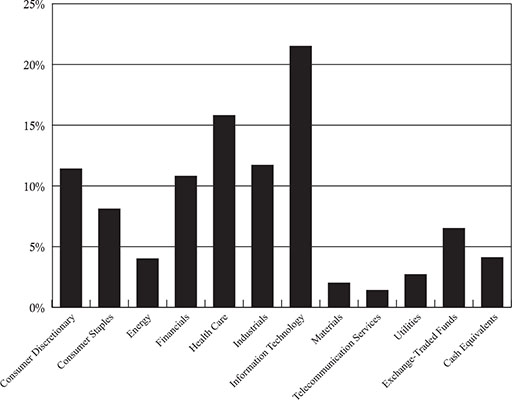
Top Ten Equity Holdings
Security Description | % of Net Assets |
Apple, Inc. | 5.6% |
Vanguard Mid-Cap ETF | 3.9% |
Visa, Inc. - Class A | 3.7% |
Walt Disney Company (The) | 3.2% |
MasterCard, Inc. - Class A | 3.0% |
General Dynamics Corporation | 2.3% |
JPMorgan Chase & Company | 2.1% |
Comcast Corporation - Class A | 2.1% |
Allergan plc | 2.0% |
Gilead Sciences, Inc. | 2.0% |
6
THE GOVERNMENT STREET MID-CAP FUND PORTFOLIO INFORMATION
September 30, 2015 (Unaudited)
Asset Allocation
(% of Net Assets)

Top Ten Equity Holdings
Security Description | % of Net Assets |
Vanguard Mid-Cap ETF | 3.4% |
Guggenheim Mid-Cap Core ETF | 2.7% |
Mid-America Apartment Communities, Inc. | 2.3% |
iShares Nasdaq Biotechnology ETF | 2.0% |
Hormel Foods Corporation | 1.7% |
Church & Dwight Company, Inc. | 1.6% |
Snap-on, Inc. | 1.4% |
Jack Henry & Associates, Inc. | 1.4% |
O'Reilly Automotive, Inc. | 1.3% |
Jarden Corporation | 1.3% |
7
THE ALABAMA TAX FREE BOND FUND
PORTFOLIO INFORMATION
September 30, 2015 (Unaudited)
Asset Allocation
(% of Net Assets)

Distribution by Rating |
Rating | | % of Holdings |
AAA | | 9.3% |
AA | | 79.8% |
A | | 9.0% |
Not Rated | | 1.9% |
8
THE GOVERNMENT STREET EQUITY FUND
SCHEDULE OF INVESTMENTS
September 30, 2015 (Unaudited) | |
COMMON STOCKS — 89.4% | | Shares | | | Value | |
Consumer Discretionary — 11.4% | | | | | | |
Comcast Corporation - Class A | | | 30,000 | | | $ | 1,706,400 | |
Home Depot, Inc. (The) | | | 7,200 | | | | 831,528 | |
Johnson Controls, Inc. | | | 15,400 | | | | 636,944 | |
Lowe's Companies, Inc. | | | 8,000 | | | | 551,360 | |
McDonald's Corporation | | | 5,000 | | | | 492,650 | |
NIKE, Inc. - Class B | | | 9,350 | | | | 1,149,770 | |
TEGNA, Inc. | | | 21,000 | | | | 470,190 | |
Tractor Supply Company | | | 9,000 | | | | 758,880 | |
Walt Disney Company (The) | | | 24,775 | | | | 2,532,005 | |
| | | | | | | | 9,129,727 | |
Consumer Staples — 8.1% | | | | | | | | |
Altria Group, Inc. | | | 16,700 | | | | 908,480 | |
Anheuser-Busch InBev SA/NV - ADR | | | 10,000 | | | | 1,063,200 | |
Coca-Cola Company (The) | | | 12,000 | | | | 481,440 | |
CVS Health Corporation | | | 12,000 | | | | 1,157,760 | |
Kraft Heinz Company (The) | | | 3,378 | | | | 238,419 | |
McCormick & Company, Inc. - Non-Voting Shares | | | 7,000 | | | | 575,260 | |
Mondelēz International, Inc. - Class A | | | 28,336 | | | | 1,186,428 | |
Philip Morris International, Inc. | | | 7,860 | | | | 623,534 | |
Procter & Gamble Company (The) | | | 3,000 | | | | 215,820 | |
| | | | | | | | 6,450,341 | |
Energy — 4.0% | | | | | | | | |
ConocoPhillips | | | 24,500 | | | | 1,175,020 | |
Phillips 66 | | | 14,300 | | | | 1,098,812 | |
Pioneer Natural Resources Company | | | 7,500 | | | | 912,300 | |
| | | | | | | | 3,186,132 | |
Financials — 10.8% | | | | | | | | |
Aflac, Inc. | | | 10,565 | | | | 614,143 | |
American International Group, Inc. | | | 21,000 | | | | 1,193,220 | |
Brookfield Asset Management, Inc. - Class A | | | 33,500 | | | | 1,053,240 | |
Goldman Sachs Group, Inc. (The) | | | 6,500 | | | | 1,129,440 | |
JPMorgan Chase & Company | | | 28,000 | | | | 1,707,160 | |
Mid-America Apartment Communities, Inc. | | | 11,394 | | | | 932,827 | |
PNC Financial Services Group, Inc. (The) | | | 7,000 | | | | 624,400 | |
U.S. Bancorp | | | 4,500 | | | | 184,545 | |
Wells Fargo & Company | | | 24,000 | | | | 1,232,400 | |
| | | | | | | | 8,671,375 | |
Health Care — 15.8% | | | | | | | | |
Abbott Laboratories | | | 12,000 | | | | 482,640 | |
AbbVie, Inc. | | | 11,500 | | | | 625,715 | |
Alexion Pharmaceuticals, Inc. (a) | | | 1,000 | | | | 156,390 | |
Allergan plc (a) | | | 6,000 | | | | 1,630,860 | |
9
THE GOVERNMENT STREET EQUITY FUND
SCHEDULE OF INVESTMENTS (Continued) | |
COMMON STOCKS — 89.4% (Continued) | | Shares | | | Value | |
Health Care — 15.8% (Continued) | | | | | | |
Amgen, Inc. | | | 2,000 | | | $ | 276,640 | |
Becton, Dickinson and Company | | | 621 | | | | 82,382 | |
Bio-Techne Corporation | | | 10,000 | | | | 924,600 | |
Cardinal Health, Inc. | | | 15,000 | | | | 1,152,300 | |
Cerner Corporation (a) | | | 9,000 | | | | 539,640 | |
Gilead Sciences, Inc. | | | 16,000 | | | | 1,571,040 | |
Henry Schein, Inc. (a) | | | 4,500 | | | | 597,240 | |
Merck & Company, Inc. | | | 9,000 | | | | 444,510 | |
Novartis AG - ADR | | | 9,000 | | | | 827,280 | |
Pfizer, Inc. | | | 27,000 | | | | 848,070 | |
Regeneron Pharmaceuticals, Inc. (a) | | | 2,300 | | | | 1,069,822 | |
Shire plc - ADR | | | 3,000 | | | | 615,690 | |
Waters Corporation (a) | | | 6,475 | | | | 765,410 | |
| | | | | | | | 12,610,229 | |
Industrials — 11.7% | | | | | | | | |
Boeing Company (The) | | | 6,000 | | | | 785,700 | |
Emerson Electric Company | | | 13,000 | | | | 574,210 | |
General Dynamics Corporation | | | 13,600 | | | | 1,876,120 | |
Honeywell International, Inc. | | | 10,000 | | | | 946,900 | |
Ingersoll-Rand plc | | | 5,800 | | | | 294,466 | |
Lockheed Martin Corporation | | | 7,000 | | | | 1,451,170 | |
Norfolk Southern Corporation | | | 10,000 | | | | 764,000 | |
Quanta Services, Inc. (a) | | | 11,500 | | | | 278,415 | |
Stericycle, Inc. (a) | | | 7,000 | | | | 975,170 | |
United Technologies Corporation | | | 15,500 | | | | 1,379,345 | |
| | | | | | | | 9,325,496 | |
Information Technology — 21.5% | | | | | | | | |
Accenture plc - Class A | | | 9,500 | | | | 933,470 | |
Adobe Systems, Inc. (a) | | | 5,000 | | | | 411,100 | |
Apple, Inc. | | | 40,945 | | | | 4,516,233 | |
Automatic Data Processing, Inc. | | | 9,500 | | | | 763,420 | |
CDK Global, Inc. | | | 7,383 | | | | 352,760 | |
Google, Inc. - Class A (a) | | | 1,400 | | | | 893,718 | |
Google, Inc. - Class C (a) | | | 1,202 | | | | 731,321 | |
Intel Corporation | | | 12,000 | | | | 361,680 | |
MasterCard, Inc. - Class A | | | 26,750 | | | | 2,410,710 | |
Micron Technology, Inc. (a) | | | 30,000 | | | | 449,400 | |
Oracle Corporation | | | 6,500 | | | | 234,780 | |
QUALCOMM, Inc. | | | 12,000 | | | | 644,760 | |
TE Connectivity Ltd. | | | 12,500 | | | | 748,625 | |
Texas Instruments, Inc. | | | 12,000 | | | | 594,240 | |
Visa, Inc. - Class A | | | 42,000 | | | | 2,925,720 | |
Yahoo!, Inc. (a) | | | 6,000 | | | | 173,460 | |
| | | | | | | | 17,145,397 | |
10
THE GOVERNMENT STREET EQUITY FUND
SCHEDULE OF INVESTMENTS (Continued) | |
COMMON STOCKS — 89.4% (Continued) | | Shares | | | Value | |
Materials — 2.0% | | | | | | |
Dow Chemical Company (The) | | | 11,000 | | | $ | 466,400 | |
Ecolab, Inc. | | | 6,000 | | | | 658,320 | |
Praxair, Inc. | | | 5,000 | | | | 509,300 | |
| | | | | | | | 1,634,020 | |
Telecommunication Services — 1.4% | | | | | | | | |
Level 3 Communications, Inc. (a) | | | 5,000 | | | | 218,450 | |
Telstra Corporation Ltd. - ADR | | | 30,000 | | | | 589,500 | |
Verizon Communications, Inc. | | | 8,000 | | | | 348,080 | |
| | | | | | | | 1,156,030 | |
Utilities — 2.7% | | | | | | | | |
AGL Resources, Inc. | | | 6,000 | | | | 366,240 | |
Duke Energy Corporation | | | 8,250 | | | | 593,505 | |
Southern Company (The) | | | 11,000 | | | | 491,700 | |
WEC Energy Group, Inc | | | 14,000 | | | | 731,080 | |
| | | | | | | | 2,182,525 | |
| | | | | | | | | |
Total Common Stocks (Cost $43,104,893) | | | | | | $ | 71,491,272 | |
EXCHANGE-TRADED FUNDS — 6.5% | | Shares | | | Value | |
iShares Nasdaq Biotechnology ETF | | | 3,000 | | | $ | 909,990 | |
ProShares Large Cap Core Plus | | | 24,000 | | | | 1,108,080 | |
Vanguard Mid-Cap ETF | | | 26,900 | | | | 3,138,423 | |
Total Exchange-Traded Funds (Cost $3,206,592) | | | | | | $ | 5,156,493 | |
COMMERCIAL PAPER — 4.0% | | Par Value | | | Value | |
U.S. Bank, N.A., discount, 0.02% (b), due 10/01/2015 (Cost $3,208,000) | | $ | 3,208,000 | | | $ | 3,208,000 | |
11
THE GOVERNMENT STREET EQUITY FUND
SCHEDULE OF INVESTMENTS (Continued) | |
MONEY MARKET FUNDS — 0.2% | | Shares | | | Value | |
Invesco STIT - STIC Prime Portfolio (The) - Institutional Class, 0.08% (c) (Cost $190,001) | | | 190,001 | | | $ | 190,001 | |
| | | | | | | | | |
Total Investments at Value — 100.1% (Cost $49,709,486) | | | | | | $ | 80,045,766 | |
| | | | | | | | | |
Liabilities in Excess of Other Assets — (0.1%) | | | | | | | (104,322 | ) |
| | | | | | | | | |
Net Assets — 100.0% | | | | | | $ | 79,941,444 | |
ADR - American Depositary Receipt. |
(a) | Non-income producing security. |
(b) | Rate shown is the annualized yield at time of purchase, not a coupon rate. |
(c) | The rate shown is the 7-day effective yield as of September 30, 2015. |
See accompanying notes to financial statements. |
12
THE GOVERNMENT STREET MID-CAP FUND
SCHEDULE OF INVESTMENTS
September 30, 2015 (Unaudited) | |
COMMON STOCKS — 85.7% | | Shares | | | Value | |
Consumer Discretionary — 13.0% | | | | | | |
Buffalo Wild Wings, Inc. (a) | | | 2,035 | | | $ | 393,630 | |
Dollar Tree, Inc. (a) | | | 6,995 | | | | 466,287 | |
Gildan Activewear, Inc. - Class A | | | 13,400 | | | | 404,144 | |
Hasbro, Inc. | | | 5,200 | | | | 375,128 | |
Jarden Corporation (a) | | | 12,137 | | | | 593,257 | |
Leggett & Platt, Inc. | | | 5,500 | | | | 226,875 | |
Liberty Global plc - Series A (a) | | | 5,475 | | | | 235,096 | |
Liberty Global plc - Series C (a) | | | 4,475 | | | | 183,564 | |
Nordstrom, Inc. | | | 3,900 | | | | 279,669 | |
O'Reilly Automotive, Inc. (a) | | | 2,395 | | | | 598,750 | |
Panera Bread Company - Class A (a) | | | 2,390 | | | | 462,250 | |
Ross Stores, Inc. | | | 12,000 | | | | 581,640 | |
Service Corporation International | | | 15,200 | | | | 411,920 | |
Tiffany & Company | | | 3,475 | | | | 268,339 | |
VF Corporation | | | 4,700 | | | | 320,587 | |
| | | | | | | | 5,801,136 | |
Consumer Staples — 5.8% | | | | | | | | |
Church & Dwight Company, Inc. | | | 8,400 | | | | 704,760 | |
Edgewell Personal Care Company | | | 2,500 | | | | 204,000 | |
Energizer Holdings, Inc. | | | 2,500 | | | | 96,775 | |
Hormel Foods Corporation | | | 12,000 | | | | 759,720 | |
J.M. Smucker Company (The) | | | 4,500 | | | | 513,405 | |
Tyson Foods, Inc. - Class A | | | 7,000 | | | | 301,700 | |
| | | | | | | | 2,580,360 | |
Energy — 2.1% | | | | | | | | |
Cameron International Corporation (a) | | | 4,010 | | | | 245,893 | |
ONEOK, Inc. | | | 11,000 | | | | 354,200 | |
Valero Energy Corporation | | | 5,950 | | | | 357,595 | |
| | | | | | | | 957,688 | |
Financials — 17.9% | | | | | | | | |
Alexander & Baldwin, Inc. | | | 3,000 | | | | 102,990 | |
Alleghany Corporation (a) | | | 765 | | | | 358,104 | |
American Financial Group, Inc. | | | 6,600 | | | | 454,806 | |
Arthur J. Gallagher & Company | | | 6,750 | | | | 278,640 | |
Axis Capital Holdings Ltd. | | | 5,000 | | | | 268,600 | |
Bank of Hawaii Corporation | | | 6,000 | | | | 380,940 | |
Berkley (W.R.) Corporation | | | 6,450 | | | | 350,687 | |
CME Group, Inc. | | | 4,735 | | | | 439,124 | |
Eaton Vance Corporation | | | 8,500 | | | | 284,070 | |
Everest Re Group Ltd. | | | 2,050 | | | | 355,347 | |
HCC Insurance Holdings, Inc. | | | 4,575 | | | | 354,425 | |
Intercontinental Exchange, Inc. | | | 2,000 | | | | 469,980 | |
13
THE GOVERNMENT STREET MID-CAP FUND
SCHEDULE OF INVESTMENTS (Continued) | |
COMMON STOCKS — 85.7% (Continued) | | Shares | | | Value | |
Financials — 17.9% (Continued) | | | | | | |
Jones Lang LaSalle, Inc. | | | 2,800 | | | $ | 402,556 | |
Kemper Corporation | | | 6,200 | | | | 219,294 | |
Mid-America Apartment Communities, Inc. | | | 12,800 | | | | 1,047,936 | |
NASDAQ OMX Group, Inc. (The) | | | 9,500 | | | | 506,635 | |
Old Republic International Corporation | | | 21,400 | | | | 334,696 | |
PNC Financial Services Group, Inc. (The) | | | 3,745 | | | | 334,054 | |
Potlatch Corporation | | | 6,941 | | | | 199,831 | |
Realty Income Corporation | | | 8,025 | | | | 380,305 | |
SEI Investments Company | | | 10,000 | | | | 482,300 | |
| | | | | | | | 8,005,320 | |
Health Care — 13.2% | | | | | | | | |
Bio-Rad Laboratories, Inc. - Class A (a) | | | 2,500 | | | | 335,775 | |
Bio-Techne Corporation | | | 4,500 | | | | 416,070 | |
Centene Corporation (a) | | | 6,000 | | | | 325,380 | |
Charles River Laboratories International, Inc. (a) | | | 4,500 | | | | 285,840 | |
Chemed Corporation | | | 3,000 | | | | 400,410 | |
Endo International plc (a) | | | 3,000 | | | | 207,840 | |
Ensign Group, Inc. (The) | | | 8,000 | | | | 341,040 | |
Henry Schein, Inc. (a) | | | 3,500 | | | | 464,520 | |
Illumina, Inc. (a) | | | 2,500 | | | | 439,550 | |
Laboratory Corporation of America Holdings (a) | | | 2,074 | | | | 224,967 | |
MEDNAX, Inc. (a) | | | 5,000 | | | | 383,950 | |
ResMed, Inc. | | | 6,000 | | | | 305,760 | |
Shire plc - ADR | | | 1,500 | | | | 307,845 | |
Teleflex, Inc. | | | 4,500 | | | | 558,945 | |
United Therapeutics Corporation (a) | | | 2,300 | | | | 301,852 | |
Valeant Pharmaceuticals International, Inc. (a) | | | 1,900 | | | | 338,922 | |
Waters Corporation (a) | | | 2,000 | | | | 236,420 | |
| | | | | | | | 5,875,086 | |
Industrials — 11.5% | | | | | | | | |
AMETEK, Inc. | | | 1,350 | | | | 70,632 | |
C.H. Robinson Worldwide, Inc. | | | 6,000 | | | | 406,680 | |
Deluxe Corporation | | | 5,000 | | | | 278,700 | |
Donaldson Company, Inc. | | | 12,000 | | | | 336,960 | |
Expeditors International of Washington, Inc. | | | 8,000 | | | | 376,400 | |
Fastenal Company | | | 9,950 | | | | 364,269 | |
Graco, Inc. | | | 6,000 | | | | 402,180 | |
Jacobs Engineering Group, Inc. (a) | | | 4,475 | | | | 167,499 | |
JetBlue Airways Corporation (a) | | | 8,000 | | | | 206,160 | |
L-3 Communications Holdings, Inc. | | | 3,000 | | | | 313,560 | |
Matson, Inc. | | | 3,000 | | | | 115,470 | |
MSC Industrial Direct Company, Inc. - Class A | | | 5,000 | | | | 305,150 | |
Pentair plc | | | 2,400 | | | | 122,496 | |
Snap-on, Inc. | | | 4,275 | | | | 645,269 | |
14
THE GOVERNMENT STREET MID-CAP FUND
SCHEDULE OF INVESTMENTS (Continued) | |
COMMON STOCKS — 85.7% (Continued) | | Shares | | | Value | |
Industrials — 11.5% (Continued) | | | | | | |
SPX Corporation | | | 5,000 | | | $ | 59,600 | |
SPX FLOW, Inc. (a) | | | 5,000 | | | | 172,150 | |
Stericycle, Inc. (a) | | | 2,900 | | | | 403,999 | |
Waste Connections, Inc. | | | 6,000 | | | | 291,480 | |
WESCO International, Inc. (a) | | | 1,850 | | | | 85,970 | |
| | | | | | | | 5,124,624 | |
Information Technology — 13.1% | | | | | | | | |
Akamai Technologies, Inc. (a) | | | 3,500 | | | | 241,710 | |
ANSYS, Inc. (a) | | | 3,500 | | | | 308,490 | |
Arrow Electronics, Inc. (a) | | | 8,600 | | | | 475,408 | |
CDK Global, Inc. | | | 9,000 | | | | 430,020 | |
DST Systems, Inc. | | | 4,600 | | | | 483,644 | |
Harris Corporation | | | 6,000 | | | | 438,900 | |
IAC/InterActiveCorp | | | 4,500 | | | | 293,715 | |
Jack Henry & Associates, Inc. | | | 9,000 | | | | 626,490 | |
Lam Research Corporation | | | 8,500 | | | | 555,305 | |
Linear Technology Corporation | | | 7,000 | | | | 282,450 | |
Microchip Technology, Inc. | | | 6,000 | | | | 258,540 | |
National Instruments Corporation | | | 12,000 | | | | 333,480 | |
NetApp, Inc. | | | 5,000 | | | | 148,000 | |
NVIDIA Corporation | | | 3,000 | | | | 73,950 | |
SanDisk Corporation | | | 5,000 | | | | 271,650 | |
Xilinx, Inc. | | | 7,000 | | | | 296,800 | |
Zebra Technologies Corporation - Class A (a) | | | 4,500 | | | | 344,475 | |
| | | | | | | | 5,863,027 | |
Materials — 5.7% | | | | | | | | |
Airgas, Inc. | | | 1,650 | | | | 147,394 | |
Albemarle Corporation | | | 8,000 | | | | 352,800 | |
Ashland, Inc. | | | 3,000 | | | | 301,860 | |
Martin Marietta Materials, Inc. | | | 2,500 | | | | 379,875 | |
Packaging Corporation of America | | | 5,000 | | | | 300,800 | |
Scotts Miracle-Gro Company (The) - Class A | | | 4,000 | | | | 243,280 | |
Sonoco Products Company | | | 5,000 | | | | 188,700 | |
Steel Dynamics, Inc. | | | 12,000 | | | | 206,160 | |
Valspar Corporation (The) | | | 6,000 | | | | 431,280 | |
| | | | | | | | 2,552,149 | |
Utilities — 3.4% | | | | | | | | |
AGL Resources, Inc. | | | 8,400 | | | | 512,736 | |
One Gas, Inc. | | | 3,000 | | | | 135,990 | |
SCANA Corporation | | | 7,530 | | | | 423,638 | |
Vectren Corporation | | | 10,600 | | | | 445,306 | |
| | | | | | | | 1,517,670 | |
| | | | | | | | | |
Total Common Stocks (Cost $20,815,984) | | | | | | $ | 38,277,060 | |
15
THE GOVERNMENT STREET MID-CAP FUND
SCHEDULE OF INVESTMENTS (Continued) | |
EXCHANGE-TRADED FUNDS — 8.1% | | Shares | | | Value | |
Guggenheim Mid-Cap Core ETF | | | 26,000 | | | $ | 1,226,680 | |
iShares Nasdaq Biotechnology ETF | | | 3,025 | | | | 917,573 | |
Vanguard Mid-Cap ETF | | | 12,850 | | | | 1,499,210 | |
Total Exchange-Traded Funds (Cost $2,549,480) | | | | | | $ | 3,643,463 | |
COMMERCIAL PAPER — 5.9% | | Par Value | | | Value | |
U.S. Bank, N.A., discount, 0.02% (b), due 10/01/2015 (Cost $2,618,000) | | $ | 2,618,000 | | | $ | 2,618,000 | |
MONEY MARKET FUNDS — 0.4% | | Shares | | | Value | |
Invesco STIT - STIC Prime Portfolio (The) - Institutional Class, 0.08% (c) (Cost $178,384) | | | 178,384 | | | $ | 178,384 | |
| | | | | | | | | |
Total Investments at Value — 100.1% (Cost $26,161,848) | | | | | | $ | 44,716,907 | |
| | | | | | | | | |
Liabilities in Excess of Other Assets — (0.1%) | | | | | | | (35,989 | ) |
| | | | | | | | | |
Net Assets — 100.0% | | | | | | $ | 44,680,918 | |
ADR - American Depositary Receipt. |
(a) | Non-income producing security. |
(b) | Rate shown is the annualized yield at time of purchase, not a coupon rate. |
(c) | The rate shown is the 7-day effective yield as of September 30, 2015. |
See accompanying notes to financial statements. |
16
THE ALABAMA TAX FREE BOND FUND
SCHEDULE OF INVESTMENTS
September 30, 2015 (Unaudited) | |
ALABAMA FIXED RATE REVENUE AND GENERAL OBLIGATION (GO) BONDS — 97.3% | | Par Value | | | Value | |
Alabama Drinking Water Financing Auth., Series A, Rev., | | | | | | |
3.00%, due 08/15/2019 | | $ | 530,000 | | | $ | 567,376 | |
Alabama State Public School & College Auth., Capital Improvements, Rev., | | | | | | | | |
5.00%, due 12/01/2017 | | | 470,000 | | | | 513,842 | |
Alabama State Public School & College Auth., Capital Improvements, Series A, Rev., | | | | | | | | |
4.00%, due 02/01/2017 | | | 250,000 | | | | 261,612 | |
3.75%, due 02/01/2018 | | | 200,000 | | | | 213,805 | |
Alabama State Public School & College Auth., Capital Improvements, Series D, Rev., | | | | | | | | |
2.00%, due 09/01/2018 | | | 565,000 | | | | 583,792 | |
Alabaster, AL, Water Rev., | | | | | | | | |
3.00%, due 09/01/2017 | | | 400,000 | | | | 416,124 | |
Anniston, AL, Waterworks & Sewer Board,
Water & Sewer Rev., | | | | | | | | |
3.50%, due 06/01/2016 | | | 500,000 | | | | 509,715 | |
Athens, AL, Electric Rev., Warrants, | | | | | | | | |
3.00%, due 06/01/2016 | | | 510,000 | | | | 518,206 | |
3.00%, due 06/01/2019 | | | 375,000 | | | | 397,582 | |
Athens, AL, GO, Warrants, | | | | | | | | |
4.00%, due 09/01/2018 | | | 300,000 | | | | 325,644 | |
Auburn University, AL, General Fee Rev., | | | | | | | | |
5.00%, due 06/01/2018 | | | 315,000 | | | | 349,811 | |
5.00%, due 06/01/2020 | | | 350,000 | | | | 407,071 | |
5.00%, due 06/01/2021 | | | 200,000 | | | | 236,746 | |
Auburn, AL, Refunding & Capital Improvements,
Series B, GO, Warrants, | | | | | | | | |
4.00%, due 08/01/2018 | | | 200,000 | | | | 217,132 | |
Auburn, AL, School, Series A, GO, Warrants, | | | | | | | | |
5.00%, due 08/01/2018 | | | 500,000 | | | | 558,135 | |
Baldwin Co., AL, Board of Education, Rev., | | | | | | | | |
5.00%, due 07/01/2018 | | | 590,000 | | | | 635,188 | |
Baldwin Co., AL, GO, Warrants, | | | | | | | | |
4.00%, due 06/01/2019 | | | 200,000 | | | | 220,520 | |
Baldwin Co., AL, Series A, GO, Warrants, | | | | | | | | |
5.00%, due 02/01/2017 | | | 320,000 | | | | 339,245 | |
Birmingham, AL, Waterworks Board, Water Rev., | | | | | | | | |
5.00%, due 01/01/2017 | | | 400,000 | | | | 421,980 | |
3.625%, due 07/01/2018 | | | 250,000 | | | | 267,560 | |
Calera, AL, GO, Warrants, | | | | | | | | |
3.00%, due 12/01/2017 | | | 410,000 | | | | 428,163 | |
17
THE ALABAMA TAX FREE BOND FUND
SCHEDULE OF INVESTMENTS (Continued) | |
ALABAMA FIXED RATE REVENUE AND GENERAL OBLIGATION (GO) BONDS — 97.3% (Continued) | | Par Value | | | Value | |
Calhoun Co., AL, Gas Tax Anticipation, Series A, Rev., Warrants, | | | | | | |
4.00%, due 03/01/2016 | | $ | 445,000 | | | $ | 451,430 | |
Chambers Co., AL, Gasoline Tax Anticipation, Rev., Warrants, | | | | | | | | |
2.00%, due 11/01/2019 | | | 290,000 | | | | 291,119 | |
Decatur, AL, Sewer Rev., Warrants, | | | | | | | | |
3.00%, due 08/15/2019 | | | 500,000 | | | | 532,905 | |
Elmore Co., AL, GO, Warrants, | | | | | | | | |
5.00%, due 10/01/2022 | | | 415,000 | | | | 493,813 | |
Enterprise, AL, GO, School Warrants, | | | | | | | | |
4.00%, due 02/01/2016 | | | 400,000 | | | | 405,092 | |
Florence, AL, Board of Education, Rev., | | | | | | | | |
3.00%, due 03/01/2016 | | | 500,000 | | | | 505,315 | |
Florence, AL, Electric Rev., Warrants, | | | | | | | | |
3.50%, due 06/01/2017 | | | 515,000 | | | | 533,483 | |
Florence, AL, GO, Warrants, | | | | | | | | |
4.00%, due 08/01/2018 | | | 575,000 | | | | 620,419 | |
Foley, AL, Utilities Board, Utilities Rev., | | | | | | | | |
4.00%, due 11/01/2018 | | | 710,000 | | | | 773,424 | |
4.00%, due 11/01/2019 | | | 225,000 | | | | 249,883 | |
4.50%, due 11/01/2019 | | | 250,000 | | | | 250,943 | |
Homewood, AL, Board of Education, Special Tax School Warrants, | | | | | | | | |
4.00%, due 04/01/2017 | | | 500,000 | | | | 523,935 | |
Hoover City, AL, Board of Education, Special Tax School Warrants, | | | | | | | | |
4.00%, due 02/15/2020 | | | 470,000 | | | | 522,635 | |
Huntsville, AL, Electric Systems, Rev., | | | | | | | | |
3.00%, due 12/01/2016 | | | 375,000 | | | | 386,325 | |
Huntsville, AL, GO, Refunding and Capital Improvement Warrants, | | | | | | | | |
4.00%, due 09/01/2016 | | | 500,000 | | | | 517,050 | |
4.00%, due 09/01/2018 | | | 500,000 | | | | 545,460 | |
Huntsville, AL, Series A, GO, Warrants, | | | | | | | | |
5.00%, due 05/01/2024 | | | 665,000 | | | | 820,690 | |
Limestone Co., AL, Board of Education, Special Tax Warrants, | | | | | | | | |
3.00%, due 11/01/2019 | | | 560,000 | | | | 586,118 | |
Macon Co., AL, GO, Warrants, | | | | | | | | |
4.25%, due 10/01/2027, | | | | | | | | |
Prerefunded 10/01/2017 @ 100 | | | 200,000 | | | | 214,386 | |
18
THE ALABAMA TAX FREE BOND FUND
SCHEDULE OF INVESTMENTS (Continued) | |
ALABAMA FIXED RATE REVENUE AND GENERAL OBLIGATION (GO) BONDS — 97.3% (Continued) | | Par Value | | | Value | |
Madison Co., AL, Board of Education, Rev., Tax Anticipation Warrants, | | | | | | |
2.00%, due 09/01/2019 | | $ | 220,000 | | | $ | 225,832 | |
Madison Co., AL, GO, Warrants, | | | | | | | | |
4.00%, due 09/01/2021 | | | 465,000 | | | | 523,302 | |
Madison Co., AL, Series A, Water Rev., Warrants, | | | | | | | | |
2.00%, due 07/01/2017 | | | 250,000 | | | | 255,562 | |
Madison Co., AL, Water & Wastewater Board, Rev., | | | | | | | | |
3.00%, due 12/01/2019 | | | 430,000 | | | | 459,292 | |
Mobile Co., AL, GO, Refunding, | | | | | | | | |
5.00%, due 06/01/2023 | | | 520,000 | | | | 627,942 | |
Montgomery, AL, GO, Warrants, | | | | | | | | |
2.50%, due 04/01/2021 | | | 500,000 | | | | 506,385 | |
Montgomery, AL, Series A, GO, Warrants, | | | | | | | | |
5.00%, due 02/01/2024 | | | 220,000 | | | | 247,331 | |
Montgomery, AL, Waterworks & Sanitation, Rev., | | | | | | | | |
5.00%, due 09/01/2017 | | | 250,000 | | | | 270,640 | |
Morgan Co., AL, Board of Education, Rev., Capital Outlay Warrants, | | | | | | | | |
4.00%, due 03/01/2019 | | | 250,000 | | | | 272,655 | |
Mountain Brook, AL, City Board of Education, GO, Warrants, | | | | | | | | |
3.00%, due 03/01/2020 | | | 300,000 | | | | 321,237 | |
North Alabama Gas District, Rev., | | | | | | | | |
3.00%, due 06/01/2020 | | | 420,000 | | | | 431,495 | |
Opelika, AL, GO, Warrants, | | | | | | | | |
2.00%, due 11/01/2017 | | | 275,000 | | | | 281,559 | |
Opelika, AL, Utilities Board, Series B, Rev., | | | | | | | | |
3.00%, due 06/01/2016 | | | 475,000 | | | | 482,885 | |
3.00%, due 06/01/2018 | | | 215,000 | | | | 225,948 | |
Orange Beach, AL, GO, Warrants, | | | | | | | | |
4.00%, due 02/01/2018 | | | 200,000 | | | | 214,570 | |
5.00%, due 02/01/2019 | | | 240,000 | | | | 270,540 | |
Prattville, AL, GO, Warrants, | | | | | | | | |
5.00%, due 11/01/2022 | | | 400,000 | | | | 478,708 | |
Prattville, AL, Waterworks Board, Rev., | | | | | | | | |
3.00%, due 08/01/2017 | | | 290,000 | | | | 300,962 | |
Sheffield, AL, Electric Rev., | | | | | | | | |
4.00%, due 07/01/2017 | | | 600,000 | | | | 635,076 | |
Sumter Co., AL, School Rev., Warrants, | | | | | | | | |
4.50%, due 02/01/2031, | | | | | | | | |
Prerefunded 02/01/2016 @ 100 | | | 500,000 | | | | 507,275 | |
19
THE ALABAMA TAX FREE BOND FUND
SCHEDULE OF INVESTMENTS (Continued) | |
ALABAMA FIXED RATE REVENUE AND GENERAL OBLIGATION (GO) BONDS — 97.3% (Continued) | | Par Value | | | Value | |
Sylacauga, AL, Utilities Board, Rev., | | | | | | |
3.00%, due 05/01/2021 | | $ | 310,000 | | | $ | 328,337 | |
Trussville, AL, GO, | | | | | | | | |
5.00%, due 10/01/2019 | | | 400,000 | | | | 461,260 | |
Tuscaloosa, AL, Series B, GO, Warrants, | | | | | | | | |
4.00%, due 01/01/2020 | | | 500,000 | | | | 555,890 | |
University of Alabama, AL, Series A, Rev., | | | | | | | | |
3.00%, due 07/01/2016 | | | 340,000 | | | | 347,208 | |
5.00%, due 07/01/2017 | | | 245,000 | | | | 263,899 | |
Vestavia Hills, AL, GO, Warrants, | | | | | | | | |
4.00%, due 02/01/2018 | | | 515,000 | | | | 551,112 | |
Vestavia Hills, AL, Series A, GO, Warrants, | | | | | | | | |
3.00%, due 02/01/2018 | | | 240,000 | | | | 251,534 | |
Wetumpka, AL, Waterworks & Sewer, Rev., | | | | | | | | |
4.00%, due 03/01/2018 | | | 320,000 | | | | 335,686 | |
| | | | | | | | | |
Total Alabama Fixed Rate Revenue and General Obligation (GO) Bonds (Cost $27,777,920) | | | | | | $ | 28,247,796 | |
MONEY MARKET FUNDS — 3.6% | | Shares | | | Value | |
Fidelity Tax Exempt Portfolio - Class I, 0.01% (a) (Cost $1,055,649) | | | 1,055,649 | | | $ | 1,055,649 | |
| | | | | | | | | |
Total Investments at Value — 100.9% (Cost $28,833,569) | | | | | | $ | 29,303,445 | |
| | | | | | | | | |
Liabilities in Excess of Other Assets — (0.9%) | | | | | | | (268,609 | ) |
| | | | | | | | | |
Net Assets — 100.0% | | | | | | $ | 29,034,836 | |
(a) | The rate shown is the 7-day effective yield as of September 30, 2015. |
See accompanying notes to financial statements. |
20
THE GOVERNMENT STREET FUNDS
STATEMENTS OF ASSETS AND LIABILITIES
September 30, 2015 (Unaudited) | |
| | Government Street
Equity
Fund | | | Government
Street
Mid-Cap
Fund | | | Alabama
Tax Free
Bond
Fund | |
ASSETS | | | | | | | | | |
Investments in securities: | | | | | | | | | |
At acquisition cost | | $ | 49,709,486 | | | $ | 26,161,848 | | | $ | 28,833,569 | |
At value (Note 2) | | $ | 80,045,766 | | | $ | 44,716,907 | | | $ | 29,303,445 | |
Cash | | | 5,099 | | | | — | | | | — | |
Dividends and interest receivable | | | 81,320 | | | | 19,884 | | | | 247,042 | |
Receivable for capital shares sold | | | — | | | | 5,583 | | | | — | |
Other assets | | | 13,094 | | | | 10,979 | | | | 9,502 | |
TOTAL ASSETS | | | 80,145,279 | | | | 44,753,353 | | | | 29,559,989 | |
| | | | | | | | | | | | | |
LIABILITIES | | | | | | | | | | | | |
Distributions payable | | | 3,911 | | | | — | | | | 2,125 | |
Payable for investment securities purchased | | | — | | | | — | | | | 487,650 | |
Payable for capital shares redeemed | | | 113,801 | | | | — | | | | 22,200 | |
Accrued investment advisory fees (Note 4) | | | 73,102 | | | | 63,945 | | | | 3,248 | |
Payable to administrator (Note 4) | | | 9,000 | | | | 5,850 | | | | 5,600 | |
Other accrued expenses | | | 4,021 | | | | 2,640 | | | | 4,330 | |
TOTAL LIABILITIES | | | 203,835 | | | | 72,435 | | | | 525,153 | |
| | | | | | | | | | | | | |
NET ASSETS | | $ | 79,941,444 | | | $ | 44,680,918 | | | $ | 29,034,836 | |
| | | | | | | | | | | | | |
Net assets consist of: | | | | | | | | | | | | |
Paid-in capital | | $ | 48,982,451 | | | $ | 25,460,354 | | | $ | 28,627,169 | |
Accumulated net investment income | | | 3,270 | | | | 86,229 | | | | — | |
Accumulated net realized gains (losses) from security transactions | | | 619,443 | | | | 579,276 | | | | (62,209 | ) |
Net unrealized appreciation on investments | | | 30,336,280 | | | | 18,555,059 | | | | 469,876 | |
| | | | | | | | | | | | | |
Net assets | | $ | 79,941,444 | | | $ | 44,680,918 | | | $ | 29,034,836 | |
| | | | | | | | | | | | | |
Shares of beneficial interest outstanding (unlimited number of shares authorized, $0.01 par value) | | | 1,333,861 | | | | 2,169,926 | | | | 2,770,354 | |
| | | | | | | | | | | | | |
Net asset value, offering price and redemption price per share (Note 2) | | $ | 59.93 | | | $ | 20.59 | | | $ | 10.48 | |
See accompanying notes to financial statements. |
21
THE GOVERNMENT STREET FUNDS
STATEMENTS OF OPERATIONS
Six Months Ended September 30, 2015 (Unaudited) | |
| | Government
Street
Equity
Fund | | | Government
Street
Mid-Cap
Fund | | | Alabama
Tax Free
Bond
Fund | |
INVESTMENT INCOME | | | | | | | | | |
Dividends | | $ | 802,511 | | | $ | 345,397 | | | $ | 44 | |
Foreign withholding taxes on dividends | | | (11,660 | ) | | | (57 | ) | | | — | |
Interest | | | 232 | | | | 192 | | | | 282,086 | |
TOTAL INVESTMENT INCOME | | | 791,083 | | | | 345,532 | | | | 282,130 | |
| | | | | | | | | | | | | |
EXPENSES | | | | | | | | | | | | |
Investment advisory fees (Note 4) | | | 265,901 | | | | 182,406 | | | | 50,522 | |
Administration fees (Note 4) | | | 53,651 | | | | 33,377 | | | | 30,000 | |
Professional fees | | | 9,458 | | | | 8,878 | | | | 8,570 | |
Account maintenance fees | | | 13,474 | | | | 7,395 | | | | 3,669 | |
Custodian and bank service fees | | | 7,384 | | | | 5,773 | | | | 2,338 | |
Trustees’ fees and expenses (Note 4) | | | 5,120 | | | | 5,120 | | | | 5,120 | |
Registration and filing fees | | | 5,267 | | | | 4,424 | | | | 3,649 | |
Compliance fees (Note 4) | | | 4,918 | | | | 4,071 | | | | 3,672 | |
Printing of shareholder reports | | | 4,061 | | | | 2,429 | | | | 1,921 | |
Pricing costs | | | 1,009 | | | | 1,383 | | | | 5,603 | |
Postage and supplies | | | 2,123 | | | | 1,628 | | | | 1,313 | |
Insurance expense | | | 1,691 | | | | 1,057 | | | | 676 | |
Other expenses | | | 3,096 | | | | 1,366 | | | | 1,765 | |
TOTAL EXPENSES | | | 377,153 | | | | 259,307 | | | | 118,818 | |
Fees voluntarily waived by the Adviser (Note 4) | | | — | | | | — | | | | (24,909 | ) |
NET EXPENSES | | | 377,153 | | | | 259,307 | | | | 93,909 | |
| | | | | | | | | | | | | |
NET INVESTMENT INCOME | | | 413,930 | | | | 86,225 | | | | 188,221 | |
| | | | | | | | | | | | | |
REALIZED AND UNREALIZED GAINS (LOSSES) ON INVESTMENTS | | | | | | | | | | | | |
Net realized gains from security transactions | | | 640,094 | | | | 579,306 | | | | 1,152 | |
Net realized gains from in-kind redemptions (Note 2) | | | 2,982,115 | | | | 447,745 | | | | — | |
Net change in unrealized appreciation (depreciation) on investments | | | (9,883,845 | ) | | | (4,535,273 | ) | | | (23,424 | ) |
| | | | | | | | | | | | | |
NET REALIZED AND UNREALIZED LOSSES ON INVESTMENTS | | | (6,261,636 | ) | | | (3,508,222 | ) | | | (22,272 | ) |
| | | | | | | | | | | | | |
NET INCREASE (DECREASE) IN NET ASSETS FROM OPERATIONS | | $ | (5,847,706 | ) | | $ | (3,421,997 | ) | | $ | 165,949 | |
See accompanying notes to financial statements. |
22
THE GOVERNMENT STREET FUNDS
STATEMENTS OF CHANGES IN NET ASSETS | |
| | Government Street
Equity Fund | | | Government Street
Mid-Cap Fund | |
| | Six Months Ended
Sept. 30,
2015
(Unaudited) | | | Year
Ended
March 31, 2015 | | | Six Months Ended
Sept. 30,
2015
(Unaudited) | | | Year
Ended
March 31, 2015 | |
FROM OPERATIONS | | | | | | | | | | | | |
Net investment income | | $ | 413,930 | | | $ | 957,716 | | | $ | 86,225 | | | $ | 243,475 | |
Net realized gains from security transactions | | | 640,094 | | | | 2,980,788 | | | | 579,306 | | | | 1,879,231 | |
Net realized gains from in-kind redemptions (Note 2) | | | 2,982,115 | | | | 3,609,846 | | | | 447,745 | | | | 3,329,346 | |
Net change in unrealized appreciation (depreciation) on investments | | | (9,883,845 | ) | | | 3,040,301 | | | | (4,535,273 | ) | | | (461,181 | ) |
Net increase (decrease) in net assets from operations | | | (5,847,706 | ) | | | 10,588,651 | | | | (3,421,997 | ) | | | 4,990,871 | |
| | | | | | | | | | | | | | | | | |
DISTRIBUTIONS TO SHAREHOLDERS | | | | | | | | | | | | | | | | |
From net investment income | | | (464,720 | ) | | | (919,996 | ) | | | (43,683 | ) | | | (164,104 | ) |
From net realized capital gains on security transactions | | | (1,668,939 | ) | | | (4,883,611 | ) | | | (1,603,110 | ) | | | (1,759,524 | ) |
Decrease in net assets from distributions to shareholders | | | (2,133,659 | ) | | | (5,803,607 | ) | | | (1,646,793 | ) | | | (1,923,628 | ) |
| | | | | | | | | | | | | | | | | |
FROM CAPITAL SHARE TRANSACTIONS | | | | | | | | | | | | | | | | |
Proceeds from shares sold | | | 627,868 | | | | 4,442,263 | | | | 969,042 | | | | 909,807 | |
Net asset value of shares issued in reinvestment of distributions to shareholders | | | 2,092,387 | | | | 5,687,312 | | | | 1,561,235 | | | | 1,779,485 | |
Payments for shares redeemed | | | (8,575,701 | ) | | | (15,423,430 | ) | | | (4,679,016 | ) | | | (8,733,265 | ) |
Net decrease in net assets from capital share transactions | | | (5,855,446 | ) | | | (5,293,855 | ) | | | (2,148,739 | ) | | | (6,043,973 | ) |
| | | | | | | | | | | | | | | | | |
TOTAL DECREASE IN NET ASSETS | | | (13,836,811 | ) | | | (508,811 | ) | | | (7,217,529 | ) | | | (2,976,730 | ) |
| | | | | | | | | | | | | | | | | |
NET ASSETS | | | | | | | | | | | | | | | | |
Beginning of period | | | 93,778,255 | | | | 94,287,066 | | | | 51,898,447 | | | | 54,875,177 | |
End of period | | $ | 79,941,444 | | | $ | 93,778,255 | | | $ | 44,680,918 | | | $ | 51,898,447 | |
| | | | | | | | | | | | | | | | | |
ACCUMULATED NET INVESTMENT INCOME | | $ | 3,270 | | | $ | 54,060 | | | $ | 86,229 | | | $ | 43,687 | |
| | | | | | | | | | | | | | | | | |
CAPITAL SHARE ACTIVITY | | | | | | | | | | | | | | | | |
Shares sold | | | 9,900 | | | | 68,466 | | | | 44,643 | | | | 40,835 | |
Shares reinvested | | | 32,681 | | | | 89,486 | | | | 71,354 | | | | 83,509 | |
Shares redeemed | | | (130,742 | ) | | | (237,871 | ) | | | (206,646 | ) | | | (395,465 | ) |
Net decrease in shares outstanding | | | (88,161 | ) | | | (79,919 | ) | | | (90,649 | ) | | | (271,121 | ) |
Shares outstanding, beginning of period | | | 1,422,022 | | | | 1,501,941 | | | | 2,260,575 | | | | 2,531,696 | |
Shares outstanding, end of period | | | 1,333,861 | | | | 1,422,022 | | | | 2,169,926 | | | | 2,260,575 | |
See accompanying notes to financial statements. |
23
THE GOVERNMENT STREET FUNDS
STATEMENTS OF CHANGES IN NET ASSETS (Continued) | |
| | Alabama Tax Free
Bond Fund | |
| | Six Months Ended
Sept. 30,
2015
(Unaudited) | | | Year
Ended
March 31, 2015 | |
FROM OPERATIONS | | | | | | |
Net investment income | | $ | 188,221 | | | $ | 408,871 | |
Net realized gain (losses) from security transactions | | | 1,152 | | | | (10,382 | ) |
Net change in unrealized appreciation (depreciation) on investments | | | (23,424 | ) | | | (43,213 | ) |
Net increase in net assets from operations | | | 165,949 | | | | 355,276 | |
| | | | | | | | | |
DISTRIBUTIONS TO SHAREHOLDERS | | | | | | | | |
From net investment income | | | (188,221 | ) | | | (408,862 | ) |
| | | | | | | | | |
FROM CAPITAL SHARE TRANSACTIONS | | | | | | | | |
Proceeds from shares sold | | | 1,089,654 | | | | 1,505,115 | |
Net asset value of shares issued in reinvestment of distributions to shareholders | | | 173,279 | | | | 369,143 | |
Payments for shares redeemed | | | (2,175,240 | ) | | | (4,481,199 | ) |
Net decrease in net assets from capital share transactions | | | (912,307 | ) | | | (2,606,941 | ) |
| | | | | | | | | |
TOTAL DECREASE IN NET ASSETS | | | (934,579 | ) | | | (2,660,527 | ) |
| | | | | | | | | |
NET ASSETS | | | | | | | | |
Beginning of period | | | 29,969,415 | | | | 32,629,942 | |
End of period | | $ | 29,034,836 | | | $ | 29,969,415 | |
| | | | | | | | | |
ACCUMULATED NET INVESTMENT INCOME | | $ | — | | | $ | — | |
| | | | | | | | | |
CAPITAL SHARE ACTIVITY | | | | | | | | |
Shares sold | | | 104,130 | | | | 142,760 | |
Shares reinvested | | | 16,571 | | | | 35,041 | |
Shares redeemed | | | (207,988 | ) | | | (424,837 | ) |
Net decrease in shares outstanding | | | (87,287 | ) | | | (247,036 | ) |
Shares outstanding, beginning of period | | | 2,857,641 | | | | 3,104,677 | |
Shares outstanding, end of period | | | 2,770,354 | | | | 2,857,641 | |
See accompanying notes to financial statements. |
24
THE GOVERNMENT STREET EQUITY FUND
FINANCIAL HIGHLIGHTS | |
Selected Per Share Data and Ratios for a Share Outstanding Throughout Each Period | |
| | Six Months Ended
Sept. 30,
2015 (Unaudited) | | |
Years Ended March 31, | |
| | | 2015 | | | | 2014 | | | | 2013 | | | | 2012 | | | | 2011 | |
Net asset value at beginning of period | | $ | 65.95 | | | $ | 62.78 | | | $ | 53.61 | | | $ | 50.42 | | | $ | 48.00 | | | $ | 40.89 | |
| | | | | | | | | | | | | | | | | | | | | | | | | |
Income (loss) from investment operations: | | | | | | | | | | | | | | | | | | | | | | | | |
Net investment income | | | 0.31 | | | | 0.67 | | | | 0.62 | | | | 0.64 | | | | 0.47 | | | | 0.39 | |
Net realized and unrealized gains (losses) on investments | | | (4.74 | ) | | | 6.55 | | | | 9.17 | | | | 4.21 | | | | 2.66 | | | | 7.19 | |
Total from investment operations | | | (4.43 | ) | | | 7.22 | | | | 9.79 | | | | 4.85 | | | | 3.13 | | | | 7.58 | |
| | | | | | | | | | | | | | | | | | | | | | | | | |
Less distributions: | | | | | | | | | | | | | | | | | | | | | | | | |
Dividends from net investment income | | | (0.35 | ) | | | (0.64 | ) | | | (0.61 | ) | | | (0.64 | ) | | | (0.48 | ) | | | (0.39 | ) |
Distributions from net realized gains | | | (1.24 | ) | | | (3.41 | ) | | | (0.01 | ) | | | (1.02 | ) | | | (0.23 | ) | | | (0.08 | ) |
Total distributions | | | (1.59 | ) | | | (4.05 | ) | | | (0.62 | ) | | | (1.66 | ) | | | (0.71 | ) | | | (0.47 | ) |
| | | | | | | | | | | | | | | | | | | | | | | | | |
Net asset value at end of period | | $ | 59.93 | | | $ | 65.95 | | | $ | 62.78 | | | $ | 53.61 | | | $ | 50.42 | | | $ | 48.00 | |
| | | | | | | | | | | | | | | | | | | | | | | | | |
Total return (a) | | | (6.87% | )(b) | | | 11.87 | % | | | 18.34 | % | | | 9.93 | % | | | 6.67 | % | | | 18.69 | % |
| | | | | | | | | | | | | | | | | | | | | | | | | |
Net assets at end of period (000’s) | | $ | 79,941 | | | $ | 93,778 | | | $ | 94,287 | | | $ | 81,689 | | | $ | 72,268 | | | $ | 66,373 | |
| | | | | | | | | | | | | | | | | | | | | | | | | |
Ratio of total expenses to average net assets | | | 0.85 | %(c) | | | 0.84 | % | | | 0.84 | % | | | 0.85 | % | | | 0.87 | % | | | 0.88 | % |
| | | | | | | | | | | | | | | | | | | | | | | | | |
Ratio of net investment income to average net assets | | | 0.93 | %(c) | | | 1.02 | % | | | 1.06 | % | | | 1.29 | % | | | 1.01 | % | | | 0.92 | % |
| | | | | | | | | | | | | | | | | | | | | | | | | |
Portfolio turnover rate | | | 4 | %(b) | | | 26 | % | | | 36 | % | | | 38 | % | | | 36 | % | | | 26 | % |
(a) | Total return is a measure of the change in value of an investment in the Fund over the periods covered, which assumes any dividends or capital gains distributions are reinvested in shares of the Fund. Returns do not reflect the deduction of taxes a shareholder would pay on Fund distributions or the redemption of Fund shares. |
See accompanying notes to financial statements. |
25
THE GOVERNMENT STREET MID-CAP FUND
FINANCIAL HIGHLIGHTS | |
Selected Per Share Data and Ratios for a Share Outstanding Throughout Each Period | |
| | Six Months Ended
Sept. 30,
2015 (Unaudited) | | |
Years Ended March 31,
| |
| | | 2015 | | | | 2014 | | | | 2013 | | | | 2012 | | | | 2011 | |
Net asset value at beginning of period | | $ | 22.96 | | | $ | 21.68 | | | $ | 18.26 | | | $ | 16.26 | | | $ | 15.89 | | | $ | 12.87 | |
| | | | | | | | | | | | | | | | | | | | | | | | | |
Income (loss) from investment operations: | | | | | | | | | | | | | | | | | | | | | | | | |
Net investment income | | | 0.04 | | | | 0.10 | | | | 0.09 | | | | 0.10 | | | | 0.04 | | | | 0.03 | |
Net realized and unrealized gains (losses) on investments | | | (1.63 | ) | | | 2.02 | | | | 3.46 | | | | 2.05 | | | | 0.37 | | | | 3.03 | |
Total from investment operations | | | (1.59 | ) | | | 2.12 | | | | 3.55 | | | | 2.15 | | | | 0.41 | | | | 3.06 | |
| | | | | | | | | | | | | | | | | | | | | | | | | |
Less distributions: | | | | | | | | | | | | | | | | | | | | | | | | |
Dividends from net investment income | | | (0.02 | ) | | | (0.07 | ) | | | (0.11 | ) | | | (0.11 | ) | | | (0.04 | ) | | | (0.03 | ) |
Distributions in excess of net investment income | | | — | | | | — | | | | — | | | | — | | | | — | | | | (0.01 | ) |
Distributions from net realized gains | | | (0.76 | ) | | | (0.77 | ) | | | (0.02 | ) | | | (0.04 | ) | | | (0.00 | )(a) | | | — | |
Total distributions | | | (0.78 | ) | | | (0.84 | ) | | | (0.13 | ) | | | (0.15 | ) | | | (0.04 | ) | | | (0.04 | ) |
| | | | | | | | | | | | | | | | | | | | | | | | | |
Net asset value at end of period | | $ | 20.59 | | | $ | 22.96 | | | $ | 21.68 | | | $ | 18.26 | | | $ | 16.26 | | | $ | 15.89 | |
| | | | | | | | | | | | | | | | | | | | | | | | | |
Total return (b) | | | (7.14 | %)(c) | | | 10.14 | % | | | 19.43 | % | | | 13.35 | % | | | 2.59 | % | | | 23.80 | % |
| | | | | | | | | | | | | | | | | | | | | | | | | |
Net assets at end of period (000’s) | | $ | 44,681 | | | $ | 51,898 | | | $ | 54,875 | | | $ | 45,918 | | | $ | 39,843 | | | $ | 39,983 | |
| | | | | | | | | | | | | | | | | | | | | | | | | |
Ratio of total expenses to average net assets | | | 1.07 | %(d) | | | 1.05 | % | | | 1.06 | % | | | 1.08 | % | | | 1.09 | % | | | 1.13 | % |
| | | | | | | | | | | | | | | | | | | | | | | | | |
Ratio of net investment income to average net assets | | | 0.35 | %(d) | | | 0.47 | % | | | 0.43 | % | | | 0.63 | % | | | 0.29 | % | | | 0.21 | % |
| | | | | | | | | | | | | | | | | | | | | | | | | |
Portfolio turnover rate | | | 6 | %(c) | | | 16 | % | | | 10 | % | | | 12 | % | | | 18 | % | | | 20 | % |
(a) | Amount rounds to less than $0.01 per share. |
(b) | Total return is a measure of the change in value of an investment in the Fund over the periods covered, which assumes any dividends or capital gains distributions are reinvested in shares of the Fund. Returns do not reflect the deduction of taxes a shareholder would pay on Fund distributions or the redemption of Fund shares. |
See accompanying notes to financial statements. |
26
THE ALABAMA TAX FREE BOND FUND
FINANCIAL HIGHLIGHTS | |
Selected Per Share Data and Ratios for a Share Outstanding Throughout Each Period | |
| | Six Months Ended
Sept. 30,
2015 (Unaudited) | | |
Years Ended March 31, | |
| | | 2015 | | | | 2014 | | | | 2013 | | | | 2012 | | | | 2011 | |
Net asset value at beginning of period | | $ | 10.49 | | | $ | 10.51 | | | $ | 10.63 | | | $ | 10.64 | | | $ | 10.45 | | | $ | 10.53 | |
| | | | | | | | | | | | | | | | | | | | | | | | | |
Income (loss) from investment operations: | | | | | | | | | | | | | | | | | | | | | | | | |
Net investment income | | | 0.07 | | | | 0.14 | | | | 0.15 | | | | 0.18 | | | | 0.23 | | | | 0.26 | |
Net realized and unrealized gains (losses) on investments | | | (0.01 | ) | | | (0.02 | ) | | | (0.12 | ) | | | (0.01 | ) | | | 0.19 | | | | (0.07 | ) |
Total from investment operations | | | 0.06 | | | | 0.12 | | | | 0.03 | | | | 0.17 | | | | 0.42 | | | | 0.19 | |
| | | | | | | | | | | | | | | | | | | | | | | | | |
Less distributions: | | | | | | | | | | | | | | | | | | | | | | | | |
Dividends from net investment income | | | (0.07 | ) | | | (0.14 | ) | | | (0.15 | ) | | | (0.18 | ) | | | (0.23 | ) | | | (0.27 | ) |
Distributions from net realized gains | | | — | | | | — | | | | — | | | | — | | | | — | | | | (0.00 | )(a) |
Total distributions | | | (0.07 | ) | | | (0.14 | ) | | | (0.15 | ) | | | (0.18 | ) | | | (0.23 | ) | | | (0.27 | ) |
| | | | | | | | | | | | | | | | | | | | | | | | | |
Net asset value at end of period | | $ | 10.48 | | | $ | 10.49 | | | $ | 10.51 | | | $ | 10.63 | | | $ | 10.64 | | | $ | 10.45 | |
| | | | | | | | | | | | | | | | | | | | | | | | | |
Total return (b) | | | 0.56 | %(c) | | | 1.14 | % | | | 0.28 | % | | | 1.64 | % | | | 4.04 | % | | | 1.78 | % |
| | | | | | | | | | | | | | | | | | | | | | | | | |
Net assets at end of period (000’s) | | $ | 29,035 | | | $ | 29,969 | | | $ | 32,630 | | | $ | 33,265 | | | $ | 24,719 | | | $ | 27,026 | |
| | | | | | | | | | | | | | | | | | | | | | | | | |
Ratio of total expenses to average net assets | | | 0.82 | %(d) | | | 0.79 | % | | | 0.76 | % | | | 0.76 | % | | | 0.80 | % | | | 0.77 | % |
| | | | | | | | | | | | | | | | | | | | | | | | | |
Ratio of net expenses to average net assets (e) | | | 0.65 | %(d) | | | 0.65 | % | | | 0.65 | % | | | 0.65 | % | | | 0.65 | % | | | 0.65 | % |
| | | | | | | | | | | | | | | | | | | | | | | | | |
Ratio of net investment income to average net assets (e) | | | 1.30 | %(d) | | | 1.32 | % | | | 1.41 | % | | | 1.70 | % | | | 2.17 | % | | | 2.51 | % |
| | | | | | | | | | | | | | | | | | | | | | | | | |
Portfolio turnover rate | | | 7 | %(c) | | | 6 | % | | | 10 | % | | | 7 | % | | | 18 | % | | | 21 | % |
(a) | Amount rounds to less than $0.01 per share. |
(b) | Total return is a measure of the change in value of an investment in the Fund over the periods covered, which assumes any dividends or capital gains distributions are reinvested in shares of the Fund. Returns do not reflect the deduction of taxes a shareholder would pay on Fund distributions or the redemption of Fund shares. |
(e) | Ratios were determined after voluntary advisory fee waivers by the Adviser (Note 4). |
See accompanying notes to financial statements. |
27
THE GOVERNMENT STREET FUNDS
NOTES TO FINANCIAL STATEMENTS
September 30, 2015 (Unaudited)
1. Organization
The Government Street Equity Fund, The Government Street Mid-Cap Fund and The Alabama Tax Free Bond Fund (the “Funds”) are each a no-load series of the Williamsburg Investment Trust (the “Trust”), an open-end management investment company registered under the Investment Company Act of 1940. The Government Street Equity Fund and The Government Street Mid-Cap Fund are each a diversified fund and The Alabama Tax Free Bond Fund is a non-diversified fund. The Trust was organized as a Massachusetts business trust on July 18, 1988. Other series of the Trust are not included in this report.
The Government Street Equity Fund’s investment objective is to seek capital appreciation.
The Government Street Mid-Cap Fund’s investment objective is to seek capital appreciation.
The Alabama Tax Free Bond Fund’s investment objectives are to provide current income exempt from federal income taxes and from the personal income taxes of Alabama and to preserve capital.
2. Significant Accounting Policies
As an investment company, as defined in Financial Accounting Standards Board (“FASB”) Accounting Standards Update 2013-08, the Funds follow accounting and reporting guidance under FASB Accounting Standards Codification Topic 946, “Financial Services – Investment Companies.” The following is a summary of the Funds’ significant accounting policies. The policies are in conformity with accounting principles generally accepted in the United States of America (“GAAP”).
Securities valuation — The Funds’ portfolio securities are valued as of the close of business of the regular session of the New York Stock Exchange (normally 4:00 p.m., Eastern time). Securities traded on a national stock exchange are valued based upon the closing price on the principal exchange where the security is traded, if available, otherwise, at the last quoted bid price. Securities which are quoted by NASDAQ are valued at the NASDAQ Official Closing Price. Investments representing shares of other investment companies are valued at their net asset value as reported by such companies.
Fixed income securities are typically valued on the basis of prices provided by an independent pricing service. The prices provided by the pricing service are determined with consideration given to institutional bid and last sale prices and take into account securities prices, yields, maturities, call features, ratings, institutional trading in similar
28
THE GOVERNMENT STREET FUNDS
NOTES TO FINANCIAL STATEMENTS (Continued)
groups of securities and developments related to specific securities. Commercial paper may be valued at amortized cost, which under normal circumstances approximates market value.
When market quotations are not readily available, if a pricing service cannot provide a price or the investment adviser believes the price received from the pricing service is not indicative of market value, securities will be valued in good faith at fair value using methods consistent with procedures adopted by the Board of Trustees and will be classified as Level 2 or 3 within the fair value hierarchy (see below), depending on the inputs used. Such methods of fair valuation may include, but are not limited to: multiple of earnings, multiple of book value, discount from market of a similar freely traded security, purchase price of the security, subsequent private transactions in the security or related securities, or a combination of these and other factors.
GAAP establishes a single authoritative definition of fair value, sets out a framework for measuring fair value and requires additional isclosures about fair value measurements.
Various inputs are used in determining the value of each of the Fund’s investments. These inputs are summarized in the three broad levels listed below:
● | Level 1 – quoted prices in active markets for identical securities |
● | Level 2 – other significant observable inputs |
● | Level 3 – significant unobservable inputs |
Fixed income securities, including municipal bonds, are classified as Level 2 since the values for such securities are based on prices provided by an independent pricing service that utilizes various “other significant observable inputs” including bid and ask quotations, prices of similar securities and interest rates, among other factors. Commercial paper held by the Funds is classified as Level 2 since it is valued at amortized cost, which approximates the current market value of the security and is not obtained from a quoted price in an active market.
The inputs or methodology used for valuing securities are not necessarily an indication of the risks associated with investing in those securities. The inputs used to measure fair value may fall into different levels of the fair value hierarchy. In such cases, for disclosure purposes, the level in the fair value hierarchy within which the fair value measurement falls in its entirety is determined based on the lowest level input that is significant to the fair value measurement.
29
THE GOVERNMENT STREET FUNDS
NOTES TO FINANCIAL STATEMENTS (Continued)
The following is a summary of the inputs used to value each Fund’s investments as of September 30, 2015 by security type:
The Government Street Equity Fund | | Level 1 | | | Level 2 | | | Level 3 | | | Total | |
Common Stocks | | $ | 71,491,272 | | | $ | — | | | $ | — | | | $ | 71,491,272 | |
Exchange-Traded Funds | | | 5,156,493 | | | | — | | | | — | | | | 5,156,493 | |
Commercial Paper | | | — | | | | 3,208,000 | | | | — | | | | 3,208,000 | |
Money Market Funds | | | 190,001 | | | | — | | | | — | | | | 190,001 | |
Total | | $ | 76,837,766 | | | $ | 3,208,000 | | | $ | — | | | $ | 80,045,766 | |
The Government Street Mid-Cap Fund | | Level 1 | | | Level 2 | | | Level 3 | | | Total | |
Common Stocks | | $ | 38,277,060 | | | $ | — | | | $ | — | | | $ | 38,277,060 | |
Exchange-Traded Funds | | | 3,643,463 | | | | — | | | | — | | | | 3,643,463 | |
Commercial Paper | | | — | | | | 2,618,000 | | | | — | | | | 2,618,000 | |
Money Market Funds | | | 178,384 | | | | — | | | | — | | | | 178,384 | |
Total | | $ | 42,098,907 | | | $ | 2,618,000 | | | $ | — | | | $ | 44,716,907 | |
The Alabama Tax Free Bond Fund | | Level 1 | | | Level 2 | | | Level 3 | | | Total | |
Municipal Bonds | | $ | — | | | $ | 28,247,796 | | | $ | — | | | $ | 28,247,796 | |
Money Market Funds | | | 1,055,649 | | | | — | | | | — | | | | 1,055,649 | |
Total | | $ | 1,055,649 | | | $ | 28,247,796 | | | $ | — | | | $ | 29,303,445 | |
Refer to The Government Street Equity Fund’s and The Government Street Mid-Cap Fund’s Schedules of Investments for a listing of the common stocks by sector type. As of September 30, 2015, the Funds did not have any transfers into and out of any Level. There were no Level 3 securities or derivative instruments held by the Funds as of September 30, 2015. It is the Funds’ policy to recognize transfers into and out of any Level at the end of the reporting period.
Share valuation — The net asset value per share of each Fund is calculated daily by dividing the total value of its assets, less liabilities, by the number of shares outstanding. The offering price and redemption price per share of each Fund is equal to the net asset value per share.
Investment income — Interest income is accrued as earned. Dividend income is recorded on the ex-dividend date. Discounts and premiums on fixed-income securities purchased are amortized using the interest method.
Distributions to shareholders — Dividends arising from net investment income are declared and paid quarterly to shareholders of The Government Street Equity Fund; declared and paid annually to shareholders of The Government Street Mid-Cap Fund; and declared daily and paid monthly to shareholders of The Alabama Tax Free Bond Fund. Net realized short-term capital gains, if any, may be distributed throughout the
30
THE GOVERNMENT STREET FUNDS
NOTES TO FINANCIAL STATEMENTS (Continued)
year and net realized long-term capital gains, if any, are distributed at least once each year. The amount of distributions from net investment income and net realized capital gains are determined in accordance with federal income tax regulations, which may differ from GAAP. These “book/tax” differences are either temporary or permanent in nature.
The tax character of distributions paid during the periods ended September 30, 2015 and March 31, 2015 is as follows:
| Period
Ended | | Ordinary Income | | | Exempt- Interest Dividends | | | Long-Term Capital Gains | | | Total Distributions | |
The Government Street Equity Fund | 9/30/15 | | $ | 464,720 | | | $ | — | | | $ | 1,668,939 | | | $ | 2,133,659 | |
| | 3/31/15 | | $ | 919,996 | | | $ | — | | | $ | 4,883,611 | | | $ | 5,803,607 | |
The Government Street Mid-Cap Fund | 9/30/15 | | $ | 82,064 | | | $ | — | | | $ | 1,564,729 | | | $ | 1,646,793 | |
| | 3/31/15 | | $ | 164,104 | | | $ | — | | | $ | 1,759,524 | | | $ | 1,923,628 | |
The Alabama Tax Free Bond Fund | 9/30/15 | | $ | — | | | $ | 188,221 | | | $ | — | | | $ | 188,221 | |
| | 3/31/15 | | $ | — | | | $ | 408,862 | | | $ | — | | | $ | 408,862 | |
Security transactions — Security transactions are accounted for on trade date for financial reporting purposes. Gains and losses on securities sold are determined on a specific identification basis.
Common expenses — Common expenses of the Trust are allocated among the series of the Trust based on relative net assets of each series or the nature of the services performed and the relative applicability to each series.
Estimates — The preparation of financial statements in conformity with GAAP requires management to make estimates and assumptions that affect the reported amounts of assets and liabilities and the disclosure of contingent assets and liabilities as of the date of the financial statements and the reported amounts of income and expenses during the reporting period. Actual results could differ from those estimates.
Federal income tax — Each Fund has qualified and intends to continue to qualify as a regulated investment company under the Internal Revenue Code of 1986 (the “Code”). Qualification generally will relieve the Funds of liability for federal income taxes to the extent 100% of their net investment income and any realized capital gains are distributed in accordance with the Code. Accordingly, no provision for income tax has been made.
In order to avoid imposition of the excise tax applicable to regulated investment companies, it is also each Fund’s intention to declare as dividends in each calendar year at least 98% of its net investment income (earned during the calendar year) and 98.2% of its net realized capital gains (earned during the twelve months ended October 31) plus undistributed amounts from prior years.
31
THE GOVERNMENT STREET FUNDS
NOTES TO FINANCIAL STATEMENTS (Continued)
The following information is computed on a tax basis for each item as of September 30, 2015:
| | The Government
Street Equity
Fund | | | The Government
Street Mid-Cap
Fund | | | The Alabama
Tax Free Bond
Fund | |
Cost of portfolio investments | | $ | 49,709,486 | | | $ | 26,161,848 | | | $ | 28,833,569 | |
Gross unrealized appreciation | | $ | 31,543,219 | | | $ | 18,959,848 | | | $ | 487,260 | |
Gross unrealized depreciation | | | (1,206,939 | ) | | | (404,789 | ) | | | (17,384 | ) |
Net unrealized appreciation | | | 30,336,280 | | | | 18,555,059 | | | | 469,876 | |
Undistributed ordinary income | | | 7,181 | | | | 86,229 | | | | — | |
Undistributed tax exempt income | | | — | | | | — | | | | 2,125 | |
Capital loss carryforwards | | | — | | | | — | | | | (63,361 | ) |
Other gains | | | 619,443 | | | | 579,276 | | | | 1,152 | |
Other temporary differences | | | (3,911 | ) | | | — | | | | (2,125 | ) |
Total distributable earnings | | $ | 30,958,993 | | �� | $ | 19,220,564 | | | $ | 407,667 | |
As of March 31, 2015, The Alabama Tax Free Bond Fund had a short-term capital loss carryforward for federal income tax purposes of $24,704 and a long-term capital loss carryforward for federal income tax purposes of $38,657, both of which may be carried forward indefinitely. These capital loss carryforwards are available to offset realized capital gains in the current and future years, thereby reducing future taxable gains distributions.
During the six months ended September 30, 2015, The Government Street Equity Fund and The Government Street Mid-Cap Fund realized $2,982,115 and $447,745, respectively, of net capital gains resulting from in-kind redemptions (redemptions in which shareholders who redeemed Fund shares received securities held by the Fund rather than cash). The Funds recognize a gain on in-kind redemptions to the extent that the value of the distributed securities on the date of redemption exceeds the cost of those securities. Such gains are not taxable to the Funds and are not required to be distributed to shareholders. The Funds have reclassified these amounts against paid-in capital. These reclassifications are reflected on the Statements of Assets and Liabilities. Such reclassifications, the result of permanent differences between the financial statement and income tax reporting requirements, had no effect on each Fund’s net assets or net asset value per share.
The Funds recognize the tax benefits or expenses of uncertain tax positions only when the position is “more likely than not” to be sustained assuming examination by tax authorities. Management has reviewed the tax positions taken on federal income tax returns for the current and all open tax years (tax years ended March 31, 2012 through March 31, 2015) of each Fund and has concluded that no provision for unrecognized tax benefits or expenses is required in these financial statements.
32
THE GOVERNMENT STREET FUNDS
NOTES TO FINANCIAL STATEMENTS (Continued)
3. Investment Transactions
Investment transactions, other than short-term investments and U.S. government securities, were as follows for the six months ended September 30, 2015:
| | The Government
Street Equity
Fund | | | The Government
Street Mid-Cap
Fund | | | The Alabama
Tax Free Bond
Fund | |
Purchases of investment securities | | $ | 3,605,780 | | | $ | 2,601,277 | | | $ | 2,027,603 | |
Proceeds from sales and maturities of investment securities | | $ | 13,293,636 | | | $ | 6,943,350 | | | $ | 1,920,911 | |
4. Transactions with Related Parties
INVESTMENT ADVISORY AGREEMENT
The Funds’ investments are managed by Leavell Investment Management, Inc. (the “Adviser”) under the terms of an Investment Advisory Agreement. The Government Street Equity Fund pays the Adviser a fee, which is computed and accrued daily and paid monthly, at an annual rate of .60% of its average daily net assets up to $100 million and .50% of such assets in excess of $100 million. The Government Street Mid-Cap Fund pays the Adviser a fee, which is computed and accrued daily and paid monthly, at an annual rate of .75% of its average daily net assets. The Alabama Tax Free Bond Fund pays the Adviser a fee, which is computed and accrued daily and paid monthly, at an annual rate of .35% of its average daily net assets up to $100 million and .25% of such assets in excess of $100 million.
During the six months ended September 30, 2015, the Adviser voluntarily limited the total operating expenses of The Alabama Tax Free Bond Fund to .65% of the Fund’s average daily net assets. Accordingly, the Adviser waived $24,909 of its investment advisory fees from The Alabama Tax Free Bond Fund during the six months ended September 30, 2015.
Certain officers of the Trust are also officers of the Adviser.
OTHER SERVICE PROVIDERS
Ultimus Fund Solutions, LLC (“Ultimus”) provides fund administration, fund accounting, compliance and transfer agent services to the Funds. The Funds pay Ultimus fees in accordance with the agreements for such services. In addition, the Funds pay out-of-pocket expenses including, but not limited to, postage, supplies, and costs of pricing the Funds’ portfolio securities. Certain officers of the Trust are also officers of Ultimus, or of Ultimus Fund Distributors, LLC (the “Distributor”), the principal underwriter of each Fund’s shares and an affiliate of Ultimus. The Distributor is compensated by the Adviser (not the Funds) for acting as principal underwriter.
33
THE GOVERNMENT STREET FUNDS
NOTES TO FINANCIAL STATEMENTS (Continued)
COMPENSATION OF TRUSTEES
Trustees and officers affiliated with the Adviser or Ultimus are not compensated by the Trust for their services. Each Trustee who is not an affiliated person of the Adviser or Ultimus receives from the Trust an annual retainer of $12,000, payable quarterly; a fee of $1,500 for attendance at each meeting of the Board of Trustees (except that such fee is $2,500 for the independent chairman); and a fee of $1,000 for attendance at each meeting of any committee of the Board (except that such fee is $1,500 for the committee chairman); plus reimbursement of travel and other expenses incurred in attending meetings.
5. Contingencies and Commitments
The Funds indemnify the Trust’s officers and Trustees for certain liabilities that might arise from their performance of their duties to the Funds. Additionally, in the normal course of business the Funds enter into contracts that contain a variety of representations and warranties and which provide general indemnifications. The Funds’ maximum exposure under these arrangements is unknown, as this would involve future claims that may be made against the Funds that have not yet occurred. However, based on experience, the Funds expect the risk of loss to be remote.
6. Concentration of Credit Risk
The Alabama Tax Free Bond Fund invests primarily in debt instruments of municipal issuers in the state of Alabama. The issuers’ abilities to meet their obligations may be affected by economic developments in the state or its region, as well as disruptions in the credit markets and the economy, generally.
7. Subsequent Events
The Funds are required to recognize in the financial statements the effects of all subsequent events that provide additional evidence about conditions that existed as of the date of the Statements of Assets and Liabilities. For non-recognized subsequent events that must be disclosed to keep the financial statements from being misleading, the Funds are required to disclose the nature of the event as well as an estimate of its financial effect, or a statement that such an estimate cannot be made. Management has evaluated subsequent events through the issuance of these financial statements and has noted no such events.
34
THE GOVERNMENT STREET FUNDS
ABOUT YOUR FUNDS’ EXPENSES (Unaudited)
We believe it is important for you to understand the impact of costs on your investment. All mutual funds have operating expenses. As a shareholder of the Funds, you incur ongoing costs, including management fees and other expenses. These ongoing costs, which are deducted from each Fund’s gross income, directly reduce the investment returns of the Funds.
A mutual fund’s ongoing costs are expressed as a percentage of its average net assets. This figure is known as the expense ratio. The following examples are intended to help you understand the ongoing costs (in dollars) of investing in the Funds and to compare these costs with the ongoing costs of investing in other mutual funds. The examples below are based on an investment of $1,000 made at the beginning of the period shown and held for the entire period (April 1, 2015 through September 30, 2015).
The table below illustrates each Fund’s ongoing costs in two ways:
Actual fund return – This section helps you to estimate the actual expenses that you paid over the period. The “Ending Account Value” shown is derived from each Fund’s actual return, and the third column shows the dollar amount of operating expenses that would have been paid by an investor who started with $1,000 in the Funds. You may use the information here, together with the amount you invested, to estimate the expenses that you paid over the period.
To do so, simply divide your account value by $1,000 (for example, an $8,600 account value divided by $1,000 = 8.6), then multiply the result by the number given for the Funds under the heading “Expenses Paid During Period.”
Hypothetical 5% return – This section is intended to help you compare the Funds’ ongoing costs with those of other mutual funds. It assumes that each Fund had an annual return of 5% before expenses during the period shown, but that the expense ratio is unchanged. In this case, because the returns used are not the Funds’ actual returns, the results do not apply to your investment. The example is useful in making comparisons because the Securities and Exchange Commission (the “SEC”) requires all mutual funds to calculate expenses based on a 5% return. You can assess each Fund’s ongoing costs by comparing this hypothetical example with the hypothetical examples that appear in shareholder reports of other funds.
Note that expenses shown in the table are meant to highlight and help you compare ongoing costs only. The Funds do not charge sales loads or redemption fees.
The calculations assume no shares were bought or sold during the period. Your actual costs may have been higher or lower, depending on the amount of your investment and the timing of any purchases or redemptions.
35
THE GOVERNMENT STREET FUNDS
ABOUT YOUR FUNDS’ EXPENSES (Unaudited) (Continued)
More information about the Funds’ expenses, including historical expense ratios, can be found in this report. For additional information on operating expenses and other shareholder costs, please refer to the Funds’ prospectus.
| | Beginning
Account Value
April 1, 2015 | Ending
Account Value
Sept. 30, 2015 | Net Expense Ratio(a) | Expenses
Paid During
Period(b) |
The Government Street Equity Fund |
Based on Actual Fund Return | $1,000.00 | $931.30 | 0.85% | $4.12 |
Based on Hypothetical 5% Return (before expenses) | $1,000.00 | $1,020.81 | 0.85% | $4.31 |
The Government Street Mid-Cap Fund |
Based on Actual Fund Return | $1,000.00 | $928.60 | 1.07% | $5.17 |
Based on Hypothetical 5% Return (before expenses) | $1,000.00 | $1,019.70 | 1.07% | $5.42 |
The Alabama Tax Free Bond Fund |
Based on Actual Fund Return | $1,000.00 | $1,005.60 | 0.65% | $3.27 |
Based on Hypothetical 5% Return (before expenses) | $1,000.00 | $1,021.81 | 0.65% | $3.29 |
(a) | Annualized, based on the Fund’s most recent one-half year expenses. |
(b) | Expenses are equal to the Fund’s annualized expense ratio multiplied by the average account value over the period, multiplied by 183/365 (to reflect the one-half year period). |
36
THE GOVERNMENT STREET FUNDS
OTHER INFORMATION (Unaudited)
A description of the policies and procedures that the Funds use to vote proxies relating to portfolio securities is available without charge upon request by calling toll-free 1-866-738-1125, or on the SEC’s website at http://www.sec.gov. Information regarding how the Funds voted proxies relating to portfolio securities during the most recent 12-month period ended June 30 is also available without charge upon request by calling toll-free 1-866-738-1125 or on the SEC’s website at http://www.sec.gov.
The Trust files a complete listing of portfolio holdings for the Funds with the SEC as of the end of the first and third quarters of each fiscal year on Form N-Q. The filings are available upon request, by calling 1-866-738-1125. Furthermore, you may obtain a copy of these filings on the SEC’s website at http://www.sec.gov. The Trust’s Forms N-Q may also be reviewed and copied at the SEC’s Public Reference Room in Washington, DC, and information on the operation of the Public Reference Room may be obtained by calling 1-800-SEC-0330.
37
| | The Government Street Funds
No-Load Mutual Funds Investment Adviser Leavell Investment Management, Inc. 210 St. Joseph Street Mobile, AL 36602 Administrator Ultimus Fund Solutions, LLC P.O. Box 46707 Cincinnati, OH 45246-0707 1-866-738-1125 Legal Counsel Sullivan & Worcester LLP One Post Office Square Boston, MA 02109 Independent Registered Public Accounting Firm Ernst & Young LLP 1900 Scripps Center 312 Walnut Street Cincinnati, OH 45202 Board of Trustees Robert S. Harris, Ph.D., Chairman John P. Ackerly, IV John T. Bruce George K. Jennison Harris V. Morrissette Elizabeth W. Robertson Portfolio Managers Thomas W. Leavell, The Government Street Equity Fund The Government Street Mid-Cap Fund Timothy S. Healey, The Government Street Mid-Cap Fund The Alabama Tax Free Bond Fund Richard E. Anthony, Jr., CFA, The Government Street Mid-Cap Fund | |
THE
JAMESTOWN
FUNDS No-Load Funds The Jamestown Equity Fund
The Jamestown Tax Exempt Virginia Fund SEMI-ANNUAL REPORT September 30, 2015
(Unaudited) Investment Adviser Lowe, Brockenbrough & Company, Inc. Richmond, Virginia |
LETTER TO SHAREHOLDERS | October 26, 2015 |
The Jamestown Equity Fund
For the six month period ended September 30, 2015, The Jamestown Equity Fund (the “Fund”) declined -9.58% compared to -6.18% for the S&P 500 Index, the Fund’s benchmark. Equity market volatility returned in the third calendar quarter of 2015 as investors grew increasingly nervous about slower economic growth around the globe. The U.S. economy continues to be somewhat uneven from quarter to quarter, yet it is generally consistent with the modest growth and low inflation manifested since the initial recovery from the financial crisis. Global economies are experiencing a modest slowdown, with U.S. growth slightly disappointing, slower growth in emerging markets and slightly better than expected growth in Europe. Monetary policy continues to be extremely accommodative across the globe. The Federal Reserve decided to hold off from raising interest rates at its September 2015 policy meeting; the European Central Bank stands ready to extend its quantitative easing program if necessary; and interest rates are being cut across many emerging markets including China. While we are looking vigilantly for signs that the slowdown could morph into something more ominous, our indicators currently predict that a recession is neither imminent nor even on the near-term horizon.
Consumer Discretionary, Consumer Staples and Utilities were the best performing sectors during the six month period, while the Energy, Industrials, and Materials sectors lagged. The Fund’s performance trailed that of its benchmark during the period due to stock selection. The Fund’s stock selection was positive in the Materials sector, while stock selection was most negative in the Information Technology, Energy and Industrials sectors.
At the end of September 2015, the greatest sector overweights in the Fund, relative to benchmark weightings, were in the Health Care and Consumer Discretionary sectors. The largest sector underweights in the Fund were in the Utilities, Telecommunication Services, and Consumer Staples sectors.
Earnings growth for the S&P 500 Index has been negative year-to-date, as the drag from lower commodity prices and the translation effect of the stronger U.S. dollar has dampened profits for many large multinational companies. We believe that further upside for stock prices will likely depend on future earnings growth rather than further expansion in valuation. The S&P 500 Index ended the September 2015 quarter trading above 16 times forward 12 month earnings, slightly above the historical average, while the holdings in the Fund are valued at approximately 13.5 times forward 12 month earnings.
We continue to evaluate the above factors and look for opportunities to buy what we believe to be are high-quality businesses trading at reasonable prices. Our biggest concerns continue to be the very elevated level of profit margins currently enjoyed by public companies, as well as the pace of global economic growth. Profit margins are likely to be supported until there is significant pressure from wage growth or an economic slowdown, neither of which appear imminent.
The merger of The Jamestown Balanced Fund into The Jamestown Equity Fund was consummated on July 29, 2015. We appreciate the cooperation of the shareholders who approved the reorganization. As a result of the merger, the expense ratio for The Jamestown Equity Fund is projected to be at an annual rate of 0.98%. Thank you for investing in The Jamestown Equity Fund.
1
THE JAMESTOWN TAX EXEMPT VIRGINIA FUND
For the six month period ended September 30, 2015, The Jamestown Tax Exempt Virginia Fund (the “Fund”) earned a total return of 0.50%. By comparison, the Barclays 1-10 Year Municipal Blend Index returned 0.80% for the period. As of September 30, 2015, the Fund’s SEC 30-day yield was 1.66%, which is a taxable equivalent yield of 2.93% for investors subject to the maximum 43.4% federal income tax rate.
The U.S. economy experienced moderate growth with real GDP expanding by 2.3% during the first six months of 2015. The recovery in labor markets has essentially reached full employment, with the unemployment rate falling to 5.1%. Disinflation was evident due to the plunge in oil prices with the Consumer Price Index falling to 0.0% year-over-year change as of September 30, 2015. Core prices, excluding food and energy, were up by 1.9% during the same interval. Monetary policy remained extraordinarily accommodative through the period. The Federal Reserve (the “Fed”) kept short-term interest rates near zero, where they have been since late 2008. Certain Fed officials have signaled their intention to begin normalizing interest rates, yet the central bank continues to find reasons to delay the first rate hike. Interest rate futures markets are now pushing out the expected timing of liftoff to 2016.
The second calendar quarter of 2015 saw municipal bond prices fall as yields climbed. Subsequently bonds rallied during the third quarter on safe haven demand during an environment of renewed turbulence in global equity markets. Over the fiscal six month period, interest rates fluctuated in a narrow range and were slightly higher at the close of the period. Quality spreads were little changed during the period. Primary market issuance for municipal bonds has been robust in 2015 although issuance waned in September.
Interest income contributed to the Fund’s return for the reporting period, while the decrease in municipal bond prices detracted from performance. The Fund’s relative performance can be attributed to its duration, yield curve positioning and its emphasis on high credit quality. For the fiscal six month period, the slope of the municipal yield curve was little changed as it steepened while yields were rising and then flattened as yields dropped towards the end of the period. The yield advantage of longer maturity bonds was the driver of returns in this environment. At September 30, 2015, the Fund’s average stated maturity was 5.8 years, nearly unchanged from the beginning of the period, while the effective duration increased to 4.1 years from 3.9 years.
We expect the Fund will remain cautiously positioned with regard to interest rate sensitivity as the long-anticipated increase in interest rates could be just around the corner.
Data presented reflects past performance, which is no guarantee of future results. Investment results and principal value will fluctuate so that shares, when redeemed, may be worth more or less than their original cost. Due to market volatility, current performance may be higher or lower than the performance shown.
This report is submitted for the general information of the shareholders of the Funds. The report is not authorized for distribution to prospective investors in the Funds unless it is accompanied by a current prospectus.
This report reflects our views, opinions and portfolio holdings as of September 30, 2015, the end of the reporting period. These views are subject to change at any time based upon market or other conditions. For more current information throughout the year please visit www.jamestownfunds.com. The Funds are distributed by Ultimus Fund Distributors, LLC.
2
THE JAMESTOWN EQUITY FUND
PERFORMANCE INFORMATION (Unaudited)
Comparison of the Change in Value of a $10,000 Investment in
The Jamestown Equity Fund and the Standard & Poor’s 500® Index

| | Average Annual Total Returns(a)
(for periods ended September 30, 2015) |
| | 1 Year | 5 Years | 10 Years |
The Jamestown Equity Fund | (5.69%) | 11.55% | 5.57% |
Standard & Poor’s 500® Index | (0.61%) | 13.34% | 6.80% |
(a) | Total return is a measure of the change in value of an investment in the Fund over the periods covered, which assumes any dividends or capital gains distributions are reinvested in shares of the Fund. Returns shown do not reflect the deduction of taxes a shareholder would pay on Fund distributions or the redemption of Fund shares. |
3
THE JAMESTOWN TAX EXEMPT VIRGINIA FUND
PERFORMANCE INFORMATION (Unaudited)
Comparison of the Change in Value of a $10,000 Investment in
The Jamestown Tax Exempt Virginia Fund, the Barclays 1-10 Year Municipal Blend Index*
and the Barclays Municipal Bond Index

| | Average Annual Total Returns(a)
(for periods ended September 30, 2015) |
| | 1 Year | 5 Years | 10 Years |
The Jamestown Tax Exempt Virginia Fund | 1.45% | 1.73% | 2.97% |
Barclays 1-10 Year Municipal Blend Index | 2.22% | 3.00% | 4.05% |
Barclays Municipal Bond Index | 3.16% | 4.14% | 4.63% |
* | The Barclays 1-10 Year Municipal Blend Index is an unmanaged, market value-weighted index which covers the short and intermediate components of the U.S. investment-grade tax-exempt bond market. The Barclays Municipal Bond Fund is a rules-based, market-value-weighted index engineered for the long-term tax-exempt bond market. |
(a) | Total return is a measure of the change in value of an investment in the Fund over the periods covered, which assumes any dividends or capital gains distributions are reinvested in shares of the Fund. Returns shown do not reflect the deduction of taxes a shareholder would pay on Fund distributions or the redemption of Fund shares. |
4
THE JAMESTOWN EQUITY FUND
PORTFOLIO INFORMATION
September 30, 2015 (Unaudited)
Sector Concentration vs. the S&P 500® Index |

Ten Largest Equity Holdings | % of
Net Assets |
Apple, Inc. | 4.6% |
CVS Health Corporation | 3.3% |
Allergan plc | 2.7% |
AmerisourceBergen Corporation | 2.6% |
Cisco Systems, Inc. | 2.6% |
Discover Financial Services | 2.5% |
JPMorgan Chase & Company | 2.3% |
Dollar Tree, Inc. | 2.3% |
McKesson Corporation | 2.3% |
Lennar Corporation - Class A | 2.2% |
THE JAMESTOWN TAX EXEMPT VIRGINIA FUND
PORTFOLIO INFORMATION
September 30, 2015 (Unaudited)
Characteristics
(Weighted Average) | | Maturity Breakdown
(% of Portfolio) |
30-day SEC Yield | 1.66% | | |
Tax-Equivalent Yield | 2.93%* | |
Average Maturity (years) | 5.8 | |
Average Duration (years) | 4.1 | |
Average Quality | AA | |
Number of Issues | 59 | |
| | | |
| * | Assumes a maximum 43.4% federal tax rate. |
Credit Quality (% of Portfolio) | | Sector Diversification (% of Portfolio) |
| | |
THE JAMESTOWN EQUITY FUND
SCHEDULE OF INVESTMENTS
September 30, 2015 (Unaudited) | |
COMMON STOCKS — 95.3% | | Shares | | | Value | |
Consumer Discretionary — 15.6% | | | | | | |
Comcast Corporation - Class A | | | 13,900 | | | $ | 790,632 | |
Dollar Tree, Inc. (a) | | | 13,500 | | | | 899,910 | |
Home Depot, Inc. (The) | | | 3,500 | | | | 404,215 | |
Johnson Controls, Inc. | | | 18,100 | | | | 748,616 | |
Lennar Corporation - Class A | | | 17,800 | | | | 856,714 | |
Priceline Group, Inc. (The) (a) | | | 650 | | | | 803,959 | |
Royal Caribbean Cruises Ltd. | | | 8,500 | | | | 757,265 | |
TJX Companies, Inc. (The) | | | 11,500 | | | | 821,330 | |
| | | | | | | | 6,082,641 | |
Consumer Staples — 7.2% | | | | | | | | |
Archer-Daniels-Midland Company | | | 12,900 | | | | 534,705 | |
CVS Health Corporation | | | 13,300 | | | | 1,283,184 | |
PepsiCo, Inc. | | | 6,800 | | | | 641,240 | |
Procter & Gamble Company (The) | | | 4,900 | | | | 352,506 | |
| | | | | | | | 2,811,635 | |
Energy — 4.1% | | | | | | | | |
Chevron Corporation | | | 7,000 | | | | 552,160 | |
Hess Corporation | | | 11,200 | | | | 560,672 | |
Marathon Oil Corporation | | | 30,600 | | | | 471,240 | |
| | | | | | | | 1,584,072 | |
Financials — 15.9% | | | | | | | | |
Ameriprise Financial, Inc. | | | 7,000 | | | | 763,910 | |
Discover Financial Services | | | 18,700 | | | | 972,213 | |
Invesco Ltd. | | | 23,500 | | | | 733,905 | |
JPMorgan Chase & Company | | | 15,000 | | | | 914,550 | |
MetLife, Inc. | | | 15,000 | | | | 707,250 | |
Morgan Stanley | | | 21,400 | | | | 674,100 | |
PNC Financial Services Group, Inc. (The) | | | 8,300 | | | | 740,360 | |
Principal Financial Group, Inc. | | | 14,700 | | | | 695,898 | |
| | | | | | | | 6,202,186 | |
Health Care — 17.0% | | | | | | | | |
Abbott Laboratories | | | 9,600 | | | | 386,112 | |
AbbVie, Inc. | | | 8,500 | | | | 462,485 | |
Aetna, Inc. | | | 7,500 | | | | 820,575 | |
Allergan plc (a) | | | 3,850 | | | | 1,046,469 | |
AmerisourceBergen Corporation | | | 10,800 | | | | 1,025,892 | |
Amgen, Inc. | | | 5,100 | | | | 705,432 | |
McKesson Corporation | | | 4,750 | | | | 878,892 | |
Thermo Fisher Scientific, Inc. | | | 5,975 | | | | 730,623 | |
UnitedHealth Group, Inc. | | | 5,000 | | | | 580,050 | |
| | | | | | | | 6,636,530 | |
7
THE JAMESTOWN EQUITY FUND
SCHEDULE OF INVESTMENTS (Continued) | |
COMMON STOCKS — 95.3% (Continued) | | Shares | | | Value | |
Industrials — 13.3% | | | | | | |
CSX Corporation | | | 14,400 | | | $ | 387,360 | |
Eaton Corporation plc | | | 11,050 | | | | 566,865 | |
FedEx Corporation | | | 5,100 | | | | 734,298 | |
General Electric Company | | | 33,000 | | | | 832,260 | |
Nielsen Holdings plc | | | 17,500 | | | | 778,225 | |
Norfolk Southern Corporation | | | 8,000 | | | | 611,200 | |
Ryder System, Inc. | | | 9,100 | | | | 673,764 | |
United Technologies Corporation | | | 7,000 | | | | 622,930 | |
| | | | | | | | 5,206,902 | |
Information Technology — 19.0% | | | | | | | | |
Apple, Inc. | | | 16,400 | | | | 1,808,920 | |
Cisco Systems, Inc. | | | 38,000 | | | | 997,500 | |
EMC Corporation | | | 31,000 | | | | 748,960 | |
Google, Inc. - Class A (a) | | | 975 | | | | 622,411 | |
Google, Inc. - Class C (a) | | | 1,000 | | | | 608,420 | |
Microsoft Corporation | | | 11,000 | | | | 486,860 | |
Oracle Corporation | | | 20,700 | | | | 747,684 | |
QUALCOMM, Inc. | | | 11,000 | | | | 591,030 | |
TE Connectivity Ltd. | | | 13,250 | | | | 793,542 | |
| | | | | | | | 7,405,327 | |
Materials — 3.2% | | | | | | | | |
Eastman Chemical Company | | | 11,350 | | | | 734,572 | |
LyondellBasell Industries N.V. - Class A | | | 6,400 | | | | 533,504 | |
| | | | | | | | 1,268,076 | |
| | | | | | | | | |
Total Common Stocks (Cost $26,545,248) | | | | | | $ | 37,197,369 | |
EXCHANGE-TRADED FUNDS — 1.7% | | Shares | | | Value | |
Consumer Staples Select Sector SPDR® Fund (The) (Cost $672,234) | | | 14,000 | | | $ | 660,660 | |
| | | | | | | | | |
Total Investments at Value — 97.0% (Cost $27,217,482) | | | | | | $ | 37,858,029 | |
| | | | | | | | | |
Other Assets in Excess of Liabilities — 3.0% | | | | | | | 1,154,889 | |
| | | | | | | | | |
Net Assets — 100.0% | | | | | | $ | 39,012,918 | |
(a) | Non-income producing security. |
See accompanying notes to financial statements. |
8
THE JAMESTOWN TAX EXEMPT VIRGINIA FUND
SCHEDULE OF INVESTMENTS
September 30, 2015 (Unaudited) |
VIRGINIA REVENUE AND GENERAL OBLIGATION (GO) BONDS — 91.1% | | Par Value | | | Value | |
Capital Region Airport Commission, Virginia, Airport Revenue, | | | | | | |
4.50%, due 07/01/2016 | | $ | 520,000 | | | $ | 536,125 | |
Chesterfield Co., Virginia, GO, | | | | | | | | |
5.00%, due 01/01/2020 | | | 700,000 | | | | 739,102 | |
5.00%, due 01/01/2024 | | | 250,000 | | | | 297,755 | |
5.00%, due 01/01/2025 | | | 460,000 | | | | 566,062 | |
City of Winchester, Virginia, GO, | | | | | | | | |
5.00%, due 09/01/2027 | | | 125,000 | | | | 152,185 | |
Fairfax Co., Virginia, Industrial Dev. Authority, Revenue, | | | | | | | | |
5.00%, due 05/15/2022 | | | 750,000 | | | | 846,000 | |
Fairfax Co., Virginia, Sewer, Revenue, | | | | | | | | |
4.50%, due 07/15/2030 | | | 250,000 | | | | 274,532 | |
Fairfax Co., Virginia, Water, Revenue, | | | | | | | | |
5.00%, due 04/01/2027 | | | 500,000 | | | | 592,380 | |
Fauquier Co., Virginia, GO, | | | | | | | | |
5.00%, due 07/01/2017, | | | | | | | | |
prerefunded 07/01/2016 @ 100 | | | 500,000 | | | | 517,965 | |
Hampton Roads Sanitation District, Virginia, Wastewater, Revenue, | | | | | | | | |
5.00%, due 04/01/2022 | | | 400,000 | | | | 442,072 | |
5.00%, due 07/01/2026 | | | 500,000 | | | | 606,245 | |
Hampton Roads Sanitation District, Virginia, Wastewater, Series A, Revenue, | | | | | | | | |
5.00%, due 01/01/2027 | | | | | | | | |
prerefunded 04/01/2018 @ 100 | | | 400,000 | | | | 455,260 | |
Hampton, Virginia, GO, | | | | | | | | |
5.00%, due 04/01/2025 | | | 500,000 | | | | 594,990 | |
Harrisonburg, Virginia, GO, | | | | | | | | |
5.00%, due 07/15/2022 | | | 350,000 | | | | 422,345 | |
Henrico Co., Virginia, Public Improvement, Series A, GO, | | | | | | | | |
5.00%, due 12/01/2015 | | | 250,000 | | | | 252,080 | |
Henrico Co., Virginia, Water & Sewer, Revenue, | | | | | | | | |
5.00%, due 05/01/2020 | | | 350,000 | | | | 398,002 | |
5.00%, due 05/01/2022 | | | 430,000 | | | | 486,528 | |
James City, Virginia, School District, GO, | | | | | | | | |
5.00%, due 12/15/2018 | | | | | | | | |
prerefunded 12/15/2015 @ 100 | | | 500,000 | | | | 505,085 | |
Leesburg, Virginia, GO, | | | | | | | | |
5.00%, due 09/15/2016 | | | 500,000 | | | | 522,845 | |
Louisa, Virginia, Industrial Dev. Authority, Poll Control Revenue, | | | | | | | | |
2.15%, due 11/01/2035 | | | 200,000 | | | | 200,294 | |
9
THE JAMESTOWN TAX EXEMPT VIRGINIA FUND
SCHEDULE OF INVESTMENTS (Continued) | |
VIRGINIA REVENUE AND GENERAL OBLIGATION (GO) BONDS — 91.1% (Continued) | | Par Value | | | Value | |
Lynchburg, Virginia, Public Improvement, Series A, GO, | | | | | | |
5.00%, due 08/01/2019 | | $ | 625,000 | | | $ | 715,619 | |
Manassas, Virginia, Public Improvement,Series D, GO, | | | | | | | | |
5.00%, due 07/01/2019 | | | 250,000 | | | | 286,837 | |
New Kent Co., Virginia, Economic Dev. Authority, Revenue, | | | | | | | | |
5.00%, due 02/01/2019 | | | | | | | | |
prerefunded 02/01/2017 @ 100 | | | 500,000 | | | | 529,815 | |
Northern Virginia Transportation Authority, Special Tax, Revenue, | | | | | | | | |
5.00%, due 06/01/2026 | | | 400,000 | | | | 483,768 | |
Portsmouth, Virginia, Series D, GO, | | | | | | | | |
4.00%, due 12/01/2017 | | | 215,000 | | | | 230,624 | |
Prince William Co., Virginia, Lease Participation Certificates, | | | | | | | | |
5.00%, due 10/01/2020 | | | 500,000 | | | | 581,155 | |
Rappahannock Virginia Regional Jail Authority, Revenue, | | | | | | | | |
5.00%, due 10/01/2024 | | | 300,000 | | | | 365,595 | |
Roanoke, Virginia, Public Improvement, Series A, GO, | | | | | | | | |
5.00%, due 07/15/2025 | | | 400,000 | | | | 479,544 | |
Spotsylvania Co., Virginia, Economic Dev. Authority, Revenue, | | | | | | | | |
5.00%, due 06/01/2021 | | | 300,000 | | | | 354,405 | |
Spotsylvania Co., Virginia, GO, | | | | | | | | |
5.00%, due 01/15/2023 | | | 400,000 | | | | 486,644 | |
Spotsylvania Co., Virginia, Water & Sewer, Revenue, | | | | | | | | |
5.00%, due 06/01/2026 | | | 500,000 | | | | 500,070 | |
Stafford Co., Virginia, Public Improvement, GO, | | | | | | | | |
5.00%, due 08/01/2026 | | | 375,000 | | | | 468,881 | |
Suffolk, Virginia, Public Improvement, GO, | | | | | | | | |
5.00%, due 02/01/2022 | | | 400,000 | | | | 481,556 | |
Suffolk, Virginia, Public Improvement, Series A, GO, | | | | | | | | |
4.00%, due 08/01/2018 | | | 250,000 | | | | 272,458 | |
Upper Occoquan, Virginia, Sewer Authority, Revenue, | | | | | | | | |
5.15%, due 07/01/2020 | | | 250,000 | | | | 276,033 | |
5.00%, due 07/01/2027 | | | 350,000 | | | | 431,788 | |
Virginia Beach, Virginia, Public Improvement, GO, | | | | | | | | |
5.00%, due 06/01/2021, | | | | | | | | |
prerefunded 06/01/2019 @ 100 | | | 250,000 | | | | 285,952 | |
5.00%, due 03/01/2023 | | | 300,000 | | | | 366,246 | |
4.00%, due 04/01/2027 | | | 205,000 | | | | 226,919 | |
Virginia Biotechnology Research Partnership Authority, Lease Revenue, | | | | | | | | |
5.00%, due 09/01/2020 | | | 500,000 | | | | 584,315 | |
10
THE JAMESTOWN TAX EXEMPT VIRGINIA FUND
SCHEDULE OF INVESTMENTS (Continued) | |
VIRGINIA REVENUE AND GENERAL OBLIGATION (GO) BONDS — 91.1% (Continued) | | Par Value | | | Value | |
Virginia College Building Authority, Educational Facilities, Revenue, | | | | | | |
5.00%, due 03/01/2019 | | $ | 250,000 | | | $ | 283,390 | |
4.00%, due 09/01/2026 | | | 500,000 | | | | 550,490 | |
Virginia Commonwealth Transportation Board, Federal Highway Reimbursement Anticipation Notes, Revenue, | | | | | | | | |
5.00%, due 03/15/2023 | | | 500,000 | | | | 593,650 | |
5.00%, due 03/15/2025 | | | 500,000 | | | | 598,315 | |
Virginia Polytechnic Institute & State University, General and Athletic Facilities, Series D, Revenue, | | | | | | | | |
5.00%, due 06/01/2016 | | | 115,000 | | | | 115,313 | |
Virginia Small Business Financing Authority, Healthcare Facilities, Revenue, | | | | | | | | |
5.00%, due 11/01/2017 | | | 250,000 | | | | 271,928 | |
Virginia State Public School Authority, Revenue, | | | | | | | | |
5.00%, due 08/01/2023 | | | 500,000 | | | | 602,295 | |
5.00%, due 07/15/2026 | | | 300,000 | | | | 359,706 | |
Virginia State Public School Authority, Series A, Revenue, | | | | | | | | |
5.00%, due 08/01/2020 | | | | | | | | |
prerefunded 08/01/2016 @ 100 | | | 585,000 | | | | 608,090 | |
Virginia State Public School Authority, Series B-1, Revenue, | | | | | | | | |
5.00%, due 08/01/2018 | | | 500,000 | | | | 558,585 | |
Virginia State Resources Authority, Clean Water, Revenue, | | | | | | | | |
5.00%, due 10/01/2021 | | | | | | | | |
prerefunded 10/01/2019 @ 100 | | | 500,000 | | | | 577,000 | |
Virginia State Resources Authority, Infrastructure, Revenue, | | | | | | | | |
5.00%, due 11/01/2024, | | | | | | | | |
prerefunded 11/01/2018 @ 100 | | | 180,000 | | | | 202,761 | |
5.00%, due 11/01/2024 | | | 320,000 | | | | 357,430 | |
Virginia State Resources Authority, Infrastructure, Series B, Revenue, | | | | | | | | |
5.00%, due 11/01/2024 | | | 150,000 | | | | 179,079 | |
Virginia State, Series B, GO, | | | | | | | | |
5.00%, due 06/01/2017 | | | 250,000 | | | | 268,685 | |
Western Virginia Regional Jail Authority, Revenue, | | | | | | | | |
5.00%, due 12/01/2023 | | | 250,000 | | | | 302,903 | |
| | | | | | | | | |
Total Virginia Revenue and General Obligation (GO) Bonds (Cost $23,392,461) | | | | | | $ | 24,245,696 | |
11
THE JAMESTOWN TAX EXEMPT VIRGINIA FUND
SCHEDULE OF INVESTMENTS (Continued) |
WASHINGTON, D.C. REVENUE BONDS — 2.1% | | Par Value | | | Value | |
Metropolitan Washington Airports Authority, Series C, Revenue, | | | | | | |
5.00%, due 10/01/2022 (Cost $504,123) | | $ | 500,000 | | | $ | 555,975 | |
EXCHANGE-TRADED FUNDS — 0.5% | | Shares | | | Value | |
SPDR Nuveen Barclays Short Term Municipal Bond ETF (Cost $120,500) | | | 5,000 | | | $ | 121,800 | |
MONEY MARKET FUNDS — 6.8% | | Shares | | | Value | |
Fidelity Tax Exempt Portfolio - Class I, 0.01% (a) (Cost $1,816,590) | | | 1,816,590 | | | $ | 1,816,590 | |
| | | | | | | | | |
Total Investments at Value — 100.5% (Cost $25,833,674) | | | | | | $ | 26,740,061 | |
| | | | | | | | | |
Liabilities in Excess of Other Assets — (0.5%) | | | | | | | (125,634 | ) |
| | | | | | | | | |
Net Assets — 100.0% | | | | | | $ | 26,614,427 | |
(a) | The rate shown is the 7-day effective yield as of September 30, 2015. |
See accompanying notes to financial statements. |
12
THE JAMESTOWN FUNDS
STATEMENTS OF ASSETS AND LIABILITIES
September 30, 2015 (Unaudited) | |
| | The Jamestown
Equity
Fund | | | The
Jamestown
Tax Exempt
Virginia
Fund | |
ASSETS | | | | | | |
Investments in securities: | | | | | | |
At acquisition cost | | $ | 27,217,482 | | | $ | 25,833,674 | |
At value (Note 2) | | $ | 37,858,029 | | | $ | 26,740,061 | |
Cash | | | 939,107 | | | | — | |
Dividends and interest receivable | | | 27,173 | | | | 285,201 | |
Receivable for investment securities sold | | | 253,691 | | | | — | |
Receivable for capital shares sold | | | 1,326 | | | | — | |
Other assets | | | 9,406 | | | | 8,179 | |
TOTAL ASSETS | | | 39,088,732 | | | | 27,033,441 | |
| | | | | | | | | |
LIABILITIES | | | | | | | | |
Distributions payable | | | 4,223 | | | | 4,781 | |
Payable for investment securities purchased | | | — | | | | 365,541 | |
Payable for capital shares redeemed | | | 42,351 | | | | 37,077 | |
Accrued investment advisory fees (Note 4) | | | 21,325 | | | | 4,138 | |
Payable to administrator (Note 4) | | | 5,700 | | | | 5,700 | |
Other accrued expenses | | | 2,215 | | | | 1,777 | |
TOTAL LIABILITIES | | | 75,814 | | | | 419,014 | |
| | | | | | | | | |
NET ASSETS | | $ | 39,012,918 | | | $ | 26,614,427 | |
| | | | | | | | | |
Net assets consist of: | | | | | | | | |
Paid-in capital | | $ | 27,876,663 | | | $ | 25,718,887 | |
Accumulated net investment income | | | 2,961 | | | | — | |
Accumulated net realized gains (losses) from security transactions | | | 492,747 | | | | (10,847 | ) |
Net unrealized appreciation on investments | | | 10,640,547 | | | | 906,387 | |
Net assets | | $ | 39,012,918 | | | $ | 26,614,427 | |
| | | | | | | | | |
Shares of beneficial interest outstanding (unlimited number of shares authorized, $0.01 par value) | | | 2,076,264 | | | | 2,630,350 | |
| | | | | | | | | |
Net asset value, offering price and redemption price per share (Note 2) | | $ | 18.79 | | | $ | 10.12 | |
See accompanying notes to financial statements. |
13
THE JAMESTOWN FUNDS
STATEMENTS OF OPERATIONS
Six Months Ended September 30, 2015 (Unaudited) | |
| | The Jamestown Equity
Fund | | | The Jamestown Tax Exempt Virginia
Fund | |
INVESTMENT INCOME | | | | | | |
Dividends | | $ | 308,364 | | | $ | 610 | |
Foreign withholding taxes on dividends | | | (454 | ) | | | — | |
Interest | | | — | | | | 381,289 | |
TOTAL INVESTMENT INCOME | | | 307,910 | | | | 381,899 | |
| | | | | | | | | |
EXPENSES | | | | | | | | |
Investment advisory fees (Note 4) | | | 109,934 | | | | 53,235 | |
Administration fees (Note 4) | | | 30,042 | | | | 30,000 | |
Professional fees | | | 8,570 | | | | 8,518 | |
Trustees’ fees and expenses (Note 4) | | | 5,120 | | | | 5,120 | |
Custodian and bank service fees | | | 4,232 | | | | 2,779 | |
Compliance service fees (Note 4) | | | 3,468 | | | | 3,468 | |
Account maintenance fees | | | 2,080 | | | | 4,024 | |
Registration and filing fees | | | 3,533 | | | | 2,271 | |
Pricing costs | | | 552 | | | | 5,041 | |
Printing of shareholder reports | | | 4,246 | | | | 1,310 | |
Postage and supplies | | | 2,280 | | | | 1,305 | |
Other expenses | | | 2,025 | | | | 1,828 | |
TOTAL EXPENSES | | | 176,082 | | | | 118,899 | |
Fees voluntarily waived by the Adviser (Note 4) | | | — | | | | (27,069 | ) |
Expenses reimbursed through a directed brokerage arrangement (Note 5) | | | (6,000 | ) | | | — | |
NET EXPENSES | | | 170,082 | | | | 91,830 | |
| | | | | | | | | |
NET INVESTMENT INCOME | | | 137,828 | | | | 290,069 | |
| | | | | | | | | |
REALIZED AND UNREALIZED GAINS (LOSSES) ON INVESTMENTS | | | | | | | | |
Net realized gains on security transactions | | | 577,488 | | | | — | |
Net change in unrealized appreciation/depreciation on investments | | | (4,985,509 | ) | | | (158,001 | ) |
| | | | | | | | | |
NET REALIZED AND UNREALIZED LOSSES ON INVESTMENTS | | | (4,408,021 | ) | | | (158,001 | ) |
| | | | | | | | | |
NET INCREASE (DECREASE) IN NET ASSETS FROM OPERATIONS | | $ | (4,270,193 | ) | | $ | 132,068 | |
See accompanying notes to financial statements. |
14
THE JAMESTOWN EQUITY FUND
STATEMENTS OF CHANGES IN NET ASSETS | |
| | Six Months Ended
Sept. 30, 2015 (Unaudited) | | | Year
Ended
March 31, 2015 | |
FROM OPERATIONS | | | | | | |
Net investment income | | $ | 137,828 | | | $ | 217,314 | |
Net realized gains on security transactions | | | 577,488 | | | | 3,030,039 | |
Net change in unrealized appreciation/depreciation on investments | | | (4,985,509 | ) | | | (316,145 | ) |
Net increase (decrease) in net assets from operations | | | (4,270,193 | ) | | | 2,931,208 | |
| | | | | | | | | |
DISTRIBUTIONS TO SHAREHOLDERS | | | | | | | | |
From net investment income | | | (132,994 | ) | | | (220,231 | ) |
From net realized gains from security transactions | | | (1,405,343 | ) | | | (3,470,588 | ) |
Decrease in net assets from distributions to shareholders | | | (1,538,337 | ) | | | (3,690,819 | ) |
| | | | | | | | | |
FROM CAPITAL SHARE TRANSACTIONS | | | | | | | | |
Net assets received in conjunction with fund merger (Note 1) | | | 15,513,703 | | | | — | |
Proceeds from shares sold | | | 215,939 | | | | 585,424 | |
Net asset value of shares issued in reinvestment of distributions to shareholders | | | 1,467,350 | | | | 3,513,477 | |
Payments for shares redeemed | | | (1,971,480 | ) | | | (4,488,942 | ) |
Net increase (decrease) in net assets from capital share transactions | | | 15,225,512 | | | | (390,041 | ) |
| | | | | | | | | |
TOTAL INCREASE (DECREASE) IN NET ASSETS | | | 9,416,982 | | | | (1,149,652 | ) |
| | | | | | | | | |
NET ASSETS | | | | | | | | |
Beginning of period | | | 29,595,936 | | | | 30,745,588 | |
End of period | | $ | 39,012,918 | | | $ | 29,595,936 | |
| | | | | | | | | |
ACCUMULATED (DISTRIBUTIONS IN EXCESS OF) NET INVESTMENT INCOME | | $ | 2,961 | | | $ | (1,873 | ) |
| | | | | | | | | |
CAPITAL SHARE ACTIVITY | | | | | | | | |
Shares received in connection with fund merger (Note 1) | | | 738,504 | | | | — | |
Shares sold | | | 10,751 | | | | 26,969 | |
Shares reinvested | | | 70,505 | | | | 164,154 | |
Shares redeemed | | | (94,546 | ) | | | (208,164 | ) |
Net increase (decrease) in shares outstanding | | | 725,214 | | | | (17,041 | ) |
Shares outstanding, beginning of period | | | 1,351,050 | | | | 1,368,091 | |
Shares outstanding, end of period | | | 2,076,264 | | | | 1,351,050 | |
See accompanying notes to financial statements. |
15
THE JAMESTOWN TAX EXEMPT VIRGINIA FUND
STATEMENTS OF CHANGES IN NET ASSETS | |
| | Six Months Ended
Sept. 30, 2015 (Unaudited) | | | Year
Ended
March 31, 2015 | |
FROM OPERATIONS | | | | | | |
Net investment income | | $ | 290,069 | | | $ | 628,532 | |
Net realized gains on security transactions | | | — | | | | 9,689 | |
Net change in unrealized appreciation/depreciation on investments | | | (158,001 | ) | | | 32,334 | |
Net increase in net assets from operations | | | 132,068 | | | | 670,555 | |
| | | | | | | | | |
DISTRIBUTIONS TO SHAREHOLDERS | | | | | | | | |
From net investment income | | | (290,069 | ) | | | (628,553 | ) |
| | | | | | | | | |
FROM CAPITAL SHARE TRANSACTIONS | | | | | | | | |
Proceeds from shares sold | | | 265,876 | | | | 2,186,736 | |
Net asset value of shares issued in reinvestment of distributions to shareholders | | | 260,104 | | | | 550,371 | |
Payments for shares redeemed | | | (448,426 | ) | | | (2,368,257 | ) |
Net increase in net assets from capital share transactions | | | 77,554 | | | | 368,850 | |
| | | | | | | | | |
TOTAL INCREASE (DECREASE) IN NET ASSETS | | | (80,447 | ) | | | 410,852 | |
| | | | | | | | | |
NET ASSETS | | | | | | | | |
Beginning of period | | | 26,694,874 | | | | 26,284,022 | |
End of period | | $ | 26,614,427 | | | $ | 26,694,874 | |
| | | | | | | | | |
ACCUMULATED NET INVESTMENT INCOME | | $ | — | | | $ | — | |
| | | | | | | | | |
CAPITAL SHARE ACTIVITY | | | | | | | | |
Shares sold | | | 26,212 | | | | 214,675 | |
Shares reinvested | | | 25,779 | | | | 53,901 | |
Shares redeemed | | | (44,532 | ) | | | (232,059 | ) |
Net increase in shares outstanding | | | 7,459 | | | | 36,517 | |
Shares outstanding, beginning of period | | | 2,622,891 | | | | 2,586,374 | |
Shares outstanding, end of period | | | 2,630,350 | | | | 2,622,891 | |
See accompanying notes to financial statements. |
16
THE JAMESTOWN EQUITY FUND
FINANCIAL HIGHLIGHTS | |
Selected Per Share Data and Ratios for a Share Outstanding Throughout Each Period | |
| | Six Months Ended
Sept. 30, 2015
(Unaudited) | | |
Years Ended March 31,
| |
| | | 2015 | | | | 2014 | | | | 2013 | | | | 2012 | | | | 2011 | |
Net asset value at beginning of period | | $ | 21.91 | | | $ | 22.47 | | | $ | 19.60 | | | $ | 17.73 | | | $ | 16.54 | | | $ | 14.67 | |
| | | | | | | | | | | | | | | | | | | | | | | | | |
Income (loss) from investment operations: | | | | | | | | | | | | | | | | | | | | | | | | |
Net investment income | | | 0.08 | | | | 0.16 | | | | 0.15 | | | | 0.15 | | | | 0.09 | | | | 0.09 | |
Net realized and unrealized gains (losses) on investments | | | (2.07 | ) | | | 1.96 | | | | 4.30 | | | | 1.93 | | | | 1.21 | | | | 1.87 | |
Total from investment operations | | | (1.99 | ) | | | 2.12 | | | | 4.45 | | | | 2.08 | | | | 1.30 | | | | 1.96 | |
| | | | | | | | | | | | | | | | | | | | | | | | | |
Less distributions: | | | | | | | | | | | | | | | | | | | | | | | | |
Dividends from net investment income | | | (0.08 | ) | | | (0.16 | ) | | | (0.15 | ) | | | (0.15 | ) | | | (0.11 | ) | | | (0.09 | ) |
Distributions from net realized gains | | | (1.05 | ) | | | (2.52 | ) | | | (1.43 | ) | | | (0.06 | ) | | | — | | | | — | |
Total distributions | | | (1.13 | ) | | | (2.68 | ) | | | (1.58 | ) | | | (0.21 | ) | | | (0.11 | ) | | | (0.09 | ) |
| | | | | | | | | | | | | | | | | | | | | | | | | |
Net asset value at end of period | | $ | 18.79 | | | $ | 21.91 | | | $ | 22.47 | | | $ | 19.60 | | | $ | 17.73 | | | $ | 16.54 | |
| | | | | | | | | | | | | | | | | | | | | | | | | |
Total return (a) | | | (9.58% | )(b) | | | 10.14 | % | | | 23.55 | % | | | 11.84 | % | | | 7.89 | % | | | 13.48 | % |
| | | | | | | | | | | | | | | | | | | | | | | | | |
Net assets at end of period (000’s) | | $ | 39,013 | | | $ | 29,596 | | | $ | 30,746 | | | $ | 28,316 | | | $ | 27,703 | | | $ | 28,359 | |
| | | | | | | | | | | | | | | | | | | | | | | | | |
Ratio of total expenses to average net assets | | | 1.04 | %(c) | | | 1.09 | % | | | 1.07 | % | | | 1.11 | % | | | 1.11 | % | | | 1.13 | % |
| | | | | | | | | | | | | | | | | | | | | | | | | |
Ratio of net expenses to average net assets (d) | | | 1.00 | %(c) | | | 1.05 | % | | | 1.03 | % | | | 1.06 | % | | | 1.06 | % | | | 1.09 | % |
| | | | | | | | | | | | | | | | | | | | | | | | | |
Ratio of net investment income to average net assets (d) | | | 0.81 | %(c) | | | 0.71 | % | | | 0.72 | % | | | 0.81 | % | | | 0.56 | % | | | 0.56 | % |
| | | | | | | | | | | | | | | | | | | | | | | | | |
Portfolio turnover rate | | | 10 | %(b) | | | 29 | % | | | 21 | % | | | 28 | % | | | 28 | % | | | 49 | % |
(a) | Total return is a measure of the change in value of an investment in the Fund over the periods covered, which assumes any dividends or capital gains distributions are reinvested in shares of the Fund. Returns do not reflect the deduction of taxes a shareholder would pay on Fund distributions or the redemption of Fund shares. |
(d) | Ratios were determined based on net expenses after expense reimbursements through a directed brokerage arrangement (Note 5). |
See accompanying notes to financial statements. |
17
THE JAMESTOWN TAX EXEMPT VIRGINIA FUND
FINANCIAL HIGHLIGHTS | |
Selected Per Share Data and Ratios for a Share Outstanding Throughout Each Period | |
| | Six Months Ended
Sept. 30, 2015
(Unaudited) | | |
Years Ended March 31,
| |
| | | 2015 | | | | 2014 | | | | 2013 | | | | 2012 | | | | 2011 | |
Net asset value at beginning of period | | $ | 10.18 | | | $ | 10.16 | | | $ | 10.47 | | | $ | 10.57 | | | $ | 10.25 | | | $ | 10.33 | |
| | | | | | | | | | | | | | | | | | | | | | | | | |
Income (loss) from
investment operations: | | | | | | | | | | | | | | | | | | | | | | | | |
Net investment income | | | 0.11 | | | | 0.24 | | | | 0.26 | | | | 0.26 | | | | 0.29 | | | | 0.29 | |
Net realized and unrealized gains (losses) on investments | | | (0.06 | ) | | | 0.02 | | | | (0.30 | ) | | | (0.06 | ) | | | 0.32 | | | | (0.06 | ) |
Total from investment operations | | | 0.05 | | | | 0.26 | | | | (0.04 | ) | | | 0.20 | | | | 0.61 | | | | 0.23 | |
| | | | | | | | | | | | | | | | | | | | | | | | | |
Less distributions: | | | | | | | | | | | | | | | | | | | | | | | | |
Dividends from net investment income | | | (0.11 | ) | | | (0.24 | ) | | | (0.26 | ) | | | (0.27 | ) | | | (0.29 | ) | | | (0.29 | ) |
Distributions from net realized gains | | | — | | | | — | | | | (0.01 | ) | | | (0.03 | ) | | | (0.00 | )(a) | | | (0.02 | ) |
Total distributions | | | (0.11 | ) | | | (0.24 | ) | | | (0.27 | ) | | | (0.30 | ) | | | (0.29 | ) | | | (0.31 | ) |
| | | | | | | | | | | | | | | | | | | | | | | | | |
Net asset value at end of period | | $ | 10.12 | | | $ | 10.18 | | | $ | 10.16 | | | $ | 10.47 | | | $ | 10.57 | | | $ | 10.25 | |
| | | | | | | | | | | | | | | | | | | | | | | | | |
Total return (b) | | | 0.50 | %(c) | | | 2.61 | % | | | (0.37 | %) | | | 1.88 | % | | | 6.03 | % | | | 2.26 | % |
| | | | | | | | | | | | | | | | | | | | | | | | | |
Net assets at end of period (000’s) | | $ | 26,614 | | | $ | 26,695 | | | $ | 26,284 | | | $ | 27,782 | | | $ | 30,063 | | | $ | 30,368 | |
| | | | | | | | | | | | | | | | | | | | | | | | | |
Ratio of total expenses to average net assets | | | 0.89 | %(d) | | | 0.88 | % | | | 0.88 | % | | | 0.76 | % | | | 0.77 | % | | | 0.76 | % |
| | | | | | | | | | | | | | | | | | | | | | | | | |
Ratio of net expenses to average net assets (e) | | | 0.69 | %(d) | | | 0.69 | % | | | 0.69 | % | | | 0.69 | % | | | 0.69 | % | | | 0.69 | % |
| | | | | | | | | | | | | | | | | | | | | | | | | |
Ratio of net investment income to average net assets (e) | | | 2.38 | %(d) | | | 2.38 | % | | | 2.59 | % | | | 2.50 | % | | | 2.75 | % | | | 2.78 | % |
| | | | | | | | | | | | | | | | | | | | | | | | | |
Portfolio turnover rate | | | 9 | %(c) | | | 16 | % | | | 1 | % | | | 15 | % | | | 2 | % | | | 8 | % |
(a) | Amount rounds to less than a $0.01 per share. |
(b) | Total return is a measure of the change in value of an investment in the Fund over the periods covered, which assumes any dividends or capital gains distributions are reinvested in shares of the Fund. Returns do not reflect the deduction of taxes a shareholder would pay on Fund distributions or the redemption of Fund shares. |
(e) | Ratios were determined after voluntary advisory fee waivers by the Adviser (Note 4). |
See accompanying notes to financial statements. |
18
THE JAMESTOWN FUNDS
NOTES TO FINANCIAL STATEMENTS
September 30, 2015 (Unaudited)
1. Organization
The Jamestown Equity Fund and The Jamestown Tax Exempt Virginia Fund (individually, a “Fund,” and, collectively, the “Funds”) are each a no-load series of Williamsburg Investment Trust (the “Trust”), an open-end management investment company registered under the Investment Company Act of 1940. The Jamestown Equity Fund is a diversified fund and The Jamestown Tax Exempt Virginia Fund is a non-diversified fund. The Trust was organized as a Massachusetts business trust on July 18, 1988. Other series of the Trust are not included in this report.
The Jamestown Equity Fund’s investment objective is long-term growth of capital.
The Jamestown Tax Exempt Virginia Fund’s investment objectives are to provide current income exempt from federal income taxes and from the personal income taxes of Virginia, to preserve capital, to limit credit risk and to take advantage of opportunities to increase and enhance the value of a shareholder’s investment.
On July 29, 2015, The Jamestown Equity Fund consummated a tax-free merger with The Jamestown Balanced Fund, previously a series of the Trust. Pursuant to the terms of the agreement governing the merger, each share of The Jamestown Balanced Fund was converted into an equivalent dollar amount of shares of The Jamestown Equity Fund, based on the net asset value of The Jamestown Equity Fund and The Jamestown Balanced Fund as of July 28, 2015 ($21.01 and $14.07, respectively), resulting in a conversion ratio of 0.669654 shares of The Jamestown Equity Fund for each share of The Jamestown Balanced Fund. The Jamestown Equity Fund issued 738,504 shares to shareholders of The Jamestown Balanced Fund. The basis of the assets transferred from The Jamestown Balanced Fund reflected the historical basis of the assets as of the date of the tax-free merger. Net assets of The Jamestown Equity Fund and The Jamestown Balanced Fund as of the merger date were $28,889,235 and $15,513,703, respectively, including unrealized appreciation on investments of $11,999,716 and $3,528,216, respectively. The Jamestown Balanced Fund’s net assets at the time of the merger included accumulated realized capital losses of $25,177. Total net assets of The Jamestown Equity Fund immediately after the merger were $44,402,938.
2. Significant Accounting Policies
As an investment company, as defined in Financial Accounting Standards Board (“FASB”) Accounting Standards Update 2013-08, the Funds follow accounting and reporting guidance under FASB Accounting Standards Codification Topic 946, “Financial Services – Investment Companies.” The following is a summary of the Funds’ significant accounting policies. These policies are in conformity with accounting principles generally accepted in the United States of America (“GAAP”).
Securities valuation — The Funds’ portfolio securities are valued as of the close of business of the regular session of the New York Stock Exchange (normally 4:00 p.m., Eastern time). Securities traded on a national stock exchange are generally valued based upon the closing price on the principal exchange where the security is traded, if available, otherwise, at the last quoted
19
THE JAMESTOWN FUNDS
NOTES TO FINANCIAL STATEMENTS (Continued)
bid price. Securities which are quoted by NASDAQ are valued at the NASDAQ Official Closing Price. Investments representing shares of other investment companies are valued at their net asset value as reported by such companies.
Fixed income securities are typically valued on the basis of prices provided by an independent pricing service. The prices provided by the pricing service are determined with consideration given to institutional bid and last sale prices and take into account securities prices, yields, maturities, call features, ratings, institutional trading in similar groups of securities and developments related to specific securities.
When market quotations are not readily available, if a pricing service cannot provide a price or the investment adviser believes the price received from the pricing service is not indicative of market value, securities will be valued in good faith at fair value using methods consistent with procedures adopted by the Board of Trustees and will be classified as Level 2 or 3 within the fair value hierarchy (see below), depending on the inputs used. Such methods of fair valuation may include, but are not limited to: multiple of earnings, multiple of book value, discount from market of a similar freely traded security, purchase price of the security, subsequent private transactions in the security or related securities, or a combination of these and other factors.
GAAP establishes a single authoritative definition of fair value, sets out a framework for measuring fair value and requires additional disclosures about fair value measurements.
Various inputs are used in determining the value of each Fund’s investments. These inputs are summarized in the three broad levels listed below:
● | Level 1 – quoted prices in active markets for identical securities |
● | Level 2 – other significant observable inputs |
● | Level 3 – significant unobservable inputs |
Fixed income securities, including municipal bonds, are classified as Level 2 since the values for such securities are based on prices provided by an independent pricing service that utilizes various “other significant observable inputs” including bid and ask quotations, prices of similar securities and interest rates, among other factors.
The inputs or methodology used for valuing securities are not necessarily an indication of the risks associated with investing in those securities. The inputs used to measure fair value may fall into different levels of the fair value hierarchy. In such cases, for disclosure purposes, the level in the fair value hierarchy within which the fair value measurement falls in its entirety is determined based on the lowest level input that is significant to the fair value measurement.
20
THE JAMESTOWN FUNDS
NOTES TO FINANCIAL STATEMENTS (Continued)
The following is a summary of the inputs used to value each Fund’s investments as of September 30, 2015 by security type:
The Jamestown Equity Fund | | Level 1 | | | Level 2 | | | Level 3 | | | Total | |
Common Stocks | | $ | 37,197,369 | | | $ | — | | | $ | — | | | $ | 37,197,369 | |
Exchange-Traded Funds | | | 660,660 | | | | — | | | | — | | | | 660,660 | |
Total | | $ | 37,858,029 | | | $ | — | | | $ | — | | | $ | 37,858,029 | |
The Jamestown Tax Exempt Virginia Fund | | Level 1 | | | Level 2 | | | Level 3 | | | Total | |
Municipal Bonds | | $ | — | | | $ | 24,801,671 | | | $ | — | | | $ | 24,801,671 | |
Exchange-Traded Funds | | | 121,800 | | | | — | | | | — | | | | 121,800 | |
Money Market Funds | | | 1,816,590 | | | | — | | | | — | | | | 1,816,590 | |
Total | | $ | 1,938,390 | | | $ | 24,801,671 | | | $ | — | | | $ | 26,740,061 | |
Refer to The Jamestown Equity Fund’s Schedules of Investments for a listing of the common stocks by sector type. As of September 30, 2015, the Funds did not have any transfers into and out of any Level. There were no Level 3 securities or derivative instruments held by the Funds as of September 30, 2015. It is the Funds’ policy to recognize transfers into and out of any Level at the end of the reporting period.
Share valuation — The net asset value per share of each Fund is calculated daily by dividing the total value of its assets, less liabilities, by the number of shares outstanding. The offering price and redemption price per share of each Fund is equal to the net asset value per share.
Investment income — Interest income is accrued as earned. Dividend income is recorded on the ex-dividend date. Discounts and premiums on fixed income securities purchased are amortized using the interest method.
Distributions to shareholders — Dividends arising from net investment income, if any, are declared and paid quarterly to shareholders of The Jamestown Equity Fund. Dividends arising from net investment income are declared daily and paid monthly to shareholders of The Jamestown Tax Exempt Virginia Fund. Net realized short-term capital gains, if any, may be distributed throughout the year and net realized long-term capital gains, if any, are distributed at least once each year. The amount of distributions from net investment income and net realized capital gains are determined in accordance with federal income tax regulations, which may differ from GAAP. These “book/tax” differences are permanent in nature and are primarily due to differing treatments of net short-term capital gains. Dividends and distributions are recorded on the ex-dividend date.
21
THE JAMESTOWN FUNDS
NOTES TO FINANCIAL STATEMENTS (Continued)
The tax character of distributions paid during the periods ended September 30, 2015 and March 31, 2015 was as follows:
| Periods Ended | | Ordinary Income | | | Long-Term Capital Gains | | | Exempt- Interest Dividends | | | Total Distributions | |
The Jamestown Equity Fund | 9/30/15 | | $ | 132,994 | | | $ | 1,405,343 | | | $ | — | | | $ | 1,538,337 | |
| | 3/31/15 | | $ | 317,270 | | | $ | 3,373,549 | | | $ | — | | | $ | 3,690,819 | |
The Jamestown Tax Exempt Virginia Fund | 9/30/15 | | $ | — | | | $ | — | | | $ | 290,069 | | | $ | 290,069 | |
| | 3/31/15 | | $ | — | | | $ | — | | | $ | 628,553 | | | $ | 628,553 | |
Security transactions — Security transactions are accounted for on trade date for financial reporting purposes. Gains and losses on securities sold are determined on a specific identification basis.
Common expenses — Common expenses of the Trust are allocated among the series of the Trust based on relative net assets of each series or the nature of the services performed and the relative applicability to each series.
Estimates — The preparation of financial statements in conformity with GAAP requires management to make estimates and assumptions that affect the reported amounts of assets and liabilities and the disclosure of contingent assets and liabilities as of the date of the financial statements and the reported amounts of income and expenses during the reporting period. Actual results could differ from those estimates.
Federal income tax — Each Fund has qualified and intends to continue to qualify as a regulated investment company under the Internal Revenue Code of 1986 (the “Code”). Qualification generally will relieve the Funds of liability for federal income taxes to the extent 100% of their net investment income and net realized capital gains are distributed in accordance with the Code. Accordingly, no provision for income taxes has been made.
In order to avoid imposition of the excise tax applicable to regulated investment companies, it is also each Fund’s intention to declare as dividends in each calendar year at least 98% of its net investment income (earned during the calendar year) and 98.2% of its net realized capital gains (earned during the twelve months ended October 31) plus undistributed amounts from prior years.
22
THE JAMESTOWN FUNDS
NOTES TO FINANCIAL STATEMENTS (Continued)
The tax character of distributable earnings at September 30, 2015 was as follows:
| | The Jamestown Equity Fund | | | The Jamestown Tax Exempt Virginia Fund | |
Cost of portfolio investments | | $ | 27,300,619 | | | $ | 25,833,674 | |
Gross unrealized appreciation | | $ | 12,121,248 | | | $ | 928,704 | |
Gross unrealized depreciation | | | (1,563,838 | ) | | | (22,317 | ) |
Net unrealized appreciation on investments | | | 10,557,410 | | | | 906,387 | |
Undistributed ordinary income | | | 7,184 | | | | — | |
Undistributed tax exempt income | | | — | | | | 4,781 | |
Capital loss carryforwards | | | — | | | | (10,847 | ) |
Other gains | | | 575,884 | | | | — | |
Other temporary differences | | | (4,223 | ) | | | (4,781 | ) |
Total distributable earnings | | $ | 11,136,255 | | | $ | 895,540 | |
The difference between the federal income tax cost of portfolio investments and the financial statement cost for The Jamestown Equity Fund is due to certain timing differences in the recognition of capital gains or losses under income tax regulations and GAAP. These “book/tax” differences are temporary in nature and are primarily due to the tax deferral of losses on wash sales.
As of March 31, 2015, The Jamestown Tax Exempt Virginia Fund had a long-term capital loss carryforward of $10,847 for federal income tax purposes. This capital loss carryforward, which does not expire, may be utilized in the current and future years to offset net realized capital gains, if any, prior to distributing such gains to shareholders.
The Funds recognize the tax benefits or expenses of uncertain tax positions only when the position is “more likely than not” to be sustained assuming examination by tax authorities. Management has reviewed the tax positions taken on Federal income tax returns for the current tax year and all open tax years (tax years ended March 31, 2012 through March 31, 2015) of each Fund and has concluded that no provision for unrecognized tax benefits or expenses is required in these financial statements.
23
THE JAMESTOWN FUNDS
NOTES TO FINANCIAL STATEMENTS (Continued)
3. Investment Transactions
Investment transactions, other than short-term investments and U.S. government securities, were as follows for the six months ended September 30, 2015:
| | The Jamestown Equity Fund | | | The Jamestown Tax Exempt Virginia Fund | |
Purchase of investment securities | | $ | 6,053,413 | | | $ | 2,181,935 | |
Proceeds from sales and maturities of investment securities | | $ | 3,435,994 | | | $ | 2,760,000 | |
4. Transactions with Related Parties
INVESTMENT ADVISORY AGREEMENTS
Each Fund’s investments are managed by Lowe, Brockenbrough & Company, Inc. (the “Adviser”) under the terms of an Investment Advisory Agreement. The Jamestown Equity Fund pays the Adviser a fee, which is computed and accrued daily and paid monthly, at annual rates of .65% of its average daily net assets up to $500 million and .55% of such assets in excess of $500 million. The Jamestown Tax Exempt Virginia Fund pays the Adviser a fee, which is computed and accrued daily and paid monthly, at annual rates of .40% of its average daily net assets up to $250 million, .35% of the next $250 million of such assets and .30% of such assets in excess of $500 million. Certain officers of the Trust are also officers of the Adviser.
During the six months ended September 30, 2015, the Adviser voluntarily limited the total annual operating expenses of The Jamestown Tax Exempt Virginia Fund to .69% of its average daily net assets; accordingly, the Adviser voluntarily waived $27,069 of its investment advisory fees during the six months ended September 30, 2015.
OTHER SERVICE PROVIDERS
Ultimus Fund Solutions, LLC (“Ultimus”) provides fund administration, fund accounting, compliance and transfer agent services to the Funds. Pursuant to servicing agreements with Ultimus, the Funds pay Ultimus fees in accordance with such agreements. Certain officers of the Trust are also officers of Ultimus, or of Ultimus Fund Distributors, LLC (the “Distributor”), the principal underwriter of the Funds and an affiliate of Ultimus. The Distributor is compensated by the Adviser (not the Funds) for acting as principal underwriter.
COMPENSATION OF TRUSTEES
Trustees and officers affiliated with the Adviser or Ultimus are not compensated by the Trust for their services. Each Trustee who is not an affiliated person of the Adviser or Ultimus receives from the Trust an annual retainer of $12,000, payable quarterly; a fee of $1,500 for attendance at each meeting of the Board of Trustees (except that such fee is $2,500 for the independent chairman); and $1,000 for attendance at each meeting of any committee of the Board (except that such fee is $1,500 for the committee chairman); plus reimbursement of travel and other expenses incurred in attending meetings. Each Fund pays its proportionate share of such fees.
24
THE JAMESTOWN FUNDS
NOTES TO FINANCIAL STATEMENTS (Continued)
5. Brokerage Arrangement
In order to reduce the total operating expenses of The Jamestown Equity Fund, a portion of the Fund’s operating expenses have been paid through an arrangement with a third-party broker-dealer who is compensated through commission trades. Payment of expenses by the broker-dealer is based on a percentage of commissions earned. Expenses reimbursed through the brokerage arrangement totaled $6,000 for The Jamestown Equity Fund for the six months ended September 30, 2015.
6. Contingencies and Commitments
The Funds indemnify the Trust’s officers and Trustees for certain liabilities that might arise from their performance of their duties to the Funds. Additionally, in the normal course of business the Funds enter into contracts that contain a variety of representations and warranties and which provide general indemnifications. The Funds’ maximum exposure under these arrangements is unknown, as this would involve future claims that may be made against the Funds that have not yet occurred. However, based on experience, the Trust expects the risk of loss to be remote.
7. Concentration of Credit Risk
The Jamestown Tax Exempt Virginia Fund invests primarily in debt instruments of municipal issuers in the Commonwealth of Virginia. The issuers’ abilities to meet their obligations may be affected by economic developments in the Commonwealth or its region, as well as disruptions in the credit markets and the economy, generally.
8. Subsequent Events
The Funds are required to recognize in the financial statements the effects of all subsequent events that provide additional evidence about conditions that existed as of the date of the Statements of Assets and Liabilities. For non-recognized subsequent events that must be disclosed to keep the financial statements from being misleading, the Funds are required to disclose the nature of the event as well as an estimate of its financial effect, or a statement that such an estimate cannot be made. Management has evaluated subsequent events through the issuance of these financial statements and has noted no such events.
25
THE JAMESTOWN FUNDS
ABOUT YOUR FUNDS’ EXPENSES (Unaudited)
We believe it is important for you to understand the impact of costs on your investment. All mutual funds have operating expenses. As a shareholder of the Funds, you incur ongoing costs, including management fees and other expenses. The following examples are intended to help you understand your ongoing costs (in dollars) of investing in the Funds and to compare these costs with the ongoing costs of investing in other mutual funds.
A mutual fund’s ongoing costs are expressed as a percentage of its average net assets. This figure is known as the expense ratio. The expenses in the table below are based on an investment of $1,000 made at the beginning of the period shown and held for the entire period (April 1, 2015 through September 30, 2015).
The table below illustrates each Fund’s costs in two ways:
Actual fund return – This section helps you to estimate the actual expenses that you paid over the period. The “Ending Account Value” shown is derived from each Fund’s actual return, and the third column shows the dollar amount of operating expenses that would have been paid by an investor who started with $1,000 in the Funds. You may use the information here, together with the amount you invested, to estimate the expenses that you paid over the period.
To do so, simply divide your account value by $1,000 (for example, an $8,600 account value divided by $1,000 = 8.6), then multiply the result by the number given for the Funds under the heading “Expenses Paid During Period.”
Hypothetical 5% return – This section is intended to help you compare each Fund's ongoing costs with those of other mutual funds. It assumes that each Fund had an annual return of 5% before expenses during the period shown, but that the expense ratio is unchanged. In this case, because the returns used are not the Funds’ actual returns, the results do not apply to your investment. The example is useful in making comparisons because the Securities and Exchange Commission (“SEC”) requires all mutual funds to calculate expenses based on a 5% return. You can assess each Fund’s ongoing costs by comparing this hypothetical example with the hypothetical examples that appear in shareholder reports of other funds.
Note that expenses shown in the table are meant to highlight and help you compare ongoing costs only. The Funds do not charge sales loads or redemption fees.
The calculations assume no shares were bought or sold during the period. Your actual costs may have been higher or lower, depending on the amount of your investment and the timing of any purchases or redemptions.
More information about the Funds’ expenses, including annual expense ratios for the prior five fiscal years, can be found in this report. For additional information on operating expenses and other shareholder costs, please refer to the Funds’ prospectus.
26
THE JAMESTOWN FUNDS
ABOUT YOUR FUNDS’ EXPENSES (Unaudited) (Continued)
| | Beginning
Account Value
April 1,
2015 | Ending
Account Value
September 30,
2015 | Net
Expense Ratio(a) | Expenses Paid During Period(b) |
The Jamestown Equity Fund |
Based on Actual Fund Return | $1,000.00 | $904.20 | 1.00% | $4.77 |
Based on Hypothetical 5% Return (before expenses) | $1,000.00 | $1,020.05 | 1.00% | $5.06 |
The Jamestown Tax Exempt Virginia Fund |
Based on Actual Fund Return | $1,000.00 | $1,005.00 | 0.69% | $3.47 |
Based on Hypothetical 5% Return (before expenses) | $1,000.00 | $1,021.61 | 0.69% | $3.50 |
(a) | Annualized, based on the Fund’s most recent one-half year expenses. |
(b) | Expenses are equal to the Fund’s annualized expense ratio multiplied by the average account value over the period, multiplied by 183/365 (to reflect the one-half year period). |
27
THE JAMESTOWN FUNDS
OTHER INFORMATION (Unaudited)
A description of the policies and procedures that the Funds use to vote proxies relating to portfolio securities is available without charge upon request by calling toll-free 1-866-738-1126, or on the SEC’s website at http://www.sec.gov. Information regarding how the Funds voted proxies relating to portfolio securities during the most recent 12-month period ended June 30 is also available without charge upon request by calling toll-free 1-866-738-1126, or on the SEC’s website at http://www.sec.gov.
The Trust files a complete listing of portfolio holdings of the Funds with the SEC as of the end of the first and third quarters of each fiscal year on Form N-Q. The filings are available upon request, by calling 1-866-738-1126. Furthermore, you may obtain a copy of these filings on the SEC’s website at http://www.sec.gov. The Trust’s Forms N-Q may also be reviewed and copied at the SEC’s Public Reference Room in Washington, DC, and information on the operation of the Public Reference Room may be obtained by calling 1-800-SEC-0330.
28
THE JAMESTOWN FUNDS
RESULTS OF SPECIAL MEETING OF SHAREHOLDERS (Unaudited)
On July 17, 2015, a Special Meeting of Shareholders of The Jamestown Balanced Fund series of the Trust was held for the purpose of voting upon an Agreement and Plan of Reorganization and related transactions that provide for the reorganization of The Jamestown Balanced Fund into The Jamestown Equity Fund series of the Trust. Shareholders of The Jamestown Balanced Fund approved the reorganization by the following vote:
Number of Shares |
For | Against | Abstain | % Voted in Favor |
804,099.631 | 14,585.328 | 30,227.494 | 70.82% |
On July 29, 2015, all of the assets and liabilities of The Jamestown Balanced Fund were transferred into The Jamestown Equity Fund in exchange for shares of The Jamestown Equity Fund and the assumption by The Jamestown Equity Fund of all of the known liabilities of The Jamestown Balanced Fund.
29
| | THE JAMESTOWN FUNDS www.jamestownfunds.com Investment Adviser Lowe, Brockenbrough & Company, Inc. 1802 Bayberry Court Suite 400 Richmond, Virginia 23226 Administrator Ultimus Fund Solutions, LLC P.O. Box 46707 Cincinnati, Ohio 45246-0707 (Toll-Free) 1-866-738-1126 Independent Registered
Public Accounting Firm Ernst & Young LLP 1900 Scripps Center 312 Walnut Street Cincinnati, Ohio 45202 Legal Counsel Sullivan & Worcester LLP One Post Office Square Boston, Massachusetts 02109 Board of Trustees John P. Ackerly, IV John T. Bruce George K. Jennison Robert S. Harris, Ph.D. Harris V. Morrissette Elizabeth W. Robertson | |
Not required
| Item 3. | Audit Committee Financial Expert. |
Not required
| Item 4. | Principal Accountant Fees and Services. |
Not required
| Item 5. | Audit Committee of Listed Registrants. |
Not applicable
| Item 6. | Schedule of Investments. |
| (a) | Not applicable [schedule filed with Item 1] |
| Item 7. | Disclosure of Proxy Voting Policies and Procedures for Closed-End Management Investment Companies. |
Not applicable
| Item 8. | Portfolio Managers of Closed-End Management Investment Companies. |
Not applicable
| Item 9. | Purchases of Equity Securities by Closed-End Management Investment Company and Affiliated Purchasers. |
Not applicable
| Item 10. | Submission of Matters to a Vote of Security Holders. |
The registrant’s Nominating Committee shall review shareholder recommendations to fill vacancies on the registrant’s board of trustees if such recommendations are submitted in writing, addressed to the Committee at the registrant’s offices and meet any minimum qualifications adopted by the Committee. The Committee may adopt, by resolution, a policy regarding its procedures for considering candidates for the board of trustees, including any recommended by shareholders.
| Item 11. | Controls and Procedures. |
(a) Based on their evaluation of the registrant’s disclosure controls and procedures (as defined in Rule 30a-3(c) under the Investment Company Act of 1940) as of a date within 90 days of the filing date of this report, the registrant’s principal executive officers and principal financial officer have concluded that such disclosure controls and procedures are reasonably designed and are operating effectively to ensure that material information relating to the registrant, including its consolidated subsidiaries, is made known to them by others within those entities, particularly during the period in which this report is being prepared, and that the information required in filings on Form N-CSR is recorded, processed, summarized, and reported on a timely basis.
(b) There were no changes in the registrant’s internal control over financial reporting (as defined in Rule 30a-3(d) under the Investment Company Act of 1940) that occurred during the second fiscal quarter of the period covered by this report that have materially affected, or are reasonably likely to materially affect, the registrant’s internal control over financial reporting.
File the exhibits listed below as part of this Form. Letter or number the exhibits in the sequence indicated.
(a)(1) Any code of ethics, or amendment thereto, that is the subject of the disclosure required by Item 2, to the extent that the registrant intends to satisfy the Item 2 requirements through filing of an exhibit: Not required
(a)(2) A separate certification for each principal executive officer and principal financial officer of the registrant as required by Rule 30a-2(a) under the Act (17 CFR 270.30a-2(a)): Attached hereto
(a)(3) Any written solicitation to purchase securities under Rule 23c-1 under the Act (17 CFR 270.23c-1) sent or given during the period covered by the report by or on behalf of the registrant to 10 or more persons: Not applicable
(b) Certifications required by Rule 30a-2(b) under the Act (17 CFR 270.30a-2(b)): Attached hereto
| Exhibit 99.CERT | Certifications required by Rule 30a-2(a) under the Act |
| | |
| Exhibit 99.906CERT | Certifications required by Rule 30a-2(b) under the Act |
SIGNATURES
Pursuant to the requirements of the Securities Exchange Act of 1934 and the Investment Company Act of 1940, the registrant has duly caused this report to be signed on its behalf by the undersigned, thereunto duly authorized.
| (Registrant) | Williamsburg Investment Trust | | |
| | | | |
| By (Signature and Title)* | /s/ Tina H. Bloom | |
| | | Tina H. Bloom, Secretary and Chief Compliance Officer | |
| | | | |
| Date | November 18, 2015 | | |
| | | | |
| Pursuant to the requirements of the Securities Exchange Act of 1934 and the Investment Company Act of 1940, this report has been signed below by the following persons on behalf of the registrant and in the capacities and on the dates indicated. |
| | | | |
| By (Signature and Title)* | /s/ John T. Bruce | |
| | | John T. Bruce, President | |
| | | (FBP Equity & Dividend Plus Fund and FBP Appreciation & Income Opportunities Fund) | |
| | | | |
| Date | November 18, 2015 | | |
| | | | |
| By (Signature and Title)* | /s/ Thomas W. Leavell | |
| | | Thomas W. Leavell, President | |
| | | (The Government Street Equity Fund, The Government Street Mid-Cap Fund and The Alabama Tax Free Bond Fund) | |
| | | | |
| Date | November 18, 2015 | | |
| | | | |
| By (Signature and Title)* | /s/ Charles M. Caravati III | |
| | | Charles M. Caravati III, President | |
| | | (The Jamestown Equity Fund) | |
| | | | |
| Date | November 18, 2015 | | |
| | | | |
| By (Signature and Title)* | /s/ Joseph A. Jennings III | |
| | | Joseph A. Jennings III, President | |
| | | (The Jamestown Tax Exempt Virginia Fund) | |
| | | | |
| Date | November 18, 2015 | | |
| | | | |
| By (Signature and Title)* | /s/ John P. Ackerly IV | |
| | | John P. Ackerly IV, President | |
| | | (The Davenport Core Fund, Davenport Value & Income Fund, Davenport Equity Opportunities Fund and Davenport Small Cap Focus Fund) | |
| | | | |
| Date | November 18, 2015 | | |
| | | | |
| By (Signature and Title)* | /s/ Mark J. Seger | |
| | | Mark J. Seger, Treasurer | |
| | | | |
| Date | November 18, 2015 | | |
| * | Print the name and title of each signing officer under his or her signature. |