| OMB APPROVAL |
OMB Number: 3235-0570 Expires: January 31, 2017 Estimated average burden hours per response: 20.6 |
| Investment Company Act file number | 811-05685 |
| Williamsburg Investment Trust |
| (Exact name of registrant as specified in charter) |
| 225 Pictoria Drive, Suite 450 Cincinnati, Ohio | 45246 |
| (Address of principal executive offices) | (Zip code) |
| Sullivan & Worcester LLP One Post Office Square Boston, Massachusetts 02109 |
| (Name and address of agent for service) |
| Registrant's telephone number, including area code: | (513) 587-3400 |
| Date of fiscal year end: | March 31 | |
| Date of reporting period: | September 30, 2016 |
| Item 1. | Reports to Stockholders. |

SEMI-ANNUAL REPORT
September 30, 2016
(Unaudited)
THE DAVENPORT FUNDS | November 10, 2016 |
Dear Shareholders,
Equity markets had a good third quarter, with the S&P 500 Index up 3.85% and the Russell 2000 Index up 9.05%. Volatility subsided in Q3 after the “Brexit” vote had caused a fleeting selloff at the end of Q2. Year-to-date, the S&P 500 has gained 7.84% and the Russell 2000 is up 11.46%. This is very impressive performance in the face of widespread pessimism and one of the worst starts to the year on record. In fact, the S&P 500 finished Q3 a whopping 18.5% above its mid-February low, when it was down roughly 11% to start the year.
Market leadership changed significantly during the quarter. As we mentioned last quarter, we felt there was a “fear bubble” creeping into the markets as investors continued to chase share prices of “defensive” companies higher. We were concerned the share prices of these stable companies may have more risk in them than many realize, given fairly lofty valuations. In Q3 our fears were realized; the Telecom, Utilities and Consumer Staples sectors were the only areas of the market that witnessed declines, to the tune of 3-5%.
We continue to think that it is a contrarian view to believe the world gets a little better from here. We have expressed this view in our Funds as we have been finding relative value in the more economically-sensitive sectors of the market this year. Our tilt towards those areas across the funds aided performance in the quarter, with the best-performing sectors including Information Technology, Financials, Industrials and Materials.
Going forward we continue to find reasons to be cautiously optimistic. Corporate earnings are forecasted to grow in Q4 (after nearly two years of declines). The uncertainty of the election will soon be behind us, and the economy appears to be able to handle a quarter-point increase in short-term interest rates if the Federal Reserve follows through on its indications of a rate hike in December (after holding rates flat year-to- date). In our view, valuations remain reasonable in light of the easy monetary conditions, pessimism continues to abound and ample cash remains on the sidelines, all of which could assist returns if the global economy continues to heal.
Please read on for a discussion of Fund themes and ideas. We thank you for your trust and look forward to reporting back to you later in the year.
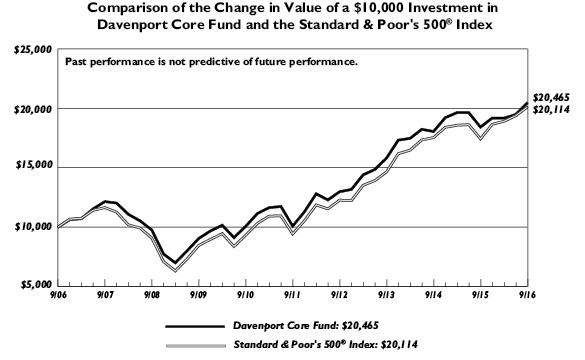
Davenport Core Fund
The following chart represents Davenport Core Fund (DAVPX) performance and the performance of the S&P 500 Index, the Core Fund’s primary benchmark, for the periods ended September 30, 2016.
| Q3 2016 | YTD 2016 | 1 Year | 3 Years* | 5 Years* | 10 Years* | Since Inception* 1/15/98 |
Core Fund (DAVPX) | 5.07% | 6.68% | 11.12% | 8.96% | 15.20% | 7.42% | 6.26% |
S&P 500 Index** | 3.85% | 7.84% | 15.43% | 11.16% | 16.37% | 7.24% | 6.48% |
30-Day SEC Yield: 0.60%; Expense Ratio in current prospectus: 0.92%
1
Past performance is no guarantee of future results. Investment return and principal value of an investment will fluctuate so that an investor’s shares, when redeemed, may be worth more or less than their original cost. Current performance may be lower or higher than the performance data quoted. Performance data, current to the most recent month end, may be obtained by calling 1-800-281-3217.
* | Returns greater than one year are annualized. |
** | The S&P 500 Index is comprised of 500 U.S. stocks and is an indicator of the performance of the overall U.S. stock market. An investor cannot invest in an index and its returns are not indicative of the performance of any specific investment. |
The Core Fund returned 5.07% in the third quarter, versus a 3.85% return for the S&P 500. Year-to-date, the Fund is up 6.68% relative to a 7.84% return for the broader market. As mentioned in the introduction letter, market leadership changed significantly during Q3, and the Fund was set up favorably to take advantage of that shift.
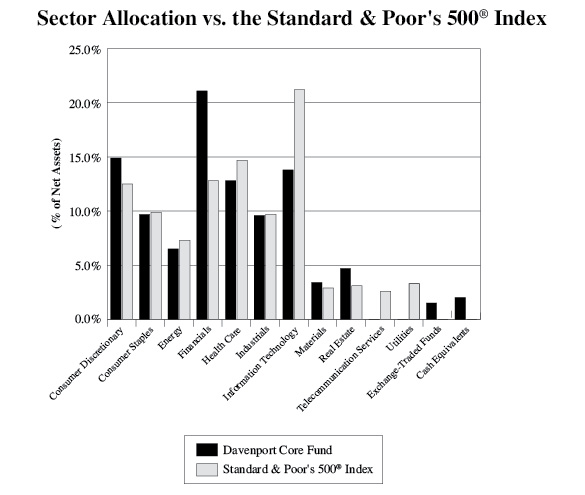
For example, the Fund’s 0% weighting in the defensive Utility and Telecom sectors aided performance this quarter, as investors’ willingness to pay high valuations for perceived safety finally waned in Q3. In addition, stock picking in the Consumer Discretionary sector aided performance, with PVH (PVH), Priceline (PCLN) and Liberty Broadband (LBRDK/LBRDA) all having standout quarters. Our worst sector was Information Technology, where the Fund’s underweight position was a drag on performance in a hot quarter for technology stocks.
We mentioned our positive view on housing last quarter and added a second housing-related stock to the Fund this quarter: Weyerhaeuser (WY), the largest publicly-traded timberland REIT. After a major overhaul that involved shedding underperforming divisions and doubling its timberland acreage through a large acquisition, WY is well positioned for an improving housing market. We have long been attracted to the timber business. A real and renewable asset, input costs (sun and water) are cheap (or free) and capital intensity is also fairly modest. Over time, timber has a strong track record of low risk and positive returns, after inflation. Furthermore, a constructive building environment should allow the company to bring forward some value.
In addition, we focused on trimming back stocks that have worked well recently—e.g. Starbucks (SBUX), Liberty Broadband (LBRDA)—and added to a few key names that all aided performance during the quarter: FedEx (FDX), Visa (V) and Adobe (ADBE). All three companies are benefiting from long-term secular drivers: e-commerce in the case of FedEx, digital payments in the case of Visa, and the proliferation of data consumption and digital content in the case of Adobe.
Towards the end of the quarter we sold the Fund’s position in Monsanto (MON) amidst acquisition-related uncertainty and put the proceeds to work in Ecolab (ECL), a specialty cleaning chemical producer. ECL has built an enviable track record over the past couple decades with its 85% consumable sales mix, 25,000 strong direct sales force, 95%+ customer retention, and technological innovation driving pricing power. More recently, results (and the stock) have been hampered by weak energy markets and foreign exchange headwinds. As both of these issues improve we think profits are poised to inflect higher. As an enabler of clean water, healthy environments, abundant energy and safe food we see a long runway for Ecolab to continue its mid-teens earnings per share growth rate.
In sum we are pleased with the performance in the quarter and think the actions taken during the quarter further increase the attractiveness of the Fund. We look forward to reporting back at the end of the fiscal year.
2
The following are transactions performed in the Core Fund for the quarter ended September 30, 2016.
Recent Purchases
Adobe Systems, Inc. (ADBE)—Initially purchased back in March, we elected to make the position more meaningful on our continued confidence in growth of subscription revenue.
Ecolab, Inc. (ECL)—We initiated a position in this leading specialty chemical company this quarter as its cleaning solutions have been increasingly adopted by customers and the company has turned out impressive and consistent growth, consistently growing adjusted Earnings Per Share (EPS) over the last twenty years.
FedEx Corporation (FDX)—We added to the position on weakness during the quarter, following “Brexit” related concerns and forward guidance which fell short of analyst expectations due to increased capital expenditures (which we view favorably over the longer term).
Southwest Airlines Company (LUV)—We added to the position on continued sector weakness, believing the longer term thesis of sound financial management and improving pricing trends remains intact for this best in class domestic operator.
Visa, Inc. (V)—We added to the position during the quarter as shorter-term currency and legal/regulatory headwinds provided an attractive entry point into this longer-term growth story operating one of the best business models around.
Weyerhaeuser Company (WY)—We initiated a position in this leading timberland REIT during the quarter, attracted to the high barriers to entry, renewable asset characteristics, long track record of attractive risk/return characteristics (net of inflation) and leverage to an improving housing market.
Recent Sales
Brookfield Business Partners LP (BBU)—An entity recently created through a special in-kind dividend from Brookfield Asset Management, we elected to sell this position given its K-1 tax treatment and small stub position.
Check Point Software Technologies Ltd. (CHKP)—While we continue to view cybersecurity as an attractive end market, we elected to sell the position, as we are increasingly concerned over competitive pressures negatively impacting market share.
CME Group, Inc. (CME)—While we remain attracted to the shares and own a meaningful position, we elected to reduce the Fund’s exposure somewhat as shares have strengthened alongside moderating fears over high frequency trading.
Liberty Broadband Corporation A Shares (LBRDA)—A strong performer year to date, we elected to sell this position, moving proceeds to more timely opportunities (we retain our position in Liberty Broadband C Shares).
Monsanto Company (MON)—We elected to sell the remainder of the position during the quarter, despite the board’s recent agreement to a takeover offer from Bayer AG (BAYRY). There is still some risk that the deal will not go through. MON’s business remains challenged due to a multiyear crop glut. We opted to put funds to work in a more timely situation.
3
PVH Corporation (PVH)—With continued solid execution from management, PVH has performed nicely since our addition earlier in the year; thus we elected to reduce the position size, capture profits and move to more attractive risk/reward opportunities.
Starbucks Corporation (SBUX)—While we remain impressed with company’s execution and high margin sales growth, shares have rerated (up) substantially since our initial purchase and we felt it appropriate to sell and move to opportunities with a more favorable risk/reward profile.
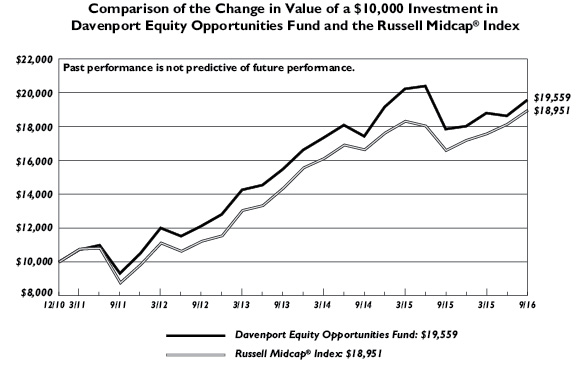
Davenport Equity Opportunities Fund
The following chart represents Davenport Equity Opportunities Fund (DEOPX) performance and the performance of the Russell Midcap Index, the Fund’s primary benchmark, and the S&P 500 Index for the periods ended September 30, 2016.
| Q3 2016 | YTD 2016 | 1 Year | 3 Years* | 5 Years* | Since Inception* 12/31/10 |
Equity Opportunities Fund (DEOPX) | 5.00% | 8.55% | 9.57% | 8.11% | 15.97% | 12.38% |
Russell Midcap Index** | 4.52% | 10.26% | 14.25% | 9.70% | 16.67% | 11.76% |
S&P 500 Index** | 3.85% | 7.84% | 15.43% | 11.16% | 16.37% | 12.31% |
30-Day SEC Yield: 0.10%; Expense Ratio in current prospectus: 0.95%
Past performance is no guarantee of future results. Investment return and principal value of an investment will fluctuate so that an investor’s shares, when redeemed, may be worth more or less than their original cost. Current performance may be lower or higher than the performance data quoted. Performance data, current to the most recent month end, may be obtained by calling 1-800-281-3217.
* | Returns greater than one year are annualized. |
** | The Russell Midcap® Index measures the performance of the 800 smallest companies in the Russell 1000, which represent approximately 25% of the total market capitalization of the Russell 1000®. Frank Russell Company is the source and owner of the trademarks, service marks, and copyrights related to the Russell Indexes. Russell® is a trademark of Frank Russell Company. The S&P 500 Index is comprised of 500 U.S. stocks and is an indicator of the performance of the overall U.S. stock market. An investor cannot invest in an index and its returns are not indicative of the performance of any specific investment. |
The Equity Opportunities Fund posted sound results for the third quarter with a gain of 5.00%. This compares to gains of 4.52% and 3.85% for the Russell Mid Cap Index and S&P 500, respectively. Year-to-date, the Fund ended the period up 8.55% versus 10.26% and 7.84% for the Russell Mid Cap and S&P 500. After “Brexit” prompted wild moves at the end of the second quarter, we were pleased to see market volatility subside in Q3. We were also pleased to see solid performance from positions that we added to during the “Brexit” tumult.
Live Nation (LYV) and Wabco (WBC) were among the leading contributors for the quarter. Fortunately, we were able to build each position at the end of Q2 when market weakness created opportunities. WBC was especially impacted by Brexit given its large exposure to Europe. In the case of LYV, a meeting with company management further bolstered our faith in this company’s numerous growth avenues and growing competitive edge in the global concert business.
4
Dollar Tree (DLTR) was by far the biggest detractor during the quarter. Shares of the retailer declined roughly 15% as investors fretted over a lackluster quarterly update. True, consumer spending trends have been uneven and discount retail has become more of a competitive battleground. However, DLTR has consistently executed in numerous business environments as evidenced by 34 straight quarters of same-store sales growth. We think its unique business model will continue to yield steady growth even in tougher climates. With the acquisition of Family Dollar, the company also now has the opportunity to apply its operating prowess to a much larger store base. We think this deal may yield significant synergies and believe investors are being too short-sighted in their assessment of the company. Hence, DLTR remains one of the Fund’s biggest positions.
We have established a new position in Sherwin Williams (SHW). SHW manufactures and sells paints and coatings and has an impressive history of creating value for shareholders. It has the leading market share in the U.S. for architectural products, which should enjoy the tailwind of an ongoing recovery in the housing market. What’s more, the company recently reached an agreement to acquire Valspar (VAL) for $11.3 billion. This transformational deal would both expand SHW’s geographic presence and greatly enhance its position in the global protective coatings industry. We think synergies from this deal and steady growth in the existing business could allow the company to earn $20/share by the end of the decade.
We continue to feel the Fund could be coiled for upside given the depressed valuations of numerous positions. In addition to some of the names mentioned above, this can be said for top holdings such as Capital One (COF), Carmax (KMX), Colfax (CFX) and TripAdvisor (TRIP). While all are “growth” stories, these companies have faced headwinds that allowed us to build stakes at very favorable prices. We want our best ideas in terms of risk/ reward to be well represented in the Fund’s top holdings and firmly believe that is the case today. Our concentrated approach may cause performance to come in spurts, but over time we think it will yield superior results.
The following are transactions performed in the Equity Opportunities Fund for the quarter ended September 30, 2016.
Recent Purchases
Capital One Financial Corporation (COF)—Given recent “lower for longer” fallout from Brexit, we elected to add to these shares on weakness, as we remain attracted to growth drivers intact within the longer term story.
FNF Group (FNF)—We added to shares of this high quality title insurer during the quarter, believing we are in the early innings of a recovery in housing.
Sherwin-Williams Company (SHW)—Founded in 1866, SHW is a leader in the development and distribution of paints and coatings and boasts a long track record of value creation. As such, we initiated a position during the quarter alongside continued improvement in the housing market and potential synergies following the purchase of Valspar earlier in the year.
TripAdvisor, Inc. (TRIP)—We chose to add to shares of this travel industry leader during the quarter alongside broader weakness in the travel industry and ongoing concerns around the company’s efforts to transition to more of a booking platform.
Zoetis, Inc. (ZTS)—We elected to purchase a position as the company is well diversified both geographically and from a product standpoint, while also being one of the purest ways to play compelling secular growth themes within the companion animal and livestock markets.
5
Recent Sales
Brookfield Business Partners LP (BBU)—An entity recently created through a special in-kind dividend from BAM, we elected to sell this position, given its K-1 tax treatment and small stub position within the Fund.
Discovery Communications, Inc. A Shares (DISCA)— We continue to hold shares in the name, but given ongoing “cord cutting” concerns and lack of near term catalysts, we opted to chip the position and move proceeds to more timely opportunities.
Discovery Communications, Inc. C Shares (DISCK)— While we are willing to continue owning the stock given a seemingly attractive risk/reward profile, a smaller position seems to make sense as we don’t think the sentiment headwind will abate much as we move into 2017 and therefore elected to chip the position.
Gaming & Leisure Properties, Inc. (GLPI)—While we maintain a meaningful position in the Fund, we opted to reduce the size given recent performance alongside strength in the REIT sector and broader flight to stable income plays.
Liberty Broadband Corporation (LBRDK)—A strong performer year to date, we elected to capture profits and reduce the size of the position, moving proceeds to more timely opportunities from a risk return perspective.
Penn National Gaming, Inc. (PENN)—Having been a great stock for the Fund over time, we elected to sell the remainder of the position and direct proceeds to more attractive opportunities.
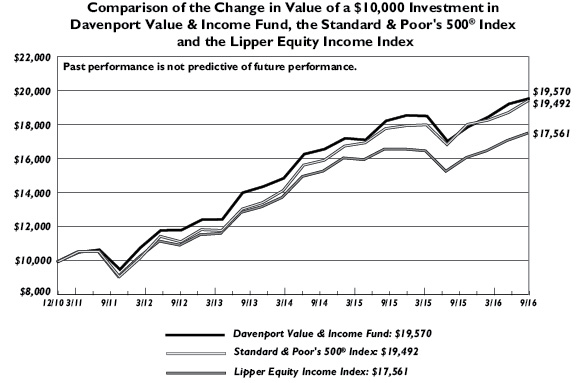
Davenport Value & Income Fund
The following chart represents Davenport Value & Income Fund (DVIPX) performance and the performance of the S&P 500 Index, the Value & Income Fund’s primary benchmark, and the Lipper Equity Income Index for the periods ended September 30, 2016.
| Q3 2016 | YTD 2016 | 1 Year | 3 Years* | 5 Years* | Since Inception* 12/31/10 |
Value & Income Fund (DVIPX) | 1.68% | 9.35% | 14.73% | 9.57% | 15.51% | 12.39% |
S&P 500 Index** | 3.85% | 7.84% | 15.43% | 11.16% | 16.37% | 12.31% |
Lipper Equity Income Index** | 2.50% | 8.86% | 14.59% | 8.41% | 13.93% | 10.29% |
30-Day SEC Yield: 2.17%; Expense Ratio in current prospectus: 0.93%
Past performance is no guarantee of future results. Investment return and principal value of an investment will fluctuate so that an investor’s shares, when redeemed, may be worth more or less than their original cost. Current performance may be lower or higher than the performance data quoted. Performance data, current to the most recent month end, may be obtained by calling 1-800-281-3217.
* | Returns greater than one year are annualized. |
** | The S&P 500 Index is comprised of 500 U.S. stocks and is an indicator of the performance of the overall U.S. stock market. The Lipper Equity Income Index is an unmanaged index of the 30 largest funds in the Lipper Equity Income fund category. An investor cannot invest in an index and its returns are not indicative of the performance of any specific investment. |
The Value & Income Fund gained 1.68% in the quarter, versus a 2.50% increase for the Lipper Equity Income Index. Year-to-date, the Fund is up 9.35%, compared to the Lipper’s 8.86%.
6
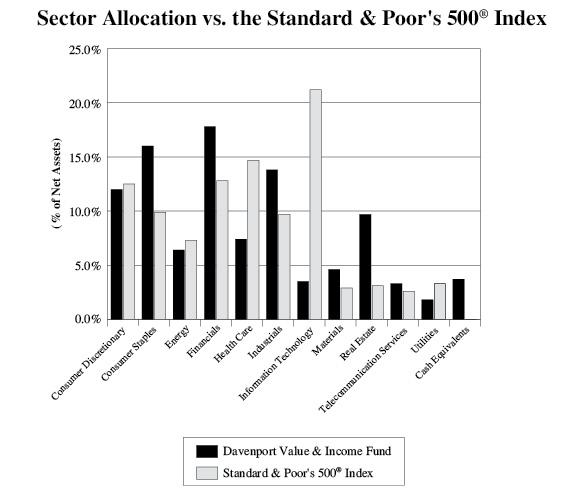
Standout stocks in the quarter included Las Vegas Sands (LVS), which benefited from improving sales numbers in its Macau casinos, Spectra Energy (SE), which will be acquired by Enbridge (ENB), banks such as Capital One (COF), and REITs which benefited from continued low interest rates. The worst performing sector was Information Technology, where an underweight position cost the Fund performance in a hot quarter for this sector.
During the quarter, the Fund purchased two down-and-out stocks in the consumer discretionary sector: Whirlpool (WHR) and Kroger (KR). Whirlpool is the world’s largest manufacturer of major home appliances and operates a diversified line of well-known brands across the value-premium spectrum such as Whirlpool, KitchenAid, Jenn-Air and Maytag. Currently battling inexpensive foreign competition, WHR shares have sold off, offering an attractive entry point. We see WHR as a self-help, margin improvement story with a focus on cost reduction and productivity initiatives that could enable the company to boost earnings substantially over the next few years.
With $110 billion in sales, Kroger is the second largest grocer in the US. The company has nearly 2,800 densely clustered stores across 35 states, giving the company scale and cost advantages relative to current competitors and new entrants. Over the last several years, KR has put together an impressive track record of same-store-sales growth, market share gains and profit improvement via prudent capital management, private label penetration and technology initiatives. More recently, the shares have weakened due to concerns surrounding competitive threats, fuel margin weakness and deflationary food trends. We felt this was a compelling opportunity to put money to work in a proven value creator with a defensive business model.
To fund these transactions, we took some profits, chipping back positions in Altria (MO), Philip Morris International (PM), and W.P. Carey (WPC), which have all been strong performers this year. We also sold Eastman Chemical (EMN). Although Eastman has made a great deal of progress transitioning from a lower-value commodity chemical company towards a specialty chemical producer with higher market share(s) and margins, the quarter of the business that is still commodity-centric deteriorated alongside the oil selloff and remains challenged, with weak end-market demand and general oversupply. New competitors in Asia have expanded capacity and could limit a recovery in this segment even when oil prices recover.
In sum, we continue to be mindful of the “fear bubble” that has crept into the markets and the expensive prices the market is paying for companies with recession-resistant businesses. We remain disciplined on the valuations we are willing to pay, and continue to find more value in dividend growth stories (as opposed to current yield) and companies that have a bit more cyclicality. We think that we will be rewarded for this disciplined approach and began to see some benefit during Q3.
The following are transactions performed in the Value & Income Fund for the quarter ended September 30, 2016.
Recent Purchases
Merck & Company, Inc. (MRK)—We added to shares during the quarter, as we remain attracted to the robust product pipeline, reduced headwinds from old franchises rolling off, under-levered balance sheet and attractive dividend yield.
7
The Kroger Company (KR)—Long impressed with the company’s same-store-sales growth, market share gains, prudent capital management and defensive business model, we initiated a position in this second largest US grocer during the quarter as shares weakened alongside fears of competitive threats, fuel margin weakness and deflationary food trends.
Whirlpool Corporation (WHR)—With shares trading at a discount valuation, we chose to initiate a position in WHR during the quarter, attracted to the company’s focus on global cost reduction, productivity initiatives and leverage to an improving US housing market.
Recent Sales
Eastman Chemical Company (EMN)—While the company has continued its transition from a lower-value commodity chemical company towards a specialty chemical producer with higher market shares and margins, we opted to sell the position during the quarter, concerned with increasing levels of competition, overcapacity and little improvement in end markets.
Phillip Morris International, Inc. (PM)—We remain attracted to the company’s strong brand equity, predictable demand patterns and robust pricing power, but with the stock currently sitting near all-time highs, we opted to chip the position and move proceeds to better risk/reward opportunities.
Altria Group, Inc. (MO)—The stock has performed very well throughout the year and currently sits near all-time highs. Though we remain attracted to the company’s strong brand equity, predictable demand patterns and robust pricing power, we felt the funds could be put to better use and thus chipped the position.
Spectra Energy Corporation (SE)—While we remain attracted to the company’s assets, demand-pull growth strategy, and the covered 4.5% current dividend yield, we elected to chip the position and take profits with the stock having rerated substantially this year (up over 50% year-to-date).
W.P. Carey, Inc. (WPC)—In the wake of ever-lower interest rates, shares have benefited from investors favoring stable income-producing securities. We therefore opted to scale back the Fund’s exposure on this strength, taking profits to be used elsewhere in the Fund.
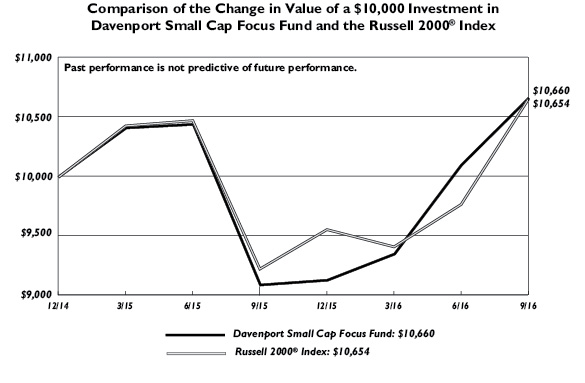
Davenport Small Cap Focus Fund
The following chart represents Davenport Small Cap Focus Fund (DSCPX) performance and the performance of the Russell 2000 Index, the Small Cap Focus Fund’s primary benchmark, for the periods ended September 30, 2016.
| Q3 2016 | YTD 2016 | 1 Year | Since Inception* 12/31/14 |
Small Cap Focus Fund (DSCPX) | 5.55% | 16.78% | 17.29% | 3.72% |
Russell 2000® Index** | 9.05% | 11.46% | 15.47% | 3.69% |
30-Day SEC Yield: 0.02%; Expense Ratio in current prospectus: 1.17%
8
Past performance is no guarantee of future results. Investment return and principal value of an investment will fluctuate so that an investor’s shares, when redeemed, may be worth more or less than their original cost. Current performance may be lower or higher than the performance data quoted. Performance data, current to the most recent month end, may be obtained by calling 1-800-281-3217.
* | Returns greater than one year are annualized. |
** | The Russell 2000® Index measures the performance of the 2,000 smallest companies in the Russell 3000 Index. The Russell 3000 Index measures the performance of the 3,000 largest U.S. companies based on total market capitalization and represents approximately 98% of the investable U.S. equity market. Frank Russell Company is the source and owner of the trademarks, service marks, and copyrights related to the Russell Indexes. Russell® is a trademark of Frank Russell Company. An investor cannot invest in an index and its returns are not indicative of the performance of any specific investment. |
The Davenport Small Cap Focus Fund (DSCPX) posted solid absolute results during the third quarter; however, the Fund’s 5.55% advance failed to keep pace with the blistering 9.05% gain for the Russell 2000 Index (more than double the return for the S&P 500 Index). Year-to-date, the Fund’s 16.78% gain remains nicely ahead of the 11.46% rise for the Russell 2000.
On the heels of significant outperformance in Q2, we were not surprised to see relative results wane. While weakness in key holdings such as Boston Beer (SAM) and Coremark Holdings (CORE) served as a drag on results, our strategy’s underweight position in the Information Technology sector (which is heavily emphasized in the Russell 2000) was also a headwind. As a reminder, our bottoms-up orientation and concentrated approach can lead to meaningful variances from benchmark weightings. In this case, we missed out on some momentum in the Information Technology sector. On the positive side, the Fund continued to benefit from key holdings in the regional gaming space, where Monarch Casino (MCRI) and Isle of Capri Casinos (ISLE) posted nice gains.
In the case of ISLE, the stock advanced roughly 30% near quarter end as the company announced it has agreed to be acquired by another one of the Fund’s holdings, El Dorado Resorts (ERI), for stock and cash. We believe this deal is attractive from both shareholder perspectives. As ISLE shareholders, both the transaction multiple and premium paid (30%) are reasonable. As ERI shareholders, we value the company’s increased scale, favorable financing terms, ability to exceed synergy targets and opportunity to quickly de-lever with improved free cash flow conversion. As such, we have chosen to maintain holdings in ERI and ISLE, which will result in a 2.5% position in the combined entity (based on current price levels) once the deal is consummated in 2Q 2017.
We initiated a new position in American Woodmark Corporation (AMWD) during the quarter. Woodmark, headquartered in Winchester, VA, is one of the largest manufacturers of kitchen cabinets and vanities in the U.S. We view this as another way to play a recovering housing market (both new construction and repair/ remodel), a theme we expect to continue for the next few years. In addition to growing end markets, AMWD has seen a dramatic improvement in its operations, with margins increasing to ~10%, from a loss position in 2011. Management accomplished this by closing plants, focusing on the highly profitable dealer channel and improving efficiencies. With double-digit revenue growth forecast over the next few years and some additional margin expansion, we think AMWD can grow earnings at a mid-teens rate for the foreseeable future.
9
While relative results lagged a bit during the quarter, we are pleased with year-to-date performance. Though we would expect some moderation in the red hot returns the small cap universe has produced over the last couple quarters, we continue to find attractive opportunities to put cash to work and feel confident in the risk/reward profile of the Fund.
Davenport Balanced Income Fund
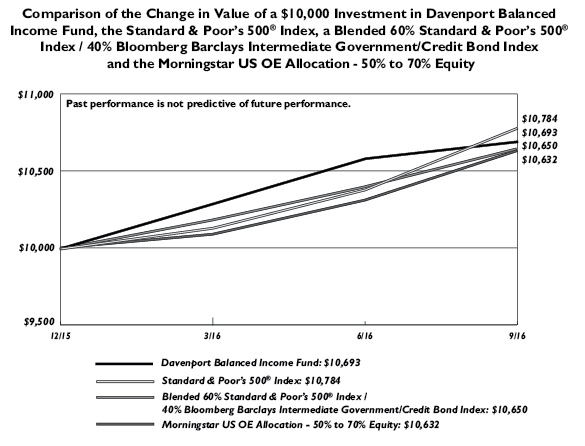
The following chart represents the performance of the Davenport Balanced Income Fund (DBALX), Morningstar US OE Allocation 50-70% Equity Index, and the S&P 500 Index for the periods ended September 30, 2016.
| Q3 2016 | Since Inception 12/31/15 |
Balanced Income Fund (DBALX) | 1.04% | 6.93% |
Morningstar US OE Allocation 50-70% Equity* | 3.12% | 6.32% |
S&P 500 Index* | 3.85% | 7.84% |
30-Day SEC Yield: 1.34%; Expense Ratio in current prospectus: 1.25%
Past performance is no guarantee of future results. Investment return and principal value of an investment will fluctuate so that an investor’s shares, when redeemed, may be worth more or less than their original cost. Current performance may be lower or higher than the performance data quoted. Performance data, current to the most recent month end, may be obtained by calling 1-800-281-3217.
* | The Morningstar US OE Allocation 50-70% Equity Index is composed of funds which seek to provide both income and capital appreciation by investing in multiple asset classes, including stocks, bonds, and cash. These portfolios are dominated by domestic holdings and have equity exposures between 50% and 70%. The S&P 500 Index is comprised of 500 U.S. stocks and is an indicator of the performance of the overall U.S. stock market. An investor cannot invest in an index and index returns are not indicative of the performance of any specific investment. |
The Davenport Balanced Income Fund gained 1.04% in the quarter, versus a 3.12% increase for the Morningstar US OE 50%-70% Equity Index. Year-to-date, the Fund is up 6.93%, compared to the Morningstar’s 6.32%.
Following the volatility induced by the “Brexit” vote at the end of Q2, the fixed income market traded relatively sideways for the third quarter. The Bloomberg Barclays U.S. Intermediate Government Credit Index returned 0.16% for Q3 compared to its year-to-date returns of 4.24%. Treasury yields moved slightly higher during the quarter. The US 10- year Treasury began the quarter at 1.47% and finished Q3 at 1.59% on September 30th, while hitting its year-to-date low of 1.36% on July 8th, post “Brexit.”
The bond allocation of the Fund continues to focus on intermediate maturities. We opportunistically added to the Fund’s fixed positions to increase income, while adding to the exposure in floating rate notes, in order to hedge against the anticipated rising rates, and take advantage of the rise in LIBOR rates due to money market reform. Overall, we feel that our fixed allocation strategically continues to provide current income while providing stability during periods of increased volatility.
The equity portion of the Fund saw standout performance from stocks such as Las Vegas Sands (LVS), which benefited from strong sales in its Macau casinos following recent new property openings, and Spectra Energy (SE), which received a boost following Enbridge’s (ENB)
10
announcement to purchase Spectra in an all-stock deal. Moreover, the Fund’s REIT holdings continued to benefit from a low interest rate environment. The Fund’s under-weight position in the Information Technology sector was a drag on performance, particularly in the month of July, during which technology outperformed all other sectors.
We initiated a position in Alliance Resource Partners (ARLP), which produces and markets coal primarily to major US utilities and industrials users. Shares weakened as coal inventories remained elevated early in the year following a mild winter with low natural gas prices; however, we believe a rebound in natural gas prices, alongside a normalized winter, will continue to drive increased coal demand and normalize coal stock piles over the next few quarters. The company has responded to recent market conditions by lowering operating expenses and capital expenditures and has focused on maintaining liquidity. Additionally, the company offers a dividend yield of 8%.
In conclusion, we remain valuation sensitive, cognizant of the expensive prices the market is paying for more recession-resistant businesses. As such, we have increased our emphasis on more cyclical businesses, which appear to offer favorable risk/reward profiles. We continue to believe our balanced allocation will provide a lower volatility investment option in uncertain times, with a focus on current income and long term capital appreciation.
We are pleased that The Davenport Funds have had a good year thus far in 2016. We thank you for your trust and look forward to reporting back early next year.
Sincerely,
John P. Ackerly, IV
President, The Davenport Funds
11
DAVENPORT CORE FUND
PERFORMANCE INFORMATION (Unaudited)
Average Annual Total Returns | |||
1 Year | 5 Years | 10 Years | |
Davenport Core Fund(a) | 11.12% | 15.20% | 7.42% |
Standard & Poor’s 500® Index | 15.43% | 16.37% | 7.24% |
(a) | The total returns shown do not reflect the deduction of taxes that a shareholder would pay on Fund distributions or the redemption of Fund shares. |
12
DAVENPORT VALUE & INCOME FUND
PERFORMANCE INFORMATION (Unaudited)
Average Annual Total Returns | |||
1 Year | 5 Years | Since | |
Davenport Value & Income Fund(a) | 14.73% | 15.51% | 12.39% |
Standard & Poor’s 500® Index | 15.43% | 16.37% | 12.31% |
Lipper Equity Income Index | 14.59% | 13.93% | 10.29% |
(a) | The total returns shown do not reflect the deduction of taxes that a shareholder would pay on Fund distributions or the redemption of Fund shares. |
(b) | Commencement of operations was December 31, 2010. |
13
DAVENPORT EQUITY OPPORTUNITIES FUND
PERFORMANCE INFORMATION (Unaudited)
Average Annual Total Returns | |||
1 Year | 5 Years | Since | |
Davenport Equity Opportunities Fund(a) | 9.57% | 15.97% | 12.38% |
Russell Midcap® Index | 14.25% | 16.67% | 11.76% |
(a) | The total returns shown do not reflect the deduction of taxes that a shareholder would pay on Fund distributions or the redemption of Fund shares. |
(b) | Commencement of operations was December 31, 2010. |
14
DAVENPORT SMALL CAP FOCUS FUND
PERFORMANCE INFORMATION (Unaudited)
Average Annual Total Returns | ||
1 Year | Since Inception(b) | |
Davenport Small Cap Focus Fund(a) | 17.29% | 3.72% |
Russell 2000® Index | 15.47% | 3.69% |
(a) | The total returns shown do not reflect the deduction of taxes that a shareholder would pay on Fund distributions or the redemption of Fund shares. |
(b) | Commencement of operations was December 31, 2014. |
15
DAVENPORT BALANCED INCOME FUND
PERFORMANCE INFORMATION (Unaudited)
Total Returns | |
Since Inception(b) | |
Davenport Balanced Income Fund(a) | 6.93% |
Standard & Poor’s 500® Index | 7.84% |
Blended 60% Standard & Poor’s 500® Index / 40% Bloomberg Barclays Intermediate Government/Credit Bond Index | 6.50% |
Morningstar US OE Allocation - 50% to 70% equity | 6.32% |
(a) | The total return shown does not reflect the deduction of taxes that a shareholder would pay on Fund distributions or the redemption of Fund shares. |
(b) | Commencement of operations was December 31, 2015. |
16
DAVENPORT CORE FUND
PORTFOLIO INFORMATION
September 30, 2016 (Unaudited)
Top Ten Equity Holdings
Security Description | % of Net Assets |
Markel Corporation | 3.7% |
Brookfield Asset Management, Inc. - Class A | 3.4% |
Capital One Financial Corporation | 3.2% |
American Tower Corporation | 3.1% |
Visa, Inc. - Class A | 3.0% |
Johnson & Johnson | 3.0% |
Accenture plc - Class A | 2.9% |
Danaher Corporation | 2.7% |
CarMax, Inc. | 2.6% |
Berkshire Hathaway, Inc. - Class B | 2.5% |
17
DAVENPORT VALUE & INCOME FUND
PORTFOLIO INFORMATION
September 30, 2016 (Unaudited)
Top Ten Equity Holdings
Security Description | % of Net Assets |
Johnson & Johnson | 3.3% |
FNF Group | 3.0% |
Markel Corporation | 2.9% |
Capital One Financial Corporation | 2.9% |
Watsco, Inc. | 2.8% |
JPMorgan Chase & Company | 2.7% |
Merck & Company, Inc. | 2.7% |
Diageo plc - ADR | 2.5% |
General Electric Company | 2.4% |
Citigroup, Inc. | 2.2% |
18
DAVENPORT EQUITY OPPORTUNITIES FUND
PORTFOLIO INFORMATION
September 30, 2016 (Unaudited)
Top Ten Equity Holdings
Security Description | % of Net Assets |
Capital One Financial Corporation | 5.5% |
Brookfield Asset Management, Inc. - Class A | 5.2% |
Colfax Corporation | 5.1% |
Live Nation Entertainment, Inc. | 5.0% |
American Tower Corporation | 4.9% |
CarMax, Inc. | 4.9% |
WABCO Holdings, Inc. | 4.6% |
Dollar Tree, Inc. | 4.5% |
Markel Corporation | 4.3% |
Discovery Communications, Inc. - Series C | 4.2% |
19
DAVENPORT SMALL CAP FOCUS FUND
PORTFOLIO INFORMATION
September 30, 2016 (Unaudited)

Top Ten Equity Holdings
Security Description | % of Net Assets |
Monarch Casino & Resort, Inc. | 5.0% |
Boston Beer Company, Inc. (The) - Class A | 3.7% |
Colfax Corporation | 3.5% |
VCA, Inc. | 3.5% |
Live Nation Entertainment, Inc. | 3.4% |
Seaboard Corporation | 3.1% |
TowneBank | 3.1% |
Liberty Broadband Corporation - Series C | 3.1% |
Liberty TripAdvisor Holdings, Inc. - Series A | 3.0% |
Stewart Information Services Corporation | 2.9% |
20
DAVENPORT BALANCED INCOME FUND
PORTFOLIO INFORMATION
September 30, 2016 (Unaudited)
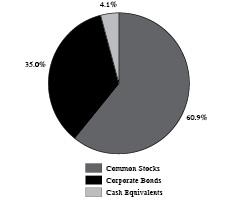
Asset Allocation (% of Net Assets) | Ten Largest Equity Holdings | % of Net Assets | |
 | Johnson & Johnson | 2.0% | |
FNF Group | 1.8% | ||
Markel Corporation | 1.7% | ||
Capital One Financial Corporation | 1.7% | ||
Watsco, Inc. | 1.6% | ||
JPMorgan Chase & Company | 1.6% | ||
Merck & Company, Inc. | 1.6% | ||
Diageo plc - ADR | 1.5% | ||
General Electric Company | 1.4% | ||
Citigroup, Inc. | 1.3% | ||
Equity Sector Concentration vs. the S&P 500®Index (60.9% of Net Assets) |
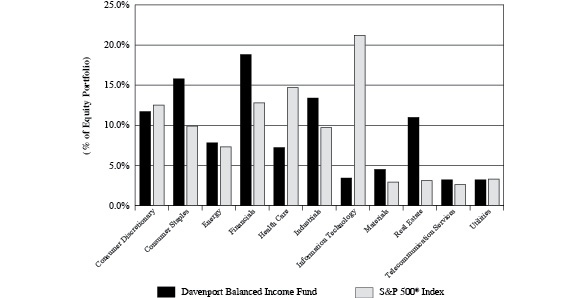 |
Corporate Bond Portfolio (35.0% of Net Assets) | Credit Quality | Composite Quality | ||
Number of Fixed-Income Securities | 34 | AAA | —% | |
Average Quality | A | AA | 21.2% | |
Effective Maturity | 4.2 yrs. | A | 66.1% | |
Average Effective Duration | 3.5 yrs. | BBB | 12.7% | |
Sector Breakdown | % of Corporate |
Financials | 32.1% |
Consumer Staples | 23.3% |
Information Technology | 9.8% |
Telecommunication Services | 9.4% |
Health Care | 9.1% |
Industrials | 9.0% |
Consumer Discretionary | 7.3% |
21
DAVENPORT CORE FUND |
COMMON STOCKS — 96.5% | Shares | Value | ||||||
Consumer Discretionary — 14.9% | ||||||||
Amazon.com, Inc. (a) | 7,866 | $ | 6,586,280 | |||||
CarMax, Inc. (a) | 175,597 | 9,368,100 | ||||||
Discovery Communications, Inc. - Series C (a) | 269,609 | 7,093,413 | ||||||
Liberty Broadband Corporation - Series C (a) | 51,714 | 3,696,517 | ||||||
Liberty SiriusXM Group - Series A (a) | 45,012 | 1,529,508 | ||||||
Liberty SiriusXM Group - Series C (a) | 137,789 | 4,603,530 | ||||||
Priceline Group, Inc. (The) (a) | 6,057 | 8,912,815 | ||||||
PVH Corporation | 66,367 | 7,333,554 | ||||||
Walt Disney Company (The) | 53,891 | 5,004,318 | ||||||
54,128,035 | ||||||||
Consumer Staples — 9.7% | ||||||||
Anheuser-Busch InBev SA/NV - ADR | 41,710 | 5,481,111 | ||||||
J.M. Smucker Company (The) | 59,592 | 8,077,100 | ||||||
Mondelēz International, Inc. - Class A | 142,655 | 6,262,555 | ||||||
Nestlé S.A. - ADR | 114,307 | 9,032,539 | ||||||
PepsiCo, Inc. | 57,286 | 6,230,998 | ||||||
35,084,303 | ||||||||
Energy — 6.5% | ||||||||
Chevron Corporation | 44,097 | 4,538,463 | ||||||
Exxon Mobil Corporation | 73,443 | 6,410,105 | ||||||
Marathon Petroleum Corporation | 136,808 | 5,553,037 | ||||||
Schlumberger Ltd. | 87,670 | 6,894,369 | ||||||
23,395,974 | ||||||||
Financials — 21.1% | ||||||||
Berkshire Hathaway, Inc. - Class B (a) | 63,556 | 9,181,935 | ||||||
Brookfield Asset Management, Inc. - Class A | 344,934 | 12,134,778 | ||||||
Capital One Financial Corporation | 160,119 | 11,501,348 | ||||||
Citigroup, Inc. | 177,347 | 8,376,099 | ||||||
CME Group, Inc. - Class A | 65,776 | 6,874,907 | ||||||
JPMorgan Chase & Company | 119,808 | 7,978,015 | ||||||
Markel Corporation (a) | 14,253 | 13,237,759 | ||||||
Wells Fargo & Company | 156,604 | 6,934,425 | ||||||
76,219,266 | ||||||||
Health Care — 12.8% | ||||||||
AmerisourceBergen Corporation | 69,705 | 5,630,770 | ||||||
Amgen, Inc. | 30,831 | 5,142,919 | ||||||
Celgene Corporation (a) | 71,658 | 7,490,411 | ||||||
Danaher Corporation | 125,197 | 9,814,193 | ||||||
Johnson & Johnson | 92,462 | 10,922,536 | ||||||
Merck & Company, Inc. | 120,245 | 7,504,490 | ||||||
46,505,319 | ||||||||
22
DAVENPORT CORE FUND |
COMMON STOCKS — 96.5%(Continued) | Shares | Value | ||||||
Industrials — 9.6% | ||||||||
FedEx Corporation | 42,511 | $ | 7,425,821 | |||||
Fortive Corporation | 62,598 | 3,186,238 | ||||||
General Dynamics Corporation | 38,019 | 5,899,028 | ||||||
General Electric Company | 163,340 | 4,838,131 | ||||||
Southwest Airlines Company | 149,356 | 5,808,455 | ||||||
Union Pacific Corporation | 76,914 | 7,501,422 | ||||||
34,659,095 | ||||||||
Information Technology — 13.8% | ||||||||
Accenture plc - Class A | 86,071 | 10,515,294 | ||||||
Adobe Systems, Inc. (a) | 72,374 | 7,855,474 | ||||||
Alphabet, Inc. - Class A (a) | 7,325 | 5,889,740 | ||||||
Alphabet, Inc. - Class C (a) | 6,677 | 5,189,965 | ||||||
Apple, Inc. | 40,822 | 4,614,927 | ||||||
Oracle Corporation | 122,357 | 4,806,183 | ||||||
Visa, Inc. - Class A | 133,221 | 11,017,377 | ||||||
49,888,960 | ||||||||
Materials — 3.4% | ||||||||
Ecolab, Inc. | 45,205 | 5,502,353 | ||||||
Praxair, Inc. | 57,852 | 6,990,257 | ||||||
12,492,610 | ||||||||
Real Estate — 4.7% | ||||||||
American Tower Corporation | 98,097 | 11,117,333 | ||||||
Weyerhaeuser Company | 182,880 | 5,841,187 | ||||||
16,958,520 | ||||||||
Total Common Stocks (Cost $251,521,776) | $ | 349,332,082 | ||||||
EXCHANGE-TRADED FUNDS — 1.5% | Shares | Value | ||||||
iShares U.S. Home Construction ETF (Cost $5,372,108) | 190,184 | $ | 5,239,569 | |||||
23
DAVENPORT CORE FUND |
MONEY MARKET FUNDS — 2.1% | Shares | Value | ||||||
First American Treasury Obligations Fund - Class Z, 0.23% (b) (Cost $7,694,912) | 7,694,912 | $ | 7,694,912 | |||||
Total Investments at Value — 100.1% (Cost $264,588,796) | $ | 362,266,563 | ||||||
Liabilities in Excess of Other Assets — (0.1%) | (209,010 | ) | ||||||
Net Assets — 100.0% | $ | 362,057,553 | ||||||
ADR - American Depositary Receipt.
(a) | Non-income producing security. |
(b) | The rate shown is the 7-day effective yield as of September 30, 2016. |
See accompanying notes to financial statements.
24
DAVENPORT VALUE & INCOME FUND |
COMMON STOCKS — 96.3% | Shares | Value | ||||||
Consumer Discretionary — 12.0% | ||||||||
Carnival Corporation | 144,525 | $ | 7,055,710 | |||||
Las Vegas Sands Corporation | 175,365 | 10,090,502 | ||||||
McDonald's Corporation | 56,170 | 6,479,771 | ||||||
Ralph Lauren Corporation - Class A | 73,509 | 7,434,700 | ||||||
Six Flags Entertainment Corporation | 110,265 | 5,911,307 | ||||||
Time Warner, Inc. | 126,770 | 10,092,160 | ||||||
Whirlpool Corporation | 42,880 | 6,953,421 | ||||||
Williams-Sonoma, Inc. | 138,715 | 7,085,562 | ||||||
61,103,133 | ||||||||
Consumer Staples — 16.0% | ||||||||
Altria Group, Inc. | 113,976 | 7,206,703 | ||||||
Anheuser-Busch InBev SA/NV - ADR | 67,485 | 8,868,204 | ||||||
Archer-Daniels-Midland Company | 170,585 | 7,193,570 | ||||||
Coca-Cola Company (The) | 238,595 | 10,097,340 | ||||||
Diageo plc - ADR | 110,885 | 12,867,095 | ||||||
Kroger Company (The) | 230,100 | 6,829,368 | ||||||
PepsiCo, Inc. | 91,885 | 9,994,332 | ||||||
Philip Morris International, Inc. | 75,520 | 7,342,054 | ||||||
Procter & Gamble Company (The) | 120,335 | 10,800,066 | ||||||
81,198,732 | ||||||||
Energy — 6.4% | ||||||||
Chevron Corporation | 65,101 | 6,700,195 | ||||||
Exxon Mobil Corporation | 81,710 | 7,131,649 | ||||||
Occidental Petroleum Corporation | 138,920 | 10,130,046 | ||||||
Spectra Energy Corporation | 203,395 | 8,695,136 | ||||||
32,657,026 | ||||||||
Financials — 17.8% | ||||||||
Capital One Financial Corporation | 205,890 | 14,789,079 | ||||||
Citigroup, Inc. | 239,840 | 11,327,643 | ||||||
FNF Group | 414,060 | 15,282,955 | ||||||
JPMorgan Chase & Company | 208,175 | 13,862,373 | ||||||
Markel Corporation (a) | 16,065 | 14,920,690 | ||||||
Regions Financial Corporation | 951,885 | 9,395,105 | ||||||
Wells Fargo & Company | 239,115 | 10,588,012 | ||||||
90,165,857 | ||||||||
Health Care — 7.4% | ||||||||
Johnson & Johnson | 143,590 | 16,962,287 | ||||||
Merck & Company, Inc. | 216,380 | 13,504,276 | ||||||
Sanofi - ADR | 188,965 | 7,216,573 | ||||||
37,683,136 | ||||||||
Industrials — 13.8% | ||||||||
3M Company | 57,730 | 10,173,758 | ||||||
Boeing Company (The) | 56,690 | 7,468,341 | ||||||
25
DAVENPORT VALUE & INCOME FUND |
COMMON STOCKS — 96.3%(Continued) | Shares | Value | ||||||
Industrials — 13.8% (Continued) | ||||||||
Eaton Corporation plc | 119,607 | $ | 7,859,376 | |||||
General Electric Company | 409,495 | 12,129,242 | ||||||
Illinois Tool Works, Inc. | 77,145 | 9,245,057 | ||||||
Raytheon Company | 66,966 | 9,116,081 | ||||||
Watsco, Inc. | 99,880 | 14,073,092 | ||||||
70,064,947 | ||||||||
Information Technology — 3.5% | ||||||||
Cisco Systems, Inc. | 264,965 | 8,404,689 | ||||||
Microsoft Corporation | 163,733 | 9,431,021 | ||||||
17,835,710 | ||||||||
Materials — 4.6% | ||||||||
International Paper Company | 189,070 | 9,071,579 | ||||||
Nucor Corporation | 127,395 | 6,299,683 | ||||||
Potash Corporation of Saskatchewan, Inc. | 490,995 | 8,013,038 | ||||||
23,384,300 | ||||||||
Real Estate — 9.7% | ||||||||
Equity LifeStyle Properties, Inc. | 96,040 | 7,412,367 | ||||||
Gaming and Leisure Properties, Inc. | 337,519 | 11,290,010 | ||||||
Lamar Advertising Company - Class A | 173,390 | 11,324,101 | ||||||
Sun Communities, Inc. | 104,760 | 8,221,565 | ||||||
W.P. Carey, Inc. | 172,454 | 11,128,457 | ||||||
49,376,500 | ||||||||
Telecommunication Services — 3.3% | ||||||||
AT&T, Inc. | 184,395 | 7,488,281 | ||||||
Verizon Communications, Inc. | 173,910 | 9,039,842 | ||||||
16,528,123 | ||||||||
Utilities — 1.8% | ||||||||
Dominion Resources, Inc. | 122,825 | 9,122,213 | ||||||
Total Common Stocks (Cost $420,895,539) | $ | 489,119,677 | ||||||
26
DAVENPORT VALUE & INCOME FUND |
MONEY MARKET FUNDS — 3.5% | Shares | Value | ||||||
First American Treasury Obligations Fund - Class Z, 0.23% (b) (Cost $17,560,886) | 17,560,886 | $ | 17,560,886 | |||||
Total Investments at Value — 99.8% (Cost $438,456,425) | $ | 506,680,563 | ||||||
Other Assets in Excess of Liabilities — 0.2% | 1,172,629 | |||||||
Net Assets — 100.0% | $ | 507,853,192 | ||||||
ADR - American Depositary Receipt.
(a) | Non-income producing security. |
(b) | The rate shown is the 7-day effective yield as of September 30, 2016. |
See accompanying notes to financial statements.
27
DAVENPORT EQUITY OPPORTUNITIES FUND |
COMMON STOCKS — 95.7% | Shares | Value | ||||||
Consumer Discretionary — 35.1% | ||||||||
CarMax, Inc. (a) | 310,535 | $ | 16,567,042 | |||||
Discovery Communications, Inc. - Series C (a) | 534,000 | 14,049,540 | ||||||
Dish Network Corporation - Class A (a) | 125,695 | 6,885,572 | ||||||
Dollar Tree, Inc. (a) | 190,991 | 15,074,920 | ||||||
Hanesbrands, Inc. | 455,630 | 11,504,658 | ||||||
Liberty Broadband Corporation - Series C (a) | 188,140 | 13,448,247 | ||||||
Live Nation Entertainment, Inc. (a) | 617,514 | 16,969,285 | ||||||
LKQ Corporation (a) | 333,316 | 11,819,385 | ||||||
TripAdvisor, Inc. (a) | 195,180 | 12,331,472 | ||||||
118,650,121 | ||||||||
Consumer Staples — 3.6% | ||||||||
Church & Dwight Company, Inc. | 255,080 | 12,223,433 | ||||||
Financials — 23.4% | ||||||||
Brookfield Asset Management, Inc. - Class A | 496,297 | 17,459,728 | ||||||
Capital One Financial Corporation | 256,779 | 18,444,436 | ||||||
Fairfax Financial Holdings Ltd. | 19,718 | 11,557,903 | ||||||
FNF Group | 260,305 | 9,607,858 | ||||||
Markel Corporation (a) | 15,695 | 14,577,045 | ||||||
PRA Group, Inc. (a) | 212,308 | 7,333,118 | ||||||
78,980,088 | ||||||||
Health Care — 4.5% | ||||||||
Henry Schein, Inc. (a) | 50,685 | 8,260,641 | ||||||
Zoetis, Inc. - Class A | 130,680 | 6,796,667 | ||||||
15,057,308 | ||||||||
Industrials — 14.7% | ||||||||
Colfax Corporation (a) | 549,221 | 17,262,016 | ||||||
Genesee & Wyoming, Inc. - Class A (a) | 139,035 | 9,586,463 | ||||||
WABCO Holdings, Inc. | 137,555 | 15,616,619 | ||||||
Watsco, Inc. | 50,820 | 7,160,538 | ||||||
49,625,636 | ||||||||
Information Technology — 3.4% | ||||||||
Intuit, Inc. | 105,665 | 11,624,207 | ||||||
Materials — 2.7% | ||||||||
Sherwin-Williams Company (The) | 33,605 | 9,297,159 | ||||||
Real Estate — 8.3% | ||||||||
American Tower Corporation | 146,970 | 16,656,110 | ||||||
Gaming and Leisure Properties, Inc. | 339,070 | 11,341,892 | ||||||
27,998,002 | ||||||||
Total Common Stocks (Cost $292,332,124) | $ | 323,455,954 | ||||||
28
DAVENPORT EQUITY OPPORTUNITIES FUND |
MONEY MARKET FUNDS — 3.3% | Shares | Value | ||||||
First American Treasury Obligations Fund - Class Z, 0.23% (b) (Cost $11,082,843) | 11,082,843 | $ | 11,082,843 | |||||
Total Investments at Value — 99.0% (Cost $303,414,967) | $ | 334,538,797 | ||||||
Other Assets in Excess of Liabilities — 1.0% | 3,330,616 | |||||||
Net Assets — 100.0% | $ | 337,869,413 | ||||||
(a) | Non-income producing security. |
(b) | The rate shown is the 7-day effective yield as of September 30, 2016. |
See accompanying notes to financial statements.
29
DAVENPORT SMALL CAP FOCUS FUND |
COMMON STOCKS — 94.2% | Shares | Value | ||||||
Consumer Discretionary — 25.4% | ||||||||
Cable One, Inc. | 1,500 | $ | 876,000 | |||||
Core-Mark Holding Company, Inc. | 26,142 | 935,883 | ||||||
Eldorado Resorts, Inc. (a) | 73,310 | 1,030,739 | ||||||
Isle of Capri Casinos, Inc. (a) | 40,000 | 891,200 | ||||||
Liberty Broadband Corporation - Series C (a) | 21,918 | 1,566,699 | ||||||
Liberty TripAdvisor Holdings, Inc. - Series A (a) | 70,500 | 1,540,425 | ||||||
Live Nation Entertainment, Inc. (a) | 62,179 | 1,708,679 | ||||||
Monarch Casino & Resort, Inc. (a) | 100,425 | 2,527,697 | ||||||
Pool Corporation | 11,457 | 1,082,916 | ||||||
Unifi, Inc. (a) | 27,607 | 812,474 | ||||||
12,972,712 | ||||||||
Consumer Staples — 9.1% | ||||||||
Boston Beer Company, Inc. (The) - Class A (a) | 12,000 | 1,863,120 | ||||||
Seaboard Corporation (a) | 458 | 1,575,520 | ||||||
Snyder's-Lance, Inc. | 35,617 | 1,196,019 | ||||||
4,634,659 | ||||||||
Energy — 2.3% | ||||||||
CNX Coal Resources, L.P. | 61,400 | 951,700 | ||||||
Navigator Holdings Ltd. (a) | 30,000 | 215,700 | ||||||
1,167,400 | ||||||||
Financials — 15.7% | ||||||||
Cohen & Steers, Inc. | 17,500 | 748,125 | ||||||
Diamond Hill Investment Group, Inc. - Class A | 6,044 | 1,116,870 | ||||||
Encore Capital Group, Inc. (a) | 37,579 | 844,776 | ||||||
Kinsale Capital Group, Inc. | 18,220 | 400,840 | ||||||
PRA Group, Inc. (a) | 24,302 | 839,391 | ||||||
Raymond James Financial, Inc. | 18,000 | 1,047,780 | ||||||
Stewart Information Services Corporation | 33,029 | 1,468,139 | ||||||
TowneBank | 65,359 | 1,570,577 | ||||||
8,036,498 | ||||||||
Health Care — 7.3% | ||||||||
Heska Corporation (a) | 10,000 | 544,300 | ||||||
VCA, Inc. (a) | 25,155 | 1,760,347 | ||||||
VWR Corporation (a) | 49,361 | 1,399,878 | ||||||
3,704,525 | ||||||||
Industrials — 19.4% | ||||||||
AMERCO | 2,000 | 648,460 | ||||||
American Woodmark Corporation (a) | 10,000 | 805,700 | ||||||
Colfax Corporation (a) | 57,514 | 1,807,665 | ||||||
Covenant Transportation Group, Inc. - Class A (a) | 39,057 | 754,972 | ||||||
Genesee & Wyoming, Inc. - Class A (a) | 20,870 | 1,438,986 | ||||||
Marten Transport Ltd. | 50,178 | 1,053,738 | ||||||
Mistras Group, Inc. (a) | 56,133 | 1,317,442 | ||||||
30
DAVENPORT SMALL CAP FOCUS FUND |
COMMON STOCKS — 94.2%(Continued) | Shares | Value | ||||||
Industrials — 19.4%(Continued) | ||||||||
On Assignment, Inc. (a) | 20,000 | $ | 725,800 | |||||
Watsco, Inc. | 9,558 | 1,346,722 | ||||||
9,899,485 | ||||||||
Information Technology — 2.5% | ||||||||
Black Knight Financial Services, Inc. - Class A (a) | 31,000 | 1,267,900 | ||||||
Materials — 5.2% | ||||||||
FMC Corporation | 25,000 | 1,208,500 | ||||||
Fortuna Silver Mines, Inc. (a) | 100,580 | 728,199 | ||||||
NewMarket Corporation | 1,636 | 702,368 | ||||||
2,639,067 | ||||||||
Real Estate — 7.3% | ||||||||
FRP Holdings, Inc. (a) | 21,893 | 680,215 | ||||||
Gaming and Leisure Properties, Inc. | 20,198 | 675,623 | ||||||
Lamar Advertising Company - Class A | 16,500 | 1,077,615 | ||||||
Outfront Media, Inc. | 54,289 | 1,283,935 | ||||||
3,717,388 | ||||||||
Total Common Stocks (Cost $43,709,266) | $ | 48,039,634 | ||||||
MONEY MARKET FUNDS — 6.2% | Shares | Value | ||||||
First American Treasury Obligations Fund - Class Z, 0.23% (b) (Cost $3,153,282) | 3,153,282 | $ | 3,153,282 | |||||
Total Investments at Value — 100.4% (Cost $46,862,548) | $ | 51,192,916 | ||||||
Liabilities in Excess of Other Assets — (0.4%) | (213,667 | ) | ||||||
Net Assets — 100.0% | $ | 50,979,249 | ||||||
(a) | Non-income producing security. |
(b) | The rate shown is the 7-day effective yield as of September 30, 2016. |
See accompanying notes to financial statements.
31
DAVENPORT BALANCED INCOME FUND |
COMMON STOCKS — 60.9% | Shares | Value | ||||||
Consumer Discretionary — 7.1% | ||||||||
Carnival Corporation | 7,960 | $ | 388,607 | |||||
Las Vegas Sands Corporation | 9,655 | 555,549 | ||||||
McDonald's Corporation | 3,090 | 356,462 | ||||||
Ralph Lauren Corporation - Class A | 4,045 | 409,111 | ||||||
Six Flags Entertainment Corporation | 6,075 | 325,681 | ||||||
Time Warner, Inc. | 6,985 | 556,076 | ||||||
Whirlpool Corporation | 2,365 | 383,508 | ||||||
Williams-Sonoma, Inc. | 7,645 | 390,507 | ||||||
3,365,501 | ||||||||
Consumer Staples — 9.6% | ||||||||
Altria Group, Inc. | 6,585 | 416,370 | ||||||
Anheuser-Busch InBev SA/NV - ADR | 3,715 | 488,188 | ||||||
Archer-Daniels-Midland Company | 9,390 | 395,976 | ||||||
Coca-Cola Company (The) | 13,135 | 555,873 | ||||||
Diageo plc - ADR | 6,105 | 708,424 | ||||||
Kroger Company (The) | 12,750 | 378,420 | ||||||
PepsiCo, Inc. | 5,060 | 550,376 | ||||||
Philip Morris International, Inc. | 4,680 | 454,990 | ||||||
Procter & Gamble Company (The) | 6,630 | 595,043 | ||||||
4,543,660 | ||||||||
Energy — 4.8% | ||||||||
Alliance Resource Partners, L.P. | 19,870 | 440,716 | ||||||
Chevron Corporation | 3,580 | 368,453 | ||||||
Exxon Mobil Corporation | 4,495 | 392,324 | ||||||
Occidental Petroleum Corporation | 7,655 | 558,203 | ||||||
Spectra Energy Corporation | 11,205 | 479,014 | ||||||
2,238,710 | ||||||||
Financials — 11.4% | ||||||||
Capital One Financial Corporation | 11,340 | 814,552 | ||||||
Citigroup, Inc. | 13,200 | 623,436 | ||||||
FNF Group | 22,805 | 841,733 | ||||||
JPMorgan Chase & Company | 11,470 | 763,787 | ||||||
Lazard Ltd. - Class A | 11,855 | 431,048 | ||||||
Markel Corporation (a) | 887 | 823,819 | ||||||
Regions Financial Corporation | 52,425 | 517,435 | ||||||
Wells Fargo & Company | 13,165 | 582,946 | ||||||
5,398,756 | ||||||||
Health Care — 4.4% | ||||||||
Johnson & Johnson | 7,905 | 933,818 | ||||||
Merck & Company, Inc. | 11,905 | 742,991 | ||||||
Sanofi - ADR | 10,405 | 397,367 | ||||||
2,074,176 | ||||||||
32
DAVENPORT BALANCED INCOME FUND |
COMMON STOCKS — 60.9% (Continued) | Shares | Value | ||||||
Industrials — 8.2% | ||||||||
3M Company | 3,175 | $ | 559,530 | |||||
Boeing Company (The) | 3,115 | 410,370 | ||||||
Eaton Corporation plc | 6,590 | 433,029 | ||||||
General Electric Company | 22,550 | 667,931 | ||||||
Illinois Tool Works, Inc. | 4,250 | 509,320 | ||||||
Raytheon Company | 3,680 | 500,958 | ||||||
Watsco, Inc. | 5,505 | 775,655 | ||||||
3,856,793 | ||||||||
Information Technology — 2.1% | ||||||||
Cisco Systems, Inc. | 14,585 | 462,636 | ||||||
Microsoft Corporation | 9,015 | 519,264 | ||||||
981,900 | ||||||||
Materials — 2.7% | ||||||||
International Paper Company | 10,415 | 499,712 | ||||||
Nucor Corporation | 7,015 | 346,892 | ||||||
Potash Corporation of Saskatchewan, Inc. | 27,035 | 441,211 | ||||||
1,287,815 | ||||||||
Real Estate — 6.7% | ||||||||
Equity Lifestyle Properties, Inc. | 5,290 | 408,282 | ||||||
Gaming and Leisure Properties, Inc. | 18,585 | 621,668 | ||||||
Lamar Advertising Company - Class A | 9,545 | 623,384 | ||||||
Outfront Media, Inc. | 18,745 | 443,319 | ||||||
Sun Communities, Inc. | 5,770 | 452,830 | ||||||
W.P. Carey, Inc. | 9,490 | 612,390 | ||||||
3,161,873 | ||||||||
Telecommunication Services — 1.9% | ||||||||
AT&T, Inc. | 10,155 | 412,394 | ||||||
Verizon Communications, Inc. | 9,570 | 497,449 | ||||||
909,843 | ||||||||
Utilities — 2.0% | ||||||||
Brookfield Renewable Partners, L.P. | 13,695 | 421,258 | ||||||
Dominion Resources, Inc. | 6,770 | 502,808 | ||||||
924,066 | ||||||||
Total Common Stocks (Cost $27,304,688) | $ | 28,743,093 | ||||||
33
DAVENPORT BALANCED INCOME FUND |
FIXED RATE CORPORATE BONDS — 27.8% | Par Value | Value | ||||||
Consumer Discretionary — 2.5% | ||||||||
Amazon.com, Inc., 3.30%, due 12/05/2021 | $ | 600,000 | $ | 643,371 | ||||
Home Depot, Inc. (The), 4.40%, due 04/01/2046 | 500,000 | 556,990 | ||||||
1,200,361 | ||||||||
Consumer Staples — 8.2% | ||||||||
Altria Group, Inc., 4.75%, due 05/05/2021 | 600,000 | 678,214 | ||||||
CVS Health Corporation, 3.875%, due 07/20/2025 | 600,000 | 653,171 | ||||||
J.M. Smucker Company (The), 3.50%, due 10/15/2021 | 700,000 | 752,206 | ||||||
PepsiCo, Inc., 2.75%, due 03/05/2022 | 750,000 | 790,201 | ||||||
Sysco Corporation, 2.60%, due 10/01/2020 | 950,000 | 978,007 | ||||||
3,851,799 | ||||||||
Financials — 6.1% | ||||||||
Bank of America Corporation, 2.65%, due 04/01/2019 | 50,000 | 51,093 | ||||||
BlackRock, Inc., 3.50%, due 03/18/2024 | 500,000 | 546,721 | ||||||
Citigroup, Inc., 1.35%, due 03/10/2017 | 200,000 | 200,121 | ||||||
General Electric Capital Corporation, 4.65%, due 10/17/2021 | 500,000 | 569,658 | ||||||
Goldman Sachs Group, Inc., 2.90%, due 07/19/2018 | 700,000 | 716,584 | ||||||
Morgan Stanley, 2.125%, due 04/25/2018 | 675,000 | 680,673 | ||||||
Suntrust Banks, Inc., 3.50%, due 01/20/2017 | 100,000 | 100,507 | ||||||
2,865,357 | ||||||||
Health Care — 2.6% | ||||||||
Becton Dickinson & Company, 3.25%, due 11/12/2020 | 500,000 | 525,637 | ||||||
Express Scripts Holding Company, 3.00%, due 07/15/2023 | 675,000 | 685,592 | ||||||
1,211,229 | ||||||||
Industrials — 3.1% | ||||||||
Burlington Northern Santa Fe, LLC, 4.70%, due 10/01/2019 | 350,000 | 384,649 | ||||||
Deere & Company, 4.375%, due 10/16/2019 | 500,000 | 544,465 | ||||||
United Technologies Corporation, 4.50%, due 04/15/2020 | 500,000 | 552,712 | ||||||
1,481,826 | ||||||||
Information Technology — 2.5% | ||||||||
Apple, Inc., 3.20%, due 05/13/2025 | 500,000 | 532,918 | ||||||
Oracle Corporation, 3.625%, due 07/15/2023 | 600,000 | 651,554 | ||||||
1,184,472 | ||||||||
Telecommunication Services — 2.8% | ||||||||
AT&T, Inc., 2.30%, due 03/11/2019 | 600,000 | 610,072 | ||||||
Verizon Communications, Inc., | ||||||||
3.00%, due 11/1/2021 | 500,000 | 523,176 | ||||||
3.50%, due 11/1/2021 | 200,000 | 214,708 | ||||||
1,347,956 | ||||||||
Total Fixed Rate Corporate Bonds (Cost $13,023,601) | $ | 13,143,000 | ||||||
34
DAVENPORT BALANCED INCOME FUND |
VARIABLE RATE CORPORATE BONDS (b)— 7.2% | Par Value | Value | ||||||
Financials — 5.2% | ||||||||
American Express Credit Corporation, 1.557%, due 11/05/2018 | $ | 250,000 | $ | 251,618 | ||||
Bank of America Corporation, 1.435%, due 08/25/2017 | 189,000 | 189,210 | ||||||
Bank of New York Mellon, 1.316%, due 08/01/2018 | 400,000 | 401,610 | ||||||
Citigroup, Inc., 1.385%, due 03/10/2017 | 200,000 | 200,176 | ||||||
JPMorgan Chase & Company, 1.614%, due 01/25/2018 | 600,000 | 602,981 | ||||||
Royal Bank of Canada, 1.291%, due 07/30/2018 | 471,000 | 472,048 | ||||||
Wells Fargo & Company, 1.843%, due 12/07/2020 | 325,000 | 326,680 | ||||||
2,444,323 | ||||||||
Health Care — 0.7% | ||||||||
Amgen, Inc., 1.411%, due 05/22/2019 | 300,000 | 300,361 | ||||||
Information Technology — 0.9% | ||||||||
Cisco Systems, Inc., 1.197%, due 09/20/2019 | 435,000 | 435,318 | ||||||
Telecommunication Services — 0.4% | ||||||||
Verizon Communications, Inc., 2.606%, due 09/14/2018 | 200,000 | 205,253 | ||||||
Total Variable Rate Corporate Bonds (Cost $3,376,459) | $ | 3,385,255 | ||||||
MONEY MARKET FUNDS — 3.2% | Shares | Value | ||||||
First American Treasury Obligations Fund - Class Z, 0.23% (c) (Cost $1,502,244) | 1,502,244 | $ | 1,502,244 | |||||
Total Investments at Value — 99.1% (Cost $45,206,992) | $ | 46,773,592 | ||||||
Other Assets in Excess of Liabilities — 0.9% | 447,387 | |||||||
Net Assets — 100.0% | $ | 47,220,979 | ||||||
ADR - American Depositary Receipt.
(a) | Non-income producing security. |
(b) | Variable rate securities. The rates shown are the effective interest rates as of September 30, 2016. |
(c) | The rate shown is the 7-day effective yield as of September 30, 2016. |
See accompanying notes to financial statements.
35
THE DAVENPORT FUNDS |
Davenport Core | Davenport Value & Income Fund | Davenport Equity Opportunities Fund | ||||||||||
ASSETS | ||||||||||||
Investments in securities: | ||||||||||||
At acquisition cost | $ | 264,588,796 | $ | 438,456,425 | $ | 303,414,967 | ||||||
At market value (Note 2) | $ | 362,266,563 | $ | 506,680,563 | $ | 334,538,797 | ||||||
Cash | 38,115 | — | 54,841 | |||||||||
Dividends receivable | 251,465 | 1,252,140 | 83,826 | |||||||||
Receivable for investment securities sold | 5,107,549 | — | 3,243,241 | |||||||||
Receivable for capital shares sold | 402,640 | 611,665 | 434,919 | |||||||||
Other assets | 22,218 | 25,788 | 22,785 | |||||||||
TOTAL ASSETS | 368,088,550 | 508,570,156 | 338,378,409 | |||||||||
LIABILITIES | ||||||||||||
Payable for investment securities purchased | 5,460,041 | — | — | |||||||||
Payable for capital shares redeemed | 293,916 | 334,275 | 247,904 | |||||||||
Accrued investment advisory fees (Note 4) | 221,380 | 310,611 | 205,450 | |||||||||
Payable to administrator (Note 4) | 36,900 | 48,850 | 36,250 | |||||||||
Other accrued expenses and liabilities | 18,760 | 23,228 | 19,392 | |||||||||
TOTAL LIABILITIES | 6,030,997 | 716,964 | 508,996 | |||||||||
NET ASSETS | $ | 362,057,553 | $ | 507,853,192 | $ | 337,869,413 | ||||||
Net assets consist of: | ||||||||||||
Paid-in capital | $ | 259,517,229 | $ | 438,222,757 | $ | 314,394,367 | ||||||
Accumulated net investment income | 310,006 | 594,249 | 204,476 | |||||||||
Accumulated net realized gains (losses) from security transactions | 4,552,551 | 812,048 | (7,853,260 | ) | ||||||||
Net unrealized appreciation on investments | 97,677,767 | 68,224,138 | 31,123,830 | |||||||||
Net assets | $ | 362,057,553 | $ | 507,853,192 | $ | 337,869,413 | ||||||
Shares of beneficial interest outstanding (unlimited number of shares authorized, $0.01 par value) | 18,341,244 | 33,687,026 | 22,330,476 | |||||||||
Net asset value, offering price and redemption price per share (Note 2) | $ | 19.74 | $ | 15.08 | $ | 15.13 | ||||||
See accompanying notes to financial statements.
36
THE DAVENPORT FUNDS |
Davenport Small Cap Focus | Davenport Balanced Income | |||||||
ASSETS | ||||||||
Investments in securities: | ||||||||
At acquisition cost | $ | 46,862,548 | $ | 45,206,992 | ||||
At market value (Note 2) | $ | 51,192,916 | $ | 46,773,592 | ||||
Cash | — | 4,556 | ||||||
Dividends and interest receivable | 19,355 | 213,825 | ||||||
Receivable for capital shares sold | 359,628 | 256,520 | ||||||
Other assets | 16,215 | 18,527 | ||||||
TOTAL ASSETS | 51,588,114 | 47,267,020 | ||||||
LIABILITIES | ||||||||
Payable for investment securities purchased | 551,330 | — | ||||||
Payable for capital shares redeemed | 13,082 | 18,523 | ||||||
Accrued investment advisory fees (Note 4) | 30,542 | 15,518 | ||||||
Payable to administrator (Note 4) | 7,000 | 5,550 | ||||||
Other accrued expenses | 6,911 | 6,450 | ||||||
TOTAL LIABILITIES | 608,865 | 46,041 | ||||||
NET ASSETS | $ | 50,979,249 | $ | 47,220,979 | ||||
Net assets consist of: | ||||||||
Paid-in capital | $ | 48,720,930 | $ | 45,621,545 | ||||
Accumulated net investment income (loss) | (108,008 | ) | 33,637 | |||||
Accumulated net realized losses from security transactions | (1,964,041 | ) | (803 | ) | ||||
Net unrealized appreciation on investments | 4,330,368 | 1,566,600 | ||||||
Net assets | $ | 50,979,249 | $ | 47,220,979 | ||||
Shares of beneficial interest outstanding (unlimited number of shares authorized, $0.01 par value) | 4,786,712 | 4,451,776 | ||||||
Net asset value, offering price and redemption price per share (Note 2) | $ | 10.65 | $ | 10.61 | ||||
See accompanying notes to financial statements.
37
THE DAVENPORT FUNDS |
Davenport | Davenport Value & Income | Davenport Equity Opportunities Fund | ||||||||||
INVESTMENT INCOME | ||||||||||||
Dividends | $ | 2,994,906 | $ | 7,705,447 | $ | 1,837,915 | ||||||
Foreign withholding taxes on dividends | (151,211 | ) | (143,893 | ) | (51,199 | ) | ||||||
TOTAL INVESTMENT INCOME | 2,843,695 | 7,561,554 | 1,786,716 | |||||||||
EXPENSES | ||||||||||||
Investment advisory fees (Note 4) | 1,312,986 | 1,810,771 | 1,221,624 | |||||||||
Administration fees (Note 4) | 208,176 | 271,361 | 204,975 | |||||||||
Custodian and bank service fees | 13,039 | 18,332 | 11,739 | |||||||||
Compliance service fees (Note 4) | 12,328 | 16,278 | 11,775 | |||||||||
Registration and filing fees | 12,253 | 14,390 | 12,045 | |||||||||
Professional fees | 9,111 | 9,111 | 9,111 | |||||||||
Insurance expense | 5,440 | 7,087 | 5,142 | |||||||||
Trustees’ fees and expenses (Note 4) | 5,472 | 5,472 | 5,472 | |||||||||
Postage and supplies | 4,199 | 4,769 | 5,297 | |||||||||
Printing of shareholder reports | 4,294 | 5,206 | 4,564 | |||||||||
Other expenses | 17,484 | 18,039 | 17,673 | |||||||||
TOTAL EXPENSES | 1,604,782 | 2,180,816 | 1,509,417 | |||||||||
NET INVESTMENT INCOME | 1,238,913 | 5,380,738 | 277,299 | |||||||||
REALIZED AND UNREALIZED GAINS (LOSSES) ON INVESTMENTS | ||||||||||||
Net realized gains (losses) from security transactions | 4,565,195 | 7,064,491 | (7,092,032 | ) | ||||||||
Net change in unrealized appreciation (depreciation) on investments | 17,059,560 | 14,509,577 | 19,898,809 | |||||||||
NET REALIZED AND UNREALIZED GAINS ON INVESTMENTS | 21,624,755 | 21,574,068 | 12,806,777 | |||||||||
NET INCREASE IN NET ASSETS FROM OPERATIONS | $ | 22,863,668 | $ | 26,954,806 | $ | 13,084,076 | ||||||
See accompanying notes to financial statements.
38
THE DAVENPORT FUNDS |
Davenport Small Cap Focus | Davenport Balanced Income | |||||||
INVESTMENT INCOME | ||||||||
Dividends | $ | 265,161 | $ | 347,977 | ||||
Foreign withholding taxes on dividends | (1,606 | ) | (6,339 | ) | ||||
Interest | — | 115,925 | ||||||
TOTAL INVESTMENT INCOME | 263,555 | 457,563 | ||||||
EXPENSES | ||||||||
Investment advisory fees (Note 4) | 170,460 | 138,472 | (a) | |||||
Administration fees (Note 4) | 35,939 | 30,000 | ||||||
Registration and filing fees | 9,693 | 11,117 | ||||||
Professional fees | 9,251 | 9,861 | ||||||
Trustees’ fees and expenses (Note 4) | 5,472 | 5,472 | ||||||
Custodian and bank service fees | 2,897 | 5,902 | ||||||
Compliance service fees (Note 4) | 3,494 | 3,116 | ||||||
Printing of shareholder reports | 1,665 | 1,374 | ||||||
Postage and supplies | 1,523 | 964 | ||||||
Insurance expense | 826 | 421 | ||||||
Other expenses | 7,871 | 4,153 | ||||||
TOTAL EXPENSES | 249,091 | 210,852 | ||||||
NET INVESTMENT INCOME | 14,464 | 246,711 | ||||||
REALIZED AND UNREALIZED GAINS | ||||||||
Net realized gains from security transactions | 562,191 | 13,458 | ||||||
Net change in unrealized appreciation (depreciation) on investments | 5,263,809 | 934,063 | ||||||
NET REALIZED AND UNREALIZED GAINS ON INVESTMENTS | 5,826,000 | 947,521 | ||||||
NET INCREASE IN NET ASSETS FROM OPERATIONS | $ | 5,840,464 | $ | 1,194,232 | ||||
(a) | Includes previous investment advisory fee reductions recouped by the Adviser of $11,128 (Note 4). |
See accompanying notes to financial statements.
39
DAVENPORT CORE FUND |
Six Months | Year | |||||||
FROM OPERATIONS | ||||||||
Net investment income | $ | 1,238,913 | $ | 1,874,569 | ||||
Net realized gains from security transactions | 4,565,195 | 9,641,359 | ||||||
Net change in unrealized appreciation (depreciation) on investments | 17,059,560 | (19,512,860 | ) | |||||
Net increase (decrease) in net assets from operations | 22,863,668 | (7,996,932 | ) | |||||
DISTRIBUTIONS TO SHAREHOLDERS (Note 2) | ||||||||
From net investment income | (950,837 | ) | (1,852,639 | ) | ||||
From net realized gains from security transactions | (4,339,995 | ) | (11,534,728 | ) | ||||
Decrease in net assets from distributions to shareholders | (5,290,832 | ) | (13,387,367 | ) | ||||
FROM CAPITAL SHARE TRANSACTIONS | ||||||||
Proceeds from shares sold | 15,868,777 | 43,745,136 | ||||||
Net asset value of shares issued in reinvestment of distributions to shareholders | 5,101,637 | 12,948,950 | ||||||
Payments for shares redeemed | (13,715,148 | ) | (28,766,990 | ) | ||||
Net increase in net assets from capital share transactions | 7,255,266 | 27,927,096 | ||||||
TOTAL INCREASE IN NET ASSETS | 24,828,102 | 6,542,797 | ||||||
NET ASSETS | ||||||||
Beginning of period | 337,229,451 | 330,686,654 | ||||||
End of period | $ | 362,057,553 | $ | 337,229,451 | ||||
ACCUMULATED NET INVESTMENT INCOME | $ | 310,006 | $ | 21,930 | ||||
CAPITAL SHARE ACTIVITY | ||||||||
Shares sold | 825,729 | 2,282,460 | ||||||
Shares reinvested | 273,620 | 661,768 | ||||||
Shares redeemed | (712,670 | ) | (1,508,906 | ) | ||||
Net increase in shares outstanding | 386,679 | 1,435,322 | ||||||
Shares outstanding at beginning of period | 17,954,565 | 16,519,243 | ||||||
Shares outstanding at end of period | 18,341,244 | 17,954,565 | ||||||
See accompanying notes to financial statements.
40
DAVENPORT VALUE & INCOME FUND |
Six Months | Year | |||||||
FROM OPERATIONS | ||||||||
Net investment income | $ | 5,380,738 | $ | 8,601,669 | ||||
Net realized gains from security transactions | 7,064,491 | 2,292,583 | ||||||
Net change in unrealized appreciation (depreciation) on investments | 14,509,577 | (12,356,435 | ) | |||||
Net increase (decrease) in net assets from operations | 26,954,806 | (1,462,183 | ) | |||||
DISTRIBUTIONS TO SHAREHOLDERS (Note 2) | ||||||||
From net investment income | (5,239,187 | ) | (8,403,091 | ) | ||||
From net realized gains from security transactions | — | (19,689,392 | ) | |||||
Decrease in net assets from distributions to shareholders | (5,239,187 | ) | (28,092,483 | ) | ||||
FROM CAPITAL SHARE TRANSACTIONS | ||||||||
Proceeds from shares sold | 48,884,582 | 86,973,081 | ||||||
Net asset value of shares issued in reinvestment of distributions to shareholders | 4,696,699 | 25,982,187 | ||||||
Payments for shares redeemed | (17,890,649 | ) | (40,730,457 | ) | ||||
Net increase in net assets from capital share transactions | 35,690,632 | 72,224,811 | ||||||
TOTAL INCREASE IN NET ASSETS | 57,406,251 | 42,670,145 | ||||||
NET ASSETS | ||||||||
Beginning of period | 450,446,941 | 407,776,796 | ||||||
End of period | $ | 507,853,192 | $ | 450,446,941 | ||||
ACCUMULATED NET INVESTMENT INCOME | $ | 594,249 | $ | 452,698 | ||||
CAPITAL SHARE ACTIVITY | ||||||||
Shares sold | 3,287,748 | 5,971,001 | ||||||
Shares reinvested | 318,160 | 1,775,907 | ||||||
Shares redeemed | (1,203,793 | ) | (2,844,498 | ) | ||||
Net increase in shares outstanding | 2,402,115 | 4,902,410 | ||||||
Shares outstanding at beginning of period | 31,284,911 | 26,382,501 | ||||||
Shares outstanding at end of period | 33,687,026 | 31,284,911 | ||||||
See accompanying notes to financial statements.
41
DAVENPORT EQUITY OPPORTUNITIES FUND |
Six Months | Year | |||||||
FROM OPERATIONS | ||||||||
Net investment income | $ | 277,299 | $ | 56,576 | ||||
Net realized gains (losses) from security transactions | (7,092,032 | ) | 11,981,326 | |||||
Net change in unrealized appreciation (depreciation) on investments | 19,898,809 | (35,252,070 | ) | |||||
Net increase (decrease) in net assets from operations | 13,084,076 | (23,214,168 | ) | |||||
DISTRIBUTIONS TO SHAREHOLDERS (Note 2) | ||||||||
From net investment income | — | (129,343 | ) | |||||
From net realized gains from security transactions | (4,091,481 | ) | (14,359,968 | ) | ||||
Decrease in net assets from distributions to shareholders | (4,091,481 | ) | (14,489,311 | ) | ||||
FROM CAPITAL SHARE TRANSACTIONS | ||||||||
Proceeds from shares sold | 23,097,549 | 94,157,195 | ||||||
Net asset value of shares issued in reinvestment of distributions to shareholders | 3,934,296 | 13,877,514 | ||||||
Payments for shares redeemed | (14,943,053 | ) | (31,246,686 | ) | ||||
Net increase in net assets from capital share transactions | 12,088,792 | 76,788,023 | ||||||
TOTAL INCREASE IN NET ASSETS | 21,081,387 | 39,084,544 | ||||||
NET ASSETS | ||||||||
Beginning of period | 316,788,026 | 277,703,482 | ||||||
End of period | $ | 337,869,413 | $ | 316,788,026 | ||||
ACCUMULATED (DISTRIBUTIONS IN EXCESS OF) NET INVESTMENT INCOME | $ | 204,476 | $ | (72,767 | ) | |||
CAPITAL SHARE ACTIVITY | ||||||||
Shares sold | 1,558,669 | 6,016,951 | ||||||
Shares reinvested | 273,025 | 898,633 | ||||||
Shares redeemed | (1,006,287 | ) | (2,132,071 | ) | ||||
Net increase in shares outstanding | 825,407 | 4,783,513 | ||||||
Shares outstanding at beginning of period | 21,505,069 | 16,721,556 | ||||||
Shares outstanding at end of period | 22,330,476 | 21,505,069 | ||||||
See accompanying notes to financial statements.
42
DAVENPORT SMALL CAP FOCUS FUND |
Six Months | Year | |||||||
FROM OPERATIONS | ||||||||
Net investment income | $ | 14,464 | $ | 55,456 | ||||
Net realized gains (losses) from security transactions | 562,191 | (2,710,990 | ) | |||||
Net change in unrealized appreciation (depreciation) on investments | 5,263,809 | (2,068,369 | ) | |||||
Net increase (decrease) in net assets from operations | 5,840,464 | (4,723,903 | ) | |||||
DISTRIBUTIONS TO SHAREHOLDERS (Note 2) | ||||||||
From net realized gains from security transactions | — | (37,962 | ) | |||||
FROM CAPITAL SHARE TRANSACTIONS | ||||||||
Proceeds from shares sold | 7,127,478 | 21,401,677 | ||||||
Net asset value of shares issued in reinvestment of distributions to shareholders | — | 36,932 | ||||||
Payments for shares redeemed | (1,624,755 | ) | (8,332,057 | ) | ||||
Net increase in net assets from capital share transactions | 5,502,723 | 13,106,552 | ||||||
TOTAL INCREASE IN NET ASSETS | 11,343,187 | 8,344,687 | ||||||
NET ASSETS | ||||||||
Beginning of period | 39,636,062 | 31,291,375 | ||||||
End of period | $ | 50,979,249 | $ | 39,636,062 | ||||
ACCUMULATED (DISTRIBUTIONS IN EXCESS OF)NET INVESTMENT INCOME | $ | (108,008 | ) | $ | (122,472 | ) | ||
CAPITAL SHARE ACTIVITY | ||||||||
Shares sold | 705,934 | 2,145,270 | ||||||
Shares reinvested | — | 3,504 | ||||||
Shares redeemed | (164,643 | ) | (909,485 | ) | ||||
Net increase in shares outstanding | 541,291 | 1,239,289 | ||||||
Shares outstanding at beginning of period | 4,245,421 | 3,006,132 | ||||||
Shares outstanding at end of period | 4,786,712 | 4,245,421 | ||||||
See accompanying notes to financial statements.
43
DAVENPORT BALANCED INCOME FUND |
Six Months | Period | |||||||
FROM OPERATIONS | ||||||||
Net investment income | $ | 246,711 | $ | 38,315 | ||||
Net realized gains (losses) from security transactions | 13,458 | (14,261 | ) | |||||
Net change in unrealized appreciation (depreciation) on investments | 934,063 | 632,537 | ||||||
Net increase in net assets from operations | 1,194,232 | 656,591 | ||||||
DISTRIBUTIONS TO SHAREHOLDERS (Note 2) | ||||||||
From net investment income | (222,276 | ) | (29,113 | ) | ||||
FROM CAPITAL SHARE TRANSACTIONS | ||||||||
Proceeds from shares sold | 30,424,407 | 17,274,414 | ||||||
Net asset value of shares issued in reinvestment of distributions to shareholders | 206,748 | 27,366 | ||||||
Payments for shares redeemed | (2,267,608 | ) | (43,782 | ) | ||||
Net increase in net assets from capital share transactions | 28,363,547 | 17,257,998 | ||||||
TOTAL INCREASE IN NET ASSETS | 29,335,503 | 17,885,476 | ||||||
NET ASSETS | ||||||||
Beginning of period | 17,885,476 | — | ||||||
End of period | $ | 47,220,979 | $ | 17,885,476 | ||||
ACCUMULATED NET INVESTMENT INCOME | $ | 33,637 | $ | 9,202 | ||||
CAPITAL SHARE ACTIVITY | ||||||||
Shares sold | 2,903,825 | 1,742,964 | ||||||
Shares reinvested | 19,771 | 2,704 | ||||||
Shares redeemed | (213,056 | ) | (4,432 | ) | ||||
Net increase in shares outstanding | 2,710,540 | 1,741,236 | ||||||
Shares outstanding at beginning of period | 1,741,236 | — | ||||||
Shares outstanding at end of period | 4,451,776 | 1,741,236 | ||||||
(a) | Represents the period from the commencement of operations (December 31, 2015) through March 31, 2016. |
See accompanying notes to financial statements.
44
DAVENPORT CORE FUND |
Selected Per Share Data and Ratios for a Share Outstanding Throughout Each Period | ||||||||||||||||||||||||
Six Months | Years Ended March 31, | |||||||||||||||||||||||
2016 | 2015 | 2014 | 2013 | 2012 | ||||||||||||||||||||
Net asset value at beginning of period | $ | 18.78 | $ | 20.02 | $ | 19.30 | $ | 16.75 | $ | 15.00 | $ | 13.73 | ||||||||||||
Income (loss) from investment operations: | ||||||||||||||||||||||||
Net investment income | 0.07 | 0.11 | 0.10 | 0.12 | 0.11 | 0.09 | ||||||||||||||||||
Net realized and unrealized gains (losses) on investments | 1.18 | (0.56 | ) | 2.20 | 3.39 | 1.75 | 1.27 | |||||||||||||||||
Total from investment operations | 1.25 | (0.45 | ) | 2.30 | 3.51 | 1.86 | 1.36 | |||||||||||||||||
Less distributions: | ||||||||||||||||||||||||
Dividends from net investment income | (0.05 | ) | (0.11 | ) | (0.10 | ) | (0.12 | ) | (0.11 | ) | (0.09 | ) | ||||||||||||
Distributions from net realized gains | (0.24 | ) | (0.68 | ) | (1.48 | ) | (0.84 | ) | — | — | ||||||||||||||
Total distributions | (0.29 | ) | (0.79 | ) | (1.58 | ) | (0.96 | ) | (0.11 | ) | (0.09 | ) | ||||||||||||
Net asset value at end of period | $ | 19.74 | $ | 18.78 | $ | 20.02 | $ | 19.30 | $ | 16.75 | $ | 15.00 | ||||||||||||
Total return (a) | 6.77 | %(b) | (2.39 | %) | 12.42 | % | 21.32 | % | 12.47 | % | 9.99 | % | ||||||||||||
Net assets at end of period (000’s) | $ | 362,058 | $ | 337,229 | $ | 330,687 | $ | 281,231 | $ | 210,899 | $ | 174,898 | ||||||||||||
Ratio of total expenses to average net assets | 0.92 | %(c) | 0.92 | % | 0.93 | % | 0.94 | % | 0.95 | % | 0.96 | % | ||||||||||||
Ratio of net investment income to average net assets | 0.71 | %(c) | 0.56 | % | 0.49 | % | 0.64 | % | 0.71 | % | 0.66 | % | ||||||||||||
Portfolio turnover rate | 13 | %(b) | 23 | % | 21 | % | 29 | % | 26 | % | 19 | % | ||||||||||||
(a) | Total return is a measure of the change in value of an investment in the Fund over the period covered, which assumes any dividends or capital gains distributions are reinvested in shares of the Fund. Returns shown do not reflect the deduction of taxes a shareholder would pay on Fund distributions or the redemption of Fund shares. |
(b) | Not annualized. |
(c) | Annualized. |
See accompanying notes to financial statements.
45
DAVENPORT VALUE & INCOME FUND |
Selected Per Share Data and Ratios for a Share Outstanding Throughout Each Period | ||||||||||||||||||||||||
Six Months | Years Ended March 31, | |||||||||||||||||||||||
2016 | 2015 | 2014 | 2013 | 2012 | ||||||||||||||||||||
Net asset value at beginning of period | $ | 14.40 | $ | 15.46 | $ | 14.71 | $ | 13.18 | $ | 11.51 | $ | 10.50 | ||||||||||||
Income (loss) from investment operations: | ||||||||||||||||||||||||
Net investment income | 0.16 | 0.29 | 0.25 | 0.30 | 0.28 | 0.23 | ||||||||||||||||||
Net realized and unrealized gains (losses) on investments | 0.68 | (0.36 | ) | 1.45 | 2.04 | 1.81 | 1.02 | |||||||||||||||||
Total from investment operations | 0.84 | (0.07 | ) | 1.70 | 2.34 | 2.09 | 1.25 | |||||||||||||||||
Less distributions: | ||||||||||||||||||||||||
Dividends from net investment income | (0.16 | ) | (0.29 | ) | (0.25 | ) | (0.29 | ) | (0.27 | ) | (0.23 | ) | ||||||||||||
Distributions from net realized gains | — | (0.70 | ) | (0.70 | ) | (0.52 | ) | (0.15 | ) | (0.01 | ) | |||||||||||||
Total distributions | (0.16 | ) | (0.99 | ) | (0.95 | ) | (0.81 | ) | (0.42 | ) | (0.24 | ) | ||||||||||||
Net asset value at end of period | $ | 15.08 | $ | 14.40 | $ | 15.46 | $ | 14.71 | $ | 13.18 | $ | 11.51 | ||||||||||||
Total return (a) | 5.86 | %(b) | (0.46 | %) | 11.92 | % | 18.25 | % | 18.69 | % | 12.23 | % | ||||||||||||
Net assets at end of period (000’s) | $ | 507,853 | $ | 450,447 | $ | 407,777 | $ | 304,288 | $ | 196,890 | $ | 98,757 | ||||||||||||
Ratio of total expenses to average net assets | 0.90 | %(c) | 0.91 | % | 0.92 | % | 0.94 | % | 0.96 | % | 1.04 | % | ||||||||||||
Ratio of net investment income to average net assets | 2.23 | %(c) | 2.03 | % | 1.66 | % | 2.22 | % | 2.37 | % | 2.30 | % | ||||||||||||
Portfolio turnover rate | 7 | %(b) | 25 | % | 23 | % | 32 | % | 29 | % | 27 | % | ||||||||||||
(a) | Total return is a measure of the change in value of an investment in the Fund over the period covered, which assumes any dividends or capital gains distributions are reinvested in shares of the Fund. Returns shown do not reflect the deduction of taxes a shareholder would pay on Fund distributions or the redemption of Fund shares. |
(b) | Not annualized. |
(c) | Annualized. |
See accompanying notes to financial statements.
46
DAVENPORT EQUITY OPPORTUNITIES FUND |
Selected Per Share Data and Ratios for a Share Outstanding Throughout Each Period | ||||||||||||||||||||||||
Six Months | Years Ended March 31, | |||||||||||||||||||||||
2016 | 2015 | 2014 | 2013 | 2012 | ||||||||||||||||||||
Net asset value at beginning of period | $ | 14.73 | $ | 16.61 | $ | 15.91 | $ | 13.86 | $ | 11.96 | $ | 10.72 | ||||||||||||
Income (loss) from investment operations: | ||||||||||||||||||||||||
Net investment income (loss) | 0.01 | 0.00 | (a) | 0.04 | 0.24 | 0.03 | (0.02 | ) | ||||||||||||||||
Net realized and unrealized gains (losses) on investments | 0.58 | (1.14 | ) | 2.42 | 2.65 | 2.17 | 1.30 | |||||||||||||||||
Total from investment operations | 0.59 | (1.14 | ) | 2.46 | 2.89 | 2.20 | 1.28 | |||||||||||||||||
Less distributions: | ||||||||||||||||||||||||
Dividends from net investment income | — | (0.01 | ) | (0.26 | ) | (0.02 | ) | (0.02 | ) | — | ||||||||||||||
Distributions from net realized gains | (0.19 | ) | (0.73 | ) | (1.50 | ) | (0.82 | ) | (0.28 | ) | (0.04 | ) | ||||||||||||
Total distributions | (0.19 | ) | (0.74 | ) | (1.76 | ) | (0.84 | ) | (0.30 | ) | (0.04 | ) | ||||||||||||
Net asset value at end of period | $ | 15.13 | $ | 14.73 | $ | 16.61 | $ | 15.91 | $ | 13.86 | $ | 11.96 | ||||||||||||
Total return (b) | 4.06 | %(c) | (7.07 | %) | 16.67 | % | 21.57 | % | 18.77 | % | 12.00 | % | ||||||||||||
Net assets at end of period (000’s) | $ | 337,869 | $ | 316,788 | $ | 277,703 | $ | 174,489 | $ | 102,679 | $ | 59,135 | ||||||||||||
Ratio of total expenses to average net assets | 0.93 | %(d) | 0.93 | % | 0.96 | % | 0.97 | % | 1.01 | % | 1.10 | % | ||||||||||||
Ratio of net investment income (loss) to average net assets | 0.17 | %(d) | 0.02 | % | 0.33 | % | 1.96 | % | 0.23 | % | (0.22 | %) | ||||||||||||
Portfolio turnover rate | 10 | %(c) | 29 | % | 31 | % | 49 | % | 41 | % | 35 | % | ||||||||||||
(a) | Amount rounds to less than a penny per share. |
(b) | Total return is a measure of the change in value of an investment in the Fund over the period covered, which assumes any dividends or capital gains distributions are reinvested in shares of the Fund. Returns shown do not reflect the deduction of taxes a shareholder would pay on Fund distributions or the redemption of Fund shares. |
(c) | Not annualized. |
(d) | Annualized. |
See accompanying notes to financial statements.
47
DAVENPORT SMALL CAP FOCUS FUND |
Selected Per Share Data and Ratios for a Share Outstanding Throughout Each Period | ||||||||||||
Six Months | Year March 31, 2016 | Period | ||||||||||
Net asset value at beginning of period | $ | 9.34 | $ | 10.41 | $ | 10.00 | ||||||
Income (loss) from investment operations: | ||||||||||||
Net investment income (loss) | 0.01 | 0.01 | (0.01 | ) | ||||||||
Net realized and unrealized gains (losses) on investments | 1.30 | (1.07 | ) | 0.42 | ||||||||
Total from investment operations | 1.31 | (1.06 | ) | 0.41 | ||||||||
Less distributions: | ||||||||||||
Distributions from net realized gains | — | (0.01 | ) | — | ||||||||
Net asset value at end of period | $ | 10.65 | $ | 9.34 | $ | 10.41 | ||||||
Total return (b) | 14.03 | %(c) | (10.19 | %) | 4.10 | %(c) | ||||||
Net assets at end of period (000’s) | $ | 50,979 | $ | 39,636 | $ | 31,291 | ||||||
Ratio of net expenses to average net assets | 1.09 | %(d) | 1.15 | % | 1.25 | %(d)(e) | ||||||
Ratio of net investment income (loss) to average net assets | 0.06 | %(d) | 0.14 | % | (0.30 | %)(d)(f) | ||||||
Portfolio turnover rate | 14 | %(c) | 48 | % | 15 | %(c) | ||||||
(a) | Represents the period from commencement of operations (December 31, 2014) through March 31, 2015. |
(b) | Total return is a measure of the change in value of an investment in the Fund over the period covered, which assumes any dividends or capital gains distributions are reinvested in shares of the Fund. Returns shown do not reflect the deduction of taxes a shareholder would pay on Fund distributions or the redemption of Fund shares. |
(c) | Not annualized. |
(d) | Annualized. |
(e) | Absent advisory fee reductions, the ratio of total expenses to average net assets would have been 1.42%(d) for the period ended March 31, 2015 (Note 4). |
(f) | Ratio was determined after advisory fee reductions. |
See accompanying notes to financial statements.
48
DAVENPORT BALANCED INCOME FUND |
Selected Per Share Data and Ratios for a Share Outstanding Throughout Each Period | ||||||||
Six Months | Period | |||||||
Net asset value at beginning of period | $ | 10.27 | $ | 10.00 | ||||
Income from investment operations: | ||||||||
Net investment income | 0.06 | 0.03 | ||||||
Net realized and unrealized gains on investments | 0.34 | 0.26 | ||||||
Total from investment operations | 0.40 | 0.29 | ||||||
Less distributions: | ||||||||
Dividends from net investment income | (0.06 | ) | (0.02 | ) | ||||
Net asset value at end of period | $ | 10.61 | $ | 10.27 | ||||
Total return (b) | 3.91 | %(c) | 2.90 | %(c) | ||||
Net assets at end of period (000’s) | $ | 47,221 | $ | 17,885 | ||||
Ratio of net expenses to average net assets | 1.24 | %(d) | 1.25 | %(d)(e) | ||||
Ratio of net investment income to average net assets | 1.45 | %(d) | 1.65 | %(d)(f) | ||||
Portfolio turnover rate | 2 | %(c) | 7 | %(c) | ||||
(a) | Represents the period from commencement of operations (December 31, 2015) through March 31, 2016. |
(b) | Total return is a measure of the change in value of an investment in the Fund over the period covered, which assumes any dividends or capital gains distributions are reinvested in shares of the Fund. The returns shown do not reflect the deduction of taxes a shareholder would pay on Fund distributions or the redemption of Fund shares. |
(c) | Not annualized. |
(d) | Annualized. |
(e) | Absent advisory fee reductions and expense reimbursements, the ratio of total expenses to average net assets would have been 2.25%(d) for the period ended March 31, 2016 (Note 4). |
(f) | Ratio was determined after advisory fee reductions and expense reimbursements. |
See accompanying notes to financial statements.
49
THE DAVENPORT FUNDS
NOTES TO FINANCIAL STATEMENTS
September 30, 2016 (Unaudited)
1. Organization
Davenport Core Fund, Davenport Value & Income Fund, Davenport Equity Opportunities Fund, Davenport Small Cap Focus Fund and Davenport Balanced Income Fund (individually, a “Fund,” and, collectively, the “Funds”) are each a no-load series of the Williamsburg Investment Trust (the “Trust”), an open-end management investment company registered under the Investment Company Act of 1940. The Trust was organized as a Massachusetts business trust on July 18, 1988. Other series of the Trust are not incorporated in this report. Davenport Core Fund began operations on January 15, 1998. Davenport Value & Income Fund and Davenport Equity Opportunities Fund each began operations on December 31, 2010. Davenport Small Cap Focus Fund began operations on December 31, 2014. Davenport Balanced Income Fund began operations on December 31, 2015.
Davenport Core Fund’s investment objective is long term growth of capital.
Davenport Value & Income Fund’s investment objective is to achieve long term growth while generating current income through dividend payments on portfolio securities.
Davenport Equity Opportunities Fund’s investment objective is long term capital appreciation.
Davenport Small Cap Focus Fund’s investment objective is long term capital appreciation.
Davenport Balanced Income Fund’s investment objective is current income and an opportunity for long term growth.
Davenport Core Fund, Davenport Value & Income Fund and Davenport Balanced Income Fund are each classified as a diversified fund. Davenport Equity Opportunities Fund and Davenport Small Cap Focus Fund are each classified as a non-diversified fund.
2. Significant Accounting Policies
As an investment company, as defined in Financial Accounting Standards Board (“FASB”) Accounting Standards Update 2013-08, each Fund follows accounting and reporting guidance under FASB Accounting Standards Codification Topic 946, “Financial Services – Investment Companies.” The following is a summary of the Funds’ significant accounting policies. The policies are in conformity with accounting principles generally accepted in the United States of America (“GAAP”).
Securities valuation — The Funds’ portfolio securities are valued as of the close of business of the regular session of the New York Stock Exchange (normally 4:00 p.m., Eastern time). Securities traded on a national stock exchange, including common stocks, are valued based upon the closing price on the principal exchange where the security is traded, if available, otherwise, at the last quoted bid price. Securities which are quoted by NASDAQ are valued at the NASDAQ Official Closing Price. Investments representing shares of other open-end investment companies, including money market funds, are valued at their net asset value as reported by such companies.
50
THE DAVENPORT FUNDS
NOTES TO FINANCIAL STATEMENTS (Continued)
Fixed income securities, including corporate bonds, are typically valued on the basis of prices provided by an independent pricing service. The prices provided by the pricing service are determined with consideration given to institutional bid and last sale prices and take into account securities prices, yields, maturities, call features, ratings, institutional trading in similar groups of securities and developments related to specific securities.
When using a quoted price and when the market is considered active, securities will be classified as Level 1 within the fair value hierarchy. When market quotations are not readily available, if a pricing service cannot provide a price or the investment adviser believes the price received from the pricing service is not indicative of market value, securities will be valued in good faith at fair value using methods consistent with procedures adopted by the Board of Trustees and will be classified as Level 2 or 3 within the fair value hierarchy (see below), depending on the inputs used. Such methods of fair valuation may include, but are not limited to: multiple of earnings, multiple of book value, discount from market of a similar freely traded security, purchase price of the security, subsequent private transactions in the security or related securities, or a combination of these and other factors.
GAAP establishes a single authoritative definition of fair value, sets out a framework for measuring fair value and requires additional disclosures about fair value measurements.
Various inputs are used in determining the value of the Funds’ investments. These inputs are summarized in the three broad levels listed below:
● Level 1 – quoted prices in active markets for identical securities
● Level 2 – other significant observable inputs
● Level 3 – significant unobservable inputs
Fixed income securities, including corporate bonds, held by Davenport Balanced Income Fund are classified as Level 2 since the values for such securities are based on prices provided by an independent pricing service that utilizes various “other significant observable inputs” including bid and ask quotations, prices of similar securities and interest rates, among other factors.
The inputs or methodology used for valuing securities are not necessarily an indication of the risks associated with investing in those securities. The inputs used to measure fair value may fall into different levels of the fair value hierarchy. In such cases, for disclosure purposes, the level in the fair value hierarchy within which the fair value measurement falls in its entirety is determined based on the lowest level input that is significant to the fair value measurement.
The following is a summary of the inputs used to value the Funds’ investments as of September 30, 2016, by security type:
Davenport Core Fund | Level 1 | Level 2 | Level 3 | Total | ||||||||||||
Common Stocks | $ | 349,332,082 | $ | — | $ | — | $ | 349,332,082 | ||||||||
Exchange-Traded Funds | 5,239,569 | — | — | 5,239,569 | ||||||||||||
Money Market Funds | 7,694,912 | — | — | 7,694,912 | ||||||||||||
Total | $ | 362,266,563 | $ | — | $ | — | $ | 362,266,563 | ||||||||
51
THE DAVENPORT FUNDS
NOTES TO FINANCIAL STATEMENTS (Continued)
Davenport Value & Income Fund | Level 1 | Level 2 | Level 3 | Total | ||||||||||||
Common Stocks | $ | 489,119,677 | $ | — | $ | — | $ | 489,119,677 | ||||||||
Money Market Funds | 17,560,886 | — | — | 17,560,886 | ||||||||||||
Total | $ | 506,680,563 | $ | — | $ | — | $ | 506,680,563 | ||||||||
Davenport Equity Opportunities Fund | Level 1 | Level 2 | Level 3 | Total | ||||||||||||
Common Stocks | $ | 323,455,954 | $ | — | $ | — | $ | 323,455,954 | ||||||||
Money Market Funds | 11,082,843 | — | — | 11,082,843 | ||||||||||||
Total | $ | 334,538,797 | $ | — | $ | — | $ | 334,538,797 | ||||||||
Davenport Small Cap Focus Fund | Level 1 | Level 2 | Level 3 | Total | ||||||||||||
Common Stocks | $ | 48,039,634 | $ | — | $ | — | $ | 48,039,634 | ||||||||
Money Market Funds | 3,153,282 | — | — | 3,153,282 | ||||||||||||
Total | $ | 51,192,916 | $ | — | $ | — | $ | 51,192,916 | ||||||||
Davenport Balanced Income Fund | Level 1 | Level 2 | Level 3 | Total | ||||||||||||
Common Stocks | $ | 28,743,093 | $ | — | $ | — | $ | 28,743,093 | ||||||||
Fixed Rate Corporate Bonds | — | 13,143,000 | — | 13,143,000 | ||||||||||||
Variable Rate Corporate Bonds | — | 3,385,255 | — | 3,385,255 | ||||||||||||
Money Market Funds | 1,502,244 | — | — | 1,502,244 | ||||||||||||
Total | $ | 30,245,337 | $ | 16,528,255 | $ | — | $ | 46,773,592 | ||||||||
Refer to each Fund’s Schedule of Investments for a listing of the securities by sector type. As of September 30, 2016, the Funds did not have any transfers into and out of any Level. There were no Level 3 securities or derivative instruments held by the Funds as of September 30, 2016. It is the Funds’ policy to recognize transfers into and out of any Level at the end of the reporting period.
Share valuation — The net asset value per share of each Fund is calculated daily by dividing the total value of its assets, less liabilities, by the number of shares outstanding. The offering price and redemption price per share of each Fund is equal to the net asset value per share.
Investment income — Interest income is accrued as earned. Dividend income is recorded on the ex-dividend date. Discounts and premiums on fixed-income securities are amortized using the interest method. Withholding taxes on foreign dividends have been recorded in accordance with the Funds’ understanding of the appropriate country’s rules and tax rates.
Security transactions — Security transactions are accounted for on trade date for financial reporting purposes. Realized gains and losses on securities sold are determined on a specific identification basis.
52
THE DAVENPORT FUNDS
NOTES TO FINANCIAL STATEMENTS (Continued)
Common expenses — Common expenses of the Trust are allocated among the series of the Trust based on relative net assets of each series or the nature of the services performed and the relative applicability to each series.
Distributions to shareholders — Dividends arising from net investment income, if any, are declared and paid quarterly to shareholders of Davenport Core Fund, Davenport Value & Income Fund, Davenport Small Cap Focus Fund and Davenport Balanced Income Fund; and declared and paid semi-annually to shareholders of Davenport Equity Opportunities Fund. Net realized short-term capital gains, if any, may be distributed throughout the year and net realized long-term capital gains, if any, are distributed at least once each year. The amount of distributions from net investment income and net realized capital gains are determined in accordance with federal income tax regulations, which may differ from GAAP. Dividends and distributions are recorded on the ex-dividend date.
The tax character of distributions paid during the periods ended September 30, 2016 and March 31, 2016 was as follows:
| Period Ended | Ordinary | Long-Term | Total | ||||||||||
Davenport Core Fund | 09/30/16 | $ | 950,837 | $ | 4,339,995 | $ | 5,290,832 | ||||||
| 03/31/16 | $ | 1,852,639 | $ | 11,534,728 | $ | 13,387,367 | |||||||
Davenport Value & Income Fund | 09/30/16 | $ | 5,239,187 | $ | — | $ | 5,239,187 | ||||||
03/31/16 | $ | 8,850,088 | $ | 19,242,395 | $ | 28,092,483 | |||||||
Davenport Equity Opportunities Fund | 09/30/16 | $ | — | $ | 4,091,481 | $ | 4,091,481 | ||||||
03/31/16 | $ | 562,406 | $ | 13,926,905 | $ | 14,489,311 | |||||||
Davenport Small Cap Focus Fund | 09/30/16 | $ | — | $ | — | $ | — | ||||||
03/31/16 | $ | 37,962 | $ | — | $ | 37,962 | |||||||
Davenport Balanced Income Fund | 09/30/16 | $ | 222,276 | $ | — | $ | 222,276 | ||||||
| 03/31/16 | $ | 29,113 | $ | — | $ | 29,113 | |||||||
Estimates — The preparation of financial statements in conformity with GAAP requires management to make estimates and assumptions that affect the reported amounts of assets and liabilities and disclosure of contingent assets and liabilities as of the date of the financial statements and the reported amounts of income and expenses during the reporting period. Actual results could differ from those estimates.
Federal income tax — Each Fund has qualified and intends to continue to qualify as a regulated investment company under the Internal Revenue Code of 1986 (the “Code”). Qualification generally will relieve the Funds of liability for federal income taxes to the extent 100% of their net investment income and net realized capital gains are distributed in accordance with the Code.
53
THE DAVENPORT FUNDS
NOTES TO FINANCIAL STATEMENTS (Continued)
In order to avoid imposition of the excise tax applicable to regulated investment companies, it is also each Fund’s intention to declare as dividends in each calendar year at least 98% of its net investment income (earned during the calendar year) and 98.2% of its net realized capital gains (earned during the twelve months ended October 31) plus undistributed amounts from prior years.
The following information is computed on a tax basis for each item as of September 30, 2016:
Davenport Core Fund | Davenport Value & Income Fund | Davenport Equity Opportunities Fund | ||||||||||
Cost of portfolio investments | $ | 264,366,295 | $ | 438,339,048 | $ | 303,415,642 | ||||||
Gross unrealized appreciation | $ | 102,767,759 | $ | 83,694,170 | $ | 51,485,164 | ||||||
Gross unrealized depreciation | (4,867,491 | ) | (15,352,655 | ) | (20,362,009 | ) | ||||||
Net unrealized appreciation | 97,900,268 | 68,341,515 | 31,123,155 | |||||||||
Accumulated ordinary income | 75,017 | 476,664 | 204,476 | |||||||||
Accumulated capital and other gains (losses) | 4,565,039 | 812,256 | (7,852,585 | ) | ||||||||
Accumulated earnings | $ | 102,540,324 | $ | 69,630,435 | $ | 23,475,046 | ||||||
Davenport Small Cap Focus Fund | Davenport Balanced Income Fund | |||||||
Cost of portfolio investments | $ | 46,950,848 | $ | 45,189,013 | ||||
Gross unrealized appreciation | $ | 7,364,642 | $ | 1,982,916 | ||||
Gross unrealized depreciation | (3,122,574 | ) | (398,337 | ) | ||||
Net unrealized appreciation | 4,242,068 | 1,584,579 | ||||||
Accumulated ordinary income (loss) | (32,975 | ) | 15,658 | |||||
Accumulated capital and other losses | (1,950,774 | ) | (803 | ) | ||||
Accumulated earnings | $ | 2,258,319 | $ | 1,599,434 | ||||
The difference between the federal income tax cost of portfolio investments and the financial statement cost for each Fund is due to certain timing differences in the recognition of capital gains and losses under income tax regulations and GAAP. These timing differences are temporary in nature and are due to the tax deferral of losses on wash sales and adjustments to basis on publicly traded partnerships.
As of March 31, 2016, Davenport Small Cap Focus Fund had a short-term capital loss carryforward for federal income tax purposes of $202,467, which may be carried forward indefinitely. This capital loss carryforward is available to offset realized capital gains in the current and future years, thereby reducing future taxable gains distributions.
During the six months ended September 30, 2016, Davenport Equity Opportunities Fund reclassified $56 of distributions in excess of net realized gains against accumulated net investment income on the Statements of Assets and Liabilities. Such reclassification, the result of permanent differences between the financial statement and income tax reporting requirements, has no effect on the Fund’s net assets or net asset value per share.
54
THE DAVENPORT FUNDS
NOTES TO FINANCIAL STATEMENTS (Continued)
The Funds recognize the tax benefits or expenses of uncertain tax positions only when the position is “more likely than not” to be sustained assuming examination by tax authorities. Management has reviewed the tax positions taken on Federal income tax returns for the current and all applicable open tax years (tax years ended March 31, 2013 through March 31, 2016) of each Fund and has concluded that no provision for unrecognized tax benefits or expenses is required in these financial statements.
3. Investment Transactions
Investment transactions, other than short-term investments and U.S. government securities, were as follows for the six months ended September 30, 2016:
Davenport | Davenport | Davenport Equity Opportunities Fund | ||||||||||
Purchases of investment securities | $ | 49,575,283 | $ | 69,502,348 | $ | 42,584,970 | ||||||
Proceeds from sales and maturities of investment securities | $ | 44,064,328 | $ | 33,004,535 | $ | 31,137,355 | ||||||
Davenport Small Cap Focus Fund | Davenport Balanced Income Fund | |||||||
Purchases of investment securities | $ | 9,119,731 | $ | 28,052,137 | ||||
Proceeds from sales and maturities of investment securities | $ | 5,905,120 | $ | 775,461 | ||||
4. Transactions with Related Parties
INVESTMENT ADVISORY AGREEMENTS
Each Fund’s investments are managed by Davenport & Company LLC (the “Adviser”) under the terms of an Investment Advisory Agreement. Under the Investment Advisory Agreement, each Fund pays the Adviser a fee, which is computed and accrued daily and paid monthly, at an annual rate of .75% on its average daily net assets. Certain officers and a Trustee of the Trust are also officers of the Adviser.
The Adviser has agreed, until August 1, 2017 for Davenport Small Cap Focus Fund and Davenport Balanced Income Fund, to reduce its investment advisory fees and to reimburse other operating expenses to the extent necessary to limit total annual operating expenses (excluding acquired fund fees and expenses) of each such Fund to an amount not exceeding 1.25% of average daily net assets. Any such fee reductions by the Adviser, or payments by the Adviser of expenses which are Davenport Small Cap Focus Fund’s and Davenport Balanced Income Fund’s obligation, are subject to repayment by the Funds for a period of three years from the end of the fiscal year when such fee reductions or reimbursements occurred, provided the Funds are able to effect such repayment and remain in compliance with the undertaking by the Adviser to limit expenses of the
55
THE DAVENPORT FUNDS
NOTES TO FINANCIAL STATEMENTS (Continued)
Funds. During the six months ended September 30, 2016, the Adviser did not reduce Advisory fees for Davenport Small Cap Focus Fund and Davenport Balanced Income Fund. During the six months ended September 30, 2016, the Adviser recouped from Davenport Balanced Income Fund $11,128 of previous advisory fee reductions. As of September 30, 2016, advisory fee reductions and expense reimbursements in the amount of $12,000 may be recouped by the Adviser no later than March 31, 2019, as relates to Davenport Balanced Income Fund.
OTHER SERVICE PROVIDERS
Ultimus Fund Solutions, LLC (“Ultimus”) provides administration, fund accounting, compliance and transfer agent services to the Funds. The Funds pay Ultimus fees in accordance with the agreements for such services. In addition, the Funds pay out-of-pocket expenses including, but not limited to, postage, supplies, and costs of pricing the Funds’ portfolio securities. Certain officers of the Trust are also officers of Ultimus, or of Ultimus Fund Distributors, LLC (the “Distributor”), the principal underwriter of each Fund’s shares and an affiliate of Ultimus. The Distributor is compensated by the Adviser (not the Funds) for acting as principal underwriter.
COMPENSATION OF TRUSTEES
Trustees and officers affiliated with an investment adviser to the Trust or Ultimus are not compensated by the Trust for their services. Each Trustee who is not an affiliated person of an investment adviser or Ultimus receives from the Trust an annual retainer of $15,000, payable quarterly; a fee of $1,500 for attendance at each meeting of the Board of Trustees (except that such fee is $2,500 for the independent chair); and a fee of $1,000 for attendance at each meeting of any committee of the Board (except that such fee is $1,500 for the committee chair); plus reimbursement of travel and other expenses incurred in attending meetings. Each series of the Trust pays its proportionate share of such fees.
5. Sector Risk
If a Fund has significant investments in the securities of issuers in industries within a particular sector, any development affecting that sector will have a greater impact on the value of the net assets of the Fund than would be the case if the Fund did not have significant investments in that sector. In addition, this may increase the risk of loss of an investment in the Fund and increase the volatility of the Fund’s net asset value per share. From time to time, circumstances may affect a particular sector and the companies within such sector. For instance, economic or market factors, regulation or deregulation, or other developments may negatively impact all companies in a particular sector and therefore the value of a Fund’s portfolio would be adversely affected. As of September 30, 2016, Davenport Equity Opportunities Fund had 35.1% of the value of its net assets invested in stocks within the Consumer Discretionary sector and Davenport Small Cap Focus Fund had 25.4% of the value of its net assets invested in stocks within the Consumer Discretionary sector.
56
THE DAVENPORT FUNDS
NOTES TO FINANCIAL STATEMENTS (Continued)
6. Contingencies and Commitments
The Funds indemnify the Trust’s officers and Trustees for certain liabilities that might arise from their performance of their duties to the Funds. Additionally, in the normal course of business the Funds enter into contracts that contain a variety of representations and warranties and which provide general indemnifications. The Funds’ maximum exposure under these arrangements is unknown, as this would involve future claims that may be made against the Funds that have not yet occurred. However, based on experience, the Funds expect the risk of loss to be remote.
7. Subsequent Events
The Funds are required to recognize in the financial statements the effects of all subsequent events that provide additional evidence about conditions that existed as of the date of the Statements of Assets and Liabilities. For non-recognized subsequent events that must be disclosed to keep the financial statements from being misleading, the Funds are required to disclose the nature of the event as well as an estimate of its financial effect, or a statement that such an estimate cannot be made. Management has evaluated subsequent events through the issuance of these financial statements and has noted no such events.
57
THE DAVENPORT FUNDS
YOUR FUNDS’ EXPENSES (Unaudited)
We believe it is important for you to understand the impact of costs on your investment. All mutual funds have operating expenses. As a shareholder of the Funds, you incur ongoing costs, including management fees and other expenses. These ongoing costs, which are deducted from each Fund’s gross income, directly reduce the investment return of the Funds.
A mutual fund’s ongoing costs are expressed as a percentage of its average net assets. This figure is known as the expense ratio. The following examples are intended to help you understand the ongoing costs (in dollars) of investing in the Funds and to compare these costs with the ongoing costs of investing in other mutual funds. The examples below are based on an investment of $1,000 made at the beginning of the period shown and held for the entire period (April 1, 2016 and held through September 30, 2016).
The table below illustrates each Fund’s ongoing costs in two ways:
Actual fund return – This section helps you to estimate the actual expenses that you paid over the period. The “Ending Account Value” shown is derived from each Fund’s actual return, and the fourth column shows the dollar amount of operating expenses that would have been paid by an investor who started with $1,000 in the Funds. You may use the information here, together with the amount you invested, to estimate the expenses that you paid over the period.
To do so, simply divide your account value by $1,000 (for example, an $8,600 account value divided by $1,000 = 8.6), then multiply the result by the number given for the applicable Fund under the heading “Expenses Paid During Period.”
Hypothetical 5% return – This section is intended to help you compare each Fund’s ongoing costs with those of other mutual funds. It assumes that each Fund had an annual return of 5% before expenses during the period shown, but that the expense ratio is unchanged. In this case, because the return used is not each Fund’s actual return, the results do not apply to your investment. The example is useful in making comparisons because the Securities and Exchange Commission (“SEC”) requires all mutual funds to calculate expenses based on a 5% return. You can assess each Fund’s ongoing costs by comparing this hypothetical example with the hypothetical examples that appear in shareholder reports of other funds.
Note that expenses shown in the table are meant to highlight and help you compare ongoing costs only. The Funds do not charge sales loads or redemption fees.
The calculations assume no shares were bought or sold during the period. Your actual costs may have been higher or lower, depending on the amount of your investment and the timing of any purchases or redemptions.
More information about each Fund’s expenses, including historical annual expense ratios, can be found in this report. For additional information on operating expenses and other shareholder costs, please refer to the Funds’ prospectus.
58
THE DAVENPORT FUNDS
YOUR FUNDS’ EXPENSES (Unaudited) (Continued)
Beginning | Ending | Expense | Expenses Paid | |
Davenport Core Fund | ||||
Based on Actual Fund Return | $1,000.00 | $1,067.70 | 0.92% | $4.76 |
Based on Hypothetical 5% Return (before expenses) | $1,000.00 | $1,020.40 | 0.92% | $4.65 |
Davenport Value & Income Fund | ||||
Based on Actual Fund Return | $1,000.00 | $1,058.60 | 0.90% | $4.63 |
Based on Hypothetical 5% Return (before expenses) | $1,000.00 | $1,020.50 | 0.90% | $4.55 |
Davenport Equity Opportunities Fund | ||||
Based on Actual Fund Return | $1,000.00 | $1,040.60 | 0.93% | $4.74 |
Based on Hypothetical 5% Return (before expenses) | $1,000.00 | $1,020.35 | 0.93% | $4.70 |
Davenport Small Cap Focus Fund | ||||
Based on Actual Fund Return | $1,000.00 | $1,040.30 | 1.09% | $5.83 |
Based on Hypothetical 5% Return (before expenses) | $1,000.00 | $1,019.55 | 1.09% | $5.50 |
Davenport Balanced Income Fund | ||||
Based on Actual Fund Return | $1,000.00 | $1,039.10 | 1.24% | $6.32 |
Based on Hypothetical 5% Return (before expenses) | $1,000.00 | $1,018.80 | 1.24% | $6.26 |
(a) | Annualized, based on the Fund’s most recent one-half year expenses. |
(b) | Expenses are equal to the Fund’s annualized expense ratio multiplied by the average account value over the period, multiplied by 183/366 (to reflect the one-half year period). |
59
THE DAVENPORT FUNDS |
A description of the policies and procedures that the Funds use to vote proxies relating to portfolio securities is available without charge upon request by calling toll-free 1-800-281-3217, or on the SEC’s website at http://www.sec.gov. Information regarding how the Funds voted proxies relating to portfolio securities during the most recent 12-month period ended June 30 is also available without charge upon request by calling toll-free 1-800-281-3217, or on the SEC’s website at http://www.sec.gov.
The Trust files a complete listing of portfolio holdings for each Fund with the SEC as of the end of the first and third quarters of each fiscal year on Form N-Q. These filings are available upon request by calling 1-800-281-3217. Furthermore, you may obtain a copy of these filings on the SEC’s website at http://www.sec.gov. The Trust’s Forms N-Q may also be reviewed and copied at the SEC’s Public Reference Room in Washington, DC, and information on the operation of the Public Reference Room may be obtained by calling 1-800-SEC-0330.
A complete listing of portfolio holdings for each Fund is updated daily and can be reviewed at the Funds’ website at http://www.investdavenport.com.
60
DAVENPORT BALANCED INCOME FUND
DISCLOSURE REGARDING APPROVAL OF
INVESTMENT ADVISORY AGREEMENT (Unaudited)
The Board of Trustees, including the Independent Trustees voting separately, reviewed and approved the Investment Advisory Agreement with the Adviser on behalf of Davenport Balanced Income Fund (the “Balanced Fund”) at an in-person meeting held on November 10, 2015. The Trustees were advised by independent counsel of their fiduciary obligations in approving the Investment Advisory Agreement and the Trustees requested such information from the Adviser as they deemed reasonably necessary to evaluate the terms of the Investment Advisory Agreement and whether the Agreement is in the best interests of the Balanced Fund.
The Trustees reviewed the investment objective and principal investment strategies of the Balanced Fund. The Trustees considered the mix of permissible investments for the Balanced Fund and noted that equity component will be similar to that of the Davenport Value & Income Fund, while the fixed income component will consist primarily of investment grade, intermediate maturity debt. The Trustees considered that, on a day-to-day basis, the equity portion of the Balanced Fund will be managed by Adviser’s Investment Policy Committee (the “IPC”) and that the fixed income portion of the Fund will be managed by Messrs. Charles A. Gomer, III and Christopher T. Kelley, subject to the oversight of the IPC.
The Trustees were provided with copies of the proposed Investment Advisory Agreement for the Balanced Fund and reviewed the services to be provided by the Adviser and the responsibilities of the Adviser under such Agreement. The Adviser proposed that the advisory fee for the Balanced Fund be 0.75% per annum of its average daily net assets, and the Trustees noted that this is the same advisory fee rate paid by Davenport Core Fund, Davenport Value & Income Fund, Davenport Equity Opportunities Fund and Davenport Small Cap Focus Fund.
The Trustees evaluated and discussed the background, duties and responsibilities of the members of the IPC and Messrs. Gomer and Kelly; the financial condition of the Adviser as of September 30, 2015 and its insurance coverage; the Adviser’s projected profitability from the Investment Advisory Agreement; the proposed advisory fees for the Balanced Fund as compared to similarly managed mutual funds; the Balanced Fund’s projected expense ratio as compared to similarly managed mutual funds; the Adviser’s plans for marketing and distributing shares of the Balanced Fund; and the indirect benefits that the Adviser expects to receive as a result of the Investment Advisory Agreement. The Trustees discussed the nature, extent and quality of the services to be provided by the Adviser and noted that they are familiar with the Adviser’s qualifications and responsibilities as a mutual fund investment manager and that the Adviser has established a history of care and consistency in its investment approach. The Trustees were mindful that the investment processes that will be used by the Adviser in managing the equity portion of the Balanced Fund will incorporate some of the processes that Davenport has successfully used to manage the Davenport Value & Income Fund and separately managed accounts and that the Adviser has assembled a team of fixed income portfolio managers. The Trustees considered the credentials of the investment professionals that will manage the fixed income portion of the Balanced Fund and their understanding of the fixed income management process that will be
61
DAVENPORT BALANCED INCOME FUND
DISCLOSURE REGARDING APPROVAL OF
INVESTMENT ADVISORY AGREEMENT (Unaudited)
(Continued)
applied to the Fund. Having reviewed detailed information about the investment processes for the Balanced Fund, the Board concluded that it was satisfied with the nature, extent and quality of the investment advisory services that will be provided by the Adviser to the Balanced Fund.
The Trustees noted that the Adviser has agreed to maintain an expense cap of 1.25% for the Balanced Fund until August 1, 2017, which could effectively reduce the Fund’s advisory fee rate. After considering the comparative information regarding advisory fees and expense ratios for the Morningstar universe of moderate allocation funds, it was the consensus of the Trustees that the proposed investment advisory fee and projected total expense ratio for the Balanced Fund are reasonable as compared to the average fees and expense ratios of similarly situated funds, as well as the fees charged by the Adviser to private accounts having a similar investment strategy. The Board concluded that the proposed advisory fee for the Balanced Fund is reasonable in relation to the nature of the investment programs and the level of services to be provided by the Adviser.
No single factor was considered in isolation or to be determinative to the decision of the Trustees to approve the Investment Advisory Agreement. Rather, the Trustees concluded, in light of a weighing and balancing of all factors considered, that approval of the Investment Advisory Agreement would be in the best interests of the Balanced Fund.
62
PRIVACY NOTICE |
FACTS | WHAT DO THE DAVENPORT FUNDS DO WITH YOUR PERSONAL INFORMATION? | ||
Why? | Financial companies choose how they share your personal information. Federal law gives consumers the right to limit some but not all sharing. Federal law also requires us to tell you how we collect, share, and protect your personal information. Please read this notice carefully to understand what we do. | ||
What? | The types of personal information we collect and share depend on the product or service you have with us. This information can include: ■ Social Security number ■ Assets ■ Retirement Assets ■ Transaction History ■ Checking Account Information ■ Purchase History ■ Account Balances ■ Account Transactions ■ Wire Transfer Instructions When you are no longer our customer, we continue to share your information as described in this notice. | ||
How? | All financial companies need to share your personal information to run their everyday business. In the section below, we list the reasons financial companies can share their customers’ personal information; the reasons The Davenport Funds choose to share; and whether you can limit this sharing. | ||
Reasons we can share your personal information | Do The Davenport Funds share? | Can you limit this sharing? | |
For our everyday business purposes – | Yes | No | |
For our marketing purposes – | No | We don’t share | |
For joint marketing with other financial companies | No | We don’t share | |
For our affiliates’ everyday business purposes – information about your creditworthiness | No | We don’t share | |
For nonaffiliates to market to you | No | We don’t share | |
Questions? | Call 1-800-281-3217 | ||
63
Who we are | |
Who is providing this notice? | Williamsburg Investment Trust Ultimus Fund Distributors, LLC Ultimus Fund Solutions, LLC |
What we do | |
How do The Davenport Funds protect my personal information? | To protect your personal information from unauthorized access and use, we use security measures that comply with federal law. These measures include computer safeguards and secured files and buildings. Our service providers are held accountable for adhering to strict policies and procedures to prevent any misuse of your nonpublic personal information. |
How do The Davenport Funds collect my personal information? | We collect your personal information, for example, when you ■ Provide account information ■ Give us your contact information ■ Make deposits or withdrawals from your account ■ Make a wire transfer ■ Tell us where to send the money ■ Tell us who receives the money ■ Show your government-issued ID ■ Show your driver’s license We also collect your personal information from other companies. |
Why can’t I limit all sharing? | Federal law gives you the right to limit only ■ Sharing for affiliates’ everyday business purposes – information about your creditworthiness ■ Affiliates from using your information to market to you ■ Sharing for nonaffiliates to market to you State laws and individual companies may give you additional rights to limit sharing. |
Definitions | |
Affiliates | Companies related by common ownership or control. They can be financial and nonfinancial companies. ■ Davenport & Company LLC, the investment adviser to The Davenport Funds, could be deemed to be an affiliate. |
Nonaffiliates | Companies not related by common ownership or control. They can be financial and nonfinancial companies ■ The Davenport Funds do not share with nonaffiliates so they can market to you |
Joint marketing | A formal agreement between nonaffiliated financial companies that together market financial products or services to you. ■ The Davenport Funds don’t jointly market. |
64
THE DAVENPORT FUNDS
Investment Adviser
Administrator
Custodian
Independent Registered Public
Legal Counsel
Board of Trustees
Officers
|

One James Center
901 East Cary Street
Richmond, VA 23219
Davenport & Company LLC
Member: NYSE ● SIPC
Toll Free: (800) 846-6666
www.investdavenport.com
FBP Equity & Dividend Plus Fund FBP Appreciation & Income Opportunities Fund
Semi-Annual Report September 30, 2016 (Unaudited)
No-Load Funds
|
Letter to Shareholders | November 15, 2016 |
We are pleased to report on your Funds and their investments for the six month period ended September 30, 2016 and to provide some additional information since we last communicated with you. While investors enjoyed positive market returns over this reporting period with the S&P 500 Index returning 6.40%, it was accomplished with increased uncertainty, increased volatility and a significant change in market leadership.
Economic and Market Update
In the early months of the period, concerns focused on the pace of growth of the US economy and whether growth momentum would pick up as the year progressed. Adding to those concerns were the intense and disruptive campaigns occurring in both parties election primaries.
The surprising outcome of the “remain or leave” referendum in the United Kingdom, i.e. Brexit, certainly added excitement and volatility to global financial markets as the June quarter came to a end. The U.S. equity market sell-off in the immediate aftermath of the June 23 referendum was broad and steep. The Dow Jones Industrials lost almost 1,000 points in the two trading days following the vote. After that, however, domestic stock markets quickly recovered with the Dow closing out the quarter within 100 points of where it was prior to the vote. Internationally, equity markets followed a similar pattern, especially in Europe where the most pain was felt. Other financial markets also reacted sharply to the rising uncertainty of the economic situation in Europe. The U.S. government bond market is considered one of the safe-havens of the financial world, and it rallied in the aftermath of the vote with bond prices surging and interest rates falling. The 10-year U.S. Treasury bond yield moved to all-time low levels under 1.40%. Currency markets were disrupted, with the British pound sterling collapsing to levels against the U.S. dollar not seen in more than 30 years.
Somewhat overshadowed by the Brexit vote, the U.S. economy continued to exhibit steady, if unspectacular, growth. First quarter GDP was revised upward a second time from an initially reported 0.5%, but only to a rate of 1.1%. Consumer confidence did move higher in June, as reported by the Conference Board, and the Institute of Supply Management’s Manufacturing Index also advanced by 1.9 points for the month. Defensive sectors such as Utilities, Telecommunications and Consumer Staples led the market returns during this early period, benefiting from falling interest rates and all of the uncertainties mentioned above.
As we moved into the beginning of the September quarter, positive economic momentum became more apparent. Not only was the rate of growth of GDP expected to increase, but earnings for the S&P 500 were forecasted to begin growing again. A growing conviction that the economy and earnings would improve in 2017 began to arise. There was, however, considerable apprehension concerning the Presidential election and volatility picked up as the election neared. In hindsight, we can see that investors looked through the possible election outcome and realized that both candidates had big plans to increase spending, which would result in higher growth in 2017 and beyond. With this higher growth, corporate earnings would improve. Market leadership shifted during the September quarter to the Information Technology, Energy and Materials sectors, which are more cyclically-oriented groups, and Financials, which would benefit from higher interest rates.
FBP Equity & Dividend Plus Fund Review
The FBP Equity & Dividend Plus Fund returned 6.48% for the semi-annual period and 15.06% for the annual period ended September 30, 2016. The S&P 500 Index returned 6.40% and 15.43% over the same periods. The Fund was invested 92.6% equity and 7.4% cash as of September 30, 2016. Information Technology, Consumer Staples and Health Care were the sectors with the strongest contribution to returns, with Nordstrom, Merck and HP, Inc. being the best individual contributors. Industrials, Utilities and Energy
1
were the weaker sectors, with Staples, CenturyLink and Ford Motor producing the poorest returns. During the period, the Fund added a new position in Nordstrom and added to several other issues on price weakness, specifically Apple, Target, Wells Fargo and United Technologies. Eliminated from the Fund were Applied Materials, PepsiCo, R.R. Donnelley and HSBC. Overall, the Fund benefited from the rotation from defensive stocks to more cyclical companies as the period progressed. The Fund is well diversified across all eleven economic sectors and is structured to benefit as the economy grows. The Fund seeks to invest in companies that provide above average and growing dividends and uses covered call options to enhance the cash flow to the Fund.
FBP Appreciation & Income Opportunities Fund Review
The FBP Appreciation & Income Opportunities Fund returned 5.86% for the semi-annual period and 11.25% for the annual period ended September 30, 2016. The S&P 500 Index returned 6.40% and 15.43% and the Bloomberg Barclays U.S. Government/Credit Index returned 3.08% and 5.86% over the same periods. The Fund was 75.8% equity, 12.9% fixed income and 11.3% cash as of September 30, 2016. The Fund’s solid results were driven by strong equity returns. Positive attribution was provided by the Financials, Health Care, Information Technology and Energy sectors. Devon Energy, Merck and Lincoln National were the top individual contributors. Consumer Discretionary and Utilities were the weaker sectors. Noble Corp. and Staples were the individual laggards. Investments were added to Apple, Target, and Untied Technologies and a new position in Nokia Corp. was added. The Fund also benefited from the rotation from defensive issues to more cyclical companies as the period progressed. On the fixed income portion of the Fund, the short-to-intermediate duration of the fixed investments should provide some cushion as interest rates gradually move higher.
Looking Ahead
With the election results in and a change in policies on the horizon, equity investors have moved portfolios to be more economically sensitive expecting improved growth and higher inflation. Fixed income markets have reacted negatively to these same expectations as the long awaited normalization of interest rates is beginning to happen. In our opinion, both Funds are currently structured to benefit in this environment. Earnings growth is the key factor needed to fuel future stock market gains. We are hopeful that the Trump administration’s pro growth policies will materialize and corporate earnings will indeed pick up. Consumers have been the driver of the economy and now the opportunity is present for corporations to increase capital spending as well. We also expect to see continued restructuring by companies, acquisitions to increase growth opportunities and stock buybacks.
We want to thank you for your continued support and investment in the Flippin, Bruce & Porter Funds. Please visit our website at www.fbpfunds.com for information on your Funds and the investment philosophy and process we utilize to achieve their investment objectives.

John T. Bruce, CFA
President - Portfolio Manager
November 15, 2016
2
Data presented reflects past performance, which is no guarantee of future results. Investment results and principal value will fluctuate so that shares, when redeemed, may be worth more or less than their original cost. Due to market volatility, current performance may be higher or lower than the performance shown.Updated performance information, current through the most recent month-end, is available by contacting the Funds at 1-866-738-1127.
This report is submitted for the general information of the shareholders of the Funds. It reflects our views, opinions and portfolio holdings as of the date of this letter. These views are subject to change at any time based upon market or other conditions. For more current information throughout the year please visit www.fbpfunds.com or call the Funds at 1-866-738-1127. This report is not authorized for distribution to prospective investors in the Funds unless accompanied by a current prospectus.
3
THE FLIPPIN, BRUCE & PORTER FUNDS
COMPARATIVE PERFORMANCE CHARTS
(Unaudited)
Performance for each Fund is compared to the most appropriate broad-based index, the Standard and Poor’s 500® Index, an unmanaged index of 500 large common stocks. Results are also compared to the Consumer Price Index, a measure of inflation.

4
THE FLIPPIN, BRUCE & PORTER FUNDS
COMPARATIVE PERFORMANCE CHARTS
(Unaudited) (Continued)
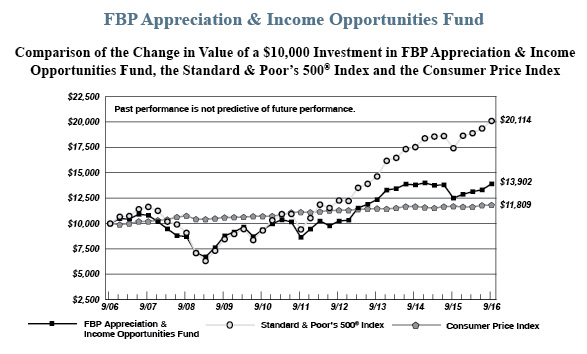
Average Annual Total Returns (for periods ended September 30, 2016) | |||
| 1 Year | 5 Years | 10 Years |
FBP Equity & Dividend Plus Fund(a) | 15.06% | 12.45% | 2.06% |
FBP Appreciation & Income Opportunities Fund(a) | 11.25% | 10.01% | 3.35% |
Standard & Poor’s 500® Index | 15.43% | 16.37% | 7.24% |
Consumer Price Index | 1.08% | 1.23% | 1.68% |
(a) | Total returns are a measure of the change in value of an investment in the Funds over the periods covered, which assumes any dividends or capital gains distributions are reinvested in shares of the Funds. Returns do not reflect the deduction of taxes a shareholder would pay on the Funds’ distributions or the redemption of Fund shares. |
5
FBP EQUITY & DIVIDEND PLUS FUND
PORTFOLIO INFORMATION
September 30, 2016 (Unaudited)
General Information |
| |||
Net Asset Value Per Share | $ | 23.84 | ||
Total Net Assets ( Millions ) | $ | 25.6 | ||
Current Expense Ratio | 1.07 | % | ||
Portfolio Turnover | 9 | % | ||
Fund Inception Date | 7/30/1993 | |||
Stock Characteristics | Fund | S&P 500® Index |
Number of Stocks | 49 | 500 |
Weighted Avg Market Capitalization ( Billions ) | $ 134.0 | $ 147.0 |
Price-to-Earnings Ratio (Bloomberg 1 Yr. Forecast EPS) | 13.8 | 16.9 |
Price-to-Book Value | 1.9 | 2.9 |
Asset Allocation (% of Net Assets) |
|

Sector Diversification vs. the S&P 500® Index |
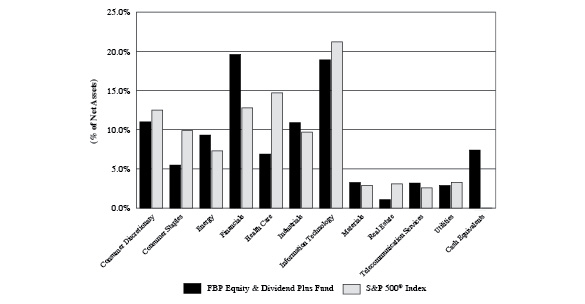
Ten Largest Equity Holdings | % of Net Assets |
JPMorgan Chase & Company | 4.0% |
Procter & Gamble Company (The) | 3.5% |
Apple, Inc. | 3.4% |
Merck & Company, Inc. | 3.1% |
International Business Machines Corporation | 2.8% |
Pfizer, Inc. | 2.6% |
Western Union Company (The) | 2.6% |
Cisco Systems, Inc. | 2.5% |
Microsoft Corporation | 2.5% |
Chevron Corporation | 2.4% |
6
FBP APPRECIATION & INCOME OPPORTUNITIES FUND
PORTFOLIO INFORMATION
September 30, 2016 (Unaudited)
General Information | |
Net Asset Value Per Share | $ 17.37 |
Total Net Assets ( Millions ) | $ 32.0 |
Current Expense Ratio | 1.00% |
Portfolio Turnover | 10% |
Fund Inception Date | 7/3/1989 |
Asset Allocation (% of Net Assets) |
|
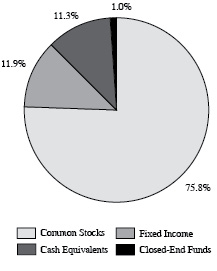
Common Stock Portfolio (75.8% of Fund ) | |
Number of Stocks | 52 |
Weighted Avg Market Capitalization ( Billions ) | $ 123.4 |
Price-to-Earnings Ratio (Bloomberg 1 Yr. Forecast EPS) | 14.1 |
Price-to-Book Value | 1.7 |
Ten Largest Equity Holdings | % of Net Assets |
Microsoft Corporation | 3.1% |
Bank of America Corporation | 2.9% |
Apple, Inc. | 2.8% |
Merck & Company, Inc. | 2.7% |
Cisco Systems, Inc. | 2.7% |
JPMorgan Chase & Company | 2.5% |
Travelers Companies, Inc. (The) | 2.3% |
International Business Machines Corporation | 2.2% |
Western Union Company (The) | 2.2% |
Pfizer, Inc. | 2.1% |
Five Largest Sectors | % of Net Assets |
Information Technology | 15.8% |
Financials | 15.5% |
Energy | 9.8% |
Industrials | 9.0% |
Consumer Discretionary | 7.4% |
Fixed-Income Portfolio (11.9% of Fund) | |
Number of Fixed-Income Securities | 7 |
Average Quality | BBB |
Average Weighted Maturity | 4.0 yrs |
Average Effective Duration | 3.8 yrs |
Sector Breakdown | % of Net Assets |
Energy | 3.2% |
Industrials | 2.4% |
Utilities | 1.6% |
Financials | 1.6% |
Consumer Discretionary | 1.6% |
U.S. Government & Agency Obligations | 1.5% |
7
FBP EQUITY & DIVIDEND PLUS FUND |
COMMON STOCKS — 92.6% | Shares | Value | ||||||
Consumer Discretionary — 11.0% | ||||||||
Best Buy Company, Inc. (a) | 10,000 | $ | 381,800 | |||||
Coach, Inc. | 11,000 | 402,160 | ||||||
Ford Motor Company | 39,500 | 476,765 | ||||||
Kohl's Corporation | 9,400 | 411,250 | ||||||
Nordstrom, Inc. (a) | 6,300 | 326,844 | ||||||
Staples, Inc. | 41,500 | 354,825 | ||||||
Target Corporation | 6,900 | 473,892 | ||||||
2,827,536 | ||||||||
Consumer Staples — 5.5% | ||||||||
Coca-Cola Company (The) (a) | 6,000 | 253,920 | ||||||
Procter & Gamble Company (The) (a) | 10,000 | 897,500 | ||||||
Wal-Mart Stores, Inc. (a) | 3,700 | 266,844 | ||||||
1,418,264 | ||||||||
Energy — 9.3% | ||||||||
Chevron Corporation | 6,000 | 617,520 | ||||||
ConocoPhillips (a) | 12,200 | 530,334 | ||||||
Exxon Mobil Corporation | 3,500 | 305,480 | ||||||
Occidental Petroleum Corporation (a) | 5,900 | 430,228 | ||||||
Royal Dutch Shell plc - Class B - ADR | 9,500 | 501,885 | ||||||
2,385,447 | ||||||||
Financials — 19.6% | ||||||||
BB&T Corporation | 15,500 | 584,660 | ||||||
JPMorgan Chase & Company (a) | 15,358 | 1,022,689 | ||||||
KeyCorp | 39,940 | 486,070 | ||||||
Manulife Financial Corporation | 20,000 | 282,200 | ||||||
MetLife, Inc. | 11,200 | 497,616 | ||||||
People's United Financial, Inc. | 25,000 | 395,500 | ||||||
Prudential Financial, Inc. | 6,900 | 563,385 | ||||||
U.S. Bancorp | 14,200 | 609,038 | ||||||
Wells Fargo & Company | 13,000 | 575,640 | ||||||
5,016,798 | ||||||||
Health Care — 6.9% | ||||||||
Johnson & Johnson | 2,600 | 307,138 | ||||||
Merck & Company, Inc. (a) | 12,800 | 798,848 | ||||||
Pfizer, Inc. (a) | 20,000 | 677,400 | ||||||
1,783,386 | ||||||||
Industrials — 10.9% | ||||||||
Eaton Corporation plc | 8,000 | 525,680 | ||||||
Emerson Electric Company | 10,000 | 545,100 | ||||||
General Electric Company | 20,800 | 616,096 | ||||||
Koninklijke Philips N.V. | 11,379 | 336,704 | ||||||
United Parcel Service, Inc. - Class B | 2,600 | 284,336 | ||||||
United Technologies Corporation | 4,700 | 477,520 | ||||||
2,785,436 | ||||||||
8
FBP EQUITY & DIVIDEND PLUS FUND |
COMMON STOCKS — 92.6% (Continued) | Shares | Value | ||||||
Information Technology — 18.9% | ||||||||
Apple, Inc. (a) | 7,700 | $ | 870,485 | |||||
Cisco Systems, Inc. | 20,000 | 634,400 | ||||||
Hewlett Packard Enterprise Company (a) | 19,500 | 443,625 | ||||||
HP, Inc. | 30,000 | 465,900 | ||||||
Intel Corporation | 11,000 | 415,250 | ||||||
International Business Machines Corporation | 4,500 | 714,825 | ||||||
Microsoft Corporation (a) | 11,000 | 633,600 | ||||||
Western Union Company (The) (a) | 32,000 | 666,240 | ||||||
4,844,325 | ||||||||
Materials — 3.3% | ||||||||
Mosaic Company (The) (a) | 9,000 | 220,140 | ||||||
Nucor Corporation (a) | 9,000 | 445,050 | ||||||
Rio Tinto plc - ADR | 5,600 | 187,040 | ||||||
852,230 | ||||||||
Real Estate — 1.1% | ||||||||
Ventas, Inc. (a) | 4,000 | 282,520 | ||||||
Telecommunication Services — 3.2% | ||||||||
AT&T, Inc. | 8,500 | 345,185 | ||||||
CenturyLink, Inc. (a) | 17,000 | 466,310 | ||||||
811,495 | ||||||||
Utilities — 2.9% | ||||||||
FirstEnergy Corporation (a) | 17,000 | 562,360 | ||||||
PPL Corporation (a) | 5,000 | 172,850 | ||||||
735,210 | ||||||||
Total Common Stocks (Cost $19,160,821) | $ | 23,742,647 | ||||||
MONEY MARKET FUNDS — 7.6% | Shares | Value | ||||||
Fidelity Institutional Money Market Government Portfolio - Class I, 0.27% (b) (Cost $1,952,164) | 1,952,164 | $ | 1,952,164 | |||||
Total Investments at Value — 100.2%(Cost $21,112,985) | $ | 25,694,811 | ||||||
Liabilities in Excess of Other Assets — (0.2%) | (60,844 | ) | ||||||
Net Assets — 100.0% | $ | 25,633,967 | ||||||
ADR - American Depositary Receipt. | |
(a) | Security covers a written call option. |
(b) | The rate shown is the 7-day effective yield as of September 30, 2016. |
See accompanying notes to financial statements. | |
9
FBP EQUITY & DIVIDEND PLUS FUND |
COVERED CALL OPTIONS | Option Contracts | Value of | Premiums Received | |||||||||
Apple, Inc, | ||||||||||||
03/17/2017 at $120 | 25 | $ | 9,625 | $ | 13,424 | |||||||
Best Buy Company, Inc., | ||||||||||||
03/17/2017 at $38 | 100 | 32,600 | 34,195 | |||||||||
CenturyLink, Inc., | ||||||||||||
10/21/2016 at $35 | 70 | 350 | 8,187 | |||||||||
Coca-Cola Company (The), | ||||||||||||
11/18/2016 at $46 | 60 | 240 | 5,517 | |||||||||
ConocoPhillips, | ||||||||||||
11/18/2016 at $50 | 60 | 1,200 | 11,217 | |||||||||
FirstEnergy Corporation, | ||||||||||||
10/21/2016 at $38 | 100 | 500 | 11,696 | |||||||||
Hewlett Packard Enterprise Company, | ||||||||||||
11/18/2016 at $17 | 195 | 126,750 | 22,807 | |||||||||
JPMorgan Chase & Company, | ||||||||||||
12/16/2016 at $67.5 | 35 | 6,300 | 6,368 | |||||||||
Merck & Company, Inc., | ||||||||||||
01/20/2017 at $60 | 66 | 27,126 | 12,999 | |||||||||
Microsoft Corporation, | ||||||||||||
11/18/2016 at $60 | 55 | 3,960 | 6,708 | |||||||||
Mosaic Company (The), | ||||||||||||
03/17/2017 at $33 | 55 | 3,025 | 10,557 | |||||||||
Nordstrom, Inc., | ||||||||||||
01/20/2017 at $55.15 | 30 | 6,840 | 6,749 | |||||||||
Nucor Corporation, | ||||||||||||
10/21/2016 at $48 | 70 | 15,680 | 13,326 | |||||||||
01/20/2017 at $55 | 20 | 1,620 | 3,139 | |||||||||
Occidental Petroleum Corporation, | ||||||||||||
11/18/2016 at $82.5 | 30 | 600 | 6,059 | |||||||||
Pfizer, Inc., | ||||||||||||
01/20/2017 at $37 | 100 | 1,800 | 8,696 | |||||||||
PPL Corporation, | ||||||||||||
01/20/2017 at $40 | 50 | 500 | 5,848 | |||||||||
Procter & Gamble Company (The), | ||||||||||||
01/20/2017 at $87.5 | 50 | 20,850 | 12,598 | |||||||||
Ventas, Inc., | ||||||||||||
11/18/2016 at $70 | 40 | 11,600 | 6,478 | |||||||||
Wal-Mart Stores, Inc., | ||||||||||||
01/20/2017 at $75 | 37 | 5,291 | 6,251 | |||||||||
Western Union Company (The), | ||||||||||||
01/20/2017 at $20 | 170 | 21,250 | 17,333 | |||||||||
$ | 297,707 | $ | 230,152 | |||||||||
See accompanying notes to financial statements. |
10
FBP APPRECIATION & INCOME OPPORTUNITIES FUND |
COMMON STOCKS — 75.8% | Shares | Value | ||||||
Consumer Discretionary — 7.4% | ||||||||
Bloomin' Brands, Inc. | 22,000 | $ | 379,280 | |||||
Coach, Inc. | 12,000 | 438,720 | ||||||
Ford Motor Company | 40,000 | 482,800 | ||||||
Kohl's Corporation | 9,000 | 393,750 | ||||||
Staples, Inc. | 35,000 | 299,250 | ||||||
Target Corporation | 5,500 | 377,740 | ||||||
2,371,540 | ||||||||
Consumer Staples — 5.2% | ||||||||
CVS Caremark Corporation | 3,800 | 338,162 | ||||||
PepsiCo, Inc. | 2,500 | 271,925 | ||||||
Procter & Gamble Company (The) (a) | 4,500 | 403,875 | ||||||
Wal-Mart Stores, Inc. | 9,000 | 649,080 | ||||||
1,663,042 | ||||||||
Energy — 9.8% | ||||||||
Baker Hughes, Inc. | 8,000 | 403,760 | ||||||
Chevron Corporation | 5,000 | 514,600 | ||||||
ConocoPhillips (a) | 12,500 | 543,375 | ||||||
Devon Energy Corporation | 14,000 | 617,540 | ||||||
Noble Corporation plc | 24,000 | 152,160 | ||||||
Occidental Petroleum Corporation | 5,200 | 379,184 | ||||||
Royal Dutch Shell plc - Class B - ADR | 10,000 | 528,300 | ||||||
3,138,919 | ||||||||
Financials — 15.5% | ||||||||
Bank of America Corporation | 59,000 | 923,350 | ||||||
Bank of New York Mellon Corporation (The) | 13,500 | 538,380 | ||||||
Capital One Financial Corporation | 6,000 | 430,980 | ||||||
JPMorgan Chase & Company | 12,000 | 799,080 | ||||||
KeyCorp | 16,320 | 198,614 | ||||||
Lincoln National Corporation | 14,000 | 657,720 | ||||||
MetLife, Inc. | 15,000 | 666,450 | ||||||
Travelers Companies, Inc. (The) | 6,500 | 744,575 | ||||||
4,959,149 | ||||||||
Health Care — 4.8% | ||||||||
Merck & Company, Inc. (a) | 14,000 | 873,740 | ||||||
Pfizer, Inc. | 20,000 | 677,400 | ||||||
1,551,140 | ||||||||
Industrials — 9.0% | ||||||||
Eaton Corporation plc | 8,000 | 525,680 | ||||||
FedEx Corporation | 1,700 | 296,956 | ||||||
General Electric Company | 17,000 | 503,540 | ||||||
Ingersoll-Rand plc | 4,700 | 319,318 | ||||||
Koninklijke Philips N.V. | 16,578 | 490,543 | ||||||
11
FBP APPRECIATION & INCOME OPPORTUNITIES FUND |
COMMON STOCKS — 75.8% (Continued) | Shares | Value | ||||||
Industrials — 9.0% (Continued) | ||||||||
Norfolk Southern Corporation | 3,000 | $ | 291,180 | |||||
United Technologies Corporation | 4,600 | 467,360 | ||||||
2,894,577 | ||||||||
Information Technology — 15.8% | ||||||||
Apple, Inc. | 7,800 | 881,790 | ||||||
Cisco Systems, Inc. | 27,000 | 856,440 | ||||||
Hewlett Packard Enterprise Company | 16,000 | 364,000 | ||||||
HP, Inc. | 20,000 | 310,600 | ||||||
International Business Machines Corporation | 4,500 | 714,825 | ||||||
Microsoft Corporation | 17,000 | 979,200 | ||||||
Nokia Corporation - ADR | 40,000 | 231,600 | ||||||
Western Union Company (The) | 34,000 | 707,880 | ||||||
5,046,335 | ||||||||
Materials — 3.9% | ||||||||
E.I. du Pont de Nemours and Company | 4,000 | 267,880 | ||||||
Freeport-McMoRan, Inc. | 25,000 | 271,500 | ||||||
Mosaic Company (The) | 6,000 | 146,760 | ||||||
Nucor Corporation (a) | 6,000 | 296,700 | ||||||
Rio Tinto plc - ADR | 8,000 | 267,200 | ||||||
1,250,040 | ||||||||
Real Estate — 1.0% | ||||||||
Ventas, Inc. (a) | 4,500 | 317,835 | ||||||
Telecommunication Services — 2.1% | ||||||||
AT&T, Inc. | 6,000 | 243,660 | ||||||
CenturyLink, Inc. (a) | 15,000 | 411,450 | ||||||
655,110 | ||||||||
Utilities — 1.3% | ||||||||
FirstEnergy Corporation (a) | 8,000 | 264,640 | ||||||
PPL Corporation | 4,000 | 138,280 | ||||||
402,920 | ||||||||
Total Common Stocks (Cost $18,618,986) | $ | 24,250,607 | ||||||
U.S. GOVERNMENT & AGENCY OBLIGATIONS — 1.5% | Par Value | Value | ||||||
Federal National Mortgage Association — 1.5% | ||||||||
1.20%, due 07/17/2020 (Cost $500,000) | $ | 500,000 | $ | 499,538 | ||||
12
FBP APPRECIATION & INCOME OPPORTUNITIES FUND |
CORPORATE BONDS — 10.4% | Par Value | Value | ||||||
Consumer Discretionary — 1.6% | ||||||||
Mattel, Inc., 2.35%, due 05/06/2019 | $ | 500,000 | $ | 508,456 | ||||
Energy — 3.2% | ||||||||
Dominion Resources, Inc., 2.50%, due 12/01/2019 | 500,000 | 512,073 | ||||||
Pioneer Natural Resources Company, 3.95%, due 07/15/2022 | 500,000 | 532,068 | ||||||
1,044,141 | ||||||||
Financials — 1.6% | ||||||||
Unum Group, 3.00%, due 05/15/2021 | 500,000 | 511,224 | ||||||
Industrials — 2.4% | ||||||||
Ryder System, Inc., 2.50%, due 05/11/2020 | 750,000 | 759,702 | ||||||
Utilities — 1.6% | ||||||||
PSEG Power LLC, 3.00%, due 06/15/2021 | 500,000 | 514,468 | ||||||
Total Corporate Bonds (Cost $3,247,073) | $ | 3,337,991 | ||||||
CLOSED-END FUNDS — 1.0% | Shares | Value | ||||||
Prudential Short Duration High Yield Fund, Inc. (Cost $291,069) | 20,000 | $ | 319,800 | |||||
MONEY MARKET FUNDS — 12.1% | Shares | Value | ||||||
Fidelity Institutional Money Market Government Portfolio - Class I, 0.27% (b) | 3,092,514 | $ | 3,092,514 | |||||
First American Government Obligations Fund - Class Z, 0.25% (b) | 775,456 | 775,456 | ||||||
Total Money Market Funds (Cost $3,867,970) | $ | 3,867,970 | ||||||
Total Investments at Value — 100.8%(Cost $26,525,098) | $ | 32,275,906 | ||||||
Liabilities in Excess of Other Assets — (0.8%) | (270,490 | ) | ||||||
Net Assets — 100.0% | $ | 32,005,416 | ||||||
ADR - American Depositary Receipt. | |
(a) | Security covers a written call option. |
(b) | The rate shown is the 7-day effective yield as of September 30, 2016. |
See accompanying notes to financial statements. | |
13
FBP APPRECIATION & INCOME OPPORTUNITIES FUND |
COVERED CALL OPTIONS | Option Contracts | Value of | Premiums Received | |||||||||
CenturyLink, Inc., | ||||||||||||
10/21/2016 at $35 | 50 | $ | 250 | $ | 5,848 | |||||||
ConocoPhillips, | ||||||||||||
11/18/2016 at $50 | 60 | 1,200 | 11,218 | |||||||||
FirstEnergy Corporation, | ||||||||||||
10/21/2016 at $38 | 40 | 200 | 4,678 | |||||||||
Merck & Company, Inc., | ||||||||||||
01/20/2017 at $60 | 40 | 16,440 | 7,878 | |||||||||
Nucor Corporation, | ||||||||||||
10/21/2016 at $48 | 50 | 11,200 | 9,519 | |||||||||
Procter & Gamble Company (The), | ||||||||||||
01/20/2017 at $87.5 | 15 | 6,255 | 3,779 | |||||||||
Ventas, Inc., | ||||||||||||
11/18/2016 at $70 | 45 | 13,050 | 7,288 | |||||||||
$ | 48,595 | $ | 50,208 | |||||||||
See accompanying notes to financial statements. |
14
THE FLIPPIN, BRUCE & PORTER FUNDS |
FBP Equity | FBP | |||||||
ASSETS | ||||||||
Investments in securities: | ||||||||
At acquisition cost | $ | 21,112,985 | $ | 26,525,098 | ||||
At value (Note 2) | $ | 25,694,811 | $ | 32,275,906 | ||||
Cash | — | 1,504 | ||||||
Dividends and interest receivable | 42,174 | 61,324 | ||||||
Receivable for investment securities sold | 211,182 | 251,037 | ||||||
Receivable for capital shares sold | 2,200 | — | ||||||
Other assets | 12,767 | 12,072 | ||||||
TOTAL ASSETS | 25,963,134 | 32,601,843 | ||||||
LIABILITIES | ||||||||
Written call options, at value (Notes 2 and 5) (premiums received $230,152 and $50,208, respectively) | 297,707 | 48,595 | ||||||
Distributions payable | 2,373 | 9,509 | ||||||
Payable for investment securities purchased | — | 500,000 | ||||||
Payable for capital shares redeemed | 9,480 | 14,240 | ||||||
Accrued investment advisory fees (Note 4) | 12,127 | 16,213 | ||||||
Payable to administrator (Note 4) | 5,700 | 5,700 | ||||||
Other accrued expenses | 1,780 | 2,170 | ||||||
TOTAL LIABILITIES | 329,167 | 596,427 | ||||||
NET ASSETS | $ | 25,633,967 | $ | 32,005,416 | ||||
Net assets consist of: | ||||||||
Paid-in capital | $ | 21,148,678 | $ | 25,802,166 | ||||
Accumulated (distributions in excess of) net investment income | 537 | (15,416 | ) | |||||
Accumulated net realized gains (losses) from security transactions | (29,519 | ) | 466,245 | |||||
Net unrealized appreciation (depreciation) on: | ||||||||
Investments | 4,581,826 | 5,750,808 | ||||||
Written option contracts | (67,555 | ) | 1,613 | |||||
Net assets | $ | 25,633,967 | $ | 32,005,416 | ||||
Shares of beneficial interest outstanding (unlimited number of shares authorized, $0.01 par value) | 1,075,237 | 1,842,195 | ||||||
Net asset value, offering price and redemption price per share (Note 2) | $ | 23.84 | $ | 17.37 | ||||
See accompanying notes to financial statements. |
15
THE FLIPPIN, BRUCE & PORTER FUNDS |
FBP Equity | FBP Appreciation | |||||||
INVESTMENT INCOME | ||||||||
Dividends | $ | 424,807 | $ | 384,075 | ||||
Foreign withholding taxes on dividends | (2,314 | ) | (2,123 | ) | ||||
Interest | — | 43,421 | ||||||
TOTAL INVESTMENT INCOME | 422,493 | 425,373 | ||||||
EXPENSES | ||||||||
Investment advisory fees (Note 4) | 87,666 | 112,081 | ||||||
Administration fees (Note 4) | 30,000 | 30,000 | ||||||
Professional fees | 9,861 | 9,861 | ||||||
Trustees’ fees and expenses (Note 4) | 5,472 | 5,472 | ||||||
Registration and filing fees | 5,280 | 4,912 | ||||||
Compliance service fees (Note 4) | 4,200 | 4,200 | ||||||
Custodian and bank service fees | 3,971 | 3,565 | ||||||
Printing of shareholder reports | 3,596 | 2,308 | ||||||
Postage and supplies | 2,138 | 1,376 | ||||||
Insurance expense | 539 | 675 | ||||||
Other expenses | 3,891 | 5,200 | ||||||
TOTAL EXPENSES | 156,614 | 179,650 | ||||||
Fees voluntarily waived by the Adviser (Note 4) | (22,610 | ) | (19,534 | ) | ||||
NET EXPENSES | 134,004 | 160,116 | ||||||
NET INVESTMENT INCOME | 288,489 | 265,257 | ||||||
REALIZED AND UNREALIZED GAINS (LOSSES) ON INVESTMENTS | ||||||||
Net realized gains from: | ||||||||
Security transactions | 361,655 | 731,792 | ||||||
Written option contracts (Note 5) | 7,446 | 13,232 | ||||||
Net change in unrealized appreciation (depreciation) on: | ||||||||
Investments | 932,528 | 797,911 | ||||||
Written option contracts (Note 5) | (22,451 | ) | 16,689 | |||||
NET REALIZED AND UNREALIZED GAINS ON INVESTMENTS | 1,279,178 | 1,559,624 | ||||||
NET INCREASE IN NET ASSETS FROM OPERATIONS | $ | 1,567,667 | $ | 1,824,881 | ||||
See accompanying notes to financial statements. |
16
FBP EQUITY & DIVIDEND PLUS FUND |
Six Months | Year Ended | |||||||
FROM OPERATIONS | ||||||||
Net investment income | $ | 288,489 | $ | 677,002 | ||||
Net realized gains from: | ||||||||
Security transactions | 361,655 | 422,266 | ||||||
Written option contracts (Note 5) | 7,446 | 165,687 | ||||||
Net realized gains from in-kind redemptions (Note 2) | — | 459,928 | ||||||
Net change in unrealized appreciation (depreciation) on: | ||||||||
Investments | 932,528 | (2,482,528 | ) | |||||
Written option contracts (Note 5) | (22,451 | ) | 33,357 | |||||
Net increase (decrease) in net assets from operations | 1,567,667 | (724,288 | ) | |||||
DISTRIBUTIONS TO SHAREHOLDERS | ||||||||
From net investment income | (289,775 | ) | (676,704 | ) | ||||
From net realized gains from security transactions | — | (1,124,422 | ) | |||||
Decrease in net assets from distributions to shareholders | (289,775 | ) | (1,801,126 | ) | ||||
FROM CAPITAL SHARE TRANSACTIONS | ||||||||
Proceeds from shares sold | 380,844 | 927,125 | ||||||
Net asset value of shares issued in reinvestment of distributions to shareholders | 284,686 | 1,773,837 | ||||||
Payments for shares redeemed | (1,073,510 | ) | (4,193,387 | ) | ||||
Net decrease in net assets from capital share transactions | (407,980 | ) | (1,492,425 | ) | ||||
TOTAL INCREASE (DECREASE) IN NET ASSETS | 869,912 | (4,017,839 | ) | |||||
NET ASSETS | ||||||||
Beginning of period | 24,764,055 | 28,781,894 | ||||||
End of period | $ | 25,633,967 | $ | 24,764,055 | ||||
ACCUMULATED NET INVESTMENT INCOME | $ | 537 | $ | 1,823 | ||||
CAPITAL SHARE ACTIVITY | ||||||||
Shares sold | 16,261 | 39,293 | ||||||
Shares reinvested | 12,184 | 77,361 | ||||||
Shares redeemed | (46,634 | ) | (179,384 | ) | ||||
Net decrease in shares outstanding | (18,189 | ) | (62,730 | ) | ||||
Shares outstanding, beginning of period | 1,093,426 | 1,156,156 | ||||||
Shares outstanding, end of period | 1,075,237 | 1,093,426 | ||||||
See accompanying notes to financial statements. |
17
FBP APPRECIATION & INCOME OPPORTUNITIES FUND |
Six Months | Year Ended | |||||||
FROM OPERATIONS | ||||||||
Net investment income | $ | 265,257 | $ | 606,258 | ||||
Net realized gains from: | ||||||||
Security transactions | 731,792 | 213,815 | ||||||
Written option contracts (Note 5) | 13,232 | 107,759 | ||||||
Net realized gains from in-kind redemptions (Note 2) | — | 2,067,015 | ||||||
Net change in unrealized appreciation (depreciation) on: | ||||||||
Investments | 797,911 | (4,640,221 | ) | |||||
Written option contracts (Note 5) | 16,689 | 10,231 | ||||||
Net increase (decrease) in net assets from operations | 1,824,881 | (1,635,143 | ) | |||||
DISTRIBUTIONS TO SHAREHOLDERS | ||||||||
From net investment income | (271,530 | ) | (631,302 | ) | ||||
From net realized gains from security transactions | — | (1,742,745 | ) | |||||
Decrease in net assets from distributions to shareholders | (271,530 | ) | (2,374,047 | ) | ||||
FROM CAPITAL SHARE TRANSACTIONS | ||||||||
Proceeds from shares sold | 84,524 | 634,129 | ||||||
Net asset value of shares issued in reinvestment of distributions to shareholders | 251,690 | 2,267,673 | ||||||
Payments for shares redeemed | (1,552,654 | ) | (6,214,793 | ) | ||||
Net decrease in net assets from capital share transactions | (1,216,440 | ) | (3,312,991 | ) | ||||
TOTAL INCREASE (DECREASE) IN NET ASSETS | 336,911 | (7,322,181 | ) | |||||
NET ASSETS | ||||||||
Beginning of period | 31,668,505 | 38,990,686 | ||||||
End of period | $ | 32,005,416 | $ | 31,668,505 | ||||
ACCUMULATED DISTRIBUTIONS IN EXCESS OF NET INVESTMENT INCOME | $ | (15,416 | ) | $ | (9,143 | ) | ||
CAPITAL SHARE ACTIVITY | ||||||||
Shares sold | 4,964 | 36,037 | ||||||
Shares reinvested | 14,797 | 130,576 | ||||||
Shares redeemed | (90,762 | ) | (358,024 | ) | ||||
Net decrease in shares outstanding | (71,001 | ) | (191,411 | ) | ||||
Shares outstanding, beginning of period | 1,913,196 | 2,104,607 | ||||||
Shares outstanding, end of period | 1,842,195 | 1,913,196 | ||||||
See accompanying notes to financial statements. |
18
FBP EQUITY & DIVIDEND PLUS FUND |
Selected Per Share Data and Ratios for a Share Outstanding Throughout Each Period | ||||||||||||||||||||||||
Six Months | Years Ended March 31, | |||||||||||||||||||||||
2016 | 2015 | 2014 | 2013 | 2012 | ||||||||||||||||||||
Net asset value at beginning of period | $ | 22.65 | $ | 24.89 | $ | 24.78 | $ | 21.67 | $ | 19.10 | $ | 20.70 | ||||||||||||
Income (loss) from investment operations: | ||||||||||||||||||||||||
Net investment income | 0.27 | 0.61 | 0.50 | 0.42 | 0.47 | 0.23 | ||||||||||||||||||
Net realized and unrealized gains (losses) on investments | 1.19 | (1.21 | ) | 0.57 | 3.11 | 2.56 | (1.59 | ) | ||||||||||||||||
Total from investment operations | 1.46 | (0.60 | ) | 1.07 | 3.53 | 3.03 | (1.36 | ) | ||||||||||||||||
Less distributions: | ||||||||||||||||||||||||
Dividends from net investment income | (0.27 | ) | (0.61 | ) | (0.51 | ) | (0.42 | ) | (0.46 | ) | (0.24 | ) | ||||||||||||
Distributions from net realized gains | — | (1.03 | ) | (0.45 | ) | — | — | — | ||||||||||||||||
Total distributions | (0.27 | ) | (1.64 | ) | (0.96 | ) | (0.42 | ) | (0.46 | ) | (0.24 | ) | ||||||||||||
Net asset value at end of period | $ | 23.84 | $ | 22.65 | $ | 24.89 | $ | 24.78 | $ | 21.67 | $ | 19.10 | ||||||||||||
Total return (a) | 6.48 | %(b) | (2.31 | %) | 4.23 | % | 16.40 | % | 16.19 | % | (6.49 | %) | ||||||||||||
Net assets at end of period (000’s) | $ | 25,634 | $ | 24,764 | $ | 28,782 | $ | 27,794 | $ | 22,570 | $ | 23,194 | ||||||||||||
Ratio of total expenses to average net assets | 1.25 | %(c) | 1.19 | % | 1.17 | % | 1.21 | % | 1.29 | % | 1.29 | % | ||||||||||||
| �� | ||||||||||||||||||||||||
Ratio of net expenses to average net assets (d) | 1.07 | %(c) | 1.07 | % | 1.07 | % | 1.07 | % | 1.07 | % | 1.07 | % | ||||||||||||
Ratio of net investment income to average net assets (d) | 2.30 | %(c) | 2.60 | % | 1.98 | % | 1.82 | % | 2.40 | % | 1.24 | % | ||||||||||||
Portfolio turnover rate | 9 | %(b) | 21 | % | 19 | % | 24 | % | 32 | % | 46 | % | ||||||||||||
(a) | Total return is a measure of the change in value of an investment in the Fund over the period covered, which assumes any dividends or capital gains distributions are reinvested in shares of the Fund. Returns shown do not reflect the deduction of taxes a shareholder would pay on Fund distributions or the redemption of Fund shares. |
(b) | Not annualized. |
(c) | Annualized. |
(d) | Ratios were determined after voluntary advisory fee waivers by the Adviser (Note 4). |
See accompanying notes to financial statements. | |
19
FBP APPRECIATION & INCOME OPPORTUNITIES FUND |
Selected Per Share Data and Ratios for a Share Outstanding Throughout Each Period | ||||||||||||||||||||||||
Six Months | Years Ended March 31, | |||||||||||||||||||||||
2016 | 2015 | 2014 | 2013 | 2012 | ||||||||||||||||||||
Net asset value at beginning of period | $ | 16.55 | $ | 18.53 | $ | 18.97 | $ | 17.16 | $ | 15.85 | $ | 16.35 | ||||||||||||
Income (loss) from investment operations: | ||||||||||||||||||||||||
Net investment income | 0.15 | 0.31 | 0.26 | 0.25 | 0.29 | 0.26 | ||||||||||||||||||
Net realized and unrealized gains (losses) on investments | 0.82 | (1.11 | ) | 0.19 | 2.50 | 1.61 | (0.46 | ) | ||||||||||||||||
Total from investment operations | 0.97 | (0.80 | ) | 0.45 | 2.75 | 1.90 | (0.20 | ) | ||||||||||||||||
Less distributions: | ||||||||||||||||||||||||
Dividends from net investment income | (0.15 | ) | (0.32 | ) | (0.26 | ) | (0.26 | ) | (0.30 | ) | (0.30 | ) | ||||||||||||
Distributions from net realized gains | — | (0.86 | ) | (0.63 | ) | (0.68 | ) | (0.29 | ) | — | ||||||||||||||
Total distributions | (0.15 | ) | (1.18 | ) | (0.89 | ) | (0.94 | ) | (0.59 | ) | (0.30 | ) | ||||||||||||
Net asset value at end of period | $ | 17.37 | $ | 16.55 | $ | 18.53 | $ | 18.97 | $ | 17.16 | $ | 15.85 | ||||||||||||
Total return (a) | 5.86 | %(b) | (4.48 | %) | 2.36 | % | 16.50 | % | 12.51 | % | (1.13 | %) | ||||||||||||
Net assets at end of period (000’s) | $ | 32,005 | $ | 31,669 | $ | 38,991 | $ | 39,951 | $ | 36,825 | $ | 39,520 | ||||||||||||
Ratio of total expenses to average net assets | 1.12 | %(c) | 1.05 | % | 1.04 | % | 1.03 | % | 1.06 | % | 1.06 | % | ||||||||||||
Ratio of net expenses to average net assets (d) | 1.00 | %(c) | 1.00 | % | 1.00 | % | 1.00 | % | 1.00 | % | 1.00 | % | ||||||||||||
Ratio of net investment income to average net assets (d) | 1.66 | %(c) | 1.75 | % | 1.36 | % | 1.36 | % | 1.83 | % | 1.71 | % | ||||||||||||
Portfolio turnover rate | 10 | %(b) | 23 | % | 12 | % | 10 | % | 15 | % | 17 | % | ||||||||||||
(a) | Total return is a measure of the change in value of an investment in the Fund over the period covered, which assumes any dividends or capital gains distributions are reinvested in shares of the Fund. Returns shown do not reflect the deduction of taxes a shareholder would pay on Fund distributions or the redemption of Fund shares. |
(b) | Not annualized. |
(c) | Annualized. |
(d) | Ratios were determined after voluntary advisory fee waivers by the Adviser (Note 4). |
See accompanying notes to financial statements. | |
20
THE FLIPPIN, BRUCE & PORTER FUNDS |
1. Organization
FBP Equity & Dividend Plus Fund and FBP Appreciation & Income Opportunities Fund (the “Funds”) are no-load, diversified series of Williamsburg Investment Trust (the “Trust”), an open-end management investment company registered under the Investment Company Act of 1940. The Trust was organized as a Massachusetts business trust on July 18, 1988. Other series of the Trust are not included in this report.
FBP Equity & Dividend Plus Fund seeks to provide above-average and growing income while also achieving long-term growth of capital.
FBP Appreciation & Income Opportunities Fund seeks long term capital appreciation and current income, assuming a moderate level of investment risk.
2. Significant Accounting Policies
As an investment company, as defined in Financial Accounting Standards Board (“FASB”) Accounting Standards Update 2013-08, each Fund follows accounting and reporting guidance under FASB Accounting Standards Codification Topic 946, “Financial Services – Investment Companies.” The following is a summary of the Funds’ significant accounting policies. These policies are in conformity with accounting principles generally accepted in the United States of America (“GAAP”).
Securities valuation — The Funds’ portfolio securities are valued as of the close of business of the regular session of the New York Stock Exchange (normally 4:00 p.m., Eastern time). Securities traded on a national stock exchange, including common stocks, are valued based upon the closing price on the principal exchange where the security is traded, if available, otherwise, at the last quoted bid price. Securities which are quoted by NASDAQ are valued at the NASDAQ Official Closing Price. Covered call options written by the Funds are valued at the last quoted sale price or, in the absence of a sale, at the ask price on the principal exchanges on which they are traded. Investments representing shares of other investment companies, including closed-end funds and money market funds, are valued at their net asset value as reported by such companies.
Fixed income securities, including government bonds, corporate bonds and municipal bonds, if any, are typically valued on the basis of prices provided by an independent pricing service. The prices provided by the pricing service are determined with consideration given to institutional bid and last sale prices and take into account securities prices, yields, maturities, call features, ratings, institutional trading in similar groups of securities and developments related to specific securities.
When using a quoted price and when the market is considered active, securities will be classified as Level 1 within the fair value hierarchy. When market quotations are not readily available, if a pricing service cannot provide a price or the investment adviser believes the price received from the pricing service is not indicative of market value, securities will be valued in good faith at fair value using methods consistent with procedures adopted by the Board of Trustees and will be classified as Level 2 or 3 within the fair value hierarchy (see below), depending on the inputs used. Such methods of fair valuation may include, but are not limited to: multiple of earnings, multiple of book value, discount from market of a similar freely traded security, purchase price of the security, subsequent private transactions in the security or related securities, or a combination of these and other factors.
21
THE FLIPPIN, BRUCE & PORTER FUNDS |
GAAP establishes a single authoritative definition of fair value, sets out a framework for measuring fair value and requires additional disclosures about fair value measurements. Various inputs are used in determining the value of each Fund’s investments. These inputs are summarized in the three broad levels listed below:
● | Level 1 – quoted prices in active markets for identical securities |
● | Level 2 – other significant observable inputs |
● | Level 3 – significant unobservable inputs |
Fixed income securities, including government bonds, corporate bonds and municipal bonds, if any, held by FBP Appreciation & Income Opportunities Fund are classified as Level 2 since the values for such securities are based on prices provided by an independent pricing service that utilizes various “other significant observable inputs” including bid and ask quotations, prices of similar securities and interest rates, among other factors.
The inputs or methodology used for valuing securities are not necessarily an indication of the risks associated with investing in those securities. The inputs used to measure fair value may fall into different levels of the fair value hierarchy. In such cases, for disclosure purposes, the level in the fair value hierarchy within which the fair value measurement falls in its entirety is determined based on the lowest level input that is significant to the fair value measurement.
The following is a summary of the inputs used to value each Fund’s investments and other financial instruments as of September 30, 2016, by security type:
FBP Equity & Dividend Plus Fund | Level 1 | Level 2 | Level 3 | Total | ||||||||||||
Investments in Securities: | ||||||||||||||||
Common Stocks | $ | 23,742,647 | $ | — | $ | — | $ | 23,742,647 | ||||||||
Money Market Funds | 1,952,164 | — | — | 1,952,164 | ||||||||||||
Total | $ | 25,694,811 | $ | — | $ | — | $ | 25,694,811 | ||||||||
Other Financial Instruments: | ||||||||||||||||
Written Call Options | $ | (297,707 | ) | $ | — | $ | — | $ | (297,707 | ) | ||||||
Total | $ | (297,707 | ) | $ | — | $ | — | $ | (297,707 | ) | ||||||
FBP Appreciation & Income Opportunities Fund | Level 1 | Level 2 | Level 3 | Total | ||||||||||||
Investments in Securities: | ||||||||||||||||
Common Stocks | $ | 24,250,607 | $ | — | $ | — | $ | 24,250,607 | ||||||||
U.S. Government and Agency Bonds | — | 499,538 | — | 499,538 | ||||||||||||
Corporate Bonds | — | 3,337,991 | — | 3,337,991 | ||||||||||||
Closed-End Funds | 319,800 | — | — | 319,800 | ||||||||||||
Money Market Funds | 3,867,970 | — | — | 3,867,970 | ||||||||||||
Total | $ | 28,438,377 | $ | 3,837,529 | $ | — | $ | 32,275,906 | ||||||||
Other Financial Instruments: | ||||||||||||||||
Written Call Options | $ | (48,595 | ) | $ | — | $ | — | $ | (48,595 | ) | ||||||
Total | $ | (48,595 | ) | $ | — | $ | — | $ | (48,595 | ) | ||||||
22
THE FLIPPIN, BRUCE & PORTER FUNDS |
Refer to each Fund’s Schedule of Investments for a listing of the common stocks and corporate bonds by sector type. As of September 30, 2016, the Funds did not have any transfers into and out of any Level. There were no Level 3 securities held by the Funds as of September 30, 2016. It is the Funds’ policy to recognize transfers into and out of any Level at the end of the reporting period.
Share valuation — The net asset value per share of each Fund is calculated daily by dividing the total value of its assets, less liabilities, by the number of shares outstanding. The offering price and redemption price per share of each Fund is equal to its net asset value per share.
Investment income — Interest income is accrued as earned. Dividend income is recorded on the ex-dividend date. Discounts and premiums on fixed income securities purchased are amortized using the interest method. Withholding taxes on foreign dividends have been recorded in accordance with the Funds’ understanding of the appropriate country’s rules and tax rates.
Distributions to shareholders — Dividends arising from net investment income are declared and paid quarterly to shareholders of each Fund. Net realized short-term capital gains, if any, may be distributed throughout the year and net realized long-term capital gains, if any, are distributed at least once each year. The amount of distributions from net investment income and net realized capital gains are determined in accordance with federal income tax regulations, which may differ from GAAP. These “book/tax” differences are either temporary or permanent in nature. Dividends and distributions are recorded on the ex-dividend date. The tax character of distributions paid during the periods ended September 30, 2016 and March 31, 2016 was as follows:
Period | Ordinary Income | Long-Term Capital Gains | Total Distributions | ||||||||||
FBP Equity & Dividend Plus Fund | 9/30/2016 | $ | 289,775 | $ | — | $ | 289,775 | ||||||
3/31/2016 | $ | 676,761 | $ | 1,124,365 | $ | 1,801,126 | |||||||
FBP Appreciation & Income Opportunities Fund | 9/30/2016 | $ | 271,530 | $ | — | $ | 271,530 | ||||||
3/31/2016 | $ | 631,394 | $ | 1,742,653 | $ | 2,374,047 | |||||||
Security transactions — Security transactions are accounted for on trade date for financial reporting purposes. Realized gains and losses on securities sold are determined on a specific identification basis.
Common expenses — Common expenses of the Trust are allocated among the series of the Trust based on relative net assets of each series or the nature of the services performed and the relative applicability to each series.
Options transactions — When the Funds’ investment adviser believes that individual portfolio securities held by the Funds are approaching the top of the adviser’s growth and price expectations, covered call options may be written (sold) against such securities and the Funds will receive a premium in return. The Funds write options only for income generation and hedging purposes and not for speculation. The premiums received from writing the options are recorded as a liability and are subsequently valued daily at the closing prices on their primary exchanges. Premiums received from writing options which expire are treated as realized gains. Premiums received from writing options which are exercised increase the proceeds used to calculate the realized gain or loss on the sale of the underlying security. If a closing purchase transaction
23
THE FLIPPIN, BRUCE & PORTER FUNDS |
is used to terminate a Fund’s obligation on a call option, a gain or loss will be realized, depending upon whether the price of the closing purchase transaction is more or less than the premium previously received on the call option written.
Estimates — The preparation of financial statements in conformity with GAAP requires management to make estimates and assumptions that affect the reported amounts of assets and liabilities and the disclosure of contingent assets and liabilities as of the date of the financial statements and the reported amounts of income and expenses during the reporting period. Actual results could differ from those estimates.
Federal income tax — Each Fund has qualified and intends to continue to qualify as a regulated investment company under the Internal Revenue Code of 1986 (the “Code”). Qualification generally will relieve the Funds of liability for federal income taxes to the extent 100% of their net investment income and any net realized capital gains are distributed in accordance with the Code.
In order to avoid imposition of the excise tax applicable to regulated investment companies, it is also each Fund’s intention to declare as dividends in each calendar year at least 98% of its net investment income (earned during the calendar year) and 98.2% of its net realized capital gains (earned during the twelve months ended October 31) plus undistributed amounts from prior years.
The following information is computed on a tax basis for each item as of September 30, 2016:
FBP Equity | FBP Appreciation & Income Opportunities | |||||||
Tax cost of portfolio investments | $ | 21,112,985 | $ | 26,525,365 | ||||
Gross unrealized appreciation | $ | 5,378,083 | $ | 7,089,128 | ||||
Gross unrealized depreciation | (796,257 | ) | (1,338,587 | ) | ||||
Net unrealized appreciation on investments | 4,581,826 | 5,750,541 | ||||||
Net unrealized appreciation (depreciation) on written option contracts | (67,555 | ) | 1,613 | |||||
Accumulated ordinary income | 2,910 | 10,420 | ||||||
Accumulated capital and other gains (losses) | (29,519 | ) | 450,185 | |||||
Distributions payable | (2,373 | ) | (9,509 | ) | ||||
Accumulated earnings | $ | 4,485,289 | $ | 6,203,250 | ||||
As of September 30, 2016, the tax cost of written option contracts for FBP Equity & Dividend Plus Fund and FBP Appreciation & Income Opportunities Fund was $230,152 and $50,208, respectively.
The difference between the federal income tax cost of portfolio investments and the financial statement cost for FBP Appreciation & Income Opportunities Fund is due to certain differences in the recognition of capital gains and losses under income tax regulations and GAAP. These “book/tax” differences are temporary in nature and are primarily due to differing methods in the amortization of discounts and premiums on fixed income securities.
During the year ended March 31, 2016, FBP Equity & Dividend Plus Fund and FBP Appreciation & Income Opportunities Fund realized $459,928 and $2,067,015, respectively, of net capital gains resulting from in-kind redemptions (redemptions in which shareholders who redeemed Fund shares received securities held
24
THE FLIPPIN, BRUCE & PORTER FUNDS |
by the Fund rather than cash). The Fund recognizes a gain on in-kind redemptions to the extent that the value of the distributed securities on the date of redemption exceeds the cost of those securities. Such gains are not taxable to the Fund and are not required to be distributed to shareholders.
The Funds recognize the tax benefits or expenses of uncertain tax positions only when the position is “more likely than not” to be sustained assuming examination by tax authorities. Management has reviewed the tax positions taken on federal income tax returns for the current and all open tax years (tax years ended March 31, 2013 through March 31, 2016) of each Fund and has concluded that no provision for unrecognized tax benefits or expenses is required in these financial statements.
3. Investment Transactions
Investment transactions, other than short-term investments and U.S. government securities, were as follows for the six months ended September 30, 2016:
FBP Equity | FBP Appreciation & Income Opportunities | |||||||
Purchases of investment securities | $ | 2,139,272 | $ | 2,211,630 | ||||
Proceeds from sales and maturities of investment securities | $ | 3,026,258 | $ | 3,078,464 | ||||
4. Transactions with Related Parties
INVESTMENT ADVISORY AGREEMENTS
Each Fund’s investments are managed by Flippin, Bruce & Porter, Inc. (the “Adviser”) under the terms of an Investment Advisory Agreement. Under the Investment Advisory Agreements, each Fund pays the Adviser a fee, which is computed and accrued daily and paid monthly, at an annual rate of .70% of its average daily net assets up to $250 million; .65% of the next $250 million of such assets; and .50% of such assets in excess of $500 million.
During the six months ended September 30, 2016, the Adviser voluntarily waived $22,610 and $19,534 of its investment advisory fees from FBP Equity & Dividend Plus Fund and FBP Appreciation & Income Opportunities Fund, respectively. These amounts are not subject to recapture in future periods.
Certain officers and a Trustee of the Trust are also officers of the Adviser.
OTHER SERVICE PROVIDERS
Ultimus Fund Solutions, LLC (“Ultimus”) provides administration, fund accounting, compliance and transfer agent services to the Funds. The Funds pay Ultimus fees in accordance with the agreements for such services. In addition, the Funds pay out-of-pocket expenses including, but not limited to, postage, supplies, and costs of pricing the Funds’ portfolio securities. Certain officers of the Trust are also officers of Ultimus, or of Ultimus Fund Distributors, LLC (the “Distributor”), the principal underwriter of each Fund’s shares and an affiliate of Ultimus. The Distributor is compensated by the Adviser (not the Funds) for acting as principal underwriter.
25
THE FLIPPIN, BRUCE & PORTER FUNDS |
COMPENSATION OF TRUSTEES
Trustees and officers affiliated with the Adviser or Ultimus are not compensated by the Trust for their services. Each Trustee who is not an affiliated person of the Adviser or Ultimus receives from the Trust an annual retainer of $15,000, payable quarterly; a fee of $1,500 for attendance at each meeting of the Board of Trustees (except that such fee is $2,500 for the independent chair); and a fee of $1,000 for attendance at each meeting of any committee of the Board (except that such fee is $1,500 for the committee chair); plus reimbursement of travel and other expenses incurred in attending meetings. Each series of the Trust pays its proportionate share of such fees.
5. Derivatives Transactions
Transactions in call option contracts written by the Funds during the six months ended September 30, 2016, were as follows:
| FBP Appreciation | |||||||||||||||
Option Contracts | Option Premiums | Option Contracts | Option Premiums | |||||||||||||
Options outstanding at beginning of period | 1,938 | $ | 231,331 | 930 | $ | 142,774 | ||||||||||
Options written | 1,338 | 211,656 | 160 | 30,163 | ||||||||||||
Options cancelled in a closing purchase transaction | (720 | ) | (101,488 | ) | (260 | ) | (41,313 | ) | ||||||||
Options expired | (868 | ) | (69,094 | ) | (290 | ) | (38,317 | ) | ||||||||
Options exercised | (270 | ) | (42,253 | ) | (240 | ) | (43,099 | ) | ||||||||
Options outstanding at end of period | 1,418 | $ | 230,152 | 300 | $ | 50,208 | ||||||||||
The location in the Statements of Assets and Liabilities of the Funds’ derivative positions is as follows:
FBP Equity & Dividend Plus Fund
Fair Value | |||||||||||||
Type of Derivative | Location | Asset Derivatives | Liability Derivatives | Gross Notional Amount Outstanding September 30, | |||||||||
Equity call options written | Written call options, at value | $ | — | $ | (297,707 | ) | $ | (5,924,955 | ) | ||||
FBP Appreciation & Income Opportunities Fund
Fair Value | |||||||||||||
Type of Derivative | Location | Asset | Liability | Gross Notional Amount Outstanding September 30, | |||||||||
Equity call options written | Written call options, at value | $ | — | $ | (48,595 | ) | $ | (1,479,640 | ) | ||||
26
THE FLIPPIN, BRUCE & PORTER FUNDS |
The average monthly notional amount of option contracts written during the six months ended September 30, 2016 was $6,218,290 and $2,662,391 for FBP Equity & Dividend Plus Fund and FBP Appreciation & Income Opportunities Fund, respectively.
The Funds’ transactions in derivative instruments during the six months ended September 30, 2016 are recorded in the following location in the Statements of Operations:
FBP Equity & Dividend Plus Fund
Type of Derivative | Location | Net | Location | Change in Unrealized Appreciation (Depreciation) | ||||||
Equity Contracts (Call options written) | Net realized gains from written option contracts | $ | 7,446 | Net change in unrealized appreciation (depreciation) on written option contracts | $ | (22,451 | ) | |||
FBP Appreciation & Income Opportunities Fund
Type of Derivative | Location | Net | Location | Change in Unrealized Appreciation (Depreciation) | ||||||
Equity Contracts (Call options written) | Net realized gains from written option contracts | $ | 13,232 | Net change in unrealized appreciation (depreciation) on written option contracts | $ | 16,689 | ||||
6. Contingencies and Commitments
The Funds indemnify the Trust’s officers and Trustees for certain liabilities that might arise from their performance of their duties to the Funds. Additionally, in the normal course of business the Funds enter into contracts that contain a variety of representations and warranties and which provide general indemnifications. The Funds’ maximum exposure under these arrangements is unknown, as this would involve future claims that may be made against the Funds that have not yet occurred. However, based on experience, the Funds expect the risk of loss to be remote.
7. Subsequent Events
The Funds are required to recognize in the financial statements the effects of all subsequent events that provide additional evidence about conditions that existed as of the date of the Statements of Assets and Liabilities. For non-recognized subsequent events that must be disclosed to keep the financial statements from being misleading, the Funds are required to disclose the nature of the event as well as an estimate of its financial effect, or a statement that such an estimate cannot be made. Management has evaluated subsequent events through the issuance of these financial statements and has noted no such events.
27
THE FLIPPIN, BRUCE & PORTER FUNDS |
We believe it is important for you to understand the impact of costs on your investment. All mutual funds have operating expenses. As a shareholder of the Funds, you incur ongoing costs, including management fees and other operating expenses. These ongoing costs, which are deducted from each Fund’s gross income, directly reduce the investment return of the Funds.
A mutual fund’s ongoing costs are expressed as a percentage of its average net assets. This figure is known as the expense ratio. The following examples are intended to help you understand the ongoing costs (in dollars) of investing in the Funds and to compare these costs with the ongoing costs of investing in other mutual funds. The examples below are based on an investment of $1,000 made at the beginning of the period shown and held for the entire period (April 1, 2016 through September 30, 2016).
The table below illustrates each Fund’s ongoing costs in two ways:
Actual fund return – This section helps you to estimate the actual expenses that you paid over the period. The “Ending Account Value” shown is derived from each Fund’s actual return, and the fourth column shows the dollar amount of operating expenses that would have been paid by an investor who started with $1,000 in the Funds. You may use the information here, together with the amount you invested, to estimate the expenses that you paid over the period.
To do so, simply divide your account value by $1,000 (for example, an $8,600 account value divided by $1,000 = 8.6), then multiply the result by the number given for the Funds under the heading “Expenses Paid During Period.”
Hypothetical 5% return – This section is intended to help you compare the Funds’ ongoing costs with those of other mutual funds. It assumes that each Fund had an annual return of 5% before expenses during the period shown, but that the expense ratio is unchanged. In this case, because the returns used are not the Funds’ actual returns, the results do not apply to your investment. The example is useful in making comparisons because the Securities and Exchange Commission (“SEC”) requires all mutual funds to calculate expenses based on a 5% return. You can assess each Fund’s ongoing costs by comparing this hypothetical example with the hypothetical examples that appear in shareholder reports of other funds.
Note that expenses shown in the table are meant to highlight and help you compare ongoing costs only. The Funds do not charge sales loads or redemption fees.
The calculations assume no shares were bought or sold during the period. Your actual costs may have been higher or lower, depending on the amount of your investment and the timing of any purchases or redemptions.
More information about the Funds’ expenses, including annual expense ratios for the past five fiscal years, can be found in this report. For additional information on operating expenses and other shareholder costs, please refer to the Funds’ prospectus.
28
THE FLIPPIN, BRUCE & PORTER FUNDS |
Beginning | Ending 2016 | Net Ratio(a) | Expenses Paid During Period(b) | |||||||||||||
FBP Equity & Dividend Plus Fund | ||||||||||||||||
Based on Actual Fund Return | $ | 1,000.00 | $ | 1,064.80 | 1.07 | % | $ | 5.52 | ||||||||
Based on Hypothetical 5% Return (before expenses) | $ | 1,000.00 | $ | 1,019.65 | 1.07 | % | $ | 5.40 | ||||||||
FBP Appreciation & Income Opportunities Fund | ||||||||||||||||
Based on Actual Fund Return | $ | 1,000.00 | $ | 1,058.60 | 1.00 | % | $ | 5.15 | ||||||||
Based on Hypothetical 5% Return (before expenses) | $ | 1,000.00 | $ | 1,020.00 | 1.00 | % | $ | 5.05 | ||||||||
(a) | Annualized, based on the Fund’s most recent one-half year expenses. |
(b) | Expenses are equal to the Fund’s net expense ratio multiplied by the average account value over the period, multiplied by 183/366 (to reflect the one-half year period). |
29
THE FLIPPIN, BRUCE & PORTER FUNDS |
The Trust files a complete listing of portfolio holdings for the Funds with the SEC as of the end of the first and third quarters of each fiscal year on Form N-Q. The filings are available upon request, by calling 1-800-327-9375. Furthermore, you may obtain a copy of these filings on the SEC’s website at http://www.sec.gov. The Trust’s Forms N-Q may also be reviewed and copied at the SEC’s Public Reference Room in Washington, DC, and information on the operation of the Public Reference Room may be obtained by calling 1-800-SEC-0330.
A description of the policies and procedures that the Funds use to determine how to vote proxies relating to portfolio securities is available without charge upon request by calling toll-free 1-800-327-9375, or on the SEC’s website at http://www.sec.gov. Information regarding how the Funds voted proxies relating to portfolio securities during the most recent 12-month period ended June 30 is also available without charge upon request by calling toll-free 1-800-327-9375, or on the SEC’s website at http://www.sec.gov.
30
This page intentionally left blank.
This page intentionally left blank.
This page intentionally left blank.
 | |
Investment Adviser
Flippin, Bruce & Porter, Inc. 800 Main Street, Second Floor P.O. Box 6138 Lynchburg, Virginia 24505 Toll-Free 1-800-327-9375 www.fbpfunds.com
Administrator
Ultimus Fund Solutions, LLC P.O. Box 46707 Cincinnati, Ohio 45246-0707 Toll-Free 1-866-738-1127
Custodian
U.S. Bank, N.A. 425 Walnut Street Cincinnati, Ohio 45202
Independent Registered
Cohen & Company, Ltd. Cleveland, Ohio 44115
| Legal Counsel
Sullivan & Worcester LLP One Post Office Square Boston, Massachusetts 02109
Officers
John T. Bruce, President and Portfolio Manager John H. Hanna, IV, Vice President R. Gregory Porter, III,
Trustees
Robert S. Harris, Ph.D., Chairman John P. Ackerly, IV John T. Bruce George K. Jennison Harris V. Morrissette Elizabeth W. Robertson |
34
THE GOVERNMENT STREET FUNDS
No-Load Mutual Funds
Semi-Annual Report
|
 |
The Government Street Equity Fund
The Government Street Mid-Cap Fund
The Alabama Tax Free Bond Fund
|
LETTER FROM THE PRESIDENT | October 2016 |
Dear Fellow Shareholders:
We are enclosing for your review the Semi-Annual Reports of The Government Street Funds for the six months ended September 30, 2016.
The Government Street Equity Fund
The Government Street Equity Fund had a positive return of 4.35% for the semi-annual fiscal period ended September 30, 2016. By comparison, the S&P 500 Index and the Morningstar Large Cap Blend Equity category were up 6.40% and 5.03%, respectively.
The recent semi-annual fiscal period gave investors much to think about as they tried to understand the interactions between political campaigns, continued Federal Reserve inaction and an extended slow growth economy. The overall result was a generally upbeat performance in stocks, a continued modest return from bonds and explosion of many people’s anxiety levels as the 24/7 pre-election news coverage rose to unbearable levels.
Large capitalization domestic stocks generally rose. However, there was significant rotation within the eleven economic sectors that make up the group. The most obvious negative moves came in utilities, real estate and other higher income producing securities as prospects for future increases in interest rates became more probable. Energy reasserted itself with the best sector returns as oil markets recovered toward the fifty dollar per barrel level. Health care stocks were generally under pressure as negative election rhetoric focused on pharmaceutical prices and the excessive costs of The Affordable Care Act became obvious.
All in all, it was a very uncomfortable period as uncertainty was pervasive. It is the environment that requires attention to fundamentals and, we believe, a steady and somewhat cautious approach to investing. The adage, “this too shall pass” is a good mantra for the present time. We achieve that with extensive diversification across all economic sectors and with cash reserves adequate to meet positive or negative contingencies. Please refer to the body of your semi-annual report to confirm that approach.
In the meantime, we will maintain a consistent approach until results from the election give us an indication of favorable and unfavorable areas for future investments. Our current level of 5.6% in money market funds acts as a buffer and/or a reserve to address either of the outcomes.
1
The top 10 holdings in The Government Street Equity Fund as of September 30, 2016 were:
Security Description | % of Net Assets |
Vanguard Mid-Cap ETF | 4.3% |
Visa, Inc. - Class A | 3.7% |
Apple, Inc. | 3.5% |
JPMorgan Chase & Company | 2.7% |
MasterCard, Inc. - Class A | 2.5% |
Lockheed Martin Corporation | 2.4% |
General Dynamics Corporation | 2.3% |
United Technologies Corporation | 2.2% |
Alphabet, Inc. - Class C | 2.1% |
Alphabet, Inc. - Class A | 2.0% |
The significant positive individual performances held for the entire six month period as measured by the internal rate of return were:
Security Description | Return |
NVIDIA Corporation | 93.74% |
Spectra Energy Corporation | 42.75% |
Western Digital Corporation | 36.48% |
Pioneer Natural Resources Company | 31.95% |
Quanta Services, Inc. | 24.07% |
Texas Instruments, Inc. | 23.70% |
The 5 worst individual performances of securities held for the entire six months measured by the internal rate of return were:
Security Description | Return |
Gilead Sciences, Inc. | -13.62% |
NIKE, Inc. - Class B | -13.86% |
Tractor Supply Company | -24.90% |
Goldcorp, Inc. | -28.18% |
Stericycle, Inc. | -36.49% |
2
The following chart is added to give substance to the economic sector performance that is frequently referred to in these semi-annual letters. Obviously, these sectors are populated with many individual stocks. You may review the component securities in the body of the report.
3/31/16 – 9/30/16 | Time Weighted Return (USD) |
The Government Street Equity Fund | 4.79% |
Equity | 5.16% |
Stock | 5.08% |
Consumer Discretionary | -4.32% |
Consumer Staples | 2.85% |
Energy | 15.16% |
Financials | 7.04% |
Health Care | 3.81% |
Industrials | 3.53% |
Information Technology | 9.80% |
Materials | 5.47% |
Telecommunication Services | 6.16% |
Utilities | 0.54% |
Real Estate | -3.54% |
Total | 4.79% |
S&P 500 Index (Total Return) | 6.40% |
Note:The investment performances listed for economic sectors and securities are extracted from an in-house independent internal rate of return computation by the Advent Axys portfolio accounting system. The calculations are gross investment returns.
As of September 30, 2016, the Fund’s net assets were $71,318,138 and the net asset value per share was $63.58. The portfolio turnover rate for the previous six months was 8%. The net expense ratio was 0.86%. The twelve month total return was 9.29%.
The Government Street Mid-Cap Fund
The Government Street Mid-Cap Fund produced a semi-annual fiscal period return, ended September 30, 2016, of 4.84%. By comparison, the S&P MidCap 400 Index and the Morningstar Mid Cap Blend category were up 8.30% and 6.49%, respectively, during the same period. The goal of the Index and your Fund is to demonstrate the results of participating in investments that, in terms of size, are less than the S&P 500, but above the smaller Russell 2000 Index type of securities. Your managers consider these mid cap capitalizations to be a great opportunity to invest in companies that have significant investment futures. They are large enough to have moved beyond the financial and business difficulties of small corporations, but have prospects to grow into the upper tiers of American companies.
Companies in the Fund are impacted by the same general economic environment as the larger capitalization companies. As such, the reviewer should refer to The Government Street Equity Fund’s commentary. The benefit, for investors, is that over longer periods of time, mid capitalization investment results should show greater
3
positive returns for the slightly greater risk that the investor assumes. Diversification in the larger and smaller fund categories is very similar and covers all the same economic areas.
The top 10 holdings in The Government Street Mid Cap Fund as of September 30, 2016 were:
Security Description | % of Net Assets |
Mid-America Apartment Communities, Inc. | 3.1% |
Guggenheim Mid-Cap Core ETF | 3.0% |
Vanguard Mid-Cap ETF | 2.8% |
Jack Henry & Associates, Inc. | 2.0% |
Lam Research Corporation | 1.8% |
Realty Income Corporation | 1.7% |
Albemarle Corporation | 1.7% |
Telefkex, Inc. | 1.7% |
Nasdaq, Inc. | 1.6% |
Ross Stores, Inc. | 1.6% |
The two exchange traded funds (ETFs) are index type investments that provide broad diversification and are used primarily to reduce the risk of the overall portfolio. The investments are highly liquid and can readily provide funds for individual security purchases or to meet any cash needs without disrupting overall diversification or significantly affecting overall portfolio returns.
The most significant positive individual performances of securities held for the entire six month period as measured by the internal rate of return were:
Security Description | Return |
NVIDIA Corporation | 91.22% |
ONEOK, Inc. | 77.86% |
Packaging Corporation of America | 36.50% |
Albemarle Corporation | 34.92% |
Linear Technology Corporation | 34.71% |
The 5 worst individual performances of securities held for the entire six months measured by the internal rate of return were:
Security Description | Return |
Ensign Group. Inc. (The) | -10.58% |
Graco, Inc. | -11.13% |
VF Corporation | -12.35% |
Fastenal Company | -13.59% |
Stericycle, Inc. | -35.95% |
4
The following chart is added to give substance to the economic sector performance that is frequently referred to in these semi-annual letters. Obviously, these sectors are populated with many individual stocks. You may review the component securities in the body of the report.
3/31/16 – 9/30/16 | Time Weighted Return (USD) |
The Government Street Mid-Cap Fund | 4.85% |
Equity | 5.82% |
Stock | 5.67% |
Consumer Discretionary | -0.35% |
Consumer Staples | -1.04% |
Energy | 14.92% |
Financials | 7.42% |
Health Care | 8.12% |
Industrials | 0.34% |
Information Technology | 11.32% |
Materials | 15.71% |
Telecommunication Services | -8.35% |
Utilities | 2.52% |
Real Estate | -1.54% |
Total | 4.85% |
S&P MidCap 400 Index (Total Return) | 8.30% |
Note:The investment performances listed for economic sectors and securities are extracted from an in-house independent internal rate of return computation by the Advent Axys portfolio accounting system. The calculations are gross investment returns.
As of September 30, 2016, the net assets of The Government Street Mid-Cap Fund were $45,831,347 and the net asset value per share was $22.81. The portfolio turnover rate for the previous six months was 7%. The net expense ratio was 1.08%. The twelve month total return was 14.07%.
The Alabama Tax Free Bond Fund
The accommodative policies of the Federal Reserve continued to support fixed income prices during the six month period ended September 30, 2016 and municipal bonds generated modestly positive returns. Continued low yields in the bond market have resulted from economic growth concerns, a growing consensus that the Federal Reserve will further delay raising U.S. rates and ongoing heightened demand for perceived low risk assets as a result of the impact of the Brexit vote on June 23, 2016, when the United Kingdom voted to leave the European Union. The result of the vote was a surprise to global financial markets and a rush to “safe haven” investments was beneficial for U. S. Treasury bonds. The yield on the 10-year U.S. Treasury note plunged to 1.37% on July 5th, its lowest closing level in more than 5 years.
Bond yields began to creep higher in August and September and the yield on the 10-year U. S. Treasury note increased to 1.56% at the end of September, 2016. At its meeting on September 21, 2016, the Federal Reserve remained on hold, choosing not to raise the federal funds rate at that time. It did, however, signal that it is on course
5
to raise the rate later this year, likely at the December meeting. The Fed once again lowered its longer-term forecast of future interest rate hikes. It now forecasts just two rate hikes in 2017, down from three hikes forecasted at the June meeting and the four hikes forecasted at the March meeting. For now, flows into bonds are strong and central banks across the developed world remain hesitant to either spook the markets or hinder a still fragile economic recovery by doing more than just paying lip service to a move away from their easy money policies.
Fundamentals in the municipal bond market remained stable with continued growth in state and local government revenues, albeit at a slower pace than in 2015. Municipal bond default rates were consistent with the improving trends from recent years. On a technical basis, demand has generally remained steady though municipal bond performance has been impacted by a sharp increase in supply. Issuers rushed to market ahead of the election and the potential Fed rate hike and new municipal bond issuance reached record levels in August and September. As a result, municipal bonds have lagged the performance of U. S. Treasury securities in recent months and a general shift to a steeper yield curve has led to short term bonds outperforming longer dated issues.
The Alabama Tax Free Bond Fund maintains its focus on high quality, short and intermediate term bonds. More than 99% of the portfolio was invested in securities rated A, AA, or AAA by Moody’s or Standard & Poor’s rating agencies. The duration of the portfolio as of September 30, 2016 was 2.9 years, unchanged from the fiscal year ended March 31, 2016. The Fund’s weighted average maturity was 3.2 years, also unchanged from the end of the fiscal year.
The total return of The Alabama Tax Free Bond Fund for the six month period ended September 30, 2016 was 0.42%. For the same period, the Bloomberg Barclays 3-Year Municipal Bond Index had a return of 0.43% and the Bloomberg Barclays 7-Year Municipal Bond Index returned 1.76%. The net assets of the Fund as of September 30, 2016 were $28,864,076 and the net asset value per share was $10.49. The ratio of net investment income to average net assets during the six months was 1.27% and the net expense ratio was 0.65%.
Thank you for your continued confidence in The Government Street Funds. Please call us if we can be of further service to you.
Very truly yours,

Thomas W. Leavell
President
Leavell Investment Management, Inc.
The Government Street Funds
6
Data presented reflects past performance, which is no guarantee of future results. Investment results and principal value will fluctuate so that shares, when redeemed, may be worth more or less than their original cost. Due to market volatility, current performance may be higher or lower than the performance shown.
This report is submitted for the general information of the shareholders of the Funds. The report is not authorized for distribution to prospective investors in the Funds unless it is accompanied by a current prospectus.
This report reflects our views, opinions and portfolio holdings as of September 30, 2016, the end of the reporting period. These views are subject to change at any time based upon market or other conditions. For more current information throughout the year please visit www.leavellinvestments.com.
7
THE GOVERNMENT STREET EQUITY FUND
PORTFOLIO INFORMATION
September 30, 2016 (Unaudited)
Asset Allocation
(% of Net Assets)
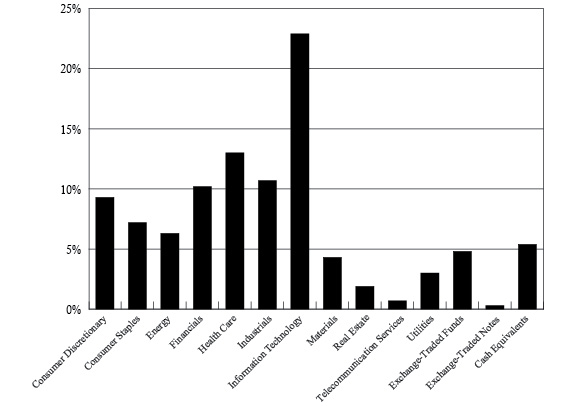
Top Ten Equity Holdings
Security Description | % of Net Assets |
Vanguard Mid-Cap ETF | 4.3% |
Visa, Inc. - Class A | 3.7% |
Apple, Inc. | 3.5% |
JPMorgan Chase & Company | 2.7% |
MasterCard, Inc. - Class A | 2.5% |
Lockheed Martin Corporation | 2.4% |
General Dynamics Corporation | 2.3% |
United Technologies Corporation | 2.2% |
Alphabet, Inc. - Class C | 2.1% |
Alphabet, Inc. - Class A | 2.0% |
8
THE GOVERNMENT STREET MID-CAP FUND
PORTFOLIO INFORMATION
September 30, 2016 (Unaudited)
Asset Allocation
(% of Net Assets)
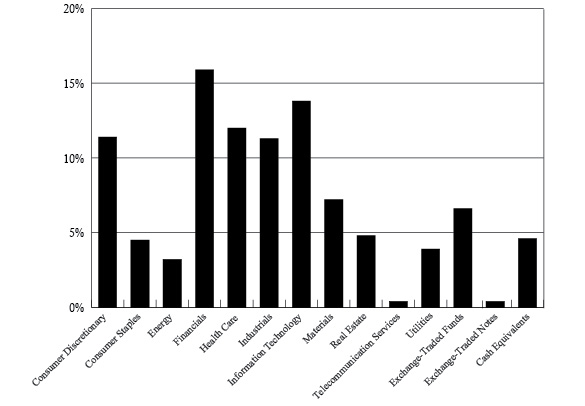
Top Ten Equity Holdings
Security Description | % of Net Assets |
Mid-America Apartment Communities, Inc. | 3.1% |
Guggenheim Mid-Cap Core ETF | 3.0% |
Vanguard Mid-Cap ETF | 2.8% |
Jack Henry & Associates, Inc. | 2.0% |
Lam Research Corporation | 1.8% |
Realty Income Corporation | 1.7% |
Albemarle Corporation | 1.7% |
Teleflex, Inc. | 1.7% |
Nasdaq, Inc. | 1.6% |
Ross Stores, Inc. | 1.6% |
9
THE ALABAMA TAX FREE BOND FUND
PORTFOLIO INFORMATION
September 30, 2016 (Unaudited)
Asset Allocation
(% of Net Assets)
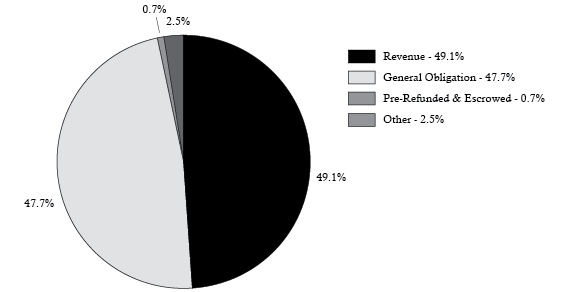
Distribution by Rating | ||
Rating | % of Holdings | |
AAA | 8.2% | |
AA | 72.9% | |
A | 7.3% | |
Not Rated | 11.6% | |
10
THE GOVERNMENT STREET EQUITY FUND |
COMMON STOCKS — 89.5% | Shares | Value | ||||||
Consumer Discretionary — 9.3% | ||||||||
Comcast Corporation - Class A | 20,000 | $ | 1,326,800 | |||||
Dollar Tree, Inc. (a) | 8,000 | 631,440 | ||||||
Home Depot, Inc. (The) | 7,200 | 926,496 | ||||||
Lowe's Companies, Inc. | 8,000 | 577,680 | ||||||
McDonald's Corporation | 5,000 | 576,800 | ||||||
NIKE, Inc. - Class B | 13,900 | 731,835 | ||||||
O'Reilly Automotive, Inc. (a) | 1,400 | 392,154 | ||||||
Ross Stores, Inc. | 7,000 | 450,100 | ||||||
Tractor Supply Company | 4,500 | 303,075 | ||||||
Walt Disney Company (The) | 7,925 | 735,916 | ||||||
6,652,296 | ||||||||
Consumer Staples — 7.2% | ||||||||
Anheuser-Busch InBev SA/NV - ADR | 9,500 | 1,248,395 | ||||||
Coca-Cola Company (The) | 12,000 | 507,840 | ||||||
CVS Health Corporation | 9,000 | 800,910 | ||||||
Kraft Heinz Company (The) | 5,378 | 481,385 | ||||||
McCormick & Company, Inc. - Non-Voting Shares | 7,000 | 699,440 | ||||||
Mondelēz International, Inc. - Class A | 18,836 | 826,900 | ||||||
Procter & Gamble Company (The) | 6,000 | 538,500 | ||||||
5,103,370 | ||||||||
Energy — 6.3% | ||||||||
ConocoPhillips | 15,500 | 673,785 | ||||||
Exxon Mobil Corporation | 8,500 | 741,880 | ||||||
Phillips 66 | 10,800 | 869,940 | ||||||
Pioneer Natural Resources Company | 7,500 | 1,392,375 | ||||||
Spectra Energy Corporation | 19,000 | 812,250 | ||||||
4,490,230 | ||||||||
Financials — 10.2% | ||||||||
Aflac, Inc. | 11,565 | 831,177 | ||||||
Berkshire Hathaway, Inc. - Class B (a) | 8,000 | 1,155,760 | ||||||
Brookfield Asset Management, Inc. - Class A | 33,500 | 1,178,530 | ||||||
CME Group, Inc. - Class A | 8,500 | 888,420 | ||||||
Intercontinental Exchange, Inc. | 4,000 | 1,077,440 | ||||||
JPMorgan Chase & Company | 29,000 | 1,931,110 | ||||||
Toronto-Dominion Bank (The) | 5,000 | 222,000 | ||||||
7,284,437 | ||||||||
Health Care— 13.0% | ||||||||
Abbott Laboratories | 14,000 | 592,060 | ||||||
AbbVie, Inc. | 11,500 | 725,305 | ||||||
Amgen, Inc. | 2,000 | 333,620 | ||||||
Becton, Dickinson and Company | 621 | 111,612 | ||||||
Bio-Techne Corporation | 9,000 | 985,500 | ||||||
11
THE GOVERNMENT STREET EQUITY FUND |
COMMON STOCKS — 89.5%(Continued) | Shares | Value | ||||||
Health Care— 13.0%(Continued) | ||||||||
Cardinal Health, Inc. | 15,000 | $ | 1,165,500 | |||||
Cerner Corporation (a) | 9,000 | 555,750 | ||||||
Gilead Sciences, Inc. | 11,000 | 870,320 | ||||||
Henry Schein, Inc. (a) | 4,500 | 733,410 | ||||||
Merck & Company, Inc. | 14,000 | 873,740 | ||||||
Pfizer, Inc. | 27,000 | 914,490 | ||||||
Regeneron Pharmaceuticals, Inc. (a) | 2,000 | 804,040 | ||||||
Shire plc - ADR | 3,000 | 581,580 | ||||||
9,246,927 | ||||||||
Industrials— 10.7% | ||||||||
Emerson Electric Company | 13,000 | 708,630 | ||||||
General Dynamics Corporation | 10,600 | 1,644,696 | ||||||
Honeywell International, Inc. | 10,000 | 1,165,900 | ||||||
Lockheed Martin Corporation | 7,000 | 1,678,040 | ||||||
Quanta Services, Inc. (a) | 11,500 | 321,885 | ||||||
Stericycle, Inc. (a) | 7,000 | 560,980 | ||||||
United Technologies Corporation | 15,500 | 1,574,800 | ||||||
7,654,931 | ||||||||
Information Technology— 22.9% | ||||||||
Accenture plc - Class A | 9,500 | 1,160,615 | ||||||
Alphabet, Inc. - Class A (a) | 1,800 | 1,447,308 | ||||||
Alphabet, Inc. - Class C (a) | 1,902 | 1,478,406 | ||||||
Apple, Inc. | 22,045 | 2,492,187 | ||||||
Automatic Data Processing, Inc. | 7,500 | 661,500 | ||||||
Facebook, Inc. - Class A (a) | 4,300 | 551,561 | ||||||
Intel Corporation | 12,000 | 453,000 | ||||||
MasterCard, Inc. - Class A | 17,250 | 1,755,532 | ||||||
Microsoft Corporation | 11,000 | 633,600 | ||||||
NVIDIA Corporation | 12,500 | 856,500 | ||||||
TE Connectivity Ltd. | 13,000 | 836,940 | ||||||
Texas Instruments, Inc. | 12,000 | 842,160 | ||||||
Visa, Inc. - Class A | 32,000 | 2,646,400 | ||||||
Western Digital Corporation | 9,000 | 526,230 | ||||||
16,341,939 | ||||||||
Materials— 4.3% | ||||||||
Dow Chemical Company (The) | 11,000 | 570,130 | ||||||
Ecolab, Inc. | 6,000 | 730,320 | ||||||
Goldcorp, Inc. | 8,000 | 132,160 | ||||||
Newmont Mining Corporation | 6,000 | 235,740 | ||||||
Praxair, Inc. | 5,000 | 604,150 | ||||||
Vulcan Materials Company | 7,000 | 796,110 | ||||||
3,068,610 | ||||||||
12
THE GOVERNMENT STREET EQUITY FUND |
COMMON STOCKS — 89.5%(Continued) | Shares | Value | ||||||
Real Estate— 1.9% | ||||||||
Mid-America Apartment Communities, Inc. | 11,394 | $ | 1,070,922 | |||||
Realty Income Corporation | 4,500 | 301,185 | ||||||
1,372,107 | ||||||||
Telecommunication Services— 0.7% | ||||||||
AT&T, Inc. | 13,000 | 527,930 | ||||||
Utilities— 3.0% | ||||||||
Duke Energy Corporation | 8,250 | 660,330 | ||||||
Southern Company (The) | 12,000 | 615,600 | ||||||
WEC Energy Group, Inc. | 14,000 | 838,320 | ||||||
2,114,250 | ||||||||
Total Common Stocks (Cost $38,134,613) | $ | 63,857,027 | ||||||
EXCHANGE-TRADED FUNDS — 4.8% | Shares | Value | ||||||
SPDR® Gold Shares (a) | 3,000 | $ | 376,920 | |||||
Vanguard Mid-Cap ETF | 23,600 | 3,054,784 | ||||||
Total Exchange-Traded Funds (Cost $1,680,711) | $ | 3,431,704 | ||||||
EXCHANGE-TRADED NOTES — 0.3% | Shares | Value | ||||||
JPMorgan Alerian MLP Index ETN (Cost $184,436) | 6,000 | $ | 189,000 | |||||
MONEY MARKET FUNDS - 5.6% | Shares | Value | ||||||
Fidelity Institutional Money Market Government Portfolio - Class I, 0.27% (b) (Cost $3,976,134) | 3,976,134 | $ | 3,976,134 | |||||
Total Investments at Value— 100.2%(Cost $43,975,894) | $ | 71,453,865 | ||||||
Liabilities in Excess of Other Assets—(0.2%) | (135,727 | ) | ||||||
Net Assets—100.0% | $ | 71,318,138 | ||||||
ADR - American Depositary Receipt. | |
(a) | Non-income producing security. |
(b) | The rate shown is the 7-day effective yield as of September 30, 2016. |
See accompanying notes to financial statements. | |
13
THE GOVERNMENT STREET MID-CAP FUND |
COMMON STOCKS — 88.4% | Shares | Value | ||||||
Consumer Discretionary — 11.4% | ||||||||
Cracker Barrel Old Country Store, Inc. | 2,500 | $ | 330,550 | |||||
Dollar Tree, Inc. (a) | 6,995 | 552,115 | ||||||
Gildan Activewear, Inc. | 13,400 | 374,530 | ||||||
Hasbro, Inc. | 7,000 | 555,310 | ||||||
Leggett & Platt, Inc. | 7,000 | 319,060 | ||||||
Nordstrom, Inc. | 3,900 | 202,332 | ||||||
O'Reilly Automotive, Inc. (a) | 1,945 | 544,814 | ||||||
Panera Bread Company - Class A (a) | 2,390 | 465,381 | ||||||
Ross Stores, Inc. | 11,500 | 739,450 | ||||||
Service Corporation International | 15,200 | 403,408 | ||||||
Tiffany & Company | 3,475 | 252,389 | ||||||
Vail Resorts, Inc. | 1,500 | 235,320 | ||||||
VF Corporation | 4,700 | 263,435 | ||||||
5,238,094 | ||||||||
Consumer Staples—4.5% | ||||||||
Church & Dwight Company, Inc. | 9,000 | 431,280 | ||||||
Edgewell Personal Care Company (a) | 4,000 | 318,080 | ||||||
Energizer Holdings, Inc. | 2,500 | 124,900 | ||||||
J.M. Smucker Company (The) | 5,000 | 677,700 | ||||||
Tyson Foods, Inc. - Class A | 7,000 | 522,690 | ||||||
2,074,650 | ||||||||
Energy—3.2% | ||||||||
Helmerich & Payne, Inc. | 4,000 | 269,200 | ||||||
Oil States International, Inc. (a) | 4,000 | 126,280 | ||||||
ONEOK, Inc. | 11,000 | 565,290 | ||||||
Patterson-UTI Energy, Inc. | 22,000 | 492,140 | ||||||
1,452,910 | ||||||||
Financials—15.9% | ||||||||
Alexander & Baldwin, Inc. | 4,000 | 153,680 | ||||||
Alleghany Corporation (a) | 865 | 454,142 | ||||||
American Financial Group, Inc. | 7,600 | 570,000 | ||||||
Arthur J. Gallagher & Company | 9,250 | 470,548 | ||||||
Axis Capital Holdings Ltd. | 5,000 | 271,650 | ||||||
Bank of Hawaii Corporation | 6,500 | 472,030 | ||||||
Berkley (W.R.) Corporation | 6,950 | 401,432 | ||||||
Brown & Brown, Inc. | 9,500 | 358,245 | ||||||
CME Group, Inc. - Class A | 5,735 | 599,422 | ||||||
Cullen/Frost Bankers, Inc. | 4,000 | 287,760 | ||||||
Eaton Vance Corporation | 12,000 | 468,600 | ||||||
Everest Re Group Ltd. | 2,750 | 522,418 | ||||||
Intercontinental Exchange, Inc. | 2,200 | 592,592 | ||||||
Nasdaq, Inc. | 11,000 | 742,940 | ||||||
14
THE GOVERNMENT STREET MID-CAP FUND |
COMMON STOCKS — 88.4%(Continued) | Shares | Value | ||||||
Financials—15.9% (Continued) | ||||||||
Old Republic International Corporation | 24,400 | $ | 429,928 | |||||
SEI Investments Company | 10,500 | 478,905 | ||||||
7,274,292 | ||||||||
Health Care—12.0% | ||||||||
Bio-Rad Laboratories, Inc. - Class A (a) | 2,500 | 409,525 | ||||||
Bio-Techne Corporation | 4,500 | 492,750 | ||||||
Centene Corporation (a) | 11,000 | 736,560 | ||||||
Charles River Laboratories International, Inc. (a) | 4,500 | 375,030 | ||||||
Chemed Corporation | 3,000 | 423,210 | ||||||
Computer Programs & Systems, Inc. | 2,000 | 52,120 | ||||||
Ensign Group, Inc. (The) | 16,000 | 322,080 | ||||||
Henry Schein, Inc. (a) | 3,500 | 570,430 | ||||||
Illumina, Inc. (a) | 2,000 | 363,320 | ||||||
Laboratory Corporation of America Holdings (a) | 2,074 | 285,134 | ||||||
ResMed, Inc. | 6,000 | 388,740 | ||||||
Teleflex, Inc. | 4,500 | 756,225 | ||||||
Waters Corporation (a) | 2,000 | 316,980 | ||||||
5,492,104 | ||||||||
Industrials—11.3% | ||||||||
AMETEK, Inc. | 1,350 | 64,503 | ||||||
C.H. Robinson Worldwide, Inc. | 6,000 | 422,760 | ||||||
Deluxe Corporation | 5,000 | 334,100 | ||||||
Donaldson Company, Inc. | 13,000 | 485,290 | ||||||
Expeditors International of Washington, Inc. | 8,000 | 412,160 | ||||||
Fastenal Company | 11,650 | 486,737 | ||||||
Graco, Inc. | 7,000 | 518,000 | ||||||
Jacobs Engineering Group, Inc. (a) | 5,475 | 283,167 | ||||||
L-3 Communications Holdings, Inc. | 3,000 | 452,190 | ||||||
Matson, Inc. | 4,000 | 159,520 | ||||||
MSC Industrial Direct Company, Inc. - Class A | 6,000 | 440,460 | ||||||
Pentair plc | 2,900 | 186,296 | ||||||
Snap-on, Inc. | 1,475 | 224,141 | ||||||
Stericycle, Inc. (a) | 2,400 | 192,336 | ||||||
Waste Connections, Inc. | 7,000 | 522,900 | ||||||
5,184,560 | ||||||||
Information Technology—13.8% | ||||||||
ANSYS, Inc. (a) | 3,500 | 324,135 | ||||||
Arrow Electronics, Inc. (a) | 10,100 | 646,097 | ||||||
Broadridge Financial Solutions, Inc. | 3,000 | 203,370 | ||||||
DST Systems, Inc. | 5,100 | 601,392 | ||||||
Harris Corporation | 6,000 | 549,660 | ||||||
Jack Henry & Associates, Inc. | 10,500 | 898,275 | ||||||
Lam Research Corporation | 8,500 | 805,035 | ||||||
15
THE GOVERNMENT STREET MID-CAP FUND |
COMMON STOCKS — 88.4%(Continued) | Shares | Value | ||||||
Information Technology—13.8%(Continued) | ||||||||
Linear Technology Corporation | 7,200 | $ | 426,888 | |||||
Microchip Technology, Inc. | 6,000 | 372,840 | ||||||
National Instruments Corporation | 12,000 | 340,800 | ||||||
NVIDIA Corporation | 5,500 | 376,860 | ||||||
Tech Data Corporation (a) | 3,500 | 296,485 | ||||||
Western Digital Corporation | 1,693 | 98,990 | ||||||
Xilinx, Inc. | 7,000 | 380,380 | ||||||
6,321,207 | ||||||||
Materials—7.2% | ||||||||
Albemarle Corporation | 9,000 | 769,410 | ||||||
Ashland Global Holdings, Inc. | 3,000 | 347,850 | ||||||
Goldcorp, Inc. | 9,000 | 148,680 | ||||||
Martin Marietta Materials, Inc. | 3,000 | 537,330 | ||||||
Newmont Mining Corporation | 6,000 | 235,740 | ||||||
Packaging Corporation of America | 7,000 | 568,820 | ||||||
Scotts Miracle-Gro Company (The) - Class A | 5,000 | 416,350 | ||||||
Steel Dynamics, Inc. | 12,000 | 299,880 | ||||||
3,324,060 | ||||||||
Real Estate—4.8% | ||||||||
Mid-America Apartment Communities, Inc. | 15,000 | 1,409,850 | ||||||
Realty Income Corporation | 11,525 | 771,368 | ||||||
2,181,218 | ||||||||
Telecommunication Services—0.4% | ||||||||
Telephone and Data Systems, Inc. | 6,500 | 176,670 | ||||||
Utilities—3.9% | ||||||||
AmeriGas Partners, L.P. | 6,500 | 296,790 | ||||||
ONE Gas, Inc. | 5,000 | 309,200 | ||||||
SCANA Corporation | 8,530 | 617,316 | ||||||
Vectren Corporation | 11,600 | 582,320 | ||||||
1,805,626 | ||||||||
Total Common Stocks (Cost $22,174,385) | $ | 40,525,391 | ||||||
EXCHANGE-TRADED FUNDS — 6.6% | Shares | Value | ||||||
Guggenheim Mid-Cap Core ETF | 26,000 | $ | 1,386,265 | |||||
SPDR® Gold Shares ETF (a) | 2,700 | 339,228 | ||||||
Vanguard Mid-Cap ETF | 9,850 | 1,274,984 | ||||||
Total Exchange-Traded Funds (Cost $1,909,750) | $ | 3,000,477 | ||||||
16
THE GOVERNMENT STREET MID-CAP FUND |
EXCHANGE-TRADED NOTES — 0.4% | Shares | Value | ||||||
JPMorgan Alerian MLP Index ETN (Cost $186,183) | 6,000 | $ | 189,000 | |||||
MONEY MARKET FUNDS — 4.8% | Shares | Value | ||||||
Fidelity Institutional Money Market Government Portfolio - Class I, 0.27% (b) (Cost $2,186,612) | 2,186,612 | $ | 2,186,612 | |||||
Total Investments at Value—100.2%(Cost $26,456,930) | $ | 45,901,480 | ||||||
Liabilities in Excess of Other Assets—(0.2%) | (70,133 | ) | ||||||
Net Assets—100.0% | $ | 45,831,347 | ||||||
(a) | Non-income producing security. |
(b) | The rate shown is the 7-day effective yield as of September 30, 2016. |
See accompanying notes to financial statements. | |
17
THE ALABAMA TAX FREE BOND FUND |
ALABAMA FIXED RATE REVENUE AND GENERAL OBLIGATION (GO) BONDS — 97.5% | Par Value | Value | ||||||
Alabama Drinking Water Financing Auth., Series A, Rev., | ||||||||
3.00%, due 08/15/2019 | $ | 530,000 | $ | 560,740 | ||||
Alabama State Public School & College Auth., Capital Improvements, Rev., | ||||||||
5.00%, due 12/01/2017 | 470,000 | 492,645 | ||||||
Alabama State Public School & College Auth., Capital Improvements, Series A, Rev., | ||||||||
4.00%, due 02/01/2017 | 235,000 | 237,521 | ||||||
4.00%, due 02/01/2017 | 15,000 | 15,162 | ||||||
3.75%, due 02/01/2018 | 190,000 | 197,175 | ||||||
3.75%, due 02/01/2018 | 10,000 | 10,388 | ||||||
Alabama State Public School & College Auth., Capital Improvements, Series D, Rev., | ||||||||
2.00%, due 09/01/2018 | 565,000 | 576,831 | ||||||
Alabama State, Series A, GO, | ||||||||
5.00%, due 08/01/2023 | 400,000 | 498,160 | ||||||
Alabaster, AL, Water Rev., | ||||||||
3.00%, due 09/01/2017 | 400,000 | 407,004 | ||||||
Athens, AL, Electric Rev., Warrants, | ||||||||
3.00%, due 06/01/2019 | 375,000 | 392,711 | ||||||
Athens, AL, GO, Warrants, | ||||||||
4.00%, due 09/01/2018 | 300,000 | 317,163 | ||||||
5.00%, due 04/01/2024 | 500,000 | 611,725 | ||||||
Auburn University, AL, General Fee Rev., | ||||||||
5.00%, due 06/01/2018 | 315,000 | 336,458 | ||||||
5.00%, due 06/01/2020 | 350,000 | 399,857 | ||||||
5.00%, due 06/01/2021 | 200,000 | 235,172 | ||||||
Auburn, AL, Refunding & Capital Improvements, Series B, GO, Warrants, | ||||||||
4.00%, due 08/01/2018 | 200,000 | 210,780 | ||||||
Auburn, AL, School, Series A, GO, Warrants, | ||||||||
5.00%, due 08/01/2018 | 500,000 | 537,160 | ||||||
Baldwin Co., AL, Board of Education, Rev., | ||||||||
5.00%, due 07/01/2018 | 590,000 | 608,644 | ||||||
Baldwin Co., AL, GO, Warrants, | ||||||||
4.00%, due 06/01/2019 | 200,000 | 215,828 | ||||||
Baldwin Co., AL, Series A, GO, Warrants, | ||||||||
5.00%, due 02/01/2017 | 320,000 | 324,525 | ||||||
Birmingham, AL, Waterworks Board, Water Rev., | ||||||||
5.00%, due 01/01/2017 | 400,000 | 404,144 | ||||||
3.625%, due 07/01/2018 | 250,000 | 261,237 | ||||||
18
THE ALABAMA TAX FREE BOND FUND |
ALABAMA FIXED RATE REVENUE AND GENERAL OBLIGATION (GO) BONDS — 97.5%(Continued) | Par Value | Value | ||||||
Calera, AL, GO, Warrants, | ||||||||
3.00%, due 12/01/2017 | $ | 410,000 | $ | 419,118 | ||||
Chambers Co., AL, Gasoline Tax Anticipation, Rev., Warrants, | ||||||||
2.00%, due 11/01/2019 | 290,000 | 292,326 | ||||||
Cullman, AL, Board of Education Special Tax School Warrants, Rev., | ||||||||
2.00%, due 03/01/2023 | 325,000 | 333,216 | ||||||
Decatur, AL, Sewer Rev., Warrants, | ||||||||
3.00%, due 08/15/2019 | 500,000 | 526,885 | ||||||
Elmore Co., AL, GO, Warrants, | ||||||||
5.00%, due 10/01/2022 | 415,000 | 499,008 | ||||||
Florence, AL, Electric Rev., Warrants, | ||||||||
3.50%, due 06/01/2017 | 515,000 | 522,766 | ||||||
Florence, AL, GO, Warrants, | ||||||||
4.00%, due 08/01/2018 | 575,000 | 604,181 | ||||||
Foley, AL, Utilities Board, Utilities Rev., | ||||||||
4.00%, due 11/01/2018 | 710,000 | 753,906 | ||||||
4.00%, due 11/01/2019 | 225,000 | 245,293 | ||||||
Homewood, AL, Board of Education, Special Tax School Warrants, | ||||||||
4.00%, due 04/01/2017 | 500,000 | 507,315 | ||||||
Hoover City, AL, Board of Education, Special Tax School Warrants, | ||||||||
4.00%, due 02/15/2020 | 470,000 | 514,786 | ||||||
Huntsville, AL, Electric Systems, Rev., | ||||||||
3.00%, due 12/01/2016 | 375,000 | 376,399 | ||||||
Huntsville, AL, GO, Refunding and Capital Improvement Warrants, | ||||||||
4.00%, due 09/01/2018 | 500,000 | 529,655 | ||||||
Huntsville, AL, Series A, GO, Warrants, | ||||||||
5.00%, due 05/01/2024 | 665,000 | 837,820 | ||||||
Huntsville, AL, Series C, GO, Warrants, | ||||||||
4.00%, due 05/01/2022 | 500,000 | 576,500 | ||||||
Limestone Co., AL, Board of Education, Special Tax Warrants, | ||||||||
3.00%, due 11/01/2019 | 560,000 | 586,734 | ||||||
Macon Co., AL, GO, Warrants, | ||||||||
4.25%, due 10/01/2027, | ||||||||
Prerefunded 10/01/2017 @ 100 | 200,000 | 207,000 | ||||||
Madison Co., AL, Board of Education, Rev., Tax Anticipation Warrants, | ||||||||
2.00%, due 09/01/2019 | 220,000 | 225,372 | ||||||
19
THE ALABAMA TAX FREE BOND FUND |
ALABAMA FIXED RATE REVENUE AND GENERAL OBLIGATION (GO) BONDS — 97.5%(Continued) | Par Value | Value | ||||||
Madison Co., AL, GO, School Warrants, | ||||||||
5.00%, due 03/01/2025 | $ | 500,000 | $ | 625,900 | ||||
Madison Co., AL, GO, Warrants, | ||||||||
4.00%, due 09/01/2021 | 465,000 | 524,474 | ||||||
Madison Co., AL, Series A, Water Rev., Warrants, | ||||||||
2.00%, due 07/01/2017 | 250,000 | 252,000 | ||||||
Madison Co., AL, Water & Wastewater Board, Rev., | ||||||||
3.00%, due 12/01/2019 | 430,000 | 456,944 | ||||||
Mobile Co., AL, GO, Refunding, | ||||||||
5.00%, due 06/01/2023 | 520,000 | 637,931 | ||||||
Mobile, AL, Board of School Commissioners, GO, Warrants, | ||||||||
5.00%, due 03/01/2025 | 250,000 | 313,618 | ||||||
Montgomery, AL, GO, Warrants, | ||||||||
2.50%, due 04/01/2021 | 500,000 | 508,790 | ||||||
Montgomery, AL, Series A, GO, Warrants, | ||||||||
5.00%, due 02/01/2024 | 220,000 | 246,915 | ||||||
Montgomery, AL, Waterworks & Sanitation, Rev., | ||||||||
5.00%, due 09/01/2017 | 250,000 | 259,513 | ||||||
Morgan Co., AL, Board of Education, Rev., Capital Outlay Warrants, | ||||||||
4.00%, due 03/01/2019 | 250,000 | 266,600 | ||||||
Mountain Brook, AL, City Board of Education, GO, Warrants, | ||||||||
3.00%, due 03/01/2020 | 300,000 | 320,502 | ||||||
North Alabama Gas District, Rev., | ||||||||
3.00%, due 06/01/2020 | 420,000 | 430,660 | ||||||
Northport, AL, GO, Warrants, | ||||||||
3.00%, due 09/01/2024 | 385,000 | 422,630 | ||||||
Opelika, AL, GO, Warrants, | ||||||||
2.00%, due 11/01/2017 | 275,000 | 277,841 | ||||||
Opelika, AL, Utilities Board, Series B, Rev., | ||||||||
3.00%, due 06/01/2018 | 215,000 | 221,706 | ||||||
Orange Beach, AL, GO, Warrants, | ||||||||
4.00%, due 02/01/2018 | 200,000 | 207,888 | ||||||
5.00%, due 02/01/2019 | 240,000 | 261,691 | ||||||
Prattville, AL, GO, Warrants, | ||||||||
5.00%, due 11/01/2022 | 400,000 | 483,852 | ||||||
Prattville, AL, Waterworks Board, Rev., | ||||||||
3.00%, due 08/01/2017 | 290,000 | 294,472 | ||||||
Sheffield, AL, Electric Rev., | ||||||||
4.00%, due 07/01/2017 | 600,000 | 613,914 | ||||||
20
THE ALABAMA TAX FREE BOND FUND |
ALABAMA FIXED RATE REVENUE AND GENERAL OBLIGATION (GO) BONDS — 97.5%(Continued) | Par Value | Value | ||||||
Sylacauga, AL, Utilities Board, Rev., | ||||||||
3.00%, due 05/01/2021 | $ | 310,000 | $ | 333,771 | ||||
Trussville, AL, GO, | ||||||||
5.00%, due 10/01/2019 | 400,000 | 448,856 | ||||||
Tuscaloosa, AL, Series B, GO, Warrants, | ||||||||
4.00%, due 01/01/2020 | 500,000 | 547,040 | ||||||
University of Alabama, AL, Series A, Rev., | ||||||||
5.00%, due 07/01/2017 | 245,000 | 252,705 | ||||||
Vestavia Hills, AL, GO, Warrants, | ||||||||
4.00%, due 02/01/2018 | 515,000 | 534,864 | ||||||
4.00%, due 02/01/2021 | 500,000 | 558,110 | ||||||
Vestavia Hills, AL, Series A, GO, Warrants, | ||||||||
3.00%, due 02/01/2018 | 240,000 | 246,418 | ||||||
Wetumpka, AL, Waterworks & Sewer, Rev., | ||||||||
4.00%, due 03/01/2018 | 320,000 | 324,278 | ||||||
Total Alabama Fixed Rate Revenue and General Obligation (GO) Bonds—97.5%(Cost $26,828,271) | $ | 27,283,193 | ||||||
Other Assets in Excess of Liabilities—2.5% | 693,265 | |||||||
Net Assets—100.0% | $ | 27,976,458 | ||||||
See accompanying notes to financial statements. |
21
THE GOVERNMENT STREET FUNDS |
Government Street | Government | Alabama | ||||||||||
ASSETS | ||||||||||||
Investments in securities: | ||||||||||||
At acquisition cost | $ | 43,975,894 | $ | 26,456,930 | $ | 26,828,271 | ||||||
At value (Note 2) | $ | 71,453,865 | $ | 45,901,480 | $ | 27,283,193 | ||||||
Cash | 3,702 | — | 466,863 | |||||||||
Dividends and interest receivable | 44,121 | 29,075 | 255,736 | |||||||||
Receivable for capital shares sold | 1,123 | 100 | — | |||||||||
Other assets | 12,460 | 11,290 | 10,884 | |||||||||
TOTAL ASSETS | 71,515,271 | 45,941,945 | 28,016,676 | |||||||||
LIABILITIES | ||||||||||||
Distributions payable | 3,106 | — | 189 | |||||||||
Payable for capital shares redeemed | 110,240 | 33,278 | 23,396 | |||||||||
Accrued investment advisory fees (Note 4) | 68,183 | 64,028 | 4,858 | |||||||||
Payable to administrator (Note 4) | 8,125 | 5,850 | 5,600 | |||||||||
Other accrued expenses and liabilities | 7,479 | 7,442 | 6,175 | |||||||||
TOTAL LIABILITIES | 197,133 | 110,598 | 40,218 | |||||||||
NET ASSETS | $ | 71,318,138 | $ | 45,831,347 | $ | 27,976,458 | ||||||
Net assets consist of: | ||||||||||||
Paid-in capital | $ | 42,891,154 | $ | 24,829,695 | $ | 27,583,025 | ||||||
Accumulated net investment income | 384 | 133,123 | — | |||||||||
Accumulated net realized gains (losses) from security transactions | 948,629 | 1,423,979 | (61,489 | ) | ||||||||
Net unrealized appreciation on investments | 27,477,971 | 19,444,550 | 454,922 | |||||||||
Net assets | $ | 71,318,138 | $ | 45,831,347 | $ | 27,976,458 | ||||||
Shares of beneficial interest outstanding (unlimited number of shares authorized, $0.01 par value) | 1,121,740 | 2,009,255 | 2,670,863 | |||||||||
Net asset value, offering price and redemption price per share (Note 2) | $ | 63.58 | $ | 22.81 | $ | 10.47 | ||||||
See accompanying notes to financial statements. |
22
THE GOVERNMENT STREET FUNDS |
Government | Government | Alabama | ||||||||||
INVESTMENT INCOME | ||||||||||||
Dividends | $ | 723,416 | $ | 388,958 | $ | 537 | ||||||
Foreign withholding taxes on dividends | (9,698 | ) | (597 | ) | — | |||||||
Interest | — | — | 267,758 | |||||||||
TOTAL INVESTMENT INCOME | 713,718 | 388,361 | 268,295 | |||||||||
EXPENSES | ||||||||||||
Investment advisory fees (Note 4) | 227,333 | 177,836 | 50,263 | |||||||||
Administration fees (Note 4) | 47,341 | 32,889 | 30,000 | |||||||||
Professional fees | 9,111 | 9,111 | 9,861 | |||||||||
Account maintenance fees | 11,820 | 7,399 | 3,735 | |||||||||
Trustees’ fees and expenses (Note 4) | 5,472 | 5,472 | 5,472 | |||||||||
Registration and filing fees | 4,639 | 5,012 | 3,637 | |||||||||
Compliance fees (Note 4) | 4,476 | 3,936 | 3,604 | |||||||||
Pricing costs | 1,070 | 1,374 | 5,700 | |||||||||
Custodian and bank service fees | 3,675 | 1,600 | 2,379 | |||||||||
Printing of shareholder reports | 3,090 | 2,011 | 1,634 | |||||||||
Postage and supplies | 1,702 | 1,344 | 936 | |||||||||
Insurance expense | 1,489 | 956 | 634 | |||||||||
Other expenses | 3,128 | 6,247 | 1,790 | |||||||||
TOTAL EXPENSES | 324,346 | 255,187 | 119,645 | |||||||||
Fees voluntarily waived by the Adviser (Note 4) | — | — | (26,299 | ) | ||||||||
NET EXPENSES | 324,346 | 255,187 | 93,346 | |||||||||
NET INVESTMENT INCOME | 389,372 | 133,174 | 174,949 | |||||||||
REALIZED AND UNREALIZED GAINS (LOSSES) ON INVESTMENTS | ||||||||||||
Net realized gains from security transactions | 948,665 | 1,424,043 | 97 | |||||||||
Net realized gains from in-kind redemptions (Note 2) | 5,921,508 | 2,460,854 | — | |||||||||
Net change in unrealized appreciation (depreciation) on investments | (4,110,215 | ) | (1,714,051 | ) | (51,411 | ) | ||||||
NET REALIZED AND UNREALIZED GAINS (LOSSES) ON INVESTMENTS | 2,759,958 | 2,170,846 | (51,314 | ) | ||||||||
NET INCREASE IN NET ASSETS FROM OPERATIONS | $ | 3,149,330 | $ | 2,304,020 | $ | 123,635 | ||||||
See accompanying notes to financial statements. |
23
THE GOVERNMENT STREET FUNDS |
Government Street | Government Street | |||||||||||||||
Six Months | Year | Six Months | Year | |||||||||||||
FROM OPERATIONS | ||||||||||||||||
Net investment income | $ | 389,372 | $ | 803,645 | $ | 133,174 | $ | 218,695 | ||||||||
Net realized gains from security transactions | 948,665 | 1,606,478 | 1,424,043 | 1,166,270 | ||||||||||||
Net realized gains from in-kind redemptions (Note 2) | 5,921,508 | 4,095,529 | 2,460,854 | 1,026,289 | ||||||||||||
Net change in unrealized appreciation (depreciation) on investments | (4,110,215 | ) | (8,631,939 | ) | (1,714,051 | ) | (1,931,731 | ) | ||||||||
Net increase (decrease) in net assets from operations | 3,149,330 | (2,126,287 | ) | 2,304,020 | 479,523 | |||||||||||
DISTRIBUTIONS TO SHAREHOLDERS | ||||||||||||||||
From net investment income | (399,185 | ) | (843,753 | ) | (37,550 | ) | (224,883 | ) | ||||||||
From net realized capital gains on security transactions | (565,163 | ) | (2,693,418 | ) | (390,734 | ) | (2,378,680 | ) | ||||||||
Decrease in net assets from distributions to shareholders | (964,348 | ) | (3,537,171 | ) | (428,284 | ) | (2,603,563 | ) | ||||||||
FROM CAPITAL SHARE TRANSACTIONS | ||||||||||||||||
Proceeds from shares sold | 376,989 | 2,078,093 | 617,441 | 3,026,439 | ||||||||||||
Net asset value of shares issued in reinvestment of distributions to shareholders | 948,318 | 3,467,306 | 421,052 | 2,468,857 | ||||||||||||
Payments for shares redeemed | (12,499,036 | ) | (13,353,311 | ) | (5,629,808 | ) | (6,722,777 | ) | ||||||||
Net decrease in net assets from capital share transactions | (11,173,729 | ) | (7,807,912 | ) | (4,591,315 | ) | (1,227,481 | ) | ||||||||
TOTAL DECREASE IN NET ASSETS | (8,988,747 | ) | (13,471,370 | ) | (2,715,579 | ) | (3,351,521 | ) | ||||||||
NET ASSETS | ||||||||||||||||
Beginning of period | 80,306,885 | 93,778,255 | 48,546,926 | 51,898,447 | ||||||||||||
End of period | $ | 71,318,138 | $ | 80,306,885 | $ | 45,831,347 | $ | 48,546,926 | ||||||||
ACCUMULATED NET INVESTMENT INCOME | $ | 384 | $ | 10,197 | $ | 133,123 | $ | 37,499 | ||||||||
CAPITAL SHARE ACTIVITY | ||||||||||||||||
Shares sold | 6,027 | 33,300 | 27,600 | 141,863 | ||||||||||||
Shares reinvested | 15,262 | 54,228 | 18,697 | 113,586 | ||||||||||||
Shares redeemed | (200,758 | ) | (208,341 | ) | (249,027 | ) | (304,039 | ) | ||||||||
Net decrease in shares outstanding | (179,469 | ) | (120,813 | ) | (202,730 | ) | (48,590 | ) | ||||||||
Shares outstanding, beginning of period | 1,301,209 | 1,422,022 | 2,211,985 | 2,260,575 | ||||||||||||
Shares outstanding, end of period | 1,121,740 | 1,301,209 | 2,009,255 | 2,211,985 | ||||||||||||
See accompanying notes to financial statements. |
24
THE GOVERNMENT STREET FUNDS |
Alabama Tax Free | ||||||||
Six Months | Year | |||||||
FROM OPERATIONS | ||||||||
Net investment income | $ | 174,949 | $ | 368,596 | ||||
Net realized gains from security transactions | 97 | 1,775 | ||||||
Net change in unrealized appreciation (depreciation) on investments | (51,411 | ) | 13,033 | |||||
Net increase in net assets from operations | 123,635 | 383,404 | ||||||
DISTRIBUTIONS TO SHAREHOLDERS | ||||||||
From net investment income | (174,949 | ) | (368,599 | ) | ||||
FROM CAPITAL SHARE TRANSACTIONS | ||||||||
Proceeds from shares sold | 510,813 | 1,580,300 | ||||||
Net asset value of shares issued in reinvestment of distributions to shareholders | 165,265 | 340,322 | ||||||
Payments for shares redeemed | (1,512,382 | ) | (3,040,766 | ) | ||||
Net decrease in net assets from capital share transactions | (836,304 | ) | (1,120,144 | ) | ||||
TOTAL DECREASE IN NET ASSETS | (887,618 | ) | (1,105,339 | ) | ||||
NET ASSETS | ||||||||
Beginning of period | 28,864,076 | 29,969,415 | ||||||
End of period | $ | 27,976,458 | $ | 28,864,076 | ||||
ACCUMULATED NET INVESTMENT INCOME | $ | — | $ | — | ||||
CAPITAL SHARE ACTIVITY | ||||||||
Shares sold | 48,575 | 150,997 | ||||||
Shares reinvested | 15,730 | 32,502 | ||||||
Shares redeemed | (144,132 | ) | (290,450 | ) | ||||
Net decrease in shares outstanding | (79,827 | ) | (106,951 | ) | ||||
Shares outstanding, beginning of period | 2,750,690 | 2,857,641 | ||||||
Shares outstanding, end of period | 2,670,863 | 2,750,690 | ||||||
See accompanying notes to financial statements. |
25
THE GOVERNMENT STREET EQUITY FUND |
Selected Per Share Data and Ratios for a Share Outstanding Throughout Each Period |
Six Months | Years Ended March 31, | |||||||||||||||||||||||
| 2016 | 2015 | 2014 | 2013 | 2012 | ||||||||||||||||||||
Net asset value at beginning of period | $ | 61.72 | $ | 65.95 | $ | 62.78 | $ | 53.61 | $ | 50.42 | $ | 48.00 | ||||||||||||
Income (loss) from investment operations: | ||||||||||||||||||||||||
Net investment income | 0.33 | 0.61 | 0.67 | 0.62 | 0.64 | 0.47 | ||||||||||||||||||
Net realized and unrealized gains (losses) on investments | 2.34 | (2.17 | ) | 6.55 | 9.17 | 4.21 | 2.66 | |||||||||||||||||
Total from investment operations | 2.67 | (1.56 | ) | 7.22 | 9.79 | 4.85 | 3.13 | |||||||||||||||||
Less distributions: | ||||||||||||||||||||||||
Dividends from net investment income | (0.34 | ) | (0.64 | ) | (0.64 | ) | (0.61 | ) | (0.64 | ) | (0.48 | ) | ||||||||||||
Distributions from net realized gains | (0.47 | ) | (2.03 | ) | (3.41 | ) | (0.01 | ) | (1.02 | ) | (0.23 | ) | ||||||||||||
Total distributions | (0.81 | ) | (2.67 | ) | (4.05 | ) | (0.62 | ) | (1.66 | ) | (0.71 | ) | ||||||||||||
Net asset value at end of period | $ | 63.58 | $ | 61.72 | $ | 65.95 | $ | 62.78 | $ | 53.61 | $ | 50.42 | ||||||||||||
Total return (a) | 4.35 | %(b) | (2.46 | %) | 11.87 | % | 18.34 | % | 9.93 | % | 6.67 | % | ||||||||||||
Net assets at end of period (000’s) | $ | 71,318 | $ | 80,307 | $ | 93,778 | $ | 94,287 | $ | 81,689 | $ | 72,268 | ||||||||||||
Ratio of total expenses to average net assets | 0.86 | %(c) | 0.85 | % | 0.84 | % | 0.84 | % | 0.85 | % | 0.87 | % | ||||||||||||
Ratio of net investment income to average net assets | 1.03 | %(c) | 0.95 | % | 1.02 | % | 1.06 | % | 1.29 | % | 1.01 | % | ||||||||||||
Portfolio turnover rate | 8 | %(b) | 17 | % | 26 | % | 36 | % | 38 | % | 36 | % | ||||||||||||
(a) | Total return is a measure of the change in value of an investment in the Fund over the period covered, which assumes any dividends or capital gains distributions are reinvested in shares of the Fund. Returns do not reflect the deduction of taxes a shareholder would pay on Fund distributions or the redemption of Fund shares. |
(b) | Not annualized. |
(c) | Annualized. |
See accompanying notes to financial statements. | |
26
THE GOVERNMENT STREET MID-CAP FUND |
Selected Per Share Data and Ratios for a Share Outstanding Throughout Each Period | ||||||||||||||||||||||||
Six Months | Years Ended March 31, | |||||||||||||||||||||||
2016 | 2015 | 2014 | 2013 | 2012 | ||||||||||||||||||||
Net asset value at beginning of period | $ | 21.95 | $ | 22.96 | $ | 21.68 | $ | 18.26 | $ | 16.26 | $ | 15.89 | ||||||||||||
Income from investment operations: | ||||||||||||||||||||||||
Net investment income | 0.07 | 0.10 | 0.10 | 0.09 | 0.10 | 0.04 | ||||||||||||||||||
Net realized and unrealized gains on investments | 0.99 | 0.11 | 2.02 | 3.46 | 2.05 | 0.37 | ||||||||||||||||||
Total from investment operations | 1.06 | 0.21 | 2.12 | 3.55 | 2.15 | 0.41 | ||||||||||||||||||
Less distributions: | ||||||||||||||||||||||||
Dividends from net investment income | (0.02 | ) | (0.10 | ) | (0.07 | ) | (0.11 | ) | (0.11 | ) | (0.04 | ) | ||||||||||||
Distributions from net realized gains | (0.18 | ) | (1.12 | ) | (0.77 | ) | (0.02 | ) | (0.04 | ) | (0.00 | )(a) | ||||||||||||
Total distributions | (0.20 | ) | (1.22 | ) | (0.84 | ) | (0.13 | ) | (0.15 | ) | (0.04 | ) | ||||||||||||
Net asset value at end of period | $ | 22.81 | $ | 21.95 | $ | 22.96 | $ | 21.68 | $ | 18.26 | $ | 16.26 | ||||||||||||
Total return (b) | 4.84 | %(c) | 1.04 | % | 10.14 | % | 19.43 | % | 13.35 | % | 2.59 | % | ||||||||||||
Net assets at end of period (000’s) | $ | 45,831 | $ | 48,547 | $ | 51,898 | $ | 54,875 | $ | 45,918 | $ | 39,843 | ||||||||||||
Ratio of total expenses to average net assets | 1.08 | %(d) | 1.07 | % | 1.05 | % | 1.06 | % | 1.08 | % | 1.09 | % | ||||||||||||
Ratio of net investment income to average net assets | 0.56 | %(d) | 0.46 | % | 0.47 | % | 0.43 | % | 0.63 | % | 0.29 | % | ||||||||||||
Portfolio turnover rate | 7 | %(c) | 20 | % | 16 | % | 10 | % | 12 | % | 18 | % | ||||||||||||
(a) | Amount rounds to less than $0.01 per share. |
(b) | Total return is a measure of the change in value of an investment in the Fund over the period covered, which assumes any dividends or capital gains distributions are reinvested in shares of the Fund. Returns do not reflect the deduction of taxes a shareholder would pay on Fund distributions or the redemption of Fund shares. |
(c) | Not annualized. |
(d) | Annualized. |
See accompanying notes to financial statements. | |
27
THE ALABAMA TAX FREE BOND FUND |
Selected Per Share Data and Ratios for a Share Outstanding Throughout Each Period | ||||||||||||||||||||||||
Six Months | Years Ended March 31, | |||||||||||||||||||||||
2016 | 2015 | 2014 | 2013 | 2012 | ||||||||||||||||||||
Net asset value at beginning of period | $ | 10.49 | $ | 10.49 | $ | 10.51 | $ | 10.63 | $ | 10.64 | $ | 10.45 | ||||||||||||
Income (loss) from investment operations: | ||||||||||||||||||||||||
Net investment income | 0.06 | 0.13 | 0.14 | 0.15 | 0.18 | 0.23 | ||||||||||||||||||
Net realized and unrealized gains (losses) on investments | (0.02 | ) | 0.00 | (a) | (0.02 | ) | (0.12 | ) | (0.01 | ) | 0.19 | |||||||||||||
Total from investment operations | 0.04 | 0.13 | 0.12 | 0.03 | 0.17 | 0.42 | ||||||||||||||||||
Less dividends from net investment income | (0.06 | ) | (0.13 | ) | (0.14 | ) | (0.15 | ) | (0.18 | ) | (0.23 | ) | ||||||||||||
Net asset value at end of period | $ | 10.47 | $ | 10.49 | $ | 10.49 | $ | 10.51 | $ | 10.63 | $ | 10.64 | ||||||||||||
Total return (b) | 0.42 | %(c) | 1.28 | % | 1.14 | % | 0.28 | % | 1.64 | % | 4.04 | % | ||||||||||||
Net assets at end of period (000’s) | $ | 27,976 | $ | 28,864 | $ | 29,969 | $ | 32,630 | $ | 33,265 | $ | 24,719 | ||||||||||||
Ratio of total expenses to average net assets | 0.83 | %(d) | 0.82 | % | 0.79 | % | 0.76 | % | 0.76 | % | 0.80 | % | ||||||||||||
Ratio of net expenses to average net assets (e) | 0.65 | %(d) | 0.65 | % | 0.65 | % | 0.65 | % | 0.65 | % | 0.65 | % | ||||||||||||
Ratio of net investment income to average net assets (e) | 1.22 | %(d) | 1.27 | % | 1.32 | % | 1.41 | % | 1.70 | % | 2.17 | % | ||||||||||||
Portfolio turnover rate | 8 | %(c) | 13 | % | 6 | % | 10 | % | 7 | % | 18 | % | ||||||||||||
(a) | Amount rounds to less than $0.01 per share. |
(b) | Total return is a measure of the change in value of an investment in the Fund over the period covered, which assumes any dividends or capital gains distributions are reinvested in shares of the Fund. Returns do not reflect the deduction of taxes a shareholder would pay on Fund distributions or the redemption of Fund shares. |
(c) | Not annualized. |
(d) | Annualized. |
(e) | Ratios were determined after voluntary advisory fee waivers by the Adviser (Note 4). |
See accompanying notes to financial statements. | |
28
THE GOVERNMENT STREET FUNDS
NOTES TO FINANCIAL STATEMENTS
September 30, 2016 (Unaudited)
1. Organization
The Government Street Equity Fund, The Government Street Mid-Cap Fund and The Alabama Tax Free Bond Fund (the “Funds”) are each a no-load series of the Williamsburg Investment Trust (the “Trust”), an open-end management investment company registered under the Investment Company Act of 1940. The Government Street Equity Fund and The Government Street Mid-Cap Fund are each a diversified fund and The Alabama Tax Free Bond Fund is a non-diversified fund. The Trust was organized as a Massachusetts business trust on July 18, 1988. Other series of the Trust are not included in this report.
The Government Street Equity Fund’s investment objective is to seek capital appreciation.
The Government Street Mid-Cap Fund’s investment objective is to seek capital appreciation.
The Alabama Tax Free Bond Fund’s investment objectives are to provide current income exempt from federal income taxes and from the personal income taxes of Alabama and to preserve capital.
2. Significant Accounting Policies
As an investment company, as defined in Financial Accounting Standards Board (“FASB”) Accounting Standards Update 2013-08, each Fund follows accounting and reporting guidance under FASB Accounting Standards Codification Topic 946, “Financial Services – Investment Companies.” The following is a summary of the Funds’ significant accounting policies. The policies are in conformity with accounting principles generally accepted in the United States of America (“GAAP”).
Securities valuation — The Funds’ portfolio securities are valued as of the close of business of the regular session of the New York Stock Exchange (normally 4:00 p.m., Eastern time). Securities traded on a national stock exchange, including common stocks, are valued based upon the closing price on the principal exchange where the security is traded, if available, otherwise, at the last quoted bid price. Securities which are quoted by NASDAQ are valued at the NASDAQ Official Closing Price. Investments representing shares of other open-end investment companies, including exchange-traded funds and money market funds, are valued at their net asset value as reported by such companies.
Fixed income securities, including municipal bonds, are typically valued on the basis of prices provided by an independent pricing service. The prices provided by the pricing service are determined with consideration given to institutional bid and last
29
THE GOVERNMENT STREET FUNDS
NOTES TO FINANCIAL STATEMENTS (Continued)
sale prices and take into account securities prices, yields, maturities, call features, ratings, institutional trading in similar groups of securities and developments related to specific securities.
When using a quoted price and when the market is considered active, securities will be classified as Level 1 within the fair value hierarchy. When market quotations are not readily available, if a pricing service cannot provide a price or the investment adviser believes the price received from the pricing service is not indicative of market value, securities will be valued in good faith at fair value using methods consistent with procedures adopted by the Board of Trustees and will be classified as Level 2 or 3 within the fair value hierarchy (see below), depending on the inputs used. Such methods of fair valuation may include, but are not limited to: multiple of earnings, multiple of book value, discount from market of a similar freely traded security, purchase price of the security, subsequent private transactions in the security or related securities, or a combination of these and other factors.
GAAP establishes a single authoritative definition of fair value, sets out a framework for measuring fair value and requires additional disclosures about fair value measurements.
Various inputs are used in determining the value of each Fund’s investments. These inputs are summarized in the three broad levels listed below:
● | Level 1 – quoted prices in active markets for identical securities |
● | Level 2 – other significant observable inputs |
● | Level 3 – significant unobservable inputs |
Fixed income securities, including municipal bonds, are classified as Level 2 since the values for such securities are based on prices provided by an independent pricing service that utilizes various “other significant observable inputs” including bid and ask quotations, prices of similar securities and interest rates, among other factors.
The inputs or methodology used for valuing securities are not necessarily an indication of the risks associated with investing in those securities. The inputs used to measure fair value may fall into different levels of the fair value hierarchy. In such cases, for disclosure purposes, the level in the fair value hierarchy within which the fair value measurement falls in its entirety is determined based on the lowest level input that is significant to the fair value measurement.
30
THE GOVERNMENT STREET FUNDS
NOTES TO FINANCIAL STATEMENTS (Continued)
The following is a summary of the inputs used to value each Fund’s investments as of September 30, 2016, by security type:
The Government Street Equity Fund | Level 1 | Level 2 | Level 3 | Total | ||||||||||||
Common Stocks | $ | 63,857,027 | $ | — | $ | — | $ | 63,857,027 | ||||||||
Exchange-Traded Funds | 3,431,704 | — | — | 3,431,704 | ||||||||||||
Exchange-Traded Notes | 189,000 | — | — | 189,000 | ||||||||||||
Money Market Funds | 3,976,134 | — | — | 3,976,134 | ||||||||||||
Total | $ | 71,453,865 | $ | — | $ | — | $ | 71,453,865 | ||||||||
The Government Street Mid-Cap Fund: | Level 1 | Level 2 | Level 3 | Total | ||||||||||||
Common Stocks | $ | 40,525,391 | $ | — | $ | — | $ | 40,525,391 | ||||||||
Exchange-Traded Funds | 3,000,477 | — | — | 3,000,477 | ||||||||||||
Exchange-Traded Notes | 189,000 | — | — | 189,000 | ||||||||||||
Money Market Funds | 2,186,612 | — | — | 2,186,612 | ||||||||||||
Total | $ | 45,901,480 | $ | — | $ | — | $ | 45,901,480 | ||||||||
The Alabama Tax Free Fund: | Level 1 | Level 2 | Level 3 | Total | ||||||||||||
Municipal Bonds | $ | — | $ | 27,283,193 | $ | — | $ | 27,283,193 | ||||||||
Refer to The Government Street Equity Fund’s and The Government Street Mid-Cap Fund’s Schedules of Investments for a listing of the common stocks by sector type. As of September 30, 2016, the Funds did not have any transfers into and out of any Level. There were no Level 3 securities or derivative instruments held by the Funds as of September 30, 2016. It is the Funds’ policy to recognize transfers into and out of any Level at the end of the reporting period.
Share valuation — The net asset value per share of each Fund is calculated daily by dividing the total value of its assets, less liabilities, by the number of shares outstanding. The offering price and redemption price per share of each Fund is equal to the net asset value per share.
Investment income — Interest income is accrued as earned. Dividend income is recorded on the ex-dividend date. Discounts and premiums on fixed-income securities purchased are amortized using the interest method. Withholding taxes on foreign dividends for The Government Street Equity Fund and The Government Street Mid-Cap Fund have been recorded in accordance with the Funds’ understanding of the appropriate country’s rules and tax rates.
Distributions to shareholders — Dividends arising from net investment income are declared and paid quarterly to shareholders of The Government Street Equity Fund; declared and paid annually to shareholders of The Government Street Mid-Cap Fund; and declared daily and paid monthly to shareholders of The Alabama Tax Free Bond
31
THE GOVERNMENT STREET FUNDS
NOTES TO FINANCIAL STATEMENTS (Continued)
Fund. Net realized short-term capital gains, if any, may be distributed throughout the year and net realized long-term capital gains, if any, are distributed at least once each year. Dividends and distributions are recorded on the ex-dividend date. The amount of distributions from net investment income and net realized capital gains are determined in accordance with federal income tax regulations, which may differ from GAAP. These “book/tax” differences are either temporary or permanent in nature.
The tax character of distributions paid during the periods ended September 30, 2016 and March 31, 2016 was as follows:
Period | Ordinary Income | Exempt- Interest Dividends | Long-Term Capital Gains | Total Distributions | |||||||||||||
The Government Street Equity Fund | 09/30/16 | $ | 399,185 | $ | — | $ | 565,163 | $ | 964,348 | ||||||||
03/31/16 | $ | 843,753 | $ | — | $ | 2,693,418 | $ | 3,537,171 | |||||||||
The Government Street Mid-Cap Fund | 09/30/16 | $ | 37,550 | $ | — | $ | 390,734 | $ | 428,284 | ||||||||
03/31/16 | $ | 263,265 | $ | — | $ | 2,340,298 | $ | 2,603,563 | |||||||||
The Alabama Tax Free Bond Fund | 09/30/16 | $ | — | $ | 174,949 | $ | — | $ | 174,949 | ||||||||
| 03/31/16 | $ | — | $ | 368,599 | $ | — | $ | 368,599 | |||||||||
Security transactions — Security transactions are accounted for on trade date for financial reporting purposes. Realized gains and losses on securities sold are determined on a specific identification basis.
Common expenses — Common expenses of the Trust are allocated among the series of the Trust based on relative net assets of each series or the nature of the services performed and the relative applicability to each series.
Estimates — The preparation of financial statements in conformity with GAAP requires management to make estimates and assumptions that affect the reported amounts of assets and liabilities and the disclosure of contingent assets and liabilities as of the date of the financial statements and the reported amounts of income and expenses during the reporting period. Actual results could differ from those estimates.
Federal income tax — Each Fund has qualified and intends to continue to qualify as a regulated investment company under the Internal Revenue Code of 1986 (the “Code”). Qualification generally will relieve the Funds of liability for federal income taxes to the extent 100% of their net investment income and any net realized capital gains are distributed in accordance with the Code.
In order to avoid imposition of the excise tax applicable to regulated investment companies, it is also each Fund’s intention to declare as dividends in each calendar year at least 98% of its net investment income (earned during the calendar year) and 98.2% of its net realized capital gains (earned during the twelve months ended October 31) plus undistributed amounts from prior years.
32
THE GOVERNMENT STREET FUNDS
NOTES TO FINANCIAL STATEMENTS (Continued)
The following information is computed on a tax basis for each item as of September 30, 2016:
The Government | The Government | The Alabama | ||||||||||
Cost of portfolio investments | $ | 43,975,894 | $ | 26,456,930 | $ | 26,828,271 | ||||||
Gross unrealized appreciation | $ | 27,637,902 | $ | 19,640,150 | $ | 456,749 | ||||||
Gross unrealized depreciation | (159,931 | ) | (195,600 | ) | (1,827 | ) | ||||||
Net unrealized appreciation | 27,477,971 | 19,444,550 | 454,922 | |||||||||
Accumulated ordinary income | 3,490 | 133,123 | 189 | |||||||||
Accumulated capital and other gains (losses) | 948,629 | 1,423,979 | (61,489 | ) | ||||||||
Distributions payable | (3,106 | ) | — | (189 | ) | |||||||
Total distibutable earnings | $ | 28,426,984 | $ | 21,001,652 | $ | 393,433 | ||||||
As of March 31, 2016, The Alabama Tax Free Bond Fund had a short-term capital loss carryforward for federal income tax purposes of $24,704 and a long-term capital loss carryforward for federal income tax purposes of $36,882, both of which may be carried forward indefinitely. These capital loss carryforwards are available to offset realized capital gains in the current and future years, thereby reducing future taxable gains distributions.
During the six months ended September 30, 2016, The Government Street Equity Fund and The Government Street Mid-Cap Fund realized $5,921,508 and $2,460,854, respectively, of net capital gains resulting from in-kind redemptions (redemptions in which shareholders who redeemed Fund shares received securities held by the Fund rather than cash). The Funds recognize a gain on in-kind redemptions to the extent that the value of the distributed securities on the date of redemption exceeds the cost of those securities. Such gains are not taxable to the Funds and are not required to be distributed to shareholders. The Funds have reclassified these amounts against paid-in capital on the Statements of Assets and Liabilities. Such reclassifications, the result of permanent differences between the financial statement and income tax reporting requirements, have no effect on each Fund’s net assets or net asset value per share.
The Funds recognize the tax benefits or expenses of uncertain tax positions only when the position is “more likely than not” to be sustained assuming examination by tax authorities. Management has reviewed the tax positions taken on federal income tax returns for the current and all open tax years (tax years ended March 31, 2013 through March 31, 2016) of each Fund and has concluded that no provision for unrecognized tax benefits or expenses is required in these financial statements.
33
THE GOVERNMENT STREET FUNDS
NOTES TO FINANCIAL STATEMENTS (Continued)
3. Investment Transactions
Investment transactions, other than short-term investments and U.S. government securities, were as follows for the six months ended September 30, 2016:
The Government | The Government | The Alabama | ||||||||||
Purchases of investment securities | $ | 5,644,744 | $ | 3,281,862 | $ | 2,176,927 | ||||||
Proceeds from sales and maturities of investment securities | $ | 16,345,147 | $ | 6,896,925 | $ | 2,325,000 | ||||||
4. Transactions with Related Parties
INVESTMENT ADVISORY AGREEMENT
Each Fund’s investments are managed by Leavell Investment Management, Inc. (the “Adviser”) under the terms of an Investment Advisory Agreement. The Government Street Equity Fund pays the Adviser a fee, which is computed and accrued daily and paid monthly, at annual rates of .60% of its average daily net assets up to $100 million and .50% of such assets in excess of $100 million. The Government Street Mid-Cap Fund pays the Adviser a fee, which is computed and accrued daily and paid monthly, at an annual rate of .75% of its average daily net assets. The Alabama Tax Free Bond Fund pays the Adviser a fee, which is computed and accrued daily and paid monthly, at annual rates of .35% of its average daily net assets up to $100 million and .25% of such assets in excess of $100 million.
During the six months ended September 30, 2016, the Adviser voluntarily limited the total annual operating expenses of The Alabama Tax Free Bond Fund to .65% of the Fund’s average daily net assets. Accordingly, the Adviser waived $26,299 of its investment advisory fees from The Alabama Tax Free Bond Fund during the six months ended September 30, 2016. This amount is not subject to recapture in future periods.
Certain officers of the Trust are also officers of the Adviser.
OTHER SERVICE PROVIDERS
Ultimus Fund Solutions, LLC (“Ultimus”) provides administration, fund accounting, compliance and transfer agent services to the Funds. The Funds pay Ultimus fees in accordance with the agreements for such services. In addition, the Funds pay out-of-pocket expenses including, but not limited to, postage, supplies, and costs of pricing the Funds’ portfolio securities. Certain officers of the Trust are also officers of Ultimus, or of Ultimus Fund Distributors, LLC (the “Distributor”), the principal underwriter of each Fund’s shares and an affiliate of Ultimus. The Distributor is compensated by the Adviser (not the Funds) for acting as principal underwriter.
34
THE GOVERNMENT STREET FUNDS
NOTES TO FINANCIAL STATEMENTS (Continued)
COMPENSATION OF TRUSTEES
Trustees and officers affiliated with the Adviser or Ultimus are not compensated by the Trust for their services. Each Trustee who is not an affiliated person of the Adviser or Ultimus receives from the Trust an annual retainer of $15,000, payable quarterly; a fee of $1,500 for attendance at each meeting of the Board of Trustees (except that such fee is $2,500 for the independent chair); and a fee of $1,000 for attendance at each meeting of any committee of the Board (except that such fee is $1,500 for the committee chair); plus reimbursement of travel and other expenses incurred in attending meetings. Each series of the Trust pays its proportionate share of such fees.
5. Contingencies and Commitments
The Funds indemnify the Trust’s officers and Trustees for certain liabilities that might arise from their performance of their duties to the Funds. Additionally, in the normal course of business the Funds enter into contracts that contain a variety of representations and warranties and which provide general indemnifications. The Funds’ maximum exposure under these arrangements is unknown, as this would involve future claims that may be made against the Funds that have not yet occurred. However, based on experience, the Funds expect the risk of loss to be remote.
6. Concentration of Credit Risk
The Alabama Tax Free Bond Fund invests primarily in debt instruments of municipal issuers in the state of Alabama. The issuers’ abilities to meet their obligations may be affected by economic developments in the state or its region, as well as disruptions in the credit markets and the economy, generally.
7. Subsequent Events
The Funds are required to recognize in the financial statements the effects of all subsequent events that provide additional evidence about conditions that existed as of the date of the Statements of Assets and Liabilities. For non-recognized subsequent events that must be disclosed to keep the financial statements from being misleading, the Funds are required to disclose the nature of the event as well as an estimate of its financial effect, or a statement that such an estimate cannot be made. Management has evaluated subsequent events through the issuance of these financial statements and has noted no such events.
35
THE GOVERNMENT STREET FUNDS
ABOUT YOUR FUNDS’ EXPENSES (Unaudited)
We believe it is important for you to understand the impact of costs on your investment. All mutual funds have operating expenses. As a shareholder of the Funds, you incur ongoing costs, including management fees and other expenses. These ongoing costs, which are deducted from each Fund’s gross income, directly reduce the investment returns of the Funds.
A mutual fund’s ongoing costs are expressed as a percentage of its average net assets. This figure is known as the expense ratio. The following examples are intended to help you understand the ongoing costs (in dollars) of investing in the Funds and to compare these costs with the ongoing costs of investing in other mutual funds. The examples below are based on an investment of $1,000 made at the beginning of the period shown and held for the entire period (April 1, 2016 through September 30, 2016).
The table below illustrates each Fund’s ongoing costs in two ways:
Actual fund return – This section helps you to estimate the actual expenses that you paid over the period. The “Ending Account Value” shown is derived from each Fund’s actual return, and the fourth column shows the dollar amount of operating expenses that would have been paid by an investor who started with $1,000 in the Funds. You may use the information here, together with the amount you invested, to estimate the expenses that you paid over the period.
To do so, simply divide your account value by $1,000 (for example, an $8,600 account value divided by $1,000 = 8.6), then multiply the result by the number given for the Funds under the heading “Expenses Paid During Period.”
Hypothetical 5% return – This section is intended to help you compare the Funds’ ongoing costs with those of other mutual funds. It assumes that each Fund had an annual return of 5% before expenses during the period shown, but that the expense ratio is unchanged. In this case, because the returns used are not the Funds’ actual returns, the results do not apply to your investment. The example is useful in making comparisons because the Securities and Exchange Commission (the “SEC”) requires all mutual funds to calculate expenses based on a 5% return. You can assess each Fund’s ongoing costs by comparing this hypothetical example with the hypothetical examples that appear in shareholder reports of other funds.
Note that expenses shown in the table are meant to highlight and help you compare ongoing costs only. The Funds do not charge sales loads or redemption fees.
The calculations assume no shares were bought or sold during the period. Your actual costs may have been higher or lower, depending on the amount of your investment and the timing of any purchases or redemptions.
More information about the Funds’ expenses, including historical expense ratios, can be found in this report. For additional information on operating expenses and other shareholder costs, please refer to the Funds’ prospectus.
36
THE GOVERNMENT STREET FUNDS
ABOUT YOUR FUNDS’ EXPENSES (Unaudited) (Continued)
Beginning | Ending | Net | Expenses | |||||||||||||
The Government Street Equity Fund | ||||||||||||||||
Based on Actual Fund Return | $ | 1,000.00 | $ | 1,043.50 | 0.86 | % | $ | 4.39 | ||||||||
Based on Hypothetical 5% Return (before expenses) | $ | 1,000.00 | $ | 1,020.70 | 0.86 | % | $ | 4.34 | ||||||||
The Government Street Mid-Cap Fund | ||||||||||||||||
Based on Actual Fund Return | $ | 1,000.00 | $ | 1,048.40 | 1.08 | % | $ | 5.53 | ||||||||
Based on Hypothetical 5% Return (before expenses) | $ | 1,000.00 | $ | 1,019.60 | 1.08 | % | $ | 5.45 | ||||||||
The Alabama Tax Free Bond Fund | ||||||||||||||||
Based on Actual Fund Return | $ | 1,000.00 | $ | 1,004.20 | 0.65 | % | $ | 3.26 | ||||||||
Based on Hypothetical 5% Return (before expenses) | $ | 1,000.00 | $ | 1,021.75 | 0.65 | % | $ | 3.29 | ||||||||
(a) | Annualized, based on the Fund's most recent one-half year expenses. |
(b) | Expenses are equal to the Fund’s annualized expense ratio multiplied by the average account value over the period, muliplied by 183/366 (to reflect the one-half year period). |
37
THE GOVERNMENT STREET FUNDS
OTHER INFORMATION (Unaudited)
A description of the policies and procedures that the Funds use to vote proxies relating to portfolio securities is available without charge upon request by calling toll-free 1-866-738-1125, or on the SEC’s website at http://www.sec.gov. Information regarding how the Funds voted proxies relating to portfolio securities during the most recent 12-month period ended June 30 is also available without charge upon request by calling toll-free 1-866-738-1125 or on the SEC’s website at http://www.sec.gov.
The Trust files a complete listing of portfolio holdings for the Funds with the SEC as of the end of the first and third quarters of each fiscal year on Form N-Q. The filings are available upon request, by calling 1-866-738-1125. Furthermore, you may obtain a copy of these filings on the SEC’s website at http://www.sec.gov. The Trust’s Forms N-Q may also be reviewed and copied at the SEC’s Public Reference Room in Washington, DC, and information on the operation of the Public Reference Room may be obtained by calling 1-800-SEC-0330.
38
This page intentionally left blank.
This page intentionally left blank.
This page intentionally left blank.
The Government Street Funds
No-Load Mutual Funds | |
Investment Adviser Leavell Investment Management, Inc. 210 St. Joseph Street Mobile, AL 36602
Administrator Ultimus Fund Solutions, LLC P.O. Box 46707 Cincinnati, OH 45246-0707 1-866-738-1125
Legal Counsel Sullivan & Worcester LLP One Post Office Square Boston, MA 02109
Independent Registered Public Accounting Firm Cohen & Company, Ltd. 1350 Euclid Avenue Suite 800 Cleveland, Ohio 44115
Board of Trustees Robert S. Harris, Ph.D., Chairman John P. Ackerly, IV John T. Bruce George K. Jennison Harris V. Morrissette Elizabeth W. Robertson
Portfolio Managers Thomas W. Leavell, The Government Street Equity Fund The Government Street Mid-Cap Fund Timothy S. Healey, The Alabama Tax Free Bond Fund
| |
THE
No-Load Funds
The Jamestown Equity Fund
SEMI-ANNUAL REPORT
September 30, 2016
Investment Adviser Lowe, Brockenbrough & Company, Inc. Richmond, Virginia
|
LETTER TO SHAREHOLDERS | November 15, 2016 |
The Jamestown Equity Fund
For the six month period ended September 30, 2016, The Jamestown Equity Fund rose 3.17% compared to 6.40% for the S&P 500 Index. The equity market continued the rally off the February lows until the surprise Brexit vote in the United Kingdom caused a selloff in late June. The equity market, however, quickly recovered from the Brexit decline as the Federal Reserve decided not to raise interest rates given the market and economic uncertainty. While quarter-to-quarter economic growth has been somewhat volatile, the economy continues to expand at a modest pace of about 2%. Inflation has begun to increase slightly and rates across the Treasury curve increased after the low immediately following the Brexit vote.
Earnings on the S&P 500 companies are set to report a light increase after several quarters of declines caused largely by the decline in oil prices. Outside of earnings for energy companies, the rest of the companies in the S&P 500 have been posting low to middle single digit increases. Earnings are expected to increase at a faster pace beginning in the last quarter of the calendar year as many companies lag the impact of the stronger U.S. dollar and falling oil prices. Earnings growth will be the primary driver if equity prices are going to continue to rise given somewhat elevated valuations. The S&P 500 currently trades at over 17X forecasted earnings for 2017. This valuation is elevated compared to the average of slightly over 15X earnings in the past 10 years. Valuations are supported by continued low interest rates, and the dividend yield on the S&P 500 remains above that of the 10 year Treasury.
We expect to see continued volatility in equity prices as investors look for better earnings growth while facing the likelihood that the Federal Reserve will raise interest rates later this year. In addition, investors are faced with concerns over the U.S. election and modest economic growth. While the Federal Reserve is largely expected to raise interest rates later this year, monetary policy remains accommodative around the globe due to the quantitative easing policies ongoing at a number of Central Banks.
The Fund lagged the S&P 500’s return due to the impact of sector and stock selection. As interest rates came down though out the world, investors migrated into low volatility, dividend paying stocks. Many of these types of stocks are in the Utilities, Consumer Staples, and Real Estate sectors of the market where the Fund remains underweight given very modest growth rates and elevated valuations. At the end of September, low volatility stocks in the S&P 500 were trading at their highest valuation levels since 2000. Stock selection was most challenging in the Health Care and Financials sectors. The Health Care sector came under pressure as pricing concerns rose, and the Financials sector was hurt by the decline in interest rates around the globe.
At the end of September 2016, the greatest sector overweights in the portfolio, relative to benchmark weightings, were in the Consumer Discretionary and Health Care sectors. The largest sector underweights in the Fund remain in the Utilities, Real Estate, and the Consumer Staples sectors.
1
THE JAMESTOWN TAX EXEMPT VIRGINIA FUND
For the six month period ended September 30, 2016, The Jamestown Tax Exempt Virginia Fund (the “Fund”) earned a total return of 0.95%. By comparison, the Bloomberg Barclays 1-10 Year Municipal Blend Index returned 1.33% for the period. As of September 30, 2016, the Fund’s SEC 30-day yield was 1.19%, which is a taxable equivalent yield of 2.10% for investors in the maximum 43.4% federal income tax bracket.
The U.S. economy experienced tepid growth during the first six months of 2016 with real GDP expanding by 1.1%. Real growth improved to 2.9% annual pace in the third quarter, according to the government’s advance estimate, led by consumer spending. The U.S. labor market is essentially at full employment, with the unemployment rate hovering around 5.0% and steady growth in nonfarm payrolls. The inflation rate has inched upward in 2016 as oil prices rebounded. Core prices, excluding food and energy, have been running above 2.0% for the past nine months. Monetary policy remained accommodative through the period. The Federal Reserve (the “Fed”) has refrained from increasing short-term interest rates in 2016, although markets are anticipating one rate hike by the end of 2016.
Municipal bond prices generally rose during the second calendar quarter of 2016, continuing the rally from the first quarter when yields fell sharply. Yields bottomed, and bond prices peaked in early July after the Brexit vote surprised markets. Subsequently, bonds reversed direction during the third quarter and yields drifted higher. The sell-off accelerated in September on the weight of record supply in the primary market. Heavy secondary market selling was evident in short maturity bonds due to liquidations from tax-exempt money market funds ahead of changes to money fund pricing. Over the fiscal six month period, the municipal yield curve flattened somewhat as yields increased about 20 basis points in the short end and fell about 20 basis points in the 10-year maturity range. Quality spreads were little changed during the period.
Interest income contributed to the Fund’s return for the reporting period, while the Fund’s ending net asset value was unchanged from the beginning of the period. The return was negatively affected by the underperformance of the short end of the municipal yield curve. At September 30, 2016, the Fund’s average stated maturity was 5.2 years, down from 5.6 years at the beginning of the period, while the effective duration decreased slightly to 3.9 years from 4.0 years.
Data presented reflects past performance, which is no guarantee of future results. Investment results and principal value will fluctuate so that shares, when redeemed, may be worth more or less than their original cost. Due to market volatility, current performance may be higher or lower than the performance shown.
This report is submitted for the general information of the shareholders of the Funds. The report is not authorized for distribution to prospective investors in the Funds unless it is accompanied by a current prospectus.
This report reflects our views, opinions and portfolio holdings as of September 30, 2016, the end of the reporting period. These views are subject to change at any time based upon market or other conditions. For more current information throughout the year please visit www.jamestownfunds.com. The Funds are distributed by Ultimus Fund Distributors, LLC.
2
THE JAMESTOWN EQUITY FUND
PERFORMANCE INFORMATION (Unaudited)
Comparison of the Change in Value of a $10,000 Investment in
The Jamestown Equity Fund and the Standard & Poor’s 500® Index
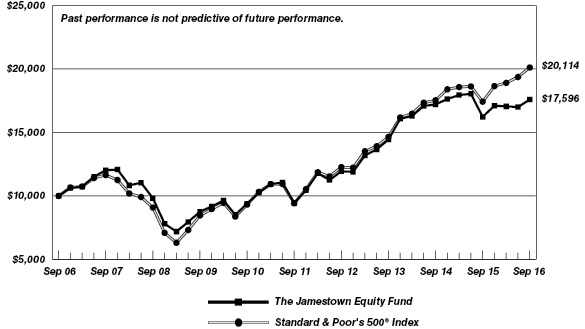
Average Annual Total Returns | |||
1 Year | 5 Years | 10 Years | |
The Jamestown Equity Fund(a) | 8.44% | 13.28% | 5.81% |
Standard & Poor’s 500® Index | 15.43% | 16.37% | 7.24% |
(a) | Total return is a measure of the change in value of an investment in the Fund over the periods covered, which assumes any dividends or capital gains distributions are reinvested in shares of the Fund. Returns shown do not reflect the deduction of taxes a shareholder would pay on Fund distributions or the redemption of Fund shares. |
3
THE JAMESTOWN TAX EXEMPT VIRGINIA FUND
PERFORMANCE INFORMATION (Unaudited)
Comparison of the Change in Value of a $10,000 Investment in
The Jamestown Tax Exempt Virginia Fund
and the Bloomberg Barclays 1-10 Year Municipal Blend Index*
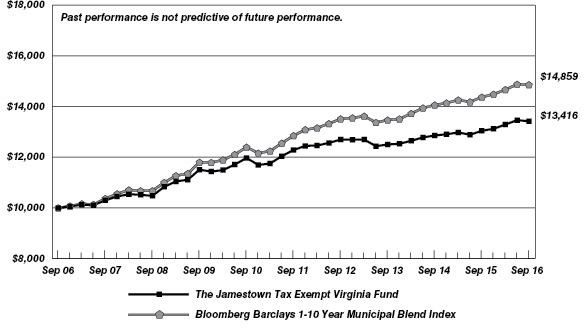
Average Annual Total Returns | |||
1 Year | 5 Years | 10 Years | |
The Jamestown Tax Exempt Virginia Fund(a) | 2.86% | 1.77% | 2.98% |
Bloomberg Barclays 1-10 Year Municipal Blend Index | 3.40% | 2.95% | 4.04% |
* | The Bloomberg Barclays 1-10 Year Municipal Blend Index is an unmanaged, market value-weighted index which covers the short and intermediate components of the U.S. investment-grade tax-exempt bond market. |
(a) | Total return is a measure of the change in value of an investment in the Fund over the periods covered, which assumes any dividends or capital gains distributions are reinvested in shares of the Fund. Returns shown do not reflect the deduction of taxes a shareholder would pay on Fund distributions or the redemption of Fund shares. |
4
THE JAMESTOWN EQUITY FUND
PORTFOLIO INFORMATION
September 30, 2016 (Unaudited)
Asset Allocation (% of Net Assets) | Ten Largest Equity Holdings | % of | |
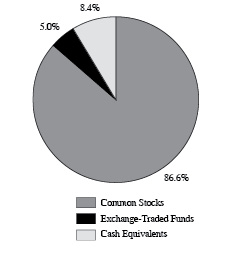 | Apple, Inc. | 3.4% | |
Vanguard Information Technology ETF | 2.7% | ||
CVS Health Corporation | 2.7% | ||
JPMorgan Chase & Company | 2.4% | ||
Discover Financial Services | 2.4% | ||
Chevron Corporation | 2.4% | ||
AT&T, Inc. | 2.3% | ||
Thermo Fisher Scientific, Inc. | 2.3% | ||
Consumer Staples Select Sector SPDR® Fund (The) | 2.3% | ||
Cisco Systems, Inc. | 2.2% | ||
Sector Concentration vs. the S&P 500® Index |
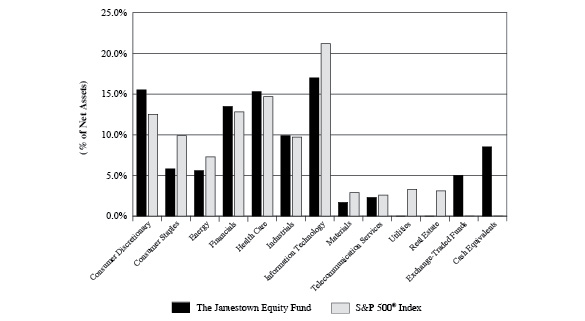
5
THE JAMESTOWN TAX EXEMPT VIRGINIA FUND
PORTFOLIO INFORMATION
September 30, 2016 (Unaudited)
Characteristics | Maturity Breakdown | ||
30-day SEC Yield | 1.19% | 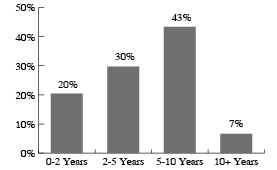 | |
Tax-Equivalent Yield | 2.10%* | ||
Average Maturity (years) | 5.2 | ||
Average Duration (years) | 3.9 | ||
Average Quality | AA | ||
Number of Issues | 55 | ||
* Assumes a maximum 43.4% federal tax rate. | |||
Credit Quality (% of Bonds) | Sector Diversification (% of Bonds) | |
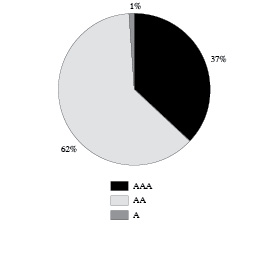 | 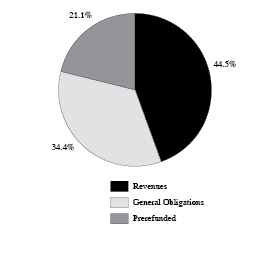 |
6
THE JAMESTOWN EQUITY FUND |
COMMON STOCKS — 86.6% | Shares | Value | ||||||
Consumer Discretionary — 15.5% | ||||||||
Amazon.com, Inc. (a) | 825 | $ | 690,781 | |||||
Comcast Corporation - Class A | 12,100 | 802,714 | ||||||
Dollar Tree, Inc. (a) | 6,500 | 513,045 | ||||||
Home Depot, Inc. (The) | 5,500 | 707,740 | ||||||
Lennar Corporation - Class A | 15,250 | 645,685 | ||||||
Lowe's Companies, Inc. | 4,930 | 355,995 | ||||||
Priceline Group, Inc. (The) (a) | 300 | 441,447 | ||||||
Royal Caribbean Cruises Ltd. | 7,400 | 554,630 | ||||||
TJX Companies, Inc. (The) | 4,700 | 351,466 | ||||||
Walt Disney Company (The) | 7,100 | 659,306 | ||||||
5,722,809 | ||||||||
Consumer Staples — 5.8% | ||||||||
CVS Health Corporation | 11,000 | 978,890 | ||||||
PepsiCo, Inc. | 6,400 | 696,128 | ||||||
Procter & Gamble Company (The) | 5,000 | 448,750 | ||||||
2,123,768 | ||||||||
Energy — 5.6% | ||||||||
Chevron Corporation | 8,500 | 874,820 | ||||||
Exxon Mobil Corporation | 6,300 | 549,864 | ||||||
Hess Corporation | 12,200 | 654,164 | ||||||
2,078,848 | ||||||||
Financials — 13.5% | ||||||||
Ameriprise Financial, Inc. | 6,200 | 618,574 | ||||||
Chubb Ltd. | 3,500 | 439,775 | ||||||
Discover Financial Services | 15,500 | 876,525 | ||||||
Invesco Ltd. | 16,500 | 515,955 | ||||||
JPMorgan Chase & Company | 13,500 | 898,965 | ||||||
Morgan Stanley | 17,000 | 545,020 | ||||||
PNC Financial Services Group, Inc. (The) | 7,800 | 702,702 | ||||||
Wells Fargo & Company | 8,000 | 354,240 | ||||||
4,951,756 | ||||||||
Health Care — 15.3% | ||||||||
Abbott Laboratories | 10,000 | 422,900 | ||||||
Aetna, Inc. | 6,500 | 750,425 | ||||||
Allergan plc (a) | 2,500 | 575,775 | ||||||
AmerisourceBergen Corporation | 2,400 | 193,872 | ||||||
Amgen, Inc. | 4,000 | 667,240 | ||||||
McKesson Corporation | 3,800 | 633,650 | ||||||
Merck & Company, Inc. | 13,000 | 811,330 | ||||||
Thermo Fisher Scientific, Inc. | 5,400 | 858,924 | ||||||
UnitedHealth Group, Inc. | 5,000 | 700,000 | ||||||
5,614,116 | ||||||||
7
THE JAMESTOWN EQUITY FUND |
COMMON STOCKS — 86.6% (Continued) | Shares | Value | ||||||
Industrials — 9.9% | ||||||||
Delta Air Lines, Inc. | 13,000 | $ | 511,680 | |||||
Eaton Corporation plc | 8,800 | 578,248 | ||||||
General Electric Company | 25,000 | 740,500 | ||||||
Nielsen Holdings plc | 13,500 | 723,195 | ||||||
Norfolk Southern Corporation | 5,000 | 485,300 | ||||||
United Technologies Corporation | 6,100 | 619,760 | ||||||
3,658,683 | ||||||||
Information Technology — 17.0% | ||||||||
Alphabet, Inc. - Class A (a) | 975 | 783,959 | ||||||
Alphabet, Inc. - Class C (a) | 1,000 | 777,290 | ||||||
Apple, Inc. | 11,000 | 1,243,550 | ||||||
Cisco Systems, Inc. | 26,000 | 824,720 | ||||||
Microsoft Corporation | 11,500 | 662,400 | ||||||
Oracle Corporation | 18,000 | 707,040 | ||||||
QUALCOMM, Inc. | 8,300 | 568,550 | ||||||
TE Connectivity Ltd. | 10,700 | 688,866 | ||||||
6,256,375 | ||||||||
Materials — 1.7% | ||||||||
Eastman Chemical Company | 9,000 | 609,120 | ||||||
Telecommunication Services — 2.3% | ||||||||
AT&T, Inc. | 21,250 | 862,962 | ||||||
Total Common Stocks (Cost $20,741,550) | $ | 31,878,437 | ||||||
EXCHANGE-TRADED FUNDS — 5.0% | Shares | Value | ||||||
Consumer Staples Select Sector SPDR® Fund (The) | 15,700 | $ | 835,397 | |||||
Vanguard Information Technology ETF | 8,300 | 999,071 | ||||||
Total Exchange-Traded Funds (Cost $1,747,294) | $ | 1,834,468 | ||||||
8
THE JAMESTOWN EQUITY FUND |
MONEY MARKET FUNDS — 8.5% | Shares | Value | ||||||
Federated Government Obligations Fund - Institutional Class, 0.26% (b) (Cost $3,135,662) | 3,135,662 | $ | 3,135,662 | |||||
Total Investments at Value — 100.1%(Cost $25,624,506) | $ | 36,848,567 | ||||||
Liabilities in Excess of Other Assets — (0.1%) | (53,342 | ) | ||||||
Net Assets — 100.0% | $ | 36,795,225 | ||||||
(a) | Non-income producing security. |
(b) | The rate shown is the 7-day effective yield as of September 30, 2016. |
See accompanying notes to financial statements. | |
9
THE JAMESTOWN TAX EXEMPT VIRGINIA FUND |
VIRGINIA REVENUE AND GENERAL OBLIGATION (GO) BONDS — 84.3% | Par Value | Value | ||||||
Chesterfield Co., Virginia, GO, | ||||||||
5.00%, due 01/01/2020 | $ | 300,000 | $ | 303,186 | ||||
5.00%, due 01/01/2024 | 250,000 | 299,342 | ||||||
5.00%, due 01/01/2025 | 460,000 | 575,621 | ||||||
City of Norfolk, Virginia, Series A, GO, | ||||||||
5.00%, due 10/01/2026 | 200,000 | 260,820 | ||||||
City of Winchester, Virginia, GO, | ||||||||
5.00%, due 09/01/2027 | 125,000 | 157,588 | ||||||
Fairfax Co., Virginia, Industrial Dev. Authority, Revenue, | ||||||||
5.00%, due 05/15/2022, | ||||||||
prerefunded 05/15/2019 @ 100 | 750,000 | 829,695 | ||||||
Fairfax Co., Virginia, Sewer, Revenue, | ||||||||
4.50%, due 07/15/2030, | ||||||||
prerefunded 07/15/2021 @ 100 | 250,000 | 291,042 | ||||||
Fairfax Co., Virginia, Water, Revenue, | ||||||||
5.00%, due 04/01/2027 | 500,000 | 596,770 | ||||||
Hampton Roads Sanitation District, Virginia, Wastewater, Revenue, | ||||||||
5.00%, due 04/01/2022, | ||||||||
prerefunded 04/01/2018 @ 100 | 400,000 | 424,800 | ||||||
5.00%, due 07/01/2026 | 500,000 | 626,795 | ||||||
Hampton Roads Sanitation District, Virginia, Wastewater, Series A, Revenue, | ||||||||
5.00%, due 01/01/2027, | ||||||||
prerefunded 01/01/2021 @ 100 | 400,000 | 467,540 | ||||||
Hampton, Virginia, GO, | ||||||||
5.00%, due 04/01/2025 | 500,000 | 603,255 | ||||||
Harrisonburg, Virginia, GO, | ||||||||
5.00%, due 07/15/2022 | 350,000 | 424,550 | ||||||
Henrico Co., Virginia, Water & Sewer, Revenue, | ||||||||
5.00%, due 05/01/2020, | ||||||||
prerefunded 05/01/2019 @ 100 | 350,000 | 386,662 | ||||||
5.00%, due 05/01/2022, | ||||||||
prerefunded 05/01/2019 @ 100 | 430,000 | 475,043 | ||||||
James City, Virginia, Water & Sewer, Revenue, | ||||||||
5.00%, due 01/15/2026 | 250,000 | 322,037 | ||||||
Louisa, Virginia, Industrial Dev. Authority, Poll Control Revenue, | ||||||||
2.15%, due 11/01/2035 | 200,000 | 205,932 | ||||||
Lynchburg, Virginia, Public Improvement, Series A, GO, | ||||||||
5.00%, due 08/01/2019 | 625,000 | 697,025 | ||||||
Manassas, Virginia, Public Improvement, Series D, GO, | ||||||||
5.00%, due 07/01/2019 | 250,000 | 278,820 | ||||||
10
THE JAMESTOWN TAX EXEMPT VIRGINIA FUND |
VIRGINIA REVENUE AND GENERAL OBLIGATION (GO) BONDS — 84.3% (Continued) | Par Value | Value | ||||||
New Kent Co., Virginia, Economic Dev. Authority, Revenue, | ||||||||
5.00%, due 02/01/2019, | ||||||||
prerefunded 02/01/2017 @ 100 | $ | 500,000 | $ | 507,130 | ||||
Newport News, Virginia, GO, | ||||||||
5.00%, due 07/15/2025 | 350,000 | 450,135 | ||||||
Northern Virginia Transportation Authority, Special Tax, Revenue, | ||||||||
5.00%, due 06/01/2026 | 400,000 | 496,376 | ||||||
Portsmouth, Virginia, Series D, GO, | ||||||||
4.00%, due 12/01/2017 | 215,000 | 223,015 | ||||||
Prince William Co., Virginia, Lease Participation Certificates, | ||||||||
5.00%, due 10/01/2020 | 500,000 | 573,300 | ||||||
Rappahannock, Virginia, Regional Jail Authority, Revenue, | ||||||||
5.00%, due 10/01/2024 | 300,000 | 378,000 | ||||||
Roanoke, Virginia, Public Improvement, Series A, GO, | ||||||||
5.00%, due 07/15/2025 | 400,000 | 493,540 | ||||||
Spotsylvania Co., Virginia, Economic Dev. Authority, Revenue, | ||||||||
5.00%, due 06/01/2021 | 300,000 | 351,711 | ||||||
Spotsylvania Co., Virginia, GO, | ||||||||
5.00%, due 01/15/2023 | 400,000 | 492,576 | ||||||
Stafford Co., Virginia, Public Improvement, GO, | ||||||||
5.00%, due 08/01/2026 | 375,000 | 482,276 | ||||||
Suffolk, Virginia, Public Improvement, GO, | ||||||||
5.00%, due 02/01/2022 | 400,000 | 481,408 | ||||||
Suffolk, Virginia, Public Improvement, Series A, GO, | ||||||||
4.00%, due 08/01/2018 | 250,000 | 264,345 | ||||||
Upper Occoquan, Virginia, Sewer Authority, Revenue, | ||||||||
5.15%, due 07/01/2020 | 205,000 | 223,577 | ||||||
5.00%, due 07/01/2027 | 350,000 | 446,667 | ||||||
Virginia Beach, Virginia, Public Improvement, GO, | ||||||||
5.00%, due 06/01/2021, | ||||||||
prerefunded 06/01/2019 @ 100 | 250,000 | 277,135 | ||||||
5.00%, due 03/01/2023 | 300,000 | 371,319 | ||||||
4.00%, due 04/01/2027 | 205,000 | 231,888 | ||||||
Virginia Biotechnology Research Partnership Authority, Lease Revenue, | ||||||||
5.00%, due 09/01/2020 | 500,000 | 574,735 | ||||||
Virginia College Building Authority, Educational Facilities, Revenue, | ||||||||
5.00%, due 03/01/2019 | 250,000 | 274,390 | ||||||
4.00%, due 09/01/2026 | 500,000 | 573,395 | ||||||
11
THE JAMESTOWN TAX EXEMPT VIRGINIA FUND |
VIRGINIA REVENUE AND GENERAL OBLIGATION (GO) BONDS — 84.3% (Continued) | Par Value | Value | ||||||
Virginia Commonwealth Transportation Board, Federal Highway Reimbursement Anticipation Notes, Revenue, | ||||||||
5.00%, due 03/15/2023 | $ | 500,000 | $ | 598,455 | ||||
5.00%, due 03/15/2025 | 500,000 | 608,570 | ||||||
Virginia Small Business Financing Authority, Healthcare Facilities, Revenue, | ||||||||
5.00%, due 11/01/2017 | 250,000 | 261,042 | ||||||
Virginia State Housing Dev. Authority, Revenue, | ||||||||
3.05%, due 07/01/2021 | 200,000 | 214,642 | ||||||
Virginia State Public School Authority, Revenue, | ||||||||
5.00%, due 08/01/2023 | 500,000 | 608,930 | ||||||
5.00%, due 07/15/2026 | 300,000 | 373,122 | ||||||
Virginia State Public School Authority, Series B-1, Revenue, | ||||||||
5.00%, due 08/01/2018 | 500,000 | 537,445 | ||||||
Virginia State Resources Authority, Clean Water, Revenue, | ||||||||
5.00%, due 10/01/2021, | ||||||||
prerefunded 10/01/2019 @ 100 | 500,000 | 560,595 | ||||||
Virginia State Resources Authority, Infrastructure, Revenue, | ||||||||
5.00%, due 11/01/2024, | ||||||||
prerefunded 11/01/2018 @ 100 | 405,000 | 439,530 | ||||||
5.00%, due 11/01/2024, | ||||||||
prerefunded 11/01/2018 @ 100 | 35,000 | 37,984 | ||||||
5.00%, due 11/01/2024 | 60,000 | 64,944 | ||||||
Virginia State Resources Authority, Infrastructure, Series B, Revenue, | ||||||||
5.00%, due 11/01/2024 | 150,000 | 183,257 | ||||||
Virginia State, Series B, GO, | ||||||||
5.00%, due 06/01/2017 | 250,000 | 257,038 | ||||||
Washington Co., Virginia, Revenue, | ||||||||
4.00%, due 12/01/2025 | 350,000 | 415,079 | ||||||
Western Virginia Regional Jail Authority, Revenue, | ||||||||
5.00%, due 12/01/2023 | 250,000 | 309,198 | ||||||
Total Virginia Revenue and General Obligation (GO) Bonds (Cost $20,777,502) | $ | 21,863,272 | ||||||
WASHINGTON, D.C. REVENUE BONDS — 2.1% | Par Value | Value | ||||||
Metropolitan Washington Airports Authority, Series C, Revenue, | ||||||||
5.00%, due 10/01/2022 (Cost $502,813) | $ | 500,000 | $ | 538,265 | ||||
12
THE JAMESTOWN TAX EXEMPT VIRGINIA FUND |
EXCHANGE-TRADED FUNDS — 1.8% | Shares | Value | ||||||
SPDR® Nuveen Barclays Short Term Municipal Bond ETF | 2,500 | $ | 122,125 | |||||
VanEck Vectors ETF | 14,000 | 344,260 | ||||||
Total Exchange-Traded Funds (Cost $467,750) | $ | 466,385 | ||||||
MONEY MARKET FUNDS — 11.7% | Shares | Value | ||||||
Federated Government Obligations Fund - Institutional Class, 0.26% (a) (Cost $3,030,524) | 3,030,524 | $ | 3,030,524 | |||||
Total Investments at Value — 99.9%(Cost $24,778,589) | $ | 25,898,446 | ||||||
Other Assets in Excess of Liabilities — 0.1% | 15,161 | |||||||
Net Assets — 100.0% | $ | 25,913,607 | ||||||
(a) | The rate shown is the 7-day effective yield as of September 30, 2016. |
See accompanying notes to financial statements. | |
13
THE JAMESTOWN FUNDS |
The Jamestown | The | |||||||
ASSETS | ||||||||
Investments in securities: | ||||||||
At acquisition cost | $ | 25,624,506 | $ | 24,778,589 | ||||
At value (Note 2) | $ | 36,848,567 | $ | 25,898,446 | ||||
Dividends and interest receivable | 24,417 | 259,198 | ||||||
Receivable for capital shares sold | 1,919 | 50,000 | ||||||
Other assets | 9,885 | 9,600 | ||||||
TOTAL ASSETS | 36,884,788 | 26,217,244 | ||||||
LIABILITIES | ||||||||
Distributions payable | 5,807 | 1,780 | ||||||
Payable for investment securities purchased | 15,250 | 260,392 | ||||||
Payable for capital shares redeemed | 42,598 | 30,767 | ||||||
Accrued investment advisory fees (Note 4) | 18,080 | 3,153 | ||||||
Payable to administrator (Note 4) | 5,700 | 5,700 | ||||||
Other accrued expenses | 2,128 | 1,845 | ||||||
TOTAL LIABILITIES | 89,563 | 303,637 | ||||||
NET ASSETS | $ | 36,795,225 | $ | 25,913,607 | ||||
Net assets consist of: | ||||||||
Paid-in capital | $ | 24,247,454 | $ | 24,796,858 | ||||
Accumulated net investment income | 1,162 | — | ||||||
Accumulated net realized gains (losses) from security transactions | 1,322,548 | (3,108 | ) | |||||
Net unrealized appreciation on investments | 11,224,061 | 1,119,857 | ||||||
Net assets | $ | 36,795,225 | $ | 25,913,607 | ||||
Shares of beneficial interest outstanding (unlimited number of shares authorized, $0.01 par value) | 1,837,703 | 2,539,017 | ||||||
Net asset value, offering price and redemption price per share (Note 2) | $ | 20.02 | $ | 10.21 | ||||
See accompanying notes to financial statements. |
14
THE JAMESTOWN FUNDS |
The Jamestown Equity | The Jamestown Tax Exempt Virginia | |||||||
INVESTMENT INCOME | ||||||||
Dividends | $ | 366,635 | $ | 2,897 | ||||
Interest | — | 327,229 | ||||||
TOTAL INVESTMENT INCOME | 366,635 | 330,126 | ||||||
EXPENSES | ||||||||
Investment advisory fees (Note 4) | 121,395 | 51,042 | ||||||
Administration fees (Note 4) | 30,000 | 30,000 | ||||||
Professional fees | 9,111 | 9,861 | ||||||
Trustees’ fees and expenses (Note 4) | 5,472 | 5,472 | ||||||
Compliance service fees (Note 4) | 4,200 | 4,200 | ||||||
Custodian and bank service fees | 4,320 | 2,785 | ||||||
Account maintenance fees | 2,109 | 3,535 | ||||||
Pricing costs | 725 | 4,605 | ||||||
Registration and filing fees | 3,302 | 1,994 | ||||||
Printing of shareholder reports | 3,748 | 1,407 | ||||||
Postage and supplies | 2,154 | 1,203 | ||||||
Other expenses | 4,275 | 2,776 | ||||||
TOTAL EXPENSES | 190,811 | 118,880 | ||||||
Fees voluntarily waived by the Adviser (Note 4) | (7,387 | ) | (30,833 | ) | ||||
Expenses reimbursed through a directed brokerage arrangement (Note 5) | (6,000 | ) | — | |||||
NET EXPENSES | 177,424 | 88,047 | ||||||
NET INVESTMENT INCOME | 189,211 | 242,079 | ||||||
REALIZED AND UNREALIZED GAINS (LOSSES) ON INVESTMENTS | ||||||||
Net realized gains on security transactions | 1,418,824 | 6,214 | ||||||
Capital gain distributions from regulated investment companies | — | 573 | ||||||
Net change in unrealized appreciation (depreciation) on investments | (423,892 | ) | (9,980 | ) | ||||
NET REALIZED AND UNREALIZED GAINS (LOSSES) ON INVESTMENTS | 994,932 | (3,193 | ) | |||||
NET INCREASE IN NET ASSETS FROM OPERATIONS | $ | 1,184,143 | $ | 238,886 | ||||
See accompanying notes to financial statements. |
15
THE JAMESTOWN EQUITY FUND |
Six Months | Year | |||||||
FROM OPERATIONS | ||||||||
Net investment income | $ | 189,211 | $ | 293,553 | ||||
Net realized gains on security transactions | 1,418,824 | 308,030 | ||||||
Net realized gains from in-kind redemptions (Note 2) | — | 1,079,680 | ||||||
Net change in unrealized appreciation (depreciation) on investments | (423,892 | ) | (3,978,103 | ) | ||||
Net increase (decrease) in net assets from operations | 1,184,143 | (2,296,840 | ) | |||||
DISTRIBUTIONS TO SHAREHOLDERS | ||||||||
From net investment income | (197,761 | ) | (281,968 | ) | ||||
From net realized gains from security transactions | (114,384 | ) | (1,610,525 | ) | ||||
Decrease in net assets from distributions to shareholders | (312,145 | ) | (1,892,493 | ) | ||||
FROM CAPITAL SHARE TRANSACTIONS | ||||||||
Net assets received in conjunction with fund merger (Note 1) | — | 15,513,703 | ||||||
Proceeds from shares sold | 297,094 | 976,998 | ||||||
Net asset value of shares issued in reinvestment of distributions to shareholders | 291,086 | 1,798,593 | ||||||
Payments for shares redeemed | (2,346,690 | ) | (6,014,160 | ) | ||||
Net increase (decrease) in net assets from capital share transactions | (1,758,510 | ) | 12,275,134 | |||||
TOTAL INCREASE (DECREASE) IN NET ASSETS | (886,512 | ) | 8,085,801 | |||||
NET ASSETS | ||||||||
Beginning of period | 37,681,737 | 29,595,936 | ||||||
End of period | $ | 36,795,225 | $ | 37,681,737 | ||||
ACCUMULATED NET INVESTMENT INCOME | $ | 1,162 | $ | 9,712 | ||||
CAPITAL SHARE ACTIVITY | ||||||||
Shares received in conjunction with fund merger (Note 1) | — | 738,504 | ||||||
Shares sold | 15,181 | 50,176 | ||||||
Shares reinvested | 14,870 | 87,142 | ||||||
Shares redeemed | (117,959 | ) | (301,261 | ) | ||||
Net increase (decrease) in shares outstanding | (87,908 | ) | 574,561 | |||||
Shares outstanding, beginning of period | 1,925,611 | 1,351,050 | ||||||
Shares outstanding, end of period | 1,837,703 | 1,925,611 | ||||||
See accompanying notes to financial statements. |
16
THE JAMESTOWN TAX EXEMPT VIRGINIA FUND |
Six Months | Year | |||||||
FROM OPERATIONS | ||||||||
Net investment income | $ | 242,079 | $ | 547,481 | ||||
Net realized gains (losses) on security transactions | 6,214 | (358 | ) | |||||
Capital gain distributions from regulated investment companies | 573 | 1,310 | ||||||
Net change in unrealized appreciation (depreciation) on investments | (9,980 | ) | 65,449 | |||||
Net increase in net assets from operations | 238,886 | 613,882 | ||||||
DISTRIBUTIONS TO SHAREHOLDERS | ||||||||
From net investment income | (242,079 | ) | (547,481 | ) | ||||
FROM CAPITAL SHARE TRANSACTIONS | ||||||||
Proceeds from shares sold | 744,083 | 956,558 | ||||||
Net asset value of shares issued in reinvestment of distributions to shareholders | 217,772 | 490,264 | ||||||
Payments for shares redeemed | (691,786 | ) | (2,561,366 | ) | ||||
Net increase (decrease) in net assets from capital share transactions | 270,069 | (1,114,544 | ) | |||||
TOTAL INCREASE (DECREASE) IN NET ASSETS | 266,876 | (1,048,143 | ) | |||||
NET ASSETS | ||||||||
Beginning of period | 25,646,731 | 26,694,874 | ||||||
End of period | $ | 25,913,607 | $ | 25,646,731 | ||||
ACCUMULATED NET INVESTMENT INCOME | $ | — | $ | — | ||||
CAPITAL SHARE ACTIVITY | ||||||||
Shares sold | 72,691 | 93,889 | ||||||
Shares reinvested | 21,253 | 48,415 | ||||||
Shares redeemed | (67,476 | ) | (252,646 | ) | ||||
Net increase (decrease) in shares outstanding | 26,468 | (110,342 | ) | |||||
Shares outstanding, beginning of period | 2,512,549 | 2,622,891 | ||||||
Shares outstanding, end of period | 2,539,017 | 2,512,549 | ||||||
See accompanying notes to financial statements. |
17
THE JAMESTOWN EQUITY FUND |
Selected Per Share Data and Ratios for a Share Outstanding Throughout Each Period | ||||||||||||||||||||||||
Six Months | Years Ended March 31, | |||||||||||||||||||||||
2016 | 2015 | 2014 | 2013 | 2012 | ||||||||||||||||||||
Net asset value at beginning of period | $ | 19.57 | $ | 21.91 | $ | 22.47 | $ | 19.60 | $ | 17.73 | $ | 16.54 | ||||||||||||
Income (loss) from investment operations: | ||||||||||||||||||||||||
Net investment income | 0.10 | 0.16 | 0.16 | 0.15 | 0.15 | 0.09 | ||||||||||||||||||
Net realized and unrealized gains (losses) on investments | 0.52 | (1.18 | ) | 1.96 | 4.30 | 1.93 | 1.21 | |||||||||||||||||
Total from investment operations | 0.62 | (1.02 | ) | 2.12 | 4.45 | 2.08 | 1.30 | |||||||||||||||||
Less distributions: | ||||||||||||||||||||||||
Dividends from net investment income | (0.11 | ) | (0.16 | ) | (0.16 | ) | (0.15 | ) | (0.15 | ) | (0.11 | ) | ||||||||||||
Distributions from net realized gains | (0.06 | ) | (1.16 | ) | (2.52 | ) | (1.43 | ) | (0.06 | ) | — | |||||||||||||
Total distributions | (0.17 | ) | (1.32 | ) | (2.68 | ) | (1.58 | ) | (0.21 | ) | (0.11 | ) | ||||||||||||
Net asset value at end of period | $ | 20.02 | $ | 19.57 | $ | 21.91 | $ | 22.47 | $ | 19.60 | $ | 17.73 | ||||||||||||
Total return (a) | 3.17 | %(b) | (4.96 | %) | 10.14 | % | 23.55 | % | 11.84 | % | 7.89 | % | ||||||||||||
Net assets at end of period (000’s) | $ | 36,795 | $ | 37,682 | $ | 29,596 | $ | 30,746 | $ | 28,316 | $ | 27,703 | ||||||||||||
Ratio of total expenses to average net assets | 1.02 | %(c) | 1.03 | % | 1.09 | % | 1.07 | % | 1.11 | % | 1.11 | % | ||||||||||||
Ratio of net expenses to average net assets (d) | 0.95 | %(c)(e) | 1.00 | % | 1.05 | % | 1.03 | % | 1.06 | % | 1.06 | % | ||||||||||||
Ratio of net investment income to average net assets (d) | 1.01 | %(c)(e) | 0.82 | % | 0.71 | % | 0.72 | % | 0.81 | % | 0.56 | % | ||||||||||||
Portfolio turnover rate | 16 | %(b) | 50 | % | 29 | % | 21 | % | 28 | % | 28 | % | ||||||||||||
(a) | Total return is a measure of the change in value of an investment in the Fund over the period covered, which assumes any dividends or realized capital gains distributions are reinvested in shares of the Fund. Returns do not reflect the deduction of taxes a shareholder would pay on Fund distributions or the redemption of Fund shares. |
(b) | Not annualized. |
(c) | Annualized. |
(d) | Ratios were determined based on net expenses after expense reimbursements through a directed brokerage arrangement (Note 5). |
(e) | Ratio was determined after voluntary advisory fee waivers by the Adviser (Note 4). |
See accompanying notes to financial statements. | |
18
THE JAMESTOWN TAX EXEMPT VIRGINIA FUND |
Selected Per Share Data and Ratios for a Share Outstanding Throughout Each Period | ||||||||||||||||||||||||
Six Months | Years Ended March 31, | |||||||||||||||||||||||
2016 | 2015 | 2014 | 2013 | 2012 | ||||||||||||||||||||
Net asset value at beginning of period | $ | 10.21 | $ | 10.18 | $ | 10.16 | $ | 10.47 | $ | 10.57 | $ | 10.25 | ||||||||||||
Income (loss) from investment operations: | ||||||||||||||||||||||||
Net investment income | 0.10 | 0.21 | 0.24 | 0.26 | 0.26 | 0.29 | ||||||||||||||||||
Net realized and unrealized gains (losses) on investments | (0.00 | )(a) | 0.03 | 0.02 | (0.30 | ) | (0.06 | ) | 0.32 | |||||||||||||||
Total from investment operations | 0.10 | 0.24 | 0.26 | (0.04 | ) | 0.20 | 0.61 | |||||||||||||||||
Less distributions: | ||||||||||||||||||||||||
Dividends from net investment income | (0.10 | ) | (0.21 | ) | (0.24 | ) | (0.26 | ) | (0.27 | ) | (0.29 | ) | ||||||||||||
Distributions from net realized gains | — | — | — | (0.01 | ) | (0.03 | ) | (0.00 | )(a) | |||||||||||||||
Total distributions | (0.10 | ) | (0.21 | ) | (0.24 | ) | (0.27 | ) | (0.30 | ) | (0.29 | ) | ||||||||||||
Net asset value at end of period | $ | 10.21 | $ | 10.21 | $ | 10.18 | $ | 10.16 | $ | 10.47 | $ | 10.57 | ||||||||||||
Total return (b) | 0.95 | %(c) | 2.40 | % | 2.61 | % | (0.37 | %) | 1.88 | % | 6.03 | % | ||||||||||||
Net assets at end of period (000’s) | $ | 25,914 | $ | 25,647 | $ | 26,695 | $ | 26,284 | $ | 27,782 | $ | 30,063 | ||||||||||||
Ratio of total expenses to average net assets | 0.93 | %(d) | 0.90 | % | 0.88 | % | 0.88 | % | 0.76 | % | 0.77 | % | ||||||||||||
Ratio of net expenses to average net assets (e) | 0.69 | %(d) | 0.69 | % | 0.69 | % | 0.69 | % | 0.69 | % | 0.69 | % | ||||||||||||
Ratio of net investment income to average net assets (e) | 1.90 | %(d) | 2.08 | % | 2.38 | % | 2.59 | % | 2.50 | % | 2.75 | % | ||||||||||||
Portfolio turnover rate | 6 | %(c) | 11 | % | 16 | % | 1 | % | 15 | % | 2 | % | ||||||||||||
(a) | Amount rounds to less than a $0.01 per share. |
(b) | Total return is a measure of the change in value of an investment in the Fund over the period covered, which assumes any dividends or realized capital gains distributions are reinvested in shares of the Fund. Returns do not reflect the deduction of taxes a shareholder would pay on Fund distributions or the redemption of Fund shares. |
(c) | Not annualized. |
(d) | Annualized. |
(e) | Ratios were determined after voluntary advisory fee waivers by the Adviser (Note 4). |
See accompanying notes to financial statements. |
19
THE JAMESTOWN FUNDS
NOTES TO FINANCIAL STATEMENTS
September 30, 2016 (Unaudited)
1. Organization
The Jamestown Equity Fund and The Jamestown Tax Exempt Virginia Fund (individually, a “Fund,” and, collectively, the “Funds”) are each a no-load series of Williamsburg Investment Trust (the “Trust”), an open-end management investment company registered under the Investment Company Act of 1940. The Jamestown Equity Fund is a diversified fund and The Jamestown Tax Exempt Virginia Fund is a non-diversified fund. The Trust was organized as a Massachusetts business trust on July 18, 1988. Other series of the Trust are not included in this report.
The Jamestown Equity Fund’s investment objective is long-term growth of capital.
The Jamestown Tax Exempt Virginia Fund’s investment objectives are to provide current income exempt from federal income taxes and from the personal income taxes of Virginia, to preserve capital, to limit credit risk and to take advantage of opportunities to increase and enhance the value of a shareholder’s investment.
On July 29, 2015, The Jamestown Equity Fund consummated a tax-free merger with The Jamestown Balanced Fund, previously a series of the Trust, as approved by the Board of Trustees on May 19, 2015. Pursuant to the terms of the agreement governing the merger, each share of The Jamestown Balanced Fund was converted into an equivalent dollar amount of shares of The Jamestown Equity Fund, based on the net asset value of The Jamestown Equity Fund and The Jamestown Balanced Fund as of July 28, 2015 ($21.01 and $14.07, respectively), resulting in a conversion ratio of 0.669654 shares of The Jamestown Equity Fund for each share of The Jamestown Balanced Fund. The Jamestown Equity Fund issued 738,504 shares to shareholders of The Jamestown Balanced Fund. The basis of the assets transferred from The Jamestown Balanced Fund reflected the historical basis of the assets as of the date of the tax-free merger. Net assets of The Jamestown Equity Fund and The Jamestown Balanced Fund as of the merger date were $28,889,235 and $15,513,703, respectively, including unrealized appreciation on investments of $11,999,716 and $3,528,216, respectively. The Jamestown Balanced Fund’s net assets at the time of the merger included accumulated realized capital losses of $25,176. Total net assets of The Jamestown Equity Fund immediately after the merger were $44,402,938.
Assuming the acquisition had been completed on April 1, 2015, the beginning of the annual reporting period of The Jamestown Equity Fund, The Jamestown Equity Fund's pro forma results of operation for the year ended March 31, 2016, are as follows:
Net Investment | Net Realized Losses and Net Change in Unrealized Depreciation on Investments | Net Decrease in Net Assets Resulting from Operations | ||||||||
| $ 342,730 |
| $ (2,602,705) |
|
| $ (2,259,975) |
| |||
Because the combined investment portfolios have been managed as a single integrated portfolio since the acquisition was completed, it is not practical to separate the amounts of revenue and earnings of The Jamestown Balanced Fund that has been included in The Jamestown Equity Fund's Statement of Operations since July 29, 2015.
20
THE JAMESTOWN FUNDS
NOTES TO FINANCIAL STATEMENTS (Continued)
2. Significant Accounting Policies
As an investment company, as defined in Financial Accounting Standards Board (“FASB”) Accounting Standards Update 2013-08, each Fund follows accounting and reporting guidance under FASB Accounting Standards Codification Topic 946, “Financial Services – Investment Companies.” The following is a summary of the Funds’ significant accounting policies. These policies are in conformity with accounting principles generally accepted in the United States of America (“GAAP”).
Securities valuation — The Funds’ portfolio securities are valued as of the close of business of the regular session of the New York Stock Exchange (normally 4:00 p.m., Eastern time). Securities traded on a national stock exchange, including common stocks, are generally valued based upon the closing price on the principal exchange where the security is traded, if available, otherwise, at the last quoted bid price. Securities which are quoted by NASDAQ are valued at the NASDAQ Official Closing Price. Investments representing shares of other open-end investment companies, including exchange-traded funds and money market funds, are valued at their net asset value as reported by such companies.
Fixed income securities, including municipal bonds, are typically valued on the basis of prices provided by an independent pricing service. The prices provided by the pricing service are determined with consideration given to institutional bid and last sale prices and take into account securities prices, yields, maturities, call features, ratings, institutional trading in similar groups of securities and developments related to specific securities.
When using a quoted price and when the market is considered active, securities will be classified as Level 1 within the fair value hierarchy. When market quotations are not readily available, if a pricing service cannot provide a price or the investment adviser believes the price received from the pricing service is not indicative of market value, securities will be valued in good faith at fair value using methods consistent with procedures adopted by the Board of Trustees and will be classified as Level 2 or 3 within the fair value hierarchy (see below), depending on the inputs used. Such methods of fair valuation may include, but are not limited to: multiple of earnings, multiple of book value, discount from market of a similar freely traded security, purchase price of the security, subsequent private transactions in the security or related securities, or a combination of these and other factors.
GAAP establishes a single authoritative definition of fair value, sets out a framework for measuring fair value and requires additional disclosures about fair value measurements.
Various inputs are used in determining the value of each Fund’s investments. These inputs are summarized in the three broad levels listed below:
● | Level 1 – quoted prices in active markets for identical securities |
● | Level 2 – other significant observable inputs |
● | Level 3 – significant unobservable inputs |
21
THE JAMESTOWN FUNDS
NOTES TO FINANCIAL STATEMENTS (Continued)
Fixed income securities, including municipal bonds, are classified as Level 2 since the values for such securities are based on prices provided by an independent pricing service that utilizes various “other significant observable inputs” including bid and ask quotations, prices of similar securities and interest rates, among other factors.
The inputs or methodology used for valuing securities are not necessarily an indication of the risks associated with investing in those securities. The inputs used to measure fair value may fall into different levels of the fair value hierarchy. In such cases, for disclosure purposes, the level in the fair value hierarchy within which the fair value measurement falls in its entirety is determined based on the lowest level input that is significant to the fair value measurement.
The following is a summary of the inputs used to value each Fund’s investments as of September 30, 2016, by security type:
The Jamestown Equity Fund | Level 1 | Level 2 | Level 3 | Total | ||||||||||||
Common Stocks | $ | 31,878,437 | $ | — | $ | — | $ | 31,878,437 | ||||||||
Exchange-Traded Funds | 1,834,468 | — | — | 1,834,468 | ||||||||||||
Money Market Funds | 3,135,662 | — | — | 3,135,662 | ||||||||||||
Total | $ | 36,848,567 | $ | — | $ | — | $ | 36,848,567 | ||||||||
The Jamestown Tax Exempt Virginia Fund | Level 1 | Level 2 | Level 3 | Total | ||||||||||||
Municipal Bonds | $ | — | $ | 22,401,537 | $ | — | $ | 22,401,537 | ||||||||
Exchange-Traded Funds | 466,385 | — | — | 466,385 | ||||||||||||
Money Market Funds | 3,030,524 | — | — | 3,030,524 | ||||||||||||
Total | $ | 3,496,909 | $ | 22,401,537 | — | $ | 25,898,446 | |||||||||
Refer to The Jamestown Equity Fund’s Schedule of Investments for a listing of the common stocks by sector type. As of September 30, 2016, the Funds did not have any transfers into and out of any Level. There were no Level 3 securities or derivative instruments held by the Funds as of September 30, 2016. It is the Funds’ policy to recognize transfers into and out of any Level at the end of the reporting period.
Share valuation — The net asset value per share of each Fund is calculated daily by dividing the total value of its assets, less liabilities, by the number of shares outstanding. The offering price and redemption price per share of each Fund is equal to the net asset value per share.
Investment income — Interest income is accrued as earned. Dividend income and capital gain distributions are recorded on the ex-dividend date. Discounts and premiums on fixed income securities purchased are amortized using the interest method. Withholding taxes on foreign dividends received by The Jamestown Equity Fund, if any, have been recorded in accordance with the Fund's understanding of the appropriate country's rules and tax rates.
Distributions to shareholders — Dividends arising from net investment income, if any, are declared and paid quarterly to shareholders of The Jamestown Equity Fund. Dividends arising from net investment income are declared daily and paid monthly to shareholders of The
22
THE JAMESTOWN FUNDS
NOTES TO FINANCIAL STATEMENTS (Continued)
Jamestown Tax Exempt Virginia Fund. Net realized short-term capital gains, if any, may be distributed throughout the year and net realized long-term capital gains, if any, are distributed at least once each year. The amount of distributions from net investment income and net realized capital gains are determined in accordance with federal income tax regulations, which may differ from GAAP. These “book/tax” differences are permanent in nature and are primarily due to differing treatments of net short-term capital gains. Dividends and distributions are recorded on the ex-dividend date.
The tax character of distributions paid during the periods ended September 30, 2016 and March 31, 2016 was as follows:
Periods Ended | Ordinary Income | Long-Term Capital Gains | Exempt- Interest Dividends | Total Distributions | |||||||||||||
The Jamestown Equity Fund | 9/30/16 | $ | 197,761 | $ | 114,384 | $ | — | $ | 312,145 | ||||||||
3/31/16 | $ | 281,968 | $ | 1,610,525 | $ | — | $ | 1,892,493 | |||||||||
The Jamestown Tax Exempt Virginia Fund | 9/30/16 | $ | — | $ | — | $ | 242,079 | $ | 242,079 | ||||||||
| 3/31/16 | $ | — | $ | — | $ | 547,481 | $ | 547,481 | ||||||||
Security transactions — Security transactions are accounted for on trade date for financial reporting purposes. Realized gains and losses on securities sold are determined on a specific identification basis.
Common expenses — Common expenses of the Trust are allocated among the series of the Trust based on relative net assets of each series or the nature of the services performed and the relative applicability to each series.
Estimates — The preparation of financial statements in conformity with GAAP requires management to make estimates and assumptions that affect the reported amounts of assets and liabilities and the disclosure of contingent assets and liabilities as of the date of the financial statements and the reported amounts of income and expenses during the reporting period. Actual results could differ from those estimates.
Federal income tax — Each Fund has qualified and intends to continue to qualify as a regulated investment company under the Internal Revenue Code of 1986 (the “Code”). Qualification generally will relieve the Funds of liability for federal income taxes to the extent 100% of their net investment income and net realized capital gains are distributed in accordance with the Code.
In order to avoid imposition of the excise tax applicable to regulated investment companies, it is also each Fund’s intention to declare as dividends in each calendar year at least 98% of its net investment income (earned during the calendar year) and 98.2% of its net realized capital gains (earned during the twelve months ended October 31) plus undistributed amounts from prior years.
23
THE JAMESTOWN FUNDS
NOTES TO FINANCIAL STATEMENTS (Continued)
The tax character of distributable earnings at September 30, 2016 was as follows:
The Jamestown Equity Fund | The Jamestown Tax Exempt Virginia Fund | |||||||
Tax cost of portfolio investments | $ | 25,713,936 | $ | 24,778,589 | ||||
Gross unrealized appreciation | $ | 11,486,895 | $ | 1,122,847 | ||||
Gross unrealized depreciation | (352,264 | ) | (2,990 | ) | ||||
Net unrealized appreciation | 11,134,631 | 1,119,857 | ||||||
Accumulated ordinary income | 6,969 | — | ||||||
Accumulated tax exempt income | — | 1,780 | ||||||
Accumulated capital and other gains (losses) | 1,411,978 | (3,108 | ) | |||||
Distributions payable | (5,807 | ) | (1,780 | ) | ||||
Accumulated earnings | $ | 12,547,771 | $ | 1,116,749 | ||||
The difference between the federal income tax cost of portfolio investments and the financial statement cost for The Jamestown Equity Fund is due to certain timing differences in the recognition of capital gains or losses under income tax regulations and GAAP. These “book/tax” differences are temporary in nature and are primarily due to the tax deferral of losses on wash sales.
During the year ended March 31, 2016, The Jamestown Equity Fund realized $1,079,680 of net capital gains resulting from in-kind redemptions (redemptions in which shareholders who redeemed Fund shares received securities held by the Fund rather than cash). The Fund recognizes a gain on in-kind redemptions to the extent that the value of the distributed securities on the date of redemption exceeds the cost of those securities. Such gains are not taxable to the Fund and are not required to be distributed to shareholders.
As of March 31, 2016, The Jamestown Tax Exempt Virginia Fund had a long-term capital loss carryforward of $9,895 for federal income tax purposes. This capital loss carryforward, which does not expire, may be utilized in the current and future years to offset net realized capital gains, if any, prior to distributing such gains to shareholders.
The Funds recognize the tax benefits or expenses of uncertain tax positions only when the position is “more likely than not” to be sustained assuming examination by tax authorities. Management has reviewed the tax positions taken on Federal income tax returns for the current and all open tax years (tax years ended March 31, 2013 through March 31, 2016) of each Fund and has concluded that no provision for unrecognized tax benefits or expenses is required in these financial statements.
24
THE JAMESTOWN FUNDS
NOTES TO FINANCIAL STATEMENTS (Continued)
3. Investment Transactions
Investment transactions, other than short-term investments and U.S. government securities, were as follows for the six months ended September 30, 2016:
The Jamestown Equity Fund | The Jamestown Tax Exempt Virginia Fund | |||||||
Purchase of investment securities | $ | 5,360,096 | $ | 1,338,851 | ||||
Proceeds from sales and maturities of investment securities | $ | 7,639,465 | $ | 2,559,852 | ||||
4. Transactions with Related Parties
INVESTMENT ADVISORY AGREEMENTS
Each Fund’s investments are managed by Lowe, Brockenbrough & Company, Inc. (the “Adviser”) under the terms of an Investment Advisory Agreement. The Jamestown Equity Fund pays the Adviser a fee, which is computed and accrued daily and paid monthly, at annual rates of .65% of its average daily net assets up to $500 million and .55% of such assets in excess of $500 million. The Jamestown Tax Exempt Virginia Fund pays the Adviser a fee, which is computed and accrued daily and paid monthly, at annual rates of .40% of its average daily net assets up to $250 million, .35% of the next $250 million of such assets and .30% of such assets in excess of $500 million. Certain officers of the Trust are also officers of the Adviser.
During the six months ended September 30, 2016, the Adviser voluntarily limited the total annual operating expenses of The Jamestown Equity Fund and The Jamestown Tax Exempt Virginia Fund to .95% and .69% of its average daily net assets, respectively; accordingly, the Adviser voluntarily waived $7,387 and $30,833 of its investment advisory fees during the six months ended September 30, 2016 for The Jamestown Equity Fund and The Jamestown Tax Exempt Virginia Fund, respectively. These amounts are not subject to recapture in future periods.
OTHER SERVICE PROVIDERS
Ultimus Fund Solutions, LLC (“Ultimus”) provides administration, fund accounting, compliance and transfer agent services to the Funds. The Funds pay Ultimus fees in accordance with the agreements for such services. Certain officers of the Trust are also officers of Ultimus, or of Ultimus Fund Distributors, LLC (the “Distributor”), the principal underwriter of the Funds and an affiliate of Ultimus. The Distributor is compensated by the Adviser (not the Funds) for acting as principal underwriter.
COMPENSATION OF TRUSTEES
Trustees and officers affiliated with the Adviser or Ultimus are not compensated by the Trust for their services. Each Trustee who is not an affiliated person of the Adviser or Ultimus receives from the Trust an annual retainer of $15,000, payable quarterly; a fee of $1,500 for attendance at each meeting of the Board of Trustees (except that such fee is $2,500 for the independent chair);
25
THE JAMESTOWN FUNDS
NOTES TO FINANCIAL STATEMENTS (Continued)
and $1,000 for attendance at each meeting of any committee of the Board (except that such fee is $1,500 for the committee chair); plus reimbursement of travel and other expenses incurred in attending meetings. Each series of the Trust pays its proportionate share of such fees.
5. Brokerage Arrangement
In order to reduce the total operating expenses of The Jamestown Equity Fund, a portion of the Fund’s operating expenses have been paid through an arrangement with a third-party broker-dealer who is compensated through commission trades. Payment of expenses by the broker-dealer is based on a percentage of commissions earned. Expenses reimbursed through the brokerage arrangement totaled $6,000 for The Jamestown Equity Fund for the six months ended September 30, 2016.
6. Contingencies and Commitments
The Funds indemnify the Trust’s officers and Trustees for certain liabilities that might arise from their performance of their duties to the Funds. Additionally, in the normal course of business the Funds enter into contracts that contain a variety of representations and warranties and which provide general indemnifications. The Funds’ maximum exposure under these arrangements is unknown, as this would involve future claims that may be made against the Funds that have not yet occurred. However, based on experience, the Trust expects the risk of loss to be remote.
7. Concentration of Credit Risk
The Jamestown Tax Exempt Virginia Fund invests primarily in debt instruments of municipal issuers in the Commonwealth of Virginia. The issuers’ abilities to meet their obligations may be affected by economic developments in the Commonwealth or its region, as well as disruptions in the credit markets and the economy, generally.
8. Subsequent Events
The Funds are required to recognize in the financial statements the effects of all subsequent events that provide additional evidence about conditions that existed as of the date of the Statements of Assets and Liabilities. For non-recognized subsequent events that must be disclosed to keep the financial statements from being misleading, the Funds are required to disclose the nature of the event as well as an estimate of its financial effect, or a statement that such an estimate cannot be made. Management has evaluated subsequent events through the issuance of these financial statements and has noted no such events.
26
THE JAMESTOWN FUNDS
ABOUT YOUR FUNDS’ EXPENSES (Unaudited)
We believe it is important for you to understand the impact of costs on your investment. All mutual funds have operating expenses. As a shareholder of the Funds, you incur ongoing costs, including management fees and other expenses. The following examples are intended to help you understand your ongoing costs (in dollars) of investing in the Funds and to compare these costs with the ongoing costs of investing in other mutual funds.
A mutual fund’s ongoing costs are expressed as a percentage of its average net assets. This figure is known as the expense ratio. The expenses in the table below are based on an investment of $1,000 made at the beginning of the period shown and held for the entire period (April 1, 2016 through September 30, 2016).
The table below illustrates each Fund’s costs in two ways:
Actual fund return – This section helps you to estimate the actual expenses that you paid over the period. The “Ending Account Value” shown is derived from each Fund’s actual return, and the fourth column shows the dollar amount of operating expenses that would have been paid by an investor who started with $1,000 in the Funds. You may use the information here, together with the amount you invested, to estimate the expenses that you paid over the period.
To do so, simply divide your account value by $1,000 (for example, an $8,600 account value divided by $1,000 = 8.6), then multiply the result by the number given for the Funds under the heading “Expenses Paid During Period.”
Hypothetical 5% return – This section is intended to help you compare each Fund's ongoing costs with those of other mutual funds. It assumes that each Fund had an annual return of 5% before expenses during the period shown, but that the expense ratio is unchanged. In this case, because the returns used are not the Funds’ actual returns, the results do not apply to your investment. The example is useful in making comparisons because the Securities and Exchange Commission (“SEC”) requires all mutual funds to calculate expenses based on a 5% return. You can assess each Fund’s ongoing costs by comparing this hypothetical example with the hypothetical examples that appear in shareholder reports of other funds.
Note that expenses shown in the table are meant to highlight and help you compare ongoing costs only. The Funds do not charge sales loads or redemption fees.
The calculations assume no shares were bought or sold during the period. Your actual costs may have been higher or lower, depending on the amount of your investment and the timing of any purchases or redemptions.
More information about the Funds’ expenses, including annual expense ratios for the prior five fiscal years, can be found in this report. For additional information on operating expenses and other shareholder costs, please refer to the Funds’ prospectus.
27
THE JAMESTOWN FUNDS
ABOUT YOUR FUNDS’ EXPENSES (Unaudited) (Continued)
Beginning | Ending 2016 | Net Ratio(a) | Expenses Paid During Period(b) | |||||||||||||
The Jamestown Equity Fund | ||||||||||||||||
Based on Actual Fund Return | $ | 1,000.00 | $ | 1,031.70 | 0.95 | % | $ | 4.83 | ||||||||
Based on Hypothetical 5% Return (before expenses) | $ | 1,000.00 | $ | 1,020.25 | 0.95 | % | $ | 4.80 | ||||||||
The Jamestown Tax Exempt Virginia Fund | ||||||||||||||||
Based on Actual Fund Return | $ | 1,000.00 | $ | 1,009.50 | 0.69 | % | $ | 3.47 | ||||||||
Based on Hypothetical 5% Return (before expenses) | $ | 1,000.00 | $ | 1,021.55 | 0.69 | % | $ | 3.49 | ||||||||
(a) | Annualized, based on the Fund’s most recent one-half year expenses. |
(b) | Expenses are equal to the Fund’s annualized net expense ratio multiplied by the average account value over the period, multiplied by 183/366 (to reflect the one-half year period). |
28
THE JAMESTOWN FUNDS
OTHER INFORMATION (Unaudited)
A description of the policies and procedures that the Funds use to vote proxies relating to portfolio securities is available without charge upon request by calling toll-free 1-866-738-1126, or on the SEC’s website at http://www.sec.gov. Information regarding how the Funds voted proxies relating to portfolio securities during the most recent 12-month period ended June 30 is also available without charge upon request by calling toll-free 1-866-738-1126, or on the SEC’s website at http://www.sec.gov.
The Trust files a complete listing of portfolio holdings of the Funds with the SEC as of the end of the first and third quarters of each fiscal year on Form N-Q. The filings are available upon request, by calling 1-866-738-1126. Furthermore, you may obtain a copy of these filings on the SEC’s website at http://www.sec.gov. The Trust’s Forms N-Q may also be reviewed and copied at the SEC’s Public Reference Room in Washington, DC, and information on the operation of the Public Reference Room may be obtained by calling 1-800-SEC-0330.
29
THE JAMESTOWN FUNDS
www.jamestownfunds.com
Investment Adviser Lowe, Brockenbrough & Company, Inc. 1802 Bayberry Court Suite 400 Richmond, Virginia 23226
Administrator Ultimus Fund Solutions, LLC P.O. Box 46707 Cincinnati, Ohio 45246-0707 (Toll-Free) 1-866-738-1126
Independent Registered Cohen & Company, Ltd. 1350 Euclid Avenue Suite 800 Cleveland, Ohio 44115
Legal Counsel Sullivan & Worcester LLP One Post Office Square Boston, Massachusetts 02109
Board of Trustees John P. Ackerly, IV John T. Bruce George K. Jennison Robert S. Harris, Ph.D. Harris V. Morrissette Elizabeth W. Robertson |
| Item 2. | Code of Ethics. |
| Item 3. | Audit Committee Financial Expert. |
| Item 4. | Principal Accountant Fees and Services. |
| Item 5. | Audit Committee of Listed Registrants. |
| Item 6. | Schedule of Investments. |
| (a) | Not applicable [schedule filed with Item 1] |
| (b) | Not applicable |
| Item 7. | Disclosure of Proxy Voting Policies and Procedures for Closed-End Management Investment Companies. |
| Item 8. | Portfolio Managers of Closed-End Management Investment Companies. |
| Item 9. | Purchases of Equity Securities by Closed-End Management Investment Company and Affiliated Purchasers. |
| Item 10. | Submission of Matters to a Vote of Security Holders. |
| Item 11. | Controls and Procedures. |
| Item 12. | Exhibits. |
| Exhibit 99.CERT | Certifications required by Rule 30a-2(a) under the Act |
| Exhibit 99.906CERT | Certifications required by Rule 30a-2(b) under the Act |
| (Registrant) | Williamsburg Investment Trust | ||
| By (Signature and Title)* | /s/ Tina H. Bloom | ||
| Tina H. Bloom, Secretary and Chief Compliance Officer | |||
| Date | December 5, 2016 | ||
| Pursuant to the requirements of the Securities Exchange Act of 1934 and the Investment Company Act of 1940, this report has been signed below by the following persons on behalf of the registrant and in the capacities and on the dates indicated. | |||
| By (Signature and Title)* | /s/ John T. Bruce | ||
| John T. Bruce, President | |||
| (FBP Equity & Dividend Plus Fund and FBP Appreciation & Income Opportunities Fund) | |||
| Date | December 5, 2016 | ||
| By (Signature and Title)* | /s/ Thomas W. Leavell | ||
| Thomas W. Leavell, President | |||
| (The Government Street Equity Fund, The Government Street Mid-Cap Fund and The Alabama Tax Free Bond Fund) | |||
| Date | December 5, 2016 | ||
| By (Signature and Title)* | /s/ Charles M. Caravati III | ||
| Charles M. Caravati III, President | |||
| (The Jamestown Equity Fund) | |||
| Date | December 5, 2016 | ||
| By (Signature and Title)* | /s/ Joseph A. Jennings III | ||
| Joseph A. Jennings III, President | |||
| (The Jamestown Tax Exempt Virginia Fund) | |||
| Date | December 5, 2016 | ||
| By (Signature and Title)* | /s/ John P. Ackerly IV | ||
| John P. Ackerly IV, President | |||
| (The Davenport Core Fund, Davenport Value & Income Fund, Davenport Equity Opportunities Fund, Davenport Small Cap Focus Fund and the Davenport Balanced Income Fund) | |||
| Date | December 5, 2016 | ||
| By (Signature and Title)* | /s/ Mark J. Seger | ||
| Mark J. Seger, Treasurer and Principal Financial Officer | |||
| Date | December 5, 2016 | ||
* | Print the name and title of each signing officer under his or her signature. |