| OMB APPROVAL |
OMB Number: 3235-0570 Expires: January 31, 2014 Estimated average burden hours per response: 20.6 |
UNITED STATES
SECURITIES AND EXCHANGE COMMISSION
Washington, D.C. 20549
FORM N-CSR
CERTIFIED SHAREHOLDER REPORT OF REGISTERED
MANAGEMENT INVESTMENT COMPANIES
Investment Company Act file number 811-05685
Williamsburg Investment Trust
(Exact name of registrant as specified in charter)
| 225 Pictoria Drive, Suite 450 Cincinnati, Ohio | 45246 |
| (Address of principal executive offices) | (Zip code) |
W. Lee H. Dunham, Esq.
Sullivan & Worcester LLP One Post Office Square Boston, Massachusetts 02109
(Name and address of agent for service)
Registrant's telephone number, including area code: (513) 587-3400
Date of fiscal year end: March 31, 2014
Date of reporting period: September 30, 2013
Form N-CSR is to be used by management investment companies to file reports with the Commission not later than 10 days after the transmission to stockholders of any report that is required to be transmitted to stockholders under Rule 30e-1 under the Investment Company Act of 1940 (17 CFR 270.30e-1). The Commission may use the information provided on Form N-CSR in its regulatory, disclosure review, inspection, and policymaking roles.
A registrant is required to disclose the information specified by Form N-CSR, and the Commission will make this information public. A registrant is not required to respond to the collection of information contained in Form N-CSR unless the Form displays a currently valid Office of Management and Budget ("OMB") control number. Please direct comments concerning the accuracy of the information collection burden estimate and any suggestions for reducing the burden to Secretary, Securities and Exchange Commission, 450 Fifth Street, NW, Washington, DC 20549-0609. The OMB has reviewed this collection of information under the clearance requirements of 44 U.S.C. § 3507.
Item 1. Reports to Stockholders.
SEMI-ANNUAL REPORT
September 30, 2013 (Unaudited) |
THE DAVENPORT FUNDS LETTER TO SHAREHOLDERS | |
Dear Shareholders,
Equity markets enjoyed very strong returns during the third quarter. The S&P 500 and Russell 2000 indices advanced 5.24% and 10.21%, respectively. On a year-to-date basis, the S&P 500 and Russell 2000 finished the period up 19.79% and 27.69%. When we started 2013, we suggested stocks should have some more “gas in the tank,” but suggested returns would be more subdued than in 2012. To some, even that forecast seemed optimistic given a period of great returns and the potential headwinds of fiscal restraint and higher interest rates. Well, here we are nine months into the year and the market is exceeding expectations once again. CNBC recently referred to it as the “zombie market…a staggering, stumbling, somnambulant thing of macabre beauty that sustains slings, arrows and shotgun blasts but still marches forward.” This description seems appropriate as equities have indeed shrugged off every potential threat.
The Federal Reserve System’s (the “Fed”) “taper” plans continue to dominate headlines. Recently coined by financial news outlets, so-called “tapering” involves a reduction in the bond buying plan that has helped suppress interest rates in recent years. The prevailing fear is that interest rates will move higher and bring an end to the “cheap money” environment that has supported stocks and many other asset classes.
We think the 2012 bottom of roughly 1.40% on the 10-year Treasury yield may have indeed marked an inflection point comparable to the NASDAQ hitting 5,000 in year 2000 (13 years later it stands at 3,600). In other words, longer-dated Treasuries may be due for a sustained period of underperformance following a long period of outperformance (BCA Research notes that Treasuries have outperformed the S&P 500 by 70 percentage points since the tech bubble peaked — for more information visit www.bcaresearch.com). However, we don’t expect yields to skyrocket in the near term given tepid economic growth and limited inflationary pressure.
Apparently, the Fed also perceives economic growth to be fairly lackluster. Recently, the Fed surprised investors and pundits by deciding to delay the tapering process, which most expected would commence in September. Now, some have accused the Fed of sending mixed messages and being “chicken.” Many, including us, would prefer to see a world less dependent on an accommodative Fed policy. Chairman Bernanke’s remarks suggested employment growth wasn’t yet strong enough to warrant a reduction of monetary stimulus. He and his colleagues also seem to fear actions on Capitol Hill (i.e., higher taxes and reduced government spending) could restrain the economy.
While tapering has temporarily been put on hold, it’s likely something we’ll contend with in coming months. Many investors wonder how stocks will fare if rates continue to rise. BCA Research points out that there have been 21 instances over the past 68 years where 10-year Treasury yields have increased by at least 100 basis points and during those instances stocks have risen three times as often as they’ve fallen and have generated a median Compound Annual Growth Rate (CAGR) of 7%. The S&P 500’s CAGR over that time frame also equals roughly 7%, “making returns during periods of rising real rates indistinguishable from returns across the entire postwar period.” (BCA)
Taper talk aside, we’ve become less bullish as the market has enjoyed a solid rally this year. We don’t consider ourselves bearish, but we recognize that much of the market’s upside has been multiple driven (i.e., higher valuations rather than higher earnings). Over time, stocks should appreciate at a rate commensurate with earnings growth. Clearly, they’ve accomplished much more than this during 2013 and we suspect the market’s “re-rating” likely won’t continue at its recent pace. If one believes 7%-9% Earnings Per Share (EPS) growth is attainable as the economy improves, this would seem to be a reasonable target for equity market returns. Hopefully, we can add a little to these returns by identifying companies that are growing at an above average pace and paying reasonable prices for them. We thank you for your trust and look forward to reporting back to you at year-end.
Davenport Core Fund
The following chart represents Davenport Core Fund (the “Core Fund”) performance and the performance of the S&P 500 Index*, the Core Fund’s primary benchmark, for the periods ended September 30, 2013.
| | | | | | Since Inception** 1/15/1998 | |
| Core Fund | 6.51% | 21.89% | 16.25% | 10.15% | 7.94% | 5.75% | 0.94% |
| S&P 500 Index* | 5.24% | 19.34% | 16.27% | 10.02% | 7.57% | 5.61% | — |
Past performance is no guarantee of future results. Investment return and principal value of an investment will fluctuate so that an investor’s shares, when redeemed, may be worth more or less than their original cost. Current performance may be lower or higher than the performance data quoted. Performance data, current to the most recent month end, may be obtained by calling 1-800-281-3217.
| * | The S&P 500 Index is comprised of 500 U.S. stocks and is an indicator of the performance of the overall U.S. stock market. An investor cannot invest in an index and its returns are not indicative of the performance of any specific investment. |
The Core Fund advanced 6.51% during the third quarter, nicely outpacing the 5.24% gain for the S&P 500 Index. The Core Fund is up 20.12% year-to-date, ahead of the 19.79% rise for the S&P 500 Index.
Biotechnology holdings Celgene (CELG) and Amgen (AMGN) surged during the period alongside solid results at the former and a major acquisition announcement at the latter. Announcements such as these drove significant gains across the sector, benefitting our holdings in the iShares Nasdaq Biotechnology Index Fund (IBB), which posted a 20%+ return during the quarter. Exxon (XOM) was the biggest laggard during the quarter, followed by International Business Machines (IBM). Though we have decided to stick with our position in XOM due to its high-quality assets and strong track record of shareholder returns, we sold our position in IBM given a lack of conviction in the company’s ability to reinvigorate organic growth.
The Information Technology sector saw a lot of activity during the quarter. In addition to the sale of IBM mentioned above, we elected to use price strength created by the announcement of CEO Steve Ballmer’s resignation to take profits in Microsoft (MSFT). With the funds, we elected to increase our position in Google (GOOG) and purchase a new position in Facebook (FB). While GOOG and FB are certainly more expensive relative to current earnings, we feel each company has proven an ability to monetize mobile internet traffic and are poised to profit from the evolution
of technology and consumer preferences. Ultimately, we feel comfortable having moved away from two mature franchises fighting secular declines while adding exposure to more innovative companies that are better positioned for the future.
We initiated a position in iconic global beverage and food products retailer Starbucks (SBUX) during the quarter. CEO Howard Schultz has done an incredible job turning a small Seattle coffee store chain into a global juggernaut, changing the consumption patterns of people across the globe. While SBUX is often viewed solely as a collection of coffee stores, the company has numerous levers at its disposal to grow moving forward. Ultimately, we believe the company’s new product innovation, groundbreaking leadership in social media and large international opportunity could allow it to achieve and surpass its goals for 15%-20% earnings growth over time. Furthermore, we note the company’s significant cash generation provides more than enough capital to fuel its growth objectives, which could translate into increased buybacks and dividends over time.
Near quarter end, we purchased a position in leading satellite TV provider, DIRECTV (DTV). The company’s domestic operations have high recurring revenues and generate strong free cash flow, much of which is being redeployed into the company’s quickly growing Latin American operations that carry very attractive returns. While the company faces competitive challenges domestically, we feel there is a long runway for growth in Latin America given low penetration rates, less competition and lower Subscriber Acquisition Costs (SAC). Finally, we note the company has repurchased roughly 60% of its shares outstanding since 2005. Going forward, we expect the company to continue to aggressively repurchase stock with excess cash flow.
In sum, we are encouraged by such strong performance in light of the robust market conditions as of late. Though “deals” are increasingly harder to come by as the market plows ahead, we are still seeing opportunities to invest in quality franchises at reasonable prices.
New Positions
Chicago Bridge & Iron Company (CBI) We purchased a position in this engineering and construction company which is well positioned to capitalize on increasing energy project spending due to the oil and gas shale revolution.
DIRECTV (DTV) We purchased a position in this leading satellite provider in the Americas as we were attracted to the company’s strong cash generation and inexpensive value.
Facebook, Inc. – Class A (FB) We purchased a position in the world’s largest social network as the company is in the early stages of monetizing its membership base through advertisements.
Monsanto Company (MON) We purchased a position in this leading agricultural products provider as we are attracted to its strong competitive position and favorable exposure to increasing global food consumption.
Starbucks Corporation (SBUX) We purchased a position in this premier coffee purveyor given its long runway for growth across the globe in a variety of product channels, including packaged products, tea, juice and new food offerings.
Increased Positions
American Tower Corporation (AMT) We added to this wireless tower owner and operator as weakness across the real estate investment trust (REIT) sector provided an attractive entry point to this quality, high-growth story.
Google, Inc. – Class A (GOOG) We added to our position as we believe the company’s constant innovation makes it one of the most attractive ways to play increased internet and mobile consumption.
Decreased Positions
Visa, Inc. – Class A (V) We chipped our position in this leading payment network provider following the stock’s strong run and some concern over increasing regulatory/legal headwinds.
Positions Sold
Brookfield Property Partners LP (BPY) After receiving them via a spin-off, we sold our shares as a matter of housekeeping.
CSTBrands, Inc. (CST) After receiving them via a spin-off, we sold our shares as a matter of housekeeping.
International Business Machines Corporation (IBM) We sold our position in this technology bellwether as we are concerned sluggish revenue trends will continue into the foreseeable future.
Microsoft Corporation (MSFT) We sold our position in this mature technology player as part of our shift towards dominant franchises with strong growth potential.
News Corporation – Class A (NWSA) After receiving the shares as a result of the breakup of News Corporation (NWS), we sold our position as a matter of housekeeping.
Procter & Gamble Company (PG) We sold our position in this large consumer products company given slow revenue growth and a great run in the stock which has left the valuation full.
Davenport Value & Income Fund
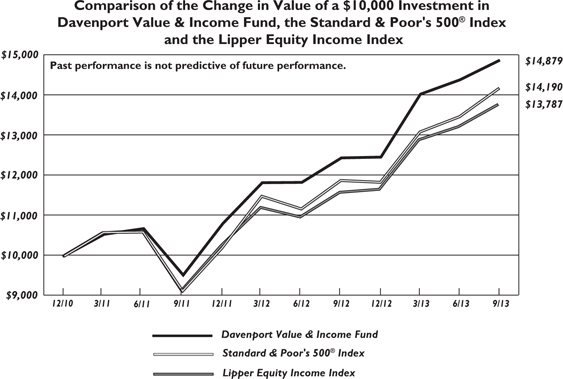
The following chart represents Davenport Value & Income Fund (the “Value & Income Fund”) performance and the performance of the S&P 500 Index*, the Value & Income Fund’s primary benchmark, and the Lipper Equity Income Index for the periods ended September 30, 2013.
| | | Since Inception** 12/31/2010 | | |
| Value & Income Fund | 3.39% | 19.58% | 15.56% | 0.94% | 1.51% |
| S&P 500 Index* | 5.24% | 19.34% | 13.58% | — | — |
| Lipper Equity Income Index* | 4.16% | 18.88% | 12.39% | — | — |
Past performance is no guarantee of future results. Investment return and principal value of an investment will fluctuate so that an investor’s shares, when redeemed, may be worth more or less than their original cost. Current performance may be lower or higher than the performance data quoted. Performance data, current to the most recent month end, may be obtained by calling 1-800-281-3217.
| * | The S&P 500 Index is comprised of 500 U.S. stocks and is an indicator of the performance of the overall U.S. stock market. The Lipper Equity Income Fund Index is an unmanaged index of the 30 largest funds, based on total year-end net asset value, in the Lipper Equity Income Fund Index. An investor cannot invest in an index and its returns are not indicative of the performance of any specific investment. |
The Value & Income Fund gained 3.39% during the quarter, lagging gains of 5.24% and 4.16%, respectively, for the S&P 500 Index and Lipper Equity Income Index. Year-to-date, the Value & Income Fund is up 19.39% versus gains of 19.79% and 18.11%, respectively, for the S&P 500 Index and Lipper Equity Income Index. Dividend stocks continued to underperform broader market averages during the quarter; however, they still managed nice absolute gains despite fears of rising interest rates. At quarter end, the Value & Income Fund’s 30-day SEC yield was 1.51%.
Walgreen (WAG) was the Value & Income Fund’s top performer during the quarter, gaining over 20% in response to improved results and greater visibility into the benefits of recent strategic partnerships with Alliance Boots and AmerisourceBergen (ABC). The SPDR EURO STOXX 50 ETF (FEZ) produced substantial gains given improving sentiment (and data) coming out of the Eurozone. Vodafone (VOD) was also a key contributor, as the long awaited sale of its stake in Verizon Wireless back to Verizon (VZ) finally came to fruition. We elected to take profits on strength given a lack of confidence in management’s ability to elevate returns. Key detractors during the quarter were LinnCo (LNCO) and Sun Communities (SUI). Though we decided to part ways with our position in LNCO, we used weakness as an opportunity to add to our position in SUI.
After a blistering start to the year, shares of SUI tumbled alongside other high yielding REITs. While we would admit that the stock’s high of almost $58 in late May was probably an overshot, we feel its subsequent underperformance has also been a bit too extreme. Following SUI’s 25% decline from its high, the shares now yield near 6.0% and trade at less than 12x Funds From Operations (FFO) estimates for next year. This compares to apartment and self storage REITs that trade at almost 20x FFO and nearly half the yield in some cases. Though we do not expect the stock’s discount to peers to go away completely, we feel the current disparity is excessive given the company’s strong underlying fundamentals coupled with the attractive characteristics of the manufactured housing industry (i.e., low capex and stable and predictable cash flows). Furthermore, we feel the company is in a great position to start raising its dividend and can sustain meaningful dividend growth into the future as earnings improve alongside increasing occupancy, new site additions and rate increases.
At the end of the second quarter, we initiated a position in Canada’s second largest telecommunications operator, Telus (TU). The shares had weakened substantially in response to speculation that VZ is attempting to enter the Canadian market via the acquisition of a smaller competitor. While increased competition is never a welcome sight in such a rationally competitive environment, we felt the stock’s reaction provided us a great entry point into a company that has been gaining share, improving profitability and growing its dividend at an attractive rate. Since our purchase, VZ announced the acquisition of VOD’s stake in Verizon Wireless, while also indicating that it has abandoned its strategy of making a push into Canada. Though this prompted a rally in TU, we are still attracted to the company’s growth prospects and ability to increase the dividend at a 10% pace through 2016.
Near quarter end, we initiated a position in diversified theme park operator Six Flags (SIX). After emerging from bankruptcy in 2010 with a new management team, low debt levels and almost $1.0 billion of Net Operating Losses (NOLs), SIX has gone on to be a great stock alongside improving operating metrics that have allowed for significant return of capital to shareholders. More recently, however, the shares have weakened as a tragic accident at one of the company’s Texas parks and unfavorable weather trends have compounded general weakness among dividend
paying stocks. We feel this weakness has presented a buying opportunity in a well-run company that generates strong cash flows, has sizable barriers to entry and pays an attractive dividend (yields over 5%) that can grow.
In summary, we are pleased with the Value & Income Fund’s performance and continue to find exciting investment opportunities. At the risk of sounding like a broken record, we feel dividends (especially growing dividends) will continue to be a meaningful component of total returns despite headwinds created by rising interest rates. There is no guarantee that a company will continue to pay a dividend.
New Positions
Kinder Morgan, Inc. (KMI) We purchased a position in this holding company that owns a plethora of hydrocarbon transportation assets and has a strong growth outlook driven by the need for additional pipelines to connect new oil and gas production to demand centers. Current yield: 4.5%
Six Flags Entertainment Corporation (SIX) We purchased a position in this diversified theme park operator given its attractive yield and high barriers to entry. Current yield: 5.3%
Teva Pharmaceutical Industries Ltd. - ADR (TEVA) We purchased a position in this Israel-based generic and branded pharmaceutical company as we were attracted to its strong franchise, hefty cash flow and inexpensive share price. Current yield: 3.2%
Increased Positions
Marathon Petroleum Corporation (MPC) We added to our position in this refining company given our belief that the company will continue to benefit from increasing domestic oil production. Current yield: 2.6%
Sun Communities, Inc. (SUI) We added to our position in this manufactured housing REIT as weakness across the REIT complex provided an attractive entry point. Current yield: 5.9%
Positions Sold
Cracker Barrel Old Country Store, Inc. (CBRL) We sold our position in this owner and operator of themed restaurants, electing to take profits in the name following strong performance which resulted in the shares being more fairly valued.
LinnCo, LLC (LNCO) We sold our position in this Master Limited Partnership investment vehicle as a short attack and subsequent ongoing SEC investigation raised this risk profile above our comfort level.
Microsoft Corporation (MSFT) We sold our position in this mature technology player as part of our shift towards dominant franchises with strong growth potential.
Vodafone Group plc - ADR (VOD) We sold our position in this European telecom, taking profits after the company announced a deal to sell its stake in Verizon Wireless which drove the stock higher.
WisdomTree Japan Hedged Equity Fund (DXJ) We sold our position in this Japanese ETF after enjoying outsized returns and growing concern that their market had become somewhat disconnected from economic fundamentals.
Davenport Equity Opportunities Fund
The following chart represents Davenport Equity Opportunities Fund (the “Equity Opportunties Fund”) performance and the performance of the Russell Midcap Index*, the Equity Opportunity Fund’s primary benchmark, and the S&P 500 Index for the periods ended September 30, 2013.
| | | Since Inception** 12/31/2010 | |
| Equity Opportunities Fund | 6.44% | 27.63% | 17.23% | 0.98% |
| Russell Midcap Index* | 7.70% | 27.91% | 14.06% | — |
| S&P 500 Index* | 5.24% | 19.34% | 13.58% | — |
Past performance is no guarantee of future results. Investment return and principal value of an investment will fluctuate so that an investor’s shares, when redeemed, may be worth more or less than their original cost. Current performance may be lower or higher than the performance data quoted. Performance data, current to the most recent month end, may be obtained by calling 1-800-281-3217.
| * | The Russell Midcap Index measures the performance of the 800 smallest companies in the Russell 1000, which represent approximately 25% of the total market capitalization of the Russell 1000. The S&P 500 Index is comprised of 500 U.S. stocks and is an indicator of the performance of the overall U.S. stock market. An investor cannot invest in an index and its returns are not indicative of the performance of any specific investment. |
The Equity Opportunities Fund enjoyed a very strong third quarter. The Fund advanced 6.44% as a number of its holdings posted sizeable gains. This compared to gains of 5.24% and 7.70%, respectively, for the S&P 500 and Russell Midcap indices. Year-to-date, the Equity Opportunities Fund was up 20.83% at quarter-end versus gains of 19.79% and 24.34% for the S&P 500 and Russell Midcap, respectively. In our last letter, we noted it might be difficult to sustain the positive momentum we witnessed in the first half of the year. Fortunately, we’ve been wrong thus far.
A few of our holdings in the consumer arena were standouts during the quarter. Shares of CarMax (KMX), Hanesbrands (HBI), Dollar Tree (DLTR) and O’Reilly Automotive (ORLY) were among our top performers. Each company continues to exhibit solid organic growth while also wisely deploying excess free cash flow into store openings, acquisitions and/or share buybacks. Aon (AON), which is one of our larger holdings in the Financials sector, was another bright spot. The stock continued to hit new highs as enthusiasm built around the company’s blossoming health care exchange business. We chipped our position modestly given outsized gains this year, but think momentum in the core insurance brokerage business, coupled with a newfound contribution from the exchange business, will drive further upside. We also sold our position in Rockwell Collins (COL). Shares of the defense/aerospace company shrugged off sequestration fears and marched to new highs, where they seemed fully valued.
As we’ve mentioned in the past, we are a fan of companies that own durable brands. In a rapidly changing world, such brands tend to stand the test of time and steadily grow more valuable. To that end, we recently added to a position in Church & Dwight (CHD) and bought a new position in Beam (BEAM). Many have never heard the name Church & Dwight, but may recognize household brands such as Arm & Hammer, Nair, OxiClean and Orajel. Over time, this nimble company has innovated new products while also acquiring and improving existing brands. With a market capitalization just over $8 billion (compared to Procter & Gamble (PG) at $210 billion),
there’s ample room for growth and recent weakness in the stock afforded us an opportunity. In the case of BEAM, the company is best known for its flagship Jim Beam brand, but has a stable of well-known spirits. The company continues to deliver steady growth and could be a takeout candidate for larger global players with broader distribution capabilities.
While the bulk of the Equity Opportunities Fund is focused on compounding growth stories, occasionally we’ll look at distressed situations where the odds seemed stacked in our favor. One recent example is Ultra Petroleum (UPL). UPL is a natural gas producer with a well regarded management team and low-cost, long-lived dry natural gas assets in Wyoming and Pennsylvania. The company’s shares, which traded near $50 just over two years ago versus $20.50 currently, are deeply out of favor given the poor price environment for natural gas. We think natural gas prices could move higher in coming years as supply growth flattens and demand improves alongside the construction of gas-dependent petrochemical plants, exports of liquefied natural gas and more stringent emission standards from the U.S. Environmental Protection Agency (EPA) (favoring gas over coal). Management has shown capital discipline during a tough time and has stuck to the company’s dry gas roots; hence, UPL is one of few remaining dry gas pure plays and could exhibit material upside in a better environment. While we acknowledge we could be early, we think UPL is a compelling contrarian investment opportunity.
On a final note, we were pleased to recently spend time with management of Brookfield Asset Management (BAM). CEO Bruce Flatt is sometimes called the Warren Buffett of Canada given his track record as a value investor. He and his team’s interests are clearly aligned with ours as 20% of the stock is owned by management and directors. As a reminder, BAM owns hard assets such as hydroelectric power facilities, rails, electric transmission lines and commercial real estate, all of which generate toll booth-like cash flows. Following some recent asset sales, the company finds itself loaded with liquidity and ready to pounce on new opportunities. Perhaps even more exciting, the company has a flourishing asset management franchise that invests in hard assets on behalf of other investors and could see significant fee growth in coming years. We came away from our meeting happier than ever to count BAM as one of our largest positions and are very confident in management’s ability to grow the company’s intrinsic value at a double-digit rate over time. Hopefully, by owning BAM and other top shelf companies, we’ll also do pretty well.
New Positions
Beam, Inc. (BEAM) We purchased a position in this global spirits company which manufactures and markets such popular brands as Pinnacle vodka, Sauza tequila, Skinnygirl cocktails and the fastest growing North American whiskey brand, Jim Beam.
Krispy Kreme Doughnuts, Inc. (KKD) We purchased a position in this well-known doughnut restaurant company due to the company’s industry leading returns on new stores and immense growth opportunities domestically and abroad.
Pinnacle Entertainment, Inc. (PNK) We purchased a position in this regional gaming operator. We are encouraged by the company’s new, operationally-focused management and the recent acquisition of Ameristar Casinos (ASCA), which we view as a transformational deal.
Ultra Petroleum Corporation (UPL) We purchased a position in this natural gas producer as the outlook for natural gas prices is more constructive over the next several years due to rising demand and moderating supply growth.
Increased Positions
Brookfield Asset Management, Inc. – Class A (BAM) We added to our position in this premier global infrastructure asset manager; penalized by fears of rising interest rates, we felt the stock’s underperformance provided an opportunity in this well-run company.
Church & Dwight Company, Inc. (CHD) One of our longest standing positions, this well-run company owns a collection of “power” brands including OxiClean, Orajel and flagship brand, Arm & Hammer; we added to our position following weakness in the stock which left the shares trading as cheaply as we have seen in some time.
Penn National Gaming, Inc. (PENN) We added to our position in this regional gaming operator as recent weakness provided an opportunity to gain exposure to an entity with a top notch management team whose pending conversion to a REIT could unlock significant value for shareholders.
Decreased Positions
Albemarle Corporation (ALB) We chipped our position in this specialty chemicals developer, manufacturer and marketer given our belief that near-term upside is limited amidst sluggish demand.
Aon plc (AON) We chipped our position in this insurance brokerage and human resources outsourcing provider as the stock appeared more fairly valued following strong performance.
Safety Insurance Group, Inc. (SAFT) We chipped our position in this auto and homeowners insurance provider as strong performance provided the ability to take profits in the name.
Positions Sold
Lamar Advertising Company – Class A (LAMR) We sold our position in this outdoor advertising firm as the stock seemed more fairly valued.
Rockwell Collins, Inc. (COL) We sold our position in this avionics systems provider following strong year-to-date performance resulting in a seemingly fair valuation.
Sincerely,
John P. Ackerly, IV
President, The Davenport Funds
DAVENPORT CORE FUND
PERFORMANCE INFORMATION (Unaudited)
| | Average Annual Total Returns(a) (for periods ended September 30, 2013) |
| | | | |
| Davenport Core Fund | 21.89% | 10.15% | 7.94% |
Standard & Poor’s 500® Index | 19.34% | 10.02% | 7.57% |
| (a) | The total returns shown do not reflect the deduction of taxes that a shareholder would pay on Fund distributions or the redemption of Fund shares. |
DAVENPORT VALUE & INCOME FUND
PERFORMANCE INFORMATION (Unaudited)
| | Average Annual Total Returns(a) (for periods ended September 30, 2013) |
| | | |
| Davenport Value & Income Fund | 19.58% | 15.56% |
Standard & Poor’s 500® Index | 19.34% | 13.58% |
| Lipper Equity Income Index | 18.88% | 12.40% |
| (a) | The total returns shown do not reflect the deduction of taxes that a shareholder would pay on Fund distributions or the redemption of Fund shares. |
| | |
| (b) | Commencement of operations was December 31, 2010. |
DAVENPORT EQUITY OPPORTUNITIES FUND
PERFORMANCE INFORMATION (Unaudited)
| | Average Annual Total Returns(a) (for periods ended September 30, 2013) |
| | | |
| Davenport Equity Opportunities Fund | 27.63% | 17.23% |
Russell Midcap® Index | 27.91% | 14.06% |
| (a) | The total returns shown do not reflect the deduction of taxes that a shareholder would pay on Fund distributions or the redemption of Fund shares. |
| | |
| (b) | Commencement of operations was December 31, 2010. |
DAVENPORT CORE FUND
PORTFOLIO INFORMATION
September 30, 2013 (Unaudited)
Top Ten Equity Holdings
| Security Description | % of Net Assets |
| CarMax, Inc. | 3.1% |
| Johnson & Johnson | 2.9% |
| Capital One Financial Corporation | 2.8% |
| Markel Corporation | 2.6% |
| Berkshire Hathaway, Inc. - Class B | 2.5% |
| Danaher Corporation | 2.5% |
| iShares Nasdaq Biotechnology Index Fund | 2.4% |
| Brookfield Asset Management, Inc. - Class A | 2.4% |
| Wells Fargo & Company | 2.3% |
| Google, Inc. - Class A | 2.2% |
DAVENPORT VALUE & INCOME FUND
PORTFOLIO INFORMATION
September 30, 2013 (Unaudited)
Top Ten Equity Holdings
| Security Description | % of Net Assets |
| JPMorgan Chase & Company | 2.8% |
| Walgreen Company | 2.7% |
SPDR EURO STOXX 50® ETF | 2.6% |
| Johnson & Johnson | 2.5% |
| GlaxoSmithKline plc - ADR | 2.5% |
| Wells Fargo & Company | 2.5% |
| General Electric Company | 2.5% |
| Travelers Companies, Inc. (The) | 2.4% |
| Sun Communities, Inc. | 2.4% |
| Capital One Financial Corporation | 2.3% |
DAVENPORT EQUITY OPPORTUNITIES FUND
PORTFOLIO INFORMATION
September 30, 2013 (Unaudited)
Top Ten Equity Holdings
| Security Description | % of Net Assets |
| Penn National Gaming, Inc. | 7.4% |
| CarMax, Inc. | 5.7% |
| Markel Corporation | 5.2% |
| Brookfield Asset Management, Inc. - Class A | 4.8% |
| O'Reilly Automotive, Inc. | 4.6% |
| Intuit, Inc. | 3.7% |
| American Tower Corporation | 3.7% |
| Capital One Financial Corporation | 3.6% |
| Dollar Tree, Inc. | 3.6% |
| Hanesbrands, Inc. | 3.4% |
DAVENPORT CORE FUND
SCHEDULE OF INVESTMENTS
September 30, 2013 (Unaudited)
| | | | | | |
| Consumer Discretionary — 17.4% | | | | | | |
Amazon.com, Inc. (a) | | | 15,343 | | | $ | 4,796,836 | |
CarMax, Inc. (a) | | | 153,012 | | | | 7,416,492 | |
DIRECTV (a) | | | 58,515 | | | | 3,496,271 | |
General Motors Company (a) | | | 128,555 | | | | 4,624,123 | |
| Lowe's Companies, Inc. | | | 96,006 | | | | 4,570,846 | |
| McDonald's Corporation | | | 43,220 | | | | 4,158,196 | |
News Corporation - Class A (a) | | | 1 | | | | 16 | |
| Starbucks Corporation | | | 49,290 | | | | 3,793,851 | |
| Twenty-First Century Fox, Inc. - Class A | | | 131,566 | | | | 4,407,461 | |
| Walt Disney Company (The) | | | 72,218 | | | | 4,657,339 | |
| | | | | | | | 41,921,431 | |
| Consumer Staples — 10.7% | | | | | | | | |
| Anheuser-Busch InBev SA/NV - ADR | | | 34,645 | | | | 3,436,784 | |
| J.M. Smucker Company (The) | | | 49,837 | | | | 5,234,879 | |
| Nestle SA - ADR | | | 66,177 | | | | 4,605,919 | |
| PepsiCo, Inc. | | | 48,106 | | | | 3,824,427 | |
| Walgreen Company | | | 83,485 | | | | 4,491,493 | |
| Wal-Mart Stores, Inc. | | | 55,682 | | | | 4,118,241 | |
| | | | | | | | 25,711,743 | |
| Energy — 9.1% | | | | | | | | |
| Chevron Corporation | | | 37,137 | | | | 4,512,146 | |
| Exxon Mobil Corporation | | | 55,692 | | | | 4,791,740 | |
| National Oilwell Varco, Inc. | | | 55,340 | | | | 4,322,607 | |
| Occidental Petroleum Corporation | | | 41,499 | | | | 3,881,816 | |
| Valero Energy Corporation | | | 129,461 | | | | 4,421,093 | |
| | | | | | | | 21,929,402 | |
| Financials — 20.3% | | | | | | | | |
American Tower Corporation (b) | | | 72,543 | | | | 5,377,613 | |
| Aon plc | | | 71,210 | | | | 5,300,872 | |
Berkshire Hathaway, Inc. - Class B (a) | | | 53,556 | | | | 6,079,142 | |
| Brookfield Asset Management, Inc. - Class A | | | 152,289 | | | | 5,695,609 | |
| Capital One Financial Corporation | | | 97,892 | | | | 6,729,096 | |
| Goldman Sachs Group, Inc. (The) | | | 26,225 | | | | 4,149,057 | |
| JPMorgan Chase & Company | | | 69,728 | | | | 3,604,240 | |
Markel Corporation (a) | | | 12,218 | | | | 6,326,114 | |
| Wells Fargo & Company | | | 137,044 | | | | 5,662,658 | |
| | | | | | | | 48,924,401 | |
| Health Care — 9.9% | | | | | | | | |
| AmerisourceBergen Corporation | | | 80,870 | | | | 4,941,157 | |
| Amgen, Inc. | | | 33,320 | | | | 3,729,841 | |
Celgene Corporation (a) | | | 26,962 | | | | 4,150,260 | |
| Johnson & Johnson | | | 79,913 | | | | 6,927,658 | |
DAVENPORT CORE FUND
SCHEDULE OF INVESTMENTS (Continued)
COMMON STOCKS — 93.9% (Continued) | | | | | | |
| Health Care — 9.9% (Continued) | | | | | | |
| WellPoint, Inc. | | | 50,390 | | | $ | 4,213,108 | |
| | | | | | | | 23,962,024 | |
| Industrials — 10.3% | | | | | | | | |
| Chicago Bridge & Iron Company NV | | | 55,008 | | | | 3,727,892 | |
| Danaher Corporation | | | 85,872 | | | | 5,952,647 | |
| General Electric Company | | | 132,645 | | | | 3,168,889 | |
| Parker Hannifin Corporation | | | 35,710 | | | | 3,882,391 | |
| Stanley Black & Decker, Inc. | | | 39,738 | | | | 3,599,071 | |
| United Technologies Corporation | | | 42,694 | | | | 4,603,267 | |
| | | | | | | | 24,934,157 | |
| Information Technology — 11.5% | | | | | | | | |
| Accenture plc - Class A | | | 57,314 | | | | 4,220,603 | |
| Apple, Inc. | | | 6,920 | | | | 3,299,110 | |
| Automatic Data Processing, Inc. | | | 49,175 | | | | 3,559,286 | |
Facebook, Inc. - Class A (a) | | | 88,440 | | | | 4,443,226 | |
Google, Inc. - Class A (a) | | | 6,205 | | | | 5,435,022 | |
| QUALCOMM, Inc. | | | 49,890 | | | | 3,360,590 | |
| Visa, Inc. - Class A | | | 18,669 | | | | 3,567,646 | |
| | | | | | | | 27,885,483 | |
| Materials — 4.7% | | | | | | | | |
| Albemarle Corporation | | | 55,483 | | | | 3,492,100 | |
| Monsanto Company | | | 33,426 | | | | 3,488,671 | |
| Praxair, Inc. | | | 37,208 | | | | 4,472,774 | |
| | | | | | | | 11,453,545 | |
| | | | | | | | | |
Total Common Stocks (Cost $155,922,543) | | | | | | $ | 226,722,186 | |
EXCHANGE-TRADED FUNDS — 2.4% | | | | | | |
| iShares Nasdaq Biotechnology Index Fund (Cost $4,014,106) | | | 28,182 | | | $ | 5,906,947 | |
DAVENPORT CORE FUND
SCHEDULE OF INVESTMENTS (Continued)
MONEY MARKET FUNDS — 1.9% | | | | | | |
First American Treasury Obligations Fund - Class Z, 0.00% (c) (Cost $4,571,006) | | | 4,571,006 | | | $ | 4,571,006 | |
| | | | | | | | | |
Total Investments at Value — 98.2% (Cost $164,507,655) | | | | | | $ | 237,200,139 | |
| | | | | | | | | |
| Other Assets in Excess of Liabilities — 1.8% | | | | | | | 4,374,421 | |
| | | | | | | | | |
| Net Assets — 100.0% | | | | | | $ | 241,574,560 | |
ADR - American Depositary Receipt.
| (a) | Non-income producing security. |
| (b) | Real estate investment trust (REIT). |
| (c) | The rate shown is the 7-day effective yield as of September 30, 2013. |
See accompanying notes to financial statements.
DAVENPORT VALUE & INCOME FUND
SCHEDULE OF INVESTMENTS
September 30, 2013 (Unaudited)
| | | | | | |
| Consumer Discretionary — 6.3% | | | | | | |
| Darden Restaurants, Inc. | | | 55,990 | | | $ | 2,591,777 | |
| McDonald's Corporation | | | 44,715 | | | | 4,302,030 | |
Penn National Gaming, Inc. (a) | | | 86,455 | | | | 4,786,149 | |
| Six Flags Entertainment Corporation | | | 103,330 | | | | 3,491,521 | |
| | | | | | | | 15,171,477 | |
| Consumer Staples — 15.6% | | | | | | | | |
| Altria Group, Inc. | | | 89,166 | | | | 3,062,852 | |
| Anheuser-Busch InBev SA/NV - ADR | | | 41,340 | | | | 4,100,928 | |
| Archer-Daniels-Midland Company | | | 106,430 | | | | 3,920,881 | |
| Coca-Cola Company (The) | | | 106,960 | | | | 4,051,645 | |
| Diageo plc - ADR | | | 26,195 | | | | 3,328,861 | |
| PepsiCo, Inc. | | | 56,290 | | | | 4,475,055 | |
| Philip Morris International, Inc. | | | 44,450 | | | | 3,848,925 | |
| Walgreen Company | | | 121,780 | | | | 6,551,764 | |
| Wal-Mart Stores, Inc. | | | 61,052 | | | | 4,515,406 | |
| | | | | | | | 37,856,317 | |
| Energy — 10.8% | | | | | | | | |
| BP plc - ADR | | | 105,900 | | | | 4,450,977 | |
| Chevron Corporation | | | 39,886 | | | | 4,846,149 | |
| Exxon Mobil Corporation | | | 50,470 | | | | 4,342,439 | |
| Kinder Morgan, Inc. | | | 122,925 | | | | 4,372,442 | |
| Marathon Petroleum Corporation | | | 69,580 | | | | 4,475,385 | |
| TransCanada Corporation | | | 86,520 | | | | 3,801,689 | |
| | | | | | | | 26,289,081 | |
| Financials — 24.0% | | | | | | | | |
| Aflac, Inc. | | | 84,340 | | | | 5,228,237 | |
| Capital One Financial Corporation | | | 81,430 | | | | 5,597,498 | |
| Fidelity National Financial, Inc. - Class A | | | 163,450 | | | | 4,347,770 | |
| Hartford Financial Services Group, Inc. | | | 178,005 | | | | 5,539,516 | |
| JPMorgan Chase & Company | | | 129,320 | | | | 6,684,551 | |
Markel Corporation (a) | | | 6,615 | | | | 3,425,048 | |
Sun Communities, Inc. (b) | | | 136,823 | | | | 5,831,396 | |
| Travelers Companies, Inc. (The) | | | 69,390 | | | | 5,882,190 | |
W.P. Carey, Inc. (b) | | | 82,354 | | | | 5,328,304 | |
| Wells Fargo & Company | | | 146,650 | | | | 6,059,578 | |
Weyerhaeuser Company (b) | | | 147,839 | | | | 4,232,631 | |
| | | | | | | | 58,156,719 | |
| Health Care — 10.3% | | | | | | | | |
| GlaxoSmithKline plc - ADR | | | 121,405 | | | | 6,090,889 | |
| Johnson & Johnson | | | 71,240 | | | | 6,175,796 | |
| Merck & Company, Inc. | | | 80,305 | | | | 3,823,321 | |
| Teva Pharmaceutical Industries Ltd. - ADR | | | 113,235 | | | | 4,278,018 | |
DAVENPORT VALUE & INCOME FUND
SCHEDULE OF INVESTMENTS (Continued)
COMMON STOCKS — 88.8% (Continued) | | | | | | |
| Health Care — 10.3% (Continued) | | | | | | |
| WellPoint, Inc. | | | 54,705 | | | $ | 4,573,885 | |
| | | | | | | | 24,941,909 | |
| Industrials — 13.3% | | | | | | | | |
| 3M Company | | | 35,455 | | | | 4,233,681 | |
| Eaton Corporation plc | | | 73,357 | | | | 5,049,896 | |
| General Electric Company | | | 250,965 | | | | 5,995,554 | |
| Illinois Tool Works, Inc. | | | 47,295 | | | | 3,607,190 | |
| Norfolk Southern Corporation | | | 51,130 | | | | 3,954,905 | |
| Raytheon Company | | | 65,356 | | | | 5,036,987 | |
| Watsco, Inc. | | | 46,570 | | | | 4,390,154 | |
| | | | | | | | 32,268,367 | |
| Information Technology — 2.0% | | | | | | | | |
| Automatic Data Processing, Inc. | | | 65,950 | | | | 4,773,461 | |
| | | | | | | | | |
| Materials — 3.1% | | | | | | | | |
| E.I. du Pont de Nemours and Company | | | 64,230 | | | | 3,761,309 | |
| Eastman Chemical Company | | | 47,230 | | | | 3,679,217 | |
| | | | | | | | 7,440,526 | |
| Telecommunication Services — 1.5% | | | | | | | | |
| TELUS Corporation | | | 107,085 | | | | 3,546,655 | |
| | | | | | | | | |
| Utilities — 1.9% | | | | | | | | |
| Dominion Resources, Inc. | | | 75,540 | | | | 4,719,739 | |
| | | | | | | | | |
Total Common Stocks (Cost $182,675,098) | | | | | | $ | 215,164,251 | |
EXCHANGE-TRADED FUNDS — 2.6% | | | | | | |
SPDR EURO STOXX 50 ® ETF (Cost $5,205,354) | | | 166,360 | | | $ | 6,384,897 | |
| | | | | | |
| Tortoise Energy Infrastructure Corporation (Cost $1,641,240) | | | 39,355 | | | $ | 1,806,395 | |
DAVENPORT VALUE & INCOME FUND
SCHEDULE OF INVESTMENTS (Continued)
MONEY MARKET FUNDS — 2.8% | | | | | | |
First American Treasury Obligations Fund - Class Z, 0.00% (c) (Cost $6,792,005) | | | 6,792,005 | | | $ | 6,792,005 | |
| | | | | | | | | |
Total Investments at Value — 95.0% (Cost $196,313,697) | | | | | | $ | 230,147,548 | |
| | | | | | | | | |
| Other Assets in Excess of Liabilities — 5.0% | | | | | | | 12,184,761 | |
| | | | | | | | | |
| Net Assets — 100.0% | | | | | | $ | 242,332,309 | |
ADR - American Depositary Receipt.
| (a) | Non-income producing security. |
| (b) | Real estate investment trust (REIT). |
| (c) | The rate shown is the 7-day effective yield as of September 30, 2013. |
See accompanying notes to financial statements.
DAVENPORT EQUITY OPPORTUNITIES FUND
SCHEDULE OF INVESTMENTS
September 30, 2013 (Unaudited)
| | | | | | |
| Consumer Discretionary — 31.7% | | | | | | |
Cabela's, Inc. - Class A (a) | | | 28,865 | | | $ | 1,819,361 | |
CarMax, Inc. (a) | | | 154,975 | | | | 7,511,638 | |
| CST Brands, Inc. | | | 87,922 | | | | 2,620,076 | |
Dollar Tree, Inc. (a) | | | 83,220 | | | | 4,756,855 | |
| Hanesbrands, Inc. | | | 70,825 | | | | 4,413,106 | |
Krispy Kreme Doughnuts, Inc. (a) | | | 97,050 | | | | 1,876,947 | |
O'Reilly Automotive, Inc. (a) | | | 47,070 | | | | 6,005,661 | |
Penn National Gaming, Inc. (a) | | | 175,055 | | | | 9,691,045 | |
Pinnacle Entertainment, Inc. (a) | | | 118,160 | | | | 2,959,908 | |
| | | | | | | | 41,654,597 | |
| Consumer Staples — 10.3% | | | | | | | | |
| Beam, Inc. | | | 39,255 | | | | 2,537,836 | |
| Church & Dwight Company, Inc. | | | 65,770 | | | | 3,949,488 | |
| J.M. Smucker Company (The) | | | 36,850 | | | | 3,870,724 | |
| Walgreen Company | | | 58,930 | | | | 3,170,434 | |
| | | | | | | | 13,528,482 | |
| Energy — 5.8% | | | | | | | | |
| National Oilwell Varco, Inc. | | | 33,375 | | | | 2,606,922 | |
Ultra Petroleum Corporation (a) | | | 158,100 | | | | 3,252,117 | |
| Valero Energy Corporation | | | 52,815 | | | | 1,803,632 | |
| | | | | | | | 7,662,671 | |
| Financials — 28.8% | | | | | | | | |
| American International Group, Inc. | | | 58,665 | | | | 2,852,879 | |
American Tower Corporation (b) | | | 65,815 | | | | 4,878,866 | |
| Aon plc | | | 55,255 | | | | 4,113,182 | |
| Brookfield Asset Management, Inc. - Class A | | | 170,110 | | | | 6,362,114 | |
| Brookfield Property Partners L.P. | | | 6,543 | | | | 126,803 | |
| Capital One Financial Corporation | | | 69,721 | | | | 4,792,621 | |
| Fidelity National Financial, Inc. - Class A | | | 86,995 | | | | 2,314,067 | |
Markel Corporation (a) | | | 13,100 | | | | 6,782,787 | |
| Safety Insurance Group, Inc. | | | 34,375 | | | | 1,820,844 | |
Sun Communities, Inc. (b) | | | 90,667 | | | | 3,864,228 | |
| | | | | | | | 37,908,391 | |
| Health Care — 2.1% | | | | | | | | |
Henry Schein, Inc. (a) | | | 26,060 | | | | 2,702,422 | |
| | | | | | | | | |
| Industrials — 8.4% | | | | | | | | |
Colfax Corporation (a) | | | 49,310 | | | | 2,785,522 | |
| Delta Air Lines, Inc. | | | 133,360 | | | | 3,145,962 | |
| Pall Corporation | | | 34,375 | | | | 2,648,250 | |
| Watsco, Inc. | | | 26,125 | | | | 2,462,804 | |
| | | | | | | | 11,042,538 | |
DAVENPORT EQUITY OPPORTUNITIES FUND
SCHEDULE OF INVESTMENTS (Continued)
COMMON STOCKS — 95.4% (Continued) | | | | | | |
| Information Technology — 3.7% | | | | | | |
| Intuit, Inc. | | | 74,300 | | | $ | 4,926,833 | |
| | | | | | | | | |
| Materials — 1.8% | | | | | | | | |
| Albemarle Corporation | | | 38,270 | | | | 2,408,714 | |
| | | | | | | | | |
| Utilities — 2.8% | | | | | | | | |
| ITC Holdings Corporation | | | 39,790 | | | | 3,734,689 | |
| | | | | | | | | |
Total Common Stocks (Cost $101,205,394) | | | | | | $ | 125,569,337 | |
MONEY MARKET FUNDS — 2.9% | | | | | | |
First American Treasury Obligations Fund - Class Z, 0.00% (c) (Cost $3,800,594) | | | 3,800,594 | | | $ | 3,800,594 | |
| | | | | | | | | |
Total Investments at Value — 98.3% (Cost $105,005,988) | | | | | | $ | 129,369,931 | |
| | | | | | | | | |
| Other Assets in Excess of Liabilities — 1.7% | | | | | | | 2,221,277 | |
| | | | | | | | | |
| Net Assets — 100.0% | | | | | | $ | 131,591,208 | |
| (a) | Non-income producing security. |
| (b) | Real estate investment trust (REIT). |
| (c) | The rate shown is the 7-day effective yield as of September 30, 2013. |
See accompanying notes to financial statements.
THE DAVENPORT FUNDS
STATEMENTS OF ASSETS AND LIABILITIES
September 30, 2013 (Unaudited)
| | | | | Davenport Value & Income Fund | | | Davenport Equity Opportunities Fund | |
| ASSETS | | | | | | | | | |
| Investments in securities: | | | | | | | | | |
| At acquisition cost | | $ | 164,507,655 | | | $ | 196,313,697 | | | $ | 105,005,988 | |
| At market value (Note 2) | | $ | 237,200,139 | | | $ | 230,147,548 | | | $ | 129,369,931 | |
| Cash | | | 4,481,615 | | | | 10,062,248 | | | | 1,980,950 | |
| Dividends receivable | | | 125,373 | | | | 672,182 | | | | 90,228 | |
| Receivable for capital shares sold | | | 320,605 | | | | 1,841,612 | | | | 462,410 | |
| Other assets | | | 24,392 | | | | 25,959 | | | | 18,234 | |
| TOTAL ASSETS | | | 242,152,124 | | | | 242,749,549 | | | | 131,921,753 | |
| | | | | | | | | | | | | |
| LIABILITIES | | | | | | | | | | | | |
| Payable for capital shares redeemed | | | 383,846 | | | | 232,739 | | | | 224,326 | |
| Accrued investment advisory fees (Note 4) | | | 164,650 | | | | 153,017 | | | | 86,070 | |
| Payable to administrator (Note 4) | | | 27,500 | | | | 27,600 | | | | 16,200 | |
| Other accrued expenses and liabilities | | | 1,568 | | | | 3,884 | | | | 3,949 | |
| TOTAL LIABILITIES | | | 577,564 | | | | 417,240 | | | | 330,545 | |
| | | | | | | | | | | | | |
| NET ASSETS | | $ | 241,574,560 | | | $ | 242,332,309 | | | $ | 131,591,208 | |
| | | | | | | | | | | | | |
| Net assets consist of: | | | | | | | | | | | | |
| Paid-in capital | | $ | 162,181,741 | | | $ | 202,879,988 | | | $ | 103,919,166 | |
| Accumulated net investment income | | | 28,017 | | | | 215,307 | | | | 169,714 | |
Accumulated net realized gains
from security transactions | | | 6,672,318 | | | | 5,403,163 | | | | 3,138,385 | |
| Net unrealized appreciation on investments | | | 72,692,484 | | | | 33,833,851 | | | | 24,363,943 | |
| Net assets | | $ | 241,574,560 | | | $ | 242,332,309 | | | $ | 131,591,208 | |
| | | | | | | | | | | | | |
Shares of beneficial interest outstanding
(unlimited number of shares authorized,
$0.01 par value) | | | 13,262,715 | | | | 17,764,084 | | | | 8,941,446 | |
| | | | | | | | | | | | | |
Net asset value, offering price and
redemption price per share (Note 2) | | $ | 18.21 | | | $ | 13.64 | | | $ | 14.72 | |
See accompanying notes to financial statements.
THE DAVENPORT FUNDS
STATEMENTS OF OPERATIONS
Six Months Ended September 30, 2013 (Unaudited)
| | | | | Davenport Value & Income Fund | | | Davenport Equity Opportunities Fund | |
| INVESTMENT INCOME | | | | | | | | | |
| Dividends | | $ | 2,052,024 | | | $ | 3,450,314 | | | $ | 771,947 | |
| Foreign withholding taxes on dividends | | | (56,150 | ) | | | (29,502 | ) | | | (27,143 | ) |
| TOTAL INVESTMENT INCOME | | | 1,995,874 | | | | 3,420,812 | | | | 744,804 | |
| | | | | | | | | | | | | |
| EXPENSES | | | | | | | | | | | | |
| Investment advisory fees (Note 4) | | | 853,995 | | | | 839,388 | | | | 439,436 | |
| Administration fees (Note 4) | | | 147,486 | | | | 145,766 | | | | 83,260 | |
| Professional fees | | | 16,413 | | | | 15,863 | | | | 12,213 | |
| Compliance service fees (Note 4) | | | 12,650 | | | | 12,580 | | | | 8,071 | |
| Custodian and bank service fees | | | 10,213 | | | | 11,410 | | | | 6,842 | |
| Registration and filing fees | | | 8,763 | | | | 9,207 | | | | 7,968 | |
| Printing of shareholder reports | | | 7,623 | | | | 7,213 | | | | 5,246 | |
| Insurance expense | | | 5,672 | | | | 5,264 | | | | 3,060 | |
| Trustees’ fees and expenses (Note 4) | | | 3,956 | | | | 3,956 | | | | 3,956 | |
| Postage and supplies | | | 3,054 | | | | 2,941 | | | | 2,178 | |
| Other expenses | | | 978 | | | | 2,310 | | | | 2,860 | |
| TOTAL EXPENSES | | | 1,070,803 | | | | 1,055,898 | | | | 575,090 | |
| | | | | | | | | | | | | |
| NET INVESTMENT INCOME | | | 925,071 | | | | 2,364,914 | | | | 169,714 | |
| | | | | | | | | | | | | |
REALIZED AND UNREALIZED
GAINS ON INVESTMENTS | | | | | | | | | | | | |
| Net realized gains from security transactions | | | 7,004,743 | | | | 5,404,427 | | | | 3,191,678 | |
Net change in unrealized appreciation/
depreciation on investments | | | 13,350,027 | | | | 4,764,819 | | | | 6,189,656 | |
| | | | | | | | | | | | | |
NET REALIZED AND UNREALIZED
GAINS ON INVESTMENTS | | | 20,354,770 | | | | 10,169,246 | | | | 9,381,334 | |
| | | | | | | | | | | | | |
NET INCREASE IN NET ASSETS
FROM OPERATIONS | | $ | 21,279,841 | | | $ | 12,534,160 | | | $ | 9,551,048 | |
See accompanying notes to financial statements.
DAVENPORT CORE FUND
STATEMENTS OF CHANGES IN NET ASSETS
| | Six Months Ended September 30, 2013 (Unaudited) | | | | |
| FROM OPERATIONS | | | | | | |
| Net investment income | | $ | 925,071 | | | $ | 1,307,207 | |
| Net realized gains from security transactions | | | 7,004,743 | | | | 9,676,207 | |
Net change in unrealized appreciation/
depreciation on investments | | | 13,350,027 | | | | 12,010,397 | |
| Net increase in net assets from operations | | | 21,279,841 | | | | 22,993,811 | |
| | | | | | | | | |
| DISTRIBUTIONS TO SHAREHOLDERS | | | | | | | | |
| From net investment income | | | (908,702 | ) | | | (1,315,956 | ) |
| From net realized gains from security transactions | | | (1,456,213 | ) | | | — | |
| Decrease in net assets from distributions to shareholders | | | (2,364,915 | ) | | | (1,315,956 | ) |
| | | | | | | | | |
| FROM CAPITAL SHARE TRANSACTIONS | | | | | | | | |
| Proceeds from shares sold | | | 19,215,267 | | | | 32,795,331 | |
Net asset value of shares issued in reinvestment
of distributions to shareholders | | | 2,275,693 | | | | 1,246,351 | |
| Payments for shares redeemed | | | (9,730,331 | ) | | | (19,718,238 | ) |
| Net increase in net assets from capital share transactions | | | 11,760,629 | | | | 14,323,444 | |
| | | | | | | | | |
| TOTAL INCREASE IN NET ASSETS | | | 30,675,555 | | | | 36,001,299 | |
| | | | | | | | | |
| NET ASSETS | | | | | | | | |
| Beginning of period | | | 210,899,005 | | | | 174,897,706 | |
| End of period | | $ | 241,574,560 | | | $ | 210,899,005 | |
| | | | | | | | | |
| ACCUMULATED NET INVESTMENT INCOME | | $ | 28,017 | | | $ | 11,648 | |
| | | | | | | | | |
| CAPITAL SHARE ACTIVITY | | | | | | | | |
| Shares sold | | | 1,090,139 | | | | 2,156,214 | |
| Shares reinvested | | | 130,061 | | | | 82,322 | |
| Shares redeemed | | | (552,013 | ) | | | (1,300,040 | ) |
| Net increase in shares outstanding | | | 668,187 | | | | 938,496 | |
| Shares outstanding at beginning of period | | | 12,594,528 | | | | 11,656,032 | |
| Shares outstanding at end of period | | | 13,262,715 | | | | 12,594,528 | |
See accompanying notes to financial statements.
DAVENPORT VALUE & INCOME FUND
STATEMENTS OF CHANGES IN NET ASSETS
| | Six Months Ended September 30, 2013 (Unaudited) | | | | |
| FROM OPERATIONS | | | | | | |
| Net investment income | | $ | 2,364,914 | | | $ | 3,299,446 | |
| Net realized gains from security transactions | | | 5,404,427 | | | | 6,183,266 | |
Net change in unrealized appreciation/
depreciation on investments | | | 4,764,819 | | | | 18,460,679 | |
| Net increase in net assets from operations | | | 12,534,160 | | | | 27,943,391 | |
| | | | | | | | | |
| DISTRIBUTIONS TO SHAREHOLDERS | | | | | | | | |
| From net investment income | | | (2,152,728 | ) | | | (3,316,928 | ) |
| From net realized gains from security transactions | | | (3,232,544 | ) | | | (1,962,920 | ) |
| Decrease in net assets from distributions to shareholders | | | (5,385,272 | ) | | | (5,279,848 | ) |
| | | | | | | | | |
| FROM CAPITAL SHARE TRANSACTIONS | | | | | | | | |
| Proceeds from shares sold | | | 44,250,965 | | | | 85,076,371 | |
Net asset value of shares issued in reinvestment
of distributions to shareholders | | | 4,923,703 | | | | 4,722,338 | |
| Payments for shares redeemed | | | (10,881,118 | ) | | | (14,329,788 | ) |
| Net increase in net assets from capital share transactions | | | 38,293,550 | | | | 75,468,921 | |
| | | | | | | | | |
| TOTAL INCREASE IN NET ASSETS | | | 45,442,438 | | | | 98,132,464 | |
| | | | | | | | | |
| NET ASSETS | | | | | | | | |
| Beginning of period | | | 196,889,871 | | | | 98,757,407 | |
| End of period | | $ | 242,332,309 | | | $ | 196,889,871 | |
| | | | | | | | | |
| ACCUMULATED NET INVESTMENT INCOME | | $ | 215,307 | | | $ | 3,121 | |
| | | | | | | | | |
| CAPITAL SHARE ACTIVITY | | | | | | | | |
| Shares sold | | | 3,257,346 | | | | 7,171,909 | |
| Shares reinvested | | | 365,649 | | | | 398,116 | |
| Shares redeemed | | | (795,548 | ) | | | (1,212,247 | ) |
| Net increase in shares outstanding | | | 2,827,447 | | | | 6,357,778 | |
| Shares outstanding at beginning of period | | | 14,936,637 | | | | 8,578,859 | |
| Shares outstanding at end of period | | | 17,764,084 | | | | 14,936,637 | |
See accompanying notes to financial statements.
DAVENPORT EQUITY OPPORTUNITIES FUND
STATEMENTS OF CHANGES IN NET ASSETS
| | Six Months Ended September 30, 2013 (Unaudited) | | | | |
| FROM OPERATIONS | | | | | | |
| Net investment income | | $ | 169,714 | | | $ | 164,908 | |
| Net realized gains from security transactions | | | 3,191,678 | | | | 4,578,353 | |
Net change in unrealized appreciation/
depreciation on investments | | | 6,189,656 | | | | 10,165,302 | |
| Net increase in net assets from operations | | | 9,551,048 | | | | 14,908,563 | |
| | | | | | | | | |
| DISTRIBUTIONS TO SHAREHOLDERS | | | | | | | | |
| From net investment income | | | (25,889 | ) | | | (139,019 | ) |
| From net realized gains from security transactions | | | (2,415,824 | ) | | | (1,731,142 | ) |
| Decrease in net assets from distributions to shareholders | | | (2,441,713 | ) | | | (1,870,161 | ) |
| | | | | | | | | |
| FROM CAPITAL SHARE TRANSACTIONS | | | | | | | | |
| Proceeds from shares sold | | | 23,807,584 | | | | 33,820,160 | |
Net asset value of shares issued in reinvestment
of distributions to shareholders | | | 2,363,209 | | | | 1,800,189 | |
| Payments for shares redeemed | | | (4,367,915 | ) | | | (5,114,447 | ) |
| Net increase in net assets from capital share transactions | | | 21,802,878 | | | | 30,505,902 | |
| | | | | | | | | |
| TOTAL INCREASE IN NET ASSETS | | | 28,912,213 | | | | 43,544,304 | |
| | | | | | | | | |
| NET ASSETS | | | | | | | | |
| Beginning of period | | | 102,678,995 | | | | 59,134,691 | |
| End of period | | $ | 131,591,208 | | | $ | 102,678,995 | |
| | | | | | | | | |
| ACCUMULATED NET INVESTMENT INCOME | | $ | 169,714 | | | $ | 25,889 | |
| | | | | | | | | |
| CAPITAL SHARE ACTIVITY | | | | | | | | |
| Shares sold | | | 1,667,890 | | | | 2,737,625 | |
| Shares reinvested | | | 169,284 | | | | 145,972 | |
| Shares redeemed | | | (304,829 | ) | | | (419,552 | ) |
| Net increase in shares outstanding | | | 1,532,345 | | | | 2,464,045 | |
| Shares outstanding at beginning of period | | | 7,409,101 | | | | 4,945,056 | |
| Shares outstanding at end of period | | | 8,941,446 | | | | 7,409,101 | |
See accompanying notes to financial statements.
DAVENPORT CORE FUND
FINANCIAL HIGHLIGHTS
Selected Per Share Data and Ratios for a Share Outstanding Throughout Each Period
| | | Six Months Ended Sept. 30, 2013 | | | | |
| | | | | | | | | | | | | | | | | | | |
Net asset value at
beginning of period | | $ | 16.75 | | | $ | 15.00 | | | $ | 13.73 | | | $ | 12.05 | | | $ | 8.36 | | | $ | 13.82 | |
| | | | | | | | | | | | | | | | | | | | | | | | | |
Income (loss) from
investment operations: | | | | | | | | | | | | | | | | | | | | | | | | |
| Net investment income | | | 0.07 | | | | 0.11 | | | | 0.09 | | | | 0.07 | | | | 0.08 | | | | 0.11 | |
| Net realized and unrealized gains (losses) on investments | | 1.57 | | | | 1.75 | | | | 1.27 | | | | 1.68 | | | | 3.69 | | | | (5.17 | ) |
| Total from investment operations | | | 1.64 | | | | 1.86 | | | | 1.36 | | | | 1.75 | | | | 3.77 | | | | (5.06 | ) |
| | | | | | | | | | | | | | | | | | | | | | | | | |
| Less distributions: | | | | | | | | | | | | | | | | | | | | | | | | |
Dividends from net
investment income | | | (0.07 | ) | | | (0.11 | ) | | | (0.09 | ) | | | (0.07 | ) | | | (0.08 | ) | | | (0.11 | ) |
Distributions from net
realized gains | | | (0.11 | ) | | | — | | | | — | | | | — | | | | — | | | | (0.29 | ) |
| Total distributions | | | (0.18 | ) | | | (0.11 | ) | | | (0.09 | ) | | | (0.07 | ) | | | (0.08 | ) | | | (0.40 | ) |
| | | | | | | | | | | | | | | | | | | | | | | | | |
| Net asset value at end of period | | $ | 18.21 | | | $ | 16.75 | | | $ | 15.00 | | | $ | 13.73 | | | $ | 12.05 | | | $ | 8.36 | |
| | | | | | | | | | | | | | | | | | | | | | | | | |
Total return (a) | | | 9.86% | (b) | | | 12.47% | | | | 9.99% | | | | 14.61% | | | | 45.20% | | | | (36.85% | ) |
| | | | | | | | | | | | | | | | | | | | | | | | | |
| Net assets at end of period (000’s) | $ | 241,575 | | | $ | 210,899 | | | $ | 174,898 | | | $ | 159,894 | | | $ | 132,662 | | | $ | 92,358 | |
| | | | | | | | | | | | | | | | | | | | | | | | | |
Ratio of total expenses to
average net assets | | | 0.94% | (c) | | | 0.95% | | | | 0.96% | | | | 0.99% | | | | 1.00% | | | | 1.00% | |
| | | | | | | | | | | | | | | | | | | | | | | | | |
Ratio of net investment income
to average net assets | | | 0.81% | (c) | | | 0.71% | | | | 0.66% | | | | 0.58% | | | | 0.75% | | | | 0.98% | |
| | | | | | | | | | | | | | | | | | | | | | | | | |
| Portfolio turnover rate | | | 11% | (b) | | | 26% | | | | 19% | | | | 34% | | | | 25% | | | | 39% | |
| (a) | Total return is a measure of the change in value of an investment in the Fund over the periods covered, which assumes any dividends or capital gains distributions are reinvested in shares of the Fund. Returns shown do not reflect the deduction of taxes a shareholder would pay on Fund distributions or the redemption of Fund shares. |
See accompanying notes to financial statements.
DAVENPORT VALUE & INCOME FUND
FINANCIAL HIGHLIGHTS
Selected Per Share Data and Ratios for a Share Outstanding Throughout Each Period
| | Six Months Ended Sept. 30, 2013 (Unaudited) | | | | | | | | | Period Ended March 31, 2011 (a) | |
| Net asset value at beginning of period | | $ | 13.18 | | | $ | 11.51 | | | $ | 10.50 | | | $ | 10.00 | |
| | | | | | | | | | | | | | | | | |
| Income from investment operations: | | | | | | | | | | | | | | | | |
| Net investment income | | | 0.14 | | | | 0.28 | | | | 0.23 | | | | 0.04 | |
| Net realized and unrealized gains on investments | | | 0.65 | | | | 1.81 | | | | 1.02 | | | | 0.49 | |
| Total from investment operations | | | 0.79 | | | | 2.09 | | | | 1.25 | | | | 0.53 | |
| | | | | | | | | | | | | | | | | |
| Less distributions: | | | | | | | | | | | | | | | | |
| Dividends from net investment income | | | (0.13 | ) | | | (0.27 | ) | | | (0.23 | ) | | | (0.03 | ) |
| Distributions from net realized gains | | | (0.20 | ) | | | (0.15 | ) | | | (0.01 | ) | | | — | |
| Total distributions | | | (0.33 | ) | | | (0.42 | ) | | | (0.24 | ) | | | (0.03 | ) |
| | | | | | | | | | | | | | | | | |
| Net asset value at end of period | | $ | 13.64 | | | $ | 13.18 | | | $ | 11.51 | | | $ | 10.50 | |
| | | | | | | | | | | | | | | | | |
Total return (b) | | | 6.03% | (c) | | | 18.69% | | | | 12.23% | | | | 5.35% | (c) |
| | | | | | | | | | | | | | | | | |
| Net assets at end of period (000’s) | | $ | 242,332 | | | $ | 196,890 | | | $ | 98,757 | | | $ | 48,831 | |
| | | | | | | | | | | | | | | | | |
| Ratio of total expenses to average net assets | | | 0.94% | (d) | | | 0.96% | | | | 1.04% | | | | 1.25% | (d) |
| | | | | | | | | | | | | | | | | |
| Ratio of net investment income to average net assets | | | 2.11% | (d) | | | 2.37% | | | | 2.30% | | | | 1.99% | (d) |
| | | | | | | | | | | | | | | | | |
| Portfolio turnover rate | | | 18% | (c) | | | 29% | | | | 27% | | | | 10% | (c) |
| (a) | Represents the period from commencement of operations (December 31, 2010) through March 31, 2011. |
| (b) | Total return is a measure of the change in value of an investment in the Fund over the periods covered, which assumes any dividends or capital gains distributions are reinvested in shares of the Fund. Returns shown do not reflect the deduction of taxes a shareholder would pay on Fund distributions or the redemption of Fund shares. |
See accompanying notes to financial statements.
DAVENPORT EQUITY OPPORTUNITIES FUND
FINANCIAL HIGHLIGHTS
Selected Per Share Data and Ratios for a Share Outstanding Throughout Each Period
| | Six Months Ended Sept. 30, 2013 (Unaudited) | | | | | | | | | Period Ended March 31, 2011 (a) | |
| Net asset value at beginning of period | | $ | 13.86 | | | $ | 11.96 | | | $ | 10.72 | | | $ | 10.00 | |
| | | | | | | | | | | | | | | | | |
| Income (loss) from investment operations: | | | | | | | | | | | | | | | | |
| Net investment income (loss) | | | 0.02 | | | | 0.03 | | | | (0.02 | ) | | | (0.01 | ) |
| Net realized and unrealized gains on investments | | | 1.15 | | | | 2.17 | | | | 1.30 | | | | 0.73 | |
| Total from investment operations | | | 1.17 | | | | 2.20 | | | | 1.28 | | | | 0.72 | |
| | | | | | | | | | | | | | | | | |
| Less distributions: | | | | | | | | | | | | | | | | |
| Dividends from net investment income | | | (0.01 | ) | | | (0.02 | ) | | | — | | | | — | |
| Distributions from net realized gains | | | (0.30 | ) | | | (0.28 | ) | | | (0.04 | ) | | | — | |
| Total distributions | | | (0.31 | ) | | | (0.30 | ) | | | (0.04 | ) | | | — | |
| | | | | | | | | | | | | | | | | |
| Net asset value at end of period | | $ | 14.72 | | | $ | 13.86 | | | $ | 11.96 | | | $ | 10.72 | |
| | | | | | | | | | | | | | | | | |
Total return (b) | | | 8.54% | (c) | | | 18.77% | | | | 12.00% | | | | 7.20% | (c) |
| | | | | | | | | | | | | | | | | |
| Net assets at end of period (000’s) | | $ | 131,591 | | | $ | 102,679 | | | $ | 59,135 | | | $ | 34,375 | |
| | | | | | | | | | | | | | | | | |
| Ratio of total expenses to average net assets | | | 0.98% | (d) | | | 1.01% | | | | 1.10% | | | | 1.25% | (d) |
| | | | | | | | | | | | | | | | | |
Ratio of net investment income (loss)
to average net assets | | | 0.29% | (d) | | | 0.23% | | | | (0.22% | ) | | | (0.40% | )(d) |
| | | | | | | | | | | | | | | | | |
| Portfolio turnover rate | | | 18% | (c) | | | 41% | | | | 35% | | | | 6% | (c) |
| (a) | Represents the period from commencement of operations (December 31, 2010) through March 31, 2011. |
| (b) | Total return is a measure of the change in value of an investment in the Fund over the periods covered, which assumes any dividends or capital gains distributions are reinvested in shares of the Fund. Returns shown do not reflect the deduction of taxes a shareholder would pay on Fund distributions or the redemption of Fund shares. |
See accompanying notes to financial statements.
THE DAVENPORT FUNDS
NOTES TO FINANCIAL STATEMENTS
September 30, 2013 (Unaudited)
1. Organization
Davenport Core Fund, Davenport Value & Income Fund and Davenport Equity Opportunities Fund (individually, a “Fund,” and, collectively, the “Funds”) are each a no-load, diversified series of the Williamsburg Investment Trust (the “Trust”), an open-end management investment company registered under the Investment Company Act of 1940. The Trust was organized as a Massachusetts business trust on July 18, 1988. Other series of the Trust are not incorporated in this report. Davenport Core Fund began operations on January 15, 1998. Davenport Value & Income Fund and Davenport Equity Opportunities Fund each began operations on December 31, 2010.
Davenport Core Fund’s investment objective is long term growth of capital.
Davenport Value & Income Fund’s investment objective is to achieve long term growth while generating current income through dividend payments on portfolio securities.
Davenport Equity Opportunities Fund’s investment objective is long term capital appreciation.
2. Significant Accounting Policies
The following is a summary of the Funds’ significant accounting policies. The policies are in conformity with accounting principles generally accepted in the United States of America (“GAAP”).
Securities valuation — The Funds’ portfolio securities are valued as of the close of business of the regular session of the New York Stock Exchange (normally 4:00 p.m., Eastern time). Securities traded on a national stock exchange are valued based upon the closing price on the principal exchange where the security is traded. Securities which are quoted by NASDAQ are valued at the NASDAQ Official Closing Price. Securities which are traded over-the-counter are valued at the last sales price, if available, otherwise, at the last quoted bid price. Fixed income securities will ordinarily be traded in the over-the-counter market and common stocks will ordinarily be traded on a national securities exchange, but may also be traded in the over-the-counter market.
When market quotations are not readily available, securities may be valued on the basis of prices provided by an independent pricing service. The prices provided by the pricing service are determined with consideration given to institutional bid and last sale prices and take into account securities prices, yields, maturities, call features, ratings, institutional trading in similar groups of securities and developments related to specific securities. If a pricing service cannot provide a valuation or the investment adviser believes the price received from the pricing service is not indicative of fair value, securities will be valued in good faith at fair value using methods consistent with those determined by the Board of Trustees and will be classified as Level 2 or 3 within the fair value hierarchy (see below), depending on the inputs used. Such methods of fair valuation may include, but are not limited to: multiple of earnings, multiple of book value, discount from market of a similar freely traded security, purchase price of the security, subsequent private transactions in the security or related securities, or a combination of these and other factors.
THE DAVENPORT FUNDS
NOTES TO FINANCIAL STATEMENTS (Continued)
Short-term instruments (those with remaining maturities of 60 days or less) may be valued at amortized cost, which approximates market value. Money market funds have been determined to be represented at amortized cost which approximates fair value, absent unusual circumstances.
GAAP establishes a single authoritative definition of fair value, sets out a framework for measuring fair value and requires additional disclosures about fair value measurements.
Various inputs are used in determining the value of the Funds’ investments. These inputs are summarized in the three broad levels listed below:
• Level 1 – quoted prices in active markets for identical securities
• Level 2 – other significant observable inputs
• Level 3 – significant unobservable inputs
The inputs or methodology used for valuing securities are not necessarily an indication of the risks associated with investing in those securities. The inputs used to measure fair value may fall into different levels of the fair value hierarchy. In such cases, for disclosure purposes, the level in the fair value hierarchy within which the fair value measurement falls in its entirety is determined based on the lowest level input that is significant to the fair value measurement.
The following is a summary of the inputs used to value the Funds’ investments as of September 30, 2013 by security type:
| | | | | | | | | | | | |
| Common Stocks | | $ | 226,722,186 | | | $ | — | | | $ | — | | | $ | 226,722,186 | |
| Exchange-Traded Funds | | | 5,906,947 | | | | — | | | | — | | | | 5,906,947 | |
| Money Market Funds | | | 4,571,006 | | | | — | | | | — | | | | 4,571,006 | |
| Total | | $ | 237,200,139 | | | $ | — | | | $ | — | | | $ | 237,200,139 | |
Davenport Value & Income Fund | | | | | | | | | | | | |
| Common Stocks | | $ | 215,164,251 | | | $ | — | | | $ | — | | | $ | 215,164,251 | |
| Exchange-Traded Funds | | | 6,384,897 | | | | — | | | | — | | | | 6,384,897 | |
| Closed-End Funds | | | 1,806,395 | | | | — | | | | — | | | | 1,806,395 | |
| Money Market Funds | | | 6,792,005 | | | | — | | | | — | | | | 6,792,005 | |
| Total | | $ | 230,147,548 | | | $ | — | | | $ | — | | | $ | 230,147,548 | |
Davenport Equity Opportunities Fund | | | | | | | | | | | | |
| Common Stocks | | $ | 125,569,337 | | | $ | — | | | $ | — | | | $ | 125,569,337 | |
| Money Market Funds | | | 3,800,594 | | | | — | | | | — | | | | 3,800,594 | |
| Total | | $ | 129,369,931 | | | $ | — | | | $ | — | | | $ | 129,369,931 | |
THE DAVENPORT FUNDS
NOTES TO FINANCIAL STATEMENTS (Continued)
Refer to each Fund’s Schedule of Investments for a listing of the securities valued by sector type. As of September 30, 2013, the Funds did not have any transfers in and out of any Level. There were no Level 2 or Level 3 securities or derivative instruments held by the Funds as of September 30, 2013. It is the Funds’ policy to recognize transfers into and out of any Level at the end of the reporting period.
Share valuation — The net asset value per share of each Fund is calculated daily by dividing the total value of its assets, less liabilities, by the number of shares outstanding. The offering price and redemption price per share of each Fund is equal to the net asset value per share.
Investment income — Interest income is accrued as earned. Dividend income is recorded on the ex-dividend date. Discounts and premiums on fixed-income securities purchased are amortized using the interest method.
Security transactions — Security transactions are accounted for on trade date for financial reporting purposes. Gains and losses on securities sold are determined on a specific identification basis.
Common expenses — Common expenses of the Trust are allocated among the funds within the Trust based on relative net assets of each fund or the nature of the services performed and the relative applicability to each fund.
Distributions to shareholders — Dividends arising from net investment income, if any, are declared and paid quarterly to shareholders of Davenport Core Fund and Davenport Value & Income Fund; and declared and paid annually to shareholders of Davenport Equity Opportunities Fund. Net realized short-term capital gains, if any, may be distributed throughout the year and net realized long-term capital gains, if any, are distributed at least once each year. The amount of distributions from net investment income and net realized gains are determined in accordance with federal income tax regulations which may differ from GAAP. Dividends and distributions are recorded on the ex-dividend date.
The tax character of distributions paid during the periods ended September 30, 2013 and March 31, 2013 is as follows:
| | | | | | | | | | |
| Davenport Core Fund | 9/30/13 | | $ | 908,702 | | | $ | 1,456,213 | | | $ | 2,364,915 | |
| | 3/31/13 | | $ | 1,315,956 | | | $ | — | | | $ | 1,315,956 | |
| Davenport Value & Income Fund | 9/30/13 | | $ | 2,726,686 | | | $ | 2,658,586 | | | $ | 5,385,272 | |
| | 3/31/13 | | $ | 3,316,928 | | | $ | 1,962,920 | | | $ | 5,279,848 | |
| Davenport Equity Opportunities Fund | 9/30/13 | | $ | 36,859 | | | $ | 2,404,854 | | | $ | 2,441,713 | |
| | 3/31/13 | | $ | 505,327 | | | $ | 1,364,834 | | | $ | 1,870,161 | |
THE DAVENPORT FUNDS
NOTES TO FINANCIAL STATEMENTS (Continued)
Estimates — The preparation of financial statements in conformity with GAAP requires management to make estimates and assumptions that affect the reported amounts of assets and liabilities and disclosure of contingent assets and liabilities as of the date of the financial statements and the reported amounts of income and expenses during the reporting period. Actual results could differ from those estimates.
Federal income tax — It is each Fund’s policy to comply with the special provisions of Subchapter M of the Internal Revenue Code applicable to regulated investment companies. As provided therein, in any fiscal year in which a Fund so qualifies and distributes at least 90% of its taxable net income, the Fund (but not the shareholders) will be relieved of federal income tax on the income distributed. Accordingly, no provision for income taxes has been made.
In order to avoid imposition of the excise tax applicable to regulated investment companies, it is also each Fund’s intention to declare as dividends in each calendar year at least 98% of its net investment income (earned during the calendar year) and 98.2% of its net realized capital gains (earned during the twelve months ended October 31) plus undistributed amounts from prior years.
The following information is computed on a tax basis for each item as of September 30, 2013:
| | | | | Davenport Value & Income Fund | | | Davenport Equity Opportunities Fund | |
| Cost of portfolio investments | | $ | 164,535,025 | | | $ | 196,335,895 | | | $ | 105,024,111 | |
| Gross unrealized appreciation | | $ | 73,020,941 | | | $ | 36,299,986 | | | $ | 25,208,090 | |
| Gross unrealized depreciation | | | (355,827 | ) | | | (2,488,333 | ) | | | (862,270 | ) |
| Net unrealized appreciation | | | 72,665,114 | | | | 33,811,653 | | | | 24,345,820 | |
| Undistributed ordinary income | | | 28,017 | | | | 237,298 | | | | 169,714 | |
| Other gains | | | 6,699,688 | | | | 5,403,370 | | | | 3,156,508 | |
| Total distributable earnings | | $ | 79,392,819 | | | $ | 39,452,321 | | | $ | 27,672,042 | |
The difference between the federal income tax cost and the financial statement cost for the Funds is due to certain timing differences in the recognition of capital gains and losses under income tax regulations and GAAP. These timing differences are temporary in nature and are due to the tax deferral of losses on wash sales and adjustments to basis on publicly traded partnerships.
The Funds recognize the tax benefits or expenses of uncertain tax positions only when the position is “more likely than not” to be sustained assuming examination by tax authorities. Management has reviewed the tax positions taken on Federal income tax returns for all applicable open tax years (tax years ended March 31, 2010 through March 31, 2013) of each Fund and has concluded that no provision for unrecognized tax benefits or expenses is required in these financial statements.
THE DAVENPORT FUNDS
NOTES TO FINANCIAL STATEMENTS (Continued)
3. Investment Transactions
During the six months ended September 30, 2013, the cost of purchases and proceeds from sales and maturities of investment securities, other than short-term investments and U.S. Government securities, totaled $36,826,694 and $24,171,502, respectively, for Davenport Core Fund; $66,443,584 and $37,842,956, respectively, for Davenport Value & Income Fund; and $38,723,118 and $19,310,146, respectively, for Davenport Equity Opportunities Fund.
4. Transactions with Related Parties
INVESTMENT ADVISORY AGREEMENTS
Each Fund’s investments are managed by Davenport & Company LLC (the “Adviser”) under the terms of an Investment Advisory Agreement. Under the Investment Advisory Agreement, each Fund pays the Adviser a fee, which is computed and accrued daily and paid monthly, at an annual rate of .75% on its average daily net assets.
Certain officers of the Trust are also officers of the Adviser.
MUTUAL FUND SERVICES AGREEMENT
Under the terms of a Mutual Fund Services Agreement between the Trust and Ultimus Fund Solutions, LLC (“Ultimus”), Ultimus provides administrative, pricing, accounting, dividend disbursing, shareholder servicing and transfer agent services for the Funds. For these services, Ultimus receives a monthly fee from each Fund at an annual rate of .15% on its average daily net assets up to $25 million, .125% on the next $25 million of such assets and .10% on such assets in excess of $50 million, subject to a minimum monthly fee of $4,500, plus a shareholder recordkeeping fee at the annual rate of $10 per shareholder account in excess of 1,000 accounts. In addition, the Funds pay out-of-pocket expenses including, but not limited to, postage, supplies and costs of pricing the Funds’ portfolio securities.
Certain officers of the Trust are also officers of Ultimus, or of Ultimus Fund Distributors, LLC (the “Distributor”), the principal underwriter of the Funds’ shares and an affiliate of Ultimus. The Distributor is compensated by the Adviser (not the Funds) for acting as principal underwriter.
COMPLIANCE CONSULTING AGREEMENT
Under the terms of a Compliance Consulting Agreement between the Trust and Ultimus, Ultimus provides an individual to serve as the Trust’s Chief Compliance Officer and to administer the Trust’s compliance policies and procedures. For these services, the Funds pay Ultimus an annual base fee of $18,600 plus an asset-based fee equal to 0.01% per annum on the Funds’ aggregate average net assets in excess of $100 million. Each Fund pays its proportionate share of such fee. In addition, the Funds reimburse Ultimus for any reasonable out-of-pocket expenses, if any, incurred in providing these services.
THE DAVENPORT FUNDS
NOTES TO FINANCIAL STATEMENTS (Continued)
COMPENSATION OF TRUSTEES
Trustees and officers affiliated with the Adviser or Ultimus are not compensated by the Trust for their services. Each Trustee who is not an affiliated person of the Adviser or Ultimus receives from the Trust an annual retainer of $10,000, payable quarterly; a fee of $ 1,500 for attendance at each meeting of the Board of Trustees (except that such fee is $2,500 for the independent chairman); and $1,000 for attendance at each meeting of any committee of the Board (except that such fee is $1,500 for the committee chairman); plus reimbursement of travel and other expenses incurred in attending meetings. Prior to July 1, 2013, the annual retainer was $8,000.
5. Sector Risk
If a Fund has significant investments in the securities of issuers in industries within a particular sector, any development affecting that sector will have a greater impact on the value of the net assets of the Fund than would be the case if the Fund did not have significant investments in that sector. In addition, this may increase the risk of loss of an investment in the Fund and increase the volatility of the Fund’s net asset value per share. From time to time, circumstances may affect a particular sector and the companies within such sector. For instance, economic or market factors, regulation or deregulation, or other developments may negatively impact all companies in a particular sector and therefore the value of the Fund’s portfolio would be adversely affected. As of September 30, 2013, Davenport Equity Opportunities Fund had 31.7% and 28.8% of the value of its net assets invested in stocks within the Consumer Discretionary sector and Financials sector, respectively.
6. Contingencies and Commitments
The Funds indemnify the Trust’s officers and Trustees for certain liabilities that might arise from their performance of their duties to the Funds. Additionally, in the normal course of business the Funds enter into contracts that contain a variety of representations and warranties and which provide general indemnifications. The Funds’ maximum exposure under these arrangements is unknown, as this would involve future claims that may be made against the Funds that have not yet occurred. However, based on experience, the Funds expect the risk of loss to be remote.
7. Subsequent Events
The Funds are required to recognize in the financial statements the effects of all subsequent events that provide additional evidence about conditions that existed as of the date of the Statements of Assets and Liabilities. For non-recognized subsequent events that must be disclosed to keep the financial statements from being misleading, the Funds are required to disclose the nature of the event as well as an estimate of its financial effect, or a statement that such an estimate cannot be made. Management has evaluated subsequent events through the issuance of these financial statements and has noted no such events.
THE DAVENPORT FUNDS
YOUR FUNDS’ EXPENSES (Unaudited)
We believe it is important for you to understand the impact of costs on your investment. All mutual funds have operating expenses. As a shareholder of the Funds, you incur ongoing costs, including management fees and other expenses. These ongoing costs, which are deducted from each Fund’s gross income, directly reduce the investment return of the Funds.
A mutual fund’s ongoing costs are expressed as a percentage of its average net assets. This figure is known as the expense ratio. The following examples are intended to help you understand the ongoing costs (in dollars) of investing in the Funds and to compare these costs with the ongoing costs of investing in other mutual funds. The examples below are based on an investment of $1,000 made at the beginning of the period shown and held for the entire period (April 1, 2013 through September 30, 2013).
The table below illustrates each Fund’s ongoing costs in two ways:
Actual fund return – This section helps you to estimate the actual expenses that you paid over the period. The “Ending Account Value” shown is derived from each Fund’s actual return, and the third column shows the dollar amount of operating expenses that would have been paid by an investor who started with $1,000 in the Funds. You may use the information here, together with the amount you invested, to estimate the expenses that you paid over the period.
To do so, simply divide your account value by $1,000 (for example, an $8,600 account value divided by $1,000 = 8.6), then multiply the result by the number given for the Funds under the heading “Expenses Paid During Period.”
Hypothetical 5% return – This section is intended to help you compare each Fund’s ongoing costs with those of other mutual funds. It assumes that each Fund had an annual return of 5% before expenses during the period shown, but that the expense ratio is unchanged. In this case, because the return used is not each Fund’s actual return, the results do not apply to your investment. The example is useful in making comparisons because the Securities and Exchange Commission (“SEC”) requires all mutual funds to calculate expenses based on a 5% return. You can assess each Fund’s ongoing costs by comparing this hypothetical example with the hypothetical examples that appear in shareholder reports of other funds.
Note that expenses shown in the table are meant to highlight and help you compare ongoing costs only. The Funds do not charge transaction fees, such as purchase or redemption fees, nor do they carry a “sales load.”
The calculations assume no shares were bought or sold during the period. Your actual costs may have been higher or lower, depending on the amount of your investment and the timing of any purchases or redemptions.
More information about each Fund’s expenses, including historical annual expense ratios, can be found in this report. For additional information on operating expenses and other shareholder costs, please refer to the Funds’ prospectus.
THE DAVENPORT FUNDS
YOUR FUNDS’ EXPENSES (Unaudited) (Continued)
| Beginning Account Value April 1, 2013 | Ending Account Value Sept. 30, 2013 | Expenses Paid During Period* |
| Based on Actual Fund Return | $1,000.00 | $1,098.60 | $4.95 |
| Based on Hypothetical 5% Return (before expenses) | $1,000.00 | $1,020.36 | $4.76 |
| * | Expenses are equal to Davenport Core Fund’s annualized expense ratio of 0.94% for the period, multiplied by the average account value over the period, multiplied by 183/365 (to reflect the one-half year period). |
Davenport Value & Income Fund | Beginning Account Value April 1, 2013 | Ending Account Value Sept. 30, 2013 | Expenses Paid During Period* |
| Based on Actual Fund Return | $1,000.00 | $1,060.30 | $4.85 |
| Based on Hypothetical 5% Return (before expenses) | $1,000.00 | $1,020.36 | $4.76 |
| * | Expenses are equal to Davenport Value & Income Fund’s annualized expense ratio of 0.94% for the period, multiplied by the average account value over the period, multiplied by 183/365 (to reflect the one-half year period). |
Davenport Equity Opportunities Fund | Beginning Account Value April 1, 2013 | Ending Account Value Sept. 30, 2013 | Expenses Paid During Period* |
| Based on Actual Fund Return | $1,000.00 | $1,085.40 | $5.12 |
| Based on Hypothetical 5% Return (before expenses) | $1,000.00 | $1,020.16 | $4.96 |
| * | Expenses are equal to Davenport Equity Opportunities Fund’s annualized expense ratio of 0.98% for the period, multiplied by the average account value over the period, multiplied by 183/365 (to reflect the one-half year period). |
THE DAVENPORT FUNDS
OTHER INFORMATION (Unaudited)
A description of the policies and procedures that the Funds use to vote proxies relating to portfolio securities is available without charge upon request by calling toll-free 1-800-281-3217, or on the SEC’s website at http://www.sec.gov. Information regarding how the Funds voted proxies relating to portfolio securities during the most recent 12-month period ended June 30 is also available without charge upon request by calling toll-free 1-800-281-3217, or on the SEC’s website at http://www.sec.gov.
The Trust files a complete listing of portfolio holdings for the Funds with the SEC as of the end of the first and third quarters of each fiscal year on Form N-Q. These filings are available upon request by calling 1-800-281-3217. Furthermore, you may obtain a copy of these filings on the SEC’s website at http://www.sec.gov. The Trust’s Forms N-Q may also be reviewed and copied at the SEC’s Public Reference Room in Washington, DC, and information on the operation of the Public Reference Room may be obtained by calling 1-800-SEC-0330.
A complete listing of portfolio holdings for the Funds is updated daily and can be reviewed at the Funds’ website at http://www.investdavenport.com.
| | THE DAVENPORT FUNDS Investment Adviser Davenport & Company LLC One James Center 901 East Cary Street Richmond, Virginia 23219-4037
Administrator Ultimus Fund Solutions, LLC P.O. Box 46707 Cincinnati, Ohio 45246-0707 1-800-281-3217
Custodian US Bank NA 425 Walnut Street Cincinnati, Ohio 45202
Independent Registered Public Accounting Firm Ernst & Young LLP 1900 Scripps Center 312 Walnut Street Cincinnati, Ohio 45202
Legal Counsel Sullivan & Worcester LLP One Post Office Square Boston, Massachusetts 02109
Board of Trustees John P. Ackerly, IV John T. Bruce Robert S. Harris J. Finley Lee, Jr. Richard L. Morrill Harris V. Morrissette
Officers John P. Ackerly, IV, President I. Lee Chapman, IV, Vice President George L. Smith, III, Vice President | |
Davenport & Company LLC
One James Center
901 East Cary Street
Richmond, VA 23219
Member: NYSE • SIPC
Toll Free: (800) 846-6666
www.investdavenport.com
| | | | | | |
| | | | | | | |
| | | | | | | |
| | | | Semi-Annual Report September 30, 2013 (Unaudited)
No-Load Funds | | | |
| | | | | | | |
| | | | | | | |
| | | | | | |
We are pleased to report on your Funds and their investments for the semi-annual period ended September 30, 2013. The first six months of the fiscal year are off to a great start, continuing the trend from late last year. Stocks moved higher during this semi-annual period as the U.S. economy continued to exhibit modest growth, global growth prospects seemed to have improved slightly and investors looked past political posturing in Washington.
Economic and Market Update
The period began with reasonable and steady economic growth in the U.S., but signs of slowing growth in China and other emerging markets surfaced. This perceived weakness resulted in a number of commodities experiencing price declines. Gold, iron ore, copper and aluminum all moved down significantly in the spring and summer. During roughly the same period, the Federal Reserve began to recognize the potential of improving U.S. economic growth based on recoveries in housing, auto and manufacturing. Therefore, the Fed began discussing the timing and scope of scaling back the quantitative easing bond buying program, or QE3. Volatility picked up as the news was unsettling to stock investors, but particularly so for fixed income investors. Bond investors quickly reacted to this potentially new investment landscape, resulting in major dislocations in the fixed income market, especially during June and July. Even with the increased volatility, the S&P 500 Index advanced 2.9% for the three months ended June 30, despite a 5% decline mid-quarter. Broad bond market indexes were down sharply, with the Barclays Government/Credit Index returning -2.5%.
As we moved into the fall, a number of concerns arose. Among the worries were rising interest rates and the impending removal of Federal Reserve stimulus, political concerns in the Middle East centered in Syria, and the ongoing dysfunction in Washington. Rising interest rates had quickly translated into higher mortgage rates which slowed housing sales. Fears of a government shutdown were also being discussed. Recognizing that the economy was not improving at the rate previously expected and fearing that politics in Washington were about to raise their ugly head, the Fed backed off of its taper talk which spurred an equity and bond market rally. The old axiom that the market climbs a wall of worry seems fitting to describe the current environment. Despite the fact that markets sold off of their all-time high levels near the end of September, broad stock market indexes delivered positive results for the September quarter as well with the S&P 500 Index up 5.2%. The bond market was essentially unchanged with the Barclays Government/Credit Index up 0.4%. There was a decided performance shift towards smaller capitalization stocks during this most recent quarter. To illustrate, the Russell 2000 Index, a proxy for small caps, delivered a return of 10.2% for the period while the Dow Jones Industrial Average, comprised of 30 large cap stocks, returned only 2.1%. Therefore, 2013 has so far proven to be a very strong year for stocks with positive returns in all three calendar quarters.
FBP Equity & Dividend Plus Fund Review
FBP Equity & Dividend Plus Fund has enjoyed very attractive results, returning 23.5% over the last twelve months and 7.2% for the semi-annual period ended September 30, 2013. The S&P 500 Index returned 19.3% and 8.3% over the same periods. Materials, Energy and Industrials were among the best performing sectors for the Fund, while Health Care and Consumer Staples were laggards. Some of the more significant portfolio changes for the period were the additions of new positions in Apple, Freeport-McMoRan Copper & Gold, Potash, Rio Tinto and Transocean. These stocks offer well above average dividend yields, and we believe they trade at attractive valuation levels that will allow us to own them for some time. Apple, in addition to its attractive valuation, became the world’s largest dividend payer in the quarter after increasing its dividend at a double-digit pace. We purchased both Freeport-McMoRan and Rio Tinto near the end of the
June following price underperformance due to weak commodity prices. Freeport’s acquisitions of McMoRan Exploration, which it formerly owned, and Plains Exploration will provide the company with diversification away from metals mining. Rio Tinto is one of the largest metal and mining companies in the world with a diverse portfolio of mining assets including iron ore, copper, aluminum, diamonds, and gold. We expect new management to take strategic action to improve shareholder value on top of the 4% dividend yield currently being paid. Potash Corporation of Saskatchewan, a major producer of potash, phosphates and nitrogen used as agricultural fertilizers, was also added. We elected to purchase Potash in the dividend oriented portfolio because it sports a very attractive 4.5% yield. Transocean, a company with a fleet of offshore drilling rigs and a yield nearing 5%, was also added to the Fund. We sold positions in American Electric Power, Avon Products, and H&R Block and Travelers based on valuation. This activity, along with other modest changes to the Fund, has resulted in cash levels rising to just over 11% at period end compared to approximately 3% on March 31st, reflecting a somewhat cautious near term outlook and a little more difficulty in finding attractive candidates to add to the Fund. Going forward we intend to continue to look for high quality companies which are paying sustainable, above average dividends, and are trading at a discount to normal valuations. This combination of yield and attractive valuation should provide shareholders with solid total return potential over time.
FBP Appreciation & Income Opportunities Fund Review
FBP Appreciation & Income Opportunities Fund has also enjoyed very attractive results this year, returning 20.6% over the last twelve months and 7.2% for the semi-annual period ended September 30, 2013. The S&P 500 Index returned 19.3% and 8.3% over the same periods. The Fund’s asset allocation continued to have a positive effect on performance with a higher weight towards equities. The Fund was 77.6% equity, 7.5% fixed income and 14.9% cash at period end. For the semi-annual period, Financials, Materials, and Industrials were among the best performing sectors for the Fund, while Health Care and Utilities were the sector laggards. Some of the more significant portfolio changes for the period were the additions of new positions in Freeport-McMoRan Copper & Gold, IBM, Mosaic, Rio Tinto and Transocean. Freeport McMoRan and Rio Tinto were added in June following stock price declines related to falling gold and commodity prices. The widespread declines in commodity prices over the summer months led to underperformance for the stocks of most mining companies, creating compelling valuations. Freeport’s stock also suffered after an announcement in December that the company was acquiring Plains Exploration and McMoRan Exploration (a former division of the company). The acquisitions help diversify the company away from mining, which we see as a positive, because they each are focused on oil and gas exploration. Rio Tinto, with headquarters in the U.K., has assets across the globe, making it one of the largest metals and mining companies in the world. We believe its diversified product mix including aluminum, copper, diamonds, coal, iron ore and gold help make it attractive for purchase. Mosaic, a major fertilizer company with leading market share in potash and phosphates was added to the Fund. The stock became attractive following news that a European potash pricing cartel had fallen apart, creating fear that potash prices would plummet without the cartel. We believe the stock price decline was a classic case of overreaction. Stocks sold include Martin Marietta Materials and Flextronics, both of which were eliminated following significant stock price advances. We have been positioned for rising interest rates for some time, and the Fund’s short maturity structure paid off this period by staying relatively stable even though interest rates rose over the period.
In conclusion, we are pleased with both the absolute and relative investment results for your Funds for the last few quarters. We have mentioned in prior letters that the U.S. economy has the long-term potential to continue improving. Our belief is based on sustained progress in the domestic housing recovery, a resurgence in North American energy exploration and an increasingly competitive U.S. manufacturing sector. We continue to believe that these positives will provide a tailwind or support for the economy, although the full
positive benefit remains to be felt as the economy is held back by a number of issues. A lack of confidence among individuals and businesses retards spending and investment, thus keeping unemployment stubbornly high. Our political leaders continue to be unable to work together to solve many of the issues of the day. Programs to promote job creation should be front and center, as well as moving to reform entitlements, immigration and taxes.
Going forward we continue to seek investments in companies that are trading at discounts to their normal valuations, that we believe have promising business outlooks and will be returning cash to shareholders through either dividends or share repurchases. Overall, companies are managing their business very well in the slow growth economy we are experiencing and continue to produce solid earnings gains. Valuation on the market has expanded but is still reasonable at approximately 14 times 2014 earnings estimates.
We want to thank you for your continued support and investment in the Flippin, Bruce & Porter Funds. Please visit our website at www.fbpfunds.com for information on your Funds and the investment philosophy and process we utilize to achieve their investment objectives.
John T. Bruce, CFA
President - Portfolio Manager
November 4, 2013
Data presented reflects past performance, which is no guarantee of future results. Investment results and principal value will fluctuate so that shares, when redeemed, may be worth more or less than their original cost. Due to market volatility, current performance may be higher or lower than the performance shown. Updated performance information, current through the most recent month-end, is available by contacting the Funds at 1-866-738-1127.
This report is submitted for the general information of the shareholders of the Funds. It reflects our views, opinions and portfolio holdings as of September 30, 2013, the end of the reporting period. These views are subject to change at any time based upon market or other conditions. For more current information throughout the year please visit www.fbpfunds.com or call the Funds at 1-866-738-1127. This report is not authorized for distribution to prospective investors in the Funds unless accompanied by a current prospectus. Distributed by Ultimus Fund Distributors, LLC.
THE FLIPPIN, BRUCE & PORTER FUNDS
COMPARATIVE PERFORMANCE CHARTS
(Unaudited)
Performance for each Fund is compared to the most appropriate broad-based index, the S&P 500® Index, an unmanaged index of 500 large common stocks. Results are also compared to the Consumer Price Index, a measure of inflation.
THE FLIPPIN, BRUCE & PORTER FUNDS
COMPARATIVE PERFORMANCE CHARTS
(Unaudited) (Continued)
Average Annual Total Returns(a) (for periods ended September 30, 2013) |
| | 1 Year | 5 Years | 10 Years |
| FBP Equity & Dividend Plus Fund | 23.46% | 6.15% | 4.27% |
| FBP Appreciation & Income Opportunities Fund | 20.63% | 7.25% | 5.10% |
Standard & Poor’s 500® Index | 19.34% | 10.02% | 7.57% |
| Consumer Price Index | 1.52% | 1.32% | 2.47% |
| (a) | Total returns are a measure of the change in value of an investment in the Funds over the periods covered, which assumes any dividends or capital gains distributions are reinvested in shares of the Funds. Returns do not reflect the deduction of taxes a shareholder would pay on the Funds’ distributions or the redemption of Fund shares. |
FBP EQUITY & DIVIDEND PLUS FUND
PORTFOLIO INFORMATION
September 30, 2013 (Unaudited)
| | | Asset Allocation (% of Net Assets) |
| Net Asset Value Per Share | $23.01 | |
| Total Net Assets (Millions) | $25.5 |
| Current Expense Ratio | 1.07% |
| Portfolio Turnover | 11% |
| Fund Inception Date | 7/30/1993 |
| | | |
| FBP Equity & Dividend Plus Fund | |
| Number of Stocks | 48 | 500 |
| Weighted Avg Market Capitalization (Billions) | $85.5 | $106.1 |
| Price-to-Earnings Ratio (Bloomberg 1 Yr. Forecast EPS) | 11.5 | 13.6 |
| Price-to-Book Value | 1.9 | 2.3 |
Sector Diversification vs. the S&P 500® Index |
| Ten Largest Equity Holdings | % of Net Assets |
| JPMorgan Chase & Company | 3.4% |
| ConocoPhillips | 3.3% |
| Royal Dutch Shell plc - Class A - ADR | 3.1% |
| Microsoft Corporation | 2.8% |
| PepsiCo, Inc. | 2.7% |
| Johnson & Johnson | 2.7% |
| Chevron Corporation | 2.7% |
| General Electric Company | 2.5% |
| Procter & Gamble Company (The) | 2.5% |
| Hewlett-Packard Company | 2.5% |
FBP APPRECIATION & INCOME OPPORTUNITIES FUND
PORTFOLIO INFORMATION
September 30, 2013 (Unaudited)
| | Asset Allocation (% of Net Assets) |
| Net Asset Value Per Share | $17.80 | |
| Total Net Assets (Millions) | $38.2 |
| Current Expense Ratio | 1.00% |
| Portfolio Turnover | 6% |
| Fund Inception Date | 7/3/1989 |
| | |
| | | |
| | | |
| | | |
| | | |
| | | |
| | | |
| | | |
| | | |
Common Stock Portfolio (78.4% of Net Assets) |
| Number of Stocks | 56 |
| Weighted Avg Market Capitalization (Billions) | $82.4 |
| Price-to-Earnings Ratio (Bloomberg 1 Yr. Forecast EPS) | 10.9 |
| Price-to-Book Value | 1.6 |
Ten Largest Equity Holdings | |
| JPMorgan Chase & Company | 2.8% |
| Bank of America Corporation | 2.5% |
| MetLife, Inc. | 2.5% |
| Cisco Systems, Inc. | 2.4% |
| ConocoPhillips | 2.3% |
| Johnson & Johnson | 2.3% |
| Microsoft Corporation | 2.3% |
| Lincoln National Corporation | 2.2% |
| Pfizer, Inc. | 2.1% |
| Sealed Air Corporation | 2.1% |
| |
| Financials | 16.9% |
| Information Technology | 12.8% |
| Energy | 10.4% |
| Industrials | 9.6% |
| Materials | 8.7% |
Fixed-Income Portfolio (7.6% of Net Assets) |
| Number of Fixed-Income Securities | 5 |
| Average Quality | BBB+ |
| Average Weighted Maturity | 1.6 yrs. |
| Average Effective Duration | 1.6 yrs. |
| |
| Corporate Bonds - Financials | 3.4% |
| Corporate Bonds - Industrials | 3.4% |
| Municipal Bonds | 0.8% |
FBP EQUITY & DIVIDEND PLUS FUND
SCHEDULE OF INVESTMENTS
September 30, 2013 (Unaudited)
| | | | | | |
| Consumer Discretionary — 5.2% | | | | | | |
Best Buy Company, Inc. (a) | | | 11,000 | | | $ | 412,500 | |
| Kohl's Corporation | | | 9,000 | | | | 465,750 | |
| Staples, Inc. | | | 30,000 | | | | 439,500 | |
| | | | | | | | 1,317,750 | |
| Consumer Staples — 10.1% | | | | | | | | |
| Coca-Cola Company (The) | | | 10,000 | | | | 378,800 | |
| ConAgra Foods, Inc. | | | 16,400 | | | | 497,576 | |
PepsiCo, Inc. (a) | | | 8,800 | | | | 699,600 | |
| Procter & Gamble Company (The) | | | 8,500 | | | | 642,515 | |
| Sysco Corporation | | | 11,000 | | | | 350,130 | |
| | | | | | | | 2,568,621 | |
| Energy — 11.5% | | | | | | | | |
| Chevron Corporation | | | 5,700 | | | | 692,550 | |
ConocoPhillips (a) | | | 12,200 | | | | 848,022 | |
| Occidental Petroleum Corporation | | | 4,000 | | | | 374,160 | |
| Royal Dutch Shell plc - Class A - ADR | | | 12,000 | | | | 788,160 | |
| Transocean Ltd. | | | 5,500 | | | | 244,750 | |
| | | | | | | | 2,947,642 | |
| Financials — 11.8% | | | | | | | | |
Bank of Hawaii Corporation (a) | | | 6,000 | | | | 326,700 | |
| Bank of New York Mellon Corporation (The) | | | 11,400 | | | | 344,166 | |
| BB&T Corporation | | | 10,000 | | | | 337,500 | |
| JPMorgan Chase & Company | | | 17,000 | | | | 878,730 | |
| Manulife Financial Corporation | | | 20,000 | | | | 331,200 | |
| People's United Financial, Inc. | | | 23,000 | | | | 330,740 | |
Prudential Financial, Inc. (a) | | | 6,000 | | | | 467,880 | |
| | | | | | | | 3,016,916 | |
| Health Care — 7.4% | | | | | | | | |
Johnson & Johnson (a) | | | 8,000 | | | | 693,520 | |
| Merck & Company, Inc. | | | 12,800 | | | | 609,408 | |
| Pfizer, Inc. | | | 20,000 | | | | 574,200 | |
| | | | | | | | 1,877,128 | |
| Industrials — 11.5% | | | | | | | | |
| 3M Company | | | 2,800 | | | | 334,348 | |
Avery Dennison Corporation (a) | | | 9,500 | | | | 413,440 | |
Emerson Electric Company (a) | | | 8,300 | | | | 537,010 | |
| General Electric Company | | | 27,000 | | | | 645,030 | |
| Royal Philips N.V. - ADR | | | 14,892 | | | | 480,267 | |
Norfolk Southern Corporation (a) | | | 3,600 | | | | 278,460 | |
| R.R. Donnelley & Sons Company | | | 16,000 | | | | 252,800 | |
| | | | | | | | 2,941,355 | |
| Information Technology — 16.4% | | | | | | | | |
| Apple, Inc. | | | 1,150 | | | | 548,262 | |
| Applied Materials, Inc. | | | 30,000 | | | | 526,200 | |
| Cisco Systems, Inc. | | | 24,800 | | | | 580,816 | |
Computer Sciences Corporation (a) | | | 10,000 | | | | 517,400 | |
FBP EQUITY & DIVIDEND PLUS FUND
SCHEDULE OF INVESTMENTS (Continued)
COMMON STOCKS — 89.9% (Continued) | | | | | | |
| Information Technology — 16.4% (Continued) | | | | | | |
| Dell, Inc. | | | 22,300 | | | $ | 307,071 | |
| Hewlett-Packard Company | | | 30,000 | | | | 629,400 | |
| Intel Corporation | | | 16,000 | | | | 366,720 | |
Microsoft Corporation (a) | | | 21,500 | | | | 716,165 | |
| | | | | | | | 4,192,034 | |
| Materials — 10.5% | | | | | | | | |
| E.I. du Pont de Nemours and Company | | | 5,000 | | | | 292,800 | |
| Freeport-McMoRan Copper & Gold, Inc. | | | 8,400 | | | | 277,872 | |
Nucor Corporation (a) | | | 10,000 | | | | 490,200 | |
| Potash Corporation of Saskatchewan, Inc. | | | 8,400 | | | | 262,752 | |
| Rio Tinto plc - ADR | | | 8,600 | | | | 419,336 | |
Sealed Air Corporation (a) | | | 20,000 | | | | 543,800 | |
| Sonoco Products Company | | | 10,000 | | | | 389,400 | |
| | | | | | | | 2,676,160 | |
| Telecommunication Services — 1.7% | | | | | | | | |
| AT&T, Inc. | | | 13,000 | | | | 439,660 | |
| | | | | | | | | |
| Utilities — 3.8% | | | | | | | | |
| FirstEnergy Corporation | | | 14,100 | | | | 513,945 | |
| PPL Corporation | | | 15,300 | | | | 464,814 | |
| | | | | | | | 978,759 | |
| | | | | | | | | |
Total Common Stocks (Cost $17,653,134) | | | | | | $ | 22,956,025 | |
MONEY MARKET FUNDS — 11.1% | | | | | | |
Fidelity Institutional Money Market Government Portfolio - Class I, 0.01% (b) | | | 2,489,649 | | | $ | 2,489,649 | |
First American Government Obligations Fund - Class Z, 0.01% (b) | | | 346,798 | | | | 346,798 | |
Total Money Market Funds (Cost $2,836,447) | | | | | | $ | 2,836,447 | |
| | | | | | | | | |
Total Investments at Value — 101.0% (Cost $20,489,581) | | | | | | $ | 25,792,472 | |
| | | | | | | | | |
| Liabilities in Excess of Other Assets — (1.0%) | | | | | | | (244,458 | ) |
| | | | | | | | | |
| Net Assets — 100.0% | | | | | | $ | 25,548,014 | |
| ADR - American Depositary Receipt. |
| |
| (a) | Security covers a written call option. |
| | |
| (b) | The rate shown is the 7-day effective yield as of September 30, 2013. |
| | |
| See accompanying notes to financial statements. |
FBP EQUITY & DIVIDEND PLUS FUND
SCHEDULE OF OPEN OPTION CONTRACTS
September 30, 2013 (Unaudited)
| | | | | | | | | |
| Avery Dennison Corporation, | | | | | | | | | |
| 10/19/2013 at $45 | | | 95 | | | $ | 3,800 | | | $ | 14,440 | |
| Bank of Hawaii Corporation, | | | | | | | | | | | | |
| 10/19/2013 at $50 | | | 60 | | | | 28,200 | | | | 13,220 | |
| Best Buy Company, Inc., | | | | | | | | | | | | |
| 01/18/2014 at $35 | | | 110 | | | | 50,600 | | | | 28,147 | |
| Computer Sciences Corporation, | | | | | | | | | | | | |
| 01/18/2014 at $35 | | | 50 | | | | 87,500 | | | | 13,599 | |
| 01/18/2014 at $48 | | | 50 | | | | 28,500 | | | | 13,350 | |
| ConocoPhillips, | | | | | | | | | | | | |
| 02/22/2014 at $70 | | | 50 | | | | 12,050 | | | | 10,486 | |
| Emerson Electric Company, | | | | | | | | | | | | |
| 03/22/2014 at $70 | | | 43 | | | | 5,375 | | | | 7,718 | |
| Johnson & Johnson, | | | | | | | | | | | | |
| 01/18/2014 at $92.5 | | | 26 | | | | 1,846 | | | | 5,512 | |
| Microsoft Corporation, | | | | | | | | | | | | |
| 04/19/2014 at $35 | | | 90 | | | | 11,610 | | | | 18,857 | |
| Norfolk Southern Company, | | | | | | | | | | | | |
| 01/18/2014 at $85 | | | 36 | | | | 2,520 | | | | 7,096 | |
| Nucor Corporation, | | | | | | | | | | | | |
| 04/19/2014 at $55 | | | 48 | | | | 5,136 | | | | 6,000 | |
| PepsiCo, Inc., | | | | | | | | | | | | |
| 01/18/2014 at $87.5 | | | 30 | | | | 1,350 | | | | 4,910 | |
| Prudential Financial, Inc., | | | | | | | | | | | | |
| 03/22/2014 at $87.5 | | | 30 | | | | 5,400 | | | | 7,860 | |
| Sealed Air Corporation, | | | | | | | | | | | | |
| 01/18/2014 at $25 | | | 60 | | | | 18,540 | | | | 10,942 | |
| 01/18/2014 at $30 | | | 70 | | | | 5,250 | | | | 13,440 | |
| | | | | | | $ | 267,677 | | | $ | 175,577 | |
| See accompanying notes to financial statements. |
FBP APPRECIATION & INCOME OPPORTUNITIES FUND
SCHEDULE OF INVESTMENTS
September 30, 2013 (Unaudited)
| | | | | | |
| Consumer Discretionary — 3.5% | | | | | | |
Best Buy Company, Inc. (a) | | | 10,000 | | | $ | 375,000 | |
Kohl's Corporation (a) | | | 9,500 | | | | 491,625 | |
| Staples, Inc. | | | 31,000 | | | | 454,150 | |
| | | | | | | | 1,320,775 | |
| Consumer Staples — 6.8% | | | | | | | | |
Archer-Daniels-Midland Company (a) | | | 16,000 | | | | 589,440 | |
Avon Products, Inc. (a) | | | 24,000 | | | | 494,400 | |
CVS Caremark Corporation (a) | | | 9,000 | | | | 510,750 | |
PepsiCo, Inc. (a) | | | 4,200 | | | | 333,900 | |
Walgreen Company (a) | | | 6,000 | | | | 322,800 | |
Wal-Mart Stores, Inc. (a) | | | 4,500 | | | | 332,820 | |
| | | | | | | | 2,584,110 | |
| Energy — 10.4% | | | | | | | | |
Baker Hughes, Inc. (a) | | | 11,000 | | | | 540,100 | |
| Chevron Corporation | | | 5,000 | | | | 607,500 | |
ConocoPhillips (a) | | | 12,500 | | | | 868,875 | |
| Devon Energy Corporation | | | 11,000 | | | | 635,360 | |
| Occidental Petroleum Corporation | | | 4,200 | | | | 392,868 | |
| Royal Dutch Shell plc - Class A - ADR | | | 11,000 | | | | 722,480 | |
| Transocean Ltd. | | | 5,000 | | | | 222,500 | |
| | | | | | | | 3,989,683 | |
| Financials — 16.9% | | | | | | | | |
| Bank of America Corporation | | | 69,000 | | | | 952,200 | |
| Bank of New York Mellon Corporation (The) | | | 20,000 | | | | 603,800 | |
| Capital One Financial Corporation | | | 4,000 | | | | 274,960 | |
| Comerica, Inc. | | | 13,000 | | | | 511,030 | |
| JPMorgan Chase & Company | | | 21,000 | | | | 1,085,490 | |
Lincoln National Corporation (a) | | | 20,000 | | | | 839,800 | |
| Manulife Financial Corporation | | | 24,000 | | | | 397,440 | |
| MetLife, Inc. | | | 20,000 | | | | 939,000 | |
| People's United Financial, Inc. | | | 18,000 | | | | 258,840 | |
| Travelers Companies, Inc. (The) | | | 7,000 | | | | 593,390 | |
| | | | | | | | 6,455,950 | |
| Health Care — 6.1% | | | | | | | | |
| Johnson & Johnson | | | 10,000 | | | | 866,900 | |
| Merck & Company, Inc. | | | 14,000 | | | | 666,540 | |
| Pfizer, Inc. | | | 28,000 | | | | 803,880 | |
| | | | | | | | 2,337,320 | |
| Industrials — 9.6% | | | | | | | | |
Avery Dennison Corporation (a) | | | 14,500 | | | | 631,040 | |
FedEx Corporation (a) | | | 5,400 | | | | 616,194 | |
| General Electric Company | | | 17,000 | | | | 406,130 | |
Ingersoll-Rand plc (a) | | | 9,500 | | | | 616,930 | |
| Royal Philips N.V. - ADR | | | 16,547 | | | | 533,641 | |
| Lockheed Martin Corporation | | | 2,400 | | | | 306,120 | |
FBP APPRECIATION & INCOME OPPORTUNITIES FUND
SCHEDULE OF INVESTMENTS (Continued)
COMMON STOCKS — 78.4% (Continued) | | | | | | |
| Industrials — 9.6% (Continued) | | | | | | |
Norfolk Southern Corporation (a) | | | 4,000 | | | $ | 309,400 | |
| R.R. Donnelley & Sons Company | | | 16,000 | | | | 252,800 | |
| | | | | | | | 3,672,255 | |
| Information Technology — 12.8% | | | | | | | | |
| Apple, Inc. | | | 1,200 | | | | 572,100 | |
Cisco Systems, Inc. (a) | | | 40,000 | | | | 936,800 | |
Computer Sciences Corporation (a) | | | 10,000 | | | | 517,400 | |
| Dell, Inc. | | | 35,000 | | | | 481,950 | |
Hewlett-Packard Company (a) | | | 29,000 | | | | 608,420 | |
| Intel Corporation | | | 10,000 | | | | 229,200 | |
| International Business Machines Corporation | | | 1,300 | | | | 240,734 | |
Microsoft Corporation (a) | | | 26,000 | | | | 866,060 | |
| Western Union Company (The) | | | 23,000 | | | | 429,180 | |
| | | | | | | | 4,881,844 | |
| Materials — 8.7% | | | | | | | | |
| E.I. du Pont de Nemours and Company | | | 12,000 | | | | 702,720 | |
| Freeport-McMoRan Copper & Gold, Inc. | | | 9,000 | | | | 297,720 | |
| Mosaic Company (The) | | | 6,000 | | | | 258,120 | |
| Nucor Corporation | | | 8,000 | | | | 392,160 | |
| Rio Tinto plc - ADR | | | 9,000 | | | | 438,840 | |
Sealed Air Corporation (a) | | | 29,000 | | | | 788,510 | |
| Sonoco Products Company | | | 12,000 | | | | 467,280 | |
| | | | | | | | 3,345,350 | |
| Telecommunication Services — 1.3% | | | | | | | | |
| AT&T, Inc. | | | 15,000 | | | | 507,300 | |
| | | | | | | | | |
| Utilities — 2.3% | | | | | | | | |
| FirstEnergy Corporation | | | 13,000 | | | | 473,850 | |
| PPL Corporation | | | 14,000 | | | | 425,320 | |
| | | | | | | | 899,170 | |
| | | | | | | | | |
Total Common Stocks (Cost $21,109,679) | | | | | | $ | 29,993,757 | |
| | | | | | |
| Financials — 3.4% | | | | | | |
| Berkley (W.R.) Corporation, 5.60%, due 05/15/2015 | | $ | 750,000 | | | $ | 794,271 | |
| Prudential Financial, Inc., 3.00%, due 05/12/2016 | | | 500,000 | | | | 522,726 | |
| | | | | | | | 1,316,997 | |
| Industrials — 3.4% | | | | | | | | |
| Eaton Corporation, 5.95%, due 03/20/2014 | | | 750,000 | | | | 769,111 | |
| Equifax, Inc., 4.45%, due 12/01/2014 | | | 500,000 | | | | 519,475 | |
| | | | | | | | 1,288,586 | |
| | | | | | | | | |
Total Corporate Bonds (Cost $2,532,167) | | | | | | $ | 2,605,583 | |
FBP APPRECIATION & INCOME OPPORTUNITIES FUND
SCHEDULE OF INVESTMENTS (Continued)
| | | | | | |
| Wise Co., Virginia, Industrial Dev. Authority, Revenue, | | | | | | |
| 1.70%, due 02/01/2017 (Cost $298,743) | | $ | 300,000 | | | $ | 291,450 | |
MONEY MARKET FUNDS — 15.0% | | | | | | |
Fidelity Institutional Money Market Government Portfolio - Class I, 0.01% (b) | | | 3,738,426 | | | $ | 3,738,426 | |
First American Government Obligations Fund - Class Z, 0.01% (b) | | | 2,005,917 | | | | 2,005,917 | |
Total Money Market Funds (Cost $5,744,343) | | | | | | $ | 5,744,343 | |
| | | | | | | | | |
Total Investments at Value — 101.0% (Cost $29,684,932) | | | | �� | | $ | 38,635,133 | |
| | | | | | | | | |
| Liabilities in Excess of Other Assets — (1.0%) | | | | | | | (387,028 | ) |
| | | | | | | | | |
| Net Assets — 100.0% | | | | | | $ | 38,248,105 | |
| ADR - American Depositary Receipt. |
| |
| (a) | Security covers a written call option. |
| | |
| (b) | The rate shown is the 7-day effective yield as of September 30, 2013. |
| | |
| See accompanying notes to financial statements. |
FBP APPRECIATION & INCOME OPPORTUNITIES FUND
SCHEDULE OF OPEN OPTION CONTRACTS
September 30, 2013 (Unaudited)
| | | | | | | | | |
| Archer-Daniels-Midland Company, | | | | | | | | | |
| 01/18/2014 at $37 | | | 80 | | | $ | 14,400 | | | $ | 9,040 | |
| Avery Dennison Corporation, | | | | | | | | | | | | |
| 10/19/2013 at $45 | | | 50 | | | | 2,000 | | | | 9,100 | |
| Avon Products, Inc., | | | | | | | | | | | | |
| 10/19/2013 at $25 | | | 60 | | | | 300 | | | | 7,657 | |
| Baker Hughes, Inc., | | | | | | | | | | | | |
| 01/18/2014 at $50 | | | 20 | | | | 4,360 | | | | 4,039 | |
| 01/18/2014 at $55 | | | 30 | | | | 2,010 | | | | 3,660 | |
| Best Buy Company, Inc., | | | | | | | | | | | | |
| 01/18/2014 at $35 | | | 50 | | | | 23,000 | | | | 7,550 | |
| 03/22/2014 at $37 | | | 50 | | | | 21,750 | | | | 11,850 | |
| Cisco Systems, Inc., | | | | | | | | | | | | |
| 01/18/2014 at $27 | | | 50 | | | | 850 | | | | 6,350 | |
| Computer Sciences Corporation, | | | | | | | | | | | | |
| 01/18/2014 at $35 | | | 50 | | | | 87,500 | | | | 13,599 | |
| 01/18/2014 at $55 | | | 25 | | | | 4,900 | | | | 6,175 | |
| 03/22/2014 at $55 | | | 25 | | | | 7,125 | | | | 8,991 | |
| ConocoPhillips, | | | | | | | | | | | | |
| 02/22/2014 at $70 | | | 50 | | | | 12,050 | | | | 10,486 | |
| CVS Caremark Corporation, | | | | | | | | | | | | |
| 11/16/2013 at $62.5 | | | 15 | | | | 285 | | | | 3,180 | |
| FedEx Corporation, | | | | | | | | | | | | |
| 01/18/2014 at $110 | | | 28 | | | | 22,960 | | | | 12,235 | |
| Hewlett-Packard Company, | | | | | | | | | | | | |
| 01/18/2014 at $20 | | | 50 | | | | 10,500 | | | | 6,599 | |
| Ingersoll-Rand plc, | | | | | | | | | | | | |
| 01/18/2014 at $57.5 | | | 25 | | | | 21,000 | | | | 5,799 | |
| 01/18/2014 at $62.5 | | | 25 | | | | 12,000 | | | | 6,675 | |
| 03/22/2014 at $67.5 | | | 25 | | | | 8,000 | | | | 5,675 | |
| Kohl's Corporation, | | | | | | | | | | | | |
| 01/18/2014 at $55 | | | 10 | | | | 1,220 | | | | 2,020 | |
| Lincoln National Corporation, | | | | | | | | | | | | |
| 01/18/2014 at $45 | | | 25 | | | | 3,500 | | | | 5,650 | |
| Microsoft Corporation, | | | | | | | | | | | | |
| 04/19/2014 at $35 | | | 90 | | | | 11,610 | | | | 18,857 | |
| Norfolk Southern Company, | | | | | | | | | | | | |
| 01/18/2014 at $85 | | | 40 | | | | 2,800 | | | | 7,884 | |
| PepsiCo, Inc., | | | | | | | | | | | | |
| 01/18/2014 at $87.5 | | | 14 | | | | 630 | | | | 2,716 | |
| Sealed Air Corporation, | | | | | | | | | | | | |
| 01/18/2014 at $30 | | | 90 | | | | 6,750 | | | | 17,280 | |
| Walgreen Company, | | | | | | | | | | | | |
| 10/19/2013 at $47 | | | 60 | | | | 42,000 | | | | 11,220 | |
| Wal-Mart Stores, Inc., | | | | | | | | | | | | |
| 12/21/2013 at $80 | | | 10 | | | | 230 | | | | 1,830 | |
| | | | | | | $ | 323,730 | | | $ | 206,117 | |
| See accompanying notes to financial statements. |
THE FLIPPIN, BRUCE & PORTER FUNDS
STATEMENTS OF ASSETS AND LIABILITIES
September 30, 2013 (Unaudited)
| | FBP Equity & Dividend Plus Fund | | | FBP Appreciation & Income Opportunities Fund | |
| ASSETS | | | | | | |
| Investments in securities: | | | | | | |
| At acquisition cost | | $ | 20,489,581 | | | $ | 29,684,932 | |
| At value (Note 2) | | $ | 25,792,472 | | | $ | 38,635,133 | |
| Cash | | | — | | | | 1,995 | |
| Dividends and interest receivable | | | 38,199 | | | | 68,805 | |
| Receivable for capital shares sold | | | 2,909 | | | | — | |
| Other assets | | | 6,200 | | | | 4,598 | |
| TOTAL ASSETS | | | 25,839,780 | | | | 38,710,531 | |
| | | | | | | | | |
| LIABILITIES | | | | | | | | |
Covered call options, at value (Notes 2 and 5)
(premiums received $175,577 and $206,117, respectively) | | | 267,677 | | | | 323,730 | |
| Distributions payable | | | 2,805 | | | | 15,450 | |
| Payable for capital shares redeemed | | | 118 | | | | 90,911 | |
| Accrued investment advisory fees (Note 4) | | | 9,606 | | | | 19,535 | |
| Payable to administrator (Note 4) | | | 5,200 | | | | 5,200 | |
| Other accrued expenses | | | 6,360 | | | | 7,600 | |
| TOTAL LIABILITIES | | | 291,766 | | | | 462,426 | |
| | | | | | | | | |
| NET ASSETS | | $ | 25,548,014 | | | $ | 38,248,105 | |
| | | | | | | | | |
| Net assets consist of: | | | | | | | | |
| Paid-in capital | | $ | 21,203,954 | | | $ | 28,854,808 | |
Undistributed (distributions in excess of)
net investment income | | | 160 | | | | (4,140 | ) |
Accumulated net realized gains (losses)
from security transactions | | | (866,891 | ) | | | 564,849 | |
| Net unrealized appreciation (depreciation) on: | | | | | | | | |
| Investments | | | 5,302,891 | | | | 8,950,201 | |
| Option contracts | | | (92,100 | ) | | | (117,613 | ) |
| Net assets | | $ | 25,548,014 | | | $ | 38,248,105 | |
| | | | | | | | | |
Shares of beneficial interest outstanding
(unlimited number of shares authorized, $0.01 par value) | | | 1,110,225 | | | | 2,148,539 | |
| | | | | | | | | |
Net asset value, offering price and
redemption price per share (Note 2) | | $ | 23.01 | | | $ | 17.80 | |
| See accompanying notes to financial statements. |
THE FLIPPIN, BRUCE & PORTER FUNDS
STATEMENTS OF OPERATIONS
Six Months Ended September 30, 2013 (Unaudited)
| | FBP Equity & Dividend Plus Fund | | | FBP Appreciation & Income Opportunities Fund | |
| INVESTMENT INCOME | | | | | | |
| Dividends | | $ | 357,881 | | | $ | 402,358 | |
| Foreign withholding taxes on dividends | | | (5,922 | ) | | | (6,243 | ) |
| Interest | | | — | | | | 70,751 | |
| TOTAL INVESTMENT INCOME | | | 351,959 | | | | 466,866 | |
| | | | | | | | | |
| EXPENSES | | | | | | | | |
| Investment advisory fees (Note 4) | | | 85,240 | | | | 133,828 | |
| Administration fees (Note 4) | | | 27,000 | | | | 27,365 | |
| Registration and filing fees | | | 7,350 | | | | 5,240 | |
| Professional fees | | | 5,672 | | | | 5,832 | |
| Compliance service fees and expenses (Note 4) | | | 4,632 | | | | 4,632 | |
| Custodian and bank service fees | | | 4,034 | | | | 4,388 | |
| Trustees’ fees and expenses (Note 4) | | | 3,956 | | | | 3,956 | |
| Printing of shareholder reports | | | 4,437 | | | | 2,926 | |
| Postage and supplies | | | 2,259 | | | | 1,651 | |
| Insurance expense | | | 888 | | | | 1,361 | |
| Other expenses | | | 2,960 | | | | 3,967 | |
| TOTAL EXPENSES | | | 148,428 | | | | 195,146 | |
| Fees voluntarily waived by the Adviser (Note 4) | | | (18,133 | ) | | | (3,963 | ) |
| NET EXPENSES | | | 130,295 | | | | 191,183 | |
| | | | | | | | | |
| NET INVESTMENT INCOME | | | 221,664 | | | | 275,683 | |
| | | | | | | | | |
REALIZED AND UNREALIZED GAINS
(LOSSES) ON INVESTMENTS | | | | | | | | |
| Net realized gains (losses) from: | | | | | | | | |
| Security transactions | | | 765,798 | | | | 797,534 | |
| Option contracts (Note 5) | | | (156,401 | ) | | | (175,771 | ) |
| Net change in unrealized appreciation/depreciation on: | | | | | | | | |
| Investments | | | 577,141 | | | | 1,714,204 | |
| Option contracts (Note 5) | | | 204,281 | | | | 19,006 | |
| | | | | | | | | |
NET REALIZED AND UNREALIZED
GAINS ON INVESTMENTS | | | 1,390,819 | | | | 2,354,973 | |
| | | | | | | | | |
NET INCREASE IN NET ASSETS
FROM OPERATIONS | | $ | 1,612,483 | | | $ | 2,630,656 | |
| See accompanying notes to financial statements. |
THE FLIPPIN, BRUCE & PORTER FUNDS
STATEMENTS OF CHANGES IN NET ASSETS
| | | FBP Equity & Dividend Plus Fund | | | FBP Appreciation & Income Opportunities Fund | |
| | Six Months Ended Sept. 30, 2013 (Unaudited) | | | | | | Six Months Ended Sept. 30, 2013 (Unaudited) | | | | |
| FROM OPERATIONS | | | | | | | | | | | | |
| Net investment income | | $ | 221,664 | | | $ | 523,466 | | | $ | 275,683 | | | $ | 638,339 | |
| Net realized gains (losses) from: | | | | | | | | | | | | | | | | |
| Security transactions | | | 765,798 | | | | 519,446 | | | | 797,534 | | | | 1,954,011 | |
| Option contracts (Note 5) | | | (156,401 | ) | | | 43,281 | | | | (175,771 | ) | | | 82,796 | |
Net realized gains from in-kind
redemptions (Note 2) | | | — | | | | — | | | | — | | | | 149,541 | |
Net change in unrealized
appreciation/depreciation on: | | | | | | | | | | | | | | | | |
| Investments | | | 577,141 | | | | 2,435,149 | | | | 1,714,204 | | | | 1,160,720 | |
| Option contracts (Note 5) | | | 204,281 | | | | (272,339 | ) | | | 19,006 | | | | (84,990 | ) |
| Net increase in net assets from operations | | | 1,612,483 | | | | 3,249,003 | | | | 2,630,656 | | | | 3,900,417 | |
| | | | | | | | | | | | | | | | | |
| DISTRIBUTIONS TO SHAREHOLDERS | | | | | | | | | | | | | | | | |
| From net investment income | | | (221,946 | ) | | | (520,286 | ) | | | (286,389 | ) | | | (665,559 | ) |
From net realized gains from
security transactions | | | — | | | | — | | | | (927,003 | ) | | | (626,479 | ) |
Decrease in net assets from
distributions to shareholders | | | (221,946 | ) | | | (520,286 | ) | | | (1,213,392 | ) | | | (1,292,038 | ) |
| | | | | | | | | | | | | | | | | |
| FROM CAPITAL SHARE TRANSACTIONS | | | | | | | | | | | | | | | | |
| Proceeds from shares sold | | | 1,966,425 | | | | 1,432,990 | | | | 318,342 | | | | 1,092,453 | |
Net asset value of shares issued in
reinvestment of distributions to
shareholders | | | 215,764 | | | | 504,248 | | | | 1,115,978 | | | | 1,171,415 | |
| Payments for shares redeemed | | | (594,676 | ) | | | (5,289,545 | ) | | | (1,428,581 | ) | | | (7,567,218 | ) |
Net increase (decrease) in net assets
from capital share transactions | | | 1,587,513 | | | | (3,352,307 | ) | | | 5,739 | | | | (5,303,350 | ) |
| | | | | | | | | | | | | | | | | |
TOTAL INCREASE (DECREASE)
IN NET ASSETS | | | 2,978,050 | | | | (623,590 | ) | | | 1,423,003 | | | | (2,694,971 | ) |
| | | | | | | | | | | | | | | | | |
| NET ASSETS | | | | | | | | | | | | | | | | |
| Beginning of period | | | 22,569,964 | | | | 23,193,554 | | | | 36,825,102 | | | | 39,520,073 | |
| End of period | | $ | 25,548,014 | | | $ | 22,569,964 | | | $ | 38,248,105 | | | $ | 36,825,102 | |
| | | | | | | | | | | | | | | | | |
UNDISTRIBUTED (DISTRIBUTIONS
IN EXCESS OF) NET
INVESTMENT INCOME | | $ | 160 | | | $ | 442 | | | $ | (4,140 | ) | | $ | (50,309 | ) |
| | | | | | | | | | | | | | | | | |
| CAPITAL SHARE ACTIVITY | | | | | | | | | | | | | | | | |
| Shares sold | | | 85,125 | | | | 74,836 | | | | 17,914 | | | | 68,122 | |
| Shares reinvested | | | 9,532 | | | | 26,081 | | | | 64,728 | | | | 75,820 | |
| Shares redeemed | | | (25,927 | ) | | | (273,612 | ) | | | (80,038 | ) | | | (491,200 | ) |
Net increase (decrease)
in shares outstanding | | | 68,730 | | | | (172,695 | ) | | | 2,604 | | | | (347,258 | ) |
Shares outstanding at
beginning of period | | | 1,041,495 | | | | 1,214,190 | | | | 2,145,935 | | | | 2,493,193 | |
| Shares outstanding at end of period | | | 1,110,225 | | | | 1,041,495 | | | | 2,148,539 | | | | 2,145,935 | |
| See accompanying notes to financial statements. |
FBP EQUITY & DIVIDEND PLUS FUND
FINANCIAL HIGHLIGHTS
Selected Per Share Data and Ratios for a Share Outstanding Throughout Each Period
| | | Six Months Ended Sept. 30, 2013 | | | | |
| | | | | | | | | | | | | | | | | | | |
Net asset value at
beginning of period | | $ | 21.67 | | | $ | 19.10 | | | $ | 20.70 | | | $ | 19.42 | | | $ | 12.02 | | | $ | 20.99 | |
| | | | | | | | | | | | | | | | | | | | | | | | | |
Income (loss) from
investment operations: | | | | | | | | | | | | | | | | | | | | | | | | |
| Net investment income | | | 0.21 | | | | 0.47 | | | | 0.23 | | | | 0.15 | | | | 0.12 | | | | 0.27 | |
Net realized and unrealized gains
(losses) on investments | | 1.34 | | | | 2.56 | | | | (1.59 | ) | | | 1.27 | | | | 7.41 | | | | (8.98 | ) |
| Total from investment operations | | | 1.55 | | | | 3.03 | | | | (1.36 | ) | | | 1.42 | | | | 7.53 | | | | (8.71 | ) |
| | | | | | | | | | | | | | | | | | | | | | | | | |
| Less distributions: | | | | | | | | | | | | | | | | | | | | | | | | |
Dividends from net
investment income | | | (0.21 | ) | | | (0.46 | ) | | | (0.24 | ) | | | (0.14 | ) | | | (0.13 | ) | | | (0.26 | ) |
| | | | | | | | | | | | | | | | | | | | | | | | | |
| Net asset value at end of period | | $ | 23.01 | | | $ | 21.67 | | | $ | 19.10 | | | $ | 20.70 | | | $ | 19.42 | | | $ | 12.02 | |
| | | | | | | | | | | | | | | | | | | | | | | | | |
Total return (a) | | | 7.15% | (b) | | | 16.19% | | | | (6.49% | ) | | | 7.40% | | | | 62.84% | | | | (41.78% | ) |
| | | | | | | | | | | | | | | | | | | | | | | | | |
| Net assets at end of period (000’s) | $ | 25,548 | | | $ | 22,570 | | | $ | 23,194 | | | $ | 27,407 | | | $ | 28,617 | | | $ | 20,605 | |
| | | | | | | | | | | | | | | | | | | | | | | | | |
Ratio of total expenses to
average net assets | | | 1.22% | (c) | | | 1.29% | | | | 1.29% | | | | 1.19% | | | | 1.19% | | | | 1.18% | |
| | | | | | | | | | | | | | | | | | | | | | | | | |
Ratio of net expenses to
average net assets (d) | | | 1.07% | (c) | | | 1.07% | | | | 1.07% | | | | 1.07% | | | | 1.07% | | | | 1.07% | |
| | | | | | | | | | | | | | | | | | | | | | | | | |
Ratio of net investment income to average net assets (d) | | | 1.82% | (c) | | | 2.40% | | | | 1.24% | | | | 0.78% | | | | 0.74% | | | | 1.59% | |
| | | | | | | | | | | | | | | | | | | | | | | | | |
| Portfolio turnover rate | | | 11% | (b) | | | 32% | | | | 46% | | | | 25% | | | | 21% | | | | 16% | |
| (a) | Total return is a measure of the change in value of an investment in the Fund over the periods covered, which assumes any dividends or capital gains distributions are reinvested in shares of the Fund. Returns shown do not reflect the deduction of taxes a shareholder would pay on Fund distributions or the redemption of Fund shares. |
| | |
| (b) | Not Annualized. |
| | |
| (c) | Annualized. |
| | |
| (d) | Ratios were determined after voluntary advisory fee reductions by the Adviser (Note 4). |
| | |
| See accompanying notes to financial statements. |
FBP APPRECIATION & INCOME OPPORTUNITIES FUND
FINANCIAL HIGHLIGHTS
Selected Per Share Data and Ratios for a Share Outstanding Throughout Each Period
| | | Six Months Ended Sept. 30, 2013 | | | | |
| | | | | | | | | | | | | | | | | | | |
Net asset value at
beginning of period | | $ | 17.16 | | | $ | 15.85 | | | $ | 16.35 | | | $ | 15.49 | | | $ | 10.97 | | | $ | 15.84 | |
| | | | | | | | | | | | | | | | | | | | | | | | | |
Income (loss) from
investment operations: | | | | | | | | | | | | | | | | | | | | | | | | |
| Net investment income | | | 0.13 | | | | 0.29 | | | | 0.26 | | | | 0.24 | | | | 0.27 | | | | 0.32 | |
Net realized and unrealized gains
(losses) on investments | | 1.08 | | | | 1.61 | | | | (0.46 | ) | | | 0.88 | | | | 4.53 | | | | (4.89 | ) |
| Total from investment operations | | | 1.21 | | | | 1.90 | | | | (0.20 | ) | | | 1.12 | | | | 4.80 | | | | (4.57 | ) |
| | | | | | | | | | | | | | | | | | | | | | | | | |
| Less distributions: | | | | | | | | | | | | | | | | | | | | | | | | |
Dividends from net
investment income | | | (0.13 | ) | | | (0.30 | ) | | | (0.30 | ) | | | (0.26 | ) | | | (0.28 | ) | | | (0.30 | ) |
Distributions from net
realized gains | | | (0.44 | ) | | | (0.29 | ) | | | — | | | | — | | | | — | | | | — | |
| Total distributions | | | (0.57 | ) | | | (0.59 | ) | | | (0.30 | ) | | | (0.26 | ) | | | (0.28 | ) | | | (0.30 | ) |
| | | | | | | | | | | | | | | | | | | | | | | | | |
| Net asset value at end of period | | $ | 17.80 | | | $ | 17.16 | | | $ | 15.85 | | | $ | 16.35 | | | $ | 15.49 | | | $ | 10.97 | |
| | | | | | | | | | | | | | | | | | | | | | | | | |
Total return (a) | | | 7.17% | (b) | | | 12.51% | | | | (1.13% | ) | | | 7.35% | | | | 44.01% | | | | (29.15% | ) |
| | | | | | | | | | | | | | | | | | | | | | | | | |
| Net assets at end of period (000’s) | $ | 38,248 | | | $ | 36,825 | | | $ | 39,520 | | | $ | 46,406 | | | $ | 45,507 | | | $ | 34,199 | |
| | | | | | | | | | | | | | | | | | | | | | | | | |
Ratio of total expenses to
average net assets | | | 1.02% | (c) | | | 1.06% | | | | 1.06% | | | | 1.03% | | | | 1.03% | | | | 1.05% | |
| | | | | | | | | | | | | | | | | | | | | | | | | |
Ratio of net expenses to
average net assets (d) | | | 1.00% | (c) | | | 1.00% | | | | 1.00% | | | | 1.00% | | | | 1.00% | | | | 1.00% | |
| | | | | | | | | | | | | | | | | | | | | | | | | |
Ratio of net investment income to average net assets (d) | | | 1.44% | (c) | | | 1.83% | | | | 1.71% | | | | 1.59% | | | | 1.90% | | | | 2.36% | |
| | | | | | | | | | | | | | | | | | | | | | | | | |
| Portfolio turnover rate | | | 6% | (b) | | | 15% | | | | 17% | | | | 24% | | | | 24% | | | | 24% | |
| (a) | Total return is a measure of the change in value of an investment in the Fund over the periods covered, which assumes any dividends or capital gains distributions are reinvested in shares of the Fund. Returns shown do not reflect the deduction of taxes a shareholder would pay on Fund distributions or the redemption of Fund shares. |
| | |
| (b) | Not Annualized. |
| | |
| (c) | Annualized. |
| | |
| (d) | Ratios were determined after voluntary advisory fee reductions by the Adviser (Note 4). |
| | |
| See accompanying notes to financial statements. |
THE FLIPPIN, BRUCE & PORTER FUNDS
NOTES TO FINANCIAL STATEMENTS
September 30, 2013 (Unaudited)
1. Organization
FBP Equity & Dividend Plus Fund and FBP Appreciation & Income Opportunities Fund (the “Funds”) are no-load, diversified series of the Williamsburg Investment Trust (the “Trust”), an open-end management investment company registered under the Investment Company Act of 1940. The Trust was organized as a Massachusetts business trust on July 18, 1988. Other series of Williamsburg Investment Trust are not included in this report.
FBP Equity & Dividend Plus Fund seeks to provide above-average and growing income while also achieving long-term growth of capital.
FBP Appreciation & Income Opportunities Fund seeks long term capital appreciation and current income, assuming a moderate level of investment risk.
2. Significant Accounting Policies
The following is a summary of the Funds’ significant accounting policies. The policies are in conformity with accounting principles generally accepted in the United States of America (“GAAP”).
Securities valuation — The Funds’ portfolio securities are valued as of the close of business of the regular session of the New York Stock Exchange (normally 4:00 p.m., Eastern time). Securities traded on a national stock exchange are valued based upon the closing price on the principal exchange where the security is traded. Securities which are quoted by NASDAQ are valued at the NASDAQ Official Closing Price. Securities which are traded over-the-counter are valued at the last sales price, if available, otherwise, at the last quoted bid price. It is expected that fixed income securities will ordinarily be traded in the over-the-counter market, and common stocks will ordinarily be traded on a national securities exchange, but may also be traded in the over-the-counter market. Call options written by the Funds are valued at the then current market quotation, using the ask price as of the close of each day on the principal exchanges on which they are traded. Short-term instruments (those with remaining maturities of 60 days or less) may be valued at amortized cost, which approximates market value.
When market quotations are not readily available, securities may be valued on the basis of prices provided by an independent pricing service. The prices provided by the pricing service are determined with consideration given to institutional bid and last sale prices and take into account securities prices, yields, maturities, call features, ratings, institutional trading in similar groups of securities and developments related to specific securities and will be classified as Level 2 within the fair value hierarchy (see below). If a pricing service cannot provide a valuation or the investment adviser believes the price received from the pricing service is not indicative of fair value, securities will be valued in good faith at fair value using methods consistent with those determined by the Board of Trustees and will be classified as Level 2 or 3 within the fair value hierarchy, depending on the inputs used. Such methods of fair valuation may include, but are not limited to: multiple of earnings, multiple of book value, discount from market of a similar freely traded security, purchase price of the security, subsequent private transactions in the security or related securities, or a combination of these and other factors.
THE FLIPPIN, BRUCE & PORTER FUNDS
NOTES TO FINANCIAL STATEMENTS (Continued)
GAAP establishes a single authoritative definition of fair value, sets out a framework for measuring fair value and requires additional disclosures about fair value measurements. Various inputs are used in determining the value of each Fund’s investments. These inputs are summarized in the three broad levels listed below:
• Level 1 – quoted prices in active markets for identical securities
• Level 2 – other significant observable inputs
• Level 3 – significant unobservable inputs
Fixed income securities, including corporate bonds and municipal bonds, held by FBP Appreciation & Income Opportunities Fund are classified as Level 2 since the values for such securities are based on prices provided by an independent pricing service that utilizes various “other significant observable inputs” including bid and ask quotations, prices of similar securities and interest rates, among other factors.
The inputs or methodology used for valuing securities are not necessarily an indication of the risks associated with investing in those securities. The inputs used to measure fair value may fall into different levels of the fair value hierarchy. In such cases, for disclosure purposes, the level in the fair value hierarchy within which the fair value measurement falls in its entirety is determined based on the lowest level input that is significant to the fair value measurement.
The following is a summary of the inputs used to value each Fund’s investments and other financial instruments as of September 30, 2013 by security type:
FBP Equity & Dividend Plus Fund | | | | | | | | | | | | |
| Investments in Securities: | | | | | | | | | | | | |
| Common Stocks | | $ | 22,956,025 | | | $ | — | | | $ | — | | | $ | 22,956,025 | |
| Money Market Funds | | | 2,836,447 | | | | — | | | | — | | | | 2,836,447 | |
| Total | | $ | 25,792,472 | | | $ | — | | | $ | — | | | $ | 25,792,472 | |
| | | | | | | | | | | | | | | | | |
| Other Financial Instruments: | | | | | | | | | | | | | | | | |
| Covered Call Options | | $ | (267,677 | ) | | $ | — | | | $ | — | | | $ | (267,677 | ) |
| Total | | $ | (267,677 | ) | | $ | — | | | $ | — | | | $ | (267,677 | ) |
FBP Appreciation & Income Opportunities Fund | | | | | | | | | | | | |
| Investments in Securities: | | | | | | | | | | | | |
| Common Stocks | | $ | 29,993,757 | | | $ | — | | | $ | — | | | $ | 29,993,757 | |
| Corporate Bonds | | | — | | | | 2,605,583 | | | | — | | | | 2,605,583 | |
| Municipal Bonds | | | — | | | | 291,450 | | | | — | | | | 291,450 | |
| Money Market Funds | | | 5,744,343 | | | | — | | | | — | | | | 5,744,343 | |
| Total | | $ | 35,738,100 | | | $ | 2,897,033 | | | $ | — | | | $ | 38,635,133 | |
| | | | | | | | | | | | | | | | | |
| Other Financial Instruments: | | | | | | | | | | | | | | | | |
| Covered Call Options | | $ | (323,730 | ) | | $ | — | | | $ | — | | | $ | (323,730 | ) |
| Total | | $ | (323,730 | ) | | $ | — | | | $ | — | | | $ | (323,730 | ) |
THE FLIPPIN, BRUCE & PORTER FUNDS
NOTES TO FINANCIAL STATEMENTS (Continued)
Refer to each Fund’s Schedule of Investments for a listing of the common stocks and corporate bonds by sector type. As of September 30, 2013, the Funds did not have any transfers in and out of any Level. There were no Level 3 securities held by the Funds as of September 30, 2013. It is the Funds’ policy to recognize transfers into and out of any Level at the end of the reporting period.
Share valuation — The net asset value per share of each Fund is calculated daily by dividing the total value of its assets, less liabilities, by the number of shares outstanding. The offering price and redemption price per share of each Fund is equal to its net asset value per share.
Investment income — Interest income is accrued as earned. Dividend income is recorded on the ex-dividend date. Discounts and premiums on fixed income securities purchased are amortized using the interest method.
Distributions to shareholders — Dividends arising from net investment income are declared and paid quarterly to shareholders of each Fund. Net realized short-term capital gains, if any, may be distributed throughout the year and net realized long-term capital gains, if any, are distributed at least once each year. The amount of distributions from net investment income and net realized gains are determined in accordance with federal income tax regulations, which may differ from GAAP. These “book/tax” differences are either temporary or permanent in nature. The tax character of distributions paid during the periods ended September 30, 2013 and March 31, 2013 was as follows:
| | | | | | | | | | |
| FBP Equity & Dividend Plus Fund | 9/30/2013 | | $ | 221,946 | | | $ | — | | | $ | 221,946 | |
| | 3/31/2013 | | $ | 520,286 | | | $ | — | | | $ | 520,286 | |
| FBP Appreciation & Income Opportunities Fund | 9/30/2013 | | $ | 286,389 | | | $ | 927,003 | | | $ | 1,213,392 | |
| | 3/31/2013 | | $ | 665,559 | | | $ | 626,479 | | | $ | 1,292,038 | |
Security transactions — Security transactions are accounted for on trade date for financial reporting purposes. Gains and losses on securities sold are determined on a specific identification basis.
Common expenses — Common expenses of the Trust are allocated among the series of the Trust based on relative net assets of each series or the nature of the services performed and the relative applicability to each series.
Options transactions — When the Funds’ investment adviser believes that individual portfolio securities held by the Funds are approaching the top of the adviser’s growth and price expectations, covered call options may be written (sold) against such securities and the Funds will receive a premium in return. The Funds write options only for income generation and hedging purposes and not for speculation. The premiums received from writing the options are recorded as a liability and are subsequently valued daily at the closing prices on their primary exchanges. Premiums received from writing options which expire are treated as realized gains. Premiums received from writing options which are exercised increase the proceeds used to calculate the realized gain or loss on the sale of the security. If a closing purchase transaction is used to terminate a Fund’s obligation on a call option, a gain or loss will be realized, depending upon whether the price of the closing purchase transaction is more or less than the premium previously received on the call option written.
THE FLIPPIN, BRUCE & PORTER FUNDS
NOTES TO FINANCIAL STATEMENTS (Continued)
The Funds may also purchase put options on stock indices. By purchasing a put option on a stock index, a Fund could hedge the risk of a general market decline. The value of the put option would be expected to rise as a result of a market decline and thus could offset all or a portion of losses resulting from declines in the prices of individual securities held by a Fund. However, option premiums tend to decrease over time as the expiration date nears. Therefore, because of the cost of the option (in the form of premium and transaction costs), the Fund would suffer a loss in the put option if prices do not decline, or do not decline sufficiently, to offset the deterioration in the value of the option premium. Premiums paid for buying options that expire are treated as realized losses. Premiums paid from buying options which are exercised decrease the proceeds used to calculate the realized gain or loss on the exercise of the option.
Estimates — The preparation of financial statements in conformity with GAAP requires management to make estimates and assumptions that affect the reported amounts of assets and liabilities and the disclosure of contingent assets and liabilities as of the date of the financial statements and the reported amounts of income and expenses during the reporting period. Actual results could differ from those estimates.
Federal income tax — It is each Fund’s policy to comply with the special provisions of Subchapter M of the Internal Revenue Code applicable to regulated investment companies. As provided therein, in any fiscal year in which a Fund so qualifies and distributes at least 90% of its taxable net income, the Fund (but not the shareholders) will be relieved of federal income tax on the income distributed. Accordingly, no provision for income taxes has been made.
In order to avoid imposition of the excise tax applicable to regulated investment companies, it is also each Fund’s intention to declare as dividends in each calendar year at least 98% of its net investment income (earned during the calendar year) and 98.2% of its net realized capital gains (earned during the twelve months ended October 31) plus undistributed amounts from prior years.
The following information is computed on a tax basis for each item as of September 30, 2013:
| | FBP Equity & Dividend Plus Fund | | | FBP Appreciation & Income Opportunities Fund | |
| Tax cost of portfolio investments | | $ | 20,489,581 | | | $ | 29,690,987 | |
| Gross unrealized appreciation | | $ | 5,541,350 | | | $ | 9,595,284 | |
| Gross unrealized depreciation | | | (238,459 | ) | | | (651,138 | ) |
| Net unrealized appreciation on investments | | | 5,302,891 | | | | 8,944,146 | |
| Net unrealized depreciation on option contracts | | | (92,100 | ) | | | (117,613 | ) |
| Undistributed ordinary income | | | 2,965 | | | | 17,365 | |
| Capital loss carryforwards | | | (1,476,288 | ) | | | — | |
| Other gains | | | 609,397 | | | | 564,849 | |
| Other temporary differences | | | (2,805 | ) | | | (15,450 | ) |
| Accumulated earnings | | $ | 4,344,060 | | | $ | 9,393,297 | |
As of September 30, 2013, the tax cost of written options for FBP Equity & Dividend Plus Fund and FBP Appreciation & Income Opportunities Fund is $175,577 and $206,117, respectively.
THE FLIPPIN, BRUCE & PORTER FUNDS
NOTES TO FINANCIAL STATEMENTS (Continued)
The difference between the federal income tax cost of portfolio investments and the financial statement cost for FBP Appreciation & Income Opportunities Fund is due to certain differences in the recognition of capital gains and losses under income tax regulations and GAAP. These “book/tax” differences are temporary in nature and are primarily due to differing methods in the amortization of discounts and premiums on fixed income securities.
As of March 31, 2013, FBP Equity & Dividend Plus Fund had short-term capital loss carryforwards for federal income tax purposes of $1,476,288 which expire on March 31, 2018. These capital loss carryforwards may be utilized in the current and future years to offset net realized capital gains, if any, prior to distributing such gains to shareholders.
Under the Regulated Investment Company Modernization Act of 2010 (the “Act”), net capital losses realized after March 31, 2011 may be carried forward indefinitely and their character is retained as short-term and/or long-term losses. Under the law in effect prior to the Act, pre-enactment net capital losses were carried forward for eight years and treated as short-term losses. As a transition rule, the Act requires that post-enactment net capital losses be used before pre-enactment net capital losses. Therefore, there may be a greater likelihood that all or a portion of the FBP Equity & Dividend Plus Fund’s pre-enactment capital loss carryovers may expire without being utilized.
For the six months ended September 30, 2013, FBP Appreciation & Income Opportunities Fund reclassified accumulated net realized gains from security transactions of $56,875 against distributions in excess of net investment income on the Statements of Assets and Liabilities. Such reclassification, the result of permanent differences between the financial statement and income tax reporting requirements, has no effect on the Fund’s net assets or net asset value per share.
During the year ended March 31, 2013, FBP Appreciation & Income Opportunities Fund realized $149,541 of net capital gains resulting from in-kind redemptions (redemptions in which shareholders who redeemed Fund shares received securities held by the Fund rather than cash). The Fund recognizes a gain on in-kind redemptions to the extent that the value of the distributed securities on the date of redemption exceeds the cost of those securities. Such gains are not taxable to the Fund and are not required to be distributed to shareholders.
The Funds recognize the tax benefits or expenses of uncertain tax positions only when the position is “more likely than not” to be sustained assuming examination by tax authorities. Management has reviewed the tax positions taken on federal income tax returns for all open tax years (tax years ended March 31, 2010 through March 31, 2013) of each Fund and has concluded that no provision for unrecognized tax benefits or expenses is required in these financial statements.
3. Investment Transactions
During the six months ended September 30, 2013, cost of purchases and proceeds from sales and maturities of investment securities, other than short-term investments and U.S. Government securities, totaled $2,519,290 and $3,149,674, respectively, for FBP Equity & Dividend Plus Fund and $1,911,457 and $3,602,560, respectively, for FBP Appreciation & Income Opportunities Fund.
THE FLIPPIN, BRUCE & PORTER FUNDS
NOTES TO FINANCIAL STATEMENTS (Continued)
4. Transactions with Related Parties
INVESTMENT ADVISORY AGREEMENTS
The Funds’ investments are managed by Flippin, Bruce & Porter, Inc. (the “Adviser”) under the terms of an Investment Advisory Agreement. Under the Investment Advisory Agreement, each Fund pays the Adviser a fee, which is computed and accrued daily and paid monthly, at an annual rate of .70% of its average daily net assets up to $250 million; .65% of the next $250 million of such assets; and .50% of such assets in excess of $500 million.
During the six months ended September 30, 2013, the Adviser voluntarily waived $18,133 and $3,963 of its investment advisory fees from FBP Equity & Dividend Plus Fund and FBP Appreciation & Income Opportunities Fund, respectively.
Certain officers of the Trust are also officers of the Adviser.
MUTUAL FUND SERVICES AGREEMENT
Under the terms of a Mutual Fund Services Agreement between the Trust and Ultimus Fund Solutions, LLC (“Ultimus”), Ultimus provides administrative, pricing, accounting, dividend disbursing, shareholder servicing and transfer agent services for the Funds. For these services, Ultimus receives a monthly fee from each Fund at an annual rate of .15% of its average daily net assets up to $25 million, .125% of the next $25 million of such assets, and .10% of such assets in excess of $50 million, subject to a minimum monthly fee of $4,500. In addition, each Fund pays out-of-pocket expenses including, but not limited to, postage, supplies and costs of pricing the Funds’ portfolio securities.
Certain officers of the Trust are also officers of Ultimus, or of Ultimus Fund Distributors, LLC (the “Distributor”), the principal underwriter of each Fund’s shares and an affiliate of Ultimus. The Distributor is compensated by the Adviser (not the Funds) for acting as principal underwriter.
COMPLIANCE CONSULTING AGREEMENT
Under the terms of a Compliance Consulting Agreement between the Trust and Ultimus, Ultimus provides an individual to serve as the Trust’s Chief Compliance Officer and to administer the Funds’ compliance policies and procedures. For these services, the Funds pay Ultimus an annual base fee of $16,800 plus an asset-based fee equal to 0.01% per annum on the Funds’ aggregate net assets in excess of $100 million. In addition, the Funds reimburse Ultimus for reasonable out-of-pocket expenses, if any, incurred in connection with these services.
COMPENSATION OF TRUSTEES
Trustees and officers affiliated with the Adviser or Ultimus are not compensated by the Trust for their services. Each Trustee who is not an affiliated person of the Adviser or Ultimus receives from the Trust an annual retainer of $10,000, payable quarterly; a fee of $1,500 for attendance at each meeting of the Board of Trustees (except that such fee is $2,500 for the independent chariman); and $1,000 for attendance at each meeting for any committee of the Board (except that such fee is $1,500 for the committee chairman); plus reimbursement of travel and other expenses incurred in attending meetings. Prior to July 1, 2013, the annual retainer was $8,000.
THE FLIPPIN, BRUCE & PORTER FUNDS
NOTES TO FINANCIAL STATEMENTS (Continued)
5. Derivatives Transactions
Transactions in option contracts written by the Funds during the six months ended September 30, 2013 were as follows:
| | | FBP Equity & Dividend Plus Fund | | | FBP Appreciation & Income Opportunities Fund | |
| | | | | | | | | | | | |
| Options outstanding at beginning of period | | | 975 | | | $ | 170,005 | | | | 483 | | | $ | 103,398 | |
| Options written | | | 762 | | | | 148,897 | | | | 824 | | | | 150,770 | |
| Options cancelled in a closing purchase transaction | | | (105 | ) | | | (20,853 | ) | | | — | | | | — | |
| Options expired | | | (140 | ) | | | (24,277 | ) | | | (40 | ) | | | (6,879 | ) |
| Options exercised | | | (644 | ) | | | (98,195 | ) | | | (220 | ) | | | (41,172 | ) |
| Options outstanding at end of period | | | 848 | | | $ | 175,577 | | | | 1,047 | | | $ | 206,117 | |
The location in the Statements of Assets and Liabilities of the Funds’ derivative positions is as follows:
FBP Equity & Dividend Plus Fund
| | | | | | | | |
| | | | | | | | | Gross Notional Amount Outstanding September 30, 2013 | |
| Covered call options written | Covered call options, at value | | | — | | | $ | (267,677 | ) | | $ | (4,160,650 | ) |
FBP Appreciation & Income Opportunities Fund
| | | | | | | | |
| | | | | | | | | Gross Notional Amount Outstanding September 30, 2013 | |
| Covered call options written | Covered call options, at value | | | — | | | $ | (323,730 | ) | | $ | (4,753,738 | ) |
The average monthly notional amount of option contracts written during the six months ended September 30, 2013 was $3,405,462 and $3,554,298 for FBP Equity & Dividend Plus Fund and FBP Appreciation & Income Opportunities Fund, respectively.
The Funds held no put option contracts on stock indices as of September 30, 2013. The average notional amount of put option contracts purchased during the six months ended September 30, 2013 for FBP Equity & Dividend Plus Fund and FBP Appreciation & Income Opportunities Fund was $4,554,388 and $5,791,748, respectively.
THE FLIPPIN, BRUCE & PORTER FUNDS
NOTES TO FINANCIAL STATEMENTS (Continued)
Transactions in derivative instruments during the six months ended September 30, 2013 by the Funds are recorded in the following location in the Statements of Operations:
FBP Equity & Dividend Plus Fund
| | | Net Realized Gains (Losses) | | | | Change in Unrealized Gains (Losses) | |
| Covered call options written | Net realized gains (losses) from option contracts | | $24,277 | | Net change in unrealized appreciation/depreciation on option contracts | | $204,281 | |
| Purchased index put options | Net realized gains (losses) from option contracts | | $(180,678) | | Net change in unrealized appreciation/depreciation on option contracts | | $— | |
FBP Appreciation & Income Opportunities Fund
| | | Net Realized Gains (Losses) | | | | Change in Unrealized Gains (Losses) | |
| Covered call options written | Net realized gains (losses) from option contracts | | $6,879 | | Net change in unrealized appreciation/depreciation on option contracts | | $19,006 | |
| Purchased index put options | Net realized gains (losses) from option contracts | | $(182,650) | | Net change in unrealized appreciation/depreciation on option contracts | | $— | |
6. Contingencies and Commitments
The Funds indemnify the Trust’s officers and Trustees for certain liabilities that might arise from their performance of their duties to the Funds. Additionally, in the normal course of business the Funds enter into contracts that contain a variety of representations and warranties and which provide general indemnifications. The Funds’ maximum exposure under these arrangements is unknown, as this would involve future claims that may be made against the Funds that have not yet occurred. However, based on experience, the Funds expect the risk of loss to be remote.
7. Subsequent Events
The Funds are required to recognize in the financial statements the effects of all subsequent events that provide additional evidence about conditions that existed as of the date of the Statements of Assets and Liabilities. For non-recognized subsequent events that must be disclosed to keep the financial statements from being misleading, the Funds are required to disclose the nature of the event as well as an estimate of its financial effect, or a statement that such an estimate cannot be made. Management has evaluated subsequent events through the issuance of these financial statements and has noted no such events.
THE FLIPPIN, BRUCE & PORTER FUNDS
ABOUT YOUR FUNDS’ EXPENSES (Unaudited)
We believe it is important for you to understand the impact of costs on your investment. All mutual funds have operating expenses. As a shareholder of the Funds, you incur ongoing costs, including management fees and other operating expenses. These ongoing costs, which are deducted from each Fund’s gross income, directly reduce the investment return of the Funds.
A mutual fund’s ongoing costs are expressed as a percentage of its average net assets. This figure is known as the expense ratio. The following examples are intended to help you understand the ongoing costs (in dollars) of investing in the Funds and to compare these costs with the ongoing costs of investing in other mutual funds. The examples below are based on an investment of $1,000 made at the beginning of the period shown and held for the entire period (April 1, 2013 through September 30, 2013).
The table below illustrates each Fund’s ongoing costs in two ways:
Actual fund return – This section helps you to estimate the actual expenses that you paid over the period. The “Ending Account Value” shown is derived from each Fund’s actual return, and the third column shows the dollar amount of operating expenses that would have been paid by an investor who started with $1,000 in the Funds. You may use the information here, together with the amount you invested, to estimate the expenses that you paid over the period.
To do so, simply divide your account value by $1,000 (for example, an $8,600 account value divided by $1,000 = 8.6), then multiply the result by the number given for the Funds under the heading “Expenses Paid During Period.”
Hypothetical 5% return – This section is intended to help you compare the Funds’ ongoing costs with those of other mutual funds. It assumes that each Fund had an annual return of 5% before expenses during the period shown, but that the expense ratio is unchanged. In this case, because the returns used are not the Funds’ actual returns, the results do not apply to your investment. The example is useful in making comparisons because the Securities and Exchange Commission (“SEC”) requires all mutual funds to calculate expenses based on a 5% return. You can assess each Fund’s ongoing costs by comparing this hypothetical example with the hypothetical examples that appear in shareholder reports of other funds.
Note that expenses shown in the table are meant to highlight and help you compare ongoing costs only. The Funds do not charge sales loads or redemption fees, nor do they carry a “sales load.”
The calculations assume no shares were bought or sold during the period. Your actual costs may have been higher or lower, depending on the amount of your investment and the timing of any purchases or redemptions.
More information about the Funds’ expenses, including annual expense ratios for the past five fiscal years, can be found in this report. For additional information on operating expenses and other shareholder costs, please refer to the Funds’ prospectus.
THE FLIPPIN, BRUCE & PORTER FUNDS
ABOUT YOUR FUNDS’ EXPENSES (Unaudited) (Continued)
FBP Equity & Dividend Plus Fund
| Beginning Account Value April 1, 2013 | Ending Account Value September 30, 2013 | Expenses Paid During Period* |
| Based on Actual Fund Return | $1,000.00 | $1,071.50 | $5.56 |
| Based on Hypothetical 5% Return (before expenses) | $1,000.00 | $1,019.70 | $5.42 |
| * | Expenses are equal to the FBP Equity & Dividend Plus Fund’s annualized expense ratio of 1.07% for the period, multiplied by the average account value over the period, multiplied by 183/365 (to reflect the one-half year period). |
FBP Appreciation & Income Opportunities Fund
| Beginning Account Value April 1, 2013 | Ending Account Value September 30, 2013 | Expenses Paid During Period* |
| Based on Actual Fund Return | $1,000.00 | $1,071.70 | $5.19 |
| Based on Hypothetical 5% Return (before expenses) | $1,000.00 | $1,020.05 | $5.06 |
| * | Expenses are equal to the FBP Appreciation & Income Opportunities Fund’s annualized expense ratio of 1.00% for the period, multiplied by the average account value over the period, multiplied by 183/365 (to reflect the one-half year period). |
OTHER INFORMATION (Unaudited)
The Trust files a complete listing of portfolio holdings for the Funds with the SEC as of the end of the first and third quarters of each fiscal year on Form N-Q. The filings are available upon request, by calling 1-800-327-9375. Furthermore, you may obtain a copy of these filings on the SEC’s website at http://www.sec.gov. The Trust’s Forms N-Q may also be reviewed and copied at the SEC’s Public Reference Room in Washington, DC, and information on the operation of the Public Reference Room may be obtained by calling 1-800-SEC-0330.
A description of the policies and procedures that the Funds use to determine how to vote proxies relating to portfolio securities is available without charge upon request by calling toll-free 1-800-327-9375, or on the SEC’s website at http://www.sec.gov. Information regarding how the Funds voted proxies relating to portfolio securities during the most recent 12-month period ended June 30 is also available without charge upon request by calling toll-free 1-800-327-9375, or on the SEC’s website at http://www.sec.gov.
| | | | | | |
| | | | | | | |
| | | | | | | |
| | | | | | | |
| | | | Investment Adviser Flippin, Bruce & Porter, Inc. 800 Main Street, Second Floor P.O. Box 6138 Lynchburg, Virginia 24505 Toll-Free 1-800-327-9375 www.fbpfunds.com Administrator Ultimus Fund Solutions, LLC P.O. Box 46707 Cincinnati, Ohio 45246-0707 Toll-Free 1-866-738-1127 Custodian US Bank NA 425 Walnut Street Cincinnati, Ohio 45202 Independent Registered Public Accounting Firm Ernst & Young LLP 1900 Scripps Center 312 Walnut Street Cincinnati, Ohio 45202 | Legal Counsel Sullivan & Worcester LLP One Post Office Square Boston, Massachusetts 02109 Officers John T. Bruce, President and Portfolio Manager John M. Flippin, Vice President John H. Hanna, IV, Vice President David J. Marshall, Vice President R. Gregory Porter, III, Vice President Trustees John P. Ackerly, IV John T. Bruce Robert S. Harris J. Finley Lee, Jr. Richard L. Morrill Harris V. Morrissette | | | |
| | | | | | | |
| | | | | | | |
| | | | | | |
THE GOVERNMENT STREET FUNDS No-Load Mutual Funds Semi-Annual Report September 30, 2013 (Unaudited) |
The Government Street Equity Fund The Government Street Mid-Cap Fund The Alabama Tax Free Bond Fund |
LETTER FROM THE PRESIDENT | |
Dear Fellow Shareholders:
We are enclosing for your review the Semi-Annual Reports of The Government Street Funds for the six months ended September 30, 2013.
The Government Street Equity Fund
The Government Street Equity Fund (the “Fund”) had a positive return of 7.86% for the semi-annual fiscal period ended September 30, 2013. By comparison, the S&P 500 Index and the Morningstar Large Cap Blend Equity category were up 8.31% and 11.53%, respectively. The large cap section of domestic markets continues to be positively affected by the dynamics of the S&P 500 Index which has remained in a positive up trend since the low point reached in March 2009.
In four of the six months under review for this semi-annual letter, the stock market, as measured by the S&P 500 Index, turned in positive returns. However, in the second three months, a higher level of volatility in pricing returned most likely due to questions of the Federal Reserve’s continued application of stimulative policies and the perplexing question of what constitutes a “red line.” “Red Line” is the controversial consideration for military action against Syria in response to their use of chemical weapons, which would have destabilizing financial effects.
Corporations, in general, turned in better earnings than expected even though revenue growth was restrained. As a result of the confused economic messages emanating from Washington, capital equipment expenditures, jobs, and business expansions domestically remained neutral. The positive by-product of this lethargy has been very large corporate stock repurchases, balance sheet strengthening and some increased merger and acquisition activity, which is all good for stock prices.
The improvement in the financial position of international markets, along with the continued stimulus of bond purchases by the Federal Reserve, resulted in an environment biased toward wealth creation. Ultimately, we believe without real progress in regulatory, tax and fiscal policy forthcoming, that it will be very difficult to maintain the current upward trajectory in stock returns. The good news is that corporate profits and consequently gross national product (“GNP”) continue to grow, albeit slowly by historical standards, which provides a positive bias for growth as opposed to recession.
In this environment, we believe that the most basic of risk control measures available, diversification in quality companies, is mandatory. As of September 30, 2013, the Fund contained investments in 95 individual common stocks and 8 multiple stock holdings represented by Exchange-Traded Funds (ETFs) and Exchange-Traded Notes (ETNs). The cash reserves were approximately 3.5% of the portfolio.
The ETF and ETN’s internal holdings broaden investment participation to emphasize agricultural related stocks, mid and small capitalization domestic securities, master limited partnerships, international companies and hedged investments. In the aggregate, these investments accounted for approximately 14% of the total portfolio.
The top 10 holdings in the Fund as of September 30, 2013 were:
| Security Description | % of Net Assets |
| Vanguard Mid-Cap ETF | 3.2% |
| Apple, Inc. | 3.1% |
| MasterCard, Inc. - Class A | 2.7% |
| JPMorgan Alerian MLP Index ETN | 2.6% |
| Walt Disney Company (The) | 2.2% |
| Visa, Inc. - Class A | 2.1% |
| Conoco Phillips | 2.0% |
| iShares Russell 2000 Index Fund | 2.0% |
| United Technologies Corporation | 1.9% |
| iShares Core S&P Mid-Cap ETF | 1.8% |
The 5 best performing securities held by the Fund for the entire six month period were:
| Prothena Corporation plc | 202.39% |
| Questcor Pharmaceuticals, Inc. | 80.50% |
| Regeneron Pharmaceuticals, Inc. | 77.36% |
| Pioneer Natural Resources Company | 51.95% |
| Whole Foods Market, Inc. | 35.44% |
The 5 worst performing securities held by the Fund for the entire six month period were:
| Phillips 66 | -20.75% |
| International Business Machines Corporation | -12.33% |
| McCormick & Company, Inc. – Non-Voting Shares | -10.28% |
| Market Vectors Agribusiness ETF | -9.19% |
| Plum Creek Timber Company, Inc. | -8.66% |
The Fund’s best performing economic sector for the six months was Health Care at 19.46%, followed by Consumer Discretionary at 11.52%. The worst performing sector was Utilities at -6.82%.
Note: The investment performances listed for economic sectors and securities in the two preceding paragraphs are extracted from an in-house independent internal rate of return computation by the Advent Axys portfolio accounting system. The calculations are gross investment returns.
There is not a discernible pattern in the performance of the 5 best and worst performing securities over the six month period. However, overall, those stocks found within the Telecommunication Services, Utilities and Consumer Staples sectors, generally considered to be defensive, were the underperformers. These sectors in the portfolio had returns of -0.41%, -6.82% and 1.99%, respectively. These sectors are generally good dividend payers and very stable in pricing action. They were left behind by a market focused on Health Care (+19.46%), Consumer Discretionary (+11.52%) and Industrials (+11.02%). The results definitely did not display a normal risk aversion pattern associated with the perception of uncertain times.
As of September 30, 2013, the Fund’s net assets were $87,294,253. Net asset value per share was $57.48. The portfolio turnover rate for the six months was 17% and the total number of holdings was 107 as of September 30, 2013. The net expense ratio for the Fund was 0.85%.
The Government Street Mid-Cap Fund
The Government Street Mid-Cap Fund (the “Fund”) produced a six month return of 8.27% as of September 30, 2013 while the Fund’s benchmark, the S&P MidCap 400 Index (the “S&P 400”), produced a six month return of 8.62%. The S&P 400 is an index maintained by the Standard & Poor’s Index Committee that selects companies with market capitalizations between $1.2 billion and $5.1 billion. The goal of the S&P 400 is to identify companies that represent the risk and reward characteristics of mid-sized companies. For the year ended September 30, 2013, the Fund returned 23.39% while the S&P 400 had a one year return of 27.68%. Within the Fund, the Health Care and Financials sectors were the top two contributors to performance while the Utilities and Telecommunication Services sectors were the top detractors for the recent 12 month period. The Fund also held almost 15% in ETFs that provided exposure to asset classes not included in the S&P 400, which contributed positively to performance. Some of the biggest individual stock contributors to the Fund’s performance over the past year were Pioneer Natural Resources Company (+80%), O’Reilly Automotive, Inc. (+52%), Alliance Data Systems Corporation (+48%) and Stericycle, Inc. (+27%).
The longer term performance of the Fund has been competitive when compared to the S&P 400, as well as large-cap stocks, as measured by the S&P 500 Index, and small-cap stocks, as measured by the Russell 2000 Index. The annualized returns for the past 3 years and 5 years ended September 30, 2013 are shown in the following table:
| | |
| The Government Street Mid-Cap Fund | 15.09% | 11.76% |
| S&P MidCap 400 Index | 17.45% | 13.08% |
| S&P 500 Index | 16.27% | 10.02% |
| Russell 2000 Index | 18.29% | 11.15% |
Equities have continued to set a torrid pace this year as central governments around the world continue to provide liquidity by keeping short-term interest rates near all-time lows. While central governments have control over short-term rates, the markets have more influence on rates further out the yield curve. With inflation remaining relatively tame, market forces have not yet put much upward pressure on rates so we remain at low rates across the curve. With so much liquidity in the financial system and paltry yields in fixed income, investors are forced to look at equities to achieve any acceptable level of return. As a result, money has poured into equity funds from fixed income and cash holdings. The bearish investor might worry about a potential bubble in equities as markets have risen steadily for 5 years with the help of government intervention. But corporate earnings have continued to be strong with earnings and revenues growing each quarter; albeit at a slowing rate. P/E multiples based on recent and forward estimates are also at reasonable levels based on historical
comparisons. Companies have done a very good job of managing resources since the credit crisis and it is evident in their results. As always, a strong case can be made for and against continued growth in the markets, which is why it is important to maintain a long-term focus and realize that the enduring trend is up with intermittent periods of dislocation. This is why it is imperative to develop an individualized long-term plan and eliminate the need to make decisions during periods of market unrest.
As of September 30, 2013, the net assets of the Fund were $50,417,122 and the net asset value per share was $19.77. The portfolio turnover rate for the six months was 7% and the total number of holdings was 164 as of September 30, 2013. The net expense ratio for the Fund was 1.06%.
The Alabama Tax Free Bond Fund
Fixed income investors have continued to focus on Federal Reserve policies in recent months, particularly as they relate to the continuation of quantitative easing. While market participants generally expected a reduction in bond buying by the Federal Reserve to occur in September, 2013, the Board of Governors deferred any modification to their policy until a later date. Bond prices recovered at that point and recouped some of the losses which occurred earlier in the year, though most bonds still posted slightly negative returns for the six month period ended September 30, 2013.
The municipal bond market was buffeted by the city of Detroit’s bankruptcy and headlines surrounding Puerto Rican debt problems. Even though The Alabama Tax Free Bond Fund does not have exposure to either of these issuers, the impact was felt throughout the municipal bond market and bond prices generally suffered as a result. Investors will be keeping a close eye on the bankruptcy proceedings in Detroit, the ultimate resolution of which could have an impact on outstanding municipal bond debt as it relates to the pension obligations to public employees versus the claims of bondholders. In general, the financial health of states and municipalities is improving, reflected by the 15 consecutive quarters of growth in state and local tax revenues. Additionally, pension liability and health-care obligations are drawing the necessary attention from lawmakers across the country and many have already introduced reforms in an effort to address the problems.
The Alabama Tax Free Bond Fund continues to maintain a defensive posture with a focus on short maturities and Alabama tax exempt issues rated at the higher end of the quality spectrum. The duration of the portfolio as of September 30, 2013 was 3.4 years, down slightly from 3.7 years as of March 31, 2013. More than 97% of the portfolio was invested in securities rated A, AA, or AAA by Moody’s or Standard and Poor’s rating agencies.
For the six months ended September 30, 2013, the Fund had a total return of -0.67%. The weighted average maturity of the portfolio was 3.7 years, slightly lower than the weighted average maturity of 3.9 years at the end of the last fiscal year ended March 31, 2013. The net assets of the Fund as of September 30, 2013 were $33,287,581 and the net asset value per share was $10.48. The ratio of net investment income to average net assets during the six months was 1.46% and the ratio of net expenses to average net assets was 0.65%.
The Alabama Tax Free Bond Fund continues to provide an attractive option for those investors seeking a no-load mutual fund that provides income which is sheltered from Federal and Alabama income taxes.
Thank you for your continued confidence in The Government Street Funds. Please call us if we can be of further service to you.
Very truly yours,
Thomas W. Leavell
President
Leavell Investment Management, Inc.
The Government Street Funds
Data presented reflects past performance, which is no guarantee of future results. Investment results and principal value will fluctuate so that shares, when redeemed, may be worth more or less than their original cost. Due to market volatility, current performance may be higher or lower than the performance shown.
This report is submitted for the general information of the shareholders of the Funds. The report is not authorized for distribution to prospective investors in the Funds unless it is accompanied by a current prospectus.
This report reflects our views, opinions and portfolio holdings as of September 30, 2013, the end of the reporting period. These views are subject to change at any time based upon market or other conditions. For more current information throughout the year please visit www.leavellinvestments.com.
THE GOVERNMENT STREET EQUITY FUND
PORTFOLIO INFORMATION
September 30, 2013 (Unaudited)
Sector Concentration
(% of Net Assets)
Top Ten Long-Term Holdings
| |
| Vanguard Mid-Cap ETF | 3.2% |
| Apple, Inc. | 3.1% |
| MasterCard, Inc. - Class A | 2.7% |
| JPMorgan Alerian MLP Index ETN | 2.6% |
| Walt Disney Company (The) | 2.2% |
| Visa, Inc. - Class A | 2.1% |
| iShares Russell 2000 Index Fund | 2.0% |
| ConocoPhillips | 2.0% |
| United Technologies Corporation | 1.9% |
| iShares Core S&P Mid-Cap ETF | 1.8% |
THE GOVERNMENT STREET MID-CAP FUND
PORTFOLIO INFORMATION
September 30, 2013 (Unaudited)
Sector Concentration
(% of Net Assets)
Top Ten Long-Term Holdings
| |
| Vanguard Mid-Cap ETF | 3.1% |
| iShares Core S&P Mid-Cap ETF | 2.8% |
SPDR® S&P MIDCAP 400® ETF Trust | 2.7% |
| Guggenheim Mid-Cap Core ETF | 2.6% |
| JPMorgan Alerian MLP Index ETN | 2.4% |
| Stericycle, Inc. | 1.5% |
| Colonial Properties Trust | 1.3% |
| Church & Dwight Company, Inc. | 1.3% |
| ONEOK, Inc. | 1.3% |
| iShares Nasdaq Biotechnology Index Fund | 1.3% |
THE ALABAMA TAX FREE BOND FUND
PORTFOLIO INFORMATION
September 30, 2013 (Unaudited)
Asset Allocation
(% of Net Assets)
|
| | |
| AAA | | 8.9% |
| AA | | 81.1% |
| A | | 7.8% |
| Not Rated | | 2.2% |
GOVERNMENT STREET EQUITY FUND
SCHEDULE OF INVESTMENTS
September 30, 2013 (Unaudited)
| | | | | | |
| Consumer Discretionary — 9.2% | | | | | | |
| Comcast Corporation - Class A | | | 30,000 | | | $ | 1,354,500 | |
| Home Depot, Inc. (The) | | | 14,200 | | | | 1,077,070 | |
| Johnson Controls, Inc. | | | 18,600 | | | | 771,900 | |
| McDonald's Corporation | | | 7,000 | | | | 673,470 | |
| NIKE, Inc. - Class B | | | 12,000 | | | | 871,680 | |
| Tractor Supply Company | | | 14,000 | | | | 940,380 | |
Urban Outfitters, Inc. (a) | | | 10,000 | | | | 367,700 | |
| Walt Disney Company (The) | | | 30,000 | | | | 1,934,700 | |
| | | | | | | | 7,991,400 | |
| Consumer Staples — 8.5% | | | | | | | | |
| Altria Group, Inc. | | | 30,000 | | | | 1,030,500 | |
| Anheuser-Busch InBev SA/NV - ADR | | | 10,000 | | | | 992,000 | |
| Coca-Cola Company (The) | | | 22,000 | | | | 833,360 | |
| Costco Wholesale Corporation | | | 1,500 | | | | 172,680 | |
| Kraft Foods Group, Inc. | | | 8,278 | | | | 434,098 | |
| McCormick & Company, Inc. - Non-Voting Shares | | | 7,000 | | | | 452,900 | |
Mondelēz International, Inc. - Class A | | | 23,336 | | | | 733,217 | |
| Philip Morris International, Inc. | | | 10,610 | | | | 918,720 | |
| Procter & Gamble Company (The) | | | 10,000 | | | | 755,900 | |
| Whole Foods Market, Inc. | | | 19,000 | | | | 1,111,500 | |
| | | | | | | | 7,434,875 | |
| Energy — 8.4% | | | | | | | | |
| Apache Corporation | | | 2,489 | | | | 211,913 | |
| Chevron Corporation | | | 9,300 | | | | 1,129,950 | |
| ConocoPhillips | | | 24,500 | | | | 1,702,995 | |
| Marathon Oil Corporation | | | 11,000 | | | | 383,680 | |
| Phillips 66 | | | 8,300 | | | | 479,906 | |
| Pioneer Natural Resources Company | | | 8,000 | | | | 1,510,400 | |
| Range Resources Corporation | | | 11,000 | | | | 834,790 | |
| Spectra Energy Corporation | | | 10,000 | | | | 342,300 | |
| TransCanada Corporation | | | 16,000 | | | | 703,040 | |
| | | | | | | | 7,298,974 | |
| Financials — 12.5% | | | | | | | | |
| Aflac, Inc. | | | 10,565 | | | | 654,924 | |
American Capital Ltd. (a) | | | 12,990 | | | | 178,613 | |
| American International Group, Inc. | | | 18,000 | | | | 875,340 | |
| Bank of America Corporation | | | 50,000 | | | | 690,000 | |
| Bank of New York Mellon Corporation (The) | | | 25,000 | | | | 754,750 | |
| Brookfield Asset Management, Inc. - Class A | | | 21,000 | | | | 785,400 | |
| Colonial Properties Trust | | | 20,400 | | | | 458,796 | |
| Cullen/Frost Bankers, Inc. | | | 14,500 | | | | 1,022,975 | |
| Goldman Sachs Group, Inc. (The) | | | 5,000 | | | | 791,050 | |
GOVERNMENT STREET EQUITY FUND
SCHEDULE OF INVESTMENTS (Continued)
COMMON STOCKS — 82.8% (Continued) | | | | | | |
| Financials — 12.5% (Continued) | | | | | | |
| JPMorgan Chase & Company | | | 27,000 | | | $ | 1,395,630 | |
| KKR & Company, L.P. | | | 20,000 | | | | 411,600 | |
| Plum Creek Timber Company, Inc. | | | 15,000 | | | | 702,450 | |
| Protective Life Corporation | | | 12,000 | | | | 510,600 | |
| Rayonier, Inc. | | | 13,000 | | | | 723,450 | |
| Wells Fargo & Company | | | 24,000 | | | | 991,680 | |
| | | | | | | | 10,947,258 | |
| Health Care — 10.6% | | | | | | | | |
| Abbott Laboratories | | | 10,000 | | | | 331,900 | |
| AbbVie, Inc. | | | 10,000 | | | | 447,300 | |
Alexion Pharmaceuticals, Inc. (a) | | | 7,240 | | | | 840,998 | |
| Cardinal Health, Inc. | | | 11,965 | | | | 623,975 | |
CareFusion Corporation (a) | | | 6,800 | | | | 250,920 | |
Cerner Corporation (a) | | | 10,430 | | | | 548,097 | |
Elan Corporation plc - ADR (a) | | | 4,950 | | | | 77,121 | |
| Fresenius Medical Care AG & Company KGaA - ADR | | | 5,000 | | | | 161,900 | |
Gilead Sciences, Inc. (a) | | | 16,000 | | | | 1,005,440 | |
Henry Schein, Inc. (a) | | | 3,500 | | | | 362,950 | |
| Novartis AG - ADR | | | 5,500 | | | | 421,905 | |
| Pfizer, Inc. | | | 25,000 | | | | 717,750 | |
Prothena Corporation plc (a) | | | 158 | | | | 3,196 | |
| Questcor Pharmaceuticals, Inc. | | | 4,000 | | | | 232,000 | |
Regeneron Pharmaceuticals, Inc. (a) | | | 2,300 | | | | 719,601 | |
Seattle Genetics, Inc. (a) | | | 5,000 | | | | 219,150 | |
| Shire plc - ADR | | | 5,000 | | | | 599,450 | |
| Techne Corporation | | | 10,000 | | | | 800,600 | |
Waters Corporation (a) | | | 8,625 | | | | 916,061 | |
| | | | | | | | 9,280,314 | |
| Industrials — 8.9% | | | | | | | | |
| C.H. Robinson Worldwide, Inc. | | | 3,000 | | | | 178,680 | |
| Emerson Electric Company | | | 15,000 | | | | 970,500 | |
| General Dynamics Corporation | | | 15,000 | | | | 1,312,800 | |
| General Electric Company | | | 34,000 | | | | 812,260 | |
| Ingersoll-Rand plc | | | 10,000 | | | | 649,400 | |
| Manitowoc Company, Inc. (The) | | | 14,000 | | | | 274,120 | |
| Norfolk Southern Corporation | | | 10,000 | | | | 773,500 | |
Quanta Services, Inc. (a) | | | 11,500 | | | | 316,365 | |
Stericycle, Inc. (a) | | | 7,000 | | | | 807,800 | |
| United Technologies Corporation | | | 15,500 | | | | 1,671,210 | |
| | | | | | | | 7,766,635 | |
| Information Technology — 17.5% | | | | | | | | |
| Accenture plc - Class A | | | 9,500 | | | | 699,580 | |
Adobe Systems, Inc. (a) | | | 20,000 | | | | 1,038,800 | |
| Apple, Inc. | | | 5,705 | | | | 2,719,859 | |
GOVERNMENT STREET EQUITY FUND
SCHEDULE OF INVESTMENTS (Continued)
COMMON STOCKS — 82.8% (Continued) | | | | | | |
| Information Technology — 17.5% (Continued) | | | | | | |
| Automatic Data Processing, Inc. | | | 12,400 | | | $ | 897,512 | |
| Broadridge Financial Solutions, Inc. | | | 5,000 | | | | 158,750 | |
eBay, Inc. (a) | | | 8,000 | | | | 446,320 | |
Google, Inc. - Class A (a) | | | 1,300 | | | | 1,138,683 | |
| International Business Machines Corporation | | | 8,500 | | | | 1,574,030 | |
| MasterCard, Inc. - Class A | | | 3,500 | | | | 2,354,730 | |
| NetApp, Inc. | | | 13,000 | | | | 554,060 | |
| QUALCOMM, Inc. | | | 8,000 | | | | 538,880 | |
| TE Connectivity Ltd. | | | 12,000 | | | | 621,360 | |
| Texas Instruments, Inc. | | | 10,000 | | | | 402,700 | |
| Visa, Inc. - Class A | | | 9,500 | | | | 1,815,450 | |
| Western Union Company (The) | | | 10,000 | | | | 186,600 | |
Yahoo!, Inc. (a) | | | 5,000 | | | | 165,800 | |
| | | | | | | | 15,313,114 | |
| Materials — 3.3% | | | | | | | | |
| Ecolab, Inc. | | | 5,000 | | | | 493,800 | |
| Freeport-McMoRan Copper & Gold, Inc. | | | 8,932 | | | | 295,471 | |
| International Paper Company | | | 5,000 | | | | 224,000 | |
| Monsanto Company | | | 5,000 | | | | 521,850 | |
| POSCO - ADR | | | 5,000 | | | | 368,200 | |
| Praxair, Inc. | | | 5,000 | | | | 601,050 | |
| Sherwin-Williams Company (The) | | | 2,100 | | | | 382,578 | |
| | | | | | | | 2,886,949 | |
| Telecommunication Services — 1.8% | | | | | | | | |
| Telstra Corporation Ltd. - ADR | | | 30,000 | | | | 695,700 | |
| Verizon Communications, Inc. | | | 18,000 | | | | 839,880 | |
| | | | | | | | 1,535,580 | |
| Utilities — 2.1% | | | | | | | | |
| Duke Energy Corporation | | | 19,000 | | | | 1,268,820 | |
| Wisconsin Energy Corporation | | | 14,000 | | | | 565,320 | |
| | | | | | | | 1,834,140 | |
| | | | | | | | | |
Total Common Stocks (Cost $42,454,099) | | | | | | $ | 72,289,239 | |
GOVERNMENT STREET EQUITY FUND
SCHEDULE OF INVESTMENTS (Continued)
EXCHANGE-TRADED FUNDS — 11.0% | | | | | | |
| Guggenheim S&P Equal Weight ETF | | | 23,000 | | | $ | 1,499,600 | |
| iShares Core S&P Mid-Cap ETF | | | 13,000 | | | | 1,613,820 | |
| iShares Russell 2000 Index Fund | | | 16,000 | | | | 1,705,920 | |
| Market Vectors Agribusiness ETF | | | 12,000 | | | | 615,960 | |
| ProShares Credit Suisse 130/30 ETF | | | 10,000 | | | | 794,088 | |
| Vanguard FTSE All World Ex-US Index ETF | | | 12,000 | | | | 583,200 | |
| Vanguard Mid-Cap ETF | | | 26,900 | | | | 2,754,022 | |
Total Exchange-Traded Funds (Cost $7,446,846) | | | | | | $ | 9,566,610 | |
EXCHANGE-TRADED NOTES — 2.6% | | | | | | |
| JPMorgan Alerian MLP Index ETN (Cost $1,843,715) | | | 52,000 | | | $ | 2,319,200 | |
| | | | | | |
American International Group, Inc., 01/19/2021 at $45 (a) (Cost $13,600) | | | 800 | | | $ | 15,160 | |
| | | | | | |
U.S. Bank, N.A., discount, 0.02% (c), due 10/01/2013 (Cost $3,205,000) | | $ | 3,205,000 | | | $ | 3,205,000 | |
MONEY MARKET FUNDS — 0.0% (b) | | | | | | |
Invesco STIT - STIC Prime Portfolio (The) - Institutional Class, 0.02% (d) (Cost $377) | | | 377 | | | $ | 377 | |
| | | | | | | | | |
Total Investments at Value — 100.1% (Cost $54,963,637) | | | | | | $ | 87,395,586 | |
| | | | | | | | | |
| Liabilities in Excess of Other Assets — (0.1%) | | | | | | | (101,333 | ) |
| | | | | | | | | |
| Net Assets — 100.0% | | | | | | $ | 87,294,253 | |
| ADR - American Depositary Receipt. |
| |
| (a) | Non-income producing security. |
| | |
| (b) | Percentage rounds to less than 0.1%. |
| | |
| (c) | Rate shown is the annualized yield at time of purchase, not a coupon rate. |
| | |
| (d) | The rate shown is the 7-day effective yield as of September 30, 2013. |
| | |
| See accompanying notes to financial statements. |
GOVERNMENT STREET MID-CAP FUND
SCHEDULE OF INVESTMENTS
September 30, 2013 (Unaudited)
| | | | | | |
| Consumer Discretionary — 13.0% | | | | | | |
| BorgWarner, Inc. | | | 2,800 | | | $ | 283,892 | |
Buffalo Wild Wings, Inc. (a) | | | 3,135 | | | | 348,675 | |
| Chico's FAS, Inc. | | | 7,100 | | | | 118,286 | |
| Coach, Inc. | | | 5,825 | | | | 317,637 | |
| Darden Restaurants, Inc. | | | 2,275 | | | | 105,310 | |
Dollar Tree, Inc. (a) | | | 4,200 | | | | 240,072 | |
| Family Dollar Stores, Inc. | | | 2,800 | | | | 201,656 | |
| Gildan Activewear, Inc. - Class A | | | 10,700 | | | | 496,908 | |
| Hasbro, Inc. | | | 2,525 | | | | 119,028 | |
HomeAway, Inc. (a) | | | 2,500 | | | | 70,000 | |
Jarden Corporation (a) | | | 9,025 | | | | 436,810 | |
| John Wiley & Sons, Inc. - Class A | | | 1,800 | | | | 85,842 | |
Liberty Global plc - Series A (a) | | | 4,475 | | | | 355,091 | |
| Nordstrom, Inc. | | | 3,900 | | | | 219,180 | |
O'Reilly Automotive, Inc. (a) | | | 2,825 | | | | 360,442 | |
Panera Bread Company - Class A (a) | | | 1,750 | | | | 277,427 | |
| PetSmart, Inc. | | | 3,500 | | | | 266,910 | |
| PVH Corporation | | | 3,700 | | | | 439,153 | |
| Ross Stores, Inc. | | | 6,000 | | | | 436,800 | |
| Service Corporation International | | | 15,200 | | | | 283,024 | |
| Tiffany & Company | | | 3,475 | | | | 266,255 | |
| Tractor Supply Company | | | 3,760 | | | | 252,559 | |
Urban Outfitters, Inc. (a) | | | 5,600 | | | | 205,912 | |
| Vail Resorts, Inc. | | | 1,700 | | | | 117,946 | |
| VF Corporation | | | 1,175 | | | | 233,884 | |
| | | | | | | | 6,538,699 | |
| Consumer Staples — 3.4% | | | | | | | | |
| Church & Dwight Company, Inc. | | | 10,800 | | | | 648,540 | |
| Hormel Foods Corporation | | | 12,000 | | | | 505,440 | |
| J.M. Smucker Company (The) | | | 4,700 | | | | 493,688 | |
| Tyson Foods, Inc. - Class A | | | 2,000 | | | | 56,560 | |
| | | | | | | | 1,704,228 | |
| Energy — 4.5% | | | | | | | | |
Cameron International Corporation (a) | | | 4,010 | | | | 234,064 | |
| Cimarex Energy Company | | | 3,250 | | | | 313,300 | |
| Murphy Oil Corporation | | | 3,740 | | | | 225,597 | |
| Noble Corporation | | | 5,360 | | | | 202,447 | |
| Peabody Energy Corporation | | | 8,200 | | | | 141,450 | |
| Pioneer Natural Resources Company | | | 1,330 | | | | 251,104 | |
| Range Resources Corporation | | | 3,500 | | | | 265,615 | |
| Schlumberger Ltd. | | | 3,134 | | | | 276,920 | |
Ultra Petroleum Corporation (a) | | | 9,900 | | | | 203,643 | |
GOVERNMENT STREET MID-CAP FUND
SCHEDULE OF INVESTMENTS (Continued)
COMMON STOCKS — 79.4% (Continued) | | | | | | |
| Energy — 4.5% (Continued) | | | | | | |
| Valero Energy Corporation | | | 4,950 | | | $ | 169,042 | |
| | | | | | | | 2,283,182 | |
| Financials — 14.9% | | | | | | | | |
Alexander & Baldwin, Inc. (a) | | | 3,000 | | | | 108,060 | |
Alleghany Corporation (a) | | | 765 | | | | 313,382 | |
| American Financial Group, Inc. | | | 6,600 | | | | 356,796 | |
Arch Capital Group Ltd. (a) | | | 5,650 | | | | 305,835 | |
| Arthur J. Gallagher & Company | | | 6,750 | | | | 294,637 | |
| Axis Capital Holdings Ltd. | | | 5,000 | | | | 216,550 | |
| Bank of Hawaii Corporation | | | 6,000 | | | | 326,700 | |
| Berkley (W.R.) Corporation | | | 6,450 | | | | 276,447 | |
| CME Group, Inc. | | | 2,735 | | | | 202,062 | |
| Colonial Properties Trust | | | 30,000 | | | | 674,700 | |
| Cullen/Frost Bankers, Inc. | | | 4,400 | | | | 310,420 | |
| Eaton Vance Corporation | | | 8,500 | | | | 330,055 | |
| Everest Re Group Ltd. | | | 2,050 | | | | 298,091 | |
| HCC Insurance Holdings, Inc. | | | 4,575 | | | | 200,476 | |
IntercontinentalExchange, Inc. (a) | | | 1,850 | | | | 335,627 | |
| Jones Lang LaSalle, Inc. | | | 2,800 | | | | 244,440 | |
| Kemper Corporation | | | 6,200 | | | | 208,320 | |
| Liberty Property Trust | | | 5,680 | | | | 202,208 | |
| NASDAQ OMX Group, Inc. (The) | | | 9,500 | | | | 304,855 | |
| New York Community Bancorp, Inc. | | | 12,970 | | | | 195,977 | |
| Old Republic International Corporation | | | 21,400 | | | | 329,560 | |
| PNC Financial Services Group, Inc. (The) | | | 2,745 | | | | 198,875 | |
| Potlatch Corporation | | | 6,941 | | | | 275,419 | |
| Rayonier, Inc. | | | 5,250 | | | | 292,162 | |
| Realty Income Corporation | | | 5,025 | | | | 199,744 | |
| SEI Investments Company | | | 10,000 | | | | 309,100 | |
| Westamerica Bancorporation | | | 4,370 | | | | 217,364 | |
| | | | | | | | 7,527,862 | |
| Health Care — 8.7% | | | | | | | | |
| Abaxis, Inc. | | | 1,000 | | | | 42,100 | |
Alexion Pharmaceuticals, Inc. (a) | | | 1,000 | | | | 116,160 | |
Bio-Rad Laboratories, Inc. - Class A (a) | | | 2,500 | | | | 293,900 | |
| Cantel Medical Corporation | | | 4,500 | | | | 143,325 | |
Charles River Laboratories International, Inc. (a) | | | 4,000 | | | | 185,040 | |
| Chemed Corporation | | | 1,000 | | | | 71,500 | |
| Computer Programs & Systems, Inc. | | | 1,800 | | | | 105,300 | |
Covance, Inc. (a) | | | 4,000 | | | | 345,840 | |
| Covidien plc | | | 1,500 | | | | 91,410 | |
Endo Health Solutions, Inc. (a) | | | 2,000 | | | | 90,880 | |
| Ensign Group, Inc. (The) | | | 3,000 | | | | 123,330 | |
Hanger, Inc. (a) | | | 4,000 | | | | 135,040 | |
GOVERNMENT STREET MID-CAP FUND
SCHEDULE OF INVESTMENTS (Continued)
COMMON STOCKS — 79.4% (Continued) | | | | | | |
| Health Care — 8.7% (Continued) | | | | | | |
Henry Schein, Inc. (a) | | | 3,000 | | | $ | 311,100 | |
Illumina, Inc. (a) | | | 2,000 | | | | 161,660 | |
ImmunoGen, Inc. (a) | | | 2,000 | | | | 34,040 | |
Intuitive Surgical, Inc. (a) | | | 200 | | | | 75,254 | |
Life Technologies Corporation (a) | | | 2,891 | | | | 216,334 | |
MEDNAX, Inc. (a) | | | 1,500 | | | | 150,600 | |
| ResMed, Inc. | | | 6,000 | | | | 316,920 | |
Seattle Genetics, Inc. (a) | | | 2,500 | | | | 109,575 | |
| Shire plc - ADR | | | 1,500 | | | | 179,835 | |
| Techne Corporation | | | 4,500 | | | | 360,270 | |
| Teleflex, Inc. | | | 4,000 | | | | 329,120 | |
United Therapeutics Corporation (a) | | | 1,000 | | | | 78,850 | |
| Universal Health Services, Inc. - Class B | | | 1,500 | | | | 112,485 | |
Waters Corporation (a) | | | 2,000 | | | | 212,420 | |
| | | | | | | | 4,392,288 | |
| Industrials — 12.4% | | | | | | | | |
| AMETEK, Inc. | | | 1,350 | | | | 62,127 | |
| C.H. Robinson Worldwide, Inc. | | | 5,000 | | | | 297,800 | |
| Deluxe Corporation | | | 5,000 | | | | 208,300 | |
| Donaldson Company, Inc. | | | 12,000 | | | | 457,560 | |
Engility Holdings, Inc. (a) | | | 500 | | | | 15,865 | |
| Expeditors International of Washington, Inc. | | | 6,000 | | | | 264,360 | |
| Fastenal Company | | | 9,950 | | | | 499,987 | |
| Graco, Inc. | | | 6,000 | | | | 444,360 | |
Jacobs Engineering Group, Inc. (a) | | | 4,475 | | | | 260,355 | |
| Joy Global, Inc. | | | 2,000 | | | | 102,080 | |
| L-3 Communications Holdings, Inc. | | | 3,000 | | | | 283,500 | |
| ManpowerGroup, Inc. | | | 4,000 | | | | 290,960 | |
| Matson, Inc. | | | 3,000 | | | | 78,690 | |
| MSC Industrial Direct Company, Inc. - Class A | | | 5,000 | | | | 406,750 | |
| Pentair Ltd. | | | 2,400 | | | | 155,856 | |
| Snap-on, Inc. | | | 4,275 | | | | 425,363 | |
| SPX Corporation | | | 5,000 | | | | 423,200 | |
Stericycle, Inc. (a) | | | 6,500 | | | | 750,100 | |
| Timken Company | | | 5,000 | | | | 302,000 | |
| Valmont Industries, Inc. | | | 700 | | | | 97,237 | |
| Waste Connections, Inc. | | | 6,000 | | | | 272,460 | |
WESCO International, Inc. (a) | | | 1,850 | | | | 141,581 | |
| | | | | | | | 6,240,491 | |
| Information Technology — 12.9% | | | | | | | | |
| ADTRAN, Inc. | | | 8,000 | | | | 213,120 | |
| Advent Software, Inc. | | | 8,000 | | | | 254,000 | |
Alliance Data Systems Corporation (a) | | | 2,020 | | | | 427,169 | |
Arrow Electronics, Inc. (a) | | | 8,600 | | | | 417,358 | |
GOVERNMENT STREET MID-CAP FUND
SCHEDULE OF INVESTMENTS (Continued)
COMMON STOCKS — 79.4% (Continued) | | | | | | |
| Information Technology — 12.9% (Continued) | | | | | | |
Cognizant Technology Solutions Corporation - Class A (a) | | | 3,000 | | | $ | 246,360 | |
Cree, Inc. (a) | | | 5,820 | | | | 350,306 | |
| Diebold, Inc. | | | 5,000 | | | | 146,800 | |
| DST Systems, Inc. | | | 4,000 | | | | 301,640 | |
FARO Technologies, Inc. (a) | | | 5,000 | | | | 210,850 | |
| Harris Corporation | | | 6,000 | | | | 355,800 | |
| IAC/InterActiveCorporation | | | 4,000 | | | | 218,680 | |
Integrated Device Technology, Inc. (a) | | | 10,000 | | | | 94,200 | |
| Jack Henry & Associates, Inc. | | | 9,000 | | | | 464,490 | |
Lam Research Corporation (a) | | | 6,000 | | | | 307,140 | |
| Linear Technology Corporation | | | 6,000 | | | | 237,960 | |
| Microchip Technology, Inc. | | | 5,000 | | | | 201,450 | |
| National Instruments Corporation | | | 12,000 | | | | 371,160 | |
| NetApp, Inc. | | | 5,000 | | | | 213,100 | |
NeuStar, Inc. - Class A (a) | | | 1,000 | | | | 49,480 | |
Polycom, Inc. (a) | | | 8,000 | | | | 87,360 | |
Rackspace Hosting, Inc. (a) | | | 4,000 | | | | 211,040 | |
Rovi Corporation (a) | | | 6,000 | | | | 115,020 | |
| SanDisk Corporation | | | 5,000 | | | | 297,550 | |
| Solera Holdings, Inc. | | | 4,000 | | | | 211,480 | |
| Xilinx, Inc. | | | 7,000 | | | | 328,020 | |
Zebra Technologies Corporation - Class A (a) | | | 4,000 | | | | 182,120 | |
| | | | | | | | 6,513,653 | |
| Materials — 5.8% | | | | | | | | |
| Airgas, Inc. | | | 4,000 | | | | 424,200 | |
| Albemarle Corporation | | | 8,000 | | | | 503,520 | |
| Ashland, Inc. | | | 3,000 | | | | 277,440 | |
| Cabot Corporation | | | 4,000 | | | | 170,840 | |
| Martin Marietta Materials, Inc. | | | 2,500 | | | | 245,425 | |
| Packaging Corporation of America | | | 5,000 | | | | 285,450 | |
| Scotts Miracle-Gro Company (The) - Class A | | | 4,000 | | | | 220,120 | |
| Sonoco Products Company | | | 5,000 | | | | 194,700 | |
| Steel Dynamics, Inc. | | | 12,000 | | | | 200,520 | |
| Valspar Corporation (The) | | | 6,000 | | | | 380,580 | |
| | | | | | | | 2,902,795 | |
| Utilities — 3.8% | | | | | | | | |
| AGL Resources, Inc. | | | 8,400 | | | | 386,652 | |
| Great Plains Energy, Inc. | | | 9,050 | | | | 200,910 | |
| ONEOK, Inc. | | | 12,000 | | | | 639,840 | |
| SCANA Corporation | | | 7,530 | | | | 346,681 | |
| Vectren Corporation | | | 10,600 | | | | 353,510 | |
| | | | | | | | 1,927,593 | |
| | | | | | | | | |
Total Common Stocks (Cost $22,974,050) | | | | | | $ | 40,030,791 | |
GOVERNMENT STREET MID-CAP FUND
SCHEDULE OF INVESTMENTS (Continued)
EXCHANGE-TRADED FUNDS — 14.8% | | | | | | |
First Trust NYSE Arca Biotechnology Index Fund (a) | | | 9,000 | | | $ | 583,200 | |
| Guggenheim Mid-Cap Core ETF | | | 31,000 | | | | 1,311,920 | |
| iShares Core S&P Mid-Cap ETF | | | 11,355 | | | | 1,409,610 | |
| iShares Nasdaq Biotechnology Index Fund | | | 3,000 | | | | 628,800 | |
| Schwab U.S. Mid-Cap ETF | | | 15,000 | | | | 519,300 | |
SPDR® S&P Homebuilders ETF Trust | | | 4,360 | | | | 133,285 | |
SPDR® S&P MIDCAP 400® ETF Trust | | | 6,000 | | | | 1,357,980 | |
| Vanguard Mid-Cap ETF | | | 15,000 | | | | 1,535,700 | |
Total Exchange-Traded Funds (Cost $5,651,527) | | | | | | $ | 7,479,795 | |
EXCHANGE-TRADED NOTES — 2.4% | | | | | | |
| JPMorgan Alerian MLP Index ETN (Cost $980,004) | | | 27,000 | | | $ | 1,204,200 | |
| | | | | | |
U.S. Bank, N.A., discount, 0.02% (b), due 10/01/2013 (Cost $1,733,000) | | $ | 1,733,000 | | | $ | 1,733,000 | |
MONEY MARKET FUNDS — 0.0% (c) | | | | | | |
Invesco STIT - STIC Prime Portfolio (The) - Institutional Class, 0.02% (d) (Cost $772) | | | 772 | | | $ | 772 | |
| | | | | | | | | |
Total Investments at Value — 100.1% (Cost $31,339,353) | | | | | | $ | 50,448,558 | |
| | | | | | | | | |
| Liabilities in Excess of Other Assets — (0.1%) | | | | | | | (31,436 | ) |
| | | | | | | | | |
| Net Assets — 100.0% | | | | | | $ | 50,417,122 | |
| ADR - American Depositary Receipt. |
| |
| (a) | Non-income producing security. |
| | |
| (b) | Rate shown is the annualized yield at time of purchase, not a coupon rate. |
| | |
| (c) | Percentage rounds to less than 0.1%. |
| | |
| (d) | The rate shown is the 7-day effective yield as of September 30, 2013. |
| | |
| See accompanying notes to financial statements. |
THE ALABAMA TAX FREE BOND FUND
SCHEDULE OF INVESTMENTS
September 30, 2013 (Unaudited)
ALABAMA FIXED RATE REVENUE AND
GENERAL OBLIGATION (GO) BONDS — 93.3% | | | | | | |
| Alabama Drinking Water Financing Auth., Rev., | | | | | | |
| 4.00%, due 08/15/2014 | | $ | 250,000 | | | $ | 251,270 | |
| 5.00%, due 08/15/2018 | | | 400,000 | | | | 421,092 | |
| Alabama State Public School & College Auth., Capital Improvements, Rev., | | | | | | | | |
| 5.00%, due 12/01/2017 | | | 470,000 | | | | 542,013 | |
| Alabama State Public School & College Auth., Capital Improvements, Series A, Rev., | | | | | | | | |
| 4.00%, due 02/01/2017 | | | 250,000 | | | | 274,448 | |
| 3.75%, due 02/01/2018 | | | 200,000 | | | | 218,802 | |
| Alabama State, GO, | | | | | | | | |
| 5.00%, due 02/01/2016 | | | 575,000 | | | | 610,989 | |
| Alabaster, AL, Water Rev., | | | | | | | | |
| 3.00%, due 09/01/2017 | | | 400,000 | | | | 424,424 | |
| Anniston, AL, Waterworks & Sewer Board, Water & Sewer Rev., | | | | | | | | |
| 3.50%, due 06/01/2016 | | | 500,000 | | | | 530,150 | |
| Athens, AL, Electric Rev., Warrants, | | | | | | | | |
| 3.00%, due 06/01/2016 | | | 510,000 | | | | 534,077 | |
| 3.00%, due 06/01/2019 | | | 375,000 | | | | 391,845 | |
| Athens, AL, GO, Warrants, | | | | | | | | |
| 4.00%, due 09/01/2018 | | | 300,000 | | | | 334,677 | |
| Auburn University, AL, General Fee Rev., | | | | | | | | |
| 5.00%, due 06/01/2018 | | | 315,000 | | | | 365,803 | |
| 5.00%, due 06/01/2020 | | | 350,000 | | | | 412,913 | |
| Auburn, AL, Refunding & Capital Improvements, Series B, GO, Warrants, | | | | | | | | |
| 4.00%, due 08/01/2018 | | | 200,000 | | | | 222,234 | |
| Auburn, AL, School, Series A, GO, Warrants, | | | | | | | | |
| 5.00%, due 08/01/2018 | | | 500,000 | | | | 579,520 | |
| Auburn, AL, Waterworks Board, Water Rev., | | | | | | | | |
| 5.00%, due 09/01/2014 | | | 205,000 | | | | 213,116 | |
| Baldwin Co., AL, Board of Education, Rev., | | | | | | | | |
| 5.00%, due 07/01/2018 | | | 590,000 | | | | 656,292 | |
| Baldwin Co., AL, GO, Warrants, | | | | | | | | |
| 5.00%, due 02/01/2015 | | | 200,000 | | | | 203,122 | |
| 4.00%, due 06/01/2019 | | | 200,000 | | | | 219,538 | |
| Baldwin Co., AL, Series A, GO, Warrants, | | | | | | | | |
| 5.00%, due 02/01/2017 | | | 320,000 | | | | 362,326 | |
| Birmingham, AL, Waterworks Board, Water Rev., | | | | | | | | |
| 5.00%, due 01/01/2017 | | | 400,000 | | | | 447,796 | |
| 3.625%, due 07/01/2018 | | | 250,000 | | | | 269,988 | |
THE ALABAMA TAX FREE BOND FUND
SCHEDULE OF INVESTMENTS (Continued)
ALABAMA FIXED RATE REVENUE AND
GENERAL OBLIGATION (GO) BONDS — 93.3% (Continued) | | | | | | |
| Calera, AL, GO, Warrants, | | | | | | |
| 3.00%, due 12/01/2016 | | $ | 250,000 | | | $ | 264,805 | |
| 3.00%, due 12/01/2017 | | | 410,000 | | | | 435,469 | |
| Calhoun Co., AL, Gas Tax Anticipation, Series A, Rev., Warrants, | | | | | | | | |
| 4.00%, due 03/01/2016 | | | 445,000 | | | | 475,233 | |
| Chambers Co., AL, Gasoline Tax Anticipation, Rev., Warrants, | | | | | | | | |
| 2.00%, due 11/01/2019 | | | 290,000 | | | | 283,997 | |
| Chelsea, AL, GO, | | | | | | | | |
| 4.00%, due 05/01/2015 | | | 260,000 | | | | 272,470 | |
| Decatur, AL, Sewer Rev., Warrants, | | | | | | | | |
| 3.00%, due 08/15/2019 | | | 500,000 | | | | 525,725 | |
| Enterprise, AL, GO, School Warrants, | | | | | | | | |
| 4.00%, due 02/01/2016 | | | 400,000 | | | | 430,412 | |
| Florence, AL, Board of Education, Rev., | | | | | | | | |
| 3.00%, due 03/01/2016 | | | 500,000 | | | | 524,300 | |
| Florence, AL, Electric Rev., Warrants, | | | | | | | | |
| 3.10%, due 06/01/2015 | | | 300,000 | | | | 310,419 | |
| 3.50%, due 06/01/2017 | | | 515,000 | | | | 550,355 | |
| Florence, AL, GO, Warrants, | | | | | | | | |
| 4.00%, due 08/01/2018 | | | 575,000 | | | | 632,356 | |
| Foley, AL, GO, Warrants, | | | | | | | | |
| 4.00%, due 01/01/2015 | | | 315,000 | | | | 329,033 | |
| Foley, AL, Utilities Board, Utilities Rev., | | | | | | | | |
| 4.00%, due 11/01/2018 | | | 710,000 | | | | 793,262 | |
| 4.00%, due 11/01/2019 | | | 225,000 | | | | 249,975 | |
| 4.50%, due 11/01/2019 | | | 250,000 | | | | 271,070 | |
| Gadsden, AL, GO, School Warrants, | | | | | | | | |
| 3.00%, due 08/01/2015 | | | 250,000 | | | | 259,480 | |
| Homewood, AL, Board of Education, Special Tax School Warrants, | | | | | | | | |
| 4.00%, due 04/01/2017 | | | 500,000 | | | | 546,320 | |
| Homewood, AL, GO, Warrants, | | | | | | | | |
| 5.00%, due 09/01/2015 | | | 250,000 | | | | 271,663 | |
| Hoover City, AL, Board of Education, Special Tax School Warrants, | | | | | | | | |
| 4.00%, due 02/15/2020 | | | 470,000 | | | | 516,615 | |
| 4.00%, due 02/15/2021 | | | 245,000 | | | | 266,425 | |
| 4.00%, due 02/15/2022 | | | 250,000 | | | | 268,175 | |
| Houston Co., AL, Board of Education, GO, Capital Outlay Warrants, | | | | | | | | |
| 4.00%, due 12/01/2013 | | | 545,000 | | | | 547,948 | |
THE ALABAMA TAX FREE BOND FUND
SCHEDULE OF INVESTMENTS (Continued)
ALABAMA FIXED RATE REVENUE AND
GENERAL OBLIGATION (GO) BONDS — 93.3% (Continued) | | | | | | |
| Houston Co., AL, GO, | | | | | | |
| 4.75%, due 10/15/2016 | | $ | 500,000 | | | $ | 523,545 | |
| Huntsville, AL, Electric Systems, Rev., | | | | | | | | |
| 4.00%, due 12/01/2013 | | | 300,000 | | | | 301,929 | |
| 3.00%, due 12/01/2016 | | | 375,000 | | | | 400,196 | |
| Huntsville, AL, GO, Capital Improvement Warrants, | | | | | | | | |
| 4.00%, due 03/01/2015 | | | 550,000 | | | | 578,782 | |
| 5.00%, due 11/01/2017, | | | | | | | | |
| Prerefunded 11/01/2013 @ 100 | | | 300,000 | | | | 301,239 | |
| Huntsville, AL, GO, Refunding and Capital Improvement Warrants, | | | | | | | | |
| 4.00%, due 09/01/2016 | | | 500,000 | | | | 547,490 | |
| 4.00%, due 09/01/2018 | | | 500,000 | | | | 559,980 | |
| Jacksonville, AL, GO, Warrants, | | | | | | | | |
| 2.00%, due 09/01/2016 | | | 200,000 | | | | 204,246 | |
| Limestone Co., AL, Board of Education, Special Tax Warrants, | | | | | | | | |
| 3.00%, due 11/01/2019 | | | 560,000 | | | | 580,619 | |
| Macon Co., AL, GO, Warrants, | | | | | | | | |
| 4.25%, due 10/01/2027, | | | | | | | | |
| Prerefunded 10/01/2017 @ 100 | | | 200,000 | | | | 226,114 | |
| Madison Co., AL, Board of Education, Rev., Tax Anticipation Warrants, | | | | | | | | |
| 2.00%, due 09/01/2019 | | | 220,000 | | | | 218,211 | |
| Madison Co., AL, Series A, Water Rev., Warrants, | | | | | | | | |
| 2.00%, due 07/01/2017 | | | 250,000 | | | | 257,883 | |
| Mobile Co., AL, GO, Refunding and Improvement Warrants, | | | | | | | | |
| 5.25%, due 08/01/2015, | | | | | | | | |
| Prerefunded 08/01/2014 @ 100 | | | 400,000 | | | | 416,820 | |
| Montgomery, AL, GO, Warrants, | | | | | | | | |
| 3.00%, due 11/01/2014 | | | 500,000 | | | | 514,415 | |
| 2.50%, due 04/01/2021 | | | 500,000 | | | | 504,160 | |
| Montgomery, AL, Waterworks & Sanitation, Rev., | | | | | | | | |
| 5.00%, due 09/01/2017 | | | 250,000 | | | | 286,020 | |
| Morgan Co., AL, Board of Education, Rev., Capital Outlay Warrants, | | | | | | | | |
| 4.00%, due 03/01/2019 | | | 250,000 | | | | 274,335 | |
| Mountain Brook, AL, City Board of Education, GO, Warrants, | | | | | | | | |
| 3.00%, due 03/01/2020 | | | 300,000 | | | | 315,372 | |
| North Alabama Gas District, Rev., | | | | | | | | |
| 3.00%, due 06/01/2020 | | | 420,000 | | | | 429,131 | |
THE ALABAMA TAX FREE BOND FUND
SCHEDULE OF INVESTMENTS (Continued)
ALABAMA FIXED RATE REVENUE AND
GENERAL OBLIGATION (GO) BONDS — 93.3% (Continued) | | | | | | |
| Opelika, AL, GO, Warrants, | | | | | | |
| 2.00%, due 11/01/2017 | | $ | 275,000 | | | $ | 281,985 | |
| Opelika, AL, Utilities Board, Series B, Rev., | | | | | | | | |
| 3.00%, due 06/01/2016 | | | 475,000 | | | | 498,821 | |
| 3.00%, due 06/01/2018 | | | 215,000 | | | | 225,735 | |
| Orange Beach, AL, GO, Warrants, | | | | | | | | |
| 4.00%, due 02/01/2018 | | | 200,000 | | | | 219,480 | |
| 5.00%, due 02/01/2019 | | | 240,000 | | | | 278,102 | |
| Prattville, AL, Waterworks Board, Rev., | | | | | | | | |
| 3.00%, due 08/01/2017 | | | 290,000 | | | | 306,359 | |
| Sheffield, AL, Electric Rev., | | | | | | | | |
| 4.00%, due 07/01/2017 | | | 600,000 | | | | 666,378 | |
| St. Clair Co., AL, GO, | | | | | | | | |
| 4.00%, due 08/01/2014 | | | 205,000 | | | | 210,853 | |
| Sumter Co., AL, School Rev., Warrants, | | | | | | | | |
| 4.50%, due 02/01/2031, | | | | | | | | |
| Prerefunded 02/01/2016 @ 100 | | | 500,000 | | | | 545,630 | |
| Tuscaloosa, AL, Series B, GO, Warrants, | | | | | | | | |
| 4.00%, due 01/01/2020 | | | 500,000 | | | | 556,935 | |
| University of Alabama, AL, Rev., | | | | | | | | |
| 4.00%, due 10/01/2014 | | | 500,000 | | | | 518,430 | |
| University of Alabama, AL, Series A, Rev., | | | | | | | | |
| 3.00%, due 07/01/2016 | | | 340,000 | | | | 361,379 | |
| 5.00%, due 07/01/2017 | | | 245,000 | | | | 281,059 | |
| Vestavia Hills, AL, GO, Warrants, | | | | | | | | |
| 4.00%, due 02/01/2018 | | | 515,000 | | | | 565,161 | |
| Vestavia Hills, AL, Series A, GO, Warrants, | | | | | | | | |
| 3.00%, due 02/01/2018 | | | 240,000 | | | | 255,989 | |
| Wetumpka, AL, Waterworks & Sewer, Rev., | | | | | | | | |
| 4.00%, due 03/01/2018 | | | 320,000 | | | | 346,688 | |
| | | | | | | | | |
Total Alabama Fixed Rate Revenue and General Obligation (GO) Bonds (Cost $30,644,503) | | | | | | $ | 31,071,413 | |
THE ALABAMA TAX FREE BOND FUND
SCHEDULE OF INVESTMENTS (Continued)
MONEY MARKET FUNDS — 7.3% | | | | | | |
Alpine Municipal Money Market Fund - Class I, 0.03% (a) | | | 1,510,967 | | | $ | 1,510,967 | |
Fidelity Tax Exempt Portfolio - Class I, 0.01% (a) | | | 907,375 | | | | 907,375 | |
Total Money Market Funds (Cost $2,418,342) | | | | | | $ | 2,418,342 | |
| | | | | | | | | |
Total Investments at Value — 100.6% (Cost $33,062,845) | | | | | | $ | 33,489,755 | |
| | | | | | | | | |
| Liabilities in Excess of Other Assets — (0.6%) | | | | | | | (202,174 | ) |
| | | | | | | | | |
| Net Assets — 100.0% | | | | | | $ | 33,287,581 | |
| (a) | The rate shown is the 7-day effective yield as of September 30, 2013. |
| | |
| See accompanying notes to financial statements. |
THE GOVERNMENT STREET FUNDS
STATEMENTS OF ASSETS AND LIABILITIES
September 30, 2013 (Unaudited)
| | Government Street Equity Fund | | | Government Street Mid-Cap Fund | | | | |
| ASSETS | | | | | | | | | |
| Investments in securities: | | | | | | | | | |
| At acquisition cost | | $ | 54,963,637 | | | $ | 31,339,353 | | | $ | 33,062,845 | |
| At value (Note 2) | | $ | 87,395,586 | | | $ | 50,448,558 | | | $ | 33,489,755 | |
| Cash | | | 21,317 | | | | — | | | | — | |
| Dividends and interest receivable | | | 68,474 | | | | 24,666 | | | | 273,140 | |
| Receivable for capital shares sold | | | 6,077 | | | | 2,564 | | | | — | |
| Other assets | | | 13,511 | | | | 10,461 | | | | 8,825 | |
| TOTAL ASSETS | | | 87,504,965 | | | | 50,486,249 | | | | 33,771,720 | |
| | | | | | | | | | | | | |
| LIABILITIES | | | | | | | | | | | | |
| Distributions payable | | | 10,110 | | | | — | | | | 4,028 | |
| Payable for investment securities purchased | | | — | | | | 28,834 | | | | 423,984 | |
| Payable for capital shares redeemed | | | 142,361 | | | | — | | | | 40,881 | |
| Accrued investment advisory fees (Note 4) | | | 42,818 | | | | 30,793 | | | | 5,816 | |
| Payable to administrator (Note 4) | | | 9,525 | | | | 6,275 | | | | 4,625 | |
| Other accrued expenses | | | 5,898 | | | | 3,225 | | | | 4,805 | |
| TOTAL LIABILITIES | | | 210,712 | | | | 69,127 | | | | 484,139 | |
| | | | | | | | | | | | | |
| NET ASSETS | | $ | 87,294,253 | | | $ | 50,417,122 | | | $ | 33,287,581 | |
| | | | | | | | | | | | | |
| Net assets consist of: | | | | | | | | | | | | |
| Paid-in capital | | $ | 54,853,180 | | | $ | 31,102,840 | | | $ | 32,912,412 | |
| Accumulated net investment income | | | 1,765 | | | | 175,466 | | | | 1,238 | |
Accumulated net realized gains (losses)
from security transactions | | | 7,359 | | | | 29,611 | | | | (52,979 | ) |
| Net unrealized appreciation on investments | | | 32,431,949 | | | | 19,109,205 | | | | 426,910 | |
| | | | | | | | | | | | | |
| Net assets | | $ | 87,294,253 | | | $ | 50,417,122 | | | $ | 33,287,581 | |
| | | | | | | | | | | | | |
Shares of beneficial interest outstanding (unlimited
number of shares authorized, $0.01 par value) | | | 1,518,568 | | | | 2,550,438 | | | | 3,177,613 | |
| | | | | | | | | | | | | |
Net asset value, offering price and
redemption price per share (Note 2) | | $ | 57.48 | | | $ | 19.77 | | | $ | 10.48 | |
| See accompanying notes to financial statements. |
THE GOVERNMENT STREET FUNDS
STATEMENTS OF OPERATIONS
Six Months Ended September 30, 2013 (Unaudited)
| | Government Street Equity Fund | | | Government Street Mid-Cap Fund | | | | |
| INVESTMENT INCOME | | | | | | | | | |
| Dividends | | $ | 885,152 | | | $ | 430,390 | | | $ | 238 | |
| Foreign withholding taxes on dividends | | | (13,557 | ) | | | (892 | ) | | | — | |
| Interest | | | 233 | | | | 204 | | | | 349,087 | |
| TOTAL INVESTMENT INCOME | | | 871,828 | | | | 429,702 | | | | 349,325 | |
| | | | | | | | | | | | | |
| EXPENSES | | | | | | | | | | | | |
| Investment advisory fees (Note 4) | | | 253,289 | | | | 180,116 | | | | 57,939 | |
| Administration fees (Note 4) | | | 51,692 | | | | 33,138 | | | | 24,125 | |
| Professional fees | | | 11,413 | | | | 10,038 | | | | 9,563 | |
| Account maintenance fees | | | 10,906 | | | | 6,198 | | | | 4,105 | |
| Registration and filing fees | | | 5,211 | | | | 4,832 | | | | 3,882 | |
| Compliance fees and expenses (Note 4) | | | 4,800 | | | | 4,071 | | | | 3,768 | |
| Trustees’ fees and expenses (Note 4) | | | 3,956 | | | | 3,956 | | | | 3,956 | |
| Custodian and bank service fees | | | 5,708 | | | | 3,735 | | | | 2,372 | |
| Pricing costs | | | 1,016 | | | | 1,473 | | | | 7,609 | |
| Printing of shareholder reports | | | 4,192 | | | | 2,515 | | | | 1,976 | |
| Insurance expense | | | 2,526 | | | | 1,560 | | | | 1,202 | |
| Postage and supplies | | | 1,760 | | | | 1,275 | | | | 1,026 | |
| Other expenses | | | 2,356 | | | | 1,329 | | | | 2,014 | |
| TOTAL EXPENSES | | | 358,825 | | | | 254,236 | | | | 123,537 | |
| Fees voluntarily waived by the Adviser (Note 4) | | | — | | | | — | | | | (15,935 | ) |
| NET EXPENSES | | | 358,825 | | | | 254,236 | | | | 107,602 | |
| | | | | | | | | | | | | |
| NET INVESTMENT INCOME | | | 513,003 | | | | 175,466 | | | | 241,723 | |
| | | | | | | | | | | | | |
| REALIZED AND UNREALIZED GAINS (LOSSES) ON INVESTMENTS | | | | | | | | | | | | |
Net realized gains (losses) from
security transactions | | | 1,075 | | | | (23,973 | ) | | | — | |
Net realized gains from in-kind
redemptions (Note 2) | | | 2,591,036 | | | | 1,248,993 | | | | — | |
Net change in unrealized appreciation
(depreciation) on investments | | | 3,275,892 | | | | 2,418,906 | | | | (462,251 | ) |
| | | | | | | | | | | | | |
NET REALIZED AND UNREALIZED
GAINS (LOSSES) ON INVESTMENTS | | | 5,868,003 | | | | 3,643,926 | | | | (462,251 | ) |
| | | | | | | | | | | | | |
NET INCREASE (DECREASE) IN NET
ASSETS FROM OPERATIONS | | $ | 6,381,006 | | | $ | 3,819,392 | | | $ | (220,528 | ) |
| See accompanying notes to financial statements. |
THE GOVERNMENT STREET FUNDS
STATEMENTS OF CHANGES IN NET ASSETS
| | | Government Street Equity Fund | | | Government Street Mid-Cap Fund | |
| | Six Months Ended Sept. 30,
2013 (Unaudited) | | | | | | Six Months Ended Sept. 30,
2013 (Unaudited) | | | | |
| FROM OPERATIONS | | | | | | | | | | | | |
| Net investment income | | $ | 513,003 | | | $ | 959,124 | | | $ | 175,466 | | | $ | 253,475 | |
Net realized gains (losses) from
security transactions | | | 1,075 | | | | 1,064,199 | | | | (23,973 | ) | | | 51,266 | |
Net realized gains from in-kind
redemptions (Note 2) | | | 2,591,036 | | | | 3,319,533 | | | | 1,248,993 | | | | 1,118,636 | |
Net change in unrealized appreciation
(depreciation) on investments | | | 3,275,892 | | | | 2,117,277 | | | | 2,418,906 | | | | 3,942,003 | |
| Net increase in net assets from operations | | | 6,381,006 | | | | 7,460,133 | | | | 3,819,392 | | | | 5,365,380 | |
| | | | | | | | | | | | | | | | | |
| DISTRIBUTIONS TO SHAREHOLDERS | | | | | | | | | | | | | | | | |
| From net investment income | | | (508,922 | ) | | | (956,588 | ) | | | — | | | | (267,235 | ) |
From net realized capital gains on
security transactions | | | — | | | | (1,539,170 | ) | | | — | | | | (107,026 | ) |
Decrease in net assets from
distributions to shareholders | | | (508,922 | ) | | | (2,495,758 | ) | | | — | | | | (374,261 | ) |
| | | | | | | | | | | | | | | | | |
| FROM CAPITAL SHARE TRANSACTIONS | | | | | | | | | | | | | | | | |
| Proceeds from shares sold | | | 3,946,982 | | | | 10,723,235 | | | | 2,593,629 | | | | 3,762,403 | |
Net asset value of shares issued in reinvestment
of distributions to shareholders | | | 485,606 | | | | 2,337,254 | | | | — | | | | 318,690 | |
| Payments for shares redeemed | | | (4,699,095 | ) | | | (8,604,620 | ) | | | (1,913,869 | ) | | | (2,997,134 | ) |
Net increase (decrease) in net assets from
capital share transactions | | | (266,507 | ) | | | 4,455,869 | | | | 679,760 | | | | 1,083,959 | |
| | | | | | | | | | | | | | | | | |
| TOTAL INCREASE IN NET ASSETS | | | 5,605,577 | | | | 9,420,244 | | | | 4,499,152 | | | | 6,075,078 | |
| | | | | | | | | | | | | | | | | |
| NET ASSETS | | | | | | | | | | | | | | | | |
| Beginning of period | | | 81,688,676 | | | | 72,268,432 | | | | 45,917,970 | | | | 39,842,892 | |
| End of period | | $ | 87,294,253 | | | $ | 81,688,676 | | | $ | 50,417,122 | | | $ | 45,917,970 | |
| | | | | | | | | | | | | | | | | |
ACCUMULATED (DISTRIBUTIONS
IN EXCESS OF) NET
INVESTMENT INCOME | | $ | 1,765 | | | $ | (2,316 | ) | | $ | 175,466 | | | $ | 9,624 | |
| | | | | | | | | | | | | | | | | |
| CAPITAL SHARE ACTIVITY | | | | | | | | | | | | | | | | |
| Shares sold | | | 70,837 | | | | 216,009 | | | | 136,633 | | | | 228,901 | |
| Shares reinvested | | | 8,696 | | | | 47,153 | | | | — | | | | 19,774 | |
| Shares redeemed | | | (84,652 | ) | | | (172,812 | ) | | | (100,937 | ) | | | (184,890 | ) |
| Net increase (decrease) in shares outstanding | | | (5,119 | ) | | | 90,350 | | | | 35,696 | | | | 63,785 | |
| Shares outstanding, beginning of period | | | 1,523,687 | | | | 1,433,337 | | | | 2,514,742 | | | | 2,450,957 | |
| Shares outstanding, end of period | | | 1,518,568 | | | | 1,523,687 | | | | 2,550,438 | | | | 2,514,742 | |
| See accompanying notes to financial statements. |
THE GOVERNMENT STREET FUNDS
STATEMENTS OF CHANGES IN NET ASSETS (Continued)
| | | Alabama Tax Free Bond Fund | |
| | Six Months Ended Sept. 30, 2013 (Unaudited) | | | | |
| FROM OPERATIONS | | | | | | |
| Net investment income | | $ | 241,723 | | | $ | 465,434 | |
| Net realized gains from security transactions | | | — | | | | 1,630 | |
| Net change in unrealized appreciation (depreciation) on investments | | | (462,251 | ) | | | (72,420 | ) |
| Net increase (decrease) in net assets from operations | | | (220,528 | ) | | | 394,644 | |
| | | | | | | | | |
| DISTRIBUTIONS TO SHAREHOLDERS | | | | | | | | |
| From net investment income | | | (245,321 | ) | | | (464,913 | ) |
| | | | | | | | | |
| FROM CAPITAL SHARE TRANSACTIONS | | | | | | | | |
| Proceeds from shares sold | | | 1,491,070 | | | | 10,825,742 | |
| Net asset value of shares issued in reinvestment of distributions to shareholders | | | 214,548 | | | | 386,377 | |
| Payments for shares redeemed | | | (1,216,834 | ) | | | (2,595,786 | ) |
| Net increase in net assets from capital share transactions | | | 488,784 | | | | 8,616,333 | |
| | | | | | | | | |
| TOTAL INCREASE IN NET ASSETS | | | 22,935 | | | | 8,546,064 | |
| | | | | | | | | |
| NET ASSETS | | | | | | | | |
| Beginning of period | | | 33,264,646 | | | | 24,718,582 | |
| End of period | | $ | 33,287,581 | | | $ | 33,264,646 | |
| | | | | | | | | |
| ACCUMULATED NET INVESTMENT INCOME | | $ | 1,238 | | | $ | 1,710 | |
| | | | | | | | | |
| CAPITAL SHARE ACTIVITY | | | | | | | | |
| Shares sold | | | 142,181 | | | | 1,014,633 | |
| Shares reinvested | | | 20,432 | | | | 36,212 | |
| Shares redeemed | | | (115,298 | ) | | | (243,171 | ) |
| Net increase in shares outstanding | | | 47,315 | | | | 807,674 | |
| Shares outstanding, beginning of period | | | 3,130,298 | | | | 2,322,624 | |
| Shares outstanding, end of period | | | 3,177,613 | | | | 3,130,298 | |
| See accompanying notes to financial statements. |
THE GOVERNMENT STREET EQUITY FUND
FINANCIAL HIGHLIGHTS
Selected Per Share Data and Ratios for a Share Outstanding Throughout Each Period
| | | Six Months Ended Sept. 30, 2013 | | | | |
| | | | | | | | | | | | | | | | | | | |
Net asset value at
beginning of period | | $ | 53.61 | | | $ | 50.42 | | | $ | 48.00 | | | $ | 40.89 | | | $ | 26.72 | | | $ | 44.76 | |
| | | | | | | | | | | | | | | | | | | | | | | | | |
Income (loss) from
investment operations: | | | | | | | | | | | | | | | | | | | | | | | | |
| Net investment income | | | 0.34 | | | | 0.64 | | | | 0.47 | | | | 0.39 | | | | 0.40 | | | | 0.55 | |
Net realized and unrealized gains
(losses) on investments | | 3.87 | | | | 4.21 | | | | 2.66 | | | | 7.19 | | | | 14.17 | | | | (18.07 | ) |
| Total from investment operations | | | 4.21 | | | | 4.85 | | | | 3.13 | | | | 7.58 | | | | 14.57 | | | | (17.52 | ) |
| | | | | | | | | | | | | | | | | | | | | | | | | |
| Less distributions: | | | | | | | | | | | | | | | | | | | | | | | | |
Dividends from net
investment income | | | (0.34 | ) | | | (0.64 | ) | | | (0.48 | ) | | | (0.39 | ) | | | (0.40 | ) | | | (0.52 | ) |
Distributions from net
realized gains | | | — | | | | (1.02 | ) | | | (0.23 | ) | | | (0.08 | ) | | | — | | | | — | |
| Total distributions | | | (0.34 | ) | | | (1.66 | ) | | | (0.71 | ) | | | (0.47 | ) | | | (0.40 | ) | | | (0.52 | ) |
| | | | | | | | | | | | | | | | | | | | | | | | | |
| Net asset value at end of period | | $ | 57.48 | | | $ | 53.61 | | | $ | 50.42 | | | $ | 48.00 | | | $ | 40.89 | | | $ | 26.72 | |
| | | | | | | | | | | | | | | | | | | | | | | | | |
Total return (a) | | | 7.86% | (b) | | | 9.93% | | | | 6.67% | | | | 18.69% | | | | 54.71% | | | | (39.43% | ) |
| | | | | | | | | | | | | | | | | | | | | | | | | |
| Net assets at end of period (000’s) | $ | 87,294 | | | $ | 81,689 | | | $ | 72,268 | | | $ | 66,373 | | | $ | 57,766 | | | $ | 37,656 | |
| | | | | | | | | | | | | | | | | | | | | | | | | |
Ratio of total expenses to
average net assets | | | 0.85% | (c) | | | 0.85% | | | | 0.87% | | | | 0.88% | | | | 0.90% | | | | 0.91% | |
| | | | | | | | | | | | | | | | | | | | | | | | | |
Ratio of net investment income
to average net assets | | | 1.21% | (c) | | | 1.29% | | | | 1.01% | | | | 0.92% | | | | 1.14% | | | | 1.47% | |
| | | | | | | | | | | | | | | | | | | | | | | | | |
| Portfolio turnover rate | | | 17% | (b) | | | 38% | | | | 36% | | | | 26% | | | | 30% | | | | 35% | |
| (a) | Total return is a measure of the change in value of an investment in the Fund over the period covered, which assumes any dividends or capital gains distributions are reinvested in shares of the Fund. Returns do not reflect the deduction of taxes a shareholder would pay on Fund distributions or the redemption of Fund shares. |
| | |
| (b) | Not annualized. |
| | |
| (c) | Annualized. |
| | |
| See accompanying notes to financial statements. |
THE GOVERNMENT STREET MID-CAP FUND
FINANCIAL HIGHLIGHTS
Selected Per Share Data and Ratios for a Share Outstanding Throughout Each Period
| | | Six Months Ended Sept. 30, 2013 | | | | |
| | | | | | | | | | | | | | | | | | | |
Net asset value at
beginning of period | | $ | 18.26 | | | $ | 16.26 | | | $ | 15.89 | | | $ | 12.87 | | | $ | 8.46 | | | $ | 12.28 | |
| | | | | | | | | | | | | | | | | | | | | | | | | |
Income (loss) from
investment operations: | | | | | | | | | | | | | | | | | | | | | | | | |
| Net investment income | | | 0.07 | | | | 0.10 | | | | 0.04 | | | | 0.03 | | | | 0.05 | | | | 0.05 | |
| Net realized and unrealized gains (losses) on investments | | 1.44 | | | | 2.05 | | | | 0.37 | | | | 3.03 | | | | 4.41 | | | | (3.82 | ) |
| Total from investment operations | | | 1.51 | | | | 2.15 | | | | 0.41 | | | | 3.06 | | | | 4.46 | | | | (3.77 | ) |
| | | | | | | | | | | | | | | | | | | | | | | | | |
| Less distributions: | | | | | | | | | | | | | | | | | | | | | | | | |
Dividends from net
investment income | | | — | | | | (0.11 | ) | | | (0.04 | ) | | | (0.03 | ) | | | (0.05 | ) | | | (0.05 | ) |
In excess of net
investment income | | | — | | | | — | | | | — | | | | (0.01 | ) | | | — | | | | (0.00 | )(a) |
Distributions from net
realized gains | | | — | | | | (0.04 | ) | | | (0.00 | )(a) | | | — | | | | — | | | | (0.00 | )(a) |
| Total distributions | | | — | | | | (0.15 | ) | | | (0.04 | ) | | | (0.04 | ) | | | (0.05 | ) | | | (0.05 | ) |
| | | | | | | | | | | | | | | | | | | | | | | | | |
| Net asset value at end of period | | $ | 19.77 | | | $ | 18.26 | | | $ | 16.26 | | | $ | 15.89 | | | $ | 12.87 | | | $ | 8.46 | |
| | | | | | | | | | | | | | | | | | | | | | | | | |
Total return (b) | | | 8.27% | (c) | | | 13.35% | | | | 2.59% | | | | 23.80% | | | | 52.73% | | | | (30.65% | ) |
| | | | | | | | | | | | | | | | | | | | | | | | | |
| Net assets at end of period (000’s) | $ | 50,417 | | | $ | 45,918 | | | $ | 39,843 | | | $ | 39,983 | | | $ | 32,198 | | | $ | 21,522 | |
| | | | | | | | | | | | | | | | | | | | | | | | | |
Ratio of total expenses to
average net assets | | | 1.06% | (d) | | | 1.08% | | | | 1.09% | | | | 1.13% | | | | 1.18% | | | | 1.23% | |
| | | | | | | | | | | | | | | | | | | | | | | | | |
Ratio of net expenses to
average net assets | | | 1.06% | (d) | | | 1.08% | | | | 1.09% | | | | 1.13% | | | | 1.13% | (e) | | | 1.10% | (e) |
| | | | | | | | | | | | | | | | | | | | | | | | | |
Ratio of net investment income
to average net assets | | | 0.73% | (d) | | | 0.63% | | | | 0.29% | | | | 0.21% | | | | 0.47% | (e) | | | 0.47% | (e) |
| | | | | | | | | | | | | | | | | | | | | | | | | |
| Portfolio turnover rate | | | 7% | (c) | | | 12% | | | | 18% | | | | 20% | | | | 10% | | | | 14% | |
| (a) | Amount rounds to less than $0.01 per share. |
| | |
| (b) | Total return is a measure of the change in value of an investment in the Fund over the period covered, which assumes any dividends or capital gains distributions are reinvested in shares of the Fund. Returns do not reflect the deduction of taxes a shareholder would pay on Fund distributions or the redemption of Fund shares. |
| | |
| (c) | Not annualized. |
| | |
| (d) | Annualized. |
| | |
| (e) | Ratios were determined after voluntary advisory fee waivers by the Adviser. |
| | |
| See accompanying notes to financial statements. |
THE ALABAMA TAX FREE BOND FUND
FINANCIAL HIGHLIGHTS
Selected Per Share Data and Ratios for a Share Outstanding Throughout Each Period
| | | Six Months Ended Sept. 30, 2013 | | | | |
| | | | | | | | | | | | | | | | | | | |
Net asset value at
beginning of period | | $ | 10.63 | | | $ | 10.64 | | | $ | 10.45 | | | $ | 10.53 | | | $ | 10.54 | | | $ | 10.50 | |
| | | | | | | | | | | | | | | | | | | | | | | | | |
Income (loss) from
investment operations: | | | | | | | | | | | | | | | | | | | | | | | | |
| Net investment income | | | 0.08 | | | | 0.18 | | | | 0.23 | | | | 0.26 | | | | 0.28 | | | | 0.35 | |
| Net realized and unrealized gains (losses) on investments | | (0.15 | ) | | | (0.01 | ) | | | 0.19 | | | | (0.07 | ) | | | (0.00 | )(a) | | | 0.04 | |
| Total from investment operations | | | (0.07 | ) | | | 0.17 | | | | 0.42 | | | | 0.19 | | | | 0.28 | | | | 0.39 | |
| | | | | | | | | | | | | | | | | | | | | | | | | |
| Less distributions: | | | | | | | | | | | | | | | | | | | | | | | | |
Dividends from net
investment income | | | (0.08 | ) | | | (0.18 | ) | | | (0.23 | ) | | | (0.27 | ) | | | (0.28 | ) | | | (0.35 | ) |
Distributions from net
realized gains | | | — | | | | — | | | | — | | | | (0.00 | )(a) | | | (0.01 | ) | | | (0.00 | )(a) |
| Total distributions | | | (0.08 | ) | | | (0.18 | ) | | | (0.23 | ) | | | (0.27 | ) | | | (0.29 | ) | | | (0.35 | ) |
| | | | | | | | | | | | | | | | | | | | | | | | | |
| Net asset value at end of period | | $ | 10.48 | | | $ | 10.63 | | | $ | 10.64 | | | $ | 10.45 | | | $ | 10.53 | | | $ | 10.54 | |
| | | | | | | | | | | | | | | | | | | | | | | | | |
Total return (b) | | | (0.67% | )(c) | | | 1.64% | | | | 4.04 | | | | 1.78% | | | | 2.88% | | | | 3.80% | |
| | | | | | | | | | | | | | | | | | | | | | | | | |
| Net assets at end of period (000’s) | $ | 33,288 | | | $ | 33,265 | | | $ | 24,719 | | | $ | 27,026 | | | $ | 29,716 | | | $ | 28,358 | |
| | | | | | | | | | | | | | | | | | | | | | | | | |
Ratio of total expenses to
average net assets | | | 0.75% | (d) | | | 0.76% | | | | 0.80% | | | | 0.77% | | | | 0.75% | | | | 0.79% | |
| | | | | | | | | | | | | | | | | | | | | | | | | |
Ratio of net expenses to
average net assets (e) | | | 0.65% | (d) | | | 0.65% | | | | 0.65% | | | | 0.65% | | | | 0.65% | | | | 0.65% | |
| | | | | | | | | | | | | | | | | | | | | | | | | |
Ratio of net investment income
to average net assets (e) | | | 1.46% | (d) | | | 1.70% | | | | 2.17% | | | | 2.51% | | | | 2.85% | | | | 3.36% | |
| | | | | | | | | | | | | | | | | | | | | | | | | |
Portfolio turnover rate | | | 5% | (c) | | | 7% | | | | 18% | | | | 21% | | | | 32% | | | | 8% | |
| (a) | Amount rounds to less than $0.01 per share. |
| | |
| (b) | Total return is a measure of the change in value of an investment in the Fund over the period covered, which assumes any dividends or capital gains distributions are reinvested in shares of the Fund. Returns do not reflect the deduction of taxes a shareholder would pay on Fund distributions or the redemption of Fund shares. |
| | |
| (c) | Not annualized. |
| | |
| (d) | Annualized. |
| | |
| (e) | Ratios were determined after voluntary advisory fee waivers by the Adviser (Note 4). |
| | |
| See accompanying notes to financial statements. |
THE GOVERNMENT STREET FUNDS
NOTES TO FINANCIAL STATEMENTS
September 30, 2013 (Unaudited)
1. Organization
The Government Street Equity Fund, The Government Street Mid-Cap Fund and The Alabama Tax Free Bond Fund (the “Funds”) are each a no-load series of the Williamsburg Investment Trust (the “Trust”), an open-end management investment company registered under the Investment Company Act of 1940. The Government Street Equity Fund and The Government Street Mid-Cap Fund are each a diversified fund and The Alabama Tax Free Bond Fund is a non-diversified fund. The Trust was organized as a Massachusetts business trust on July 18, 1988. Other series of the Trust are not included in this report.
The Government Street Equity Fund’s investment objective is to seek capital appreciation.
The Government Street Mid-Cap Fund’s investment objective is to seek capital appreciation.
The Alabama Tax Free Bond Fund’s investment objectives are to provide current income exempt from federal income taxes and from the personal income taxes of Alabama and to preserve capital.
2. Significant Accounting Policies
The following is a summary of the Funds’ significant accounting policies. The policies are in conformity with accounting principles generally accepted in the United States of America (“GAAP”).
Securities valuation — The Funds’ portfolio securities are valued as of the close of business of the regular session of the New York Stock Exchange (normally 4:00 p.m., Eastern time). Securities traded on a national stock exchange are valued based upon the closing price on the principal exchange where the security is traded. Securities which are quoted by NASDAQ are valued at the NASDAQ Official Closing Price. Securities which are traded over-the-counter are valued at the last sales price, if available, otherwise, at the last quoted bid price. It is expected that fixed income securities will ordinarily be traded in the over-the-counter market, and common stocks will ordinarily be traded on a national securities exchange, but may also be traded in the over-the-counter market.
When market quotations are not readily available, securities may be valued on the basis of prices provided by an independent pricing service. The prices provided by the pricing service are determined with consideration given to institutional bid and last sale prices and take into account securities prices, yields, maturities, call features, ratings, institutional trading in similar groups of securities and developments related to specific securities. If a pricing service cannot provide a valuation or the investment adviser believes the price received from the pricing service is not indicative of fair value, securities will be valued in
THE GOVERNMENT STREET FUNDS
NOTES TO FINANCIAL STATEMENTS (Continued)
good faith at fair value using procedures established by and under the general supervision of the Board of Trustees and will be classified as Level 2 or 3 within the fair value hierarchy (see below), depending on the inputs used. Such methods of fair valuation may include, but are not limited to: multiple of earnings, multiple of book value, discount from market of a similar freely traded security, purchase price of the security, subsequent private transactions in the security or related securities, or a combination of these and other factors. Short-term instruments (those with remaining maturities of 60 days or less) may be valued at amortized cost, which approximates market value.
GAAP establishes a single authoritative definition of fair value, sets out a framework for measuring fair value and requires additional disclosures about fair value measurements.
Various inputs are used in determining the value of each of the Fund’s investments. These inputs are summarized in the three broad levels listed below:
| • | Level 1 – quoted prices in active markets for identical securities |
| • | Level 2 – other significant observable inputs |
| • | Level 3 – significant unobservable inputs |
Fixed income securities, including municipal bonds, are classified as Level 2 since the values for such securities are based on prices provided by an independent pricing service that utilizes various “other significant observable inputs” including bid and ask quotations, prices of similar securities and interest rates, among other factors. Commercial paper held by the Funds is classified as Level 2 since it is valued at amortized cost, which approximates the current fair value of the security and is not obtained from a quoted price in an active market.
The inputs or methodology used for valuing securities are not necessarily an indication of the risks associated with investing in those securities. The inputs used to measure fair value may fall into different levels of the fair value hierarchy. In such cases, for disclosure purposes, the level in the fair value hierarchy within which the fair value measurement falls in its entirety is determined based on the lowest level input that is significant to the fair value measurement.
The following is a summary of the inputs used to value each Fund’s investments as of September 30, 2013 by security type:
The Government Street Equity Fund | | | | | | | | | | | | |
| Common Stocks | | $ | 72,289,239 | | | $ | — | | | $ | — | | | $ | 72,289,239 | |
| Exchange-Traded Funds | | | 9,566,610 | | | | — | | | | — | | | | 9,566,610 | |
| Exchange-Traded Notes | | | 2,319,200 | | | | — | | | | — | | | | 2,319,200 | |
| Warrants | | | 15,160 | | | | — | | | | — | | | | 15,160 | |
| Commercial Paper | | | — | | | | 3,205,000 | | | | — | | | | 3,205,000 | |
| Money Market Funds | | | 377 | | | | — | | | | — | | | | 377 | |
| Total | | $ | 84,190,586 | | | $ | 3,205,000 | | | $ | — | | | $ | 87,395,586 | |
THE GOVERNMENT STREET FUNDS
NOTES TO FINANCIAL STATEMENTS (Continued)
The Government Street Mid-Cap Fund | | | | | | | | | | | | |
| Common Stocks | | $ | 40,030,791 | | | $ | — | | | $ | — | | | $ | 40,030,791 | |
| Exchange-Traded Funds | | | 7,479,795 | | | | — | | | | — | | | | 7,479,795 | |
| Exchange-Traded Notes | | | 1,204,200 | | | | — | | | | — | | | | 1,204,200 | |
| Commercial Paper | | | — | | | | 1,733,000 | | | | — | | | | 1,733,000 | |
| Money Market Funds | | | 772 | | | | — | | | | — | | | | 772 | |
| Total | | $ | 48,715,558 | | | $ | 1,733,000 | | | $ | — | | | $ | 50,448,558 | |
The Alabama Tax Free Bond Fund | | | | | | | | | | | | |
| Municipal Bonds | | $ | — | | | $ | 31,071,413 | | | $ | — | | | $ | 31,071,413 | |
| Money Market Funds | | | 2,418,342 | | | | — | | | | — | | | | 2,418,342 | |
| Total | | $ | 2,418,342 | | | $ | 31,071,413 | | | $ | — | | | $ | 33,489,755 | |
Refer to The Government Street Equity Fund’s and The Government Street Mid-Cap Fund’s Schedules of Investments for a listing of the common stocks by sector type. As of September 30, 2013, the Funds did not have any transfers in and out of any Level. There were no Level 3 securities or derivative instruments held in the Funds as of September 30, 2013. It is the Funds’ policy to recognize transfers into and out of any Level at the end of the reporting period.
Share valuation — The net asset value per share of each Fund is calculated daily by dividing the total value of its assets, less liabilities, by the number of shares outstanding. The offering price and redemption price per share of each Fund is equal to the net asset value per share.
Investment income — Interest income is accrued as earned. Dividend income is recorded on the ex-dividend date. Discounts and premiums on fixed-income securities purchased are amortized using the interest method.
Distributions to shareholders — Dividends arising from net investment income are declared and paid quarterly to shareholders of The Government Street Equity Fund; declared and paid annually to shareholders of The Government Street Mid-Cap Fund; and declared daily and paid monthly to shareholders of The Alabama Tax Free Bond Fund. Net realized short-term capital gains, if any, may be distributed throughout the year and net realized long-term capital gains, if any, are distributed at least once each year. The amount of distributions from net investment income and net realized gains are determined in accordance with federal income tax regulations, which may differ from GAAP. These “book/tax” differences are either temporary or permanent in nature.
THE GOVERNMENT STREET FUNDS
NOTES TO FINANCIAL STATEMENTS (Continued)
The tax character of distributions paid during the periods ended September 30, 2013 and March 31, 2013 is as follows:
| | | | | | Exempt- Interest Dividends | | | | | | | |
| The Government Street Equity Fund | 9/30/13 | | $ | 508,922 | | | $ | — | | | $ | — | | | $ | 508,922 | |
| | 3/31/13 | | $ | 1,017,044 | | | $ | — | | | $ | 1,478,714 | | | $ | 2,495,758 | |
| The Government Street Mid-Cap Fund | 9/30/13 | | $ | — | | | $ | — | | | $ | — | | | $ | — | |
| | 3/31/13 | | $ | 267,235 | | | $ | — | | | $ | 107,026 | | | $ | 374,261 | |
| The Alabama Tax Free Bond Fund | 9/30/13 | | $ | — | | | $ | 245,321 | | | $ | — | | | $ | 245,321 | |
| | 3/31/13 | | $ | 1,252 | | | $ | 463,661 | | | $ | — | | | $ | 464,913 | |
Security transactions — Security transactions are accounted for on trade date for financial reporting purposes. Gains and losses on securities sold are determined on a specific identification basis.
Common expenses — Common expenses of the Trust are allocated among the series of the Trust based on relative net assets of each series or the nature of the services performed and the relative applicability to each series.
Estimates — The preparation of financial statements in conformity with GAAP requires management to make estimates and assumptions that affect the reported amounts of assets and liabilities and the disclosure of contingent assets and liabilities as of the date of the financial statements and the reported amounts of income and expenses during the reporting period. Actual results could differ from those estimates.
Federal income tax — It is each Fund’s policy to comply with the special provisions of Subchapter M of the Internal Revenue Code applicable to regulated investment companies. As provided therein, in any fiscal year in which a Fund so qualifies, and distributes at least 90% of its taxable net income, the Fund (but not the shareholders) will be relieved of federal income tax on the income distributed. Accordingly, no provision for income taxes has been made.
In order to avoid imposition of the excise tax applicable to regulated investment companies, it is also each Fund’s intention to declare as dividends in each calendar year at least 98% of its net investment income (earned during the calendar year) and 98.2% of its net realized capital gains (earned during the twelve months ended October 31) plus undistributed amounts from prior years.
THE GOVERNMENT STREET FUNDS
NOTES TO FINANCIAL STATEMENTS (Continued)
The following information is computed on a tax basis for each item as of September 30, 2013:
| | The Government Street Equity Fund | | | The Government Street Mid-Cap Fund | | | The Alabama Tax Free Bond Fund | |
| Cost of portfolio investments | | $ | 54,963,637 | | | $ | 31,339,353 | | | $ | 33,062,845 | |
| Gross unrealized appreciation | | $ | 32,634,193 | | | $ | 19,433,149 | | | $ | 681,081 | |
| Gross unrealized depreciation | | | (202,244 | ) | | | (323,944 | ) | | | (254,171 | ) |
| Net unrealized appreciation | | | 32,431,949 | | | | 19,109,205 | | | | 426,910 | |
| Undistributed ordinary income | | | 11,875 | | | | 175,466 | | | | 1,238 | |
| Undistributed tax exempt income | | | — | | | | — | | | | 2,790 | |
| Undistributed long-term gains | | | 6,284 | | | | 43,960 | | | | — | |
| Capital loss carryforwards | | | — | | | | — | | | | (40,120 | ) |
| Other gains (losses) | | | 1,075 | | | | (14,349 | ) | | | (11,621 | ) |
| Other temporary differences | | | (10,110 | ) | | | — | | | | (4,028 | ) |
| Total distributable earnings | | $ | 32,441,073 | | | $ | 19,314,282 | | | $ | 375,169 | |
As of March 31, 2013, The Alabama Tax Free Bond Fund had a short-term capital loss carryforward for federal income tax purposes of $23,075 and a long-term capital loss carryforward for federal income tax purposes of $17,045, both of which may be carried forward indefinitely. These capital loss carryforwards are available to offset realized capital gains in the current and future years, thereby reducing future taxable gains distributions.
During the six months ended September 30, 2013, The Government Street Equity Fund and The Government Street Mid-Cap Fund realized $2,591,036 and $1,248,993, respectively, of net capital gains resulting from in-kind redemptions (redemptions in which shareholders who redeemed Fund shares received securities held by the Fund rather than cash). The Funds recognize a gain on in-kind redemptions to the extent that the value of the distributed securities on the date of redemption exceeds the cost of those securities. Such gains are not taxable to the Funds and are not required to be distributed to shareholders. The Funds have reclassified these amounts against paid-in capital. These reclassifications are reflected on the Statements of Assets and Liabilities. Such reclassifications, the result of permanent differences between the financial statement and income tax reporting requirements, had no effect on each Fund’s net assets or net asset value per share.
THE GOVERNMENT STREET FUNDS
NOTES TO FINANCIAL STATEMENTS (Continued)
For the six months ended September 30, 2013, The Government Street Mid-Cap Fund reclassified $9,624 of accumulated net realized losses from security transactions against accumulated net investment income and The Alabama Tax Free Bond Fund reclassified $3,126 of accumulated net investment loss against accumulated net realized losses from security transactions on the Statements of Assets and Liabilities. Such reclassifications, the result of permanent differences between the financial statement and income tax reporting requirements, had no effect on the Funds’ net assets or net asset value per share.
The Funds recognize the tax benefits or expenses of uncertain tax positions only when the position is “more likely than not” to be sustained assuming examination by tax authorities. Management has reviewed the tax positions taken on federal income tax returns for all open tax years (tax years ended March 31, 2010 through March 31, 2013) of each Fund and has concluded that no provision for unrecognized tax benefits or expenses is required in these financial statements.
3. Investment Transactions
During the six months ended September 30, 2013, cost of purchases and proceeds from sales and maturities of investment securities, other than short-term investments and U.S. government securities, totaled $13,754,426 and $14,687,201, respectively, for The Government Street Equity Fund; $4,135,127 and $3,115,555, respectively, for The Government Street Mid-Cap Fund; and $2,213,071 and $1,699,500, respectively, for The Alabama Tax Free Bond Fund.
4. Transactions with Related Parties
INVESTMENT ADVISORY AGREEMENT
The Funds’ investments are managed by Leavell Investment Management, Inc. (the “Adviser”) under the terms of an Investment Advisory Agreement. The Government Street Equity Fund pays the Adviser a fee, which is computed and accrued daily and paid monthly, at an annual rate of .60% of its average daily net assets up to $100 million and .50% of such assets in excess of $100 million. The Government Street Mid-Cap Fund pays the Adviser a fee, which is computed and accrued daily and paid monthly, at an annual rate of .75% of its average daily net assets. The Alabama Tax Free Bond Fund pays the Adviser a fee, which is computed and accrued daily and paid monthly, at an annual rate of .35% of its average daily net assets up to $100 million and .25% of such assets in excess of $100 million.
During the six months ended September 30, 2013, the Adviser voluntarily undertook to limit the total operating expenses of The Alabama Tax Free Bond Fund to .65% of the Fund’s average daily net assets. Accordingly, the Adviser waived $15,935 of its investment advisory fees from The Alabama Tax Free Bond Fund during the six months ended September 30, 2013.
THE GOVERNMENT STREET FUNDS
NOTES TO FINANCIAL STATEMENTS (Continued)
Certain officers of the Trust are also officers of the Adviser.
MUTUAL FUND SERVICES AGREEMENT
Under the terms of a Mutual Fund Services Agreement between the Trust and Ultimus Fund Solutions, LLC (“Ultimus”), Ultimus provides administrative, pricing, accounting, dividend disbursing, shareholder servicing and transfer agent services for the Funds. For these services, Ultimus receives a monthly fee from each Fund at an annual rate of .15% of the Fund’s average daily net assets up to $25 million, .125% of the next $25 million of such assets, and .10% of such assets in excess of $50 million. The Government Street Equity Fund and The Government Street Mid-Cap Fund are each subject to a minimum monthly fee of $4,500 and The Alabama Tax Free Bond Fund is subject to a minimum monthly fee of $4,000. In addition, each Fund pays out-of-pocket expenses including, but not limited to, postage, supplies and costs of pricing portfolio securities.
Certain officers of the Trust are also officers of Ultimus, or of Ultimus Fund Distributors, LLC (the “Distributor”), the principal underwriter of each Fund’s shares and an affiliate of Ultimus. The Distributor is compensated by the Adviser (not the Funds) for acting as principal underwriter.
COMPLIANCE CONSULTING AGREEMENT
Under the terms of a Compliance Consulting Agreement between the Trust and Ultimus, Ultimus provides an individual to serve as the Trust’s Chief Compliance Officer and to administer the Funds’ compliance policies and procedures. For these services, the Funds pay Ultimus an annual base fee of $18,600 plus an asset-based fee equal to 0.01% per annum on the Funds’ aggregate net assets in excess of $100 million. Each Fund pays its proportionate share of such fee. In addition, the Funds reimburse Ultimus for reasonable out-of-pocket expenses, if any, incurred in connection with these services.
COMPENSATION OF TRUSTEES
Trustees and officers affiliated with the Adviser or Ultimus are not compensated by the Trust for their services. Each Trustee who is not an affiliated person of the Adviser or Ultimus receives from the Trust an annual retainer of $10,000, payable quarterly; a fee of $1,500 for attendance at each meeting of the Board of Trustees (except that such fee is $2,500 for the independent chairman); and $1,000 for attendance at each meeting of any committee of the Board (except that such fee is $1,500 for the committee chairman); plus reimbursement of travel and other expenses incurred in attending meetings. Prior to July 1, 2013, the annual retainer was $8,000.
THE GOVERNMENT STREET FUNDS
NOTES TO FINANCIAL STATEMENTS (Continued)
5. Contingencies and Commitments
The Funds indemnify the Trust’s officers and Trustees for certain liabilities that might arise from their performance of their duties to the Funds. Additionally, in the normal course of business the Funds enter into contracts that contain a variety of representations and warranties and which provide general indemnifications. The Funds’ maximum exposure under these arrangements is unknown, as this would involve future claims that may be made against the Funds that have not yet occurred. However, based on experience, the Funds expect the risk of loss to be remote.
6. Concentration of Credit Risk
The Alabama Tax Free Bond Fund invests primarily in debt instruments of municipal issuers in the state of Alabama. The issuers’ abilities to meet their obligations may be affected by economic developments in the state or its region, as well as disruptions in the credit markets and the economy, generally.
7. Subsequent Events
The Funds are required to recognize in the financial statements the effects of all subsequent events that provide additional evidence about conditions that existed as of the date of the Statements of Assets and Liabilities. For non-recognized subsequent events that must be disclosed to keep the financial statements from being misleading, the Funds are required to disclose the nature of the event as well as an estimate of its financial effect, or a statement that such an estimate cannot be made. Management has evaluated subsequent events through the issuance of these financial statements and has noted no such events.
THE GOVERNMENT STREET FUNDS
ABOUT YOUR FUNDS’ EXPENSES (Unaudited)
We believe it is important for you to understand the impact of costs on your investment. All mutual funds have operating expenses. As a shareholder of the Funds, you incur ongoing costs, including management fees and other expenses. These ongoing costs, which are deducted from each Fund’s gross income, directly reduce the investment returns of the Funds.
A mutual fund’s ongoing costs are expressed as a percentage of its average net assets. This figure is known as the expense ratio. The following examples are intended to help you understand the ongoing costs (in dollars) of investing in the Funds and to compare these costs with the ongoing costs of investing in other mutual funds. The examples below are based on an investment of $1,000 made at the beginning of the period shown and held for the entire period (April 1, 2013 through September 30, 2013).
The table below illustrates each Fund’s ongoing costs in two ways:
Actual fund return – This section helps you to estimate the actual expenses that you paid over the period. The “Ending Account Value” shown is derived from each Fund’s actual return, and the third column shows the dollar amount of operating expenses that would have been paid by an investor who started with $1,000 in the Funds. You may use the information here, together with the amount you invested, to estimate the expenses that you paid over the period.
To do so, simply divide your account value by $1,000 (for example, an $8,600 account value divided by $1,000 = 8.6), then multiply the result by the number given for the Funds under the heading “Expenses Paid During Period.”
Hypothetical 5% return – This section is intended to help you compare the Funds’ ongoing costs with those of other mutual funds. It assumes that each Fund had an annual return of 5% before expenses during the period shown, but that the expense ratio is unchanged. In this case, because the returns used are not the Funds’ actual returns, the results do not apply to your investment. The example is useful in making comparisons because the Securities and Exchange Commission (the “SEC”) requires all mutual funds to calculate expenses based on a 5% return. You can assess each Fund’s ongoing costs by comparing this hypothetical example with the hypothetical examples that appear in shareholder reports of other funds.
Note that expenses shown in the table are meant to highlight and help you compare ongoing costs only. The Funds do not charge sales loads or redemption fees.
The calculations assume no shares were bought or sold during the period. Your actual costs may have been higher or lower, depending on the amount of your investment and the timing of any purchases or redemptions.
THE GOVERNMENT STREET FUNDS
ABOUT YOUR FUNDS’ EXPENSES (Unaudited)
(Continued)
More information about the Funds’ expenses, including historical expense ratios, can be found in this report. For additional information on operating expenses and other shareholder costs, please refer to the Funds’ prospectus.
| | Beginning Account Value April 1, 2013 | Ending Account Value Sept. 30, 2013 | Expenses Paid During Period* |
The Government Street Equity Fund |
| Based on Actual Fund Return | $1,000.00 | $1,078.60 | $4.43 |
| Based on Hypothetical 5% Return (before expenses) | $1,000.00 | $1,020.81 | $4.31 |
The Government Street Mid-Cap Fund |
| Based on Actual Fund Return | $1,000.00 | $1,082.70 | $5.53 |
| Based on Hypothetical 5% Return (before expenses) | $1,000.00 | $1,019.75 | $5.37 |
The Alabama Tax Free Bond Fund |
| Based on Actual Fund Return | $1,000.00 | $993.30 | $3.25 |
| Based on Hypothetical 5% Return (before expenses) | $1,000.00 | $1,021.81 | $3.29 |
| * | Expenses are equal to the Funds’ annualized expense ratios for the period as stated below, multiplied by the average account value over the period, multiplied by 183/365 (to reflect the one-half year period). |
| The Government Street Equity Fund | 0.85% |
| The Government Street Mid-Cap Fund | 1.06% |
| The Alabama Tax Free Bond Fund | 0.65% |
THE GOVERNMENT STREET FUNDS
OTHER INFORMATION (Unaudited)
A description of the policies and procedures that the Funds use to vote proxies relating to portfolio securities is available without charge upon request by calling toll-free 1-866-738-1125, or on the SEC’s website at http://www.sec.gov. Information regarding how the Funds voted proxies relating to portfolio securities during the most recent 12-month period ended June 30 is also available without charge upon request by calling toll-free 1-866-738-1125 or on the SEC’s website at http://www.sec.gov.
The Trust files a complete listing of portfolio holdings for the Funds with the SEC as of the end of the first and third quarters of each fiscal year on Form N-Q. The filings are available upon request, by calling 1-866-738-1125. Furthermore, you may obtain a copy of these filings on the SEC’s website at http://www.sec.gov. The Trust’s Forms N-Q may also be reviewed and copied at the SEC’s Public Reference Room in Washington, DC, and information on the operation of the Public Reference Room may be obtained by calling 1-800-SEC-0330.
This page intentionally left blank.
| | | | | | | | |
| | | | | | | | | |
| | | | | | | | | |
| | | | | The Government Street Funds | | | | |
| | | | | | | | | |
| | | | | Investment Adviser Leavell Investment Management, Inc. Post Office Box 1307 Mobile, AL 36633
Administrator Ultimus Fund Solutions, LLC P.O. Box 46707 Cincinnati, OH 45246-0707 1-866-738-1125
Legal Counsel Sullivan & Worcester LLP One Post Office Square Boston, MA 02109
Independent Registered Public Accounting Firm Ernst & Young LLP 1900 Scripps Center 312 Walnut Street Cincinnati, OH 45202
Board of Trustees John P. Ackerly, IV John T. Bruce Robert S. Harris J. Finley Lee, Jr. Richard L. Morrill Harris V. Morrissette
Portfolio Managers Thomas W. Leavell, The Government Street Equity Fund The Government Street Mid-Cap Fund Timothy S. Healey, The Government Street Mid-Cap Fund The Alabama Tax Free Bond Fund Richard E. Anthony, Jr., CFA, The Government Street Mid-Cap Fund Michael J. Hofto, CFA, The Government Street Mid-Cap Fund | | | | |
| | | | | | | | | |
| | | | | | | | | |
| | | | | | | | |
| | | | | | | | |
| | | | | | | | | |
| | | | | | | | | |
| | | | | THE JAMESTOWN FUNDS
No-Load Funds
The Jamestown Balanced Fund The Jamestown Equity Fund The Jamestown Tax Exempt Virginia Fund
SEMI-ANNUAL REPORT
September 30, 2013 (Unaudited) Investment Adviser Lowe, Brockenbrough & Company, Inc. Richmond, Virginia | | | | |
| | | | | | | | | |
| | | | | | | | | |
| | | | | | | | |
The Jamestown Balanced Fund
For the six months ended September 30, 2013, The Jamestown Balanced Fund performed well, with a return of 6.2% compared to a 4.5% return for a blend of 60% S&P 500 Index/40% Barclays Intermediate U.S. Government/Credit Index. Equity markets rose during the first half of the fiscal year as markets overcame concerns about military action in Syria, the Federal Reserve beginning to slow bond purchases, the temporary government shutdown, and the debt ceiling debate. The Barclays Intermediate U.S. Government/Credit Index returned -1.1%, as interest rates rose during the six month period.
The Fund outperformed for the first half of the fiscal year due to the overweight in equities and strong stock selection in the equity portion of the portfolio. The Consumer Discretionary, Industrials, Health Care, and Financials sectors led the equity market higher, while the Telecommunication Services, Utilities, and Consumer Staples sectors lagged during the first half of the fiscal year. Stock selection in the Fund was a positive contributor to relative performance, as good selection in the Health Care, Financials, and Consumer Staples sectors more than outweighed the negative selection in the Information Technology sector. Sector allocation was also positive in the past six months as the drag from a slightly higher than normal cash position was offset by being overweight equities and by being underweight in Utilities and Telecommunication Services within the equity portion of the Fund. As of September 30, 2013, the largest sector overweights in the equity portion of the portfolio were in the Energy, Health Care, Industrials and Information Technology sectors. The largest sector underweights were in the Financials, Utilities, Telecommunication Services, and Materials sectors.
Interest rates rose modestly during the quarter, but finished well below their peak levels as yields declined following the Federal Reserve’s decision not to slow down the purchases of bonds in the marketplace. Spreads on corporate bonds tightened during the quarter as corporate bonds reacted less sharply to the rise in rates. The Fund continues to have a shorter duration than the Barclays Intermediate U.S. Government/Credit Index and maintains an overweight in corporate bonds at the expense of Treasuries. As of September 30, the Fund had 66% of its portfolio in equities, 27% in fixed income, and 7% in cash.
The Jamestown Equity Fund
For the six months ended September 30, 2013, The Jamestown Equity Fund performed well, with a return of 9.5% compared to the 8.3% return for the S&P 500 Index. Equity markets rose during the first half of the fiscal year as markets overcame concerns about military action in Syria, the Federal Reserve beginning to slow bond purchases, the temporary government shutdown, and the debt ceiling debate. The Consumer Discretionary, Industrials, Health Care, and Financials sectors led the market higher, while the Telecommunication Services, Utilities, and Consumer Staples sectors lagged during the first half of the fiscal year. The Jamestown Equity Fund outperformed the S&P 500 Index during the first half of the fiscal year largely due to stock selection, as good selection in the Health Care, Financials, and Consumer Staples sectors more than outweighed the negative selection in the Information Technology sector. Sector allocation was largely neutral in the past six months, as the drag from a slightly higher than normal cash position was offset by being underweight in Utilities and Telecommunication Serivces.
As of September 30, 2013, the largest sector overweights in the Fund were in the Energy, Health Care, Industrials and Information Technology sectors. The largest sector underweights in the portfolio were in the Financials, Utilities, Telecommunication Services, and Materials sectors.
Market Outlook
The S&P 500 Index has significantly outperformed corporate earnings growth so far this fiscal year as valuation has expanded. We believe that further upside will likely depend more on future earnings growth rather than further expansion in valuation. The market ended the September 2013 quarter trading at about 15X earnings, in line with the historical average. The Federal Reserve’s decision to postpone the slowing of bond purchases made the interest rate environment more supportive, though markets will still have to deal with less accommodation from the Fed going forward (likely in 2014). The economy continues to grow modestly while inflation remains well contained. Investor sentiment has ebbed and flowed with the market, but has yet to reach extreme bullish or bearish levels so far this fiscal year.
We continue to evaluate the factors above and look for the opportunity to buy high-quality businesses trading at reasonable prices. Our biggest concerns continue to be the very elevated level of profit margins currently enjoyed by public companies, as well as the political environment in Washington. Margins are likely to be supported until there is significant pressure from wage growth or an economic slowdown, neither of which appear imminent. However, when the economy is growing slowly, it is more susceptible to policy mistakes. Recent studies continue to support the notion that the uncertainty coming from both political parties is hampering economic growth, as corporations are less likely to invest capital and consumers are less likely to spend in the current political climate. Despite the turmoil in Washington, the U.S. has led the global recovery since the financial crisis, and any real solution from the politicians would likely kick off a period of faster growth.
The Jamestown Tax Exempt Virginia Fund
For the six-month period ended September 30, 2013, The Jamestown Tax Exempt Virginia Fund returned -1.51%. By comparison, the Barclays 5-year Municipal Bond Index was down -0.86% for the period. The Fund was conservatively positioned with regard to interest rate risk and credit quality, enabling the Fund to stack up favorably relative to other intermediate municipal funds. As of September 30, 2013, the Fund’s SEC 30-day yield was 1.89%, which is a taxable equivalent yield of 3.13% for investors subject to the maximum 39.6% federal income tax bracket.
The U.S. economy experienced moderate real growth and inflation remained subdued. Markets expected that the Federal Reserve would begin to taper its purchases of $85 billion per month of Treasuries and government agency mortgage-backed securities; however, the Fed surprised markets at its September FOMC meeting by maintaining the current size of its asset purchases until it sees further improvement in employment.
Municipal bond prices declined during the six-month period, as interest rates moved higher in all sectors of the fixed income market. The representative yield-to-maturity of a high grade tax-exempt general obligation bond with a 5-year maturity increased 48 basis points to 1.32%, while the 10-year maturity climbed 63 basis points to 2.54%, according to Municipal Market Data. Despite experiencing losses for the six-month period, bond prices rallied during September following the Fed’s decision to delay tapering of its bond buying program. Yields finished well below their peak levels for the period.
The Fund’s relative performance can be attributed to its intermediate maturity structure and its emphasis on high credit quality. The municipal yield curve steepened during the period, with greater increases in yields on long maturities than those on short and intermediate maturities. This resulted in underperformance for long maturity bonds. Strategies that emphasize intermediate
maturities generally saw smaller losses than those that concentrate on long maturities. The portfolio’s average maturity was shortened by 0.5 year over the course of the six-month period. As of September 30, 2013, the Fund’s average stated maturity was 5.8 years, compared to 6.3 years at the beginning of the period, and the effective duration was decreased to 4.0 years from 4.2 years.
Quality spreads widened during the bond sell-off as heightened credit risk became a concern for some segments of the municipal market. The Fund remains positioned in predominantly AA and AAA-rated credits from Virginia municipal issuers. Despite the threat that federal spending cuts will disproportionately hurt Virginia’s economy, the state recently completed its fiscal year with a surplus of $585 million, the fourth consecutive year of budget surplus. Concomitant with its revised outlook on the credit rating for the United States government, in mid-July Moody’s revised its outlook to stable for the Aaa credit rating of Virginia as well as for many of the Aaa-rated localities in Northern Virginia. General obligation bonds of Virginia carry the top credit rating by all three major rating firms.
Notably, the Fund has no exposure to Puerto Rico bonds, which have plummeted in price this year due to deteriorating credit fundamentals. Many state-specific municipal funds have owned Puerto Rico debt because the interest is exempt from federal, state and local income taxes in all U.S. states and the island’s debt typically offers greater yield than most U.S. issuers. With lingering headlines over Detroit’s municipal bankruptcy, concerns over credit risk, and fears of rising interest rates, municipal bond mutual funds have seen consistent net outflows in 2013. While fund selling has pressured secondary market activity, primary issuance has ebbed this year with a diminished number of refunding deals.
We expect the Fund will remain defensively positioned with regard to interest rate sensitivity while seeking opportunities to enhance the income for the Fund’s investors.
| |
Charles M. Caravati, III, CFA President Jamestown Balanced Fund Jamestown Equity Fund | Joseph A. Jennings, III, CFA President Jamestown Tax Exempt Virginia Fund |
Data presented reflects past performance, which is no guarantee of future results. Investment results and principal value will fluctuate so that shares, when redeemed, may be worth more or less than their original cost. Due to market volatility, current performance may be higher or lower than the performance shown.
This report is submitted for the general information of the shareholders of the Funds. The report is not authorized for distribution to prospective investors in the Funds unless it is accompanied by a current prospectus.
This report reflects our views, opinions and portfolio holdings as of September 30, 2013, the end of the reporting period. These views are subject to change at any time based upon market or other conditions. For more current information throughout the year please visit www.jamestownfunds.com. The Funds are distributed by Ultimus Fund Distributors, LLC.
THE JAMESTOWN BALANCED FUND
PERFORMANCE INFORMATION (Unaudited)
| | Average Annual Total Returns(a) (for periods ended September 30, 2013) |
| | | | |
| The Jamestown Balanced Fund | 13.94% | 7.01% | 5.91% |
Standard & Poor’s 500® Index | 19.34% | 10.02% | 7.57% |
| 60% S&P 500 Index / 40% Barclays Intermediate U.S. Government/Credit Index | 11.10% | 8.40% | 6.45% |
| (a) | Total return is a measure of the change in value of an investment in the Fund over the periods covered, which assumes any dividends or capital gains distributions are reinvested in shares of the Fund. Returns shown do not reflect the deduction of taxes a shareholder would pay on Fund distributions or the redemption of Fund shares. |
THE JAMESTOWN EQUITY FUND
PERFORMANCE INFORMATION (Unaudited)
| | Average Annual Total Returns(a) (for periods ended September 30, 2013) |
| | | | |
| The Jamestown Equity Fund | 20.97% | 8.01% | 6.75% |
Standard & Poor’s 500® Index | 19.34% | 10.02% | 7.57% |
| (a) | Total return is a measure of the change in value of an investment in the Fund over the periods covered, which assumes any dividends or capital gains distributions are reinvested in shares of the Fund. Returns shown do not reflect the deduction of taxes a shareholder would pay on Fund distributions or the redemption of Fund shares. |
THE JAMESTOWN TAX EXEMPT VIRGINIA FUND
PERFORMANCE INFORMATION (Unaudited)
| | Average Annual Total Returns(a) (for periods ended September 30, 2013) |
| | | | |
| The Jamestown Tax Exempt Virginia Fund | (1.50%) | 3.60% | 2.89% |
| Barclays 5-Year Municipal Bond Index | (0.24%) | 4.90% | 3.85% |
| Barclays Municipal Bond Index | (2.21%) | 5.98% | 4.40% |
| * | The Barclays 5-Year Municipal Bond Index is an unmanaged index generally representative of 5-year tax-exempt bonds. Because the Fund is typically classified as an intermediate-term fund (with an average duration of between 2 and 10 years), this index is believed to be the most appropriate broad-based securities market index against which to compare the Fund’s performance. |
| | |
| (a) | Total return is a measure of the change in value of an investment in the Fund over the periods covered, which assumes any dividends or capital gains distributions are reinvested in shares of the Fund. Returns shown do not reflect the deduction of taxes a shareholder would pay on Fund distributions or the redemption of Fund shares. |
THE JAMESTOWN BALANCED FUND
PORTFOLIO INFORMATION
September 30, 2013 (Unaudited)
Asset Allocation (% of Net Assets) | | Ten Largest Equity Holdings | |
| | Apple, Inc. | 2.6% |
| Google, Inc. - Class A | 1.9% |
| JPMorgan Chase & Company | 1.8% |
| Oracle Corporation | 1.7% |
| General Electric Company | 1.6% |
| Noble Corporation | 1.6% |
| Ameriprise Financial, Inc. | 1.6% |
| Aetna, Inc. | 1.5% |
| Dollar Tree, Inc. | 1.5% |
| EMC Corporation | 1.5% |
| |
Equity Sector Concentration vs. the S&P 500® Index (65.1% of Net Assets) |
Fixed-Income Portfolio (27.2% of Net Assets) | | | % of Fixed Income Portfolio |
| Average Stated Maturity (Years) | 3.68 | | U.S. Treasury Obligations | 27.6% |
| Average Duration (Years) | 3.33 | | U.S. Government Agency Obligations | 10.9% |
| Current Yield | 3.85% | | Corporate Bonds | 53.1% |
| Average Yield to Maturity | 1.44% | | Mortgage-Backed Securities | 6.4% |
| | | | Municipal Bonds | 2.0% |
THE JAMESTOWN EQUITY FUND
PORTFOLIO INFORMATION
September 30, 2013 (Unaudited)
Asset Allocation (% of Net Assets) | | Ten Largest Equity Holdings | |
| | Apple, Inc. | 3.8% |
| JPMorgan Chase & Company | 2.6% |
| Google, Inc. - Class A | 2.5% |
| Oracle Corporation | 2.4% |
| Ameriprise Financial, Inc. | 2.3% |
| Noble Corporation | 2.3% |
| General Electric Company | 2.2% |
| TJX Companies, Inc. (The) | 2.2% |
| Eaton Corporation plc | 2.1% |
| Aetna, Inc. | 2.1% |
| |
Sector Concentration vs. the S&P 500® Index
THE JAMESTOWN TAX EXEMPT VIRGINIA FUND
PORTFOLIO INFORMATION
September 30, 2013 (Unaudited)
| | Maturity Breakdown (% of Portfolio) |
| 30-day SEC Yield | 1.89% | | |
| Tax-Equivalent Yield | 3.13%* | |
| Weighted Average Maturity (years) | 5.8 | |
| Weighted Average Duration (years) | 4.0 | |
| | | |
| * Assumes a maximum 39.6% federal tax rate. | |
Credit Quality (% of Portfolio) | | Sector Diversification (% of Portfolio) |
| | |
THE JAMESTOWN BALANCED FUND
SCHEDULE OF INVESTMENTS
September 30, 2013 (Unaudited)
| | | | | | |
| Consumer Discretionary — 8.0% | | | | | | |
| Comcast Corporation - Class A | | | 6,200 | | | $ | 279,930 | |
Discovery Communications, Inc. - Class A (a) | | | 2,000 | | | | 168,840 | |
Dollar Tree, Inc. (a) | | | 5,000 | | | | 285,800 | |
| Macy's, Inc. | | | 5,400 | | | | 233,658 | |
| TJX Companies, Inc. (The) | | | 5,000 | | | | 281,950 | |
| Viacom, Inc. - Class B | | | 3,000 | | | | 250,740 | |
| | | | | | | | 1,500,918 | |
| Consumer Staples — 6.9% | | | | | | | | |
| Archer-Daniels-Midland Company | | | 5,000 | | | | 184,200 | |
| CVS Caremark Corporation | | | 4,500 | | | | 255,375 | |
| Kroger Company (The) | | | 3,000 | | | | 121,020 | |
| Mondelēz International, Inc. - Class A | | | 6,600 | | | | 207,372 | |
| PepsiCo, Inc. | | | 3,300 | | | | 262,350 | |
| Sysco Corporation | | | 3,200 | | | | 101,856 | |
| Wal-Mart Stores, Inc. | | | 2,400 | | | | 177,504 | |
| | | | | | | | 1,309,677 | |
| Energy — 8.9% | | | | | | | | |
| Apache Corporation | | | 3,100 | | | | 263,934 | |
| Baker Hughes, Inc. | | | 4,200 | | | | 206,220 | |
| Chevron Corporation | | | 2,000 | | | | 243,000 | |
| Hess Corporation | | | 3,400 | | | | 262,956 | |
| Marathon Oil Corporation | | | 3,900 | | | | 136,032 | |
| Noble Corporation | | | 8,200 | | | | 309,714 | |
| Royal Dutch Shell plc - Class A - ADR | | | 4,000 | | | | 262,720 | |
| | | | | | | | 1,684,576 | |
| Financials — 10.4% | | | | | | | | |
| American Express Company | | | 3,450 | | | | 260,544 | |
| Ameriprise Financial, Inc. | | | 3,300 | | | | 300,564 | |
| BB&T Corporation | | | 7,500 | | | | 253,125 | |
| Discover Financial Services, LLC | | | 5,500 | | | | 277,970 | |
| JPMorgan Chase & Company | | | 6,700 | | | | 346,323 | |
| MetLife, Inc. | | | 6,000 | | | | 281,700 | |
| PNC Financial Services Group, Inc. | | | 3,500 | | | | 253,575 | |
| | | | | | | | 1,973,801 | |
| Health Care — 9.5% | | | | | | | | |
| Abbott Laboratories | | | 3,200 | | | | 106,208 | |
| AbbVie, Inc. | | | 3,200 | | | | 143,136 | |
| Aetna, Inc. | | | 4,500 | | | | 288,090 | |
| AmerisourceBergen Corporation | | | 4,300 | | | | 262,730 | |
| Amgen, Inc. | | | 2,300 | | | | 257,462 | |
| McKesson Corporation | | | 2,000 | | | | 256,600 | |
| Thermo Fisher Scientific, Inc. | | | 2,500 | | | | 230,375 | |
THE JAMESTOWN BALANCED FUND
SCHEDULE OF INVESTMENTS (Continued)
COMMON STOCKS — 65.1% (Continued) | | | | | | |
| Health Care — 9.5% (Continued) | | | | | | |
| UnitedHealth Group, Inc. | | | 3,600 | | | $ | 257,796 | |
| | | | | | | | 1,802,397 | |
| Industrials — 8.6% | | | | | | | | |
| Dover Corporation | | | 3,000 | | | | 269,490 | |
| Eaton Corporation plc | | | 3,800 | | | | 261,592 | |
| FedEx Corporation | | | 2,400 | | | | 273,864 | |
| General Electric Company | | | 13,000 | | | | 310,570 | |
| Norfolk Southern Corporation | | | 3,200 | | | | 247,520 | |
| Ryder System, Inc. | | | 4,300 | | | | 256,710 | |
| | | | | | | | 1,619,746 | |
| Information Technology — 12.8% | | | | | | | | |
| Apple, Inc. | | | 1,025 | | | | 488,669 | |
| Cisco Systems, Inc. | | | 11,800 | | | | 276,356 | |
| EMC Corporation | | | 11,100 | | | | 283,716 | |
Google, Inc. - Class A (a) | | | 400 | | | | 350,364 | |
| Intel Corporation | | | 5,300 | | | | 121,476 | |
| International Business Machines Corporation | | | 900 | | | | 166,662 | |
| Microsoft Corporation | | | 4,000 | | | | 133,240 | |
| Oracle Corporation | | | 9,800 | | | | 325,066 | |
| QUALCOMM, Inc. | | | 4,100 | | | | 276,176 | |
| | | | | | | | 2,421,725 | |
| | | | | | | | | |
Total Common Stocks (Cost $7,278,911) | | | | | | $ | 12,312,840 | |
EXCHANGE-TRADED FUNDS — 0.8% | | | | | | |
| Financial Select Sector SPDR Fund (The) (Cost $149,387) | | | 7,500 | | | $ | 149,400 | |
U.S. TREASURY OBLIGATIONS — 7.5% | | | | | | |
| U.S. Treasury Notes — 7.5% | | | | | | |
| 4.25%, 11/15/2014 | | $ | 350,000 | | | $ | 366,064 | |
| 0.375%, 08/31/2015 | | | 300,000 | | | | 300,352 | |
| 4.25%, 11/15/2017 | | | 400,000 | | | | 451,031 | |
| 2.625%, 08/15/2020 | | | 175,000 | | | | 182,643 | |
| 2.125%, 08/15/2021 | | | 120,000 | | | | 119,025 | |
Total U.S. Treasury Obligations (Cost $1,354,907) | | | | | | $ | 1,419,115 | |
THE JAMESTOWN BALANCED FUND
SCHEDULE OF INVESTMENTS (Continued)
U.S. GOVERNMENT AGENCY OBLIGATIONS — 3.0% | | | | | | |
| Federal Home Loan Mortgage Corporation — 3.0% | | | | | | |
| 5.25%, due 04/18/2016 (Cost $497,523) | | $ | 500,000 | | | $ | 559,308 | |
| | | | | | |
| Consumer Discretionary — 1.1% | | | | | | |
Anheuser-Busch Companies, Inc.,
4.50%, due 04/01/2018 | | $ | 100,000 | | | $ | 108,587 | |
Comcast Corporation,
5.70%, due 07/01/2019 | | | 75,000 | | | | 87,113 | |
| | | | | | | | 195,700 | |
| Consumer Staples — 2.8% | | | | | | | | |
Colgate-Palmolive Company,
1.95%, due 02/01/2023 | | | 100,000 | | | | 90,083 | |
General Mills, Inc.,
5.70%, due 02/15/2017 | | | 150,000 | | | | 170,237 | |
Mondelēz International, Inc.,
6.50%, due 08/11/2017 | | | 100,000 | | | | 116,293 | |
PepsiCo, Inc.,
3.10%, due 01/15/2015 | | | 75,000 | | | | 77,418 | |
Wal-Mart Stores, Inc.,
4.25%, due 04/15/2021 | | | 75,000 | | | | 81,451 | |
| | | | | | | | 535,482 | |
| Energy — 1.1% | | | | | | | | |
Shell International Finance B.V.,
4.30%, due 09/22/2019 | | | 100,000 | | | | 110,393 | |
Total Capital S.A.,
3.00%, due 06/24/2015 | | | 100,000 | | | | 104,051 | |
| | | | | | | | 214,444 | |
| Financials — 3.6% | | | | | | | | |
Aflac, Inc.,
2.65%, due 02/15/2017 | | | 75,000 | | | | 77,721 | |
BB&T Corporation,
2.15%, due 03/22/2017 | | | 100,000 | | | | 101,632 | |
JPMorgan Chase & Company,
3.40%, due 06/24/2015 | | | 110,000 | | | | 114,610 | |
Northern Trust Corporation,
4.625%, due 05/01/2014 | | | 150,000 | | | | 153,748 | |
PNC Funding Corporation,
5.125%, due 02/08/2020 | | | 110,000 | | | | 122,357 | |
Royal Bank of Canada,
2.30%, due 07/20/2016 | | | 100,000 | | | | 103,369 | |
| | | | | | | | 673,437 | |
| Health Care — 3.3% | | | | | | | | |
Amgen, Inc.,
5.85%, due 06/01/2017 | | | 150,000 | | | | 171,143 | |
THE JAMESTOWN BALANCED FUND
SCHEDULE OF INVESTMENTS (Continued)
CORPORATE BONDS — 14.5% (Continued) | | | | | | |
| Health Care — 3.3% (Continued) | | | | | | |
GlaxoSmithKline plc,
5.65%, due 05/15/2018 | | $ | 200,000 | | | $ | 232,806 | |
Medtronic, Inc.,
4.75%, due 09/15/2015 | | | 100,000 | | | | 107,699 | |
Novartis Securities Investment Ltd.,
5.125%, due 02/10/2019 | | | 100,000 | | | | 114,530 | |
| | | | | | | | 626,178 | |
| Information Technology — 0.4% | | | | | | | | |
Cisco Systems, Inc.,
4.95%, due 02/15/2019 | | | 71,000 | | | | 80,563 | |
| | | | | | | | | |
| Materials — 0.7% | | | | | | | | |
| E.I. du Pont de Nemours and Company, | | | | | | | | |
| 5.875%, due 01/15/2014 | | | 26,000 | | | | 26,388 | |
| 4.875%, due 04/30/2014 | | | 100,000 | | | | 102,453 | |
| | | | | | | | 128,841 | |
| Telecommunication Services — 0.4% | | | | | | | | |
| Verizon Communications, Inc., 2.50%, due 09/15/2016 | | | 65,000 | | | | 66,995 | |
| | | | | | | | | |
| Utilities — 1.1% | | | | | | | | |
Consolidated Edison Company of New York, Inc.,
5.55%, due 04/01/2014 | | | 70,000 | | | | 71,700 | |
Virginia Electric & Power Company,
5.00%, due 06/30/2019 | | | 125,000 | | | | 142,693 | |
| | | | | | | | 214,393 | |
| | | | | | | | | |
Total Corporate Bonds (Cost $2,643,286) | | | | | | $ | 2,736,033 | |
MORTGAGE-BACKED SECURITIES — 1.7% | | | | | | |
| Federal Home Loan Mortgage Corporation — 0.4% | | | | | | |
| Pool #A97047, 4.50%, due 02/01/2041 | | $ | 71,376 | | | $ | 76,018 | |
| | | | | | | | | |
| Federal National Mortgage Association — 1.3% | | | | | | | | |
| Pool #618465, 5.00%, due 12/01/2016 | | | 21,110 | | | | 22,456 | |
| Pool #255455, 5.00%, due 10/01/2024 | | | 50,441 | | | | 54,816 | |
| Pool #255702, 5.00%, due 05/01/2025 | | | 69,934 | | | | 76,044 | |
| Pool #808413, 5.50%, due 01/01/2035 | | | 80,710 | | | | 88,213 | |
| | | | | | | | 241,529 | |
Government National Mortgage Association — 0.0% (b) | | | | | | | | |
| Pool #781344, 6.50%, due 10/15/2031 | | | 10,883 | | | | 12,280 | |
| | | | | | | | | |
Total Mortgage-Backed Securities (Cost $308,022) | | | | | | $ | 329,827 | |
THE JAMESTOWN BALANCED FUND
SCHEDULE OF INVESTMENTS (Continued)
VIRGINIA REVENUE AND GENERAL OBLIGATION (GO) BONDS — 0.5% | | | | | | |
Virginia State, Build America Bonds, Taxable, GO,
2.95%, due 06/01/2019 (Cost $99,946) | | $ | 100,000 | | | $ | 102,097 | |
| | | | | | | | | |
Total Investments at Value — 93.1% (Cost $12,331,982) | | | | | | $ | 17,608,620 | |
| | | | | | | | | |
| Other Assets in Excess of Liabilities — 6.9% | | | | | | | 1,309,529 | |
| | | | | | | | | |
| Net Assets — 100.0% | | | | | | $ | 18,918,149 | |
| ADR - American Depositary Receipt. |
| |
| (a) | Non-income producing security. |
| | |
| (b) | Percentage rounds to less than 0.1%. |
| | |
| See accompanying notes to financial statements. |
THE JAMESTOWN EQUITY FUND
SCHEDULE OF INVESTMENTS
September 30, 2013 (Unaudited)
| | | | | | |
| Consumer Discretionary — 11.7% | | | | | | |
| Comcast Corporation - Class A | | | 13,500 | | | $ | 609,525 | |
Discovery Communications, Inc. - Class A (a) | | | 4,400 | | | | 371,448 | |
Dollar Tree, Inc. (a) | | | 11,100 | | | | 634,476 | |
| Macy's, Inc. | | | 12,500 | | | | 540,875 | |
| McDonald's Corporation | | | 1,300 | | | | 125,073 | |
| TJX Companies, Inc. (The) | | | 11,700 | | | | 659,763 | |
| Viacom, Inc. - Class B | | | 7,000 | | | | 585,060 | |
| | | | | | | | 3,526,220 | |
| Consumer Staples — 9.9% | | | | | | | | |
| Archer-Daniels-Midland Company | | | 12,500 | | | | 460,500 | |
| CVS Caremark Corporation | | | 10,200 | | | | 578,850 | |
| Kroger Company (The) | | | 6,000 | | | | 242,040 | |
| Mondelēz International, Inc. - Class A | | | 15,000 | | | | 471,300 | |
| PepsiCo, Inc. | | | 7,100 | | | | 564,450 | |
| Sysco Corporation | | | 8,000 | | | | 254,640 | |
| Wal-Mart Stores, Inc. | | | 5,400 | | | | 399,384 | |
| | | | | | | | 2,971,164 | |
| Energy — 12.3% | | | | | | | | |
| Apache Corporation | | | 7,000 | | | | 595,980 | |
| Baker Hughes, Inc. | | | 9,100 | | | | 446,810 | |
| Chevron Corporation | | | 4,100 | | | | 498,150 | |
| Hess Corporation | | | 7,800 | | | | 603,252 | |
| Marathon Oil Corporation | | | 8,800 | | | | 306,944 | |
| Noble Corporation | | | 18,500 | | | | 698,745 | |
| Royal Dutch Shell plc - Class A - ADR | | | 8,500 | | | | 558,280 | |
| | | | | | | | 3,708,161 | |
| Financials — 14.8% | | | | | | | | |
| American Express Company | | | 7,800 | | | | 589,056 | |
| Ameriprise Financial, Inc. | | | 7,700 | | | | 701,316 | |
| BB&T Corporation | | | 17,000 | | | | 573,750 | |
| Discover Financial Services, LLC | | | 12,500 | | | | 631,750 | |
| JPMorgan Chase & Company | | | 15,000 | | | | 775,350 | |
| MetLife, Inc. | | | 13,300 | | | | 624,435 | |
| PNC Financial Services Group, Inc. | | | 7,800 | | | | 565,110 | |
| | | | | | | | 4,460,767 | |
| Health Care — 13.6% | | | | | | | | |
| Abbott Laboratories | | | 7,500 | | | | 248,925 | |
| AbbVie, Inc. | | | 7,600 | | | | 339,948 | |
| Aetna, Inc. | | | 10,000 | | | | 640,200 | |
| AmerisourceBergen Corporation | | | 9,400 | | | | 574,340 | |
| Amgen, Inc. | | | 5,200 | | | | 582,088 | |
| McKesson Corporation | | | 4,600 | | | | 590,180 | |
THE JAMESTOWN EQUITY FUND
SCHEDULE OF INVESTMENTS (Continued)
COMMON STOCKS — 92.5% (Continued) | | | | | | |
| Health Care — 13.6% (Continued) | | | | | | |
| Thermo Fisher Scientific, Inc. | | | 5,700 | | | $ | 525,255 | |
| UnitedHealth Group, Inc. | | | 8,500 | | | | 608,685 | |
| | | | | | | | 4,109,621 | |
| Industrials — 12.2% | | | | | | | | |
| Dover Corporation | | | 7,100 | | | | 637,793 | |
| Eaton Corporation plc | | | 9,300 | | | | 640,212 | |
| FedEx Corporation | | | 5,400 | | | | 616,194 | |
| General Electric Company | | | 28,200 | | | | 673,698 | |
| Norfolk Southern Corporation | | | 6,500 | | | | 502,775 | |
| Ryder System, Inc. | | | 10,100 | | | | 602,970 | |
| | | | | | | | 3,673,642 | |
| Information Technology — 18.0% | | | | | | | | |
| Apple, Inc. | | | 2,400 | | | | 1,144,200 | |
| Cisco Systems, Inc. | | | 25,800 | | | | 604,236 | |
| EMC Corporation | | | 25,000 | | | | 639,000 | |
Google, Inc. - Class A (a) | | | 875 | | | | 766,421 | |
| Intel Corporation | | | 11,600 | | | | 265,872 | |
| International Business Machines Corporation | | | 2,000 | | | | 370,360 | |
| Microsoft Corporation | | | 9,100 | | | | 303,121 | |
| Oracle Corporation | | | 22,000 | | | | 729,740 | |
| QUALCOMM, Inc. | | | 9,000 | | | | 606,240 | |
| | | | | | | | 5,429,190 | |
| | | | | | | | | |
Total Common Stocks (Cost $17,176,348) | | | | | | $ | 27,878,765 | |
EXCHANGE-TRADED FUNDS — 1.2% | | | | | | |
| Financial Select Sector SPDR Fund (The) (Cost $358,529) | | | 18,000 | | | $ | 358,560 | |
| | | | | | | | | |
Total Investments at Value — 93.7% (Cost $17,534,877) | | | | | | $ | 28,237,325 | |
| | | | | | | | | |
| Other Assets in Excess of Liabilities — 6.3% | | | | | | | 1,886,025 | |
| | | | | | | | | |
| Net Assets — 100.0% | | | | | | $ | 30,123,350 | |
| ADR - American Depositary Receipt. |
| |
| (a) | Non-income producing security. |
| | |
| See accompanying notes to financial statements. |
THE JAMESTOWN TAX EXEMPT VIRGINIA FUND
SCHEDULE OF INVESTMENTS
September 30, 2013 (Unaudited)
VIRGINIA REVENUE AND GENERAL OBLIGATION (GO) BONDS — 95.0% | | | | | | |
| Arlington Co., Virginia, GO, | | | | | | |
| 4.10%, due 11/01/2018 | | $ | 500,000 | | | $ | 521,070 | |
| Capital Region Airport Commission, Virginia, Airport Revenue, | | | | | | | | |
| 4.50%, due 07/01/2016 | | | 520,000 | | | | 570,331 | |
| Chesterfield Co., Virginia, GO, | | | | | | | | |
| 5.00%, due 01/01/2020 | | | 700,000 | | | | 787,941 | |
| 5.00%, due 01/01/2024 | | | 250,000 | | | | 293,283 | |
| Fairfax Co., Virginia, Industrial Dev. Authority, Revenue, | | | | | | | | |
| 5.00%, due 05/15/2022 | | | 750,000 | | | | 828,742 | |
| Fairfax Co., Virginia, Sewer, Revenue, | | | | | | | | |
| 4.50%, due 07/15/2030 | | | 250,000 | | | | 261,865 | |
| Fauquier Co., Virginia, GO, | | | | | | | | |
| 5.00%, due 07/01/2017, | | | | | | | | |
| prerefunded 07/01/2016 @ 100 | | | 500,000 | | | | 559,530 | |
| Hampton Roads Sanitation District, Virginia, Wastewater, Revenue, | | | | | | | | |
| 5.00%, due 04/01/2022 | | | 400,000 | | | | 453,952 | |
| Hampton Roads Sanitation District, Virginia, Wastewater, Series A, Revenue, | | | | | | | | |
| 5.00%, due 01/01/2027 | | | 400,000 | | | | 444,888 | |
| Hampton, Virginia, GO, | | | | | | | | |
| 5.00%, due 04/01/2020, | | | | | | | | |
| prerefunded 04/01/2015 @ 100 | | | 500,000 | | | | 535,330 | |
| 5.00%, due 04/01/2025 | | | 500,000 | | | | 574,065 | |
| Henrico Co., Virginia, Public Improvement, Series A, GO, | | | | | | | | |
| 5.00%, due 12/01/2015 | | | 250,000 | | | | 274,795 | |
| Henrico Co., Virginia, Water & Sewer, Revenue, | | | | | | | | |
| 5.00%, due 05/01/2020 | | | 350,000 | | | | 409,069 | |
| 5.00%, due 05/01/2022 | | | 430,000 | | | | 500,722 | |
| James City, Virginia, School District, GO, | | | | | | | | |
| 5.00%, due 12/15/2018 | | | 500,000 | | | | 548,465 | |
| Leesburg, Virginia, GO, | | | | | | | | |
| 5.00%, due 09/15/2016 | | | 500,000 | | | | 561,690 | |
| Lynchburg, Virginia, GO, | | | | | | | | |
| 5.00%, due 06/01/2015 | | | 500,000 | | | | 538,185 | |
| Lynchburg, Virginia, Public Improvement, Series A, GO, | | | | | | | | |
| 5.00%, due 08/01/2019 | | | 625,000 | | | | 738,744 | |
| Manassas, Virginia, Public Improvement, Series D, GO, | | | | | | | | |
| 5.00%, due 07/01/2019 | | | 250,000 | | | | 298,970 | |
| New Kent Co., Virginia, Economic Dev. Authority, Revenue, | | | | | | | | |
| 5.00%, due 02/01/2019 | | | 500,000 | | | | 549,515 | |
| Norfolk, Virginia, GO, | | | | | | | | |
| 4.50%, due 06/01/2015 | | | 500,000 | | | | 513,915 | |
THE JAMESTOWN TAX EXEMPT VIRGINIA FUND
SCHEDULE OF INVESTMENTS (Continued)
VIRGINIA REVENUE AND GENERAL OBLIGATION (GO) BONDS — 95.0% (Continued) | | | | | | |
| Portsmouth, Virginia, GO, | | | | | | |
| 5.00%, due 04/01/2016, | | | | | | |
| prerefunded 4/01/2015 @ 100 | | $ | 160,000 | | | $ | 171,254 | |
| 5.00%, due 04/01/2016 | | | 90,000 | | | | 96,246 | |
| Portsmouth, Virginia, Series D, GO, | | | | | | | | |
| 4.00%, due 12/01/2017 | | | 215,000 | | | | 239,693 | |
| Prince William Co., Virginia, Lease Participation Certificates, | | | | | | | | |
| 5.00%, due 10/01/2020 | | | 500,000 | | | | 582,635 | |
| Richmond, Virginia, Metropolitan Authority, Revenue, | | | | | | | | |
| 5.25%, due 07/15/2014, ETM | | | 715,000 | | | | 741,934 | |
| 5.25%, due 07/15/2014 | | | 285,000 | | | | 295,440 | |
| Roanoke, Virginia, Public Improvement, Series A, GO, | | | | | | | | |
| 5.00%, due 07/15/2025 | | | 400,000 | | | | 464,176 | |
| Southeastern Public Service Authority, Virginia, Revenue, | | | | | | | | |
| 5.00%, due 07/01/2015, ETM | | | 1,000,000 | | | | 1,052,765 | |
| Spotsylvania Co., Virginia, Economic Dev. Authority, Revenue, | | | | | | | | |
| 5.00%, due 06/01/2021 | | | 300,000 | | | | 349,920 | |
| Spotsylvania Co., Virginia, GO, | | | | | | | | |
| 5.00%, due 01/15/2016 | | | 500,000 | | | | 506,720 | |
| Spotsylvania Co., Virginia, Water & Sewer, Revenue, | | | | | | | | |
| 5.00%, due 06/01/2026 | | | 500,000 | | | | 529,750 | |
| Suffolk, Virginia, Public Improvement, Series A, GO, | | | | | | | | |
| 4.00%, due 08/01/2018 | | | 250,000 | | | | 280,145 | |
| Upper Occoquan, Virginia, Sewer Authority, Revenue, | | | | | | | | |
| 5.15%, due 07/01/2020 | | | 250,000 | | | | 288,570 | |
| Virginia Beach, Virginia, Public Improvement, GO, | | | | | | | | |
| 5.00%, due 06/01/2021, | | | | | | | | |
| prerefunded 06/01/2019 @ 100 | | | 250,000 | | | | 296,915 | |
| Virginia Biotechnology Research Partnership Authority, Lease Revenue, | | | | | | | | |
| 5.00%, due 09/01/2020 | | | 500,000 | | | | 591,140 | |
| Virginia College Building Authority, Educational Facilities, Revenue, | | | | | | | | |
| 5.00%, due 04/01/2017 | | | 500,000 | | | | 529,335 | |
| 5.00%, due 03/01/2019 | | | 250,000 | | | | 290,022 | |
| 4.00%, due 09/01/2026 | | | 500,000 | | | | 523,685 | |
| Virginia Commonwealth Transportation Board, Federal Highway Reimbursement Anticipation Notes, Revenue, | | | | | | | |
| 5.00%, due 09/28/2015 | | | 500,000 | | | | 545,660 | |
| Virginia Polytechnic Institute & State University, General and Athletic Facilities, Series D, Revenue, | | | | | | | | |
| 5.00%, due 06/01/2016 | | | 115,000 | | | | 119,714 | |
THE JAMESTOWN TAX EXEMPT VIRGINIA FUND
SCHEDULE OF INVESTMENTS (Continued)
VIRGINIA REVENUE AND GENERAL OBLIGATION (GO) BONDS — 95.0% (Continued) | | | | | | |
| Virginia Small Business Financing Authority, Healthcare Facilities, Revenue, | | | | | | |
| 5.00%, due 11/01/2017 | | $ | 250,000 | | | $ | 284,565 | |
| Virginia State Commonwealth Transportation Board, Federal Transportation Grant Anticipation Notes, Series A, Revenue, | | | | | | | | |
| 5.00%, due 03/15/2023 | | | 500,000 | | | | 585,530 | |
| Virginia State Public Building Authority, Public Facilities, Series D, Revenue, | | | | | | | | |
| 5.00%, due 08/01/2016 | | | 1,000,000 | | | | 1,039,010 | |
| Virginia State Public School Authority, Revenue, | | | | | | | | |
| 5.00%, due 08/01/2023 | | | 500,000 | | | | 585,385 | |
| Virginia State Public School Authority, Series A, Revenue, | | | | | | | | |
| 5.00%, due 08/01/2020 | | | 585,000 | | | | 649,362 | |
| Virginia State Public School Authority, Series B-1, Revenue, | | | | | | | | |
| 5.00%, due 08/01/2018 | | | 500,000 | | | | 582,820 | |
| Virginia State Resources Authority, Clean Water, Revenue, | | | | | | | | |
| 5.00%, due 10/01/2021 | | | 500,000 | | | | 585,910 | |
| Virginia State Resources Authority, Infrastructure, Series B, Revenue, | | | | | | | | |
| 5.00%, due 11/01/2024 | | | 650,000 | | | | 743,877 | |
| Virginia State, Series B, GO, | | | | | | | | |
| 5.00%, due 06/01/2017 | | | 250,000 | | | | 287,462 | |
| | | | | | | | | |
Total Virginia Revenue and General Obligation (GO) Bonds (Cost $23,600,159) | | | | | | $ | 24,604,707 | |
WASHINGTON, D.C. REVENUE BONDS — 2.2% | | | | | | |
| Metropolitan Washington Airports Authority, Series C, Revenue, | | | | | | |
| 5.00%, due 10/01/2022 (Cost $506,570) | | $ | 500,000 | | | $ | 566,975 | |
EXCHANGE-TRADED FUNDS — 0.5% | | | | | | |
| SPDR Nuveen Barclays Short TermMunicipal Bond ETF (Cost $120,500) | | | 5,000 | | | $ | 121,100 | |
THE JAMESTOWN TAX EXEMPT VIRGINIA FUND
SCHEDULE OF INVESTMENTS (Continued)
MONEY MARKET FUNDS — 0.7% | | | | | | |
Fidelity Tax Exempt Portfolio - Class I, 0.01% (a) (Cost $184,793) | | | 184,793 | | | $ | 184,793 | |
| | | | | | | | | |
Total Investments at Value — 98.4% (Cost $24,412,022) | | | | | | $ | 25,477,575 | |
| | | | | | | | | |
| Other Assets in Excess of Liabilities — 1.6% | | | | | | | 405,648 | |
| | | | | | | | | |
| Net Assets — 100.0% | | | | | | $ | 25,883,223 | |
| ETM - Escrowed to Maturity. |
| |
| (a) | The rate shown is the 7-day effective yield as of September 30, 2013. |
| | |
| See accompanying notes to financial statements. |
THE JAMESTOWN FUNDS
STATEMENTS OF ASSETS AND LIABILITIES
September 30, 2013 (Unaudited)
| | | | | | | | The Jamestown Tax Exempt Virginia Fund | |
| ASSETS | | | | | | | | | |
| Investments in securities: | | | | | | | | | |
| At acquisition cost | | $ | 12,331,982 | | | $ | 17,534,877 | | | $ | 24,412,022 | |
| At value (Note 2) | | $ | 17,608,620 | | | $ | 28,237,325 | | | $ | 25,477,575 | |
| Cash | | | 1,525,048 | | | | 2,077,983 | | | | — | |
| Dividends and interest receivable | | | 63,152 | | | | 21,090 | | | | 333,113 | |
| Receivable for investment securities sold | | | — | | | | — | | | | 120,899 | |
| Receivable for capital shares sold | | | — | | | | 515 | | | | — | |
| Other assets | | | 3,182 | | | | 8,372 | | | | 7,572 | |
| TOTAL ASSETS | | | 19,200,002 | | | | 30,345,285 | | | | 25,939,159 | |
| | | | | | | | | | | | | |
| LIABILITIES | | | | | | | | | | | | |
| Distributions payable | | | 5,422 | | | | 3,063 | | | | 7,967 | |
| Payable for investment securities purchased | | | 211,803 | | | | 88,665 | | | | — | |
| Payable for capital shares redeemed | | | 40,004 | | | | 106,756 | | | | 38,606 | |
| Accrued investment advisory fees (Note 4) | | | 9,650 | | | | 16,212 | | | | 4,848 | |
| Payable to administrator (Note 4) | | | 5,015 | | | | 5,015 | | | | 4,515 | |
| Other accrued expenses | | | 9,959 | | | | 2,224 | | | | — | |
| TOTAL LIABILITIES | | | 281,853 | | | | 221,935 | | | | 55,936 | |
| | | | | | | | | | | | | |
| NET ASSETS | | $ | 18,918,149 | | | $ | 30,123,350 | | | $ | 25,883,223 | |
| | | | | | | | | | | | | |
| Net assets consist of: | | | | | | | | | | | | |
| Paid-in capital | | $ | 12,715,819 | | | $ | 18,314,209 | | | $ | 24,825,896 | |
Accumulated (distributions in excess of)
net investment income | | | (33,435 | ) | | | 1,061 | | | | — | |
Accumulated net realized gains (losses)
from security transactions | | | 959,127 | | | | 1,105,632 | | | | (8,226 | ) |
| Net unrealized appreciation on investments | | | 5,276,638 | | | | 10,702,448 | | | | 1,065,553 | |
| Net assets | | $ | 18,918,149 | | | $ | 30,123,350 | | | $ | 25,883,223 | |
| | | | | | | | | | | | | |
Shares of beneficial interest outstanding (unlimited
number of shares authorized, $0.01 par value) | | | 1,281,325 | | | | 1,449,711 | | | | 2,542,684 | |
| | | | | | | | | | | | | |
Net asset value, offering price and
redemption price per share (Note 2) | | $ | 14.76 | | | $ | 20.78 | | | $ | 10.18 | |
| See accompanying notes to financial statements. |
THE JAMESTOWN FUNDS
STATEMENTS OF OPERATIONS
Six Months Ended September 30, 2013 (Unaudited)
| | The Jamestown Balanced Fund | | | | | | The Jamestown Tax Exempt Virginia Fund | |
| INVESTMENT INCOME | | | | | | | | | |
| Dividends | | $ | 127,588 | | | $ | 273,906 | | | $ | 1,145 | |
| Foreign withholding taxes on dividends | | | (1,106 | ) | | | (2,351 | ) | | | — | |
| Interest | | | 81,743 | | | | — | | | | 431,340 | |
| TOTAL INVESTMENT INCOME | | | 208,225 | | | | 271,555 | | | | 432,485 | |
| | | | | | | | | | | | | |
| EXPENSES | | | | | | | | | | | | |
| Investment advisory fees (Note 4) | | | 62,643 | | | | 96,692 | | | | 53,140 | |
| Administration fees (Note 4) | | | 27,000 | | | | 27,000 | | | | 24,000 | |
| Professional fees | | | 1,733 | | | | 9,363 | | | | 9,363 | |
| Trustees’ fees and expenses (Note 4) | | | 3,956 | | | | 3,956 | | | | 3,956 | |
| Compliance service fees (Note 4) | | | 3,100 | | | | 3,100 | | | | 3,100 | |
| Registration and filing fees | | | 3,349 | | | | 3,578 | | | | 2,275 | |
| Account maintenance fees | | | 1,184 | | | | 3,881 | | | | 3,823 | |
| Custodian and bank service fees | | | 3,249 | | | | 3,131 | | | | 2,410 | |
| Pricing costs | | | 3,012 | | | | 487 | | | | 4,594 | |
| Printing of shareholder reports | | | 2,429 | | | | 3,811 | | | | 1,585 | |
| Postage and supplies | | | 1,203 | | | | 1,563 | | | | 991 | |
| Insurance expense | | | 785 | | | | 1,092 | | | | 1,087 | |
| Other expenses | | | 5,270 | | | | 2,801 | | | | 1,444 | |
| TOTAL EXPENSES | | | 118,913 | | | | 160,455 | | | | 111,768 | |
| Fees voluntarily waived by the Adviser (Note 4) | | | (3,000 | ) | | | — | | | | (20,101 | ) |
| Expenses reimbursed through a directed brokerage arrangement (Note 5) | | | (3,000 | ) | | | (6,000 | ) | | | — | |
| NET EXPENSES | | | 112,913 | | | | 154,455 | | | | 91,667 | |
| | | | | | | | | | | | | |
| NET INVESTMENT INCOME | | | 95,312 | | | | 117,100 | | | | 340,818 | |
| | | | | | | | | | | | | |
REALIZED AND UNREALIZED GAINS
(LOSSES) ON INVESTMENTS | | | | | | | | | | | | |
| Net realized gains (losses) on security transactions | | | 1,003,332 | | | | 1,183,569 | | | | (20,560 | ) |
Net change in unrealized appreciation/
depreciation on investments | | | 77,296 | | | | 1,373,273 | | | | (740,377 | ) |
| | | | | | | | | | | | | |
NET REALIZED AND UNREALIZED GAINS
(LOSSES) ON INVESTMENTS | | | 1,080,628 | | | | 2,556,842 | | | | (760,937 | ) |
| | | | | | | | | | | | | |
NET INCREASE (DECREASE) IN NET ASSETS
FROM OPERATIONS | | $ | 1,175,940 | | | $ | 2,673,942 | | | $ | (420,119 | ) |
| See accompanying notes to financial statements. |
THE JAMESTOWN FUNDS
STATEMENTS OF CHANGES IN NET ASSETS
| | | The Jamestown Balanced Fund | | | | |
| | Six Months Ended Sept. 30, 2013 (Unaudited) | | | | | | Six Months Ended Sept. 30, 2013 (Unaudited) | | | | |
| FROM OPERATIONS | | | | | | | | | | | | |
| Net investment income | | $ | 95,312 | | | $ | 207,317 | | | $ | 117,100 | | | $ | 215,401 | |
Net realized gains on security
transactions | | | 1,003,332 | | | | 889,984 | | | | 1,183,569 | | | | 1,922,949 | |
Net change in unrealized appreciation/
depreciation on investments | | | 77,296 | | | | 478,467 | | | | 1,373,273 | | | | 876,033 | |
| Net increase in net assets from operations | | | 1,175,940 | | | | 1,575,768 | | | | 2,673,942 | | | | 3,014,383 | |
| | | | | | | | | | | | | | | | | |
DISTRIBUTIONS TO
SHAREHOLDERS | | | | | | | | | | | | | | | | |
| From net investment income | | | (113,342 | ) | | | (224,146 | ) | | | (117,373 | ) | | | (215,083 | ) |
From net realized gains from
security transactions | | | (355,439 | ) | | | (790,954 | ) | | | (823,204 | ) | | | (94,273 | ) |
Decrease in net assets from
distributions to shareholders | | | (468,781 | ) | | | (1,015,100 | ) | | | (940,577 | ) | | | (309,356 | ) |
| | | | | | | | | | | | | | | | | |
FROM CAPITAL SHARE
TRANSACTIONS | | | | | | | | | | | | | | | | |
| Proceeds from shares sold | | | 4,186 | | | | 131,667 | | | | 633,577 | | | | 1,576,724 | |
Net asset value of shares issued in
reinvestment of distributions
to shareholders | | | 450,167 | | | | 974,201 | | | | 911,698 | | | | 300,415 | |
| Payments for shares redeemed | | | (1,907,062 | ) | | | (1,050,797 | ) | | | (1,470,961 | ) | | | (3,969,846 | ) |
Net increase (decrease) in net assets from
capital share transactions | | | (1,452,709 | ) | | | 55,071 | | | | 74,314 | | | | (2,092,707 | ) |
| | | | | | | | | | | | | | | | | |
TOTAL INCREASE (DECREASE)
IN NET ASSETS | | | (745,550 | ) | | | 615,739 | | | | 1,807,679 | | | | 612,320 | |
| | | | | | | | | | | | | | | | | |
| NET ASSETS | | | | | | | | | | | | | | | | |
| Beginning of period | | | 19,663,699 | | | | 19,047,960 | | | | 28,315,671 | | | | 27,703,351 | |
| End of period | | $ | 18,918,149 | | | $ | 19,663,699 | | | $ | 30,123,350 | | | $ | 28,315,671 | |
| | | | | | | | | | | | | | | | | |
ACCUMULATED (DISTRIBUTIONS
IN EXCESS OF) NET
INVESTMENT INCOME | | $ | (33,435 | ) | | $ | (16,454 | ) | | $ | 1,061 | | | $ | 1,334 | |
| | | | | | | | | | | | | | | | | |
| CAPITAL SHARE ACTIVITY | | | | | | | | | | | | | | | | |
| Shares sold | | | 288 | | | | 9,633 | | | | 31,781 | | | | 89,792 | |
| Shares reinvested | | | 31,503 | | | | 73,177 | | | | 46,122 | | | | 16,841 | |
| Shares redeemed | | | (130,333 | ) | | | (77,534 | ) | | | (72,703 | ) | | | (224,592 | ) |
Net increase (decrease)
in shares outstanding | | | (98,542 | ) | | | 5,276 | | | | 5,200 | | | | (117,959 | ) |
| Shares outstanding, beginning of period | | | 1,379,867 | | | | 1,374,591 | | | | 1,444,511 | | | | 1,562,470 | |
| Shares outstanding, end of period | | | 1,281,325 | | | | 1,379,867 | | | | 1,449,711 | | | | 1,444,511 | |
| See accompanying notes to financial statements. |
THE JAMESTOWN FUNDS
STATEMENTS OF CHANGES IN NET ASSETS (Continued)
| | | The Jamestown Tax Exempt Virginia Fund | |
| | Six Months
Ended Sept. 30, 2013 (Unaudited) | | | | |
| FROM OPERATIONS | | | | | | |
| Net investment income | | $ | 340,818 | | | $ | 747,939 | |
| Net realized gains (losses) on security transactions | | | (20,560 | ) | | | 78,456 | |
| Net change in unrealized appreciation/depreciation on investments | | | (740,377 | ) | | | (242,548 | ) |
| Net increase (decrease) in net assets from operations | | | (420,119 | ) | | | 583,847 | |
| | | | | | | | | |
| DISTRIBUTIONS TO SHAREHOLDERS | | | | | | | | |
| From net investment income | | | (340,818 | ) | | | (747,939 | ) |
| From net realized gains from security transactions | | | — | | | | (93,442 | ) |
| Decrease in net assets from distributions to shareholders | | | (340,818 | ) | | | (841,381 | ) |
| | | | | | | | | |
| FROM CAPITAL SHARE TRANSACTIONS | | | | | | | | |
| Proceeds from shares sold | | | 128,780 | | | | 734,926 | |
Net asset value of shares issued in reinvestment of
distributions to shareholders | | | 289,896 | | | | 708,237 | |
| Payments for shares redeemed | | | (1,556,537 | ) | | | (3,466,314 | ) |
| Net decrease in net assets from capital share transactions | | | (1,137,861 | ) | | | (2,023,151 | ) |
| | | | | | | | | |
| TOTAL DECREASE IN NET ASSETS | | | (1,898,798 | ) | | | (2,280,685 | ) |
| | | | | | | | | |
| NET ASSETS | | | | | | | | |
| Beginning of period | | | 27,782,021 | | | | 30,062,706 | |
| End of period | | $ | 25,883,223 | | | $ | 27,782,021 | |
| | | | | | | | | |
| ACCUMULATED NET INVESTMENT INCOME | | $ | — | | | $ | — | |
| | | | | | | | | |
| CAPITAL SHARE ACTIVITY | | | | | | | | |
| Shares sold | | | 12,647 | | | | 69,415 | |
| Shares reinvested | | | 28,268 | | | | 66,905 | |
| Shares redeemed | | | (150,862 | ) | | | (328,521 | ) |
| Net decrease in shares outstanding | | | (109,947 | ) | | | (192,201 | ) |
| Shares outstanding, beginning of period | | | 2,652,631 | | | | 2,844,832 | |
| Shares outstanding, end of period | | | 2,542,684 | | | | 2,652,631 | |
| See accompanying notes to financial statements. |
THE JAMESTOWN BALANCED FUND
FINANCIAL HIGHLIGHTS
Selected Per Share Data and Ratios for a Share Outstanding Throughout Each Period
| | | Six Months Ended Sept. 30, 2013 | | | | |
| | | | | | | | | | | | | | | | | | | |
Net asset value at
beginning of period | | $ | 14.25 | | | $ | 13.86 | | | $ | 13.16 | | | $ | 12.11 | | | $ | 10.09 | | | $ | 12.95 | |
| | | | | | | | | | | | | | | | | | | | | | | | | |
Income (loss) from
investment operations: | | | | | | | | | | | | | | | | | | | | | | | | |
| Net investment income | | | 0.07 | | | | 0.15 | | | | 0.14 | | | | 0.16 | | | | 0.22 | | | | 0.25 | |
| Net realized and unrealized gains (losses) on investments | | 0.80 | | | | 0.98 | | | | 0.71 | | | | 1.06 | | | | 2.04 | | | | (2.91 | ) |
| Total from investment operations | | 0.87 | | | | 1.13 | | | | 0.85 | | | | 1.22 | | | | 2.26 | | | | (2.66 | ) |
| | | | | | | | | | | | | | | | | | | | | | | | | |
| Less distributions: | | | | | | | | | | | | | | | | | | | | | | | | |
Dividends from net
investment income | | | (0.09 | ) | | | (0.16 | ) | | | (0.15 | ) | | | (0.17 | ) | | | (0.24 | ) | | | (0.20 | ) |
Distributions from net
realized gains | | | (0.27 | ) | | | (0.58 | ) | | | — | | | | — | | | | — | | | | — | |
| Total distributions | | | (0.36 | ) | | | (0.74 | ) | | | (0.15 | ) | | | (0.17 | ) | | | (0.24 | ) | | | (0.20 | ) |
| | | | | | | | | | | | | | | | | | | | | | | | | |
| Net asset value at end of period | | $ | 14.76 | | | $ | 14.25 | | | $ | 13.86 | | | $ | 13.16 | | | $ | 12.11 | | | $ | 10.09 | |
| | | | | | | | | | | | | | | | | | | | | | | | | |
Total return (a) | | | 6.21% | (b) | | | 8.68% | | | | 6.56% | | | | 10.24% | | | | 22.56% | | | | (20.75% | ) |
| | | | | | | | | | | | | | | | | | | | | | | | | |
| Net assets at end of period (000’s) | $ | 18,918 | | | $ | 19,664 | | | $ | 19,048 | | | $ | 21,331 | | | $ | 22,183 | | | $ | 21,072 | |
| | | | | | | | | | | | | | | | | | | | | | | | | |
Ratio of total expenses to
average net assets | | | 1.23% | (c) | | | 1.29% | | | | 1.28% | | | | 1.24% | | | | 1.20% | | | | 1.14% | |
| | | | | | | | | | | | | | | | | | | | | | | | | |
Ratio of net expenses to
average net assets (d) | | | 1.17% | (c) | | | 1.22% | | | | 1.21% | | | | 1.18% | | | | 1.11% | | | | 1.05% | |
| | | | | | | | | | | | | | | | | | | | | | | | | |
Ratio of net investment income
to average net assets (d) | | | 0.99% | (c) | | | 1.11% | | | | 1.08% | | | | 1.31% | | | | 1.98% | | | | 2.10% | |
| | | | | | | | | | | | | | | | | | | | | | | | | |
| Portfolio turnover rate | | | 13% | (b) | | | 21% | | | | 20% | | | | 30% | | | | 40% | | | | 43% | |
| (a) | Total return is a measure of the change in value of an investment in the Fund over the period covered, which assumes any dividends or capital gains distributions are reinvested in shares of the Fund. Returns do not reflect the deduction of taxes a shareholder would pay on Fund distributions or the redemption of Fund shares. |
| | |
| (b) | Not annualized. |
| | |
| (c) | Annualized. |
| | |
| (d) | Ratios were determined based on net expenses after voluntary advisory fee waivers by the Adviser (Note 4) and/or expense reimbursements through a directed brokerage arrangement (Note 5). |
| | |
| See accompanying notes to financial statements. |
THE JAMESTOWN EQUITY FUND
FINANCIAL HIGHLIGHTS
Selected Per Share Data and Ratios for a Share Outstanding Throughout Each Period
| | | Six Months Ended Sept. 30, 2013 | | | | |
| | | | | | | | | | | | | | | | | | | |
Net asset value at
beginning of period | | $ | 19.60 | | | $ | 17.73 | | | $ | 16.54 | | | $ | 14.67 | | | $ | 11.01 | | | $ | 16.68 | |
| | | | | | | | | | | | | | | | | | | | | | | | | |
Income (loss) from
investment operations: | | | | | | | | | | | | | | | | | | | | | | | | |
| Net investment income | | | 0.08 | | | | 0.15 | | | | 0.09 | | | | 0.09 | | | | 0.10 | | | | 0.08 | |
| Net realized and unrealized gains (losses) on investments | | 1.75 | | | | 1.93 | | | | 1.21 | | | | 1.87 | | | | 3.64 | | | | (5.68 | ) |
| Total from investment operations | | | 1.83 | | | | 2.08 | | | | 1.30 | | | | 1.96 | | | | 3.74 | | | | (5.60 | ) |
| | | | | | | | | | | | | | | | | | | | | | | | | |
| Less distributions: | | | | | | | | | | | | | | | | | | | | | | | | |
Dividends from net
investment income | | | (0.08 | ) | | | (0.15 | ) | | | (0.11 | ) | | | (0.09 | ) | | | (0.08 | ) | | | — | |
Distributions from net
realized gains | | | (0.57 | ) | | | (0.06 | ) | | | — | | | | — | | | | — | | | | — | |
| Return of capital | | | — | | | | — | | | | — | | | | — | | | | — | | | | (0.07 | ) |
| Total distributions | | | (0.65 | ) | | | (0.21 | ) | | | (0.11 | ) | | | (0.09 | ) | | | (0.08 | ) | | | (0.07 | ) |
| | | | | | | | | | | | | | | | | | | | | | | | | |
| Net asset value at end of period | | $ | 20.78 | | | $ | 19.60 | | | $ | 17.73 | | | $ | 16.54 | | | $ | 14.67 | | | $ | 11.01 | |
| | | | | | | | | | | | | | | | | | | | | | | | | |
Total return (a) | | | 9.52% | (b) | | | 11.84% | | | | 7.89% | | | | 13.48% | | | | 33.96% | | | | (33.63% | ) |
| | | | | | | | | | | | | | | | | | | | | | | | | |
| Net assets at end of period (000’s) | $ | 30,123 | | | $ | 28,316 | | | $ | 27,703 | | | $ | 28,359 | | | $ | 26,534 | | | $ | 18,790 | |
| | | | | | | | | | | | | | | | | | | | | | | | | |
Ratio of total expenses to
average net assets | | | 1.08% | (c) | | | 1.11% | | | | 1.11% | | | | 1.13% | | | | 1.16% | | | | 1.15% | |
| | | | | | | | | | | | | | | | | | | | | | | | | |
Ratio of net expenses to
average net assets (d) | | | 1.04% | (c) | | | 1.06% | | | | 1.06% | | | | 1.09% | | | | 1.12% | | | | 1.10% | |
| | | | | | | | | | | | | | | | | | | | | | | | | |
Ratio of net investment income
to average net assets (d) | | | 0.79% | (c) | | | 0.81% | | | | 0.56% | | | | 0.56% | | | | 0.78% | | | | 0.56% | |
| | | | | | | | | | | | | | | | | | | | | | | | | |
| Portfolio turnover rate | | | 12% | (b) | | | 28% | | | | 28% | | | | 49% | | | | 59% | | | | 69% | |
| (a) | Total return is a measure of the change in value of an investment in the Fund over the period covered, which assumes any dividends or capital gains distributions are reinvested in shares of the Fund. Returns do not reflect the deduction of taxes a shareholder would pay on Fund distributions or the redemption of Fund shares. |
| | |
| (b) | Not annualized. |
| | |
| (c) | Annualized. |
| | |
| (d) | Ratios were determined based on net expenses after expense reimbursements through a directed brokerage arrangement (Note 5). |
| | |
| See accompanying notes to financial statements. |
THE JAMESTOWN TAX EXEMPT VIRGINIA FUND
FINANCIAL HIGHLIGHTS
Selected Per Share Data and Ratios for a Share Outstanding Throughout Each Period
| | | Six Months Ended Sept. 30, 2013 | | | | |
| | | | | | | | | | | | | | | | | | | |
Net asset value at
beginning of period | | $ | 10.47 | | | $ | 10.57 | | | $ | 10.25 | | | $ | 10.33 | | | $ | 10.24 | | | $ | 10.10 | |
| | | | | | | | | | | | | | | | | | | | | | | | | |
Income (loss) from
investment operations: | | | | | | | | | | | | | | | | | | | | | | | | |
| Net investment income | | | 0.13 | | | | 0.26 | | | | 0.29 | | | | 0.29 | | | | 0.30 | | | | 0.34 | |
| Net realized and unrealized gains (losses) on investments | | (0.29 | ) | | | (0.06 | ) | | | 0.32 | | | | (0.06 | ) | | | 0.11 | | | | 0.13 | |
| Total from investment operations | | | (0.16 | ) | | | 0.20 | | | | 0.61 | | | | 0.23 | | | | 0.41 | | | | 0.47 | |
| | | | | | | | | | | | | | | | | | | | | | | | | |
| Less distributions: | | | | | | | | | | | | | | | | | | | | | | | | |
Dividends from net
investment income | | | (0.13 | ) | | | (0.27 | ) | | | (0.29 | ) | | | (0.29 | ) | | | (0.31 | ) | | | (0.33 | ) |
Distributions from net
realized gains | | | — | | | | (0.03 | ) | | | (0.00 | )(a) | | | (0.02 | ) | | | (0.01 | ) | | | (0.00 | )(a) |
| Total distributions | | | (0.13 | ) | | | (0.30 | ) | | | (0.29 | ) | | | (0.31 | ) | | | (0.32 | ) | | | (0.33 | ) |
| | | | | | | | | | | | | | | | | | | | | | | | | |
| Net asset value at end of period | | $ | 10.18 | | | $ | 10.47 | | | $ | 10.57 | | | $ | 10.25 | | | $ | 10.33 | | | $ | 10.24 | |
| | | | | | | | | | | | | | | | | | | | | | | | | |
Total return (b) | | | (1.51% | )(c) | | | 1.88% | | | | 6.03% | | | | 2.26% | | | | 4.04% | | | | 4.77% | |
| | | | | | | | | | | | | | | | | | | | | | | | | |
| Net assets at end of period (000’s) | $ | 25,883 | | | $ | 27,782 | | | $ | 30,063 | | | $ | 30,368 | | | $ | 32,905 | | | $ | 32,730 | |
| | | | | | | | | | | | | | | | | | | | | | | | | |
Ratio of total expenses to
average net assets | | | 0.84% | (d) | | | 0.76% | | | | 0.77% | | | | 0.76% | | | | 0.75% | | | | 0.77% | |
| | | | | | | | | | | | | | | | | | | | | | | | | |
Ratio of net expenses to
average net assets (e) | | | 0.69% | (d) | | | 0.69% | | | | 0.69% | | | | 0.69% | | | | 0.69% | | | | 0.69% | |
| | | | | | | | | | | | | | | | | | | | | | | | | |
Ratio of net investment income
to average net assets (e) | | | 2.57% | (d) | | | 2.50% | | | | 2.75% | | | | 2.78% | | | | 2.89% | | | | 3.31% | |
| | | | | | | | | | | | | | | | | | | | | | | | | |
| Portfolio turnover rate | | | 1% | (c) | | | 15% | | | | 2% | | | | 8% | | | | 16% | | | | 10% | |
| (a) | Amount rounds to less than a penny per share. |
| | |
| (b) | Total return is a measure of the change in value of an investment in the Fund over the period covered, which assumes any dividends or capital gains distributions are reinvested in shares of the Fund. Returns do not reflect the deduction of taxes a shareholder would pay on Fund distributions or the redemption of Fund shares. |
| | |
| (c) | Not annualized. |
| | |
| (d) | Annualized. |
| | |
| (e) | Ratios were determined after voluntary advisory fee waivers by the Adviser (Note 4). |
| | |
| See accompanying notes to financial statements. |
THE JAMESTOWN FUNDS
NOTES TO FINANCIAL STATEMENTS
September 30, 2013 (Unaudited)
1. Organization
The Jamestown Balanced Fund, The Jamestown Equity Fund and The Jamestown Tax Exempt Virginia Fund (individually, a “Fund,” and, collectively, the “Funds”) are each a no-load series of Williamsburg Investment Trust (the “Trust”), an open-end management investment company registered under the Investment Company Act of 1940. The Jamestown Balanced Fund and The Jamestown Equity Fund are each a diversified fund and The Jamestown Tax Exempt Virginia Fund is a non-diversified fund. The Trust was organized as a Massachusetts business trust on July 18, 1988. Other series of the Trust are not included in this report.
The Jamestown Balanced Fund’s investment objectives are long-term growth of capital and income.
The Jamestown Equity Fund’s investment objective is long-term growth of capital.
The Jamestown Tax Exempt Virginia Fund’s investment objectives are to provide current income exempt from federal income taxes and from the personal income taxes of Virginia, to preserve capital, to limit credit risk and to take advantage of opportunities to increase and enhance the value of a shareholder’s investment.
2. Significant Accounting Policies
The following is a summary of the Funds’ significant accounting policies. The policies are in conformity with accounting principles generally accepted in the United States of America (“GAAP”).
Securities valuation — The Funds’ portfolio securities are valued as of the close of business of the regular session of the New York Stock Exchange (normally 4:00 p.m., Eastern time). Securities traded on a national stock exchange are generally valued based upon the closing price on the principal exchange where the security is traded. Securities which are quoted by NASDAQ are valued at the NASDAQ Official Closing Price. Securities which are traded over-the-counter are valued at the last sales price, if available, otherwise, at the last quoted bid price. It is expected that fixed income securities will ordinarily be traded in the over-the-counter market, and common stocks will ordinarily be traded on a national securities exchange, but may also be traded in the over-the-counter market. Short-term instruments (those with remaining maturities of 60 days or less) may be valued at amortized cost, which approximates market value.
When market quotations are not readily available, securities may be valued on the basis of prices provided by an independent pricing service. The prices provided by the pricing service are determined with consideration given to institutional bid and last sale prices and take into account securities prices, yields, maturities, call features, ratings, institutional trading in similar groups of securities and developments related to specific securities. If a pricing service cannot provide a valuation or the investment adviser believes the price received from the pricing service is not indicative of fair value, securities will be valued in good faith at fair value using methods consistent with those established by and under the general supervision of the Board of Trustees and will be classified as Level 2 or 3 within the fair value hierarchy (see below), depending on the inputs used. Such methods of fair valuation may include, but are not limited to: multiple
THE JAMESTOWN FUNDS
NOTES TO FINANCIAL STATEMENTS (Continued)
of earnings, multiple of book value, discount from market of a similar freely traded security, purchase price of the security, subsequent private transactions in the security or related securities, or a combination of these and other factors.
GAAP establishes a single authoritative definition of fair value, sets out a framework for measuring fair value and requires additional disclosures about fair value measurements.
Various inputs are used in determining the value of each Fund’s investments. These inputs are summarized in the three broad levels listed below:
| • | Level 1 – quoted prices in active markets for identical securities |
| • | Level 2 – other significant observable inputs |
| • | Level 3 – significant unobservable inputs |
Fixed income securities, including obligations of the U.S. Treasury and U.S. Government agencies, corporate bonds, mortgage-backed securities and municipal bonds, are classified as Level 2 since the values for such securities are based on prices provided by an independent pricing service that utilizes various “other significant observable inputs” including bid and ask quotations, prices of similar securities and interest rates, among other factors.
The inputs or methodology used for valuing securities are not necessarily an indication of the risks associated with investing in those securities. The inputs used to measure fair value may fall into different levels of the fair value hierarchy. In such cases, for disclosure purposes, the level in the fair value hierarchy within which the fair value measurement falls in its entirety is determined based on the lowest level input that is significant to the fair value measurement.
The following is a summary of the inputs used to value each Fund’s investments as of September 30, 2013 by security type:
The Jamestown Balanced Fund | | | | | | | | | | | | |
| Common Stocks | | $ | 12,312,840 | | | $ | — | | | $ | — | | | $ | 12,312,840 | |
| Exchange-Traded Funds | | | 149,400 | | | | — | | | | — | | | | 149,400 | |
| U.S. Treasury Obligations | | | — | | | | 1,419,115 | | | | — | | | | 1,419,115 | |
| U.S. Government Agency Obligations | | | — | | | | 559,308 | | | | — | | | | 559,308 | |
| Corporate Bonds | | | — | | | | 2,736,033 | | | | — | | | | 2,736,033 | |
| Mortgage-Backed Securities | | | — | | | | 329,827 | | | | — | | | | 329,827 | |
| Municipal Bonds | | | — | | | | 102,097 | | | | — | | | | 102,097 | |
| Total | | $ | 12,462,240 | | | $ | 5,146,380 | | | $ | — | | | $ | 17,608,620 | |
The Jamestown Equity Fund | | | | | | | | | | | | |
| Common Stocks | | $ | 27,878,765 | | | $ | — | | | $ | — | | | $ | 27,878,765 | |
| Exchange-Traded Funds | | | 358,560 | | | | — | | | | — | | | | 358,560 | |
| Total | | $ | 28,237,325 | | | $ | — | | | $ | — | | | $ | 28,237,325 | |
THE JAMESTOWN FUNDS
NOTES TO FINANCIAL STATEMENTS (Continued)
The Jamestown Tax Exempt Virginia Fund | | | | | | | | | | | | |
| Municipal Bonds | | $ | — | | | $ | 25,171,682 | | | $ | — | | | $ | 25,171,682 | |
| Exchange-Traded Funds | | | 121,100 | | | | — | | | | — | | | | 121,100 | |
| Money Market Funds | | | 184,793 | | | | — | | | | — | | | | 184,793 | |
| Total | | $ | 305,893 | | | $ | 25,171,682 | | | $ | — | | | $ | 25,477,575 | |
Refer to The Jamestown Balanced Fund’s and The Jamestown Equity Fund’s Schedules of Investments for a listing of the common stocks and corporate bonds by sector type. As of September 30, 2013, the Funds did not have any transfers in and out of any Level. There were no Level 3 securities or derivative instruments held by the Funds as of September 30, 2013. It is the Funds’ policy to recognize transfers into and out of any Level at the end of the reporting period.
Share valuation — The net asset value per share of each Fund is calculated daily by dividing the total value of its assets, less liabilities, by the number of shares outstanding. The offering price and redemption price per share of each Fund is equal to the net asset value per share.
Investment income — Interest income is accrued as earned. Dividend income is recorded on the ex-dividend date. Discounts and premiums on fixed income securities purchased are amortized using the interest method.
Distributions to shareholders — Dividends arising from net investment income, if any, are declared and paid quarterly to shareholders of The Jamestown Balanced Fund and The Jamestown Equity Fund. Dividends arising from net investment income are declared daily and paid monthly to shareholders of The Jamestown Tax Exempt Virginia Fund. Net realized short-term capital gains, if any, may be distributed throughout the year and net realized long-term capital gains, if any, are distributed at least once each year. The amount of distributions from net investment income and net realized gains are determined in accordance with federal income tax regulations which may differ from GAAP. These “book/tax” differences are permanent in nature and are primarily due to differing treatments of net short-term gains. Dividends and distributions are recorded on the ex-dividend date.
The tax character of distributions paid during the periods ended September 30, 2013 and March 31, 2013 was as follows:
| | | | | | | | | Exempt- Interest Dividends | | | | |
| The Jamestown Balanced Fund | 9/30/13 | | $ | 212,471 | | | $ | 256,310 | | | $ | — | | | $ | 468,781 | |
| | 3/31/13 | | $ | 298,063 | | | $ | 717,037 | | | $ | — | | | $ | 1,015,100 | |
| The Jamestown Equity Fund | 9/30/13 | | $ | 117,373 | | | $ | 823,204 | | | $ | — | | | $ | 940,577 | |
| | 3/31/13 | | $ | 215,083 | | | $ | 94,273 | | | $ | — | | | $ | 309,356 | |
| The Jamestown Tax Exempt Virginia Fund | 9/30/13 | | $ | — | | | $ | — | | | $ | 340,818 | | | $ | 340,818 | |
| | 3/31/13 | | $ | 108 | | | $ | 93,334 | | | $ | 747,939 | | | $ | 841,381 | |
THE JAMESTOWN FUNDS
NOTES TO FINANCIAL STATEMENTS (Continued)
Security transactions — Security transactions are accounted for on trade date for financial reporting purposes. Gains and losses on securities sold are determined on a specific identification basis.
Securities traded on a “to-be-announced” basis — The Jamestown Balanced Fund may trade securities on a “to-be-announced” (“TBA”) basis. In a TBA transaction, the Fund has committed to purchase securities for which all specific information is not yet known at the time of the trade, particularly the face amount in mortgage-backed securities transactions. Securities purchased on a TBA basis are not settled until they are delivered to the Fund, normally 15 to 45 days later. These transactions are subject to market fluctuations and their current value is determined in the same manner as for other portfolio securities.
Common expenses — Common expenses of the Trust are allocated among the series of the Trust based on relative net assets of each series or the nature of the services performed and the relative applicability to each series.
Estimates — The preparation of financial statements in conformity with GAAP requires management to make estimates and assumptions that affect the reported amounts of assets and liabilities and the disclosure of contingent assets and liabilities as of the date of the financial statements and the reported amounts of income and expenses during the reporting period. Actual results could differ from those estimates.
Federal income tax — It is each Fund’s policy to comply with the special provisions of Subchapter M of the Internal Revenue Code applicable to regulated investment companies. As provided therein, in any fiscal year in which a Fund so qualifies and distributes at least 90% of its taxable net income, the Fund (but not the shareholders) will be relieved of federal income tax on the income distributed. Accordingly, no provision for income taxes has been made.
In order to avoid imposition of the excise tax applicable to regulated investment companies, it is also each Fund’s intention to declare as dividends in each calendar year at least 98% of its net investment income (earned during the calendar year) and 98.2% of its net realized capital gains (earned during the twelve months ended October 31) plus undistributed amounts from prior years.
The tax character of distributable earnings at September 30, 2013 was as follows:
| | The Jamestown Balanced Fund | | | The Jamestown Equity Fund | | | The Jamestown Tax Exempt Virginia Fund | |
| Cost of portfolio investments | | $ | 12,397,964 | | | $ | 17,609,796 | | | $ | 24,412,022 | |
| Gross unrealized appreciation | | $ | 5,279,554 | | | $ | 10,695,813 | | | $ | 1,288,686 | |
| Gross unrealized depreciation | | | (68,898 | ) | | | (68,284 | ) | | | (223,133 | ) |
| Net unrealized appreciation on investments | | | 5,210,656 | | | | 10,627,529 | | | | 1,065,553 | |
| Accumulated ordinary income | | | 5,888 | | | | 4,124 | | | | — | |
| Accumulated tax exempt income | | | — | | | | — | | | | 7,967 | |
| Undistributed long-term capital gains | | | — | | | | — | | | | 12,334 | |
| Other gains (losses) | | | 991,208 | | | | 1,180,551 | | | | (20,560 | ) |
| Other temporary differences | | | (5,422 | ) | | | (3,063 | ) | | | (7,967 | ) |
| Total distributable earnings | | $ | 6,202,330 | | | $ | 11,809,141 | | | $ | 1,057,327 | |
THE JAMESTOWN FUNDS
NOTES TO FINANCIAL STATEMENTS (Continued)
The difference between the federal income tax cost of portfolio investments and the financial statement cost for The Jamestown Balanced Fund and The Jamestown Equity Fund is due to certain timing differences in the recognition of capital gains or losses under income tax regulations and GAAP. These “book/tax” differences are temporary in nature and are primarily due to the tax deferral of losses on wash sales and/or differing methods in the amortization of premium on fixed income securities.
For the six months ended September 30, 2013, The Jamestown Balanced Fund reclassified $1,049 of distributions in excess of net investment income against accumulated net realized gains from security transactions. The difference is primarily due to the tax treatment of certain debt obligations and paydown adjustments. Such reclassification had no effect on the Fund's net assets or net asset value per share.
The Funds recognize the tax benefits or expenses of uncertain tax positions only when the position is “more likely than not” to be sustained assuming examination by tax authorities. Management has reviewed the tax positions taken on Federal income tax returns for all open tax years (tax years ended March 31, 2010 through March 31, 2013) of each Fund and has concluded that no provision for unrecognized tax benefits or expenses is required in these financial statements.
3. Investment Transactions
Investment transactions, other than short-term investments and U.S. government securities, were as follows for the six months ended September 30, 2013:
| | The Jamestown Balanced Fund | | | The Jamestown Equity Fund | | | The Jamestown Tax Exempt Virginia Fund | |
| Purchase of investment securities | | $ | 1,961,388 | | | $ | 3,284,387 | | | $ | 284,325 | |
| Proceeds from sales and maturities of investment securities | | $ | 3,107,184 | | | $ | 3,711,322 | | | $ | 1,010,734 | |
4. Transactions with Related Parties
INVESTMENT ADVISORY AGREEMENTS
Each Fund’s investments are managed by Lowe, Brockenbrough & Company, Inc. (the “Adviser”) under the terms of an Investment Advisory Agreement. The Jamestown Balanced Fund pays the Adviser a fee, which is computed and accrued daily and paid monthly, at an annual rate of .65% of its average daily net assets up to $250 million, .60% of the next $250 million of such assets and .55% of such assets in excess of $500 million. The Jamestown Equity Fund pays the Adviser a fee, which is computed and accrued daily and paid monthly, at an annual rate of .65% of its average daily net assets up to $500 million and .55% of such assets in excess of $500 million. The Jamestown Tax Exempt Virginia Fund pays the Adviser a fee, which is computed and accrued daily and paid monthly, at an annual rate of .40% of its average daily net assets up to $250 million, .35% of the next $250 million of such assets and .30% of such assets in excess of $500 million. Certain officers of the Trust are also officers of the Adviser.
THE JAMESTOWN FUNDS
NOTES TO FINANCIAL STATEMENTS (Continued)
In order to limit the annual operating expenses of The Jamestown Balanced Fund, the Adviser voluntarily waived $3,000 of its investment advisory fees during the six months ended September 30, 2013. Additionally, during the six months ended September 30, 2013, the Adviser voluntarily undertook to limit the total annual operating expenses of The Jamestown Tax Exempt Virginia Fund to .69% of average daily net assets. Accordingly, the Adviser voluntarily waived $20,101 of its investment advisory fees during the six months ended September 30, 2013.
MUTUAL FUND SERVICES AGREEMENT
Under the terms of a Mutual Fund Services Agreement between the Trust and Ultimus Fund Solutions, LLC (“Ultimus”), Ultimus provides administrative, pricing, accounting, dividend disbursing, shareholder servicing and transfer agent services for the Funds. For these services, Ultimus receives a monthly fee from each Fund at an annual rate of .15% of its average daily net assets up to $25 million; .125% of the next $25 million of such assets; and .10% of such assets in excess of $50 million. The Jamestown Balanced Fund and The Jamestown Equity Fund are each subject to a minimum monthly fee of $4,500 and The Jamestown Tax Exempt Virginia Fund is subject to a minimum monthly fee of $4,000. In addition, each Fund pays out-of-pocket expenses including, but not limited to, postage, supplies and costs of pricing portfolio securities. Certain officers of the Trust are also officers of Ultimus, or of Ultimus Fund Distributors, LLC (the “Distributor”), the principal underwriter of each Fund’s shares and an affiliate of Ultimus. The Distributor is compensated by the Adviser (not the Funds) for acting as principal underwriter.
COMPLIANCE CONSULTING AGREEMENT
Under the terms of a Compliance Consulting Agreement between the Trust and Ultimus, Ultimus provides an individual to serve as the Trust’s Chief Compliance Officer and to administer the Funds’ compliance policies and procedures. For these services, the Funds pay Ultimus an annual base fee of $18,600 plus an asset-based fee equal to 0.01% per annum on the Funds’ aggregate net assets in excess of $100 million. Each Fund pays its proportionate share of such fee. In addition, the Funds reimburse Ultimus for reasonable out-of-pocket expenses, if any, incurred in connection with these services.
COMPENSATION OF TRUSTEES
Trustees and officers affiliated with the Adviser or Ultimus are not compensated by the Trust for their services. Each Trustee who is not an affiliated person of the Adviser or Ultimus receives from the Trust an annual retainer of $10,000, payable quarterly; a fee of $1,500 for attendance at each meeting of the Board of Trustees (except that such fee is $2,500 for the independent chairman); and $1,000 for attendance at each meeting of any committee of the Board (except that such fee is $1,500 for the committee chairman); plus reimbursement of travel and other expenses incurred in attending meetings. Prior to July 1, 2013, the annual retainer was $8,000.
THE JAMESTOWN FUNDS
NOTES TO FINANCIAL STATEMENTS (Continued)
5. Brokerage Arrangement
In order to reduce the total operating expenses of The Jamestown Balanced Fund and The Jamestown Equity Fund, a portion of each Fund’s operating expenses have been paid through an arrangement with a third-party broker-dealer who is compensated through commission trades. Payment of expenses by the broker-dealer is based on a percentage of commissions earned. Expenses reimbursed through the brokerage arrangement totaled $3,000 and $6,000 for The Jamestown Balanced Fund and The Jamestown Equity Fund, respectively, for the six months ended September 30, 2013.
6. Contingencies and Commitments
The Funds indemnify the Trust’s officers and Trustees for certain liabilities that might arise from their performance of their duties to the Funds. Additionally, in the normal course of business the Funds enter into contracts that contain a variety of representations and warranties and which provide general indemnifications. The Funds’ maximum exposure under these arrangements is unknown, as this would involve future claims that may be made against the Funds that have not yet occurred. However, based on experience, the Funds expect the risk of loss to be remote.
7. Concentration of Credit Risk
The Jamestown Tax Exempt Virginia Fund invests primarily in debt instruments of municipal issuers in the Commonwealth of Virginia. The issuers’ abilities to meet their obligations may be affected by economic developments in the Commonwealth or its region, as well as disruptions in the credit markets and the economy, generally.
8. Subsequent Events
The Funds are required to recognize in the financial statements the effects of all subsequent events that provide additional evidence about conditions that existed as of the date of the Statements of Assets and Liabilities. For non-recognized subsequent events that must be disclosed to keep the financial statements from being misleading, the Funds are required to disclose the nature of the event as well as an estimate of its financial effect, or a statement that such an estimate cannot be made. Management has evaluated subsequent events through the issuance of these financial statements and has noted no such events.
THE JAMESTOWN FUNDS
ABOUT YOUR FUNDS’ EXPENSES (Unaudited)
We believe it is important for you to understand the impact of costs on your investment. All mutual funds have operating expenses. As a shareholder of the Funds, you incur ongoing costs, including management fees and other expenses. The following examples are intended to help you understand your ongoing costs (in dollars) of investing in the Funds and to compare these costs with the ongoing costs of investing in other mutual funds.
A mutual fund’s ongoing costs are expressed as a percentage of its average net assets. This figure is known as the expense ratio. The expenses in the table below are based on an investment of $1,000 made at the beginning of the period shown and held for the entire period (April 1, 2013 through September 30, 2013).
The table below illustrates each Fund’s costs in two ways:
Actual fund return – This section helps you to estimate the actual expenses that you paid over the period. The “Ending Account Value” shown is derived from each Fund’s actual return, and the third column shows the dollar amount of operating expenses that would have been paid by an investor who started with $1,000 in the Funds. You may use the information here, together with the amount you invested, to estimate the expenses that you paid over the period.
To do so, simply divide your account value by $1,000 (for example, an $8,600 account value divided by $1,000 = 8.6), then multiply the result by the number given for the Funds under the heading “Expenses Paid During Period.”
Hypothetical 5% return – This section is intended to help you compare the Funds’ ongoing costs with those of other mutual funds. It assumes that each Fund had an annual return of 5% before expenses during the period shown, but that the expense ratio is unchanged. In this case, because the returns used are not the Funds’ actual returns, the results do not apply to your investment. The example is useful in making comparisons because the Securities and Exchange Commission (“SEC”) requires all mutual funds to calculate expenses based on a 5% return. You can assess each Fund’s ongoing costs by comparing this hypothetical example with the hypothetical examples that appear in shareholder reports of other funds.
Note that expenses shown in the table are meant to highlight and help you compare ongoing costs only. The Funds do not charge sales loads or redemption fees.
The calculations assume no shares were bought or sold during the period. Your actual costs may have been higher or lower, depending on the amount of your investment and the timing of any purchases or redemptions.
More information about the Funds’ expenses, including annual expense ratios for the prior five fiscal years, can be found in this report. For additional information on operating expenses and other shareholder costs, please refer to the Funds’ prospectus.
THE JAMESTOWN FUNDS
ABOUT YOUR FUNDS’ EXPENSES (Unaudited) (Continued)
| | Beginning Account Value April 1, 2013 | Ending Account Value September 30, 2013 | Expenses Paid During Period* |
The Jamestown Balanced Fund |
| Based on Actual Fund Return | $1,000.00 | $1,062.10 | $6.20 |
| Based on Hypothetical 5% Return (before expenses) | $1,000.00 | $1,019.05 | $6.07 |
The Jamestown Equity Fund |
| Based on Actual Fund Return | $1,000.00 | $1,095.20 | $5.67 |
| Based on Hypothetical 5% Return (before expenses) | $1,000.00 | $1,019.65 | $5.47 |
The Jamestown Tax Exempt Virginia Fund |
| Based on Actual Fund Return | $1,000.00 | $984.90 | $3.43 |
| Based on Hypothetical 5% Return (before expenses) | $1,000.00 | $1,021.61 | $3.50 |
| * | Expenses are equal to the Funds’ annualized expense ratios for the period as stated below, multiplied by the average account value over the period, multiplied by 183/365 (to reflect the one-half year period). With respect to The Jamestown Balanced Fund and The Jamestown Equity Fund, the annualized expense ratios exclude any reimbursements received through a directed brokerage arrangement (Note 5). |
| The Jamestown Balanced Fund | 1.20% |
| The Jamestown Equity Fund | 1.08% |
| The Jamestown Tax Exempt Virginia Fund | 0.69% |
THE JAMESTOWN FUNDS
OTHER INFORMATION (Unaudited)
A description of the policies and procedures that the Funds use to vote proxies relating to portfolio securities is available without charge upon request by calling toll-free 1-866-738-1126, or on the SEC’s website at http://www.sec.gov. Information regarding how the Funds voted proxies relating to portfolio securities during the most recent 12-month period ended June 30 is also available without charge upon request by calling toll-free 1-866-738-1126, or on the SEC’s website at http://www.sec.gov.
The Trust files a complete listing of portfolio holdings of the Funds with the SEC as of the end of the first and third quarters of each fiscal year on Form N-Q. The filings are available upon request, by calling 1-866-738-1126. Furthermore, you may obtain a copy of these filings on the SEC’s website at http://www.sec.gov. The Trust’s Forms N-Q may also be reviewed and copied at the SEC’s Public Reference Room in Washington, DC, and information on the operation of the Public Reference Room may be obtained by calling 1-800-SEC-0330.
| | | | | | | | |
| | | | | | | | | |
| | | | | | | | | |
| | | | | THE JAMESTOWN FUNDS www.jamestownfunds.com Investment Adviser Lowe, Brockenbrough & Company, Inc. 1802 Bayberry Court Suite 400 Richmond, Virginia 23226 Administrator Ultimus Fund Solutions, LLC P.O. Box 46707 Cincinnati, Ohio 45246-0707 (Toll-Free) 1-866-738-1126 Independent Registered Public Accounting Firm Ernst & Young LLP 1900 Scripps Center 312 Walnut Street Cincinnati, Ohio 45202 Legal Counsel Sullivan & Worcester LLP One Post Office Square Boston, Massachusetts 02109 Board of Trustees John P. Ackerly, IV John T. Bruce Robert S. Harris J. Finley Lee, Jr. Richard L. Morrill Harris V. Morrissette | | | | |
| | | | | | | | | |
| | | | | | | | | |
| | | | | | | | |
Not required
| Item 3. | Audit Committee Financial Expert. |
Not required
| Item 4. | Principal Accountant Fees and Services. |
Not required
| Item 5. | Audit Committee of Listed Registrants. |
Not applicable
| Item 6. | Schedule of Investments. |
| (a) | Not applicable [schedule filed with Item 1] |
| Item 7. | Disclosure of Proxy Voting Policies and Procedures for Closed-End Management Investment Companies. |
Not applicable
| Item 8. | Portfolio Managers of Closed-End Management Investment Companies. |
Not applicable
| Item 9. | Purchases of Equity Securities by Closed-End Management Investment Company and Affiliated Purchasers. |
Not applicable
| Item 10. | Submission of Matters to a Vote of Security Holders. |
The registrant’s Nominating Committee shall review shareholder recommendations to fill vacancies on the registrant’s board of trustees if such recommendations are submitted in writing, addressed to the Committee at the registrant’s offices and meet any minimum qualifications adopted by the Committee. The Committee may adopt, by resolution, a policy regarding its procedures for considering candidates for the board of trustees, including any recommended by shareholders.
| Item 11. | Controls and Procedures. |
(a) Based on their evaluation of the registrant’s disclosure controls and procedures (as defined in Rule 30a-3(c) under the Investment Company Act of 1940) as of a date within 90 days of the filing date of this report, the registrant’s principal executive officers and principal financial officer have concluded that such disclosure controls and procedures are reasonably designed and are operating effectively to ensure that material information relating to the registrant, including its consolidated subsidiaries, is made known to them by others within those entities, particularly during the period in which this report is being prepared, and that the information required in filings on Form N-CSR is recorded, processed, summarized, and reported on a timely basis.
(b) There were no changes in the registrant’s internal control over financial reporting (as defined in Rule 30a-3(d) under the Investment Company Act of 1940) that occurred during the second fiscal quarter of the period covered by this report that have materially affected, or are reasonably likely to materially affect, the registrant’s internal control over financial reporting.
File the exhibits listed below as part of this Form. Letter or number the exhibits in the sequence indicated.
(a)(1) Any code of ethics, or amendment thereto, that is the subject of the disclosure required by Item 2, to the extent that the registrant intends to satisfy the Item 2 requirements through filing of an exhibit: Not required
(a)(2) A separate certification for each principal executive officer and principal financial officer of the registrant as required by Rule 30a-2(a) under the Act (17 CFR 270.30a-2(a)): Attached hereto
(a)(3) Any written solicitation to purchase securities under Rule 23c-1 under the Act (17 CFR 270.23c-1) sent or given during the period covered by the report by or on behalf of the registrant to 10 or more persons: Not applicable
(b) Certifications required by Rule 30a-2(b) under the Act (17 CFR 270.30a-2(b)): Attached hereto
| Exhibit 99.CERT | Certifications required by Rule 30a-2(a) under the Act |
| | |
| Exhibit 99.906CERT | Certifications required by Rule 30a-2(b) under the Act |
SIGNATURES
Pursuant to the requirements of the Securities Exchange Act of 1934 and the Investment Company Act of 1940, the registrant has duly caused this report to be signed on its behalf by the undersigned, thereunto duly authorized.
(Registrant) Williamsburg Investment Trust
| By (Signature and Title)* | /s/ Tina H. Bloom | |
| | | Tina H. Bloom, Secretary and Chief Compliance Officer |
| | | | |
| Date | November 27, 2013 | | |
| | | | |
| Pursuant to the requirements of the Securities Exchange Act of 1934 and the Investment Company Act of 1940, this report has been signed below by the following persons on behalf of the registrant and in the capacities and on the dates indicated. |
| | | | |
| By (Signature and Title)* | /s/ John T. Bruce | |
| | | John T. Bruce, President (FBP Equity & Dividend |
| | | Plus Fund and FBP Appreciation & Income |
| | | Opportunities Fund) | |
| | | | |
| Date | November 27, 2013 | | |
| | | | |
| By (Signature and Title)* | /s/ Thomas W. Leavell | |
| | | Thomas W. Leavell, President (The Government | |
| | | Street Equity Fund, The Government Street
Mid-Cap Fund and The Alabama Tax Free Bond Fund) |
| | | | |
| Date | November 27, 2013 | | |
| By (Signature and Title)* | /s/ Charles M. Caravati III | |
| | | Charles M. Caravati III, President (The Jamestown Balanced |
| | | Fund and The Jamestown Equity Fund) | |
| | | | |
| Date | November 27, 2013 | | |
| | | | |
| By (Signature and Title)* | /s/ Joseph A. Jennings III | |
| | | Joseph A. Jennings III, President | |
| | | (The Jamestown Tax Exempt Virginia Fund) | |
| | | | |
| Date | November 27, 2013 | | |
| | | | |
| By (Signature and Title)* | /s/ John P. Ackerly IV | |
| | | John P. Ackerly IV, President | |
| | | (The Davenport Core Fund, Davenport Value & Income |
| | | Fund and Davenport Equity Opportunities Fund) |
| | | | |
| Date | November 27, 2013 | | |
| | | | |
| By (Signature and Title)* | /s/ Mark J. Seger | |
| | | Mark J. Seger, Treasurer | |
| | | | |
| Date | November 27, 2013 | | |
* Print the name and title of each signing officer under his or her signature.