| OMB APPROVAL |
OMB Number: 3235-0570 Expires: August 31, 2011 Estimated average burden hours per response: 18.9 |
UNITED STATES
SECURITIES AND EXCHANGE COMMISSION
Washington, D.C. 20549
FORM N-CSR
CERTIFIED SHAREHOLDER REPORT OF REGISTERED
MANAGEMENT INVESTMENT COMPANIES
Investment Company Act file number 811-05685
| Williamsburg Investment Trust |
| (Exact name of registrant as specified in charter) |
| 225 Pictoria Drive, Suite 450 Cincinnati, Ohio | 45246 |
| (Address of principal executive offices) | (Zip code) |
W. Lee H. Dunham, Esq.
| Sullivan & Worcester LLP One Post Office Square Boston, Massachusetts 02109 |
| (Name and address of agent for service) |
Registrant's telephone number, including area code: (513) 587-3400
Date of fiscal year end: March 31, 2011
Date of reporting period: September 30, 2010
Form N-CSR is to be used by management investment companies to file reports with the Commission not later than 10 days after the transmission to stockholders of any report that is required to be transmitted to stockholders under Rule 30e-1 under the Investment Company Act of 1940 (17 CFR 270.30e-1). The Commission may use the information provided on Form N-CSR in its regulatory, disclosure review, inspection, and policymaking roles.
A registrant is required to disclose the information specified by Form N-CSR, and the Commission will make this information public. A registrant is not required to respond to the collection of information contained in Form N-CSR unless the Form displays a currently valid Office of Management and Budget ("OMB") control number. Please direct comments concerning the accuracy of the information collection burden estimate and any suggestions for reducing the burden to Secretary, Securities and Exchange Commission, 450 Fifth Street, NW, Washington, DC 20549-0609. The OMB has reviewed this collection of information under the clearance requirements of 44 U.S.C. § 3507.
| Item 1. | Reports to Stockholders. |
| SEMI-ANNUAL REPORT
September 30, 2010 (Unaudited) |
THE DAVENPORT CORE FUND LETTER TO SHAREHOLDERS | |
Dear Shareholders,
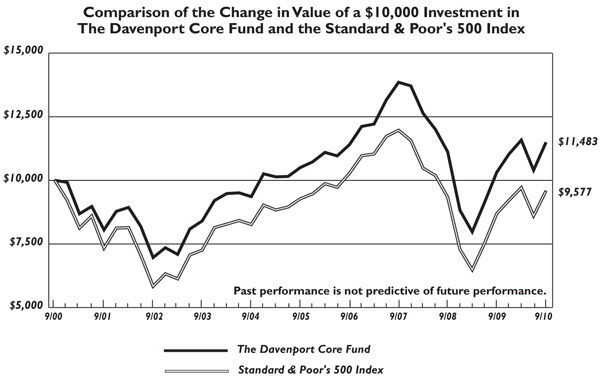
The following chart represents The Davenport Core Fund’s (the “Fund”) performance and the performance of the S&P 500 Index*, the Fund’s primary benchmark, for the periods ended September 30, 2010.
| | | | | | | | Since Inception** (1/15/98) | |
| DAVPX | 10.43% | 4.04% | 11.27% | -6.07% | 1.80% | 1.39% | 3.41% | 0.99% |
| S&P 500 | 11.29% | 3.89% | 10.16% | -7.16% | 0.64% | -0.43% | 3.24% | |
Past performance is no guarantee of future results. Investment return and principal value of an investment will fluctuate so that an investor’s shares, when redeemed, may be worth more or less than their original cost. Current performance may be lower or higher than the performance data quoted. Performance data, current to the most recent month end, may be obtained by calling 1-800-281-3217.
| * | The S&P 500 Index is comprised of 500 U.S. stocks and is an indicator of the performance of the overall U.S. stock market. An investor cannot invest in an index and its returns are not indicative of the performance of any specific investment. |
| *** | For the six months ended September 30, 2010. |
Market Commentary
Back and forth we go. After a nasty second quarter had many investors conjuring up memories of 2008, stocks managed to post very solid gains in the third quarter 2010. The S&P 500 Index and Russell 2000 Index both advanced 11.3% during the period. Furthermore, both indices were up on a year-to-date basis at quarter end. Throughout the quarter, we continued to witness significant volatility. Stocks had a strong July alongside encouraging corporate earnings reports; however, renewed signs of an economic slowdown pressured them in August. Then, stocks snapped back very strongly in September in tandem with a few positive data points. This month by month breakdown means little to long-term equity investors; however, it reminds us that any economic recovery will likely be very uneven and we should probably be prepared for erratic market activity.
There is still quite a bit of negativity in the equity market. This may be best evidenced by the flows into bond funds, which are setting new records and rival flows into equity funds in the late 90’s. In fact, a 10-year U.S. Treasury bond currently now yields less than 3%. After taxes and assuming a return to some normal level of inflation, this could equate to a real return of nearly zero. Unless we enter a prolonged period of deflation, which our government seems determined to prevent, this should be a red flag for bond investors. Meanwhile, earnings yields on equities look very attractive and we continue
to see a trend toward returning cash to shareholders. The apparent “bond bubble” may continue to expand, but we think equity valuations look compelling versus bonds. We also remind investors that most companies are in much better financial condition than they were a couple years ago. According to Dow Jones, non-financial companies had $1.8 trillion of cash as of July 31st (25% more than when the recession began).
We recently stumbled upon an old Davenport research report on Coca Cola (KO). The report is dated January 29, 1999 and our analyst rated the stock “Underperform,” which to most of us means sell. At the time, KO was trading at $65.25. The company was earning $1.40, which implied a P/E multiple of 46.6 times, and paying a dividend of $0.60, which equated to a yield of 0.9%. Moreover, earnings per share were not expected to grow. Fast forward to now. Coke is currently trading for roughly $59/share. The company is expected to earn $3.75 next year, which is roughly 2.7 times what it earned back then and implies a P/E multiple of 15.7 times. The dividend has nearly tripled to $1.76 per share, implying a yield of 3.0%. Also, earnings are expected to grow 8% next year. Bottom line: despite having nearly tripled earnings, having nea rly tripled the dividend and having resumed growth, KO is trading nearly 10% lower than where it was 11 years ago. This isn’t meant to be a plug for Coca Cola, rather, it is an example that epitomizes the current market environment.
We have swung from one end of the spectrum to the other, having gone from a love affair with stocks (especially large cap stocks) to widespread skepticism. This is understandable in light of the events we experienced and the headwinds we continue to face. That noted, the odds seem much more favorable for us as investors than they were back on the date of the Coke report. Still, many retail and institutional investors are clearly under-invested in stocks. Many interviews with prominent hedge fund managers include phrases such as “market neutral,” “net short,” “fully hedged” or “on the sidelines.” Being “long” is obviously not in vogue. In fact, it is downright contrarian at the moment. Doubt certainly seems warranted when considering the wounds inflicted by 2008 and 2009, prosp ects for very low growth, and political/regulatory uncertainty. That said, such skepticism could provide the base for solid returns if the economy doesn’t collapse, and we don’t believe it will.
Back and forth activity may persist, but we are hopeful the trend is up. As confidence re-builds, we believe retail investors, hedge funds, and “asset allocators” will likely begin to commit more capital to equities. Perhaps the next step will be to get some clarity on looming regulatory and tax changes.
The Fund
Despite significant volatility, stocks posted modest declines over the past two quarters. The S&P 500 Index declined 1.4% for the six months ended September 30, 2010; however, the Index has gained 3.9% on a year-to-date basis at quarter end. The Fund declined 0.9% and increased 4.0% for the respective periods. We are pleased to have modestly outperformed over each of these turbulent periods and remain confident in the portfolio’s positioning. While volatility is likely to persist, we hope to continue to take advantage of opportunities presented by weakness in some of the quality names we own and monitor.
Telecommunication Services was the best performing sector over the six months ended September 30, 2010. Our holdings in Millicom International (MICC) and American Tower (AMT) each made strong advances, benefiting performance on both a relative and absolute basis. We think these companies should continue to prosper given the ongoing global wireless/mobile internet boom.
The Health Care sector was our greatest source of relative outperformance. For the most part, this is due to strong gains in Novo Nordisk (NVO), a leader in the global diabetes care industry. While we elected to chip the position after quarter end, we remain attracted to this company’s dominant positioning in what is likely to be a growing problem for the global population.
Consumer Discretionary was a top performing sector in the portfolio. While many of our stocks enjoyed a lift in September from a more constructive outlook for the consumer, CarMax (KMX) and AutoZone (AZO) were clear standouts. Additionally, the Fund’s position in McDonald’s (MCD) posted nice gains as the company reported solid results and raised its dividend.
Despite absolute weakness, our Financials stocks were a nice source of relative strength. This was due in part to our underweight position in banks, which failed as a group to keep pace with the market’s advances in September. In terms of our holdings, we enjoyed solid performance out of Brookfield Asset Management and T. Rowe Price. Both of these companies are high quality asset managers that should exhibit meaningful operating leverage as asset prices recover. On the flip side, we were a bit disappointed with bank holdings JPMorgan (JPM) and Wells Fargo (WFC). While regulatory and economic uncertainty may persist, we ultimately believe that banks will likely participate in any recovery. When this occurs, JPM and WFC appear to be two of the best positioned franchises with the ability to generate significant earnings power.
Our Information Technology holdings were a bit disappointing. Despite solid performance from holdings in QUALCOMM (QCOM) and Fiserv (FISV), the sector was weighed down by weakness in some the larger, bellwether names that we own. More specifically, Microsoft (MSFT), Intel (INTC) and Cisco (CSCO) struggled as investors seemed to call their growth prospects into question. While we acknowledge the low likelihood of these companies generating the earnings growth they were known for a decade ago, we continue to think the stocks are a pretty good deal in light of their strong balance sheets and cheap valuations.
Though we are encouraged by the Fund’s performance year-to-date, we remain as focused as ever on identifying new ideas. We continue to think that, as an asset class, quality equities offer a solid risk reward proposition at these prices. In closing, we thank you for your support and look forward to reporting back at year end.
New Positions
Anheuser-Busch InBev SA# (BUD) became the world’s largest brewer and one of the world’s leading consumer products companies as a result of the 2008 merger between Anheuser-Busch and InBev. BUD has a high quality, stable business model that should continue to throw off impressive amounts of free cash flow as the company utilizes its
pricing power and leverages its unrivaled global scale. In the near term, value should accrue to shareholders via synergies from the Anheuser-Busch deal, an intense focus on operating costs, and aggressive deleveraging of the balance sheet. Once optimal leverage ratios are reached, the company will be in a position to use its significant cash flows to buy back stock and/or pay a much more meaningful dividend than the current $0.42 annual distribution (yields ~0.8%).
Check Point Software Technologies Ltd.# (CHKP) is an Israeli-based, leading provider of security software solutions to corporations and governments. As recent acquisitions in the space have shown, security has become and will continue to be an important component of any company’s IT strategy. Within the security world, we believe CHKP’s status as a leading network security provider positions them well to benefit from recent trends such as the increasing importance of mobile/wireless capabilities in addition to higher utilization of remote data storage or “cloud computing.”
Ford Motor Company (F) is one of the largest vehicle producers in the world. Since the company’s brush with bankruptcy during the credit crisis of 2008-2009, Ford has emerged a much stronger company with a healthy balance sheet, a focused management team, an impressive slate of high quality vehicles and significant earnings power. While the stock has made heroic advances alongside the company’s debt reduction efforts, market share gains, and new product momentum, we believe we are in the early innings of what could be a multi-year success story.
Illinois Tool Works, Inc. (ITW) is a large cap diversified industrial company whose differentiated management approach has led to impressive earnings growth, free cash flow and returns on capital over the years. While aggressive on the acquisition front, the company has been a skillful acquirer, growing the size of the company in a way that has created significant value for shareholders. ITW pays a $1.36 dividend that yields 2.9%.
Increased Positions
Lowe’s Companies, Inc. (LOW) is a leading North American home improvement retailer. While we do not expect a severe snap back in construction or home improvement spending, we believe the actions the company has taken on costs should lead to substantial operating leverage in the event of a modest recovery. Despite weak stock performance over the last several years, we believe LOW has done a commendable job of weathering a dismal environment. As a result, the company’s solid balance sheet, efficient cost structure and large runway for new store opportunities should allow for significant earnings growth as the economy recovers.
Sincerely,
John P. Ackerly, IV
President, The Davenport Core Fund
THE DAVENPORT CORE FUND PERFORMANCE INFORMATION (Unaudited) |
| | Average Annual Total Returns(a) (for periods ended September 30, 2010) |
| | 1 Year | 5 Years | 10 Years |
| The Davenport Core Fund | 11.27% | 1.80% | 1.39% |
| Standard & Poor’s 500 Index | 10.16% | 0.64% | -0.43% |
(a) The total returns shown do not reflect the deduction of taxes that a shareholder would pay on Fund distributions or the redemption of Fund shares. |
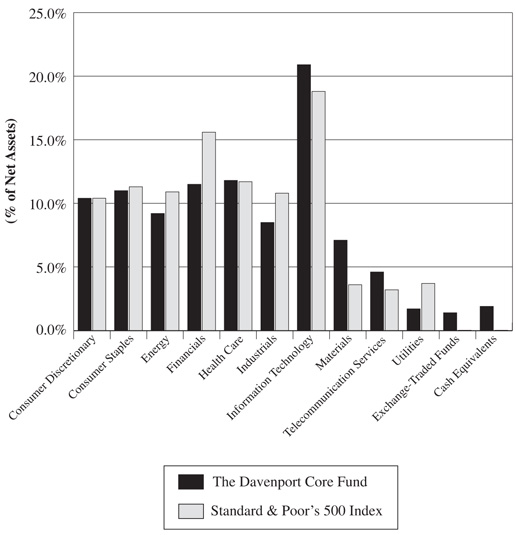
THE DAVENPORT CORE FUND PORTFOLIO INFORMATION September 30, 2010 (Unaudited) |
Sector Allocation vs. the Standard & Poor's 500 Index
Top Ten Equity Holdings
| Security Description | % of Net Assets |
| Albemarle Corporation | 2.6% |
| American Tower Corporation | 2.4% |
| QUALCOMM, Inc. | 2.4% |
| Markel Corporation | 2.3% |
| Millicom International Cellular S.A. | 2.2% |
| PepsiCo, Inc. | 2.2% |
| United Technologies Corporation | 2.1% |
| Wal-Mart Stores, Inc. | 2.1% |
| Chevron Corporation | 2.1% |
| Fiserv, Inc. | 2.0% |
THE DAVENPORT CORE FUND SCHEDULE OF INVESTMENTS September 30, 2010 (Unaudited) | |
| | | | | |
| | | Consumer Discretionary — 10.4% | | | |
| | 10,977 | | AutoZone, Inc. (a) | | $ | 2,512,745 | |
| | 87,100 | | CarMax, Inc. (a) | | | 2,426,606 | |
| | 143,900 | | Ford Motor Company (a) | | | 1,761,336 | |
| | 118,064 | | Lowe’s Companies, Inc. | | | 2,631,647 | |
| | 26,789 | | McDonald's Corporation | | | 1,996,048 | |
| | 66,412 | | Walt Disney Company (The) | | | 2,198,901 | |
| | | | | | | 13,527,283 | |
| | | | Consumer Staples — 11.0% | | | | |
| | 33,675 | | Anheuser-Busch InBev SA - ADR | | | 1,978,406 | |
| | 27,722 | | Colgate-Palmolive Company | | | 2,130,713 | |
| | 42,560 | | PepsiCo, Inc. | | | 2,827,686 | |
| | 35,435 | | Procter & Gamble Company (The) | | | 2,125,037 | |
| | 80,416 | | SABMiller plc - ADR | | | 2,565,270 | |
| | 51,239 | | Wal-Mart Stores, Inc. | | | 2,742,311 | |
| | | | | | | 14,369,423 | |
| | | | Energy — 9.2% | | | | |
| | 33,750 | | Chevron Corporation | | | 2,735,437 | |
| | 16,482 | | EOG Resources, Inc. | | | 1,532,332 | |
| | 41,308 | | Exxon Mobil Corporation | | | 2,552,421 | |
| | 27,190 | | Occidental Petroleum Corporation | | | 2,128,977 | |
| | 31,043 | | Schlumberger Ltd. | | | 1,912,559 | |
| | 18,463 | | Transocean Ltd. (a) | | | 1,186,986 | |
| | | | | | | 12,048,712 | |
| | | | Financials — 11.5% | | | | |
| | 30,470 | | Berkshire Hathaway, Inc. - Class B (a) | | | 2,519,260 | |
| | 86,273 | | Brookfield Asset Management, Inc. - Class A | | | 2,447,565 | |
| | 4,499 | | CME Group, Inc. | | | 1,171,764 | |
| | 50,372 | | JPMorgan Chase & Company | | | 1,917,662 | |
| | 8,793 | | Markel Corporation (a) | | | 3,029,980 | |
| | 41,979 | | T. Rowe Price Group, Inc. | | | 2,101,679 | |
| | 71,983 | | Wells Fargo & Company | | | 1,808,933 | |
| | | | | | | 14,996,843 | |
| | | | Health Care — 11.8% | | | | |
| | 32,466 | | Abbott Laboratories | | | 1,696,024 | |
| | 31,083 | | Becton, Dickinson and Company | | | 2,303,250 | |
| | 40,932 | | Johnson & Johnson | | | 2,536,147 | |
| | 28,360 | | Laboratory Corporation of America Holdings (a) | | | 2,224,275 | |
| | 61,144 | | Merck & Company, Inc. | | | 2,250,711 | |
| | 26,994 | | Novo Nordisk A/S - ADR | | | 2,657,289 | |
| | 32,924 | | Teva Pharmaceutical Industries Ltd. | | | 1,736,741 | |
| | | | | | | 15,404,437 | |
| | | | Industrials — 8.5% | | | | |
| | 26,879 | | Caterpillar, Inc. | | | 2,114,840 | |
| | 65,346 | | Danaher Corporation | | | 2,653,701 | |
| | 25,153 | | General Dynamics Corporation | | | 1,579,860 | |
| | 41,950 | | Illinois Tool Works, Inc. | | | 1,972,489 | |
| | 39,059 | | United Technologies Corporation | | | 2,782,173 | |
| | | | | | | 11,103,063 | |
THE DAVENPORT CORE FUND SCHEDULE OF INVESTMENTS (Continued) | |
| | COMMON STOCKS — 96.7% (Continued) | | | |
| | | Information Technology — 20.9% | | | |
| | 51,108 | | Accenture plc - Class A | | $ | 2,171,579 | |
| | 9,292 | | Apple, Inc. (a) | | | 2,636,605 | |
| | 45,529 | | Automatic Data Processing, Inc. | | | 1,913,584 | |
| | 50,575 | | Check Point Software Technologies Ltd. (a) | | | 1,867,735 | |
| | 98,657 | | Cisco Systems, Inc. (a) | | | 2,160,588 | |
| | 49,611 | | Fiserv, Inc. (a) | | | 2,670,064 | |
| | 3,839 | | Google, Inc. - Class A (a) | | | 2,018,508 | |
| | 101,643 | | Intel Corporation | | | 1,954,595 | |
| | 19,713 | | International Business Machines Corporation | | | 2,644,302 | |
| | 95,974 | | Microsoft Corporation | | | 2,350,403 | |
| | 68,097 | | QUALCOMM, Inc. | | | 3,072,537 | |
| | 24,600 | | Visa, Inc. - Class A | | | 1,826,796 | |
| | | | | | | 27,287,296 | |
| | | | Materials — 7.1% | | | | |
| | 73,054 | | Albemarle Corporation | | | 3,419,658 | |
| | 38,875 | | Barrick Gold Corporation | | | 1,799,524 | |
| | 38,650 | | International Flavors & Fragrances, Inc. | | | 1,875,298 | |
| | 24,098 | | Praxair, Inc. | | | 2,175,085 | |
| | | | | | | 9,269,565 | |
| | | | Telecommunication Services — 4.6% | | | | |
| | 61,100 | | American Tower Corporation (a) | | | 3,131,986 | |
| | 29,636 | | Millicom International Cellular S.A. | | | 2,843,574 | |
| | | | | | | 5,975,560 | |
| | | | Utilities — 1.7% | | | | |
| | 40,883 | | NextEra Energy, Inc. | | | 2,223,626 | |
| | | | | | | | |
| | | | Total Common Stocks (Cost $108,898,840) | | $ | 126,205,808 | |
| | |
| | EXCHANGE-TRADED FUNDS — 1.4% | | | |
| | 31,353 | | SPDR® S&P® Biotech ETF (Cost $2,068,232) | | $ | 1,861,428 | |
| |
| | MONEY MARKET FUNDS — 1.9% | | | |
| | 2,452,146 | | First American Treasury Obligations Fund - Class Y, 0.00% (b) (Cost $2,452,146) | | $ | 2,452,146 | |
| | | | | | | | |
| | | | Total Investments at Value — 100.0% (Cost $113,419,218) | | $ | 130,519,382 | |
| | | | | | | | |
| | | | Other Assets in Excess of Liabilities — 0.0% | | | 31,503 | |
| | | | | | | | |
| | | | Net Assets — 100.0% | | $ | 130,550,885 | |
| (a) | Non-income producing security. |
| (b) | Variable rate security. The rate shown is the 7-day effective yield as of September 30, 2010. |
| ADR - American Depositary Receipt |
| See accompanying notes to financial statements. |
THE DAVENPORT CORE FUND STATEMENT OF ASSETS AND LIABILITIES September 30, 2010 (Unaudited) | |
| ASSETS | | | |
| Investments in securities: | | | |
At acquisition cost | | $ | 113,419,218 | |
At market value (Note 1) | | $ | 130,519,382 | |
Dividends receivable | | | 91,799 | |
Receivable for capital shares sold | | | 56,217 | |
Other assets | | | 20,717 | |
TOTAL ASSETS | | | 130,688,115 | |
| | | | | |
| LIABILITIES | | | | |
Payable for capital shares redeemed | | | 31,197 | |
Accrued investment advisory fees (Note 3) | | | 89,683 | |
Accrued administration fees (Note 3) | | | 14,900 | |
Accrued compliance fees (Note 3) | | | 1,450 | |
TOTAL LIABILITIES | | | 137,230 | |
| | | | | |
NET ASSETS | | $ | 130,550,885 | |
| | | | | |
| Net assets consist of: | | | | |
Paid-in capital | | $ | 126,513,772 | |
Accumulated undistributed net investment income | | | 21,767 | |
| Accumulated net realized losses from security transactions | | | (13,084,818 | ) |
Net unrealized appreciation on investments | | | 17,100,164 | |
Net assets | | $ | 130,550,885 | |
| | | | | |
Shares of beneficial interest outstanding
(unlimited number of shares authorized, no par value) | | | 10,974,315 | |
| | | | | |
| Net asset value, offering price and redemption price per share (Note 1) | | $ | 11.90 | |
| See accompanying notes to financial statements. |
THE DAVENPORT CORE FUND STATEMENT OF OPERATIONS Six Months Ended September 30, 2010 (Unaudited) | |
| INVESTMENT INCOME | | | |
Dividends (Net of foreign tax of $34,092) | | $ | 1,123,749 | |
Interest | | | 29 | |
TOTAL INVESTMENT INCOME | | | 1,123,778 | |
| | | | | |
| EXPENSES | | | | |
Investment advisory fees (Note 3) | | | 477,316 | |
Administration fees (Note 3) | | | 91,074 | |
Custodian and bank service fees | | | 10,008 | |
Professional fees | | | 9,359 | |
Compliance service fees (Note 3) | | | 8,887 | |
Registration fees | | | 7,924 | |
Printing of shareholder reports | | | 7,594 | |
Trustees’ fees and expenses | | | 6,842 | |
Insurance expense | | | 6,340 | |
Postage and supplies | | | 3,871 | |
Other expenses | | | 988 | |
TOTAL EXPENSES | | | 630,203 | |
| | | | | |
NET INVESTMENT INCOME | | | 493,575 | |
| | | | | |
| REALIZED AND UNREALIZED GAINS (LOSSES) ON INVESTMENTS | | | | |
Net realized gains from security transactions | | | 424,482 | |
| Net change in unrealized appreciation/depreciation on investments | | | (2,194,038 | ) |
| | | | | |
| NET REALIZED AND UNREALIZED LOSSES ON INVESTMENTS | | | (1,769,556 | ) |
| | | | | |
| NET DECREASE IN NET ASSETS FROM OPERATIONS | | $ | (1,275,981 | ) |
| See accompanying notes to financial statements. |
THE DAVENPORT CORE FUND STATEMENTS OF CHANGES IN NET ASSETS | |
| | Six Months Ended September 30, 2010 (Unaudited) | | | | |
| FROM OPERATIONS | | | | | | |
Net investment income | | $ | 493,575 | | | $ | 872,940 | |
| Net realized gains (losses) from security transactions | | | 424,482 | | | | (1,188,524 | ) |
Net change in unrealized appreciation/
depreciation on investments | | | (2,194,038 | ) | | | 42,183,572 | |
| Net increase (decrease) in net assets from operations | | | (1,275,981 | ) | | | 41,867,988 | |
| | | | | | | | | |
| DISTRIBUTIONS TO SHAREHOLDERS | | | | | | | | |
From net investment income | | | (492,718 | ) | | | (865,302 | ) |
| | | | | | | | | |
| FROM CAPITAL SHARE TRANSACTIONS | | | | | | | | |
Proceeds from shares sold | | | 7,838,014 | | | | 11,590,012 | |
Net asset value of shares issued in
reinvestment of distributions to shareholders | | | 468,541 | | | | 821,362 | |
Payments for shares redeemed | | | (8,648,558 | ) | | | (13,110,640 | ) |
| Net decrease in net assets from capital share transactions | | | (342,003 | ) | | | (699,266 | ) |
| | | | | | | | | |
| TOTAL INCREASE (DECREASE) IN NET ASSETS | | | (2,110,702 | ) | | | 40,303,420 | |
| | | | | | | | | |
| NET ASSETS | | | | | | | | |
Beginning of period | | | 132,661,587 | | | | 92,358,167 | |
End of period | | $ | 130,550,885 | | | $ | 132,661,587 | |
| | | | | | | | | |
ACCUMULATED UNDISTRIBUTED
NET INVESTMENT INCOME | | $ | 21,767 | | | $ | 20,910 | |
| | | | | | | | | |
| CAPITAL SHARE ACTIVITY | | | | | | | | |
Shares sold | | | 679,594 | | | | 1,095,709 | |
Shares reinvested | | | 40,497 | | | | 76,595 | |
Shares redeemed | | | (751,588 | ) | | | (1,220,427 | ) |
Net decrease in shares outstanding | | | (31,497 | ) | | | (48,123 | ) |
Shares outstanding at beginning of period | | | 11,005,812 | | | | 11,053,935 | |
Shares outstanding at end of period | | | 10,974,315 | | | | 11,005,812 | |
| See accompanying notes to financial statements. |
THE DAVENPORT CORE FUND FINANCIAL HIGHLIGHTS | |
Selected Per Share Data and Ratios for a Share Outstanding Throughout Each Period | |
| | | Six Months Ended September 30, 2010 (Unaudited) | | | | |
| | | 2010 | | | | 2009 | | | | 2008 | | | | 2007 | | | | 2006 | |
| Net asset value at beginning of period | | $ | 12.05 | | | $ | 8.36 | | | $ | 13.82 | | | $ | 14.75 | | | $ | 13.99 | | | $ | 13.08 | |
| | | | | | | | | | | | | | | | | | | | | | | | | |
Income (loss) from
investment operations: | | | | | | | | | | | | | | | | | | | | | | | | |
Net investment income | | | 0.05 | | | | 0.08 | | | | 0.11 | | | | 0.10 | | | | 0.10 | | | | 0.07 | |
| Net realized and unrealized gains (losses) on investments | | | (0.15 | ) | | | 3.69 | | | | (5.17 | ) | | | 0.53 | | | | 1.28 | | | | 1.17 | |
| Total from investment operations | | | (0.10 | ) | | | 3.77 | | | | (5.06 | ) | | | 0.63 | | | | 1.38 | | | | 1.24 | |
| | | | | | | | | | | | | | | | | | | | | | | | | |
| Less distributions: | | | | | | | | | | | | | | | | | | | | | | | | |
Dividends from net
investment income | | | (0.05 | ) | | | (0.08 | ) | | | (0.11 | ) | | | (0.10 | ) | | | (0.10 | ) | | | (0.07 | ) |
Distributions from net
realized gains | | | — | | | | — | | | | (0.29 | ) | | | (1.46 | ) | | | (0.52 | ) | | | (0.26 | ) |
Total distributions | | | (0.05 | ) | | | (0.08 | ) | | | (0.40 | ) | | | (1.56 | ) | | | (0.62 | ) | | | (0.33 | ) |
| | | | | | | | | | | | | | | | | | | | | | | | | |
| Net asset value at end of period | | $ | 11.90 | | | $ | 12.05 | | | $ | 8.36 | | | $ | 13.82 | | | $ | 14.75 | | | $ | 13.99 | |
| | | | | | | | | | | | | | | | | | | | | | | | | |
Total return (a) | | | (0.86)% | (b) | | | 45.20% | | | | (36.85)% | | | | 3.44% | | | | 10.02% | | | | 9.48% | |
| | | | | | | | | | | | | | | | | | | | | | | | | |
| Net assets at end of period (000’s) | | $ | 130,551 | | | $ | 132,662 | | | $ | 92,358 | | | $ | 155,799 | | | $ | 151,655 | | | $ | 148,923 | |
| | | | | | | | | | | | | | | | | | | | | | | | | |
Ratio of expenses
to average net assets | | | 0.99% | (c) | | | 1.00% | | | | 1.00% | | | | 0.96% | | | | 0.98% | | | | 0.98% | |
| | | | | | | | | | | | | | | | | | | | | | | | | |
Ratio of net investment income
to average net assets | | | 0.78% | (c) | | | 0.75% | | | | 0.98% | | | | 0.60% | | | | 0.67% | | | | 0.50% | |
| | | | | | | | | | | | | | | | | | | | | | | | | |
Portfolio turnover rate | | | 17% | (b) | | | 25% | | | | 39% | | | | 37% | | | | 26% | | | | 39% | |
| (a) | Total return is a measure of the change in value of an investment in the Fund over the periods covered, which assumes any dividends or capital gains distributions are reinvested in shares of the Fund. Returns shown do not reflect the deduction of taxes a shareholder would pay on Fund distributions or the redemption of Fund shares. |
| See accompanying notes to financial statements. |
THE DAVENPORT CORE FUND NOTES TO FINANCIAL STATEMENTS September 30, 2010 (Unaudited) |
1. Organization and Significant Accounting Policies
The Davenport Core Fund (the “Fund”) is a no-load, diversified series of the Williamsburg Investment Trust (the “Trust”), an open-end management investment company registered under the Investment Company Act of 1940. The Trust was organized as a Massachusetts business trust on July 18, 1988. Other series of the Trust are not incorporated in this report. The Fund began operations on January 15, 1998.
The Fund’s investment objective is long term growth of capital through investment in a diversified portfolio of common stocks. Current income is incidental to this objective and may not be significant.
The following is a summary of the Fund’s significant accounting policies:
Securities valuation — The Fund’s portfolio securities are valued as of the close of business of the regular session of the New York Stock Exchange (normally 4:00 p.m., Eastern time). Securities traded on a national stock exchange are valued based upon the closing price on the principal exchange where the security is traded. Securities which are quoted by NASDAQ are valued at the NASDAQ Official Closing Price. Securities which are traded over-the-counter are valued at the last sales price, if available, otherwise, at the last quoted bid price. Fixed income securities will ordinarily be traded in the over-the-counter market and common stocks will ordinarily be traded on a national securities exchange, but may also be traded in the over-the-counter market. Short-term instruments (those with remaining maturities of 60 days or less) may be valued at amortized cost, which approximates market value.
When market quotations are not readily available, securities may be valued on the basis of prices provided by an independent pricing service. The prices provided by the pricing service are determined with consideration given to institutional bid and last sale prices and take into account securities prices, yields, maturities, call features, ratings, institutional trading in similar groups of securities and developments related to specific securities. If a pricing service cannot provide a valuation, securities will be valued in good faith at fair value using methods consistent with those determined by the Board of Trustees and will be classified as Level 2 or 3 within the fair value hierarchy, depending on the inputs used. Such methods of fair valuation may include, but are not limited to: multiple of earnings, multiple of book value, d iscount from market of a similar freely traded security, purchase price of the security, subsequent private transactions in the security or related securities, or a combination of these and other factors.
Accounting principles generally accepted in the United States (“GAAP”) establish a single authoritative definition of fair value, set out a framework for measuring fair value and require additional disclosures about fair value measurements.
Various inputs are used in determining the value of the Fund’s investments. These inputs are summarized in the three broad levels listed below:
• Level 1 – quoted prices in active markets for identical securities
• Level 2 – other significant observable inputs
• Level 3 – significant unobservable inputs
THE DAVENPORT CORE FUND NOTES TO FINANCIAL STATEMENTS (Continued) |
The inputs or methodology used for valuing securities are not necessarily an indication of the risks associated with investing in those securities. The inputs used to measure fair value may fall into different levels of the fair value hierarchy. In such cases, for disclosure purposes, the level in the fair value hierarchy within which the fair value measurement falls in its entirety is determined based on the lowest level input that is significant to the fair value measurement.
The following is a summary of the inputs used to value the Fund’s investments as of September 30, 2010 by security type:
| | | | | | | | | | | | |
Common Stocks | | $ | 126,205,808 | | | $ | — | | | $ | — | | | $ | 126,205,808 | |
Exchange-Traded Funds | | | 1,861,428 | | | | — | | | | — | | | | 1,861,428 | |
Money Market Funds | | | 2,452,146 | | | | — | | | | — | | | | 2,452,146 | |
Total | | $ | 130,519,382 | | | $ | — | | | $ | — | | | $ | 130,519,382 | |
Refer to the Fund’s Schedule of Investments for a listing of the securities valued using Level 1 inputs by sector type. During the six months ended September 30, 2010, the Fund did not have any significant transfers in and out of Level 1 or Level 2. There were no Level 3 securities or derivative instruments held by the Fund during the six months ended or as of September 30, 2010.
Repurchase agreements — The Fund may enter into repurchase agreements. The repurchase agreement, which is collateralized by U.S. Government obligations, is valued at cost which, together with accrued interest, approximates market. At the time the Fund enters into the repurchase agreement, the seller agrees that the value of the underlying securities, including accrued interest, will at all times be equal to or exceed the face amount of the repurchase agreement. In addition, the Fund actively monitors and seeks additional collateral, as needed. If the seller defaults, the fair value of the collateral may decline and realization of the collateral by the Fund may be delayed or limited.
Share valuation — The net asset value per share of the Fund is calculated daily by dividing the total value of the Fund’s assets, less liabilities, by the number of shares outstanding. The offering price and redemption price per share of the Fund is equal to the net asset value per share.
Investment income — Interest income is accrued as earned. Dividend income is recorded on the ex-dividend date. Discounts and premiums on fixed-income securities purchased are amortized using the interest method.
Security transactions — Security transactions are accounted for on trade date. Gains and losses on securities sold are determined on a specific identification basis.
Common expenses — Common expenses of the Trust are allocated among the funds within the Trust based on relative net assets of each fund or the nature of the services performed and the relative applicability to each fund.
THE DAVENPORT CORE FUND NOTES TO FINANCIAL STATEMENTS (Continued) |
Distributions to shareholders — Dividends arising from net investment income are declared and paid quarterly to shareholders of the Fund. Net realized short-term capital gains, if any, may be distributed throughout the year and net realized long-term capital gains, if any, are distributed at least once each year. The amount of distributions from net investment income and net realized gains are determined in accordance with federal income tax regulations which may differ from GAAP. Dividends and distributions are recorded on the ex-dividend date. The tax character of distributions paid during the periods ended September 30, 2010 and March 31, 2010 was ordinary income.
Estimates — The preparation of financial statements in conformity with GAAP requires management to make estimates and assumptions that affect the reported amounts of assets and liabilities and disclosure of contingent assets and liabilities at the date of the financial statements and the reported amounts of income and expenses during the reporting period. Actual results could differ from those estimates.
Federal income tax — It is the Fund’s policy to comply with the special provisions of Subchapter M of the Internal Revenue Code applicable to regulated investment companies. As provided therein, in any fiscal year in which the Fund so qualifies and distributes at least 90% of its taxable net income, the Fund (but not the shareholders) will be relieved of federal income tax on the income distributed. Accordingly, no provision for income taxes has been made.
In order to avoid imposition of the excise tax applicable to regulated investment companies, it is also the Fund’s intention to declare as dividends in each calendar year at least 98% of its net investment income (earned during the calendar year) and 98% of its net realized capital gains (earned during the twelve months ended October 31) plus undistributed amounts from prior years.
The following information is computed on a tax basis for each item as of September 30, 2010:
Cost of portfolio investments | | $ | 113,723,538 | |
Gross unrealized appreciation | | $ | 21,750,231 | |
Gross unrealized depreciation | | | (4,954,387 | ) |
Net unrealized appreciation | | | 16,795,844 | |
Undistributed ordinary income | | | 21,767 | |
Capital loss carryforwards | | | (13,204,982 | ) |
Other gains | | | 424,484 | |
Accumulated earnings | | $ | 4,037,113 | |
The difference between the federal income tax cost and the financial statement cost is due to certain timing differences in the recognition of capital gains and losses under income tax regulations and GAAP. These timing differences are temporary in nature and are due to the tax deferral of losses on wash sales.
As of March 31, 2010, the Fund had capital loss carryforwards of $13,204,982, of which $2,581,964 expires March 31, 2017 and $10,623,018 expires March 31, 2018. These capital loss carryforwards may be utilized in the current and future years to offset net realized capital gains, if any, prior to distributing such gains to shareholders.
THE DAVENPORT CORE FUND NOTES TO FINANCIAL STATEMENTS (Continued) |
The Fund recognizes the tax benefits or expenses of uncertain tax positions only when the position is “more likely than not” to be sustained assuming examination by tax authorities. Management has reviewed the Fund’s tax positions taken on Federal income tax returns for all open tax years (tax years ended March 31, 2007 through March 31, 2010) and concluded that no provision for unrecognized tax benefits or expenses is required in these financial statements.
2. Investment Transactions
During the six months ended September 30, 2010, the cost of purchases and proceeds from sales and maturities of investment securities, other than short-term investments and U.S. government securities, totaled $21,245,917 and $22,811,390, respectively.
3. Transactions with Affiliates
INVESTMENT ADVISORY AGREEMENT
The Fund’s investments are managed by Davenport & Company LLC (the “Adviser”) under the terms of an Investment Advisory Agreement. Under the Investment Advisory Agreement, the Fund pays the Adviser a fee, which is computed and accrued daily and paid monthly, at an annual rate of .75% on its average daily net assets. Certain officers of the Trust are also officers of the Adviser.
MUTUAL FUND SERVICES AGREEMENT
Under the terms of a Mutual Fund Services Agreement between the Trust and Ultimus Fund Solutions, LLC (“Ultimus”), Ultimus provides administrative, pricing, accounting, dividend disbursing, shareholder servicing and transfer agent services for the Fund. For these services, Ultimus receives a monthly fee from the Fund at an annual rate of .15% on its average daily net assets up to $25 million, .125% on the next $25 million of such assets and .10% on such assets in excess of $50 million, subject to a minimum monthly fee of $4,000, plus a shareholder recordkeeping fee at the annual rate of $10 per shareholder account in excess of 1,000 accounts. In addition, the Fund pays out-of-pocket expenses including, but not limited to, postage, supplies and costs of pricing the Fund’s portfolio securities.
Certain officers of the Trust are also officers of Ultimus, or of Ultimus Fund Distributors, LLC (the “Distributor”), the principal underwriter of the Fund’s shares and an affiliate of Ultimus. The Distributor receives no compensation from the Fund for acting as principal underwriter.
COMPLIANCE CONSULTING AGREEMENT
Under the terms of a Compliance Consulting Agreement between the Trust and Ultimus, Ultimus provides an individual to serve as the Trust’s Chief Compliance Officer and to administer the Trust’s compliance policies and procedures. For these services, the Fund pays Ultimus an annual base fee of $15,000 plus an asset-based fee equal to 0.01% per annum on average net assets in excess of $100 million. In addition, the Fund reimburses Ultimus for any out-of-pocket expenses incurred for providing these services.
THE DAVENPORT CORE FUND NOTES TO FINANCIAL STATEMENTS (Continued) |
4. Contingencies and Commitments
The Fund indemnifies the Trust’s officers and Trustees for certain liabilities that might arise from their performance of their duties to the Fund. Additionally, in the normal course of business the Fund enters into contracts that contain a variety of representations and warranties and which provide general indemnifications. The Fund’s maximum exposure under these arrangements is unknown, as this would involve future claims that may be made against the Fund that have not yet occurred. However, based on experience, the Fund expects the risk of loss to be remote.
5. Subsequent Events
The Fund is required to recognize in the financial statements the effects of all subsequent events that provide additional evidence about conditions that existed at the date of the Statement of Assets and Liabilities. For non-recognized subsequent events that must be disclosed to keep the financial statements from being misleading, the Fund is required to disclose the nature of the event as well as an estimate of its financial effect, or a statement that such an estimate cannot be made. Management has evaluated subsequent events through the issuance of these financial statements and has noted no such events.
6. Recent Accounting Pronouncement
In January 2010, the Financial Accounting Standards Board (“FASB”) issued Accounting Standards Update (“ASU”) No. 2010-06 “Improving Disclosures about Fair Value Measurements.” ASU No. 2010-06 amends FASB Accounting Standards Codification Topic 820, Fair Value Measurements and Disclosures, to require additional disclosures regarding fair value measurements. Certain disclosures required by ASU No. 2010-06 are effective for interim and annual reporting periods beginning after December 15, 2009 and others for fiscal years beginning after December 15, 2010 and for interim periods within those fiscal years. Management is currently evaluating the impact ASU No. 2010-06 will have on the Fund’s financial statement disclosures.
THE DAVENPORT CORE FUND YOUR FUND’S EXPENSES (Unaudited) |
We believe it is important for you to understand the impact of costs on your investment. All mutual funds have operating expenses. As a shareholder of the Fund, you incur ongoing costs, including management fees and other Fund expenses. These ongoing costs, which are deducted from the Fund’s gross income, directly reduce the investment return of the Fund.
A mutual fund’s ongoing costs are expressed as a percentage of its average net assets. This figure is known as the expense ratio. The following examples are intended to help you understand the ongoing costs (in dollars) of investing in the Fund and to compare these costs with the ongoing costs of investing in other mutual funds. The examples below are based on an investment of $1,000 made at the beginning of the period shown and held for the entire period (April 1, 2010 through September 30, 2010).
The table below illustrates the Fund’s ongoing costs in two ways:
Actual fund return – This section helps you to estimate the actual expenses that you paid over the period. The “Ending Account Value” shown is derived from the Fund’s actual return, and the third column shows the dollar amount of operating expenses that would have been paid by an investor who started with $1,000 in the Fund. You may use the information here, together with the amount you invested, to estimate the expenses that you paid over the period.
To do so, simply divide your account value by $1,000 (for example, an $8,600 account value divided by $1,000 = 8.6), then multiply the result by the number given for the Fund under the heading “Expenses Paid During Period.”
Hypothetical 5% return – This section is intended to help you compare the Fund’s ongoing costs with those of other mutual funds. It assumes that the Fund had an annual return of 5% before expenses during the period shown, but that the expense ratio is unchanged. In this case, because the return used is not the Fund’s actual return, the results do not apply to your investment. The example is useful in making comparisons because the Securities and Exchange Commission (“SEC”) requires all mutual funds to calculate expenses based on a 5% return. You can assess the Fund’s ongoing costs by comparing this hypothetical example with the hypothetical examples that appear in shareholder reports of other funds.
Note that expenses shown in the table are meant to highlight and help you compare ongoing costs only. The Fund does not charge transaction fees, such as purchase or redemption fees, nor does it carry a “sales load.”
The calculations assume no shares were bought or sold during the period. Your actual costs may have been higher or lower, depending on the amount of your investment and the timing of any purchases or redemptions.
More information about the Fund’s expenses, including historical annual expense ratios, can be found in this report. For additional information on operating expenses and other shareholder costs, please refer to the Fund’s prospectus.
| Beginning Account Value April 1, 2010 | Ending Account Value September 30, 2010 | Expenses Paid During Period* |
Based on Actual Fund Return | $1,000.00 | $ 991.40 | $4.94 |
| Based on Hypothetical 5% Return (before expenses) | $1,000.00 | $1,020.10 | $5.01 |
| * | Expenses are equal to the Fund’s annualized expense ratio of 0.99% for the period, multiplied by the average account value over the period, multiplied by 183/365 (to reflect the one-half year period). |
THE DAVENPORT CORE FUND OTHER INFORMATION (Unaudited) |
A description of the policies and procedures that the Fund uses to vote proxies relating to portfolio securities is available without charge upon request by calling toll-free 1-800-281-3217, or on the SEC’s website at http://www.sec.gov. Information regarding how the Fund voted proxies relating to portfolio securities during the most recent 12-month period ended June 30 is also available without charge upon request by calling toll-free 1-800-281-3217, or on the SEC’s website at http://www.sec.gov.
The Trust files a complete listing of portfolio holdings for the Fund with the SEC as of the first and third quarters of each fiscal year on Form N-Q. These filings are available upon request by calling 1-800-281-3217. Furthermore, you may obtain a copy of these filings on the SEC’s website at http://www.sec.gov. The Trust’s Forms N-Q may also be reviewed and copied at the SEC’s Public Reference Room in Washington, DC, and information on the operation of the Public Reference Room may be obtained by calling 1-800-SEC-0330.
A complete listing of portfolio holdings for the Fund is updated daily and can be reviewed at the Fund’s website at http://www.investdavenport.com.
This page intentionally left blank.
| THE DAVENPORT CORE FUND Investment Adviser Davenport & Company LLC One James Center 901 East Cary Street Richmond, Virginia 23219-4037 Administrator Ultimus Fund Solutions, LLC P.O. Box 46707 Cincinnati, Ohio 45246-0707 1-800-281-3217 Custodian US Bank NA 425 Walnut Street Cincinnati, Ohio 45202 Independent Registered Public Accounting Firm Ernst & Young LLP 1900 Scripps Center 312 Walnut Street Cincinnati, Ohio 45202 Legal Counsel Sullivan & Worcester LLP One Post Office Square Boston, Massachusetts 02109 Board of Trustees Austin Brockenbrough III John T. Bruce Charles M. Caravati, Jr. Robert S. Harris J. Finley Lee, Jr. Richard L. Morrill Harris V. Morrissette Samuel B. Witt III Officers John P. Ackerly IV, President I. Lee Chapman IV, Vice President |
Davenport & Company LLC
One James Center
901 East Cary Street
Richmond, VA 23219
Member: NYSE • SIPC
Toll Free: (800) 846-6666
www.investdavenport.com
| | | |
|
| | |
FBP Value Fund FBP Balanced Fund
Semi-Annual Report September 30, 2010 (Unaudited)
No-Load Funds | | |
| | | |
|
We are pleased to report on your Funds and their investments for the semi-annual period ended September 30, 2010.
After peaking in late April, broad stock market indexes corrected some of last year’s strong gains by falling more than 15% through June 30, 2010. The market weakness was not confined to the U.S., as markets in Europe and Asia declined as well. In fact, the pain was even more pronounced in some overseas markets; the China Shanghai Index dropped about 25% the last two months of the June quarter. With wounds from the 2008 market collapse still fresh in the minds of investors, that drop raised new fears among many that the next bear market was just over the horizon. The explosion of the Deepwater Horizon oil rig in the Gulf of Mexico in April certainly impacted investor sentiment beyond the direct stock market declines of the companies involved in the disaster.
Also troubling to the market was the fact that the strength and sustainability of the economic recovery remained uncertain. First quarter GDP in the U.S. was revised down to 2.7%, a relatively low level considering we were still in the early stages of an economic expansion. At best, it appeared that economic activity had hit a soft spot, with the momentum of growth slowing worldwide, even in emerging markets where the absolute level of growth remained high. The debt crisis in Europe brought to the forefront the challenges faced by governments as they seek to balance stimulative spending and skyrocketing budget deficits. Greece was the first to make headlines with this dilemma, but other countries, including the U.S., will deal with similar issues over the coming months and years if corrective actions are not taken.
Fears of a double dip in the economy subsided during the most recent quarter, providing a sharp lift to the stock market in September. Generally improving sales and earnings from corporations gave investors added comfort that the economy was just experiencing a soft patch and not rolling over into another recession. An August 27th speech by Fed Chairman Ben Bernanke, in which he outlined additional measures that the Fed may undertake to stimulate the economy if conditions worsen, also helped investor confidence. Equity markets benefited as well from the anticipation of Congressional changes expected from the midterm elections.
After ending the March 2010 fiscal year of the Funds with relatively strong performance, our Funds trailed the S&P 500 Index for the semi-annual period ended September 30, 2010. The bulk of the underperformance was from stocks in the Consumer Staples, Consumer Discretionary and Information Technology sectors. A lack of exposure to defensive sectors such as Telecommunication and Utilities also held back returns. SUPERVALU, Hewlett Packard and JPMorganChase were the weakest performers, while Pioneer Natural Resources and Sealed Air provided nice gains. Weakness during this period allowed us to add to existing positions and to also add some new investments to the Funds. Stocks added included Northrup Grumman
in the Industrials sector and Bank of New York Mellon, Bank of America and MetLife in the Financials sector. Northrup Grumman’s leading positions in information and electronics systems should enable it to grow despite cutbacks in defense outlays. The stock trades at 10 times expected earnings and yields more than 3%. Bank of New York Mellon is a leading custody and asset management company trading at 9 times earnings. We like the fact that it has limited exposure to the risks associated with credit cycles that traditional banks face. Bank of America, the largest retail bank in the country, should benefit from its stable and relatively inexpensive deposit base. Having raised capital and repaid TARP, they are using strong operating earnings to work through problem loans and mortgage issues. Its Merrill Lynch acquisition proved more costly than projected, but should contribute nicely to earnings growth longer term. With the stock currently trading near tangible book value, we believe the downside is limited and its upside potential to full value is substantial. MetLife is the largest life insurer in the country, and one of the most well capitalized as well. We believe it offers size and quality benefits compared to its competitors, yet it trades at only a modest premium to the group. The company was in the process of purchasing ALICO, an international subsidiary of AIG, which will give MetLife increased global diversification and growth prospects. Each of these stocks offers very strong return potential as they trade at significant discounts to our full value target prices. We eliminated Sysco and Corelogic from the portfolio as they were trading close to our target values and CVS Caremark due to concerns with their pharmacy benefit management strategy.
As we look forward, the economy is expanding, but at a rate much lower than prior recoveries. We believe recent economic reports showing relatively stable consumer confidence, gradually rising personal incomes and a slight upward adjustment in reported GDP help to confirm our belief that the economy is expanding slowly. This sluggish growth could be expected given the over- leveraged state of the U.S. consumer and the uncertain political and regulatory environment facing taxpayers and businesses. These headwinds are real; yet solid corporate profit reports, high levels of cash on corporate balance sheets and the promise by the Federal Reserve to keep interest rates exceptionally low for some time underpin our belief in a continued gradually improving economy.
As we outlined in our last letter, with interest rates at historically low levels, equity valuation levels reasonable, skepticism still abundant and a decade of very low returns behind us, we are quite optimistic about the potential for stocks to perform well over the long term. Our focus is to build the Funds’ portfolios with companies trading at substantial discounts to our estimated values. We want to understand the businesses we invest in and to understand the drivers of future value. Strong financial flexibility, excess cash flow generation, revenue and margin potential and competitive position are some of the key factors we consider. Once economic activity sufficiently improves, the Federal Reserve current policy of keeping interest rates depressed will reverse, allowing interest rates to rise to market based levels. We the refore will continue to maintain short duration maturities in the Balanced Fund to protect the principal value of the bonds.
Please visit our website at www.fbpfunds.com for information on your Funds and the investment philosophy and process we utilize to achieve their investment objectives.
John T. Bruce, CFA
President - Portfolio Manager
November 11, 2010
Data presented reflects past performance, which is no guarantee of future results. Investment results and principal value will fluctuate so that shares, when redeemed, may be worth more or less than their original cost. Due to market volatility, current performance may be higher or lower than the performance shown. Updated performance information, current through the most recent month-end, is available by contacting the Funds at 1-866-738-1127.
This report is submitted for the general information of the shareholders of the Funds. It reflects our views, opinions and portfolio holdings as of September 30, 2010, the end of the reporting period. These views are subject to change at any time based upon market or other conditions. For more current information throughout the year please visit www.fbpfunds.com or call the Funds at 1-866-738-1127. This report is not authorized for distribution to prospective investors in the Funds unless accompanied by a current prospectus. Distributed by Ultimus Fund Distributors, LLC
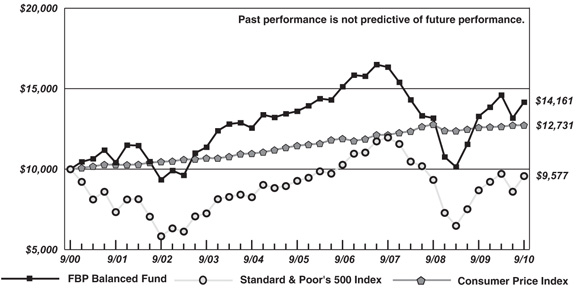
THE FLIPPIN, BRUCE & PORTER FUNDS COMPARATIVE PERFORMANCE CHARTS (Unaudited) |
Performance for each Fund is compared to the most appropriate broad-based index, the S&P 500 Index, an unmanaged index of 500 large common stocks. Over time, this index has the potential to outpace FBP Balanced Fund, which normally maintains at least 25% of its net assets in fixed income securities. Balanced funds have the growth potential to outpace inflation, but they will typically lag a 100% stock index over the long term because of the fixed income portion of their portfolios. However, the advantage of the fixed income portion is that it can make the return and principal of a balanced fund more stable than a portfolio completely invested in stocks. Results are also compared to the Consumer Price Index, a measure of inflation.
FBP Value Fund
Comparison of the Change in Value of a $10,000 Investment in the FBP Value
Fund, the Standard & Poor's 500 Index and the Consumer Price Index
THE FLIPPIN, BRUCE & PORTER FUNDS COMPARATIVE PERFORMANCE CHARTS (Unaudited) (Continued) |
FBP Balanced Fund
Comparison of the Change in Value of a $10,000 Investment in the FBP Balanced
Fund, the Standard & Poor's 500 Index and the Consumer Price Index
Average Annual Total Returns(a) (for periods ended September 30, 2010) |
| | 1 Year | 5 Years | 10 Years |
| FBP Value Fund | 5.98% | -2.17% | 2.05% |
| FBP Balanced Fund | 6.65% | 0.82% | 3.54% |
| Standard & Poor’s 500 Index | 10.16% | 0.64% | -0.43% |
| Consumer Price Index | 1.14% | 2.13% | 2.44% |
| (a) | Total returns are a measure of the change in value of an investment in the Funds over the periods covered, which assumes any dividends or capital gains distributions are reinvested in shares of the Funds. Returns do not reflect the deduction of taxes a shareholder would pay on the Funds’ distributions or the redemption of Fund shares. |
FBP VALUE FUND PORTFOLIO INFORMATION September 30, 2010 (Unaudited) |
| General Information | | Asset Allocation |
| Net Asset Value Per Share | $ 18.19 | 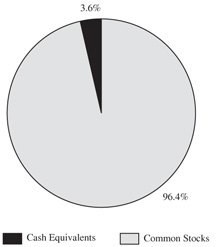 |
| Total Net Assets (Millions) | $ 26.3 |
| Current Expense Ratio | 1.07% |
| Portfolio Turnover | 16% |
| Fund Inception Date | 7/30/1993 |
| | | |
| Stock Characteristics | FBP Value Fund | S&P 500 Index |
| Number of Stocks | 45 | 500 |
Weighted Avg Market
Capitalization (Billions) | $ 56.1 | $ 78.3 |
Price-to-Earnings Ratio
(IBES 1 Yr. Forecast EPS) | 10.5 | 12.4 |
| Price-to-Book Value | 1.7 | 2.1 |
| Sector Diversification vs. the S&P 500 Index |
| Ten Largest Equity Holdings | % of Net Assets |
| JPMorgan Chase & Company | 4.3% |
| Walgreen Company | 3.8% |
| Devon Energy Corporation | 3.7% |
| Sealed Air Corporation | 3.5% |
| Computer Sciences Corporation | 3.5% |
| McGraw-Hill Companies, Inc. (The) | 3.1% |
| Avon Products, Inc. | 3.1% |
| Johnson & Johnson | 2.9% |
| Hewlett-Packard Company | 2.9% |
| Kimberly-Clark Corporation | 2.8% |
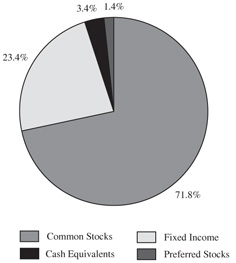
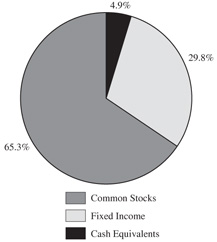
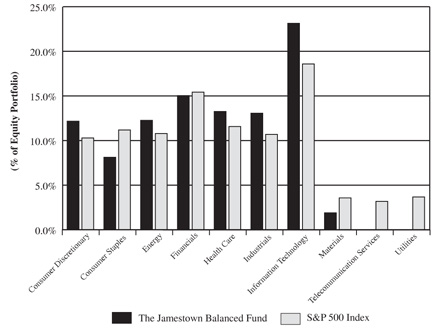
FBP BALANCED FUND PORTFOLIO INFORMATION September 30, 2010 (Unaudited) |
| General Information | | Asset Allocation |
| Net Asset Value Per Share | $ 14.89 | |
| Total Net Assets (Millions) | $ 43.6 |
| Current Expense Ratio | 1.00% |
| Portfolio Turnover | 13% |
| Fund Inception Date | 7/3/1989 |
| |
| Common Stock Portfolio (71.8% of Fund) |
| Number of Stocks | 51 | | Ten Largest Equity Holdings | | |
| Weighted Avg Market Capitalization (Billions) | $54.9 | | JPMorgan Chase & Company | | 2.7% |
| Price-to-Earnings Ratio (IBES 1 Yr. Forecast EPS) | 10.7 | | Devon Energy Corporation | | 2.5% |
| Price-to-Book Value | 1.7 | | Walgreen Company | | 2.5% |
| | | | Computer Sciences Corporation | | 2.4% |
| | | International Business Machines Corporation | | 2.3% |
| Information Technology | 13.1% | | Sealed Air Corporation | | 2.2% |
| Financials | 12.6% | | Johnson & Johnson | | 2.0% |
| Consumer Staples | 9.2% | | Avon Products, Inc. | | 2.0% |
| Industrials | 8.8% | | McGraw-Hill Companies, Inc. (The) | | 2.0% |
| Energy | 7.8% | | Ingersoll-Rand plc | | 2.0% |
| Fixed-Income Portfolio (23.4% of Fund) | |
| Number of Fixed-Income Securities | 13 | | | | |
| Average Quality | A | | U.S. Treasury | | 1.7% |
| Average Weighted Maturity | 1.8 yrs. | | U.S. Government Agency | | 1.7% |
| Average Effective Duration | 1.6 yrs. | | Corporate | | 20.0% |
FBP VALUE FUND SCHEDULE OF INVESTMENTS September 30, 2010 (Unaudited) | |
| | | | | | |
| Consumer Discretionary — 11.0% | | | | | | |
H&R Block, Inc. | | | 32,000 | | | $ | 414,400 | |
Home Depot, Inc. (The) | | | 11,000 | | | | 348,480 | |
KB Home | | | 23,000 | | | | 260,590 | |
Kohl's Corporation (a) | | | 8,000 | | | | 421,440 | |
Macy's, Inc. | | | 26,500 | | | | 611,885 | |
McGraw-Hill Companies, Inc. (The) | | | 25,000 | | | | 826,500 | |
| | | | | | | | 2,883,295 | |
| Consumer Staples — 13.0% | | | | | | | | |
Avon Products, Inc. | | | 25,300 | | | | 812,383 | |
Kimberly-Clark Corporation | | | 11,500 | | | | 748,075 | |
SUPERVALU, Inc. | | | 52,000 | | | | 599,560 | |
Walgreen Company | | | 30,000 | | | | 1,005,000 | |
Wal-Mart Stores, Inc. | | | 4,900 | | | | 262,248 | |
| | | | | | | | 3,427,266 | |
| Energy — 8.7% | | | | | | | | |
Chevron Corporation | | | 6,000 | | | | 486,300 | |
Devon Energy Corporation | | | 15,000 | | | | 971,100 | |
Pioneer Natural Resources Company | | | 3,300 | | | | 214,599 | |
Royal Dutch Shell plc - Class A - ADR | | | 10,000 | | | | 603,000 | |
| | | | | | | | 2,274,999 | |
| Financials — 18.4% | | | | | | | | |
Bank of America Corporation | | | 36,000 | | | | 471,960 | |
Bank of New York Mellon Corporation (The) | | | 18,000 | | | | 470,340 | |
Comerica, Inc. (b). | | | 10,500 | | | | 390,075 | |
First American Financial Corporation | | | 4,000 | | | | 59,760 | |
JPMorgan Chase & Company | | | 30,000 | | | | 1,142,100 | |
Lincoln National Corporation | | | 23,000 | | | | 550,160 | |
MetLife, Inc. | | | 9,900 | | | | 380,655 | |
Travelers Companies, Inc. (The) | | | 14,001 | | | | 729,453 | |
Willis Group Holdings plc | | | 21,000 | | | | 647,220 | |
| | | | | | | | 4,841,723 | |
| Health Care — 10.1% | | | | | | | | |
Amgen, Inc. (a) | | | 8,400 | | | | 462,924 | |
Johnson & Johnson | | | 12,500 | | | | 774,500 | |
Merck & Company, Inc. | | | 15,000 | | | | 552,150 | |
Pfizer, Inc. | | | 30,000 | | | | 515,100 | |
WellPoint, Inc. (a) | | | 6,300 | | | | 356,832 | |
| | | | | | | | 2,661,506 | |
| Industrials — 12.2% | | | | | | | | |
Avery Dennison Corporation | | | 17,900 | | | | 664,448 | |
FedEx Corporation | | | 4,600 | | | | 393,300 | |
General Electric Company | | | 26,500 | | | | 430,625 | |
Ingersoll-Rand plc | | | 18,300 | | | | 653,493 | |
Lockheed Martin Corporation | | | 7,900 | | | | 563,112 | |
Masco Corporation | | | 24,400 | | | | 268,644 | |
Northrop Grumman Corporation | | | 4,000 | | | | 242,520 | |
| | | | | | | | 3,216,142 | |
FBP VALUE FUND SCHEDULE OF INVESTMENTS (Continued) | |
COMMON STOCKS — 96.4% (Continued) | | | | | | |
| Information Technology — 19.5% | | | | | | |
Cisco Systems, Inc. (a) | | | 22,000 | | | $ | 481,800 | |
Computer Sciences Corporation | | | 20,000 | | | | 920,000 | |
Dell, Inc. (a) | | | 45,000 | | | | 583,200 | |
Flextronics International Ltd. (a) | | | 84,000 | | | | 507,360 | |
Hewlett-Packard Company | | | 18,000 | | | | 757,260 | |
International Business Machines Corporation | | | 5,200 | | | | 697,528 | |
Microsoft Corporation | | | 20,000 | | | | 489,800 | |
Western Union Company (The) | | | 39,000 | | | | 689,130 | |
| | | | | | | | 5,126,078 | |
| Materials — 3.5% | | | | | | | | |
Sealed Air Corporation | | | 41,100 | | | | 923,927 | |
| | | | | | | | | |
Total Common Stocks (Cost $22,743,604) | | | | | | $ | 25,354,936 | |
| | |
MONEY MARKET FUNDS — 3.5% | | | | | | |
Fidelity Institutional Money Market Government Portfolio - Class I, 0.06% (c) (Cost $927,691) | | | 927,691 | | | $ | 927,691 | |
| | | | | | | | | |
Total Investments at Value — 99.9% (Cost $23,671,295) | | | | | | $ | 26,282,627 | |
| | | | | | | | | |
Other Assets in Excess of Liabilities — 0.1% | | | | | | | 22,565 | |
| | | | | | | | | |
Net Assets — 100.0% | | | | | | $ | 26,305,192 | |
| ADR - American Depositary Receipt. |
| |
| (a) | Non-income producing security. |
| | |
| (b) | Security covers a written call option. |
| | |
| (c) | Variable rate security. The rate shown is the 7-day effective yield as of September 30, 2010. |
| | |
| See accompanying notes to financial statements. |
FBP VALUE FUND SCHEDULE OF OPEN OPTION CONTRACTS September 30, 2010 (Unaudited) | |
| | | | | | | | | |
| Comerica, Inc., | | | | | | | | | |
10/16/2010 at $45 | | | 70 | | | $ | 210 | | | $ | 16,589 | |
| See accompanying notes to financial statements. |
FBP BALANCED FUND SCHEDULE OF INVESTMENTS September 30, 2010 (Unaudited) | |
| | | | | | |
| Consumer Discretionary — 7.1% | | | | | | |
H&R Block, Inc. | | | 38,000 | | | $ | 492,100 | |
Home Depot, Inc. (The) | | | 11,800 | | | | 373,824 | |
KB Home | | | 26,000 | | | | 294,580 | |
Kohl's Corporation (a) | | | 7,500 | | | | 395,100 | |
Macy's, Inc. | | | 30,000 | | | | 692,700 | |
McGraw-Hill Companies, Inc. (The) | | | 26,000 | | | | 859,560 | |
| | | | | | | | 3,107,864 | |
| Consumer Staples — 9.2% | | | | | | | | |
Avon Products, Inc. | | | 27,000 | | | | 866,970 | |
Kimberly-Clark Corporation | | | 12,300 | | | | 800,115 | |
Philip Morris International, Inc. | | | 6,500 | | | | 364,130 | |
SUPERVALU, Inc. | | | 54,000 | | | | 622,620 | |
Walgreen Company | | | 32,000 | | | | 1,072,000 | |
Wal-Mart Stores, Inc. | | | 5,500 | | | | 294,360 | |
| | | | | | | | 4,020,195 | |
| Energy — 7.8% | | | | | | | | |
Chevron Corporation | | | 7,000 | | | | 567,350 | |
ConocoPhillips | | | 12,500 | | | | 717,875 | |
Devon Energy Corporation | | | 17,000 | | | | 1,100,580 | |
Pioneer Natural Resources Company | | | 6,000 | | | | 390,180 | |
Royal Dutch Shell plc - Class A - ADR | | | 10,000 | | | | 603,000 | |
| | | | | | | | 3,378,985 | |
| Financials — 12.6% | | | | | | | | |
Bank of America Corporation | | | 42,000 | | | | 550,620 | |
Bank of New York Mellon Corporation (The) | | | 21,000 | | | | 548,730 | |
Comerica, Inc. (b) | | | 15,000 | | | | 557,250 | |
First American Financial Corporation | | | 9,000 | | | | 134,460 | |
JPMorgan Chase & Company | | | 31,000 | | | | 1,180,170 | |
Lincoln National Corporation | | | 25,000 | | | | 598,000 | |
MetLife, Inc. | | | 11,000 | | | | 422,950 | |
Travelers Companies, Inc. (The) | | | 16,000 | | | | 833,600 | |
Willis Group Holdings plc | | | 22,000 | | | | 678,040 | |
| | | | | | | | 5,503,820 | |
| Health Care — 6.5% | | | | | | | | |
Amgen, Inc. (a) | | | 8,850 | | | | 487,724 | |
Johnson & Johnson | | | 14,000 | | | | 867,440 | |
Merck & Company, Inc. | | | 15,600 | | | | 574,236 | |
Pfizer, Inc. | | | 31,000 | | | | 532,270 | |
WellPoint, Inc. (a) | | | 6,500 | | | | 368,160 | |
| | | | | | | | 2,829,830 | |
| Industrials — 8.8% | | | | | | | | |
Avery Dennison Corporation | | | 19,000 | | | | 705,280 | |
FedEx Corporation | | | 6,400 | | | | 547,200 | |
General Electric Company | | | 35,000 | | | | 568,750 | |
Ingersoll-Rand plc | | | 24,000 | | | | 857,040 | |
Lockheed Martin Corporation | | | 8,400 | | | | 598,752 | |
FBP BALANCED FUND SCHEDULE OF INVESTMENTS (Continued) | |
COMMON STOCKS — 71.8% (Continued) | | | | | | |
| Industrials — 8.8%(Continued) | | | | | | |
Masco Corporation | | | 25,000 | | | $ | 275,250 | |
Northrop Grumman Corporation | | | 5,000 | | | | 303,150 | |
| | | | | | | | 3,855,422 | |
| Information Technology — 13.1% | | | | | | | | |
Cisco Systems, Inc. (a) | | | 24,000 | | | | 525,600 | |
Computer Sciences Corporation | | | 23,000 | | | | 1,058,000 | |
Dell, Inc. (a) | | | 35,000 | | | | 453,600 | |
Flextronics International Ltd. (a) | | | 85,000 | | | | 513,400 | |
Hewlett-Packard Company | | | 20,000 | | | | 841,400 | |
International Business Machines Corporation | | | 7,500 | | | | 1,006,050 | |
Microsoft Corporation | | | 21,000 | | | | 514,290 | |
Western Union Company (The) | | | 45,000 | | | | 795,150 | |
| | | | | | | | 5,707,490 | |
| Materials — 4.5% | | | | | | | | |
E.I. du Pont de Nemours and Company | | | 18,000 | | | | 803,160 | |
RPM International, Inc. | | | 10,000 | | | | 199,200 | |
Sealed Air Corporation | | | 42,000 | | | | 944,160 | |
| | | | | | | | 1,946,520 | |
| Utilities — 2.2% | | | | | | | | |
American Electric Power Company, Inc. | | | 14,000 | | | | 507,220 | |
Duke Energy Corporation | | | 26,000 | | | | 460,460 | |
| | | | | | | | 967,680 | |
| | | | | | | | | |
Total Common Stocks (Cost $26,139,270) | | | | | | $ | 31,317,806 | |
| | |
| | | | | | |
BB&T Capital Trust VII (Cost $550,000) | | | 22,000 | | | $ | 608,740 | |
| |
U.S. GOVERNMENT & AGENCY OBLIGATIONS — 3.4% | | | | | | |
| U.S. Treasury Notes — 1.7% | | | | | | |
4.50%, due 11/15/2010 | | $ | 750,000 | | | $ | 753,954 | |
| | | | | | | | | |
| Federal Home Loan Bank — 1.7% | | | | | | | | |
4.375%, due 10/22/2010 | | | 750,000 | | | | 751,780 | |
| | | | | | | | | |
Total U.S. Government & Agency Obligations
(Cost $1,500,569) | | | | | | $ | 1,505,734 | |
FBP BALANCED FUND SCHEDULE OF INVESTMENTS (Continued) | |
| | | | | | |
| Consumer Discretionary — 1.8% | | | | | | |
| Anheuser-Busch InBev SA/NV, 3.00%, due 10/15/2012 | | $ | 750,000 | | | $ | 778,713 | |
| | | | | | | | | |
| Consumer Staples — 1.8% | | | | | | | | |
Kraft Foods, Inc., 5.625%, due 11/01/2011 | | | 750,000 | | | | 787,695 | |
| | | | | | | | | |
| Financials — 3.7% | | | | | | | | |
| Berkley (W.R.) Corporation, 5.60%, due 05/15/2015 | | | 750,000 | | | | 806,639 | |
| Prudential Financial, Inc., 5.80%, due 06/15/2012 | | | 750,000 | | | | 802,016 | |
| | | | | | | | 1,608,655 | |
| Health Care — 1.7% | | | | | | | | |
| UnitedHealth Group, Inc., 5.25%, due 03/15/2011 | | | 750,000 | | | | 764,254 | |
| | | | | | | | | |
| Industrials — 5.5% | | | | | | | | |
| Donnelly (R.R.) & Sons Company, 4.95%, due 04/01/2014 | | | 750,000 | | | | 778,139 | |
Eaton Corporation, 5.95%, due 03/20/2014 | | | 750,000 | | | | 860,764 | |
Ryder System, Inc., 5.00%, due 04/01/2011 | | | 750,000 | | | | 762,995 | |
| | | | | | | | 2,401,898 | |
| Information Technology — 1.9% | | | | | | | | |
Analog Devices, Inc., 5.00%, due 07/01/2014 | | | 750,000 | | | | 824,223 | |
| | | | | | | | | |
| Utilities — 3.6% | | | | | | | | |
Ohio Power Company, 5.30%, due 11/01/2010 | | | 750,000 | | | | 752,369 | |
| SBC Communications, Inc., 5.875%, due 02/01/2012 | | | 750,000 | | | | 798,779 | |
| | | | | | | | 1,551,148 | |
| | | | | | | | | |
Total Corporate Bonds (Cost $8,295,759) | | | | | | $ | 8,716,586 | |
| | |
MONEY MARKET FUNDS — 2.4% | | | | | | |
Fidelity Institutional Money Market Government Portfolio - Class I, 0.06% (c) (Cost $1,028,306) | | | 1,028,306 | | | $ | 1,028,306 | |
| | | | | | | | | |
Total Investments at Value — 99.0% (Cost $37,513,904) | | | | | | $ | 43,177,172 | |
| | | | | | | | | |
Other Assets in Excess of Liabilities — 1.0% | | | | | | | 421,575 | |
| | | | | | | | | |
Net Assets — 100.0% | | | | | | $ | 43,598,747 | |
| ADR - American Depositary Receipt. |
| |
| (a) | Non-income producing security. |
| | |
| (b) | Security covers a written call option. |
| | |
| (c) | Variable rate security. The rate shown is the 7-day effective yield as of September 30, 2010. |
| | |
| See accompanying notes to financial statements. |
FBP BALANCED FUND SCHEDULE OF OPEN OPTION CONTRACTS September 30, 2010 (Unaudited) | |
| | | | | | | | | |
| Comerica, Inc., | | | | | | | | | |
10/16/2010 at $45 | | | 70 | | | $ | 210 | | | $ | 16,589 | |
| See accompanying notes to financial statements. |
THE FLIPPIN, BRUCE & PORTER FUNDS STATEMENTS OF ASSETS AND LIABILITIES September 30, 2010 (Unaudited) | |
| | | | | | |
| ASSETS | | | | | | |
| Investments in securities: | | | | | | |
At acquisition cost | | $ | 23,671,295 | | | $ | 37,513,904 | |
At value (Note 1) | | $ | 26,282,627 | | | $ | 43,177,172 | |
Dividends and interest receivable | | | 37,595 | | | | 204,697 | |
Receivable for capital shares sold | | | 5,169 | | | | 277,402 | |
Other assets | | | 8,464 | | | | 6,245 | |
TOTAL ASSETS | | �� | 26,333,855 | | | | 43,665,516 | |
| | | | | | | | | |
| LIABILITIES | | | | | | | | |
Covered call options, at value (Notes 1 and 4)
(premiums received $16,589 and $16,589, respectively) | | | 210 | | | | 210 | |
Distributions payable | | | 1,322 | | | | 19,856 | |
Payable for capital shares redeemed | | | 2,414 | | | | 7,630 | |
Accrued investment advisory fees (Note 3) | | | 11,427 | | | | 23,673 | |
Payable to administrator (Note 3) | | | 4,700 | | | | 5,600 | |
Other accrued expenses | | | 8,590 | | | | 9,800 | |
TOTAL LIABILITIES | | | 28,663 | | | | 66,769 | |
| | | | | | | | | |
NET ASSETS | | $ | 26,305,192 | | | $ | 43,598,747 | |
| | | | | | | | | |
| Net assets consist of: | | | | | | | | |
Paid-in capital | | $ | 26,917,681 | | | $ | 39,340,463 | |
Accumulated undistributed (distributions in excess of)
net investment income | | | 648 | | | | (6,317 | ) |
| Accumulated net realized losses from security transactions | | | (3,240,848 | ) | | | (1,415,046 | ) |
Net unrealized appreciation on investments | | | 2,627,711 | | | | 5,679,647 | |
Net assets | | $ | 26,305,192 | | | $ | 43,598,747 | |
| | | | | | | | | |
Shares of beneficial interest outstanding
(unlimited number of shares authorized, no par value) | | | 1,445,910 | | | | 2,928,491 | |
| | | | | | | | | |
Net asset value, offering price and redemption
price per share (Note 1) | | $ | 18.19 | | | $ | 14.89 | |
| See accompanying notes to financial statements. |
THE FLIPPIN, BRUCE & PORTER FUNDS STATEMENTS OF OPERATIONS Six Months Ended September 30, 2010 (Unaudited) | |
| | | | | | |
| INVESTMENT INCOME | | | | | | |
Interest | | $ | — | | | $ | 225,697 | |
Dividends | | | 237,932 | | | | 354,486 | |
Foreign withholding taxes on dividends | | | (2,520 | ) | | | (2,520 | ) |
TOTAL INVESTMENT INCOME | | | 235,412 | | | | 577,663 | |
| | | | | | | | | |
| EXPENSES | | | | | | | | |
Investment advisory fees (Note 3) | | | 92,918 | | | | 151,495 | |
Administration fees (Note 3) | | | 24,000 | | | | 30,191 | |
Professional fees | | | 9,309 | | | | 10,059 | |
Trustees’ fees and expenses | | | 6,842 | | | | 6,842 | |
Registration fees | | | 6,343 | | | | 4,473 | |
| Compliance service fees and expenses (Note 3) | | | 4,555 | | | | 4,555 | |
Custodian and bank service fees | | | 3,691 | | | | 4,371 | |
Printing of shareholder reports | | | 3,479 | | | | 2,381 | |
Insurance expense | | | 1,729 | | | | 2,503 | |
Postage and supplies | | | 2,140 | | | | 1,691 | |
Other expenses | | | 3,945 | | | | 4,971 | |
TOTAL EXPENSES | | | 158,951 | | | | 223,532 | |
| Fees voluntarily waived by the Adviser (Note 3) | | | (16,920 | ) | | | (7,110 | ) |
NET EXPENSES | | | 142,031 | | | | 216,422 | |
| | | | | | | | | |
NET INVESTMENT INCOME | | | 93,381 | | | | 361,241 | |
| | | | | | | | | |
REALIZED AND UNREALIZED GAINS
(LOSSES) ON INVESTMENTS | | | | | | | | |
| Net realized gains from: | | | | | | | | |
Security transactions | | | 1,068,382 | | | | 862,330 | |
Option contracts | | | 14,819 | | | | 31,626 | |
| Net change in unrealized appreciation/depreciation on: | | | | | | | | |
Investments | | | (2,951,536 | ) | | | (2,662,521 | ) |
Option contracts | | | 16,379 | | | | 16,379 | |
| | | | | | | | | |
NET REALIZED AND UNREALIZED
LOSSES ON INVESTMENTS | | | (1,851,956 | ) | | | (1,752,186 | ) |
| | | | | | | | | |
NET DECREASE IN NET ASSETS
FROM OPERATIONS | | $ | (1,758,575 | ) | | | (1,390,945 | ) |
| See accompanying notes to financial statements. |
THE FLIPPIN, BRUCE & PORTER FUNDS STATEMENTS OF CHANGES IN NET ASSETS | |
| | | | | | | |
| | Six Months Ended September 30, 2010 (Unaudited) | | | | | | Six Months Ended September 30, 2010 (Unaudited) | | | | |
| FROM OPERATIONS | | | | | | | | | | | | |
Net investment income | | $ | 93,381 | | | $ | 193,366 | | | $ | 361,241 | | | $ | 797,205 | |
| Net realized gains on: | | | | | | | | | | | | | | | | |
Security transactions | | | 1,068,382 | | | | 1,048,186 | | | | 862,330 | | | | 1,458,838 | |
Option contracts | | | 14,819 | | | | 28,944 | | | | 31,626 | | | | 32,808 | |
Net change in unrealized appreciation/
depreciation on: | | | | | | | | | | | | | | | | |
Investments | | | (2,951,536 | ) | | | 10,893,329 | | | | (2,662,521 | ) | | | 12,459,369 | |
Option contracts | | | 16,379 | | | | — | | | | 16,379 | | | | — | |
Net increase (decrease) in
net assets from operations | | | (1,758,575 | ) | | | 12,163,825 | | | | (1,390,945 | ) | | | 14,748,220 | |
| | | | | | | | | | | | | | | | | |
| DISTRIBUTIONS TO SHAREHOLDERS | | | | | | | | | | | | | | | | |
From net investment income | | | (91,508 | ) | | | (205,334 | ) | | | (372,435 | ) | | | (838,744 | ) |
| | | | | | | | | | | | | | | | | |
| FROM CAPITAL SHARE TRANSACTIONS | | | | | | | | | | | | | | | | |
Proceeds from shares sold | | | 489,268 | | | | 811,111 | | | | 820,918 | | | | 1,129,444 | |
Net asset value of shares issued in
reinvestment of distributions to
shareholders | | | 88,817 | | | | 199,289 | | | | 327,792 | | | | 747,349 | |
Payments for shares redeemed | | | (1,039,410 | ) | | | (4,957,268 | ) | | | (1,293,317 | ) | | | (4,478,899 | ) |
Net decrease in net assets from
capital share transactions | | | (461,325 | ) | | | (3,946,868 | ) | | | (144,607 | ) | | | (2,602,106 | ) |
| | | | | | | | | | | | | | | | | |
TOTAL INCREASE (DECREASE)
IN NET ASSETS | | | (2,311,408 | ) | | | 8,011,623 | | | | (1,907,987 | ) | | | 11,307,370 | |
| | | | | | | | | | | | | | | | | |
| NET ASSETS | | | | | | | | | | | | | | | | |
Beginning of period | | | 28,616,600 | | | | 20,604,977 | | | | 45,506,734 | | | | 34,199,364 | |
End of period | | $ | 26,305,192 | | | $ | 28,616,600 | | | $ | 43,598,747 | | | $ | 45,506,734 | |
| | | | | | | | | | | | | | | | | |
ACCUMULATED UNDISTRIBUTED
(DISTRIBUTIONS IN EXCESS OF)
NET INVESTMENT INCOME | | $ | 648 | | | $ | (1,225 | ) | | $ | (6,317 | ) | | $ | 4,877 | |
| | | | | | | | | | | | | | | | | |
| CAPITAL SHARE ACTIVITY | | | | | | | | | | | | | | | | |
Shares sold | | | 25,905 | | | | 50,497 | | | | 55,740 | | | | 83,529 | |
Shares reinvested | | | 5,106 | | | | 12,030 | | | | 22,836 | | | | 53,343 | |
Shares redeemed | | | (58,812 | ) | | | (303,238 | ) | | | (87,901 | ) | | | (317,389 | ) |
Net decrease in shares outstanding | | | (27,801 | ) | | | (240,711 | ) | | | (9,325 | ) | | | (180,517 | ) |
| Shares outstanding at beginning of period | | | 1,473,711 | | | | 1,714,422 | | | | 2,937,816 | | | | 3,118,333 | |
Shares outstanding at end of period | | | 1,445,910 | | | | 1,473,711 | | | | 2,928,491 | | | | 2,937,816 | |
| See accompanying notes to financial statements. |
FBP VALUE FUND FINANCIAL HIGHLIGHTS | |
Selected Per Share Data and Ratios for a Share Outstanding Throughout Each Period | |
| | Six Months Ended September 30, 2010 (Unaudited) | | | | |
| | | 2010 | | | | 2009 | | | | 2008 | | | | 2007 | | | | 2006 | |
| Net asset value at beginning of period | | $ | 19.42 | | | $ | 12.02 | | | $ | 20.99 | | | $ | 27.30 | | | $ | 26.60 | | | $ | 25.73 | |
| | | | | | | | | | | | | | | | | | | | | | | | | |
| Income (loss) from investment operations: | | | | | | | | | | | | | | | | | | | | | | | | |
| Net investment income | | | 0.06 | | | | 0.12 | | | | 0.27 | | | | 0.32 | | | | 0.33 | | | | 0.32 | |
Net realized and unrealized gains
(losses) on investments | | | (1.23 | ) | | | 7.41 | | | | (8.98 | ) | | | (4.43 | ) | | | 2.71 | | | | 2.70 | |
| Total from investment operations | | | (1.17 | ) | | | 7.53 | | | | (8.71 | ) | | | (4.11 | ) | | | 3.04 | | | | 3.02 | |
| | | | | | | | | | | | | | | | | | | | | | | | | |
| Less distributions: | | | | | | | | | | | | | | | | | | | | | | | | |
| Dividends from net investment income | | | (0.06 | ) | | | (0.13 | ) | | | (0.26 | ) | | | (0.32 | ) | | | (0.33 | ) | | | (0.32 | ) |
| Distributions from net realized gains | | | — | | | | — | | | | — | | | | (1.68 | ) | | | (2.01 | ) | | | (1.83 | ) |
Return of capital | | | — | | | | — | | | | — | | | | (0.20 | ) | | | — | | | | — | |
Total distributions | | | (0.06 | ) | | | (0.13 | ) | | | (0.26 | ) | | | (2.20 | ) | | | (2.34 | ) | | | (2.15 | ) |
| | | | | | | | | | | | | | | | | | | | | | | | | |
| Net asset value at end of period | | $ | 18.19 | | | $ | 19.42 | | | $ | 12.02 | | | $ | 20.99 | | | $ | 27.30 | | | $ | 26.60 | |
| | | | | | | | | | | | | | | | | | | | | | | | | |
Total return (a) | | | (5.99% | )(b) | | | 62.84% | | | | (41.78% | ) | | | (16.33% | ) | | | 11.57% | | | | 12.03% | |
| | | | | | | | | | | | | | | | | | | | | | | | | |
| Net assets at end of period (000’s) | | $ | 26,305 | | | $ | 28,617 | | | $ | 20,605 | | | $ | 43,072 | | | $ | 60,233 | | | $ | 59,611 | |
| | | | | | | | | | | | | | | | | | | | | | | | | |
Ratio of net expenses to
average net assets | | | 1.07% | (c)(d) | | | 1.07% | (d) | | | 1.07% | (d) | | | 1.01% | | | | 1.01% | | | | 1.01% | |
| | | | | | | | | | | | | | | | | | | | | | | | | |
Ratio of net investment income to
average net assets | | | 0.70% | (c) | | | 0.74% | | | | 1.59% | | | | 1.21% | | | | 1.19% | | | | 1.17% | |
| | | | | | | | | | | | | | | | | | | | | | | | | |
Portfolio turnover rate | | | 16% | (b) | | | 21% | | | | 16% | | | | 26% | | | | 16% | | | | 15% | |
| (a) | Total return is a measure of the change in value of an investment in the Fund over the periods covered, which assumes any dividends or capital gains distributions are reinvested in shares of the Fund. Returns shown do not reflect the deduction of taxes a shareholder would pay on Fund distributions or the redemption of Fund shares. |
| | |
| (b) | Not annualized. |
| | |
| (c) | Annualized. |
| | |
| (d) | Absent investment advisory fees voluntarily waived by the Adviser, the ratio of expenses to average net assets would have been 1.20%(c), 1.19% and 1.18% for the periods ended September 30, 2010 and March 31, 2010 and 2009, respectively (Note 3). |
| | |
| See accompanying notes to financial statements. |
FBP BALANCED FUND FINANCIAL HIGHLIGHTS | |
Selected Per Share Data and Ratios for a Share Outstanding Throughout Each Period | |
| | Six Months Ended September 30, 2010 (Unaudited) | | | | |
| | | 2010 | | | | 2009 | | | | 2008 | | | | 2007 | | | | 2006 | |
| Net asset value at beginning of period | | $ | 15.49 | | | $ | 10.97 | | | $ | 15.84 | | | $ | 18.95 | | | $ | 18.39 | | | $ | 18.06 | |
| | | | | | | | | | | | | | | | | | | | | | | | | |
| Income (loss) from investment operations: | | | | | | | | | | | | | | | | | | | | | | | | |
| Net investment income | | | 0.12 | | | | 0.27 | | | | 0.32 | | | | 0.38 | | | | 0.37 | | | | 0.33 | |
Net realized and unrealized gains
(losses) on investments | | | (0.59 | ) | | | 4.53 | | | | (4.89 | ) | | | (2.01 | ) | | | 1.39 | | | | 1.22 | |
| Total from investment operations | | | (0.47 | ) | | | 4.80 | | | | (4.57 | ) | | | (1.63 | ) | | | 1.76 | | | | 1.55 | |
| | | | | | | | | | | | | | | | | | | | | | | | | |
| Less distributions: | | | | | | | | | | | | | | | | | | | | | | | | |
| Dividends from net investment income | | | (0.13 | ) | | | (0.28 | ) | | | (0.30 | ) | | | (0.39 | ) | | | (0.37 | ) | | | (0.32 | ) |
| Distributions from net realized gains | | | — | | | | — | | | | — | | | | (1.02 | ) | | | (0.83 | ) | | | (0.90 | ) |
Return of capital | | | — | | | | — | | | | — | | | | (0.07 | ) | | | — | | | | — | |
Total distributions | | | (0.13 | ) | | | (0.28 | ) | | | (0.30 | ) | | | (1.48 | ) | | | (1.20 | ) | | | (1.22 | ) |
| | | | | | | | | | | | | | | | | | | | | | | | | |
| Net asset value at end of period | | $ | 14.89 | | | $ | 15.49 | | | $ | 10.97 | | | $ | 15.84 | | | $ | 18.95 | | | $ | 18.39 | |
| | | | | | | | | | | | | | | | | | | | | | | | | |
Total return (a) | | | (3.01% | )(b) | | | 44.01% | | | | (29.15% | ) | | | (9.27% | ) | | | 9.70% | | | | 8.81% | |
| | | | | | | | | | | | | | | | | | | | | | | | | |
| Net assets at end of period (000’s) | | $ | 43,599 | | | $ | 45,507 | | | $ | 34,199 | | | $ | 54,995 | | | $ | 66,358 | | | $ | 62,781 | |
| | | | | | | | | | | | | | | | | | | | | | | | | |
Ratio of net expenses to
average net assets | | | 1.00% | (c)(d) | | | 1.00% | (d) | | | 1.00% | (d) | | | 0.96% | | | | 0.97% | | | | 0.99% | |
| | | | | | | | | | | | | | | | | | | | | | | | | |
Ratio of net investment income to
average net assets | | | 1.67% | (c) | | | 1.90% | | | | 2.36% | | | | 2.05% | | | | 1.95% | | | | 1.75% | |
| | | | | | | | | | | | | | | | | | | | | | | | | |
Portfolio turnover rate | | | 13% | (b) | | | 24% | | | | 24% | | | | 29% | | | | 17% | | | | 24% | |
| (a) | Total return is a measure of the change in value of an investment in the Fund over the periods covered, which assumes any dividends or capital gains distributions are reinvested in shares of the Fund. Returns shown do not reflect the deduction of taxes a shareholder would pay on Fund distributions or the redemption of Fund shares. |
| | |
| (b) | Not annualized. |
| | |
| (c) | Annualized. |
| | |
| (d) | Absent investment advisory fees voluntarily waived by the Adviser, the ratio of expenses to average net assets would have been 1.03%(c), 1.03% and 1.05% for the periods ended September 30, 2010 and March 31, 2010 and 2009, respectively (Note 3). |
| | |
| See accompanying notes to financial statements. |
THE FLIPPIN, BRUCE & PORTER FUNDS NOTES TO FINANCIAL STATEMENTS September 30, 2010 (Unaudited) |
1. Organization and Significant Accounting Policies
FBP Value Fund and FBP Balanced Fund (the “Funds”) are no-load, diversified series of the Williamsburg Investment Trust (the “Trust”), an open-end management investment company registered under the Investment Company Act of 1940. The Trust was organized as a Massachusetts business trust on July 18, 1988. Other series of Williamsburg Investment Trust are not included in this report.
FBP Value Fund seeks long term growth of capital through investment in a diversified portfolio comprised primarily of equity securities, with current income as a secondary objective.
FBP Balanced Fund seeks long term capital appreciation and current income through investment in a balanced portfolio of equity and fixed income securities.
The following is a summary of the Funds’ significant accounting policies:
Securities valuation — The Funds’ portfolio securities are valued as of the close of business of the regular session of the New York Stock Exchange (normally 4:00 p.m., Eastern time). Securities traded on a national stock exchange are valued based upon the closing price on the principal exchange where the security is traded. Securities which are quoted by NASDAQ are valued at the NASDAQ Official Closing Price. Securities which are traded over-the-counter are valued at the last sales price, if available, otherwise, at the last quoted bid price. It is expected that fixed income securities will ordinarily be traded in the over-the-counter market, and common stocks will ordinarily be traded on a national securities exchange, but may also be traded in the over-the-counter market. Call options written by the Funds are valued at t he then current market quotation, using the ask price as of the close of each day on the principal exchanges on which they are traded. Short-term instruments (those with remaining maturities of 60 days or less) may be valued at amortized cost, which approximates market value.
When market quotations are not readily available, securities may be valued on the basis of prices provided by an independent pricing service. The prices provided by the pricing service are determined with consideration given to institutional bid and last sale prices and take into account securities prices, yields, maturities, call features, ratings, institutional trading in similar groups of securities and developments related to specific securities. If a pricing service cannot provide a valuation, securities will be valued in good faith at fair value using methods consistent with those determined by the Board of Trustees and will be classified as Level 2 or 3 within the fair value hierarchy, depending on the inputs used. Such methods of fair valuation may include, but are not limited to: multiple of earnings, multiple of book value, d iscount from market of a similar freely traded security, purchase price of the security, subsequent private transactions in the security or related securities, or a combination of these and other factors.
Accounting principles generally accepted in the United States (“GAAP”) establish a single authoritative definition of fair value, set out a framework for measuring fair value and require additional disclosures about fair value measurements. Various inputs are used in determining the value of each Fund’s investments. These inputs are summarized in the three broad levels listed below:
• Level 1 – quoted prices in active markets for identical securities
• Level 2 – other significant observable inputs
• Level 3 – significant unobservable inputs
THE FLIPPIN, BRUCE & PORTER FUNDS NOTES TO FINANCIAL STATEMENTS (Continued) |
The inputs or methodology used for valuing securities are not necessarily an indication of the risks associated with investing in those securities. The inputs used to measure fair value may fall into different levels of the fair value hierarchy. In such cases, for disclosure purposes, the level in the fair value hierarchy within which the fair value measurement falls in its entirety is determined based on the lowest level input that is significant to the fair value measurement.
The following is a summary of the inputs used to value each Fund’s investments and other financial instruments as of September 30, 2010 by security type:
| FBP Value Fund | | Level 1 | | | Level 2 | | | Level 3 | | | Total | |
Common Stocks | | $ | 25,354,936 | | | $ | — | | | $ | — | | | $ | 25,354,936 | |
Covered Call Options | | | (210 | ) | | | — | | | | — | | | | (210 | ) |
Money Market Funds | | | 927,691 | | | | — | | | | — | | | | 927,691 | |
Total | | $ | 26,282,417 | | | $ | — | | | $ | — | | | $ | 26,282,417 | |
| FBP Balanced Fund | | Level 1 | | | Level 2 | | | Level 3 | | | Total | |
Common Stocks | | $ | 31,317,806 | | | $ | — | | | $ | — | | | $ | 31,317,806 | |
Preferred Stocks | | | 608,740 | | | | — | | | | — | | | | 608,740 | |
| U.S. Government & Agency Obligations | | | — | | | | 1,505,734 | | | | — | | | | 1,505,734 | |
Corporate Bonds | | | — | | | | 8,716,586 | | | | — | | | | 8,716,586 | |
Covered Call Options | | | (210 | ) | | | — | | | | — | | | | (210 | ) |
Money Market Funds | | | 1,028,306 | | | | — | | | | — | | | | 1,028,306 | |
Total | | $ | 32,954,642 | | | $ | 10,222,320 | | | $ | — | | | $ | 43,176,962 | |
Refer to each Fund’s Schedule of Investments for a listing of the common stocks and corporate bonds valued using Level 1 and Level 2 inputs by sector type. During the six months ended September 30, 2010, the Funds did not have any significant transfers in and out of Level 1 or Level 2. There were no Level 3 securities held by the Funds during the six months ended or as of September 30, 2010.
Share valuation — The net asset value per share of each Fund is calculated daily by dividing the total value of its assets, less liabilities, by the number of shares outstanding. The offering price and redemption price per share of each Fund is equal to its net asset value per share.
Investment income — Interest income is accrued as earned. Dividend income is recorded on the ex-dividend date. Discounts and premiums on fixed income securities purchased are amortized using the interest method.
Repurchase agreements — Each Fund may enter into repurchase agreements. A repurchase agreement, which is collateralized by U.S. Government obligations, is valued at cost which, together with accrued interest, approximates market value. At the time a Fund enters into a repurchase agreement, the Fund takes possession of the underlying securities and the seller agrees that the value of the underlying securities, including accrued interest, will at all times be equal to or exceed the face amount of the repurchase agreement. In addition, the Funds actively monitor and seek additional collateral, as needed. If the seller defaults, the fair value of the collateral may decline and realization of the collateral by the Funds may be delayed or limited.
THE FLIPPIN, BRUCE & PORTER FUNDS NOTES TO FINANCIAL STATEMENTS (Continued) |
Distributions to shareholders — Dividends arising from net investment income are declared and paid quarterly to shareholders of each Fund. Net realized short-term capital gains, if any, may be distributed throughout the year and net realized long-term capital gains, if any, are distributed at least once each year. The amount of distributions from net investment income and net realized gains are determined in accordance with federal income tax regulations, which may differ from GAAP. These “book/tax” differences are either temporary or permanent in nature.
The tax character of distributions paid by each Fund during the periods ended September 30, 2010 and March 31, 2010 is ordinary income.
Security transactions — Security transactions are accounted for on trade date. Gains and losses on securities sold are determined on a specific identification basis.
Common expenses — Common expenses of the Trust are allocated among the funds of the Trust based on relative net assets of each fund or the nature of the services performed and the relative applicability to each fund.
Options transactions — When the Funds’ investment adviser believes that individual portfolio securities held by the Funds are approaching the top of the adviser’s growth and price expectations, the Funds may write covered call options for which premiums are received and are recorded as liabilities, and are subsequently valued daily at the closing prices on their primary exchanges. Premiums received from writing options which expire are treated as realized gains. Premiums received from writing options which are exercised increase the proceeds used to calculate the realized gain or loss on the sale of the security. If a closing purchase transaction is used to terminate a Fund’s obligation on a call option, a gain or loss will be realized, depending upon whether the price of the closing purchase transaction is more or less than the premium previously received on the call option written.
Estimates — The preparation of financial statements in conformity with GAAP requires management to make estimates and assumptions that affect the reported amounts of assets and liabilities and the disclosure of contingent assets and liabilities at the date of the financial statements and the reported amounts of income and expenses during the reporting period. Actual results could differ from those estimates.
Federal income tax — It is each Fund’s policy to comply with the special provisions of Subchapter M of the Internal Revenue Code applicable to regulated investment companies. As provided therein, in any fiscal year in which a Fund so qualifies and distributes at least 90% of its taxable net income, the Fund (but not the shareholders) will be relieved of federal income tax on the income distributed. Accordingly, no provision for income taxes has been made.
In order to avoid imposition of the excise tax applicable to regulated investment companies, it is also each Fund’s intention to declare as dividends in each calendar year at least 98% of its net investment income (earned during the calendar year) and 98% of its net realized capital gains (earned during the twelve months ended October 31) plus undistributed amounts from prior years.
THE FLIPPIN, BRUCE & PORTER FUNDS NOTES TO FINANCIAL STATEMENTS (Continued) |
The following information is computed on a tax basis for each item as of September 30, 2010:
| | | FBP Value Fund | | | FBP Balanced Fund | |
| Cost of portfolio investments and option contracts | | $ | 23,654,706 | | | $ | 37,517,588 | |
Gross unrealized appreciation | | $ | 5,314,868 | | | $ | 8,363,781 | |
Gross unrealized depreciation | | | (2,687,157 | ) | | | (2,704,407 | ) |
Net unrealized appreciation | | | 2,627,711 | | | | 5,659,374 | |
Accumulated ordinary income | | | 1,970 | | | | 33,812 | |
Capital loss carryforwards | | | (4,324,049 | ) | | | (2,309,002 | ) |
Other gains | | | 1,083,201 | | | | 893,956 | |
Other temporary differences | | | (1,322 | ) | | | (19,856 | ) |
Total distributable earnings (deficit) | | $ | (612,489 | ) | | $ | 4,258,284 | |
The difference between the federal income tax cost of portfolio investments and the financial statement cost for FBP Balanced Fund is due to certain differences in the recognition of capital gains and losses under income tax regulations and GAAP. These “book/tax” differences are temporary in nature and are primarily due to differing methods in the amortization of discounts and premiums on fixed income securities.
As of March 31, 2010, the Funds had the following capital loss carryforwards for federal income tax purposes:
| Expires March 31, | | FBP Value Fund | | | FBP Balanced Fund | |
2017 | | $ | 2,475,616 | | | $ | 1,823,332 | |
2018 | | | 1,848,433 | | | | 485,670 | |
| | | $ | 4,324,049 | | | $ | 2,309,002 | |
These capital loss carryforwards may be utilized in the current and future years to offset net realized capital gains, if any, prior to distributing such gains to shareholders.
The Funds recognize the tax benefits or expenses of uncertain tax positions only when the position is “more likely than not” to be sustained assuming examination by tax authorities. Management has reviewed the tax positions taken on federal income tax returns for all open tax years (tax years ended March 31, 2007 through March 31, 2010) of each Fund and has concluded that no provision for unrecognized tax benefits or expenses is required in these financial statements.
2. Investment Transactions
During the six months ended September 30, 2010, cost of purchases and proceeds from sales and maturities of investment securities, other than short-term investments and U.S. government securities, totaled $4,065,844 and $4,390,811, respectively, for FBP Value Fund and $6,502,873 and $5,505,179, respectively, for FBP Balanced Fund.
THE FLIPPIN, BRUCE & PORTER FUNDS NOTES TO FINANCIAL STATEMENTS (Continued) |
3. Transactions with Affiliates
INVESTMENT ADVISORY AGREEMENT
The Funds’ investments are managed by Flippin, Bruce & Porter, Inc. (the “Adviser”) under the terms of an Investment Advisory Agreement. Under the Investment Advisory Agreement, each Fund pays the Adviser a fee, which is computed and accrued daily and paid monthly, at an annual rate of .70% of its average daily net assets up to $250 million; .65% of the next $250 million of such assets; and .50% of such assets in excess of $500 million.
During the six months ended September 30, 2010, the Adviser voluntarily waived $16,920 and $7,110 of its investment advisory fees from FBP Value Fund and FBP Balanced Fund, respectively.
Certain officers of the Trust are also officers of the Adviser.
MUTUAL FUND SERVICES AGREEMENT
Under the terms of a Mutual Fund Services Agreement between the Trust and Ultimus Fund Solutions, LLC (“Ultimus”), Ultimus provides administrative, pricing, accounting, dividend disbursing, shareholder servicing and transfer agent services for the Funds. For these services, Ultimus receives a monthly fee from each Fund at an annual rate of .15% of its average daily net assets up to $25 million, .125% of the next $25 million of such assets, and .10% of such assets in excess of $50 million, subject to a minimum monthly fee of $4,000; plus a shareholder recordkeeping fee at the annual rate of $10 per shareholder account in excess of 1,000 accounts. In addition, each Fund pays out-of-pocket expenses including, but not limited to, postage, supplies and costs of pricing portfolio securities. Certain officers of the Trust are also officers of Ultimus, or of Ultimus Fund Distributors, LLC (the “Distributor”), the principal underwriter of each Fund’s shares. The Distributor is compensated by the Adviser (not the Funds) for acting as principal underwriter.
COMPLIANCE CONSULTING AGREEMENT
Under the terms of a Compliance Consulting Agreement between the Trust and Ultimus, Ultimus provides an individual to serve as the Trust’s Chief Compliance Officer and to administer the Funds’ compliance policies and procedures. For these services, the Funds pay Ultimus an annual base fee of $16,800 plus an asset-based fee equal to 0.01% per annum on the Funds’ aggregate net assets in excess of $100 million. In addition, the Funds reimburse Ultimus for reasonable out-of-pocket expenses, if any, incurred in connection with these services.
THE FLIPPIN, BRUCE & PORTER FUNDS NOTES TO FINANCIAL STATEMENTS (Continued) |
4. Derivatives Transactions
Transactions in option contracts written by the Funds during the six months ended September 30, 2010 were as follows:
| | | FBP Value Fund | | | FBP Balanced Fund | |
| | | Option Contracts | | | Option Premiums | | | Option Contracts | | | Option Premiums | |
| Options outstanding at beginning of period | | | — | | | $ | — | | | | — | | | $ | — | |
Options written | | | 131 | | | | 47,974 | | | | 180 | | | | 67,456 | |
| Options cancelled in a closing purchase transaction | | | (28 | ) | | | (15,315 | ) | | | (80 | ) | | | (36,258 | ) |
Options exercised | | | (33 | ) | | | (16,070 | ) | | | (30 | ) | | | (14,609 | ) |
| Options outstanding at end of period | | | 70 | | | $ | 16,589 | | | | 70 | | | $ | 16,589 | |
The location in the Statements of Assets and Liabilities of FBP Value Fund’s derivative positions is as follows:
| | | | Fair Value | | | Gross Notional Amount Outstanding | |
| Type of Derivative | Location | | Asset Derivatives | | | Liability Derivatives | | | | |
| Covered call options written | Covered call options, at value | | | — | | | $ | (210 | ) | | $ | (315,000 | ) |
The average monthly notional amount of option contracts during the six months ended September 30, 2010 was $633,750 for FBP Value Fund.
The location in the Statements of Assets and Liabilities of FBP Balanced Fund’s derivative positions is as follows:
| | | | Fair Value | | | Gross Notional Amount Outstanding | |
| Type of Derivative | Location | | Asset Derivatives | | | Liability Derivatives | | | | |
| Covered call options written | Covered call options, at value | | | — | | | $ | (210 | ) | | $ | (315,000 | ) |
The average monthly notional amount of option contracts during the six months ended September 30, 2010 was $665,000 for FBP Balanced Fund.
Transactions in derivative instruments during the six months ended September 30, 2010 by FBP Value Fund are recorded in the following location in the Statements of Operations:
| Type of Derivative | Location | | Realized Gains (Losses) | | Location | | Change in Unrealized Gains (Losses) | |
| Covered call options written | Net realized gains from option contracts | | $ | 14,819 | | Net change in unrealized appreciation/depreciation on option contracts | | $ | 16,379 | |
THE FLIPPIN, BRUCE & PORTER FUNDS NOTES TO FINANCIAL STATEMENTS (Continued) |
Transactions in derivative instruments during the six months ended September 30, 2010 by FBP Balanced Fund are recorded in the following location in the Statements of Operations:
| Type of Derivative | Location | | Realized Gains (Losses) | | Location | | Change in Unrealized Gain (Losses) | |
| Covered call options written | Net realized gains from option contracts | | $ | 31,626 | | Net change in unrealized appreciation/depreciation on option contracts | | $ | 16,379 | |
5. Contingencies and Commitments
The Funds indemnify the Trust’s officers and Trustees for certain liabilities that might arise from their performance of their duties to the Funds. Additionally, in the normal course of business the Funds enter into contracts that contain a variety of representations and warranties and which provide general indemnifications. The Funds’ maximum exposure under these arrangements is unknown, as this would involve future claims that may be made against the Funds that have not yet occurred. However, based on experience, the Funds expect the risk of loss to be remote.
6. Subsequent Events
The Funds are required to recognize in the financial statements the effects of all subsequent events that provide additional evidence about conditions that existed as of the date of the Statements of Assets and Liabilities. For non-recognized subsequent events that must be disclosed to keep the financial statements from being misleading, the Funds are required to disclose the nature of the event as well as an estimate of its financial effect, or a statement that such an estimate cannot be made. Management has evaluated subsequent events through the issuance of these financial statements and has noted no such events.
7. Recent Accounting Pronouncement
In January 2010, the Financial Accounting Standards Board (“FASB”) issued Accounting Standards Update (“ASU”) No. 2010-06 “Improving Disclosures about Fair Value Measurements.” ASU No. 2010-06 amends FASB Accounting Standards Codification Topic 820, Fair Value Measurements and Disclosures, to require additional disclosures regarding fair value measurements. Certain disclosures required by ASU No. 2010-06 are effective for interim and annual reporting periods beginning after December 15, 2009 and others for fiscal years beginning after December 15, 2010 and for interim periods within those fiscal years. Management is currently evaluating the impact ASU No. 2010-06 will have on the Funds’ financial statement disclosures.
THE FLIPPIN, BRUCE & PORTER FUNDS ABOUT YOUR FUNDS’ EXPENSES (Unaudited) |
We believe it is important for you to understand the impact of costs on your investment. All mutual funds have operating expenses. As a shareholder of the Funds, you incur ongoing costs, including management fees and other operating expenses. These ongoing costs, which are deducted from each Fund’s gross income, directly reduce the investment return of the Funds.
A mutual fund’s ongoing costs are expressed as a percentage of its average net assets. This figure is known as the expense ratio. The following examples are intended to help you understand the ongoing costs (in dollars) of investing in the Funds and to compare these costs with the ongoing costs of investing in other mutual funds. The examples below are based on an investment of $1,000 made at the beginning of the period shown and held for the entire period (April 1, 2010 through September 30, 2010).
The table below illustrates each Fund’s ongoing costs in two ways:
Actual fund return – This section helps you to estimate the actual expenses that you paid over the period. The “Ending Account Value” shown is derived from each Fund’s actual return, and the third column shows the dollar amount of operating expenses that would have been paid by an investor who started with $1,000 in the Funds. You may use the information here, together with the amount you invested, to estimate the expenses that you paid over the period.
To do so, simply divide your account value by $1,000 (for example, an $8,600 account value divided by $1,000 = 8.6), then multiply the result by the number given for the Funds under the heading “Expenses Paid During Period.”
Hypothetical 5% return – This section is intended to help you compare the Funds’ ongoing costs with those of other mutual funds. It assumes that each Fund had an annual return of 5% before expenses during the period shown, but that the expense ratio is unchanged. In this case, because the returns used are not the Funds’ actual returns, the results do not apply to your investment. The example is useful in making comparisons because the Securities and Exchange Commission (“SEC”) requires all mutual funds to calculate expenses based on a 5% return. You can assess each Fund’s ongoing costs by comparing this hypothetical example with the hypothetical examples that appear in shareholder reports of other funds.
Note that expenses shown in the table are meant to highlight and help you compare ongoing costs only. The Funds do not charge sales loads or redemption fees, nor do they carry a “sales load.”
The calculations assume no shares were bought or sold during the period. Your actual costs may have been higher or lower, depending on the amount of your investment and the timing of any purchases or redemptions.
More information about the Funds’ expenses, including annual expense ratios for the past five fiscal years, can be found in this report. For additional information on operating expenses and other shareholder costs, please refer to the Funds’ prospectus.
FBP Value Fund
| | Beginning Account Value April 1, 2010 | Ending Account Value September 30, 2010 | Expenses Paid During Period* |
| Based on Actual Fund Return | $1,000.00 | $ 940.10 | $5.20 |
| Based on Hypothetical 5% Return (before expenses) | $1,000.00 | $1,019.70 | $5.42 |
| * | Expenses are equal to the FBP Value Fund’s annualized expense ratio of 1.07% for the period, multiplied by the average account value over the period, multiplied by 183/365 (to reflect the one-half year period). |
THE FLIPPIN, BRUCE & PORTER FUNDS ABOUT YOUR FUNDS’ EXPENSES (Unaudited) (Continued) |
FBP Balanced Fund
| | Beginning Account Value April 1, 2010 | Ending Account Value September 30, 2010 | Expenses Paid During Period* |
| Based on Actual Fund Return | $1,000.00 | $ 969.90 | $4.94 |
| Based on Hypothetical 5% Return (before expenses) | $1,000.00 | $1,020.05 | $5.06 |
| * | Expenses are equal to the FBP Balanced Fund’s annualized expense ratio of 1.00% for the period, multiplied by the average account value over the period, multiplied by 183/365 (to reflect the one-half year period). |
OTHER INFORMATION (Unaudited) |
The Trust files a complete listing of portfolio holdings for the Funds with the SEC as of the first and third quarters of each fiscal year on Form N-Q. The filings are available upon request, by calling 1-800-327-9375. Furthermore, you may obtain a copy of these filings on the SEC’s website at http://www.sec.gov. The Trust’s Forms N-Q may also be reviewed and copied at the SEC’s Public Reference Room in Washington, DC, and information on the operation of the Public Reference Room may be obtained by calling 1-800-SEC-0330.
A description of the policies and procedures that the Funds use to determine how to vote proxies relating to portfolio securities is available without charge upon request by calling toll-free 1-800-327-9375, or on the SEC’s website at http://www.sec.gov. Information regarding how the Funds voted proxies relating to portfolio securities during the most recent 12-month period ended June 30 is also available without charge upon request by calling toll-free 1-800-327-9375, or on the SEC’s website at http://www.sec.gov.
This page intentionally left blank.
This page intentionally left blank.
| | | |
|
| | | | | |
Investment Adviser Flippin, Bruce & Porter, Inc. 800 Main Street, Second Floor P.O. Box 6138 Lynchburg, Virginia 24505 Toll-Free 1-800-327-9375 www.fbpinc.com Administrator Ultimus Fund Solutions, LLC P.O. Box 46707 Cincinnati, Ohio 45246-0707 Toll-Free 1-866-738-1127 Custodian US Bank NA 425 Walnut Street Cincinnati, Ohio 45202 Independent Registered Public Accounting Firm Ernst & Young LLP 1900 Scripps Center 312 Walnut Street Cincinnati, Ohio 45202 | Legal Counsel Sullivan & Worcester LLP One Post Office Square Boston, Massachusetts 02109 Officers John T. Bruce, President and Portfolio Manager John M. Flippin, Vice President R. Gregory Porter, III, Vice President John H. Hanna, IV, Vice President David J. Marshall, Vice President Trustees Austin Brockenbrough, III John T. Bruce Charles M. Caravati, Jr. Robert S. Harris J. Finley Lee, Jr. Richard L. Morrill Harris V. Morrissette Samuel B. Witt, III |
| | | |
|
THE GOVERNMENT STREET FUNDS No-Load Mutual Funds Semi-Annual Report September 30, 2010 (Unaudited) |
The Government Street Equity Fund The Government Street Mid-Cap Fund The Alabama Tax Free Bond Fund |
THE GOVERNMENT STREET EQUITY FUND PORTFOLIO INFORMATION September 30, 2010 (Unaudited) |
| Sector Concentration vs. the S&P 500 Index |
| | Security Description | % of Net Assets | |
| | Vanguard Emerging Markets ETF | 3.2% | |
| | Vanguard Mid-Cap ETF | 2.8% | |
| | Philip Morris International, Inc. | 2.7% | |
| | Apple, Inc. | 2.2% | |
| | Caterpillar, Inc. | 2.2% | |
| | Chevron Corporation | 2.1% | |
| | Duke Energy Corporation | 2.0% | |
| | ProShares Credit Suisse 130/30 ETF | 2.0% | |
| | United Technologies Corporation | 2.0% | |
| | International Business Machines Corporation | 1.9% | |
THE GOVERNMENT STREET MID-CAP FUND PORTFOLIO INFORMATION September 30, 2010 (Unaudited) |
| Sector Concentration vs. the S&P MidCap 400 Index |
| | Security Description | % of Net Assets | |
| | iShares Russell 2000 Index Fund | 3.1% | |
| | iShares S&P MidCap 400 Index Fund | 3.0% | |
| | Stericycle, Inc. | 1.8% | |
| | Cognizant Technology Solutions Corporation - Class A | 1.6% | |
| | Cerner Corporation | 1.5% | |
| | Albemarle Corporation | 1.1% | |
| | Fastenal Company | 1.1% | |
| | priceline.com, Inc. | 1.1% | |
| | AMETEK, Inc. | 1.1% | |
| | Rayonier, Inc. | 1.1% | |
THE ALABAMA TAX FREE BOND FUND PORTFOLIO INFORMATION September 30, 2010 (Unaudited) |
Asset Allocation (% of Net Assets) |
| Distribution by Rating |
| Rating | | % Holdings |
| AAA | | 31.1% |
| AA | | 60.9% |
| A | | 4.1% |
| Not Rated | | 3.9% |
GOVERNMENT STREET EQUITY FUND SCHEDULE OF INVESTMENTS September 30, 2010 (Unaudited) | |
| | | | | | |
| Consumer Discretionary — 6.2% | | | | | | |
Darden Restaurants, Inc. | | | 4,000 | | | $ | 171,120 | |
Home Depot, Inc. (The) | | | 17,500 | | | | 554,400 | |
ITT Educational Services, Inc. (a) | | | 1,600 | | | | 112,432 | |
Johnson Controls, Inc. | | | 20,000 | | | | 610,000 | |
McDonald's Corporation | | | 5,500 | | | | 409,805 | |
NIKE, Inc. - Class B | | | 9,000 | | | | 721,260 | |
Walt Disney Company (The) | | | 30,000 | | | | 993,300 | |
| | | | | | | | 3,572,317 | |
| Consumer Staples — 8.7% | | | | | | | | |
Altria Group, Inc. | | | 33,000 | | | | 792,660 | |
Coca-Cola Company (The) | | | 6,000 | | | | 351,120 | |
Kraft Foods, Inc. - Class A | | | 22,836 | | | | 704,719 | |
McCormick & Company, Inc. | | | 7,000 | | | | 294,280 | |
Mead Johnson Nutrition Company | | | 12,000 | | | | 682,920 | |
Philip Morris International, Inc. | | | 28,000 | | | | 1,568,560 | |
Procter & Gamble Company (The) | | | 10,000 | | | | 599,700 | |
| | | | | | | | 4,993,959 | |
| Energy — 8.2% | | | | | | | | |
Apache Corporation | | | 5,089 | | | | 497,501 | |
Chevron Corporation | | | 15,000 | | | | 1,215,750 | |
ConocoPhillips | | | 18,500 | | | | 1,062,455 | |
Ensco plc - ADR | | | 12,000 | | | | 536,760 | |
Murphy Oil Corporation | | | 5,000 | | | | 309,600 | |
Pioneer Natural Resources Company | | | 5,000 | | | | 325,150 | |
Plains Exploration & Production Company (a) | | | 9,000 | | | | 240,030 | |
Southwestern Energy Company (a) | | | 3,000 | | | | 100,320 | |
TransCanada Corporation | | | 11,000 | | | | 408,320 | |
| | | | | | | | 4,695,886 | |
| Financials — 8.7% | | | | | | | | |
Aegon N.V. - ARS (a) | | | 30,900 | | | | 185,091 | |
Aflac, Inc. (b) | | | 20,600 | | | | 1,065,226 | |
American Capital Ltd. (a) | | | 9,990 | | | | 58,042 | |
Berkshire Hathaway, Inc. - Class B (a) | | | 7,500 | | | | 620,100 | |
Brookfield Asset Management, Inc. | | | 19,000 | | | | 539,030 | |
Colonial Properties Trust | | | 65,000 | | | | 1,052,350 | |
Hartford Financial Services Group, Inc. | | | 25,000 | | | | 573,750 | |
U.S. Bancorp | | | 34,000 | | | | 735,080 | |
Willis Group Holdings plc | | | 5,000 | | | | 154,100 | |
| | | | | | | | 4,982,769 | |
| Health Care — 9.8% | | | | | | | | |
Abbott Laboratories | | | 3,000 | | | | 156,720 | |
Alexion Pharmaceuticals, Inc. (a) | | | 8,000 | | | | 514,880 | |
Cardinal Health, Inc. | | | 8,515 | | | | 281,335 | |
CareFusion Corporation (a) | | | 6,000 | | | | 149,040 | |
Cerner Corporation (a) | | | 7,500 | | | | 629,925 | |
GOVERNMENT STREET EQUITY FUND SCHEDULE OF INVESTMENTS (Continued) | |
COMMON STOCKS — 78.8% (Continued) | | | | | | |
| Health Care — 9.8% (Continued) | | | | | | |
Computer Programs & Systems, Inc. | | | 9,100 | | | $ | 387,387 | |
Covidien plc | | | 5,000 | | | | 200,950 | |
Elan Corporation plc - ADR (a) | | | 20,000 | | | | 115,000 | |
| Fresenius Medical Care AG & Company - ADR | | | 5,000 | | | | 308,700 | |
Intuitive Surgical, Inc. (a) | | | 500 | | | | 141,870 | |
Questcor Pharmaceuticals, Inc. (a) | | | 20,000 | | | | 198,400 | |
Shire plc - ADR | | | 7,000 | | | | 470,960 | |
Techne Corporation | | | 10,000 | | | | 617,300 | |
Teva Pharmaceutical Industries Ltd. - ADR | | | 8,000 | | | | 422,000 | |
Waters Corporation (a) | | | 14,000 | | | | 990,920 | |
| | | | | | | | 5,585,387 | |
| Industrials — 11.8% | | | | | | | | |
C.H. Robinson Worldwide, Inc. | | | 3,000 | | | | 209,760 | |
Caterpillar, Inc. | | | 16,000 | | | | 1,258,880 | |
Emerson Electric Company | | | 20,000 | | | | 1,053,200 | |
General Dynamics Corporation | | | 15,000 | | | | 942,150 | |
Ingersoll-Rand plc | | | 13,500 | | | | 482,085 | |
Manitowoc Company, Inc. (The) | | | 14,000 | | | | 169,540 | |
Norfolk Southern Corporation | | | 10,000 | | | | 595,100 | |
Quanta Services, Inc. (a) | | | 20,000 | | | | 381,600 | |
Stericycle, Inc. (a) | | | 8,000 | | | | 555,840 | |
United Technologies Corporation (b) | | | 16,000 | | | | 1,139,680 | |
| | | | | | | | 6,787,835 | |
| Information Technology — 16.5% | | | | | | | | |
Accenture plc - Class A | | | 9,500 | | | | 403,655 | |
Adobe Systems, Inc. (a) | | | 25,000 | | | | 653,750 | |
ADTRAN, Inc. | | | 8,000 | | | | 282,400 | |
Apple, Inc. (a) | | | 4,500 | | | | 1,276,875 | |
Automatic Data Processing, Inc. | | | 20,000 | | | | 840,600 | |
Broadridge Financial Solutions, Inc. | | | 5,000 | | | | 114,350 | |
Cisco Systems, Inc. (a) | | | 23,450 | | | | 513,555 | |
Corning, Inc. | | | 28,000 | | | | 511,840 | |
eBay, Inc. (a) | | | 3,000 | | | | 73,200 | |
Google, Inc. - Class A (a) | | | 400 | | | | 210,316 | |
Hewlett-Packard Company (b) | | | 22,300 | | | | 938,161 | |
| International Business Machines Corporation | | | 8,000 | | | | 1,073,120 | |
Lam Research Corporation (a) | | | 3,000 | | | | 125,550 | |
MasterCard, Inc. - Class A | | | 4,000 | | | | 896,000 | |
NetApp, Inc. (a) | | | 13,000 | | | | 647,270 | |
Oracle Corporation | | | 10,000 | | | | 268,500 | |
Texas Instruments, Inc. | | | 10,000 | | | | 271,400 | |
Tyco Electronics Ltd. | | | 7,000 | | | | 204,540 | |
Varian Semiconductor Equipment Associates, Inc. (a) | | | 3,000 | | | | 86,340 | |
Western Digital Corporation (a) | | | 3,000 | | | | 85,170 | |
| | | | | | | | 9,476,592 | |
GOVERNMENT STREET EQUITY FUND SCHEDULE OF INVESTMENTS (Continued) | |
COMMON STOCKS — 78.8% (Continued) | | | | | | |
| Materials — 4.4% | | | | | | |
Airgas, Inc. | | | 3,000 | | | $ | 203,850 | |
Albemarle Corporation | | | 6,000 | | | | 280,860 | |
Dow Chemical Company (The) | | | 17,000 | | | | 466,820 | |
Freeport-McMoRan Copper & Gold, Inc. | | | 4,966 | | | | 424,047 | |
Nucor Corporation | | | 11,000 | | | | 420,200 | |
Praxair, Inc. | | | 8,000 | | | | 722,080 | |
| | | | | | | | 2,517,857 | |
| Telecommunication Services — 0.3% | | | | | | | | |
| América Móvil S.A.B. de C.V. - Series L - ADR | | | 3,500 | | | | 186,655 | |
| | | | | | | | | |
| Utilities — 4.2% | | | | | | | | |
Duke Energy Corporation | | | 65,980 | | | | 1,168,506 | |
FirstEnergy Corporation | | | 21,000 | | | | 809,340 | |
Wisconsin Energy Corporation | | | 7,000 | | | | 404,600 | |
| | | | | | | | 2,382,446 | |
| | | | | | | | | |
Total Common Stocks (Cost $29,304,120) | | | | | | $ | 45,181,703 | |
| | |
EXCHANGE-TRADED FUNDS — 17.1% | | | | | | |
iShares MSCI BRIC Index Fund | | | 18,000 | | | $ | 859,680 | |
| iShares MSCI Emerging Markets Index Fund | | | 4,600 | | | | 205,942 | |
iShares Russell 2000 Index Fund | | | 14,600 | | | | 985,062 | |
Market Vectors Agribusiness ETF | | | 12,000 | | | | 550,200 | |
Market Vectors Coal ETF | | | 20,000 | | | | 747,800 | |
Market Vectors Gold Miners ETF | | | 10,000 | | | | 559,300 | |
Market Vectors Steel Index ETF | | | 6,000 | | | | 378,060 | |
ProShares Credit Suisse 130/30 ETF | | | 22,000 | | | | 1,140,260 | |
Vanguard Emerging Markets ETF | | | 40,000 | | | | 1,816,000 | |
Vanguard Mid-Cap ETF | | | 24,600 | | | | 1,630,980 | |
Vanguard Small-Cap ETF | | | 15,000 | | | | 951,600 | |
| | | | | | | | | |
Total Exchange-Traded Funds (Cost $7,786,871) | | | | | | $ | 9,824,884 | |
| | |
EXCHANGE-TRADED NOTES — 0.8% | | | | | | |
| JPMorgan Alerian MLP Index ETN (Cost $422,564) | | | 14,000 | | | $ | 472,360 | |
| |
| | | | | | |
U.S. Bank, N.A., discount, 0.10% (c), due 10/01/2010 (Cost $1,806,000) | | $ | 1,806,000 | | | $ | 1,806,000 | |
GOVERNMENT STREET EQUITY FUND SCHEDULE OF INVESTMENTS (Continued) | |
MONEY MARKET FUNDS — 0.0% | | | | | | |
AIM STIT - STIC Prime Portfolio - Institutional Class, 0.15% (d) (Cost $421) | | | 421 | | | $ | 421 | |
| | | | | | | | | |
Total Investments at Value — 99.9% (Cost $39,319,976) | | | | | | $ | 57,285,368 | |
| | | | | | | | | |
| Other Assets in Excess of Liabilities — 0.1% | | | | | | | 40,394 | |
| | | | | | | | | |
Net Assets — 100.0% | | | | | | $ | 57,325,762 | |
| ADR - American Depositary Receipt. |
| |
| ARS - American Registered Shares. |
| |
| (a) | Non-income producing security. |
| | |
| (b) | Security covers a written call option. |
| | |
| (c) | Rate shown is the annualized yield at time of purchase, not a coupon rate. |
| | |
| (d) | Variable rate security. The rate shown is the 7-day effective yield as of September 30, 2010. |
| | |
| See accompanying notes to financial statements. |
GOVERNMENT STREET EQUITY FUND SCHEDULE OF OPEN OPTION CONTRACTS September 30, 2010 (Unaudited) | |
| | | | | | | | | |
| Aflac, Inc., | | | | | | | | | |
11/20/2010 at $60 | | | 56 | | | $ | 1,792 | | | $ | 12,431 | |
| Hewlett Packard Company, | | | | | | | | | | | | |
11/20/2010 at $60 | | | 50 | | | | 150 | | | | 8,249 | |
| United Technologies Corporation, | | | | | | | | | | | | |
11/20/2010 at $80 | | | 60 | | | | 1,140 | | | | 12,659 | |
| | | | | | | $ | 3,082 | | | $ | 33,339 | |
| See accompanying notes to financial statements. |
THE GOVERNMENT STREET MID-CAP FUND SCHEDULE OF INVESTMENTS September 30, 2010 (Unaudited) | |
| | | | | | |
| Consumer Discretionary — 13.5% | | | | | | |
BorgWarner, Inc. (a) | | | 2,550 | | | $ | 134,181 | |
Buffalo Wild Wings, Inc. (a) | | | 2,400 | | | | 114,936 | |
Chico's FAS, Inc. | | | 6,400 | | | | 67,328 | |
Coach, Inc. | | | 5,200 | | | | 223,392 | |
Darden Restaurants, Inc. | | | 2,275 | | | | 97,325 | |
DeVry, Inc. | | | 1,850 | | | | 91,039 | |
Dollar Tree, Inc. (a) | | | 2,100 | | | | 102,396 | |
DreamWorks Animation SKG, Inc. - Class A (a) | | | 4,300 | | | | 137,213 | |
Family Dollar Stores, Inc. | | | 2,800 | | | | 123,648 | |
Gildan Activewear, Inc. - Class A (a) | | | 6,600 | | | | 185,394 | |
Guess?, Inc. | | | 5,675 | | | | 230,575 | |
Hasbro, Inc. | | | 2,525 | | | | 112,388 | |
ITT Educational Services, Inc. (a) | | | 905 | | | | 63,594 | |
Jarden Corporation | | | 5,050 | | | | 157,206 | |
John Wiley & Sons, Inc. - Class A | | | 1,800 | | | | 73,548 | |
Liberty Global, Inc. - Class A (a) | | | 3,825 | | | | 117,848 | |
Netflix, Inc. (a) | | | 1,425 | | | | 231,078 | |
Nordstrom, Inc. | | | 3,900 | | | | 145,080 | |
O'Reilly Automotive, Inc. (a) | | | 5,050 | | | | 268,660 | |
Panera Bread Company - Class A (a) | | | 1,100 | | | | 97,471 | |
PetSmart, Inc. | | | 3,500 | | | | 122,500 | |
Phillips-Van Heusen Corporation | | | 3,400 | | | | 204,544 | |
priceline.com, Inc. (a) | | | 1,030 | | | | 358,790 | |
Ross Stores, Inc. | | | 3,000 | | | | 163,860 | |
Service Corporation International | | | 13,700 | | | | 118,094 | |
Tiffany & Company | | | 3,175 | | | | 149,193 | |
True Religion Apparel, Inc. (a) | | | 7,250 | | | | 154,715 | |
Urban Outfitters, Inc. (a) | | | 5,600 | | | | 176,064 | |
Vail Resorts, Inc. (a) | | | 2,700 | | | | 101,304 | |
VF Corporation | | | 1,175 | | | | 95,199 | |
| | | | | | | | 4,418,563 | |
| Consumer Staples — 3.0% | | | | | | | | |
Church & Dwight Company, Inc. | | | 5,400 | | | | 350,676 | |
Hormel Foods Corporation | | | 6,000 | | | | 267,600 | |
J.M. Smucker Company (The) | | | 4,700 | | | | 284,491 | |
Mead Johnson Nutrition Company | | | 1,000 | | | | 56,910 | |
Tyson Foods, Inc. - Class A | | | 2,000 | | | | 32,040 | |
| | | | | | | | 991,717 | |
| Energy — 7.0% | | | | | | | | |
Cameron International Corporation (a) | | | 6,610 | | | | 283,966 | |
Cimarex Energy Company | | | 2,750 | | | | 181,995 | |
FMC Technologies, Inc. (a) | | | 4,030 | | | | 275,209 | |
Murphy Oil Corporation | | | 3,740 | | | | 231,581 | |
Newfield Exploration Company (a) | | | 2,800 | | | | 160,832 | |
Noble Corporation (a) | | | 5,360 | | | | 181,114 | |
Overseas Shipholding Group, Inc. | | | 3,600 | | | | 123,552 | |
THE GOVERNMENT STREET MID-CAP FUND SCHEDULE OF INVESTMENTS (Continued) | |
COMMON STOCKS — 88.8% (Continued) | | | | | | |
| Energy — 7.0% (Continued) | | | | | | |
Peabody Energy Corporation | | | 4,800 | | | $ | 235,248 | |
Pioneer Natural Resources Company | | | 2,680 | | | | 174,280 | |
Pride International, Inc. (a) | | | 5,000 | | | | 147,150 | |
Schlumberger Ltd. | | | 3,134 | | | | 193,086 | |
Valero Energy Corporation | | | 4,950 | | | | 86,674 | |
| | | | | | | | 2,274,687 | |
| Financials — 14.4% | | | | | | | | |
Alleghany Corporation (a) | | | 750 | | | | 227,272 | |
American Financial Group, Inc. | | | 8,400 | | | | 256,872 | |
Annaly Capital Management, Inc. | | | 8,500 | | | | 149,600 | |
Arch Capital Group Ltd. (a) | | | 2,650 | | | | 222,070 | |
Arthur J. Gallagher & Company | | | 6,750 | | | | 177,997 | |
Axis Capital Holdings Ltd. | | | 5,000 | | | | 164,700 | |
Bank of Hawaii Corporation | | | 6,000 | | | | 269,520 | |
Berkley (W.R.) Corporation | | | 10,050 | | | | 272,054 | |
Cullen/Frost Bankers, Inc. | | | 5,600 | | | | 301,672 | |
Eaton Vance Corporation | | | 10,250 | | | | 297,660 | |
Hudson City Bancorp, Inc. | | | 13,000 | | | | 159,380 | |
IntercontinentalExchange, Inc. (a) | | | 1,850 | | | | 193,732 | |
Jones Lang Lasalle, Inc. | | | 2,800 | | | | 241,556 | |
Legg Mason, Inc. | | | 3,780 | | | | 114,572 | |
Liberty Property Trust | | | 4,600 | | | | 146,740 | |
New York Community Bancorp, Inc. | | | 10,270 | | | | 166,888 | |
Old Republic International Corporation | | | 16,400 | | | | 227,140 | |
Potlatch Corporation | | | 6,941 | | | | 235,994 | |
Rayonier, Inc. | | | 7,000 | | | | 350,840 | |
SEI Investments Company | | | 10,000 | | | | 203,400 | |
Unitrin, Inc. | | | 6,200 | | | | 151,218 | |
Westamerica Bancorporation | | | 3,300 | | | | 179,817 | |
| | | | | | | | 4,710,694 | |
| Health Care — 11.3% | | | | | | | | |
Alexion Pharmaceuticals, Inc. (a) | | | 800 | | | | 51,488 | |
Almost Family, Inc. (a) | | | 1,000 | | | | 29,630 | |
Bio-Rad Laboratories, Inc. - Class A (a) | | | 2,500 | | | | 226,275 | |
C.R. Bard, Inc. | | | 1,000 | | | | 81,430 | |
Cantel Medical Corporation | | | 2,000 | | | | 32,400 | |
Cephalon, Inc. (a) | | | 2,000 | | | | 124,880 | |
Cerner Corporation (a) | | | 6,000 | | | | 503,940 | |
Charles River Laboratories International, Inc. (a) | | | 3,000 | | | | 99,450 | |
Computer Programs & Systems, Inc. | | | 1,800 | | | | 76,626 | |
Covance, Inc. (a) | | | 4,000 | | | | 187,160 | |
Covidien plc | | | 1,500 | | | | 60,285 | |
Edwards Lifesciences Corporation (a) | | | 5,000 | | | | 335,250 | |
Ensign Group, Inc. (The) | | | 3,000 | | | | 53,850 | |
| Fresenius Medical Care AG & Company - ADR | | | 4,000 | | | | 246,960 | |
Gilead Sciences, Inc. (a) | | | 150 | | | | 5,341 | |
Hanger Orthopedic Group, Inc. (a) | | | 4,000 | | | | 58,160 | |
HealthSpring, Inc. (a) | | | 2,500 | | | | 64,600 | |
THE GOVERNMENT STREET MID-CAP FUND SCHEDULE OF INVESTMENTS (Continued) | |
COMMON STOCKS — 88.8% (Continued) | | | | | | |
| Health Care — 11.3% (Continued) | | | | | | |
Henry Schein, Inc. (a) | | | 2,000 | | | $ | 117,160 | |
Illumina, Inc. (a) | | | 1,000 | | | | 49,200 | |
Intuitive Surgical, Inc. (a) | | | 200 | | | | 56,748 | |
Life Technologies Corporation (a) | | | 2,891 | | | | 134,981 | |
Myrexis, Inc. (a) | | | 250 | | | | 965 | |
Myriad Genetics, Inc. (a) | | | 1,000 | | | | 16,410 | |
PSS World Medical, Inc. (a) | | | 2,000 | | | | 42,760 | |
Questcor Pharmaceuticals, Inc. (a) | | | 3,000 | | | | 29,760 | |
ResMed, Inc. (a) | | | 6,000 | | | | 196,860 | |
Shire plc - ADR | | | 1,500 | | | | 100,920 | |
Techne Corporation | | | 4,500 | | | | 277,785 | |
Teleflex, Inc. | | | 3,000 | | | | 170,340 | |
Teva Pharmaceutical Industries Ltd. - ADR | | | 2,163 | | | | 114,098 | |
Waters Corporation (a) | | | 2,000 | | | | 141,560 | |
| | | | | | | | 3,687,272 | |
| Industrials — 14.2% | | | | | | | | |
Alexander & Baldwin, Inc. | | | 3,000 | | | | 104,520 | |
AMETEK, Inc. | | | 7,500 | | | | 358,275 | |
C.H. Robinson Worldwide, Inc. | | | 5,000 | | | | 349,600 | |
Donaldson Company, Inc. | | | 6,000 | | | | 282,780 | |
| Expeditors International of Washington, Inc. | | | 6,000 | | | | 277,380 | |
Fastenal Company | | | 7,000 | | | | 372,330 | |
Goodrich Corporation | | | 3,500 | | | | 258,055 | |
Graco, Inc. | | | 6,000 | | | | 190,380 | |
Harsco Corporation | | | 3,000 | | | | 73,740 | |
Herman Miller, Inc. | | | 5,500 | | | | 108,240 | |
Jacobs Engineering Group, Inc. (a) | | | 4,475 | | | | 173,183 | |
Joy Global, Inc. | | | 2,000 | | | | 140,640 | |
L-3 Communications Holdings, Inc. | | | 3,000 | | | | 216,810 | |
Manpower, Inc. | | | 4,000 | | | | 208,800 | |
| MSC Industrial Direct Company, Inc. - Class A | | | 5,000 | | | | 270,200 | |
Snap-on, Inc. | | | 3,575 | | | | 166,273 | |
SPX Corporation | | | 5,000 | | | | 316,400 | |
Stericycle, Inc. (a) | | | 8,275 | | | | 574,947 | |
Trinity Industries, Inc. | | | 5,000 | | | | 111,350 | |
WESCO International, Inc. (a) | | | 1,850 | | | | 72,686 | |
| | | | | | | | 4,626,589 | |
| Information Technology — 14.7% | | | | | | | | |
Activision Blizzard, Inc. | | | 16,000 | | | | 173,120 | |
ADC Telecommunications, Inc. (a) | | | 8,500 | | | | 107,695 | |
ADTRAN, Inc. | | | 6,000 | | | | 211,800 | |
Advent Software, Inc. (a) | | | 4,000 | | | | 208,760 | |
Alliance Data Systems Corporation (a) | | | 5,000 | | | | 326,300 | |
Arrow Electronics, Inc. (a) | | | 8,000 | | | | 213,840 | |
Aviat Networks, Inc. (a) | | | 1,490 | | | | 6,094 | |
Cognizant Technology Solutions Corporation - Class A (a) | | | 8,000 | | | | 515,760 | |
CommScope, Inc. (a) | | | 1,000 | | | | 23,740 | |
THE GOVERNMENT STREET MID-CAP FUND SCHEDULE OF INVESTMENTS (Continued) | |
COMMON STOCKS — 88.8% (Continued) | | | | | | |
| Information Technology — 14.7% (Continued) | | | | | | |
Cree, Inc. (a) | | | 4,820 | | | $ | 261,678 | |
DST Systems, Inc. | | | 4,000 | | | | 179,360 | |
Harris Corporation | | | 6,000 | | | | 265,740 | |
IAC/InterActiveCorporation (a) | | | 3,000 | | | | 78,810 | |
Integrated Device Technology, Inc. (a) | | | 10,000 | | | | 58,500 | |
Jack Henry & Associates, Inc. | | | 9,000 | | | | 229,500 | |
Lam Research Corporation (a) | | | 6,000 | | | | 251,100 | |
Linear Technology Corporation | | | 5,000 | | | | 153,650 | |
Microchip Technology, Inc. | | | 5,000 | | | | 157,250 | |
National Instruments Corporation | | | 8,000 | | | | 261,280 | |
NetApp, Inc. (a) | | | 5,000 | | | | 248,950 | |
Polycom, Inc. (a) | | | 4,000 | | | | 109,120 | |
Rovi Corporation (a) | | | 6,000 | | | | 302,460 | |
SanDisk Corporation (a) | | | 5,000 | | | | 183,250 | |
Xilinx, Inc. | | | 7,000 | | | | 186,270 | |
Zebra Technologies Corporation - Class A (a) | | | 2,500 | | | | 84,100 | |
| | | | | | | | 4,798,127 | |
| Materials — 5.9% | | | | | | | | |
Airgas, Inc. | | | 4,000 | | | | 271,800 | |
Albemarle Corporation | | | 8,000 | | | | 374,480 | |
Ashland, Inc. | | | 3,000 | | | | 146,310 | |
Cabot Corporation | | | 4,000 | | | | 130,280 | |
Eagle Materials, Inc. | | | 2,500 | | | | 59,250 | |
Martin Marietta Materials, Inc. | | | 2,500 | | | | 192,425 | |
| Scotts Miracle-Gro Company (The) - Class A | | | 4,000 | | | | 206,920 | |
Sonoco Products Company | | | 5,000 | | | | 167,200 | |
Steel Dynamics, Inc. | | | 12,000 | | | | 169,320 | |
Valspar Corporation (The) | | | 7,000 | | | | 222,950 | |
| | | | | | | | 1,940,935 | |
| Telecommunication Services — 0.3% | | | | | | | | |
Syniverse Holdings, Inc. (a) | | | 2,400 | | | | 54,408 | |
Telephone and Data Systems, Inc. | | | 1,000 | | | | 32,800 | |
| | | | | | | | 87,208 | |
| Utilities — 4.5% | | | | | | | | |
AGL Resources, Inc. | | | 8,400 | | | | 322,224 | |
Great Plains Energy, Inc. | | | 9,050 | | | | 171,045 | |
ONEOK, Inc. | | | 5,750 | | | | 258,980 | |
Pepco Holdings, Inc. | | | 7,900 | | | | 146,940 | |
SCANA Corporation | | | 7,530 | | | | 303,610 | |
Vectren Corporation | | | 10,600 | | | | 274,222 | |
| | | | | | | | 1,477,021 | |
| | | | | | | | | |
Total Common Stocks (Cost $21,633,693) | | | | | | $ | 29,012,813 | |
THE GOVERNMENT STREET MID-CAP FUND SCHEDULE OF INVESTMENTS (Continued) | |
EXCHANGE-TRADED FUNDS — 6.6% | | | | | | |
First Trust NYSE Arca Biotechnology Index Fund (a) | | | 4,000 | | | $ | 139,680 | |
iShares Dow Jones U.S. Home Construction Index Fund | | | 3,600 | | | | 43,380 | |
iShares Russell 2000 Index Fund | | | 15,000 | | | | 1,012,050 | |
iShares S&P MidCap 400 Index Fund | | | 12,070 | | | | 966,566 | |
| | | | | | | | | |
Total Exchange-Traded Funds (Cost $1,758,871) | | | | | | $ | 2,161,676 | |
| |
EXCHANGE-TRADED NOTES — 0.7% | | | | | | |
| JPMorgan Alerian MLP Index ETN (Cost $215,754) | | | 7,000 | | | $ | 236,180 | |
| |
| | | | | | |
U.S. Bank, N.A., discount, 0.10% (b), due 10/01/2010 (Cost $1,251,000) | | $ | 1,251,000 | | | $ | 1,251,000 | |
| |
MONEY MARKET FUNDS — 0.0% | | | | | | |
AIM STIT - STIC Prime Portfolio - Institutional Class, 0.15% (c) (Cost $780) | | | 780 | | | $ | 780 | |
| | | | | | | | | |
Total Investments at Value — 100.0%
(Cost $24,860,098) | | | | | | $ | 32,662,449 | |
| | | | | | | | | |
| Other Assets in Excess of Liabilities — 0.0% | | | | | | | 10,327 | |
| | | | | | | | | |
Net Assets — 100.0% | | | | | | $ | 32,672,776 | |
| ADR - American Depositary Receipt. |
| |
| (a) | Non-income producing security. |
| | |
| (b) | Rate shown is the annualized yield at time of purchase, not a coupon rate. |
| | |
| (c) | Variable rate security. The rate shown is the 7-day effective yield as of September 30, 2010. |
| | |
| See accompanying notes to financial statements. |
THE ALABAMA TAX FREE BOND FUND SCHEDULE OF INVESTMENTS September 30, 2010 (Unaudited) | |
ALABAMA FIXED RATE REVENUE AND GENERAL OBLIGATION (GO) BONDS — 96.7% | | | | | | |
| Alabama Drinking Water Financing Auth., Rev., | | | | | | |
4.00%, due 08/15/2014 | | $ | 250,000 | | | $ | 267,545 | |
5.00%, due 08/15/2018 | | | 400,000 | | | | 435,600 | |
| Alabama Special Care Facilities Financing Auth., Birmingham, Rev., | | | | | | | | |
5.375%, due 11/01/2012, ETM | | | 400,000 | | | | 401,536 | |
| Alabama Special Care Facilities Financing Auth., Mobile, Hospital Rev., | | | | | | | | |
4.50%, due 11/01/2010, ETM | | | 250,000 | | | | 250,872 | |
| Alabama State Federal Highway Financing Auth., Rev., | | | | | | | | |
5.00%, due 03/01/2016 | | | 300,000 | | | | 315,711 | |
| Alabama State Public School & College Auth., Capital Improvements, Rev., | | | | | | | | |
5.00%, due 12/01/2011 | | | 350,000 | | | | 368,791 | |
5.00%, due 12/01/2017 | | | 300,000 | | | | 357,024 | |
| Alabama State Public School & College Auth., Capital Improvements, Series A, Rev., | | | | | | | | |
4.00%, due 02/17/2017 | | | 250,000 | | | | 279,705 | |
| Alabama State, GO, | | | | | | | | |
5.00%, due 09/01/2015 | | | 300,000 | | | | 304,023 | |
5.00%, due 09/01/2016 | | | 300,000 | | | | 304,011 | |
5.00%, due 09/01/2017 | | | 300,000 | | | | 328,035 | |
| Alabama Water Pollution Control Auth., Rev., | | | | | | | | |
5.375%, due 08/15/2014 | | | 225,000 | | | | 233,721 | |
| Athens, AL, Electric Rev., Warrants, | | | | | | | | |
3.00%, due 06/01/2011 | | | 500,000 | | | | 507,550 | |
| Athens, AL, GO, Warrants, | | | | | | | | |
4.00%, due 09/01/2018 | | | 300,000 | | | | 334,128 | |
| Auburn University, AL, General Fee Rev., | | | | | | | | |
5.25%, due 06/01/2015 | | | 400,000 | | | | 426,228 | |
| Auburn, AL, GO, Warrants, | | | | | | | | |
5.00%, due 08/01/2012 | | | 225,000 | | | | 243,083 | |
| Auburn, AL, School, Series A, GO, Warrants, | | | | | | | | |
5.00%, due 08/01/2018 | | | 500,000 | | | | 595,415 | |
| Auburn, AL, Waterworks Board, Rev., | | | | | | | | |
5.00%, due 07/01/2015 | | | 335,000 | | | | 350,042 | |
| Baldwin Co., AL, GO, Warrants, | | | | | | | | |
5.00%, due 02/01/2015 | | | 200,000 | | | | 224,770 | |
| Baldwin Co., AL, Series A, GO, Warrants, | | | | | | | | |
5.00%, due 02/01/2017 | | | 320,000 | | | | 378,864 | |
| Calhoun Co., AL, Gas Tax Anticipation, Series A, Rev., Warrants, | | | | | | | | |
4.00%, due 03/01/2016 | | | 445,000 | | | | 490,657 | |
| Calhoun Co., AL, Gas Tax Anticipation, Series B, Rev., Warrants, | | | | | | | | |
2.00%, due 03/01/2011 | | | 365,000 | | | | 366,836 | |
THE ALABAMA TAX FREE BOND FUND SCHEDULE OF INVESTMENTS (Continued) | |
ALABAMA FIXED RATE REVENUE AND GENERAL OBLIGATION (GO) BONDS — 96.7% (Continued) | | | | | | |
| Chelsea, AL, GO, | | | | | | |
4.00%, due 05/01/2015 | | $ | 260,000 | | | $ | 286,164 | |
| Enterprise, AL, GO, School Warrants, | | | | | | | | |
4.00%, due 02/01/2016 | | | 400,000 | | | | 446,408 | |
| Florence, AL, Electric Rev., Warrants, | | | | | | | | |
3.10%, due 06/01/2015 | | | 300,000 | | | | 314,622 | |
3.50%, due 06/01/2017 | | | 515,000 | | | | 545,272 | |
| Foley, AL, GO, Warrants, | | | | | | | | |
4.00%, due 01/01/2015 | | | 315,000 | | | | 348,692 | |
| Foley, AL, Utilities Board, Utilities Rev., | | | | | | | | |
4.00%, due 11/01/2018 | | | 710,000 | | | | 795,413 | |
4.50%, due 11/01/2019 | | | 250,000 | | | | 271,408 | |
| Homewood, AL, GO, Warrants, | | | | | | | | |
5.00%, due 09/01/2014, prerefunded 09/01/2011 @ 101 | | | 500,000 | | | | 526,560 | |
5.00%, due 09/01/2015 | | | 250,000 | | | | 291,900 | |
| Hoover, AL, Special Tax Rev., Warrants, | | | | | | | | |
5.00%, due 02/15/2015 | | | 370,000 | | | | 393,447 | |
| Houston Co., AL, Board of Education, GO, Capital Outlay Warrants, | | | | | | | | |
4.00%, due 12/01/2013 | | | 545,000 | | | | 597,598 | |
| Houston Co., AL, GO, | | | | | | | | |
4.75%, due 10/15/2016 | | | 500,000 | | | | 550,185 | |
| Huntsville, AL, Capital Improvements, Series C, GO, Warrants, | | | | | | | | |
3.25%, due 11/01/2010 | | | 100,000 | | | | 100,258 | |
5.00%, due 11/01/2017 | | | 300,000 | | | | 332,919 | |
| Huntsville, AL, Electric Systems, Rev., | | | | | | | | |
4.00%, due 12/01/2013 | | | 300,000 | | | | 329,289 | |
| Huntsville, AL, GO, | | | | | | | | |
5.00%, due 08/01/2011 | | | 500,000 | | | | 519,565 | |
4.00%, due 09/01/2018 | | | 500,000 | | | | 566,515 | |
5.125%, due 05/01/2020 | | | 300,000 | | | | 328,386 | |
| Jefferson Co., AL, Sewer Rev., | | | | | | | | |
5.00%, due 02/01/2041, prerefunded 02/01/2011 @ 101 | | | 225,000 | | | | 229,948 | |
| Limestone Co., AL, Board of Education, Rev., | | | | | | | | |
4.75%, due 11/01/2010 | | | 250,000 | | | | 250,930 | |
| Limestone Co., AL, GO, Warrants, | | | | | | | | |
4.00%, due 11/01/2018 | | | 200,000 | | | | 224,060 | |
| Macon Co., AL, GO, Warrants, | | | | | | | | |
4.25%, due 10/01/2027, prerefunded 10/01/2017 @ 100 | | | 200,000 | | | | 233,220 | |
| Madison Co., AL, Board of Education, Series B, Rev., Tax Anticipation Warrants, | | | | | | | | |
3.00%, due 09/01/2017 | | | 410,000 | | | | 426,470 | |
THE ALABAMA TAX FREE BOND FUND SCHEDULE OF INVESTMENTS (Continued) | |
ALABAMA FIXED RATE REVENUE AND GENERAL OBLIGATION (GO) BONDS — 96.7% (Continued) | | | | | | |
| Mobile Co., AL, GO, | | | | | | |
5.25%, due 08/01/2015 | | $ | 400,000 | | | $ | 456,768 | |
| Mobile, AL, GO, | | | | | | | | |
4.50%, due 08/01/2013 | | | 100,000 | | | | 110,265 | |
4.75%, due 02/15/2014 | | | 400,000 | | | | 413,188 | |
5.50%, due 08/15/2015, prerefunded 08/15/2011 @ 102 | | | 500,000 | | | | 532,700 | |
5.20%, due 08/15/2018, prerefunded 08/15/2011 @ 102 | | | 725,000 | | | | 770,515 | |
| Mobile, AL, Water & Sewer, Rev., | | | | | | | | |
5.25%, due 01/01/2012 | | | 205,000 | | | | 215,949 | |
5.25%, due 01/01/2014 | | | 300,000 | | | | 317,616 | |
5.25%, due 01/01/2020 | | | 400,000 | | | | 423,488 | |
| Montgomery, AL, GO, | | | | | | | | |
5.00%, due 11/01/2015 | | | 300,000 | | | | 304,224 | |
| Montgomery, AL, Waterworks & Sanitation, Rev., | | | | | | | | |
5.25%, due 09/01/2011 | | | 350,000 | | | | 365,806 | |
5.00%, due 09/01/2017 | | | 250,000 | | | | 297,400 | |
| Mountain Brook, AL, City Board of Education, GO, Capital Outlay Warrants, | | | | | | | | |
4.80%, due 02/15/2011 | | | 405,000 | | | | 406,381 | |
| Oxford, AL, Waterworks & Sewer Board, Rev., | | | | | | | | |
3.00%, due 12/01/2011 | | | 415,000 | | | | 424,321 | |
| Prattville, AL, GO, Warrants, | | | | | | | | |
4.00%, due 09/01/2016 | | | 450,000 | | | | 501,759 | |
| Prattville, AL, Waterworks Board, Rev., | | | | | | | | |
3.00%, due 08/01/2017 | | | 290,000 | | | | 303,273 | |
| Sheffield, AL, Electric Rev., | | | | | | | | |
4.00%, due 07/01/2017 | | | 600,000 | | | | 653,640 | |
| Shelby, AL, Board of Education, Special Tax Warrants, | | | | | | | | |
4.00%, due 02/01/2017 | | | 200,000 | | | | 215,496 | |
| Smiths, AL, Water & Sewer Auth., Rev., | | | | | | | | |
4.00%, due 06/01/2013 | | | 200,000 | | | | 212,930 | |
| St. Clair Co., AL, GO, | | | | | | | | |
4.00%, due 08/01/2013 | | | 145,000 | | | | 158,173 | |
4.00%, due 08/01/2014 | | | 205,000 | | | | 227,587 | |
| Sumter Co., AL, School Rev., Warrants, | | | | | | | | |
4.50%, due 02/01/2031, prerefunded 02/01/2016 @ 100 | | | 500,000 | | | | 580,620 | |
| Trussville, AL, GO, Warrants, | | | | | | | | |
4.30%, due 10/01/2010 | | | 400,000 | | | | 400,044 | |
| Tuscaloosa, AL, GO, Warrants, | | | | | | | | |
4.25%, due 02/15/2011 | | | 145,000 | | | | 147,156 | |
| Tuscaloosa, AL, Public Building Auth., Student Housing Rev., | | | | | | | | |
4.00%, due 07/01/2013 | | | 350,000 | | | | 376,355 | |
THE ALABAMA TAX FREE BOND FUND SCHEDULE OF INVESTMENTS (Continued) | |
ALABAMA FIXED RATE REVENUE AND GENERAL OBLIGATION (GO) BONDS — 96.7% (Continued) | | | | | | |
| University of Alabama, AL, Birmingham, Series A, Hospital Rev., | | | | | | |
5.00%, due 09/01/2011 | | $ | 100,000 | | | $ | 103,579 | |
5.00%, due 09/01/2012 | | | 180,000 | | | | 190,708 | |
| University of Alabama, AL, General Fee Rev., | | | | | | | | |
4.10%, due 12/01/2013 | | | 240,000 | | | | 253,080 | |
| University of Alabama, AL, Series A, Rev., | | | | | | | | |
4.00%, due 10/01/2010 | | | 375,000 | | | | 375,038 | |
3.00%, due 07/01/2016 | | | 340,000 | | | | 364,120 | |
5.00%, due 07/01/2017 | | | 245,000 | | | | 290,692 | |
| Vestavia Hills, AL, Series A, GO, Warrants, | | | | | | | | |
5.00%, due 02/01/2012 | | | 565,000 | | | | 584,679 | |
3.00%, due 02/01/2018 | | | 240,000 | | | | 254,578 | |
| Wetumpka, AL, Waterworks & Sewer, Rev., | | | | | | | | |
4.00%, due 03/01/2018 | | | 320,000 | | | | 341,270 | |
| | | | | | | | | |
Total Alabama Fixed Rate Revenue and General Obligation (GO) Bonds (Cost $27,159,127) | | | | | | $ | 28,246,774 | |
| | |
MONEY MARKET FUNDS — 3.2% | | | | | | |
Alpine Municipal Money Market Fund - Class I, 0.26% (a) (Cost $949,403) | | | 949,403 | | | $ | 949,403 | |
| | | | | | | | | |
Total Investments at Value — 99.9%
(Cost $28,108,530) | | | | | | $ | 29,196,177 | |
| | | | | | | | | |
| Other Assets in Excess of Liabilities — 0.1% | | | | | | | 21,662 | |
| | | | | | | | | |
Net Assets — 100.0% | | | | | | $ | 29,217,839 | |
| ETM - Escrowed to Maturity. |
| |
| (a) | Variable rate security. The rate shown is the 7-day effective yield as of September 30, 2010. |
| | |
| See accompanying notes to financial statements. |
THE GOVERNMENT STREET FUNDS STATEMENTS OF ASSETS AND LIABILITIES September 30, 2010 (Unaudited) | |
| | Government Street Equity Fund | | | Government Street Mid-Cap Fund | | | | |
| ASSETS | | | | | | | | | |
| Investments in securities: | | | | | | | | | |
At acquisition cost | | $ | 39,319,976 | | | $ | 24,860,098 | | | $ | 28,108,530 | |
At value (Note 1) | | $ | 57,285,368 | | | $ | 32,662,449 | | | $ | 29,196,177 | |
Cash | | | 945 | | | | — | | | | — | |
Dividends and interest receivable | | | 76,733 | | | | 26,297 | | | | 260,327 | |
Receivable for capital shares sold | | | 5,250 | | | | 1,670 | | | | — | |
Other assets | | | 13,427 | | | | 10,233 | | | | 8,960 | |
TOTAL ASSETS | | | 57,381,723 | | | | 32,700,649 | | | | 29,465,464 | |
| | | | | | | | | | | | | |
| LIABILITIES | | | | | | | | | | | | |
Written call options, at value (Notes 1 and 4)
(premiums received $33,339) | | | 3,082 | | | | — | | | | — | |
Distributions payable | | | 4,372 | | | | — | | | | 13,832 | |
| Payable for investment securities purchased | | | — | | | | — | | | | 213,190 | |
Payable for capital shares redeemed | | | 10,769 | | | | — | | | | 5,505 | |
| Accrued investment advisory fees (Note 3) | | | 27,586 | | | | 19,495 | | | | 6,493 | |
Payable to Administrator (Note 3) | | | 6,675 | | | | 4,550 | | | | 4,050 | |
Other accrued expenses | | | 3,477 | | | | 3,828 | | | | 4,555 | |
TOTAL LIABILITIES | | | 55,961 | | | | 27,873 | | | | 247,625 | |
| | | | | | | | | | | | | |
NET ASSETS | | $ | 57,325,762 | | | $ | 32,672,776 | | | $ | 29,217,839 | |
| | | | | | | | | | | | | |
| Net assets consist of: | | | | | | | | | | | | |
Paid-in capital | | $ | 39,253,573 | | | $ | 25,199,824 | | | $ | 28,149,095 | |
| Accumulated undistributed net investment income | | | 2,081 | | | | 52,171 | | | | 2,878 | |
Accumulated net realized gains
(losses) from security transactions | | | 74,459 | | | | (381,570 | ) | | | (21,781 | ) |
| Net unrealized appreciation on investments | | | 17,995,649 | | | | 7,802,351 | | | | 1,087,647 | |
| | | | | | | | | | | | | |
Net assets | | $ | 57,325,762 | | | $ | 32,672,776 | | | $ | 29,217,839 | |
| | | | | | | | | | | | | |
Shares of beneficial interest outstanding
(unlimited number of shares authorized,
no par value) | | | 1,408,762 | | | | 2,483,644 | | | | 2,733,507 | |
| | | | | | | | | | | | | |
Net asset value, offering price and
redemption price per share (Note 1) | | $ | 40.69 | | | $ | 13.16 | | | $ | 10.69 | |
| See accompanying notes to financial statements. |
THE GOVERNMENT STREET FUNDS STATEMENTS OF OPERATIONS Six Months Ended September 30, 2010 (Unaudited) | |
| | Government Street Equity Fund | | | Government Street Mid-Cap Fund | | | | |
| INVESTMENT INCOME | | | | | | | | | |
Interest | | $ | 783 | | | $ | 584 | | | $ | 468,304 | |
Dividends | | | 480,296 | | | | 220,975 | | | | 1,280 | |
| Foreign withholding taxes on dividends | | | (2,984 | ) | | | (947 | ) | | | — | |
TOTAL INVESTMENT INCOME | | | 478,095 | | | | 220,612 | | | | 469,584 | |
| | | | | | | | | | | | | |
| EXPENSES | | | | | | | | | | | | |
Investment advisory fees (Note 3) | | | 165,992 | | | | 117,870 | | | | 51,219 | |
Administration fees (Note 3) | | | 36,265 | | | | 24,000 | | | | 21,433 | |
Professional fees | | | 10,559 | | | | 9,134 | | | | 8,409 | |
Trustees’ fees and expenses | | | 6,842 | | | | 6,842 | | | | 6,842 | |
Custodian and bank service fees | | | 5,392 | | | | 4,450 | | | | 2,798 | |
Compliance fees (Note 3) | | | 3,497 | | | | 3,319 | | | | 3,304 | |
Pricing costs | | | 1,093 | | | | 1,778 | | | | 6,056 | |
Printing of shareholder reports | | | 4,098 | | | | 2,186 | | | | 2,115 | |
Account maintenance fees | | | 3,071 | | | | 3,040 | | | | 796 | |
Insurance expense | | | 3,091 | | | | 1,872 | | | | 1,773 | |
Registration fees | | | 2,372 | | | | 2,101 | | | | 1,896 | |
Postage and supplies | | | 2,438 | | | | 1,650 | | | | 1,521 | |
Other expenses | | | 1,574 | | | | 2,598 | | | | 2,664 | |
TOTAL EXPENSES | | | 246,284 | | | | 180,840 | | | | 110,826 | |
Fees waived by the Adviser (Note 3) | | | — | | | | — | | | | (15,706 | ) |
NET EXPENSES | | | 246,284 | | | | 180,840 | | | | 95,120 | |
| | | | | | | | | | | | | |
NET INVESTMENT INCOME | | | 231,811 | | | | 39,772 | | | | 374,464 | |
| | | | | | | | | | | | | |
REALIZED AND UNREALIZED GAINS
(LOSSES) ON INVESTMENTS | | | | | | | | | | | | |
| Net realized gains (losses) from: | | | | | | | | | | | | |
Security transactions | | | 113,436 | | | | 247,673 | | | | 2,988 | |
Option contracts | | | (13,776 | ) | | | — | | | | — | |
Net realized gains from
in-kind redemptions (Note 1) | | | 289,208 | | | | 88,748 | | | | — | |
Net change in unrealized
appreciation (depreciation) on: | | | | | | | | | | | | |
Investments | | | (684,498 | ) | | | 345,387 | | | | 441,069 | |
Option contracts | | | 39,659 | | | | — | | | | — | |
| | | | | | | | | | | | | |
NET REALIZED AND UNREALIZED
GAINS (LOSSES) ON INVESTMENTS | | | (255,971 | ) | | | 681,808 | | | | 444,057 | |
| | | | | | | | | | | | | |
NET INCREASE (DECREASE) IN NET
ASSETS FROM OPERATIONS | | $ | (24,160 | ) | | $ | 721,580 | | | $ | 818,521 | |
| See accompanying notes to financial statements. |
THE GOVERNMENT STREET FUNDS STATEMENTS OF CHANGES IN NET ASSETS | |
| | | Government Street Equity Fund | | | Government Street Mid-Cap Fund | |
| | Six Months Ended September 30, 2010 (Unaudited) | | | | | | Six Months Ended September 30, 2010 (Unaudited) | | | | |
| FROM OPERATIONS | | | | | | | | | | | | |
Net investment income | | $ | 231,811 | | | $ | 566,056 | | | $ | 39,772 | | | $ | 132,379 | |
| Net realized gains (losses) from: | | | | | | | | | | | | | | | | |
Security transactions | | | 113,436 | | | | 148,167 | | | | 247,673 | | | | 34,204 | |
Option contracts | | | (13,776 | ) | | | — | | | | — | | | | — | |
Net realized gains from
in-kind redemptions (Note 1) | | | 289,208 | | | | 1,241,775 | | | | 88,748 | | | | 309,466 | |
Net change in unrealized
appreciation (depreciation) on: | | | | | | | | | | | | | | | | |
Investments | | | (684,498 | ) | | | 18,422,393 | | | | 345,387 | | | | 10,895,821 | |
Option contracts | | | 39,659 | | | | (9,402 | ) | | | — | | | | — | |
Net increase (decrease) in
net assets from operations | | | (24,160 | ) | | | 20,368,989 | | | | 721,580 | | | | 11,371,870 | |
| | | | | | | | | | | | | | | | | |
| DISTRIBUTIONS TO SHAREHOLDERS | | | | | | | | | | | | | | | | |
From net investment income | | | (230,495 | ) | | | (566,303 | ) | | | — | | | | (119,980 | ) |
| | | | | | | | | | | | | | | | | |
| FROM CAPITAL SHARE TRANSACTIONS | | | | | | | | | | | | | | | | |
Proceeds from shares sold | | | 972,655 | | | | 5,064,427 | | | | 480,158 | | | | 1,574,608 | |
Net asset value of shares issued in
reinvestment of distributions
to shareholders | | | 221,296 | | | | 542,448 | | | | — | | | | 112,182 | |
Payments for shares redeemed | | | (1,379,862 | ) | | | (5,299,606 | ) | | | (726,934 | ) | | | (2,262,835 | ) |
Net increase (decrease) in net assets from
capital share transactions | | | (185,911 | ) | | | 307,269 | | | | (246,776 | ) | | | (576,045 | ) |
| | | | | | | | | | | | | | | | | |
TOTAL INCREASE
(DECREASE) IN NET ASSETS | | | (440,566 | ) | | | 20,109,955 | | | | 474,804 | | | | 10,675,845 | |
| | | | | | | | | | | | | | | | | |
| NET ASSETS | | | | | | | | | | | | | | | | |
Beginning of period | | | 57,766,328 | | | | 37,656,373 | | | | 32,197,972 | | | | 21,522,127 | |
End of period | | $ | 57,325,762 | | | $ | 57,766,328 | | | $ | 32,672,776 | | | $ | 32,197,972 | |
| | | | | | | | | | | | | | | | | |
ACCUMULATED UNDISTRIBUTED
NET INVESTMENT INCOME | | $ | 2,081 | | | $ | 765 | | | $ | 52,171 | | | $ | 12,399 | |
| | | | | | | | | | | | | | | | | |
| CAPITAL SHARE ACTIVITY | | | | | | | | | | | | | | | | |
Shares sold | | | 24,504 | | | | 135,218 | | | | 37,941 | | | | 147,313 | |
Shares reinvested | | | 5,769 | | | | 14,817 | | | | — | | | | 9,427 | |
Shares redeemed | | | (34,391 | ) | | | (146,410 | ) | | | (56,131 | ) | | | (199,510 | ) |
Net increase (decrease) in
shares outstanding | | | (4,118 | ) | | | 3,625 | | | | (18,190 | ) | | | (42,770 | ) |
| Shares outstanding, beginning of period | | | 1,412,880 | | | | 1,409,255 | | | | 2,501,834 | | | | 2,544,604 | |
| Shares outstanding, end of period | | | 1,408,762 | | | | 1,412,880 | | | | 2,483,644 | | | | 2,501,834 | |
| See accompanying notes to financial statements. |
THE GOVERNMENT STREET FUNDS STATEMENTS OF CHANGES IN NET ASSETS | |
| | | Alabama Tax Free Bond Fund | |
| | Six Months Ended September 30, 2010 (Unaudited) | | | | |
| FROM OPERATIONS | | | | | | |
| Net investment income | | $ | 374,464 | | | $ | 853,644 | |
| Net realized gains from security transactions | | | 2,988 | | | | 51,774 | |
| Net change in unrealized appreciation (depreciation) on investments | | | 441,069 | | | | (64,236 | ) |
| Net increase in net assets from operations | | | 818,521 | | | | 841,182 | |
| | | | | | | | | |
| DISTRIBUTIONS TO SHAREHOLDERS | | | | | | | | |
| From net investment income | | | (378,866 | ) | | | (850,484 | ) |
| From realized capital gains on security transactions | | | — | | | | (29,128 | ) |
| Decrease in net assets from distributions to shareholders | | | (378,866 | ) | | | (879,612 | ) |
| | | | | | | | | |
| FROM CAPITAL SHARE TRANSACTIONS | | | | | | | | |
| Proceeds from shares sold | | | 2,087,608 | | | | 5,264,512 | |
Net asset value of shares issued in reinvestment
of distributions to shareholders | | | 276,055 | | | | 598,837 | |
| Payments for shares redeemed | | | (3,301,745 | ) | | | (4,466,191 | ) |
| Net increase (decrease) in net assets from capital share transactions | | | (938,082 | ) | | | 1,397,158 | |
| | | | | | | | | |
| TOTAL INCREASE (DECREASE) IN NET ASSETS | | | (498,427 | ) | | | 1,358,728 | |
| | | | | | | | | |
| NET ASSETS | | | | | | | | |
| Beginning of period | | | 29,716,266 | | | | 28,357,538 | |
| End of period | | $ | 29,217,839 | | | $ | 29,716,266 | |
| | | | | | | | | |
| ACCUMULATED UNDISTRIBUTED NET INVESTMENT INCOME | | $ | 2,878 | | | $ | 7,280 | |
| | | | | | | | | |
| CAPITAL SHARE ACTIVITY | | | | | | | | |
| Shares sold | | | 197,045 | | | | 498,641 | |
| Shares reinvested | | | 25,959 | | | | 56,622 | |
| Shares redeemed | | | (311,723 | ) | | | (422,233 | ) |
| Net increase (decrease) in shares outstanding | | | (88,719 | ) | | | 133,030 | |
| Shares outstanding, beginning of period | | | 2,822,226 | | | | 2,689,196 | |
| Shares outstanding, end of period | | | 2,733,507 | | | | 2,822,226 | |
| See accompanying notes to financial statements. |
THE GOVERNMENT STREET EQUITY FUND FINANCIAL HIGHLIGHTS | |
Selected Per Share Data and Ratios for a Share Outstanding Throughout Each Period | |
| | | Six Months Ended September 30, 2010 (Unaudited) | | | | |
| | | 2010 | | | | 2009 | | | | 2008 | | | | 2007 | | | | 2006 | |
| Net asset value at beginning of period | | $ | 40.89 | | | $ | 26.72 | | | $ | 44.76 | | | $ | 48.37 | | | $ | 52.42 | | | $ | 47.11 | |
| | | | | | | | | | | | | | | | | | | | | | | | | |
Income (loss) from
investment operations: | | | | | | | | | | | | | | | | | | | | | | | | |
Net investment income | | | 0.16 | | | | 0.40 | | | | 0.55 | | | | 0.57 | | | | 0.48 | | | | 0.50 | |
Net realized and unrealized gains
(losses) on investments | | | (0.20 | ) | | | 14.17 | | | | (18.07 | ) | | | (2.12 | ) | | | 2.90 | | | | 5.31 | |
| Total from investment operations | | | (0.04 | ) | | | 14.57 | | | | (17.52 | ) | | | (1.55 | ) | | | 3.38 | | | | 5.81 | |
| | | | | | | | | | | | | | | | | | | | | | | | | |
| Less distributions: | | | | | | | | | | | | | | | | | | | | | | | | |
Dividends from net
investment income | | | (0.16 | ) | | | (0.40 | ) | | | (0.52 | ) | | | (0.57 | ) | | | (0.48 | ) | | | (0.50 | ) |
Distributions from
net realized gains | | | — | | | | — | | | | — | | | | (1.31 | ) | | | (6.95 | ) | | | — | |
Return of capital | | | — | | | | — | | | | — | | | | (0.18 | ) | | | — | | | | — | |
Total distributions | | | (0.16 | ) | | | (0.40 | ) | | | (0.52 | ) | | | (2.06 | ) | | | (7.43 | ) | | | (0.50 | ) |
| | | | | | | | | | | | | | | | | | | | | | | | | |
| Net asset value at end of period | | $ | 40.69 | | | $ | 40.89 | | | $ | 26.72 | | | $ | 44.76 | | | $ | 48.37 | | | $ | 52.42 | |
| | | | | | | | | | | | | | | | | | | | | | | | | |
Total return (a) | | | (0.06% | )(b) | | | 54.71% | | | | (39.43% | ) | | | (3.51% | ) | | | 7.04% | | | | 12.39% | |
| | | | | | | | | | | | | | | | | | | | | | | | | |
| Net assets at end of period (000’s) | | $ | 57,326 | | | $ | 57,766 | | | $ | 37,656 | | | $ | 67,267 | | | $ | 87,757 | | | $ | 107,243 | |
| | | | | | | | | | | | | | | | | | | | | | | | | |
Ratio of expenses to
average net assets | | | 0.89% | (c) | | | 0.90% | | | | 0.91% | | | | 0.84% | | | | 0.84% | | | | 0.78% | |
| | | | | | | | | | | | | | | | | | | | | | | | | |
Ratio of net investment income
to average net assets | | | 0.84% | (c) | | | 1.14% | | | | 1.47% | | | | 1.12% | | | | 0.96% | | | | 0.95% | |
| | | | | | | | | | | | | | | | | | | | | | | | | |
Portfolio turnover rate | | | 22% | (b) | | | 30% | | | | 35% | | | | 12% | | | | 15% | | | | 17% | |
| (a) | Total return is a measure of the change in value of an investment in the Fund over the period covered, which assumes any dividends or capital gains distributions are reinvested in shares of the Fund. Returns do not reflect the deduction of taxes a shareholder would pay on Fund distributions or the redemption of Fund shares. |
| | |
| (b) | Not annualized. |
| | |
| (c) | Annualized. |
| | |
| See accompanying notes to financial statements. |
THE GOVERNMENT STREET MID-CAP FUND FINANCIAL HIGHLIGHTS | |
Selected Per Share Data and Ratios for a Share Outstanding Throughout Each Period | |
| | | Six Months Ended September 30, 2010 (Unaudited) | | | | |
| | | 2010 | | | | 2009 | | | | 2008 | | | | 2007 | | | | 2006 | |
| Net asset value at beginning of period | | $ | 12.87 | | | $ | 8.46 | | | $ | 12.28 | | | $ | 13.13 | | | $ | 13.71 | | | $ | 11.30 | |
| | | | | | | | | | | | | | | | | | | | | | | | | |
Income (loss) from
investment operations: | | | | | | | | | | | | | | | | | | | | | | | | |
Net investment income | | | 0.02 | | | | 0.05 | | | | 0.05 | | | | 0.03 | | | | 0.04 | | | | 0.05 | |
Net realized and unrealized gains
(losses) on investments | | | 0.27 | | | | 4.41 | | | | (3.82 | ) | | | (0.53 | ) | | | 0.45 | | | | 2.38 | |
| Total from investment operations | | | 0.29 | | | | 4.46 | | | | (3.77 | ) | | | (0.50 | ) | | | 0.49 | | | | 2.43 | |
| | | | | | | | | | | | | | | | | | | | | | | | | |
| Less distributions: | | | | | | | | | | | | | | | | | | | | | | | | |
Dividends from net
investment income | | | — | | | | (0.05 | ) | | | (0.05 | ) | | | (0.05 | ) | | | (0.05 | ) | | | (0.02 | ) |
| In excess of net investment income | | | — | | | | — | | | | (0.00 | )(a) | | | — | | | | — | | | | — | |
Distributions from net
realized gains | | | — | | | | — | | | | (0.00 | )(a) | | | (0.30 | ) | | | (1.02 | ) | | | — | |
Total distributions | | | — | | | | (0.05 | ) | | | (0.05 | ) | | | (0.35 | ) | | | (1.07 | ) | | | (0.02 | ) |
| | | | | | | | | | | | | | | | | | | | | | | | | |
| Net asset value at end of period | | $ | 13.16 | | | $ | 12.87 | | | $ | 8.46 | | | $ | 12.28 | | | $ | 13.13 | | | $ | 13.71 | |
| | | | | | | | | | | | | | | | | | | | | | | | | |
Total return (b) | | | 2.25% | (c) | | | 52.73% | | | | (30.65% | ) | | | (3.99% | ) | | | 3.83% | | | | 21.51% | |
| | | | | | | | | | | | | | | | | | | | | | | | | |
| Net assets at end of period (000’s) | | $ | 32,673 | | | $ | 32,198 | | | $ | 21,522 | | | $ | 31,424 | | | $ | 33,961 | | | $ | 37,619 | |
| | | | | | | | | | | | | | | | | | | | | | | | | |
Ratio of net expenses to
average net assets | | | 1.15% | (d) | | | 1.13% | (e) | | | 1.10% | (e) | | | 1.10% | (e) | | | 1.10% | (e) | | | 1.10% | (e) |
| | | | | | | | | | | | | | | | | | | | | | | | | |
Ratio of net investment income
to average net assets | | | 0.25% | (d) | | | 0.47% | | | | 0.47% | | | | 0.25% | | | | 0.26% | | | | 0.37% | |
| | | | | | | | | | | | | | | | | | | | | | | | | |
Portfolio turnover rate | | | 14% | (c) | | | 10% | | | | 14% | | | | 11% | | | | 11% | | | | 28% | |
| (a) | Amount rounds to less than $0.01 per share. |
| | |
| (b) | Total return is a measure of the change in value of an investment in the Fund over the period covered, which assumes any dividends or capital gains distributions are reinvested in shares of the Fund. Returns do not reflect the deduction of taxes a shareholder would pay on Fund distributions or the redemption of Fund shares. |
| | |
| (c) | Not annualized. |
| | |
| (d) | Annualized. |
| | |
| (e) | Absent investment advisory fees voluntarily waived by the Adviser, the ratios of expenses to average net assets would have been 1.18%, 1.23%, 1.12%, 1.12% and 1.11% for the years ended March 31, 2010, 2009, 2008, 2007 and 2006, respectively (Note 3). |
| | |
| See accompanying notes to financial statements. |
THE ALABAMA TAX FREE BOND FUND FINANCIAL HIGHLIGHTS | |
Selected Per Share Data and Ratios for a Share Outstanding Throughout Each Period | |
| | | Six Months Ended September 30, 2010 (Unaudited) | | | | |
| | | 2010 | | | | 2009 | | | | 2008 | | | | 2007 | | | | 2006 | |
| Net asset value at beginning of period | | $ | 10.53 | | | $ | 10.54 | | | $ | 10.50 | | | $ | 10.39 | | | $ | 10.40 | | | $ | 10.55 | |
| | | | | | | | | | | | | | | | | | | | | | | | | |
Income (loss) from
investment operations: | | | | | | | | | | | | | | | | | | | | | | | | |
Net investment income | | | 0.14 | | | | 0.28 | | | | 0.35 | | | | 0.36 | | | | 0.36 | | | | 0.34 | |
Net realized and unrealized gains
(losses) on investments | | | 0.16 | | | | (0.00 | )(a) | | | 0.04 | | | | 0.12 | | | | (0.01 | ) | | | (0.15 | ) |
| Total from investment operations | | | 0.30 | | | | 0.28 | | | | 0.39 | | | | 0.48 | | | | 0.35 | | | | 0.19 | |
| | | | | | | | | | | | | | | | | | | | | | | | | |
| Less distributions: | | | | | | | | | | | | | | | | | | | | | | | | |
Dividends from net
investment income | | | (0.14 | ) | | | (0.28 | ) | | | (0.35 | ) | | | (0.36 | ) | | | (0.36 | ) | | | (0.34 | ) |
Distributions from net
realized gains | | | — | | | | (0.01 | ) | | | (0.00 | )(a) | | | (0.01 | ) | | | — | | | | — | |
Total distributions | | | (0.14 | ) | | | (0.29 | ) | | | (0.35 | ) | | | (0.37 | ) | | | (0.36 | ) | | | (0.34 | ) |
| | | | | | | | | | | | | | | | | | | | | | | | | |
| Net asset value at end of period | | $ | 10.69 | | | $ | 10.53 | | | $ | 10.54 | | | $ | 10.50 | | | $ | 10.39 | | | $ | 10.40 | |
| | | | | | | | | | | | | | | | | | | | | | | | | |
Total return (b) | | | 2.84% | (c) | | | 2.88% | | | | 3.80% | | | | 4.66% | | | | 3.38% | | | | 1.80% | |
| | | | | | | | | | | | | | | | | | | | | | | | | |
| Net assets at end of period (000’s) | | $ | 29,218 | | | $ | 29,716 | | | $ | 28,358 | | | $ | 25,426 | | | $ | 25,968 | | | $ | 26,182 | |
| | | | | | | | | | | | | | | | | | | | | | | | | |
Ratio of net expenses to
average net assets (e) | | | 0.65% | (d) | | | 0.65% | | | | 0.65% | | | | 0.65% | | | | 0.65% | | | | 0.65% | |
| | | | | | | | | | | | | | | | | | | | | | | | | |
Ratio of net investment income
to average net assets | | | 2.56% | (d) | | | 2.85% | | | | 3.36% | | | | 3.46% | | | | 3.44% | | | | 3.25% | |
| | | | | | | | | | | | | | | | | | | | | | | | | |
Portfolio turnover rate | | | 10% | (c) | | | 32% | | | | 8% | | | | 6% | | | | 15% | | | | 5% | |
| (a) | Amount rounds to less than $0.01 per share. |
| | |
| (b) | Total return is a measure of the change in value of an investment in the Fund over the period covered, which assumes any dividends or capital gains distributions are reinvested in shares of the Fund. Returns do not reflect the deduction of taxes a shareholder would pay on Fund distributions or the redemption of Fund shares. |
| | |
| (c) | Not annualized. |
| | |
| (d) | Annualized. |
| | |
| (e) | Absent investment advisory fees voluntarily waived by the Adviser, the ratios of expenses to average net assets would have been 0.76%(d) for the six months ended September 30, 2010 and 0.75%, 0.79%, 0.78%, 0.76% and 0.73% for the years ended March 31, 2010, 2009, 2008, 2007 and 2006, respectively (Note 3). |
| | |
| See accompanying notes to financial statements. |
THE GOVERNMENT STREET FUNDS NOTES TO FINANCIAL STATEMENTS September 30, 2010 (Unaudited) |
1. Organization and Significant Accounting Policies
The Government Street Equity Fund, The Government Street Mid-Cap Fund and The Alabama Tax Free Bond Fund (the “Funds”) are each a no-load series of the Williamsburg Investment Trust (the “Trust”), an open-end management investment company registered under the Investment Company Act of 1940. The Trust was organized as a Massachusetts business trust on July 18, 1988. Other series of the Trust are not included in this report.
The Government Street Equity Fund’s investment objective is to seek capital appreciation.
The Government Street Mid-Cap Fund’s investment objective is to seek capital appreciation.
The Alabama Tax Free Bond Fund’s investment objectives are to provide current income exempt from federal income taxes and from the personal income taxes of Alabama and to preserve capital.
The following is a summary of the Funds’ significant accounting policies:
Securities valuation — The Funds’ portfolio securities are valued as of the close of business of the regular session of the New York Stock Exchange (normally 4:00 p.m., Eastern time). Securities traded on a national stock exchange are valued based upon the closing price on the principal exchange where the security is traded. Securities which are quoted by NASDAQ are valued at the NASDAQ Official Closing Price. Securities which are traded over-the-counter are valued at the last sales price, if available, otherwise, at the last quoted bid price. It is expected that fixed income securities will ordinarily be traded in the over-the-counter market, and common stocks will ordinarily be traded on a national securities exchange, but may also be traded in the over-the-counter market. Call options written by the Funds are valued at t he then current market quotation, using the ask price as of the close of each day on the principal exchanges on which they are traded.
When market quotations are not readily available, securities may be valued on the basis of prices provided by an independent pricing service. The prices provided by the pricing service are determined with consideration given to institutional bid and last sale prices and take into account securities prices, yields, maturities, call features, ratings, institutional trading in similar groups of securities and developments related to specific securities. If a pricing service cannot provide a valuation, securities will be valued in good faith at fair value using procedures established by and under the general supervision of the Board of Trustees and will be classified as Level 2 or 3 within the fair value hierarchy, depending on the inputs used. Such methods of fair valuation may include, but are not limited to: multiple of earnings, multip le of book value, discount from market of a similar freely traded security, purchase price of the security, subsequent private transactions in the security or related securities, or a combination of these and other factors. Short-term instruments (those with
THE GOVERNMENT STREET FUNDS NOTES TO FINANCIAL STATEMENTS (Continued) |
remaining maturities of 60 days or less) may be valued at amortized cost, which approximates market value.
Accounting principles generally accepted in the United States (“GAAP”) establish a single authoritative definition of fair value, set out a framework for measuring fair value and require additional disclosures about fair value measurements.
Various inputs are used in determining the value of each of the Fund’s investments. These inputs are summarized in the three broad levels listed below:
• Level 1 – quoted prices in active markets for identical securities
• Level 2 – other significant observable inputs
• Level 3 – significant unobservable inputs
The inputs or methodology used for valuing securities are not necessarily an indication of the risks associated with investing in those securities. The inputs used to measure fair value may fall into different levels of the fair value hierarchy. In such cases, for disclosure purposes, the level in the fair value hierarchy within which the fair value measurement falls in its entirety is determined based on the lowest level input that is significant to the fair value measurement.
The following is a summary of the inputs used to value each Fund’s investments as of September 30, 2010 by security type:
The Government Street Equity Fund: | | | | | | | | | | | | |
Common Stocks | | $ | 45,181,703 | | | $ | — | | | $ | — | | | $ | 45,181,703 | |
Exchange-Traded Funds | | | 9,824,884 | | | | — | | | | — | | | | 9,824,884 | |
Exchange-Traded Notes | | | 472,360 | | | | — | | | | — | | | | 472,360 | |
Commercial Paper | | | — | | | | 1,806,000 | | | | — | | | | 1,806,000 | |
Money Market Funds | | | 421 | | | | — | | | | — | | | | 421 | |
Written Call Option Contracts | | | (3,082 | ) | | | — | | | | — | | | | (3,082 | ) |
Total | | $ | 55,476,286 | | | $ | 1,806,000 | | | $ | — | | | $ | 57,282,286 | |
The Government Street Mid-Cap Fund: | | | | | | | | | | | | |
Common Stocks | | $ | 29,012,813 | | | $ | — | | | $ | — | | | $ | 29,012,813 | |
Exchange-Traded Funds | | | 2,161,676 | | | | — | | | | — | | | | 2,161,676 | |
Exchange-Traded Notes | | | 236,180 | | | | — | | | | — | | | | 236,180 | |
Commercial Paper | | | — | | | | 1,251,000 | | | | — | | | | 1,251,000 | |
Money Market Funds | | | 780 | | | | — | | | | — | | | | 780 | |
Total | | $ | 31,411,449 | | | $ | 1,251,000 | | | $ | — | | | $ | 32,662,449 | |
The Alabama Tax Free Bond Fund: | | | | | | | | | | | | |
| Alabama Fixed Rate Revenue and General Obligation Bonds | | $ | — | | | $ | 28,246,774 | | | $ | — | | | $ | 28,246,774 | |
Money Market Funds | | | 949,403 | | | | — | | | | — | | | | 949,403 | |
Total | | $ | 949,403 | | | $ | 28,246,774 | | | $ | — | | | $ | 29,196,177 | |
THE GOVERNMENT STREET FUNDS NOTES TO FINANCIAL STATEMENTS (Continued) |
Refer to The Government Street Equity Fund’s and The Government Street Mid-Cap Fund’s Schedule of Investments for a listing of the common stocks valued using Level 1 inputs by sector type. During the six months ended September 30, 2010, the Funds did not have any significant transfers in and out of Level 1 or Level 2. There were no Level 3 securities held by the Funds or derivative instruments held by The Government Street Mid-Cap Fund or The Alabama Tax-Free Bond Fund during the six months ended or as of September 30, 2010.
Share valuation — The net asset value per share of each Fund is calculated daily by dividing the total value of each Fund’s assets, less liabilities, by the number of shares outstanding. The offering price and redemption price per share of each Fund is equal to the net asset value per share.
Investment income — Interest income is accrued as earned. Dividend income is recorded on the ex-dividend date. Discounts and premiums on fixed-income securities purchased are amortized using the interest method.
Repurchase agreements — The Funds may enter into repurchase agreements. A repurchase agreement, which is collateralized by U.S. Government obligations, is valued at cost which, together with accrued interest, approximates market value. At the time a Fund enters into a repurchase agreement, the seller agrees that the value of the underlying securities, including accrued interest, will at all times be equal to or exceed the face amount of the repurchase agreement. In addition, the Funds actively monitor and seek additional collateral, as needed. If the seller defaults, the fair value of the collateral may decline and realization of the collateral by the Funds may be delayed or limited. The Funds did not enter into any repurchase agreements during the six months ended September 30, 2010.
Distributions to shareholders — Dividends arising from net investment income are declared and paid quarterly to shareholders of The Government Street Equity Fund; declared and paid annually to shareholders of The Government Street Mid-Cap Fund; and declared daily and paid monthly to shareholders of The Alabama Tax Free Bond Fund. Net realized short-term capital gains, if any, may be distributed throughout the year and net realized long-term capital gains, if any, are distributed at least once each year. The amount of distributions from net investment income and net realized gains are determined in accordance with federal income tax regulations, which may differ from GAAP. These “book/tax” differences are either temporary or permanent in nature.
The tax character of distributions paid during the periods ended September 30, 2010 and March 31, 2010 is as follows:
THE GOVERNMENT STREET FUNDS NOTES TO FINANCIAL STATEMENTS (Continued) |
| | | | | | | Exempt- Interest Dividends | | | | | | | |
| The Government Street Equity Fund | 9/30/10 | | $ | 230,495 | | | $ | — | | | $ | — | | | $ | 230,495 | |
| | 3/31/10 | | $ | 566,303 | | | $ | — | | | $ | — | | | $ | 566,303 | |
| The Government Street Mid-Cap Fund | 9/30/10 | | $ | — | | | $ | — | | | $ | — | | | $ | — | |
| | 3/31/10 | | $ | 119,980 | | | $ | — | | | $ | — | | | $ | 119,980 | |
| The Alabama Tax Free Bond Fund | 9/30/10 | | $ | — | | | $ | 378,866 | | | $ | — | | | $ | 378,866 | |
| | 3/31/10 | | $ | 27,129 | | | $ | 850,484 | | | $ | 1,999 | | | $ | 879,612 | |
Security transactions — Security transactions are accounted for on trade date. Gains and losses on securities sold are determined on a specific identification basis.
Common expenses — Common expenses of the Trust are allocated among the series of the Trust based on relative net assets of each series or the nature of the services performed and the relative applicability to each series.
Options transactions — With the intent of increasing the total returns of the investment portfolios of The Government Street Equity Fund and The Government Street Mid-Cap Fund, the Funds may write covered call options, primarily against highly appreciated, low basis securities to increase income. When the Funds write a covered call option contract, premiums are received and are recorded as liabilities, and are subsequently valued daily at the closing prices on their primary exchanges. Premiums received from writing options which expire are treated as realized gains. Premiums received from writing options which are exercised increase the proceeds used to calculate the realized gain or loss on the sale of the security. If a closing purchase transaction is used to terminate a Fund’s obligation on a written call option contract , a gain or loss will be realized, depending upon whether the price of the closing purchase transaction is more or less than the premium previously received on the call option written.
Estimates — The preparation of financial statements in conformity with GAAP requires management to make estimates and assumptions that affect the reported amounts of assets and liabilities and the disclosure of contingent assets and liabilities as of the date of the financial statements and the reported amounts of income and expenses during the reporting period. Actual results could differ from those estimates.
Federal income tax — It is each Fund’s policy to comply with the special provisions of Subchapter M of the Internal Revenue Code applicable to regulated investment companies. As provided therein, in any fiscal year in which a Fund so qualifies, and distributes at least 90% of its taxable net income, the Fund (but not the shareholders) will be relieved of federal income tax on the income distributed. Accordingly, no provision for income taxes has been made.
In order to avoid imposition of the excise tax applicable to regulated investment companies, it is also each Fund’s intention to declare as dividends in each calendar
THE GOVERNMENT STREET FUNDS NOTES TO FINANCIAL STATEMENTS (Continued) |
year at least 98% of its net investment income (earned during the calendar year) and 98% of its net realized capital gains (earned during the twelve months ended October 31) plus undistributed amounts from prior years.
The following information is computed on a tax basis for each item as of September 30, 2010:
| | Government Street Equity Fund | | | Government Street Mid-Cap Fund | | | | |
Cost of portfolio investments and written call options | | $ | 39,286,637 | | | $ | 24,860,098 | | | $ | 28,130,313 | |
Gross unrealized appreciation | | $ | 19,424,067 | | | $ | 8,935,192 | | | $ | 1,090,884 | |
Gross unrealized depreciation | | | (1,428,418 | ) | | | (1,132,841 | ) | | | (25,020 | ) |
Net unrealized appreciation | | | 17,995,649 | | | | 7,802,351 | | | | 1,065,864 | |
Undistributed ordinary income | | | 6,453 | | | | 52,171 | | | | 1,634 | |
Undistributed tax exempt income | | | — | | | | — | | | | 13,832 | |
Undistributed long-term gains | | | 114,658 | | | | — | | | | — | |
Capital loss carryforward | | | — | | | | (629,243 | ) | | | (1,742 | ) |
Other gains (losses) | | | (40,199 | ) | | | 247,673 | | | | 2,988 | |
Other temporary differences | | | (4,372 | ) | | | — | | | | (13,832 | ) |
Total distributable earnings | | $ | 18,072,189 | | | $ | 7,472,952 | | | $ | 1,068,744 | |
The difference between the federal income tax cost of portfolio investments and the financial statement cost for The Alabama Tax Free Bond Fund is due to certain timing differences in the recognition of capital gains or losses under income tax regulations and GAAP. These “book/tax” differences are temporary in nature and are primarily due to the tax deferral of losses on wash sales and differing methods in the amortization of market discount and premium on fixed income securities.
As of March 31, 2010, The Government Street Mid-Cap Fund had capital loss carryforwards for federal income tax purposes of $629,243, of which $223,256 expires March 31, 2017 and $405,987 expires March 31, 2018. As of March 31, 2010, The Alabama Tax Free Bond Fund had a capital loss carryforward for federal income tax purposes of $1,742, which expires March 31, 2018. These capital loss carryforwards may be utilized in the current and future years to offset net realized capital gains, if any, prior to distribution to shareholders.
During the six months ended September 30, 2010, The Government Street Equity Fund and The Government Street Mid-Cap Fund realized $289,208 and $88,748, respectively, of net capital gains resulting from in-kind redemptions (redemptions in which shareholders who redeemed Fund shares received securities held by the Fund rather than cash). The Funds recognize a gain on in-kind redemptions to the extent that the value of the distributed securities on the date of redemption exceeds the cost of those securities. Such gains are not taxable to the Funds and are not required
THE GOVERNMENT STREET FUNDS NOTES TO FINANCIAL STATEMENTS (Continued) |
to be distributed to shareholders. The Funds have reclassified these amounts against paid-in capital. These reclassifications are reflected on the Statements of Assets and Liabilities. Such reclassifications, the result of permanent differences between the financial statement and income tax reporting requirements, had no effect on each Fund’s net assets or net asset value per share.
The Funds recognize the tax benefits or expenses of uncertain tax positions only when the position is “more likely than not” to be sustained assuming examination by tax authorities. Management has reviewed the tax positions taken on Federal income tax returns for all open tax years (tax years ended March 31, 2007 through March 31, 2010) of each Fund and has concluded that no provision for unrecognized tax benefits or expenses is required in these financial statements.
2. Investment Transactions
During the six months ended September 30, 2010, cost of purchases and proceeds from sales and maturities of investment securities, other than short-term investments and U.S. government securities, totaled $11,649,498 and $12,208,698, respectively, for The Government Street Equity Fund; $4,335,058 and $5,693,755, respectively, for The Government Street Mid-Cap Fund; and $2,726,467 and $3,261,500, respectively, for The Alabama Tax Free Bond Fund.
3. Transactions with Affiliates
INVESTMENT ADVISORY AGREEMENT
The Funds’ investments are managed by Leavell Investment Management, Inc. (the “Adviser”) under the terms of an Investment Advisory Agreement. The Government Street Equity Fund pays the Adviser a fee, which is computed and accrued daily and paid monthly, at an annual rate of .60% of its average daily net assets up to $100 million and .50% of such assets in excess of $100 million. The Government Street Mid-Cap Fund pays the Adviser a fee at an annual rate of .75% of its average daily net assets. The Alabama Tax Free Bond Fund pays the Adviser a fee at an annual rate of .35% of its average daily net assets up to $100 million and .25% of such assets in excess of $100 million.
During the six months ended September 30, 2010, the Adviser voluntarily undertook to limit the total operating expenses of The Alabama Tax Free Bond Fund to .65% of the Fund’s average daily net assets. Accordingly, the Adviser waived $15,706 of its investment advisory fees from The Alabama Tax Free Bond Fund during the six months ended September 30, 2010.
Certain officers of the Trust are also officers of the Adviser.
MUTUAL FUND SERVICES AGREEMENT
Under the terms of a Mutual Fund Services Agreement between the Trust and Ultimus Fund Solutions, LLC (“Ultimus”), Ultimus provides administrative, pricing, accounting, dividend disbursing, shareholder servicing and transfer agent
THE GOVERNMENT STREET FUNDS NOTES TO FINANCIAL STATEMENTS (Continued) |
services for the Funds. For these services, Ultimus receives a monthly fee from each Fund at an annual rate of .15% of the Fund’s average daily net assets up to $25 million, .125% of the next $25 million of such assets, and .10% of such assets in excess of $50 million. The minimum monthly fee payable to Ultimus is $4,000 with respect to The Government Street Equity Fund and The Government Street Mid-Cap Fund and $3,500 with respect to The Alabama Tax Free Bond Fund. In addition, each Fund pays out-of-pocket expenses including, but not limited to, postage, supplies and costs of pricing portfolio securities. Certain officers of the Trust are also officers of Ultimus, or of Ultimus Fund Distributors, LLC (the “Distributor”), the principal underwriter of each Fund’s shares and an affiliate of Ultimus. The Distributo r is compensated by the Adviser (not the Funds) for acting as principal underwriter.
COMPLIANCE CONSULTING AGREEMENT
Under the terms of a Compliance Consulting Agreement between the Trust and Ultimus, Ultimus provides an individual to serve as the Trust’s Chief Compliance Officer and to administer the Funds’ compliance policies and procedures. For these services, the Funds pay Ultimus an annual base fee of $18,600 plus an asset-based fee equal to 0.01% per annum on the Funds’ aggregate net assets in excess of $100 million. In addition, the Funds reimburse Ultimus for reasonable out-of-pocket expenses, if any, incurred in connection with these services.
4. Derivatives Transactions
Transactions in option contracts written by The Government Street Equity Fund during the six months ended September 30, 2010 were as follows:
| | | | | | |
| Options outstanding at beginning of period | | | 166 | | | $ | 12,478 | |
| Options written | | | 166 | | | | 33,339 | |
| Options cancelled in a closing purchase transaction | | | (166 | ) | | | (12,478 | ) |
| Options outstanding at end of period | | | 166 | | | $ | 33,339 | |
The location in the Statements of Assets and Liabilities of The Government Street Equity Fund’s derivative positions is as follows:
| | | Gross Notional Amount Outstanding September 30, 2010 |
| |
| Covered call options written | Written call options, at value | — | $(3,082) | $(1,116,000) |
The average monthly notional amount of option contracts during the six months ended September 30, 2010 was $1,116,000 for The Government Street Equity Fund.
THE GOVERNMENT STREET FUNDS NOTES TO FINANCIAL STATEMENTS (Continued) |
Transactions in derivative instruments during the six months ended September 30, 2010 by The Government Street Equity Fund are recorded in the following location in the Statements of Operations:
| | | | Change in Unrealized Gains (Losses) |
| Covered call options written | Net realized gains from option contracts | $(13,776) | Net change in unrealized appreciation (depreciation) on option contracts | $39,659 |
No option contracts were written by The Government Street Mid-Cap Fund during the six months ended September 30, 2010.
5. Contingencies and Commitments
The Funds indemnify the Trust’s officers and Trustees for certain liabilities that might arise from their performance of their duties to the Funds. Additionally, in the normal course of business the Funds enter into contracts that contain a variety of representations and warranties and which provide general indemnifications. The Funds’ maximum exposure under these arrangements is unknown, as this would involve future claims that may be made against the Funds that have not yet occurred. However, based on experience, the Funds expect the risk of loss to be remote.
6. Subsequent Events
The Funds are required to recognize in the financial statements the effects of all subsequent events that provide additional evidence about conditions that existed as of the date of the Statements of Assets and Liabilities. For non-recognized subsequent events that must be disclosed to keep the financial statements from being misleading, the Funds are required to disclose the nature of the event as well as an estimate of its financial effect, or a statement that such an estimate cannot be made. Management has evaluated subsequent events through the issuance of these financial statements and has noted no such events.
7. Recent Accounting Pronouncement
In January 2010, the Financial Accounting Standards Board (“FASB”) issued Accounting Standards Update (“ASU”) No. 2010-06 “Improving Disclosures about Fair Value Measurements.” ASU No. 2010-06 amends FASB Accounting Standards Codification Topic 820, Fair Value Measurements and Disclosures, to require additional disclosures regarding fair value measurements. Certain disclosures required by ASU No. 2010-06 are effective for interim and annual reporting periods beginning after December 31, 2009 and others for fiscal years beginning after December 15, 2010 and for interim periods within those fiscal years. Management is currently evaluating the impact ASU No. 2010-06 will have on the Funds’ financial statement disclosures.
THE GOVERNMENT STREET FUNDS ABOUT YOUR FUNDS’ EXPENSES (Unaudited) |
We believe it is important for you to understand the impact of costs on your investment. All mutual funds have operating expenses. As a shareholder of the Funds, you incur ongoing costs, including management fees and other expenses. These ongoing costs, which are deducted from each Fund’s gross income, directly reduce the investment returns of the Funds.
A mutual fund’s ongoing costs are expressed as a percentage of its average net assets. This figure is known as the expense ratio. The following examples are intended to help you understand the ongoing costs (in dollars) of investing in the Funds and to compare these costs with the ongoing costs of investing in other mutual funds. The examples below are based on an investment of $1,000 made at the beginning of the period shown and held for the entire period (April 1, 2010 through September 30, 2010).
The table below illustrates each Fund’s ongoing costs in two ways:
Actual fund return – This section helps you to estimate the actual expenses that you paid over the period. The “Ending Account Value” shown is derived from each Fund’s actual return, and the third column shows the dollar amount of operating expenses that would have been paid by an investor who started with $1,000 in the Funds. You may use the information here, together with the amount you invested, to estimate the expenses that you paid over the period.
To do so, simply divide your account value by $1,000 (for example, an $8,600 account value divided by $1,000 = 8.6), then multiply the result by the number given for the Funds under the heading “Expenses Paid During Period.”
Hypothetical 5% return – This section is intended to help you compare the Funds’ ongoing costs with those of other mutual funds. It assumes that each Fund had an annual return of 5% before expenses during the period shown, but that the expense ratio is unchanged. In this case, because the returns used are not the Funds’ actual returns, the results do not apply to your investment. The example is useful in making comparisons because the Securities and Exchange Commission (the “SEC”) requires all mutual funds to calculate expenses based on a 5% return. You can assess each Fund’s ongoing costs by comparing this hypothetical example with the hypothetical examples that appear in shareholder reports of other funds.
Note that expenses shown in the table are meant to highlight and help you compare ongoing costs only. The Funds do not charge sales loads or redemption fees.
The calculations assume no shares were bought or sold during the period. Your actual costs may have been higher or lower, depending on the amount of your investment and the timing of any purchases or redemptions.
THE GOVERNMENT STREET FUNDS ABOUT YOUR FUNDS’ EXPENSES (Unaudited) (Continued) |
More information about the Funds’ expenses, including historical expense ratios, can be found in this report. For additional information on operating expenses and other shareholder costs, please refer to the Funds’ prospectus.
| | Beginning Account Value April 1, 2010 | Ending Account Value September 30, 2010 | Expenses Paid During Period* |
| The Government Street Equity Fund |
Based on Actual Fund Return | $1,000.00 | $ 999.40 | $4.46 |
Based on Hypothetical 5% Return (before expenses) | $1,000.00 | $1,020.61 | $4.51 |
| The Government Street Mid-Cap Fund |
Based on Actual Fund Return | $1,000.00 | $1,022.50 | $5.83 |
Based on Hypothetical 5% Return (before expenses) | $1,000.00 | $1,019.30 | $5.82 |
| The Alabama Tax Free Bond Fund |
Based on Actual Fund Return | $1,000.00 | $1,028.40 | $3.31 |
Based on Hypothetical 5% Return (before expenses) | $1,000.00 | $1,021.81 | $3.29 |
| * | Expenses are equal to the Funds’ annualized expense ratios for the period as stated below, multiplied by the average account value over the period, multiplied by 183/365 (to reflect the one-half year period). |
| The Government Street Equity Fund | 0.89% |
| The Government Street Mid-Cap Fund | 1.15% |
| The Alabama Tax Free Bond Fund | 0.65% |
THE GOVERNMENT STREET FUNDS OTHER INFORMATION (Unaudited) |
A description of the policies and procedures that the Funds use to vote proxies relating to portfolio securities is available without charge upon request by calling toll-free 1-866-738-1125, or on the SEC’s website at http://www.sec.gov. Information regarding how the Funds voted proxies relating to portfolio securities during the most recent 12-month period ended June 30 is also available without charge upon request by calling toll-free 1-866-738-1125 or on the SEC’s website at http://www.sec.gov.
The Trust files a complete listing of portfolio holdings for the Funds with the SEC as of the end of the first and third quarters of each fiscal year on Form N-Q. The filings are available upon request, by calling 1-866-738-1125. Furthermore, you may obtain a copy of these filings on the SEC’s website at http://www.sec.gov. The Trust’s Forms N-Q may also be reviewed and copied at the SEC’s Public Reference Room in Washington, DC, and information on the operation of the Public Reference Room may be obtained by calling 1-800-SEC-0330.
The Government Street Funds
Investment Adviser Leavell Investment Management, Inc. Post Office Box 1307 Mobile, AL 36633 Administrator Ultimus Fund Solutions, LLC P.O. Box 46707 Cincinnati, OH 45246-0707 1-866-738-1125 Legal Counsel Sullivan & Worcester LLP One Post Office Square Boston, MA 02109 Independent Registered Public Accounting Firm Ernst & Young LLP 1900 Scripps Center 312 Walnut Street Cincinnati, OH 45202 Board of Trustees Austin Brockenbrough, III John T. Bruce Charles M. Caravati, Jr. Robert S. Harris J. Finley Lee, Jr. Richard L. Morrill Harris V. Morrissette Samuel B. Witt, III Portfolio Managers Thomas W. Leavell, The Government Street Equity Fund The Government Street Mid-Cap Fund Timothy S. Healey, The Government Street Mid-Cap Fund The Alabama Tax Free Bond Fund Richard E. Anthony, Jr., CFA, The Government Street Mid-Cap Fund Michael J. Hofto, CFA, The Government Street Mid-Cap Fund |
THE JAMESTOWN FUNDS
No-Load Funds
The Jamestown Balanced Fund The Jamestown Equity Fund The Jamestown Tax Exempt Virginia Fund
SEMI-ANNUAL REPORT
September 30, 2010
(Unaudited) Investment Adviser Lowe, Brockenbrough & Company, Inc. Richmond, Virginia |
THE JAMESTOWN BALANCED FUND PORTFOLIO INFORMATION September 30, 2010 (Unaudited) |
| Asset Allocation (% of Net Assets) | | Ten Largest Equity Holdings | % of Net Assets |
| | AmerisourceBergen Corporation | 1.7% |
| | Apple, Inc. | 1.7% |
| | Hewlett-Packard Company | 1.6% |
| | Oracle Corporation | 1.5% |
| | Chevron Corporation | 1.5% |
| | ConocoPhillips | 1.5% |
| | United Technologies Corporation | 1.5% |
| | Teva Pharmaceutical Industries Ltd. - ADR | 1.5% |
| | Norfolk Southern Corporation | 1.5% |
| | Cisco Systems, Inc. | 1.4% |
| Equity Sector Concentration vs. the S&P 500 Index (65.3%of Net Assets) |
| Fixed-Income Portfolio (29.8% of Net Assets) | | Credit Quality | % of Fixed Income Portfolio |
| Average Stated Maturity (Years) | 4.37 | | AAA | 44.0% |
| Average Duration (Years) | 3.71 | | AA | 4.5% |
| Average Coupon | 5.19% | | A | 46.0% |
| Average Yield to Maturity | 1.93% | | BBB | 5.5% |
| | | | | |
| Sector Breakdown | % of Fixed Income Portfolio | | | |
| U.S. Treasury Obligations | 16.9% | | | |
| U.S. Government Agency Obligations | 9.6% | | | |
| Mortgage-Backed Securities | 17.5% | | | |
| Corporate Bonds | 56.0% | | | |
THE JAMESTOWN EQUITY FUND PORTFOLIO INFORMATION September 30, 2010 (Unaudited) |
| Asset Allocation (% of Net Assets) | | Ten Largest Equity Holdings | % of Net Assets |
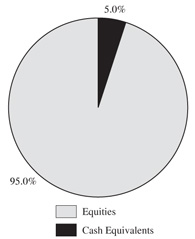 | | Apple, Inc. | 2.7% |
| | AmerisourceBergen Corporation | 2.5% |
| | Hewlett-Packard Company | 2.3% |
| | Teva Pharmaceutical Industries Ltd. - ADR | 2.3% |
| | Oracle Corporation | 2.2% |
| | Cisco Systems, Inc. | 2.2% |
| | Norfolk Southern Corporation | 2.1% |
| | United Technologies Corporation | 2.1% |
| | ConocoPhillips | 2.1% |
| | Chevron Corporation | 2.1% |
| Sector Concentration vs. the S&P 500 Index |
THE JAMESTOWN TAX EXEMPT VIRGINIA FUND PORTFOLIO INFORMATION September 30, 2010 (Unaudited) |
Characteristics (Weighted Average) | | Maturity Breakdown (%of Portfolio) |
| 30-day SEC Yield | 1.85% | |  |
| Tax-Equivalent Yield | 2.85%* |
| Average Maturity (years) | 5.2 |
| Average Duration (years) | 4.7 |
| Average Quality | AA |
| Number of Issues | 52 |
| | |
| * Assumes a maximum 35.0% federal tax rate. |
| | |
| | |
| Credit Quality (%of Portfolio) | | Sector Diversification (%of Portfolio) |
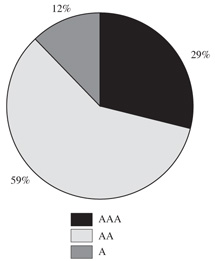 | | 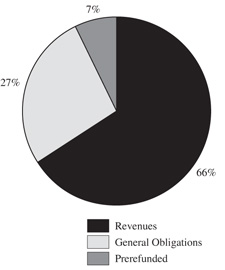 |
THE JAMESTOWN BALANCED FUND SCHEDULE OF INVESTMENTS September 30, 2010 (Unaudited) | |
| | | | | | |
| Consumer Discretionary — 8.1% | | | | | | |
Comcast Corporation - Class A | | | 14,000 | | | $ | 253,120 | |
Dollar Tree, Inc. (a) | | | 5,700 | | | | 277,932 | |
McDonald's Corporation | | | 3,700 | | | | 275,687 | |
TJX Companies, Inc. (The) | | | 6,200 | | | | 276,706 | |
Viacom, Inc. - Class B | | | 8,000 | | | | 289,520 | |
Yum! Brands, Inc. | | | 6,200 | | | | 285,572 | |
| | | | | | | | 1,658,537 | |
| Consumer Staples — 5.4% | | | | | | | | |
CVS Caremark Corporation | | | 8,300 | | | | 261,201 | |
General Mills, Inc. | | | 7,200 | | | | 263,088 | |
PepsiCo, Inc. | | | 4,300 | | | | 285,692 | |
Wal-Mart Stores, Inc. | | | 5,500 | | | | 294,360 | |
| | | | | | | | 1,104,341 | |
| Energy — 8.1% | | | | | | | | |
Apache Corporation | | | 2,400 | | | | 234,624 | |
Chevron Corporation | | | 3,800 | | | | 307,990 | |
ConocoPhillips | | | 5,350 | | | | 307,251 | |
Hess Corporation | | | 5,000 | | | | 295,600 | |
Marathon Oil Corporation | | | 8,300 | | | | 274,730 | |
Noble Corporation (a) | | | 7,100 | | | | 239,909 | |
| | | | | | | | 1,660,104 | |
| Financials — 9.9% | | | | | | | | |
Aflac, Inc. | | | 5,500 | | | | 284,405 | |
Ameriprise Financial, Inc. | | | 3,200 | | | | 151,456 | |
Bank of America Corporation | | | 1,500 | | | | 19,665 | |
Franklin Resources, Inc. | | | 2,600 | | | | 277,940 | |
JPMorgan Chase & Company | | | 7,000 | | | | 266,490 | |
MetLife, Inc. | | | 6,700 | | | | 257,615 | |
PNC Financial Services Group, Inc. | | | 5,000 | | | | 259,550 | |
Prudential Financial, Inc. | | | 5,000 | | | | 270,900 | |
Toronto-Dominion Bank (The) | | | 3,500 | | | | 252,910 | |
| | | | | | | | 2,040,931 | |
| Health Care — 8.7% | | | | | | | | |
Abbott Laboratories | | | 5,200 | | | | 271,648 | |
Aetna, Inc. | | | 8,600 | | | | 271,846 | |
AmerisourceBergen Corporation | | | 11,600 | | | | 355,656 | |
Amgen, Inc. (a) | | | 2,600 | | | | 143,286 | |
Bristol-Myers Squibb Company | | | 6,000 | | | | 162,660 | |
Medco Health Solutions, Inc. (a) | | | 5,500 | | | | 286,330 | |
Teva Pharmaceutical Industries Ltd. - ADR | | | 5,800 | | | | 305,950 | |
| | | | | | | | 1,797,376 | |
THE JAMESTOWN BALANCED FUND SCHEDULE OF INVESTMENTS (Continued) | |
COMMON STOCKS — 65.3% (Continued) | | | | | | |
| Industrials — 8.6% | | | | | | |
Dover Corporation | | | 5,400 | | | $ | 281,934 | |
General Dynamics Corporation | | | 4,200 | | | | 263,802 | |
General Electric Company | | | 5,500 | | | | 89,375 | |
Illinois Tool Works, Inc. | | | 5,700 | | | | 268,014 | |
ITT Corporation | | | 5,500 | | | | 257,565 | |
Norfolk Southern Corporation | | | 5,100 | | | | 303,501 | |
United Technologies Corporation | | | 4,300 | | | | 306,289 | |
| | | | | | | | 1,770,480 | |
| Information Technology — 15.3% | | | | | | | | |
Accenture plc - Class A | | | 5,000 | | | | 212,450 | |
Apple, Inc. (a) | | | 1,250 | | | | 354,688 | |
Cisco Systems, Inc. (a) | | | 13,500 | | | | 295,650 | |
EMC Corporation (a) | | | 14,200 | | | | 288,402 | |
Google, Inc. - Class A (a) | | | 550 | | | | 289,184 | |
Hewlett-Packard Company | | | 7,700 | | | | 323,939 | |
Intel Corporation | | | 13,500 | | | | 259,605 | |
International Business Machines Corporation | | | 2,100 | | | | 281,694 | |
Microsoft Corporation | | | 11,500 | | | | 281,635 | |
Oracle Corporation | | | 11,500 | | | | 308,775 | |
QUALCOMM, Inc. | | | 5,500 | | | | 248,160 | |
| | | | | | | | 3,144,182 | |
| Materials — 1.2% | | | | | | | | |
Eastman Chemical Company | | | 3,500 | | | | 259,000 | |
| | | | | | | | | |
Total Common Stocks (Cost $10,621,060) | | | | | | $ | 13,434,951 | |
| | |
U.S. TREASURY OBLIGATIONS — 5.0% | | | | | | |
| U.S. Treasury Notes — 5.0% | | | | | | |
4.25%, 11/15/2014 | | $ | 350,000 | | | $ | 396,785 | |
4.25%, 11/15/2017 | | | 400,000 | | | | 462,843 | |
2.625%, 08/15/2020 | | | 175,000 | | | | 176,641 | |
Total U.S. Treasury Obligations (Cost $930,332) | | | | | | $ | 1,036,269 | |
| | |
U.S. GOVERNMENT AGENCY OBLIGATIONS — 2.9% | | | | | | |
| Federal Home Loan Mortgage Corporation — 2.9% | | | | | | |
5.25%, due 04/18/2016 (Cost $495,036) | | $ | 500,000 | | | $ | 590,925 | |
THE JAMESTOWN BALANCED FUND SCHEDULE OF INVESTMENTS (Continued) | |
MORTGAGE-BACKED SECURITIES — 5.2% | | | | | | |
| Federal Home Loan Mortgage Corporation — 0.9% | | | | | | |
Pool #E90624, 6.00%, due 08/01/2017 | | $ | 11,081 | | | $ | 11,981 | |
Pool #A43942, 5.50%, due 03/01/2036 | | | 163,772 | | | | 174,225 | |
| | | | | | | | 186,206 | |
| Federal National Mortgage Association — 4.2% | | | | | | | | |
Pool #618465, 5.00%, due 12/01/2016 | | | 98,357 | | | | 104,356 | |
Pool #684231, 5.00%, due 01/01/2018 | | | 140,369 | | | | 148,931 | |
Pool #255455, 5.00%, due 10/01/2024 | | | 150,948 | | | | 160,155 | |
Pool #255702, 5.00%, due 05/01/2025 | | | 237,769 | | | | 252,009 | |
Pool #808413, 5.50%, due 01/01/2035 | | | 183,792 | | | | 195,520 | |
| | | | | | | | 860,971 | |
| Government National Mortgage Association — 0.1% | | | | | | | | |
Pool #781344, 6.50%, due 10/15/2031 | | | 21,502 | | | | 23,671 | |
| | | | | | | | | |
Total Mortgage-Backed Securities (Cost $1,005,576) | | | | | | $ | 1,070,848 | |
| |
| | | | | | |
| Consumer Staples — 3.4% | | | | | | |
| Coca-Cola Company (The), | | | | | | |
5.35%, due 11/15/2017 | | $ | 250,000 | | | $ | 294,305 | |
| General Mills, Inc., | | | | | | | | |
5.70%, due 02/15/2017 | | | 150,000 | | | | 177,096 | |
| PepsiCo, Inc., | | | | | | | | |
4.65%, due 02/15/2013 | | | 200,000 | | | | 217,969 | |
| | | | | | | | 689,370 | |
| Energy — 0.5% | | | | | | | | |
| Shell International Finance B.V., | | | | | | | | |
4.30%, due 09/22/2019 | | | 100,000 | | | | 109,680 | |
| | | | | | | | | |
| Financials — 6.6% | | | | | | | | |
| American Express Company, | | | | | | | | |
4.875%, due 07/15/2013 | | | 150,000 | | | | 162,294 | |
| BB&T Corporation, | | | | | | | | |
6.50%, due 08/01/2011 | | | 325,000 | | | | 339,894 | |
| JPMorgan Chase & Company, | | | | | | | | |
6.75%, due 02/01/2011 | | | 300,000 | | | | 305,981 | |
| Morgan Stanley, | | | | | | | | |
5.30%, due 03/01/2013 | | | 250,000 | | | | 269,233 | |
| Northern Trust Corporation, | | | | | | | | |
4.625%, due 05/01/2014 | | | 150,000 | | | | 166,333 | |
| PNC Funding Corporation, | | | | | | | | |
5.125%, due 02/08/2020 | | | 110,000 | | | | 119,083 | |
| | | | | | | | 1,362,818 | |
| Health Care — 2.0% | | | | | | | | |
| Amgen, Inc., | | | | | | | | |
5.85%, due 06/01/2017 | | | 150,000 | | | | 179,064 | |
| GlaxoSmithKline plc, | | | | | | | | |
5.65%, due 05/15/2018 | | | 200,000 | | | | 237,603 | |
| | | | | | | | 416,667 | |
THE JAMESTOWN BALANCED FUND SCHEDULE OF INVESTMENTS (Continued) | |
CORPORATE BONDS — 16.7% (Continued) | | | | | | |
| Industrials — 1.3% | | | | | | |
| United Technologies Corporation, | | | | | | |
6.10%, due 05/15/2012 | | $ | 250,000 | | | $ | 270,209 | |
| | | | | | | | | |
| Materials — 0.9% | | | | | | | | |
| E.I. du Pont de Nemours and Company, | | | | | | | | |
5.875%, due 01/15/2014 | | | 150,000 | | | | 171,649 | |
| | | | | | | | | |
| Telecommunication Services — 1.3% | | | | | | | | |
| AT&T, Inc., | | | | | | | | |
4.95%, due 01/15/2013 | | | 250,000 | | | | 271,659 | |
| | | | | | | | | |
| Utilities — 0.7% | | | | | | | | |
| Virginia Electric & Power Company, | | | | | | | | |
5.00%, due 06/30/2019 | | | 125,000 | | | | 142,361 | |
| | | | | | | | | |
Total Corporate Bonds (Cost $3,142,739) | | | | | | $ | 3,434,413 | |
| |
MONEY MARKET FUNDS — 2.4% | | | | | | |
Fidelity Institutional Money Market Portfolio - Select Class, 0.20% (b) (Cost $498,998) | | | 498,998 | | | $ | 498,998 | |
| |
REPURCHASE AGREEMENTS — 2.6% | | | | | | |
U.S. Bank N.A., 0.01%, dated 09/30/2010, due 10/01/2010, repurchase proceeds: $526,164 (Cost $526,164) (c) | | $ | 526,164 | | | $ | 526,164 | |
| | | | | | | | | |
Total Investments at Value — 100.1%
(Cost $17,219,905) | | | | | | $ | 20,592,568 | |
| | | | | | | | | |
Liabilities in Excess of Other Assets — (0.1%) | | | | | | | (30,741 | ) |
| | | | | | | | | |
Net Assets — 100.0% | | | | | | $ | 20,561,827 | |
| ADR - American Depositary Receipt. |
| (a) | Non-income producing security. |
| (b) | Variable rate security. The rate shown is the 7-day effective yield as of September 30, 2010. |
| (c) | Repurchase agreement is fully collateralized by $503,563 FGCI #E99430, 4.50%, due 09/01/2018. The aggregate market value of the collateral at September 30, 2010 was $536,738. |
| See accompanying notes to financial statements. |
THE JAMESTOWN EQUITY FUND SCHEDULE OF INVESTMENTS September 30, 2010 (Unaudited) | |
| | | | | | |
| Consumer Discretionary — 11.7% | | | | | | |
Comcast Corporation - Class A | | | 24,700 | | | $ | 446,576 | |
Dollar Tree, Inc. (a) | | | 10,200 | | | | 497,352 | |
McDonald's Corporation | | | 6,500 | | | | 484,315 | |
TJX Companies, Inc. (The) | | | 11,400 | | | | 508,783 | |
Viacom, Inc. - Class B | | | 14,600 | | | | 528,374 | |
Yum! Brands, Inc. | | | 11,100 | | | | 511,266 | |
| | | | | | | | 2,976,666 | |
| Consumer Staples — 7.7% | | | | | | | | |
CVS Caremark Corporation | | | 15,100 | | | | 475,197 | |
General Mills, Inc. | | | 12,700 | | | | 464,058 | |
PepsiCo, Inc. | | | 7,800 | | | | 518,232 | |
Wal-Mart Stores, Inc. | | | 9,500 | | | | 508,440 | |
| | | | | | | | 1,965,927 | |
| Energy — 11.5% | | | | | | | | |
Apache Corporation | | | 4,000 | | | | 391,040 | |
Chevron Corporation | | | 6,600 | | | | 534,930 | |
ConocoPhillips | | | 9,400 | | | | 539,842 | |
Hess Corporation | | | 8,700 | | | | 514,344 | |
Marathon Oil Corporation | | | 15,200 | | | | 503,120 | |
Noble Corporation (a) | | | 13,200 | | | | 446,028 | |
| | | | | | | | 2,929,304 | |
| Financials — 14.5% | | | | | | | | |
Aflac, Inc. | | | 10,000 | | | | 517,100 | |
Ameriprise Financial, Inc. | | | 6,000 | | | | 283,980 | |
Franklin Resources, Inc. | | | 4,600 | | | | 491,740 | |
JPMorgan Chase & Company | | | 12,800 | | | | 487,296 | |
MetLife, Inc. | | | 12,300 | | | | 472,935 | |
PNC Financial Services Group, Inc. | | | 9,300 | | | | 482,763 | |
Prudential Financial, Inc. | | | 9,000 | | | | 487,620 | |
Toronto-Dominion Bank (The) | | | 6,500 | | | | 469,690 | |
| | | | | | | | 3,693,124 | |
| Health Care — 12.9% | | | | | | | | |
Abbott Laboratories | | | 9,500 | | | | 496,280 | |
Aetna, Inc. | | | 15,800 | | | | 499,438 | |
AmerisourceBergen Corporation | | | 20,900 | | | | 640,794 | |
Amgen, Inc. (a) | | | 4,700 | | | | 259,017 | |
Bristol-Myers Squibb Company | | | 10,400 | | | | 281,944 | |
Medco Health Solutions, Inc. (a) | | | 10,200 | | | | 531,012 | |
Teva Pharmaceutical Industries Ltd. - ADR | | | 10,900 | | | | 574,975 | |
| | | | | | | | 3,283,460 | |
THE JAMESTOWN EQUITY FUND SCHEDULE OF INVESTMENTS (Continued) | |
COMMON STOCKS — 95.0% (Continued) | | | | | | |
| Industrials — 12.3% | | | | | | |
Dover Corporation | | | 10,000 | | | $ | 522,100 | |
General Dynamics Corporation | | | 7,600 | | | | 477,356 | |
General Electric Company | | | 6,000 | | | | 97,500 | |
Illinois Tool Works, Inc. | | | 10,500 | | | | 493,710 | |
ITT Corporation | | | 9,600 | | | | 449,568 | |
Norfolk Southern Corporation | | | 9,100 | | | | 541,541 | |
United Technologies Corporation | | | 7,600 | | | | 541,348 | |
| | | | | | | | 3,123,123 | |
| Information Technology — 22.6% | | | | | | | | |
Accenture plc - Class A | | | 9,000 | | | | 382,410 | |
Apple, Inc. (a) | | | 2,400 | | | | 681,000 | |
Cisco Systems, Inc. (a) | | | 25,000 | | | | 547,500 | |
EMC Corporation (a) | | | 25,600 | | | | 519,936 | |
Google, Inc. - Class A (a) | | | 1,000 | | | | 525,790 | |
Hewlett-Packard Company | | | 14,200 | | | | 597,394 | |
Intel Corporation | | | 24,200 | | | | 465,366 | |
International Business Machines Corporation | | | 3,800 | | | | 509,732 | |
Microsoft Corporation | | | 20,800 | | | | 509,392 | |
Oracle Corporation | | | 20,500 | | | | 550,425 | |
QUALCOMM, Inc. | | | 9,800 | | | | 442,176 | |
| | | | | | | | 5,731,121 | |
| Materials — 1.8% | | | | | | | | |
Eastman Chemical Company | | | 6,200 | | | | 458,800 | |
| | | | | | | | | |
Total Common Stocks (Cost $19,725,284) | | | | | | $ | 24,161,525 | |
| |
MONEY MARKET FUNDS — 1.0% | | | | | | |
Fidelity Institutional Money Market Portfolio - Select Class, 0.20% (b) (Cost $242,351) | | | 242,351 | | | $ | 242,351 | |
| |
REPURCHASE AGREEMENTS — 4.5% | | | | | |
U.S. Bank N.A., 0.01%, dated 09/30/2010, due 10/01/2010, repurchase proceeds: $1,133,082 (Cost $1,133,082) (c) | $ | 1,133,082 | | | $ | 1,133,082 | |
| | | | | | | | |
Total Investments at Value — 100.5% (Cost $21,100,717) | | | | | $ | 25,536,958 | |
| | | | | | | | |
Liabilities in Excess of Other Assets — (0.5%) | | | | | | (114,879 | ) |
| | | | | | | | |
Net Assets — 100.0% | | | | | $ | 25,422,079 | |
| ADR - American Depositary Receipt. |
| (a) | Non-income producing security. |
| (b) | Variable rate security. The rate shown is the 7-day effective yield as of September 30, 2010. |
| (c) | Repurchase agreement is fully collateralized by $1,084,408 FGCI #E99430, 4.50%, due 09/01/2018. The aggregate market value of the collateral at September 30, 2010 was $1,155,848. |
| See accompanying notes to financial statements. |
THE JAMESTOWN TAX EXEMPT VIRGINIA FUND SCHEDULE OF INVESTMENTS September 30, 2010 (Unaudited) | |
VIRGINIA REVENUE AND GENERAL OBLIGATION (GO) BONDS — 95.1% | | | | | | |
| Arlington Co., Virginia, GO, | | | | | | |
4.10%, due 11/01/2018 | | $ | 500,000 | | | $ | 540,440 | |
| Capital Region Airport Commission, Virginia, Airport Revenue, | | | | | | | | |
4.50%, due 07/01/2016 | | | 520,000 | | | | 587,881 | |
| Chesterfield Co., Virginia, GO, | | | | | | | | |
5.00%, due 01/01/2020 | | | 700,000 | | | | 813,001 | |
| Fairfax Co., Virginia, Economic Dev. Authority, Revenue, | | | | | | | | |
5.00%, due 06/01/2018 | | | 1,000,000 | | | | 1,100,280 | |
| Fairfax Co., Virginia, Industrial Dev. Authority, Revenue, | | | | | | | | |
5.00%, due 05/15/2022 | | | 750,000 | | | | 842,602 | |
| Fauquier Co., Virginia, GO, | | | | | | | | |
5.00%, due 07/01/2017 | | | 500,000 | | | | 587,800 | |
| Hampton Roads Sanitation District, Virginia, Wastewater, Revenue, | | | | | | | | |
5.00%, due 04/01/2022 | | | 400,000 | | | | 464,108 | |
| Hampton, Virginia, GO, | | | | | | | | |
| 5.00%, due 04/01/2020, | | | | | | | | |
prerefunded 04/01/2015 @ 100 | | | 500,000 | | | | 587,000 | |
| Henrico Co., Virginia, Public Improvement, Series A, GO, | | | | | | | | |
5.00%, due 12/01/2015 | | | 250,000 | | | | 296,578 | |
| Henrico Co., Virginia, Water & Sewer, Revenue, | | | | | | | | |
5.00%, due 05/01/2020 | | | 350,000 | | | | 420,525 | |
5.00%, due 05/01/2022 | | | 430,000 | | | | 507,641 | |
| James City, Virginia, School District, GO, | | | | | | | | |
5.00%, due 12/15/2018 | | | 500,000 | | | | 582,305 | |
| James City, Virginia, Service Authority, Water & Sewer, Revenue, | | | | | | | | |
5.125%, due 01/15/2017 | | | 1,000,000 | | | | 1,083,280 | |
| Leesburg, Virginia, GO, | | | | | | | | |
5.00%, due 09/15/2016 | | | 500,000 | | | | 594,680 | |
| Loudoun Co., Virginia, Industrial Dev. Authority, Public Facility Lease, Revenue, | | | | | | | | |
5.00%, due 03/01/2019 | | | 1,000,000 | | | | 1,078,800 | |
| Lynchburg, Virginia, GO, | | | | | | | | |
5.00%, due 06/01/2015 | | | 500,000 | | | | 585,400 | |
| Lynchburg, Virginia, Public Improvement, Series A, GO, | | | | | | | | |
5.00%, due 08/01/2019 | | | 625,000 | | | | 761,337 | |
| Manassas, Virginia, Public Improvement, GO, | | | | | | | | |
Series D, 5.00%, due 07/01/2019 | | | 250,000 | | | | 304,780 | |
| Medical College of Virginia, Hospitals Authority, Revenue, | | | | | | | | |
5.00%, due 07/01/2013 | | | 700,000 | | | | 701,596 | |
| New Kent Co., Virginia, Economic Dev. Authority, Revenue, | | | | | | | | |
5.00%, due 02/01/2019 | | | 500,000 | | | | 570,860 | |
| New River Valley Regional Jail Authority, Revenue, | | | | | | | | |
4.00%, due 04/01/2011 | | | 250,000 | | | | 252,923 | |
THE JAMESTOWN TAX EXEMPT VIRGINIA FUND SCHEDULE OF INVESTMENTS (Continued) | |
VIRGINIA REVENUE AND GENERAL OBLIGATION (GO) BONDS — 95.1% (Continued) | | | | | | |
| Norfolk, Virginia, GO, | | | | | | |
4.50%, due 06/01/2015 | | $ | 500,000 | | | $ | 558,040 | |
| Norfolk, Virginia, Water, Revenue, | | | | | | | | |
5.00%, due 11/01/2016 | | | 1,000,000 | | | | 1,044,120 | |
| Portsmouth, Virginia, Series A, GO, | | | | | | | | |
5.00%, due 04/01/2016 | | | 500,000 | | | | 574,625 | |
| Portsmouth, Virginia, Series D, GO, | | | | | | | | |
4.00%, due 12/01/2017 | | | 215,000 | | | | 245,016 | |
| Prince William Co., Virginia, County Facilities, Refunding Lease Participation Certificates, | | | | | | | | |
5.00%, due 10/01/2020 | | | 500,000 | | | | 586,335 | |
| Richmond, Virginia, Metropolitan Authority, Revenue, | | | | | | | | |
5.25%, due 07/15/2014 | | | 1,000,000 | | | | 1,129,400 | |
| Southeastern Public Service Authority, Virginia, Revenue, | | | | | | | | |
5.00%, due 07/01/2015, ETM | | | 1,000,000 | | | | 1,137,382 | |
| Spotsylvania Co., Virginia, GO, | | | | | | | | |
5.00%, due 01/15/2016 | | | 500,000 | | | | 555,700 | |
| Spotsylvania Co., Virginia, Water & Sewer, Revenue, | | | | | | | | |
5.00%, due 06/01/2026 | | | 500,000 | | | | 542,555 | |
| Suffolk Virginia, Public Improvement, Series A, GO, | | | | | | | | |
4.00%, due 08/01/2018 | | | 250,000 | | | | 283,725 | |
| University of Virginia, Revenue, | | | | | | | | |
5.00%, due 06/01/2013 | | | 585,000 | | | | 652,117 | |
| Upper Occoquan, Virginia, Sewer Authority, Revenue, | | | | | | | | |
5.15%, due 07/01/2020 | | | 250,000 | | | | 300,755 | |
| Virginia Beach, Virginia, Public Improvement, GO, | | | | | | | | |
| 5.00%, due 06/01/2021, | | | | | | | | |
prerefunded 06/01/2019 @ 100 | | | 250,000 | | | | 308,165 | |
| Virginia Biotechnology Research Partnership Authority, Lease Revenue, | | | | | | | | |
5.00%, due 09/01/2020 | | | 500,000 | | | | 600,300 | |
| Virginia College Building Authority, Educational Facilities, Revenue, | | | | | | | | |
| 5.00%, due 02/01/2017, | | | | | | | | |
prerefunded 02/01/2014 @ 100 | | | 500,000 | | | | 570,250 | |
5.00%, due 04/01/2017 | | | 500,000 | | | | 561,760 | |
| Virginia Commonwealth Transportation Board, Federal Highway Reimbursement Anticipation Note, Revenue, | | | | | | | | |
5.00%, due 09/28/2015 | | | 500,000 | | | | 589,235 | |
| Virginia Polytechnic Institute & State University, Revenue, | | | | | | | | |
5.00%, due 06/01/2016 | | | 500,000 | | | | 564,960 | |
| Virginia Small Business Financing Authority, Healthcare Facilities Revenue, | | | | | | | | |
5.00%, due 11/01/2017 | | | 250,000 | | | | 286,680 | |
| Virginia State Public Building Authority, Public Facilities, Series D, Revenue, | | | | | | | | |
5.00%, due 08/01/2016 | | | 1,000,000 | | | | 1,137,600 | |
THE JAMESTOWN TAX EXEMPT VIRGINIA FUND SCHEDULE OF INVESTMENTS (Continued) | |
VIRGINIA REVENUE AND GENERAL OBLIGATION (GO) BONDS — 95.1% (Continued) | | | | | | |
| Virginia State Public Building Authority, Revenue, | | | | | | |
5.00%, due 08/01/2012 | | $ | 635,000 | | | $ | 687,743 | |
| Virginia State Public School Authority, Series A, Revenue, | | | | | | | | |
5.00%, due 08/01/2020 | | | 585,000 | | | | 671,369 | |
| Virginia State Public School Authority, Series B, Revenue, | | | | | | | | |
4.00%, due 08/01/2014 | | | 400,000 | | | | 446,088 | |
| Virginia State Public School Authority, Series B-1, Revenue, | | | | | | | | |
5.00%, due 08/01/2018 | | | 500,000 | | | | 603,365 | |
| Virginia State Resources Authority, Clean Water, Revenue, | | | | | | | | |
5.00%, due 10/01/2021 | | | 500,000 | | | | 597,765 | |
| Virginia State Resources Authority, Infrastructure, Series B, Revenue, | | | | | | | | |
5.00%, due 11/01/2024 | | | 500,000 | | | | 580,860 | |
| Virginia State, Series B, GO, | | | | | | | | |
5.00%, due 06/01/2012 | | | 500,000 | | | | 538,095 | |
5.00%, due 06/01/2017 | | | 250,000 | | | | 301,420 | |
| | | | | | | | | |
Total Virginia Revenue and General Obligation (GO) Bonds (Cost $27,816,397) | | | | | | $ | 29,919,242 | |
| | |
WASHINGTON, D.C. REVENUE BONDS — 1.8% | | | | | | |
Metropolitan Washington Airports Authority,
Series C, Revenue, | | | | | | |
5.00%, due 10/01/2022 (Cost $509,839) | | $ | 500,000 | | | $ | 562,535 | |
| | |
EXCHANGE-TRADED FUNDS — 0.8% | | | | | | |
| SPDR Nuveen Barclays Capital Short Term Municipal Bond ETF (Cost $241,000) | | | 10,000 | | | $ | 243,200 | |
| | |
MONEY MARKET FUNDS — 3.1% | | | | | | |
Fidelity Tax Exempt Portfolio - Class I, 0.09% (a)
(Cost $982,966) | | | 982,966 | | | $ | 982,966 | |
| | | | | | | | | |
Total Investments at Value — 100.8% (Cost $29,550,202) | | | | | | $ | 31,707,943 | |
| | | | | | | | | |
Liabilities in Excess of Other Assets — (0.8%) | | | | | | | (243,081 | ) |
| | | | | | | | | |
Net Assets — 100.0% | | | | | | $ | 31,464,862 | |
| ETM - Escrowed to Maturity. |
| (a) | Variable rate security. The rate shown is the 7-day effective yield as of September 30, 2010. |
| See accompanying notes to financial statements. |
THE JAMESTOWN FUNDS STATEMENTS OF ASSETS AND LIABILITIES September 30, 2010 (Unaudited) | |
| | | | | | | | Jamestown Tax Exempt Virginia Fund | |
| ASSETS | | | | | | | | | |
| Investments in securities: | | | | | | | | | |
At acquisition cost | | $ | 17,219,905 | | | $ | 21,100,717 | | | $ | 29,550,202 | |
At value (Note 1) | | $ | 20,592,568 | | | $ | 25,536,958 | | | $ | 31,707,943 | |
Dividends and interest receivable | | | 78,578 | | | | 17,220 | | | | 377,715 | |
Receivable for investment securities sold | | | 32,413 | | | | 16,910 | | | | — | |
Receivable for capital shares sold | | | — | | | | 3,513 | | | | — | |
Other assets | | | 3,276 | | | | 10,853 | | | | 8,057 | |
TOTAL ASSETS | | | 20,706,835 | | | | 25,585,454 | | | | 32,093,715 | |
| | | | | | | | | | | | | |
| LIABILITIES | | | | | | | | | | | | |
Distributions payable | | | 8,557 | | | | 1,649 | | | | 11,508 | |
Payable for investment securities purchased | | | 69,545 | | | | 109,966 | | | | 587,150 | |
Payable for capital shares redeemed | | | 41,633 | | | | 34,023 | | | | 13,489 | |
Accrued investment advisory fees (Note 3) | | | 10,826 | | | | 13,222 | | | | 8,509 | |
Payable to administrator (Note 3) | | | 4,515 | | | | 4,515 | | | | 4,215 | |
Other accrued expenses | | | 9,932 | | | | — | | | | 3,982 | |
TOTAL LIABILITIES | | | 145,008 | | | | 163,375 | | | | 628,853 | |
| | | | | | | | | | | | | |
NET ASSETS | | $ | 20,561,827 | | | $ | 25,422,079 | | | $ | 31,464,862 | |
| | | | | | | | | | | | | |
| Net assets consist of: | | | | | | | | | | | | |
Paid-in capital | | $ | 18,487,498 | | | $ | 23,789,878 | | | $ | 29,235,169 | |
| Accumulated undistributed (overdistributed) net investment income | | | (25,835 | ) | | | 31,654 | | | | — | |
Accumulated net realized gains (losses)
from security transactions | | | (1,272,499 | ) | | | (2,835,694 | ) | | | 71,952 | |
Net unrealized appreciation on investments | | | 3,372,663 | | | | 4,436,241 | | | | 2,157,741 | |
Net assets | | $ | 20,561,827 | | | $ | 25,422,079 | | | $ | 31,464,862 | |
| | | | | | | | | | | | | |
Shares of beneficial interest outstanding
(unlimited number of shares authorized, no par value) | | | 1,717,954 | | | | 1,783,287 | | | | 2,964,462 | |
| | | | | | | | | | | | | |
Net asset value, offering price and redemption
price per share | | $ | 11.97 | | | $ | 14.26 | | | $ | 10.61 | |
| See accompanying notes to financial statements. |
THE JAMESTOWN FUNDS STATEMENTS OF OPERATIONS Six Months Ended September 30, 2010 (Unaudited) | |
| | | | | | | | Jamestown Tax Exempt Virginia Fund | |
| INVESTMENT INCOME | | | | | | | | | |
Dividends | | $ | 116,492 | | | $ | 203,217 | | | $ | 1,301 | |
Foreign withholding taxes on dividends | | | (899 | ) | | | (1,590 | ) | | | — | |
Interest | | | 154,520 | | | | 41 | | | | 566,135 | |
TOTAL INVESTMENT INCOME | | | 270,113 | | | | 201,668 | | | | 567,436 | |
| | | | | | | | | | | | | |
| EXPENSES | | | | | | | | | | | | |
Investment advisory fees (Note 3) | | | 67,716 | | | | 80,816 | | | | 64,751 | |
Administration fees (Note 3) | | | 24,000 | | | | 24,000 | | | | 23,290 | |
Professional fees | | | 10,709 | | | | 9,359 | | | | 7,909 | |
Trustees’ fees and expenses | | | 6,842 | | | | 6,842 | | | | 6,842 | |
Custodian and bank service fees | | | 3,271 | | | | 4,863 | | | | 3,045 | |
Compliance fees and expenses (Note 3) | | | 3,284 | | | | 3,284 | | | | 3,284 | |
Pricing costs | | | 2,641 | | | | 547 | | | | 4,319 | |
Printing of shareholder reports | | | 2,190 | | | | 3,675 | | | | 1,500 | |
Insurance expense | | | 1,374 | | | | 1,645 | | | | 1,901 | |
Registration fees | | | 2,129 | | | | 2,242 | | | | 1,208 | |
Postage and supplies | | | 1,089 | | | | 1,195 | | | | 821 | |
Other expenses | | | 2,952 | | | | 1,810 | | | | 4,048 | |
TOTAL EXPENSES | | | 128,197 | | | | 140,278 | | | | 122,918 | |
Fees voluntarily waived by the Adviser (Note 3) | | | — | | | | — | | | | (11,223 | ) |
Expenses reimbursed through a directed
brokerage arrangement (Note 4) | | | (6,000 | ) | | | (6,000 | ) | | | — | |
NET EXPENSES | | | 122,197 | | | | 134,278 | | | | 111,695 | |
| | | | | | | | | | | | | |
NET INVESTMENT INCOME | | | 147,916 | | | | 67,390 | | | | 455,741 | |
| | | | | | | | | | | | | |
REALIZED AND UNREALIZED GAINS
(LOSSES) ON INVESTMENTS | | | | | | | | | | | | |
Net realized gains on security transactions | | | 551,078 | | | | 885,200 | | | | 52,423 | |
Net change in unrealized appreciation/
depreciation on investments | | | (826,138 | ) | | | (1,589,776 | ) | | | 838,672 | |
| | | | | | | | | | | | | |
NET REALIZED AND UNREALIZED GAINS
(LOSSES) ON INVESTMENTS | | | (275,060 | ) | | | (704,576 | ) | | | 891,095 | |
| | | | | | | | | | | | | |
NET INCREASE (DECREASE) IN NET
ASSETS FROM OPERATIONS | | $ | (127,144 | ) | | $ | (637,186 | ) | | $ | 1,346,836 | |
| See accompanying notes to financial statements. |
THE JAMESTOWN FUNDS STATEMENTS OF CHANGES IN NET ASSETS | |
| | | | | | | |
| | Six Months Ended September 30, 2010 (Unaudited) | | | | | | Six Months Ended September 30, 2010 (Unaudited) | | | | |
| FROM OPERATIONS | | | | | | | | | | | | |
Net investment income | | $ | 147,916 | | | $ | 442,944 | | | $ | 67,390 | | | $ | 177,984 | |
Net realized gains (losses) on
security transactions | | | 551,078 | | | | (520,906 | ) | | | 885,200 | | | | (1,004,607 | ) |
Net change in unrealized appreciation/
depreciation on investments | | | (826,138 | ) | | | 4,616,015 | | | | (1,589,776 | ) | | | 7,294,861 | |
Net increase (decrease) in net assets
from operations | | | (127,144 | ) | | | 4,538,053 | | | | (637,186 | ) | | | 6,468,238 | |
| | | | | | | | | | | | | | | | | |
DISTRIBUTIONS TO
SHAREHOLDERS | | | | | | | | | | | | | | | | |
From net investment income | | | (158,133 | ) | | | (464,931 | ) | | | (78,932 | ) | | | (134,788 | ) |
| | | | | | | | | | | | | | | | | |
FROM CAPITAL SHARE
TRANSACTIONS | | | | | | | | | | | | | | | | |
Proceeds from shares sold | | | 28,614 | | | | 246,821 | | | | 1,132,738 | | | | 4,602,946 | |
Net asset value of shares
issued in reinvestment of
distributions to shareholders | | | 138,578 | | | | 400,602 | | | | 75,319 | | | | 128,492 | |
Payments for shares redeemed | | | (1,503,557 | ) | | | (3,608,673 | ) | | | (1,603,497 | ) | | | (3,321,397 | ) |
Net increase (decrease) in net assets
from capital share transactions | | | (1,336,365 | ) | | | (2,961,250 | ) | | | (395,440 | ) | | | 1,410,041 | |
| | | | | | | | | | | | | | | | | |
TOTAL INCREASE
(DECREASE) IN NET ASSETS | | | (1,621,642 | ) | | | 1,111,872 | | | | (1,111,558 | ) | | | 7,743,491 | |
| | | | | | | | | | | | | | | | | |
| NET ASSETS | | | | | | | | | | | | | | | | |
Beginning of period | | | 22,183,469 | | | | 21,071,597 | | | | 26,533,637 | | | | 18,790,146 | |
End of period | | $ | 20,561,827 | | | $ | 22,183,469 | | | $ | 25,422,079 | | | $ | 26,533,637 | |
| | | | | | | | | | | | | | | | | |
ACCUMULATED UNDISTRIBUTED (OVERDISTRIBUTED) NET
INVESTMENT INCOME | | $ | (25,835 | ) | | $ | (25,209 | ) | | $ | 31,654 | | | $ | 43,196 | |
| | | | | | | | | | | | | | | | | |
| CAPITAL SHARE ACTIVITY | | | | | | | | | | | | | | | | |
Shares sold | | | 2,410 | | | | 21,848 | | | | 81,203 | | | | 336,642 | |
Shares reinvested | | | 12,047 | | | | 35,858 | | | | 5,575 | | | | 9,198 | |
Shares redeemed | | | (127,733 | ) | | | (315,673 | ) | | | (112,418 | ) | | | (243,780 | ) |
Net increase (decrease) in
shares outstanding | | | (113,276 | ) | | | (257,967 | ) | | | (25,640 | ) | | | 102,060 | |
Shares outstanding, beginning of period | | | 1,831,230 | | | | 2,089,197 | | | | 1,808,927 | | | | 1,706,867 | |
Shares outstanding, end of period | | | 1,717,954 | | | | 1,831,230 | | | | 1,783,287 | | | | 1,808,927 | |
| See accompanying notes to financial statements. |
THE JAMESTOWN FUNDS STATEMENTS OF CHANGES IN NET ASSETS | |
| | | Jamestown Tax Exempt Virginia Fund | |
| | Six Months Ended September 30, 2010 (Unaudited) | | | | |
| FROM OPERATIONS | | | | | | |
Net investment income | | $ | 455,741 | | | $ | 965,888 | |
Net realized gains on security transactions | | | 52,423 | | | | 54,035 | |
| Net change in unrealized appreciation/depreciation on investments | | | 838,672 | | | | 294,919 | |
Net increase in net assets from operations | | | 1,346,836 | | | | 1,314,842 | |
| | | | | | | | | |
| DISTRIBUTIONS TO SHAREHOLDERS | | | | | | | | |
From net investment income | | | (456,257 | ) | | | (991,361 | ) |
| From net realized gains from security transactions | | | — | | | | (40,804 | ) |
| Decrease in net assets from distributions to shareholders | | | (456,257 | ) | | | (1,032,165 | ) |
| | | | | | | | | |
| FROM CAPITAL SHARE TRANSACTIONS | | | | | | | | |
Proceeds from shares sold | | | 987,484 | | | | 1,899,062 | |
Net asset value of shares issued in reinvestment of
distributions to shareholders | | | 382,446 | | | | 876,547 | |
Payments for shares redeemed | | | (3,700,242 | ) | | | (2,883,645 | ) |
| Net decrease in net assets from capital share transactions | | | (2,330,312 | ) | | | (108,036 | ) |
| | | | | | | | | |
| TOTAL INCREASE (DECREASE) IN NET ASSETS | | | (1,439,733 | ) | | | 174,641 | |
| | | | | | | | | |
| NET ASSETS | | | | | | | | |
Beginning of period | | | 32,904,595 | | | | 32,729,954 | |
End of period | | $ | 31,464,862 | | | $ | 32,904,595 | |
| | | | | | | | | |
| ACCUMULATED UNDISTRIBUTED NET INVESTMENT INCOME | | $ | — | | | $ | 393 | |
| | | | | | | | | |
| CAPITAL SHARE ACTIVITY | | | | | | | | |
Shares sold | | | 93,891 | | | | 184,087 | |
Shares reinvested | | | 36,375 | | | | 84,650 | |
Shares redeemed | | | (352,224 | ) | | | (277,154 | ) |
Net decrease in shares outstanding | | | (221,958 | ) | | | (8,417 | ) |
Shares outstanding, beginning of period | | | 3,186,420 | | | | 3,194,837 | |
Shares outstanding, end of period | | | 2,964,462 | | | | 3,186,420 | |
| See accompanying notes to financial statements. |
THE JAMESTOWN BALANCED FUND FINANCIAL HIGHLIGHTS | |
Selected Per Share Data and Ratios for a Share Outstanding Throughout Each Period | |
| | | Six Months Ended September 30, 2010 (Unaudited) | | | | |
| | | 2010 | | | | 2009 | | | | 2008 | | | | 2007 | | | | 2006 | |
Net asset value at
beginning of period | | $ | 12.11 | | | $ | 10.09 | | | $ | 12.95 | | | $ | 14.53 | | | $ | 14.97 | | | $ | 14.92 | |
| | | | | | | | | | | | | | | | | | | | | | | | | |
Income (loss) from
investment operations: | | | | | | | | | | | | | | | | | | | | | | | | |
Net investment income | | | 0.09 | | | | 0.22 | | | | 0.25 | | | | 0.26 | | | | 0.27 | | | | 0.26 | |
Net realized and unrealized
gains (losses) on
investments | | | (0.14 | ) | | | 2.04 | | | | (2.91 | ) | | | 0.27 | | | | 0.69 | | | | 1.06 | |
Total from investment operations | | | (0.05 | ) | | | 2.26 | | | | (2.66 | ) | | | 0.53 | | | | 0.96 | | | | 1.32 | |
| | | | | | | | | | | | | | | | | | | | | | | | | |
| Less distributions: | | | | | | | | | | | | | | | | | | | | | | | | |
Dividends from net
investment income | | | (0.09 | ) | | | (0.24 | ) | | | (0.20 | ) | | | (0.28 | ) | | | (0.29 | ) | | | (0.27 | ) |
Distributions from net
realized gains | | | — | | | | — | | | | — | | | | (1.83 | ) | | | (1.11 | ) | | | (1.00 | ) |
Total distributions | | | (0.09 | ) | | | (0.24 | ) | | | (0.20 | ) | | | (2.11 | ) | | | (1.40 | ) | | | (1.27 | ) |
| | | | | | | | | | | | | | | | | | | | | | | | | |
Net asset value at end of period | | $ | 11.97 | | | $ | 12.11 | | | $ | 10.09 | | | $ | 12.95 | | | $ | 14.53 | | | $ | 14.97 | |
| | | | | | | | | | | | | | | | | | | | | | | | | |
Total return (a) | | | (0.37% | )(b) | | | 22.56% | | | | (20.75% | ) | | | 2.97% | | | | 6.57% | | | | 9.14% | |
| | | | | | | | | | | | | | | | | | | | | | | | | |
Net assets at end of period (000’s) | | $ | 20,562 | | | $ | 22,183 | | | $ | 21,072 | | | $ | 32,058 | | | $ | 45,460 | | | $ | 56,879 | |
| | | | | | | | | | | | | | | | | | | | | | | | | |
Ratio of gross expenses to
average net assets | | | 1.23% | (c) | | | 1.20% | | | | 1.14% | | | | 1.01% | | | | 0.94% | | | | 0.93% | |
| | | | | | | | | | | | | | | | | | | | | | | | | |
Ratio of net expenses to
average net assets (d) | | | 1.17% | (c) | | | 1.11% | | | | 1.05% | | | | 0.95% | | | | 0.89% | | | | 0.89% | |
| | | | | | | | | | | | | | | | | | | | | | | | | |
Ratio of net investment
income to average net assets | | | 1.42% | (c) | | | 1.98% | | | | 2.10% | | | | 1.71% | | | | 1.80% | | | | 1.72% | |
| | | | | | | | | | | | | | | | | | | | | | | | | |
Portfolio turnover rate | | | 17% | (b) | | | 40% | | | | 43% | | | | 30% | | | | 40% | | | | 49% | |
| (a) | Total return is a measure of the change in value of an investment in the Fund over the period covered, which assumes any dividends or capital gains distributions are reinvested in shares of the Fund. Returns do not reflect the deduction of taxes a shareholder would pay on Fund distributions or the redemption of Fund shares. |
| (d) | Ratios were determined based on net expenses after expense reimbursements through a directed brokerage arrangement (Note 4). |
| See accompanying notes to financial statements. |
THE JAMESTOWN EQUITY FUND FINANCIAL HIGHLIGHTS | |
Selected Per Share Data and Ratios for a Share Outstanding Throughout Each Period | |
| | | Six Months Ended September 30, 2010 (Unaudited) | | | | |
| | | 2010 | | | | 2009 | | | | 2008 | | | | 2007 | | | | 2006 | |
Net asset value at
beginning of period | | $ | 14.67 | | | $ | 11.01 | | | $ | 16.68 | | | $ | 18.12 | | | $ | 18.45 | | | $ | 17.69 | |
| | | | | | | | | | | | | | | | | | | | | | | | | |
Income (loss) from
investment operations: | | | | | | | | | | | | | | | | | | | | | | | | |
Net investment income | | | 0.04 | | | | 0.10 | | | | 0.08 | | | | 0.08 | | | | 0.10 | | | | 0.07 | |
Net realized and unrealized
gains (losses) on
investments | | | (0.41 | ) | | | 3.64 | | | | (5.68 | ) | | | 0.20 | | | | 1.15 | | | | 2.11 | |
Total from investment operations | | | (0.37 | ) | | | 3.74 | | | | (5.60 | ) | | | 0.28 | | | | 1.25 | | | | 2.18 | |
| | | | | | | | | | | | | | | | | | | | | | | | | |
| Less distributions: | | | | | | | | | | | | | | | | | | | | | | | | |
Dividends from net
investment income | | | (0.04 | ) | | | (0.08 | ) | | | — | | | | (0.08 | ) | | | (0.10 | ) | | | (0.07 | ) |
Distributions from net
realized gains | | | — | | | | — | | | | — | | | | (1.50 | ) | | | (1.48 | ) | | | (1.35 | ) |
Return of capital | | | — | | | | — | | | | (0.07 | ) | | | (0.14 | ) | | | — | | | | — | |
Total distributions | | | (0.04 | ) | | | (0.08 | ) | | | (0.07 | ) | | | (1.72 | ) | | | (1.58 | ) | | | (1.42 | ) |
| | | | | | | | | | | | | | | | | | | | | | | | | |
Net asset value at end of period | | $ | 14.26 | | | $ | 14.67 | | | $ | 11.01 | | | $ | 16.68 | | | $ | 18.12 | | | $ | 18.45 | |
| | | | | | | | | | | | | | | | | | | | | | | | | |
Total return (a) | | | (2.48% | )(b) | | | 33.96% | | | | (33.63% | ) | | | 0.94% | | | | 6.92% | | | | 12.69% | |
| | | | | | | | | | | | | | | | | | | | | | | | | |
Net assets at end of period (000’s) | | $ | 25,422 | | | $ | 26,534 | | | $ | 18,790 | | | $ | 32,317 | | | $ | 37,128 | | | $ | 42,770 | |
| | | | | | | | | | | | | | | | | | | | | | | | | |
Ratio of gross expenses to
average net assets | | | 1.13% | (c) | | | 1.16% | | | | 1.15% | | | | 0.99% | | | | 0.97% | | | | 0.97% | |
| | | | | | | | | | | | | | | | | | | | | | | | | |
Ratio of net expenses to
average net assets (d) | | | 1.08% | (c) | | | 1.12% | | | | 1.10% | | | | 0.95% | | | | 0.91% | | | | 0.92% | |
| | | | | | | | | | | | | | | | | | | | | | | | | |
Ratio of net investment income to
average net assets | | | 0.54% | (c) | | | 0.78% | | | | 0.56% | | | | 0.38% | | | | 0.52% | | | | 0.36% | |
| | | | | | | | | | | | | | | | | | | | | | | | | |
Portfolio turnover rate | | | 28% | (b) | | | 59% | | | | 69% | | | | 46% | | | | 53% | | | | 60% | |
| (a) | Total return is a measure of the change in value of an investment in the Fund over the period covered, which assumes any dividends or capital gains distributions are reinvested in shares of the Fund. Returns do not reflect the deduction of taxes a shareholder would pay on Fund distributions or the redemption of Fund shares. |
| (d) | Ratios were determined based on net expenses after expense reimbursements through a directed brokerage arrangement (Note 4). |
| See accompanying notes to financial statements. |
THE JAMESTOWN TAX EXEMPT VIRGINIA FUND FINANCIAL HIGHLIGHTS | |
Selected Per Share Data and Ratios for a Share Outstanding Throughout Each Period | |
| | | Six Months Ended September 30, 2010 (Unaudited) | | | | |
| | | 2010 | | | | 2009 | | | | 2008 | | | | 2007 | | | | 2006 | |
Net asset value at
beginning of period | | $ | 10.33 | | | $ | 10.24 | | | $ | 10.10 | | | $ | 10.06 | | | $ | 10.05 | | | $ | 10.22 | |
| | | | | | | | | | | | | | | | | | | | | | | | | |
Income (loss) from
investment operations: | | | | | | | | | | | | | | | | | | | | | | | | |
Net investment income | | | 0.15 | | | | 0.30 | | | | 0.34 | | | | 0.36 | | | | 0.37 | | | | 0.36 | |
Net realized and unrealized
gains (losses) on
investments | | | 0.28 | | | | 0.11 | | | | 0.13 | | | | 0.05 | | | | 0.01 | | | | (0.17 | ) |
Total from investment operations | | | 0.43 | | | | 0.41 | | | | 0.47 | | | | 0.41 | | | | 0.38 | | | | 0.19 | |
| | | | | | | | | | | | | | | | | | | | | | | | | |
| Less distributions: | | | | | | | | | | | | | | | | | | | | | | | | |
Dividends from net
investment income | | | (0.15 | ) | | | (0.31 | ) | | | (0.33 | ) | | | (0.36 | ) | | | (0.36 | ) | | | (0.36 | ) |
Distributions from net
realized gains | | | — | | | | (0.01 | ) | | | (0.00 | )(a) | | | (0.01 | ) | | | (0.01 | ) | | | — | |
Total distributions | | | (0.15 | ) | | | (0.32 | ) | | | (0.33 | ) | | | (0.37 | ) | | | (0.37 | ) | | | (0.36 | ) |
| | | | | | | | | | | | | | | | | | | | | | | | | |
Net asset value at end of period | | $ | 10.61 | | | $ | 10.33 | | | $ | 10.24 | | | $ | 10.10 | | | $ | 10.06 | | | $ | 10.05 | |
| | | | | | | | | | | | | | | | | | | | | | | | | |
Total return (b) | | | 4.17% | (c) | | | 4.04% | | | | 4.77% | | | | 4.09% | | | | 3.85% | | | | 1.83% | |
| | | | | | | | | | | | | | | | | | | | | | | | | |
Net assets at end of period (000’s) | | $ | 31,465 | | | $ | 32,905 | | | $ | 32,730 | | | $ | 29,093 | | | $ | 28,981 | | | $ | 30,421 | |
| | | | | | | | | | | | | | | | | | | | | | | | | |
Ratio of gross expenses to
average net assets | | | 0.76% | (d) | | | 0.75% | | | | 0.77% | | | | 0.77% | | | | 0.75% | | | | 0.73% | |
| | | | | | | | | | | | | | | | | | | | | | | | | |
Ratio of net expenses to
average net assets | | | 0.69% | (d) | | | 0.69% | | | | 0.69% | | | | 0.69% | | | | 0.69% | | | | 0.69% | |
| | | | | | | | | | | | | | | | | | | | | | | | | |
Ratio of net investment
income to average net assets | | | 2.82% | (d) | | | 2.89% | | | | 3.31% | | | | 3.54% | | | | 3.66% | | | | 3.50% | |
| | | | | | | | | | | | | | | | | | | | | | | | | |
Portfolio turnover rate | | | 6% | (c) | | | 16% | | | | 10% | | | | 13% | | | | 10% | | | | 22% | |
| (a) | Amount rounds to less than a penny per share. |
| (b) | Total return is a measure of the change in value of an investment in the Fund over the period covered, which assumes any dividends or capital gains distributions are reinvested in shares of the Fund. Returns do not reflect the deduction of taxes a shareholder would pay on Fund distributions or the redemption of Fund shares. |
| See accompanying notes to financial statements. |
THE JAMESTOWN FUNDS NOTES TO FINANCIAL STATEMENTS September 30, 2010 (Unaudited) |
1. Organization and Significant Accounting Policies
The Jamestown Balanced Fund, The Jamestown Equity Fund and The Jamestown Tax Exempt Virginia Fund (individually, a “Fund,” and, collectively, the “Funds”) are each a no-load series of Williamsburg Investment Trust (the “Trust”), an open-end management investment company registered under the Investment Company Act of 1940. The Trust was organized as a Massachusetts business trust on July 18, 1988. Other series of the Trust are not included in this report.
The Jamestown Balanced Fund’s investment objectives are long-term growth of capital and income through investment in a portfolio of domestic equity and fixed income securities.
The Jamestown Equity Fund’s investment objective is long-term growth of capital through investment in a diversified portfolio composed primarily of domestic equity securities.
The Jamestown Tax Exempt Virginia Fund’s investment objectives are to provide current income exempt from federal income taxes and from the personal income taxes of Virginia, to preserve capital, to limit credit risk and to take advantage of opportunities to increase and enhance the value of a shareholder’s investment.
The following is a summary of the Funds’ significant accounting policies:
Securities valuation — The Funds’ portfolio securities are valued as of the close of business of the regular session of the New York Stock Exchange (normally 4:00 p.m., Eastern time). Securities traded on a national stock exchange are generally valued based upon the closing price on the principal exchange where the security is traded. Securities which are quoted by NASDAQ are valued at the NASDAQ Official Closing Price. Securities which are traded over-the-counter are valued at the last sales price, if available, otherwise, at the last quoted bid price. It is expected that fixed income securities will ordinarily be traded in the over-the-counter market, and common stocks will ordinarily be traded on a national securities exchange, but may also be traded in the over-the-counter market. Short-term instruments (those with rema ining maturities of 60 days or less) may be valued at amortized cost, which approximates market value.
When market quotations are not readily available, securities may be valued on the basis of prices provided by an independent pricing service. The prices provided by the pricing service are determined with consideration given to institutional bid and last sale prices and take into account securities prices, yields, maturities, call features, ratings, institutional trading in similar groups of securities and developments related to specific securities. If a pricing service cannot provide a valuation, securities will be valued in good faith at fair value using methods consistent with those established by and under the general supervision of the Board of Trustees and will be classified as Level 2 or 3 within the fair value hierarchy, depending on the inputs used. Such methods of fair valuation may include, but are not limited to: multiple of earnings, multiple of book value, discount from market of a similar freely traded security, purchase price of the security, subsequent private transactions in the security or related securities, or a combination of these and other factors.
THE JAMESTOWN FUNDS NOTES TO FINANCIAL STATEMENTS (Continued) |
Accounting principles generally accepted in the United States (“GAAP”) establish a single authoritative definition of fair value, set out a framework for measuring fair value and require additional disclosures about fair value measurements.
Various inputs are used in determining the value of each Fund’s investments. These inputs are summarized in the three broad levels listed below:
• Level 1 – quoted prices in active markets for identical securities
• Level 2 – other significant observable inputs
• Level 3 – significant unobservable inputs
The inputs or methodology used for valuing securities are not necessarily an indication of the risks associated with investing in those securities. The inputs used to measure fair value may fall into different levels of the fair value hierarchy. In such cases, for disclosure purposes, the level in the fair value hierarchy within which the fair value measurement falls in its entirety is determined based on the lowest level input that is significant to the fair value measurement.
The following is a summary of the inputs used to value each Fund’s investments as of September 30, 2010 by security type:
| The Jamestown Balanced Fund | | Level 1 | | | Level 2 | | | Level 3 | | | Total | |
Common Stocks | | $ | 13,434,951 | | | $ | — | | | $ | — | | | $ | 13,434,951 | |
U.S. Treasury & Government Agency Obligations | | | — | | | | 1,627,194 | | | | — | | | | 1,627,194 | |
Mortgage-Backed Securities | | | — | | | | 1,070,848 | | | | — | | | | 1,070,848 | |
Corporate Bonds | | | — | | | | 3,434,413 | | | | — | | | | 3,434,413 | |
Money Market Funds | | | 498,998 | | | | — | | | | — | | | | 498,998 | |
Repurchase Agreements | | | — | | | | 526,164 | | | | — | | | | 526,164 | |
Total | | $ | 13,933,949 | | | $ | 6,658,519 | | | $ | — | | | $ | 20,592,568 | |
| The Jamestown Equity Fund | | Level 1 | | | Level 2 | | | Level 3 | | | Total | |
Common Stocks | | $ | 24,161,525 | | | $ | — | | | $ | — | | | $ | 24,161,525 | |
Money Market Funds | | | 242,351 | | | | — | | | | — | | | | 242,351 | |
Repurchase Agreements | | | — | | | | 1,133,082 | | | | — | | | | 1,133,082 | |
Total | | $ | 24,403,876 | | | $ | 1,133,082 | | | $ | — | | | $ | 25,536,958 | |
| The Jamestown Tax Exempt Virginia Fund | | Level 1 | | | Level 2 | | | Level 3 | | | Total | |
Municipal Bonds | | $ | — | | | $ | 30,481,777 | | | $ | — | | | $ | 30,481,777 | |
Exchange-Traded Funds | | | 243,200 | | | | — | | | | — | | | | 243,200 | |
Money Market Funds | | | 982,966 | | | | — | | | | — | | | | 982,966 | |
Total | | $ | 1,226,166 | | | $ | 30,481,777 | | | $ | — | | | $ | 31,707,943 | |
Refer to The Jamestown Balanced Fund’s and The Jamestown Equity Fund’s Schedule of Investments for a listing of the common stocks and corporate bonds valued using Level 1 and Level 2 inputs by sector type. During the six months ended September 30, 2010, the Funds did not
THE JAMESTOWN FUNDS NOTES TO FINANCIAL STATEMENTS (Continued) |
have any significant transfers in and out of Level 1 or Level 2. There were no Level 3 securities or derivative instruments held by the Funds during the quarter ended or as of September 30, 2010.
Repurchase agreements — The Funds may enter into repurchase agreements. A repurchase agreement, which is collateralized by U.S. Government obligations, is valued at cost which, together with accrued interest, approximates market value. At the time a Fund enters into a repurchase agreement, the seller agrees that the value of the underlying securities, including accrued interest, will at all times be equal to or exceed the face amount of the repurchase agreement. In addition, the Funds actively monitor and seek additional collateral, as needed. If the seller defaults, the fair value of the collateral may decline and realization of the collateral by the Funds may be delayed or limited.
Share valuation — The net asset value per share of each Fund is calculated daily by dividing the total value of each Fund’s assets, less liabilities, by the number of shares outstanding. The offering price and redemption price per share of each Fund is equal to the net asset value per share.
Investment income — Interest income is accrued as earned. Dividend income is recorded on the ex-dividend date. Discounts and premiums on fixed income securities purchased are amortized using the interest method.
Distributions to shareholders — Dividends arising from net investment income, if any, are declared and paid quarterly to shareholders of The Jamestown Balanced Fund and The Jamestown Equity Fund. Dividends arising from net investment income are declared daily and paid monthly to shareholders of The Jamestown Tax Exempt Virginia Fund. Net realized short-term capital gains, if any, may be distributed throughout the year and net realized long-term capital gains, if any, are distributed at least once each year. The amount of distributions from net investment income and net realized gains are determined in accordance with federal income tax regulations which may differ from GAAP. These “book/tax” differences are either temporary or permanent in nature.
The tax character of distributions paid during the periods ended September 30, 2010 and March 31, 2010 was as follows:
| | Periods Ended | | Ordinary Income | | | Long-Term Capital Gains | | | Exempt- Interest Dividends | | | Total Distributions | |
| The Jamestown Balanced Fund | 9/30/10 | | $ | 158,134 | | | $ | — | | | $ | — | | | $ | 158,134 | |
| | 3/31/10 | | $ | 464,931 | | | $ | — | | | $ | — | | | $ | 464,931 | |
| The Jamestown Equity Fund | 9/30/10 | | $ | 78,932 | | | $ | — | | | $ | — | | | $ | 78,932 | |
| | 3/31/10 | | $ | 134,788 | | | $ | — | | | $ | — | | | $ | 134,788 | |
| The Jamestown Tax Exempt Virginia Fund | 9/30/10 | | $ | — | | | $ | — | | | $ | 456,257 | | | $ | 456,257 | |
| | 3/31/10 | | $ | 2,107 | | | $ | 38,697 | | | $ | 991,361 | | | $ | 1,032,165 | |
Security transactions — Security transactions are accounted for on trade date. Gains and losses on securities sold are determined on a specific identification basis.
Securities traded on a “to-be-announced” basis — The Jamestown Balanced Fund may trade securities on a “to-be-announced” (“TBA”) basis. In a TBA transaction, the Fund has committed
THE JAMESTOWN FUNDS NOTES TO FINANCIAL STATEMENTS (Continued) |
to purchase securities for which all specific information is not yet known at the time of the trade, particularly the face amount in mortgage-backed securities transactions. Securities purchased on a TBA basis are not settled until they are delivered to the Fund, normally 15 to 45 days later. These transactions are subject to market fluctuations and their current value is determined in the same manner as for other portfolio securities.
Common expenses — Common expenses of the Trust are allocated among the series of the Trust based on relative net assets of each series or the nature of the services performed and the relative applicability to each series.
Estimates — The preparation of financial statements in conformity with GAAP requires management to make estimates and assumptions that affect the reported amounts of assets and liabilities and the disclosure of contingent assets and liabilities at the date of the financial statements and the reported amounts of income and expenses during the reporting period. Actual results could differ from those estimates.
Federal income tax — It is each Fund’s policy to comply with the special provisions of Subchapter M of the Internal Revenue Code applicable to regulated investment companies. As provided therein, in any fiscal year in which a Fund so qualifies and distributes at least 90% of its taxable net income, the Fund (but not the shareholders) will be relieved of federal income tax on the income distributed. Accordingly, no provision for income taxes has been made.
In order to avoid imposition of the excise tax applicable to regulated investment companies, it is also each Fund’s intention to declare as dividends in each calendar year at least 98% of its net investment income (earned during the calendar year) and 98% of its net realized capital gains (earned during the twelve months ended October 31) plus undistributed amounts from prior years.
The tax character of distributable earnings at September 30, 2010 was as follows:
| | | The Jamestown Balanced Fund | | | The Jamestown Equity Fund | | | The Jamestown Tax Exempt Virginia Fund | |
Cost of portfolio investments | | $ | 17,271,045 | | | $ | 21,183,926 | | | $ | 29,550,202 | |
Gross unrealized appreciation | | $ | 3,570,656 | | | $ | 4,821,667 | | | $ | 2,158,556 | |
Gross unrealized depreciation | | | (249,133 | ) | | | (468,635 | ) | | | (815 | ) |
| Net unrealized appreciation on investments | | | 3,321,523 | | | | 4,353,032 | | | | 2,157,741 | |
| Accumulated undistributed ordinary income | | | 10,295 | | | | 33,303 | | | | — | |
Accumulated undistributed tax exempt income | | | — | | | | — | | | | 11,508 | |
Undistributed long-term gains | | | — | | | | — | | | | 19,652 | |
Capital loss carryforwards | | | (1,681,314 | ) | | | (3,234,415 | ) | | | — | |
Post-October losses | | | (109,105 | ) | | | (395,303 | ) | | | — | |
Other gains | | | 541,487 | | | | 877,233 | | | | 52,300 | |
Other temporary differences | | | (8,557 | ) | | | (1,649 | ) | | | (11,508 | ) |
Total distributable earnings | | $ | 2,074,329 | | | $ | 1,632,201 | | | $ | 2,229,693 | |
THE JAMESTOWN FUNDS NOTES TO FINANCIAL STATEMENTS (Continued) |
The difference between the federal income tax cost of portfolio investments and the Schedule of Investments cost for The Jamestown Balanced Fund and The Jamestown Equity Fund is due to certain timing differences in the recognition of capital gains or losses under income tax regulations and GAAP. These “book/tax” differences are temporary in nature and are primarily due to the tax deferral of losses on wash sales and/or differing methods in the amortization of market discount and premium on fixed income securities.
As of March 31, 2010, The Jamestown Balanced Fund and The Jamestown Equity Fund had the following capital loss carryforwards for federal income tax purposes:
| | | Amount | | | Expires March 31, | |
| The Jamestown Balanced Fund | | $ | 931,525 | | | | 2017 | |
| | | | 749,789 | | | | 2018 | |
| | | $ | 1,681,314 | | | | | |
| | | | | | | | | |
| The Jamestown Equity Fund | | $ | 1,615,894 | | | | 2017 | |
| | | | 1,618,521 | | | | 2018 | |
| | | $ | 3,234,415 | | | | | |
In addition, The Jamestown Balanced Fund and The Jamestown Equity Fund had net realized capital losses of $109,105 and $395,303, respectively, during the period November 1, 2009 through March 31, 2010, which are treated for federal income tax purposes as arising during the Funds’ tax year ending March 31, 2011. These capital loss carryforwards and “post-October” losses may be utilized in the current and future years to offset net realized capital gains, if any, prior to distribution to shareholders.
For the six months ended September 30, 2010, The Jamestown Balanced Fund reclassified $9,591 of overdistributed net investment income against accumulated net realized losses on the Statements of Assets and Liabilities due to permanent differences in the recognition of capital gains or losses under income tax regulations and GAAP. These differences are primarily due to the tax treatment of certain debt obligations and paydown adjustments. Such reclassification had no effect on the Fund’s net assets or net asset value per share.
For the six months ended September 30, 2010, The Jamestown Tax Exempt Virginia Fund reclassified $123 of undistributed net investment income against accumulated net realized gains on the Statements of Assets and Liabilities due to permanent differences in the recognition of capital gains or losses under income tax regulations and GAAP. These differences are primarily due to the tax treatment of certain debt obligations. Such reclassification had no effect on the Fund’s net assets or net asset value per share.
The Funds recognize the tax benefits or expenses of uncertain tax positions only when the position is “more likely than not” to be sustained assuming examination by tax authorities. Management has reviewed the tax positions taken on Federal income tax returns for all open tax years (tax years ended March 31, 2007 through March 31, 2010) of each Fund and has concluded that no provision for unrecognized tax benefits or expenses is required in these financial statements.
THE JAMESTOWN FUNDS NOTES TO FINANCIAL STATEMENTS (Continued) |
2. Investment Transactions
Investment transactions, other than short-term investments and U.S. government securities, were as follows for the six months ended September 30, 2010:
| | | The Jamestown Balanced Fund | | | The Jamestown Equity Fund | | | The Jamestown Tax Exempt Virginia Fund | |
Purchase of investment securities | | $ | 3,171,924 | | | $ | 6,649,229 | | | $ | 2,038,703 | |
| Proceeds from sales and maturities of investment securities | | $ | 5,332,923 | | | $ | 7,599,023 | | | $ | 3,801,343 | |
3. Transactions with Affiliates
INVESTMENT ADVISORY AGREEMENT
Each Fund’s investments are managed by Lowe, Brockenbrough & Company, Inc. (the “Adviser”) under the terms of an Investment Advisory Agreement. The Jamestown Balanced Fund pays the Adviser a fee, which is computed and accrued daily and paid monthly, at an annual rate of .65% of its average daily net assets up to $250 million, .60% of the next $250 million of such assets and .55% of such assets in excess of $500 million. The Jamestown Equity Fund pays the Adviser a fee at an annual rate of .65% of its average daily net assets up to $500 million and .55% of such assets in excess of $500 million. The Jamestown Tax Exempt Virginia Fund pays the Adviser a fee at an annual rate of .40% of its average daily net assets up to $250 million, .35% of the next $250 million of such assets and .30% of such assets in excess of $5 00 million. Certain Trustees and officers of the Trust are also officers of the Adviser.
During the six months ended September 30, 2010, the Adviser voluntarily undertook to limit the total annual operating expenses of The Jamestown Tax Exempt Virginia Fund to .69% of average daily net assets. Accordingly, the Adviser voluntarily waived $11,223 of its investment advisory fees during the six months ended September 30, 2010.
MUTUAL FUND SERVICES AGREEMENT
Under the terms of a Mutual Fund Services Agreement between the Trust and Ultimus Fund Solutions, LLC (“Ultimus”), Ultimus provides administrative, pricing, accounting, dividend disbursing, shareholder servicing and transfer agent services for the Funds. For these services, Ultimus receives a monthly fee from each Fund at an annual rate of .15% of its average daily net assets up to $25 million; .125% of the next $25 million of such assets; and .10% of such assets in excess of $50 million. The Jamestown Balanced Fund and The Jamestown Equity Fund are each subject to a minimum monthly fee of $4,000. The Jamestown Tax Exempt Virginia Fund is subject to a minimum monthly fee of $3,500. In addition, each Fund pays out-of-pocket expenses including, but not limited to, postage, supplies and costs of pricing portfolio securities. C ertain officers of the Trust are also officers of Ultimus, or of Ultimus Fund Distributors, LLC (the “Distributor”), the principal underwriter of each Fund’s shares and an affiliate of Ultimus. The Distributor is compensated by the Adviser (not the Funds) for acting as principal underwriter.
THE JAMESTOWN FUNDS NOTES TO FINANCIAL STATEMENTS (Continued) |
COMPLIANCE CONSULTING AGREEMENT
Under the terms of a Compliance Consulting Agreement between the Trust and Ultimus, Ultimus provides an individual to serve as the Trust’s Chief Compliance Officer and to administer the Funds’ compliance policies and procedures. For these services, the Funds pay Ultimus an annual base fee of $18,600 plus an asset-based fee equal to 0.01% per annum on the Funds’ aggregate net assets in excess of $100 million. In addition, the Funds reimburse Ultimus for reasonable out-of-pocket expenses, if any, incurred in connection with these services.
4. Brokerage Arrangement
In order to reduce the total operating expenses of The Jamestown Balanced Fund and The Jamestown Equity Fund, a portion of each Fund’s operating expenses have been paid through an arrangement with a third-party broker-dealer who is compensated through commission trades. Payment of expenses by the broker-dealer is based on a percentage of commissions earned.
Expenses reimbursed through the brokerage arrangement totaled $6,000 for each Fund for the six months ended September 30, 2010.
5. Contingencies and Commitments
The Funds indemnify the Trust’s officers and Trustees for certain liabilities that might arise from their performance of their duties to the Funds. Additionally, in the normal course of business the Funds enter into contracts that contain a variety of representations and warranties and which provide general indemnifications. The Funds’ maximum exposure under these arrangements is unknown, as this would involve future claims that may be made against the Funds that have not yet occurred. However, based on experience, the Funds expect the risk of loss to be remote.
6. Subsequent Events
The Funds are required to recognize in the financial statements the effects of all subsequent events that provide additional evidence about conditions that existed as of the date of the Statements of Assets and Liabilities. For non-recognized subsequent events that must be disclosed to keep the financial statements from being misleading, the Funds are required to disclose the nature of the event as well as an estimate of its financial effect, or a statement that such an estimate cannot be made. Management has evaluated subsequent events through the issuance of these financial statements and has noted no such events.
7. Recent Accounting Pronouncement
In January 2010, the Financial Accounting Standards Board (“FASB”) issued Accounting Standards Update (“ASU”) No. 2010-06 “Improving Disclosures about Fair Value Measurements.” ASU No. 2010-06 amends FASB Accounting Standards Codification Topic 820, Fair Value Measurements and Disclosures, to require additional disclosures regarding fair value measurements. Certain disclosures required by ASU No. 2010-06 are effective for interim and annual reporting periods beginning after December 15, 2009 and others for fiscal years beginning after December 15, 2010 and for interim periods within those fiscal years. Management is currently evaluating the impact ASU No. 2010-06 will have on the Funds’ financial statement disclosures.
THE JAMESTOWN FUNDS ABOUT YOUR FUNDS’ EXPENSES (Unaudited) |
We believe it is important for you to understand the impact of costs on your investment. As a shareholder of the Funds, you may incur two types of costs: (1) transaction costs; and (2) ongoing costs, including management fees and other Fund expenses. The following examples are intended to help you understand your ongoing costs (in dollars) of investing in the Funds and to compare these costs with the ongoing costs of investing in other mutual funds.
A mutual fund’s ongoing costs are expressed as a percentage of its average net assets. This figure is known as the expense ratio. The expenses in the table below are based on an investment of $1,000 made at the beginning of the period shown and held for the entire period (April 1, 2010 through September 30, 2010).
The table below illustrates each Fund’s costs in two ways:
Actual fund return – This section helps you to estimate the actual expenses that you paid over the period. The “Ending Account Value” shown is derived from each Fund’s actual return, and the third column shows the dollar amount of operating expenses that would have been paid by an investor who started with $1,000 in the Funds. You may use the information here, together with the amount you invested, to estimate the expenses that you paid over the period.
To do so, simply divide your account value by $1,000 (for example, an $8,600 account value divided by $1,000 = 8.6), then multiply the result by the number given for the Funds under the heading “Expenses Paid During Period.”
Hypothetical 5% return – This section is intended to help you compare the Funds’ ongoing costs with those of other mutual funds. It assumes that each Fund had an annual return of 5% before expenses during the period shown, but that the expense ratio is unchanged. In this case, because the returns used are not the Funds’ actual returns, the results do not apply to your investment. The example is useful in making comparisons because the Securities and Exchange Commission (“SEC”) requires all mutual funds to calculate expenses based on a 5% return. You can assess each Fund’s ongoing costs by comparing this hypothetical example with the hypothetical examples that appear in shareholder reports of other funds.
Note that expenses shown in the table are meant to highlight and help you compare ongoing costs only. The Funds do not charge sales loads or redemption fees.
The calculations assume no shares were bought or sold during the period. Your actual costs may have been higher or lower, depending on the amount of your investment and the timing of any purchases or redemptions.
More information about the Funds’ expenses, including annual expense ratios for the prior five fiscal years, can be found in this report. For additional information on operating expenses and other shareholder costs, please refer to the Funds’ prospectus.
THE JAMESTOWN FUNDS ABOUT YOUR FUNDS’ EXPENSES (Unaudited) (Continued) |
| | Beginning Account Value April 1, 2010 | Ending Account Value September 30, 2010 | Expenses Paid During Period* |
| The Jamestown Balanced Fund | | | |
Based on Actual Fund Return | $1,000.00 | $ 996.30 | $5.86 |
Based on Hypothetical 5% Return (before expenses) | $1,000.00 | $1,019.20 | $5.92 |
| The Jamestown Equity Fund | | | |
Based on Actual Fund Return | $1,000.00 | $ 975.20 | $5.35 |
Based on Hypothetical 5% Return (before expenses) | $1,000.00 | $1,019.65 | $5.47 |
| The Jamestown Tax Exempt Virginia Fund | | | |
Based on Actual Fund Return | $1,000.00 | $1,041.70 | $3.53 |
Based on Hypothetical 5% Return (before expenses) | $1,000.00 | $1,021.61 | $3.50 |
| * | Expenses are equal to the Funds’ annualized expense ratios for the period as stated below, multiplied by the average account value over the period, multiplied by 183/365 (to reflect the one-half year period). |
| The Jamestown Balanced Fund | 1.17% |
| The Jamestown Equity Fund | 1.08% |
| The Jamestown Tax Exempt Virginia Fund | 0.69% |
OTHER INFORMATION (Unaudited) |
A description of the policies and procedures that the Funds use to vote proxies relating to portfolio securities is available without charge upon request by calling toll-free 1-866-738-1126, or on the SEC’s website at http://www.sec.gov. Information regarding how the Funds voted proxies relating to portfolio securities during the most recent 12-month period ended June 30 is also available without charge upon request by calling toll-free 1-866-738-1126, or on the SEC’s website at http://www.sec.gov.
The Trust files a complete listing of portfolio holdings of the Funds with the SEC as of the end of the first and third quarters of each fiscal year on Form N-Q. The filings are available upon request, by calling 1-866-738-1126. Furthermore, you may obtain a copy of these filings on the SEC’s website at http://www.sec.gov. The Trust’s Forms N-Q may also be reviewed and copied at the SEC’s Public Reference Room in Washington, DC, and information on the operation of the Public Reference Room may be obtained by calling 1-800-SEC-0330.
This page intentionally left blank.
| | THE JAMESTOWN FUNDS Investment Adviser Lowe, Brockenbrough & Company, Inc. 1802 Bayberry Court Suite 400 Richmond, Virginia 23226 www.jamestownfunds.com Administrator Ultimus Fund Solutions, LLC P.O. Box 46707 Cincinnati, Ohio 45246-0707 (Toll-Free) 1-866-738-1126 Independent Registered Public Accounting Firm Ernst & Young LLP 1900 Scripps Center 312 Walnut Street Cincinnati, Ohio 45202 Legal Counsel Sullivan & Worcester LLP One Post Office Square Boston, Massachusetts 02109 Board of Trustees Austin Brockenbrough, III John T. Bruce Charles M. Caravati, Jr. Robert S. Harris J. Finley Lee, Jr. Richard L. Morrill Harris V. Morrissette Samuel B. Witt, III |
Not required
| Item 3. | Audit Committee Financial Expert. |
Not required
| Item 4. | Principal Accountant Fees and Services. |
Not required
| Item 5. | Audit Committee of Listed Registrants. |
Not applicable
| Item 6. | Schedule of Investments. |
| (a) | Not applicable [schedule filed with Item 1] |
| Item 7. | Disclosure of Proxy Voting Policies and Procedures for Closed-End Management Investment Companies. |
Not applicable
| Item 8. | Portfolio Managers of Closed-End Management Investment Companies. |
Not applicable
| Item 9. | Purchases of Equity Securities by Closed-End Management Investment Company and Affiliated Purchasers. |
Not applicable
| Item 10. | Submission of Matters to a Vote of Security Holders. |
The registrant’s Nominating Committee shall review shareholder recommendations to fill vacancies on the registrant’s board of trustees if such recommendations are submitted in writing, addressed to the Committee at the registrant’s offices and meet any minimum qualifications adopted by the Committee. The Committee may adopt, by resolution, a policy regarding its procedures for considering candidates for the board of trustees, including any recommended by shareholders.
| Item 11. | Controls and Procedures. |
(a) Based on their evaluation of the registrant’s disclosure controls and procedures (as defined in Rule 30a-3(c) under the Investment Company Act of 1940) as of a date within 90 days of the filing date of this report, the registrant’s principal executive officers and principal financial officer have concluded that such disclosure controls and procedures are reasonably designed and are operating effectively to ensure that material information relating to the registrant, including its consolidated subsidiaries, is made known to them by others within those entities, particularly during the period in which this report is being prepared, and that the information required in filings on Form N-CSR is recorded, processed, summarized, and reported on a timely basis.
(b) There were no changes in the registrant’s internal control over financial reporting (as defined in Rule 30a-3(d) under the Investment Company Act of 1940) that occurred during the second fiscal quarter of the period covered by this report that have materially affected, or are reasonably likely to materially affect, the registrant’s internal control over financial reporting.
File the exhibits listed below as part of this Form. Letter or number the exhibits in the sequence indicated.
(a)(1) Any code of ethics, or amendment thereto, that is the subject of the disclosure required by Item 2, to the extent that the registrant intends to satisfy the Item 2 requirements through filing of an exhibit: Not required
(a)(2) A separate certification for each principal executive officer and principal financial officer of the registrant as required by Rule 30a-2(a) under the Act (17 CFR 270.30a-2(a)): Attached hereto
(a)(3) Any written solicitation to purchase securities under Rule 23c-1 under the Act (17 CFR 270.23c-1) sent or given during the period covered by the report by or on behalf of the registrant to 10 or more persons: Not applicable
(b) Certifications required by Rule 30a-2(b) under the Act (17 CFR 270.30a-2(b)): Attached hereto
| Exhibit 99.CERT | Certifications required by Rule 30a-2(a) under the Act |
| Exhibit 99.906CERT | Certifications required by Rule 30a-2(b) under the Act |
SIGNATURES
Pursuant to the requirements of the Securities Exchange Act of 1934 and the Investment Company Act of 1940, the registrant has duly caused this report to be signed on its behalf by the undersigned, thereunto duly authorized.
(Registrant) Williamsburg Investment Trust
| By (Signature and Title)* | /s/ John F. Splain | |
| | John F. Splain, Secretary | |
| | | |
| Date | November 26, 2010 | | |
Pursuant to the requirements of the Securities Exchange Act of 1934 and the Investment Company Act of 1940, this report has been signed below by the following persons on behalf of the registrant and in the capacities and on the dates indicated.
| By (Signature and Title)* | /s/ John T. Bruce | |
| | John T. Bruce, President (FBP Value Fund and FBP Balanced Fund) | |
| | | |
| Date | November 26, 2010 | | |
| | | | |
| | | | |
| By (Signature and Title)* | /s/ Thomas W. Leavell | |
| | Thomas W. Leavell, President (The Government Street Equity Fund, The Government Street Mid- Cap Fund and The Alabama Tax Free Bond Fund) | |
| Date | November 26, 2010 | | |
| | | | |
| | | | |
| By (Signature and Title)* | /s/ Charles M. Caravati III | |
| | Charles M. Caravati III, President (The Jamestown Balanced Fund and The Jamestown Equity Fund) | |
| | | |
| Date | November 26, 2010 | | |
| | | | |
| | | | |
| By (Signature and Title)* | /s/ Joseph A. Jennings III | |
| | Joseph A. Jennings III, President | |
| | (The Jamestown Tax Exempt Virginia Fund) | |
| | | |
| Date | November 26, 2010 | | |
| | | | |
| | | | |
| By (Signature and Title)* | /s/ John P. Ackerly IV | |
| | John P. Ackerly IV, President | |
| | (The Davenport Core Fund) | |
| | | |
| Date | November 26, 2010 | | |
| | | | |
| | | | |
| By (Signature and Title)* | /s/ Mark J. Seger | |
| | Mark J. Seger, Treasurer | |
| | | |
| Date | November 26, 2010 | | |
* Print the name and title of each signing officer under his or her signature.