| OMB APPROVAL |
OMB Number: 3235-0570 Expires: January 31, 2014 Estimated average burden hours per response: 20.6 |
UNITED STATES
SECURITIES AND EXCHANGE COMMISSION
Washington, D.C. 20549
FORM N-CSR
CERTIFIED SHAREHOLDER REPORT OF REGISTERED
MANAGEMENT INVESTMENT COMPANIES
Investment Company Act file number 811-05685
Williamsburg Investment Trust
(Exact name of registrant as specified in charter)
| 225 Pictoria Drive, Suite 450 Cincinnati, Ohio | 45246 |
| (Address of principal executive offices) | (Zip code) |
W. Lee H. Dunham, Esq.
Sullivan & Worcester LLP One Post Office Square Boston, Massachusetts 02109
(Name and address of agent for service)
Registrant's telephone number, including area code: (513) 587-3400
Date of fiscal year end: March 31, 2012
Date of reporting period: September 30, 2011
Form N-CSR is to be used by management investment companies to file reports with the Commission not later than 10 days after the transmission to stockholders of any report that is required to be transmitted to stockholders under Rule 30e-1 under the Investment Company Act of 1940 (17 CFR 270.30e-1). The Commission may use the information provided on Form N-CSR in its regulatory, disclosure review, inspection, and policymaking roles.
A registrant is required to disclose the information specified by Form N-CSR, and the Commission will make this information public. A registrant is not required to respond to the collection of information contained in Form N-CSR unless the Form displays a currently valid Office of Management and Budget ("OMB") control number. Please direct comments concerning the accuracy of the information collection burden estimate and any suggestions for reducing the burden to Secretary, Securities and Exchange Commission, 450 Fifth Street, NW, Washington, DC 20549-0609. The OMB has reviewed this collection of information under the clearance requirements of 44 U.S.C. § 3507.
| Item 1. | Reports to Stockholders. |
 SEMI-ANNUAL REPORT September 30, 2011 (Unaudited) |
THE DAVENPORT FUNDS LETTER TO SHAREHOLDERS | October 20, 2011 |
Market Commentary
Equity investing hasn’t been very fun recently. In fact, we’ve just endured the toughest stretch for stocks since the 2008 financial crisis. Major stock indices declined during every month of the third quarter. The S&P 500 Index and Russell 2000 Index declined 13.9% and 21.9%, respectively, during the quarter ended September 30, 2011 and are now down 8.7% and 17.0%, respectively, on a year-to-date basis. Interestingly, the performance spread between large and small caps has become very noticeable during this tumultuous time. Perhaps most telling, the Dow Jones Industrial Average was down a more manageable 3.9% year-to-date. We entered the year thinking that large cap stocks should do well on a relative basis and that has proven to be the case thus far (although we’d rather it be under different circumstances).
We have a couple comments about performance. In terms of absolute performance, we think it’s important to put the market’s recent correction in perspective. Since March 2009 (the low point of the crisis), the S&P 500 has still gained over 60% through quarter end. Wide swings, including recent losses, have made for a bumpy and sometimes painful ride, but investors have nonetheless enjoyed a solid market recovery. Moving to relative performance, we note this has been a very tough year for active managers. In fact, J.P. Morgan recently reported this is the worst year for active managers since 1998 with nearly 50% of mutual funds under-performing their respective benchmarks by more than 2.5 percentage points. Stocks have been highly correlated, making it difficult for managers to differentiate themselves. We know relative performance doesn’t pay the bills, but are pleased that two of our three Funds are ahead of their benchmarks and the third isn’t far behind. Also, we sense a lot of investors have been whipsawed in this market and some have experienced big negative surprises. While we haven’t delivered big gains, we take pride in having stayed pretty consistent through turbulent times and not having delivered our shareholders any big surprises relative to how equity markets have behaved.
Clear signs of renewed economic weakness have emerged and have bolstered the case for a “double dip” recession. Unemployment remains elevated and the housing market continues to struggle. Furthermore, investor angst has been exacerbated by political discord out of Washington D.C. Politics in our country definitely seems to have hit a new low point and has eroded consumer, corporate and investor confidence. We also think market declines have taken on somewhat of a self-fulfilling nature. In other words, a prolonged downtrend has weighed on consumer and business demand, which in turn is weighing further on markets. While we have yet to see a broad based reduction of corporate earnings outlooks, we have seen some indications of weakness and the stock market is clearly saying there are more to follow. We definitely expect to hear some cautious commentary when companies report third quarter numbers in coming weeks.
We aren’t sure monetary policy can save us this time around. While current easy policy is expected to persist, there aren’t many more arrows in the Federal Reserve’s quiver. Recently, the Fed announced what was dubbed “Operation Twist.” Essentially, this entails shifting government bond purchases towards longer-dated notes with the intent of lowering long-term interest rates.
2
The Fed’s plans and a general flight to safety have driven up bond prices. A 10-year bond now yields less than 2% whereas a 30-year yields less than 3%. In theory, this would not only encourage borrowing, but would also entice investors to take on more risk in search of higher returns. Equities have performed quite poorly since the announcement as the marginal impact of these policy moves has been called into question. Meanwhile, commodity prices have plummeted giving rise to deflation worries (a significant change from six months ago when inflation was the focal point). Even Fed Chairman Ben Bernanke has noted that economic conditions are now more dependent on sound fiscal policy from Washington.
Unfortunately, government spending is needed at a time when governments can least afford to spend. Nations around the world are struggling beneath giant debt burdens following years of excess spending. Budget troubles are most evident in Europe, where the woes of specific nations such as Greece are threatening the vitality of the whole Eurozone and the viability of the Euro as a currency. The chickens also appear to be coming home to roost in the U.S., where spending cuts are at the heart of political rancor surrounding our record deficit. We recently noted it may be time to “take our medicine,” implying a long period of low growth alongside government austerity. This scenario is looking increasingly likely; however, it doesn’t mean economic growth will come to a halt. Furthermore, a period of government restraint and debt pay-down could ultimately sow the seeds for a stronger economy.
We are worried, but don’t believe we are in for a repeat of 2008. There’s no doubt that Europe’s problems will weigh on multinational companies and emerging markets are beginning to cool. Domestically, however, we aren’t coming off the same high as we were in ’08 and many industries are already operating at depressed levels. We think it currently makes sense to emphasize companies with a domestic bias. 2008 followed a period when many American individuals and companies did unwise things (mainly excessive borrowing) and growth was inflated. A financial/liquidity crisis, which we don’t expect to recur, prompted a period of more conservative behavior and repairing past mistakes. Now, companies generally are in good shape, many with little debt, large cash positions, lean cost structures and access to cheap capital. Corporate America is now much better suited to absorb any economic weakness.
Oftentimes, extreme levels of dread and uncertainty can lead to market gains as obstacles are overcome. We are hopeful that Eurozone leaders can arrange a comprehensive budget solution, even if it means slower growth in coming years. We are also hopeful that U.S. leadership will introduce constructive economic policy that instills confidence in businesses and consumers. Who knows, maybe the threat of not being re-elected in 2012 will drive more decisive action by many politicians? Market weakness has been very broad based and many companies are trading at low double-digit earnings multiples. It would appear that a lot of bad news is reflected in current stock prices. We continue to focus on companies we know and like best. In doing so, we believe we can lay the foundation for years of strong absolute and relative performance. We thank you for your trust and look forward to reporting back to you at year end.
Davenport Core Fund
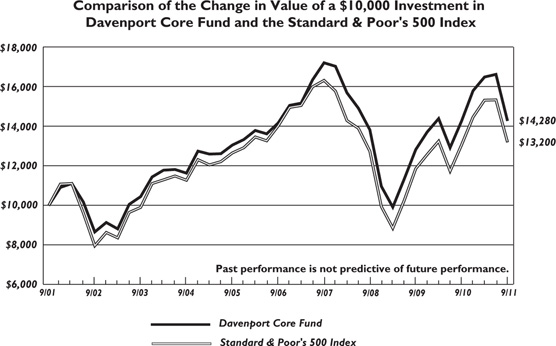
The following chart represents Davenport Core Fund (the “Fund”) performance and the performance of the S&P 500 Index*, the Fund’s primary benchmark, for the periods ended September 30, 2011.
3
Q3 | 1 Year | 3 Years** | 5 Years** | 10 Years** | Since Inception** (1/15/98) | Expense Ratio: | |
| DAVPX | -14.06 | 0.17 | 1.12 | 0.17 | 3.63 | 3.17 | 0.97% |
| S&P 500 | -13.87 | 1.14 | 1.23 | -1.18 | 2.82 | 3.09 |
Past performance is no guarantee of future results. Investment return and principal value of an investment will fluctuate so that an investor’s shares, when redeemed, may be worth more or less than their original cost. Current performance may be lower or higher than the performance data quoted. Performance data, current to the most recent month end, may be obtained by calling 1-800-281-3217.
| * | The S&P 500 Index is comprised of 500 U.S. stocks and is an indicator of the performance of the overall U.S. stock market. An investor cannot invest in an index and its returns are not indicative of the performance of any specific investment. |
| ** | Annualized. |
The Core Fund declined 14.06% during the third quarter, roughly in line with the S&P 500’s 13.87% tumble. Year to date, the Fund is down 9.54%, slightly trailing the 8.68% decline for the S&P 500. While large cap stocks fared better versus their smaller brethren, they were not spared from the global flight to safety (namely cash and U.S. Treasuries).
The combination of intense volatility and high correlations allowed few standouts in terms of absolute performance during the quarter. Ironically, after expressing our frustrations with large cap technology in our last letter, shares of Apple (AAPL) came to life, posting a gain in the mid teens. Other top performers included Dollar Tree (DLTR), McDonald’s (MCD) and American Tower (AMT), which all have the common thread of relatively insulated earnings streams. Smaller cap cyclical stocks such as CarMax (KMX) and Albemarle (ALB) were among the biggest detractors for the period. However, in each case, we are willing to look through near term volatility in results given a high level of confidence in longer term earnings power.
The Financials sector was the largest source of relative performance during the quarter as names such as Markel (MKL), Berkshire Hathaway (BRK/B) and Brookfield Asset Management (BAM) performed better than banks and other credit sensitive entities. While we have enjoyed our light exposure to banks, weakness provided a great opportunity to add to a credit sensitive name such as Capital One (COF). We believe 2012 earnings of $6.00+ seem achievable in light of credit and loan growth trends. Moreover, the company’s recent proposed acquisitions of ING Direct and HSBC’s credit card business should increase scale, improve profitability and generate significant cross selling opportunities down the road. We also added to our position in Berkshire Hathaway (BRK/B) at a slight premium to book value. Put simply, we thought the stock was too cheap given the company’s collection of above average businesses, immense cash flows and impressive history of capital allocation. While we realize “The Oracle” will not be around forever, we believe Mr. Buffett has built a valuable franchise capable of creating value long after he retires. Apparently, Mr. Buffet agrees as evidenced by the uncharacteristic share repurchase authorization the company announced near quarter end.
Excluding a strong quarter from recently purchased Dollar Tree (DLTR), the Consumer Discretionary sector had a rough go as troublesome economic data, European financial issues and market volatility pushed consumer confidence to new lows. As we enter a period likely
4
characterized by slow demand growth, we are attracted to capacity constrained industries that can maintain pricing power. As such, we sold our position in Ford Motor (F) and initiated a position in leading luxury hotel operator, Starwood Hotels (HOT). While we think auto demand will eventually recover, we are still concerned there may be overcapacity in the industry. On the other hand, hotel supply growth has been virtually dormant since the financial crisis. We believe that this phenomenon, coupled with an expectation for negligible supply growth over the next couple of years, provides a structural tailwind that should be supportive of occupancy, room rates and revenue per available room (RevPAR) for HOT. Given the company’s quality product offering, loyal customer base and meaningful operating leverage, we expect earnings to ramp significantly as the company captures these trends. Furthermore, we purchased the shares at valuation levels not seen since the beginning of 2009, which we think paves the way for significant upside as the aforementioned trends manifest and the stock’s multiple expands.
Near the end of the quarter, we initiated a position in the world’s largest food and beverage company, Nestlé (NSRGY). We think Nestlé is a great example of an all weather stock that can do well in a variety of market environments. For one, management has an impressive track record of value creation and the business produces returns on capital in the low 30% range. The company’s leading brands (Nestlé, Nescafé, Jenny Craig, Perrier, Pure Life, etc.) and unrivaled manufacturing scale create significant competitive advantages and enable pricing power with lead retailers. In addition to these defensive qualities, the company derives one third of its revenues from emerging markets, where it continues to invest in growth opportunities. Moreover, Nestlé has a rock solid balance sheet it can use to augment both top line growth through acquisitions and per share value through the repurchase of stock. We believe the combination of these characteristics pave the way for low risk, solid growth in revenues and earnings that should demand a premium valuation in today’s environment.
As we ponder recent results and survey the current market backdrop we continue to conclude that quality matters. Though the “dash to trash” following the meltdown of 2008-9 sent stocks of the lowest quality flying, we note that we are no longer dealing with an environment where companies are on the verge of collapse amid rampant leverage and frozen credit. Therefore, with different ingredients in place this time, we don’t expect junk to lead the market. In a low growth environment, large cap stocks should outperform given that they are generally cheap, have strong balance sheets and should be able to augment returns via buybacks and dividends. Furthermore, should things recover more quickly than expected; we don’t expect them to be left in the dust.
New Positions
Nestlé S.A. - ADR (NSRGY) Nestlé is the largest food and beverage company in the world with a diverse product portfolio that includes brands such as Nestlé, Nescafe, Jenny Craig, Perrier and Pure Life. Nestlé’s diverse product offering, manufacturing scale and global distribution network create significant competitive advantages. Moreover, the company’s leading brands and product breadth enable pricing power with lead retailers, protecting the company against rising input costs. In addition to its defensive qualities, the company has significant exposure to emerging markets where it continues to invest in growth opportunities. We believe the combination of these characteristics pave the way for low risk, solid growth in revenues and earnings over the next few years. Furthermore, we point out that the company has a massive cash position with which it can augment earnings growth via acquisitions or share buybacks. Though the shares trade at a slight premium to peers, we believe this is warranted due to the aforementioned factors.
5
Starwood Hotels & Resorts Worldwide, Inc. (HOT) Starwood is the largest operator of luxury and upscale hotels in the world. Company franchises including Sheraton, Westin, W Hotels, St. Regis and Aloft are well known throughout the world, enjoy a loyal customer base and have low levels of competition relative to others in the industry. In recent months the stock (alongside the lodging sector) has underperformed the market as investors have shed “risk” in the midst of slowing sector/economic data, European concerns and turmoil in the Middle East. With the stock off 30+% year-to-date, and now trading at valuation levels not seen since January of 2009, we think the risk reward profile is compelling. Despite an uncertain global economic backdrop and weak consumer demand expectations, a dearth of hotel supply growth should continue to support pricing across the industry over the next few years. This, in tandem with HOT’s high quality luxury brands, loyal customer base and meaningful exposure to business travel (corporations are still flush with cash), should support solid RevPAR (revenue per available room) growth. Given the significant operating leverage in the company’s business model, we believe results should continue to improve and could warrant an upward revision in the stock’s multiple. Put simply, we think this stock may have upside into the $60s while further downside should be limited.
Increased Positions
Berkshire Hathaway, Inc. - Class B (BRKB) Berkshire is a financial holding company with a wide variety of subsidiaries engaged in business activities ranging from insurance, manufacturing, retail, railroads, energy and finance. The stock is well off recent highs due to weak insurance results, anemic investment portfolio returns and concerns surrounding the company succession plan; however, at 1.1x book value we think the shares are a great deal. While BRK.B is a conglomerate by most standards, we believe it holds a portfolio of above average businesses, with sustainable competitive advantages and strong returns on capital that should have meaningful leverage to any cyclical recovery. Furthermore, should the economic backdrop worsen, the company has almost $30 billion for famed investor Warren Buffett to deploy as he sees fit. Though we realize he will not be around for much longer, we believe Mr. Buffett has built a valuable franchise that is capable of compounding value long after he retires. As such, we believe the risk reward profile is compelling at current levels.
Capital One Financial Corporation (COF) COF is the 5th largest U.S. credit card provider, with operations in auto lending, consumer installment lending, small business lending and deposit taking activities. The stock has been very weak alongside other credit sensitive financials amid recent market turmoil. We thought this was an opportune time to add to the position given the company’s improving credit profile, significant earnings power and ability to generate capital internally.
Caterpillar, Inc. (CAT) Caterpillar is the world’s largest manufacturer of earthmoving equipment, with a significant presence in the manufacture of construction equipment, material handling machinery, engines (diesel and natural gas) and turbines. We continue to believe CAT is one of the highest quality names in the Industrials space and point out that the company has emerged from the recent economic crisis a leaner entity with much greater earnings power. While various sectors of the economy are showing signs of slowing, CAT’s results have continued to press on. Ultimately, we think EPS power of $12-$14 per share is achievable as demand recovers and the company integrates its recent acquisition of Bucyrus.
6
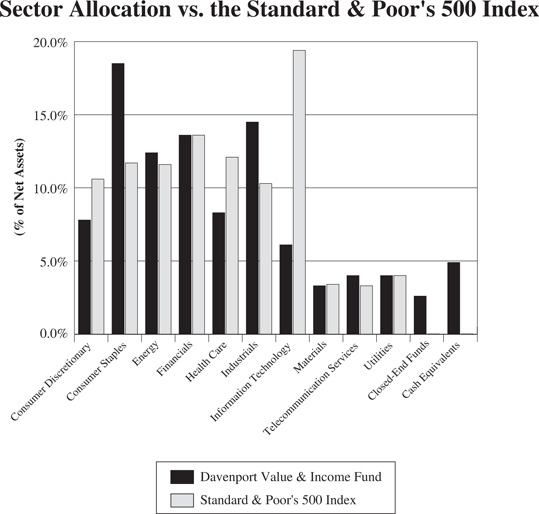
Davenport Value & Income Fund
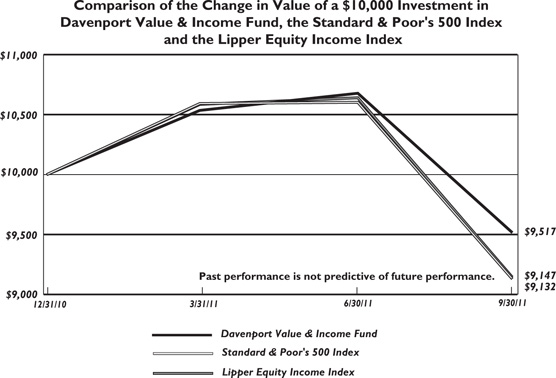
The following chart represents Davenport Value & Income Fund (the “Fund”) performance and the performance of the S&P 500 Index*, the Fund’s primary benchmark, and the Lipper Equity Income Index* for the periods ended September 30, 2011.
Q3 2011 | Since Inception 12/31/2010 | Expense Ratio | |
| DVIPX | -10.86 | -4.83 | 1.09% |
| S&P 500 | -13.87 | -8.68 | |
| Lipper Equity Income Index | -14.04 | -8.53 |
Past performance is no guarantee of future results. Investment return and principal value of an investment will fluctuate so that an investor’s shares, when redeemed, may be worth more or less than their original cost. Current performance may be lower or higher than the performance data quoted. Performance data, current to the most recent month end, may be obtained by calling 1-800-281-3217.
| * | The S&P 500 Index is comprised of 500 U.S. stocks and is an indicator of the performance of the overall U.S. stock market. The Lipper Equity Income Fund Index is an unmanaged index of the 30 largest funds, based on total year-end net asset value, in the Lipper Equity Income Fund Index. An investor cannot invest in an index and its returns are not indicative of the performance of any specific investment. |
The Value & Income Fund had a rough quarter but held in well versus the market. The Fund was down 10.86%, outpacing the 13.87% decline for the S&P 500 Index and the 14.10% decline for the Lipper Equity Income Index. The Fund is now off 4.83% for the year, still well ahead of the 8.68% decline for the S&P 500 Index and the 8.53% decline for the Lipper Equity Income Index. Though we never enjoy reporting negative numbers, we are pleased with the way the Fund has behaved in such a difficult market.
For the second quarter in a row, the Fund’s’s Financials holdings generated strong relative performance. While much of this was due to lower exposure to the banking sector, we enjoyed another solid quarter of gains from Walter Investment Management (WAC). Given the elimination of the dividend and the company’s REIT status as a result of its merger with Green Tree, we used strength in the stock as an opportunity to exit our position in WAC. Other top performers during the period included Consumer Discretionary stocks VF Corp. (VFC) and McDonald’s (MCD). We decided to chip each of these holdings following recent strength; however, we are impressed by each company’s execution in the current consumer environment and remain encouraged by their longer term prospects. Due to problems plaguing the Euro Zone, international telecom holdings Vodafone (VOD) and Telefonica (TEF) underperformed their sectors. However, the Fund’s biggest detractors for the quarter were more cyclical holdings such as Encana (ECA) and Watsco (WSO).
Near the beginning of the quarter, we purchased a position in the world’s largest retailer, Wal-Mart (WMT). We think Wal-Mart is a great example of a large company that can still create significant value in a low growth environment. Though the company’s growth prospects are not what they used to be; we believe this classic growth story has morphed into an attractive value situation. Over the years the company has built a valuable competitive advantage through its low cost leadership and scalable distribution network. Domestic growth has stalled during the economic
7
downturn; however, the business continues to generate immense amounts of cash. Meanwhile the company is growing internationally with significant room for further expansion. Perhaps most importantly, management has gotten much more aggressive with capital management via increased share buybacks. Put simply, we think the company can buy back around 8% of its stock a year using internally generated cash flow. Assuming this level of buybacks alongside the 2.75% dividend yield, provides the potential for double digit returns on a per share basis.
We continue to emphasize quality in the Fund, adding to Travelers (TRV) and initiating a position in Southern Company (SO). Each of these companies is well respected in its industry, and has strong cash flows that should continue to support dividend growth. Travelers trades at a discount to book value and also appears cheap on a P/E basis. We thought this was attractive in light of the company’s solid balance sheet, focus on buybacks and solid dividend that yields 3.3%. Furthermore, it is hard to imagine things getting much worse for the company’s property & casuality insurance business given low interest rates (hurts investment income) and recent weather events. Southern is one of the largest regulated utilities in the U.S. While a bit more expensive, SO has a deep, highly regarded management team that has produced industry leading returns while being great proponents of shareholder value. The $1.89 dividend yields 4.5%, and has remained stable or increased for over 240 consecutive quarters (>60 years). Given its solid yield, high quality assets and attractive returns, we believe SO should perform well in the context of a slow growth economy and persistently low interest rates.
Though the Fund benefitted from a defensive bias throughout the quarter, we found that some of the best bargains were among the more cyclical names. While we can’t rule out a meaningful slowdown, we note that most companies’ cost structures are much improved and downside risk to earnings simply isn’t what it was headed into 2008. As such, we took advantage of what appeared to be great buying opportunity in Dow Chemical (DOW) which seems to be discounting a scenario in which earnings return to near 2008-2009 levels. Dow is the second largest chemical company in the world. While the company’s earnings are clearly cyclical, we are attracted to its diversified product mix and capital light approach to expansion. Given a sustainable dividend yielding 4.0%, a cheap valuation and long-term earnings tailwinds resulting from an abundance of cheap natural gas, we felt DOW was a solid fit for this Fund.
Low interest rates should continue to benefit income generating stocks for some time. At quarter end, the Fund’s yield stood at 3.6% versus the 10-year treasury at 1.9%. Though equities certainly contain more risk, the income component continues to be meaningful. As we look ahead, we feel the Fund is positioned to perform well as we enter what appears to be a period of persistently low interest rates and slower growth.
New Positions
Dow Chemical Company (The) (DOW) DOW is the second largest chemical company in the world, providing chemical, plastic and agricultural products and services to a diverse array of end markets. The stock has been pummeled in recent weeks alongside other cyclical names as economic concerns and fears surrounding global financial instability cascaded through markets. We viewed this as an opportunity to pick up some cyclical exposure in a depressed name at an attractive valuation with a solid yield (3.5%). Longer term, given an abundance of cheap, liquids-rich natural gas in the U.S., we think DOW’s cost advantage as a domestic producer of plastics (key feedstock for plastics is derived from natural gas liquids) distinguishes the company from other cyclical industrial commodity plays. Because of its defensive bias, the company has
8
performed very well recently relative to broader market indices. While we remain comfortable with our sector allocations in addition to the individual stocks we own, we believe some of the best bargains in the market are among the more cyclical names.
Southern Company (The) (SO) SO is one of the largest regulated utilities in the U.S., serving 4.4 million customers through its four electric utilities in Alabama, Georgia, Florida and Mississippi. The company is well positioned in stable/friendly regulatory environments that offer attractive demographics. SO has a deep, highly regarded management team that has produced industry leading returns while being great proponents of shareholder value. The $1.89 dividend yields 5.0%, and has remained stable or increased for over 240 consecutive quarters (>60 years). Given its solid yield, high quality assets and attractive returns, we believe SO should perform well in the context of a slow growth economy and persistently low interest rates.
Wal-Mart Stores, Inc. (WMT) WMT is the world’s largest retailer, with roughly 9,000 discount stores, superstores and warehouse centers located in 15 different countries. Like many large company growth stocks, WMT has seen earnings and dividends grow over the past ten years, yet the stock price has gone nowhere because of significant multiple contraction. Though we concede some multiple compression was warranted as the stock was overpriced at its peak and growth prospects are not what they used to be, we believe this classic growth story has morphed into an attractive value situation. Over the years the company has built a valuable competitive advantage through its low cost leadership and scalable distribution network. Domestic growth has stalled during the economic downturn; however, the business continues to generate immense amounts of cash. Meanwhile the company is growing internationally with significant room for further expansion. Perhaps most importantly, management has gotten much more aggressive with capital management (i.e. accelerated its buyback program) which should significantly magnify earnings and dividend growth (currently yields 2.7%) at the per share level. We feel that at 12x EPS, the shares inadequately reflect the potential value creation within the company.
Increased Positions
Fidelity National Financial, Inc. – Class A (FNF) After acquiring the bankrupt title operations of LandAmerica Financial in late 2008, FNF became the largest title insurer in the U.S. with roughly 44% market share of the $10 billion title premium market. Though housing has not shown many signs of recovery, it is difficult to imagine the environment getting much worse. Assuming the market is in the process of bottoming, we believe the risk/reward for FNF (and housing related stocks in general) is compelling given its cheap valuation and long term earnings power. As a reminder, we believe the long term EPS power of FNF is significant as housing transactions recover given their diligent cost focus and scale advantage resulting from the LandAmerica transaction. In the meantime, the company trades at a modest premium to book value and pays a solid dividend yielding ~3.0%.
Travelers Companies, Inc. (The) (TRV) Travelers is a leading provider of property and casualty insurance, with roughly one third of its business coming from personal lines and the balance generated through commercial lines. Following recent weakness, the stock trades at a discount to book value and also appears cheap on a P/E basis. We believe this is attractive in light of the company’s strong balance sheet, focus on share buybacks and a solid dividend that continues to grow. While recent results have suffered from anomalistic levels of catastrophic losses, we believe future pricing (and ultimately earnings) could benefit from these events. As such, we believe the risk-reward profile is compelling at current levels. The stock currently yields 3.2%.
9
Watsco, Inc. (WSO) Disappointing Q2 results and general market weakness have caused the shares to decline meaningfully from recent highs. Though economic uncertainty continues to delay a replacement cycle in HVAC equipment, we believe the company is executing well in a tough environment and still appears poised to deliver significant earnings growth as demand returns. The company’s strong balance sheet, attractive dividend yield and heavy insider ownership continue to support our excitement surrounding this attractive multi-year growth story. As such, we elected to use recent weakness as an opportunity to add to the position. the largest independent distributor of heating, ventilation, air conditioning (HVAC) and refrigeration equipment, parts, and supplies in the U.S. The stock currently yields 3.4%.
Davenport Equity Opportunities Fund
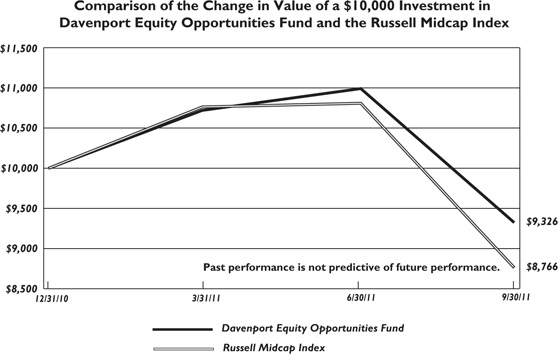
The following chart represents Davenport Equity Opportunities Fund (the “Fund”) performance and the performance of the Russell Midcap Index*, the Fund’s primary benchmark, and the S&P 500 Index* for the periods ended September 30, 2011.
Q3 2011 | Since Inception 12/31/2010 | Expense Ratio | |
| DEOPX | -15.14 | -6.74 | 1.15% |
| Russell Midcap Index | -18.90 | -12.34 | |
| S&P 500 Index | -13.87 | -8.68 |
Past performance is no guarantee of future results. Investment return and principal value of an investment will fluctuate so that an investor’s shares, when redeemed, may be worth more or less than their original cost. Current performance may be lower or higher than the performance data quoted. Performance data, current to the most recent month end, may be obtained by calling 1-800-281-3217.
| * | The Russell Midcap Index measures the performance of the 800 smallest companies in the Russell 1000, which represent approximately 25% of the total market capitalization of the Russell 1000. The S&P 500 Index is comprised of 500 U.S. stocks and is an indicator of the performance of the overall U.S. stock market. An investor cannot invest in an index and its returns are not indicative of the performance of any specific investment. |
The Equity Opportunities Fund declined 15.14% relative to an 18.90% decline for the Russell Midcap Index and a 13.87% drop for the S&P 500. Year-to-date, the Equity Opportunities Fund was down 6.74% at quarter end versus a 12.34% decline for the Russell Midcap and an 8.68% drop for the S&P 500. Perhaps most astonishing, the Russell 2000 declined a whopping 21.87% in Q3 and is now down 17.02% year-to-date. Suffice it to say, we don’t like reporting negative numbers and are unhappy to see solid gains be quickly erased. However, we do take some comfort in having held in relatively well versus the broader market, especially small and mid-cap indices.
As noted in our Market Commentary, this has been a very difficult year for managers to differentiate themselves given high correlations among stocks. Fortunately, we’ve been able to separate ourselves somewhat due to the solid performance of a few holdings. Companies with resilient earnings streams like Church & Dwight (CHD), ITC Holdings (ITC), American Tower (AMT) and O’Reilly (ORLY) actually managed small gains this past quarter. On the other hand, more cyclical consumer stocks such as CarMax (KMX) and Penn National (PENN) were big drags on performance. These two stocks are currently some of our largest holdings and we think the earnings streams of both companies will be more durable than currently expected. We were
10
also stung by our holdings in the Energy complex, namely Plains Exploration (PXP) and Ultra Petroleum (UPL). Fortunately, our small weighting in Energy stocks has helped limit downside versus the broader market as commodity prices have plummeted. The Financials sector has also been a source of positive relative performance for us. While our Financials holdings were down a bit, we have generally been light in credit sensitive areas (e.g. banks) that have been extremely weak.
In tough times, we think it’s important to have the conviction to add to favorite holdings. When the market swooned in early August, we bought more American Tower (AMT) and Brookfield Asset Management (BAM). We had been patiently waiting for an opportunity to own more of each and broad based market weakness gave us our chance. Both companies should be able to continue growing even in a tough environment and have held up relatively well since our recent purchases. Other additions involved more cyclical entities and were not quite as timely. For instance, we added to specialty chemical producer Albemarle (ALB) in early September after the stock had nosedived from over $70/share to roughly $48. Since then, the stock has dropped further into the high $30’s. We think the shares have now gone a long way towards discounting the likelihood of lower earnings next year. Even though we didn’t time the bottom, we expect to make money in the stock long-term. We also reduced a few positions at good prices. We chipped both Church & Dwight (CHD) and Fidelity National Financial (FNF) near 52-week highs and sold our position in Expedia (EXPE) not far from the stock’s high. We like the idea of recycling capital from these names into more depressed names with brighter outlooks.
We also like the idea of buying companies with embedded growth stories that aren’t solely dependent on the global economy. One example is International Game Technology (IGT) which is the world’s leading maker of slot machines and a name we have been familiar with for many years. We were able to establish a position just below $14/share. The stock peaked at nearly $50 a few years ago as new gaming jurisdictions were opening, a slot replacement cycle was booming, the company was taking market share and a buoyant economy was supporting participation games (machines where IGT takes a percent of daily win rather than sell the machine). Then, the replacement cycle came to a screeching halt, competitors started to regain their momentum and the economy cooled. As this was happening, IGT seemed to lose its creative edge and management lost some credibility. A couple years ago, IGT brought in new a CEO, who subsequently hired a new COO and new CTO (Chief Technology Officer). Since that time, the company has changed its focus and seems to be in the early stages of executing a successful turnaround. The company’s cost structure has been right-sized, new games seem to be gaining traction and the company’s market share is improving. Also, new management is very focused on returns on capital and value per share. The macro backdrop hasn’t improved much, but the company’s internal efforts, market share improvement and capital allocation practices seem to be ingredients for good share performance even in the absence of economic strength. At 12.5 times EPS estimates that should prove relatively sturdy, we feel like we’re getting a decent deal.
Another example is Colfax (CFX). Colfax is principally a pump manufacturer serving a variety of end markets including commercial marine, oil & gas and power generation. The company is in the process of acquiring Charter plc, which makes air and gas handling equipment as well as welding and cutting equipment. Colfax was capitalized by Mitch and Steve Rales, who are best known for their value creation at Danaher (DHR). The Rales own over 40% of Colfax and, while there is no way to insure a repeat of past success, we like having them as partners. CFX has weathered a very tough operating environment and posted impressive margin gains. Moreover, the
11
proposed acquisition of Charter could be transformational. While it entails taking on significant debt and increasing exposure to some markets that seem to be fragile at the moment (Europe and emerging markets), CFX has the opportunity to dramatically improve the profitability of an under-performing enterprise. While a global economic collapse could render our thesis irrelevant, this deal could yield multiple years of double-digit earnings growth even in a low growth environment.
In summary, our relative performance feels pretty good, but this clearly isn’t the year we were anticipating in terms of absolute performance. Some cooling off was to be expected after a big two year advance, but the degree of recent weakness has caught us off guard. Our main focus right now is continuing to optimize the Fund for future performance. This entails “high grading” the Fund by adding to favorite names, opportunistically seeking new opportunities and reducing exposure to areas where our conviction levels have waned. We feel like our recent moves have been steps in the right direction.
New Positions
Capital One Financial Corporation (COF) COF has been dragged down alongside other credit sensitive Financials and we think the risk/reward in the stock is very attractive right here. The yields on COF’s credit card portfolio are very attractive (especially when compared to bank assets) and the company has announced some sizeable acquisitions that could be very accretive. We think the company could be capable of earning $7.00/share and could ultimately trade to the $80 level. Also, we have benefitted from being light credit sensitive Financials in this Fund (we haven’t owned any banks). Now seems to be a good time to be looking at this depressed area, especially a unique growth story like COF.
Colfax, Inc. (CFX) Colfax is principally a pump manufacturer serving a variety of end markets including commercial marine, oil and gas, power generation, global navies and general industry. The company has a strong global presence with roughly 70% of sales outside of the U.S. The company is in the process of acquiring Charter plc which operates through two segments. The company’s ESAB segment supplies welding and cutting equipment and consumables. The company’s Howden segment designs and supplies air and gas handling equipment, particularly for the power generation industry.
International Game Technology (IGT) IGT is the world’s leading maker of slot machines. A couple years ago, IGT brought in new a CEO. Subsequently, the company hired a new COO and new CTO (Chief Technology Officer). Since that time, the company has changed its focus and seems to be in the early stages of executing a successful turnaround. The company’s cost structure has been right sized, new games seem to be gaining traction with casino operators and the company’s market share is improving. New management is very focused on returns on capital and value per share. Debt has been paid down and the company has started buying back stock. The macro backdrop hasn’t improved much, but the company’s internal efforts, market share improvement and capital allocation practices seem to be ingredients for good share performance even in the absence of economic strength.
Tessera Technologies, Inc. (TSRA) While an unusual story, the stock seems to have a very favorable risk/reward profile right here. In addition to a patent licensing business, TSRA has over $10/share of net cash (and growing). On a sum-of-the-parts basis, we think the stock should be worth more and believe downside should be cushioned by the company’s growing cash balance. The company lowered guidance last week and we are buying it near its lows.
12
Increased Positions
Albemarle Corporation (ALB) Albemarle is a specialty chemical company that operates in three segments: Polymer Solutions (includes flame retardants), Catalysts (refinery catalysts and others used in production of plastics) and Fine Chemistry (elemental bromine and third party services). While we are respectful of the risks to economic growth and the uncertainty surrounding demand in cyclical industries such as specialty chemicals, we believe the consensus has become overly pessimistic and that the selloff in the shares is overdone. Though exposed to cyclical factors, ALB participates in markets with attractive supply/demand characteristics that have continued to produce impressive results. Furthermore, the company has a credible management team that we believe has set an achievable goal of doubling EPS to >$9 by 2015. We elected to use recent weakness to add to this high quality situation with significant upside potential.
American Tower Corporation – Class A (AMT) AMT owns cell phone towers and leases space on those towers to wireless carriers. With the explosion of wireless devices, demand for new tower and space on existing tower continues to increase. Also, these are multi-year deals with annual price escalators, which provide some growth visibility. This business requires little capital and generates significant free cash flow. The company is now emulating its U.S. success abroad, having acquired towers in many other countries. The company is exceptionally well run, capable of growing even in a no/low growth environment, and very shareholder oriented. Also, the company will convert to a REIT at year end and begin paying a dividend, which should attract a broader shareholder base.
Brookfield Asset Management, Inc. (BAM) BAM owns and manages hard assets including hydroelectric power, electric transmission, timber and commercial real estate. Its assets have high barriers to entry, long lives and stable/predictable cash flows. The company also has significant excess liquidity and a proven track record of opportunistically buying assets. Lastly, it has a growing asset management business (investing third party capital) that is quickly scaling as hard assets become more appealing in a world where the value of many paper assets is being questioned. The company is exceptionally well run, capable of growing even in a no/low growth environment, and very shareholder oriented.
Lamar Advertising Company – Class A (LAMR) LAMR has been a big disappointment this year and one of our worst performing stocks. Lamar faces numerous headwinds including slowing local advertising growth, rising capital expenditure requirements and blossoming competition from mobile advertising. However, even in a flattish environment, this business will still generate significant free cash flow (perhaps $2.50/share), which can be used to de-lever and ultimately buy back stock. Also, the conversion to digital billboards creates an interesting re-investment opportunity for LAMR.
13
DAVENPORT CORE FUND
PERFORMANCE INFORMATION (Unaudited)
Average Annual Total Returns(a) (for periods ended September 30, 2011) | |||
| 1 Year | 5 Years | 10 Years | |
| Davenport Core Fund | 0.17% | 0.17% | 3.63% |
| Standard & Poor’s 500 Index | 1.14% | -1.18% | 2.82% |
| (a) | The total returns shown do not reflect the deduction of taxes that a shareholder would pay on Fund distributions or the redemption of Fund shares. |
14
DAVENPORT VALUE & INCOME FUND
PERFORMANCE INFORMATION (Unaudited)
Total Returns(a) (for period ended September 30, 2011) | |
Since Inception(b) | |
| Davenport Value & Income Fund | -4.83% |
| Standard & Poor’s 500 Index | -8.68% |
| Lipper Equity Income Index | -8.53% |
| (a) | The total return shown does not reflect the deduction of taxes that a shareholder would pay on Fund distributions or the redemption of Fund shares. |
| (b) | Commencement of operations was December 31, 2010. |
15
DAVENPORT EQUITY OPPORTUNITIES FUND
PERFORMANCE INFORMATION (Unaudited)
Total Returns(a) (for period ended September 30, 2011) | |
Since Inception(b) | |
| Davenport Equity Opportunities Fund | -6.74% |
| Russell Midcap Index | -12.34% |
| (a) | The total return shown does not reflect the deduction of taxes that a shareholder would pay on Fund distributions or the redemption of Fund shares. |
| (b) | Commencement of operations was December 31, 2010. |
16
DAVENPORT CORE FUND
PORTFOLIO INFORMATION
September 30, 2011 (Unaudited)
Top Ten Equity Holdings
| Security Description | % of Net Assets |
| Exxon Mobil Corporation | 2.8% |
| International Business Machines Corporation | 2.6% |
| Apple, Inc. | 2.6% |
| Berkshire Hathaway, Inc. - Class B | 2.6% |
| QUALCOMM, Inc. | 2.5% |
| American Tower Corporation - Class A | 2.4% |
| Brookfield Asset Management, Inc. - Class A | 2.4% |
| Chevron Corporation | 2.3% |
| Markel Corporation | 2.3% |
| Millicom International Cellular S.A. | 2.2% |
17
DAVENPORT VALUE & INCOME FUND
PORTFOLIO INFORMATION
September 30, 2011 (Unaudited)
Top Ten Equity Holdings
| Security Description | % of Net Assets |
| Royal Dutch Shell plc - Class A - ADR | 2.8% |
| GlaxoSmithKline plc - ADR | 2.7% |
| Fidelity National Financial, Inc. - Class A | 2.6% |
| Altria Group, Inc. | 2.6% |
| Tortoise Energy Infrastructure Corporation | 2.6% |
| Dominion Resources, Inc. | 2.4% |
| Chevron Corporation | 2.4% |
| Coca-Cola Company (The) | 2.4% |
| Watsco, Inc. | 2.4% |
| Wells Fargo & Company | 2.3% |
18
DAVENPORT EQUITY OPPORTUNITIES FUND
PORTFOLIO INFORMATION
September 30, 2011 (Unaudited)

Top Ten Equity Holdings
| Security Description | % of Net Assets |
| Penn National Gaming, Inc. | 4.2% |
| Acacia Research Corporation | 4.1% |
| O'Reilly Automotive, Inc. | 3.9% |
| CarMax, Inc. | 3.9% |
| Millicom International Cellular S.A. | 3.8% |
| Markel Corporation | 3.6% |
| Hanesbrands, Inc. | 3.5% |
| NewMarket Corporation | 3.2% |
| American Tower Corporation - Class A | 3.1% |
| NCR Corporation | 3.0% |
19
DAVENPORT CORE FUND
SCHEDULE OF INVESTMENTS
September 30, 2011 (Unaudited)
COMMON STOCKS — 95.5% | Shares | Value | ||||||
| Consumer Discretionary — 12.9% | ||||||||
CarMax, Inc. (a) | 113,481 | $ | 2,706,522 | |||||
Discovery Communications, Inc. - Class C (a) | 66,909 | 2,351,851 | ||||||
Dollar Tree, Inc. (a) | 27,659 | 2,077,468 | ||||||
Lowe's Companies, Inc. | 119,617 | 2,313,393 | ||||||
McDonald's Corporation | 27,659 | 2,429,013 | ||||||
NVR, Inc. (a) | 3,024 | 1,826,436 | ||||||
| Starwood Hotels & Resorts Worldwide, Inc. | 50,910 | 1,976,326 | ||||||
Walt Disney Company (The) | 67,815 | 2,045,300 | ||||||
| 17,726,309 | ||||||||
| Consumer Staples — 8.6% | ||||||||
Anheuser-Busch InBev SA/NV - ADR | 34,245 | 1,814,300 | ||||||
Nestlé S.A. - ADR | 41,940 | 2,310,894 | ||||||
PepsiCo, Inc. | 43,938 | 2,719,762 | ||||||
Procter & Gamble Company (The) | 36,162 | 2,284,715 | ||||||
Wal-Mart Stores, Inc. | 52,305 | 2,714,630 | ||||||
| 11,844,301 | ||||||||
| Energy — 10.7% | ||||||||
Chevron Corporation | 34,782 | 3,218,031 | ||||||
EOG Resources, Inc. | 23,128 | 1,642,319 | ||||||
Exxon Mobil Corporation | 52,315 | 3,799,638 | ||||||
Occidental Petroleum Corporation | 27,648 | 1,976,832 | ||||||
Schlumberger Ltd. | 42,358 | 2,530,043 | ||||||
Transocean Ltd. | 30,894 | 1,474,880 | ||||||
| 14,641,743 | ||||||||
| Financials — 14.2% | ||||||||
Bank of America Corporation | 134,871 | 825,411 | ||||||
Berkshire Hathaway, Inc. - Class B (a) | 50,062 | 3,556,404 | ||||||
| Brookfield Asset Management, Inc. - Class A | 119,034 | 3,279,387 | ||||||
Capital One Financial Corporation | 67,274 | 2,666,069 | ||||||
JPMorgan Chase & Company | 51,714 | 1,557,626 | ||||||
Markel Corporation (a) | 8,956 | 3,198,456 | ||||||
T. Rowe Price Group, Inc. | 43,011 | 2,054,635 | ||||||
Wells Fargo & Company | 99,046 | 2,388,989 | ||||||
| 19,526,977 | ||||||||
| Health Care — 8.4% | ||||||||
Johnson & Johnson | 42,980 | 2,738,256 | ||||||
Laboratory Corporation of America Holdings (a) | 29,155 | 2,304,703 | ||||||
Merck & Company, Inc. | 63,484 | 2,076,562 | ||||||
Novo Nordisk A/S - ADR | 19,493 | 1,939,943 | ||||||
WellPoint, Inc. | 38,196 | 2,493,435 | ||||||
| 11,552,899 | ||||||||
| Industrials — 9.7% | ||||||||
Boeing Company (The) | 32,401 | 1,960,585 | ||||||
Caterpillar, Inc. | 27,964 | 2,064,862 | ||||||
20
DAVENPORT CORE FUND
SCHEDULE OF INVESTMENTS (Continued)
COMMON STOCKS — 95.5% (Continued) | Shares | Value | ||||||
| Industrials — 9.7% (Continued) | ||||||||
Danaher Corporation | 66,329 | $ | 2,781,838 | |||||
Illinois Tool Works, Inc. | 42,674 | 1,775,239 | ||||||
Stanley Black & Decker, Inc. | 37,932 | 1,862,461 | ||||||
United Technologies Corporation | 40,040 | 2,817,214 | ||||||
| 13,262,199 | ||||||||
| Information Technology — 21.6% | ||||||||
Accenture plc - Class A | 52,399 | 2,760,379 | ||||||
Apple, Inc. (a) | 9,336 | 3,558,696 | ||||||
Automatic Data Processing, Inc. | 47,057 | 2,218,738 | ||||||
Check Point Software Technologies Ltd. (a) | 51,103 | 2,696,194 | ||||||
Fiserv, Inc. (a) | 50,998 | 2,589,168 | ||||||
Google, Inc. - Class A (a) | 4,004 | 2,059,578 | ||||||
Intel Corporation | 104,588 | 2,230,862 | ||||||
| International Business Machines Corporation | 20,652 | 3,614,720 | ||||||
Microsoft Corporation | 98,603 | 2,454,229 | ||||||
QUALCOMM, Inc. | 70,070 | 3,407,504 | ||||||
Visa, Inc. - Class A | 25,288 | 2,167,687 | ||||||
| 29,757,755 | ||||||||
| Materials — 4.8% | ||||||||
Albemarle Corporation | 51,693 | 2,088,397 | ||||||
International Flavors & Fragrances, Inc. | 40,040 | 2,251,049 | ||||||
Praxair, Inc. | 24,719 | 2,310,732 | ||||||
| 6,650,178 | ||||||||
| Telecommunication Services — 4.6% | ||||||||
American Tower Corporation - Class A (a) | 62,346 | 3,354,215 | ||||||
Millicom International Cellular S.A. | 30,536 | 3,026,118 | ||||||
| 6,380,333 | ||||||||
Total Common Stocks (Cost $118,328,963) | $ | 131,342,694 | ||||||
MONEY MARKET FUNDS — 2.4% | Shares | Value | ||||||
First American Treasury Obligations Fund - Class Z, 0.00% (b) (Cost $3,262,917) | 3,262,917 | $ | 3,262,917 | |||||
Total Investments at Value — 97.9% (Cost $121,591,880) | $ | 134,605,611 | ||||||
| Other Assets in Excess of Liabilities — 2.1% | 2,913,532 | |||||||
Net Assets — 100.0% | $ | 137,519,143 | ||||||
ADR - American Depositary Receipt.
| (a) | Non-income producing security. |
| (b) | Variable rate security. The rate shown is the 7-day effective yield as of September 30, 2011. |
See accompanying notes to financial statements.
21
DAVENPORT VALUE & INCOME FUND
SCHEDULE OF INVESTMENTS
September 30, 2011 (Unaudited)
COMMON STOCKS — 92.5% | Shares | Value | ||||||
| Consumer Discretionary — 7.8% | ||||||||
Home Depot, Inc. (The) | 35,480 | $ | 1,166,228 | |||||
Leggett & Platt, Inc. | 51,955 | 1,028,189 | ||||||
McDonald's Corporation | 11,840 | 1,039,789 | ||||||
VF Corporation | 11,170 | 1,357,378 | ||||||
| 4,591,584 | ||||||||
| Consumer Staples — 18.5% | ||||||||
Altria Group, Inc. | 57,071 | 1,530,074 | ||||||
Anheuser-Busch InBev SA/NV - ADR | 22,675 | 1,201,321 | ||||||
Coca-Cola Company (The) | 20,865 | 1,409,639 | ||||||
Diageo plc - ADR | 15,945 | 1,210,704 | ||||||
H.J. Heinz Company | 17,515 | 884,157 | ||||||
Philip Morris International, Inc. | 21,750 | 1,356,765 | ||||||
Procter & Gamble Company (The) | 17,215 | 1,087,644 | ||||||
Sysco Corporation | 38,130 | 987,567 | ||||||
Wal-Mart Stores, Inc. | 23,820 | 1,236,258 | ||||||
| 10,904,129 | ||||||||
| Energy — 12.4% | ||||||||
Chevron Corporation | 15,506 | 1,434,615 | ||||||
ConocoPhillips | 16,575 | 1,049,529 | ||||||
Encana Corporation | 40,030 | 768,976 | ||||||
Exxon Mobil Corporation | 17,045 | 1,237,978 | ||||||
Royal Dutch Shell plc - Class A - ADR | 26,475 | 1,642,774 | ||||||
Spectra Energy Corporation | 47,560 | 1,166,647 | ||||||
| 7,300,519 | ||||||||
| Financials — 13.6% | ||||||||
Bank of America Corporation | 63,105 | 386,203 | ||||||
Fidelity National Financial, Inc. - Class A | 101,425 | 1,539,631 | ||||||
JPMorgan Chase & Company | 29,850 | 899,082 | ||||||
Plum Creek Timber Company, Inc. | 35,405 | 1,228,907 | ||||||
Travelers Companies, Inc. (The) | 26,445 | 1,288,665 | ||||||
Wells Fargo & Company | 57,225 | 1,380,267 | ||||||
Willis Group Holdings plc - ADR | 37,221 | 1,279,286 | ||||||
| 8,002,041 | ||||||||
| Health Care — 8.3% | ||||||||
Abbott Laboratories | 18,475 | 944,812 | ||||||
GlaxoSmithKline plc - ADR | 38,070 | 1,571,910 | ||||||
Johnson & Johnson | 20,875 | 1,329,946 | ||||||
Merck & Company, Inc. | 31,410 | 1,027,421 | ||||||
| 4,874,089 | ||||||||
| Industrials — 14.5% | ||||||||
3M Company | 13,835 | 993,215 | ||||||
General Dynamics Corporation | 18,305 | 1,041,371 | ||||||
General Electric Company | 68,520 | 1,044,245 | ||||||
Illinois Tool Works, Inc. | 18,470 | 768,352 | ||||||
22
DAVENPORT VALUE & INCOME FUND
SCHEDULE OF INVESTMENTS (Continued)
COMMON STOCKS — 92.5% (Continued) | Shares | Value | ||||||
| Industrials — 14.5% (Continued) | ||||||||
Norfolk Southern Corporation | 19,840 | $ | 1,210,637 | |||||
Raytheon Company | 25,505 | 1,042,389 | ||||||
Waste Management, Inc. | 31,745 | 1,033,617 | ||||||
Watsco, Inc. | 27,410 | 1,400,651 | ||||||
| 8,534,477 | ||||||||
| Information Technology — 6.1% | ||||||||
Automatic Data Processing, Inc. | 25,740 | 1,213,641 | ||||||
Intel Corporation | 58,035 | 1,237,887 | ||||||
Microsoft Corporation | 47,105 | 1,172,443 | ||||||
| 3,623,971 | ||||||||
| Materials — 3.3% | ||||||||
Dow Chemical Company (The) | 43,390 | 974,540 | ||||||
E.I. du Pont de Nemours and Company | 25,055 | 1,001,448 | ||||||
| 1,975,988 | ||||||||
| Telecommunication Services — 4.0% | ||||||||
Telefonica S.A. - ADR | 53,955 | 1,031,620 | ||||||
Vodafone Group plc - ADR | 51,020 | 1,308,663 | ||||||
| 2,340,283 | ||||||||
| Utilities — 4.0% | ||||||||
Dominion Resources, Inc. | 28,380 | 1,440,853 | ||||||
Southern Company (The) | 22,200 | 940,614 | ||||||
| 2,381,467 | ||||||||
Total Common Stocks (Cost $59,982,416) | $ | 54,528,548 | ||||||
CLOSED-END FUNDS — 2.6% | Shares | Value | ||||||
| Tortoise Energy Infrastructure Corporation (Cost $1,739,580) | 44,725 | $ | 1,517,519 | |||||
MONEY MARKET FUNDS — 2.9% | Shares | Value | ||||||
First American Treasury Obligations Fund - Class Z, 0.00% (a) (Cost $1,697,540) | 1,697,540 | $ | 1,697,540 | |||||
Total Investments at Value — 98.0% (Cost $63,419,536) | $ | 57,743,607 | ||||||
| Other Assets in Excess of Liabilities — 2.0% | 1,195,193 | |||||||
Net Assets — 100.0% | $ | 58,938,800 | ||||||
ADR - American Depositary Receipt.
| (a) | Variable rate security. The rate shown is the 7-day effective yield as of September 30, 2011. |
See accompanying notes to financial statements.
23
DAVENPORT EQUITY OPPORTUNITIES FUND
SCHEDULE OF INVESTMENTS
September 30, 2011 (Unaudited)
COMMON STOCKS — 95.1% | Shares | Value | ||||||
| Consumer Discretionary — 23.3% | ||||||||
Brookfield Residential Properties, Inc. (a) | 65,405 | $ | 434,943 | |||||
CarMax, Inc. (a) | 64,460 | 1,537,371 | ||||||
Hanesbrands, Inc. (a) | 56,045 | 1,401,686 | ||||||
International Game Technology | 58,610 | 851,603 | ||||||
Lamar Advertising Company - Class A (a) | 65,280 | 1,111,718 | ||||||
NVR, Inc. (a) | 1,142 | 689,745 | ||||||
O'Reilly Automotive, Inc. (a) | 23,334 | 1,554,745 | ||||||
Penn National Gaming, Inc. (a) | 50,095 | 1,667,663 | ||||||
| 9,249,474 | ||||||||
| Consumer Staples — 3.0% | ||||||||
Church & Dwight Company, Inc. | 19,180 | 847,756 | ||||||
Omega Protein Corporation (a) | 36,810 | 334,235 | ||||||
| 1,181,991 | ||||||||
| Energy — 3.0% | ||||||||
Plains Exploration & Production Company (a) | 27,295 | 619,869 | ||||||
Ultra Petroleum Corporation (a) | 20,005 | 554,539 | ||||||
| 1,174,408 | ||||||||
| Financials — 16.9% | ||||||||
| Brookfield Asset Management, Inc. - Class A | 37,525 | 1,033,814 | ||||||
Capital One Financial Corporation | 24,325 | 964,000 | ||||||
Fidelity National Financial, Inc. - Class A | 69,315 | 1,052,201 | ||||||
Markel Corporation (a) | 3,995 | 1,426,734 | ||||||
Safety Insurance Group, Inc. | 28,595 | 1,081,749 | ||||||
| Walter Investment Management Corporation | 49,900 | 1,144,207 | ||||||
| 6,702,705 | ||||||||
| Health Care — 3.7% | ||||||||
Henry Schein, Inc. (a) | 12,890 | 799,309 | ||||||
Laboratory Corporation of America Holdings (a) | 8,375 | 662,044 | ||||||
| 1,461,353 | ||||||||
| Industrials — 17.0% | ||||||||
Acacia Research Corporation (a) | 45,410 | 1,634,306 | ||||||
Babcock & Wilcox Company (a) | 32,214 | 629,784 | ||||||
Colfax Corporation (a) | 37,590 | 761,573 | ||||||
Cooper Industries plc - Class A | 15,925 | 734,461 | ||||||
Republic Services, Inc. | 32,165 | 902,550 | ||||||
Rockwell Collins, Inc. | 17,580 | 927,521 | ||||||
Watsco, Inc. | 23,195 | 1,185,264 | ||||||
| 6,775,459 | ||||||||
| Information Technology — 13.5% | ||||||||
Check Point Software Technologies Ltd. (a) | 18,115 | 955,747 | ||||||
CoreLogic, Inc. (a) | 60,455 | 645,055 | ||||||
Fiserv, Inc. (a) | 17,285 | 877,559 | ||||||
Intuit, Inc. (a) | 21,245 | 1,007,863 | ||||||
24
DAVENPORT EQUITY OPPORTUNITIES FUND
SCHEDULE OF INVESTMENTS (Continued)
COMMON STOCKS — 95.1% (Continued) | Shares | Value | ||||||
| Information Technology — 13.5% (Continued) | ||||||||
NCR Corporation (a) | 71,336 | $ | 1,204,865 | |||||
Tessera Technologies, Inc. (a) | 57,235 | 683,386 | ||||||
| 5,374,475 | ||||||||
| Materials — 5.3% | ||||||||
Albemarle Corporation | 21,515 | 869,206 | ||||||
NewMarket Corporation | 8,260 | 1,254,446 | ||||||
| 2,123,652 | ||||||||
| Telecommunication Services — 6.9% | ||||||||
American Tower Corporation - Class A (a) | 23,040 | 1,239,552 | ||||||
Millicom International Cellular S.A. | 15,355 | 1,521,681 | ||||||
| 2,761,233 | ||||||||
| Utilities — 2.5% | ||||||||
ITC Holdings Corporation | 12,970 | 1,004,267 | ||||||
Total Common Stocks (Cost $42,377,353) | $ | 37,809,017 | ||||||
MONEY MARKET FUNDS — 2.9% | Shares | Value | ||||||
First American Treasury Obligations Fund - Class Z, 0.00% (b) (Cost $1,138,924) | 1,138,924 | $ | 1,138,924 | |||||
Total Investments at Value — 98.0% (Cost $43,516,277) | $ | 38,947,941 | ||||||
| Other Assets in Excess of Liabilities — 2.0% | 810,363 | |||||||
Net Assets — 100.0% | $ | 39,758,304 | ||||||
| (a) | Non-income producing security. |
| (b) | Variable rate security. The rate shown is the 7-day effective yield as of September 30, 2011. |
See accompanying notes to financial statements.
25
THE DAVENPORT FUNDS
STATEMENTS OF ASSETS AND LIABILITIES
September 30, 2011 (Unaudited)
Davenport Core Fund | Davenport Value & Income Fund | Davenport Equity Opportunities Fund | ||||||||||
| ASSETS | ||||||||||||
| Investments in securities: | ||||||||||||
At acquisition cost | $ | 121,591,880 | $ | 63,419,536 | $ | 43,516,277 | ||||||
At market value (Note 2) | $ | 134,605,611 | $ | 57,743,607 | $ | 38,947,941 | ||||||
Cash | — | 686,065 | 585,269 | |||||||||
Dividends receivable | 102,335 | 186,157 | 34,906 | |||||||||
Receivable for investment securities sold | 2,699,501 | — | — | |||||||||
Receivable for capital shares sold | 323,950 | 386,551 | 230,733 | |||||||||
Other assets | 20,343 | 15,144 | 13,395 | |||||||||
TOTAL ASSETS | 137,751,740 | 59,017,524 | 39,812,244 | |||||||||
| LIABILITIES | ||||||||||||
Payable for capital shares redeemed | 101,824 | 19,570 | 12,613 | |||||||||
Accrued investment advisory fees (Note 4) | 102,670 | 37,161 | 26,535 | |||||||||
Payable to administrator (Note 4) | 17,750 | 8,200 | 6,125 | |||||||||
Other accrued expenses | 10,353 | 13,793 | 8,667 | |||||||||
TOTAL LIABILITIES | 232,597 | 78,724 | 53,940 | |||||||||
NET ASSETS | $ | 137,519,143 | $ | 58,938,800 | $ | 39,758,304 | ||||||
| Net assets consist of: | ||||||||||||
Paid-in capital | $ | 135,115,120 | $ | 64,374,092 | $ | 44,254,455 | ||||||
Accumulated net investment income (loss) | 1,748 | 1,986 | (65,050 | ) | ||||||||
Accumulated net realized gains (losses) from security transactions | (10,611,456 | ) | 238,651 | 137,235 | ||||||||
Net unrealized appreciation (depreciation) on investments | 13,013,731 | (5,675,929 | ) | (4,568,336 | ) | |||||||
Net assets | $ | 137,519,143 | $ | 58,938,800 | $ | 39,758,304 | ||||||
Shares of beneficial interest outstanding (unlimited number of shares authorized, $0.01 par value) | 11,595,520 | 6,289,818 | 4,279,639 | |||||||||
| Net asset value, offering price and redemption price per share (Note 2) | $ | 11.86 | $ | 9.37 | $ | 9.29 | ||||||
See accompanying notes to financial statements.
26
THE DAVENPORT FUNDS
STATEMENTS OF OPERATIONS
Six Months Ended September 30, 2011 (Unaudited)
Davenport Core Fund | Davenport Value & Income Fund | Davenport Equity Opportunities Fund | ||||||||||
| INVESTMENT INCOME | ||||||||||||
Dividends | $ | 1,223,672 | $ | 950,195 | $ | 167,294 | ||||||
Foreign withholding taxes on dividends | (12,957 | ) | (9,475 | ) | (4,552 | ) | ||||||
Interest | 25 | — | — | |||||||||
TOTAL INVESTMENT INCOME | 1,210,740 | 940,720 | 162,742 | |||||||||
| EXPENSES | ||||||||||||
Investment advisory fees (Note 4) | 587,787 | 211,952 | 148,825 | |||||||||
Administration fees (Note 4) | 107,339 | 42,888 | 31,601 | |||||||||
Professional fees | 9,405 | 8,405 | 8,405 | |||||||||
Custodian and bank service fees | 9,800 | 9,395 | 5,684 | |||||||||
Registration fees | 7,726 | 6,905 | 5,942 | |||||||||
Compliance service fees (Note 4) | 8,161 | 5,000 | 4,502 | |||||||||
Printing of shareholder reports | 9,066 | 3,919 | 3,383 | |||||||||
Trustees’ fees and expenses | 5,418 | 5,418 | 5,418 | |||||||||
Insurance expense | 5,836 | 2,108 | 1,587 | |||||||||
Postage and supplies | 707 | 468 | 449 | |||||||||
Other expenses | 9,224 | 11,900 | 11,996 | |||||||||
TOTAL EXPENSES | 760,469 | 308,358 | 227,792 | |||||||||
NET INVESTMENT INCOME (LOSS) | 450,271 | 632,362 | (65,050 | ) | ||||||||
REALIZED AND UNREALIZED GAINS (LOSSES) ON INVESTMENTS | ||||||||||||
Net realized gains from security transactions | 135,428 | 238,651 | 137,468 | |||||||||
| Net change in unrealized appreciation/ depreciation on investments | (21,868,177 | ) | (6,905,369 | ) | (5,898,980 | ) | ||||||
| NET REALIZED AND UNREALIZED LOSSES ON INVESTMENTS | (21,732,749 | ) | (6,666,718 | ) | (5,761,512 | ) | ||||||
NET DECREASE IN NET ASSETS FROM OPERATIONS | $ | (21,282,478 | ) | $ | (6,034,356 | ) | $ | (5,826,562 | ) | |||
See accompanying notes to financial statements.
27
DAVENPORT CORE FUND
STATEMENTS OF CHANGES IN NET ASSETS
Six Months Ended September 30, 2011 (Unaudited) | Year Ended March 31, 2011 | |||||||
| FROM OPERATIONS | ||||||||
Net investment income | $ | 450,271 | $ | 781,757 | ||||
Net realized gains from security transactions | 135,428 | 2,762,416 | ||||||
Net change in unrealized appreciation/ depreciation on investments | (21,868,177 | ) | 15,587,706 | |||||
Net increase (decrease) in net assets from operations | (21,282,478 | ) | 19,131,879 | |||||
| DISTRIBUTIONS TO SHAREHOLDERS | ||||||||
From net investment income | (470,333 | ) | (780,857 | ) | ||||
| FROM CAPITAL SHARE TRANSACTIONS | ||||||||
Proceeds from shares sold | 9,926,110 | 27,476,146 | ||||||
Net asset value of shares issued in reinvestment of distributions to shareholders | 441,253 | 741,331 | ||||||
Payments for shares redeemed | (10,989,857 | ) | (19,335,638 | ) | ||||
| Net increase (decrease) in net assets from capital share transactions | (622,494 | ) | 8,881,839 | |||||
TOTAL INCREASE (DECREASE) IN NET ASSETS | (22,375,305 | ) | 27,232,861 | |||||
| NET ASSETS | ||||||||
Beginning of period | 159,894,448 | 132,661,587 | ||||||
End of period | $ | 137,519,143 | $ | 159,894,448 | ||||
ACCUMULATED NET INVESTMENT INCOME | $ | 1,748 | $ | 21,810 | ||||
| CAPITAL SHARE ACTIVITY | ||||||||
Shares sold | 735,011 | 2,149,143 | ||||||
Shares reinvested | 33,989 | 61,329 | ||||||
Shares redeemed | (819,466 | ) | (1,570,298 | ) | ||||
Net increase (decrease) in shares outstanding | (50,466 | ) | 640,174 | |||||
Shares outstanding at beginning of period | 11,645,986 | 11,005,812 | ||||||
Shares outstanding at end of period | 11,595,520 | 11,645,986 | ||||||
See accompanying notes to financial statements.
28
DAVENPORT VALUE & INCOME FUND
STATEMENTS OF CHANGES IN NET ASSETS
Six Months Ended September 30, 2011 (Unaudited) | Period Ended March 31, 2011 (a) | |||||||
| FROM OPERATIONS | ||||||||
Net investment income | $ | 632,362 | $ | 140,872 | ||||
Net realized gains from security transactions | 238,651 | 71,734 | ||||||
Net change in unrealized appreciation/ depreciation on investments | (6,905,369 | ) | 1,229,440 | |||||
Net increase (decrease) in net assets from operations | (6,034,356 | ) | 1,442,046 | |||||
| DISTRIBUTIONS TO SHAREHOLDERS | ||||||||
From net investment income | (639,406 | ) | (131,842 | ) | ||||
From net realized gains from security transactions | (71,734 | ) | — | |||||
Decrease in net assets from distributions to shareholders | (711,140 | ) | (131,842 | ) | ||||
| FROM CAPITAL SHARE TRANSACTIONS | ||||||||
Proceeds from shares sold | 18,643,960 | 47,565,809 | ||||||
Net asset value of shares issued in reinvestment of distributions to shareholders | 608,068 | 110,894 | ||||||
Payments for shares redeemed | (2,398,262 | ) | (156,377 | ) | ||||
Net increase in net assets from capital share transactions | 16,853,766 | 47,520,326 | ||||||
TOTAL INCREASE IN NET ASSETS | 10,108,270 | 48,830,530 | ||||||
| NET ASSETS | ||||||||
Beginning of period | 48,830,530 | — | ||||||
End of period | $ | 58,938,800 | $ | 48,830,530 | ||||
ACCUMULATED NET INVESTMENT INCOME | $ | 1,986 | $ | 9,030 | ||||
| CAPITAL SHARE ACTIVITY | ||||||||
Shares sold | 1,813,380 | 4,655,581 | ||||||
Shares reinvested | 60,777 | 10,830 | ||||||
Shares redeemed | (235,893 | ) | (14,857 | ) | ||||
Net increase in shares outstanding | 1,638,264 | 4,651,554 | ||||||
Shares outstanding at beginning of period | 4,651,554 | — | ||||||
Shares outstanding at end of period | 6,289,818 | 4,651,554 | ||||||
| (a) | Represents the period from commencement of operations (December 31, 2010) through March 31, 2011. |
See accompanying notes to financial statements.
29
DAVENPORT EQUITY OPPORTUNITIES FUND
STATEMENTS OF CHANGES IN NET ASSETS
Six Months Ended September 30, 2011 (Unaudited) | Period Ended March 31, 2011 (a) | |||||||
| FROM OPERATIONS | ||||||||
Net investment loss | $ | (65,050 | ) | $ | (21,539 | ) | ||
Net realized gains from security transactions | 137,468 | 184,336 | ||||||
Net change in unrealized appreciation/ depreciation on investments | (5,898,980 | ) | 1,330,644 | |||||
Net increase (decrease) in net assets from operations | (5,826,562 | ) | 1,493,441 | |||||
| DISTRIBUTIONS TO SHAREHOLDERS | ||||||||
From net realized gains from security transactions | (163,030 | ) | — | |||||
| FROM CAPITAL SHARE TRANSACTIONS | ||||||||
Proceeds from shares sold | 12,809,226 | 34,425,550 | ||||||
Net asset value of shares issued in reinvestment of distributions to shareholders | 157,487 | — | ||||||
Payments for shares redeemed | (1,594,238 | ) | (1,543,570 | ) | ||||
Net increase in net assets from capital share transactions | 11,372,475 | 32,881,980 | ||||||
| TOTAL INCREASE IN NET ASSETS | 5,382,883 | 34,375,421 | ||||||
| NET ASSETS | ||||||||
Beginning of period | 34,375,421 | — | ||||||
End of period | $ | 39,758,304 | $ | 34,375,421 | ||||
ACCUMULATED NET INVESTMENT LOSS | $ | (65,050 | ) | $ | — | |||
| CAPITAL SHARE ACTIVITY | ||||||||
Shares sold | 1,209,724 | 3,357,207 | ||||||
Shares reinvested | 15,593 | — | ||||||
Shares redeemed | (153,373 | ) | (149,512 | ) | ||||
Net increase in shares outstanding | 1,071,944 | 3,207,695 | ||||||
Shares outstanding at beginning of period | 3,207,695 | — | ||||||
Shares outstanding at end of period | 4,279,639 | 3,207,695 | ||||||
| (a) | Represents the period from commencement of operations (December 31, 2010) through March 31, 2011. |
See accompanying notes to financial statements.
30
DAVENPORT CORE FUND
FINANCIAL HIGHLIGHTS
| Selected Per Share Data and Ratios for a Share Outstanding Throughout Each Period | ||||||||||||||||||||||||
Six Months Ended Sept. 30, 2011 | Years Ended March 31, | |||||||||||||||||||||||
| (Unaudited) | 2011 | 2010 | 2009 | 2008 | 2007 | |||||||||||||||||||
Net asset value at beginning of period | $ | 13.73 | $ | 12.05 | $ | 8.36 | $ | 13.82 | $ | 14.75 | $ | 13.99 | ||||||||||||
Income (loss) from investment operations: | ||||||||||||||||||||||||
Net investment income | 0.04 | 0.07 | 0.08 | 0.11 | 0.10 | 0.10 | ||||||||||||||||||
| Net realized and unrealized gains (losses) on investments | (1.87 | ) | 1.68 | 3.69 | (5.17 | ) | 0.53 | 1.28 | ||||||||||||||||
| Total from investment operations | (1.83 | ) | 1.75 | 3.77 | (5.06 | ) | 0.63 | 1.38 | ||||||||||||||||
| Less distributions: | ||||||||||||||||||||||||
Dividends from net investment income | (0.04 | ) | (0.07 | ) | (0.08 | ) | (0.11 | ) | (0.10 | ) | (0.10 | ) | ||||||||||||
Distributions from net realized gains | — | — | — | (0.29 | ) | (1.46 | ) | (0.52 | ) | |||||||||||||||
Total distributions | (0.04 | ) | (0.07 | ) | (0.08 | ) | (0.40 | ) | (1.56 | ) | (0.62 | ) | ||||||||||||
| Net asset value at end of period | $ | 11.86 | $ | 13.73 | $ | 12.05 | $ | 8.36 | $ | 13.82 | $ | 14.75 | ||||||||||||
Total return (a) | (13.35% | )(b) | 14.61% | 45.20% | (36.85% | ) | 3.44% | 10.02% | ||||||||||||||||
| Net assets at end of period (000’s) | $ | 137,519 | $ | 159,894 | $ | 132,662 | $ | 92,358 | $ | 155,799 | $ | 151,655 | ||||||||||||
Ratio of total expenses to average net assets | 0.97% | (c) | 0.99% | 1.00% | 1.00% | 0.96% | 0.98% | |||||||||||||||||
Ratio of net investment income to average net assets | 0.57% | (c) | 0.58% | 0.75% | 0.98% | 0.60% | 0.67% | |||||||||||||||||
Portfolio turnover rate | 11% | (b) | 34% | 25% | 39% | 37% | 26% | |||||||||||||||||
| (a) | Total return is a measure of the change in value of an investment in the Fund over the periods covered, which assumes any dividends or capital gains distributions are reinvested in shares of the Fund. Returns shown do not reflect the deduction of taxes a shareholder would pay on Fund distributions or the redemption of Fund shares. |
| (b) | Not annualized. |
| (c) | Annualized. |
See accompanying notes to financial statements.
31
DAVENPORT VALUE & INCOME FUND
FINANCIAL HIGHLIGHTS
Selected Per Share Data and Ratios for a Share Outstanding Throughout Each Period | ||||||||
Six Months Ended September 30, 2011 (Unaudited) | Period Ended March 31, 2011 (a) | |||||||
| Net asset value at beginning of period | $ | 10.50 | $ | 10.00 | ||||
| Income (loss) from investment operations: | ||||||||
| Net investment income | 0.11 | 0.04 | ||||||
| Net realized and unrealized gains (losses) on investments | (1.12 | ) | 0.49 | |||||
| Total from investment operations | (1.01 | ) | 0.53 | |||||
| Less distributions: | ||||||||
| Dividends from net investment income | (0.11 | ) | (0.03 | ) | ||||
| Distributions from net realized gains | (0.01 | ) | — | |||||
| Total distributions | (0.12 | ) | (0.03 | ) | ||||
| Net asset value at end of period | $ | 9.37 | $ | 10.50 | ||||
Total return (b) (c) | (9.66% | ) | 5.35% | |||||
| Net assets at end of period (000’s) | $ | 58,939 | $ | 48,831 | ||||
Ratio of total expenses to average net assets (d) | 1.09% | 1.25% | ||||||
Ratio of net investment income to average net assets (d) | 2.24% | 1.99% | ||||||
Portfolio turnover rate (c) | 7% | 10% | ||||||
| (a) | Represents the period from commencement of operations (December 31, 2010) through March 31, 2011. |
| (b) | Total return is a measure of the change in value of an investment in the Fund over the periods covered, which assumes any dividends or capital gains distributions are reinvested in shares of the Fund. Returns shown do not reflect the deduction of taxes a shareholder would pay on Fund distributions or the redemption of Fund shares. |
| (c) | Not annualized. |
| (d) | Annualized. |
See accompanying notes to financial statements.
32
DAVENPORT EQUITY OPPORTUNITIES FUND
FINANCIAL HIGHLIGHTS
Selected Per Share Data and Ratios for a Share Outstanding Throughout Each Period | ||||||||
Six Months Ended September 30, 2011 (Unaudited) | Period Ended March 31, 2011 (a) | |||||||
| Net asset value at beginning of period | $ | 10.72 | $ | 10.00 | ||||
| Income (loss) from investment operations: | ||||||||
| Net investment loss | (0.02 | ) | (0.01 | ) | ||||
| Net realized and unrealized gains (losses) on investments | (1.37 | ) | 0.73 | |||||
| Total from investment operations | (1.39 | ) | 0.72 | |||||
| Less distributions: | ||||||||
| Distributions from net realized gains | (0.04 | ) | — | |||||
| Net asset value at end of period | $ | 9.29 | $ | 10.72 | ||||
Total return (b) (c) | (13.00% | ) | 7.20% | |||||
| Net assets at end of period (000’s) | $ | 39,758 | $ | 34,375 | ||||
Ratio of total expenses to average net assets (d) | 1.15% | 1.25% | ||||||
Ratio of net investment loss to average net assets (d) | (0.33% | ) | (0.40% | ) | ||||
Portfolio turnover rate (c) | 19% | 6% | ||||||
| (a) | Represents the period from commencement of operations (December 31, 2010) through March 31, 2011. |
| (b) | Total return is a measure of the change in value of an investment in the Fund over the periods covered, which assumes any dividends or capital gains distributions are reinvested in shares of the Fund. Returns shown do not reflect the deduction of taxes a shareholder would pay on Fund distributions or the redemption of Fund shares. |
| (c) | Not annualized. |
| (d) | Annualized. |
See accompanying notes to financial statements.
33
THE DAVENPORT FUNDS
NOTES TO FINANCIAL STATEMENTS
September 30, 2011 (Unaudited)
1. Organization
Davenport Core Fund, Davenport Value & Income Fund and Davenport Equity Opportunities Fund (individually, a “Fund,” and, collectively, the “Funds”) are each a no-load, diversified series of the Williamsburg Investment Trust (the “Trust”), an open-end management investment company registered under the Investment Company Act of 1940. The Trust was organized as a Massachusetts business trust on July 18, 1988. Other series of the Trust are not incorporated in this report. Davenport Core Fund began operations on January 15, 1998. Davenport Value & Income Fund and Davenport Equity Opportunities Fund began operations on December 31, 2010.
Davenport Core Fund’s investment objective is long term growth of capital.
Davenport Value & Income Fund’s investment objective is to achieve long term growth while generating current income through dividend payments on portfolio securities.
Davenport Equity Opportunities Fund’s investment objective is long term capital appreciation.
2. Significant Accounting Policies
The following is a summary of the Funds’ significant accounting policies. The policies are in conformity with accounting principles generally accepted in the United States of America (“GAAP”).
Securities valuation — The Funds’ portfolio securities are valued as of the close of business of the regular session of the New York Stock Exchange (normally 4:00 p.m., Eastern time). Securities traded on a national stock exchange are valued based upon the closing price on the principal exchange where the security is traded. Securities which are quoted by NASDAQ are valued at the NASDAQ Official Closing Price. Securities which are traded over-the-counter are valued at the last sales price, if available, otherwise, at the last quoted bid price. Fixed income securities will ordinarily be traded in the over-the-counter market and common stocks will ordinarily be traded on a national securities exchange, but may also be traded in the over-the-counter market. Short-term instruments (those with remaining maturities of 60 days or less) may be valued at amortized cost, which approximates market value.
When market quotations are not readily available, securities may be valued on the basis of prices provided by an independent pricing service. The prices provided by the pricing service are determined with consideration given to institutional bid and last sale prices and take into account securities prices, yields, maturities, call features, ratings, institutional trading in similar groups of securities and developments related to specific securities. If a pricing service cannot provide a valuation, securities will be valued in good faith at fair value using methods consistent with those determined by the Board of Trustees and will be classified as Level 2 or 3 (see below) within the fair value hierarchy, depending on the inputs used. Such methods of fair valuation may include, but are not limited to: multiple of earnings, multiple of book value, discount from market of a similar freely traded security, purchase price of the security, subsequent private transactions in the security or related securities, or a combination of these and other factors.
GAAP establishes a single authoritative definition of fair value, sets out a framework for measuring fair value and requires additional disclosures about fair value measurements.
34
THE DAVENPORT FUNDS
NOTES TO FINANCIAL STATEMENTS (Continued)
Various inputs are used in determining the value of the Funds’ investments. These inputs are summarized in the three broad levels listed below:
• Level 1 – quoted prices in active markets for identical securities
• Level 2 – other significant observable inputs
• Level 3 – significant unobservable inputs
The inputs or methodology used for valuing securities are not necessarily an indication of the risks associated with investing in those securities. The inputs used to measure fair value may fall into different levels of the fair value hierarchy. In such cases, for disclosure purposes, the level in the fair value hierarchy within which the fair value measurement falls in its entirety is determined based on the lowest level input that is significant to the fair value measurement.
The following is a summary of the inputs used to value the Funds’ investments as of September 30, 2011 by security type:
Davenport Core Fund | Level 1 | Level 2 | Level 3 | Total | ||||||||||||
Common Stocks | $ | 131,342,694 | $ | — | $ | — | $ | 131,342,694 | ||||||||
Money Market Funds | 3,262,917 | — | — | 3,262,917 | ||||||||||||
Total | $ | 134,605,611 | $ | — | $ | — | $ | 134,605,611 | ||||||||
Davenport Value & Income Fund | Level 1 | Level 2 | Level 3 | Total | ||||||||||||
Common Stocks | $ | 54,528,548 | $ | — | $ | — | $ | 54,528,548 | ||||||||
Closed-End Funds | 1,517,519 | — | — | 1,517,519 | ||||||||||||
Money Market Funds | 1,697,540 | — | — | 1,697,540 | ||||||||||||
Total | $ | 57,743,607 | $ | — | $ | — | $ | 57,743,607 | ||||||||
Davenport Equity Opportunities Fund | Level 1 | Level 2 | Level 3 | Total | ||||||||||||
Common Stocks | $ | 37,809,017 | $ | — | $ | — | $ | 37,809,017 | ||||||||
Money Market Funds | 1,138,924 | — | — | 1,138,924 | ||||||||||||
Total | $ | 38,947,941 | $ | — | $ | — | $ | 38,947,941 | ||||||||
Refer to each Fund’s Schedules of Investments for a listing of the securities valued using Level 1 inputs by sector type. During the six months ended September 30, 2011, the Funds did not have any significant transfers in and out of any Level. There were no Level 3 securities or derivative instruments held by the Funds during the six months ended or as of September 30, 2011. It is the Funds’ policy to recognize transfers into and out of any Level at the end of the reporting period.
Repurchase agreements — The Funds may enter into repurchase agreements. The repurchase agreement, which is collateralized by U.S. Government obligations, is valued at cost which, together with accrued interest, approximates market. At the time a Fund enters into the repurchase agreement, the Fund takes possession of the underlying securities and the seller agrees that the value of the underlying securities, including accrued interest, will at all times be equal to or exceed
35
THE DAVENPORT FUNDS
NOTES TO FINANCIAL STATEMENTS (Continued)
the face amount of the repurchase agreement. In addition, the Funds actively monitor and seek additional collateral, as needed. If the seller defaults, the fair value of the collateral may decline and realization of the collateral by the Funds may be delayed or limited.
Share valuation — The net asset value per share of each Fund is calculated daily by dividing the total value of its assets, less liabilities, by the number of shares outstanding. The offering price and redemption price per share of each Fund is equal to the net asset value per share.
Investment income — Interest income is accrued as earned. Dividend income is recorded on the ex-dividend date. Discounts and premiums on fixed-income securities purchased are amortized using the interest method.
Security transactions — Security transactions are accounted for on trade date. Gains and losses on securities sold are determined on a specific identification basis.
Common expenses — Common expenses of the Trust are allocated among the funds within the Trust based on relative net assets of each fund or the nature of the services performed and the relative applicability to each fund.
Distributions to shareholders — Dividends arising from net investment income, if any, are declared and paid quarterly to shareholders of Davenport Core Fund and Davenport Value & Income Fund; and declared and paid annually to shareholders of Davenport Equity Opportunities Fund. Net realized short-term capital gains, if any, may be distributed throughout the year and net realized long-term capital gains, if any, are distributed at least once each year. The amount of distributions from net investment income and net realized gains are determined in accordance with federal income tax regulations which may differ from GAAP. Dividends and distributions are recorded on the ex-dividend date. The tax character of distributions paid during the periods ended September 30, 2011 and March 31, 2011 is as follows:
Period Ended | Ordinary Income | Total Distributions | |||||||
| Davenport Core Fund | 9/30/11 | $ | 470,333 | $ | 470,333 | ||||
| 3/31/11 | $ | 780,857 | $ | 780,857 | |||||
| Davenport Value & Income Fund | 9/30/11 | $ | 711,140 | $ | 711,140 | ||||
| 3/31/11 | $ | 131,842 | $ | 131,842 | |||||
| Davenport Equity Opportunities Fund | 9/30/11 | $ | 163,030 | $ | 163,030 | ||||
| 3/31/11 | $ | — | $ | — | |||||
Estimates — The preparation of financial statements in conformity with GAAP requires management to make estimates and assumptions that affect the reported amounts of assets and liabilities and disclosure of contingent assets and liabilities at the date of the financial statements and the reported amounts of income and expenses during the reporting period. Actual results could differ from those estimates.
36
THE DAVENPORT FUNDS
NOTES TO FINANCIAL STATEMENTS (Continued)
Federal income tax — It is each Fund’s policy to comply with the special provisions of Subchapter M of the Internal Revenue Code applicable to regulated investment companies. As provided therein, in any fiscal year in which a Fund so qualifies and distributes at least 90% of its taxable net income, the Fund (but not the shareholders) will be relieved of federal income tax on the income distributed. Accordingly, no provision for income taxes has been made.
In order to avoid imposition of the excise tax applicable to regulated investment companies, it is also each Fund’s intention to declare as dividends in each calendar year at least 98% of its net investment income (earned during the calendar year) and 98.2% of its net realized capital gains (earned during the twelve months ended October 31) plus undistributed amounts from prior years.
The following information is computed on a tax basis for each item as of September 30, 2011:
Davenport Core Fund | Davenport Value & Income Fund | Davenport Equity Opportunities Fund | ||||||||||
Cost of portfolio investments | $ | 121,928,047 | $ | 63,419,536 | $ | 43,516,277 | ||||||
Gross unrealized appreciation | $ | 21,838,190 | $ | 1,220,738 | $ | 1,472,474 | ||||||
Gross unrealized depreciation | (9,160,626 | ) | (6,896,667 | ) | (6,040,810 | ) | ||||||
Net unrealized appreciation (depreciation) | 12,677,564 | (5,675,929 | ) | (4,568,336 | ) | |||||||
Accumulated ordinary income (loss) | 1,748 | 1,986 | (65,050 | ) | ||||||||
Capital loss carryforward | (10,399,037 | ) | — | — | ||||||||
Other gains | 123,748 | 238,651 | 137,235 | |||||||||
Total distributable earnings (accumulated deficit) | $ | 2,404,023 | $ | (5,435,292 | ) | $ | (4,496,151 | ) | ||||
The difference between the federal income tax cost and the financial statement cost for Davenport Core Fund is due to certain timing differences in the recognition of capital gains and losses under income tax regulations and GAAP. These timing differences are temporary in nature and are due to the tax deferral of losses on wash sales.
As of March 31, 2011, Davenport Core Fund had a capital loss carryforward of $10,399,037 which expires March 31, 2018. This capital loss carryforward may be utilized in the current and future years to offset net realized capital gains, if any, prior to distributing such gains to shareholders.
The Funds recognize the tax benefits or expenses of uncertain tax positions only when the position is “more likely than not” to be sustained assuming examination by tax authorities. Management has reviewed the tax positions taken on Federal income tax returns for all applicable open tax years (tax years ended March 31, 2008 through March 31, 2011) of each Fund and has concluded that no provision for unrecognized tax benefits or expenses is required in these financial statements.
37
THE DAVENPORT FUNDS
NOTES TO FINANCIAL STATEMENTS (Continued)
3. Investment Transactions
During the six months ended September 30, 2011, the cost of purchases and proceeds from sales and maturities of investment securities, other than short-term investments and U.S. Government securities, totaled $17,768,708 and $16,992,340, respectively, for Davenport Core Fund; $22,165,509 and $3,679,682, respectively, for Davenport Value & Income Fund; and $18,033,503 and $7,003,144, respectively, for Davenport Equity Opportunities Fund.
4. Transactions with Affiliates
INVESTMENT ADVISORY AGREEMENT
Each Fund’s investments are managed by Davenport & Company LLC (the “Adviser”) under the terms of an Investment Advisory Agreement. Under the Investment Advisory Agreement, each Fund pays the Adviser a fee, which is computed and accrued daily and paid monthly, at an annual rate of .75% on its average daily net assets.
Certain officers of the Trust are also officers of the Adviser.
MUTUAL FUND SERVICES AGREEMENT
Under the terms of a Mutual Fund Services Agreement between the Trust and Ultimus Fund Solutions, LLC (“Ultimus”), Ultimus provides administrative, pricing, accounting, dividend disbursing, shareholder servicing and transfer agent services for the Funds. For these services, Ultimus receives a monthly fee from each Fund at an annual rate of .15% on its average daily net assets up to $25 million, .125% on the next $25 million of such assets and .10% on such assets in excess of $50 million, subject to a minimum monthly fee of $4,000, plus a shareholder recordkeeping fee at the annual rate of $10 per shareholder account in excess of 1,000 accounts. In addition, the Funds pay out-of-pocket expenses including, but not limited to, postage, supplies and costs of pricing the Funds’ portfolio securities.
Certain officers of the Trust are also officers of Ultimus, or of Ultimus Fund Distributors, LLC (the “Distributor”), the principal underwriter of the Funds’ shares and an affiliate of Ultimus. The Distributor receives no compensation from the Funds for acting as principal underwriter.
COMPLIANCE CONSULTING AGREEMENT
Under the terms of a Compliance Consulting Agreement between the Trust and Ultimus, Ultimus provides an individual to serve as the Trust’s Chief Compliance Officer and to administer the Trust’s compliance policies and procedures. For these services, the Funds pay Ultimus an annual base fee of $18,600 plus an asset-based fee equal to 0.01% per annum on the Funds’ aggregate average net assets in excess of $100 million. In addition, the Funds reimburse Ultimus for any reasonable out-of-pocket expenses, if any, incurred in providing these services.
38
THE DAVENPORT FUNDS
NOTES TO FINANCIAL STATEMENTS (Continued)
5. Contingencies and Commitments
The Funds indemnify the Trust’s officers and Trustees for certain liabilities that might arise from their performance of their duties to the Funds. Additionally, in the normal course of business the Funds enter into contracts that contain a variety of representations and warranties and which provide general indemnifications. The Funds’ maximum exposure under these arrangements is unknown, as this would involve future claims that may be made against the Funds that have not yet occurred. However, based on experience, the Funds expect the risk of loss to be remote.
6. Subsequent Events
The Funds are required to recognize in the financial statements the effects of all subsequent events that provide additional evidence about conditions that existed as of the date of the Statements of Assets and Liabilities. For non-recognized subsequent events that must be disclosed to keep the financial statements from being misleading, the Funds are required to disclose the nature of the event as well as an estimate of its financial effect, or a statement that such an estimate cannot be made. Management has evaluated subsequent events through the issuance of these financial statements and has noted no such events.
7. Recent Accounting Pronouncement and New Legislation
In May 2011, the Financial Accounting Standards Board issued Accounting Standards Update (“ASU”) No. 2011-04 “Amendments to Achieve Common Fair Value Measurement and Disclosure Requirements in U.S. GAAP and IFRSs.” ASU No. 2011-04 establishes common requirements for measuring fair value and for disclosing information about fair value measurements in accordance with GAAP and International Financial Reporting Standards. ASU No. 2011-04 is effective for interim and annual periods beginning after December 15, 2011 and is applied prospectively. Management is currently evaluating the impact ASU No. 2011-04 may have on financial statement disclosures.
The Regulated Investment Company Modernization Act of 2010 (the “Act”) was enacted on December 22, 2010. The Act makes changes to several tax rules impacting the Funds. In general, the provisions of the Act will be effective for the Funds’ current fiscal year ending March 31, 2012. Although the Act provides several benefits, including unlimited carryover on future capital losses, there may be greater likelihood that all or a portion of Davenport Core Fund’s pre-enactment capital loss carryovers may expire without being utilized due to the fact that post-enactment capital losses must be utilized before pre-enactment capital loss carryovers. Relevant information regarding the impact of the Act on the Funds, if any, will be included in the Annual Report for the year ending March 31, 2012.
39
THE DAVENPORT FUNDS
YOUR FUNDS’ EXPENSES (Unaudited)
We believe it is important for you to understand the impact of costs on your investment. All mutual funds have operating expenses. As a shareholder of the Funds, you incur ongoing costs, including management fees and other expenses. These ongoing costs, which are deducted from each Fund’s gross income, directly reduce the investment return of the Funds.
A mutual fund’s ongoing costs are expressed as a percentage of its average net assets. This figure is known as the expense ratio. The following examples are intended to help you understand the ongoing costs (in dollars) of investing in the Funds and to compare these costs with the ongoing costs of investing in other mutual funds. The examples below are based on an investment of $1,000 made at the beginning of the period shown and held for the entire period (April 1, 2011 through September 30, 2011).
The table below illustrates each Fund’s ongoing costs in two ways:
Actual fund return – This section helps you to estimate the actual expenses that you paid over the period. The “Ending Account Value” shown is derived from each Fund’s actual return, and the third column shows the dollar amount of operating expenses that would have been paid by an investor who started with $1,000 in the Funds. You may use the information here, together with the amount you invested, to estimate the expenses that you paid over the period.
To do so, simply divide your account value by $1,000 (for example, an $8,600 account value divided by $1,000 = 8.6), then multiply the result by the number given for the Funds under the heading “Expenses Paid During Period.”
Hypothetical 5% return – This section is intended to help you compare each Fund’s ongoing costs with those of other mutual funds. It assumes that each Fund had an annual return of 5% before expenses during the period shown, but that the expense ratio is unchanged. In this case, because the return used is not each Fund’s actual return, the results do not apply to your investment. The example is useful in making comparisons because the Securities and Exchange Commission (“SEC”) requires all mutual funds to calculate expenses based on a 5% return. You can assess each Fund’s ongoing costs by comparing this hypothetical example with the hypothetical examples that appear in shareholder reports of other funds.
Note that expenses shown in the table are meant to highlight and help you compare ongoing costs only. The Funds do not charge transaction fees, such as purchase or redemption fees, nor do they carry a “sales load.”
The calculations assume no shares were bought or sold during the period. Your actual costs may have been higher or lower, depending on the amount of your investment and the timing of any purchases or redemptions.
More information about each Fund’s expenses, including historical annual expense ratios, can be found in this report. For additional information on operating expenses and other shareholder costs, please refer to the Funds’ prospectus.
40
THE DAVENPORT FUNDS
YOUR FUNDS’ EXPENSES (Unaudited) (Continued)
Davenport Core Fund | Beginning Account Value April 1, 2011 | Ending Account Value Sept. 30, 2011 | Expenses Paid During Period* |
Based on Actual Fund Return | $1,000.00 | $866.50 | $4.54 |
Based on Hypothetical 5% Return (before expenses) | $1,000.00 | $1,020.21 | $4.91 |
| * | Expenses are equal to Davenport Core Fund’s annualized expense ratio of 0.97% for the period, multiplied by the average account value over the period, multiplied by 183/365 (to reflect the one-half year period). |
Davenport Value & Income Fund | Beginning Account Value April 1, 2011 | Ending Account Value Sept. 30, 2011 | Expenses Paid During Period* |
Based on Actual Fund Return | $1,000.00 | $903.40 | $5.20 |
Based on Hypothetical 5% Return (before expenses) | $1,000.00 | $1,019.60 | $5.52 |
| * | Expenses are equal to Davenport Value & Income Fund’s annualized expense ratio of 1.09% for the period, multiplied by the average account value over the period, multiplied by 183/365 (to reflect the one-half year period). |
Davenport Equity Opportunities Fund | Beginning Account Value April 1, 2011 | Ending Account Value Sept. 30, 2011 | Expenses Paid During Period* |
Based on Actual Fund Return | $1,000.00 | $870.00 | $5.39 |
Based on Hypothetical 5% Return (before expenses) | $1,000.00 | $1,019.30 | $5.82 |
| * | Expenses are equal to Davenport Equity Opportunities Fund’s annualized expense ratio of 1.15% for the period, multiplied by the average account value over the period, multiplied by 183/365 (to reflect the one-half year period). |
41
THE DAVENPORT FUNDS
OTHER INFORMATION (Unaudited)
A description of the policies and procedures that the Funds use to vote proxies relating to portfolio securities is available without charge upon request by calling toll-free 1-800-281-3217, or on the SEC’s website at http://www.sec.gov. Information regarding how the Funds voted proxies relating to portfolio securities during the most recent 12-month period ended June 30 is also available without charge upon request by calling toll-free 1-800-281-3217, or on the SEC’s website at http://www.sec.gov.
The Trust files a complete listing of portfolio holdings for the Funds with the SEC as of the first and third quarters of each fiscal year on Form N-Q. These filings are available upon request by calling 1-800-281-3217. Furthermore, you may obtain a copy of these filings on the SEC’s website at http://www.sec.gov. The Trust’s Forms N-Q may also be reviewed and copied at the SEC’s Public Reference Room in Washington, DC, and information on the operation of the Public Reference Room may be obtained by calling 1-800-SEC-0330.
A complete listing of portfolio holdings for the Funds is updated daily and can be reviewed at the Funds’ website at http://www.investdavenport.com.
42
THE DAVENPORT FUNDS Investment Adviser Davenport & Company LLC One James Center 901 East Cary Street Richmond, Virginia 23219-4037 Administrator Ultimus Fund Solutions, LLC P.O. Box 46707 Cincinnati, Ohio 45246-0707 1-800-281-3217 Custodian US Bank NA 425 Walnut Street Cincinnati, Ohio 45202 Independent Registered Public Accounting Firm Ernst & Young LLP 1900 Scripps Center 312 Walnut Street Cincinnati, Ohio 45202 Legal Counsel Sullivan & Worcester LLP One Post Office Square Boston, Massachusetts 02109 Board of Trustees Austin Brockenbrough III John T. Bruce Charles M. Caravati, Jr. Robert S. Harris J. Finley Lee, Jr. Richard L. Morrill Harris V. Morrissette Officers John P. Ackerly IV, President I. Lee Chapman IV, Vice President George L. Smith, III, Vice President |
43

Davenport & Company LLC
One James Center
901 East Cary Street
Richmond, VA 23219
Member: NYSE • SIPC
Toll Free: (800) 846-6666
www.investdavenport.com
 Semi-Annual Report September 30, 2011 (Unaudited) No-Load Funds | ||||
Letter to Shareholders | November 14, 2011 |
We are pleased to report on your Funds and their investments for the semi-annual period ended September 30, 2011.
Proxy Update
By the time you receive this report, the shareholders hopefully will have voted to update and simplify the fundamental investment limitations for both the FBP Value and FBP Balanced Funds. This will provide the Funds with more investment flexibility and make them more responsive to changing regulatory and market environments.
Also proposed was an enhancement in the investment objective of the FBP Value Fund to place an increased emphasis on income. We also plan to rename the Fund the FBP Equity & Dividend Plus Fund. The investment environment has certainly become more challenging over the last several years and we believe a change in strategy to have a dual mandate will be beneficial. The Fund will have an increased focus on generating an above average and growing income while also attempting to achieve long term growth of capital. The Fund will use covered call option writing to a greater extent to increase portfolio return while adding some defensive characteristics as well. These changes will allow us to build a portfolio with broader diversification and should result in a portfolio with lower volatility.
We also plan to rename the FBP Balanced Fund, a change which does not require shareholder approval but one that we certainly want to explain and comment why it should be beneficial for shareholders. The investment objectives of the FBP Balanced Fund are long term capital appreciation and current income, assuming a moderate level of investment risk. The Fund is currently required to invest at all times a minimum of 25% in fixed income and 25% in equities. This requirement is in place because the fund name contains the word “Balanced.” Historically for the Fund, holding a minimum of 25% in fixed income investments has been a strategy we preferred. Fixed income investments have historically provided stability and an attractive level of income to the portfolio. However, with interest rates at extremely low levels (see enclosed chart) and with the possibility that they may well stay at those levels for an extended period of time, we believe the attractiveness of fixed income investments is diminished. Shorter duration fixed income investments still provide the function of stability to the Fund, but not an attractive income level.
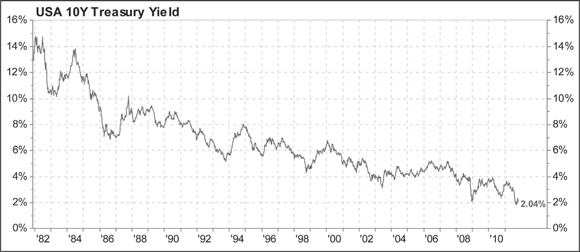
FactSet Data System
Effective at year end, the new name for the Balanced Fund will be the FBP Appreciation & Income Opportunities Fund. The Fund will continue to invest in both fixed income and equity securities but without
1
the previously described limitations, therefore the Fund will have increased flexibility to achieve its objectives. When market conditions change and yields are more attractive, the Fund will then be able to increase the fixed income component of the portfolio. However in the current investment environment, our focus will be to hold a larger portion of the portfolio in lower volatility but above-average yielding equity securities, increase our option writing activity to provide additional return and do so in a way that increases diversification. A fixed income component will be maintained to continue to provide a level of stability to the Fund.
Fund Update
The semi-annual period ended September 30, 2011 was painful for equity investors as the market peaked in early May, then moved sideways to down throughout the rest of the period. The third quarter endured its worst quarter in three years, as measured by the performance of the S&P 500 Index, and its third worst since 2002, and resulted in a disappointing semi-annual period. The S&P 500 Index slid 13.8% and the Russell 1000 Value Index dropped 16.6%. The period was marked by increased volatility and increasing concerns about macro events.
Several factors in our view have contributed to the market weakness including:
| • | a general lack of confidence in America’s political leadership |
| • | difficult Congressional negotiations concerning the U.S. debt ceiling |
| • | S&P’s downgrade of U.S. government debt |
| • | ongoing government debt crisis in Europe |
| • | the end of Fed stimulus known as QE2 |
| • | continuing decline in U.S. home prices |
| • | the apparent slowing of Asian economies |
These items have a common theme in that they all contributed to a decline in confidence, potentially leading to additional economic weakness. To be sure, we believe the odds of a recession have increased meaningfully, primarily due to the realization that Europe is probably entering one. The question is, will that spill over to the United States?
Economic data has been mixed all year with most indicators suggesting very slow growth or potential recession. The Federal Reserve announced a new stimulus effort, commonly called Operation Twist, to help address the concerns. President Obama also announced a jobs bill which includes additional stimulus efforts but also includes higher taxes, thus making passage difficult. European leaders are working to resolve their sovereign debt problems, but it is a challenging task. Housing affordability moved to new highs due to the combination of declining home prices and lower interest rates. Other recent economic reports, such as the Institute of Supply Managers index and construction spending, actually ticked higher last month and second quarter GDP was revised up slightly to 1.3%. Retail sales have also continued to track positive. Many economists are now calling for recession, but it is very difficult to forecast the economy with any certainty. We believe domestic GDP will continue to grow in the coming quarters, but that growth will likely remain slow and uneven.
How will the stock market react to that scenario? To a large extent it already has. In our view, today’s very low valuations on stocks appear to be discounting significant negative earnings revisions. Defensive sectors like Utilities, Telecommunication Services, Health Care and Consumer Staples have led the market while the more cyclical sectors such as Materials, Industrials and Information Technology have lagged. High quality, growth and dividend strategies have done well also. If GDP growth is better than currently expected, the markets will not be as focused on defensive strategies and equities can recover nicely.
Our team has worked to improve the return potential of the Funds during this most recent period of market volatility. We added Philips Electronics, Staples and Martin Marietta Materials to the portfolios and completely eliminated Willis Group, First American Financial, Home Depot and Amgen. We also adjusted the weightings of several holdings during the quarter, the most significant of which were an increase in
2
the holdings of Cisco, Bank of New York Mellon, Hewlett Packard and MetLife. These stocks all traded at significant discounts to our estimated values. Conversely we reduced Walgreen, Kimberly Clark, and McGraw Hill, as these stocks moved closer to our value. The speed and depth of the correction have been rather surprising, but we believe the portfolio is positioned for strong future returns. Whether measured on earnings or based on our estimates of company values, we believe the portfolio is trading at a deep discount to its potential. When we have seen these discounted levels in the past, above average returns have followed. Thus, we are optimistic about the long term potential in the portfolio.
We like to see “the pessimism so thick that you can cut it with a knife.” Today, there is no better example than Hewlett Packard (HPQ). Hewlett has been a disappointing investment, particularly since Mark Hurd was dismissed as CEO in 2010. Trading at less than 6 times earnings, we know that Hewlett has challenges, but we also see a company that has very strong market positions in its core businesses. The company has made management and board changes, and the new team certainly feels pressure to show improvement. HPQ is expected to generate approximately $12.5 billion in net operating earnings in 2012 but only has a market cap of roughly $50 billion. Philips Electronics, a European consumer electronics, lighting and health care company, also generates strong cash flow, forecasted to be $2.2 billion this year. The company plans to return significant amounts of this cash to shareholders in the form of dividends, which provide a current yield of 5.3%, and stock repurchases, which are expected to approach 15% of its market cap in the next 9 months. There are many other examples in the portfolio of high quality companies selling at what we believe to be very attractive prices.
Almost universally, investment managers have expected higher inflation and interest rates from the massive stimulus programs in place. The markets have delivered just the opposite. The uncertain economic situation that drove stock prices down has brought about strong performance from fixed income securities. However, the positive performance has been concentrated in U.S. government bonds and high-quality corporates, which have benefited from a dramatic flight-to-quality. Yields on U.S. treasuries were already near 50 year lows, but the surge in prices has driven them down even further. The 10-year treasury yield hit 1.71% recently, a level not seen since the 1940s. We believe that the low yields available in government bonds are unattractive. Therefore, we continue to maintain a defensive portfolio structure for the Balanced Fund, emphasizing short-term corporate bonds that will better hold their value in a rising rate environment.
Please visit our website at www.fbpfunds.com for information on your Funds and the investment philosophy and process we utilize to achieve their investment objectives.

John T. Bruce, CFA
President - Portfolio Manager
November 14, 2011
Data presented reflects past performance, which is no guarantee of future results. Investment results and principal value will fluctuate so that shares, when redeemed, may be worth more or less than their original cost. Due to market volatility, current performance may be higher or lower than the performance shown. Updated performance information, current through the most recent month-end, is available by contacting the Funds at 1-866-738-1127.
This report is submitted for the general information of the shareholders of the Funds. It reflects our views, opinions and portfolio holdings as of September 30, 2011, the end of the reporting period. These views are subject to change at any time based upon market or other conditions. For more current information throughout the year please visit www.fbpfunds.com or call the Funds at 1-866-738-1127. This report is not authorized for distribution to prospective investors in the Funds unless accompanied by a current prospectus. Distributed by Ultimus Fund Distributors, LLC
3
THE FLIPPIN, BRUCE & PORTER FUNDS
COMPARATIVE PERFORMANCE CHARTS
(Unaudited)
Performance for each Fund is compared to the most appropriate broad-based index, the S&P 500 Index, an unmanaged index of 500 large common stocks. Over time, this index has the potential to outpace FBP Balanced Fund, which normally maintains at least 25% of its net assets in fixed income securities. Balanced funds have the growth potential to outpace inflation, but they will typically lag a 100% stock index over the long term because of the fixed income portion of their portfolios. However, the advantage of the fixed income portion is that it can make the return and principal of a balanced fund more stable than a portfolio completely invested in stocks. Results are also compared to the Consumer Price Index, a measure of inflation.

4
THE FLIPPIN, BRUCE & PORTER FUNDS
COMPARATIVE PERFORMANCE CHARTS
(Unaudited) (Continued)
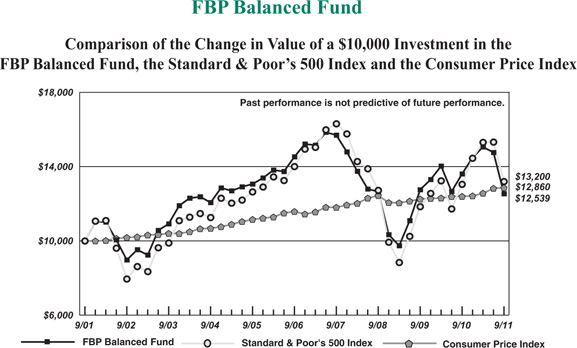
Average Annual Total Returns(a) (for periods ended September 30, 2011) | |||
| 1 Year | 5 Years | 10 Years | |
| FBP Value Fund | -12.87% | -7.37% | 0.56% |
| FBP Balanced Fund | -7.84% | -2.90% | 2.29% |
| Standard & Poor’s 500 Index | 1.14% | -1.18% | 2.82% |
| Consumer Price Index | 3.77% | 2.12% | 2.55% |
| (a) | Total returns are a measure of the change in value of an investment in the Funds over the periods covered, which assumes any dividends or capital gains distributions are reinvested in shares of the Funds. Returns do not reflect the deduction of taxes a shareholder would pay on the Funds’ distributions or the redemption of Fund shares. |
5
FBP VALUE FUND
PORTFOLIO INFORMATION
September 30, 2011 (Unaudited)
General Information | Asset Allocation (% of Net Assets) | |||
| Net Asset Value Per Share | $15.69 |  | ||
| Total Net Assets (Millions) | $19.9 | |||
| Current Expense Ratio | 1.07% | |||
| Portfolio Turnover | 13% | |||
| Fund Inception Date | 7/30/1993 | |||
Stock Characteristics | FBP Value Fund | S&P 500 Index | ||
| Number of Stocks | 46 | 500 | ||
| Weighted Avg Market Capitalization (Billions) | $54.8 | $85.7 | ||
| Price-to-Earnings Ratio (Bloomberg 1 Yr. Forecast EPS) | 8.1 | 10.5 | ||
| Price-to-Book Value | 1.2 | 1.9 | ||
Sector Diversification vs. the S&P 500 Index |
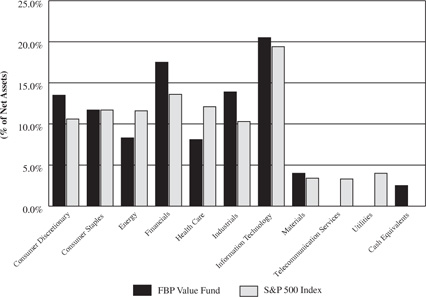
| Ten Largest Equity Holdings | % of Net Assets |
| JPMorgan Chase & Company | 4.5% |
| Johnson & Johnson | 4.0% |
| Cisco Systems, Inc. | 3.9% |
| Devon Energy Corporation | 3.3% |
| Royal Dutch Shell plc - Class A - ADR | 3.1% |
| Western Union Company (The) | 3.0% |
| McGraw-Hill Companies, Inc. (The) | 2.9% |
| Lockheed Martin Corporation | 2.9% |
| Bank of New York Mellon Corporation (The) | 2.8% |
| Hewlett-Packard Company | 2.7% |
6
FBP BALANCED FUND
PORTFOLIO INFORMATION
September 30, 2011 (Unaudited)
General Information | Asset Allocation (% of Net Assets) | ||
| Net Asset Value Per Share | $13.48 | 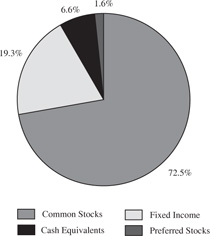 | |
| Total Net Assets (Millions) | $36.1 | ||
| Current Expense Ratio | 1.00% | ||
| Portfolio Turnover | 12% | ||
| Fund Inception Date | 7/3/1989 | ||
Common Stock Portfolio (72.5% of Fund) | ||||||
| Number of Stocks | 52 | Ten Largest Equity Holdings | % of Net Assets | |||
| Weighted Avg Market Capitalization (Billions) | $55.7 | Cisco Systems, Inc. | 2.6% | |||
| Price-to-Earnings Ratio (Bloomberg 1 Yr. Forecast EPS) | 8.5 | JPMorgan Chase & Company | 2.5% | |||
| Price-to-Book Value | 1.3 | Johnson & Johnson | 2.5% | |||
| Devon Energy Corporation | 2.3% | |||||
Five Largest Sectors | % of Net Assets | ConocoPhillips | 2.2% | |||
| Information Technology | 13.0% | E.I. du Pont de Nemours and Company | 2.0% | |||
| Financials | 10.7% | H&R Block, Inc. | 2.0% | |||
| Industrials | 9.4% | Western Union Conpany (The) | 1.9% | |||
| Consumer Staples | 9.2% | Sealed Air Corporation | 1.9% | |||
| Consumer Discretionary | 8.6% | McGraw-Hill Companies, Inc. (The) | 1.8% | |||
Fixed-Income Portfolio (19.3% of Fund) | ||||
| Number of Fixed-Income Securities | 9 | Sector Breakdown | % of Net Assets | |
| Average Quality | BBB+ | Financials | 6.4% | |
| Average Weighted Maturity | 1.7 yrs. | Industrials | 4.3% | |
| Average Effective Duration | 1.6 yrs. | Information Technology | 2.3% | |
| Consumer Discretionary | 2.1% | |||
| Utilities | 2.1% | |||
| Consumer Staples | 2.1% | |||
7
FBP VALUE FUND
SCHEDULE OF INVESTMENTS
September 30, 2011 (Unaudited)
COMMON STOCKS — 97.5% | Shares | Value | ||||||
| Consumer Discretionary — 13.5% | ||||||||
H&R Block, Inc. | 39,700 | $ | 528,407 | |||||
KB Home | 23,000 | 134,780 | ||||||
Kohl's Corporation | 8,000 | 392,800 | ||||||
Macy's, Inc. | 15,800 | 415,856 | ||||||
McGraw-Hill Companies, Inc. (The) | 14,000 | 574,000 | ||||||
Staples, Inc. | 16,000 | 212,800 | ||||||
Whirlpool Corporation | 8,600 | 429,226 | ||||||
| 2,687,869 | ||||||||
| Consumer Staples — 11.7% | ||||||||
Avon Products, Inc. | 20,000 | 392,000 | ||||||
CVS Caremark Corporation | 15,000 | 503,700 | ||||||
Kimberly-Clark Corporation | 6,000 | 426,060 | ||||||
PepsiCo, Inc. | 3,500 | 216,650 | ||||||
SUPERVALU, Inc. | 52,000 | 346,320 | ||||||
Walgreen Company | 6,000 | 197,340 | ||||||
Wal-Mart Stores, Inc. | 4,900 | 254,310 | ||||||
| 2,336,380 | ||||||||
| Energy — 8.3% | ||||||||
Chevron Corporation | 4,000 | 370,080 | ||||||
Devon Energy Corporation (a) | 12,000 | 665,280 | ||||||
Royal Dutch Shell plc - Class A - ADR | 10,000 | 615,200 | ||||||
| 1,650,560 | ||||||||
| Financials — 17.5% | ||||||||
Bank of America Corporation | 63,000 | 385,560 | ||||||
Bank of New York Mellon Corporation (The) | 29,600 | 550,264 | ||||||
Comerica, Inc. | 15,000 | 344,550 | ||||||
JPMorgan Chase & Company | 30,000 | 903,600 | ||||||
Lincoln National Corporation | 23,000 | 359,490 | ||||||
MetLife, Inc. | 17,000 | 476,170 | ||||||
Travelers Companies, Inc. (The) (a) | 9,501 | 462,984 | ||||||
| 3,482,618 | ||||||||
| Health Care — 8.1% | ||||||||
Johnson & Johnson | 12,500 | 796,375 | ||||||
Merck & Company, Inc. | 4,700 | 153,737 | ||||||
Pfizer, Inc. | 30,000 | 530,400 | ||||||
WellPoint, Inc. | 2,000 | 130,560 | ||||||
| 1,611,072 | ||||||||
| Industrials — 13.9% | ||||||||
Avery Dennison Corporation | 16,700 | 418,836 | ||||||
FedEx Corporation | 4,600 | 311,328 | ||||||
General Electric Company | 15,100 | 230,124 | ||||||
Ingersoll-Rand plc | 12,200 | 342,698 | ||||||
Koninklijke Philips Electronics N.V. - ADR | 29,000 | 520,260 | ||||||
Lockheed Martin Corporation | 7,900 | 573,856 | ||||||
Masco Corporation | 24,400 | 173,728 | ||||||
Northrop Grumman Corporation | 4,000 | 208,640 | ||||||
| 2,779,470 | ||||||||
8
FBP VALUE FUND
SCHEDULE OF INVESTMENTS (Continued)
COMMON STOCKS — 97.5% (Continued) | Shares | Value | ||||||
| Information Technology — 20.5% | ||||||||
Cisco Systems, Inc. | 50,000 | $ | 774,500 | |||||
Computer Sciences Corporation (a) | 20,000 | 537,000 | ||||||
Dell, Inc. (b) | 35,000 | 495,250 | ||||||
Flextronics International Ltd. (b) | 82,000 | 461,660 | ||||||
Hewlett-Packard Company | 24,000 | 538,800 | ||||||
International Business Machines Corporation (a) | 1,000 | 175,030 | ||||||
Microsoft Corporation | 20,000 | 497,800 | ||||||
Western Union Company (The) | 39,000 | 596,310 | ||||||
| 4,076,350 | ||||||||
| Materials — 4.0% | ||||||||
Martin Marietta Materials, Inc. | 4,800 | 303,456 | ||||||
Sealed Air Corporation | 30,000 | 501,000 | ||||||
| 804,456 | ||||||||
Total Common Stocks (Cost $21,615,076) | $ | 19,428,775 | ||||||
MONEY MARKET FUNDS — 2.4% | Shares | Value | ||||||
Fidelity Institutional Money Market Government Portfolio - Class I, 0.01% (c) (Cost $486,077) | 486,077 | $ | 486,077 | |||||
Total Investments at Value — 99.9% (Cost $22,101,153) | $ | 19,914,852 | ||||||
Other Assets in Excess of Liabilities — 0.1% | 10,722 | |||||||
Net Assets — 100.0% | $ | 19,925,574 | ||||||
| ADR - American Depositary Receipt. | |
| (a) | Security covers a written call option. |
| (b) | Non-income producing security. |
| (c) | Variable rate security. The rate shown is the 7-day effective yield as of September 30, 2011. |
| See accompanying notes to financial statements. | |
9
FBP VALUE FUND
SCHEDULE OF OPEN OPTION CONTRACTS
September 30, 2011 (Unaudited)
COVERED CALL OPTIONS | Option Contracts | Value of Options | Premiums Received | |||||||||
| Computer Sciences Corporation, | ||||||||||||
01/21/2012 at $60 | 40 | $ | 400 | $ | 14,679 | |||||||
| Devon Energy Corporation, | ||||||||||||
01/21/2012 at $100 | 20 | 140 | 9,240 | |||||||||
| International Business Machines Corporation, | ||||||||||||
01/21/2012 at $175 | 10 | 12,360 | 6,320 | |||||||||
| Travelers Companies, Inc. (The), | ||||||||||||
01/21/2012 at $65 | 35 | 350 | 10,744 | |||||||||
| $ | 13,250 | $ | 40,983 | |||||||||
| See accompanying notes to financial statements. |
10
FBP BALANCED FUND
SCHEDULE OF INVESTMENTS
September 30, 2011 (Unaudited)
COMMON STOCKS — 72.5% | Shares | Value | ||||||
| Consumer Discretionary — 8.6% | ||||||||
H&R Block, Inc. | 53,000 | $ | 705,430 | |||||
KB Home | 26,000 | 152,360 | ||||||
Kohl's Corporation | 7,500 | 368,250 | ||||||
Macy's, Inc. | 18,000 | 473,760 | ||||||
McGraw-Hill Companies, Inc. (The) | 16,000 | 656,000 | ||||||
Staples, Inc. | 19,000 | 252,700 | ||||||
Whirlpool Corporation | 10,000 | 499,100 | ||||||
| 3,107,600 | ||||||||
| Consumer Staples — 9.2% | ||||||||
Avon Products, Inc. | 24,000 | 470,400 | ||||||
CVS Caremark Corporation | 18,000 | 604,440 | ||||||
Kimberly-Clark Corporation | 7,300 | 518,373 | ||||||
PepsiCo, Inc. | 4,200 | 259,980 | ||||||
Philip Morris International, Inc. (a) | 6,500 | 405,470 | ||||||
SUPERVALU, Inc. | 54,000 | 359,640 | ||||||
Walgreen Company | 7,000 | 230,230 | ||||||
Wal-Mart Stores, Inc. | 9,500 | 493,050 | ||||||
| 3,341,583 | ||||||||
| Energy — 7.5% | ||||||||
Chevron Corporation | 5,000 | 462,600 | ||||||
ConocoPhillips (a) | 12,500 | 791,500 | ||||||
Devon Energy Corporation (a) | 15,000 | 831,601 | ||||||
Royal Dutch Shell plc - Class A - ADR | 10,000 | 615,200 | ||||||
| 2,700,901 | ||||||||
| Financials — 10.7% | ||||||||
Bank of America Corporation | 69,000 | 422,280 | ||||||
Bank of New York Mellon Corporation (The) | 34,000 | 632,060 | ||||||
Comerica, Inc. | 18,000 | 413,460 | ||||||
JPMorgan Chase & Company | 30,000 | 903,600 | ||||||
Lincoln National Corporation | 25,000 | 390,750 | ||||||
MetLife, Inc. | 20,000 | 560,200 | ||||||
Travelers Companies, Inc. (The) (a) | 11,000 | 536,030 | ||||||
| 3,858,380 | ||||||||
| Health Care — 5.8% | ||||||||
Johnson & Johnson | 14,000 | 891,940 | ||||||
Merck & Company, Inc. | 15,600 | 510,276 | ||||||
Pfizer, Inc. | 31,000 | 548,080 | ||||||
WellPoint, Inc. | 2,000 | 130,560 | ||||||
| 2,080,856 | ||||||||
| Industrials — 9.4% | ||||||||
Avery Dennison Corporation | 18,000 | 451,440 | ||||||
FedEx Corporation | 6,400 | 433,152 | ||||||
General Electric Company | 17,000 | 259,080 | ||||||
Ingersoll-Rand plc | 22,000 | 617,980 | ||||||
Koninklijke Philips Electronics N.V. - ADR | 32,700 | 586,638 | ||||||
Lockheed Martin Corporation | 8,400 | 610,176 | ||||||
11
FBP BALANCED FUND
SCHEDULE OF INVESTMENTS (Continued)
COMMON STOCKS — 72.5% (Continued) | Shares | Value | ||||||
| Industrials — 9.4% (Continued) | ||||||||
Masco Corporation | 25,000 | $ | 178,000 | |||||
Northrop Grumman Corporation | 5,000 | 260,800 | ||||||
| 3,397,266 | ||||||||
| Information Technology — 13.0% | ||||||||
Cisco Systems, Inc. | 60,000 | 929,400 | ||||||
Computer Sciences Corporation (a) | 23,000 | 617,550 | ||||||
Dell, Inc. (b) | 35,000 | 495,250 | ||||||
Flextronics International Ltd. (b) | 85,000 | 478,550 | ||||||
Hewlett-Packard Company | 27,000 | 606,150 | ||||||
International Business Machines Corporation (a) | 2,000 | 350,060 | ||||||
Microsoft Corporation | 21,000 | 522,690 | ||||||
Western Union Company (The) | 45,000 | 688,050 | ||||||
| 4,687,700 | ||||||||
| Materials — 5.4% | ||||||||
E.I. du Pont de Nemours and Company (a) | 18,000 | 719,460 | ||||||
Martin Marietta Materials, Inc. | 5,000 | 316,100 | ||||||
Nucor Corporation | 8,000 | 253,120 | ||||||
Sealed Air Corporation | 40,000 | 668,000 | ||||||
| 1,956,680 | ||||||||
| Utilities — 2.9% | ||||||||
American Electric Power Company, Inc. | 14,000 | 532,280 | ||||||
Duke Energy Corporation | 26,000 | 519,740 | ||||||
| 1,052,020 | ||||||||
Total Common Stocks (Cost $26,832,487) | $ | 26,182,986 | ||||||
PREFERRED STOCKS — 1.6% | Shares | Value | ||||||
BB&T Capital Trust VII (Cost $550,000) | 22,000 | $ | 569,800 | |||||
CORPORATE BONDS — 19.3% | Par Value | Value | ||||||
| Consumer Discretionary — 2.1% | ||||||||
| Anheuser-Busch InBev SA/NV, 3.00%, due 10/15/2012 | $ | 750,000 | $ | 765,578 | ||||
| Consumer Staples — 2.1% | ||||||||
Kraft Foods, Inc., 5.625%, due 11/01/2011 | 750,000 | 752,381 | ||||||
| Financials — 6.4% | ||||||||
| American Express Company, 4.875%, due 07/15/2013 | 750,000 | 787,670 | ||||||
| Berkley (W.R.) Corporation, 5.60%, due 05/15/2015 | 750,000 | 757,799 | ||||||
| Prudential Financial, Inc., 5.80%, due 06/15/2012 | 750,000 | 769,744 | ||||||
| 2,315,213 | ||||||||
12
FBP BALANCED FUND
SCHEDULE OF INVESTMENTS (Continued)
CORPORATE BONDS — 19.3% (Continued) | Par Value | Value | ||||||
| Industrials — 4.3% | ||||||||
| Donnelly (R.R.) & Sons Company, 4.95%, due 04/01/2014 | $ | 750,000 | $ | 708,750 | ||||
Eaton Corporation, 5.95%, due 03/20/2014 | 750,000 | 829,037 | ||||||
| 1,537,787 | ||||||||
| Information Technology — 2.3% | ||||||||
Analog Devices, Inc., 5.00%, due 07/01/2014 | 750,000 | 819,783 | ||||||
| Utilities — 2.1% | ||||||||
| SBC Communications, Inc., 5.875%, due 02/01/2012 | 750,000 | 762,067 | ||||||
Total Corporate Bonds (Cost $6,819,409) | $ | 6,952,809 | ||||||
MONEY MARKET FUNDS — 4.9% | Shares | Value | ||||||
Fidelity Institutional Money Market Government Portfolio - Class I, 0.01% (c) (Cost $1,787,462) | 1,787,462 | $ | 1,787,462 | |||||
REPURCHASE AGREEMENTS — 1.5% | Par Value | Value | ||||||
U.S. Bank N.A., 0.01%, dated 09/30/2011, due 10/03/2011, repurchase proceeds: $550,635 (Cost $550,634) (d) | $ | 550,634 | $ | 550,634 | ||||
Total Investments at Value — 99.8% (Cost $36,539,992) | $ | 36,043,691 | ||||||
Other Assets in Excess of Liabilities — 0.2% | 62,885 | |||||||
Net Assets — 100.0% | $ | 36,106,576 | ||||||
| ADR - American Depositary Receipt. | |
| (a) | Security covers a written call option. |
| (b) | Non-income producing security. |
| (c) | Variable rate security. The rate shown is the 7-day effective yield as of September 30, 2011. |
| (d) | Repurchase agreement is fully collateralized by $523,643 FGCI #E95616, 4.50%, due 03/01/2018. The aggregate market value of the collateral at September 30, 2011 was $561,750. |
| See accompanying notes to financial statements. | |
13
FBP BALANCED FUND
SCHEDULE OF OPEN OPTION CONTRACTS
September 30, 2011 (Unaudited)
COVERED CALL OPTIONS | Option Contracts | Value of Options | Premiums Received | |||||||||
| Computer Sciences Corporation, | ||||||||||||
01/21/2012 at $60 | 50 | $ | 500 | $ | 18,349 | |||||||
| ConocoPhillips, | ||||||||||||
01/21/2012 at $85 | 40 | 600 | 17,279 | |||||||||
| Devon Energy Corporation, | ||||||||||||
01/21/2012 at $100 | 20 | 140 | 9,240 | |||||||||
| E.I. du Pont de Nemours and Company, | ||||||||||||
01/21/2012 at $55 | 90 | 1,710 | 30,448 | |||||||||
| International Business Machines Corporation, | ||||||||||||
01/21/2012 at $175 | 20 | 24,720 | 12,639 | |||||||||
| Philip Morris International, Inc., | ||||||||||||
03/17/2012 at $75 | 35 | 2,520 | 8,399 | |||||||||
| Travelers Companies, Inc. (The), | ||||||||||||
01/21/2012 at $65 | 50 | 500 | 15,349 | |||||||||
| $ | 30,690 | $ | 111,703 | |||||||||
| See accompanying notes to financial statements. |
14
THE FLIPPIN, BRUCE & PORTER FUNDS
STATEMENTS OF ASSETS AND LIABILITIES
September 30, 2011 (Unaudited)
FBP Value Fund | FBP Balanced Fund | |||||||
| ASSETS | ||||||||
| Investments in securities: | ||||||||
At acquisition cost | $ | 22,101,153 | $ | 36,539,992 | ||||
At value (Note 2) | $ | 19,914,852 | $ | 36,043,691 | ||||
Cash | 1,464 | 2,684 | ||||||
Dividends and interest receivable | 32,287 | 151,721 | ||||||
Receivable for capital shares sold | 4,288 | 588 | ||||||
Other assets | 7,920 | 5,913 | ||||||
TOTAL ASSETS | 19,960,811 | 36,204,597 | ||||||
| LIABILITIES | ||||||||
| Covered call options, at value (Notes 2 and 5) (premiums received $40,983 and $111,703, respectively) | 13,250 | 30,690 | ||||||
Distributions payable | 2,230 | 23,561 | ||||||
Payable for capital shares redeemed | — | 11,014 | ||||||
Accrued investment advisory fees (Note 4) | 4,931 | 16,132 | ||||||
Payable to administrator (Note 4) | 4,700 | 5,100 | ||||||
Other accrued expenses | 10,126 | 11,524 | ||||||
TOTAL LIABILITIES | 35,237 | 98,021 | ||||||
NET ASSETS | $ | 19,925,574 | $ | 36,106,576 | ||||
| Net assets consist of: | ||||||||
Paid-in capital | $ | 23,999,529 | $ | 36,453,107 | ||||
Accumulated (Distributions in excess of) net investment income | 1,325 | (37,365 | ) | |||||
Accumulated net realized gains (losses) from security transactions | (1,916,712 | ) | 106,122 | |||||
Net unrealized depreciation on investments | (2,158,568 | ) | (415,288 | ) | ||||
Net assets | $ | 19,925,574 | $ | 36,106,576 | ||||
Shares of beneficial interest outstanding (unlimited number of shares authorized, $0.01 par value) | 1,270,284 | 2,677,674 | ||||||
Net asset value, offering price and redemption price per share (Note 2) | $ | 15.69 | $ | 13.48 | ||||
| See accompanying notes to financial statements. |
15
THE FLIPPIN, BRUCE & PORTER FUNDS
STATEMENTS OF OPERATIONS
Six Months Ended September 30, 2011 (Unaudited)
FBP Value Fund | FBP Balanced Fund | |||||||
| INVESTMENT INCOME | ||||||||
Dividends | $ | 266,181 | $ | 408,867 | ||||
Foreign withholding taxes on dividends | (2,520 | ) | (2,520 | ) | ||||
Interest | 4 | 156,977 | ||||||
TOTAL INVESTMENT INCOME | 263,665 | 563,324 | ||||||
| EXPENSES | ||||||||
Investment advisory fees (Note 4) | 86,104 | 151,227 | ||||||
Administration fees (Note 4) | 24,000 | 30,103 | ||||||
Professional fees | 10,275 | 11,070 | ||||||
Trustees’ fees and expenses | 5,418 | 5,418 | ||||||
Registration fees | 6,194 | 4,244 | ||||||
Compliance service fees (Note 4) | 4,200 | 4,200 | ||||||
Custodian and bank service fees | 3,324 | 3,937 | ||||||
Printing of shareholder reports | 3,990 | 2,772 | ||||||
Postage and supplies | 2,765 | 2,367 | ||||||
Insurance expense | 1,297 | 1,958 | ||||||
Other expenses | 3,643 | 4,433 | ||||||
TOTAL EXPENSES | 151,210 | 221,729 | ||||||
| Fees voluntarily waived by the Adviser (Note 4) | (19,593 | ) | (5,691 | ) | ||||
NET EXPENSES | 131,617 | 216,038 | ||||||
NET INVESTMENT INCOME | 132,048 | 347,286 | ||||||
REALIZED AND UNREALIZED GAINS (LOSSES) ON INVESTMENTS | ||||||||
| Net realized gains from: | ||||||||
Security transactions | 867,602 | 957,727 | ||||||
Option contracts (Note 5) | 56,997 | 83,142 | ||||||
| Net realized gains from in-kind redemptions (Note 2) | 543,794 | 983,426 | ||||||
| Net change in unrealized appreciation/depreciation on: | ||||||||
Investments | (7,877,106 | ) | (9,928,596 | ) | ||||
Option contracts (Note 5) | 7,432 | 66,648 | ||||||
NET REALIZED AND UNREALIZED LOSSES ON INVESTMENTS | (6,401,281 | ) | (7,837,653 | ) | ||||
NET DECREASE IN NET ASSETS FROM OPERATIONS | $ | (6,269,233 | ) | $ | (7,490,367 | ) | ||
| See accompanying notes to financial statements. |
16
THE FLIPPIN, BRUCE & PORTER FUNDS
STATEMENTS OF CHANGES IN NET ASSETS
FBP Value Fund | FBP Balanced Fund | |||||||||||||||
Six Months Ended Sept. 30, 2011 (Unaudited) | Year Ended March 31, 2011 | Six Months Ended Sept. 30, 2011 (Unaudited) | Year Ended March 31, 2011 | |||||||||||||
| FROM OPERATIONS | ||||||||||||||||
Net investment income | $ | 132,048 | $ | 207,857 | $ | 347,286 | $ | 706,857 | ||||||||
| Net realized gains from: | ||||||||||||||||
Security transactions | 867,602 | 1,451,330 | 957,727 | 1,379,317 | ||||||||||||
Option contracts (Note 5) | 56,997 | 31,408 | 83,142 | 38,134 | ||||||||||||
| Net realized gains from in-kind redemptions (Note 2) | 543,794 | — | 983,426 | — | ||||||||||||
| Net change in unrealized appreciation/depreciation on: | ||||||||||||||||
Investments | (7,877,106 | ) | 127,937 | (9,928,596 | ) | 1,106,506 | ||||||||||
Option contracts (Note 5) | 7,432 | 20,301 | 66,648 | 14,365 | ||||||||||||
Net increase (decrease) in net assets from operations | (6,269,233 | ) | 1,838,833 | (7,490,367 | ) | 3,245,179 | ||||||||||
| DISTRIBUTIONS TO SHAREHOLDERS | ||||||||||||||||
From net investment income | (137,733 | ) | (199,622 | ) | (399,139 | ) | (740,442 | ) | ||||||||
| FROM CAPITAL SHARE TRANSACTIONS | ||||||||||||||||
Proceeds from shares sold | 415,179 | 1,031,474 | 218,877 | 3,258,609 | ||||||||||||
Net asset value of shares issued in reinvestment of distributions to shareholders | 132,733 | 193,658 | 347,445 | 650,777 | ||||||||||||
Payments for shares redeemed | (1,622,118 | ) | (4,074,197 | ) | (2,976,543 | ) | (5,514,554 | ) | ||||||||
Net decrease in net assets from capital share transactions | (1,074,206 | ) | (2,849,065 | ) | (2,410,221 | ) | (1,605,168 | ) | ||||||||
TOTAL INCREASE (DECREASE) IN NET ASSETS | (7,481,172 | ) | (1,209,854 | ) | (10,299,727 | ) | 899,569 | |||||||||
| NET ASSETS | ||||||||||||||||
Beginning of period | 27,406,746 | 28,616,600 | 46,406,303 | 45,506,734 | ||||||||||||
End of period | $ | 19,925,574 | $ | 27,406,746 | $ | 36,106,576 | $ | 46,406,303 | ||||||||
| ACCUMULATED (DISTRIBUTIONS IN EXCESS OF) NET INVESTMENT INCOME | $ | 1,325 | $ | 7,010 | $ | (37,365 | ) | $ | 14,488 | |||||||
| CAPITAL SHARE ACTIVITY | ||||||||||||||||
Shares sold | 21,284 | 53,032 | 14,285 | 211,833 | ||||||||||||
Shares reinvested | 7,521 | 10,307 | 23,626 | 42,971 | ||||||||||||
Shares redeemed | (82,509 | ) | (213,062 | ) | (198,445 | ) | (354,412 | ) | ||||||||
Net decrease in shares outstanding | (53,704 | ) | (149,723 | ) | (160,534 | ) | (99,608 | ) | ||||||||
Shares outstanding at beginning of period | 1,323,988 | 1,473,711 | 2,838,208 | 2,937,816 | ||||||||||||
Shares outstanding at end of period | 1,270,284 | 1,323,988 | 2,677,674 | 2,838,208 | ||||||||||||
| See accompanying notes to financial statements. |
17
FBP VALUE FUND
FINANCIAL HIGHLIGHTS
Selected Per Share Data and Ratios for a Share Outstanding Throughout Each Period | ||||||||||||||||||||||||
Six Months Ended Sept. 30, 2011 (Unaudited) | Years Ended March 31, | |||||||||||||||||||||||
| 2011 | 2010 | 2009 | 2008 | 2007 | ||||||||||||||||||||
Net asset value at beginning of period | $ | 20.70 | $ | 19.42 | $ | 12.02 | $ | 20.99 | $ | 27.30 | $ | 26.60 | ||||||||||||
Income (loss) from investment operations: | ||||||||||||||||||||||||
| Net investment income | 0.10 | 0.15 | 0.12 | 0.27 | 0.32 | 0.33 | ||||||||||||||||||
Net realized and unrealized gains (losses) on investments | (5.00 | ) | 1.27 | 7.41 | (8.98 | ) | (4.43 | ) | 2.71 | |||||||||||||||
| Total from investment operations | (4.90 | ) | 1.42 | 7.53 | (8.71 | ) | (4.11 | ) | 3.04 | |||||||||||||||
| Less distributions: | ||||||||||||||||||||||||
Dividends from net investment income | (0.11 | ) | (0.14 | ) | (0.13 | ) | (0.26 | ) | (0.32 | ) | (0.33 | ) | ||||||||||||
Distributions from net realized gains | — | — | — | — | (1.68 | ) | (2.01 | ) | ||||||||||||||||
Return of capital | — | — | — | — | (0.20 | ) | — | |||||||||||||||||
Total distributions | (0.11 | ) | (0.14 | ) | (0.13 | ) | (0.26 | ) | (2.20 | ) | (2.34 | ) | ||||||||||||
| Net asset value at end of period | $ | 15.69 | $ | 20.70 | $ | 19.42 | $ | 12.02 | $ | 20.99 | $ | 27.30 | ||||||||||||
Total return (a) | (23.74% | )(b) | 7.40% | 62.84% | (41.78% | ) | (16.33% | ) | 11.57% | |||||||||||||||
| Net assets at end of period (000’s) | $ | 19,926 | $ | 27,407 | $ | 28,617 | $ | 20,605 | $ | 43,072 | $ | 60,233 | ||||||||||||
Ratio of total expenses to average net assets | 1.23% | (c) | 1.19% | 1.19% | 1.18% | 1.01% | 1.01% | |||||||||||||||||
Ratio of net expenses to average net assets (d) | 1.07% | (c) | 1.07% | 1.07% | 1.07% | 1.01% | 1.01% | |||||||||||||||||
Ratio of net investment income to average net assets (d) | 1.08% | (c) | 0.78% | 0.74% | 1.59% | 1.21% | 1.19% | |||||||||||||||||
Portfolio turnover rate | 13% | (b) | 25% | 21% | 16% | 26% | 16% | |||||||||||||||||
| (a) | Total return is a measure of the change in value of an investment in the Fund over the periods covered, which assumes any dividends or capital gains distributions are reinvested in shares of the Fund. Returns shown do not reflect the deduction of taxes a shareholder would pay on Fund distributions or the redemption of Fund shares. |
| (b) | Not annualized. |
| (c) | Annualized. |
| (d) | Ratios were determined after voluntary advisory fee reductions by the Adviser (Note 4). |
| See accompanying notes to financial statements. |
18
FBP BALANCED FUND
FINANCIAL HIGHLIGHTS
Selected Per Share Data and Ratios for a Share Outstanding Throughout Each Period | ||||||||||||||||||||||||
Six Months Ended Sept. 30, 2011 (Unaudited) | Years Ended March 31, | |||||||||||||||||||||||
| 2011 | 2010 | 2009 | 2008 | 2007 | ||||||||||||||||||||
Net asset value at beginning of period | $ | 16.35 | $ | 15.49 | $ | 10.97 | $ | 15.84 | $ | 18.95 | $ | 18.39 | ||||||||||||
Income (loss) from investment operations: | ||||||||||||||||||||||||
| Net investment income | 0.13 | 0.24 | 0.27 | 0.32 | 0.38 | 0.37 | ||||||||||||||||||
Net realized and unrealized gains (losses) on investments | (2.85 | ) | 0.88 | 4.53 | (4.89 | ) | (2.01 | ) | 1.39 | |||||||||||||||
| Total from investment operations | (2.72 | ) | 1.12 | 4.80 | (4.57 | ) | (1.63 | ) | 1.76 | |||||||||||||||
| Less distributions: | ||||||||||||||||||||||||
Dividends from net investment income | (0.15 | ) | (0.26 | ) | (0.28 | ) | (0.30 | ) | (0.39 | ) | (0.37 | ) | ||||||||||||
Distributions from net realized gains | — | — | — | — | (1.02 | ) | (0.83 | ) | ||||||||||||||||
Return of capital | — | — | — | — | (0.07 | ) | — | |||||||||||||||||
Total distributions | (0.15 | ) | (0.26 | ) | (0.28 | ) | (0.30 | ) | (1.48 | ) | (1.20 | ) | ||||||||||||
| Net asset value at end of period | $ | 13.48 | $ | 16.35 | $ | 15.49 | $ | 10.97 | $ | 15.84 | $ | 18.95 | ||||||||||||
Total return (a) | (16.73% | )(b) | 7.35% | 44.01% | (29.15% | ) | (9.27% | ) | 9.70% | |||||||||||||||
| Net assets at end of period (000’s) | $ | 36,107 | $ | 46,406 | $ | 45,507 | $ | 34,199 | $ | 54,995 | $ | 66,358 | ||||||||||||
Ratio of total expenses to average net assets | 1.03% | (c) | 1.03% | 1.03% | 1.05% | 0.96% | 0.97% | |||||||||||||||||
Ratio of net expenses to average net assets (d) | 1.00% | (c) | 1.00% | 1.00% | 1.00% | 0.96% | 0.97% | |||||||||||||||||
Ratio of net investment income to average net assets (d) | 1.61% | (c) | 1.59% | 1.90% | 2.36% | 2.05% | 1.95% | |||||||||||||||||
Portfolio turnover rate | 12% | (b) | 24% | 24% | 24% | 29% | 17% | |||||||||||||||||
| (a) | Total return is a measure of the change in value of an investment in the Fund over the periods covered, which assumes any dividends or capital gains distributions are reinvested in shares of the Fund. Returns shown do not reflect the deduction of taxes a shareholder would pay on Fund distributions or the redemption of Fund shares. |
| (b) | Not annualized. |
| (c) | Annualized. |
| (d) | Ratios were determined after voluntary advisory fee reductions by the Adviser (Note 4). |
| See accompanying notes to financial statements. |
19
THE FLIPPIN, BRUCE & PORTER FUNDS
NOTES TO FINANCIAL STATEMENTS
September 30, 2011 (Unaudited)
1. Organization
FBP Value Fund and FBP Balanced Fund (the “Funds”) are no-load, diversified series of the Williamsburg Investment Trust (the “Trust”), an open-end management investment company registered under the Investment Company Act of 1940. The Trust was organized as a Massachusetts business trust on July 18, 1988. Other series of Williamsburg Investment Trust are not included in this report.
FBP Value Fund seeks long term growth of capital with current income as a secondary objective.
FBP Balanced Fund seeks long term capital appreciation and current income, assuming a moderate level of investment risk.
2. Significant Accounting Policies
The following is a summary of the Funds’ significant accounting policies. The policies are in conformity with accounting principles generally accepted in the United States of America (“GAAP”).
Securities valuation — The Funds’ portfolio securities are valued as of the close of business of the regular session of the New York Stock Exchange (normally 4:00 p.m., Eastern time). Securities traded on a national stock exchange are valued based upon the closing price on the principal exchange where the security is traded. Securities which are quoted by NASDAQ are valued at the NASDAQ Official Closing Price. Securities which are traded over-the-counter are valued at the last sales price, if available, otherwise, at the last quoted bid price. It is expected that fixed income securities will ordinarily be traded in the over-the-counter market, and common stocks will ordinarily be traded on a national securities exchange, but may also be traded in the over-the-counter market. Call options written by the Funds are valued at the then current market quotation, using the ask price as of the close of each day on the principal exchanges on which they are traded. Short-term instruments (those with remaining maturities of 60 days or less) may be valued at amortized cost, which approximates market value.
When market quotations are not readily available, securities may be valued on the basis of prices provided by an independent pricing service. The prices provided by the pricing service are determined with consideration given to institutional bid and last sale prices and take into account securities prices, yields, maturities, call features, ratings, institutional trading in similar groups of securities and developments related to specific securities. If a pricing service cannot provide a valuation, securities will be valued in good faith at fair value using methods consistent with those determined by the Board of Trustees and will be classified as Level 2 or 3 (see below) within the fair value hierarchy, depending on the inputs used. Such methods of fair valuation may include, but are not limited to: multiple of earnings, multiple of book value, discount from market of a similar freely traded security, purchase price of the security, subsequent private transactions in the security or related securities, or a combination of these and other factors.
GAAP establishes a single authoritative definition of fair value, sets out a framework for measuring fair value and requires additional disclosures about fair value measurements. Various inputs are used in determining the value of each Fund’s investments. These inputs are summarized in the three broad levels listed below:
• Level 1 – quoted prices in active markets for identical securities
• Level 2 – other significant observable inputs
• Level 3 – significant unobservable inputs
20
THE FLIPPIN, BRUCE & PORTER FUNDS
NOTES TO FINANCIAL STATEMENTS (Continued)
For example, corporate bonds and repurchase agreements held by FBP Balanced Fund are classified as Level 2 since values are based on prices provided by an independent pricing service that utilizes various “other significant observable inputs” including bid and ask quotations, prices of similar securities and interest rates, among other factors.
The inputs or methodology used for valuing securities are not necessarily an indication of the risks associated with investing in those securities. The inputs used to measure fair value may fall into different levels of the fair value hierarchy. In such cases, for disclosure purposes, the level in the fair value hierarchy within which the fair value measurement falls in its entirety is determined based on the lowest level input that is significant to the fair value measurement.
The following is a summary of the inputs used to value each Fund’s investments and other financial instruments as of September 30, 2011 by security type:
FBP Value Fund | Level 1 | Level 2 | Level 3 | Total | ||||||||||||
Common Stocks | $ | 19,428,775 | $ | — | $ | — | $ | 19,428,775 | ||||||||
Money Market Funds | 486,077 | — | — | 486,077 | ||||||||||||
Covered Call Options | (13,250 | ) | — | — | (13,250 | ) | ||||||||||
Total | $ | 19,901,602 | $ | — | $ | — | $ | 19,901,602 | ||||||||
FBP Balanced Fund | Level 1 | Level 2 | Level 3 | Total | ||||||||||||
Common Stocks | $ | 26,182,986 | $ | — | $ | — | $ | 26,182,986 | ||||||||
Preferred Stocks | 569,800 | — | — | 569,800 | ||||||||||||
Corporate Bonds | — | 6,952,809 | — | 6,952,809 | ||||||||||||
Money Market Funds | 1,787,462 | — | — | 1,787,462 | ||||||||||||
Repurchase Agreements | — | 550,634 | — | 550,634 | ||||||||||||
Covered Call Options | (30,690 | ) | — | — | (30,690 | ) | ||||||||||
Total | $ | 28,509,558 | $ | 7,503,443 | $ | — | $ | 36,013,001 | ||||||||
Refer to each Fund’s Schedule of Investments for a listing of the common stocks and corporate bonds valued using Level 1 and Level 2 inputs by sector type. During the six months ended September 30, 2011, the Funds did not have any significant transfers in and out of any Level. There were no Level 3 securities held by the Funds during the six months ended or as of September 30, 2011. It is the Funds’ policy to recognize transfers into and out of any Level at the end of the reporting period.
Share valuation — The net asset value per share of each Fund is calculated daily by dividing the total value of its assets, less liabilities, by the number of shares outstanding. The offering price and redemption price per share of each Fund is equal to its net asset value per share.
Investment income — Interest income is accrued as earned. Dividend income is recorded on the ex-dividend date. Discounts and premiums on fixed income securities purchased are amortized using the interest method.
Repurchase agreements — Each Fund may enter into repurchase agreements. A repurchase agreement, which is collateralized by U.S. Government obligations, is valued at cost which, together with accrued interest, approximates market value. At the time a Fund enters into a repurchase agreement, the Fund takes possession
21
THE FLIPPIN, BRUCE & PORTER FUNDS
NOTES TO FINANCIAL STATEMENTS (Continued)
of the underlying securities and the seller agrees that the value of the underlying securities, including accrued interest, will at all times be equal to or exceed the face amount of the repurchase agreement. In addition, the Funds actively monitor and seek additional collateral, as needed. If the seller defaults, the fair value of the collateral may decline and realization of the collateral by the Funds may be delayed or limited.
Distributions to shareholders — Dividends arising from net investment income are declared and paid quarterly to shareholders of each Fund. Net realized short-term capital gains, if any, may be distributed throughout the year and net realized long-term capital gains, if any, are distributed at least once each year. The amount of distributions from net investment income and net realized gains are determined in accordance with federal income tax regulations, which may differ from GAAP. These “book/tax” differences are either temporary or permanent in nature.
The tax character of distributions paid by each Fund during the six months ended September 30, 2011 and the year ended March 31, 2011 is ordinary income.
Security transactions — Security transactions are accounted for on trade date. Gains and losses on securities sold are determined on a specific identification basis.
Common expenses — Common expenses of the Trust are allocated among the funds of the Trust based on relative net assets of each fund or the nature of the services performed and the relative applicability to each fund.
Options transactions — When the Funds’ investment adviser believes that individual portfolio securities held by the Funds are approaching the top of the adviser’s growth and price expectations, the Funds may write covered call options for which premiums are received and are recorded as liabilities, and are subsequently valued daily at the closing prices on their primary exchanges. Premiums received from writing options which expire are treated as realized gains. Premiums received from writing options which are exercised increase the proceeds used to calculate the realized gain or loss on the sale of the security. If a closing purchase transaction is used to terminate a Fund’s obligation on a call option, a gain or loss will be realized, depending upon whether the price of the closing purchase transaction is more or less than the premium previously received on the call option written.
Estimates — The preparation of financial statements in conformity with GAAP requires management to make estimates and assumptions that affect the reported amounts of assets and liabilities and the disclosure of contingent assets and liabilities as of the date of the financial statements and the reported amounts of income and expenses during the reporting period. Actual results could differ from those estimates.
Federal income tax — It is each Fund’s policy to comply with the special provisions of Subchapter M of the Internal Revenue Code applicable to regulated investment companies. As provided therein, in any fiscal year in which a Fund so qualifies and distributes at least 90% of its taxable net income, the Fund (but not the shareholders) will be relieved of federal income tax on the income distributed. Accordingly, no provision for income taxes has been made.
In order to avoid imposition of the excise tax applicable to regulated investment companies, it is also each Fund’s intention to declare as dividends in each calendar year at least 98% of its net investment income (earned during the calendar year) and 98.2% of its net realized capital gains (earned during the twelve months ended October 31) plus undistributed amounts from prior years.
22
THE FLIPPIN, BRUCE & PORTER FUNDS
NOTES TO FINANCIAL STATEMENTS (Continued)
The following information is computed on a tax basis for each item as of September 30, 2011:
FBP Value Fund | FBP Balanced Fund | |||||||
| Cost of portfolio investments and option contracts | $ | 22,060,170 | $ | 36,475,538 | ||||
| Gross unrealized appreciation | $ | 2,892,155 | $ | 5,145,400 | ||||
| Gross unrealized depreciation | (5,050,723 | ) | (5,607,937 | ) | ||||
| Net unrealized depreciation | (2,158,568 | ) | (462,537 | ) | ||||
| Accumulated ordinary income | 3,555 | 33,445 | ||||||
| Capital loss carryforwards | (2,841,311 | ) | (934,747 | ) | ||||
| Other gains | 924,599 | 1,040,869 | ||||||
| Other temporary differences | (2,230 | ) | (23,561 | ) | ||||
| Accumulated deficit | $ | (4,073,955 | ) | $ | (346,531 | ) | ||
The difference between the federal income tax cost of portfolio investments and the financial statement cost for FBP Balanced Fund is due to certain differences in the recognition of capital gains and losses under income tax regulations and GAAP. These “book/tax” differences are temporary in nature and are primarily due to differing methods in the amortization of discounts and premiums on fixed income securities.
As of March 31, 2011, the Funds had the following capital loss carryforwards for federal income tax purposes:
Expires March 31, | FBP Value Fund | FBP Balanced Fund | ||||||
| 2017 | $ | 992,878 | $ | 449,077 | ||||
| 2018 | 1,848,433 | 485,670 | ||||||
| $ | 2,841,311 | $ | 934,747 | |||||
These capital loss carryforwards may be utilized in the current and future years to offset net realized capital gains, if any, prior to distributing such gains to shareholders.
During the six months ended September 30, 2011, FBP Value Fund and FBP Balanced Fund realized $543,794 and $983,426, respectively, of net capital gains resulting from in-kind redemptions (redemptions in which shareholders who redeemed Fund shares received securities held by the Fund rather than cash). The Funds recognize a gain on in-kind redemptions to the extent that the value of the distributed securities on the date of redemption exceeds the cost of those securities. Such gains are not taxable to the Funds and are not required to be distributed to shareholders. The Funds have reclassified these amounts against paid-in capital. These reclassifications are reflected on the Statements of Assets and Liabilities. Such reclassifications, the result of permanent differences between the financial statement and income tax reporting requirements, had no effect on each Fund’s net assets or net asset value per share.
23
THE FLIPPIN, BRUCE & PORTER FUNDS
NOTES TO FINANCIAL STATEMENTS (Continued)
The Funds recognize the tax benefits or expenses of uncertain tax positions only when the position is “more likely than not” to be sustained assuming examination by tax authorities. Management has reviewed the tax positions taken on federal income tax returns for all open tax years (tax years ended March 31, 2008 through March 31, 2011) of each Fund and has concluded that no provision for unrecognized tax benefits or expenses is required in these financial statements.
3. Investment Transactions
During the six months ended September 30, 2011, cost of purchases and proceeds from sales and maturities of investment securities, other than short-term investments and U.S. Government securities, totaled $3,008,347 and $3,868,479, respectively, for FBP Value Fund and $4,521,320 and $4,987,779, respectively, for FBP Balanced Fund.
4. Transactions with Affiliates
INVESTMENT ADVISORY AGREEMENT
The Funds’ investments are managed by Flippin, Bruce & Porter, Inc. (the “Adviser”) under the terms of an Investment Advisory Agreement. Under the Investment Advisory Agreement, each Fund pays the Adviser a fee, which is computed and accrued daily and paid monthly, at an annual rate of .70% of its average daily net assets up to $250 million; .65% of the next $250 million of such assets; and .50% of such assets in excess of $500 million.
During the six months ended September 30, 2011, the Adviser voluntarily waived $19,593 and $5,691 of its investment advisory fees from FBP Value Fund and FBP Balanced Fund, respectively.
Certain officers of the Trust are also officers of the Adviser.
MUTUAL FUND SERVICES AGREEMENT
Under the terms of a Mutual Fund Services Agreement between the Trust and Ultimus Fund Solutions, LLC (“Ultimus”), Ultimus provides administrative, pricing, accounting, dividend disbursing, shareholder servicing and transfer agent services for the Funds. For these services, Ultimus receives a monthly fee from each Fund at an annual rate of .15% of its average daily net assets up to $25 million, .125% of the next $25 million of such assets, and .10% of such assets in excess of $50 million, subject to a minimum monthly fee of $4,000. In addition, each Fund pays out-of-pocket expenses including, but not limited to, postage, supplies and costs of pricing portfolio securities.
Certain officers of the Trust are also officers of Ultimus, or of Ultimus Fund Distributors, LLC (the “Distributor”), the principal underwriter of each Fund’s shares. The Distributor is compensated by the Adviser (not the Funds) for acting as principal underwriter.
COMPLIANCE CONSULTING AGREEMENT
Under the terms of a Compliance Consulting Agreement between the Trust and Ultimus, Ultimus provides an individual to serve as the Trust’s Chief Compliance Officer and to administer the Funds’ compliance policies and procedures. For these services, the Funds pay Ultimus an annual base fee of $16,800 plus an asset-based fee equal to 0.01% per annum on the Funds’ aggregate net assets in excess of $100 million. In addition, the Funds reimburse Ultimus for reasonable out-of-pocket expenses, if any, incurred in connection with these services.
24
THE FLIPPIN, BRUCE & PORTER FUNDS
NOTES TO FINANCIAL STATEMENTS (Continued)
5. Derivatives Transactions
Transactions in option contracts written by the Funds during the six months ended September 30, 2011 were as follows:
FBP Value Fund | FBP Balanced Fund | |||||||||||||||
Option Contracts | Option Premiums | Option Contracts | Option Premiums | |||||||||||||
| Options outstanding at beginning of year | 435 | $ | 90,401 | 720 | $ | 170,165 | ||||||||||
| Options written | 35 | 10,744 | 105 | 35,888 | ||||||||||||
| Options cancelled in a closing purchase transaction | (200 | ) | (33,184 | ) | (300 | ) | (58,219 | ) | ||||||||
| Options expired | (165 | ) | (26,978 | ) | (220 | ) | (36,131 | ) | ||||||||
| Options outstanding at end of year | 105 | $ | 40,983 | 305 | $ | 111,703 | ||||||||||
The location in the Statements of Assets and Liabilities of FBP Value Fund’s derivative positions is as follows:
Type of Derivative | Location | Fair Value | Gross Notional Amount Outstanding September 30, 2011 | |
Asset Derivatives | Liability Derivatives | |||
| Covered call options written | Covered call options, at value | — | $(13,250) | $(563,865) |
The average monthly notional amount of option contracts during the six months ended September 30, 2011 was $1,126,562 for FBP Value Fund.
The location in the Statements of Assets and Liabilities of FBP Balanced Fund’s derivative positions is as follows:
Type of Derivative | Location | Fair Value | Gross Notional Amount Outstanding September 30, 2011 | |
Asset Derivatives | Liability Derivatives | |||
| Covered call options written | Covered call options, at value | — | $(30,690) | $(1,670,180) |
The average monthly notional amount of option contracts during the six months ended September 30, 2011 was $2,696,972 for FBP Balanced Fund.
Transactions in derivative instruments during the six months ended September 30, 2011 by FBP Value Fund are recorded in the following location in the Statements of Operations:
25
THE FLIPPIN, BRUCE & PORTER FUNDS
NOTES TO FINANCIAL STATEMENTS (Continued)
Type of Derivative | Location | Realized Gains (Losses) | Location | Change in Unrealized Gains (Losses) |
| Covered call options written | Net realized gains from option contracts | $56,997 | Net change in unrealized appreciation/depreciation on option contracts | $7,432 |
Transactions in derivative instruments during the six months ended September 30, 2011 by FBP Balanced Fund are recorded in the following location in the Statements of Operations:
Type of Derivative | Location | Realized Gains (Losses) | Location | Change in Unrealized Gains (Losses) |
| Covered call options written | Net realized gains from option contracts | $83,142 | Net change in unrealized appreciation/depreciation on option contracts | $66,648 |
6. Contingencies and Commitments
The Funds indemnify the Trust’s officers and Trustees for certain liabilities that might arise from their performance of their duties to the Funds. Additionally, in the normal course of business the Funds enter into contracts that contain a variety of representations and warranties and which provide general indemnifications. The Funds’ maximum exposure under these arrangements is unknown, as this would involve future claims that may be made against the Funds that have not yet occurred. However, based on experience, the Funds expect the risk of loss to be remote.
7. Subsequent Events
The Funds are required to recognize in the financial statements the effects of all subsequent events that provide additional evidence about conditions that existed as of the date of the Statements of Assets and Liabilities. For non-recognized subsequent events that must be disclosed to keep the financial statements from being misleading, the Funds are required to disclose the nature of the event as well as an estimate of its financial effect, or a statement that such an estimate cannot be made. Management has evaluated subsequent events through the issuance of these financial statements and has noted no such events.
26
THE FLIPPIN, BRUCE & PORTER FUNDS
NOTES TO FINANCIAL STATEMENTS (Continued)
8. Recent Accounting Pronouncement and New Legislation
In May 2011, the Financial Accounting Standards Board issued Accounting Standards Update (“ASU”) No. 2011-04 “Amendments to Achieve Common Fair Value Measurement and Disclosure Requirements in U.S. GAAP and IFRSs.” ASU No. 2011-04 establishes common requirements for measuring fair value and for disclosing information about fair value measurements in accordance with GAAP and International Financial Reporting Standards. ASU No. 2011-04 is effective for interim and annual periods beginning after December 15, 2011 and is applied prospectively. Management is currently evaluating the impact ASU No. 2011-04 may have on financial statement disclosures.
The Regulated Investment Company Modernization Act of 2010 (the “Act”) was enacted on December 22, 2010. The Act makes changes to several tax rules impacting the Funds. In general, the provisions of the Act will be effective for the Funds’ current fiscal year ending March 31, 2012. Although the Act provides several benefits, including unlimited carryover on future capital losses, there may be greater likelihood that all or a portion of the Funds’ pre-enactment capital loss carryovers may expire without being utilized due to the fact that post-enactment capital losses must be utilized before pre-enactment capital loss carryovers. Relevant information regarding the impact of the Act on the Funds, if any, will be included in the Annual Report for the year ended March 31, 2012.
27
THE FLIPPIN, BRUCE & PORTER FUNDS
ABOUT YOUR FUNDS’ EXPENSES (Unaudited)
We believe it is important for you to understand the impact of costs on your investment. All mutual funds have operating expenses. As a shareholder of the Funds, you incur ongoing costs, including management fees and other operating expenses. These ongoing costs, which are deducted from each Fund’s gross income, directly reduce the investment return of the Funds.
A mutual fund’s ongoing costs are expressed as a percentage of its average net assets. This figure is known as the expense ratio. The following examples are intended to help you understand the ongoing costs (in dollars) of investing in the Funds and to compare these costs with the ongoing costs of investing in other mutual funds. The examples below are based on an investment of $1,000 made at the beginning of the period shown and held for the entire period (April 1, 2011 through September 30, 2011).
The table below illustrates each Fund’s ongoing costs in two ways:
Actual fund return – This section helps you to estimate the actual expenses that you paid over the period. The “Ending Account Value” shown is derived from each Fund’s actual return, and the third column shows the dollar amount of operating expenses that would have been paid by an investor who started with $1,000 in the Funds. You may use the information here, together with the amount you invested, to estimate the expenses that you paid over the period.
To do so, simply divide your account value by $1,000 (for example, an $8,600 account value divided by $1,000 = 8.6), then multiply the result by the number given for the Funds under the heading “Expenses Paid During Period.”
Hypothetical 5% return – This section is intended to help you compare the Funds’ ongoing costs with those of other mutual funds. It assumes that each Fund had an annual return of 5% before expenses during the period shown, but that the expense ratio is unchanged. In this case, because the returns used are not the Funds’ actual returns, the results do not apply to your investment. The example is useful in making comparisons because the Securities and Exchange Commission (“SEC”) requires all mutual funds to calculate expenses based on a 5% return. You can assess each Fund’s ongoing costs by comparing this hypothetical example with the hypothetical examples that appear in shareholder reports of other funds.
Note that expenses shown in the table are meant to highlight and help you compare ongoing costs only. The Funds do not charge sales loads or redemption fees, nor do they carry a “sales load.”
The calculations assume no shares were bought or sold during the period. Your actual costs may have been higher or lower, depending on the amount of your investment and the timing of any purchases or redemptions.
More information about the Funds’ expenses, including annual expense ratios for the past five fiscal years, can be found in this report. For additional information on operating expenses and other shareholder costs, please refer to the Funds’ prospectus.
28
THE FLIPPIN, BRUCE & PORTER FUNDS
ABOUT YOUR FUNDS’ EXPENSES (Unaudited)
(Continued)
FBP Value Fund
Beginning Account Value April 1, 2011 | Ending Account Value September 30, 2011 | Expenses Paid During Period* | |
| Based on Actual Fund Return | $1,000.00 | $762.60 | $4.73 |
| Based on Hypothetical 5% Return (before expenses) | $1,000.00 | $1,019.70 | $5.42 |
| * | Expenses are equal to the FBP Value Fund’s annualized expense ratio of 1.07% for the period, multiplied by the average account value over the period, multiplied by 183/365 (to reflect the one-half year period). |
FBP Balanced Fund
Beginning Account Value April 1, 2011 | Ending Account Value September 30, 2011 | Expenses Paid During Period* | |
| Based on Actual Fund Return | $1,000.00 | $832.70 | $4.59 |
| Based on Hypothetical 5% Return (before expenses) | $1,000.00 | $1,020.05 | $5.06 |
| * | Expenses are equal to the FBP Balanced Fund’s annualized expense ratio of 1.00% for the period, multiplied by the average account value over the period, multiplied by 183/365 (to reflect the one-half year period). |
OTHER INFORMATION (Unaudited)
The Trust files a complete listing of portfolio holdings for the Funds with the SEC as of the first and third quarters of each fiscal year on Form N-Q. The filings are available upon request, by calling 1-800-327-9375. Furthermore, you may obtain a copy of these filings on the SEC’s website at http://www.sec.gov. The Trust’s Forms N-Q may also be reviewed and copied at the SEC’s Public Reference Room in Washington, DC, and information on the operation of the Public Reference Room may be obtained by calling 1-800-SEC-0330.
A description of the policies and procedures that the Funds use to determine how to vote proxies relating to portfolio securities is available without charge upon request by calling toll-free 1-800-327-9375, or on the SEC’s website at http://www.sec.gov. Information regarding how the Funds voted proxies relating to portfolio securities during the most recent 12-month period ended June 30 is also available without charge upon request by calling toll-free 1-800-327-9375, or on the SEC’s website at http://www.sec.gov.
29
 | |||||
Investment Adviser Flippin, Bruce & Porter, Inc. 800 Main Street, Second Floor P.O. Box 6138 Lynchburg, Virginia 24505 Toll-Free 1-800-327-9375 www.fbpfunds.com Administrator Ultimus Fund Solutions, LLC P.O. Box 46707 Cincinnati, Ohio 45246-0707 Toll-Free 1-866-738-1127 Custodian US Bank NA 425 Walnut Street Cincinnati, Ohio 45202 Independent Registered Public Accounting Firm Ernst & Young LLP 1900 Scripps Center 312 Walnut Street Cincinnati, Ohio 45202 | Legal Counsel Sullivan & Worcester LLP One Post Office Square Boston, Massachusetts 02109 Officers John T. Bruce, President and Portfolio Manager John M. Flippin, Vice President John H. Hanna, IV, Vice President David J. Marshall, Vice President R. Gregory Porter, III, Vice President Trustees Austin Brockenbrough, III John T. Bruce Charles M. Caravati, Jr. Robert S. Harris J. Finley Lee, Jr. Richard L. Morrill Harris V. Morrissette | ||||
THE GOVERNMENT STREET FUNDS No-Load Mutual Funds Semi-Annual Report September 30, 2011 (Unaudited) |
 |
The Government Street Equity Fund The Government Street Mid-Cap Fund The Alabama Tax Free Bond Fund |
THE GOVERNMENT STREET EQUITY FUND
PORTFOLIO INFORMATION
September 30, 2011 (Unaudited)
Sector Concentration (% of Net Assets) |
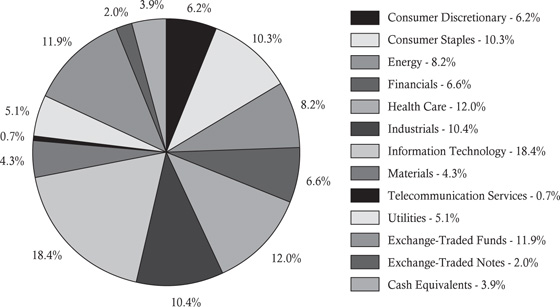
| Top Ten Equity Holdings |
Security Description | % of Net Assets |
| Apple, Inc. | 5.0% |
| Philip Morris International, Inc. | 3.1% |
| Vanguard Mid-Cap ETF | 3.0% |
| ConocoPhillips | 2.8% |
| Vanguard Emerging Markets ETF | 2.6% |
| International Business Machines Corporation | 2.5% |
| Duke Energy Corporation | 2.4% |
| Colonial Properties Trust | 2.3% |
| United Technologies Corporation | 2.1% |
| Cerner Corporation | 1.8% |
2
THE GOVERNMENT STREET MID-CAP FUND
PORTFOLIO INFORMATION
September 30, 2011 (Unaudited)
Sector Concentration (% of Net Assets) |

| Top Ten Equity Holdings |
Security Description | % of Net Assets |
| iShares S&P MidCap 400 Index Fund | 4.2% |
| ProShares Short MidCap 400 ETF | 2.5% |
| Stericycle, Inc. | 1.9% |
| Church & Dwight Company, Inc. | 1.5% |
| Alliance Data Systems Corporation | 1.5% |
| Goodrich Corporation | 1.3% |
| Fastenal Company | 1.3% |
| Rayonier, Inc. | 1.2% |
| ONEOK, Inc. | 1.2% |
| AMETEK, Inc. | 1.2% |
3
THE ALABAMA TAX FREE BOND FUND
PORTFOLIO INFORMATION
September 30, 2011 (Unaudited)
Asset Allocation (% of Net Assets) |

Distribution by Rating | ||
Rating | % of Holdings | |
| AAA | 23.5% | |
| AA | 69.3% | |
| A | 1.9% | |
| Not Rated | 5.3% | |
4
GOVERNMENT STREET EQUITY FUND
SCHEDULE OF INVESTMENTS
September 30, 2011 (Unaudited)
COMMON STOCKS — 82.2% | Shares | Value | ||||||
| Consumer Discretionary — 6.2% | ||||||||
Darden Restaurants, Inc. | 5,000 | $ | 213,750 | |||||
Ford Motor Company (a) | 5,000 | 48,350 | ||||||
Home Depot, Inc. (The) | 17,500 | 575,225 | ||||||
ITT Educational Services, Inc. (a) | 1,600 | 92,128 | ||||||
Johnson Controls, Inc. | 13,600 | 358,632 | ||||||
McDonald's Corporation | 5,500 | 483,010 | ||||||
NIKE, Inc. - Class B | 7,525 | 643,463 | ||||||
Urban Outfitters, Inc. (a) | 6,000 | 133,920 | ||||||
Walt Disney Company (The) | 30,000 | 904,800 | ||||||
| 3,453,278 | ||||||||
| Consumer Staples — 10.3% | ||||||||
Altria Group, Inc. | 33,000 | 884,730 | ||||||
Coca-Cola Company (The) | 6,500 | 439,140 | ||||||
Kraft Foods, Inc. - Class A | 22,836 | 766,833 | ||||||
McCormick & Company, Inc. - Non-Voting Shares | 8,000 | 369,280 | ||||||
Mead Johnson Nutrition Company | 13,000 | 894,790 | ||||||
Philip Morris International, Inc. | 28,000 | 1,746,640 | ||||||
Procter & Gamble Company (The) | 10,000 | 631,800 | ||||||
| 5,733,213 | ||||||||
| Energy — 8.2% | ||||||||
Apache Corporation | 5,089 | 408,341 | ||||||
Chesapeake Energy Corporation | 3,500 | 89,425 | ||||||
Chevron Corporation | 10,000 | 925,200 | ||||||
ConocoPhillips | 24,500 | 1,551,340 | ||||||
Noble Corporation (a) | 12,500 | 366,875 | ||||||
Pioneer Natural Resources Company | 5,000 | 328,850 | ||||||
Plains Exploration & Production Company (a) | 9,000 | 204,390 | ||||||
Schlumberger Ltd. | 4,500 | 268,785 | ||||||
TransCanada Corporation | 11,000 | 445,390 | ||||||
| 4,588,596 | ||||||||
| Financials — 6.6% | ||||||||
Aegon N.V. - ARS (a) | 20,900 | 84,645 | ||||||
Aflac, Inc. | 15,538 | 543,053 | ||||||
American Capital Ltd. (a) | 9,990 | 68,132 | ||||||
Brookfield Asset Management, Inc. - Class A | 19,000 | 523,450 | ||||||
Colonial Properties Trust | 70,000 | 1,271,200 | ||||||
Hartford Financial Services Group, Inc. | 15,000 | 242,100 | ||||||
JPMorgan Chase & Company | 7,000 | 210,840 | ||||||
Plum Creek Timber Company, Inc. | 5,000 | 173,550 | ||||||
U.S. Bancorp | 18,000 | 423,720 | ||||||
Willis Group Holdings plc | 5,000 | 171,850 | ||||||
| 3,712,540 | ||||||||
5
GOVERNMENT STREET EQUITY FUND
SCHEDULE OF INVESTMENTS (Continued)
COMMON STOCKS — 82.2% (Continued) | Shares | Value | ||||||
| Health Care — 12.0% | ||||||||
Abbott Laboratories | 3,000 | $ | 153,420 | |||||
Alexion Pharmaceuticals, Inc. (a) | 11,000 | 704,660 | ||||||
Cardinal Health, Inc. | 5,315 | 222,592 | ||||||
CareFusion Corporation (a) | 6,000 | 143,700 | ||||||
Cerner Corporation (a) | 15,000 | 1,027,800 | ||||||
Computer Programs & Systems, Inc. | 14,100 | 932,715 | ||||||
Elan Corporation plc - ADR (a) | 20,000 | 210,600 | ||||||
Fresenius Medical Care AG & Company KGaA - ADR | 6,000 | 405,180 | ||||||
Questcor Pharmaceuticals, Inc. (a) | 20,000 | 545,200 | ||||||
Shire plc - ADR | 9,000 | 845,370 | ||||||
Techne Corporation | 10,000 | 680,100 | ||||||
Waters Corporation (a) | 11,100 | 837,939 | ||||||
| 6,709,276 | ||||||||
| Industrials — 10.4% | ||||||||
C.H. Robinson Worldwide, Inc. | 3,000 | 205,410 | ||||||
Caterpillar, Inc. | 8,550 | 631,332 | ||||||
Emerson Electric Company | 20,000 | 826,200 | ||||||
General Dynamics Corporation | 15,000 | 853,350 | ||||||
Ingersoll-Rand plc | 13,500 | 379,215 | ||||||
Manitowoc Company, Inc. (The) | 14,000 | 93,940 | ||||||
Norfolk Southern Corporation | 10,000 | 610,200 | ||||||
Quanta Services, Inc. (a) | 20,000 | 375,800 | ||||||
Stericycle, Inc. (a) | 8,000 | 645,760 | ||||||
United Technologies Corporation | 16,500 | 1,160,940 | ||||||
| 5,782,147 | ||||||||
| Information Technology — 18.4% | ||||||||
Accenture plc - Class A | 9,500 | 500,460 | ||||||
Adobe Systems, Inc. (a) | 25,000 | 604,250 | ||||||
ADTRAN, Inc. | 19,000 | 502,740 | ||||||
Apple, Inc. (a) | 7,300 | 2,782,614 | ||||||
Automatic Data Processing, Inc. | 20,000 | 943,000 | ||||||
Broadridge Financial Solutions, Inc. | 5,000 | 100,700 | ||||||
Corning, Inc. | 28,000 | 346,080 | ||||||
eBay, Inc. (a) | 4,000 | 117,960 | ||||||
Google, Inc. - Class A (a) | 1,000 | 514,380 | ||||||
Hewlett-Packard Company | 15,000 | 336,750 | ||||||
International Business Machines Corporation | 8,000 | 1,400,240 | ||||||
MasterCard, Inc. - Class A | 3,000 | 951,480 | ||||||
NetApp, Inc. (a) | 13,000 | 441,220 | ||||||
Oracle Corporation | 10,000 | 287,400 | ||||||
TE Connectivity Ltd. | 7,000 | 196,980 | ||||||
Texas Instruments, Inc. | 10,000 | 266,500 | ||||||
| 10,292,754 | ||||||||
6
GOVERNMENT STREET EQUITY FUND
SCHEDULE OF INVESTMENTS (Continued)
COMMON STOCKS — 82.2% (Continued) | Shares | Value | ||||||
| Materials — 4.3% | ||||||||
Airgas, Inc. | 3,000 | $ | 191,460 | |||||
Albemarle Corporation | 10,500 | 424,200 | ||||||
Dow Chemical Company (The) | 17,000 | 381,820 | ||||||
Freeport-McMoRan Copper & Gold, Inc. | 9,932 | 302,430 | ||||||
Nucor Corporation | 11,000 | 348,040 | ||||||
Praxair, Inc. | 8,000 | 747,840 | ||||||
| 2,395,790 | ||||||||
| Telecommunication Services — 0.7% | ||||||||
Telstra Corporation Ltd. - ADR | 27,000 | 405,000 | ||||||
| Utilities — 5.1% | ||||||||
Duke Energy Corporation | 65,980 | 1,318,940 | ||||||
FirstEnergy Corporation | 14,000 | 628,740 | ||||||
Southern Company (The) | 11,000 | 466,070 | ||||||
Wisconsin Energy Corporation | 14,000 | 438,060 | ||||||
| 2,851,810 | ||||||||
Total Common Stocks (Cost $30,159,852) | $ | 45,924,404 | ||||||
EXCHANGE-TRADED FUNDS — 11.9% | Shares | Value | ||||||
iShares MSCI South Africa Index Fund | 7,000 | $ | 395,780 | |||||
Market Vectors Agribusiness ETF | 15,000 | 648,450 | ||||||
Market Vectors Coal ETF | 21,000 | 637,560 | ||||||
Market Vectors Gold Miners ETF | 11,000 | 607,090 | ||||||
Market Vectors Steel ETF | 10,000 | 432,400 | ||||||
ProShares Credit Suisse 130/30 ETF | 16,000 | 822,560 | ||||||
Vanguard Emerging Markets ETF | 40,000 | 1,435,600 | ||||||
Vanguard Mid-Cap ETF | 25,400 | 1,654,302 | ||||||
Total Exchange-Traded Funds (Cost $5,741,477) | $ | 6,633,742 | ||||||
EXCHANGE-TRADED NOTES — 2.0% | Shares | Value | ||||||
JPMorgan Alerian MLP Index ETN (Cost $1,121,566) | 33,000 | $ | 1,123,650 | |||||
WARRANTS — 0.0% | Shares | Value | ||||||
| American International Group, Inc., 01/19/2021 at $45 (Cost $13,600) | 800 | $ | 4,896 | |||||
7
GOVERNMENT STREET EQUITY FUND
SCHEDULE OF INVESTMENTS (Continued)
COMMERCIAL PAPER — 2.4% | Par Value | Value | ||||||
U.S. Bank, N.A., discount, 0.02% (b), due 10/03/2011 (Cost $1,346,998) | $ | 1,347,000 | $ | 1,346,998 | ||||
MONEY MARKET FUNDS — 0.0% | Shares | Value | ||||||
Invesco STIT - STIC Prime Portfolio (The) - Institutional Class, 0.06% (c) (Cost $765) | 765 | $ | 765 | |||||
Total Investments at Value — 98.5% (Cost $38,384,258) | $ | 55,034,455 | ||||||
Other Assets in Excess of Liabilities — 1.5% | 824,620 | |||||||
Net Assets — 100.0% | $ | 55,859,075 | ||||||
| ADR - American Depositary Receipt. | |
| ARS - American Registered Shares. | |
| (a) | Non-income producing security. |
| (b) | Rate shown is the annualized yield at time of purchase, not a coupon rate. |
| (c) | Variable rate security. The rate shown is the 7-day effective yield as of September 30, 2011. |
| See accompanying notes to financial statements. | |
8
THE GOVERNMENT STREET MID-CAP FUND
SCHEDULE OF INVESTMENTS
September 30, 2011 (Unaudited)
COMMON STOCKS — 86.0% | Shares | Value | ||||||
| Consumer Discretionary — 13.9% | ||||||||
BorgWarner, Inc. (a) | 2,550 | $ | 154,352 | |||||
Buffalo Wild Wings, Inc. (a) | 2,400 | 143,520 | ||||||
Chico's FAS, Inc. | 7,100 | 81,153 | ||||||
Coach, Inc. | 5,550 | 287,657 | ||||||
Darden Restaurants, Inc. | 3,175 | 135,731 | ||||||
DeVry, Inc. | 1,850 | 68,376 | ||||||
Dollar Tree, Inc. (a) | 2,100 | 157,731 | ||||||
DreamWorks Animation SKG, Inc. - Class A (a) | 2,300 | 41,814 | ||||||
Family Dollar Stores, Inc. | 2,800 | 142,408 | ||||||
Gildan Activewear, Inc. - Class A | 7,500 | 193,800 | ||||||
Guess?, Inc. | 7,575 | 215,812 | ||||||
Hasbro, Inc. | 2,525 | 82,340 | ||||||
ITT Educational Services, Inc. (a) | 905 | 52,110 | ||||||
Jarden Corporation | 5,650 | 159,669 | ||||||
John Wiley & Sons, Inc. - Class A | 1,800 | 79,956 | ||||||
Liberty Global, Inc. - Class A (a) | 5,125 | 185,422 | ||||||
Netflix, Inc. (a) | 580 | 65,633 | ||||||
Nordstrom, Inc. | 3,900 | 178,152 | ||||||
O'Reilly Automotive, Inc. (a) | 5,050 | 336,481 | ||||||
Panera Bread Company - Class A (a) | 1,100 | 114,334 | ||||||
PetSmart, Inc. | 3,500 | 149,275 | ||||||
PVH Corporation | 4,100 | 238,784 | ||||||
Ross Stores, Inc. | 3,000 | 236,070 | ||||||
Service Corporation International | 15,200 | 139,232 | ||||||
Tiffany & Company | 3,175 | 193,103 | ||||||
True Religion Apparel, Inc. (a) | 8,250 | 222,420 | ||||||
Urban Outfitters, Inc. (a) | 5,600 | 124,992 | ||||||
Vail Resorts, Inc. | 2,700 | 102,033 | ||||||
VF Corporation | 1,175 | 142,786 | ||||||
| 4,425,146 | ||||||||
| Consumer Staples — 3.9% | ||||||||
Church & Dwight Company, Inc. | 10,800 | 477,360 | ||||||
Hormel Foods Corporation | 12,000 | 324,240 | ||||||
J.M. Smucker Company (The) | 4,700 | 342,583 | ||||||
Mead Johnson Nutrition Company | 1,000 | 68,830 | ||||||
Tyson Foods, Inc. - Class A | 2,000 | 34,720 | ||||||
| 1,247,733 | ||||||||
| Energy — 5.4% | ||||||||
Cameron International Corporation (a) | 6,610 | 274,579 | ||||||
Cimarex Energy Company | 2,750 | 153,175 | ||||||
Murphy Oil Corporation | 3,740 | 165,158 | ||||||
Newfield Exploration Company (a) | 2,800 | 111,132 | ||||||
9
THE GOVERNMENT STREET MID-CAP FUND
SCHEDULE OF INVESTMENTS (Continued)
COMMON STOCKS — 86.0% (Continued) | Shares | Value | ||||||
| Energy — 5.4% (Continued) | ||||||||
Noble Corporation (a) | 5,360 | $ | 157,316 | |||||
Overseas Shipholding Group, Inc. | 3,600 | 49,464 | ||||||
Peabody Energy Corporation | 4,800 | 162,624 | ||||||
Pioneer Natural Resources Company | 2,680 | 176,264 | ||||||
Range Resources Corporation | 3,500 | 204,610 | ||||||
Schlumberger Ltd. | 3,134 | 187,194 | ||||||
Valero Energy Corporation | 4,950 | 88,011 | ||||||
| 1,729,527 | ||||||||
| Financials — 13.4% | ||||||||
Alleghany Corporation (a) | 765 | 220,702 | ||||||
American Financial Group, Inc. | 8,400 | 260,988 | ||||||
Annaly Capital Management, Inc. | 8,500 | 141,355 | ||||||
Arch Capital Group Ltd. (a) | 7,950 | 259,766 | ||||||
Arthur J. Gallagher & Company | 6,750 | 177,525 | ||||||
Axis Capital Holdings Ltd. | 5,000 | 129,700 | ||||||
Bank of Hawaii Corporation | 6,000 | 218,400 | ||||||
Berkley (W.R.) Corporation | 10,050 | 298,385 | ||||||
Cullen/Frost Bankers, Inc. | 5,600 | 256,816 | ||||||
Eaton Vance Corporation | 10,250 | 228,268 | ||||||
Hudson City Bancorp, Inc. | 13,000 | 73,580 | ||||||
IntercontinentalExchange, Inc. (a) | 1,850 | 218,781 | ||||||
Jones Lang LaSalle, Inc. | 2,800 | 145,068 | ||||||
Kemper Corporation | 6,200 | 148,552 | ||||||
Legg Mason, Inc. | 3,780 | 97,184 | ||||||
Liberty Property Trust | 4,600 | 133,906 | ||||||
New York Community Bancorp, Inc. | 10,270 | 122,213 | ||||||
Old Republic International Corporation | 16,400 | 146,288 | ||||||
Potlatch Corporation | 6,941 | 218,780 | ||||||
Rayonier, Inc. | 10,500 | 386,295 | ||||||
SEI Investments Company | 10,000 | 153,800 | ||||||
St. Joe Company (The) (a) | 7,000 | 104,930 | ||||||
Westamerica Bancorporation | 3,300 | 126,456 | ||||||
| 4,267,738 | ||||||||
| Health Care — 10.8% | ||||||||
Alexion Pharmaceuticals, Inc. (a) | 2,600 | 166,556 | ||||||
Almost Family, Inc. (a) | 1,000 | 16,630 | ||||||
Bio-Rad Laboratories, Inc. - Class A (a) | 2,500 | 226,925 | ||||||
C.R. Bard, Inc. | 1,000 | 87,540 | ||||||
Cantel Medical Corporation | 2,000 | 42,240 | ||||||
Cephalon, Inc. (a) | 2,000 | 161,400 | ||||||
Cerner Corporation (a) | 5,300 | 363,156 | ||||||
Charles River Laboratories International, Inc. (a) | 3,000 | 85,860 | ||||||
Computer Programs & Systems, Inc. | 1,800 | 119,070 | ||||||
10
THE GOVERNMENT STREET MID-CAP FUND
SCHEDULE OF INVESTMENTS (Continued)
COMMON STOCKS — 86.0% (Continued) | Shares | Value | ||||||
| Health Care — 10.8% (Continued) | ||||||||
Covance, Inc. (a) | 4,000 | $ | 181,800 | |||||
Covidien plc | 1,500 | 66,150 | ||||||
Edwards Lifesciences Corporation (a) | 2,000 | 142,560 | ||||||
Ensign Group, Inc. (The) | 3,000 | 69,330 | ||||||
Fresenius Medical Care AG & Company KGaA - ADR | 3,000 | 202,590 | ||||||
Gilead Sciences, Inc. (a) | 150 | 5,820 | ||||||
Hanger Orthopedic Group, Inc. (a) | 4,000 | 75,560 | ||||||
HealthSpring, Inc. (a) | 2,500 | 91,150 | ||||||
Henry Schein, Inc. (a) | 2,000 | 124,020 | ||||||
Illumina, Inc. (a) | 1,000 | 40,920 | ||||||
Intuitive Surgical, Inc. (a) | 200 | 72,856 | ||||||
Life Technologies Corporation (a) | 2,891 | 111,101 | ||||||
Myriad Genetics, Inc. (a) | 1,000 | 18,740 | ||||||
PSS World Medical, Inc. (a) | 2,000 | 39,380 | ||||||
ResMed, Inc. (a) | 6,000 | 172,740 | ||||||
Shire plc - ADR | 1,500 | 140,895 | ||||||
Techne Corporation | 4,500 | 306,045 | ||||||
Teleflex, Inc. | 3,000 | 161,310 | ||||||
Waters Corporation (a) | 2,000 | 150,980 | ||||||
| 3,443,324 | ||||||||
| Industrials — 15.3% | ||||||||
Alexander & Baldwin, Inc. | 3,000 | 109,590 | ||||||
AMETEK, Inc. | 11,250 | 370,912 | ||||||
C.H. Robinson Worldwide, Inc. | 5,000 | 342,350 | ||||||
Deluxe Corporation | 5,000 | 93,000 | ||||||
Donaldson Company, Inc. | 6,000 | 328,800 | ||||||
Expeditors International of Washington, Inc. | 6,000 | 243,300 | ||||||
Fastenal Company | 12,000 | 399,360 | ||||||
Goodrich Corporation | 3,500 | 422,380 | ||||||
Graco, Inc. | 6,000 | 204,840 | ||||||
Jacobs Engineering Group, Inc. (a) | 4,475 | 144,498 | ||||||
Joy Global, Inc. | 2,000 | 124,760 | ||||||
L-3 Communications Holdings, Inc. | 3,000 | 185,910 | ||||||
Manpower, Inc. | 4,000 | 134,480 | ||||||
MSC Industrial Direct Company, Inc. - Class A | 5,000 | 282,300 | ||||||
Oshkosh Corporation (a) | 5,000 | 78,700 | ||||||
Snap-on, Inc. | 4,275 | 189,810 | ||||||
SPX Corporation | 5,000 | 226,550 | ||||||
Stericycle, Inc. (a) | 7,500 | 605,400 | ||||||
Timken Company | 4,000 | 131,280 | ||||||
Waste Connections, Inc. | 6,000 | 202,920 | ||||||
WESCO International, Inc. (a) | 1,850 | 62,068 | ||||||
| 4,883,208 | ||||||||
11
THE GOVERNMENT STREET MID-CAP FUND
SCHEDULE OF INVESTMENTS (Continued)
COMMON STOCKS — 86.0% (Continued) | Shares | Value | ||||||
| Information Technology — 12.7% | ||||||||
ADTRAN, Inc. | 6,000 | $ | 158,760 | |||||
Advent Software, Inc. (a) | 8,000 | 166,800 | ||||||
Alliance Data Systems Corporation (a) | 5,000 | 463,500 | ||||||
Arrow Electronics, Inc. (a) | 8,600 | 238,908 | ||||||
Cognizant Technology Solutions Corporation - Class A (a) | 3,000 | 188,100 | ||||||
Cree, Inc. (a) | 4,820 | 125,224 | ||||||
DST Systems, Inc. | 4,000 | 175,320 | ||||||
Harris Corporation | 6,000 | 205,020 | ||||||
IAC/InterActiveCorporation (a) | 3,000 | 118,650 | ||||||
Integrated Device Technology, Inc. (a) | 10,000 | 51,500 | ||||||
Jack Henry & Associates, Inc. | 9,000 | 260,820 | ||||||
Lam Research Corporation (a) | 6,000 | 227,880 | ||||||
Linear Technology Corporation | 6,000 | 165,900 | ||||||
Microchip Technology, Inc. | 5,000 | 155,550 | ||||||
National Instruments Corporation | 12,000 | 274,320 | ||||||
NetApp, Inc. (a) | 5,000 | 169,700 | ||||||
Plantronics, Inc. | 900 | 25,605 | ||||||
Polycom, Inc. (a) | 8,000 | 146,960 | ||||||
Rovi Corporation (a) | 6,000 | 257,880 | ||||||
SanDisk Corporation (a) | 5,000 | 201,750 | ||||||
Xilinx, Inc. | 7,000 | 192,080 | ||||||
Zebra Technologies Corporation - Class A (a) | 3,000 | 92,820 | ||||||
| 4,063,047 | ||||||||
| Materials — 5.4% | ||||||||
Airgas, Inc. | 4,000 | 255,280 | ||||||
Albemarle Corporation | 8,000 | 323,200 | ||||||
Ashland, Inc. | 3,000 | 132,420 | ||||||
Cabot Corporation | 4,000 | 99,120 | ||||||
Martin Marietta Materials, Inc. | 2,500 | 158,050 | ||||||
Packaging Corporation of America | 5,000 | 116,500 | ||||||
Scotts Miracle-Gro Company (The) - Class A | 4,000 | 178,400 | ||||||
Sonoco Products Company | 5,000 | 141,150 | ||||||
Steel Dynamics, Inc. | 12,000 | 119,040 | ||||||
Valspar Corporation (The) | 7,000 | 218,470 | ||||||
| 1,741,630 | ||||||||
| Telecommunication Services — 0.1% | ||||||||
Telephone and Data Systems, Inc. | 1,000 | 21,250 | ||||||
| Utilities — 5.1% | ||||||||
AGL Resources, Inc. | 8,400 | 342,216 | ||||||
Great Plains Energy, Inc. | 9,050 | 174,665 | ||||||
ONEOK, Inc. | 5,750 | 379,730 | ||||||
Pepco Holdings, Inc. | 7,900 | 149,468 | ||||||
12
THE GOVERNMENT STREET MID-CAP FUND
SCHEDULE OF INVESTMENTS (Continued)
COMMON STOCKS — 86.0% (Continued) | Shares | Value | ||||||
| Utilities — 5.1% (Continued) | ||||||||
SCANA Corporation | 7,530 | $ | 304,589 | |||||
Vectren Corporation | 10,600 | 287,048 | ||||||
| 1,637,716 | ||||||||
Total Common Stocks (Cost $21,575,945) | $ | 27,460,319 | ||||||
EXCHANGE-TRADED FUNDS — 8.0% | Shares | Value | ||||||
First Trust NYSE Arca Biotechnology Index Fund (a) | 8,000 | $ | 264,480 | |||||
iShares Nasdaq Biotechnology Index Fund | 2,000 | 186,700 | ||||||
iShares S&P MidCap 400 Index Fund | 17,000 | 1,325,830 | ||||||
ProShares Short MidCap 400 ETF (a) | 22,000 | 790,460 | ||||||
Total Exchange-Traded Funds (Cost $2,283,487) | $ | 2,567,470 | ||||||
EXCHANGE-TRADED NOTES — 0.9% | Shares | Value | ||||||
JPMorgan Alerian MLP Index ETN (Cost $252,899) | 8,000 | $ | 272,400 | |||||
COMMERCIAL PAPER — 4.6% | Par Value | Value | ||||||
U.S. Bank, N.A., discount, 0.02% (b), due 10/03/2011 (Cost $1,466,998) | $ | 1,467,000 | $ | 1,466,998 | ||||
MONEY MARKET FUNDS — 0.0% | Shares | Value | ||||||
Invesco STIT - STIC Prime Portfolio (The) - Institutional Class, 0.06% (c) (Cost $612) | 612 | $ | 612 | |||||
Total Investments at Value — 99.5% (Cost $25,579,941) | $ | 31,767,799 | ||||||
Other Assets in Excess of Liabilities — 0.5% | 164,259 | |||||||
Net Assets — 100.0% | $ | 31,932,058 | ||||||
| ADR - American Depositary Receipt. | |
| (a) | Non-income producing security. |
| (b) | Rate shown is the annualized yield at time of purchase, not a coupon rate. |
| (c) | Variable rate security. The rate shown is the 7-day effective yield as of September 30, 2011. |
| See accompanying notes to financial statements. | |
13
THE ALABAMA TAX FREE BOND FUND
SCHEDULE OF INVESTMENTS
September 30, 2011 (Unaudited)
ALABAMA FIXED RATE REVENUE AND GENERAL OBLIGATION (GO) BONDS — 93.8% | Par Value | Value | ||||||
| Alabama Drinking Water Financing Auth., Rev., | ||||||||
4.00%, due 08/15/2014 | $ | 250,000 | $ | 263,342 | ||||
5.00%, due 08/15/2018 | 400,000 | 434,728 | ||||||
| Alabama Special Care Facilities Financing Auth., Birmingham, Rev., | ||||||||
5.375%, due 11/01/2012, ETM | 400,000 | 401,636 | ||||||
| Alabama State Federal Highway Financing Auth., Rev., | ||||||||
5.00%, due 03/01/2016 | 300,000 | 306,000 | ||||||
| Alabama State Public School & College Auth., Capital Improvements, Rev., | ||||||||
5.00%, due 12/01/2011 | 350,000 | 352,835 | ||||||
5.00%, due 12/01/2017 | 300,000 | 359,337 | ||||||
| Alabama State Public School & College Auth., Capital Improvements, Series A, Rev., | ||||||||
4.00%, due 02/17/2017 | 250,000 | 281,905 | ||||||
| Alabama State, GO, | ||||||||
5.00%, due 09/01/2015 | 300,000 | 301,095 | ||||||
5.00%, due 02/01/2016 | 575,000 | 648,008 | ||||||
| 5.00%, due 09/01/2016 | 300,000 | 301,080 | ||||||
5.00%, due 09/01/2017 | 300,000 | 317,856 | ||||||
| Alabama Water Pollution Control Auth., Rev., | ||||||||
5.375%, due 08/15/2014 | 225,000 | 227,781 | ||||||
| Anniston, AL, Waterworks & Sewer Board, Water & Sewer, Rev., | ||||||||
3.50%, due 06/01/2016 | 500,000 | 540,650 | ||||||
| Athens, AL, Warrants, | ||||||||
4.00%, due 09/01/2018 | 300,000 | 341,205 | ||||||
| Auburn, AL, GO, Warrants, | ||||||||
5.00%, due 08/01/2012 | 225,000 | 233,800 | ||||||
| Auburn, AL, School, Series A, GO, Warrants, | ||||||||
5.00%, due 08/01/2018 | 500,000 | 597,430 | ||||||
| Auburn University, AL, General Fee Rev., | ||||||||
5.25%, due 06/01/2015 | 400,000 | 411,780 | ||||||
| Baldwin Co., AL, GO, Warrants, | ||||||||
5.00%, due 02/01/2015 | 200,000 | 219,390 | ||||||
| Baldwin Co., AL, Series A, GO, Warrants, | ||||||||
5.00%, due 02/01/2017 | 320,000 | 378,086 | ||||||
| Calhoun Co., AL, Gas Tax Anticipation, Series A, Rev., Warrants, | ||||||||
4.00%, due 03/01/2016 | 445,000 | 489,269 | ||||||
14
THE ALABAMA TAX FREE BOND FUND
SCHEDULE OF INVESTMENTS (Continued)
ALABAMA FIXED RATE REVENUE AND GENERAL OBLIGATION (GO) BONDS — 93.8% (Continued) | Par Value | Value | ||||||
| Chelsea, AL, GO, | ||||||||
4.00%, due 05/01/2015 | $ | 260,000 | $ | 284,105 | ||||
| Enterprise, AL, GO, School Warrants, | ||||||||
4.00%, due 02/01/2016 | 400,000 | 446,244 | ||||||
| Florence, AL, Electric Rev., Warrants, | ||||||||
3.10%, due 06/01/2015 | 300,000 | 316,707 | ||||||
3.50%, due 06/01/2017 | 515,000 | 555,170 | ||||||
| Foley, AL, GO, Warrants, | ||||||||
4.00%, due 01/01/2015 | 315,000 | 345,379 | ||||||
| Foley, AL, Utilities Board, Utilities Rev., | ||||||||
4.00%, due 11/01/2018 | 710,000 | 808,051 | ||||||
4.50%, due 11/01/2019 | 250,000 | 269,615 | ||||||
| Homewood, AL, GO, Warrants, | ||||||||
5.00%, due 09/01/2015 | 250,000 | 288,340 | ||||||
| Hoover, AL, Special Tax Rev., Warrants, | ||||||||
| 5.00%, due 02/15/2015, | ||||||||
Prerefunded 02/15/2012 @ 100 | 370,000 | 376,638 | ||||||
| Houston Co., AL, Board of Education, GO, Capital Outlay Warrants, | ||||||||
4.00%, due 12/01/2013 | 545,000 | 581,346 | ||||||
| Houston Co., AL, GO, | ||||||||
4.75%, due 10/15/2016 | 500,000 | 544,890 | ||||||
| Huntsville, AL, Capital Improvements, Series C, GO, Warrants, | ||||||||
5.00%, due 11/01/2017 | 300,000 | 324,471 | ||||||
| Huntsville, AL, Electric Systems, Rev., | ||||||||
4.00%, due 12/01/2013 | 300,000 | 322,221 | ||||||
| Huntsville, AL, GO, | ||||||||
4.00%, due 09/01/2018 | 500,000 | 573,010 | ||||||
| 5.125%, due 05/01/2020, | ||||||||
| Prerefunded 05/01/2012 @ 102 | 300,000 | 314,589 | ||||||
| Huntsville, AL, GO, Refunding and Capital Improvement Warrants, | ||||||||
4.00%, due 09/01/2016 | 500,000 | 565,810 | ||||||
| Macon Co., AL, GO, Warrants, | ||||||||
| 4.25%, due 10/01/2027, | ||||||||
Prerefunded 10/01/2017 @ 100 | 200,000 | 236,078 | ||||||
| Mobile, AL, GO, | ||||||||
4.50%, due 08/01/2013 | 100,000 | 107,263 | ||||||
15
THE ALABAMA TAX FREE BOND FUND
SCHEDULE OF INVESTMENTS (Continued)
ALABAMA FIXED RATE REVENUE AND GENERAL OBLIGATION (GO) BONDS — 93.8% (Continued) | Par Value | Value | ||||||
| Mobile, AL, Water & Sewer, Rev., | ||||||||
5.25%, due 01/01/2012 | $ | 205,000 | $ | 207,450 | ||||
| 5.25%, due 01/01/2014, | ||||||||
Prerefunded 01/01/2012 @ 100 | 300,000 | 303,825 | ||||||
| 5.25%, due 01/01/2020, | ||||||||
Prerefunded 01/01/2012 @ 100 | 400,000 | 405,100 | ||||||
| Mobile Co., AL, GO, | ||||||||
5.25%, due 08/01/2015 | 400,000 | 447,532 | ||||||
| Montgomery, AL, GO, | ||||||||
3.00%, due 11/01/2014 | 500,000 | 533,590 | ||||||
| Montgomery, AL, Waterworks & Sanitation, Rev., | ||||||||
5.00%, due 09/01/2017 | 250,000 | 296,315 | ||||||
| Opelika, AL, Utilities Board, Series B, Rev., | ||||||||
3.00%, due 06/01/2016 | 475,000 | 503,082 | ||||||
| 3.00%, due 06/01/2018 | 215,000 | 224,008 | ||||||
| Oxford, AL, Waterworks & Sewer Board, Rev., | ||||||||
3.00%, due 12/01/2011 | 415,000 | 416,452 | ||||||
| Prattville, AL, Waterworks Board, Rev., | ||||||||
3.00%, due 08/01/2017 | 290,000 | 308,264 | ||||||
| Sheffield, AL, Electric Rev., | ||||||||
4.00%, due 07/01/2017 | 600,000 | 663,342 | ||||||
| Smiths, AL, Water & Sewer Auth., Rev., | ||||||||
4.00%, due 06/01/2013 | 200,000 | 209,050 | ||||||
| St. Clair Co., AL, GO, | ||||||||
4.00%, due 08/01/2013 | 145,000 | 153,340 | ||||||
4.00%, due 08/01/2014 | 205,000 | 222,579 | ||||||
| Sumter Co., AL, School Rev., Warrants, | ||||||||
| 4.50%, due 02/01/2031, | ||||||||
Prerefunded 02/01/2016 @ 100 | 500,000 | 578,705 | ||||||
| Tuscaloosa, AL, Public Building Auth., Student Housing Rev., | ||||||||
4.00%, due 07/01/2013 | 350,000 | 367,944 | ||||||
| University of Alabama, AL, Birmingham, Series A, Hospital Rev., | ||||||||
5.00%, due 09/01/2012 | 180,000 | 186,041 | ||||||
| University of Alabama, AL, General Fee Rev., | ||||||||
4.10%, due 12/01/2013 | 240,000 | 246,120 | ||||||
| University of Alabama, AL, Rev., | ||||||||
4.00%, due 10/01/2014 | 500,000 | 546,675 | ||||||
| University of Alabama, AL, Series A, Rev., | ||||||||
3.00%, due 07/01/2016 | 340,000 | 367,696 | ||||||
| 5.00%, due 07/01/2017 | 245,000 | 290,602 | ||||||
16
THE ALABAMA TAX FREE BOND FUND
SCHEDULE OF INVESTMENTS (Continued)
ALABAMA FIXED RATE REVENUE AND GENERAL OBLIGATION (GO) BONDS — 93.8% (Continued) | Par Value | Value | ||||||
| Vestavia Hills, AL, Series A, GO, Warrants, | ||||||||
5.00%, due 02/01/2012 | $ | 565,000 | $ | 573,989 | ||||
3.00%, due 02/01/2018 | 240,000 | 256,323 | ||||||
| Wetumpka, AL, Waterworks & Sewer, Rev., | ||||||||
4.00%, due 03/01/2018 | 320,000 | 355,808 | ||||||
Total Alabama Fixed Rate Revenue and General Obligation (GO) Bonds (Cost $22,367,574) | $ | 23,330,972 | ||||||
MONEY MARKET FUNDS — 5.4% | Shares | Value | ||||||
Alpine Municipal Money Market Fund - Class I, 0.10% (a) (Cost $1,338,093) | 1,338,093 | $ | 1,338,093 | |||||
Total Investments at Value — 99.2% (Cost $23,705,667) | $ | 24,669,065 | ||||||
Other Assets in Excess of Liabilities — 0.8% | 205,632 | |||||||
Net Assets — 100.0% | $ | 24,874,697 | ||||||
| ETM - Escrowed to Maturity. | |
| (a) | Variable rate security. The rate shown is the 7-day effective yield as of September 30, 2011. |
| See accompanying notes to financial statements. | |
17
THE GOVERNMENT STREET FUNDS
STATEMENTS OF ASSETS AND LIABILITIES
September 30, 2011 (Unaudited)
Government Street Equity Fund | Government Street Mid-Cap Fund | Alabama Tax Free Bond Fund | ||||||||||
| ASSETS | ||||||||||||
| Investments in securities: | ||||||||||||
At acquisition cost | $ | 38,384,258 | $ | 25,579,941 | $ | 23,705,667 | ||||||
At value (Note 2) | $ | 55,034,455 | $ | 31,767,799 | $ | 24,669,065 | ||||||
Cash | 1,620 | 4,968 | — | |||||||||
Dividends and interest receivable | 101,910 | 28,562 | 216,430 | |||||||||
Receivable for investment securities sold | 781,816 | — | — | |||||||||
Receivable for capital shares sold | 301,259 | 150,100 | 46 | |||||||||
Other assets | 14,425 | 11,506 | 9,456 | |||||||||
TOTAL ASSETS | 56,235,485 | 31,962,935 | 24,894,997 | |||||||||
| LIABILITIES | ||||||||||||
Distributions payable | 7,487 | — | 3,459 | |||||||||
Payable for investment securities purchased | 316,554 | — | — | |||||||||
Payable for capital shares redeemed | 9,642 | — | 4,854 | |||||||||
Accrued investment advisory fees (Note 4) | 28,657 | 20,459 | 2,982 | |||||||||
Payable to adminstrator (Note 4) | 6,900 | 4,575 | 4,050 | |||||||||
Other accrued expenses | 7,170 | 5,843 | 4,955 | |||||||||
TOTAL LIABILITIES | 376,410 | 30,877 | 20,300 | |||||||||
NET ASSETS | $ | 55,859,075 | $ | 31,932,058 | $ | 24,874,697 | ||||||
| Net assets consist of: | ||||||||||||
Paid-in capital | $ | 38,846,247 | $ | 25,720,779 | $ | 23,963,875 | ||||||
Accumulated net investment income | 1,338 | 53,757 | — | |||||||||
Accumulated net realized gains (losses) from security transactions | 361,293 | (30,336 | ) | (52,576 | ) | |||||||
Net unrealized appreciation on investments | 16,650,197 | 6,187,858 | 963,398 | |||||||||
Net assets | $ | 55,859,075 | $ | 31,932,058 | $ | 24,874,697 | ||||||
| Shares of beneficial interest outstanding (unlimited number of shares authorized, $0.01 par value) | 1,350,391 | 2,403,547 | 2,337,596 | |||||||||
Net asset value, offering price and redemption price per share (Note 2) | $ | 41.37 | $ | 13.29 | $ | 10.64 | ||||||
| See accompanying notes to financial statements. |
18
THE GOVERNMENT STREET FUNDS
STATEMENTS OF OPERATIONS
Six Months Ended September 30, 2011 (Unaudited)
Government Street Equity Fund | Government Street Mid-Cap Fund | Alabama Tax Free Bond Fund | ||||||||||
| INVESTMENT INCOME | ||||||||||||
Dividends | $ | 564,785 | $ | 263,446 | $ | 682 | ||||||
Foreign withholding taxes on dividends | (6,903 | ) | (1,352 | ) | — | |||||||
Interest | 260 | 145 | 388,968 | |||||||||
TOTAL INVESTMENT INCOME | 558,142 | 262,239 | 389,650 | |||||||||
| EXPENSES | ||||||||||||
Investment advisory fees (Note 4) | 192,287 | 143,314 | 46,426 | |||||||||
Administration fees (Note 4) | 41,438 | 27,125 | 21,000 | |||||||||
Professional fees | 9,760 | 8,305 | 7,568 | |||||||||
Trustees’ fees and expenses | 5,418 | 5,418 | 5,418 | |||||||||
Compliance fees and expenses (Note 4) | 4,094 | 3,811 | 3,659 | |||||||||
Custodian and bank service fees | 4,763 | 3,151 | 2,372 | |||||||||
Registration fees | 3,846 | 3,124 | 1,979 | |||||||||
Pricing costs | 1,162 | 1,991 | 5,546 | |||||||||
Printing of shareholder reports | 4,020 | 2,348 | 2,032 | |||||||||
Account maintenance fees | 3,167 | 3,015 | 833 | |||||||||
Insurance expense | 2,649 | 1,760 | 1,285 | |||||||||
Postage and supplies | 1,439 | 1,088 | 1,086 | |||||||||
Other expenses | 4,884 | 4,032 | 2,695 | |||||||||
TOTAL EXPENSES | 278,927 | 208,482 | 101,899 | |||||||||
| Fees voluntarily waived by the Adviser (Note 4) | — | — | (15,680 | ) | ||||||||
NET EXPENSES | 278,927 | 208,482 | 86,219 | |||||||||
NET INVESTMENT INCOME | 279,215 | 53,757 | 303,431 | |||||||||
| REALIZED AND UNREALIZED GAINS (LOSSES) ON INVESTMENTS | ||||||||||||
Net realized gains from security transactions | 329,464 | 408,778 | 1,407 | |||||||||
Net realized gains from in-kind redemptions (Note 2) | 1,627,995 | 1,500,775 | — | |||||||||
| Net change in unrealized appreciation (depreciation) on investments | (11,016,526 | ) | (8,509,441 | ) | 483,092 | |||||||
NET REALIZED AND UNREALIZED GAINS (LOSSES) ON INVESTMENTS | (9,059,067 | ) | (6,599,888 | ) | 484,499 | |||||||
NET INCREASE (DECREASE) IN NET ASSETS FROM OPERATIONS | $ | (8,779,852 | ) | $ | (6,546,131 | ) | $ | 787,930 | ||||
| See accompanying notes to financial statements. |
19
THE GOVERNMENT STREET FUNDS
STATEMENTS OF CHANGES IN NET ASSETS
Government Street Equity Fund | Government Street Mid-Cap Fund | |||||||||||||||
Six Months Ended September 30, 2011 (Unaudited) | Year Ended March 31, 2011 | Six Months Ended September 30, 2011 (Unaudited) | Year Ended March 31, 2011 | |||||||||||||
| FROM OPERATIONS | ||||||||||||||||
Net investment income | $ | 279,215 | $ | 541,729 | $ | 53,757 | $ | 69,816 | ||||||||
| Net realized gains from: | ||||||||||||||||
Security transactions | 329,464 | 171,715 | 408,778 | 190,129 | ||||||||||||
Option contracts | — | 82 | — | — | ||||||||||||
| Net realized gains from in-kind redemptions (Note 2) | 1,627,995 | 917,000 | 1,500,775 | 146,992 | ||||||||||||
Net change in unrealized appreciation (depreciation) on: | ||||||||||||||||
Investments | (11,016,526 | ) | 9,016,833 | (8,509,441 | ) | 7,240,335 | ||||||||||
Option contracts | — | 9,402 | — | — | ||||||||||||
Net increase (decrease) in net assets from operations | (8,779,852 | ) | 10,656,761 | (6,546,131 | ) | 7,647,272 | ||||||||||
| DISTRIBUTIONS TO SHAREHOLDERS | ||||||||||||||||
From net investment income | (284,261 | ) | (536,110 | ) | — | (82,215 | ) | |||||||||
From realized capital gains on security transactions | — | (114,767 | ) | — | — | |||||||||||
In excess of net investment income | — | — | — | (17,375 | ) | |||||||||||
Decrease in net assets from distributions to shareholders | (284,261 | ) | (650,877 | ) | — | (99,590 | ) | |||||||||
| FROM CAPITAL SHARE TRANSACTIONS | ||||||||||||||||
Proceeds from shares sold | 1,448,802 | 2,186,479 | 1,174,085 | 1,485,972 | ||||||||||||
| Net asset value of shares issued in reinvestment of distributions to shareholders | 269,011 | 623,340 | — | 92,758 | ||||||||||||
Payments for shares redeemed | (3,167,196 | ) | (4,209,460 | ) | (2,679,284 | ) | (1,340,996 | ) | ||||||||
| Net increase (decrease) in net assets from capital share transactions | (1,449,383 | ) | (1,399,641 | ) | (1,505,199 | ) | 237,734 | |||||||||
TOTAL INCREASE (DECREASE) IN NET ASSETS | (10,513,496 | ) | 8,606,243 | (8,051,330 | ) | 7,785,416 | ||||||||||
| NET ASSETS | ||||||||||||||||
Beginning of period | 66,372,571 | 57,766,328 | 39,983,388 | 32,197,972 | ||||||||||||
End of period | $ | 55,859,075 | $ | 66,372,571 | $ | 31,932,058 | $ | 39,983,388 | ||||||||
ACCUMULATED NET INVESTMENT INCOME | $ | 1,338 | $ | 6,384 | $ | 53,757 | $ | — | ||||||||
| CAPITAL SHARE ACTIVITY | ||||||||||||||||
Shares sold | 32,072 | 52,290 | 78,006 | 105,919 | ||||||||||||
Shares reinvested | 6,042 | 14,753 | — | 6,310 | ||||||||||||
Shares redeemed | (70,353 | ) | (97,293 | ) | (190,457 | ) | (98,065 | ) | ||||||||
Net increase (decrease) in shares outstanding | (32,239 | ) | (30,250 | ) | (112,451 | ) | 14,164 | |||||||||
Shares outstanding, beginning of period | 1,382,630 | 1,412,880 | 2,515,998 | 2,501,834 | ||||||||||||
Shares outstanding, end of period | 1,350,391 | 1,382,630 | 2,403,547 | 2,515,998 | ||||||||||||
| See accompanying notes to financial statements. |
20
THE GOVERNMENT STREET FUNDS
STATEMENTS OF CHANGES IN NET ASSETS
Alabama Tax Free Bond Fund | ||||||||
Six Months Ended September 30, 2011 (Unaudited) | Year Ended March 31, 2011 | |||||||
| FROM OPERATIONS | ||||||||
Net investment income | $ | 303,431 | $ | 718,135 | ||||
| Net realized gains (losses) from security transactions | 1,407 | (28,038 | ) | |||||
| Net change in unrealized appreciation (depreciation) on investments | 483,092 | (166,272 | ) | |||||
Net increase in net assets from operations | 787,930 | 523,825 | ||||||
| DISTRIBUTIONS TO SHAREHOLDERS | ||||||||
From net investment income | (304,735 | ) | (724,106 | ) | ||||
| From realized capital gains on security transactions | — | (1,181 | ) | |||||
| Decrease in net assets from distributions to shareholders | (304,735 | ) | (725,287 | ) | ||||
| FROM CAPITAL SHARE TRANSACTIONS | ||||||||
Proceeds from shares sold | 544,870 | 4,182,345 | ||||||
Net asset value of shares issued in reinvestment of distributions to shareholders | 252,899 | 550,393 | ||||||
Payments for shares redeemed | (3,432,756 | ) | (7,221,053 | ) | ||||
| Net decrease in net assets from capital share transactions | (2,634,987 | ) | (2,488,315 | ) | ||||
TOTAL DECREASE IN NET ASSETS | (2,151,792 | ) | (2,689,777 | ) | ||||
| NET ASSETS | ||||||||
Beginning of period | 27,026,489 | 29,716,266 | ||||||
End of period | $ | 24,874,697 | $ | 27,026,489 | ||||
| ACCUMULATED NET INVESTMENT INCOME | $ | — | $ | 1,304 | ||||
| CAPITAL SHARE ACTIVITY | ||||||||
Shares sold | 51,423 | 396,218 | ||||||
Shares reinvested | 23,857 | 52,037 | ||||||
Shares redeemed | (323,119 | ) | (685,046 | ) | ||||
Net decrease in shares outstanding | (247,839 | ) | (236,791 | ) | ||||
Shares outstanding, beginning of period | 2,585,435 | 2,822,226 | ||||||
Shares outstanding, end of period | 2,337,596 | 2,585,435 | ||||||
| See accompanying notes to financial statements. |
21
THE GOVERNMENT STREET EQUITY FUND
FINANCIAL HIGHLIGHTS
Selected Per Share Data and Ratios for a Share Outstanding Throughout Each Period | ||||||||||||||||||||||||
Six Months Ended September 30, 2011 (Unaudited) | Years Ended March 31, | |||||||||||||||||||||||
| 2011 | 2010 | 2009 | 2008 | 2007 | ||||||||||||||||||||
Net asset value at beginning of period | $ | 48.00 | $ | 40.89 | $ | 26.72 | $ | 44.76 | $ | 48.37 | $ | 52.42 | ||||||||||||
Income (loss) from investment operations: | ||||||||||||||||||||||||
Net investment income | 0.21 | 0.39 | 0.40 | 0.55 | 0.57 | 0.48 | ||||||||||||||||||
| Net realized and unrealized gains (losses) on investments | (6.63 | ) | 7.19 | 14.17 | (18.07 | ) | (2.12 | ) | 2.90 | |||||||||||||||
Total from investment operations | (6.42 | ) | 7.58 | 14.57 | (17.52 | ) | (1.55 | ) | 3.38 | |||||||||||||||
| Less distributions: | ||||||||||||||||||||||||
Dividends from net investment income | (0.21 | ) | (0.39 | ) | (0.40 | ) | (0.52 | ) | (0.57 | ) | (0.48 | ) | ||||||||||||
Distributions from net realized gains | — | (0.08 | ) | — | — | (1.31 | ) | (6.95 | ) | |||||||||||||||
Return of capital | — | — | — | — | (0.18 | ) | — | |||||||||||||||||
Total distributions | (0.21 | ) | (0.47 | ) | (0.40 | ) | (0.52 | ) | (2.06 | ) | (7.43 | ) | ||||||||||||
Net asset value at end of period | $ | 41.37 | $ | 48.00 | $ | 40.89 | $ | 26.72 | $ | 44.76 | $ | 48.37 | ||||||||||||
Total return (a) | (13.41% | )(b) | 18.69% | 54.71% | (39.43% | ) | (3.51% | ) | 7.04% | |||||||||||||||
Net assets at end of period (000’s) | $ | 55,859 | $ | 66,373 | $ | 57,766 | $ | 37,656 | $ | 67,267 | $ | 87,757 | ||||||||||||
Ratio of total expenses to average net assets | 0.87% | (c) | 0.88% | 0.90% | 0.91% | 0.84% | 0.84% | |||||||||||||||||
Ratio of net investment income to average net assets | 0.87% | (c) | 0.92% | 1.14% | 1.47% | 1.12% | 0.96% | |||||||||||||||||
Portfolio turnover rate | 18% | (b) | 26% | 30% | 35% | 12% | 15% | |||||||||||||||||
| (a) | Total return is a measure of the change in value of an investment in the Fund over the period covered, which assumes any dividends or capital gains distributions are reinvested in shares of the Fund. Returns do not reflect the deduction of taxes a shareholder would pay on Fund distributions or the redemption of Fund shares. |
| (b) | Not annualized. |
| (c) | Annualized. |
| See accompanying notes to financial statements. | |
22
THE GOVERNMENT STREET MID-CAP FUND
FINANCIAL HIGHLIGHTS
| Selected Per Share Data and Ratios for a Share Outstanding Throughout Each Period | ||||||||||||||||||||||||
Six Months Ended September 30, 2011 | Years Ended March 31, | |||||||||||||||||||||||
| (Unaudited) | 2011 | 2010 | 2009 | 2008 | 2007 | |||||||||||||||||||
Net asset value at beginning of period | $ | 15.89 | $ | 12.87 | $ | 8.46 | $ | 12.28 | $ | 13.13 | $ | 13.71 | ||||||||||||
Income (loss) from investment operations: | ||||||||||||||||||||||||
Net investment income | 0.02 | 0.03 | 0.05 | 0.05 | 0.03 | 0.04 | ||||||||||||||||||
| Net realized and unrealized gains (losses) on investments | (2.62 | ) | 3.03 | 4.41 | (3.82 | ) | (0.53 | ) | 0.45 | |||||||||||||||
Total from investment operations | (2.60 | ) | 3.06 | 4.46 | (3.77 | ) | (0.50 | ) | 0.49 | |||||||||||||||
| Less distributions: | ||||||||||||||||||||||||
Dividends from net investment income | — | (0.03 | ) | (0.05 | ) | (0.05 | ) | (0.05 | ) | (0.05 | ) | |||||||||||||
In excess of net investment income | — | (0.01 | ) | — | (0.00 | )(a) | — | — | ||||||||||||||||
Distributions from net realized gains | — | — | — | (0.00 | )(a) | (0.30 | ) | (1.02 | ) | |||||||||||||||
Total distributions | — | (0.04 | ) | (0.05 | ) | (0.05 | ) | (0.35 | ) | (1.07 | ) | |||||||||||||
Net asset value at end of period | $ | 13.29 | $ | 15.89 | $ | 12.87 | $ | 8.46 | $ | 12.28 | $ | 13.13 | ||||||||||||
Total return (b) | (16.36% | )(c) | 23.80% | 52.73% | (30.65% | ) | (3.99% | ) | 3.83% | |||||||||||||||
Net assets at end of period (000’s) | $ | 31,932 | $ | 39,983 | $ | 32,198 | $ | 21,522 | $ | 31,424 | $ | 33,961 | ||||||||||||
Ratio of total expenses to average net assets | 1.09% | (d) | 1.13% | 1.18% | 1.23% | 1.12% | 1.12% | |||||||||||||||||
Ratio of net expenses to average net assets (e) | 1.09% | (d) | 1.13% | 1.13% | 1.10% | 1.10% | 1.10% | |||||||||||||||||
Ratio of net investment income to average net assets (e) | 0.28% | (d) | 0.21% | 0.47% | 0.47% | 0.25% | 0.26% | |||||||||||||||||
Portfolio turnover rate | 4% | (c) | 20% | 10% | 14% | 11% | 11% | |||||||||||||||||
| (a) | Amount rounds to less than $0.01 per share. |
| (b) | Total return is a measure of the change in value of an investment in the Fund over the period covered, which assumes any dividends or capital gains distributions are reinvested in shares of the Fund. Returns do not reflect the deduction of taxes a shareholder would pay on Fund distributions or the redemption of Fund shares. |
| (c) | Not annualized. |
| (d) | Annualized. |
| (e) | Ratios were determined after voluntary advisory fee waivers by the Adviser. |
| See accompanying notes to financial statements. | |
23
THE ALABAMA TAX FREE BOND FUND
FINANCIAL HIGHLIGHTS
Selected Per Share Data and Ratios for a Share Outstanding Throughout Each Period | ||||||||||||||||||||||||
Six Months Ended September 30, 2011 (Unaudited) | Years Ended March 31, | |||||||||||||||||||||||
| 2011 | 2010 | 2009 | 2008 | 2007 | ||||||||||||||||||||
Net asset value at beginning of period | $ | 10.45 | $ | 10.53 | $ | 10.54 | $ | 10.50 | $ | 10.39 | $ | 10.40 | ||||||||||||
Income (loss) from investment operations: | ||||||||||||||||||||||||
Net investment income | 0.12 | 0.26 | 0.28 | 0.35 | 0.36 | 0.36 | ||||||||||||||||||
| Net realized and unrealized gains (losses) on investments | 0.19 | (0.07 | ) | (0.00 | )(a) | 0.04 | 0.12 | (0.01 | ) | |||||||||||||||
Total from investment operations | 0.31 | 0.19 | 0.28 | 0.39 | 0.48 | 0.35 | ||||||||||||||||||
| Less distributions: | ||||||||||||||||||||||||
Dividends from net investment income | (0.12 | ) | (0.27 | ) | (0.28 | ) | (0.35 | ) | (0.36 | ) | (0.36 | ) | ||||||||||||
Distributions from net realized gains | — | (0.00 | )(a) | (0.01 | ) | (0.00 | )(a) | (0.01 | ) | — | ||||||||||||||
Total distributions | (0.12 | ) | (0.27 | ) | (0.29 | ) | (0.35 | ) | (0.37 | ) | (0.36 | ) | ||||||||||||
Net asset value at end of period | $ | 10.64 | $ | 10.45 | $ | 10.53 | $ | 10.54 | $ | 10.50 | $ | 10.39 | ||||||||||||
Total return (b) | 3.00% | (c) | 1.78% | 2.88% | 3.80% | 4.66% | 3.38% | |||||||||||||||||
Net assets at end of period (000’s) | $ | 24,875 | $ | 27,026 | $ | 29,716 | $ | 28,358 | $ | 25,426 | $ | 25,968 | ||||||||||||
Ratio of total expenses to average net assets | 0.77% | (d) | 0.77% | 0.75% | 0.79% | 0.78% | 0.76% | |||||||||||||||||
Ratio of net expenses to average net assets (e) | 0.65% | (d) | 0.65% | 0.65% | 0.65% | 0.65% | 0.65% | |||||||||||||||||
Ratio of net investment income to average net assets (e) | 2.29% | (d) | 2.51% | 2.85% | 3.36% | 3.46% | 3.44% | |||||||||||||||||
Portfolio turnover rate | 3% | (c) | 21% | 32% | 8% | 6% | 15% | |||||||||||||||||
| (a) | Amount rounds to less than $0.01 per share. |
| (b) | Total return is a measure of the change in value of an investment in the Fund over the period covered, which assumes any dividends or capital gains distributions are reinvested in shares of the Fund. Returns do not reflect the deduction of taxes a shareholder would pay on Fund distributions or the redemption of Fund shares. |
| (c) | Not annualized. |
| (d) | Annualized. |
| (e) | Ratios were determined after voluntary advisory fee waivers by the Adviser (Note 4). |
| See accompanying notes to financial statements. | |
24
THE GOVERNMENT STREET FUNDS
NOTES TO FINANCIAL STATEMENTS
September 30, 2011 (Unaudited)
1. Organization
The Government Street Equity Fund, The Government Street Mid-Cap Fund and The Alabama Tax Free Bond Fund (the “Funds”) are each a no-load series of the Williamsburg Investment Trust (the “Trust”), an open-end management investment company registered under the Investment Company Act of 1940. The Trust was organized as a Massachusetts business trust on July 18, 1988. Other series of the Trust are not included in this report.
The Government Street Equity Fund’s investment objective is to seek capital appreciation.
The Government Street Mid-Cap Fund’s investment objective is to seek capital appreciation.
The Alabama Tax Free Bond Fund’s investment objectives are to provide current income exempt from federal income taxes and from the personal income taxes of Alabama and to preserve capital.
2. Significant Accounting Policies
The following is a summary of the Funds’ significant accounting policies. The policies are in conformity with accounting principles generally accepted in the United States of America (“GAAP”).
Securities valuation — The Funds’ portfolio securities are valued as of the close of business of the regular session of the New York Stock Exchange (normally 4:00 p.m., Eastern time). Securities traded on a national stock exchange are valued based upon the closing price on the principal exchange where the security is traded. Securities which are quoted by NASDAQ are valued at the NASDAQ Official Closing Price. Securities which are traded over-the-counter are valued at the last sales price, if available, otherwise, at the last quoted bid price. It is expected that fixed income securities will ordinarily be traded in the over-the-counter market, and common stocks will ordinarily be traded on a national securities exchange, but may also be traded in the over-the-counter market. Call options written by the Funds are valued at the then current market quotation, using the ask price as of the close of each day on the principal exchanges on which they are traded.
When market quotations are not readily available, securities may be valued on the basis of prices provided by an independent pricing service. The prices provided by the pricing service are determined with consideration given to institutional bid and last sale prices and take into account securities prices, yields, maturities, call features, ratings, institutional trading in similar groups of securities and developments related to specific securities. If a pricing service cannot provide a valuation, securities will be valued in good faith at fair value using procedures established by and under the general supervision of the Board of Trustees and will be classified as Level 2 or 3 (see
25
THE GOVERNMENT STREET FUNDS
NOTES TO FINANCIAL STATEMENTS (Continued)
below) within the fair value hierarchy, depending on the inputs used. Such methods of fair valuation may include, but are not limited to: multiple of earnings, multiple of book value, discount from market of a similar freely traded security, purchase price of the security, subsequent private transactions in the security or related securities, or a combination of these and other factors. Short-term instruments (those with remaining maturities of 60 days or less) may be valued at amortized cost, which approximates market value.
GAAP establishes a single authoritative definition of fair value, sets out a framework for measuring fair value and requires additional disclosures about fair value measurements.
Various inputs are used in determining the value of each of the Fund’s investments. These inputs are summarized in the three broad levels listed below:
• Level 1 – quoted prices in active markets for identical securities
• Level 2 – other significant observable inputs
• Level 3 – significant unobservable inputs
The inputs or methodology used for valuing securities are not necessarily an indication of the risks associated with investing in those securities. The inputs used to measure fair value may fall into different levels of the fair value hierarchy. In such cases, for disclosure purposes, the level in the fair value hierarchy within which the fair value measurement falls in its entirety is determined based on the lowest level input that is significant to the fair value measurement.
The following is a summary of the inputs used to value each Fund’s investments as of September 30, 2011 by security type:
The Government Street Equity Fund: | Level 1 | Level 2 | Level 3 | Total | ||||||||||||
Common Stocks | $ | 45,924,404 | $ | — | $ | — | $ | 45,924,404 | ||||||||
Exchange-Traded Funds | 6,633,742 | — | — | 6,633,742 | ||||||||||||
Exchange-Traded Notes | 1,123,650 | — | — | 1,123,650 | ||||||||||||
Warrants | 4,896 | — | — | 4,896 | ||||||||||||
Commercial Paper | — | 1,346,998 | — | 1,346,998 | ||||||||||||
Money Market Funds | 765 | — | — | 765 | ||||||||||||
Total | $ | 53,687,457 | $ | 1,346,998 | $ | — | $ | 55,034,455 | ||||||||
The Government Street Mid-Cap Fund: | Level 1 | Level 2 | Level 3 | Total | ||||||||||||
Common Stocks | $ | 27,460,319 | $ | — | $ | — | $ | 27,460,319 | ||||||||
Exchange-Traded Funds | 2,567,470 | — | — | 2,567,470 | ||||||||||||
Exchange-Traded Notes | 272,400 | — | — | 272,400 | ||||||||||||
Commercial Paper | — | 1,466,998 | — | 1,466,998 | ||||||||||||
Money Market Funds | 612 | — | — | 612 | ||||||||||||
Total | $ | 30,300,801 | $ | 1,466,998 | $ | — | $ | 31,767,799 | ||||||||
26
THE GOVERNMENT STREET FUNDS
NOTES TO FINANCIAL STATEMENTS (Continued)
The Alabama Tax Free Bond Fund: | Level 1 | Level 2 | Level 3 | Total | ||||||||||||
| Alabama Fixed Rate Revenue and General Obligation Bonds | $ | — | $ | 23,330,972 | $ | — | $ | 23,330,972 | ||||||||
Money Market Funds | 1,338,093 | — | — | 1,338,093 | ||||||||||||
Total | $ | 1,338,093 | $ | 23,330,972 | $ | — | $ | 24,669,065 | ||||||||
Refer to The Government Street Equity Fund’s and The Government Street Mid-Cap Fund’s Schedules of Investments for a listing of the common stocks valued using Level 1 inputs by sector type. During the six months ended September 30, 2011, the Funds did not have any significant transfers in and out of any Level. There were no Level 3 securities held by the Funds as of or during the six months ended September 30, 2011. It is the Funds’ policy to recognize transfers into and out of any Level at the end of the reporting period.
Share valuation — The net asset value per share of each Fund is calculated daily by dividing the total value of each Fund’s assets, less liabilities, by the number of shares outstanding. The offering price and redemption price per share of each Fund is equal to the net asset value per share.
Investment income — Interest income is accrued as earned. Dividend income is recorded on the ex-dividend date. Discounts and premiums on fixed-income securities purchased are amortized using the interest method.
Repurchase agreements — The Funds may enter into repurchase agreements. A repurchase agreement, which is collateralized by U.S. Government obligations, is valued at cost which, together with accrued interest, approximates market value. At the time a Fund enters into a repurchase agreement, the seller agrees that the value of the underlying securities, including accrued interest, will at all times be equal to or exceed the face amount of the repurchase agreement. In addition, the Funds actively monitor and seek additional collateral, as needed. If the seller defaults, the fair value of the collateral may decline and realization of the collateral by the Funds may be delayed or limited. The Funds did not enter into any repurchase agreements during the six months ended September 30, 2011.
Distributions to shareholders — Dividends arising from net investment income are declared and paid quarterly to shareholders of The Government Street Equity Fund; declared and paid annually to shareholders of The Government Street Mid-Cap Fund; and declared daily and paid monthly to shareholders of The Alabama Tax Free Bond Fund. Net realized short-term capital gains, if any, may be distributed throughout the year and net realized long-term capital gains, if any, are distributed at least once each year. The amount of distributions from net investment income and net realized gains are determined in accordance with federal income tax regulations, which may differ from GAAP. These “book/tax” differences are either temporary or permanent in nature.
27
THE GOVERNMENT STREET FUNDS
NOTES TO FINANCIAL STATEMENTS (Continued)
The tax character of distributions paid during the periods ended September 30, 2011 and March 31, 2011 is as follows:
Period Ended | Ordinary Income | Exempt- Interest Dividends | Long-Term Gains | Total Distributions | |||||||||||||
| The Government Street Equity Fund | 9/30/11 | $ | 284,261 | $ | — | $ | — | $ | 284,261 | ||||||||
| 3/31/11 | $ | 536,219 | $ | — | $ | 114,658 | $ | 650,877 | |||||||||
| The Government Street Mid-Cap Fund | 9/30/11 | $ | — | $ | — | $ | — | $ | — | ||||||||
| 3/31/11 | $ | 99,590 | $ | — | $ | — | $ | 99,590 | |||||||||
| The Alabama Tax Free Bond Fund | 9/30/11 | $ | — | $ | 304,735 | $ | — | $ | 304,735 | ||||||||
| 3/31/11 | $ | 1,634 | $ | 722,479 | $ | 1,174 | $ | 725,287 | |||||||||
Security transactions — Security transactions are accounted for on trade date. Gains and losses on securities sold are determined on a specific identification basis.
Common expenses — Common expenses of the Trust are allocated among the series of the Trust based on relative net assets of each series or the nature of the services performed and the relative applicability to each series.
Options transactions — With the intent of increasing the total returns of the investment portfolios of The Government Street Equity Fund and The Government Street Mid-Cap Fund, the Funds may write covered call options, primarily against highly appreciated, low basis securities, to increase income. When the Funds write a covered call option contract, premiums are received and are recorded as liabilities, and are subsequently valued daily at the closing prices on their primary exchanges. Premiums received from writing options which expire are treated as realized gains. Premiums received from writing options which are exercised increase the proceeds used to calculate the realized gain or loss on the sale of the security. If a closing purchase transaction is used to terminate a Fund’s obligation on a written call option contract, a gain or loss will be realized, depending upon whether the price of the closing purchase transaction is more or less than the premium previously received on the call option written.
Estimates — The preparation of financial statements in conformity with GAAP requires management to make estimates and assumptions that affect the reported amounts of assets and liabilities and the disclosure of contingent assets and liabilities as of the date of the financial statements and the reported amounts of income and expenses during the reporting period. Actual results could differ from those estimates.
Federal income tax — It is each Fund’s policy to comply with the special provisions of Subchapter M of the Internal Revenue Code applicable to regulated investment companies. As provided therein, in any fiscal year in which a Fund so qualifies, and distributes at least 90% of its taxable net income, the Fund (but not the shareholders) will be relieved of federal income tax on the income distributed. Accordingly, no provision for income taxes has been made.
28
THE GOVERNMENT STREET FUNDS
NOTES TO FINANCIAL STATEMENTS (Continued)
In order to avoid imposition of the excise tax applicable to regulated investment companies, it is also each Fund’s intention to declare as dividends in each calendar year at least 98% of its net investment income (earned during the calendar year) and 98.2% of its net realized capital gains (earned during the twelve months ended October 31) plus undistributed amounts from prior years.
The following information is computed on a tax basis for each item as of September 30, 2011:
The Government Street Equity Fund | The Government Street Mid-Cap Fund | The Alabama Tax Free Bond Fund | ||||||||||
Cost of portfolio investments | $ | 38,384,258 | $ | 25,579,941 | $ | 23,728,694 | ||||||
Gross unrealized appreciation | $ | 18,612,196 | $ | 8,286,385 | $ | 962,606 | ||||||
Gross unrealized depreciation | (1,961,999 | ) | (2,098,527 | ) | (22,235 | ) | ||||||
Net unrealized appreciation | 16,650,197 | 6,187,858 | 940,371 | |||||||||
Undistributed ordinary income | 79,272 | 53,757 | — | |||||||||
Undistributed tax exempt income | — | — | 3,459 | |||||||||
Capital loss carryforward | — | (393,825 | ) | — | ||||||||
Other gains (losses) | 290,846 | 363,489 | (29,549 | ) | ||||||||
Other temporary differences | (7,487 | ) | — | (3,459 | ) | |||||||
Total distributable earnings | $ | 17,012,828 | $ | 6,211,279 | $ | 910,822 | ||||||
The difference between the federal income tax cost of portfolio investments and the financial statement cost for The Alabama Tax Free Bond Fund is due to certain timing differences in the recognition of capital gains or losses under income tax regulations and GAAP. These “book/tax” differences are temporary in nature and are primarily due to the tax deferral of losses on wash sales and differing methods in the amortization of market discount and premium on fixed income securities.
As of March 31, 2011, The Government Street Mid-Cap Fund had a capital loss carryforward for federal income tax purposes of $393,825 which expires on March 31, 2018. This capital loss carryforward may be utilized in the current and future years to offset net realized capital gains, if any, prior to distribution to shareholders.
During the six months ended September 30, 2011, The Government Street Equity Fund and The Government Street Mid-Cap Fund realized $1,627,995 and $1,500,775, respectively, of net capital gains resulting from in-kind redemptions (redemptions in which shareholders who redeemed Fund shares received securities held by the Fund rather than cash). The Funds recognize a gain on in-kind redemptions to the extent that the value of the distributed securities on the date of redemption exceeds the cost of those securities. Such gains are not taxable to the Funds and are not required to be distributed to shareholders. The Funds have reclassified these amounts against paid-in capital. These reclassifications are reflected on the Statements of Assets and
29
THE GOVERNMENT STREET FUNDS
NOTES TO FINANCIAL STATEMENTS (Continued)
Liabilities. Such reclassifications, the result of permanent differences between the financial statement and income tax reporting requirements, had no effect on each Fund’s net assets or net asset value per share.
The Funds recognize the tax benefits or expenses of uncertain tax positions only when the position is “more likely than not” to be sustained assuming examination by tax authorities. Management has reviewed the tax positions taken on Federal income tax returns for all open tax years (tax years ended March 31, 2008 through March 31, 2011) of each Fund and has concluded that no provision for unrecognized tax benefits or expenses is required in these financial statements.
3. Investment Transactions
During the six months ended September 30, 2011, cost of purchases and proceeds from sales and maturities of investment securities, other than short-term investments and U.S. government securities, totaled $11,357,247 and $14,306,074, respectively, for The Government Street Equity Fund; $1,675,611 and $4,307,047, respectively, for The Government Street Mid-Cap Fund; and $730,030 and $3,950,850, respectively, for The Alabama Tax Free Bond Fund.
4. Transactions with Affiliates
INVESTMENT ADVISORY AGREEMENT
The Funds’ investments are managed by Leavell Investment Management, Inc. (the “Adviser”) under the terms of an Investment Advisory Agreement. The Government Street Equity Fund pays the Adviser a fee, which is computed and accrued daily and paid monthly, at an annual rate of .60% of its average daily net assets up to $100 million and .50% of such assets in excess of $100 million. The Government Street Mid-Cap Fund pays the Adviser a fee, which is computed and accrued daily and paid monthly, at an annual rate of .75% of its average daily net assets. The Alabama Tax Free Bond Fund pays the Adviser a fee, which is computed and accrued daily and paid monthly, at an annual rate of .35% of its average daily net assets up to $100 million and .25% of such assets in excess of $100 million.
During the six months ended September 30, 2011, the Adviser voluntarily undertook to limit the total operating expenses of The Alabama Tax Free Bond Fund to .65% of the Fund’s average daily net assets. Accordingly, the Adviser waived $15,680 of its investment advisory fees from The Alabama Tax Free Bond Fund during the six months ended September 30, 2011.
Certain officers of the Trust are also officers of the Adviser.
MUTUAL FUND SERVICES AGREEMENT
Under the terms of a Mutual Fund Services Agreement between the Trust and Ultimus Fund Solutions, LLC (“Ultimus”), Ultimus provides administrative, pricing, accounting, dividend disbursing, shareholder servicing and transfer agent services
30
THE GOVERNMENT STREET FUNDS
NOTES TO FINANCIAL STATEMENTS (Continued)
for the Funds. For these services, Ultimus receives a monthly fee from each Fund at an annual rate of .15% of the Fund’s average daily net assets up to $25 million, .125% of the next $25 million of such assets, and .10% of such assets in excess of $50 million. The minimum monthly fee payable to Ultimus is $4,000 with respect to The Government Street Equity Fund and The Government Street Mid-Cap Fund and $3,500 with respect to The Alabama Tax Free Bond Fund. In addition, each Fund pays out-of-pocket expenses including, but not limited to, postage, supplies and costs of pricing portfolio securities. Certain officers of the Trust are also officers of Ultimus, or of Ultimus Fund Distributors, LLC (the “Distributor”), the principal underwriter of each Fund’s shares and an affiliate of Ultimus. The Distributor is compensated by the Adviser (not the Funds) for acting as principal underwriter.
COMPLIANCE CONSULTING AGREEMENT
Under the terms of a Compliance Consulting Agreement between the Trust and Ultimus, Ultimus provides an individual to serve as the Trust’s Chief Compliance Officer and to administer the Funds’ compliance policies and procedures. For these services, the Funds pay Ultimus an annual base fee of $18,600 plus an asset-based fee equal to 0.01% per annum on the Funds’ aggregate net assets in excess of $100 million. In addition, the Funds reimburse Ultimus for reasonable out-of-pocket expenses, if any, incurred in connection with these services.
5. Derivatives Transactions
No option contracts were written by The Government Street Equity Fund or The Government Street Mid-Cap Fund during the six months ended September 30, 2011.
6. Contingencies and Commitments
The Funds indemnify the Trust’s officers and Trustees for certain liabilities that might arise from their performance of their duties to the Funds. Additionally, in the normal course of business the Funds enter into contracts that contain a variety of representations and warranties and which provide general indemnifications. The Funds’ maximum exposure under these arrangements is unknown, as this would involve future claims that may be made against the Funds that have not yet occurred. However, based on experience, the Funds expect the risk of loss to be remote.
7. Concentration of Credit Risk
The Alabama Tax Free Bond Fund invests primarily in debt instruments of municipal issuers in the state of Alabama. The issuers’ abilities to meet their obligations may be affected by economic developments in the state or its region, as well as disruptions in the credit markets and the economy, generally.
31
THE GOVERNMENT STREET FUNDS
NOTES TO FINANCIAL STATEMENTS (Continued)
8. Subsequent Events
The Funds are required to recognize in the financial statements the effects of all subsequent events that provide additional evidence about conditions that existed as of the date of the Statements of Assets and Liabilities. For non-recognized subsequent events that must be disclosed to keep the financial statements from being misleading, the Funds are required to disclose the nature of the event as well as an estimate of its financial effect, or a statement that such an estimate cannot be made. Management has evaluated subsequent events through the issuance of these financial statements and has noted no such events.
9. Recent Accounting Pronouncement and New Legislation
In May 2011, the Financial Accounting Standards Board issued Accounting Standards Update (“ASU”) No. 2011-04 “Amendments to Achieve Common Fair Value Measurement and Disclosure Requirements in U.S. GAAP and IFRSs.” ASU No. 2011-04 establishes common requirements for measuring fair value and for disclosing information about fair value measurements in accordance with GAAP and International Financial Reporting Standards. ASU No. 2011-04 is effective for interim and annual periods beginning after December 15, 2011 and is applied prospectively. Management is currently evaluating the impact ASU No. 2011-04 may have on financial statement disclosures.
The Regulated Investment Company Modernization Act of 2010 (the “Act”) was enacted on December 22, 2010. The Act makes changes to several tax rules impacting the Funds. In general, the provisions of the Act will be effective for the Funds’ current fiscal year ending March 31, 2012. Although the Act provides several benefits, including unlimited carryover on future capital losses, there may be greater likelihood that all or a portion of a Fund’s pre-enactment capital loss carryovers may expire without being utilized due to the fact that post-enactment capital losses must be utilized before pre-enactment capital loss carryovers. Relevant information regarding the impact of the Act on the Funds, if any, will be included in the Annual Report for the year ending March 31, 2012.
32
THE GOVERNMENT STREET FUNDS
ABOUT YOUR FUNDS’ EXPENSES (Unaudited)
We believe it is important for you to understand the impact of costs on your investment. All mutual funds have operating expenses. As a shareholder of the Funds, you incur ongoing costs, including management fees and other expenses. These ongoing costs, which are deducted from each Fund’s gross income, directly reduce the investment returns of the Funds.
A mutual fund’s ongoing costs are expressed as a percentage of its average net assets. This figure is known as the expense ratio. The following examples are intended to help you understand the ongoing costs (in dollars) of investing in the Funds and to compare these costs with the ongoing costs of investing in other mutual funds. The examples below are based on an investment of $1,000 made at the beginning of the period shown and held for the entire period (April 1, 2011 through September 30, 2011).
The table below illustrates each Fund’s ongoing costs in two ways:
Actual fund return – This section helps you to estimate the actual expenses that you paid over the period. The “Ending Account Value” shown is derived from each Fund’s actual return, and the third column shows the dollar amount of operating expenses that would have been paid by an investor who started with $1,000 in the Funds. You may use the information here, together with the amount you invested, to estimate the expenses that you paid over the period.
To do so, simply divide your account value by $1,000 (for example, an $8,600 account value divided by $1,000 = 8.6), then multiply the result by the number given for the Funds under the heading “Expenses Paid During Period.”
Hypothetical 5% return – This section is intended to help you compare the Funds’ ongoing costs with those of other mutual funds. It assumes that each Fund had an annual return of 5% before expenses during the period shown, but that the expense ratio is unchanged. In this case, because the returns used are not the Funds’ actual returns, the results do not apply to your investment. The example is useful in making comparisons because the Securities and Exchange Commission (the “SEC”) requires all mutual funds to calculate expenses based on a 5% return. You can assess each Fund’s ongoing costs by comparing this hypothetical example with the hypothetical examples that appear in shareholder reports of other funds.
Note that expenses shown in the table are meant to highlight and help you compare ongoing costs only. The Funds do not charge sales loads or redemption fees.
The calculations assume no shares were bought or sold during the period. Your actual costs may have been higher or lower, depending on the amount of your investment and the timing of any purchases or redemptions.
33
THE GOVERNMENT STREET FUNDS
ABOUT YOUR FUNDS’ EXPENSES (Unaudited)
(Continued)
More information about the Funds’ expenses, including historical expense ratios, can be found in this report. For additional information on operating expenses and other shareholder costs, please refer to the Funds’ prospectus.
Beginning Account Value April 1, 2011 | Ending Account Value Sept. 30, 2011 | Expenses Paid During Period* | |
The Government Street Equity Fund | |||
Based on Actual Fund Return | $1,000.00 | $865.90 | $4.07 |
Based on Hypothetical 5% Return (before expenses) | $1,000.00 | $1,020.71 | $4.41 |
The Government Street Mid-Cap Fund | |||
Based on Actual Fund Return | $1,000.00 | $836.40 | $5.02 |
Based on Hypothetical 5% Return (before expenses) | $1,000.00 | $1,019.60 | $5.52 |
The Alabama Tax Free Bond Fund | |||
Based on Actual Fund Return | $1,000.00 | $1,030.00 | $3.31 |
Based on Hypothetical 5% Return (before expenses) | $1,000.00 | $1,021.81 | $3.29 |
| * | Expenses are equal to the Funds’ annualized expense ratios for the period as stated below, multiplied by the average account value over the period, multiplied by 183/365 (to reflect the one-half year period). |
| The Government Street Equity Fund | 0.87% |
| The Government Street Mid-Cap Fund | 1.09% |
| The Alabama Tax Free Bond Fund | 0.65% |
34
THE GOVERNMENT STREET FUNDS
OTHER INFORMATION (Unaudited)
A description of the policies and procedures that the Funds use to vote proxies relating to portfolio securities is available without charge upon request by calling toll-free 1-866-738-1125, or on the SEC’s website at http://www.sec.gov. Information regarding how the Funds voted proxies relating to portfolio securities during the most recent 12-month period ended June 30 is also available without charge upon request by calling toll-free 1-866-738-1125 or on the SEC’s website at http://www.sec.gov.
The Trust files a complete listing of portfolio holdings for the Funds with the SEC as of the end of the first and third quarters of each fiscal year on Form N-Q. The filings are available upon request, by calling 1-866-738-1125. Furthermore, you may obtain a copy of these filings on the SEC’s website at http://www.sec.gov. The Trust’s Forms N-Q may also be reviewed and copied at the SEC’s Public Reference Room in Washington, DC, and information on the operation of the Public Reference Room may be obtained by calling 1-800-SEC-0330.
35
The Government Street Funds | |
Investment Adviser Leavell Investment Management, Inc. Post Office Box 1307 Mobile, AL 36633 Administrator Ultimus Fund Solutions, LLC P.O. Box 46707 Cincinnati, OH 45246-0707 1-866-738-1125 Legal Counsel Sullivan & Worcester LLP One Post Office Square Boston, MA 02109 Independent Registered Public Accounting Firm Ernst & Young LLP 1900 Scripps Center 312 Walnut Street Cincinnati, OH 45202 Board of Trustees Austin Brockenbrough, III John T. Bruce Charles M. Caravati, Jr. Robert S. Harris J. Finley Lee, Jr. Richard L. Morrill Harris V. Morrissette Portfolio Managers Thomas W. Leavell, The Government Street Equity Fund The Government Street Mid-Cap Fund Timothy S. Healey, The Government Street Mid-Cap Fund The Alabama Tax Free Bond Fund Richard E. Anthony, Jr., CFA, The Government Street Mid-Cap Fund Michael J. Hofto, CFA, The Government Street Mid-Cap Fund | |
THE JAMESTOWN FUNDS No-Load Funds The Jamestown Balanced Fund The Jamestown Equity Fund The Jamestown Tax Exempt Virginia Fund SEMI-ANNUAL REPORT September 30, 2011 (Unaudited) Investment Adviser Lowe, Brockenbrough & Company, Inc. Richmond, Virginia |
THE JAMESTOWN BALANCED FUND
PERFORMANCE INFORMATION (Unaudited)
Comparison of the Change in Value of a $10,000 Investment in
The Jamestown Balanced Fund, the Standard & Poor’s 500 Index and the
60% S&P 500 Index / 40% Barclays Capital U.S. Intermediate Government/Credit Bond Index

Average Annual Total Returns(a) (for periods ended September 30, 2011) | |||
| 1 Year | 5 Years | 10 Years | |
| The Jamestown Balanced Fund | 0.67% | 1.18% | 3.23% |
| Standard & Poor’s 500 Index | 1.14% | -1.18% | 2.82% |
| 60% S&P 500 Index / 40% Barclays Capital U.S. Intermediate Government/Credit Bond Index | 2.29% | 2.03% | 4.08% |
| (a) | Total return is a measure of the change in value of an investment in the Fund over the periods covered, which assumes any dividends or capital gains distributions are reinvested in shares of the Fund. Returns shown do not reflect the deduction of taxes a shareholder would pay on Fund distributions or the redemption of Fund shares. |
1
THE JAMESTOWN EQUITY FUND
PERFORMANCE INFORMATION (Unaudited)
Comparison of the Change in Value of a $10,000 Investment in
The Jamestown Equity Fund and the Standard & Poor’s 500 Index

Average Annual Total Returns(a) (for periods ended September 30, 2011) | |||
| 1 Year | 5 Years | 10 Years | |
| The Jamestown Equity Fund | 0.41% | -1.16% | 2.15% |
| Standard & Poor’s 500 Index | 1.14% | -1.18% | 2.82% |
| (a) | Total return is a measure of the change in value of an investment in the Fund over the periods covered, which assumes any dividends or capital gains distributions are reinvested in shares of the Fund. Returns shown do not reflect the deduction of taxes a shareholder would pay on Fund distributions or the redemption of Fund shares. |
2
THE JAMESTOWN TAX EXEMPT VIRGINIA FUND
PERFORMANCE INFORMATION (Unaudited)
Comparison of the Change in Value of a $10,000 Investment in
The Jamestown Tax Exempt Virginia Fund, the Barclays Capital 5-year Municipal Bond Index*,
the Lipper Intermediate Municipal Fund Index and the Barclays Capital Municipal Bond Index
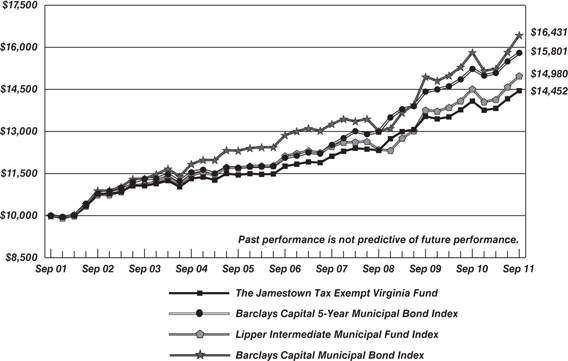
Average Annual Total Returns(a) (for periods ended September 30, 2011) | |||
| 1 Year | 5 Years | 10 Years | |
| The Jamestown Tax Exempt Virginia Fund | 2.64% | 4.21% | 3.75% |
| Barclays Capital 5-Year Municipal Bond Index | 3.75% | 5.55% | 4.68% |
| Lipper Intermediate Municipal Fund Index | 3.22% | 4.31% | 4.12% |
| Barclays Capital Municipal Bond Index | 3.88% | 5.01% | 5.09% |
| (a) | Total return is a measure of the change in value of an investment in the Fund over the periods covered, which assumes any dividends or capital gains distributions are reinvested in shares of the Fund. Returns shown do not reflect the deduction of taxes a shareholder would pay on Fund distributions or the redemption of Fund shares. |
| * | The Barclays Capital 5-Year Municipal Bond Index is an unmanaged index generally representative of 5-year tax-exempt bonds. Because the Fund is typically classified as an intermediate-term fund (with an average duration of between 2 and 10 years), this index is believed to be the most appropriate broad-based securities market index against which to compare the Fund’s performance. |
3
THE JAMESTOWN BALANCED FUND
PORTFOLIO INFORMATION
September 30, 2011 (Unaudited)
Asset Allocation (% of Net Assets) | Ten Largest Equity Holdings | % of Net Assets | |
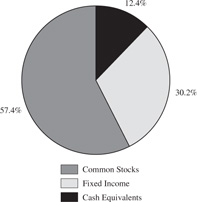 | Apple, Inc. | 2.8% | |
| PepsiCo, Inc. | 1.9% | ||
| Wal-Mart Stores, Inc. | 1.7% | ||
| Google, Inc. - Class A | 1.6% | ||
| Abbott Laboratories | 1.5% | ||
| General Electric Company | 1.4% | ||
| Microsoft Corporation | 1.4% | ||
| Chevron Corporation | 1.4% | ||
| JPMorgan Chase & Company | 1.4% | ||
| Aetna, Inc. | 1.4% | ||
Equity Sector Concentration vs. the S&P 500 Index (57.4% of Net Assets) |

Fixed Income Portfolio (30.2% of Net Assets) | Credit Quality | % of Fixed Income Portfolio | ||
| Average Stated Maturity (Years) | 4.31 | AAA | 51.3% | |
| Average Duration (Years) | 3.67 | AA | 7.4% | |
| Average Coupon | 4.86% | A | 37.9% | |
| Average Yield to Maturity | 1.89% | BBB | 3.4% | |
Sector Breakdown | % of Fixed Income Portfolio | |||
| U.S. Treasury Obligations | 20.2% | |||
| U.S. Government Agency Obligations | 11.4% | |||
| Municipal Bonds | 2.0% | |||
| Mortgage-Backed Securities | 17.7% | |||
| Corporate Bonds | 48.7% | |||
4
THE JAMESTOWN EQUITY FUND
PORTFOLIO INFORMATION
September 30, 2011 (Unaudited)
Asset Allocation (% of Net Assets) | Ten Largest Equity Holdings | % of Net Assets | |
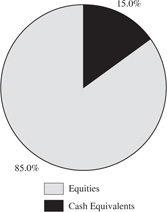 | Apple, Inc. | 4.1% | |
| PepsiCo, Inc. | 2.7% | ||
| Wal-Mart Stores, Inc. | 2.6% | ||
| Abbott Laboratories | 2.2% | ||
| Google, Inc. - Class A | 2.2% | ||
| Chevron Corporation | 2.1% | ||
| Aetna, Inc. | 2.1% | ||
| Microsoft Corporation | 2.1% | ||
| JPMorgan Chase & Company | 2.1% | ||
| Intel Corporation | 2.1% | ||
Sector Concentration vs. the S&P 500 Index |
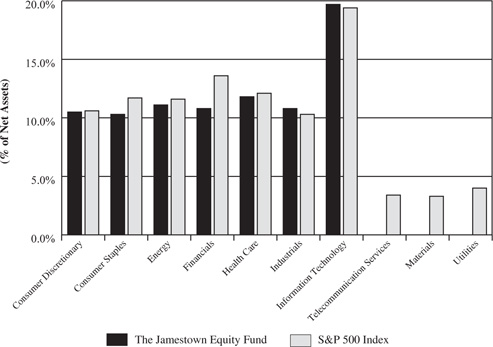
5
THE JAMESTOWN TAX EXEMPT VIRGINIA FUND
PORTFOLIO INFORMATION
September 30, 2011 (Unaudited)
Characteristics (Weighted Average) | Maturity Breakdown (%of Portfolio) | ||
| 30-day SEC Yield | 1.72% | 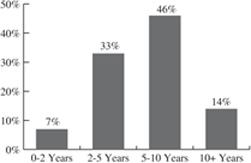 | |
| Tax-Equivalent Yield | 2.65%* | ||
| Average Maturity (years) | 6.2 | ||
| Average Duration (years) | 4.1 | ||
| Average Quality | AA | ||
| Number of Issues | 52 | ||
| * Assumes a maximum 35.0% federal tax rate. | |||
Credit Quality (%of Portfolio) | Sector Diversification (%of Portfolio) | |
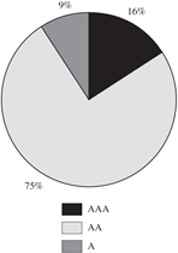 | 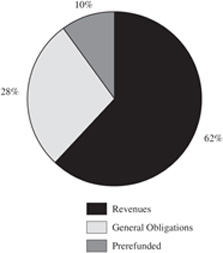 |
6
THE JAMESTOWN BALANCED FUND
SCHEDULE OF INVESTMENTS
September 30, 2011 (Unaudited)
COMMON STOCKS — 57.4% | Shares | Value | ||||||
| Consumer Discretionary — 6.8% | ||||||||
Comcast Corporation - Class A | 10,200 | $ | 213,180 | |||||
Dollar Tree, Inc. (a) | 2,700 | 202,797 | ||||||
McDonald's Corporation | 2,000 | 175,640 | ||||||
TJX Companies, Inc. (The) | 3,700 | 205,239 | ||||||
Viacom, Inc. - Class B | 5,000 | 193,700 | ||||||
Yum! Brands, Inc. | 3,500 | 172,865 | ||||||
| 1,163,421 | ||||||||
| Consumer Staples — 7.0% | ||||||||
CVS Caremark Corporation | 6,900 | 231,702 | ||||||
Kimberly-Clark Corporation | 3,300 | 234,333 | ||||||
PepsiCo, Inc. | 5,300 | 328,070 | ||||||
Sysco Corporation | 4,600 | 119,140 | ||||||
Wal-Mart Stores, Inc. | 5,700 | 295,830 | ||||||
| 1,209,075 | ||||||||
| Energy — 7.7% | ||||||||
Apache Corporation | 1,300 | 104,312 | ||||||
Chevron Corporation | 2,600 | 240,552 | ||||||
ConocoPhillips | 3,500 | 221,620 | ||||||
Exxon Mobil Corporation | 2,000 | 145,260 | ||||||
Hess Corporation | 3,700 | 194,102 | ||||||
Marathon Oil Corporation | 5,900 | 127,322 | ||||||
Marathon Petroleum Corporation | 2,800 | 75,768 | ||||||
Noble Corporation (a) | 7,000 | 205,450 | ||||||
| 1,314,386 | ||||||||
| Financials — 7.2% | ||||||||
American Express Company | 4,300 | 193,070 | ||||||
Ameriprise Financial, Inc. | 4,500 | 177,120 | ||||||
Franklin Resources, Inc. | 1,850 | 176,934 | ||||||
JPMorgan Chase & Company | 7,900 | 237,948 | ||||||
MetLife, Inc. | 4,200 | 117,642 | ||||||
PNC Financial Services Group, Inc. | 4,000 | 192,760 | ||||||
Prudential Financial, Inc. | 2,800 | 131,208 | ||||||
| 1,226,682 | ||||||||
| Health Care — 8.0% | ||||||||
Abbott Laboratories | 5,000 | 255,700 | ||||||
Aetna, Inc. | 6,500 | 236,275 | ||||||
AmerisourceBergen Corporation | 6,100 | 227,347 | ||||||
McKesson Corporation | 1,700 | 123,590 | ||||||
Medco Health Solutions, Inc. (a) | 4,000 | 187,560 | ||||||
Thermo Fisher Scientific, Inc. (a) | 4,200 | 212,688 | ||||||
UnitedHealth Group, Inc. | 2,900 | 133,748 | ||||||
| 1,376,908 | ||||||||
7
THE JAMESTOWN BALANCED FUND
SCHEDULE OF INVESTMENTS (Continued)
COMMON STOCKS — 57.4% (Continued) | Shares | Value | ||||||
| Industrials — 7.2% | ||||||||
Dover Corporation | 5,000 | $ | 233,000 | |||||
Eaton Corporation | 5,300 | 188,150 | ||||||
General Dynamics Corporation | 2,100 | 119,469 | ||||||
General Electric Company | 16,000 | 243,840 | ||||||
Norfolk Southern Corporation | 3,800 | 231,876 | ||||||
United Technologies Corporation | 3,100 | 218,116 | ||||||
| 1,234,451 | ||||||||
| Information Technology — 13.5% | ||||||||
Apple, Inc. (a) | 1,250 | 476,475 | ||||||
Cisco Systems, Inc. | 13,000 | 201,370 | ||||||
EMC Corporation (a) | 11,000 | 230,890 | ||||||
Google, Inc. - Class A (a) | 525 | 270,049 | ||||||
Intel Corporation | 10,700 | 228,231 | ||||||
International Business Machines Corporation | 1,150 | 201,285 | ||||||
Microsoft Corporation | 9,700 | 241,433 | ||||||
Oracle Corporation | 8,000 | 229,920 | ||||||
QUALCOMM, Inc. | 4,700 | 228,561 | ||||||
| 2,308,214 | ||||||||
Total Common Stocks (Cost $7,961,521) | $ | 9,833,137 | ||||||
U.S. TREASURY OBLIGATIONS — 6.1% | Par Value | Value | ||||||
| U.S. Treasury Notes — 6.1% | ||||||||
4.25%, 11/15/2014 | $ | 350,000 | $ | 390,933 | ||||
4.25%, 11/15/2017 | 400,000 | 471,750 | ||||||
2.625%, 08/15/2020 | 175,000 | 187,428 | ||||||
Total U.S. Treasury Obligations (Cost $929,937) | $ | 1,050,111 | ||||||
U.S. GOVERNMENT AGENCY OBLIGATIONS — 3.4% | Par Value | Value | ||||||
| Federal Home Loan Mortgage Corporation — 3.4% | ||||||||
5.25%, due 04/18/2016 (Cost $495,821) | $ | 500,000 | $ | 590,128 | ||||
VIRGINIA REVENUE AND GENERAL OBLIGATION (GO) BONDS — 0.6% | Par Value | Value | ||||||
| Virginia State, Build America Bonds, Taxable, GO, | ||||||||
2.95%, due 06/01/2019 (Cost $99,929) | $ | 100,000 | $ | 103,972 | ||||
8
THE JAMESTOWN BALANCED FUND
SCHEDULE OF INVESTMENTS (Continued)
MORTGAGE-BACKED SECURITIES — 5.4% | Par Value | Value | ||||||
| Federal Home Loan Mortgage Corporation — 1.6% | ||||||||
Pool #A43942, 5.50%, due 03/01/2036 | $ | 111,676 | $ | 121,454 | ||||
Pool #A97047, 4.50%, due 02/01/2041 | 145,184 | 153,700 | ||||||
| 275,154 | ||||||||
| Federal National Mortgage Association — 3.7% | ||||||||
Pool #618465, 5.00%, due 12/01/2016 | 61,518 | 66,292 | ||||||
Pool #684231, 5.00%, due 01/01/2018 | 90,673 | 97,709 | ||||||
Pool #255455, 5.00%, due 10/01/2024 | 107,225 | 116,906 | ||||||
Pool #255702, 5.00%, due 05/01/2025 | 164,764 | 179,023 | ||||||
Pool #808413, 5.50%, due 01/01/2035 | 150,738 | 164,244 | ||||||
| 624,174 | ||||||||
| Government National Mortgage Association — 0.1% | ||||||||
Pool #781344, 6.50%, due 10/15/2031 | 16,751 | 19,036 | ||||||
Total Mortgage-Backed Securities (Cost $853,115) | $ | 918,364 | ||||||
CORPORATE BONDS — 14.7% | Par Value | Value | ||||||
| Consumer Discretionary — 0.6% | ||||||||
| Anheuser-Busch Companies, Inc., | ||||||||
4.50%, due 04/01/2018 | $ | 100,000 | $ | 108,613 | ||||
| Consumer Staples — 2.3% | ||||||||
| General Mills, Inc., | ||||||||
5.70%, due 02/15/2017 | 150,000 | 175,762 | ||||||
| PepsiCo, Inc., | ||||||||
4.65%, due 02/15/2013 | 200,000 | 210,867 | ||||||
| 386,629 | ||||||||
| Energy — 0.7% | ||||||||
| Shell International Finance B.V., | ||||||||
4.30%, due 09/22/2019 | 100,000 | 112,325 | ||||||
| Financials — 4.7% | ||||||||
| American Express Company, | ||||||||
4.875%, due 07/15/2013 | 150,000 | 157,534 | ||||||
| JPMorgan Chase & Company, | ||||||||
3.40%, due 06/24/2015 | 110,000 | 111,736 | ||||||
| Morgan Stanley, | ||||||||
5.30%, due 03/01/2013 | 250,000 | 252,087 | ||||||
| Northern Trust Corporation, | ||||||||
4.625%, due 05/01/2014 | 150,000 | 161,712 | ||||||
| PNC Funding Corporation, | ||||||||
5.125%, due 02/08/2020 | 110,000 | 121,756 | ||||||
| 804,825 | ||||||||
9
THE JAMESTOWN BALANCED FUND
SCHEDULE OF INVESTMENTS (Continued)
CORPORATE BONDS — 14.7% (Continued) | Par Value | Value | ||||||
| Health Care — 2.4% | ||||||||
| Amgen, Inc., | ||||||||
5.85%, due 06/01/2017 | $ | 150,000 | $ | 178,715 | ||||
| GlaxoSmithKline plc, | ||||||||
5.65%, due 05/15/2018 | 200,000 | 241,850 | ||||||
| 420,565 | ||||||||
| Industrials — 1.5% | ||||||||
| United Technologies Corporation, | ||||||||
6.10%, due 05/15/2012 | 250,000 | 258,021 | ||||||
| Materials — 0.2% | ||||||||
| E.I. du Pont de Nemours and Company, | ||||||||
5.875%, due 01/15/2014 | 26,000 | 28,662 | ||||||
| Telecommunication Services — 1.5% | ||||||||
| AT&T, Inc., | ||||||||
4.95%, due 01/15/2013 | 250,000 | 261,835 | ||||||
| Utilities — 0.8% | ||||||||
| Virginia Electric & Power Company, | ||||||||
5.00%, due 06/30/2019 | 125,000 | 144,210 | ||||||
Total Corporate Bonds (Cost $2,363,297) | $ | 2,525,685 | ||||||
MONEY MARKET FUNDS — 1.9% | Shares | Value | ||||||
Fidelity Institutional Money Market Portfolio - Select Class, 0.07% (b) (Cost $317,785) | 317,785 | $ | 317,785 | |||||
REPURCHASE AGREEMENTS — 10.3% | Par Value | Value | ||||||
U.S. Bank N.A., 0.01%, dated 09/30/2011, due 10/03/2011, repurchase proceeds: $1,765,307 (Cost $1,765,305) (c) | $ | 1,765,305 | $ | 1,765,305 | ||||
Total Investments at Value — 99.8% (Cost $14,786,710) | $ | 17,104,487 | ||||||
Other Assets in Excess of Liabilities — 0.2% | 27,507 | |||||||
Net Assets — 100.0% | $ | 17,131,994 | ||||||
| (a) | Non-income producing security. |
| (b) | Variable rate security. The rate shown is the 7-day effective yield as of September 30, 2011. |
| (c) | Repurchase agreement is fully collateralized by $1,665,883 FGLMC #G01543, 5.00%, due 05/01/2033. The aggregate market value of the collateral at September 30, 2011 was $1,800,727. |
| See accompanying notes to financial statements. |
10
THE JAMESTOWN EQUITY FUND
SCHEDULE OF INVESTMENTS
September 30, 2011 (Unaudited)
COMMON STOCKS — 85.0% | Shares | Value | ||||||
| Consumer Discretionary — 10.5% | ||||||||
Comcast Corporation - Class A | 21,500 | $ | 449,350 | |||||
Dollar Tree, Inc. (a) | 5,700 | 428,127 | ||||||
McDonald's Corporation | 4,000 | 351,280 | ||||||
TJX Companies, Inc. (The) | 8,150 | 452,081 | ||||||
Viacom, Inc. - Class B | 10,700 | 414,518 | ||||||
Yum! Brands, Inc. | 7,300 | 360,547 | ||||||
| 2,455,903 | ||||||||
| Consumer Staples — 10.3% | ||||||||
CVS Caremark Corporation | 14,200 | 476,836 | ||||||
Kimberly-Clark Corporation | 6,600 | 468,666 | ||||||
PepsiCo, Inc. | 10,350 | 640,665 | ||||||
Sysco Corporation | 8,900 | 230,510 | ||||||
Wal-Mart Stores, Inc. | 11,700 | 607,230 | ||||||
| 2,423,907 | ||||||||
| Energy — 11.1% | ||||||||
Apache Corporation | 2,500 | 200,600 | ||||||
Chevron Corporation | 5,400 | 499,608 | ||||||
ConocoPhillips | 6,800 | 430,576 | ||||||
Exxon Mobil Corporation | 3,500 | 254,205 | ||||||
Hess Corporation | 7,700 | 403,942 | ||||||
Marathon Oil Corporation | 11,200 | 241,696 | ||||||
Marathon Petroleum Corporation | 5,500 | 148,830 | ||||||
Noble Corporation (a) | 14,500 | 425,575 | ||||||
| 2,605,032 | ||||||||
| Financials — 10.8% | ||||||||
American Express Company | 9,000 | 404,100 | ||||||
Ameriprise Financial, Inc. | 8,900 | 350,304 | ||||||
Franklin Resources, Inc. | 3,850 | 368,214 | ||||||
JPMorgan Chase & Company | 16,100 | 484,932 | ||||||
MetLife, Inc. | 8,300 | 232,483 | ||||||
PNC Financial Services Group, Inc. | 9,000 | 433,710 | ||||||
Prudential Financial, Inc. | 5,600 | 262,416 | ||||||
| 2,536,159 | ||||||||
| Health Care — 11.8% | ||||||||
Abbott Laboratories | 10,100 | 516,514 | ||||||
Aetna, Inc. | 13,700 | 497,995 | ||||||
AmerisourceBergen Corporation | 12,600 | 469,602 | ||||||
McKesson Corporation | 3,200 | 232,640 | ||||||
Medco Health Solutions, Inc. (a) | 8,000 | 375,120 | ||||||
Thermo Fisher Scientific, Inc. (a) | 8,300 | 420,312 | ||||||
UnitedHealth Group, Inc. | 5,500 | 253,660 | ||||||
| 2,765,843 | ||||||||
11
THE JAMESTOWN EQUITY FUND
SCHEDULE OF INVESTMENTS (Continued)
COMMON STOCKS — 85.0% (Continued) | Shares | Value | ||||||
| Industrials — 10.8% | ||||||||
Dover Corporation | 10,200 | $ | 475,320 | |||||
Eaton Corporation | 11,000 | 390,500 | ||||||
General Dynamics Corporation | 4,200 | 238,938 | ||||||
General Electric Company | 31,500 | 480,060 | ||||||
Norfolk Southern Corporation | 7,800 | 475,956 | ||||||
United Technologies Corporation | 6,700 | 471,412 | ||||||
| 2,532,186 | ||||||||
| Information Technology — 19.7% | ||||||||
Apple, Inc. (a) | 2,550 | 972,009 | ||||||
Cisco Systems, Inc. | 26,000 | 402,740 | ||||||
EMC Corporation (a) | 21,200 | 444,988 | ||||||
Google, Inc. - Class A (a) | 1,000 | 514,380 | ||||||
Intel Corporation | 22,700 | 484,191 | ||||||
International Business Machines Corporation | 2,300 | 402,569 | ||||||
Microsoft Corporation | 19,500 | 485,355 | ||||||
Oracle Corporation | 16,300 | 468,462 | ||||||
QUALCOMM, Inc. | 9,400 | 457,122 | ||||||
| 4,631,816 | ||||||||
Total Common Stocks (Cost $16,691,270) | $ | 19,950,846 | ||||||
MONEY MARKET FUNDS — 1.0% | Shares | Value | ||||||
Fidelity Institutional Money Market Portfolio - Select Class, 0.07% (b) (Cost $228,238) | 228,238 | $ | 228,238 | |||||
REPURCHASE AGREEMENTS — 14.1% | Par Value | Value | ||||||
U.S. Bank N.A., 0.01%, dated 09/30/2011, due 10/03/2011, repurchase proceeds: $3,310,244 (Cost $3,310,241) (c) | $ | 3,310,241 | $ | 3,310,241 | ||||
Total Investments at Value — 100.1% (Cost $20,229,749) | $ | 23,489,325 | ||||||
Liabilities in Excess of Other Assets — (0.1%) | (34,414 | ) | ||||||
Net Assets — 100.0% | $ | 23,454,911 | ||||||
| (a) | Non-income producing security. |
| (b) | Variable rate security. The rate shown is the 7-day effective yield as of September 30, 2011. |
| (c) | Repurchase agreement is fully collateralized by $3,144,658 FGCI #G11649, 4.50%, due 02/01/2020. The aggregate market value of the collateral at September 30, 2011 was $3,376,455. |
| See accompanying notes to financial statements. |
12
THE JAMESTOWN TAX EXEMPT VIRGINIA FUND
SCHEDULE OF INVESTMENTS
September 30, 2011 (Unaudited)
VIRGINIA REVENUE AND GENERAL OBLIGATION (GO) BONDS — 94.9% | Par Value | Value | ||||||
| Arlington Co., Virginia, GO, | ||||||||
4.10%, due 11/01/2018 | $ | 500,000 | $ | 538,270 | ||||
| Capital Region Airport Commission, Virginia, Airport Revenue, | ||||||||
4.50%, due 07/01/2016 | 520,000 | 589,758 | ||||||
| Chesterfield Co., Virginia, GO, | ||||||||
5.00%, due 01/01/2020 | 700,000 | 808,353 | ||||||
| Fairfax Co., Virginia, Economic Dev. Authority, Revenue, | ||||||||
5.00%, due 06/01/2018 | 1,000,000 | 1,074,440 | ||||||
| Fairfax Co., Virginia, Industrial Dev. Authority, Revenue, | ||||||||
| 5.00%, due 05/15/2022 | 750,000 | 854,715 | ||||||
| Fauquier Co., Virginia, GO, | ||||||||
5.00%, due 07/01/2017 | 500,000 | 585,115 | ||||||
| Hampton Roads Sanitation District, Virginia, Wastewater, Revenue, | ||||||||
5.00%, due 04/01/2022 | 400,000 | 459,416 | ||||||
| Hampton, Virginia, GO, | ||||||||
| 5.00%, due 04/01/2020, | ||||||||
prerefunded 04/01/2015 @ 100 | 500,000 | 577,275 | ||||||
| Henrico Co., Virginia, Public Improvement, Series A, GO, | ||||||||
5.00%, due 12/01/2015 | 250,000 | 293,870 | ||||||
| Henrico Co., Virginia, Water & Sewer, Revenue, | ||||||||
5.00%, due 05/01/2020 | 350,000 | 422,464 | ||||||
5.00%, due 05/01/2022 | 430,000 | 507,894 | ||||||
| James City, Virginia, School District, GO, | ||||||||
5.00%, due 12/15/2018 | 500,000 | 578,495 | ||||||
| James City, Virginia, Service Authority, Water & Sewer, Revenue, | ||||||||
5.125%, due 01/15/2017 | 1,000,000 | 1,057,520 | ||||||
| Leesburg, Virginia, GO, | ||||||||
5.00%, due 09/15/2016 | 500,000 | 592,280 | ||||||
| Loudoun Co., Virginia, Industrial Dev. Authority, Public Facility Lease, Revenue, | ||||||||
| 5.00%, due 03/01/2019, | ||||||||
prerefunded 03/01/2013 @ 100 | 215,000 | 229,005 | ||||||
5.00%, due 03/01/2019 | 785,000 | 824,996 | ||||||
| Lynchburg, Virginia, GO, | ||||||||
5.00%, due 06/01/2015 | 500,000 | 576,570 | ||||||
| Lynchburg, Virginia, Public Improvement, Series A, GO, | ||||||||
5.00%, due 08/01/2019 | 625,000 | 764,412 | ||||||
| Manassas, Virginia, Public Improvement, Series D, GO, | ||||||||
5.00%, due 07/01/2019 | 250,000 | 303,108 | ||||||
| New Kent Co., Virginia, Economic Dev. Authority, Revenue, | ||||||||
5.00%, due 02/01/2019 | 500,000 | 566,045 | ||||||
| Norfolk, Virginia, GO, | ||||||||
4.50%, due 06/01/2015 | 500,000 | 549,320 | ||||||
13
THE JAMESTOWN TAX EXEMPT VIRGINIA FUND
SCHEDULE OF INVESTMENTS (Continued)
VIRGINIA REVENUE AND GENERAL OBLIGATION (GO) BONDS — 94.9% (Continued) | Par Value | Value | ||||||
| Norfolk, Virginia, Water, Revenue, | ||||||||
5.00%, due 11/01/2016 | $ | 1,000,000 | $ | 1,003,790 | ||||
| Portsmouth, Virginia, Series A, GO, | ||||||||
5.00%, due 04/01/2016 | 500,000 | 567,655 | ||||||
| Portsmouth, Virginia, Series D, GO, | ||||||||
4.00%, due 12/01/2017 | 215,000 | 246,706 | ||||||
| Prince William Co., Virginia, Lease Participation Certificates, | ||||||||
5.00%, due 10/01/2020 | 500,000 | 588,175 | ||||||
| Richmond, Virginia, Metropolitan Authority, Revenue, | ||||||||
5.25%, due 07/15/2014 | 1,000,000 | 1,102,450 | ||||||
| Southeastern Public Service Authority, Virginia, Revenue, | ||||||||
5.00%, due 07/01/2015, ETM | 1,000,000 | 1,128,550 | ||||||
| Spotsylvania Co., Virginia, GO, | ||||||||
5.00%, due 01/15/2016 | 500,000 | 545,635 | ||||||
| Spotsylvania Co., Virginia, Water & Sewer, Revenue, | ||||||||
5.00%, due 06/01/2026 | 500,000 | 540,810 | ||||||
| Suffolk, Virginia, Public Improvement, Series A, GO, | ||||||||
4.00%, due 08/01/2018 | 250,000 | 286,505 | ||||||
| University of Virginia, Revenue, | ||||||||
5.00%, due 06/01/2013 | 585,000 | 629,881 | ||||||
| Upper Occoquan, Virginia, Sewer Authority, Revenue, | ||||||||
5.15%, due 07/01/2020 | 250,000 | 297,790 | ||||||
| Virginia Beach, Virginia, Public Improvement, GO, | ||||||||
5.00%, due 06/01/2021 | 250,000 | 310,543 | ||||||
| Virginia Biotechnology Research Partnership Authority, Lease Revenue, | ||||||||
5.00%, due 09/01/2020 | 500,000 | 603,370 | ||||||
| Virginia College Building Authority, Educational Facilities, Revenue, | ||||||||
| 5.00%, due 02/01/2017, | ||||||||
prerefunded 02/01/2014 @ 100 | 500,000 | 552,895 | ||||||
5.00%, due 04/01/2017 | 500,000 | 554,170 | ||||||
5.00%, due 03/01/2019 | 250,000 | 296,752 | ||||||
| Virginia Commonwealth Transportation Board, Federal Highway Reimbursement Anticipation Note, Revenue, | ||||||||
5.00%, due 09/28/2015 | 500,000 | 581,880 | ||||||
| Virginia Polytechnic Institute & State University, Revenue, | ||||||||
5.00%, due 06/01/2016 | 500,000 | 555,615 | ||||||
| Virginia Small Business Financing Authority, Healthcare Facilities Revenue, | ||||||||
5.00%, due 11/01/2017 | 250,000 | 291,992 | ||||||
| Virginia State Public Building Authority, Public Facilities, Series D, Revenue, | ||||||||
5.00%, due 08/01/2016 | 1,000,000 | 1,117,320 | ||||||
| Virginia State Public Building Authority, Revenue, | ||||||||
5.00%, due 08/01/2012 | 185,000 | 192,354 | ||||||
14
THE JAMESTOWN TAX EXEMPT VIRGINIA FUND
SCHEDULE OF INVESTMENTS (Continued)
VIRGINIA REVENUE AND GENERAL OBLIGATION (GO) BONDS — 94.9% (Continued) | Par Value | Value | ||||||
| Virginia State Public School Authority, Series A, Revenue, | ||||||||
5.00%, due 08/01/2020 | $ | 585,000 | $ | 668,866 | ||||
| Virginia State Public School Authority, Series B, Revenue, | ||||||||
4.00%, due 08/01/2014 | 400,000 | 438,684 | ||||||
| Virginia State Public School Authority, Series B-1, Revenue, | ||||||||
5.00%, due 08/01/2018 | 500,000 | 606,915 | ||||||
| Virginia State Resources Authority, Clean Water, Revenue, | ||||||||
| 5.00%, due 10/01/2021 | 500,000 | 601,525 | ||||||
| Virginia State Resources Authority, Infrastructure, Series B, Revenue, | ||||||||
| 5.00%, due 11/01/2024 | 500,000 | 575,445 | ||||||
| Virginia State, Series B, GO, | ||||||||
5.00%, due 06/01/2012 | 500,000 | 515,945 | ||||||
5.00%, due 06/01/2017 | 250,000 | 301,245 | ||||||
Total Virginia Revenue and General Obligation (GO) Bonds (Cost $26,439,664) | $ | 28,456,784 | ||||||
WASHINGTON, D.C. REVENUE BONDS — 1.9% | Par Value | Value | ||||||
| Metropolitan Washington Airports Authority, Series C, Revenue, | ||||||||
5.00%, due 10/01/2022 (Cost $508,800) | $ | 500,000 | $ | 559,155 | ||||
EXCHANGE-TRADED FUNDS — 0.8% | Shares | Value | ||||||
SPDR Nuveen Barclays Capital Short Term Municipal Bond ETF (Cost $241,000) | 10,000 | $ | 243,500 | |||||
MONEY MARKET FUNDS — 1.3% | Shares | Value | ||||||
Fidelity Tax Exempt Portfolio - Class I, 0.01% (a) (Cost $388,319) | 388,319 | $ | 388,319 | |||||
Total Investments at Value — 98.9% (Cost $27,577,783) | $ | 29,647,758 | ||||||
Other Assets in Excess of Liabilities — 1.1% | 338,208 | |||||||
Net Assets — 100.0% | $ | 29,985,966 | ||||||
ETM - Escrowed to Maturity.
| (a) | Variable rate security. The rate shown is the 7-day effective yield as of September 30, 2011. |
See accompanying notes to financial statements.
15
THE JAMESTOWN FUNDS
STATEMENTS OF ASSETS AND LIABILITIES
September 30, 2011 (Unaudited)
The Jamestown Balanced Fund | The Jamestown Equity Fund | The Jamestown Tax Exempt Virginia Fund | ||||||||||
| ASSETS | ||||||||||||
| Investments in securities: | ||||||||||||
At acquisition cost | $ | 13,021,405 | $ | 16,919,508 | $ | 27,577,783 | ||||||
At value (Note 2) | $ | 15,339,182 | $ | 20,179,084 | $ | 29,647,758 | ||||||
Repurchase agreements (Note 2) | 1,765,305 | 3,310,241 | — | |||||||||
Dividends and interest receivable | 65,439 | 13,685 | 374,653 | |||||||||
Receivable for capital shares sold | 136 | 3,497 | — | |||||||||
Other assets | 3,131 | 10,917 | 8,412 | |||||||||
TOTAL ASSETS | 17,173,193 | 23,517,424 | 30,030,823 | |||||||||
| LIABILITIES | ||||||||||||
Distributions payable | 3,760 | — | 6,446 | |||||||||
Payable for investment securities purchased | — | 30,891 | — | |||||||||
Payable for capital shares redeemed | 11,178 | 10,112 | 21,137 | |||||||||
Accrued investment advisory fees (Note 4) | 9,462 | 13,078 | 7,895 | |||||||||
Payable to administrator (Note 4) | 4,515 | 4,515 | 4,115 | |||||||||
Other accrued expenses | 12,284 | 3,917 | 5,264 | |||||||||
TOTAL LIABILITIES | 41,199 | 62,513 | 44,857 | |||||||||
NET ASSETS | $ | 17,131,994 | $ | 23,454,911 | $ | 29,985,966 | ||||||
| Net assets consist of: | ||||||||||||
Paid-in capital | $ | 14,932,911 | $ | 21,699,851 | $ | 27,904,491 | ||||||
Accumulated (Distributions in excess of) net investment income | (25,069 | ) | 27,793 | — | ||||||||
Accumulated net realized gains (losses) from security transactions | (93,625 | ) | (1,532,309 | ) | 11,500 | |||||||
Net unrealized appreciation on investments | 2,317,777 | 3,259,576 | 2,069,975 | |||||||||
Net assets | $ | 17,131,994 | $ | 23,454,911 | $ | 29,985,966 | ||||||
| Shares of beneficial interest outstanding (unlimited number of shares authorized, $0.01 par value) | 1,439,178 | 1,646,951 | 2,836,997 | |||||||||
Net asset value, offering price and redemption price per share | $ | 11.90 | $ | 14.24 | $ | 10.57 | ||||||
See accompanying notes to financial statements.
16
THE JAMESTOWN FUNDS
STATEMENTS OF OPERATIONS
Six Months Ended September 30, 2011 (Unaudited)
The Jamestown Balanced Fund | The Jamestown Equity Fund | The Jamestown Tax Exempt Virginia Fund | ||||||||||
| INVESTMENT INCOME | ||||||||||||
Dividends | $ | 111,426 | $ | 210,727 | $ | 1,850 | ||||||
Foreign withholding taxes on dividends | (169 | ) | (325 | ) | — | |||||||
Interest | 115,903 | 68 | 520,349 | |||||||||
TOTAL INVESTMENT INCOME | 227,160 | 210,470 | 522,199 | |||||||||
| EXPENSES | ||||||||||||
Investment advisory fees (Note 4) | 65,621 | 88,770 | 60,720 | |||||||||
Administration fees (Note 4) | 24,000 | 24,000 | 22,082 | |||||||||
Professional fees | 10,765 | 9,045 | 7,568 | |||||||||
Trustees’ fees and expenses | 5,418 | 5,418 | 5,418 | |||||||||
Custodian and bank service fees | 4,263 | 5,595 | 2,617 | |||||||||
Compliance fees (Note 4) | 3,100 | 3,100 | 3,100 | |||||||||
Pricing costs | 2,785 | 586 | 4,029 | |||||||||
Printing of shareholder reports | 2,153 | 3,654 | 1,417 | |||||||||
Registration fees | 2,061 | 2,779 | 1,620 | |||||||||
Postage and supplies | 1,480 | 1,330 | 961 | |||||||||
Insurance expense | 1,034 | 1,326 | 1,388 | |||||||||
Other expenses | 2,624 | 4,187 | 5,966 | |||||||||
TOTAL EXPENSES | 125,304 | 149,790 | 116,886 | |||||||||
Fees voluntarily waived by the Adviser (Note 4) | — | — | (12,144 | ) | ||||||||
| Expenses reimbursed through a directed brokerage arrangement (Note 5) | (6,000 | ) | (6,000 | ) | — | |||||||
NET EXPENSES | 119,304 | 143,790 | 104,742 | |||||||||
NET INVESTMENT INCOME | 107,856 | 66,680 | 417,457 | |||||||||
| REALIZED AND UNREALIZED GAINS (LOSSES) ON INVESTMENTS | ||||||||||||
Net realized gains on security transactions | 303,203 | 125,241 | 10,768 | |||||||||
Net change in unrealized appreciation/ depreciation on investments | (2,178,686 | ) | (3,985,349 | ) | 922,502 | |||||||
| NET REALIZED AND UNREALIZED GAINS (LOSSES) ON INVESTMENTS | (1,875,483 | ) | (3,860,108 | ) | 933,270 | |||||||
| NET INCREASE (DECREASE) IN NET ASSETS FROM OPERATIONS | $ | (1,767,627 | ) | $ | (3,793,428 | ) | $ | 1,350,727 | ||||
See accompanying notes to financial statements.
17
THE JAMESTOWN FUNDS
STATEMENTS OF CHANGES IN NET ASSETS
The Jamestown Balanced Fund | The Jamestown Equity Fund | |||||||||||||||
Six Months Ended Sept. 30, 2011 (Unaudited) | Year Ended March 31, 2011 | Six Months Ended Sept. 30, 2011 (Unaudited) | Year Ended March 31, 2011 | |||||||||||||
| FROM OPERATIONS | ||||||||||||||||
Net investment income | $ | 107,856 | $ | 275,933 | $ | 66,680 | $ | 146,142 | ||||||||
Net realized gains on security transactions | 303,203 | 1,442,653 | 125,241 | 2,063,344 | ||||||||||||
| Net change in unrealized appreciation/ depreciation on investments | (2,178,686 | ) | 297,662 | (3,985,349 | ) | 1,218,908 | ||||||||||
Net increase (decrease) in net assets from operations | (1,767,627 | ) | 2,016,248 | (3,793,428 | ) | 3,428,394 | ||||||||||
| DISTRIBUTIONS TO SHAREHOLDERS | ||||||||||||||||
From net investment income | (114,302 | ) | (294,842 | ) | (64,502 | ) | (163,723 | ) | ||||||||
| FROM CAPITAL SHARE TRANSACTIONS | ||||||||||||||||
Proceeds from shares sold | 4,509 | 35,385 | 458,667 | 2,712,183 | ||||||||||||
| Net asset value of shares issued in reinvestment of distributions to shareholders | 105,589 | 260,251 | 61,479 | 156,040 | ||||||||||||
Payments for shares redeemed | (2,427,276 | ) | (2,869,410 | ) | (1,566,698 | ) | (4,307,138 | ) | ||||||||
| Net decrease in net assets from capital share transactions | (2,317,178 | ) | (2,573,774 | ) | (1,046,552 | ) | (1,438,915 | ) | ||||||||
TOTAL INCREASE (DECREASE) IN NET ASSETS | (4,199,107 | ) | (852,368 | ) | (4,904,482 | ) | 1,825,756 | |||||||||
| NET ASSETS | ||||||||||||||||
Beginning of period | 21,331,101 | 22,183,469 | 28,359,393 | 26,533,637 | ||||||||||||
End of period | $ | 17,131,994 | $ | 21,331,101 | $ | 23,454,911 | $ | 28,359,393 | ||||||||
| ACCUMULATED (DISTRIBUTIONS IN EXCESS OF) NET INVESTMENT INCOME | $ | (25,069 | ) | $ | (27,043 | ) | $ | 27,793 | $ | 25,615 | ||||||
| CAPITAL SHARE ACTIVITY | ||||||||||||||||
Shares sold | 342 | 2,932 | 27,976 | 180,359 | ||||||||||||
Shares reinvested | 8,391 | 21,529 | 3,683 | 10,779 | ||||||||||||
Shares redeemed | (190,091 | ) | (235,155 | ) | (99,792 | ) | (284,981 | ) | ||||||||
Net decrease in shares outstanding | (181,358 | ) | (210,694 | ) | (68,133 | ) | (93,843 | ) | ||||||||
Shares outstanding, beginning of period | 1,620,536 | 1,831,230 | 1,715,084 | 1,808,927 | ||||||||||||
Shares outstanding, end of period | 1,439,178 | 1,620,536 | 1,646,951 | 1,715,084 | ||||||||||||
See accompanying notes to financial statements.
18
THE JAMESTOWN FUNDS
STATEMENTS OF CHANGES IN NET ASSETS
The Jamestown Tax Exempt Virginia Fund | ||||||||
Six Months Ended Sept. 30, 2011 (Unaudited) | Year Ended March 31, 2011 | |||||||
| FROM OPERATIONS | ||||||||
Net investment income | $ | 417,457 | $ | 877,394 | ||||
Net realized gains on security transactions | 10,768 | 53,155 | ||||||
| Net change in unrealized appreciation/depreciation on investments | 922,502 | (171,596 | ) | |||||
Net increase in net assets from operations | 1,350,727 | 758,953 | ||||||
| DISTRIBUTIONS TO SHAREHOLDERS | ||||||||
From net investment income | (417,457 | ) | (877,910 | ) | ||||
| From net realized gains from security transactions | — | (71,952 | ) | |||||
| Decrease in net assets from distributions to shareholders | (417,457 | ) | (949,862 | ) | ||||
| FROM CAPITAL SHARE TRANSACTIONS | ||||||||
Proceeds from shares sold | 590,612 | 1,686,867 | ||||||
Net asset value of shares issued in reinvestment of distributions to shareholders | 358,767 | 806,846 | ||||||
Payments for shares redeemed | (2,265,157 | ) | (4,838,925 | ) | ||||
| Net decrease in net assets from capital share transactions | (1,315,778 | ) | (2,345,212 | ) | ||||
TOTAL DECREASE IN NET ASSETS | (382,508 | ) | (2,536,121 | ) | ||||
| NET ASSETS | ||||||||
Beginning of period | 30,368,474 | 32,904,595 | ||||||
End of period | $ | 29,985,966 | $ | 30,368,474 | ||||
| ACCUMULATED NET INVESTMENT INCOME | $ | — | $ | — | ||||
| CAPITAL SHARE ACTIVITY | ||||||||
Shares sold | 56,083 | 161,718 | ||||||
Shares reinvested | 34,247 | 77,402 | ||||||
Shares redeemed | (216,135 | ) | (462,738 | ) | ||||
Net decrease in shares outstanding | (125,805 | ) | (223,618 | ) | ||||
Shares outstanding, beginning of period | 2,962,802 | 3,186,420 | ||||||
Shares outstanding, end of period | 2,836,997 | 2,962,802 | ||||||
See accompanying notes to financial statements.
19
THE JAMESTOWN BALANCED FUND
FINANCIAL HIGHLIGHTS
Selected Per Share Data and Ratios for a Share Outstanding Throughout Each Period | ||||||||||||||||||||||||
Six Months Ended Sept. 30, 2011 | Years Ended March 31, | |||||||||||||||||||||||
| (Unaudited) | 2011 | 2010 | 2009 | 2008 | 2007 | |||||||||||||||||||
Net asset value at beginning of period | $ | 13.16 | $ | 12.11 | $ | 10.09 | $ | 12.95 | $ | 14.53 | $ | 14.97 | ||||||||||||
Income (loss) from investment operations: | ||||||||||||||||||||||||
Net investment income | 0.07 | 0.16 | 0.22 | 0.25 | 0.26 | 0.27 | ||||||||||||||||||
| Net realized and unrealized gains (losses) on investments | (1.25 | ) | 1.06 | 2.04 | (2.91 | ) | 0.27 | 0.69 | ||||||||||||||||
Total from investment operations | (1.18 | ) | 1.22 | 2.26 | (2.66 | ) | 0.53 | 0.96 | ||||||||||||||||
| Less distributions: | ||||||||||||||||||||||||
Dividends from net investment income | (0.08 | ) | (0.17 | ) | (0.24 | ) | (0.20 | ) | (0.28 | ) | (0.29 | ) | ||||||||||||
Distributions from net realized gains | — | — | — | — | (1.83 | ) | (1.11 | ) | ||||||||||||||||
Total distributions | (0.08 | ) | (0.17 | ) | (0.24 | ) | (0.20 | ) | (2.11 | ) | (1.40 | ) | ||||||||||||
Net asset value at end of period | $ | 11.90 | $ | 13.16 | $ | 12.11 | $ | 10.09 | $ | 12.95 | $ | 14.53 | ||||||||||||
Total return (a) | (9.02% | )(b) | 10.24% | 22.56% | (20.75% | ) | 2.97% | 6.57% | ||||||||||||||||
Net assets at end of period (000’s) | $ | 17,132 | $ | 21,331 | $ | 22,183 | $ | 21,072 | $ | 32,058 | $ | 45,460 | ||||||||||||
Ratio of total expenses to average net assets | 1.24% | (c) | 1.24% | 1.20% | 1.14% | 1.01% | 0.94% | |||||||||||||||||
Ratio of net expenses to average net assets (d) | 1.18% | (c) | 1.18% | 1.11% | 1.05% | 0.95% | 0.89% | |||||||||||||||||
Ratio of net investment income to average net assets (d) | 1.07% | (c) | 1.31% | 1.98% | 2.10% | 1.71% | 1.80% | |||||||||||||||||
Portfolio turnover rate | 10% | (b) | 30% | 40% | 43% | 30% | 40% | |||||||||||||||||
| (a) | Total return is a measure of the change in value of an investment in the Fund over the period covered, which assumes any dividends or capital gains distributions are reinvested in shares of the Fund. Returns do not reflect the deduction of taxes a shareholder would pay on Fund distributions or the redemption of Fund shares. |
| (b) | Not annualized. |
| (c) | Annualized. |
| (d) | Ratios were determined based on net expenses after expense reimbursements through a directed brokerage arrangement (Note 5). |
| See accompanying notes to financial statements. |
20
THE JAMESTOWN EQUITY FUND
FINANCIAL HIGHLIGHTS
Selected Per Share Data and Ratios for a Share Outstanding Throughout Each Period | ||||||||||||||||||||||||
Six Months Ended Sept. 30, 2011 | Years Ended March 31, | |||||||||||||||||||||||
| (Unaudited) | 2011 | 2010 | 2009 | 2008 | 2007 | |||||||||||||||||||
Net asset value at beginning of period | $ | 16.54 | $ | 14.67 | $ | 11.01 | $ | 16.68 | $ | 18.12 | $ | 18.45 | ||||||||||||
Income (loss) from investment operations: | ||||||||||||||||||||||||
Net investment income | 0.04 | 0.09 | 0.10 | 0.08 | 0.08 | 0.10 | ||||||||||||||||||
| Net realized and unrealized gains (losses) on investments | (2.30 | ) | 1.87 | 3.64 | (5.68 | ) | 0.20 | 1.15 | ||||||||||||||||
Total from investment operations | (2.26 | ) | 1.96 | 3.74 | (5.60 | ) | 0.28 | 1.25 | ||||||||||||||||
| Less distributions: | ||||||||||||||||||||||||
Dividends from net investment income | (0.04 | ) | (0.09 | ) | (0.08 | ) | — | (0.08 | ) | (0.10 | ) | |||||||||||||
Distributions from net realized gains | — | — | — | — | (1.50 | ) | (1.48 | ) | ||||||||||||||||
Return of capital | — | — | — | (0.07 | ) | (0.14 | ) | — | ||||||||||||||||
Total distributions | (0.04 | ) | (0.09 | ) | (0.08 | ) | (0.07 | ) | (1.72 | ) | (1.58 | ) | ||||||||||||
Net asset value at end of period | $ | 14.24 | $ | 16.54 | $ | 14.67 | $ | 11.01 | $ | 16.68 | $ | 18.12 | ||||||||||||
Total return (a) | (13.71% | )(b) | 13.48% | 33.96% | (33.63% | ) | 0.94% | 6.92% | ||||||||||||||||
Net assets at end of period (000’s) | $ | 23,455 | $ | 28,359 | $ | 26,534 | $ | 18,790 | $ | 32,317 | $ | 37,128 | ||||||||||||
Ratio of total expenses to average net assets | 1.10% | (c) | 1.13% | 1.16% | 1.15% | 0.99% | 0.97% | |||||||||||||||||
Ratio of net expenses to average net assets (d) | 1.05% | (c) | 1.09% | 1.12% | 1.10% | 0.95% | 0.91% | |||||||||||||||||
Ratio of net investment income to average net assets (d) | 0.49% | (c) | 0.56% | 0.78% | 0.56% | 0.38% | 0.52% | |||||||||||||||||
Portfolio turnover rate | 14% | (b) | 49% | 59% | 69% | 46% | 53% | |||||||||||||||||
| (a) | Total return is a measure of the change in value of an investment in the Fund over the period covered, which assumes any dividends or capital gains distributions are reinvested in shares of the Fund. Returns do not reflect the deduction of taxes a shareholder would pay on Fund distributions or the redemption of Fund shares. |
| (b) | Not annualized. |
| (c) | Annualized. |
| (d) | Ratios were determined based on net expenses after expense reimbursements through a directed brokerage arrangement (Note 5). |
| See accompanying notes to financial statements. |
21
THE JAMESTOWN TAX EXEMPT VIRGINIA FUND
FINANCIAL HIGHLIGHTS
Selected Per Share Data and Ratios for a Share Outstanding Throughout Each Period | ||||||||||||||||||||||||
Six Months Ended Sept. 30, 2011 | Years Ended March 31, | |||||||||||||||||||||||
| (Unaudited) | 2011 | 2010 | 2009 | 2008 | 2007 | |||||||||||||||||||
Net asset value at beginning of period | $ | 10.25 | $ | 10.33 | $ | 10.24 | $ | 10.10 | $ | 10.06 | $ | 10.05 | ||||||||||||
Income (loss) from investment operations: | ||||||||||||||||||||||||
Net investment income | 0.14 | �� | 0.29 | 0.30 | 0.34 | 0.36 | 0.37 | |||||||||||||||||
| Net realized and unrealized gains (losses) on investments | 0.32 | (0.06 | ) | 0.11 | 0.13 | 0.05 | 0.01 | |||||||||||||||||
Total from investment operations | 0.46 | 0.23 | 0.41 | 0.47 | 0.41 | 0.38 | ||||||||||||||||||
| Less distributions: | ||||||||||||||||||||||||
Dividends from net investment income | (0.14 | ) | (0.29 | ) | (0.31 | ) | (0.33 | ) | (0.36 | ) | (0.36 | ) | ||||||||||||
Distributions from net realized gains | — | (0.02 | ) | (0.01 | ) | (0.00 | )(a) | (0.01 | ) | (0.01 | ) | |||||||||||||
Total distributions | (0.14 | ) | (0.31 | ) | (0.32 | ) | (0.33 | ) | (0.37 | ) | (0.37 | ) | ||||||||||||
Net asset value at end of period | $ | 10.57 | $ | 10.25 | $ | 10.33 | $ | 10.24 | $ | 10.10 | $ | 10.06 | ||||||||||||
Total return (b) | 4.55% | (c) | 2.26% | 4.04% | 4.77% | 4.09% | 3.85% | |||||||||||||||||
Net assets at end of period (000’s) | $ | 29,986 | $ | 30,368 | $ | 32,905 | $ | 32,730 | $ | 29,093 | $ | 28,981 | ||||||||||||
Ratio of total expenses to average net assets | 0.77% | (d) | 0.76% | 0.75% | 0.77% | 0.77% | 0.75% | |||||||||||||||||
Ratio of net expenses to average net assets (e) | 0.69% | (d) | 0.69% | 0.69% | 0.69% | 0.69% | 0.69% | |||||||||||||||||
Ratio of net investment income to average net assets (e) | 2.75% | (d) | 2.78% | 2.89% | 3.31% | 3.54% | 3.66% | |||||||||||||||||
Portfolio turnover rate | 0% | 8% | 16% | 10% | 13% | 10% | ||||||||||||||||||
| (a) | Amount rounds to less than a penny per share. |
| (b) | Total return is a measure of the change in value of an investment in the Fund over the period covered, which assumes any dividends or capital gains distributions are reinvested in shares of the Fund. Returns do not reflect the deduction of taxes a shareholder would pay on Fund distributions or the redemption of Fund shares. |
| (c) | Not annualized. |
| (d) | Annualized. |
| (e) | Ratios were determined after voluntary advisory fee waivers by the Adviser (Note 4). |
See accompanying notes to financial statements.
22
THE JAMESTOWN FUNDS
NOTES TO FINANCIAL STATEMENTS
September 30, 2011 (Unaudited)
1. Organization
The Jamestown Balanced Fund, The Jamestown Equity Fund and The Jamestown Tax Exempt Virginia Fund (individually, a “Fund,” and, collectively, the “Funds”) are each a no-load series of Williamsburg Investment Trust (the “Trust”), an open-end management investment company registered under the Investment Company Act of 1940. The Trust was organized as a Massachusetts business trust on July 18, 1988. Other series of the Trust are not included in this report.
The Jamestown Balanced Fund’s investment objectives are long-term growth of capital and income.
The Jamestown Equity Fund’s investment objective is long-term growth of capital.
The Jamestown Tax Exempt Virginia Fund’s investment objectives are to provide current income exempt from federal income taxes and from the personal income taxes of Virginia, to preserve capital, to limit credit risk and to take advantage of opportunities to increase and enhance the value of a shareholder’s investment.
2. Significant Accounting Policies
The following is a summary of the Funds’ significant accounting policies. The policies are in conformity with accounting principles generally accepted in the United States of America (“GAAP”).
Securities valuation — The Funds’ portfolio securities are valued as of the close of business of the regular session of the New York Stock Exchange (normally 4:00 p.m., Eastern time). Securities traded on a national stock exchange are generally valued based upon the closing price on the principal exchange where the security is traded. Securities which are quoted by NASDAQ are valued at the NASDAQ Official Closing Price. Securities which are traded over-the-counter are valued at the last sales price, if available, otherwise, at the last quoted bid price. It is expected that fixed income securities will ordinarily be traded in the over-the-counter market, and common stocks will ordinarily be traded on a national securities exchange, but may also be traded in the over-the-counter market. Short-term instruments (those with remaining maturities of 60 days or less) may be valued at amortized cost, which approximates market value.
When market quotations are not readily available, securities may be valued on the basis of prices provided by an independent pricing service. The prices provided by the pricing service are determined with consideration given to institutional bid and last sale prices and take into account securities prices, yields, maturities, call features, ratings, institutional trading in similar groups of securities and developments related to specific securities. If a pricing service cannot provide a valuation, securities will be valued in good faith at fair value using methods consistent with those established by and under the general supervision of the Board of Trustees and will be classified as Level 2 or 3 (see below) within the fair value hierarchy, depending on the inputs used. Such methods of fair valuation may include, but are not limited to: multiple of earnings, multiple of book value, discount from market of a similar freely traded security, purchase price of the security, subsequent private transactions in the security or related securities, or a combination of these and other factors.
23
THE JAMESTOWN FUNDS
NOTES TO FINANCIAL STATEMENTS (Continued)
GAAP establishes a single authoritative definition of fair value, sets out a framework for measuring fair value and requires additional disclosures about fair value measurements.
Various inputs are used in determining the value of each Fund’s investments. These inputs are summarized in the three broad levels listed below:
• Level 1 – quoted prices in active markets for identical securities
• Level 2 – other significant observable inputs
• Level 3 – significant unobservable inputs
For example, fixed income securities and repurchase agreements held by the Funds are classified as Level 2 since values are based on prices provided by an independent pricing service that utilizes various “other significant observable inputs” including bid and ask quotations, prices of similar securities and interest rates, among other factors.
The inputs or methodology used for valuing securities are not necessarily an indication of the risks associated with investing in those securities. The inputs used to measure fair value may fall into different levels of the fair value hierarchy. In such cases, for disclosure purposes, the level in the fair value hierarchy within which the fair value measurement falls in its entirety is determined based on the lowest level input that is significant to the fair value measurement.
The following is a summary of the inputs used to value each Fund’s investments as of September 30, 2011 by security type:
The Jamestown Balanced Fund | Level 1 | Level 2 | Level 3 | Total | ||||||||||||
Common Stocks | $ | 9,833,137 | $ | — | $ | — | $ | 9,833,137 | ||||||||
U.S. Treasury & Government Agency Obligations | — | 1,640,239 | — | 1,640,239 | ||||||||||||
Municipal Bonds | — | 103,972 | — | 103,972 | ||||||||||||
Mortgage-Backed Securities | — | 918,364 | — | 918,364 | ||||||||||||
Corporate Bonds | — | 2,525,685 | — | 2,525,685 | ||||||||||||
Money Market Funds | 317,785 | — | — | 317,785 | ||||||||||||
Repurchase Agreements | — | 1,765,305 | — | 1,765,305 | ||||||||||||
Total | $ | 10,150,922 | $ | 6,953,565 | $ | — | $ | 17,104,487 | ||||||||
The Jamestown Equity Fund | Level 1 | Level 2 | Level 3 | Total | ||||||||||||
Common Stocks | $ | 19,950,846 | $ | — | $ | — | $ | 19,950,846 | ||||||||
Money Market Funds | 228,238 | — | — | 228,238 | ||||||||||||
Repurchase Agreements | — | 3,310,241 | — | 3,310,241 | ||||||||||||
Total | $ | 20,179,084 | $ | 3,310,241 | $ | — | $ | 23,489,325 | ||||||||
24
THE JAMESTOWN FUNDS
NOTES TO FINANCIAL STATEMENTS (Continued)
The Jamestown Tax Exempt Virginia Fund | Level 1 | Level 2 | Level 3 | Total | ||||||||||||
Municipal Bonds | $ | — | $ | 29,015,939 | $ | — | $ | 29,015,939 | ||||||||
Exchange-Traded Funds | 243,500 | — | — | 243,500 | ||||||||||||
Money Market Funds | 388,319 | — | — | 388,319 | ||||||||||||
Total | $ | 631,819 | $ | 29,015,939 | $ | — | $ | 29,647,758 | ||||||||
Refer to The Jamestown Balanced Fund’s and The Jamestown Equity Fund’s Schedules of Investments for a listing of the common stocks and corporate bonds valued using Level 1 and Level 2 inputs by sector type. During the six months ended September 30, 2011, the Funds did not have any significant transfers in and out of any Level. There were no Level 3 securities or derivative instruments held by the Funds during the six months ended or as of September 30, 2011. It is the Funds’ policy to recognize transfers into and out of any Level at the end of the reporting period.
Repurchase agreements — The Funds may enter into repurchase agreements. A repurchase agreement, which is collateralized by U.S. Government obligations, is valued at cost which, together with accrued interest, approximates market value. At the time a Fund enters into a repurchase agreement, the seller agrees that the value of the underlying securities, including accrued interest, will at all times be equal to or exceed the face amount of the repurchase agreement. In addition, the Funds actively monitor and seek additional collateral, as needed. If the seller defaults, the fair value of the collateral may decline and realization of the collateral by the Funds may be delayed or limited.
Share valuation — The net asset value per share of each Fund is calculated daily by dividing the total value of each Fund’s assets, less liabilities, by the number of shares outstanding. The offering price and redemption price per share of each Fund is equal to the net asset value per share.
Investment income — Interest income is accrued as earned. Dividend income is recorded on the ex-dividend date. Discounts and premiums on fixed income securities purchased are amortized using the interest method.
Distributions to shareholders — Dividends arising from net investment income, if any, are declared and paid quarterly to shareholders of The Jamestown Balanced Fund and The Jamestown Equity Fund. Dividends arising from net investment income are declared daily and paid monthly to shareholders of The Jamestown Tax Exempt Virginia Fund. Net realized short-term capital gains, if any, may be distributed throughout the year and net realized long-term capital gains, if any, are distributed at least once each year. The amount of distributions from net investment income and net realized gains are determined in accordance with federal income tax regulations which may differ from GAAP. These “book/tax” differences are either temporary or permanent in nature.
25
THE JAMESTOWN FUNDS
NOTES TO FINANCIAL STATEMENTS (Continued)
The tax character of distributions paid during the periods ended September 30, 2011 and March 31, 2011 was as follows:
Period Ended | Ordinary Income | Long-Term Capital Gains | Exempt- Interest Dividends | Total Distributions | |||||||||||||
| The Jamestown Balanced Fund | 9/30/11 | $ | 114,302 | $ | — | $ | — | $ | 114,302 | ||||||||
| 3/31/11 | $ | 294,842 | $ | — | $ | — | $ | 294,842 | |||||||||
| The Jamestown Equity Fund | 9/30/11 | $ | 64,502 | $ | — | $ | — | $ | 64,502 | ||||||||
| 3/31/11 | $ | 163,723 | $ | — | $ | — | $ | 163,723 | |||||||||
| The Jamestown Tax Exempt Virginia Fund | 9/30/11 | $ | — | $ | — | $ | 417,457 | $ | 417,457 | ||||||||
| 3/31/11 | $ | — | $ | 71,952 | $ | 877,910 | $ | 949,862 | |||||||||
Security transactions — Security transactions are accounted for on trade date for financial reporting purposes. Gains and losses on securities sold are determined on a specific identification basis.
Securities traded on a “to-be-announced” basis — The Jamestown Balanced Fund may trade securities on a “to-be-announced” (“TBA”) basis. In a TBA transaction, the Fund has committed to purchase securities for which all specific information is not yet known at the time of the trade, particularly the face amount in mortgage-backed securities transactions. Securities purchased on a TBA basis are not settled until they are delivered to the Fund, normally 15 to 45 days later. These transactions are subject to market fluctuations and their current value is determined in the same manner as for other portfolio securities.
Common expenses — Common expenses of the Trust are allocated among the series of the Trust based on relative net assets of each series or the nature of the services performed and the relative applicability to each series.
Estimates — The preparation of financial statements in conformity with GAAP requires management to make estimates and assumptions that affect the reported amounts of assets and liabilities and the disclosure of contingent assets and liabilities as of the date of the financial statements and the reported amounts of income and expenses during the reporting period. Actual results could differ from those estimates.
Federal income tax — It is each Fund’s policy to comply with the special provisions of Subchapter M of the Internal Revenue Code applicable to regulated investment companies. As provided therein, in any fiscal year in which a Fund so qualifies and distributes at least 90% of its taxable net income, the Fund (but not the shareholders) will be relieved of federal income tax on the income distributed. Accordingly, no provision for income taxes has been made.
In order to avoid imposition of the excise tax applicable to regulated investment companies, it is also each Fund’s intention to declare as dividends in each calendar year at least 98% of its net investment income (earned during the calendar year) and 98.2% of its net realized capital gains (earned during the twelve months ended October 31) plus undistributed amounts from prior years.
26
THE JAMESTOWN FUNDS
NOTES TO FINANCIAL STATEMENTS (Continued)
The tax character of distributable earnings at September 30, 2011 was as follows:
The Jamestown Balanced Fund | The Jamestown Equity Fund | The Jamestown Tax Exempt Virginia Fund | ||||||||||
Cost of portfolio investments | $ | 14,837,412 | $ | 20,289,827 | $ | 27,577,783 | ||||||
Gross unrealized appreciation | $ | 2,704,078 | $ | 4,140,271 | $ | 2,069,975 | ||||||
Gross unrealized depreciation | (437,003 | ) | (940,773 | ) | — | |||||||
| Net unrealized appreciation on investments | 2,267,075 | 3,199,498 | 2,069,975 | |||||||||
Accumulated ordinary income | 3,943 | 27,793 | 121 | |||||||||
Accumulated tax exempt income | — | — | 6,446 | |||||||||
Undistributed long-term gains | — | — | 611 | |||||||||
Capital loss carryforward | (370,879 | ) | (1,568,139 | ) | — | |||||||
Other gains | 302,704 | 95,908 | 10,768 | |||||||||
Other temporary differences | (3,760 | ) | — | (6,446 | ) | |||||||
Total distributable earnings | $ | 2,199,083 | $ | 1,755,060 | $ | 2,081,475 | ||||||
The difference between the federal income tax cost of portfolio investments and the financial statement cost for The Jamestown Balanced Fund and The Jamestown Equity Fund is due to certain timing differences in the recognition of capital gains or losses under income tax regulations and GAAP. These “book/tax” differences are temporary in nature and are primarily due to the tax deferral of losses on wash sales and/or differing methods in the amortization of market discount and premium on fixed income securities.
As of March 31, 2011, The Jamestown Balanced Fund and The Jamestown Equity Fund had the following capital loss carryforward for federal income tax purposes:
Amount | Expires March 31, | |||||||
| The Jamestown Balanced Fund | $ | 370,879 | 2018 | |||||
| The Jamestown Equity Fund | $ | 1,568,139 | 2018 | |||||
These capital loss carryforwards may be utilized in the current and future years to offset net realized capital gains, if any, prior to distribution to shareholders.
For the six months ended September 30, 2011, The Jamestown Balanced Fund reclassified $8,420 of distributions in excess of net investment income against accumulated net realized losses from security transactions on the Statements of Assets and Liabilities due to permanent differences in the recognition of capital gains or losses under income tax regulations and GAAP. These differences are primarily due to the tax treatment of certain debt obligations and paydown adjustments. Such reclassification had no effect on the Fund’s net assets or net asset value per share.
27
THE JAMESTOWN FUNDS
NOTES TO FINANCIAL STATEMENTS (Continued)
The Funds recognize the tax benefits or expenses of uncertain tax positions only when the position is “more likely than not” to be sustained assuming examination by tax authorities. Management has reviewed the tax positions taken on Federal income tax returns for all open tax years (tax years ended March 31, 2007 through March 31, 2011) of each Fund and has concluded that no provision for unrecognized tax benefits or expenses is required in these financial statements.
3. Investment Transactions
Investment transactions, other than short-term investments and U.S. government securities, were as follows for the six months ended September 30, 2011:
The Jamestown Balanced Fund | The Jamestown Equity Fund | The Jamestown Tax Exempt Virginia Fund | ||||||||||
Purchase of investment securities | $ | 1,689,321 | $ | 3,640,787 | $ | — | ||||||
Proceeds from sales and maturities of investment securities | $ | 4,654,551 | $ | 6,862,303 | $ | 469,980 | ||||||
4. Transactions with Affiliates
INVESTMENT ADVISORY AGREEMENT
Each Fund’s investments are managed by Lowe, Brockenbrough & Company, Inc. (the “Adviser”) under the terms of an Investment Advisory Agreement. The Jamestown Balanced Fund pays the Adviser a fee, which is computed and accrued daily and paid monthly, at an annual rate of .65% of its average daily net assets up to $250 million, .60% of the next $250 million of such assets and .55% of such assets in excess of $500 million. The Jamestown Equity Fund pays the Adviser a fee at an annual rate of .65% of its average daily net assets up to $500 million and .55% of such assets in excess of $500 million. The Jamestown Tax Exempt Virginia Fund pays the Adviser a fee at an annual rate of .40% of its average daily net assets up to $250 million, .35% of the next $250 million of such assets and .30% of such assets in excess of $500 million. Certain Trustees and officers of the Trust are also officers of the Adviser.
During the six months ended September 30, 2011, the Adviser voluntarily undertook to limit the total annual operating expenses of The Jamestown Tax Exempt Virginia Fund to .69% of average daily net assets. Accordingly, the Adviser voluntarily waived $12,144 of its investment advisory fees during the six months ended September 30, 2011.
MUTUAL FUND SERVICES AGREEMENT
Under the terms of a Mutual Fund Services Agreement between the Trust and Ultimus Fund Solutions, LLC (“Ultimus”), Ultimus provides administrative, pricing, accounting, dividend disbursing, shareholder servicing and transfer agent services for the Funds. For these services, Ultimus receives a monthly fee from each Fund at an annual rate of .15% of its average daily net assets up to $25 million; .125% of the next $25 million of such assets; and .10% of such assets in excess of $50 million. The Jamestown Balanced Fund and The Jamestown Equity Fund are
28
THE JAMESTOWN FUNDS
NOTES TO FINANCIAL STATEMENTS (Continued)
each subject to a minimum monthly fee of $4,000. The Jamestown Tax Exempt Virginia Fund is subject to a minimum monthly fee of $3,500. In addition, each Fund pays out-of-pocket expenses including, but not limited to, postage, supplies and costs of pricing portfolio securities. Certain officers of the Trust are also officers of Ultimus, or of Ultimus Fund Distributors, LLC (the “Distributor”), the principal underwriter of each Fund’s shares and an affiliate of Ultimus. The Distributor is compensated by the Adviser (not the Funds) for acting as principal underwriter.
COMPLIANCE CONSULTING AGREEMENT
Under the terms of a Compliance Consulting Agreement between the Trust and Ultimus, Ultimus provides an individual to serve as the Trust’s Chief Compliance Officer and to administer the Funds’ compliance policies and procedures. For these services, the Funds pay Ultimus an annual base fee of $18,600 plus an asset-based fee equal to 0.01% per annum on the Funds’ aggregate net assets in excess of $100 million. In addition, the Funds reimburse Ultimus for reasonable out-of-pocket expenses, if any, incurred in connection with these services.
5. Brokerage Arrangement
In order to reduce the total operating expenses of The Jamestown Balanced Fund and The Jamestown Equity Fund, a portion of each Fund’s operating expenses have been paid through an arrangement with a third-party broker-dealer who is compensated through commission trades. Payment of expenses by the broker-dealer is based on a percentage of commissions earned.
Expenses reimbursed through the brokerage arrangement totaled $6,000 for each Fund for the six months ended September 30, 2011.
6. Contingencies and Commitments
The Funds indemnify the Trust’s officers and Trustees for certain liabilities that might arise from their performance of their duties to the Funds. Additionally, in the normal course of business the Funds enter into contracts that contain a variety of representations and warranties and which provide general indemnifications. The Funds’ maximum exposure under these arrangements is unknown, as this would involve future claims that may be made against the Funds that have not yet occurred. However, based on experience, the Funds expect the risk of loss to be remote.
7. Concentration of Credit Risk
The Jamestown Tax Exempt Virginia Fund invests primarily in debt instruments of municipal issuers in the Commonwealth of Virginia. The issuers’ abilities to meet their obligations may be affected by economic developments in the Commonwealth or its region, as well as disruptions in the credit markets and the economy, generally.
29
THE JAMESTOWN FUNDS
NOTES TO FINANCIAL STATEMENTS (Continued)
8. Subsequent Events
The Funds are required to recognize in the financial statements the effects of all subsequent events that provide additional evidence about conditions that existed as of the date of the Statements of Assets and Liabilities. For non-recognized subsequent events that must be disclosed to keep the financial statements from being misleading, the Funds are required to disclose the nature of the event as well as an estimate of its financial effect, or a statement that such an estimate cannot be made. Management has evaluated subsequent events through the issuance of these financial statements and has noted no such events.
9. Recent Accounting Pronouncement and New Legislation
In May 2011, the Financial Accounting Standards Board issued Accounting Standards Update (“ASU”) No. 2011-04 “Amendments to Achieve Common Fair Value Measurement and Disclosure Requirements in U.S. GAAP and IFRSs.” ASU No. 2011-04 establishes common requirements for measuring fair value and for disclosing information about fair value measurements in accordance with GAAP and International Financial Reporting Standards. ASU No. 2011-04 is effective for interim and annual periods beginning after December 15, 2011 and is applied prospectively. Management is currently evaluating the impact ASU No. 2011-04 may have on financial statement disclosures.
The Regulated Investment Company Modernization Act of 2010 (the “Act”) was enacted on December 22, 2010. The Act makes changes to several tax rules impacting the Funds. In general, the provisions of the Act will be effective for the Funds’ current fiscal year ending March 31, 2012. Although the Act provides several benefits, including unlimited carryover on future capital losses, there may be greater likelihood that all or a portion of the Funds’ pre-enactment capital loss carryovers may expire without being utilized due to the fact that post-enactment capital losses must be utilized before pre-enactment capital loss carryovers. Relevant information regarding the impact of the Act on the Funds, if any, will be included in the Annual Report for the year ending March 31, 2012.
30
THE JAMESTOWN FUNDS
ABOUT YOUR FUNDS’ EXPENSES (Unaudited)
We believe it is important for you to understand the impact of costs on your investment. All mutual funds have operating expenses. As a shareholder of the Funds, you incur ongoing costs, including management fees and other expenses. The following examples are intended to help you understand your ongoing costs (in dollars) of investing in the Funds and to compare these costs with the ongoing costs of investing in other mutual funds.
A mutual fund’s ongoing costs are expressed as a percentage of its average net assets. This figure is known as the expense ratio. The expenses in the table below are based on an investment of $1,000 made at the beginning of the period shown and held for the entire period (April 1, 2011 through September 30, 2011).
The table below illustrates each Fund’s costs in two ways:
Actual fund return – This section helps you to estimate the actual expenses that you paid over the period. The “Ending Account Value” shown is derived from each Fund’s actual return, and the third column shows the dollar amount of operating expenses that would have been paid by an investor who started with $1,000 in the Funds. You may use the information here, together with the amount you invested, to estimate the expenses that you paid over the period.
��
To do so, simply divide your account value by $1,000 (for example, an $8,600 account value divided by $1,000 = 8.6), then multiply the result by the number given for the Funds under the heading “Expenses Paid During Period.”
Hypothetical 5% return – This section is intended to help you compare the Funds’ ongoing costs with those of other mutual funds. It assumes that each Fund had an annual return of 5% before expenses during the period shown, but that the expense ratio is unchanged. In this case, because the returns used are not the Funds’ actual returns, the results do not apply to your investment. The example is useful in making comparisons because the Securities and Exchange Commission (“SEC”) requires all mutual funds to calculate expenses based on a 5% return. You can assess each Fund’s ongoing costs by comparing this hypothetical example with the hypothetical examples that appear in shareholder reports of other funds.
Note that expenses shown in the table are meant to highlight and help you compare ongoing costs only. The Funds do not charge sales loads or redemption fees.
The calculations assume no shares were bought or sold during the period. Your actual costs may have been higher or lower, depending on the amount of your investment and the timing of any purchases or redemptions.
More information about the Funds’ expenses, including annual expense ratios for the prior five fiscal years, can be found in this report. For additional information on operating expenses and other shareholder costs, please refer to the Funds’ prospectus.
31
THE JAMESTOWN FUNDS
ABOUT YOUR FUNDS’ EXPENSES (Unaudited) (Continued)
Beginning Account Value April 1, 2011 | Ending Account Value September 30, 2011 | Expenses Paid During Period* | |
The Jamestown Balanced Fund | |||
Based on Actual Fund Return | $1,000.00 | $909.80 | $5.65 |
Based on Hypothetical 5% Return (before expenses) | $1,000.00 | $1,019.15 | $5.97 |
The Jamestown Equity Fund | |||
Based on Actual Fund Return | $1,000.00 | $862.90 | $4.90 |
Based on Hypothetical 5% Return (before expenses) | $1,000.00 | $1,019.80 | $5.32 |
The Jamestown Tax Exempt Virginia Fund | |||
Based on Actual Fund Return | $1,000.00 | $1,045.50 | $3.54 |
Based on Hypothetical 5% Return (before expenses) | $1,000.00 | $1,021.61 | $3.50 |
| * | Expenses are equal to the Funds’ annualized expense ratios for the period as stated below, multiplied by the average account value over the period, multiplied by 183/365 (to reflect the one-half year period). |
| The Jamestown Balanced Fund | 1.18% |
| The Jamestown Equity Fund | 1.05% |
| The Jamestown Tax Exempt Virginia Fund | 0.69% |
32
THE JAMESTOWN FUNDS
OTHER INFORMATION (Unaudited)
A description of the policies and procedures that the Funds use to vote proxies relating to portfolio securities is available without charge upon request by calling toll-free 1-866-738-1126, or on the SEC’s website at http://www.sec.gov. Information regarding how the Funds voted proxies relating to portfolio securities during the most recent 12-month period ended June 30 is also available without charge upon request by calling toll-free 1-866-738-1126, or on the SEC’s website at http://www.sec.gov.
The Trust files a complete listing of portfolio holdings of the Funds with the SEC as of the end of the first and third quarters of each fiscal year on Form N-Q. The filings are available upon request, by calling 1-866-738-1126. Furthermore, you may obtain a copy of these filings on the SEC’s website at http://www.sec.gov. The Trust’s Forms N-Q may also be reviewed and copied at the SEC’s Public Reference Room in Washington, DC, and information on the operation of the Public Reference Room may be obtained by calling 1-800-SEC-0330.
33
THE JAMESTOWN FUNDS www.jamestownfunds.com Investment Adviser Lowe, Brockenbrough & Company, Inc. 1802 Bayberry Court Suite 400 Richmond, Virginia 23226 Administrator Ultimus Fund Solutions, LLC P.O. Box 46707 Cincinnati, Ohio 45246-0707 (Toll-Free) 1-866-738-1126 Independent Registered Public Accounting Firm Ernst & Young LLP 1900 Scripps Center 312 Walnut Street Cincinnati, Ohio 45202 Legal Counsel Sullivan & Worcester LLP One Post Office Square Boston, Massachusetts 02109 Board of Trustees Austin Brockenbrough, III John T. Bruce Charles M. Caravati, Jr. Robert S. Harris J. Finley Lee, Jr. Richard L. Morrill Harris V. Morrissette |
| Item 2. | Code of Ethics. |
Not required
| Item 3. | Audit Committee Financial Expert. |
Not required
| Item 4. | Principal Accountant Fees and Services. |
Not required
| Item 5. | Audit Committee of Listed Registrants. |
Not applicable
| Item 6. | Schedule of Investments. |
| (a) | Not applicable [schedule filed with Item 1] |
| (b) | Not applicable |
| Item 7. | Disclosure of Proxy Voting Policies and Procedures for Closed-End Management Investment Companies. |
Not applicable
| Item 8. | Portfolio Managers of Closed-End Management Investment Companies. |
Not applicable
| Item 9. | Purchases of Equity Securities by Closed-End Management Investment Company and Affiliated Purchasers. |
Not applicable
| Item 10. | Submission of Matters to a Vote of Security Holders. |
The registrant’s Nominating Committee shall review shareholder recommendations to fill vacancies on the registrant’s board of trustees if such recommendations are submitted in writing, addressed to the Committee at the registrant’s offices and meet any minimum qualifications adopted by the Committee. The Committee may adopt, by resolution, a policy regarding its procedures for considering candidates for the board of trustees, including any recommended by shareholders.
| Item 11. | Controls and Procedures. |
(a) Based on their evaluation of the registrant’s disclosure controls and procedures (as defined in Rule 30a-3(c) under the Investment Company Act of 1940) as of a date within 90 days of the filing date of this report, the registrant’s principal executive officers and principal financial officer have concluded that such disclosure controls and procedures are reasonably designed and are operating effectively to ensure that material information relating to the registrant, including its consolidated subsidiaries, is made known to them by others within those entities, particularly during the period in which this report is being prepared, and that the information required in filings on Form N-CSR is recorded, processed, summarized, and reported on a timely basis.
(b) There were no changes in the registrant’s internal control over financial reporting (as defined in Rule 30a-3(d) under the Investment Company Act of 1940) that occurred during the second fiscal quarter of the period covered by this report that have materially affected, or are reasonably likely to materially affect, the registrant’s internal control over financial reporting.
| Item 12. | Exhibits. |
File the exhibits listed below as part of this Form. Letter or number the exhibits in the sequence indicated.
(a)(1) Any code of ethics, or amendment thereto, that is the subject of the disclosure required by Item 2, to the extent that the registrant intends to satisfy the Item 2 requirements through filing of an exhibit: Not required
(a)(2) A separate certification for each principal executive officer and principal financial officer of the registrant as required by Rule 30a-2(a) under the Act (17 CFR 270.30a-2(a)): Attached hereto
(a)(3) Any written solicitation to purchase securities under Rule 23c-1 under the Act (17 CFR 270.23c-1) sent or given during the period covered by the report by or on behalf of the registrant to 10 or more persons: Not applicable
(b) Certifications required by Rule 30a-2(b) under the Act (17 CFR 270.30a-2(b)): Attached hereto
| Exhibit 99.CERT | Certifications required by Rule 30a-2(a) under the Act |
| Exhibit 99.906CERT | Certifications required by Rule 30a-2(b) under the Act |
SIGNATURES
Pursuant to the requirements of the Securities Exchange Act of 1934 and the Investment Company Act of 1940, the registrant has duly caused this report to be signed on its behalf by the undersigned, thereunto duly authorized.
(Registrant) Williamsburg Investment Trust
| By (Signature and Title)* | /s/ Tina H. Bloom | ||
| Tina H. Bloom, Secretary | |||
| Date | November 30, 2011 | ||
Pursuant to the requirements of the Securities Exchange Act of 1934 and the Investment Company Act of 1940, this report has been signed below by the following persons on behalf of the registrant and in the capacities and on the dates indicated.
| By (Signature and Title)* | /s/ John T. Bruce | ||
| John T. Bruce, President (FBP Value Fund and FBP Balanced Fund) | |||
| Date | November 30, 2011 | ||
| By (Signature and Title)* | /s/ Thomas W. Leavell | ||
| Thomas W. Leavell, President (The Government Street Equity Fund, The Government Street Mid-Cap Fund and The Alabama Tax Free Bond Fund) | |||
| Date | November 30, 2011 | ||
| By (Signature and Title)* | /s/ Charles M. Caravati III | ||
| Charles M. Caravati III, President (The Jamestown Balanced Fund and The Jamestown Equity Fund) | |||
| Date | November 30, 2011 | ||
| By (Signature and Title)* | /s/ Joseph A. Jennings III | ||
Joseph A. Jennings III, President (The Jamestown Tax Exempt Virginia Fund) | |||
| Date | November 30, 2011 | ||
| By (Signature and Title)* | /s/ John P. Ackerly IV | ||
John P. Ackerly IV, President (The Davenport Core Fund, Davenport Value & Income Fund and Davenport Equity Opportunities Fund) | |||
| Date | November 30, 2011 | ||
| By (Signature and Title)* | /s/ Mark J. Seger | ||
| Mark J. Seger, Treasurer | |||
| Date | November 30, 2011 | ||
* Print the name and title of each signing officer under his or her signature.