| OMB APPROVAL |
OMB Number: 3235-0570 Expires: January 31, 2014 Estimated average burden hours per response: 20.6 |
UNITED STATES
SECURITIES AND EXCHANGE COMMISSION
Washington, D.C. 20549
FORM N-CSR
CERTIFIED SHAREHOLDER REPORT OF REGISTERED
MANAGEMENT INVESTMENT COMPANIES
Investment Company Act file number 811-05685
Williamsburg Investment Trust
(Exact name of registrant as specified in charter)
| 225 Pictoria Drive, Suite 450 Cincinnati, Ohio | 45246 |
| (Address of principal executive offices) | (Zip code) |
W. Lee H. Dunham, Esq.
Sullivan & Worcester LLP One Post Office Square Boston, Massachusetts 02109
(Name and address of agent for service)
Registrant's telephone number, including area code: (513) 587-3400
Date of fiscal year end: March 31, 2013
Date of reporting period: September 30, 2012
Form N-CSR is to be used by management investment companies to file reports with the Commission not later than 10 days after the transmission to stockholders of any report that is required to be transmitted to stockholders under Rule 30e-1 under the Investment Company Act of 1940 (17 CFR 270.30e-1). The Commission may use the information provided on Form N-CSR in its regulatory, disclosure review, inspection, and policymaking roles.
A registrant is required to disclose the information specified by Form N-CSR, and the Commission will make this information public. A registrant is not required to respond to the collection of information contained in Form N-CSR unless the Form displays a currently valid Office of Management and Budget ("OMB") control number. Please direct comments concerning the accuracy of the information collection burden estimate and any suggestions for reducing the burden to Secretary, Securities and Exchange Commission, 450 Fifth Street, NW, Washington, DC 20549-0609. The OMB has reviewed this collection of information under the clearance requirements of 44 U.S.C. § 3507.
| Item 1. | Reports to Stockholders. |
SEMI-ANNUAL REPORT
September 30, 2012 (Unaudited) |
THE DAVENPORT FUNDS LETTER TO SHAREHOLDERS | |
Dear Shareholders,
The third quarter of 2012 treated equity investors well. The S&P 500 Index advanced 6.35% and is now up 16.44% year-to-date, while the Russell 2000 Index advanced 5.25% and finished the quarter up 14.23% year-to-date. The S&P 500 Index has now rallied 12.71% since early June and, perhaps even more impressive, is up 31.06% from the low we saw last October when Eurozone worries peaked. Most domestic indices are near multi-year highs if not all-time highs. Suffice it to say, market strength has confounded the many naysayers in the investment community. In fact, this may be one of the most doubted, distrusted and disliked rallies we have seen. Not surprisingly, those who are either under-invested or short the market seem the most troubled by recent action.
Market strength has mainly been a function of risk premiums abating. That is, stocks have advanced without improvement in the economic picture or earnings outlook. In fact, a recent Bloomberg survey found that market strategists had recently reduced their earnings forecasts for next year. Further, Bloomberg shows that Gross Domestic Product (“GDP”) is expected to grow only 2.1% next year, down from expectations for 2.5% growth when the year began. What does all this mean? Growth expectations may remain subdued, but investors have been willing to pay more for stocks as fear of economic calamity in Europe or some other “fat tail” event has diminished. As the year began, we discussed the prospect of stocks “climbing a wall of worry” and this certainly seems to be happening.
We’ve also been aided by a fresh dose of easy monetary policy. The Federal Reserve System recently unveiled the latest iteration of quantitative easing (“QE3”), which entails buying $40 billion worth of mortgage-backed securities per month in an effort to drive down interest rates. The end goal is to make borrowing more affordable (i.e. make money “cheap”) in order to improve economic conditions, namely employment. The program is open-ended, meaning the Fed is willing to throw money at the problem for as long as it takes. By effectively going “all in,” Chairman Ben Bernanke and his colleagues are clearly prioritizing job growth over inflation concerns. In addition to keeping rates low, the Fed hopes to drive up the value of assets such as stocks, real estate and homes by decreasing the appeal of cash and interest-bearing securities. It certainly appears to have impacted stocks, which experienced somewhat of a buying panic after the news.
Will it work? We are in uncharted waters and the efficacy of such unprecedented monetary stimulus remains to be seen. We and many others have some doubts about the Fed’s ability to translate QE3 into job growth and worry about the long-term side effects of their efforts, particularly the chance of rising inflation. We also can’t help but wonder what else the Fed could possibly have in its quiver after seemingly putting all its cards on the table. However, we admit to having no better solution and will operate under the assumption the Fed can tactfully withdraw stimulus as the economy finds more solid footing. What we do know is that the Fed can’t engineer economic growth without help. Government leaders will have to enact sensible fiscal policy or the economy will likely remain stuck in the mud and the American public’s confidence will remain shaken. Chairman Bernanke overtly called upon Capitol Hill when he recently noted, “We can’t solve this problem by ourselves.”
This brings us to the “fiscal cliff,” which has become the new most popular thing to worry about. If you watch the news, you may think our economy is scheduled to fly off the side of a mountain and explode into a fiery ball in the valley below. True, our economy will experience a significant slowdown if higher taxes and spending cuts go into effect, as are currently scheduled. However, it seems logical to anticipate some form of compromise that avoids an extreme scenario while also imposing some fiscal discipline (i.e. more modest tax increases and spending cuts than are currently planned). Such a compromise may be pushed into 2013 given election year politics and we are sure to see some intense bickering, media hysteria, and market volatility in the mean time. Still, a compromise shouldn’t prevent our domestic recovery from continuing, even if at a modest pace.
What about the Presidential election? This is the most polarized political landscape many have ever seen and the election’s impact on financial markets is a hot topic. At the moment, an Obama victory coupled with status quo in Congress seems likely and appears to be priced into financial markets. Many contend a Romney victory would be better for the economy and financial markets given the Republican party’s friendlier stance on both taxes and regulation. This thinking seems logical, but one could also argue Republican efforts to curtail the federal deficit could be a drag in the near term. Ultimately, the outcome may matter less than many think given the fact that either administration would be forced to deal with deficit issues. Also of interest, markets have historically performed better under Democratic presidents as compared to Republican. We can’t predict the outcome, but we do think the conclusion of the election process will remove another layer of uncertainty and give investors some indication of policy going into the next four years.
To conclude, we are pleased to be enjoying a solid year and glad to see our vanilla approach outperforming many of the exotic strategies that have gained popularity over the last decade. Given the market’s recent run, one could easily argue a measure of caution is warranted in the short term. However, we note that stocks have generally been out of favor for well over a decade and still seem both reasonably valued and relatively under-owned. Further, moderate economic growth and decreasing event risk (European debt crisis, fiscal cliff, etc.) could allow valuations to keep expanding.
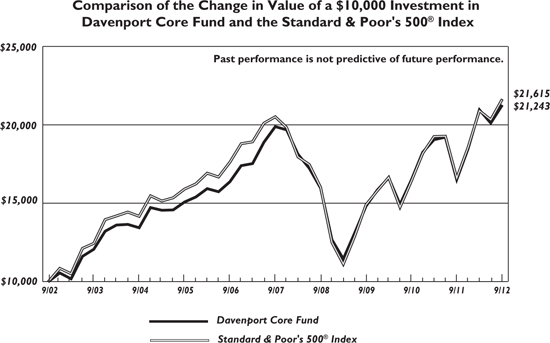
Davenport Core Fund
The following chart represents the Davenport Core Fund (the “Fund”) performance and the performance of the S&P 500 Index*, the Fund’s primary benchmark, for the periods ended September 30, 2012.
| | | | | | | | |
| Core Fund | 5.62% | 28.68% | 12.77% | 1.33% | 7.83% | 4.73% | 0.95% | 0.96% |
S&P 500 Index* | 6.35% | 30.20% | 13.20% | 1.05% | 8.01% | 4.74% | — | — |
Past performance is no guarantee of future results. Investment return and principal value of an investment will fluctuate so that an investor’s shares, when redeemed, may be worth more or less than their original cost. Current performance may be lower or higher than the performance data quoted. Performance data, current to the most recent month end, may be obtained by calling 1-800-281-3217.
| * | The S&P 500 Index is comprised of 500 U.S. stocks and is an indicator of the performance of the overall U.S. stock market. An investor cannot invest in an index and its returns are not indicative of the performance of any specific investment. |
| + | Annualized as of September 30, 2012. |
The Davenport Core Fund gained 5.62% during the third quarter, slightly lagging the 6.35% advance for the S&P 500 Index (the “S&P 500”). Year-to-date, the Fund is up 14.97% relative to the 16.44% gain for the S&P 500. As has been the case throughout much of the year, large caps continued to outperform small caps. In fact, the S&P 500 is one of the best performing indices year-to-date, finishing the quarter ahead of smaller cap indices such as the Russell 2000 Index and the Russell Midcap Index. Though we did not capture all of the market’s advances during the quarter, we are pleased to have managed solid year-to-date gains.
Weakness across a few key names in the Health Care and Materials sectors weighed on results during the quarter. Within Health Care, WellPoint (WLP) reacted negatively to a disappointing earnings release, which piled on to fresh concerns surrounding the impact of the recent upholding of provisions of the Patient Protection and Affordable Care Act. Albemarle (ALB) was a source of weakness in Materials due to renewed concerns about profitability in the second half of the year. Relative strength during the quarter came from the Industrials and Consumer Staples sectors, where holdings such as Stanley Black & Decker (SWK), Illinois Tool Works (ITW) and recently purchased J.M. Smucker (SJM), recorded nice gains. The Information Technology sector produced strong results as well, with Google (GOOG), Accenture (ACN), and Amazon.com (AMZN) hitting new highs.
Apple (AAPL) and QUALCOMM (QCOM) also performed nicely during the quarter; however, our underweight stance in AAPL led to some relative underperformance. Though it hurt performance during the most recent period, we recently elected to chip both of these names. In the case of AAPL, the stock is up more than five-fold since 2009 and has come to represent roughly 5% of the S&P 500. Though we believe this distinction is well deserved given the company’s impressive track record of innovation and profitability, we have grown a bit concerned that AAPL’s incredible competitive edge may be difficult to maintain. Furthermore, we worry that the company’s unprecedented margins and pricing power may come under pressure as the competition refines its approach. With respect to QCOM, we are concerned that the explosive growth in smartphone adoption may begin to decelerate sooner than many investors would like to admit. This, coupled with a decline in average selling prices (ASPs) of these devices (QCOM’s royalty revenues are based on price), could lead to compression in the company’s valuation multiples over time. To be clear, we continue to believe that QCOM is a great way to play the proliferation of wireless devices for years to come; we just felt like owning a little less given the aforementioned concerns.
During the quarter, we initiated positions in General Motors (GM) and Goldman Sachs (GS). Though these companies’ business activities differ greatly, we found similarities in the two, given their cheap valuations and powerful franchises that have been neglected by investors. In the case of GM, we acknowledge it is a bit more “rugged” than the average Fund holding due to its well publicized pension issues and high level of government ownership following the company’s reorganization under Chapter 11 in 2009. That said, we felt the shares offer a very attractive risk/reward opportunity considering the stock’s dirt cheap valuation and many opportunities to improve results. GS has had its own struggles, as the company’s transition from a pure investment bank to a bank holding company has limited the firm’s ability to use leverage to enhance returns in a recovering credit environment. Though pre-crisis returns on equity of 25%+ are likely a thing of the past, we believe results can improve significantly from current levels as the market environment recovers, regulatory uncertainty dissipates, and management continues to focus on capital allocation and controlling costs. Clearly, much has changed for the company from a
structural, regulatory and environmental perspective; however, we believe key attributes, such as its world renowned franchises and ability to recruit and retain world class talent, should enable the company to generate attractive returns even amid a tepid economic recovery. With the stock out of favor and trading at historically cheap levels, we felt the risk/reward profile was attractive.
In summary, we are pleased to be having such a strong year. Though some of our more “against the grain” actions have led to some relative underperformance amid a strong market environment, we feel comfortable with the Fund’s positioning. Sometimes zigging while others are zagging can lead to short term headaches; however, this approach can also yield strong returns over extended periods.
New Positions
Aon plc (AON) is a leading global provider of risk management services, insurance and reinsurance brokerage, and human resources consulting and outsourcing.
General Motors Company (GM) is the world’s largest light vehicle manufacturer, with operations in 120 countries, selling around 9 million vehicles annually.
Goldman Sachs Group, Inc. (GS) is one of the world’s leading investment banking franchises.
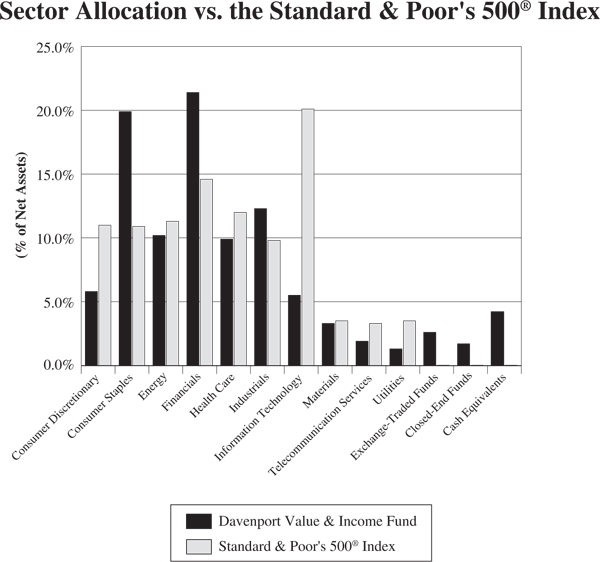
Davenport Value & Income Fund
The following chart represents the Davenport Value & Income Fund (the “Fund”) performance and the performance of the S&P 500 Index*, the Fund’s primary benchmark, and the Lipper Equity Income Index for the periods ended September 30, 2012.
| | | Since Inception** 12/31/2010 | | | |
| Value & Income Fund | 5.17% | 30.73% | 13.32% | 0.99% | 1.24% | 2.14% |
S&P 500 Index* | 6.35% | 30.20% | 10.41% | — | — | — |
Lipper Equity Income Index* | 5.60% | 26.79% | 8.85% | — | — | — |
Past performance is no guarantee of future results. Investment return and principal value of an investment will fluctuate so that an investor’s shares, when redeemed, may be worth more or less than their original cost. Current performance may be lower or higher than the performance data quoted. Performance data, current to the most recent month end, may be obtained by calling 1-800-281-3217.
| * | The S&P 500 Index is comprised of 500 U.S. stocks and is an indicator of the performance of the overall U.S. stock market. The Lipper Equity Income Fund Index is an unmanaged index of the 30 largest funds, based on total year-end net asset value, in the Lipper Equity Income Fund Index. An investor cannot invest in an index and its returns are not indicative of the performance of any specific investment. |
| + | Annualized as of September 30, 2012. |
The Davenport Value & Income Fund advanced 5.17% during the third quarter, just under the 6.35% and 5.60% gains for the S&P 500 Index and the Lipper Equity Income Fund Index, respectively. Year-to-date, the Fund was up 15.20% relative to the 16.44% and the 12.97% gains for the S&P 500 Index and the Lipper Equity Income Fund Index, respectively. Clearly, dividend stocks have not lost their luster. In fact, many low growth companies with above average yields
continue to shine, despite fairly expensive valuations. In other words, many stocks that have traditionally been perceived as value situations are now looking quite expensive. As you will read below, we have begun to move away from certain low growth, high payout companies (such as utilities) in search of stocks that may have lower yields, but better earnings and dividend growth potential.
Housing related companies exhibited strong performance during the quarter, as improving industry data coupled with the Federal Reserve System’s announcement of QE3 fueled gains across the group. More direct plays, such as Weyerhaeuser (WY), Plum Creek Timber (PCL), and Fidelity National Financial (FNF), were top performers; however, bank holdings, such as JPMorgan Chase (JPM) and SunTrust (STI), also benefitted. Marathon Petroleum (MPC) was the Fund’s top contributor for the quarter. The earnings picture continues to improve for this domestic refiner, who’s flexible asset base and geographic positioning allow the company to take advantage of high gas prices by using cheap domestic crude from areas of the country where transportation capacity is constrained. Performance suffered in the Health Care and Materials sectors where WellPoint (WLP) and Dow Chemical (DOW) weighed on results. Norfolk Southern (NSC) and Intel (INTC) were also detractors following earnings announcements that fell well below street estimates.
In keeping with the theme mentioned above, we elected to sell our position in The Southern Company (SO) and add to positions in Johnson & Johnson (JNJ) and JPM. SO has benefitted from the “yield bid” along with the rest of the Utilities sector, as investors rotated into defensive sectors with high yields. As such, we felt the valuation was a bit full relative to the company’s growth prospects and ability to raise the dividend. On the other hand, both JPM and JNJ trade at discounts to historical averages, pay solid dividends, and seem poised to generate attractive earnings growth following periods of reputational and operational setbacks. In the case of JNJ, we believe the shares offer an attractive risk/reward profile given the company’s strong balance sheet, attractive dividend (yield: 3.5%), and increasing earnings visibility from new product launches and recent acquisitions. Though JPM suffered a reputational “black eye” with its Q2 trading loss, we felt the financial ramifications of the loss had been reflected in the shares and that further downside risk was limited. Going forward, we believe JPM is well-positioned relative to many of its global competitors and seems likely to generate superior industry returns over the long term. The stock pays a solid dividend, yielding approximately 3.0%, and trades at a modest premium to its tangible book value.
Early on in the quarter, we initiated a position in leading pharmacy retailer Walgreen (WAG). At the time of the purchase, this was a contrarian move given the well publicized headwinds that have hurt earnings and bludgeoned investor sentiment through the first half of this year (contract loss with Express Scripts (ESRX), potential for further losses from Medco Health Solutions, large acquisition of European drugstore chain). Though we clearly had some luck with timing, as the ESRX/Medco dispute was resolved the day after our purchase, we continue to believe the shares can work higher from here. WAG generates solid cash flows, has a strong balance sheet, and pays a healthy dividend (yields 3.0%). Though we have already benefitted from a major catalyst, we think earnings, cash flows, and the stock’s multiple can improve as the company benefits from an aging population whose consumption of prescription drugs is set to accelerate. Furthermore, though criticized for its timing, price and strategic fit, we believe the Alliance Boots acquisition could be value accretive beyond management’s initial projections, providing incremental support to earnings down the road.
To close, we are encouraged to have generated such solid results up to this point in the year. Just as diamonds are a girl’s best friend, dividends may be an investor’s best friend for years to come and should continue to make up a meaningful component of the market’s total return. That said, we acknowledge the fact that dividend strategies have become quite crowded, which may make it difficult to replicate the strong relative performance of the past couple of years. As this occurs, it will be incumbent upon us to continue to find areas where we see value.
New Positions
Darden Restaurants, Inc. (DRI) is the largest casual dining restaurant company in the world, with over 2,000 units comprised of flagship brands such as Red Lobster, Olive Garden and Longhorn Steakhouse. Current yield: 3.6%.
Walgreen Company (WAG) is a leading pharmacy retailer. Current yield: 3.0%.
Increased Positions
Johnson & Johnson (JNJ) is a leading worldwide diversified health care corporation, operating over 250 companies in 57 different countries. Currently yields 3.5%.
JPMorgan Chase & Company (JPM) is a leading retail and investment banking franchise. Current yield: 3.0%.
There is no guarantee that a company will continue to pay a dividend.
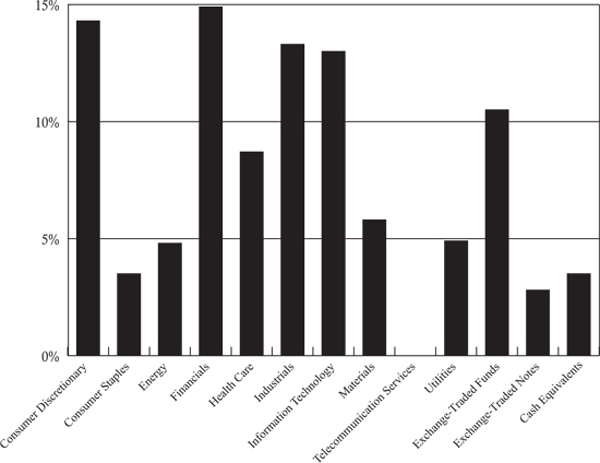
Davenport Equity Opportunities Fund
The following chart represents the Davenport Equity Opportunities Fund (the “Fund”) performance and the performance of the Russell Midcap Index*, the Fund’s primary benchmark, and the S&P 500 Index for the periods ended September 30, 2012.
| | | Since Inception** 12/31/2010 | | |
| Equity Opportunities Fund | 5.23% | 30.03% | 11.66% | 1.04% | 1.10% |
Russell Midcap Index* | 5.59% | 28.03% | 6.83% | — | — |
S&P 500 Index* | 6.35% | 30.20% | 10.41% | — | — |
Past performance is no guarantee of future results. Investment return and principal value of an investment will fluctuate so that an investor’s shares, when redeemed, may be worth more or less than their original cost. Current performance may be lower or higher than the performance data quoted. Performance data, current to the most recent month end, may be obtained by calling 1-800-281-3217.
| * | The Russell Midcap Index measures the performance of the 800 smallest companies in the Russell 1000, which represent approximately 25% of the total market capitalization of the Russell 1000. The S&P 500 Index is comprised of 500 U.S. stocks and is an indicator of the performance of the overall U.S. stock market. An investor cannot invest in an index and its returns are not indicative of the performance of any specific investment. |
| + | Annualized as of September 30, 2012. |
The Davenport Equity Opportunities Fund enjoyed a 5.23% gain for the third quarter. This compared to advances of 5.59% and 6.35% for the Russell Midcap Index (the “Russell Midcap”) and S&P 500 Index (the “S&P 500”), respectively. Year-to-date, the Fund was up 15.49% at period end versus gains of 14.00% and 16.44% for the Russell Midcap and S&P 500, respectively. As another point of reference, the small cap-oriented Russell 2000 Index finished the quarter up 14.23%, year-to-date. While we have fared well versus the aforementioned Russell indices, investors’ preference for large cap dividend payers has recently made it more difficult to keep up with the S&P 500. In fact, we are probably fortunate to have come this far without owning juggernauts such as Apple (AAPL) and Wal-Mart (WMT).
A number of companies in the Consumer Discretionary and Financials sectors were standouts this past quarter. Brookfield Residential (BRP) and SunTrust (STI) were up sharply given ongoing enthusiasm for housing-related plays. STI also benefited from efforts to further de-risk its balance sheet and provide greater earnings visibility. Lamar Advertising (LAMR) posted outsized gains as the billboard operator announced its intent to convert to a Real Estate Investment Trust (REIT), which could provide a tax shield and ultimately result in a meaningful dividend. While we still have a meaningful overweight stance in both consumer and finance, we’ve used recent strength in these stocks to reduce positions. The domestic recovery story seems intact, but the stocks definitely incorporate more enthusiasm than they did a few months ago. International Game Technology (IGT) was our biggest laggard during the quarter. Shares of the slot machine manufacturer have been disappointing for a couple of reasons. One, investors have questioned the company’s capital allocation after the purchase of online game provider DoubleDown. Two, the industry has become more competitive and the machine makers appear to be getting more aggressive on pricing. While the name has been frustrating, we bought more with the shares trading at a 52-week low and commanding the lowest P/E multiple we recalled ever seeing for the stock (less than 10x 2013 estimates). The stock has recovered some ground since then, but the risk/reward still seems attractive. We think management is very aware of investor concerns and is focused on improving returns on capital. We believe any improvement in sales trends and/or management credibility could yield another 20% -25% upside.
Penn National Gaming (PENN), which operates 19 regional casinos, represents another situation where we took advantage of weakness to build our position. The stock had declined from its highs due to the threat of increased competition at PENN’s flagship property in Charles Town, WV. Though we acknowledge the headwind of new competition and the potential cannibalization of existing PENN properties, we note this company is now very diversified and adept at adjusting its cost structure. We also point out that PENN has an underleveraged balance sheet and a penchant for finding new growth opportunities via development or acquisition. In addition, the company will be generating a huge amount of free cash flow following the opening of its new Ohio properties, which further supports the company’s ability to create value via deals or share repurchases. At less than 7x 2013 Earnings Before Interest, Taxes, Depreciation and Amortization (EBITDA) and 13x an Earnings Per Share (EPS) figure that understates free cash flow, the stock was cheaper than we’ve seen it in a while and we decided to increase our position.
We added to a couple of names we haven’t discussed in recent years. One of these was Rockwell Collins (COL). We have always admired this company for its strong balance sheet (net debt free), well above average returns on capital, and free cash flow generation. The stock has remained sluggish amid the market’s rally due to disappointing results and concerns regarding the company’s exposure to the defense budget. While 2013 will be somewhat of a transition year
for the company given slowing defense spending, we think this headwind is well-documented and 2014 earnings growth could be substantial as business jet activity improves and commercial orders associated with Boeing’s 787 program pick up steam.
Elsewhere, we added to our position in ITC Holdings (ITC), the nation’s largest independent electric transmission company. This business has tremendous barriers to entry and attractive returns that are regulated by the Federal Energy Regulatory Commission (FERC). It also has visible earnings growth associated with efforts to upgrade and provide new power sources to the electric grid. While the stock has performed very well since our initial purchase, it has stalled in the last year due to regulatory concerns and uncertainty surrounding a complex merger announced in December of 2011. We believe these concerns have presented us an opportunity to add to a quality defensive name.
In sum, we are very pleased to be enjoying such robust gains this year. While stocks in general have become more fully valued, we are still finding reasonable deals in a number of areas that haven’t been focal points for investors recently. An ongoing appetite for household names may favor large cap stocks at the moment, but we will continue leaning primarily towards small-to-medium sized companies with significant growth potential. Over time, we think a collection of superior business models run by exceptional management could yield above average returns.
Increased Positions
Aon plc (AON) is a leading global provider of risk management services, insurance and reinsurance brokerage, and human resources consulting and outsourcing.
ITC Holdings Corporation (ITC) is the nation’s largest independent electric transmission company.
International Game Technology (IGT) is the world’s leading maker of slot machines.
Penn National Gaming, Inc. (PENN) is a regional casino operator with an attractive portfolio of 19 casinos throughout the United States.
Rockwell Collins, Inc. (COL) is a leading provider of communications equipment and aviation electronics for military and commercial aerospace customers.
The P/E Ratio is a valuation ratio of a company’s current share price compared to its per share earnings.
Sincerely,
John P. Ackerly, IV
President, The Davenport Funds
DAVENPORT CORE FUND PERFORMANCE INFORMATION (Unaudited) |
| | Average Annual Total Returns(a) (for periods ended September 30, 2012) | |
| | 1 Year | 5 Years | 10 Years | |
| Davenport Core Fund | 28.68% | 1.33% | 7.83% | |
Standard & Poor’s 500® Index | 30.20% | 1.05% | 8.01% | |
(a) The total returns shown do not reflect the deduction of taxes that a shareholder would pay on Fund distributions or the redemption of Fund shares. |
DAVENPORT VALUE & INCOME FUND PERFORMANCE INFORMATION (Unaudited) |
| | Average Annual Total Returns(a) (for periods ended September 30, 2012) | |
| | 1 Year | Since Inception(b) | |
| Davenport Value & Income Fund | 30.73% | 13.32% | |
Standard & Poor’s 500® Index | 30.20% | 10.41% | |
| Lipper Equity Income Index | 26.79% | 8.85% | |
(a) The total returns shown do not reflect the deduction of taxes that a shareholder would pay on Fund distributions or the redemption of Fund shares. |
| |
(b) Commencement of operations was December 31, 2010. |
DAVENPORT EQUITY OPPORTUNITIES FUND PERFORMANCE INFORMATION (Unaudited) |
| | Average Annual Total Returns(a) (for periods ended September 30, 2012) | |
| | 1 Year | Since Inception(b) | |
| Davenport Equity Opportunities Fund | 30.03% | 11.66% | |
Russell Midcap® Index | 28.03% | 6.83% | |
(a) The total returns shown do not reflect the deduction of taxes that a shareholder would pay on Fund distributions or the redemption of Fund shares. |
| |
(b) Commencement of operations was December 31, 2010. |
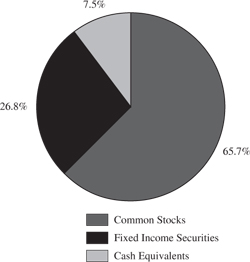
DAVENPORT CORE FUND PORTFOLIO INFORMATION September 30, 2012 (Unaudited) |
Top Ten Equity Holdings
| Security Description | % of Net Assets |
| Brookfield Asset Management, Inc. - Class A | 2.7% |
| Exxon Mobil Corporation | 2.6% |
| Berkshire Hathaway, Inc. - Class B | 2.4% |
| Wells Fargo & Company | 2.4% |
| Apple, Inc. | 2.4% |
| International Business Machines Corporation | 2.4% |
| Johnson & Johnson | 2.3% |
| Markel Corporation | 2.3% |
| Chevron Corporation | 2.2% |
| J.M. Smucker Company (The) | 2.2% |
DAVENPORT VALUE & INCOME FUND PORTFOLIO INFORMATION September 30, 2012 (Unaudited) |
Top Ten Equity Holdings
| Security Description | % of Net Assets |
| Fidelity National Financial, Inc. - Class A | 2.8% |
| JPMorgan Chase & Company | 2.7% |
| SPDR EURO STOXX 50 ETF | 2.6% |
| Wells Fargo & Company | 2.6% |
| Johnson & Johnson | 2.5% |
| Royal Dutch Shell plc - Class B - ADR | 2.5% |
| Sun Communities, Inc. | 2.4% |
| Travelers Companies, Inc. (The) | 2.4% |
| Chevron Corporation | 2.4% |
| GlaxoSmithKline plc - ADR | 2.3% |
DAVENPORT EQUITY OPPORTUNITIES FUND PORTFOLIO INFORMATION September 30, 2012 (Unaudited) |
Top Ten Equity Holdings
| Security Description | % of Net Assets |
| Markel Corporation | 4.8% |
| Penn National Gaming, Inc. | 4.6% |
| CarMax, Inc. | 4.3% |
| Aon plc | 3.9% |
| Capital One Financial Corporation | 3.9% |
| O'Reilly Automotive, Inc. | 3.9% |
| Colfax Corporation | 3.7% |
| Brookfield Asset Management, Inc. - Class A | 3.4% |
| NCR Corporation | 3.3% |
| SunTrust Banks, Inc. | 3.3% |
DAVENPORT CORE FUND SCHEDULE OF INVESTMENTS September 30, 2012 (Unaudited) |
| | | | | | |
| Consumer Discretionary — 14.1% | | | | | | |
Amazon.com, Inc. (a) | | | 14,733 | | | $ | 3,746,896 | |
CarMax, Inc. (a) | | | 145,122 | | | | 4,106,953 | |
General Motors Company (a) | | | 124,015 | | | | 2,821,341 | |
| Lowe's Companies, Inc. | | | 93,816 | | | | 2,836,996 | |
| McDonald's Corporation | | | 29,076 | | | | 2,667,723 | |
| News Corporation - Class A | | | 125,841 | | | | 3,086,880 | |
| Starwood Hotels & Resorts Worldwide, Inc. | | | 52,613 | | | | 3,049,449 | |
| Walt Disney Company (The) | | | 69,238 | | | | 3,619,763 | |
| | | | | | | | 25,936,001 | |
| Consumer Staples — 12.0% | | | | | | | | |
| Anheuser-Busch InBev SA/NV - ADR | | | 34,245 | | | | 2,941,988 | |
| Dr. Pepper Snapple Group, Inc. | | | 64,100 | | | | 2,854,373 | |
| J.M. Smucker Company (The) | | | 47,947 | | | | 4,139,264 | |
| Nestle SA - ADR | | | 39,018 | | | | 2,466,328 | |
| PepsiCo, Inc. | | | 46,101 | | | | 3,262,568 | |
| Procter & Gamble Company (The) | | | 37,814 | | | | 2,622,779 | |
| Wal-Mart Stores, Inc. | | | 53,372 | | | | 3,938,854 | |
| | | | | | | | 22,226,154 | |
| Energy — 9.2% | | | | | | | | |
| Chevron Corporation | | | 35,547 | | | | 4,143,358 | |
| Exxon Mobil Corporation | | | 53,382 | | | | 4,881,784 | |
| National Oilwell Varco, Inc. | | | 32,395 | | | | 2,595,164 | |
| Occidental Petroleum Corporation | | | 28,296 | | | | 2,435,154 | |
| Schlumberger Ltd. | | | 41,383 | | | | 2,993,232 | |
| | | | | | | | 17,048,692 | |
| Financials — 20.5% | | | | | | | | |
| American Tower Corporation | | | 46,748 | | | | 3,337,340 | |
| Aon plc | | | 51,640 | | | | 2,700,255 | |
| Bank of America Corporation | | | 142,096 | | | | 1,254,708 | |
Berkshire Hathaway, Inc. - Class B (a) | | | 51,126 | | | | 4,509,313 | |
| Brookfield Asset Management, Inc. - Class A | | | 144,424 | | | | 4,984,072 | |
| Capital One Financial Corporation | | | 68,407 | | | | 3,899,883 | |
| Goldman Sachs Group, Inc. (The) | | | 25,085 | | | | 2,851,663 | |
| JPMorgan Chase & Company | | | 68,028 | | | | 2,753,773 | |
Markel Corporation (a) | | | 9,128 | | | | 4,185,097 | |
| T. Rowe Price Group, Inc. | | | 44,511 | | | | 2,817,546 | |
| Wells Fargo & Company | | | 129,994 | | | | 4,488,693 | |
| | | | | | | | 37,782,343 | |
| Health Care — 7.1% | | | | | | | | |
| Johnson & Johnson | | | 60,938 | | | | 4,199,238 | |
Laboratory Corporation of America Holdings (a) | | | 29,917 | | | | 2,766,425 | |
| Novo Nordisk A/S - ADR | | | 20,050 | | | | 3,164,090 | |
DAVENPORT CORE FUND SCHEDULE OF INVESTMENTS (Continued) |
COMMON STOCKS — 94.1% (Continued) | | | | | | |
| Health Care — 7.1% (Continued) | | | | | | |
| WellPoint, Inc. | | | 49,485 | | | $ | 2,870,625 | |
| | | | | | | | 13,000,378 | |
| Industrials — 8.2% | | | | | | | | |
| Danaher Corporation | | | 67,792 | | | | 3,738,729 | |
| Illinois Tool Works, Inc. | | | 44,174 | | | | 2,627,028 | |
| Stanley Black & Decker, Inc. | | | 38,768 | | | | 2,956,060 | |
| Union Pacific Corporation | | | 22,405 | | | | 2,659,473 | |
| United Technologies Corporation | | | 40,819 | | | | 3,195,720 | |
| | | | | | | | 15,177,010 | |
| Information Technology — 20.1% | | | | | | | | |
| Accenture plc - Class A | | | 54,399 | | | | 3,809,562 | |
| Apple, Inc. | | | 6,635 | | | | 4,427,270 | |
| Automatic Data Processing, Inc. | | | 48,265 | | | | 2,831,225 | |
Check Point Software Technologies Ltd. (a) | | | 52,510 | | | | 2,528,882 | |
Fiserv, Inc. (a) | | | 52,408 | | | | 3,879,764 | |
Google, Inc. - Class A (a) | | | 4,279 | | | | 3,228,505 | |
| Intel Corporation | | | 107,647 | | | | 2,441,434 | |
| International Business Machines Corporation | | | 21,152 | | | | 4,387,982 | |
| Microsoft Corporation | | | 101,853 | | | | 3,033,182 | |
| QUALCOMM, Inc. | | | 47,820 | | | | 2,988,272 | |
| Visa, Inc. - Class A | | | 25,788 | | | | 3,462,813 | |
| | | | | | | | 37,018,891 | |
| Materials — 2.9% | | | | | | | | |
| Albemarle Corporation | | | 52,693 | | | | 2,775,867 | |
| Praxair, Inc. | | | 25,291 | | | | 2,627,229 | |
| | | | | | | | 5,403,096 | |
| | | | | | | | | |
Total Common Stocks (Cost $127,696,331) | | | | | | $ | 173,592,565 | |
MONEY MARKET FUNDS — 4.9% | | | | | | |
First American Treasury Obligations Fund - Class Z, 0.00% (b) (Cost $9,088,235) | | | 9,088,235 | | | $ | 9,088,235 | |
| | | | | | | | | |
Total Investments at Value — 99.0% (Cost $136,784,566) | | | | | | $ | 182,680,800 | |
| | | | | | | | | |
| Other Assets in Excess of Liabilities — 1.0% | | | | | | | 1,851,756 | |
| | | | | | | | | |
| Net Assets — 100.0% | | | | | | $ | 184,532,556 | |
ADR - American Depositary Receipt.
| (a) | Non-income producing security. |
| (b) | Variable rate security. The rate shown is the 7-day effective yield as of September 30, 2012. |
See accompanying notes to financial statements.
DAVENPORT VALUE & INCOME FUND SCHEDULE OF INVESTMENTS September 30, 2012 (Unaudited) |
| | | | | | |
| Consumer Discretionary — 5.8% | | | | | | |
| Cracker Barrel Old Country Store, Inc. | | | 29,590 | | | $ | 1,985,785 | |
| Darden Restaurants, Inc. | | | 40,545 | | | | 2,260,384 | |
| McDonald's Corporation | | | 22,155 | | | | 2,032,721 | |
| VF Corporation | | | 13,030 | | | | 2,076,461 | |
| | | | | | | | 8,355,351 | |
| Consumer Staples — 19.9% | | | | | | | | |
| Altria Group, Inc. | | | 64,941 | | | | 2,168,380 | |
| Anheuser-Busch InBev SA/NV - ADR | | | 30,025 | | | | 2,579,448 | |
| Coca-Cola Company (The) | | | 77,925 | | | | 2,955,695 | |
| Diageo plc - ADR | | | 19,115 | | | | 2,154,834 | |
| Dr. Pepper Snapple Group, Inc. | | | 48,517 | | | | 2,160,462 | |
| H.J. Heinz Company | | | 32,735 | | | | 1,831,523 | |
| PepsiCo, Inc. | | | 41,040 | | | | 2,904,401 | |
| Philip Morris International, Inc. | | | 32,345 | | | | 2,909,109 | |
| Procter & Gamble Company (The) | | | 32,155 | | | | 2,230,271 | |
| Walgreen Company | | | 88,740 | | | | 3,233,686 | |
| Wal-Mart Stores, Inc. | | | 44,512 | | | | 3,284,985 | |
| | | | | | | | 28,412,794 | |
| Energy — 10.2% | | | | | | | | |
| BP plc - ADR | | | 50,160 | | | | 2,124,778 | |
| Chevron Corporation | | | 29,016 | | | | 3,382,105 | |
| Marathon Petroleum Corporation | | | 52,430 | | | | 2,862,154 | |
| Royal Dutch Shell plc - Class B - ADR | | | 49,435 | | | | 3,524,715 | |
| Teekay Shipping Corporation | | | 88,970 | | | | 2,775,864 | |
| | | | | | | | 14,669,616 | |
| Financials — 21.4% | | | | | | | | |
| Federated Investors, Inc. - Class B | | | 103,502 | | | | 2,141,456 | |
| Fidelity National Financial, Inc. - Class A | | | 189,485 | | | | 4,053,084 | |
| JPMorgan Chase & Company | | | 94,185 | | | | 3,812,609 | |
| Plum Creek Timber Company, Inc. | | | 66,060 | | | | 2,896,071 | |
| Sun Communities, Inc. | | | 79,093 | | | | 3,489,583 | |
| SunTrust Banks, Inc. | | | 100,070 | | | | 2,828,979 | |
| Travelers Companies, Inc. (The) | | | 50,600 | | | | 3,453,956 | |
| W.P. Carey & Company, LLC | | | 30,034 | | | | 1,471,666 | |
| Wells Fargo & Company | | | 106,895 | | | | 3,691,084 | |
| Weyerhaeuser Company | | | 107,774 | | | | 2,817,212 | |
| | | | | | | | 30,655,700 | |
| Health Care — 9.9% | | | | | | | | |
| Abbott Laboratories | | | 34,520 | | | | 2,366,691 | |
| GlaxoSmithKline plc - ADR | | | 71,140 | | | | 3,289,514 | |
| Johnson & Johnson | | | 51,905 | | | | 3,576,774 | |
| Merck & Company, Inc. | | | 58,565 | | | | 2,641,281 | |
DAVENPORT VALUE & INCOME FUND SCHEDULE OF INVESTMENTS (Continued) |
COMMON STOCKS — 91.5% (Continued) | | | | | | |
| Health Care — 9.9% (Continued) | | | | | | |
| WellPoint, Inc. | | | 39,830 | | | $ | 2,310,538 | |
| | | | | | | | 14,184,798 | |
| Industrials — 12.3% | | | | | | | | |
| 3M Company | | | 25,830 | | | | 2,387,209 | |
| Eaton Corporation | | | 53,400 | | | | 2,523,684 | |
| General Electric Company | | | 128,040 | | | | 2,907,788 | |
| Illinois Tool Works, Inc. | | | 34,525 | | | | 2,053,202 | |
| Norfolk Southern Corporation | | | 37,180 | | | | 2,365,763 | |
| Raytheon Company | | | 47,656 | | | | 2,724,017 | |
| Watsco, Inc. | | | 33,945 | | | | 2,572,692 | |
| | | | | | | | 17,534,355 | |
| Information Technology — 5.5% | | | | | | | | |
| Automatic Data Processing, Inc. | | | 48,095 | | | | 2,821,253 | |
| Intel Corporation | | | 108,450 | | | | 2,459,646 | |
| Microsoft Corporation | | | 87,980 | | | | 2,620,044 | |
| | | | | | | | 7,900,943 | |
| Materials — 3.3% | | | | | | | | |
| Dow Chemical Company (The) | | | 81,170 | | | | 2,350,683 | |
| E.I. du Pont de Nemours and Company | | | 46,785 | | | | 2,351,882 | |
| | | | | | | | 4,702,565 | |
| Telecommunication Services — 1.9% | | | | | | | | |
| Vodafone Group plc - ADR | | | 95,220 | | | | 2,713,294 | |
| | | | | | | | | |
| Utilities — 1.3% | | | | | | | | |
| Dominion Resources, Inc. | | | 34,720 | | | | 1,838,077 | |
| | | | | | | | | |
Total Common Stocks (Cost $116,900,927) | | | | | | $ | 130,967,493 | |
EXCHANGE-TRADED FUNDS — 2.6% | | | | | | |
| SPDR EURO STOXX 50 ETF (Cost $3,657,597) | | | 121,170 | | | $ | 3,759,905 | |
| | | | | | |
| Tortoise Energy Infrastructure Corporation (Cost $2,323,509) | | | 58,800 | | | $ | 2,380,224 | |
DAVENPORT VALUE & INCOME FUND SCHEDULE OF INVESTMENTS (Continued) |
MONEY MARKET FUNDS — 2.9% | | | | | | |
First American Treasury Obligations Fund - Class Z, 0.00% (a) (Cost $4,142,587) | | | 4,142,587 | | | $ | 4,142,587 | |
| | | | | | | | | |
Total Investments at Value — 98.7% (Cost $127,024,620) | | | | | | $ | 141,250,209 | |
| | | | | | | | | |
| Other Assets in Excess of Liabilities — 1.3% | | | | | | | 1,891,522 | |
| | | | | | | | | |
| Net Assets — 100.0% | | | | | | $ | 143,141,731 | |
ADR - American Depositary Receipt.
| (a) | Variable rate security. The rate shown is the 7-day effective yield as of September 30, 2012. |
See accompanying notes to financial statements.
DAVENPORT EQUITY OPPORTUNITIES FUND SCHEDULE OF INVESTMENTS September 30, 2012 (Unaudited) |
| | | | | | |
| Consumer Discretionary — 21.8% | | | | | | |
Brookfield Residential Properties, Inc. (a) | | | 61,540 | | | $ | 860,329 | |
CarMax, Inc. (a) | | | 107,970 | | | | 3,055,551 | |
Hanesbrands, Inc. (a) | | | 49,365 | | | | 1,573,756 | |
| International Game Technology | | | 164,015 | | | | 2,146,957 | |
Lamar Advertising Company - Class A (a) | | | 48,200 | | | | 1,786,292 | |
O'Reilly Automotive, Inc. (a) | | | 32,760 | | | | 2,739,391 | |
Penn National Gaming, Inc. (a) | | | 75,370 | | | | 3,248,447 | |
| | | | | | | | 15,410,723 | |
| Consumer Staples — 5.2% | | | | | | | | |
| Church & Dwight Company, Inc. | | | 26,640 | | | | 1,438,294 | |
| J.M. Smucker Company (The) | | | 25,685 | | | | 2,217,386 | |
| | | | | | | | 3,655,680 | |
| Financials — 30.6% | | | | | | | | |
| American Tower Corporation | | | 27,220 | | | | 1,943,236 | |
| Aon plc | | | 53,370 | | | | 2,790,717 | |
| Brookfield Asset Management, Inc. - Class A | | | 70,480 | | | | 2,432,265 | |
| Capital One Financial Corporation | | | 48,571 | | | | 2,769,033 | |
| Fidelity National Financial, Inc. - Class A | | | 96,885 | | | | 2,072,370 | |
Markel Corporation (a) | | | 7,410 | | | | 3,397,411 | |
| Safety Insurance Group, Inc. | | | 40,330 | | | | 1,850,340 | |
| Sun Communities, Inc. | | | 47,665 | | | | 2,102,980 | |
| SunTrust Banks, Inc. | | | 81,640 | | | | 2,307,963 | |
| | | | | | | | 21,666,315 | |
| Health Care — 3.6% | | | | | | | | |
Henry Schein, Inc. (a) | | | 18,185 | | | | 1,441,525 | |
Laboratory Corporation of America Holdings (a) | | | 11,805 | | | | 1,091,608 | |
| | | | | | | | 2,533,133 | |
| Industrials — 13.0% | | | | | | | | |
Babcock & Wilcox Company (a) | | | 45,414 | | | | 1,156,694 | |
Colfax Corporation (a) | | | 72,300 | | | | 2,651,241 | |
Delta Air Lines, Inc. (a) | | | 123,480 | | | | 1,131,077 | |
| Rockwell Collins, Inc. | | | 40,400 | | | | 2,167,056 | |
| Watsco, Inc. | | | 27,800 | | | | 2,106,962 | |
| | | | | | | | 9,213,030 | |
| Information Technology — 10.1% | | | | | | | | |
Check Point Software Technologies Ltd. (a) | | | 25,545 | | | | 1,230,247 | |
Fiserv, Inc. (a) | | | 24,355 | | | | 1,803,001 | |
| Intuit, Inc. | | | 29,965 | | | | 1,764,339 | |
NCR Corporation (a) | | | 100,611 | | | | 2,345,242 | |
| | | | | | | | 7,142,829 | |
DAVENPORT EQUITY OPPORTUNITIES FUND SCHEDULE OF INVESTMENTS (Continued) |
COMMON STOCKS — 94.2% (Continued) | | | | | | |
| Materials — 4.1% | | | | | | |
| Albemarle Corporation | | | 30,015 | | | $ | 1,581,190 | |
| NewMarket Corporation | | | 5,469 | | | | 1,347,999 | |
| | | | | | | | 2,929,189 | |
| Telecommunication Services — 2.8% | | | | | | | | |
| Millicom International Cellular S.A. | | | 21,630 | | | | 2,009,211 | |
| | | | | | | | | |
| Utilities — 3.0% | | | | | | | | |
| ITC Holdings Corporation | | | 28,100 | | | | 2,123,798 | |
| | | | | | | | | |
Total Common Stocks (Cost $58,864,117) | | | | | | $ | 66,683,908 | |
MONEY MARKET FUNDS — 2.7% | | | | | | |
First American Treasury Obligations Fund - Class Z, 0.00% (b) (Cost $1,945,790) | | | 1,945,790 | | | $ | 1,945,790 | |
| | | | | | | | | |
Total Investments at Value — 96.9% (Cost $60,809,907) | | | | | | $ | 68,629,698 | |
| | | | | | | | | |
| Other Assets in Excess of Liabilities — 3.1% | | | | | | | 2,197,905 | |
| | | | | | | | | |
| Net Assets — 100.0% | | | | | | $ | 70,827,603 | |
| (a) | Non-income producing security. |
| (b) | Variable rate security. The rate shown is the 7-day effective yield as of September 30, 2012. |
See accompanying notes to financial statements.
THE DAVENPORT FUNDS STATEMENTS OF ASSETS AND LIABILITIES September 30, 2012 (Unaudited) |
| | | | | Davenport Value & Income Fund | | | Davenport Equity Opportunities Fund | |
| ASSETS | | | | | | | | | |
| Investments in securities: | | | | | | | | | |
| At acquisition cost | | $ | 136,784,566 | | | $ | 127,024,620 | | | $ | 60,809,907 | |
| At market value (Note 2) | | $ | 182,680,800 | | | $ | 141,250,209 | | | $ | 68,629,698 | |
| Cash | | | 1,957,366 | | | | 3,727,184 | | | | 2,811,608 | |
| Dividends receivable | | | 131,430 | | | | 306,798 | | | | 26,206 | |
| Receivable for capital shares sold | | | 297,401 | | | | 717,662 | | | | 138,314 | |
| Other assets | | | 20,001 | | | | 15,983 | | | | 13,697 | |
| TOTAL ASSETS | | | 185,086,998 | | | | 146,017,836 | | | | 71,619,523 | |
| | | | | | | | | | | | | |
| LIABILITIES | | | | | | | | | | | | |
| Payable for capital shares redeemed | | | 405,244 | | | | 332,890 | | | | — | |
| Payable for investment securities purchased | | | — | | | | 2,429,299 | | | | 732,412 | |
| Accrued investment advisory fees (Note 4) | | | 126,325 | | | | 87,081 | | | | 45,171 | |
| Payable to administrator (Note 4) | | | 21,850 | | | | 16,925 | | | | 9,650 | |
| Other accrued expenses | | | 1,023 | | | | 9,910 | | | | 4,687 | |
| TOTAL LIABILITIES | | | 554,442 | | | | 2,876,105 | | | | 791,920 | |
| | | | | | | | | | | | | |
| NET ASSETS | | $ | 184,532,556 | | | $ | 143,141,731 | | | $ | 70,827,603 | |
| | | | | | | | | | | | | |
| Net assets consist of: | | | | | | | | | | | | |
| Paid-in capital | | $ | 143,616,360 | | | $ | 127,882,465 | | | $ | 62,233,239 | |
| Accumulated net investment income | | | 14,848 | | | | 19,745 | | | | 12,450 | |
Accumulated net realized gains (losses) from security transactions | | | (4,994,886 | ) | | | 1,013,932 | | | | 762,123 | |
| Net unrealized appreciation on investments | | | 45,896,234 | | | | 14,225,589 | | | | 7,819,791 | |
| Net assets | | $ | 184,532,556 | | | $ | 143,141,731 | | | $ | 70,827,603 | |
| | | | | | | | | | | | | |
Shares of beneficial interest outstanding (unlimited number of shares authorized, $0.01 par value) | | | 12,177,019 | | | | 11,943,440 | | | | 5,863,035 | |
| | | | | | | | | | | | | |
Net asset value, offering price and redemption price per share (Note 2) | | $ | 15.15 | | | $ | 11.98 | | | $ | 12.08 | |
See accompanying notes to financial statements.
THE DAVENPORT FUNDS STATEMENTS OF OPERATIONS Six Months Ended September 30, 2012 (Unaudited) |
| | | | | Davenport Value & Income Fund | | | Davenport Equity Opportunities Fund | |
| INVESTMENT INCOME | | | | | | | | | |
| Dividends | | $ | 1,500,617 | | | $ | 1,926,470 | | | $ | 349,511 | |
| Foreign withholding taxes on dividends | | | (31,322 | ) | | | (1,503 | ) | | | (9,635 | ) |
| Interest | | | 60 | | | | — | | | | — | |
| TOTAL INVESTMENT INCOME | | | 1,469,355 | | | | 1,924,967 | | | | 339,876 | |
| | | | | | | | | | | | | |
| EXPENSES | | | | | | | | | | | | |
| Investment advisory fees (Note 4) | | | 653,626 | | | | 430,428 | | | | 236,187 | |
| Administration fees (Note 4) | | | 117,591 | | | | 80,319 | | | | 48,389 | |
| Custodian and bank service fees | | | 9,210 | | | | 12,700 | | | | 5,766 | |
| Professional fees | | | 8,826 | | | | 7,716 | | | | 7,716 | |
| Registration and filing fees | | | 9,134 | | | | 7,265 | | | | 6,700 | |
| Compliance service fees (Note 4) | | | 9,479 | | | | 7,259 | | | | 5,421 | |
| Printing of shareholder reports | | | 7,476 | | | | 5,060 | | | | 3,868 | |
| Trustees’ fees and expenses | | | 4,102 | | | | 4,102 | | | | 4,102 | |
| Insurance expense | | | 5,855 | | | | 3,415 | | | | 2,260 | |
| Other expenses | | | 3,391 | | | | 9,357 | | | | 7,017 | |
| TOTAL EXPENSES | | | 828,690 | | | | 567,621 | | | | 327,426 | |
| | | | | | | | | | | | | |
| NET INVESTMENT INCOME | | | 640,665 | | | | 1,357,346 | | | | 12,450 | |
| | | | | | | | | | | | | |
REALIZED AND UNREALIZED GAINS (LOSSES) ON INVESTMENTS | | | | | | | | | | | | |
| Net realized gains from security transactions | | | 3,557,533 | | | | 2,002,998 | | | | 1,246,803 | |
Net change in unrealized appreciation/ depreciation on investments | | | (1,435,826 | ) | | | 3,617,236 | | | | (189,194 | ) |
| | | | | | | | | | | | | |
NET REALIZED AND UNREALIZED GAINS ON INVESTMENTS | | | 2,121,707 | | | | 5,620,234 | | | | 1,057,609 | |
| | | | | | | | | | | | | |
NET INCREASE IN NET ASSETS FROM OPERATIONS | | $ | 2,762,372 | | | $ | 6,977,580 | | | $ | 1,070,059 | |
See accompanying notes to financial statements.
DAVENPORT CORE FUND STATEMENTS OF CHANGES IN NET ASSETS |
| | Six Months Ended September 30, 2012 (Unaudited) | | | | |
| FROM OPERATIONS | | | | | | |
| Net investment income | | $ | 640,665 | | | $ | 1,034,589 | |
| Net realized gains from security transactions | | | 3,557,533 | | | | 2,194,465 | |
Net change in unrealized appreciation/ depreciation on investments | | | (1,435,826 | ) | | | 12,450,152 | |
| Net increase in net assets from operations | | | 2,762,372 | | | | 15,679,206 | |
| | | | | | | | | |
| DISTRIBUTIONS TO SHAREHOLDERS | | | | | | | | |
| From net investment income | | | (646,214 | ) | | | (1,036,002 | ) |
| | | | | | | | | |
| FROM CAPITAL SHARE TRANSACTIONS | | | | | | | | |
| Proceeds from shares sold | | | 15,903,385 | | | | 17,735,914 | |
Net asset value of shares issued in reinvestment of distributions to shareholders | | | 610,875 | | | | 972,757 | |
| Payments for shares redeemed | | | (8,995,568 | ) | | | (18,348,617 | ) |
| Net increase in net assets from capital share transactions | | | 7,518,692 | | | | 360,054 | |
| | | | | | | | | |
| TOTAL INCREASE IN NET ASSETS | | | 9,634,850 | | | | 15,003,258 | |
| | | | | | | | | |
| NET ASSETS | | | | | | | | |
| Beginning of period | | | 174,897,706 | | | | 159,894,448 | |
| End of period | | $ | 184,532,556 | | | $ | 174,897,706 | |
| | | | | | | | | |
| ACCUMULATED NET INVESTMENT INCOME | | $ | 14,848 | | | $ | 20,397 | |
| | | | | | | | | |
| CAPITAL SHARE ACTIVITY | | | | | | | | |
| Shares sold | | | 1,091,694 | | | | 1,299,210 | |
| Shares reinvested | | �� | 41,973 | | | | 73,427 | |
| Shares redeemed | | | (612,680 | ) | | | (1,362,591 | ) |
| Net increase in shares outstanding | | | 520,987 | | | | 10,046 | |
| Shares outstanding at beginning of period | | | 11,656,032 | | | | 11,645,986 | |
| Shares outstanding at end of period | | | 12,177,019 | | | | 11,656,032 | |
See accompanying notes to financial statements.
DAVENPORT VALUE & INCOME FUND STATEMENTS OF CHANGES IN NET ASSETS |
| | Six Months Ended September 30, 2012 (Unaudited) | | | | |
| FROM OPERATIONS | | | | | | |
| Net investment income | | $ | 1,357,346 | | | $ | 1,533,671 | |
| Net realized gains (losses) from security transactions | | | 2,002,998 | | | | (989,066 | ) |
Net change in unrealized appreciation/ depreciation on investments | | | 3,617,236 | | | | 9,378,913 | |
| Net increase in net assets from operations | | | 6,977,580 | | | | 9,923,518 | |
| | | | | | | | | |
| DISTRIBUTIONS TO SHAREHOLDERS | | | | | | | | |
| From net investment income | | | (1,358,204 | ) | | | (1,522,098 | ) |
| From net realized gains from security transactions | | | — | | | | (71,734 | ) |
| Decrease in net assets from distributions to shareholders | | | (1,358,204 | ) | | | (1,593,832 | ) |
| | | | | | | | | |
| FROM CAPITAL SHARE TRANSACTIONS | | | | | | | | |
| Proceeds from shares sold | | | 44,499,551 | | | | 44,865,899 | |
Net asset value of shares issued in reinvestment of distributions to shareholders | | | 1,185,785 | | | | 1,359,339 | |
| Payments for shares redeemed | | | (6,920,388 | ) | | | (4,628,047 | ) |
| Net increase in net assets from capital share transactions | | | 38,764,948 | | | | 41,597,191 | |
| | | | | | | | | |
| TOTAL INCREASE IN NET ASSETS | | | 44,384,324 | | | | 49,926,877 | |
| | | | | | | | | |
| NET ASSETS | | | | | | | | |
| Beginning of period | | | 98,757,407 | | | | 48,830,530 | |
| End of period | | $ | 143,141,731 | | | $ | 98,757,407 | |
| | | | | | | | | |
| ACCUMULATED NET INVESTMENT INCOME | | $ | 19,745 | | | $ | 20,603 | |
| | | | | | | | | |
| CAPITAL SHARE ACTIVITY | | | | | | | | |
| Shares sold | | | 3,862,417 | | | | 4,240,900 | |
| Shares reinvested | | | 101,390 | | | | 130,856 | |
| Shares redeemed | | | (599,226 | ) | | | (444,451 | ) |
| Net increase in shares outstanding | | | 3,364,581 | | | | 3,927,305 | |
| Shares outstanding at beginning of period | | | 8,578,859 | | | | 4,651,554 | |
| Shares outstanding at end of period | | | 11,943,440 | | | | 8,578,859 | |
See accompanying notes to financial statements.
DAVENPORT EQUITY OPPORTUNITIES FUND STATEMENTS OF CHANGES IN NET ASSETS |
| | Six Months Ended September 30, 2012 (Unaudited) | | | | |
| FROM OPERATIONS | | | | | | |
| Net investment income (loss) | | $ | 12,450 | | | $ | (99,423 | ) |
| Net realized gains (losses) from security transactions | | | 1,246,803 | | | | (469,701 | ) |
Net change in unrealized appreciation/ depreciation on investments | | | (189,194 | ) | | | 6,678,341 | |
| Net increase in net assets from operations | | | 1,070,059 | | | | 6,109,217 | |
| | | | | | | | | |
| DISTRIBUTIONS TO SHAREHOLDERS | | | | | | | | |
| From net realized gains from security transactions | | | — | | | | (163,030 | ) |
| | | | | | | | | |
| FROM CAPITAL SHARE TRANSACTIONS | | | | | | | | |
| Proceeds from shares sold | | | 12,829,396 | | | | 23,587,122 | |
Net asset value of shares issued in reinvestment of distributions to shareholders | | | — | | | | 157,487 | |
| Payments for shares redeemed | | | (2,206,543 | ) | | | (4,931,526 | ) |
| Net increase in net assets from capital share transactions | | | 10,622,853 | | | | 18,813,083 | |
| | | | | | | | | |
| TOTAL INCREASE IN NET ASSETS | | | 11,692,912 | | | | 24,759,270 | |
| | | | | | | | | |
| NET ASSETS | | | | | | | | |
| Beginning of period | | | 59,134,691 | | | | 34,375,421 | |
| End of period | | $ | 70,827,603 | | | $ | 59,134,691 | |
| | | | | | | | | |
| ACCUMULATED NET INVESTMENT INCOME | | $ | 12,450 | | | $ | — | |
| | | | | | | | | |
| CAPITAL SHARE ACTIVITY | | | | | | | | |
| Shares sold | | | 1,108,162 | | | | 2,186,580 | |
| Shares reinvested | | | — | | | | 15,593 | |
| Shares redeemed | | | (190,183 | ) | | | (464,812 | ) |
| Net increase in shares outstanding | | | 917,979 | | | | 1,737,361 | |
| Shares outstanding at beginning of period | | | 4,945,056 | | | | 3,207,695 | |
| Shares outstanding at end of period | | | 5,863,035 | | | | 4,945,056 | |
See accompanying notes to financial statements.
DAVENPORT CORE FUND FINANCIAL HIGHLIGHTS |
Selected Per Share Data and Ratios for a Share Outstanding Throughout Each Period | |
| | | Six Months Ended Sept. 30, 2012 (Unaudited) | | | | |
| | | 2012 | | | | 2011 | | | | 2010 | | | | 2009 | | | | 2008 | |
Net asset value at beginning of period | | $ | 15.00 | | | $ | 13.73 | | | $ | 12.05 | | | $ | 8.36 | | | $ | 13.82 | | | $ | 14.75 | |
| | | | | | | | | | | | | | | | | | | | | | | | | |
Income (loss) from investment operations: | | | | | | | | | | | | | | | | | | | | | | | | |
| Net investment income | | | 0.05 | | | | 0.09 | | | | 0.07 | | | | 0.08 | | | | 0.11 | | | | 0.10 | |
Net realized and unrealized gains (losses) on investments | | | 0.15 | | | | 1.27 | | | | 1.68 | | | | 3.69 | | | | (5.17 | ) | | | 0.53 | |
| Total from investment operations | | | 0.20 | | | | 1.36 | | | | 1.75 | | | | 3.77 | | | | (5.06 | ) | | | 0.63 | |
| | | | | | | | | | | | | | | | | | | | | | | | | |
| Less distributions: | | | | | | | | | | | | | | | | | | | | | | | | |
Dividends from net investment income | | | (0.05 | ) | | | (0.09 | ) | | | (0.07 | ) | | | (0.08 | ) | | | (0.11 | ) | | | (0.10 | ) |
Distributions from net realized gains | | | — | | | | — | | | | — | | | | — | | | | (0.29 | ) | | | (1.46 | ) |
| Total distributions | | | (0.05 | ) | | | (0.09 | ) | | | (0.07 | ) | | | (0.08 | ) | | | (0.40 | ) | | | (1.56 | ) |
| | | | | | | | | | | | | | | | | | | | | | | | | |
| Net asset value at end of period | | $ | 15.15 | | | $ | 15.00 | | | $ | 13.73 | | | $ | 12.05 | | | $ | 8.36 | | | $ | 13.82 | |
| | | | | | | | | | | | | | | | | | | | | | | | | |
Total return (a) | | | 1.37% | (b) | | | 9.99% | | | | 14.61% | | | | 45.20% | | | | (36.85% | ) | | | 3.44% | |
| | | | | | | | | | | | | | | | | | | | | | | | | |
| Net assets at end of period (000’s) | | $ | 184,533 | | | $ | 174,898 | | | $ | 159,894 | | | $ | 132,662 | | | $ | 92,358 | | | $ | 155,799 | |
| | | | | | | | | | | | | | | | | | | | | | | | | |
Ratio of total expenses to average net assets | | | 0.95% | (c) | | | 0.96% | | | | 0.99% | | | | 1.00% | | | | 1.00% | | | | 0.96% | |
| | | | | | | | | | | | | | | | | | | | | | | | | |
Ratio of net investment income to average net assets | | | 0.73% | (c) | | | 0.66% | | | | 0.58% | | | | 0.75% | | | | 0.98% | | | | 0.60% | |
| | | | | | | | | | | | | | | | | | | | | | | | | |
| Portfolio turnover rate | | | 12% | (b) | | | 19% | | | | 34% | | | | 25% | | | | 39% | | | | 37% | |
| (a) | Total return is a measure of the change in value of an investment in the Fund over the periods covered, which assumes any dividends or capital gains distributions are reinvested in shares of the Fund. Returns shown do not reflect the deduction of taxes a shareholder would pay on Fund distributions or the redemption of Fund shares. |
See accompanying notes to financial statements.
DAVENPORT VALUE & INCOME FUND FINANCIAL HIGHLIGHTS |
Selected Per Share Data and Ratios for a Share Outstanding Throughout Each Period |
| | Six Months Ended Sept. 30, 2012 (Unaudited) | | | | | | Period Ended March 31, 2011 (a) | |
| Net asset value at beginning of period | | $ | 11.51 | | | $ | 10.50 | | | $ | 10.00 | |
| | | | | | | | | | | | | |
| Income from investment operations: | | | | | | | | | | | | |
| Net investment income | | | 0.13 | | | | 0.23 | | | | 0.04 | |
| Net realized and unrealized gains on investments | | | 0.47 | | | | 1.02 | | | | 0.49 | |
| Total from investment operations | | | 0.60 | | | | 1.25 | | | | 0.53 | |
| | | | | | | | | | | | | |
| Less distributions: | | | | | | | | | | | | |
| Dividends from net investment income | | | (0.13 | ) | | | (0.23 | ) | | | (0.03 | ) |
| Distributions from net realized gains | | | — | | | | (0.01 | ) | | | — | |
| Total distributions | | | (0.13 | ) | | | (0.24 | ) | | | (0.03 | ) |
| | | | | | | | | | | | | |
| Net asset value at end of period | | $ | 11.98 | | | $ | 11.51 | | | $ | 10.50 | |
| | | | | | | | | | | | | |
Total return (b) | | | 5.23% | (c) | | | 12.23% | | | | 5.35% | (c) |
| | | | | | | | | | | | | |
| Net assets at end of period (000’s) | | $ | 143,142 | | | $ | 98,757 | | | $ | 48,831 | |
| | | | | | | | | | | | | |
| Ratio of total expenses to average net assets | | | 0.99% | (d) | | | 1.04% | | | | 1.25% | (d) |
| | | | | | | | | | | | | |
| Ratio of net investment income to average net assets | | | 2.36% | (d) | | | 2.30% | | | | 1.99% | (d) |
| | | | | | | | | | | | | |
| Portfolio turnover rate | | | 11% | (c) | | | 27% | | | | 10% | (c) |
| (a) | Represents the period from commencement of operations (December 31, 2010) through March 31, 2011. |
| (b) | Total return is a measure of the change in value of an investment in the Fund over the periods covered, which assumes any dividends or capital gains distributions are reinvested in shares of the Fund. Returns shown do not reflect the deduction of taxes a shareholder would pay on Fund distributions or the redemption of Fund shares. |
See accompanying notes to financial statements.
DAVENPORT EQUITY OPPORTUNITIES FUND FINANCIAL HIGHLIGHTS |
Selected Per Share Data and Ratios for a Share Outstanding Throughout Each Period |
| | Six Months Ended Sept. 30, 2012 (Unaudited) | | | | | | Period Ended March 31, 2011 (a) | |
| Net asset value at beginning of period | | $ | 11.96 | | | $ | 10.72 | | | $ | 10.00 | |
| | | | | | | | | | | | | |
| Income (loss) from investment operations: | | | | | | | | | | | | |
| Net investment income (loss) | | | 0.00 | (b) | | | (0.02 | ) | | | (0.01 | ) |
| Net realized and unrealized gains on investments | | | 0.12 | | | | 1.30 | | | | 0.73 | |
| Total from investment operations | | | 0.12 | | | | 1.28 | | | | 0.72 | |
| | | | | | | | | | | | | |
| Less distributions: | | | | | | | | | | | | |
| Distributions from net realized gains | | | — | | | | (0.04 | ) | | | — | |
| | | | | | | | | | | | | |
| Net asset value at end of period | | $ | 12.08 | | | $ | 11.96 | | | $ | 10.72 | |
| | | | | | | | | | | | | |
Total return (c) | | | 1.00% | (d) | | | 12.00% | | | | 7.20% | (d) |
| | | | | | | | | | | | | |
| Net assets at end of period (000’s) | | $ | 70,828 | | | $ | 59,135 | | | $ | 34,375 | |
| | | | | | | | | | | | | |
| Ratio of total expenses to average net assets | | | 1.04% | (e) | | | 1.10% | | | | 1.25% | (e) |
| | | | | | | | | | | | | |
| Ratio of net investment income (loss) to average net assets | | | 0.04% | (e) | | | (0.22% | ) | | | (0.40% | )(e) |
| | | | | | | | | | | | | |
| Portfolio turnover rate | | | 16% | (d) | | | 35% | | | | 6% | (d) |
| (a) | Represents the period from commencement of operations (December 31, 2010) through March 31, 2011. |
| (b) | Amount rounds to less than a penny per share. |
| (c) | Total return is a measure of the change in value of an investment in the Fund over the periods covered, which assumes any dividends or capital gains distributions are reinvested in shares of the Fund. Returns shown do not reflect the deduction of taxes a shareholder would pay on Fund distributions or the redemption of Fund shares. |
See accompanying notes to financial statements.
THE DAVENPORT FUNDS NOTES TO FINANCIAL STATEMENTS September 30, 2012 (Unaudited) |
1. Organization
Davenport Core Fund, Davenport Value & Income Fund and Davenport Equity Opportunities Fund (individually, a “Fund,” and, collectively, the “Funds”) are each a no-load, diversified series of the Williamsburg Investment Trust (the “Trust”), an open-end management investment company registered under the Investment Company Act of 1940. The Trust was organized as a Massachusetts business trust on July 18, 1988. Other series of the Trust are not incorporated in this report. Davenport Core Fund began operations on January 15, 1998. Davenport Value & Income Fund and Davenport Equity Opportunities Fund each began operations on December 31, 2010.
Davenport Core Fund’s investment objective is long term growth of capital.
Davenport Value & Income Fund’s investment objective is to achieve long term growth while generating current income through dividend payments on portfolio securities.
Davenport Equity Opportunities Fund’s investment objective is long term capital appreciation.
2. Significant Accounting Policies
The following is a summary of the Funds’ significant accounting policies. The policies are in conformity with accounting principles generally accepted in the United States of America (“GAAP”).
Securities valuation — The Funds’ portfolio securities are valued as of the close of business of the regular session of the New York Stock Exchange (normally 4:00 p.m., Eastern time). Securities traded on a national stock exchange are valued based upon the closing price on the principal exchange where the security is traded. Securities which are quoted by NASDAQ are valued at the NASDAQ Official Closing Price. Securities which are traded over-the-counter are valued at the last sales price, if available, otherwise, at the last quoted bid price. Fixed income securities will ordinarily be traded in the over-the-counter market and common stocks will ordinarily be traded on a national securities exchange, but may also be traded in the over-the-counter market.
When market quotations are not readily available, securities may be valued on the basis of prices provided by an independent pricing service. The prices provided by the pricing service are determined with consideration given to institutional bid and last sale prices and take into account securities prices, yields, maturities, call features, ratings, institutional trading in similar groups of securities and developments related to specific securities. If a pricing service cannot provide a valuation, securities will be valued in good faith at fair value using methods consistent with those determined by the Board of Trustees and will be classified as Level 2 or 3 (see below) within the fair value hierarchy, depending on the inputs used. Such methods of fair valuation may include, but are not limited to: multiple of earnings, multiple of book value, discount from market of a similar freely traded security, purchase price of the security, subsequent private transactions in the security or related securities, or a combination of these and other factors.
THE DAVENPORT FUNDS NOTES TO FINANCIAL STATEMENTS (Continued) |
Short-term instruments (those with remaining maturities of 60 days or less) may be valued at amortized cost, which approximates market value. Money market funds have been determined to be represented at amortized cost which approximates fair value, absent unusual circumstances.
GAAP establishes a single authoritative definition of fair value, sets out a framework for measuring fair value and requires additional disclosures about fair value measurements.
Various inputs are used in determining the value of the Funds’ investments. These inputs are summarized in the three broad levels listed below:
• Level 1 – quoted prices in active markets for identical securities
• Level 2 – other significant observable inputs
• Level 3 – significant unobservable inputs
The inputs or methodology used for valuing securities are not necessarily an indication of the risks associated with investing in those securities. The inputs used to measure fair value may fall into different levels of the fair value hierarchy. In such cases, for disclosure purposes, the level in the fair value hierarchy within which the fair value measurement falls in its entirety is determined based on the lowest level input that is significant to the fair value measurement.
The following is a summary of the inputs used to value the Funds’ investments as of September 30, 2012 by security type:
| | | | | | | | | | | | |
| Common Stocks | | $ | 173,592,565 | | | $ | — | | | $ | — | | | $ | 173,592,565 | |
| Money Market Funds | | | 9,088,235 | | | | — | | | | — | | | | 9,088,235 | |
| Total | | $ | 182,680,800 | | | $ | — | | | $ | — | | | $ | 182,680,800 | |
Davenport Value & Income Fund | | | | | | | | | | | | |
| Common Stocks | | $ | 130,967,493 | | | $ | — | | | $ | — | | | $ | 130,967,493 | |
| Exchange-Traded Funds | | | 3,759,905 | | | | — | | | | — | | | | 3,759,905 | |
| Closed-End Funds | | | 2,380,224 | | | | — | | | | — | | | | 2,380,224 | |
| Money Market Funds | | | 4,142,587 | | | | — | | | | — | | | | 4,142,587 | |
| Total | | $ | 141,250,209 | | | $ | — | | | $ | — | | | $ | 141,250,209 | |
Davenport Equity Opportunities Fund | | | | | | | | | | | | |
| Common Stocks | | $ | 66,683,908 | | | $ | — | | | $ | — | | | $ | 66,683,908 | |
| Money Market Funds | | | 1,945,790 | | | | — | | | | — | | | | 1,945,790 | |
| Total | | $ | 68,629,698 | | | $ | — | | | $ | — | | | $ | 68,629,698 | |
THE DAVENPORT FUNDS NOTES TO FINANCIAL STATEMENTS (Continued) |
Refer to each Fund’s Schedule of Investments for a listing of the securities valued using Level 1 inputs by sector type. As of September 30, 2012, the Funds did not have any transfers in and out of any Level. There were no Level 2 or Level 3 securities or derivative instruments held by the Funds as of September 30, 2012. It is the Funds’ policy to recognize transfers into and out of any Level at the end of the reporting period.
Repurchase agreements — The Funds may enter into repurchase agreements. The repurchase agreement, which is collateralized by U.S. Government obligations, is valued at cost which, together with accrued interest, approximates market value. At the time a Fund enters into the repurchase agreement, the Fund takes possession of the underlying securities and the seller agrees that the value of the underlying securities, including accrued interest, will at all times be equal to or exceed the face amount of the repurchase agreement. In addition, the Funds actively monitor and seek additional collateral, as needed. If the seller defaults, the fair value of the collateral may decline and realization of the collateral by the Funds may be delayed or limited.
Share valuation — The net asset value per share of each Fund is calculated daily by dividing the total value of its assets, less liabilities, by the number of shares outstanding. The offering price and redemption price per share of each Fund is equal to the net asset value per share.
Investment income — Interest income is accrued as earned. Dividend income is recorded on the ex-dividend date. Discounts and premiums on fixed-income securities purchased are amortized using the interest method.
Security transactions — Security transactions are accounted for on trade date for financial reporting purposes. Gains and losses on securities sold are determined on a specific identification basis.
Common expenses — Common expenses of the Trust are allocated among the funds within the Trust based on relative net assets of each fund or the nature of the services performed and the relative applicability to each fund.
Distributions to shareholders — Dividends arising from net investment income, if any, are declared and paid quarterly to shareholders of Davenport Core Fund and Davenport Value & Income Fund; and declared and paid annually to shareholders of Davenport Equity Opportunities Fund. Net realized short-term capital gains, if any, may be distributed throughout the year and net realized long-term capital gains, if any, are distributed at least once each year. The amount of distributions from net investment income and net realized gains are determined in accordance with federal income tax regulations which may differ from GAAP. Dividends and distributions are recorded on the ex-dividend date.
THE DAVENPORT FUNDS NOTES TO FINANCIAL STATEMENTS (Continued) |
The tax character of distributions paid during the periods ended September 30, 2012 and March 31, 2012 is as follows:
| | | | | | | |
| Davenport Core Fund | 9/30/12 | | $ | 646,214 | | | $ | 646,214 | |
| | 3/31/12 | | $ | 1,036,002 | | | $ | 1,036,002 | |
| Davenport Value & Income Fund | 9/30/12 | | $ | 1,358,204 | | | $ | 1,358,204 | |
| | 3/31/12 | | $ | 1,593,832 | | | $ | 1,593,832 | |
| Davenport Equity Opportunities Fund | 9/30/12 | | $ | — | | | $ | — | |
| | 3/31/12 | | $ | 163,030 | | | $ | 163,030 | |
Estimates — The preparation of financial statements in conformity with GAAP requires management to make estimates and assumptions that affect the reported amounts of assets and liabilities and disclosure of contingent assets and liabilities as of the date of the financial statements and the reported amounts of income and expenses during the reporting period. Actual results could differ from those estimates.
Federal income tax — It is each Fund’s policy to comply with the special provisions of Subchapter M of the Internal Revenue Code applicable to regulated investment companies. As provided therein, in any fiscal year in which a Fund so qualifies and distributes at least 90% of its taxable net income, the Fund (but not the shareholders) will be relieved of federal income tax on the income distributed. Accordingly, no provision for income taxes has been made.
In order to avoid imposition of the excise tax applicable to regulated investment companies, it is also each Fund’s intention to declare as dividends in each calendar year at least 98% of its net investment income (earned during the calendar year) and 98.2% of its net realized capital gains (earned during the twelve months ended October 31) plus undistributed amounts from prior years.
The following information is computed on a tax basis for each item as of September 30, 2012:
| | | | | Davenport Value & Income Fund | | | Davenport Equity Opportunities Fund | |
| Cost of portfolio investments | | $ | 137,120,733 | | | $ | 127,024,620 | | | $ | 60,849,022 | |
| Gross unrealized appreciation | | $ | 47,121,442 | | | $ | 15,509,971 | | | $ | 9,114,652 | |
| Gross unrealized depreciation | | | (1,561,375 | ) | | | (1,284,382 | ) | | | (1,333,976 | ) |
| Net unrealized appreciation | | | 45,560,067 | | | | 14,225,589 | | | | 7,780,676 | |
| Accumulated ordinary income | | | 14,848 | | | | 19,745 | | | | 12,450 | |
| Capital loss carryforward | | | (8,216,252 | ) | | | (510,828 | ) | | | — | |
| Other gains | | | 3,557,533 | | | | 1,524,760 | | | | 801,238 | |
| Total distributable earnings | | $ | 40,916,196 | | | $ | 15,259,266 | | | $ | 8,594,364 | |
THE DAVENPORT FUNDS NOTES TO FINANCIAL STATEMENTS (Continued) |
The difference between the federal income tax cost and the financial statement cost for Davenport Core Fund and Davenport Equity Opportunities Fund is due to certain timing differences in the recognition of capital gains and losses under income tax regulations and GAAP. These timing differences are temporary in nature and are due to the tax deferral of losses on wash sales.
Under the Regulated Investment Company Modernization Act of 2010 (the “Act”), net capital losses recognized after March 31, 2011, may be carried forward indefinitely, and their character is retained as short-term and/or long-term losses. Under the law in effect prior to the Act, pre-enactment net capital losses were carried forward for eight years and treated as short-term losses. As a transition rule, the Act requires that post-enactment net capital losses be used before pre-enactment net capital losses. Therefore, there may be a greater likelihood that all or a portion of Davenport Core Fund’s pre-enactment capital loss carryover may expire without being utilized.
As of March 31, 2012, Davenport Core Fund had a short-term capital loss carryforward of $8,216,252, which expires March 31, 2018, and Davenport Value & Income Fund had a short-term capital loss carryforward of $510,828, which does not expire. These capital loss carryforwards may be utilized in the current and future years to offset net realized capital gains, if any, prior to distributing such gains to shareholders.
The Funds recognize the tax benefits or expenses of uncertain tax positions only when the position is “more likely than not” to be sustained assuming examination by tax authorities. Management has reviewed the tax positions taken on Federal income tax returns for all applicable open tax years (tax years ended March 31, 2009 through March 31, 2012) of each Fund and has concluded that no provision for unrecognized tax benefits or expenses is required in these financial statements.
3. Investment Transactions
During the six months ended September 30, 2012, the cost of purchases and proceeds from sales and maturities of investment securities, other than short-term investments and U.S. Government securities, totaled $20,177,860 and $19,772,146, respectively, for Davenport Core Fund; $47,740,748 and $12,122,364, respectively, for Davenport Value & Income Fund; and $18,071,117 and $9,738,529, respectively, for Davenport Equity Opportunities Fund.
4. Transactions with Affiliates
INVESTMENT ADVISORY AGREEMENT
Each Fund’s investments are managed by Davenport & Company LLC (the “Adviser”) under the terms of an Investment Advisory Agreement. Under the Investment Advisory Agreement, each Fund pays the Adviser a fee, which is computed and accrued daily and paid monthly, at an annual rate of .75% on its average daily net assets.
Certain officers of the Trust are also officers of the Adviser.
THE DAVENPORT FUNDS NOTES TO FINANCIAL STATEMENTS (Continued) |
MUTUAL FUND SERVICES AGREEMENT
Under the terms of a Mutual Fund Services Agreement between the Trust and Ultimus Fund Solutions, LLC (“Ultimus”), Ultimus provides administrative, pricing, accounting, dividend disbursing, shareholder servicing and transfer agent services for the Funds. For these services, Ultimus receives a monthly fee from each Fund at an annual rate of .15% on its average daily net assets up to $25 million, .125% on the next $25 million of such assets and .10% on such assets in excess of $50 million, subject to a minimum monthly fee of $4,000, plus a shareholder recordkeeping fee at the annual rate of $10 per shareholder account in excess of 1,000 accounts. In addition, the Funds pay out-of-pocket expenses including, but not limited to, postage, supplies and costs of pricing the Funds’ portfolio securities.
Certain officers of the Trust are also officers of Ultimus, or of Ultimus Fund Distributors, LLC (the “Distributor”), the principal underwriter of the Funds’ shares and an affiliate of Ultimus. The Distributor is compensated by the Advisor (not the Funds) for acting as principal underwriter.
COMPLIANCE CONSULTING AGREEMENT
Under the terms of a Compliance Consulting Agreement between the Trust and Ultimus, Ultimus provides an individual to serve as the Trust’s Chief Compliance Officer and to administer the Trust’s compliance policies and procedures. For these services, the Funds pay Ultimus an annual base fee of $18,600 plus an asset-based fee equal to 0.01% per annum on the Funds’ aggregate average net assets in excess of $100 million. In addition, the Funds reimburse Ultimus for any reasonable out-of-pocket expenses, if any, incurred in providing these services.
5. Sector Risk
If a Fund has significant investments in the securities of issuers in industries within a particular sector, any development affecting that sector will have a greater impact on the value of the net assets of the Fund than would be the case if the Fund did not have significant investments in that sector. In addition, this may increase the risk of loss of an investment in the Fund and increase the volatility of the Fund’s net asset value per share. As of September 30, 2012, Davenport Equity Opportunities Fund had 30.6% of the value of its net assets invested in stocks within the Financials sector. From time to time, circumstances may affect a particular sector and the companies within such sector. For instance, economic or market factors, regulation or deregulation, or other developments may negatively impact all companies in a particular sector and therefore the value of the Fund’s portfolio would be adversely affected.
6. Contingencies and Commitments
The Funds indemnify the Trust’s officers and Trustees for certain liabilities that might arise from their performance of their duties to the Funds. Additionally, in the normal course of business the Funds enter into contracts that contain a variety of representations and warranties and which provide general indemnifications. The Funds’ maximum exposure under these arrangements is unknown, as this would involve future claims that may be made against the Funds that have not yet occurred. However, based on experience, the Funds expect the risk of loss to be remote.
THE DAVENPORT FUNDS NOTES TO FINANCIAL STATEMENTS (Continued) |
7. Subsequent Events
The Funds are required to recognize in the financial statements the effects of all subsequent events that provide additional evidence about conditions that existed as of the date of the Statements of Assets and Liabilities. For non-recognized subsequent events that must be disclosed to keep the financial statements from being misleading, the Funds are required to disclose the nature of the event as well as an estimate of its financial effect, or a statement that such an estimate cannot be made. Management has evaluated subsequent events through the issuance of these financial statements and has noted no such events.
THE DAVENPORT FUNDS YOUR FUNDS’ EXPENSES (Unaudited) |
We believe it is important for you to understand the impact of costs on your investment. All mutual funds have operating expenses. As a shareholder of the Funds, you incur ongoing costs, including management fees and other expenses. These ongoing costs, which are deducted from each Fund’s gross income, directly reduce the investment return of the Funds.
A mutual fund’s ongoing costs are expressed as a percentage of its average net assets. This figure is known as the expense ratio. The following examples are intended to help you understand the ongoing costs (in dollars) of investing in the Funds and to compare these costs with the ongoing costs of investing in other mutual funds. The examples below are based on an investment of $1,000 made at the beginning of the period shown and held for the entire period (April 1, 2012 through September 30, 2012).
The table below illustrates each Fund’s ongoing costs in two ways:
Actual fund return – This section helps you to estimate the actual expenses that you paid over the period. The “Ending Account Value” shown is derived from each Fund’s actual return, and the third column shows the dollar amount of operating expenses that would have been paid by an investor who started with $1,000 in the Funds. You may use the information here, together with the amount you invested, to estimate the expenses that you paid over the period.
To do so, simply divide your account value by $1,000 (for example, an $8,600 account value divided by $1,000 = 8.6), then multiply the result by the number given for the Funds under the heading “Expenses Paid During Period.”
Hypothetical 5% return – This section is intended to help you compare each Fund’s ongoing costs with those of other mutual funds. It assumes that each Fund had an annual return of 5% before expenses during the period shown, but that the expense ratio is unchanged. In this case, because the return used is not each Fund’s actual return, the results do not apply to your investment. The example is useful in making comparisons because the Securities and Exchange Commission (“SEC”) requires all mutual funds to calculate expenses based on a 5% return. You can assess each Fund’s ongoing costs by comparing this hypothetical example with the hypothetical examples that appear in shareholder reports of other funds.
Note that expenses shown in the table are meant to highlight and help you compare ongoing costs only. The Funds do not charge transaction fees, such as purchase or redemption fees, nor do they carry a “sales load.”
The calculations assume no shares were bought or sold during the period. Your actual costs may have been higher or lower, depending on the amount of your investment and the timing of any purchases or redemptions.
More information about each Fund’s expenses, including historical annual expense ratios, can be found in this report. For additional information on operating expenses and other shareholder costs, please refer to the Funds’ prospectus.
THE DAVENPORT FUNDS YOUR FUNDS’ EXPENSES (Unaudited) (Continued) |
| Beginning Account Value April 1, 2012 | Ending Account Value Sept. 30, 2012 | Expenses Paid During Period* |
| Based on Actual Fund Return | $1,000.00 | $1,013.70 | $4.78 |
| Based on Hypothetical 5% Return (before expenses) | $1,000.00 | $1,020.25 | $4.80 |
| * | Expenses are equal to Davenport Core Fund’s annualized expense ratio of 0.95% for the period, multiplied by the average account value over the period, multiplied by 183/366 (to reflect the one-half year period). |
Davenport Value & Income Fund | Beginning Account Value April 1, 2012 | Ending Account Value Sept. 30, 2012 | Expenses Paid During Period* |
| Based on Actual Fund Return | $1,000.00 | $1,052.30 | $5.08 |
| Based on Hypothetical 5% Return (before expenses) | $1,000.00 | $1,020.10 | $5.00 |
| * | Expenses are equal to Davenport Value & Income Fund’s annualized expense ratio of 0.99% for the period, multiplied by the average account value over the period, multiplied by 183/366 (to reflect the one-half year period). |
Davenport Equity Opportunities Fund | Beginning Account Value April 1, 2012 | Ending Account Value Sept. 30, 2012 | Expenses Paid During Period* |
| Based on Actual Fund Return | $1,000.00 | $1,010.00 | $5.23 |
| Based on Hypothetical 5% Return (before expenses) | $1,000.00 | $1,019.80 | $5.25 |
| * | Expenses are equal to Davenport Equity Opportunities Fund’s annualized expense ratio of 1.04% for the period, multiplied by the average account value over the period, multiplied by 183/366 (to reflect the one-half year period). |
THE DAVENPORT FUNDS OTHER INFORMATION (Unaudited) |
A description of the policies and procedures that the Funds use to vote proxies relating to portfolio securities is available without charge upon request by calling toll-free 1-800-281-3217, or on the SEC’s website at http://www.sec.gov. Information regarding how the Funds voted proxies relating to portfolio securities during the most recent 12-month period ended June 30 is also available without charge upon request by calling toll-free 1-800-281-3217, or on the SEC’s website at http://www.sec.gov.
The Trust files a complete listing of portfolio holdings for the Funds with the SEC as of the end of the first and third quarters of each fiscal year on Form N-Q. These filings are available upon request by calling 1-800-281-3217. Furthermore, you may obtain a copy of these filings on the SEC’s website at http://www.sec.gov. The Trust’s Forms N-Q may also be reviewed and copied at the SEC’s Public Reference Room in Washington, DC, and information on the operation of the Public Reference Room may be obtained by calling 1-800-SEC-0330.
A complete listing of portfolio holdings for the Funds is updated daily and can be reviewed at the Funds’ website at http://www.investdavenport.com.
This page intentionally left blank.
This page intentionally left blank.
| | THE DAVENPORT FUNDS Investment Adviser Davenport & Company LLC One James Center 901 East Cary Street Richmond, Virginia 23219-4037 Administrator Ultimus Fund Solutions, LLC P.O. Box 46707 Cincinnati, Ohio 45246-0707 1-800-281-3217 Custodian US Bank NA 425 Walnut Street Cincinnati, Ohio 45202 Independent Registered Public Accounting Firm Ernst & Young LLP 1900 Scripps Center 312 Walnut Street Cincinnati, Ohio 45202 Legal Counsel Sullivan & Worcester LLP One Post Office Square Boston, Massachusetts 02109 Board of Trustees John P. Ackerly, IV John T. Bruce Robert S. Harris J. Finley Lee, Jr. Richard L. Morrill Harris V. Morrissette Officers John P. Ackerly, IV, President I. Lee Chapman, IV, Vice President George L. Smith, III, Vice President | |
Davenport & Company LLC
One James Center
901 East Cary Street
Richmond, VA 23219
Member: NYSE • SIPC
Toll Free: (800) 846-6666
www.investdavenport.com
| | | | | | |
| | | | | | | |
| | | | | | | |
| | | | Semi-Annual Report September 30, 2012 (Unaudited) | | | |
| | | | | | | |
| | | | | | | |
| | | | | | |
We are pleased to report on your Funds and their investments for the semi-annual period ended September 30, 2012. Much transpired which affected the markets over this six month period, ranging from concerns over tepid economic growth in the U.S. and beyond, to issues involved in addressing and resolving the U.S. fiscal cliff. The hotly contested race for the White House also added greatly to uncertainty about the future course for the U.S.
Economic and Market Update
Equity markets around the world fell during the second quarter of 2012 as concerns about economic growth increased. The decline was widespread with almost every country index being in the red for the quarter. At one point in early June, U.S. large cap indexes were down almost 10% for the quarter, erasing much of the double-digit gain seen earlier in the year. Among the items of concern was the U.S. Supreme Court ruling on the health care reform plan that came late in June and the fact that the U.S. presidential election campaign rhetoric began in earnest when it became clear that President Obama would face former Massachusetts Governor Mitt Romney in November. The political uncertainty contributed to an environment of caution among corporations in the U.S., many citing that investment and spending plans are on hold until there is more clarity. Additionally, JP Morgan Chase shocked investors by reporting a multi-billion dollar trading loss which caused confidence in financials, which was already fragile, to plummet further. But perhaps the most significant concern was in Europe where Spain and Italy became the latest countries to see their borrowing costs rise to unsustainable levels. While the European sovereign debt issue had been lingering for some time, it had been most evident in several of the smaller economies such as Greece and Ireland. With Spain and Italy, the sixth and fourth largest economies in the E.U., perceived as being at risk, investors became concerned that the problem would be more difficult to contain, and the chances were higher that a European recession would bring about worldwide contagion. When U.S. economic numbers began to indicate signs of slowing growth in the quarter, many began to see this as confirmation that the European slowdown was indeed spreading.
The U.S. economy continued to exhibit very slow growth during the third quarter of 2012 as well. Unemployment remained stubbornly high at levels near 8%. With little improvement in Europe, and China showing signs of slowing growth, the global economic picture appeared to be worsening. Furthermore, the geopolitical situation continued to be unstable, especially in the Middle East as Iranian/Israeli tensions built and other countries dealt with riots and violence in the streets. Oil prices remained elevated in light of the instability in the region. The one bright spot on the economic horizon was the continued improvement in the domestic housing market. The latest S&P/Case-Shiller home price index moved higher, with all 20 cities in the index experiencing rising home prices. Housing starts have also moved higher after remaining at trough levels for almost 4 years.
In the face of these increased risks, policy makers responded. The Fed announced in August that it planned additional purchases of bonds and mortgages, commonly referred to as QE3. Perhaps even more significant than QE3 was the July 26 announcement by European Central Bank President Mario Draghi that the ECB “will do whatever it takes to preserve the euro.” Draghi’s statement spoke volumes about the commitment of European policy makers to address the sovereign debt concerns that have engulfed Greece, Spain and Italy. This, in turn, gave investors hope that the economic weakness in the European Union could be contained. Investors cheered the policy moves and stock markets rallied worldwide.
Looking forward, the fiscal cliff and how it will be resolved remain a significant uncertainty for the U.S. economy. It is important that our leaders begin to address the rising government budget deficits and the huge run-up in government debt. Now that the election is behind us, President Obama has a fresh opportunity to
work with Congressional leaders to address these issues and hopefully pass bi-partisan legislation that builds a foundation for long term improvement. The U.S. economy continues to expand, but at a very slow and uneven pace. We expect this pattern to continue for the foreseeable future. As noted, housing is improving which should lead to better employment news. Lower gasoline prices will be a stimulant to consumer buying just in time for the Christmas selling season, so near term the economy may display an uptick. Rebuilding the areas devastated by Hurricane Sandy will also add to GDP growth in the coming quarters.
FBP Equity & Dividend Plus Fund Review
We began repositioning the Fund’s portfolio during the fourth quarter of 2011 to be more diversified and hold lower volatility securities. Our ultimate goal is to provide a higher level of income with a more predictable and stable return pattern. The Fund has had a nice recovery as prices have rebounded from the depressed levels of a year ago, generating a return of +23.65% over the twelve months ended September 30, 2012. For the semi-annual period ended September 30, the Fund returned +0.84%, reflecting the difficult spring period and ensuing recovery. Health Care, Industrials and Utilities were among the best performing sectors for the Fund, while Information Technology, Consumer Discretionary and Financials were laggards. Some of the more significant portfolio changes for the period were the additions of new positions in Emerson Electric, Applied Materials, PPL Corp., Cisco Systems and People’s United Financial. Emerson, a large industrial manufacturer to the electronics industry, and Applied Materials, the world’s largest semiconductor capital equipment manufacturer, were added based on attractive valuation levels and elevated yields due to their depressed share prices. PPL is an electric utility with regulated operations in Pennsylvania, Kentucky, and the United Kingdom. The company is currently trading at discounted valuation levels and a higher yield than its electric utility peers. We added Cisco to the portfolio after the company boosted its dividend payout. This high-quality technology company has an attractive dividend yield and we expect the dividend to increase at above average rates going forward because management has expressed its objective to distribute 50% of the company’s free cash flow to shareholders in the form of dividends and stock repurchases going forward. We also added a position in People’s United Financial, one of the largest independent banks in New England. People’s United has an attractive dividend yield, above 5%, and its balance sheet strength provides excess capital which can be utilized to grow its loan portfolio or returned to shareholders in the form of dividends and share buybacks. We sold positions in Duke Energy, Abbott Labs, and Kraft given that each of these stocks traded at what we believed to be full valuation levels versus their historical ranges and we sold the Fund’s shares of SuperValu and Nokia, both of which were disappointing investments that exhibited weakening fundamentals and declining stock prices. We also sold the small position in Phillips 66 that we received following a spinoff from ConocoPhillips. In addition, our shares of the BB&T Trust Preferred were called early by the company.
FBP Appreciation & Income Opportunities Fund Review
For the twelve months ended September 30, 2012, the Fund returned +18.68% from the depressed levels of a year ago, participating in the improvement of the equity market but being held back by low returns available on fixed income investments. The return for the most recent semi-annual period ended September 30, 2012 is -0.05%. We positioned the Fund with a higher equity exposure early in 2012, reaching over 80% in stocks as of March 31. The increased equity exposure came primarily from higher dividend yielding stocks, which we believe are attractive investment opportunities in today’s low interest rate environment. As the markets improved over the fall, we began to lower that exposure so that by September 30 the asset mix was 73.3% equity, 14.4% fixed income and 12.3% cash. For the semi-annual period ended September 30, 2012, Consumer Discretionary, Health Care, Industrials and Utilities were among the best performing sectors for the Fund, while Information Technology and Financials were laggards. Some of the more significant portfolio changes for the period were the additions of new positions in Archer-Daniels-Midland, Best Buy,
PPL Corp., First Energy, and Intel. Archer-Daniels-Midland is an agricultural commodities company that is a global leader in the processing of corn, soybeans, wheat and other crops which are transformed into food products and ingredients, animal feeds and biofuels such as ethanol. We used Archer’s stock price decline during the height of the summer drought as a buying opportunity. In our view, the company has a shareholder friendly management team that returns much of its cash flow to shareholders through stock buybacks and dividends. Both PPL and First Energy are electric utilities that were trading at discounted valuation levels and higher yields than their electric utility peers. Intel was added as its shares weakened and its dividend yield rose above 4%. We sold positions in Phillip Morris and McGraw-Hill as each of these stocks traded at what we believed to be full valuation levels versus their historical ranges. We also sold the Fund’s remaining position in WellPoint and the small position in Phillips 66 that we received following a spinoff from ConocoPhillips. In addition, our shares of the BB&T Trust Preferred were called early by the company.
For both Funds, we expect that during the next several months we will have opportunities to reinvest the proceeds of some of these recent sales into companies with more attractive yields and price appreciation potential. Reported earnings this quarter were mixed at best compared to expectations; GDP still remains sluggish and worries over the fiscal cliff, Europe and China have caused a number of companies to reduce their revenue and earnings forecasts for the fourth quarter of 2012 and also next year. We expect the next few months to be challenging as our leaders in Washington work to resolve the country’s fiscal issues. Companies remain cautious, which inhibits capital spending and hiring. With the uncertain economic environment, we continue to look to invest in companies that generate cash and especially those that return much of this cash to shareholders through dividends and share repurchases. Recent market weakness is beginning to provide some attractive investment opportunities.
We want to thank you for your continued support and investment in the Flippin, Bruce & Porter Funds. Please visit our website at www.fbpfunds.com for information on your Funds and the investment philosophy and process we utilize to achieve their investment objectives.
John T. Bruce, CFA
President - Portfolio Manager
November 8, 2012
Data presented reflects past performance, which is no guarantee of future results. Investment results and principal value will fluctuate so that shares, when redeemed, may be worth more or less than their original cost. Due to market volatility, current performance may be higher or lower than the performance shown. Updated performance information, current through the most recent month-end, is available by contacting the Funds at 1-866-738-1127.
This report is submitted for the general information of the shareholders of the Funds. It reflects our views, opinions and portfolio holdings as of September 30, 2012, the end of the reporting period. These views are subject to change at any time based upon market or other conditions. For more current information throughout the year please visit www.fbpfunds.com or call the Funds at 1-866-738-1127. This report is not authorized for distribution to prospective investors in the Funds unless accompanied by a current prospectus. Distributed by Ultimus Fund Distributors, LLC.
THE FLIPPIN, BRUCE & PORTER FUNDS COMPARATIVE PERFORMANCE CHARTS (Unaudited) |
Performance for each Fund is compared to the most appropriate broad-based index, the S&P 500® Index, an unmanaged index of 500 large common stocks. Results are also compared to the Consumer Price Index, a measure of inflation.
THE FLIPPIN, BRUCE & PORTER FUNDS COMPARATIVE PERFORMANCE CHARTS (Unaudited) (Continued) |
Average Annual Total Returns(a) (for periods ended September 30, 2012) |
| | 1 Year | 5 Years | 10 Years | |
| FBP Equity & Dividend Plus Fund | 23.65% | (4.97%) | 4.54% | |
| FBP Appreciation & Income Opportunities Fund | 18.68% | (1.06%) | 5.19% | |
Standard & Poor’s 500® Index | 30.20% | 1.05% | 8.01% | |
| Consumer Price Index | 1.71% | 2.07% | 2.54% | |
| (a) | Total returns are a measure of the change in value of an investment in the Funds over the periods covered, which assumes any dividends or capital gains distributions are reinvested in shares of the Funds. Returns do not reflect the deduction of taxes a shareholder would pay on the Funds’ distributions or the redemption of Fund shares. |
FBP EQUITY & DIVIDEND PLUS FUND PORTFOLIO INFORMATION September 30, 2012 (Unaudited) |
| | | Asset Allocation (% of Net Assets) |
| Net Asset Value Per Share | $19.02 |  |
| Total Net Assets (Millions) | $22.0 |
| Current Expense Ratio | 1.07% |
| Portfolio Turnover | 15% |
| Fund Inception Date | 7/30/1993 |
| | | |
| FBP Equity & Dividend Plus Fund | |
| Number of Stocks | 46 | 500 |
| Weighted Avg Market Capitalization (Billions) | $81.9 | $121.5 |
| Price-to-Earnings Ratio (Bloomberg 1 Yr. Forecast EPS) | 10.8 | 12.9 |
| Price-to-Book Value | 1.8 | 2.3 |
Sector Diversification vs. the S&P 500® Index |
| Ten Largest Equity Holdings | % of Net Assets |
| JPMorgan Chase & Company | 4.2% |
| Johnson & Johnson | 3.3% |
| ConocoPhillips | 3.2% |
| Royal Dutch Shell plc - Class A - ADR | 3.1% |
| Chevron Corporation | 3.0% |
| Lockheed Martin Corporation | 3.0% |
| Travelers Companies, Inc. (The) | 2.9% |
| 3M Company | 2.9% |
| Computer Sciences Corporation | 2.9% |
| Microsoft Corporation | 2.9% |
FBP APPRECIATION & INCOME OPPORTUNITIES FUND PORTFOLIO INFORMATION September 30, 2012 (Unaudited) |
| | | Asset Allocation (% of Net Assets) |
| Net Asset Value Per Share | | |
| Total Net Assets (Millions) | |
| Current Expense Ratio | |
| Portfolio Turnover | |
| |
| | | |
| | |
| | | |
| | | |
| | | |
| | |
Common Stock Portfolio (73.3% of Net Assets) |
| Number of Stocks | 55 |
| Weighted Avg Market Capitalization (Billions) | $70.7 |
| Price-to-Earnings Ratio (Bloomberg 1 Yr. Forecast EPS) | 10.1 |
| Price-to-Book Value | 1.5 |
Ten Largest Equity Holdings | |
| JPMorgan Chase & Company | 3.0% |
| Microsoft Corporation | 2.5% |
| Johnson & Johnson | 2.5% |
| Lockheed Martin Corporation | 2.3% |
| Cisco Systems, Inc. | 2.2% |
| Travelers Companies, Inc. (The) | 2.2% |
| ConocoPhillips | 2.1% |
| Pfizer, Inc. | 2.0% |
| Royal Dutch Shell plc - Class A - ADR | 2.0% |
| MetLife, Inc. | 2.0% |
| |
| Financials | 13.7% |
| Information Technology | 11.4% |
| Industrials | 10.8% |
| Energy | 9.1% |
| Consumer Staples | 6.5% |
Fixed-Income Portfolio (14.4% of Fund) |
| Number of Fixed-Income Securities | 7 |
| Average Quality | BBB+ |
| Average Weighted Maturity | 1.7 yrs. |
| Average Effective Duration | 1.6 yrs. |
| |
| Financials | 6.1% |
| Industrials | 3.8% |
| Information Technology | 2.3% |
| Consumer Discretionary | 2.2% |
FBP EQUITY & DIVIDEND PLUS FUND SCHEDULE OF INVESTMENTS September 30, 2012 (Unaudited) |
| | | | | | |
| Consumer Discretionary — 7.4% | | | | | | |
| Best Buy Company, Inc. | | | 17,000 | | | $ | 292,230 | |
| H&R Block, Inc. | | | 30,000 | | | | 519,900 | |
Kohl's Corporation (a) | | | 9,000 | | | | 460,980 | |
| Staples, Inc. | | | 30,000 | | | | 345,600 | |
| | | | | | | | 1,618,710 | |
| Consumer Staples — 15.1% | | | | | | | | |
| Avon Products, Inc. | | | 20,000 | | | | 319,000 | |
Coca-Cola Company (The) (a) | | | 5,000 | | | | 189,650 | |
| Conagra Foods, Inc. | | | 21,000 | | | | 579,390 | |
Kimberly-Clark Corporation (a) | | | 7,000 | | | | 600,460 | |
| PepsiCo, Inc. | | | 8,800 | | | | 622,776 | |
| Procter & Gamble Company (The) | | | 9,100 | | | | 631,176 | |
| Sysco Corporation | | | 12,000 | | | | 375,240 | |
| | | | | | | | 3,317,692 | |
| Energy — 9.3% | | | | | | | | |
| Chevron Corporation | | | 5,700 | | | | 664,392 | |
| ConocoPhillips | | | 12,200 | | | | 697,596 | |
| Royal Dutch Shell plc - Class A - ADR | | | 10,000 | | | | 694,100 | |
| | | | | | | | 2,056,088 | |
| Financials — 15.2% | | | | | | | | |
Bank of Hawaii Corporation (a) | | | 6,000 | | | | 273,720 | |
| Bank of New York Mellon Corporation (The) | | | 20,000 | | | | 452,400 | |
BB&T Corporation (a) | | | 10,000 | | | | 331,600 | |
| JPMorgan Chase & Company | | | 23,000 | | | | 931,040 | |
| Manulife Financial Corporation | | | 22,000 | | | | 264,880 | |
| MetLife, Inc. | | | 6,000 | | | | 206,760 | |
| People's United Financial, Inc. | | | 19,000 | | | | 230,660 | |
Travelers Companies, Inc. (The) (a) | | | 9,501 | | | | 648,539 | |
| | | | | | | | 3,339,599 | |
| Health Care — 10.1% | | | | | | | | |
Eli Lilly & Company (a) | | | 8,500 | | | | 402,985 | |
| Johnson & Johnson | | | 10,400 | | | | 716,664 | |
| Merck & Company, Inc. | | | 12,000 | | | | 541,200 | |
| Pfizer, Inc. | | | 23,000 | | | | 571,550 | |
| | | | | | | | 2,232,399 | |
| Industrials — 16.1% | | | | | | | | |
3M Company (a) | | | 7,000 | | | | 646,940 | |
| Avery Dennison Corporation | | | 16,000 | | | | 509,120 | |
| Emerson Electric Company | | | 9,500 | | | | 458,565 | |
| General Electric Company | | | 23,000 | | | | 522,330 | |
| Koninklijke Philips Electronics N.V. - ADR | | | 20,000 | | | | 469,000 | |
Lockheed Martin Corporation (a) | | | 7,000 | | | | 653,660 | |
| R.R. Donnelley & Sons Company | | | 26,000 | | | | 275,600 | |
| | | | | | | | 3,535,215 | |
| Information Technology — 12.0% | | | | | | | | |
| Applied Materials, Inc. | | | 30,000 | | | | 334,950 | |
| Cisco Systems, Inc. | | | 19,300 | | | | 368,437 | |
FBP EQUITY & DIVIDEND PLUS FUND SCHEDULE OF INVESTMENTS (Continued) |
COMMON STOCKS — 97.3% (Continued) | | | | | | |
| Information Technology — 12.0% (Continued) | | | | | | |
Computer Sciences Corporation (a) | | | 20,000 | | | $ | 644,200 | |
| Hewlett-Packard Company | | | 25,000 | | | | 426,500 | |
| Intel Corporation | | | 10,000 | | | | 226,800 | |
Microsoft Corporation (a) | | | 21,500 | | | | 640,270 | |
| | | | | | | | 2,641,157 | |
| Materials — 4.3% | | | | | | | | |
| Bemis Company, Inc. | | | 5,000 | | | | 157,350 | |
| Nucor Corporation | | | 11,000 | | | | 420,860 | |
| Sealed Air Corporation | | | 23,700 | | | | 366,402 | |
| | | | | | | | 944,612 | |
| Telecommunication Services — 2.2% | | | | | | | | |
| AT&T, Inc. | | | 13,000 | | | | 490,100 | |
| | | | | | | | | |
| Utilities — 5.6% | | | | | | | | |
| American Electric Power Company, Inc. | | | 10,000 | | | | 439,400 | |
| FirstEnergy Corporation | | | 8,000 | | | | 352,800 | |
| PPL Corporation | | | 15,300 | | | | 444,465 | |
| | | | | | | | 1,236,665 | |
| | | | | | | | | |
Total Common Stocks (Cost $18,963,618) | | | | | | $ | 21,412,237 | |
MONEY MARKET FUNDS — 2.2% | | | | | | |
Fidelity Institutional Money Market Government Portfolio - Class I, 0.01% (b) (Cost $490,210) | | | 490,210 | | | $ | 490,210 | |
| | | | | | | | | |
Total Investments at Value — 99.5% (Cost $19,453,828) | | | | | | $ | 21,902,447 | |
| | | | | | | | | |
| Other Assets in Excess of Liabilities — 0.5% | | | | | | | 110,377 | |
| | | | | | | | | |
| Net Assets — 100.0% | | | | | | $ | 22,012,824 | |
| ADR - American Depositary Receipt. |
| |
| (a) | Security covers a written call option. |
| | |
| (b) | Variable rate security. The rate shown is the 7-day effective yield as of September 30, 2012. |
| | |
| See accompanying notes to financial statements. |
FBP EQUITY & DIVIDEND PLUS FUND SCHEDULE OF OPEN OPTION CONTRACTS September 30, 2012 (Unaudited) |
| | | | | | | | | |
| 3M Company, | | | | | | | | | |
| 04/20/2013 at $100 | | | 35 | | | $ | 4,935 | | | $ | 8,679 | |
| Bank of Hawaii Corporation, | | | | | | | | | | | | |
| 10/20/2012 at $50 | | | 30 | | | | 900 | | | | 5,760 | |
| BB&T Corporation, | | | | | | | | | | | | |
| 01/19/2013 at $34 | | | 30 | | | | 2,850 | | | | 4,859 | |
| Coca-Cola Company (The), | | | | | | | | | | | | |
| 11/17/2012 at $39 | | | 50 | | | | 3,000 | | | | 3,325 | |
| Computer Sciences Corporation, | | | | | | | | | | | | |
| 01/18/2014 at $35 | | | 50 | | | | 19,500 | | | | 13,599 | |
| Eli Lilly & Company, | | | | | | | | | | | | |
| 10/20/2012 at $45 | | | 85 | | | | 24,480 | | | | 12,833 | |
| Kimberly-Clark Corporation, | | | | | | | | | | | | |
| 01/19/2013 at $83 | | | 70 | | | | 30,730 | | | | 12,039 | |
| Kohl's Corporation, | | | | | | | | | | | | |
| 04/20/2013 at $60 | | | 45 | | | | 4,050 | | | | 8,189 | |
| Lockheed Martin Corporation, | | | | | | | | | | | | |
| 01/19/2013 at $88 | | | 40 | | | | 28,400 | | | | 13,079 | |
| Microsoft Corporation, | | | | | | | | | | | | |
| 01/19/2013 at $35 | | | 68 | | | | 1,020 | | | | 9,655 | |
| Travelers Companies, Inc. (The), | | | | | | | | | | | | |
| 01/19/2013 at $65 | | | 40 | | | | 18,000 | | | | 10,479 | |
| | | | | | | $ | 137,865 | | | $ | 102,496 | |
| See accompanying notes to financial statements. |
FBP APPRECIATION & INCOME OPPORTUNITIES FUND SCHEDULE OF INVESTMENTS September 30, 2012 (Unaudited) |
| | | | | | |
| Consumer Discretionary — 6.3% | | | | | | |
| Best Buy Company, Inc. | | | 13,000 | | | $ | 223,470 | |
| H&R Block, Inc. | | | 32,000 | | | | 554,560 | |
KB Home (a) | | | 15,000 | | | | 215,250 | |
| Kohl's Corporation | | | 9,500 | | | | 486,590 | |
Macy's, Inc. (a) | | | 9,000 | | | | 338,580 | |
| Staples, Inc. | | | 31,000 | | | | 357,120 | |
| | | | | | | | 2,175,570 | |
| Consumer Staples — 6.5% | | | | | | | | |
| Archer-Daniels-Midland Company | | | 8,000 | | | | 217,440 | |
| Avon Products, Inc. | | | 24,000 | | | | 382,800 | |
| CVS Caremark Corporation | | | 9,000 | | | | 435,780 | |
Kimberly-Clark Corporation (a) | | | 3,000 | | | | 257,340 | |
| PepsiCo, Inc. | | | 4,200 | | | | 297,234 | |
| SUPERVALU, Inc. | | | 44,000 | | | | 106,040 | |
| Walgreen Company | | | 6,000 | | | | 218,640 | |
| Wal-Mart Stores, Inc. | | | 4,500 | | | | 332,100 | |
| | | | | | | | 2,247,374 | |
| Energy — 9.1% | | | | | | | | |
| Baker Hughes, Inc. | | | 11,000 | | | | 497,530 | |
| Chevron Corporation | | | 5,000 | | | | 582,800 | |
| ConocoPhillips | | | 12,500 | | | | 714,750 | |
| Devon Energy Corporation | | | 11,000 | | | | 665,500 | |
| Royal Dutch Shell plc - Class A - ADR | | | 10,000 | | | | 694,100 | |
| | | | | | | | 3,154,680 | |
| Financials — 13.7% | | | | | | | | |
| Bank of America Corporation | | | 69,000 | | | | 609,270 | |
| Bank of New York Mellon Corporation (The) | | | 20,000 | | | | 452,400 | |
| Comerica, Inc. | | | 14,500 | | | | 450,225 | |
| JPMorgan Chase & Company | | | 26,000 | | | | 1,052,480 | |
| Lincoln National Corporation | | | 20,000 | | | | 483,800 | |
| Manulife Financial Corporation | | | 24,000 | | | | 288,960 | |
| MetLife, Inc. | | | 20,000 | | | | 689,200 | |
Travelers Companies, Inc. (The) (a) | | | 11,000 | | | | 750,860 | |
| | | | | | | | 4,777,195 | |
| Health Care — 6.3% | | | | | | | | |
| Johnson & Johnson | | | 12,500 | | | | 861,375 | |
| Merck & Company, Inc. | | | 14,000 | | | | 631,400 | |
| Pfizer, Inc. | | | 28,000 | | | | 695,800 | |
| | | | | | | | 2,188,575 | |
| Industrials — 10.8% | | | | | | | | |
| Avery Dennison Corporation | | | 14,500 | | | | 461,390 | |
FedEx Corporation (a) | | | 5,400 | | | | 456,948 | |
| General Electric Company | | | 17,000 | | | | 386,070 | |
Ingersoll-Rand plc (a) | | | 11,000 | | | | 493,020 | |
| Koninklijke Philips Electronics N.V. - ADR | | | 19,000 | | | | 445,550 | |
Lockheed Martin Corporation (a) | | | 8,400 | | | | 784,392 | |
Masco Corporation (a) | | | 12,500 | | | | 188,125 | |
FBP APPRECIATION & INCOME OPPORTUNITIES FUND SCHEDULE OF INVESTMENTS (Continued) |
COMMON STOCKS — 73.3% (Continued) | | | | | | |
| Industrials — 10.8% (Continued) | | | | | | |
| Northrop Grumman Corporation | | | 5,000 | | | $ | 332,150 | |
| R.R. Donnelley & Sons Company | | | 20,000 | | | | 212,000 | |
| | | | | | | | 3,759,645 | |
| Information Technology — 11.4% | | | | | | | | |
| Cisco Systems, Inc. | | | 40,000 | | | | 763,600 | |
Computer Sciences Corporation (a) | | | 20,000 | | | | 644,200 | |
| Dell, Inc. | | | 35,000 | | | | 345,100 | |
Flextronics International Ltd. (b) | | | 35,000 | | | | 210,000 | |
| Hewlett-Packard Company | | | 29,000 | | | | 494,740 | |
| Intel Corporation | | | 10,000 | | | | 226,800 | |
Microsoft Corporation (a) | | | 29,000 | | | | 863,620 | |
| Western Union Company (The) | | | 23,000 | | | | 419,060 | |
| | | | | | | | 3,967,120 | |
| Materials — 5.1% | | | | | | | | |
E.I. du Pont de Nemours and Company (a) | | | 12,000 | | | | 603,240 | |
Martin Marietta Materials, Inc. (a) | | | 5,000 | | | | 414,350 | |
| Nucor Corporation | | | 8,000 | | | | 306,080 | |
| Sealed Air Corporation | | | 29,000 | | | | 448,340 | |
| | | | | | | | 1,772,010 | |
| Utilities — 4.1% | | | | | | | | |
| American Electric Power Company, Inc. | | | 10,000 | | | | 439,400 | |
| Duke Energy Corporation | | | 5,333 | | | | 345,578 | |
| FirstEnergy Corporation | | | 5,000 | | | | 220,500 | |
| PPL Corporation | | | 14,000 | | | | 406,700 | |
| | | | | | | | 1,412,178 | |
| | | | | | | | | |
Total Common Stocks (Cost $21,383,708) | | | | | | $ | 25,454,347 | |
| | | | | | |
| Consumer Discretionary — 2.2% | | | | | | |
| Anheuser-Busch InBev SA/NV, 3.00%, due 10/15/2012 | | $ | 750,000 | | | $ | 750,642 | |
| | | | | | | | | |
| Financials — 6.1% | | | | | | | | |
| American Express Company, 4.875%, due 07/15/2013 | | | 750,000 | | | | 775,473 | |
| Berkley (W.R.) Corporation, 5.60%, due 05/15/2015 | | | 750,000 | | | | 820,533 | |
| Prudential Financial, Inc., 3.00%, due 05/12/2016 | | | 500,000 | | | | 526,387 | |
| | | | | | | | 2,122,393 | |
| Industrials — 3.8% | | | | | | | | |
| Eaton Corporation, 5.95%, due 03/20/2014 | | | 750,000 | | | | 805,870 | |
| Equifax, Inc., 4.45%, due 12/01/2014 | | | 500,000 | | | | 529,154 | |
| | | | | | | | 1,335,024 | |
| Information Technology — 2.3% | | | | | | | | |
| Analog Devices, Inc., 5.00%, due 07/01/2014 | | | 750,000 | | | | 809,498 | |
| | | | | | | | | |
Total Corporate Bonds (Cost $4,810,858) | | | | | | $ | 5,017,557 | |
FBP APPRECIATION & INCOME OPPORTUNITIES FUND SCHEDULE OF INVESTMENTS (Continued) |
MONEY MARKET FUNDS — 4.9% | | | | | | |
Fidelity Institutional Money Market Government Portfolio - Class I, 0.01% (c) (Cost $1,694,249) | | | 1,694,249 | | | $ | 1,694,249 | |
REPURCHASE AGREEMENTS — 8.9% | | | | | | |
U.S. Bank N.A., 0.01%, dated 09/28/2012, due 10/01/2012, repurchase proceeds: $3,104,104 (Cost $3,104,102) (d) | | $ | 3,104,102 | | | $ | 3,104,102 | |
| | | | | | | | | |
Total Investments at Value — 101.5% (Cost $30,992,917) | | | | | | $ | 35,270,255 | |
| | | | | | | | | |
| Liabilities in Excess of Other Assets — (1.5%) | | | | | | | (532,496 | ) |
| | | | | | | | | |
| Net Assets — 100.0% | | | | | | $ | 34,737,759 | |
| ADR - American Depositary Receipt. |
| |
| (a) | Security covers a written call option. |
| | |
| (b) | Non-income producing security. |
| | |
| (c) | Variable rate security. The rate shown is the 7-day effective yield as of September 30, 2012. |
| | |
| (d) | Repurchase agreement is fully collateralized by $2,930,188 FGCI #E99430, 4.50%, due 09/01/2018. The aggregate market value of the collateral at September 30, 2012 was $3,166,235. |
| | |
| See accompanying notes to financial statements. |
FBP APPRECIATION & INCOME OPPORTUNITIES FUND SCHEDULE OF OPEN OPTION CONTRACTS September 30, 2012 (Unaudited) |
| | | | | | | | | |
| Computer Sciences Corporation, | | | | | | | | | |
| 01/18/2014 at $35 | | | 50 | | | $ | 19,500 | | | $ | 13,599 | |
| E.I. du Pont de Nemours and Company, | | | | | | | | | | | | |
| 10/20/2012 at $55 | | | 90 | | | | 270 | | | | 23,218 | |
| FedEx Corporation, | | | | | | | | | | | | |
| 01/19/2013 at $105 | | | 28 | | | | 308 | | | | 14,755 | |
| Ingersoll-Rand plc, | | | | | | | | | | | | |
| 01/19/2013 at $50 | | | 15 | | | | 1,350 | | | | 3,752 | |
| KB Home, | | | | | | | | | | | | |
| 01/19/2013 at $10 | | | 100 | | | | 45,800 | | | | 12,598 | |
| Kimberly-Clark Corporation, | | | | | | | | | | | | |
| 01/19/2013 at $83 | | | 30 | | | | 13,170 | | | | 5,310 | |
| Lockheed Martin Corporation, | | | | | | | | | | | | |
| 01/19/2013 at $88 | | | 40 | | | | 28,400 | | | | 13,079 | |
| Macy's, Inc., | | | | | | | | | | | | |
| 11/17/2012 at $40 | | | 90 | | | | 5,130 | | | | 22,678 | |
| Martin Marietta Materials, Inc., | | | | | | | | | | | | |
| 01/19/2013 at $85 | | | 25 | | | | 12,500 | | | | 13,944 | |
| Masco Corporation, | | | | | | | | | | | | |
| 01/19/2013 at $15 | | | 60 | | | | 9,000 | | | | 5,819 | |
| Microsoft Corporation, | | | | | | | | | | | | |
| 10/20/2012 at $31 | | | 70 | | | | 1,400 | | | | 8,578 | |
| Travelers Companies, Inc. (The), | | | | | | | | | | | | |
| 01/19/2013 at $65 | | | 40 | | | | 18,000 | | | | 10,519 | |
| | | | | | | $ | 154,828 | | | $ | 147,849 | |
| See accompanying notes to financial statements. |
THE FLIPPIN, BRUCE & PORTER FUNDS STATEMENTS OF ASSETS AND LIABILITIES September 30, 2012 (Unaudited) |
| | FBP Equity & Dividend Plus Fund | | | FBP Appreciation & Income Opportunities Fund | |
| ASSETS | | | | | | |
| Investments in securities: | | | | | | |
| At acquisition cost | | $ | 19,453,828 | | | $ | 30,992,917 | |
| At value (Note 2) | | $ | 21,902,447 | | | $ | 35,270,255 | |
| Cash | | | — | | | | 2,400 | |
| Dividends and interest receivable | | | 44,421 | | | | 104,482 | |
| Receivable for investment securities sold | | | 428,954 | | | | 246,475 | |
| Receivable for capital shares sold | | | 1,196 | | | | 2,942 | |
| Other assets | | | 7,595 | | | | 5,419 | |
| TOTAL ASSETS | | | 22,384,613 | | | | 35,631,973 | |
| | | | | | | | | |
| LIABILITIES | | | | | | | | |
Covered call options, at value (Notes 2 and 5) (premiums received $102,496 and $147,849, respectively) | | | 137,865 | | | | 154,828 | |
| Distributions payable | | | 4,133 | | | | 23,693 | |
| Payable for investment securities purchased | | | — | | | | 671,901 | |
| Payable for capital shares redeemed | | | 207,926 | | | | 10,783 | |
| Accrued investment advisory fees (Note 4) | | | 8,419 | | | | 18,230 | |
| Payable to administrator (Note 4) | | | 4,700 | | | | 4,800 | |
| Other accrued expenses | | | 8,746 | | | | 9,979 | |
| TOTAL LIABILITIES | | | 371,789 | | | | 894,214 | |
| | | | | | | | | |
| NET ASSETS | | $ | 22,012,824 | | | $ | 34,737,759 | |
| | | | | | | | | |
| Net assets consist of: | | | | | | | | |
| Paid-in capital | | $ | 21,893,224 | | | $ | 29,950,090 | |
Accumulated (distributions in excess of) net investment income | | | 2,352 | | | | (55,025 | ) |
Accumulated net realized gains (losses) from security transactions | | | (2,296,002 | ) | | | 572,335 | |
| Net unrealized appreciation (depreciation) on: | | | | | | | | |
| Investments | | | 2,448,619 | | | | 4,277,338 | |
| Option contracts | | | (35,369 | ) | | | (6,979 | ) |
| Net assets | | $ | 22,012,824 | | | $ | 34,737,759 | |
| | | | | | | | | |
Shares of beneficial interest outstanding (unlimited number of shares authorized, $0.01 par value) | | | 1,157,420 | | | | 2,217,040 | |
| | | | | | | | | |
Net asset value, offering price and redemption price per share (Note 2) | | $ | 19.02 | | | $ | 15.67 | |
| See accompanying notes to financial statements. |
THE FLIPPIN, BRUCE & PORTER FUNDS STATEMENTS OF OPERATIONS Six Months Ended September 30, 2012 (Unaudited) |
| | FBP Equity & Dividend Plus Fund | | | FBP Appreciation & Income Opportunities Fund | |
| INVESTMENT INCOME | | | | | | |
| Dividends | | $ | 409,185 | | | $ | 449,391 | |
| Foreign withholding taxes on dividends | | | (8,437 | ) | | | (7,306 | ) |
| Interest | | | 29 | | | | 96,074 | |
| TOTAL INVESTMENT INCOME | | | 400,777 | | | | 538,159 | |
| | | | | | | | | |
| EXPENSES | | | | | | | | |
| Investment advisory fees (Note 4) | | | 76,944 | | | | 123,237 | |
| Administration fees (Note 4) | | | 24,000 | | | | 25,182 | |
| Professional fees | | | 9,056 | | | | 9,874 | |
| Registration and filing fees | | | 7,868 | | | | 5,481 | |
| Compliance service fees (Note 4) | | | 4,200 | | | | 4,200 | |
| Trustees’ fees and expenses | | | 4,102 | | | | 4,102 | |
| Custodian and bank service fees | | | 3,567 | | | | 3,843 | |
| Printing of shareholder reports | | | 3,767 | | | | 2,401 | |
| Postage and supplies | | | 2,329 | | | | 1,731 | |
| Insurance expense | | | 1,064 | | | | 1,698 | |
| Other expenses | | | 2,850 | | | | 3,699 | |
| TOTAL EXPENSES | | | 139,747 | | | | 185,448 | |
| Fees voluntarily waived by the Adviser (Note 4) | | | (22,132 | ) | | | (9,395 | ) |
| NET EXPENSES | | | 117,615 | | | | 176,053 | |
| | | | | | | | | |
| NET INVESTMENT INCOME | | | 283,162 | | | | 362,106 | |
| | | | | | | | | |
REALIZED AND UNREALIZED GAINS (LOSSES) ON INVESTMENTS | | | | | | | | |
| Net realized gains (losses) from: | | | | | | | | |
| Security transactions | | | (276,670 | ) | | | 999,488 | |
| Option contracts (Note 5) | | | 19,683 | | | | 36,441 | |
| Net realized gains from in-kind redemptions (Note 2) | | | — | | | | 149,541 | |
| Net change in unrealized appreciation/depreciation on: | | | | | | | | |
| Investments | | | 158,018 | | | | (1,797,939 | ) |
| Option contracts (Note 5) | | | (11,327 | ) | | | 44,650 | |
| | | | | | | | | |
NET REALIZED AND UNREALIZED LOSSES ON INVESTMENTS | | | (110,296 | ) | | | (567,819 | ) |
| | | | | | | | | |
NET INCREASE (DECREASE) IN NET ASSETS FROM OPERATIONS | | $ | 172,866 | | | $ | (205,713 | ) |
| See accompanying notes to financial statements. |
THE FLIPPIN, BRUCE & PORTER FUNDS STATEMENTS OF CHANGES IN NET ASSETS |
| | | FBP Equity & Dividend Plus Fund | | | FBP Appreciation & Income Opportunities Fund | |
| | Six Months Ended Sept. 30, 2012 (Unaudited) | | | | | | Six Months Ended Sept. 30, 2012 (Unaudited) | | | | |
| FROM OPERATIONS | | | | | | | | | | | | |
| Net investment income | | $ | 283,162 | | | $ | 290,846 | | | $ | 362,106 | | | $ | 699,369 | |
| Net realized gains (losses) from: | | | | | | | | | | | | | | | | |
| Security transactions | | | (276,670 | ) | | | 710,636 | | | | 999,488 | | | | 313,845 | |
| Option contracts (Note 5) | | | 19,683 | | | | 91,660 | | | | 36,441 | | | | 181,782 | |
Net realized gains from in-kind redemptions (Note 2) | | | — | | | | 543,794 | | | | 149,541 | | | | 1,339,904 | |
Net change in unrealized appreciation/depreciation on: | | | | | | | | | | | | | | | | |
| Investments | | | 158,018 | | | | (3,400,204 | ) | | | (1,797,939 | ) | | | (3,357,018 | ) |
| Option contracts (Note 5) | | | (11,327 | ) | | | (44,343 | ) | | | 44,650 | | | | (65,994 | ) |
Net increase (decrease) in net assets from operations | | | 172,866 | | | | (1,807,611 | ) | | | (205,713 | ) | | | (888,112 | ) |
| | | | | | | | | | | | | | | | | |
DISTRIBUTIONS TO SHAREHOLDERS | | | | | | | | | | | | | | | | |
| From net investment income | | | (278,072 | ) | | | (301,039 | ) | | | (374,272 | ) | | | (781,190 | ) |
| | | | | | | | | | | | | | | | | |
FROM CAPITAL SHARE TRANSACTIONS | | | | | | | | | | | | | | | | |
| Proceeds from shares sold | | | 782,926 | | | | 1,455,754 | | | | 536,796 | | | | 747,647 | |
Net asset value of shares issued in reinvestment of distributions to shareholders | | | 269,045 | | | | 290,667 | | | | 322,832 | | | | 678,317 | |
| Payments for shares redeemed | | | (2,127,495 | ) | | | (3,850,963 | ) | | | (5,061,957 | ) | | | (6,642,892 | ) |
Net decrease in net assets from capital share transactions | | | (1,075,524 | ) | | | (2,104,542 | ) | | | (4,202,329 | ) | | | (5,216,928 | ) |
| | | | | | | | | | | | | | | | | |
| TOTAL DECREASE IN NET ASSETS | | | (1,180,730 | ) | | | (4,213,192 | ) | | | (4,782,314 | ) | | | (6,886,230 | ) |
| | | | | | | | | | | | | | | | | |
| NET ASSETS | | | | | | | | | | | | | | | | |
| Beginning of period | | | 23,193,554 | | | | 27,406,746 | | | | 39,520,073 | | | | 46,406,303 | |
| End of period | | $ | 22,012,824 | | | $ | 23,193,554 | | | $ | 34,737,759 | | | $ | 39,520,073 | |
| | | | | | | | | | | | | | | | | |
ACCUMULATED (DISTRIBUTIONS IN EXCESS OF) NET INVESTMENT INCOME | | $ | 2,352 | | | $ | (2,738 | ) | | $ | (55,025 | ) | | $ | (47,419 | ) |
| | | | | | | | | | | | | | | | | |
| CAPITAL SHARE ACTIVITY | | | | | | | | | | | | | | | | |
| Shares sold | | | 42,729 | | | | 78,890 | | | | 34,728 | | | | 48,776 | |
| Shares reinvested | | | 14,455 | | | | 16,156 | | | | 21,088 | | | | 45,367 | |
| Shares redeemed | | | (113,954 | ) | | | (204,844 | ) | | | (331,969 | ) | | | (439,158 | ) |
| Net decrease in shares outstanding | | | (56,770 | ) | | | (109,798 | ) | | | (276,153 | ) | | | (345,015 | ) |
Shares outstanding at beginning of period | | | 1,214,190 | | | | 1,323,988 | | | | 2,493,193 | | | | 2,838,208 | |
| Shares outstanding at end of period | | | 1,157,420 | | | | 1,214,190 | | | | 2,217,040 | | | | 2,493,193 | |
| See accompanying notes to financial statements. |
FBP EQUITY & DIVIDEND PLUS FUND FINANCIAL HIGHLIGHTS |
Selected Per Share Data and Ratios for a Share Outstanding Throughout Each Period |
| | | Six Months Ended Sept. 30, 2012 (Unaudited) | | | |
| | | 2012 | | | | 2011 | | | | 2010 | | | | 2009 | | | | 2008 | |
Net asset value at beginning of period | | $ | 19.10 | | | $ | 20.70 | | | $ | 19.42 | | | $ | 12.02 | | | $ | 20.99 | | | $ | 27.30 | |
| | | | | | | | | | | | | | | | | | | | | | | | | |
Income (loss) from investment operations: | | | | | | | | | | | | | | | | | | | | | | | | |
| Net investment income | | | 0.24 | | | | 0.23 | | | | 0.15 | | | | 0.12 | | | | 0.27 | | | | 0.32 | |
Net realized and unrealized gains (losses) on investments | | | (0.09 | ) | | | (1.59 | ) | | | 1.27 | | | | 7.41 | | | | (8.98 | ) | | | (4.43 | ) |
| Total from investment operations | | | 0.15 | | | | (1.36 | ) | | | 1.42 | | | | 7.53 | | | | (8.71 | ) | | | (4.11 | ) |
| | | | | | | | | | | | | | | | | | | | | | | | | |
| Less distributions: | | | | | | | | | | | | | | | | | | | | | | | | |
Dividends from net investment income | | | (0.23 | ) | | | (0.24 | ) | | | (0.14 | ) | | | (0.13 | ) | | | (0.26 | ) | | | (0.32 | ) |
Distributions from net realized gains | | | — | | | | — | | | | — | | | | — | | | | — | | | | (1.68 | ) |
| Return of capital | | | — | | | | — | | | | — | | | | — | | | | — | | | | (0.20 | ) |
| Total distributions | | | (0.23 | ) | | | (0.24 | ) | | | (0.14 | ) | | | (0.13 | ) | | | (0.26 | ) | | | (2.20 | ) |
| | | | | | | | | | | | | | | | | | | | | | | | | |
| Net asset value at end of period | | $ | 19.02 | | | $ | 19.10 | | | $ | 20.70 | | | $ | 19.42 | | | $ | 12.02 | | | $ | 20.99 | |
| | | | | | | | | | | | | | | | | | | | | | | | | |
Total return (a) | | | 0.84% | (b) | | | (6.49% | ) | | | 7.40% | | | | 62.84% | | | | (41.78% | ) | | | (16.33% | ) |
| | | | | | | | | | | | | | | | | | | | | | | | | |
| Net assets at end of period (000’s) | | $ | 22,013 | | | $ | 23,194 | | | $ | 27,407 | | | $ | 28,617 | | | $ | 20,605 | | | $ | 43,072 | |
| | | | | | | | | | | | | | | | | | | | | | | | | |
Ratio of total expenses to average net assets | | | 1.27% | (c) | | | 1.29% | | | | 1.19% | | | | 1.19% | | | | 1.18% | | | | 1.01% | |
| | | | | | | | | | | | | | | | | | | | | | | | | |
Ratio of net expenses to average net assets (d) | | | 1.07% | (c) | | | 1.07% | | | | 1.07% | | | | 1.07% | | | | 1.07% | | | | 1.01% | |
| | | | | | | | | | | | | | | | | | | | | | | | | |
Ratio of net investment income to average net assets (d) | | | 2.57% | (c) | | | 1.24% | | | | 0.78% | | | | 0.74% | | | | 1.59% | | | | 1.21% | |
| | | | | | | | | | | | | | | | | | | | | | | | | |
| Portfolio turnover rate | | | 15% | (b) | | | 46% | | | | 25% | | | | 21% | | | | 16% | | | | 26% | |
| (a) | Total return is a measure of the change in value of an investment in the Fund over the periods covered, which assumes any dividends or capital gains distributions are reinvested in shares of the Fund. Returns shown do not reflect the deduction of taxes a shareholder would pay on Fund distributions or the redemption of Fund shares. |
| | |
| (b) | Not annualized. |
| | |
| (c) | Annualized. |
| | |
| (d) | Ratios were determined after voluntary advisory fee reductions by the Adviser (Note 4). |
| | |
| See accompanying notes to financial statements. |
FBP APPRECIATION & INCOME OPPORTUNITIES FUND FINANCIAL HIGHLIGHTS |
Selected Per Share Data and Ratios for a Share Outstanding Throughout Each Period |
| | | Six Months Ended Sept. 30, 2012 (Unaudited) | | | |
| | | 2012 | | | | 2011 | | | | 2010 | | | | 2009 | | | | 2008 | |
Net asset value at beginning of period | | $ | 15.85 | | | $ | 16.35 | | | $ | 15.49 | | | $ | 10.97 | | | $ | 15.84 | | | $ | 18.95 | |
| | | | | | | | | | | | | | | | | | | | | | | | | |
Income (loss) from investment operations: | | | | | | | | | | | | | | | | | | | | | | | | |
| Net investment income | | | 0.16 | | | | 0.26 | | | | 0.24 | | | | 0.27 | | | | 0.32 | | | | 0.38 | |
Net realized and unrealized gains (losses) on investments | | | (0.17 | ) | | | (0.46 | ) | | | 0.88 | | | | 4.53 | | | | (4.89 | ) | | | (2.01 | ) |
| Total from investment operations | | | (0.01 | ) | | | (0.20 | ) | | | 1.12 | | | | 4.80 | | | | (4.57 | ) | | | (1.63 | ) |
| | | | | | | | | | | | | | | | | | | | | | | | | |
| Less distributions: | | | | | | | | | | | | | | | | | | | | | | | | |
Dividends from net investment income | | | (0.17 | ) | | | (0.30 | ) | | | (0.26 | ) | | | (0.28 | ) | | | (0.30 | ) | | | (0.39 | ) |
Distributions from net realized gains | | | — | | | | — | | | | — | | | | — | | | | — | | | | (1.02 | ) |
| Return of capital | | | — | | | | — | | | | — | | | | — | | | | — | | | | (0.07 | ) |
| Total distributions | | | (0.17 | ) | | | (0.30 | ) | | | (0.26 | ) | | | (0.28 | ) | | | (0.30 | ) | | | (1.48 | ) |
| | | | | | | | | | | | | | | | | | | | | | | | | |
| Net asset value at end of period | | $ | 15.67 | | | $ | 15.85 | | | $ | 16.35 | | | $ | 15.49 | | | $ | 10.97 | | | $ | 15.84 | |
| | | | | | | | | | | | | | | | | | | | | | | | | |
Total return (a) | | | (0.05% | )(b) | | | (1.13% | ) | | | 7.35% | | | | 44.01% | | | | (29.15% | ) | | | (9.27% | ) |
| | | | | | | | | | | | | | | | | | | | | | | | | |
| Net assets at end of period (000’s) | | $ | 34,738 | | | $ | 39,520 | | | $ | 46,406 | | | $ | 45,507 | | | $ | 34,199 | | | $ | 54,995 | |
| | | | | | | | | | | | | | | | | | | | | | | | | |
Ratio of total expenses to average net assets | | | 1.05% | (c) | | | 1.06% | | | | 1.03% | | | | 1.03% | | | | 1.05% | | | | 0.96% | |
| | | | | | | | | | | | | | | | | | | | | | | | | |
Ratio of net expenses to average net assets (d) | | | 1.00% | (c) | | | 1.00% | | | | 1.00% | | | | 1.00% | | | | 1.00% | | | | 0.96% | |
| | | | | | | | | | | | | | | | | | | | | | | | | |
Ratio of net investment income to average net assets (d) | | | 2.01% | (c) | | | 1.71% | | | | 1.59% | | | | 1.90% | | | | 2.36% | | | | 2.05% | |
| | | | | | | | | | | | | | | | | | | | | | | | | |
| Portfolio turnover rate | | | 6% | (b) | | | 17% | | | | 24% | | | | 24% | | | | 24% | | | | 29% | |
| (a) | Total return is a measure of the change in value of an investment in the Fund over the periods covered, which assumes any dividends or capital gains distributions are reinvested in shares of the Fund. Returns shown do not reflect the deduction of taxes a shareholder would pay on Fund distributions or the redemption of Fund shares. |
| | |
| (b) | Not annualized. |
| | |
| (c) | Annualized. |
| | |
| (d) | Ratios were determined after voluntary advisory fee reductions by the Adviser (Note 4). |
| | |
| See accompanying notes to financial statements. |
THE FLIPPIN, BRUCE & PORTER FUNDS NOTES TO FINANCIAL STATEMENTS September 30, 2012 (Unaudited) |
1. Organization
FBP Equity & Dividend Plus Fund and FBP Appreciation & Income Opportunities Fund (the “Funds”) are no-load, diversified series of the Williamsburg Investment Trust (the “Trust”), an open-end management investment company registered under the Investment Company Act of 1940. The Trust was organized as a Massachusetts business trust on July 18, 1988. Other series of Williamsburg Investment Trust are not included in this report.
FBP Equity & Dividend Plus Fund seeks to provide above-average and growing income while also achieving long-term growth of capital.
FBP Appreciation & Income Opportunities Fund seeks long term capital appreciation and current income, assuming a moderate level of investment risk.
2. Significant Accounting Policies
The following is a summary of the Funds’ significant accounting policies. The policies are in conformity with accounting principles generally accepted in the United States of America (“GAAP”).
Securities valuation — The Funds’ portfolio securities are valued as of the close of business of the regular session of the New York Stock Exchange (normally 4:00 p.m., Eastern time). Securities traded on a national stock exchange are valued based upon the closing price on the principal exchange where the security is traded. Securities which are quoted by NASDAQ are valued at the NASDAQ Official Closing Price. Securities which are traded over-the-counter are valued at the last sales price, if available, otherwise, at the last quoted bid price. It is expected that fixed income securities will ordinarily be traded in the over-the-counter market, and common stocks will ordinarily be traded on a national securities exchange, but may also be traded in the over-the-counter market. Call options written by the Funds are valued at the then current market quotation, using the ask price as of the close of each day on the principal exchanges on which they are traded. Short-term instruments (those with remaining maturities of 60 days or less) may be valued at amortized cost, which approximates market value.
When market quotations are not readily available, securities may be valued on the basis of prices provided by an independent pricing service. The prices provided by the pricing service are determined with consideration given to institutional bid and last sale prices and take into account securities prices, yields, maturities, call features, ratings, institutional trading in similar groups of securities and developments related to specific securities and will be classified as Level 2 within the fair value hierarchy (see below). If a pricing service cannot provide a valuation, securities will be valued in good faith at fair value using methods consistent with those determined by the Board of Trustees and will be classified as Level 2 or 3 within the fair value hierarchy, depending on the inputs used. Such methods of fair valuation may include, but are not limited to: multiple of earnings, multiple of book value, discount from market of a similar freely traded security, purchase price of the security, subsequent private transactions in the security or related securities, or a combination of these and other factors.
THE FLIPPIN, BRUCE & PORTER FUNDS NOTES TO FINANCIAL STATEMENTS (Continued) |
GAAP establishes a single authoritative definition of fair value, sets out a framework for measuring fair value and requires additional disclosures about fair value measurements. Various inputs are used in determining the value of each Fund’s investments. These inputs are summarized in the three broad levels listed below:
• Level 1 – quoted prices in active markets for identical securities
• Level 2 – other significant observable inputs
• Level 3 – significant unobservable inputs
For example, repurchase agreements and corporate bonds held by FBP Appreciation & Income Opportunities Fund are classified as Level 2 since values for the underlying collateral for the repurchase agreements and the values for the corporate bonds are based on prices provided by an independent pricing service that utilizes various “other significant observable inputs” including bid and ask quotations, prices of similar securities and interest rates, among other factors.
The inputs or methodology used for valuing securities are not necessarily an indication of the risks associated with investing in those securities. The inputs used to measure fair value may fall into different levels of the fair value hierarchy. In such cases, for disclosure purposes, the level in the fair value hierarchy within which the fair value measurement falls in its entirety is determined based on the lowest level input that is significant to the fair value measurement.
The following is a summary of the inputs used to value each Fund’s investments and other financial instruments as of September 30, 2012 by security type:
FBP Equity & Dividend Plus Fund | | | | | | | | | | | | |
| Common Stocks | | $ | 21,412,237 | | | $ | — | | | $ | — | | | $ | 21,412,237 | |
| Money Market Funds | | | 490,210 | | | | — | | | | — | | | | 490,210 | |
| Covered Call Options | | | (137,865 | ) | | | — | | | | — | | | | (137,865 | ) |
| Total | | $ | 21,764,582 | | | $ | — | | | $ | — | | | $ | 21,764,582 | |
FBP Appreciation & Income Opportunities Fund | | | | | | | | | | | | |
| Common Stocks | | $ | 25,454,347 | | | $ | — | | | $ | — | | | $ | 25,454,347 | |
| Corporate Bonds | | | — | | | | 5,017,557 | | | | — | | | | 5,017,557 | |
| Money Market Funds | | | 1,694,249 | | | | — | | | | — | | | | 1,694,249 | |
| Repurchase Agreements | | | — | | | | 3,104,102 | | | | — | | | | 3,104,102 | |
| Covered Call Options | | | (154,828 | ) | | | — | | | | — | | | | (154,828 | ) |
| Total | | $ | 26,993,768 | | | $ | 8,121,659 | | | $ | — | | | $ | 35,115,427 | |
Refer to each Fund’s Schedule of Investments for a listing of the common stocks and corporate bonds valued using Level 1 and Level 2 inputs by sector type. As of September 30, 2012, the Funds did not have any transfers in and out of any Level. There were no Level 3 securities held by the Funds as of September 30, 2012. It is the Funds’ policy to recognize transfers into and out of any Level at the end of the reporting period.
THE FLIPPIN, BRUCE & PORTER FUNDS NOTES TO FINANCIAL STATEMENTS (Continued) |
Share valuation — The net asset value per share of each Fund is calculated daily by dividing the total value of its assets, less liabilities, by the number of shares outstanding. The offering price and redemption price per share of each Fund is equal to its net asset value per share.
Investment income — Interest income is accrued as earned. Dividend income is recorded on the ex-dividend date. Discounts and premiums on fixed income securities purchased are amortized using the interest method.
Repurchase agreements — Each Fund may enter into repurchase agreements. A repurchase agreement, which is collateralized by U.S. Government obligations, is valued at cost which, together with accrued interest, approximates market value. At the time a Fund enters into a repurchase agreement, the Fund takes possession of the underlying securities and the seller agrees that the value of the underlying securities, including accrued interest, will at all times be equal to or exceed the face amount of the repurchase agreement. In addition, the Funds actively monitor and seek additional collateral, as needed. If the seller defaults, the fair value of the collateral may decline and realization of the collateral by the Funds may be delayed or limited.
Distributions to shareholders — Dividends arising from net investment income are declared and paid quarterly to shareholders of each Fund. Net realized short-term capital gains, if any, may be distributed throughout the year and net realized long-term capital gains, if any, are distributed at least once each year. The amount of distributions from net investment income and net realized gains are determined in accordance with federal income tax regulations, which may differ from GAAP. These “book/tax” differences are either temporary or permanent in nature. The tax character of distributions paid by each Fund during the periods ended September 30, 2012 and March 31, 2012 is ordinary income.
Security transactions — Security transactions are accounted for on trade date for financial reporting purposes. Gains and losses on securities sold are determined on a specific identification basis.
Common expenses — Common expenses of the Trust are allocated among the funds of the Trust based on relative net assets of each fund or the nature of the services performed and the relative applicability to each fund.
Options transactions — When the Funds’ investment adviser believes that individual portfolio securities held by the Funds are approaching the top of the adviser’s growth and price expectations, the Funds may write covered call options for which premiums are received and are recorded as liabilities, and are subsequently valued daily at the closing prices on their primary exchanges. Premiums received from writing options which expire are treated as realized gains. Premiums received from writing options which are exercised increase the proceeds used to calculate the realized gain or loss on the sale of the security. If a closing purchase transaction is used to terminate a Fund’s obligation on a call option, a gain or loss will be realized, depending upon whether the price of the closing purchase transaction is more or less than the premium previously received on the call option written.
Estimates — The preparation of financial statements in conformity with GAAP requires management to make estimates and assumptions that affect the reported amounts of assets and liabilities and the disclosure of contingent assets and liabilities as of the date of the financial statements and the reported amounts of income and expenses during the reporting period. Actual results could differ from those estimates.
THE FLIPPIN, BRUCE & PORTER FUNDS NOTES TO FINANCIAL STATEMENTS (Continued) |
Federal income tax — It is each Fund’s policy to comply with the special provisions of Subchapter M of the Internal Revenue Code applicable to regulated investment companies. As provided therein, in any fiscal year in which a Fund so qualifies and distributes at least 90% of its taxable net income, the Fund (but not the shareholders) will be relieved of federal income tax on the income distributed. Accordingly, no provision for income taxes has been made.
In order to avoid imposition of the excise tax applicable to regulated investment companies, it is also each Fund’s intention to declare as dividends in each calendar year at least 98% of its net investment income (earned during the calendar year) and 98.2% of its net realized capital gains (earned during the twelve months ended October 31) plus undistributed amounts from prior years.
The following information is computed on a tax basis for each item as of September 30, 2012:
| | FBP Equity & Dividend Plus Fund | | | FBP Appreciation & Income Opportunities Fund | |
| Tax cost of portfolio investments | | $ | 19,453,828 | | | $ | 31,099,998 | |
| Gross unrealized appreciation | | $ | 3,722,445 | | | $ | 6,763,432 | |
| Gross unrealized depreciation | | | (1,273,826 | ) | | | (2,593,175 | ) |
| Net unrealized appreciation on investments | | | 2,448,619 | | | | 4,170,257 | |
| Net unrealized depreciation on option contracts | | | (35,369 | ) | | | (6,979 | ) |
| Accumulated ordinary income | | | 6,485 | | | | 24,016 | |
| Capital loss carryforwards | | | (2,027,865 | ) | | | (147,097 | ) |
| Other gains (losses) | | | (268,137 | ) | | | 771,165 | |
| Other temporary differences | | | (4,133 | ) | | | (23,693 | ) |
| Accumulated earnings | | $ | 119,600 | | | $ | 4,787,669 | |
The difference between the federal income tax cost of portfolio investments and the financial statement cost for FBP Appreciation & Income Opportunities Fund is due to certain differences in the recognition of capital gains and losses under income tax regulations and GAAP. These “book/tax” differences are temporary in nature and are primarily due to differing methods in the amortization of discounts and premiums on fixed income securities.
Under the Regulated Investment Company Modernization Act of 2010 (the “Act”), net capital losses realized after March 31, 2011 may be carried forward indefinitely and their character is retained as short-term and/or long-term losses. Under the law in effect prior to the Act, pre-enactment net capital losses were carried forward for eight years and treated as short-term losses. As a transition rule, the Act requires that post-enactment net capital losses be used before pre-enactment net capital losses. Therefore, there may be a greater likelihood that all or a portion of the Funds’ pre-enactment capital loss carryovers may expire without being utilized.
THE FLIPPIN, BRUCE & PORTER FUNDS NOTES TO FINANCIAL STATEMENTS (Continued) |
As of March 31, 2012, the Funds had the following short-term capital loss carryforwards for federal income tax purposes:
| | FBP Equity & Dividend Plus Fund | | | FBP Appreciation & Income Opportunities Fund | |
| 2017 | | $ | 179,432 | | | $ | — | |
| 2018 | | | 1,848,433 | | | | 147,097 | |
| | | $ | 2,027,865 | | | $ | 147,097 | |
These capital loss carryforwards may be utilized in the current and future years to offset net realized capital gains, if any, prior to distributing such gains to shareholders.
For the six months ended September 30, 2012, FBP Appreciation & Income Opportunities Fund reclassified accumulated net realized gains from security transactions of $4,560 against distributions in excess of net investment income on the Statements of Assets and Liabilities. Such reclassification, the result of permanent differences between the financial statement and income tax reporting requirements, has no effect on the Fund’s net assets or net asset value per share.
During the six months ended September 30, 2012, FBP Appreciation & Income Opportunities Fund realized $149,541 of net capital gains resulting from in-kind redemptions (redemptions in which shareholders who redeemed Fund shares received securities held by the Fund rather than cash). The Fund recognizes a gain on in-kind redemptions to the extent that the value of the distributed securities on the date of redemption exceeds the cost of those securities. Such gains are not taxable to the Fund and are not required to be distributed to shareholders. The Fund has reclassified these amounts against paid-in capital. This reclassification is reflected on the Statements of Assets and Liabilities. Such reclassification, the result of permanent differences between the financial statement and income tax reporting requirements, has no effect on the Fund’s net assets or net asset value per share.
The Funds recognize the tax benefits or expenses of uncertain tax positions only when the position is “more likely than not” to be sustained assuming examination by tax authorities. Management has reviewed the tax positions taken on federal income tax returns for all open tax years (tax years ended March 31, 2009 through March 31, 2012) of each Fund and has concluded that no provision for unrecognized tax benefits or expenses is required in these financial statements.
3. Investment Transactions
During the six months ended September 30, 2012, cost of purchases and proceeds from sales and maturities of investment securities, other than short-term investments and U.S. Government securities, totaled $4,607,022 and $3,072,295, respectively, for FBP Equity & Dividend Plus Fund and $2,104,438 and $8,675,189, respectively, for FBP Appreciation & Income Opportunities Fund.
THE FLIPPIN, BRUCE & PORTER FUNDS NOTES TO FINANCIAL STATEMENTS (Continued) |
4. Transactions with Affiliates
INVESTMENT ADVISORY AGREEMENT
The Funds’ investments are managed by Flippin, Bruce & Porter, Inc. (the “Adviser”) under the terms of an Investment Advisory Agreement. Under the Investment Advisory Agreement, each Fund pays the Adviser a fee, which is computed and accrued daily and paid monthly, at an annual rate of .70% of its average daily net assets up to $250 million; .65% of the next $250 million of such assets; and .50% of such assets in excess of $500 million.
During the six months ended September 30, 2012, the Adviser voluntarily waived $22,132 and $9,395 of its investment advisory fees from FBP Equity & Dividend Plus Fund and FBP Appreciation & Income Opportunities Fund, respectively.
Certain officers of the Trust are also officers of the Adviser.
MUTUAL FUND SERVICES AGREEMENT
Under the terms of a Mutual Fund Services Agreement between the Trust and Ultimus Fund Solutions, LLC (“Ultimus”), Ultimus provides administrative, pricing, accounting, dividend disbursing, shareholder servicing and transfer agent services for the Funds. For these services, Ultimus receives a monthly fee from each Fund at an annual rate of .15% of its average daily net assets up to $25 million, .125% of the next $25 million of such assets, and .10% of such assets in excess of $50 million, subject to a minimum monthly fee of $4,000. In addition, each Fund pays out-of-pocket expenses including, but not limited to, postage, supplies and costs of pricing portfolio securities.
Certain officers of the Trust are also officers of Ultimus, or of Ultimus Fund Distributors, LLC (the “Distributor”), the principal underwriter of each Fund’s shares and an affiliate of Ultimus. The Distributor is compensated by the Adviser (not the Funds) for acting as principal underwriter.
COMPLIANCE CONSULTING AGREEMENT
Under the terms of a Compliance Consulting Agreement between the Trust and Ultimus, Ultimus provides an individual to serve as the Trust’s Chief Compliance Officer and to administer the Funds’ compliance policies and procedures. For these services, the Funds pay Ultimus an annual base fee of $16,800 plus an asset-based fee equal to 0.01% per annum on the Funds’ aggregate net assets in excess of $100 million. In addition, the Funds reimburse Ultimus for reasonable out-of-pocket expenses, if any, incurred in connection with these services.
THE FLIPPIN, BRUCE & PORTER FUNDS NOTES TO FINANCIAL STATEMENTS (Continued) |
5. Derivatives Transactions
Transactions in option contracts written by the Funds during the six months ended September 30, 2012 were as follows:
| | | FBP Equity & Dividend Plus Fund | | | FBP Appreciation & Income Opportunities Fund | |
| | | | | | | | | | | | |
| Options outstanding at beginning of period | | | 248 | | | $ | 42,758 | | | | 748 | | | $ | 159,001 | |
| Options written | | | 445 | | | | 87,081 | | | | 290 | | | | 82,880 | |
| Options cancelled in a closing purchase transaction | | | (80 | ) | | | (13,795 | ) | | | (170 | ) | | | (38,314 | ) |
| Options expired | | | (40 | ) | | | (7,879 | ) | | | (40 | ) | | | (10,679 | ) |
| Options exercised | | | (30 | ) | | | (5,669 | ) | | | (190 | ) | | | (45,039 | ) |
| Options outstanding at end of period | | | 543 | | | $ | 102,496 | | | | 638 | | | $ | 147,849 | |
The location in the Statements of Assets and Liabilities of the Funds’ derivative positions is as follows:
FBP Equity & Dividend Plus Fund
| | | | | | | Gross Notional Amount Outstanding | |
| | | | | | | | | | |
| Covered call options written | Covered call options, at value | | | — | | | $ | (137,865 | ) | | $ | (2,993,305 | ) |
FBP Appreciation & Income Opportunities Fund
| | | | | | | Gross Notional Amount Outstanding | |
| | | | | | | | | | |
| Covered call options written | Covered call options, at value | | | — | | | $ | (154,828 | ) | | $ | (2,809,351 | ) |
The average monthly notional amount of option contracts during the six months ended September 30, 2012 was $2,191,199 and $3,065,758 for FBP Equity & Dividend Plus Fund and FBP Appreciation & Income Opportunities Fund, respectively.
THE FLIPPIN, BRUCE & PORTER FUNDS NOTES TO FINANCIAL STATEMENTS (Continued) |
Transactions in derivative instruments during the six months ended September 30, 2012 by the Funds are recorded in the following location in the Statements of Operations:
FBP Equity & Dividend Plus Fund
| | | | | | | Change in Unrealized Gains (Losses) | |
| Covered call options written | Net realized gains from option contracts | | $19,683 | | Net change in unrealized appreciation/depreciation on option contracts | | $(11,327) |
FBP Appreciation & Income Opportunities Fund
| | | | | | | Change in Unrealized Gains (Losses) | |
| Covered call options written | Net realized gains from option contracts | | $36,441 | | Net change in unrealized appreciation/depreciation on option contracts | | $44,650 | |
6. Contingencies and Commitments
The Funds indemnify the Trust’s officers and Trustees for certain liabilities that might arise from their performance of their duties to the Funds. Additionally, in the normal course of business the Funds enter into contracts that contain a variety of representations and warranties and which provide general indemnifications. The Funds’ maximum exposure under these arrangements is unknown, as this would involve future claims that may be made against the Funds that have not yet occurred. However, based on experience, the Funds expect the risk of loss to be remote.
7. Subsequent Events
The Funds are required to recognize in the financial statements the effects of all subsequent events that provide additional evidence about conditions that existed as of the date of the Statements of Assets and Liabilities. For non-recognized subsequent events that must be disclosed to keep the financial statements from being misleading, the Funds are required to disclose the nature of the event as well as an estimate of its financial effect, or a statement that such an estimate cannot be made. Management has evaluated subsequent events through the issuance of these financial statements and has noted no such events.
THE FLIPPIN, BRUCE & PORTER FUNDS ABOUT YOUR FUNDS’ EXPENSES (Unaudited) |
We believe it is important for you to understand the impact of costs on your investment. All mutual funds have operating expenses. As a shareholder of the Funds, you incur ongoing costs, including management fees and other operating expenses. These ongoing costs, which are deducted from each Fund’s gross income, directly reduce the investment return of the Funds.
A mutual fund’s ongoing costs are expressed as a percentage of its average net assets. This figure is known as the expense ratio. The following examples are intended to help you understand the ongoing costs (in dollars) of investing in the Funds and to compare these costs with the ongoing costs of investing in other mutual funds. The examples below are based on an investment of $1,000 made at the beginning of the period shown and held for the entire period (April 1, 2012 through September 30, 2012).
The table below illustrates each Fund’s ongoing costs in two ways:
Actual fund return – This section helps you to estimate the actual expenses that you paid over the period. The “Ending Account Value” shown is derived from each Fund’s actual return, and the third column shows the dollar amount of operating expenses that would have been paid by an investor who started with $1,000 in the Funds. You may use the information here, together with the amount you invested, to estimate the expenses that you paid over the period.
To do so, simply divide your account value by $1,000 (for example, an $8,600 account value divided by $1,000 = 8.6), then multiply the result by the number given for the Funds under the heading “Expenses Paid During Period.”
Hypothetical 5% return – This section is intended to help you compare the Funds’ ongoing costs with those of other mutual funds. It assumes that each Fund had an annual return of 5% before expenses during the period shown, but that the expense ratio is unchanged. In this case, because the returns used are not the Funds’ actual returns, the results do not apply to your investment. The example is useful in making comparisons because the Securities and Exchange Commission (“SEC”) requires all mutual funds to calculate expenses based on a 5% return. You can assess each Fund’s ongoing costs by comparing this hypothetical example with the hypothetical examples that appear in shareholder reports of other funds.
Note that expenses shown in the table are meant to highlight and help you compare ongoing costs only. The Funds do not charge sales loads or redemption fees, nor do they carry a “sales load.”
The calculations assume no shares were bought or sold during the period. Your actual costs may have been higher or lower, depending on the amount of your investment and the timing of any purchases or redemptions.
More information about the Funds’ expenses, including annual expense ratios for the past five fiscal years, can be found in this report. For additional information on operating expenses and other shareholder costs, please refer to the Funds’ prospectus.
THE FLIPPIN, BRUCE & PORTER FUNDS ABOUT YOUR FUNDS’ EXPENSES (Unaudited) (Continued) |
FBP Equity & Dividend Plus Fund
| Beginning Account Value April 1, 2012 | Ending Account Value September 30, 2012 | Expenses Paid During Period* |
| Based on Actual Fund Return | $1,000.00 | $1,008.40 | $5.39 |
| Based on Hypothetical 5% Return (before expenses) | $1,000.00 | $1,019.70 | $5.42 |
| * | Expenses are equal to the FBP Equity & Dividend Plus Fund’s annualized expense ratio of 1.07% for the period, multiplied by the average account value over the period, multiplied by 183/365 (to reflect the one-half year period). |
FBP Appreciation & Income Opportunities Fund
| Beginning Account Value April 1, 2012 | Ending Account Value September 30, 2012 | Expenses Paid During Period* |
| Based on Actual Fund Return | $1,000.00 | $999.50 | $5.01 |
| Based on Hypothetical 5% Return (before expenses) | $1,000.00 | $1,020.05 | $5.06 |
| * | Expenses are equal to the FBP Appreciation & Income Opportunities Fund’s annualized expense ratio of 1.00% for the period, multiplied by the average account value over the period, multiplied by 183/365 (to reflect the one-half year period). |
OTHER INFORMATION (Unaudited) |
The Trust files a complete listing of portfolio holdings for the Funds with the SEC as of the end of the first and third quarters of each fiscal year on Form N-Q. The filings are available upon request, by calling 1-800-327-9375. Furthermore, you may obtain a copy of these filings on the SEC’s website at http://www.sec.gov. The Trust’s Forms N-Q may also be reviewed and copied at the SEC’s Public Reference Room in Washington, DC, and information on the operation of the Public Reference Room may be obtained by calling 1-800-SEC-0330.
A description of the policies and procedures that the Funds use to determine how to vote proxies relating to portfolio securities is available without charge upon request by calling toll-free 1-800-327-9375, or on the SEC’s website at http://www.sec.gov. Information regarding how the Funds voted proxies relating to portfolio securities during the most recent 12-month period ended June 30 is also available without charge upon request by calling toll-free 1-800-327-9375, or on the SEC’s website at http://www.sec.gov.
| | | | | | |
| | | | | | | |
| | | | | | | |
| | | | | | | |
| | | | Investment Adviser Flippin, Bruce & Porter, Inc. 800 Main Street, Second Floor P.O. Box 6138 Lynchburg, Virginia 24505 Toll-Free 1-800-327-9375 www.fbpfunds.com Administrator Ultimus Fund Solutions, LLC P.O. Box 46707 Cincinnati, Ohio 45246-0707 Toll-Free 1-866-738-1127 Custodian US Bank NA 425 Walnut Street Cincinnati, Ohio 45202 Independent Registered Public Accounting Firm Ernst & Young LLP 1900 Scripps Center 312 Walnut Street Cincinnati, Ohio 45202 | Legal Counsel Sullivan & Worcester LLP One Post Office Square Boston, Massachusetts 02109 Officers John T. Bruce, President and Portfolio Manager John M. Flippin, Vice President John H. Hanna, IV, Vice President David J. Marshall, Vice President R. Gregory Porter, III, Vice President Trustees John P. Ackerly, IV John T. Bruce Robert S. Harris J. Finley Lee, Jr. Richard L. Morrill Harris V. Morrissette | | | |
| | | | | | | |
| | | | | | | |
| | | | | | |
THE GOVERNMENT STREET FUNDS No-Load Mutual Funds Semi-Annual Report September 30, 2012 (Unaudited) |
The Government Street Equity Fund The Government Street Mid-Cap Fund The Alabama Tax Free Bond Fund |
LETTER FROM THE PRESIDENT | |
Dear Fellow Shareholders:
We are enclosing for your review the Semi-Annual Report of The Government Street Funds for the six months ended September 30, 2012.
The Government Street Equity Fund
The Government Street Equity Fund had a positive return of 1.30% for the semiannual fiscal period ended September 30, 2012. By comparison, the S&P 500 Index and the Morningstar Large Cap Blend Equity category were up 3.43% and 1.69%, respectively. The large cap section of domestic markets continues to be positively affected by the dynamics of the S&P 500 Index, which has remained in a positive up trend since the low point reached in March 2009.
While positive investment returns are always welcome, the continued current recovery in the market is exceedingly difficult to explain in terms of causal factors. The United States debt and annual deficit at approximately $15 trillion and $5 trillion, respectively, are stark examples of unhealthy fiscal policies. At the same time, the level of interest rates is artificially affected by Federal Reserve policy to create an environment which attempts to move investors to risky positions in bond and stock holdings. When the noted events are combined with considerations of uncertain tax policies, regulatory overload, escalating energy prices, international political unrest, high unemployment rates, out of control entitlement programs and mandatory health care changes, predictable investment results become highly speculative.
In this environment we believe that the most basic of risk control measures available, diversification in quality companies, is mandatory. As of September 30, 2012, The Government Street Equity Fund held investments in 90 individual common stocks and 9 multiple stock holdings represented by Exchange Traded Funds (ETFs). The cash reserves were approximately 2.6% of the portfolio.
The ETFs’ holdings broadened investment participation to emphasize agricultural related stocks, mid and small capitalization domestic securities, master limited partnerships, emerging market international companies and hedged investments. In the aggregate, these multi-faceted investments accounted for approximately 13% of the total portfolio.
The top 10 holdings in The Government Street Equity Fund as of September 30, 2012 were:
| Security Description | % of Net Assets |
| Apple, Inc. | 6.4% |
| JP Morgan Alerian MLP Index ETN | 2.8% |
| Philip Morris International, Inc. | 2.8% |
| Vanguard Mid-Cap ETF | 2.7% |
| iShares S&P MidCap 400 Index Fund | 2.2% |
| International Business Machines Corporation | 2.2% |
| Colonial Properties Trust | 2.1% |
| Walt Disney Company (The) | 2.1% |
| Conoco Phillips, Inc. | 1.8% |
| Alexion Pharmaceuticals, Inc. | 1.8% |
The most significant positive individual performances of securities held for the entire six month period as measured by the internal rate of return were:
| eBay, Inc. | 31.08% |
| American Capital Ltd. | 30.18% |
| Anheuser-Busch InBev SA/NA - ADR | 27.85% |
| Urban Outfitters, Inc. | 26.86% |
| Telstra Corporation Ltd. - ADR | 24.07% |
The 5 worst individual performances of securities held for the entire six month period as measured by the internal rate of return were:
| ADTRAN, Inc. | -44.35% |
| Questcor Pharmaceuticals, Inc. | -39.39% |
| Elan Corporation Plc - ADR | -30.88% |
| NetApp, Inc. | -26.56% |
| Caterpillar, Inc. | -18.39% |
The Fund’s best performing economic sector for the six months was Telecommunication Services at 21.10%, followed by Consumer Staples at 9.72%. The worst performing sector was Materials at -11.58%.
Note: The investment performances listed for economic sectors and securities in the two preceding paragraphs are extracted from an in-house independent internal rate of return computation by the Advent Axys portfolio accounting system. The calculations are gross investment returns. Total investment returns are for the period April 1, 2012 through September 30, 2012.
At the writing of this report, we are approaching the Presidential election, a fiscal cliff, a nuclear Iran, a Congress with less than 10% approval rating, uncertain tax policies and historical debt. Any prediction about near term markets seems improbable at best. Our approach is to stay with the same basic investment methods that have proven fundamentally sound and productive over time. Broad diversification, relatively full investment and quality companies are the basic ingredients.
As of September 30, 2012, the Fund’s net assets were $75,869,476, up from $72,268,432 at fiscal year end. Net asset value per share was $50.43. The Fund’s total return for the one-year period ended September 30, 2012 was 24.79%.
The Government Street Mid-Cap Fund
The Government Street Mid-Cap Fund produced a six month return of -0.54% as of September 30, 2012 while the Fund’s benchmark, the S&P MidCap 400 Index, produced a six month return of 0.24%. The S&P MidCap 400 Index is an index maintained by the Standard & Poor’s Index Committee that selects companies with market capitalizations between $1 billion and $4.4 billion. The goal of the Index is to identify companies that represent the risk and reward characteristics of mid-sized companies. For the year ended September 30, 2012, The Government Street Mid-Cap Fund returned 22.00% while the S&P Mid Cap 400 Index had a one year return of 28.54%. Within the Fund, the Industrials and Consumer Cyclical sectors were the top two contributors to performance while the Telecommunication Services and Utilities sectors were the top detractors for the recent 12 month period. The Fund’s portfolio
also included over 10% in exchange-traded funds (ETFs) that provided exposure to asset classes not included in the Index, which contributed to performance. Some of the biggest individual stock contributors to the Fund’s performance over the past year were Alliance Data Systems (+54%), AMETEK (+68%), ONEOK (+50%) and Valspar (+87%).
The longer term performance of the Fund has been very competitive when compared to its benchmark (S&P MidCap 400 Index) as well as large-cap stocks as measured by the S&P 500 Index and small-cap stocks as measured by the Russell 2000 Index. The annualized returns for the past 3 years and 5 years ended September 30, 2012 are shown in the following table:
| | |
| Government Street Mid-Cap Fund | 13.01% | 3.80% |
| S&P MidCap 400 Index | 14.33% | 3.83% |
| S&P 500 Index | 13.20% | 1.05% |
| Russell 2000 Index | 12.99% | 2.21% |
The market has been surprisingly strong this year in the face of some pretty significant headwinds. The market has been climbing the proverbial “wall of worry” as investors try to digest global governments’ attempts to reduce deficits while at the same time implementing programs to spur growth. Similar problems exist around the globe, but investors still see the U.S. as the safer alternative while the Eurozone works through their collective issues. The U.S. did show some modest growth in the third quarter as employment and housing improved. Many investors continue to remain on the sidelines with the uncertainty of the upcoming election and the threat of the impending fiscal cliff. While there are certainly a number of immediate concerns regarding the global economy and its ability to sustain a healthy growth rate, there are also global demographic trends that could provide support for the global economy in the future. Most of the global population growth in the next 40 years is projected to come primarily from emerging markets. Most developing countries are in better financial condition than their developed counterparts and many of those countries are experiencing significant growth of their middle class. This represents a potentially huge consumer base that could provide demand for products in coming years. As always, investing should have a long term bias with a focus on quality, which is what we attempt to do in The Government Street Mid-Cap Fund.
As of September 30, 2012, the net assets of The Government Street Mid-Cap Fund were $39,707,308 and the net asset value per share was $16.13. The turnover rate for the six months was 6% and the total number of holdings was 160 as of September 30, 2012. The net expense ratio for the Fund was 1.08%.
The Alabama Tax Free Bond Fund
The municipal bond market generally provided positive returns during the six month period ended September 30, 2012. Performance was positive across the curve for all investment grade municipal bond sectors, though longer maturity and lower quality bonds outperformed the broader market. Despite some isolated issues with some local municipalities, the overall condition of the municipal bond market remained fairly strong from a fundamental perspective. Pension obligations are a long term consideration and most municipalities understand that some sort of reform will be necessary going forward. Many issuers have already taken steps to cut spending and raise revenues in order to balance their budgets. Healthy demand for tax-exempt securities continues and a steady flow of refundings in the second half of the year has been easily absorbed.
Federal Reserve Bank policy continues to be the driving force for returns in the fixed income markets. On September 13, 2012, Federal Reserve Chairman Ben Bernanke announced the following policies:
| | 1. | The Fed initiated a new program of quantitative easing, or QE3, saying it would buy $40 billion per month of government agency mortgage backed securities. |
| | 2. | The Fed said it would continue its Operation Twist program through year-end, buying $45 billion per month of longer-term Treasury bonds and selling shorter-term Treasury securities. |
| | 3. | The Fed emphasized that QE3 would be tied to conditions in the labor market. |
| | 4. | The Fed restated its commitment to maintain a highly accommodative monetary policy “for a considerable time after the economic recovery begins.” |
| | 5. | The Fed has anchored short term rates at near zero for the last three and one-half years and they said to expect that to continue through at least mid-2015. |
The stated goal of the Fed is to maintain interest rates at levels that will encourage investment, stimulate consumer spending and increase job creation.
The Alabama Tax Free Bond Fund continues to focus on the higher end of the quality spectrum. As of September 30, 2012, more than 95% of the portfolio was invested in securities that were rated A, AA or AAA by Moody’s or Standard and Poor’s rating agencies. We have also continued to maintain the duration of the portfolio at the short end of the targeted range. The duration of the portfolio as of September 30, 2012 was 3.6 years, down just slightly from 3.7 years as of March 31, 2012. The Fund maintains a generally defensive posture with a laddered portfolio of short and intermediate term Alabama municipal bonds.
The total return of the Fund for the six months ended September 30, 2012 was 1.51%. The Fund’s weighted average maturity was 3.9 years, down slightly from 4.1 years at the end of the previous fiscal year. The net assets of the Fund as of September 30, 2012 were $26,898,325 and the net asset value per share was $10.70. The ratio of net investment income to average net assets during the six months was 1.86% and the ratio of net expenses to average net assets was 0.65%.
Thank you for your continued confidence in The Government Street Funds. Please call us if we can be of further service to you.
Very truly yours,
Thomas W. Leavell
President
Leavell Investment Management, Inc.
The Government Street Funds
Data presented reflects past performance, which is no guarantee of future results. Investment results and principal value will fluctuate so that shares, when redeemed, may be worth more or less than their original cost. Due to market volatility, current performance may be higher or lower than the performance shown.
This report is submitted for the general information of the shareholders of the Funds. The report is not authorized for distribution to prospective investors in the Funds unless it is accompanied by a current prospectus.
This report reflects our views, opinions and portfolio holdings as of September 30, 2012, the end of the reporting period. These views are subject to change at any time based upon market or other conditions. For more current information throughout the year please visit www.leavellinvestments.com.
THE GOVERNMENT STREET EQUITY FUND PORTFOLIO INFORMATION September 30, 2012 (Unaudited) |
Sector Concentration (% of Net Assets) |
| |
| Apple, Inc. | 6.4% |
| JPMorgan Alerian MLP Index ETN | 2.8% |
| Philip Morris International, Inc. | 2.8% |
| Vanguard Mid-Cap ETF | 2.7% |
| iShares S&P MidCap 400 Index Fund | 2.2% |
| International Business Machines Corporation | 2.2% |
| Colonial Properties Trust | 2.1% |
| Walt Disney Company (The) | 2.1% |
| ConocoPhillips | 1.8% |
| Alexion Pharmaceuticals, Inc. | 1.8% |
THE GOVERNMENT STREET MID-CAP FUND PORTFOLIO INFORMATION September 30, 2012 (Unaudited) |
Sector Concentration (% of Net Assets) |
| |
| iShares S&P MidCap 400 Index Fund | 3.5% |
| Vanguard Mid-Cap ETF | 3.1% |
| JPMorgan Alerian MLP Index ETN | 2.8% |
| Guggenheim Mid-Cap Core ETF | 2.2% |
| Alliance Data Systems Corporation | 1.8% |
| Stericycle, Inc. | 1.7% |
| Colonial Properties Trust | 1.6% |
| Church & Dwight Company, Inc. | 1.5% |
| ONEOK, Inc. | 1.5% |
| AMETEK, Inc. | 1.3% |
THE ALABAMA TAX FREE BOND FUND PORTFOLIO INFORMATION September 30, 2012 (Unaudited) |
|
| | |
| AAA | | 12.2% |
| AA | | 84.0% |
| A | | 1.0% |
| Not Rated | | 2.8% |
GOVERNMENT STREET EQUITY FUND SCHEDULE OF INVESTMENTS September 30, 2012 (Unaudited) |
| | | | | | |
| Consumer Discretionary — 9.2% | | | | | | |
| Comcast Corporation - Class A | | | 21,000 | | | $ | 751,170 | |
| Darden Restaurants, Inc. | | | 10,000 | | | | 557,500 | |
DIRECTV (a) | | | 6,000 | | | | 314,760 | |
| Home Depot, Inc. (The) | | | 17,500 | | | | 1,056,475 | |
| Johnson Controls, Inc. | | | 18,600 | | | | 509,640 | |
| McDonald's Corporation | | | 7,000 | | | | 642,250 | |
| NIKE, Inc. - Class B | | | 6,000 | | | | 569,460 | |
| Tractor Supply Company | | | 7,000 | | | | 692,230 | |
Urban Outfitters, Inc. (a) | | | 8,000 | | | | 300,480 | |
| Walt Disney Company (The) | | | 30,000 | | | | 1,568,400 | |
| | | | | | | | 6,962,365 | |
| Consumer Staples — 11.2% | | | | | | | | |
| Altria Group, Inc. | | | 33,000 | | | | 1,101,870 | |
| Anheuser-Busch InBev SA/NV - ADR | | | 11,500 | | | | 987,965 | |
| Coca-Cola Company (The) | | | 25,000 | | | | 948,250 | |
| Costco Wholesale Corporation | | | 1,000 | | | | 100,125 | |
| Kraft Foods, Inc. - Class A | | | 24,836 | | | | 1,026,969 | |
| McCormick & Company, Inc. - Non-Voting Shares | | | 10,000 | | | | 620,400 | |
| Philip Morris International, Inc. | | | 23,200 | | | | 2,086,608 | |
| Procter & Gamble Company (The) | | | 10,000 | | | | 693,600 | |
| Whole Foods Market, Inc. | | | 9,500 | | | | 925,300 | |
| | | | | | | | 8,491,087 | |
| Energy — 8.8% | | | | | | | | |
| Apache Corporation | | | 2,489 | | | | 215,224 | |
| BP plc - ADR | | | 20,000 | | | | 847,200 | |
| Chevron Corporation | | | 10,000 | | | | 1,165,600 | |
| ConocoPhillips | | | 24,500 | | | | 1,400,910 | |
| Phillips 66 | | | 12,250 | | | | 568,032 | |
| Pioneer Natural Resources Company | | | 8,000 | | | | 835,200 | |
Plains Exploration & Production Company (a) | | | 6,000 | | | | 224,820 | |
| Range Resources Corporation | | | 7,500 | | | | 524,025 | |
| Spectra Energy Corporation | | | 5,000 | | | | 146,800 | |
| TransCanada Corporation | | | 16,000 | | | | 728,000 | |
| | | | | | | | 6,655,811 | |
| Financials — 9.7% | | | | | | | | |
| Aflac, Inc. | | | 13,700 | | | | 655,956 | |
American Capital Ltd. (a) | | | 12,990 | | | | 147,307 | |
American International Group, Inc. (a) | | | 3,000 | | | | 98,370 | |
| Brookfield Asset Management, Inc. - Class A | | | 19,000 | | | | 655,690 | |
| Colonial Properties Trust | | | 75,000 | | | | 1,578,750 | |
| Cullen/Frost Bankers, Inc. | | | 6,500 | | | | 373,295 | |
| JPMorgan Chase & Company | | | 25,000 | | | | 1,012,000 | |
GOVERNMENT STREET EQUITY FUND SCHEDULE OF INVESTMENTS (Continued) |
COMMON STOCKS — 84.1% (Continued) | | | | | | |
| Financials — 9.7% (Continued) | | | | | | |
| Plum Creek Timber Company, Inc. | | | 15,000 | | | $ | 657,600 | |
| Protective Life Corporation | | | 17,000 | | | | 445,570 | |
| Rayonier, Inc. | | | 10,000 | | | | 490,100 | |
| U.S. Bancorp | | | 26,000 | | | | 891,800 | |
| Wells Fargo & Company | | | 11,000 | | | | 379,830 | |
| | | | | | | | 7,386,268 | |
| Health Care — 9.9% | | | | | | | | |
Alexion Pharmaceuticals, Inc. (a) | | | 12,000 | | | | 1,372,800 | |
| Cardinal Health, Inc. | | | 13,315 | | | | 518,885 | |
CareFusion Corporation (a) | | | 6,000 | | | | 170,340 | |
Cerner Corporation (a) | | | 12,000 | | | | 928,920 | |
| Computer Programs & Systems, Inc. | | | 10,100 | | | | 561,055 | |
Elan Corporation plc - ADR (a) | | | 6,500 | | | | 69,680 | |
| Fresenius Medical Care AG & Company KGaA - ADR | | | 6,000 | | | | 440,400 | |
Gilead Sciences, Inc. (a) | | | 7,000 | | | | 464,310 | |
Questcor Pharmaceuticals, Inc. (a) | | | 12,000 | | | | 222,000 | |
Regeneron Pharmaceuticals, Inc. (a) | | | 2,300 | | | | 351,118 | |
| Shire plc - ADR | | | 9,000 | | | | 798,300 | |
| Techne Corporation | | | 10,000 | | | | 719,400 | |
Waters Corporation (a) | | | 11,100 | | | | 924,963 | |
| | | | | | | | 7,542,171 | |
| Industrials — 8.3% | | | | | | | | |
| C.H. Robinson Worldwide, Inc. | | | 3,000 | | | | 175,650 | |
| Caterpillar, Inc. | | | 10,350 | | | | 890,514 | |
| Emerson Electric Company | | | 15,000 | | | | 724,050 | |
| General Dynamics Corporation | | | 15,000 | | | | 991,800 | |
| Ingersoll-Rand plc | | | 10,000 | | | | 448,200 | |
| Manitowoc Company, Inc. (The) | | | 14,000 | | | | 186,760 | |
| Norfolk Southern Corporation | | | 10,000 | | | | 636,300 | |
Quanta Services, Inc. (a) | | | 15,000 | | | | 370,500 | |
Stericycle, Inc. (a) | | | 7,000 | | | | 633,640 | |
| United Technologies Corporation | | | 15,500 | | | | 1,213,495 | |
| | | | | | | | 6,270,909 | |
| Information Technology — 18.3% | | | | | | | | |
| Accenture plc - Class A | | | 9,500 | | | | 665,285 | |
Adobe Systems, Inc. (a) | | | 25,000 | | | | 811,500 | |
| ADTRAN, Inc. | | | 22,000 | | | | 380,160 | |
| Apple, Inc. | | | 7,300 | | | | 4,870,998 | |
| Automatic Data Processing, Inc. | | | 12,400 | | | | 727,384 | |
| Broadridge Financial Solutions, Inc. | | | 5,000 | | | | 116,650 | |
eBay, Inc. (a) | | | 4,000 | | | | 193,640 | |
EMC Corporation (a) | | | 2,000 | | | | 54,540 | |
Google, Inc. - Class A (a) | | | 1,000 | | | | 754,500 | |
| International Business Machines Corporation | | | 8,000 | | | | 1,659,600 | |
GOVERNMENT STREET EQUITY FUND SCHEDULE OF INVESTMENTS (Continued) |
COMMON STOCKS — 84.1% (Continued) | | | | | | |
| Information Technology — 18.3% (Continued) | | | | | | |
| MasterCard, Inc. - Class A | | | 3,000 | | | $ | 1,354,440 | |
| Microsoft Corporation | | | 5,000 | | | | 148,900 | |
NetApp, Inc. (a) | | | 13,000 | | | | 427,440 | |
| TE Connectivity Ltd. | | | 11,000 | | | | 374,110 | |
| Texas Instruments, Inc. | | | 10,000 | | | | 275,500 | |
| Total System Services, Inc. | | | 5,000 | | | | 118,500 | |
| Visa, Inc. - Class A | | | 7,000 | | | | 939,960 | |
| | | | | | | | 13,873,107 | |
| Materials — 2.6% | | | | | | | | |
| Dow Chemical Company (The) | | | 20,000 | | | | 579,200 | |
| Freeport-McMoRan Copper & Gold, Inc. | | | 13,932 | | | | 551,429 | |
| Praxair, Inc. | | | 8,000 | | | | 831,040 | |
| | | | | | | | 1,961,669 | |
| Telecommunication Services — 2.6% | | | | | | | | |
| AT&T, Inc. | | | 15,000 | | | | 565,500 | |
| Telstra Corporation Ltd. - ADR | | | 30,000 | | | | 607,500 | |
| Verizon Communications, Inc. | | | 18,000 | | | | 820,260 | |
| | | | | | | | 1,993,260 | |
| Utilities — 3.5% | | | | | | | | |
| Duke Energy Corporation | | | 20,000 | | | | 1,296,000 | |
| Southern Company (The) | | | 18,000 | | | | 829,620 | |
| Wisconsin Energy Corporation | | | 14,000 | | | | 527,380 | |
| | | | | | | | 2,653,000 | |
| | | | | | | | | |
Total Common Stocks (Cost $38,830,737) | | | | | | $ | 63,789,647 | |
EXCHANGE-TRADED FUNDS — 10.5% | | | | | | |
| iShares Russell 2000 Index Fund | | | 10,000 | | | $ | 834,600 | |
| iShares S&P MidCap 400 Index Fund | | | 17,000 | | | | 1,677,560 | |
| Market Vectors Agribusiness ETF | | | 26,000 | | | | 1,346,540 | |
| ProShares Credit Suisse 130/30 ETF | | | 7,000 | | | | 463,890 | |
| Vanguard Growth ETF | | | 5,500 | | | | 398,200 | |
| Vanguard Mid-Cap ETF | | | 25,400 | | | | 2,062,734 | |
| Vanguard MSCI Emerging Markets ETF | | | 12,500 | | | | 521,875 | |
| WisdomTree Emerging Markets Equity Income Fund | | | 12,000 | | | | 644,040 | |
Total Exchange-Traded Funds (Cost $6,926,409) | | | | | | $ | 7,949,439 | |
EXCHANGE-TRADED NOTES — 2.8% | | | | | | |
| JPMorgan Alerian MLP Index ETN (Cost $1,843,715) | | | 52,000 | | | $ | 2,100,800 | |
GOVERNMENT STREET EQUITY FUND SCHEDULE OF INVESTMENTS (Continued) |
| | | | | | |
American International Group, Inc., 01/19/2021 at $45 (a) (Cost $13,600) | | | 800 | | | $ | 10,760 | |
| | | | | | |
U.S. Bank, N.A., discount, 0.02% (c), due 10/01/2012 (Cost $1,761,000) | | $ | 1,761,000 | | | $ | 1,761,000 | |
MONEY MARKET FUNDS — 0.0% (b) | | | | | | |
Invesco STIT - STIC Prime Portfolio (The) - Institutional Class, 0.00% (d) (Cost $906) | | | 906 | | | $ | 906 | |
| | | | | | | | | |
Total Investments at Value — 99.7% (Cost $49,376,367) | | | | | | $ | 75,612,552 | |
| | | | | | | | | |
| Other Assets in Excess of Liabilities — 0.3% | | | | | | | 256,924 | |
| | | | | | | | | |
| Net Assets — 100.0% | | | | | | $ | 75,869,476 | |
| ADR - American Depositary Receipt. |
| |
| (a) | Non-income producing security. |
| | |
| (b) | Percentage rounds to less than 0.1%. |
| | |
| (c) | Rate shown is the annualized yield at time of purchase, not a coupon rate. |
| | |
| (d) | Variable rate security. The rate shown is the 7-day effective yield as of September 30, 2012. |
| | |
| See accompanying notes to financial statements. |
THE GOVERNMENT STREET MID-CAP FUND SCHEDULE OF INVESTMENTS September 30, 2012 (Unaudited) |
| | | | | | |
| Consumer Discretionary — 14.3% | | | | | | |
BorgWarner, Inc. (a) | | | 2,800 | | | $ | 193,508 | |
Buffalo Wild Wings, Inc. (a) | | | 2,400 | | | | 205,776 | |
| Chico's FAS, Inc. | | | 7,100 | | | | 128,581 | |
| Coach, Inc. | | | 5,825 | | | | 326,316 | |
| Darden Restaurants, Inc. | | | 3,175 | | | | 177,006 | |
Dollar Tree, Inc. (a) | | | 4,200 | | | | 202,755 | |
| Family Dollar Stores, Inc. | | | 2,800 | | | | 185,640 | |
| Gildan Activewear, Inc. - Class A | | | 7,500 | | | | 237,600 | |
| Guess?, Inc. | | | 7,575 | | | | 192,557 | |
| Hasbro, Inc. | | | 2,525 | | | | 96,379 | |
| Jarden Corporation | | | 5,650 | | | | 298,546 | |
| John Wiley & Sons, Inc. - Class A | | | 1,800 | | | | 82,710 | |
Liberty Global, Inc. - Class A (a) | | | 5,125 | | | | 311,344 | |
| Nordstrom, Inc. | | | 3,900 | | | | 215,202 | |
O'Reilly Automotive, Inc. (a) | | | 4,775 | | | | 399,286 | |
Panera Bread Company - Class A (a) | | | 1,600 | | | | 273,424 | |
| PetSmart, Inc. | | | 3,500 | | | | 241,430 | |
| PVH Corporation | | | 4,100 | | | | 384,252 | |
| Ross Stores, Inc. | | | 6,000 | | | | 387,600 | |
| Service Corporation International | | | 15,200 | | | | 204,592 | |
| Tiffany & Company | | | 3,475 | | | | 215,033 | |
| True Religion Apparel, Inc. | | | 8,600 | | | | 183,438 | |
Urban Outfitters, Inc. (a) | | | 5,600 | | | | 210,336 | |
| Vail Resorts, Inc. | | | 2,700 | | | | 155,655 | |
| VF Corporation | | | 1,175 | | | | 187,248 | |
| | | | | | | | 5,696,214 | |
| Consumer Staples — 3.5% | | | | | | | | |
| Church & Dwight Company, Inc. | | | 10,800 | | | | 583,092 | |
Green Mountain Coffee Roasters, Inc. (a) | | | 650 | | | | 15,437 | |
| Hormel Foods Corporation | | | 12,000 | | | | 350,880 | |
| J.M. Smucker Company (The) | | | 4,700 | | | | 405,751 | |
| Tyson Foods, Inc. - Class A | | | 2,000 | | | | 32,040 | |
| | | | | | | | 1,387,200 | |
| Energy — 4.8% | | | | | | | | |
Cameron International Corporation (a) | | | 4,010 | | | | 224,841 | |
| Cimarex Energy Company | | | 2,750 | | | | 161,012 | |
| Murphy Oil Corporation | | | 3,740 | | | | 200,801 | |
Newfield Exploration Company (a) | | | 2,800 | | | | 87,696 | |
Noble Corporation (a) | | | 5,360 | | | | 191,781 | |
| Overseas Shipholding Group, Inc. | | | 3,600 | | | | 23,760 | |
| Peabody Energy Corporation | | | 4,800 | | | | 106,992 | |
| Pioneer Natural Resources Company | | | 2,680 | | | | 279,792 | |
THE GOVERNMENT STREET MID-CAP FUND SCHEDULE OF INVESTMENTS (Continued) |
COMMON STOCKS — 83.2% (Continued) | | | | | | |
| Energy — 4.8% (Continued) | | | | | | |
| Range Resources Corporation | | | 3,500 | | | $ | 244,545 | |
| Schlumberger Ltd. | | | 3,134 | | | | 226,682 | |
| Valero Energy Corporation | | | 4,950 | | | | 156,816 | |
| | | | | | | | 1,904,718 | |
| Financials — 14.9% | | | | | | | | |
Alexander & Baldwin, Inc. (a) | | | 3,000 | | | | 88,590 | |
Alleghany Corporation (a) | | | 765 | | | | 263,879 | |
| American Financial Group, Inc. | | | 8,400 | | | | 318,360 | |
| Annaly Capital Management, Inc. | | | 8,500 | | | | 143,140 | |
Arch Capital Group Ltd. (a) | | | 7,950 | | | | 331,356 | |
| Arthur J. Gallagher & Company | | | 6,750 | | | | 241,785 | |
| Axis Capital Holdings Ltd. | | | 5,000 | | | | 174,600 | |
| Bank of Hawaii Corporation | | | 6,000 | | | | 273,720 | |
| Berkley (W.R.) Corporation | | | 6,450 | | | | 241,811 | |
| Colonial Properties Trust | | | 30,000 | | | | 631,500 | |
| Cullen/Frost Bankers, Inc. | | | 5,600 | | | | 321,608 | |
| Eaton Vance Corporation | | | 10,250 | | | | 296,840 | |
| Hudson City Bancorp, Inc. | | | 13,000 | | | | 103,480 | |
IntercontinentalExchange, Inc. (a) | | | 1,850 | | | | 246,809 | |
| Jones Lang LaSalle, Inc. | | | 2,800 | | | | 213,780 | |
| Kemper Corporation | | | 6,200 | | | | 190,402 | |
| Legg Mason, Inc. | | | 3,780 | | | | 93,290 | |
| Liberty Property Trust | | | 4,600 | | | | 166,704 | |
| New York Community Bancorp, Inc. | | | 10,270 | | | | 145,423 | |
| Old Republic International Corporation | | | 16,400 | | | | 152,520 | |
| Potlatch Corporation | | | 6,941 | | | | 259,385 | |
| Rayonier, Inc. | | | 10,500 | | | | 514,605 | |
| SEI Investments Company | | | 10,000 | | | | 214,500 | |
St. Joe Company (The) (a) | | | 7,000 | | | | 136,500 | |
| Westamerica Bancorporation | | | 3,300 | | | | 155,265 | |
| | | | | | | | 5,919,852 | |
| Health Care — 8.7% | | | | | | | | |
Alexion Pharmaceuticals, Inc. (a) | | | 1,200 | | | | 137,280 | |
Almost Family, Inc. (a) | | | 1,000 | | | | 21,280 | |
Bio-Rad Laboratories, Inc. - Class A (a) | | | 2,500 | | | | 266,800 | |
| C.R. Bard, Inc. | | | 1,000 | | | | 104,650 | |
| Cantel Medical Corporation | | | 3,000 | | | | 81,240 | |
Cerner Corporation (a) | | | 1,700 | | | | 131,597 | |
Charles River Laboratories International, Inc. (a) | | | 3,000 | | | | 118,800 | |
| Chemed Corporation | | | 1,000 | | | | 69,290 | |
| Computer Programs & Systems, Inc. | | | 1,800 | | | | 99,990 | |
Covance, Inc. (a) | | | 4,000 | | | | 186,760 | |
| Covidien plc | | | 1,500 | | | | 89,130 | |
Edwards Lifesciences Corporation (a) | | | 1,000 | | | | 107,370 | |
THE GOVERNMENT STREET MID-CAP FUND SCHEDULE OF INVESTMENTS (Continued) |
COMMON STOCKS — 83.2% (Continued) | | | | | | |
| Health Care — 8.7% (Continued) | | | | | | |
| Ensign Group, Inc. (The) | | | 3,000 | | | $ | 91,815 | |
| Fresenius Medical Care AG & Company KGaA - ADR | | | 2,200 | | | | 161,480 | |
Gilead Sciences, Inc. (a) | | | 150 | | | | 9,949 | |
Hanger, Inc. (a) | | | 4,000 | | | | 114,120 | |
Henry Schein, Inc. (a) | | | 2,000 | | | | 158,540 | |
Illumina, Inc. (a) | | | 1,000 | | | | 48,200 | |
Intuitive Surgical, Inc. (a) | | | 200 | | | | 99,126 | |
Life Technologies Corporation (a) | | | 2,891 | | | | 141,312 | |
Myriad Genetics, Inc. (a) | | | 1,000 | | | | 26,990 | |
PSS World Medical, Inc. (a) | | | 2,000 | | | | 45,560 | |
| ResMed, Inc. | | | 6,000 | | | | 242,820 | |
| Shire plc - ADR | | | 1,500 | | | | 133,050 | |
| Techne Corporation | | | 4,500 | | | | 323,730 | |
| Teleflex, Inc. | | | 4,000 | | | | 275,360 | |
Waters Corporation (a) | | | 2,000 | | | | 166,660 | |
| | | | | | | | 3,452,899 | |
| Industrials — 13.3% | | | | | | | | |
| AMETEK, Inc. | | | 15,000 | | | | 531,750 | |
| C.H. Robinson Worldwide, Inc. | | | 5,000 | | | | 292,750 | |
| Deluxe Corporation | | | 5,000 | | | | 152,800 | |
| Donaldson Company, Inc. | | | 12,000 | | | | 416,520 | |
Engility Holdings, Inc. (a) | | | 500 | | | | 9,225 | |
| Expeditors International of Washington, Inc. | | | 6,000 | | | | 218,160 | |
| Fastenal Company | | | 9,950 | | | | 427,751 | |
| Graco, Inc. | | | 6,000 | | | | 301,680 | |
Jacobs Engineering Group, Inc. (a) | | | 4,475 | | | | 180,924 | |
| Joy Global, Inc. | | | 2,000 | | | | 112,120 | |
| L-3 Communications Holdings, Inc. | | | 3,000 | | | | 215,130 | |
| Manpower, Inc. | | | 4,000 | | | | 147,200 | |
| Matson, Inc. | | | 3,000 | | | | 62,730 | |
| MSC Industrial Direct Company, Inc. - Class A | | | 5,000 | | | | 337,300 | |
| Pentair Ltd. | | | 2,400 | | | | 106,824 | |
| Snap-on, Inc. | | | 4,275 | | | | 307,244 | |
| SPX Corporation | | | 5,000 | | | | 327,050 | |
Stericycle, Inc. (a) | | | 7,500 | | | | 678,900 | |
| Timken Company | | | 5,000 | | | | 185,800 | |
| Waste Connections, Inc. | | | 6,000 | | | | 181,500 | |
WESCO International, Inc. (a) | | | 1,850 | | | | 105,820 | |
| | | | | | | | 5,299,178 | |
| Information Technology — 13.0% | | | | | | | | |
| ADTRAN, Inc. | | | 8,000 | | | | 138,240 | |
Advent Software, Inc. (a) | | | 8,000 | | | | 196,560 | |
Alliance Data Systems Corporation (a) | | | 5,000 | | | | 709,750 | |
Arrow Electronics, Inc. (a) | | | 8,600 | | | | 289,906 | |
THE GOVERNMENT STREET MID-CAP FUND SCHEDULE OF INVESTMENTS (Continued) |
COMMON STOCKS — 83.2% (Continued) | | | | | | |
| Information Technology — 13.0% (Continued) | | | | | | |
Cognizant Technology Solutions Corporation - Class A (a) | | | 3,000 | | | $ | 209,760 | |
Cree, Inc. (a) | | | 4,820 | | | | 123,055 | |
| Diebold, Inc. | | | 5,000 | | | | 168,550 | |
| DST Systems, Inc. | | | 4,000 | | | | 226,240 | |
| Harris Corporation | | | 6,000 | | | | 307,320 | |
| IAC/InterActiveCorporation | | | 3,000 | | | | 156,180 | |
Integrated Device Technology, Inc. (a) | | | 10,000 | | | | 58,800 | |
| Jack Henry & Associates, Inc. | | | 9,000 | | | | 341,100 | |
Lam Research Corporation (a) | | | 6,000 | | | | 190,710 | |
| Linear Technology Corporation | | | 6,000 | | | | 191,100 | |
| Microchip Technology, Inc. | | | 5,000 | | | | 163,700 | |
| National Instruments Corporation | | | 12,000 | | | | 302,040 | |
NetApp, Inc. (a) | | | 5,000 | | | | 164,400 | |
Polycom, Inc. (a) | | | 8,000 | | | | 78,960 | |
Rackspace Hosting, Inc. (a) | | | 4,000 | | | | 264,360 | |
Rovi Corporation (a) | | | 6,000 | | | | 87,060 | |
SanDisk Corporation (a) | | | 5,000 | | | | 217,150 | |
| Solera Holdings, Inc. | | | 4,000 | | | | 175,480 | |
| Xilinx, Inc. | | | 7,000 | | | | 233,870 | |
Zebra Technologies Corporation - Class A (a) | | | 4,000 | | | | 150,160 | |
| | | | | | | | 5,144,451 | |
| Materials — 5.8% | | | | | | | | |
| Airgas, Inc. | | | 4,000 | | | | 329,200 | |
| Albemarle Corporation | | | 8,000 | | | | 421,440 | |
| Ashland, Inc. | | | 3,000 | | | | 214,800 | |
| Cabot Corporation | | | 4,000 | | | | 146,280 | |
| Martin Marietta Materials, Inc. | | | 2,500 | | | | 207,175 | |
| Packaging Corporation of America | | | 5,000 | | | | 181,500 | |
| Scotts Miracle-Gro Company (The) - Class A | | | 4,000 | | | | 173,880 | |
| Sonoco Products Company | | | 5,000 | | | | 154,950 | |
| Steel Dynamics, Inc. | | | 12,000 | | | | 134,760 | |
| Valspar Corporation (The) | | | 6,000 | | | | 336,600 | |
| | | | | | | | 2,300,585 | |
| Utilities — 4.9% | | | | | | | | |
| AGL Resources, Inc. | | | 8,400 | | | | 343,644 | |
| Great Plains Energy, Inc. | | | 9,050 | | | | 201,453 | |
| ONEOK, Inc. | | | 12,000 | | | | 579,720 | |
| Pepco Holdings, Inc. | | | 7,900 | | | | 149,310 | |
| SCANA Corporation | | | 7,530 | | | | 363,473 | |
| Vectren Corporation | | | 10,600 | | | | 303,160 | |
| | | | | | | | 1,940,760 | |
| | | | | | | | | |
Total Common Stocks (Cost $22,086,507) | | | | | | $ | 33,045,857 | |
THE GOVERNMENT STREET MID-CAP FUND SCHEDULE OF INVESTMENTS (Continued) |
EXCHANGE-TRADED FUNDS — 10.5% | | | | | | |
First Trust NYSE Arca Biotechnology Index Fund (a) | | | 8,000 | | | $ | 371,200 | |
| Guggenheim Mid-Cap Core ETF | | | 26,000 | | | | 867,360 | |
| iShares Nasdaq Biotechnology Index Fund | | | 2,000 | | | | 284,860 | |
| iShares S&P MidCap 400 Index Fund | | | 14,280 | | | | 1,409,150 | |
| Vanguard Mid-Cap ETF | | | 15,000 | | | | 1,218,150 | |
Total Exchange-Traded Funds (Cost $3,309,104) | | | | | | $ | 4,150,720 | |
EXCHANGE-TRADED NOTES — 2.8% | | | | | | |
| JPMorgan Alerian MLP Index ETN (Cost $980,004) | | | 27,000 | | | $ | 1,090,800 | |
| | | | | | |
U.S. Bank, N.A., discount, 0.02% (b), due 10/01/2012 (Cost $2,235,000) | | $ | 2,235,000 | | | $ | 2,235,000 | |
MONEY MARKET FUNDS — 0.0% (c) | | | | | | |
Invesco STIT - STIC Prime Portfolio (The) - Institutional Class, 0.00% (d) (Cost $636) | | | 636 | | | $ | 636 | |
| | | | | | | | | |
Total Investments at Value — 102.1% (Cost $28,611,251) | | | | | | $ | 40,523,013 | |
| | | | | | | | | |
| Liabilities in Excess of Other Assets — (2.1%) | | | | | | | (815,705 | ) |
| | | | | | | | | |
| Net Assets — 100.0% | | | | | | $ | 39,707,308 | |
| ADR - American Depositary Receipt. |
| |
| (a) | Non-income producing security. |
| | |
| (b) | Rate shown is the annualized yield at time of purchase, not a coupon rate. |
| | |
| (c) | Percentage rounds to less than 0.1%. |
| | |
| (d) | Variable rate security. The rate shown is the 7-day effective yield as of September 30, 2012. |
| | |
| See accompanying notes to financial statements. |
THE ALABAMA TAX FREE BOND FUND SCHEDULE OF INVESTMENTS September 30, 2012 (Unaudited) |
ALABAMA FIXED RATE REVENUE AND GENERAL OBLIGATION (GO) BONDS — 93.3% | | | | | | |
| Alabama Drinking Water Financing Auth., Rev., | | | | | | |
| 4.00%, due 08/15/2014 | | $ | 250,000 | | | $ | 257,522 | |
| 5.00%, due 08/15/2018 | | | 400,000 | | | | 434,728 | |
| Alabama Special Care Facilities Financing Auth., Birmingham, Rev., | | | | | | | | |
| 5.375%, due 11/01/2012, ETM | | | 205,000 | | | | 205,886 | |
| Alabama State Public School & College Auth., Capital Improvements, Rev., | | | | | | | | |
| 5.00%, due 12/01/2017 | | | 300,000 | | | | 362,235 | |
| Alabama State Public School & College Auth., Capital Improvements, Series A, Rev., | | | | | | | | |
| 4.00%, due 02/01/2017 | | | 250,000 | | | | 284,285 | |
| Alabama State, GO, | | | | | | | | |
| 5.00%, due 09/01/2015 | | | 300,000 | | | | 301,146 | |
| 5.00%, due 02/01/2016 | | | 575,000 | | | | 637,152 | |
| 5.00%, due 09/01/2016 | | | 300,000 | | | | 301,146 | |
| 5.00%, due 09/01/2017 | | | 300,000 | | | | 307,143 | |
| Anniston, AL, Waterworks & Sewer Board, Water & Sewer, Rev., | | | | | | | | |
| 3.50%, due 06/01/2016 | | | 500,000 | | | | 541,765 | |
| Athens, AL, Electric Rev., Warrants, | | | | | | | | |
| 3.00%, due 06/01/2016 | | | 510,000 | | | | 543,456 | |
| Athens, AL, Warrants, | | | | | | | | |
| 4.00%, due 09/01/2018 | | | 300,000 | | | | 350,205 | |
| Auburn University, AL, General Fee Rev., | | | | | | | | |
| 5.00%, due 06/01/2018 | | | 315,000 | | | | 384,962 | |
| 5.00%, due 06/01/2020 | | | 350,000 | | | | 437,853 | |
| Auburn, AL Refunding & Capital Improvements, Series B, GO, Warrants, | | | | | | | | |
| 4.00%, due 08/01/2018 | | | 200,000 | | | | 232,954 | |
| Auburn, AL, School, Series A, GO, Warrants, | | | | | | | | |
| 5.00%, due 08/01/2018 | | | 500,000 | | | | 610,165 | |
| Auburn, AL, Waterworks Board, Water Rev., | | | | | | | | |
| 5.00%, due 09/01/2014 | | | 205,000 | | | | 220,838 | |
| Baldwin Co., AL, GO, Warrants, | | | | | | | | |
| 5.00%, due 02/01/2015 | | | 200,000 | | | | 212,088 | |
| Baldwin Co., AL, Series A, GO, Warrants, | | | | | | | | |
| 5.00%, due 02/01/2017 | | | 320,000 | | | | 378,269 | |
| Birmingham, AL, Waterworks Board, Water Rev., | | | | | | | | |
| 5.00%, due 01/01/2017 | | | 400,000 | | | | 463,992 | |
THE ALABAMA TAX FREE BOND FUND SCHEDULE OF INVESTMENTS (Continued) |
ALABAMA FIXED RATE REVENUE AND GENERAL OBLIGATION (GO) BONDS — 93.3% (Continued) | | | | | | |
| Calhoun Co., AL, Gas Tax Anticipation, Series A, Rev., Warrants, | | | | | | |
| 4.00%, due 03/01/2016 | | $ | 445,000 | | | $ | 487,342 | |
| Chelsea, AL, GO, | | | | | | | | |
| 4.00%, due 05/01/2015 | | | 260,000 | | | | 278,983 | |
| Enterprise, AL, GO, School Warrants, | | | | | | | | |
| 4.00%, due 02/01/2016 | | | 400,000 | | | | 443,892 | |
| Florence, AL, Board of Education, Rev., | | | | | | | | |
| 3.00%, due 03/01/2016 | | | 500,000 | | | | 533,415 | |
| Florence, AL, Electric Rev., Warrants, | | | | | | | | |
| 3.10%, due 06/01/2015 | | | 300,000 | | | | 315,195 | |
| 3.50%, due 06/01/2017 | | | 515,000 | | | | 563,853 | |
| Foley, AL, GO, Warrants, | | | | | | | | |
| 4.00%, due 01/01/2015 | | | 315,000 | | | | 338,764 | |
| Foley, AL, Utilities Board, Utilities Rev., | | | | | | | | |
| 4.00%, due 11/01/2018 | | | 710,000 | | | | 831,055 | |
| 4.50%, due 11/01/2019 | | | 250,000 | | | | 272,437 | |
| Gadsden, AL, GO, School Warrants, | | | | | | | | |
| 3.00%, due 08/01/2015 | | | 250,000 | | | | 262,425 | |
| Homewood, AL, GO, Warrants, | | | | | | | | |
| 5.00%, due 09/01/2015 | | | 250,000 | | | | 282,025 | |
| Homewood, AL, Special Tax School Warrants, | | | | | | | | |
| 4.00%, due 04/01/2017 | | | 500,000 | | | | 563,145 | |
| Houston Co., AL, Board of Education, GO, Capital Outlay Warrants, | | | | | | | | |
| 4.00%, due 12/01/2013 | | | 545,000 | | | | 565,503 | |
| Houston Co., AL, GO, | | | | | | | | |
| 4.75%, due 10/15/2016 | | | 500,000 | | | | 538,140 | |
| Huntsville, AL, Electric Systems, Rev., | | | | | | | | |
| 4.00%, due 12/01/2013 | | | 300,000 | | | | 312,930 | |
| 3.00%, due 12/01/2016 | | | 375,000 | | | | 411,262 | |
| Huntsville, AL, GO, Capital Improvement Warrants, | | | | | | | | |
| 4.00%, due 03/01/2015 | | | 550,000 | | | | 596,343 | |
| 5.00%, due 11/01/2017, | | | | | | | | |
| Prerefunded 11/01/2013 @ 100 | | | 300,000 | | | | 315,071 | |
| Huntsville, AL, GO, Refunding and Capital Improvement Warrants, | | | | | | | | |
| 4.00%, due 09/01/2016 | | | 500,000 | | | | 565,560 | |
| 4.00%, due 09/01/2018 | | | 500,000 | | | | 585,030 | |
| Macon Co., AL, GO, Warrants, | | | | | | | | |
| 4.25%, due 10/01/2027, | | | | | | | | |
| Prerefunded 10/01/2017 @ 100 | | | 200,000 | | | | 235,530 | |
THE ALABAMA TAX FREE BOND FUND SCHEDULE OF INVESTMENTS (Continued) |
ALABAMA FIXED RATE REVENUE AND GENERAL OBLIGATION (GO) BONDS — 93.3% (Continued) | | | | | | |
| Mobile Co., AL, GO, Refunding and Improvement Warrants, | | | | | | |
| 4.50%, due 08/01/2013 | | $ | 100,000 | | | $ | 103,500 | |
| 5.25%, due 08/01/2015 | | | | | | | | |
| Prerefunded 08/01/2014 @100 | | | 210,000 | | | | 229,049 | |
| 5.25%, due 08/01/2015 | | | 190,000 | | | | 206,272 | |
| Montgomery, AL, GO, | | | | | | | | |
| 3.00%, due 11/01/2014 | | | 500,000 | | | | 525,100 | |
| Montgomery, AL, Waterworks & Sanitation, Rev., | | | | | | | | |
| 5.00%, due 09/01/2017 | | | 250,000 | | | | 299,535 | |
| Morgan Co., AL, Board of Education, Rev., Capital Outlay Warrants, | | | | | | | | |
| 4.00%, due 03/01/2019 | | | 250,000 | | | | 286,942 | |
| Opelika, AL, GO, Warrants, | | | | | | | | |
| 2.00%, due 11/01/2017 | | | 275,000 | | | | 287,939 | |
| Opelika, AL, Utilities Board, Series B, Rev., | | | | | | | | |
| 3.00%, due 06/01/2016 | | | 475,000 | | | | 509,428 | |
| 3.00%, due 06/01/2018 | | | 215,000 | | | | 233,286 | |
| Orange Beach, AL, GO, Warrants, | | | | | | | | |
| 4.00%, due 02/01/2018 | | | 200,000 | | | | 225,440 | |
| 5.00%, due 02/01/2019 | | | 240,000 | | | | 286,591 | |
| Prattville, AL, Waterworks Board, Rev., | | | | | | | | |
| 3.00%, due 08/01/2017 | | | 290,000 | | | | 313,757 | |
| Sheffield, AL, Electric Rev., | | | | | | | | |
| 4.00%, due 07/01/2017 | | | 600,000 | | | | 671,562 | |
| Smiths, AL, Water & Sewer Auth., Rev., | | | | | | | | |
| 4.00%, due 06/01/2013 | | | 200,000 | | | | 204,032 | |
| St. Clair Co., AL, GO, | | | | | | | | |
| 4.00%, due 08/01/2013 | | | 145,000 | | | | 148,990 | |
| 4.00%, due 08/01/2014 | | | 205,000 | | | | 216,833 | |
| Sumter Co., AL, School Rev., Warrants, | | | | | | | | |
| 4.50%, due 02/01/2031, | | | | | | | | |
| Prerefunded 02/01/2016 @ 100 | | | 500,000 | | | | 568,095 | |
| Tuscaloosa, AL, Public Building Auth., Student Housing Rev., | | | | | | | | |
| 4.00%, due 07/01/2013 | | | 350,000 | | | | 358,624 | |
| University of Alabama, AL, General Fee Rev., | | | | | | | | |
| 4.10%, due 12/01/2013 | | | 240,000 | | | | 245,506 | |
| University of Alabama, AL, Rev., | | | | | | | | |
| 4.00%, due 10/01/2014 | | | 500,000 | | | | 535,135 | |
| University of Alabama, AL, Series A, Rev., | | | | | | | | |
| 3.00%, due 07/01/2016 | | | 340,000 | | | | 370,675 | |
| 5.00%, due 07/01/2017 | | | 245,000 | | | | 292,003 | |
THE ALABAMA TAX FREE BOND FUND SCHEDULE OF INVESTMENTS (Continued) |
ALABAMA FIXED RATE REVENUE AND GENERAL OBLIGATION (GO) BONDS — 93.3% (Continued) | | | | | | |
| Vestavia Hills, AL, GO, Warrants, | | | | | | |
| 4.00%, due 02/01/2018 | | $ | 515,000 | | | $ | 588,470 | |
| Vestavia Hills, AL, Series A, GO, Warrants, | | | | | | | | |
| 3.00%, due 02/01/2018 | | | 240,000 | | | | 264,890 | |
| Wetumpka, AL, Waterworks & Sewer, Rev., | | | | | | | | |
| 4.00%, due 03/01/2018 | | | 320,000 | | | | 360,400 | |
| | | | | | | | | |
Total Alabama Fixed Rate Revenue and General Obligation (GO) Bonds (Cost $23,992,233) | | | | | | $ | 25,097,744 | |
MONEY MARKET FUNDS — 4.8% | | | | | | |
Alpine Municipal Money Market Fund - Class I, 0.09% (a) (Cost $1,284,000) | | | 1,284,000 | | | $ | 1,284,000 | |
| | | | | | | | | |
Total Investments at Value — 98.1% (Cost $25,276,233) | | | | | | $ | 26,381,744 | |
| | | | | | | | | |
| Other Assets in Excess of Liabilities — 1.9% | | | | | | | 516,581 | |
| | | | | | | | | |
| Net Assets — 100.0% | | | | | | $ | 26,898,325 | |
| ETM - Escrowed to Maturity. |
| |
| (a) | Variable rate security. The rate shown is the 7-day effective yield as of September 30, 2012. |
| | |
| See accompanying notes to financial statements. |
THE GOVERNMENT STREET FUNDS STATEMENTS OF ASSETS AND LIABILITIES September 30, 2012 (Unaudited) |
| | Government Street Equity Fund | | | Government Street Mid-Cap Fund | | | | |
| ASSETS | | | | | | | | | |
| Investments in securities: | | | | | | | | | |
| At acquisition cost | | $ | 49,376,367 | | | $ | 28,611,251 | | | $ | 25,276,233 | |
| At value (Note 2) | | $ | 75,612,552 | | | $ | 40,523,013 | | | $ | 26,381,744 | |
| Cash | | | 1,600 | | | | — | | | | 932,333 | |
| Dividends and interest receivable | | | 110,052 | | | | 32,044 | | | | 222,587 | |
| Receivable for capital shares sold | | | 589,589 | | | | 12,495 | | | | 825,808 | |
| Other assets | | | 14,773 | | | | 10,910 | | | | 8,776 | |
| TOTAL ASSETS | | | 76,328,566 | | | | 40,578,462 | | | | 28,371,248 | |
| | | | | | | | | | | | | |
| LIABILITIES | | | | | | | | | | | | |
| Distributions payable | | | 19,102 | | | | — | | | | 5,421 | |
| Payable for investment securities purchased | | | 244,549 | | | | 834,950 | | | | 1,428,042 | |
| Payable for capital shares redeemed | | | 144,504 | | | | 4,099 | | | | 20,408 | |
| Accrued investment advisory fees (Note 4) | | | 37,014 | | | | 24,538 | | | | 12,072 | |
| Payable to administrator (Note 4) | | | 8,375 | | | | 5,200 | | | | 4,070 | |
| Other accrued expenses | | | 5,546 | | | | 2,367 | | | | 2,910 | |
| TOTAL LIABILITIES | | | 459,090 | | | | 871,154 | | | | 1,472,923 | |
| | | | | | | | | | | | | |
| NET ASSETS | | $ | 75,869,476 | | | $ | 39,707,308 | | | $ | 26,898,325 | |
| | | | | | | | | | | | | |
| Net assets consist of: | | | | | | | | | | | | |
| Paid-in capital | | $ | 48,778,741 | | | $ | 27,545,954 | | | $ | 25,844,750 | |
Accumulated (Distributions in excess of) net investment income | | | 779 | | | | 127,989 | | | | (14 | ) |
Accumulated net realized gains (losses) from security transactions | | | 853,771 | | | | 121,603 | | | | (51,922 | ) |
| Net unrealized appreciation on investments | | | 26,236,185 | | | | 11,911,762 | | | | 1,105,511 | |
| | | | | | | | | | | | | |
| Net assets | | $ | 75,869,476 | | | $ | 39,707,308 | | | $ | 26,898,325 | |
| | | | | | | | | | | | | |
Shares of beneficial interest outstanding (unlimited number of shares authorized, $0.01 par value) | | | 1,504,592 | | | | 2,461,211 | | | | 2,513,082 | |
| | | | | | | | | | | | | |
Net asset value, offering price and redemption price per share (Note 2) | | $ | 50.43 | | | $ | 16.13 | | | $ | 10.70 | |
| See accompanying notes to financial statements. |
THE GOVERNMENT STREET FUNDS STATEMENTS OF OPERATIONS Six Months Ended September 30, 2012 (Unaudited) |
| | Government Street Equity Fund | | | Government Street Mid-Cap Fund | | | | |
| INVESTMENT INCOME | | | | | | | | | |
| Dividends | | $ | 759,008 | | | $ | 313,268 | | | $ | 388 | |
| Foreign withholding taxes on dividends | | | (6,280 | ) | | | (723 | ) | | | — | |
| Interest | | | 66 | | | | 41 | | | | 307,691 | |
| TOTAL INVESTMENT INCOME | | | 752,794 | | | | 312,586 | | | | 308,079 | |
| | | | | | | | | | | | | |
| EXPENSES | | | | | | | | | | | | |
| Investment advisory fees (Note 4) | | | 215,222 | | | | 144,814 | | | | 42,927 | |
| Administration fees (Note 4) | | | 45,334 | | | | 27,324 | | | | 21,000 | |
| Professional fees | | | 9,559 | | | | 8,194 | | | | 7,321 | |
| Registration and filing fees | | | 5,380 | | | | 4,889 | | | | 3,639 | |
| Trustees’ fees and expenses | | | 4,102 | | | | 4,102 | | | | 4,102 | |
| Custodian and bank service fees | | | 6,001 | | | | 3,219 | | | | 2,355 | |
| Compliance fees and expenses (Note 4) | | | 4,041 | | | | 3,596 | | | | 3,416 | |
| Printing of shareholder reports | | | 3,720 | | | | 1,944 | | | | 1,477 | |
| Pricing costs | | | 816 | | | | 1,329 | | | | 4,936 | |
| Insurance expense | | | 2,682 | | | | 1,673 | | | | 1,105 | |
| Postage and supplies | | | 1,775 | | | | 1,299 | | | | 1,006 | |
| Other expenses | | | 9,892 | | | | 5,580 | | | | 1,140 | |
| TOTAL EXPENSES | | | 308,524 | | | | 207,963 | | | | 94,424 | |
| Fees voluntarily waived by the Adviser (Note 4) | | | — | | | | — | | | | (14,703 | ) |
| NET EXPENSES | | | 308,524 | | | | 207,963 | | | | 79,721 | |
| | | | | | | | | | | | | |
| NET INVESTMENT INCOME | | | 444,270 | | | | 104,623 | | | | 228,358 | |
| | | | | | | | | | | | | |
REALIZED AND UNREALIZED GAINS (LOSSES) ON INVESTMENTS | | | | | | | | | | | | |
| Net realized gains from security transactions | | | 853,876 | | | | 121,762 | | | | — | |
Net realized gains from in-kind redemptions (Note 2) | | | 512,886 | | | | 387,173 | | | | — | |
Net change in unrealized appreciation (depreciation) on investments | | | (802,595 | ) | | | (836,534 | ) | | | 143,930 | |
| | | | | | | | | | | | | |
NET REALIZED AND UNREALIZED GAINS (LOSSES) ON INVESTMENTS | | | 564,167 | | | | (327,599 | ) | | | 143,930 | |
| | | | | | | | | | | | | |
NET INCREASE (DECREASE) IN NET ASSETS FROM OPERATIONS | | $ | 1,008,437 | | | $ | (222,976 | ) | | $ | 372,288 | |
| See accompanying notes to financial statements. |
THE GOVERNMENT STREET FUNDS STATEMENTS OF CHANGES IN NET ASSETS |
| | | Government Street Equity Fund | | | Government Street Mid-Cap Fund | |
| | Six Months Ended September 30, 2012 (Unaudited) | | | | | | Six Months Ended September 30, 2012 (Unaudited) | | | | |
| FROM OPERATIONS | | | | | | | | | | | | |
| Net investment income | | $ | 444,270 | | | $ | 650,404 | | | $ | 104,623 | | | $ | 108,529 | |
| Net realized gains from security transactions | | | 853,876 | | | | 758,941 | | | | 121,762 | | | | 544,917 | |
Net realized gains from in-kind redemptions (Note 2) | | | 512,886 | | | | 3,635,297 | | | | 387,173 | | | | 2,000,710 | |
Net change in unrealized appreciation (depreciation) on investments | | | (802,595 | ) | | | (627,943 | ) | | | (836,534 | ) | | | (1,949,003 | ) |
Net increase (decrease) in net assets from operations | | | 1,008,437 | | | | 4,416,699 | | | | (222,976 | ) | | | 705,153 | |
| | | | | | | | | | | | | | | | | |
| DISTRIBUTIONS TO SHAREHOLDERS | | | | | | | | | | | | | | | | |
| From net investment income | | | (438,639 | ) | | | (661,640 | ) | | | — | | | | (85,163 | ) |
From realized capital gains on security transactions | | | (481,360 | ) | | | (309,515 | ) | | | (99,879 | ) | | | (6,083 | ) |
Decrease in net assets from distributions to shareholders | | | (919,999 | ) | | | (971,155 | ) | | | (99,879 | ) | | | (91,246 | ) |
| | | | | | | | | | | | | | | | | |
| FROM CAPITAL SHARE TRANSACTIONS | | | | | | | | | | | | | | | | |
| Proceeds from shares sold | | | 5,150,599 | | | | 8,563,528 | | | | 1,451,959 | | | | 3,210,252 | |
Net asset value of shares issued in reinvestment of distributions to shareholders | | | 848,098 | | | | 911,251 | | | | 84,716 | | | | 77,453 | |
| Payments for shares redeemed | | | (2,486,091 | ) | | | (7,024,462 | ) | | | (1,349,404 | ) | | | (4,042,108 | ) |
Net increase (decrease) in net assets from capital share transactions | | | 3,512,606 | | | | 2,450,317 | | | | 187,271 | | | | (754,403 | ) |
| | | | | | | | | | | | | | | | | |
TOTAL INCREASE (DECREASE) IN NET ASSETS | | | 3,601,044 | | | | 5,895,861 | | | | (135,584 | ) | | | (140,496 | ) |
| | | | | | | | | | | | | | | | | |
| NET ASSETS | | | | | | | | | | | | | | | | |
| Beginning of period | | | 72,268,432 | | | | 66,372,571 | | | | 39,842,892 | | | | 39,983,388 | |
| End of period | | $ | 75,869,476 | | | $ | 72,268,432 | | | $ | 39,707,308 | | | $ | 39,842,892 | |
| | | | | | | | | | | | | | | | | |
UNDISTRIBUTED (DISTRIBUTIONS IN EXCESS OF) NET INVESTMENT INCOME | | $ | 779 | | | $ | (4,852 | ) | | $ | 127,989 | | | $ | 23,366 | |
| | | | | | | | | | | | | | | | | |
| CAPITAL SHARE ACTIVITY | | | | | | | | | | | | | | | | |
| Shares sold | | | 104,387 | | | | 186,294 | | | | 91,334 | | | | 212,716 | |
| Shares reinvested | | | 17,200 | | | | 19,849 | | | | 5,473 | | | | 5,301 | |
| Shares redeemed | | | (50,332 | ) | | | (155,436 | ) | | | (86,553 | ) | | | (283,058 | ) |
| Net increase (decrease) in shares outstanding | | | 71,255 | | | | 50,707 | | | | 10,254 | | | | (65,041 | ) |
| Shares outstanding, beginning of period | | | 1,433,337 | | | | 1,382,630 | | | | 2,450,957 | | | | 2,515,998 | |
| Shares outstanding, end of period | | | 1,504,592 | | | | 1,433,337 | | | | 2,461,211 | | | | 2,450,957 | |
| See accompanying notes to financial statements. |
THE GOVERNMENT STREET FUNDS STATEMENTS OF CHANGES IN NET ASSETS |
| | | Alabama Tax Free Bond Fund | |
| | Six Months Ended September 30, 2012 (Unaudited) | | | | |
| FROM OPERATIONS | | | | | | |
| Net investment income | | $ | 228,358 | | | $ | 555,780 | |
| Net realized gains from security transactions | | | — | | | | 1,407 | |
| Net change in unrealized appreciation (depreciation) on investments | | | 143,930 | | | | 481,275 | |
| Net increase in net assets from operations | | | 372,288 | | | | 1,038,462 | |
| | | | | | | | | |
| DISTRIBUTIONS TO SHAREHOLDERS | | | | | | | | |
| From net investment income | | | (230,000 | ) | | | (554,802 | ) |
| | | | | | | | | |
| FROM CAPITAL SHARE TRANSACTIONS | | | | | | | | |
| Proceeds from shares sold | | | 3,131,369 | | | | 1,221,790 | |
Net asset value of shares issued in reinvestment of distributions to shareholders | | | 184,482 | | | | 457,259 | |
| Payments for shares redeemed | | | (1,278,396 | ) | | | (4,470,616 | ) |
| Net increase (decrease) in net assets from capital share transactions | | | 2,037,455 | | | | (2,791,567 | ) |
| | | | | | | | | |
| TOTAL INCREASE (DECREASE) IN NET ASSETS | | | 2,179,743 | | | | (2,307,907 | ) |
| | | | | | | | | |
| NET ASSETS | | | | | | | | |
| Beginning of period | | | 24,718,582 | | | | 27,026,489 | |
| End of period | | $ | 26,898,325 | | | $ | 24,718,582 | |
| | | | | | | | | |
UNDISTRIBUTED (DISTRIBUTIONS IN EXCESS OF) NET INVESTMENT INCOME | | $ | (14 | ) | | $ | 1,628 | |
| | | | | | | | | |
| CAPITAL SHARE ACTIVITY | | | | | | | | |
| Shares sold | | | 292,832 | | | | 114,925 | |
| Shares reinvested | | | 17,260 | | | | 43,022 | |
| Shares redeemed | | | (119,634 | ) | | | (420,758 | ) |
| Net increase (decrease) in shares outstanding | | | 190,458 | | | | (262,811 | ) |
| Shares outstanding, beginning of period | | | 2,322,624 | | | | 2,585,435 | |
| Shares outstanding, end of period | | | 2,513,082 | | | | 2,322,624 | |
| See accompanying notes to financial statements. |
THE GOVERNMENT STREET EQUITY FUND FINANCIAL HIGHLIGHTS |
Selected Per Share Data and Ratios for a Share Outstanding Throughout Each Period |
| | | Six Months Ended September 30, 2012 (Unaudited) | | | |
| | | 2012 | | | | 2011 | | | | 2010 | | | | 2009 | | | | 2008 | |
Net asset value at beginning of period | | $ | 50.42 | | | $ | 48.00 | | | $ | 40.89 | | | $ | 26.72 | | | $ | 44.76 | | | $ | 48.37 | |
| | | | | | | | | | | | | | | | | | | | | | | | | |
Income (loss) from investment operations: | | | | | | | | | | | | | | | | | | | | | | | | |
| Net investment income | | | 0.30 | | | | 0.47 | | | | 0.39 | | | | 0.40 | | | | 0.55 | | | | 0.57 | |
Net realized and unrealized gains (losses) on investments | | | 0.34 | | | | 2.66 | | | | 7.19 | | | | 14.17 | | | | (18.07 | ) | | | (2.12 | ) |
| Total from investment operations | | | 0.64 | | | | 3.13 | | | | 7.58 | | | | 14.57 | | | | (17.52 | ) | | | (1.55 | ) |
| | | | | | | | | | | | | | | | | | | | | | | | | |
| Less distributions: | | | | | | | | | | | | | | | | | | | | | | | | |
Dividends from net investment income | | | (0.30 | ) | | | (0.48 | ) | | | (0.39 | ) | | | (0.40 | ) | | | (0.52 | ) | | | (0.57 | ) |
Distributions from net realized gains | | | (0.33 | ) | | | (0.23 | ) | | | (0.08 | ) | | | — | | | | — | | | | (1.31 | ) |
| Return of capital | | | — | | | | — | | | | — | | | | — | | | | — | | | | (0.18 | ) |
| Total distributions | | | (0.63 | ) | | | (0.71 | ) | | | (0.47 | ) | | | (0.40 | ) | | | (0.52 | ) | | | (2.06 | ) |
| | | | | | | | | | | | | | | | | | | | | | | | | |
| Net asset value at end of period | | $ | 50.43 | | | $ | 50.42 | | | $ | 48.00 | | | $ | 40.89 | | | $ | 26.72 | | | $ | 44.76 | |
| | | | | | | | | | | | | | | | | | | | | | | | | |
Total return (a) | | | 1.30% | (b) | | | 6.67% | | | | 18.69% | | | | 54.71% | | | | (39.43% | ) | | | (3.51% | ) |
| | | | | | | | | | | | | | | | | | | | | | | | | |
| Net assets at end of period (000’s) | | $ | 75,869 | | | $ | 72,268 | | | $ | 66,373 | | | $ | 57,766 | | | $ | 37,656 | | | $ | 67,267 | |
| | | | | | | | | | | | | | | | | | | | | | | | | |
Ratio of total expenses to average net assets | | | 0.86% | (c) | | | 0.87% | | | | 0.88% | | | | 0.90% | | | | 0.91% | | | | 0.84% | |
| | | | | | | | | | | | | | | | | | | | | | | | | |
Ratio of net investment income to average net assets | | | 1.22% | (c) | | | 1.01% | | | | 0.92% | | | | 1.14% | | | | 1.47% | | | | 1.12% | |
| | | | | | | | | | | | | | | | | | | | | | | | | |
| Portfolio turnover rate | | | 20% | (b) | | | 36% | | | | 26% | | | | 30% | | | | 35% | | | | 12% | |
| (a) | Total return is a measure of the change in value of an investment in the Fund over the period covered, which assumes any dividends or capital gains distributions are reinvested in shares of the Fund. Returns do not reflect the deduction of taxes a shareholder would pay on Fund distributions or the redemption of Fund shares. |
| | |
| (b) | Not annualized. |
| | |
| (c) | Annualized. |
| | |
| See accompanying notes to financial statements. |
THE GOVERNMENT STREET MID-CAP FUND FINANCIAL HIGHLIGHTS |
Selected Per Share Data and Ratios for a Share Outstanding Throughout Each Period |
| | | Six Months Ended September 30, 2012 (Unaudited) | | | |
| | | 2012 | | | | 2011 | | | | 2010 | | | | 2009 | | | | 2008 | |
Net asset value at beginning of period | | $ | 16.26 | | | $ | 15.89 | | | $ | 12.87 | | | $ | 8.46 | | | $ | 12.28 | | | $ | 13.13 | |
| | | | | | | | | | | | | | | | | | | | | | | | | |
Income (loss) from investment operations: | | | | | | | | | | | | | | | | | | | | | | | | |
| Net investment income | | | 0.04 | | | | 0.04 | | | | 0.03 | | | | 0.05 | | | | 0.05 | | | | 0.03 | |
Net realized and unrealized gains (losses) on investments | | | (0.13 | ) | | | 0.37 | | | | 3.03 | | | | 4.41 | | | | (3.82 | ) | | | (0.53 | ) |
| Total from investment operations | | | (0.09 | ) | | | 0.41 | | | | 3.06 | | | | 4.46 | | | | (3.77 | ) | | | (0.50 | ) |
| | | | | | | | | | | | | | | | | | | | | | | | | |
| Less distributions: | | | | | | | | | | | | | | | | | | | | | | | | |
Dividends from net investment income | | | — | | | | (0.04 | ) | | | (0.03 | ) | | | (0.05 | ) | | | (0.05 | ) | | | (0.05 | ) |
In excess of net investment income | | | — | | | | — | | | | (0.01 | ) | | | — | | | | (0.00 | )(a) | | | — | |
Distributions from net realized gains | | | (0.04 | ) | | | (0.00 | )(a) | | | — | | | | — | | | | (0.00 | )(a) | | | (0.30 | ) |
| Total distributions | | | (0.04 | ) | | | (0.04 | ) | | | (0.04 | ) | | | (0.05 | ) | | | (0.05 | ) | | | (0.35 | ) |
| | | | | | | | | | | | | | | | | | | | | | | | | |
| Net asset value at end of period | | $ | 16.13 | | | $ | 16.26 | | | $ | 15.89 | | | $ | 12.87 | | | $ | 8.46 | | | $ | 12.28 | |
| | | | | | | | | | | | | | | | | | | | | | | | | |
Total return (b) | | | (0.54% | )(c) | | | 2.59% | | | | 23.80% | | | | 52.73% | | | | (30.65% | ) | | | (3.99% | ) |
| | | | | | | | | | | | | | | | | | | | | | | | | |
| Net assets at end of period (000’s) | | $ | 39,707 | | | $ | 39,843 | | | $ | 39,983 | | | $ | 32,198 | | | $ | 21,522 | | | $ | 31,424 | |
| | | | | | | | | | | | | | | | | | | | | | | | | |
Ratio of total expenses to average net assets | | | 1.08% | (d) | | | 1.09% | | | | 1.13% | | | | 1.18% | | | | 1.23% | | | | 1.12% | |
| | | | | | | | | | | | | | | | | | | | | | | | | |
Ratio of net expenses to average net assets | | | 1.08% | (d) | | | 1.09% | | | | 1.13% | | | | 1.13% | (e) | | | 1.10% | (e) | | | 1.10% | (e) |
| | | | | | | | | | | | | | | | | | | | | | | | | |
Ratio of net investment income to average net assets | | | 0.54% | (d) | | | 0.29% | | | | 0.21% | | | | 0.47% | (e) | | | 0.47% | (e) | | | 0.25% | (e) |
| | | | | | | | | | | | | | | | | | | | | | | | | |
| Portfolio turnover rate | | | 6% | (c) | | | 18% | | | | 20% | | | | 10% | | | | 14% | | | | 11% | |
| (a) | Amount rounds to less than $0.01 per share. |
| | |
| (b) | Total return is a measure of the change in value of an investment in the Fund over the period covered, which assumes any dividends or capital gains distributions are reinvested in shares of the Fund. Returns do not reflect the deduction of taxes a shareholder would pay on Fund distributions or the redemption of Fund shares. |
| | |
| (c) | Not annualized. |
| | |
| (d) | Annualized. |
| | |
| (e) | Ratios were determined after voluntary advisory fee waivers by the Adviser. |
| | |
| See accompanying notes to financial statements. |
THE ALABAMA TAX FREE BOND FUND FINANCIAL HIGHLIGHTS |
Selected Per Share Data and Ratios for a Share Outstanding Throughout Each Period |
| | | Six Months Ended September 30, 2012 (Unaudited) | | | |
| | | 2012 | | | | 2011 | | | | 2010 | | | | 2009 | | | | 2008 | |
Net asset value at beginning of period | | $ | 10.64 | | | $ | 10.45 | | | $ | 10.53 | | | $ | 10.54 | | | $ | 10.50 | | | $ | 10.39 | |
| | | | | | | | | | | | | | | | | | | | | | | | | |
Income (loss) from investment operations: | | | | | | | | | | | | | | | | | | | | | | | | |
| Net investment income | | | 0.10 | | | | 0.23 | | | | 0.26 | | | | 0.28 | | | | 0.35 | | | | 0.36 | |
Net realized and unrealized gains (losses) on investments | | | 0.06 | | | | 0.19 | | | | (0.07 | ) | | | (0.00 | )(a) | | | 0.04 | | | | 0.12 | |
| Total from investment operations | | | 0.16 | | | | 0.42 | | | | 0.19 | | | | 0.28 | | | | 0.39 | | | | 0.48 | |
| | | | | | | | | | | | | | | | | | | | | | | | | |
| Less distributions: | | | | | | | | | | | | | | | | | | | | | | | | |
Dividends from net investment income | | | (0.10 | ) | | | (0.23 | ) | | | (0.27 | ) | | | (0.28 | ) | | | (0.35 | ) | | | (0.36 | ) |
Distributions from net realized gains | | | — | | | | — | | | | (0.00 | )(a) | | | (0.01 | ) | | | (0.00 | )(a) | | | (0.01 | ) |
| Total distributions | | | (0.10 | ) | | | (0.23 | ) | | | (0.27 | ) | | | (0.29 | ) | | | (0.35 | ) | | | (0.37 | ) |
| | | | | | | | | | | | | | | | | | | | | | | | | |
| Net asset value at end of period | | $ | 10.70 | | | $ | 10.64 | | | $ | 10.45 | | | $ | 10.53 | | | $ | 10.54 | | | $ | 10.50 | |
| | | | | | | | | | | | | | | | | | | | | | | | | |
Total return (b) | | | 1.51% | (c) | | | 4.04% | | | | 1.78% | | | | 2.88% | | | | 3.80% | | | | 4.66% | |
| | | | | | | | | | | | | | | | | | | | | | | | | |
| Net assets at end of period (000’s) | | $ | 26,898 | | | $ | 24,719 | | | $ | 27,026 | | | $ | 29,716 | | | $ | 28,358 | | | $ | 25,426 | |
| | | | | | | | | | | | | | | | | | | | | | | | | |
Ratio of total expenses to average net assets | | | 0.77% | (d) | | | 0.80% | | | | 0.77% | | | | 0.75% | | | | 0.79% | | | | 0.78% | |
| | | | | | | | | | | | | | | | | | | | | | | | | |
Ratio of net expenses to average net assets (e) | | | 0.65% | (d) | | | 0.65% | | | | 0.65% | | | | 0.65% | | | | 0.65% | | | | 0.65% | |
| | | | | | | | | | | | | | | | | | | | | | | | | |
Ratio of net investment income to average net assets (e) | | | 1.86% | (d) | | | 2.17% | | | | 2.51% | | | | 2.85% | | | | 3.36% | | | | 3.46% | |
| | | | | | | | | | | | | | | | | | | | | | | | | |
| Portfolio turnover rate | | | 6% | (c) | | | 18% | | | | 21% | | | | 32% | | | | 8% | | | | 6% | |
| (a) | Amount rounds to less than $0.01 per share. |
| | |
| (b) | Total return is a measure of the change in value of an investment in the Fund over the period covered, which assumes any dividends or capital gains distributions are reinvested in shares of the Fund. Returns do not reflect the deduction of taxes a shareholder would pay on Fund distributions or the redemption of Fund shares. |
| | |
| (c) | Not annualized. |
| | |
| (d) | Annualized. |
| | |
| (e) | Ratios were determined after voluntary advisory fee waivers by the Adviser (Note 4). |
| | |
| See accompanying notes to financial statements. |
THE GOVERNMENT STREET FUNDS NOTES TO FINANCIAL STATEMENTS September 30, 2012 (Unaudited) |
1. Organization
The Government Street Equity Fund, The Government Street Mid-Cap Fund and The Alabama Tax Free Bond Fund (the “Funds”) are each a no-load series of the Williamsburg Investment Trust (the “Trust”), an open-end management investment company registered under the Investment Company Act of 1940. The Trust was organized as a Massachusetts business trust on July 18, 1988. Other series of the Trust are not included in this report.
The Government Street Equity Fund’s investment objective is to seek capital appreciation.
The Government Street Mid-Cap Fund’s investment objective is to seek capital appreciation.
The Alabama Tax Free Bond Fund’s investment objectives are to provide current income exempt from federal income taxes and from the personal income taxes of Alabama and to preserve capital.
2. Significant Accounting Policies
The following is a summary of the Funds’ significant accounting policies. The policies are in conformity with accounting principles generally accepted in the United States of America (“GAAP”).
Securities valuation — The Funds’ portfolio securities are valued as of the close of business of the regular session of the New York Stock Exchange (normally 4:00 p.m., Eastern time). Securities traded on a national stock exchange are valued based upon the closing price on the principal exchange where the security is traded. Securities which are quoted by NASDAQ are valued at the NASDAQ Official Closing Price. Securities which are traded over-the-counter are valued at the last sales price, if available, otherwise, at the last quoted bid price. It is expected that fixed income securities will ordinarily be traded in the over-the-counter market, and common stocks will ordinarily be traded on a national securities exchange, but may also be traded in the over-the-counter market. Call options written by the Funds are valued at the then current market quotation, using the ask price as of the close of each day on the principal exchanges on which they are traded.
When market quotations are not readily available, securities may be valued on the basis of prices provided by an independent pricing service. The prices provided by the pricing service are determined with consideration given to institutional bid and last sale prices and take into account securities prices, yields, maturities, call features, ratings, institutional trading in similar groups of securities and developments related to specific securities. If a pricing service cannot provide a valuation, securities will be valued in good faith at fair value using procedures established by and under the general supervision
THE GOVERNMENT STREET FUNDS NOTES TO FINANCIAL STATEMENTS (Continued) |
of the Board of Trustees and will be classified as Level 2 or 3 (see below) within the fair value hierarchy, depending on the inputs used. Such methods of fair valuation may include, but are not limited to: multiple of earnings, multiple of book value, discount from market of a similar freely traded security, purchase price of the security, subsequent private transactions in the security or related securities, or a combination of these and other factors. Short-term instruments (those with remaining maturities of 60 days or less) may be valued at amortized cost, which approximates market value.
GAAP establishes a single authoritative definition of fair value, sets out a framework for measuring fair value and requires additional disclosures about fair value measurements.
Various inputs are used in determining the value of each of the Fund’s investments. These inputs are summarized in the three broad levels listed below:
| • | Level 1 – quoted prices in active markets for identical securities |
| • | Level 2 – other significant observable inputs |
| • | Level 3 – significant unobservable inputs |
For example, fixed income securities, including municipal bonds, are classified as Level 2 since the values for such securities are based on prices provided by an independent pricing service that utilizes various “other significant observable inputs” including bid and ask quotations, prices of similar securities and interest rates, among other factors. Commercial paper held by the Funds is classified as Level 2 since it is valued at amortized cost, which approximates the current fair value of the security, and is not obtained from a quoted price in an active market.
The inputs or methodology used for valuing securities are not necessarily an indication of the risks associated with investing in those securities. The inputs used to measure fair value may fall into different levels of the fair value hierarchy. In such cases, for disclosure purposes, the level in the fair value hierarchy within which the fair value measurement falls in its entirety is determined based on the lowest level input that is significant to the fair value measurement.
The following is a summary of the inputs used to value each Fund’s investments as of September 30, 2012 by security type:
The Government Street Equity Fund: | | | | | | | | | | | | |
| Common Stocks | | $ | 63,789,647 | | | $ | — | | | $ | — | | | $ | 63,789,647 | |
| Exchange-Traded Funds | | | 7,949,439 | | | | — | | | | — | | | | 7,949,439 | |
| Exchange-Traded Notes | | | 2,100,800 | | | | — | | | | — | | | | 2,100,800 | |
| Warrants | | | 10,760 | | | | — | | | | — | | | | 10,760 | |
| Commercial Paper | | | — | | | | 1,761,000 | | | | — | | | | 1,761,000 | |
| Money Market Funds | | | 906 | | | | — | | | | — | | | | 906 | |
| Total | | $ | 73,851,552 | | | $ | 1,761,000 | | | $ | — | | | $ | 75,612,552 | |
THE GOVERNMENT STREET FUNDS NOTES TO FINANCIAL STATEMENTS (Continued) |
The Government Street Mid-Cap Fund: | | | | | | | | | | | | |
| Common Stocks | | $ | 33,045,857 | | | $ | — | | | $ | — | | | $ | 33,045,857 | |
| Exchange-Traded Funds | | | 4,150,720 | | | | — | | | | — | | | | 4,150,720 | |
| Exchange-Traded Notes | | | 1,090,800 | | | | — | | | | — | | | | 1,090,800 | |
| Commercial Paper | | | — | | | | 2,235,000 | | | | — | | | | 2,235,000 | |
| Money Market Funds | | | 636 | | | | — | | | | — | | | | 636 | |
| Total | | $ | 38,288,013 | | | $ | 2,235,000 | | | $ | — | | | $ | 40,523,013 | |
The Alabama Tax Free Bond Fund: | | | | | | | | | | | | |
| Municipal Bonds | | $ | — | | | $ | 25,097,744 | | | $ | — | | | $ | 25,097,744 | |
| Money Market Funds | | | 1,284,000 | | | | — | | | | — | | | | 1,284,000 | |
| Total | | $ | 1,284,000 | | | $ | 25,097,744 | | | $ | — | | | $ | 26,381,744 | |
Refer to The Government Street Equity Fund’s and The Government Street Mid-Cap Fund’s Schedules of Investments for a listing of the common stocks valued using Level 1 inputs by sector type. As of September 30, 2012, the Funds did not have any transfers in and out of any Level. There were no Level 3 securities or derivative instruments held in the Funds as of September 30, 2012. It is the Funds’ policy to recognize transfers into and out of any Level at the end of the reporting period.
Share valuation — The net asset value per share of each Fund is calculated daily by dividing the total value of each Fund’s assets, less liabilities, by the number of shares outstanding. The offering price and redemption price per share of each Fund is equal to the net asset value per share.
Investment income — Interest income is accrued as earned. Dividend income is recorded on the ex-dividend date. Discounts and premiums on fixed-income securities purchased are amortized using the interest method.
Repurchase agreements — The Funds may enter into repurchase agreements. A repurchase agreement, which is collateralized by U.S. Government obligations, is valued at cost which, together with accrued interest, approximates market value. At the time a Fund enters into a repurchase agreement, the seller agrees that the value of the underlying securities, including accrued interest, will at all times be equal to or exceed the face amount of the repurchase agreement. In addition, the Funds actively monitor and seek additional collateral, as needed. If the seller defaults, the fair value of the collateral may decline and realization of the collateral by the Funds may be delayed or limited. The Funds did not enter into any repurchase agreements during the six months ended September 30, 2012.
THE GOVERNMENT STREET FUNDS NOTES TO FINANCIAL STATEMENTS (Continued) |
Distributions to shareholders — Dividends arising from net investment income are declared and paid quarterly to shareholders of The Government Street Equity Fund; declared and paid annually to shareholders of The Government Street Mid-Cap Fund; and declared daily and paid monthly to shareholders of The Alabama Tax Free Bond Fund. Net realized short-term capital gains, if any, may be distributed throughout the year and net realized long-term capital gains, if any, are distributed at least once each year. The amount of distributions from net investment income and net realized gains are determined in accordance with federal income tax regulations, which may differ from GAAP. These “book/tax” differences are either temporary or permanent in nature.
The tax character of distributions paid during the periods ended September 30, 2012 and March 31, 2012 is as follows:
| | | | | | | | | | | | | |
| The Government Street Equity Fund | 9/30/12 | | $ | 499,095 | | | $ | — | | | $ | 420,904 | | | $ | 919,999 | |
| | 3/31/12 | | $ | 971,155 | | | $ | — | | | $ | — | | | $ | 971,155 | |
| The Government Street Mid-Cap Fund | 9/30/12 | | $ | — | | | $ | — | | | $ | 99,879 | | | $ | 99,879 | |
| | 3/31/12 | | $ | 85,163 | | | $ | — | | | $ | 6,083 | | | $ | 91,246 | |
| The Alabama Tax Free Bond Fund | 9/30/12 | | $ | 1,252 | | | $ | 228,748 | | | $ | — | | | $ | 230,000 | |
| | 3/31/12 | | $ | — | | | $ | 554,802 | | | $ | — | | | $ | 554,802 | |
Security transactions — Security transactions are accounted for on trade date for financial reporting purposes. Gains and losses on securities sold are determined on a specific identification basis.
Common expenses — Common expenses of the Trust are allocated among the series of the Trust based on relative net assets of each series or the nature of the services performed and the relative applicability to each series.
Estimates — The preparation of financial statements in conformity with GAAP requires management to make estimates and assumptions that affect the reported amounts of assets and liabilities and the disclosure of contingent assets and liabilities as of the date of the financial statements and the reported amounts of income and expenses during the reporting period. Actual results could differ from those estimates.
Federal income tax — It is each Fund’s policy to comply with the special provisions of Subchapter M of the Internal Revenue Code applicable to regulated investment companies. As provided therein, in any fiscal year in which a Fund so qualifies, and distributes at least 90% of its taxable net income, the Fund (but not the shareholders) will be relieved of federal income tax on the income distributed. Accordingly, no provision for income taxes has been made.
THE GOVERNMENT STREET FUNDS NOTES TO FINANCIAL STATEMENTS (Continued) |
In order to avoid imposition of the excise tax applicable to regulated investment companies, it is also each Fund’s intention to declare as dividends in each calendar year at least 98% of its net investment income (earned during the calendar year) and 98.2% of its net realized capital gains (earned during the twelve months ended October 31) plus undistributed amounts from prior years.
The following information is computed on a tax basis for each item as of September 30, 2012:
| | The Government Street Equity Fund | | | The Government Street Mid-Cap Fund | | | The Alabama Tax Free Bond Fund | |
| Cost of portfolio investments | | $ | 49,376,367 | | | $ | 28,611,251 | | | $ | 25,288,034 | |
| Gross unrealized appreciation | | $ | 27,143,807 | | | $ | 12,993,803 | | | $ | 1,111,564 | |
| Gross unrealized depreciation | | | (907,622 | ) | | | (1,082,041 | ) | | | (17,854 | ) |
| Net unrealized appreciation | | | 26,236,185 | | | | 11,911,762 | | | | 1,093,710 | |
| Accumulated ordinary income | | | 19,881 | | | | 127,830 | | | | 5,406 | |
| Capital loss carryforwards | | | — | | | | — | | | | (31,177 | ) |
| Other gains (losses) | | | 853,771 | | | | 121,762 | | | | (8,943 | ) |
| Other temporary differences | | | (19,102 | ) | | | — | | | | (5,421 | ) |
| Total distributable earnings | | $ | 27,090,735 | | | $ | 12,161,354 | | | $ | 1,053,575 | |
The difference between the federal income tax cost of portfolio investments and the financial statement cost for The Alabama Tax Free Bond Fund is due to certain timing differences in the recognition of capital gains or losses under income tax regulations and GAAP. These “book/tax” differences are temporary in nature and are primarily due to the tax deferral of losses on wash sales.
As of March 31, 2012, The Alabama Tax Free Bond Fund had a short-term capital loss carryforward for federal income tax purposes of $23,075 and a long-term capital loss carryforward for federal income tax purposes of $8,102, both which may be carried forward indefinitely. These capital loss carryforwards are available to offset realized capital gains in the current and future years, thereby reducing future taxable gains distributions.
During the six months ended September 30, 2012, The Government Street Equity Fund and The Government Street Mid-Cap Fund realized $512,886 and $387,173, respectively, of net capital gains resulting from in-kind redemptions (redemptions in which shareholders who redeemed Fund shares received securities held by the Fund rather than cash). The Funds recognize a gain on in-kind redemptions to the extent that the value of the distributed securities on the date of redemption exceeds the cost of those securities. Such gains are not taxable to the Funds and are not required to be distributed to shareholders. The Funds have reclassified these amounts against paid-in capital. These reclassifications are reflected on the Statements of Assets and
THE GOVERNMENT STREET FUNDS NOTES TO FINANCIAL STATEMENTS (Continued) |
Liabilities. Such reclassifications, the result of permanent differences between the financial statement and income tax reporting requirements, had no effect on each Fund’s net assets or net asset value per share.
The Funds recognize the tax benefits or expenses of uncertain tax positions only when the position is “more likely than not” to be sustained assuming examination by tax authorities. Management has reviewed the tax positions taken on federal income tax returns for all open tax years (tax years ended March 31, 2009 through March 31, 2012) of each Fund and has concluded that no provision for unrecognized tax benefits or expenses is required in these financial statements.
3. Investment Transactions
During the six months ended September 30, 2012, cost of purchases and proceeds from sales and maturities of investment securities, other than short-term investments and U.S. government securities, totaled $15,853,123 and $14,102,258, respectively, for The Government Street Equity Fund; $2,264,571 and $3,199,761, respectively, for The Government Street Mid-Cap Fund; and $2,510,598 and $1,336,000, respectively, for The Alabama Tax Free Bond Fund.
4. Transactions with Affiliates
INVESTMENT ADVISORY AGREEMENT
The Funds’ investments are managed by Leavell Investment Management, Inc. (the “Adviser”) under the terms of an Investment Advisory Agreement. The Government Street Equity Fund pays the Adviser a fee, which is computed and accrued daily and paid monthly, at an annual rate of .60% of its average daily net assets up to $100 million and .50% of such assets in excess of $100 million. The Government Street Mid-Cap Fund pays the Adviser a fee, which is computed and accrued daily and paid monthly, at an annual rate of .75% of its average daily net assets. The Alabama Tax Free Bond Fund pays the Adviser a fee, which is computed and accrued daily and paid monthly, at an annual rate of .35% of its average daily net assets up to $100 million and .25% of such assets in excess of $100 million.
During the six months ended September 30, 2012, the Adviser voluntarily undertook to limit the total operating expenses of The Alabama Tax Free Bond Fund to .65% of the Fund’s average daily net assets. Accordingly, the Adviser waived $14,703 of its investment advisory fees from The Alabama Tax Free Bond Fund during the six months ended September 30, 2012.
Certain officers of the Trust are also officers of the Adviser.
THE GOVERNMENT STREET FUNDS NOTES TO FINANCIAL STATEMENTS (Continued) |
MUTUAL FUND SERVICES AGREEMENT
Under the terms of a Mutual Fund Services Agreement between the Trust and Ultimus Fund Solutions, LLC (“Ultimus”), Ultimus provides administrative, pricing, accounting, dividend disbursing, shareholder servicing and transfer agent services for the Funds. For these services, Ultimus receives a monthly fee from each Fund at an annual rate of .15% of the Fund’s average daily net assets up to $25 million, .125% of the next $25 million of such assets, and .10% of such assets in excess of $50 million. The minimum monthly fee payable to Ultimus is $4,000 with respect to each of The Government Street Equity Fund and The Government Street Mid-Cap Fund and $3,500 with respect to The Alabama Tax Free Bond Fund. In addition, each Fund pays out-of-pocket expenses including, but not limited to, postage, supplies and costs of pricing portfolio securities.
Certain officers of the Trust are also officers of Ultimus, or of Ultimus Fund Distributors, LLC (the “Distributor”), the principal underwriter of each Fund’s shares and an affiliate of Ultimus. The Distributor is compensated by the Adviser (not the Funds) for acting as principal underwriter.
COMPLIANCE CONSULTING AGREEMENT
Under the terms of a Compliance Consulting Agreement between the Trust and Ultimus, Ultimus provides an individual to serve as the Trust’s Chief Compliance Officer and to administer the Funds’ compliance policies and procedures. For these services, the Funds pay Ultimus an annual base fee of $18,600 plus an asset-based fee equal to 0.01% per annum on the Funds’ aggregate net assets in excess of $100 million. In addition, the Funds reimburse Ultimus for reasonable out-of-pocket expenses, if any, incurred in connection with these services.
5. Contingencies and Commitments
The Funds indemnify the Trust’s officers and Trustees for certain liabilities that might arise from their performance of their duties to the Funds. Additionally, in the normal course of business the Funds enter into contracts that contain a variety of representations and warranties and which provide general indemnifications. The Funds’ maximum exposure under these arrangements is unknown, as this would involve future claims that may be made against the Funds that have not yet occurred. However, based on experience, the Funds expect the risk of loss to be remote.
6. Concentration of Credit Risk
The Alabama Tax Free Bond Fund invests primarily in debt instruments of municipal issuers in the state of Alabama. The issuers’ abilities to meet their obligations may be affected by economic developments in the state or its region, as well as disruptions in the credit markets and the economy, generally.
THE GOVERNMENT STREET FUNDS NOTES TO FINANCIAL STATEMENTS (Continued) |
7. Subsequent Events
The Funds are required to recognize in the financial statements the effects of all subsequent events that provide additional evidence about conditions that existed as of the date of the Statements of Assets and Liabilities. For non-recognized subsequent events that must be disclosed to keep the financial statements from being misleading, the Funds are required to disclose the nature of the event as well as an estimate of its financial effect, or a statement that such an estimate cannot be made. Management has evaluated subsequent events through the issuance of these financial statements and has noted no such events.
THE GOVERNMENT STREET FUNDS ABOUT YOUR FUNDS’ EXPENSES (Unaudited) |
We believe it is important for you to understand the impact of costs on your investment. All mutual funds have operating expenses. As a shareholder of the Funds, you incur ongoing costs, including management fees and other expenses. These ongoing costs, which are deducted from each Fund’s gross income, directly reduce the investment returns of the Funds.
A mutual fund’s ongoing costs are expressed as a percentage of its average net assets. This figure is known as the expense ratio. The following examples are intended to help you understand the ongoing costs (in dollars) of investing in the Funds and to compare these costs with the ongoing costs of investing in other mutual funds. The examples below are based on an investment of $1,000 made at the beginning of the period shown and held for the entire period (April 1, 2012 through September 30, 2012).
The table below illustrates each Fund’s ongoing costs in two ways:
Actual fund return – This section helps you to estimate the actual expenses that you paid over the period. The “Ending Account Value” shown is derived from each Fund’s actual return, and the third column shows the dollar amount of operating expenses that would have been paid by an investor who started with $1,000 in the Funds. You may use the information here, together with the amount you invested, to estimate the expenses that you paid over the period.
To do so, simply divide your account value by $1,000 (for example, an $8,600 account value divided by $1,000 = 8.6), then multiply the result by the number given for the Funds under the heading “Expenses Paid During Period.”
Hypothetical 5% return – This section is intended to help you compare the Funds’ ongoing costs with those of other mutual funds. It assumes that each Fund had an annual return of 5% before expenses during the period shown, but that the expense ratio is unchanged. In this case, because the returns used are not the Funds’ actual returns, the results do not apply to your investment. The example is useful in making comparisons because the Securities and Exchange Commission (the “SEC”) requires all mutual funds to calculate expenses based on a 5% return. You can assess each Fund’s ongoing costs by comparing this hypothetical example with the hypothetical examples that appear in shareholder reports of other funds.
Note that expenses shown in the table are meant to highlight and help you compare ongoing costs only. The Funds do not charge sales loads or redemption fees.
The calculations assume no shares were bought or sold during the period. Your actual costs may have been higher or lower, depending on the amount of your investment and the timing of any purchases or redemptions.
THE GOVERNMENT STREET FUNDS ABOUT YOUR FUNDS’ EXPENSES (Unaudited) (Continued) |
More information about the Funds’ expenses, including historical expense ratios, can be found in this report. For additional information on operating expenses and other shareholder costs, please refer to the Funds’ prospectus.
| | Beginning Account Value April 1, 2012 | Ending Account Value Sept. 30, 2012 | Expenses Paid During Period* |
The Government Street Equity Fund |
| Based on Actual Fund Return | $1,000.00 | $1,013.00 | $4.33 |
| Based on Hypothetical 5% Return (before expenses) | $1,000.00 | $1,020.70 | $4.34 |
The Government Street Mid-Cap Fund |
| Based on Actual Fund Return | $1,000.00 | $994.60 | $5.39 |
| Based on Hypothetical 5% Return (before expenses) | $1,000.00 | $1,019.60 | $5.45 |
The Alabama Tax Free Bond Fund |
| Based on Actual Fund Return | $1,000.00 | $1,015.10 | $3.27 |
| Based on Hypothetical 5% Return (before expenses) | $1,000.00 | $1,021.75 | $3.29 |
| * | Expenses are equal to the Funds’ annualized expense ratios for the period as stated below, multiplied by the average account value over the period, multiplied by 183/366 (to reflect the one-half year period). |
| The Government Street Equity Fund | 0.86% |
| The Government Street Mid-Cap Fund | 1.08% |
| The Alabama Tax Free Bond Fund | 0.65% |
THE GOVERNMENT STREET FUNDS OTHER INFORMATION (Unaudited) |
A description of the policies and procedures that the Funds use to vote proxies relating to portfolio securities is available without charge upon request by calling toll-free 1-866-738-1125, or on the SEC’s website at http://www.sec.gov. Information regarding how the Funds voted proxies relating to portfolio securities during the most recent 12-month period ended June 30 is also available without charge upon request by calling toll-free 1-866-738-1125 or on the SEC’s website at http://www.sec.gov.
The Trust files a complete listing of portfolio holdings for the Funds with the SEC as of the end of the first and third quarters of each fiscal year on Form N-Q. The filings are available upon request, by calling 1-866-738-1125. Furthermore, you may obtain a copy of these filings on the SEC’s website at http://www.sec.gov. The Trust’s Forms N-Q may also be reviewed and copied at the SEC’s Public Reference Room in Washington, DC, and information on the operation of the Public Reference Room may be obtained by calling 1-800-SEC-0330.
This page intentionally left blank.
This page intentionally left blank.
| | | | | | | | |
| | | | | | | | | |
| | | | | | | | | |
| | | | | The Government Street Funds | | | | |
| | | | |
Investment Adviser Leavell Investment Management, Inc. Post Office Box 1307 Mobile, AL 36633
Administrator Ultimus Fund Solutions, LLC P.O. Box 46707 Cincinnati, OH 45246-0707 1-866-738-1125
Legal Counsel Sullivan & Worcester LLP One Post Office Square Boston, MA 02109
Independent Registered Public Accounting Firm Ernst & Young LLP 1900 Scripps Center 312 Walnut Street Cincinnati, OH 45202
Board of Trustees John P. Ackerly, IV John T. Bruce Robert S. Harris J. Finley Lee, Jr. Richard L. Morrill Harris V. Morrissette
Portfolio Managers Thomas W. Leavell, The Government Street Equity Fund The Government Street Mid-Cap Fund Timothy S. Healey, The Government Street Mid-Cap Fund The Alabama Tax Free Bond Fund Richard E. Anthony, Jr., CFA, The Government Street Mid-Cap Fund Michael J. Hofto, CFA, The Government Street Mid-Cap Fund | | | | |
| | | | | | | | | |
| | | | | | | | | |
| | | | | | | | | |
| | | | | | | | |
| | | | | | | | |
| | | | | | | | | |
| | | | | | | | | |
| | | | | THE JAMESTOWN FUNDS
No-Load Funds
The Jamestown Balanced Fund The Jamestown Equity Fund The Jamestown Tax Exempt Virginia Fund
SEMI-ANNUAL REPORT
September 30, 2012 (Unaudited)
Investment Adviser Lowe, Brockenbrough & Company, Inc. Richmond, Virginia | | | | |
| | | | | | | | | |
| | | | | | | | | |
| | | | | | | | |
The Jamestown Balanced Fund
Domestic equity markets have been volatile during the first half of the fiscal year. A selloff in late April and May pulled the S&P 500 Index down 8% from its high for the year. Beginning in early June, equities rebounded strongly, closing the September quarter up 6.4% and up 3.4% for the first half of the fiscal year. The Jamestown Balanced Fund’s return of 1.31% during its first fiscal half trailed the performance of the blended index of 60% S&P 500 Index and 40% Barclays Intermediate U.S. Government/Credit Index largely due to its equity underperformance in the first fiscal quarter ending June 30. The underperformance was attributable to the Fund’s underweight in the Telecommunication Services and Consumer Staples sectors, two relatively defensive sectors that we continue to feel are richly valued. However, despite higher than historical valuations, these are sectors that investors typically flock to when equity markets get unsettled. The fixed income portion of the portfolio performed in line with the Barclay’s Intermediate U.S. Government/Credit Index.
The U.S. continues to post modest positive growth, but Europe remains in recession, and growth has slowed across China and other emerging markets. Currently, we do not believe there is a significant chance of recession in the near future, but growth is likely to remain modest in the U.S., and it would not take much of an exogenous shock to threaten this outlook. While recent economic reports in the U.S. have strengthened modestly, earnings growth is slowing or turning negative, questions remain over how the U.S. will deal with the impending fiscal cliff after the U.S. elections in November, and the Euro debt crisis remains in play. Given the perceived risks to the economic environment around the globe, we continue to have slightly higher than normal cash levels in the Fund. Central banks around the globe continue to do their part in fighting economic weakness. The U.S. Federal Reserve recently initiated another round of quantitative easing, or “QE3,” which entails the monthly purchase of $40 billion of mortgage-backed securities for an undetermined length of time. Meanwhile, the European Central Bank has promised to buy government securities in stressed markets if certain conditions are met. Since that announcement, interest rates in Italy and Spain have declined.
At the end of September, the largest sector overweights in the equity portfolio were in the Energy and Consumer Discretionary sectors. The largest sector underweights were in the Financials, Utilities, Telecommunication Services and Materials sectors. In the fixed income portion of the portfolio, the Fund remains overweight corporate securities and underweight Treasuries, and is still positioned defensively relative to the Barclays Intermediate U.S. Government/Credit Index, with an average duration of 3.7 years compared to 3.9 years for the Index. While it is likely that rates may remain low for some period, we do not believe that investors are being compensated for moving out the yield curve and taking on more interest rate risk. On September 30, 2012 The Jamestown Balanced Fund was allocated 65.7% in equities, and 26.8% in fixed income and 7.5% in cash.
The Jamestown Equity Fund
Domestic equity markets have been volatile during the first half of the fiscal year. A selloff in late April and May pulled the S&P 500 Index down 8% from its high for the year. Beginning in early June, equities rebounded strongly, closing the September quarter up 6.4% and up 3.4% for the
first half of the fiscal year. The Jamestown Equity Fund’s return of 1.3% during its first fiscal half trailed the performance of the S&P 500 Index largely due to its underperformance in the first fiscal quarter ending June 30. This underperformance was attributable to the Fund’s underweight in the Telecommunication Services and Consumer Staples sectors, two relatively defensive sectors that we continue to feel are richly valued. However, despite higher than historical valuations, these are sectors that investors typically flock to when equity markets get unsettled.
The U.S. continues to post modest positive growth, but Europe remains in recession, and growth has slowed across China and other emerging markets. Currently, we do not believe there is a significant chance of recession in the near future, but growth is likely to remain modest in the U.S., and it would not take much of an exogenous shock to threaten this outlook. While recent economic reports in the U.S. have strengthened modestly, earnings growth is slowing or turning negative, questions remain over how the U.S. will deal with the impending fiscal cliff after the U.S. elections in November, and the Euro debt crisis remains in play. Given the perceived risks to the economic environment around the globe, we continue to have slightly higher than normal cash levels in the Fund. Central banks around the globe continue to do their part in fighting economic weakness. The U.S. Federal Reserve recently initiated another round of quantitative easing, or “QE3,” which entails the monthly purchase of $40 billion of mortgage-backed securities for an undetermined length of time. Meanwhile, the European Central Bank has promised to buy government securities in stressed markets if certain conditions are met. Since that announcement, interest rates in Italy and Spain have declined.
At the end of September, the largest sector overweights in the Fund were in the Energy and Consumer Discretionary sectors. The largest sector underweights were in the Financials, Utilities, Telecommunication Services and Materials sectors.
Jamestown Tax Exempt Virginia Fund
For the six-month period ended September 30, 2012, The Jamestown Tax Exempt Virginia Fund earned a total return of 1.88%. By comparison, the Barclays 5-Year Municipal Bond Index was up 2.58% for the six-month period. As of September 30, 2012, the Fund’s SEC 30-day yield was 1.59%, which results in a taxable equivalent yield of 2.45% for investors in the 35% federal tax bracket.
The U.S. economy experienced moderate real growth during the six-month period and inflation remained subdued. The Federal Reserve expanded its extremely accommodative monetary policy and announced a third round of quantitative easing in its endeavor to reduce the unemployment rate by suppressing government bond yields.
Municipal bonds have mostly rallied since the start of the fiscal year in April, following the gains seen in Treasuries through July. Strong investor demand, evidenced by 44 consecutive weeks of positive inflows to muni bond funds, helped create buoyant conditions that easily absorbed the supply of new issues. Longer maturity bonds saw the greatest price gains as the yield curve flattened. At the end of September, yields were near all-time lows. The representative yield-to-maturity of a “AAA” rated general obligation bond with a 5-year maturity dropped to 0.69% at September 30, 2012.
The Fund’s relative performance can be attributed to its intermediate maturity structure and its emphasis on high credit quality. The municipal yield curve experienced a bull flattening during the period, with yields on long maturities declining far more than yields on short and intermediate
maturities, resulting in greater gains in market value. Bond strategies that emphasize intermediate maturities generally saw smaller total returns than those that concentrate on long maturities. The Jamestown Tax-Exempt Virginia Fund’s maintained its maturity structure and effective duration over the course of the six-month period. At September 30, 2012, the Fund’s average stated maturity was 5.7 years, and the average effective duration was 3.8 years.
Quality spreads compressed during the period, as yield-starved investors were more willing to buy lower quality credits despite new headlines on default risk in California municipalities and elsewhere. The Fund remains positioned in predominantly “AA” and “AAA” rated credits from Virginia municipal issuers, so the underperformance of higher quality credits was a factor in the Fund’s relative performance.
Uncertainty over tax reform could be a headwind for the muni market toward the end of the year. Higher marginal income tax rates, slated to commence at the beginning of 2013 would normally boost demand for tax-free bonds because of the increased after-tax value for investors facing higher tax rates. However, reform proposals that diminish the benefits of tax exemption could be detrimental to muni bonds. The President’s proposal would limit the value of tax preferences to an effective rate of 28% — essentially a backdoor surtax on formerly tax-free income for those in higher tax brackets. A revival of the Bowles-Simpson deficit commission plan could eliminate tax-exemption on newly issued securities, with outstanding issues presumably grandfathered. An unintended outcome is that state and local governments could face higher financing costs in the future, and thus there could be a period of increased issuance between the election and year-end.
Data presented reflects past performance, which is no guarantee of future results. Investment results and principal value will fluctuate so that shares, when redeemed, may be worth more or less than their original cost. Due to market volatility, current performance may be higher or lower than the performance shown.
This report is submitted for the general information of the shareholders of the Funds. The report is not authorized for distribution to prospective investors in the Funds unless it is accompanied by a current prospectus.
This report reflects our views, opinions and portfolio holdings as of September 30, 2012, the end of the reporting period. These views are subject to change at any time based upon market or other conditions. For more current information throughout the year please visit www.jamestownfunds.com. The Funds are distributed by Ultimus Fund Distributors, LLC.
THE JAMESTOWN BALANCED FUND PERFORMANCE INFORMATION (Unaudited) |
Comparison of the Change in Value of a $10,000 Investment in
The Jamestown Balanced Fund, the Standard & Poor’s 500® Index and the
60% S&P 500 Index / 40% Barclays Intermediate U.S. Government/Credit Index
| | Average Annual Total Returns(a) (for periods ended September 30, 2012) | |
| | 1 Year | 5 Years | 10 Years | |
| The Jamestown Balanced Fund | 18.66% | 1.82% | 5.70% | |
Standard & Poor’s 500® Index | 30.20% | 1.05% | 8.01% | |
60% S&P 500 Index / 40% Barclays Intermediate U.S. Government/Credit Index | 19.50% | 3.35% | 7.02% | |
| (a) | Total return is a measure of the change in value of an investment in the Fund over the periods covered, which assumes any dividends or capital gains distributions are reinvested in shares of the Fund. Returns shown do not reflect the deduction of taxes a shareholder would pay on Fund distributions or the redemption of Fund shares. |
THE JAMESTOWN EQUITY FUND PERFORMANCE INFORMATION (Unaudited) |
Comparison of the Change in Value of a $10,000 Investment in
The Jamestown Equity Fund and the Standard & Poor’s 500® Index
| | Average Annual Total Returns(a) (for periods ended September 30, 2012) | |
| | 1 Year | 5 Years | 10 Years | |
| The Jamestown Equity Fund | 26.58% | -0.15% | 6.27% | |
Standard & Poor’s 500® Index | 30.20% | 1.05% | 8.01% | |
| (a) | Total return is a measure of the change in value of an investment in the Fund over the periods covered, which assumes any dividends or capital gains distributions are reinvested in shares of the Fund. Returns shown do not reflect the deduction of taxes a shareholder would pay on Fund distributions or the redemption of Fund shares. |
THE JAMESTOWN TAX EXEMPT VIRGINIA FUND PERFORMANCE INFORMATION (Unaudited) |
Comparison of the Change in Value of a $10,000 Investment in
The Jamestown Tax Exempt Virginia Fund, the Barclays 5-Year Municipal Bond Index*
and the Barclays Municipal Bond Index
| | Average Annual Total Returns(a) (for periods ended September 30, 2012) | |
| | 1 Year | 5 Years | 10 Years | |
| The Jamestown Tax Exempt Virginia Fund | 3.32% | 4.27% | 3.32% | |
| Barclays 5-Year Municipal Bond Index | 4.68% | 5.72% | 4.37% | |
| Barclays Municipal Bond Index | 8.32% | 6.06% | 5.03% | |
| * | The Barclays 5-Year Municipal Bond Index is an unmanaged index generally representative of 5-year tax-exempt bonds. Because the Fund is typically classified as an intermediate-term fund (with an average duration of between 2 and 10 years), this index is believed to be the most appropriate broad-based securities market index against which to compare the Fund’s performance. |
| | |
| (a) | Total return is a measure of the change in value of an investment in the Fund over the periods covered, which assumes any dividends or capital gains distributions are reinvested in shares of the Fund. Returns shown do not reflect the deduction of taxes a shareholder would pay on Fund distributions or the redemption of Fund shares. |
THE JAMESTOWN BALANCED FUND PORTFOLIO INFORMATION September 30, 2012 (Unaudited) |
Asset Allocation (% of Net Assets) | | Ten Largest Equity Holdings | |
| | Apple, Inc. | 4.2% |
| | Google, Inc. - Class A | 2.0% |
| | Dover Corporation | 1.8% |
| | AmerisourceBergen Corporation | 1.6% |
| | General Electric Company | 1.6% |
| | PepsiCo, Inc. | 1.5% |
| | Chevron Corporation | 1.5% |
| | Cisco Systems, Inc. | 1.5% |
| | CVS Caremark Corporation | 1.5% |
| | Aetna, Inc. | 1.5% |
| | | |
Equity Sector Concentration vs. the S&P 500® Index (65.7% of Net Assets) |
Fixed-Income Portfolio (26.8% of Net Assets) | | | % of Fixed Income Portfolio |
| Average Stated Maturity (Years) | 4.26 | | AAA | 49.8% |
| Average Duration (Years) | 3.71 | | AA | 6.0% |
| Average Coupon | 4.59% | | A | 35.3% |
| Average Yield to Maturity | 1.20% | | BBB | 8.9% |
| | | | | |
| % of Fixed Income Portfolio | | | |
| U.S. Treasury Obligations | 23.2% | | | |
| U.S. Government Agency Obligations | 11.6% | | | |
| Corporate Bonds | 50.2% | | | |
| Mortgage-Backed Securities | 12.8% | | | |
| Municipal Bonds | 2.2% | | | |
THE JAMESTOWN EQUITY FUND PORTFOLIO INFORMATION September 30, 2012 (Unaudited) |
Asset Allocation (% of Net Assets) | | Ten Largest Equity Holdings | |
| | Apple, Inc. | |
| | Google, Inc. - Class A | |
| | | |
| | General Electric Company | 2.4% |
| | AmerisourceBergen Corporation | 2.4% |
| | PepsiCo, Inc. | |
| | | 2.1% |
| | | |
| | Chevron Corporation | |
| | Aetna, Inc. | 2.1% |
| | | |
Sector Concentration vs. the S&P 500® Index |
THE JAMESTOWN TAX EXEMPT VIRGINIA FUND PORTFOLIO INFORMATION September 30, 2012 (Unaudited) |
Characteristics (Weighted Average) | | Maturity Breakdown (% of Portfolio) |
30-day SEC Yield | 1.59% | | |
| 2.45%* | |
| Average Maturity (years) | | |
| | |
| | |
| Number of Issues | | |
| | | |
* Assumes a maximum 35.0% federal tax rate. | |
Credit Quality (%of Portfolio) | | Sector Diversification (%of Portfolio) |
| | |
THE JAMESTOWN BALANCED FUND SCHEDULE OF INVESTMENTS September 30, 2012 (Unaudited) |
| | | | | | |
| Consumer Discretionary — 8.9% | | | | | | |
| Comcast Corporation - Class A | | | 5,700 | | | $ | 203,889 | |
Discovery Communications, Inc. - Class A (a) | | | 2,300 | | | | 137,149 | |
Dollar Tree, Inc. (a) | | | 5,700 | | | | 275,168 | |
| Macy's, Inc. | | | 6,200 | | | | 233,244 | |
| McDonald's Corporation | | | 2,000 | | | | 183,500 | |
| TJX Companies, Inc. (The) | | | 5,500 | | | | 246,345 | |
| Viacom, Inc. - Class B | | | 3,900 | | | | 209,001 | |
| Yum! Brands, Inc. | | | 2,900 | | | | 192,386 | |
| | | | | | | | 1,680,682 | |
| Consumer Staples — 6.7% | | | | | | | | |
| CVS Caremark Corporation | | | 5,700 | | | | 275,994 | |
| Kimberly-Clark Corporation | | | 1,400 | | | | 120,092 | |
| Kroger Company (The) | | | 11,500 | | | | 270,710 | |
| PepsiCo, Inc. | | | 4,000 | | | | 283,080 | |
| Sysco Corporation | | | 4,400 | | | | 137,588 | |
| Wal-Mart Stores, Inc. | | | 2,400 | | | | 177,120 | |
| | | | | | | | 1,264,584 | |
| Energy — 9.9% | | | | | | | | |
| Apache Corporation | | | 2,600 | | | | 224,822 | |
| Baker Hughes, Inc. | | | 4,900 | | | | 221,627 | |
| Chevron Corporation | | | 2,400 | | | | 279,744 | |
| Hess Corporation | | | 4,600 | | | | 247,112 | |
| Marathon Oil Corporation | | | 8,500 | | | | 251,345 | |
| Marathon Petroleum Corporation | | | 2,500 | | | | 136,475 | |
Noble Corporation (a) | | | 7,000 | | | | 250,460 | |
| Royal Dutch Shell PLC - Class A - ADR | | | 3,500 | | | | 242,935 | |
| | | | | | | | 1,854,520 | |
| Financials — 8.3% | | | | | | | | |
| American Express Company | | | 4,600 | | | | 261,556 | |
| Ameriprise Financial, Inc. | | | 4,600 | | | | 260,774 | |
| BB&T Corporation | | | 7,900 | | | | 261,964 | |
| JPMorgan Chase & Company | | | 6,700 | | | | 271,216 | |
| MetLife, Inc. | | | 7,200 | | | | 248,112 | |
| PNC Financial Services Group, Inc. | | | 4,000 | | | | 252,400 | |
| | | | | | | | 1,556,022 | |
| Health Care — 8.7% | | | | | | | | |
| Abbott Laboratories | | | 3,950 | | | | 270,812 | |
| Aetna, Inc. | | | 6,950 | | | | 275,220 | |
| AmerisourceBergen Corporation | | | 7,900 | | | | 305,809 | |
| McKesson Corporation | | | 2,900 | | | | 249,487 | |
| Thermo Fisher Scientific, Inc. | | | 4,500 | | | | 264,735 | |
| UnitedHealth Group, Inc. | | | 4,900 | | | | 271,509 | |
| | | | | | | | 1,637,572 | |
THE JAMESTOWN BALANCED FUND SCHEDULE OF INVESTMENTS (Continued) |
COMMON STOCKS — 65.7% (Continued) | | | | | | |
| Industrials — 8.0% | | | | | | |
| Dover Corporation | | | 5,600 | | | $ | 333,144 | |
| Eaton Corporation | | | 5,300 | | | | 250,478 | |
| General Dynamics Corporation | | | 2,000 | | | | 132,240 | |
| General Electric Company | | | 13,000 | | | | 295,230 | |
| Norfolk Southern Corporation | | | 3,700 | | | | 235,431 | |
| Ryder System, Inc. | | | 6,400 | | | | 249,984 | |
| | | | | | | | 1,496,507 | |
| Information Technology — 15.2% | | | | | | | | |
| Apple, Inc. | | | 1,175 | | | | 784,030 | |
| Cisco Systems, Inc. | | | 14,500 | | | | 276,805 | |
EMC Corporation (a) | | | 9,500 | | | | 259,065 | |
Google, Inc. - Class A (a) | | | 500 | | | | 377,250 | |
| Intel Corporation | | | 9,500 | | | | 215,460 | |
| International Business Machines Corporation | | | 900 | | | | 186,705 | |
| Microsoft Corporation | | | 8,700 | | | | 259,086 | |
| Oracle Corporation | | | 7,000 | | | | 220,430 | |
| QUALCOMM, Inc. | | | 4,400 | | | | 274,956 | |
| | | | | | | | 2,853,787 | |
| | | | | | | | | |
Total Common Stocks (Cost $8,444,046) | | | | | | $ | 12,343,674 | |
U.S. TREASURY OBLIGATIONS — 6.2% | | | | | | |
| U.S. Treasury Notes — 6.2% | | | | | | |
| 4.25%, 11/15/2014 | | $ | 350,000 | | | $ | 379,477 | |
| 4.25%, 11/15/2017 | | | 400,000 | | | | 472,281 | |
| 2.625%, 08/15/2020 | | | 175,000 | | | | 193,471 | |
| 2.125%, 08/15/2021 | | | 120,000 | | | | 126,937 | |
Total U.S. Treasury Obligations (Cost $1,055,728) | | | | | | $ | 1,172,166 | |
U.S. GOVERNMENT AGENCY OBLIGATIONS — 3.1% | | | | | | |
| Federal Home Loan Mortgage Corporation — 3.1% | | | | | | |
| 5.25%, due 04/18/2016 (Cost $496,649) | | $ | 500,000 | | | $ | 583,426 | |
THE JAMESTOWN BALANCED FUND SCHEDULE OF INVESTMENTS (Continued) |
| | | | | | |
| Consumer Discretionary — 1.1% | | | | | | |
| Anheuser-Busch Companies, Inc., | | | | | | |
| 4.50%, due 04/01/2018 | | $ | 100,000 | | | $ | 114,731 | |
| Comcast Corporation, | | | | | | | | |
| 5.70%, due 07/01/2019 | | | 75,000 | | | | 91,804 | |
| | | | | | | | 206,535 | |
| Consumer Staples — 3.0% | | | | | | | | |
| Colgate-Palmolive Company, | | | | | | | | |
| 1.95%, due 02/01/2023 | | | 100,000 | | | | 97,456 | |
| General Mills, Inc., | | | | | | | | |
| 5.70%, due 02/15/2017 | | | 150,000 | | | | 179,039 | |
| PepsiCo, Inc., | | | | | | | | |
| 4.65%, due 02/15/2013 | | | 200,000 | | | | 201,689 | |
| Wal-Mart Stores, Inc., | | | | | | | | |
| 4.25%, due 04/15/2021 | | | 75,000 | | | | 88,197 | |
| | | | | | | | 566,381 | |
| Energy — 0.6% | | | | | | | | |
| Shell International Finance B.V., | | | | | | | | |
| 4.30%, due 09/22/2019 | | | 100,000 | | | | 116,826 | |
| | | | | | | | | |
| Financials — 5.1% | | | | | | | | |
| Aflac, Inc., | | | | | | | | |
| 2.65%, due 02/15/2017 | | | 75,000 | | | | 78,690 | |
| American Express Company, | | | | | | | | |
| 4.875%, due 07/15/2013 | | | 150,000 | | | | 155,095 | |
| BB&T Corporation, | | | | | | | | |
| 2.15%, due 03/22/2017 | | | 60,000 | | | | 62,267 | |
| JPMorgan Chase & Company, | | | | | | | | |
| 3.40%, due 06/24/2015 | | | 110,000 | | | | 116,748 | |
| Morgan Stanley, | | | | | | | | |
| 5.30%, due 03/01/2013 | | | 250,000 | | | | 254,401 | |
| Northern Trust Corporation, | | | | | | | | |
| 4.625%, due 05/01/2014 | | | 150,000 | | | | 159,564 | |
| PNC Funding Corporation, | | | | | | | | |
| 5.125%, due 02/08/2020 | | | 110,000 | | | | 130,346 | |
| | | | | | | | 957,111 | |
| Health Care — 2.3% | | | | | | | | |
| Amgen, Inc., | | | | | | | | |
| 5.85%, due 06/01/2017 | | | 150,000 | | | | 179,101 | |
| GlaxoSmithKline PLC, | | | | | | | | |
| 5.65%, due 05/15/2018 | | | 200,000 | | | | 246,218 | |
| | | | | | | | 425,319 | |
| Information Technology — 0.5% | | | | | | | | |
| Cisco Systems, Inc., | | | | | | | | |
| 4.95%, due 02/15/2019 | | | 71,000 | | | | 84,928 | |
THE JAMESTOWN BALANCED FUND SCHEDULE OF INVESTMENTS (Continued) |
CORPORATE BONDS — 13.5% (Continued) | | | | | | |
| Materials — 0.1% | | | | | | |
| E.I. du Pont de Nemours and Company, | | | | | | |
| 5.875%, due 01/15/2014 | | $ | 26,000 | | | $ | 27,824 | |
| | | | | | | | | |
| Utilities — 0.8% | | | | | | | | |
| Virginia Electric & Power Company, | | | | | | | | |
| 5.00%, due 06/30/2019 | | | 125,000 | | | | 149,259 | |
| | | | | | | | | |
Total Corporate Bonds (Cost $2,343,277) | | | | | | $ | 2,534,183 | |
MORTGAGE-BACKED SECURITIES — 3.4% | | | | | | |
| Federal Home Loan Mortgage Corporation — 1.0% | | | | | | |
| Pool #A43942, 5.50%, due 03/01/2036 | | $ | 64,540 | | | $ | 70,516 | |
| Pool #A97047, 4.50%, due 02/01/2041 | | | 106,971 | | | | 115,739 | |
| | | | | | | | 186,255 | |
| Federal National Mortgage Association — 2.3% | | | | | | | | |
| Pool #618465, 5.00%, due 12/01/2016 | | | 36,583 | | | | 39,811 | |
| Pool #684231, 5.00%, due 01/01/2018 | | | 56,768 | | | | 61,776 | |
| Pool #255455, 5.00%, due 10/01/2024 | | | 79,717 | | | | 88,344 | |
| Pool #255702, 5.00%, due 05/01/2025 | | | 112,375 | | | | 124,254 | |
| Pool #808413, 5.50%, due 01/01/2035 | | | 117,491 | | | | 129,246 | |
| | | | | | | | 443,431 | |
| Government National Mortgage Association — 0.1% | | | | | | | | |
| Pool #781344, 6.50%, due 10/15/2031 | | | 13,482 | | | | 15,396 | |
| | | | | | | | | |
Total Mortgage-Backed Securities (Cost $591,734) | | | | | | $ | 645,082 | |
VIRGINIA REVENUE AND GENERAL OBLIGATION (GO) BONDS — 0.6% | | | | | | |
| Virginia State, Build America Bonds, Taxable, GO, | | | | | | |
| 2.95%, due 06/01/2019 (Cost $99,937) | | $ | 100,000 | | | $ | 108,465 | |
MONEY MARKET FUNDS — 2.2% | | | | | | |
Fidelity Institutional Money Market Portfolio - Select Class, 0.11% (b) (Cost $418,785) | | | 418,785 | | | $ | 418,785 | |
THE JAMESTOWN BALANCED FUND SCHEDULE OF INVESTMENTS (Continued) |
REPURCHASE AGREEMENTS — 5.3% | | | | | | |
U.S. Bank N.A., 0.01%, dated 09/28/2012, due 10/01/2012, repurchase proceeds: $986,977 (Cost $986,976) (c) | | $ | 986,976 | | | $ | 986,976 | |
| | | | | | | | | |
Total Investments at Value — 100.0% (Cost $14,437,132) | | | | | | $ | 18,792,757 | |
| | | | | | | | | |
Liabilities in Excess of Other Assets — (0.0%) (d) | | | | | | | (3,231 | ) |
| | | | | | | | | |
| Net Assets — 100.0% | | | | | | $ | 18,789,526 | |
| ADR - American Depositary Receipt. |
| |
| (a) | Non-income producing security. |
| | |
| (b) | Variable rate security. The rate shown is the 7-day effective yield as of September 30, 2012. |
| | |
| (c) | Repurchase agreement is fully collateralized by $931,773 FGCI #E99430, 4.50%, due 09/01/2018. The aggregate market value of the collateral at September 30, 2012 was $1,006,833. |
| | |
| (d) | Percentage rounds to less than 0.1%. |
| | |
| See accompanying notes to financial statements. |
THE JAMESTOWN EQUITY FUND SCHEDULE OF INVESTMENTS September 30, 2012 (Unaudited) |
| | | | | | |
| Consumer Discretionary — 13.1% | | | | | | |
| Comcast Corporation - Class A | | | 11,700 | | | $ | 418,509 | |
Discovery Communications, Inc. - Class A (a) | | | 4,800 | | | | 286,224 | |
Dollar Tree, Inc. (a) | | | 11,900 | | | | 574,473 | |
| Macy's, Inc. | | | 13,200 | | | | 496,584 | |
| McDonald's Corporation | | | 4,100 | | | | 376,175 | |
| TJX Companies, Inc. (The) | | | 11,500 | | | | 515,085 | |
| Viacom, Inc. - Class B | | | 7,900 | | | | 423,361 | |
| Yum! Brands, Inc. | | | 6,300 | | | | 417,942 | |
| | | | | | | | 3,508,353 | |
| Consumer Staples — 9.6% | | | | | | | | |
| CVS Caremark Corporation | | | 11,400 | | | | 551,988 | |
| Kimberly-Clark Corporation | | | 2,900 | | | | 248,762 | |
| Kroger Company (The) | | | 23,500 | | | | 553,190 | |
| PepsiCo, Inc. | | | 8,600 | | | | 608,622 | |
| Sysco Corporation | | | 8,100 | | | | 253,287 | |
| Wal-Mart Stores, Inc. | | | 4,900 | | | | 361,620 | |
| | | | | | | | 2,577,469 | |
| Energy — 14.2% | | | | | | | | |
| Apache Corporation | | | 5,600 | | | | 484,232 | |
| Baker Hughes, Inc. | | | 10,000 | | | | 452,300 | |
| Chevron Corporation | | | 4,800 | | | | 559,488 | |
| Hess Corporation | | | 9,200 | | | | 494,224 | |
| Marathon Oil Corporation | | | 17,700 | | | | 523,389 | |
| Marathon Petroleum Corporation | | | 5,000 | | | | 272,950 | |
Noble Corporation (a) | | | 14,700 | | | | 525,966 | |
| Royal Dutch Shell PLC - Class A - ADR | | | 7,400 | | | | 513,634 | |
| | | | | | | | 3,826,183 | |
| Financials — 11.8% | | | | | | | | |
| American Express Company | | | 9,000 | | | | 511,740 | |
| Ameriprise Financial, Inc. | | | 9,400 | | | | 532,886 | |
| BB&T Corporation | | | 16,300 | | | | 540,508 | |
| JPMorgan Chase & Company | | | 13,700 | | | | 554,576 | |
| MetLife, Inc. | | | 15,000 | | | | 516,900 | |
| PNC Financial Services Group, Inc. | | | 8,000 | | | | 504,800 | |
| | | | | | | | 3,161,410 | |
| Health Care — 12.3% | | | | | | | | |
| Abbott Laboratories | | | 8,050 | | | | 551,908 | |
| Aetna, Inc. | | | 14,100 | | | | 558,360 | |
| AmerisourceBergen Corporation | | | 16,400 | | | | 634,844 | |
| McKesson Corporation | | | 5,900 | | | | 507,577 | |
| Thermo Fisher Scientific, Inc. | | | 8,800 | | | | 517,704 | |
| UnitedHealth Group, Inc. | | | 9,600 | | | | 531,936 | |
| | | | | | | | 3,302,329 | |
THE JAMESTOWN EQUITY FUND SCHEDULE OF INVESTMENTS (Continued) |
COMMON STOCKS — 94.3% (Continued) | | | | | | |
| Industrials — 11.2% | | | | | | |
| Dover Corporation | | | 11,000 | | | $ | 654,390 | |
| Eaton Corporation | | | 10,800 | | | | 510,408 | |
| General Dynamics Corporation | | | 3,700 | | | | 244,644 | |
| General Electric Company | | | 28,000 | | | | 635,880 | |
| Norfolk Southern Corporation | | | 7,400 | | | | 470,862 | |
| Ryder System, Inc. | | | 13,000 | | | | 507,780 | |
| | | | | | | | 3,023,964 | |
| Information Technology — 22.1% | | | | | | | | |
| Apple, Inc. | | | 2,500 | | | | 1,668,150 | |
| Cisco Systems, Inc. | | | 28,500 | | | | 544,065 | |
EMC Corporation (a) | | | 19,800 | | | | 539,946 | |
Google, Inc. - Class A (a) | | | 1,050 | | | | 792,225 | |
| Intel Corporation | | | 19,600 | | | | 444,528 | |
| International Business Machines Corporation | | | 2,000 | | | | 414,900 | |
| Microsoft Corporation | | | 16,800 | | | | 500,304 | |
| Oracle Corporation | | | 14,800 | | | | 466,052 | |
| QUALCOMM, Inc. | | | 9,000 | | | | 562,410 | |
| | | | | | | | 5,932,580 | |
| | | | | | | | | |
Total Common Stocks (Cost $17,721,871) | | | | | | $ | 25,332,288 | |
MONEY MARKET FUNDS — 0.8% | | | | | | |
Fidelity Institutional Money Market Portfolio - Select Class, 0.11% (b) (Cost $229,238) | | | 229,238 | | | $ | 229,238 | |
REPURCHASE AGREEMENTS — 5.3% | | | | | | |
U.S. Bank N.A., 0.01%, dated 09/28/2012, due 10/01/2012, repurchase proceeds: $1,414,293 (Cost $1,414,292) (c) | | $ | 1,414,292 | | | $ | 1,414,292 | |
| | | | | | | | | |
Total Investments at Value — 100.4% (Cost $19,365,401) | | | | | | $ | 26,975,818 | |
| | | | | | | | | |
| Liabilities in Excess of Other Assets — (0.4%) | | | | | | | (99,113 | ) |
| | | | | | | | | |
| Net Assets — 100.0% | | | | | | $ | 26,876,705 | |
| ADR - American Depositary Receipt. |
| |
| (a) | Non-income producing security. |
| | |
| (b) | Variable rate security. The rate shown is the 7-day effective yield as of September 30, 2012. |
| | |
| (c) | Repurchase agreement is fully collateralized by $1,335,087 FGCI #E99430, 4.50%, due 09/01/2018. The aggregate market value of the collateral at September 30, 2012 was $1,442,637. |
| | |
| See accompanying notes to financial statements. |
THE JAMESTOWN TAX EXEMPT VIRGINIA FUND SCHEDULE OF INVESTMENTS September 30, 2012 (Unaudited) |
VIRGINIA REVENUE AND GENERAL OBLIGATION (GO) BONDS — 93.1% | | | | | | |
| Arlington Co., Virginia, GO, | | | | | | |
| 4.10%, due 11/01/2018 | | $ | 500,000 | | | $ | 534,060 | |
| Capital Region Airport Commission, Virginia, Airport Revenue, | | | | | | | | |
| 4.50%, due 07/01/2016 | | | 520,000 | | | | 589,846 | |
| Chesterfield Co., Virginia, GO, | | | | | | | | |
| 5.00%, due 01/01/2020 | | | 700,000 | | | | 822,192 | |
| Fairfax Co., Virginia, Economic Dev. Authority, Revenue, | | | | | | | | |
| 5.00%, due 06/01/2018 | | | 1,000,000 | | | | 1,042,180 | |
| Fairfax Co., Virginia, Industrial Dev. Authority, Revenue, | | | | | | | | |
| 5.00%, due 05/15/2022 | | | 750,000 | | | | 878,595 | |
| Fauquier Co., Virginia, GO, | | | | | | | | |
| 5.00%, due 07/01/2017, | | | | | | | | |
| prerefunded 07/01/2016 @ 100 | | | 500,000 | | | | 584,685 | |
| Hampton Roads Sanitation District, Virginia, Wastewater, Revenue, | | | | | | | | |
| 5.00%, due 04/01/2022 | | | 400,000 | | | | 472,368 | |
| Hampton, Virginia, GO, | | | | | | | | |
| 5.00%, due 04/01/2020, | | | | | | | | |
| prerefunded 04/01/2015 @ 100 | | | 500,000 | | | | 558,145 | |
| 5.00%, due 04/01/2025 | | | 500,000 | | | | 621,590 | |
| Henrico Co., Virginia, Public Improvement, Series A, GO, | | | | | | | | |
| 5.00%, due 12/01/2015 | | | 250,000 | | | | 286,385 | |
| Henrico Co., Virginia, Water & Sewer, Revenue, | | | | | | | | |
| 5.00%, due 05/01/2020 | | | 350,000 | | | | 429,436 | |
| 5.00%, due 05/01/2022 | | | 430,000 | | | | 526,075 | |
| James City, Virginia, School District, GO, | | | | | | | | |
| 5.00%, due 12/15/2018 | | | 500,000 | | | | 570,300 | |
| James City, Virginia, Service Authority, Water & Sewer, Revenue, | | | | | | | | |
| 5.125%, due 01/15/2017 | | | 1,000,000 | | | | 1,023,870 | |
| Leesburg, Virginia, GO, | | | | | | | | |
| 5.00%, due 09/15/2016 | | | 500,000 | | | | 586,285 | |
| Loudoun Co., Virginia, Industrial Dev. Authority, Public Facility Lease, Revenue, | | | | | | | | |
| 5.00%, due 03/01/2019, | | | | | | | | |
| prerefunded 03/01/2013 @ 100 | | | 215,000 | | | | 219,373 | |
| 5.00%, due 03/01/2019 | | | 785,000 | | | | 801,069 | |
| Lynchburg, Virginia, GO, | | | | | | | | |
| 5.00%, due 06/01/2015 | | | 500,000 | | | | 560,470 | |
| Lynchburg, Virginia, Public Improvement, Series A, GO, | | | | | | | | |
| 5.00%, due 08/01/2019 | | | 625,000 | | | | 783,269 | |
THE JAMESTOWN TAX EXEMPT VIRGINIA FUND SCHEDULE OF INVESTMENTS (Continued) |
VIRGINIA REVENUE AND GENERAL OBLIGATION (GO) BONDS — 93.1% (Continued) | | | | | | |
| Manassas, Virginia, Public Improvement, Series D, GO, | | | | | | |
| 5.00%, due 07/01/2019 | | $ | 250,000 | | | $ | 315,380 | |
| New Kent Co., Virginia, Economic Dev. Authority, Revenue, | | | | | | | | |
| 5.00%, due 02/01/2019 | | | 500,000 | | | | 575,740 | |
| Norfolk, Virginia, GO, | | | | | | | | |
| 4.50%, due 06/01/2015 | | | 500,000 | | | | 534,230 | |
| Portsmouth, Virginia, Series A, GO, | | | | | | | | |
| 5.00%, due 04/01/2016 | | | 250,000 | | | | 278,075 | |
| Portsmouth, Virginia, Series D, GO, | | | | | | | | |
| 4.00%, due 12/01/2017 | | | 215,000 | | | | 249,342 | |
| Prince William Co., Virginia, Lease Participation Certificates, | | | | | | | | |
| 5.00%, due 10/01/2020 | | | 500,000 | | | | 617,250 | |
| Richmond, Virginia, Metropolitan Authority, Revenue, | | | | | | | | |
| 5.25%, due 07/15/2014 | | | 1,000,000 | | | | 1,079,833 | |
| Richmond, Virginia, Public Improvement, Series A, GO, | | | | | | | | |
| 5.00%, due 03/01/2024 | | | 280,000 | | | | 349,465 | |
| Southeastern Public Service Authority, Virginia, Revenue, | | | | | | | | |
| 5.00%, due 07/01/2015, ETM | | | 1,000,000 | | | | 1,095,321 | |
| Spotsylvania Co., Virginia, Economic Dev. Authority, Revenue, | | | | | | | | |
| 5.00%, due 06/01/2021 | | | 300,000 | | | | 374,007 | |
| Spotsylvania Co., Virginia, GO, | | | | | | | | |
| 5.00%, due 01/15/2016 | | | 500,000 | | | | 528,765 | |
| Spotsylvania Co., Virginia, Water & Sewer, Revenue, | | | | | | | | |
| 5.00%, due 06/01/2026 | | | 500,000 | | | | 549,305 | |
| Suffolk, Virginia, Public Improvement, Series A, GO, | | | | | | | | |
| 4.00%, due 08/01/2018 | | | 250,000 | | | | 292,272 | |
| University of Virginia, Revenue, | | | | | | | | |
| 5.00%, due 06/01/2013 | | | 585,000 | | | | 603,972 | |
| Upper Occoquan, Virginia, Sewer Authority, Revenue, | | | | | | | | |
| 5.15%, due 07/01/2020 | | | 250,000 | | | | 303,680 | |
| Virginia Beach, Virginia, Public Improvement, GO, | | | | | | | | |
| 5.00%, due 06/01/2021, | | | | | | | | |
| prerefunded 06/01/2019 @ 100 | | | 250,000 | | | | 312,660 | |
| Virginia Biotechnology Research Partnership Authority, Lease Revenue, | | | | | | | | |
| 5.00%, due 09/01/2020 | | | 500,000 | | | | 632,845 | |
| Virginia College Building Authority, Educational Facilities, Revenue, | | | | | | | | |
| 5.00%, due 04/01/2017 | | | 500,000 | | | | 547,300 | |
| 5.00%, due 03/01/2019 | | | 250,000 | | | | 306,618 | |
| Virginia Commonwealth Transportation Board, Federal Highway Reimbursement Anticipation Note, Revenue, | | | | | | | | |
| 5.00%, due 09/28/2015 | | | 500,000 | | | | 566,115 | |
THE JAMESTOWN TAX EXEMPT VIRGINIA FUND SCHEDULE OF INVESTMENTS (Continued) |
VIRGINIA REVENUE AND GENERAL OBLIGATION (GO) BONDS — 93.1% (Continued) | | | | | | |
| Virginia Polytechnic Institute & State University, Revenue, | | | | | | |
| 5.00%, due 06/01/2016 | | $ | 500,000 | | | $ | 541,880 | |
| Virginia Small Business Financing Authority, Healthcare Facilities Revenue, | | | | | | | | |
| 5.00%, due 11/01/2017 | | | 250,000 | | | | 295,810 | |
| Virginia State Commonwealth Transportation Board, Federal Transportation Grant Anticipation Note, Series A, Revenue, | | | | | | | | |
| 5.00%, due 03/15/2023 | | | 500,000 | | | | 619,790 | |
| Virginia State Public Building Authority, Public Facilities, Series D, Revenue, | | | | | | | | |
| 5.00%, due 08/01/2016 | | | 1,000,000 | | | | 1,083,910 | |
| Virginia State Public School Authority, Revenue | | | | | | | | |
| 5.00%, due 08/01/2023 | | | 500,000 | | | | 630,295 | |
| Virginia State Public School Authority, Series A, Revenue, | | | | | | | | |
| 5.00%, due 08/01/2020 | | | 585,000 | | | | 673,575 | |
| Virginia State Public School Authority, Series B-1, Revenue, | | | | | | | | |
| 5.00%, due 08/01/2018 | | | 500,000 | | | | 612,840 | |
| Virginia State Resources Authority, Clean Water, Revenue, | | | | | | | | |
| 5.00%, due 10/01/2021 | | | 500,000 | | | | 629,740 | |
| Virginia State Resources Authority, Infrastructure, Series B, Revenue, | | | | | | | | |
| 5.00%, due 11/01/2024 | | | 800,000 | | | | 982,653 | |
| Virginia State, Series B, GO, | | | | | | | | |
| 5.00%, due 06/01/2017 | | | 250,000 | | | | 300,893 | |
| | | | | | | | | |
Total Virginia Revenue and General Obligation (GO) Bonds (Cost $26,255,385) | | | | | | $ | 28,373,754 | |
WASHINGTON, D.C. REVENUE BONDS — 1.9% | | | | | | |
| Metropolitan Washington Airports Authority, Series C, Revenue, | | | | | | |
| 5.00%, due 10/01/2022 (Cost $507,711) | | $ | 500,000 | | | $ | 580,300 | |
EXCHANGE-TRADED FUNDS — 0.8% | | | | | | |
| SPDR Nuveen Barclays Capital Short Term Municipal Bond ETF (Cost $241,000) | | | 10,000 | | | $ | 245,000 | |
THE JAMESTOWN TAX EXEMPT VIRGINIA FUND SCHEDULE OF INVESTMENTS (Continued) |
MONEY MARKET FUNDS — 2.2% | | | | | | |
Fidelity Tax Exempt Portfolio - Class I, 0.01% (a) (Cost $652,288) | | | 652,288 | | | $ | 652,288 | |
| | | | | | | | | |
Total Investments at Value — 98.0% (Cost $27,656,384) | | | | | | $ | 29,851,342 | |
| | | | | | | | | |
| Other Assets in Excess of Liabilities — 2.0% | | | | | | | 618,977 | |
| | | | | | | | | |
| Net Assets — 100.0% | | | | | | $ | 30,470,319 | |
| ETM - Escrowed to Maturity. |
| |
| (a) | Variable rate security. The rate shown is the 7-day effective yield as of September 30, 2012. |
| | |
| See accompanying notes to financial statements. |
THE JAMESTOWN FUNDS STATEMENTS OF ASSETS AND LIABILITIES September 30, 2012 (Unaudited) |
| | | | | | | | The Jamestown Tax Exempt Virginia Fund | |
| ASSETS | | | | | | | | | |
| Investments in securities: | | | | | | | | | |
| At acquisition cost | | $ | 14,437,132 | | | $ | 19,365,401 | | | $ | 27,656,384 | |
| At value (Note 2) | | $ | 18,792,757 | | | $ | 26,975,818 | | | $ | 29,851,342 | |
| Dividends and interest receivable | | | 59,791 | | | | 14,051 | | | | 356,180 | |
| Receivable for investment securities sold | | | — | | | | — | | | | 278,560 | |
| Receivable for capital shares sold | | | 324 | | | | 2,249 | | | | 23,000 | |
| Other assets | | | 2,969 | | | | 10,752 | | | | 8,046 | |
| TOTAL ASSETS | | | 18,855,841 | | | | 27,002,870 | | | | 30,517,128 | |
| | | | | | | | | | | | | |
| LIABILITIES | | | | | | | | | | | | |
| Distributions payable | | | 2,302 | | | | 1,408 | | | | 8,842 | |
| Payable for investment securities purchased | | | 27,764 | | | | 90,336 | | | | — | |
| Payable for capital shares redeemed | | | 10,619 | | | | 11,972 | | | | 18,937 | |
| Accrued investment advisory fees (Note 4) | | | 10,065 | | | | 14,356 | | | | 7,940 | |
| Payable to administrator (Note 4) | | | 4,515 | | | | 4,515 | | | | 4,115 | |
| Other accrued expenses | | | 11,050 | | | | 3,578 | | | | 6,975 | |
| TOTAL LIABILITIES | | | 66,315 | | | | 126,165 | | | | 46,809 | |
| | | | | | | | | | | | | |
| NET ASSETS | | $ | 18,789,526 | | | $ | 26,876,705 | | | $ | 30,470,319 | |
| | | | | | | | | | | | | |
| Net assets consist of: | | | | | | | | | | | | |
| Paid-in capital | | $ | 13,980,517 | | | $ | 19,289,546 | | | $ | 28,232,803 | |
Accumulated (distributions in excess of) net investment income | | | (8,325 | ) | | | 443 | | | | — | |
Accumulated net realized gains (losses) from security transactions | | | 461,709 | | | | (23,701 | ) | | | 42,558 | |
| Net unrealized appreciation on investments | | | 4,355,625 | | | | 7,610,417 | | | | 2,194,958 | |
| Net assets | | $ | 18,789,526 | | | $ | 26,876,705 | | | $ | 30,470,319 | |
| | | | | | | | | | | | | |
Shares of beneficial interest outstanding (unlimited number of shares authorized, $0.01 par value) | | | 1,365,156 | | | | 1,502,215 | | | | 2,868,073 | |
| | | | | | | | | | | | | |
Net asset value, offering price and redemption price per share (Note 2) | | $ | 13.76 | | | $ | 17.89 | | | $ | 10.62 | |
See accompanying notes to financial statements.
THE JAMESTOWN FUNDS STATEMENTS OF OPERATIONS Six Months Ended September 30, 2012 (Unaudited) |
| | | | | | | | The Jamestown Tax Exempt Virginia Fund | |
| INVESTMENT INCOME | | | | | | | | | |
| Dividends | | $ | 111,777 | | | $ | 230,185 | | | $ | 1,520 | |
| Foreign withholding taxes on dividends | | | (980 | ) | | | (2,025 | ) | | | — | |
| Interest | | | 99,889 | | | | 82 | | | | 497,817 | |
| TOTAL INVESTMENT INCOME | | | 210,686 | | | | 228,242 | | | | 499,337 | |
| | | | | | | | | | | | | |
| EXPENSES | | | | | | | | | | | | |
| Investment advisory fees (Note 4) | | | 59,936 | | | | 85,294 | | | | 60,687 | |
| Administration fees (Note 4) | | | 24,000 | | | | 24,000 | | | | 22,135 | |
| Professional fees | | | 10,576 | | | | 8,826 | | | | 7,321 | |
| Trustees’ fees and expenses | | | 4,102 | | | | 4,102 | | | | 4,102 | |
| Custodian and bank service fees | | | 3,231 | | | | 4,041 | | | | 2,408 | |
| Compliance service fees (Note 4) | | | 3,100 | | | | 3,100 | | | | 3,100 | |
| Registration and filing fees | | | 3,092 | | | | 3,542 | | | | 2,098 | |
| Pricing costs | | | 2,736 | | | | 386 | | | | 4,266 | |
| Printing of shareholder reports | | | 2,064 | | | | 3,787 | | | | 1,203 | |
| Account maintenance fees | | | 750 | | | | 2,608 | | | | 2,852 | |
| Postage and supplies | | | 1,370 | | | | 1,570 | | | | 1,146 | |
| Insurance expense | | | 894 | | | | 1,251 | | | | 1,326 | |
| Other expenses | | | 1,964 | | | | 2,931 | | | | 4,177 | |
| TOTAL EXPENSES | | | 117,815 | | | | 145,438 | | | | 116,821 | |
| Fees voluntarily waived by the Adviser (Note 4) | | | — | | | | — | | | | (12,137 | ) |
Expenses reimbursed through a directed brokerage arrangement (Note 5) | | | (6,000 | ) | | | (6,000 | ) | | | — | |
| NET EXPENSES | | | 111,815 | | | | 139,438 | | | | 104,684 | |
| | | | | | | | | | | | | |
| NET INVESTMENT INCOME | | | 98,871 | | | | 88,804 | | | | 394,653 | |
| | | | | | | | | | | | | |
REALIZED AND UNREALIZED GAINS (LOSSES) ON INVESTMENTS | | | | | | | | | | | | |
| Net realized gains on security transactions | | | 508,170 | | | | 1,059,708 | | | | 42,212 | |
Net change in unrealized appreciation/ depreciation on investments | | | (365,250 | ) | | | (842,725 | ) | | | 146,480 | |
| | | | | | | | | | | | | |
NET REALIZED AND UNREALIZED GAINS ON INVESTMENTS | | | 142,920 | | | | 216,983 | | | | 188,692 | |
| | | | | | | | | | | | | |
NET INCREASE IN NET ASSETS FROM OPERATIONS | | $ | 241,791 | | | $ | 305,787 | | | $ | 583,345 | |
See accompanying notes to financial statements.
THE JAMESTOWN FUNDS STATEMENTS OF CHANGES IN NET ASSETS |
| | | The Jamestown Balanced Fund | | | | |
| | Six Months Ended Sept. 30, 2012 (Unaudited) | | | | | | Six Months Ended Sept. 30, 2012 (Unaudited) | | | | |
| FROM OPERATIONS | | | | | | | | | | | | |
| Net investment income | | $ | 98,871 | | | $ | 206,139 | | | $ | 88,804 | | | $ | 147,499 | |
Net realized gains on security transactions | | | 508,170 | | | | 639,185 | | | | 1,059,708 | | | | 574,141 | |
Net change in unrealized appreciation/ depreciation on investments | | | (365,250 | ) | | | 224,412 | | | | (842,725 | ) | | | 1,208,217 | |
| Net increase in net assets from operations | | | 241,791 | | | | 1,069,736 | | | | 305,787 | | | | 1,929,857 | |
| | | | | | | | | | | | | | | | | |
| DISTRIBUTIONS TO SHAREHOLDERS | | | | | | | | | | | | | | | | |
| From net investment income | | | (105,841 | ) | | | (216,245 | ) | | | (89,377 | ) | | | (172,098 | ) |
From net realized gains from security transactions | | | (261,444 | ) | | | — | | | | — | | | | — | |
Decrease in net assets from distributions to shareholders | | | (367,285 | ) | | | (216,245 | ) | | | (89,377 | ) | | | (172,098 | ) |
| | | | | | | | | | | | | | | | | |
| FROM CAPITAL SHARE TRANSACTIONS | | | | | | | | | | | | | | | | |
| Proceeds from shares sold | | | 4,389 | | | | 56,248 | | | | 518,227 | | | | 1,054,254 | |
Net asset value of shares issued in reinvestment of distributions to shareholders | | | 350,328 | | | | 201,973 | | | | 86,487 | | | | 164,795 | |
| Payments for shares redeemed | | | (487,657 | ) | | | (3,394,853 | ) | | | (1,647,770 | ) | | | (3,632,850 | ) |
Net decrease in net assets from capital share transactions | | | (132,940 | ) | | | (3,136,632 | ) | | | (1,043,056 | ) | | | (2,413,801 | ) |
| | | | | | | | | | | | | | | | | |
| TOTAL DECREASE IN NET ASSETS | | | (258,434 | ) | | | (2,283,141 | ) | | | (826,646 | ) | | | (656,042 | ) |
| | | | | | | | | | | | | | | | | |
| NET ASSETS | | | | | | | | | | | | | | | | |
| Beginning of period | | | 19,047,960 | | | | 21,331,101 | | | | 27,703,351 | | | | 28,359,393 | |
| End of period | | $ | 18,789,526 | | | $ | 19,047,960 | | | $ | 26,876,705 | | | $ | 27,703,351 | |
| | | | | | | | | | | | | | | | | |
ACCUMULATED (DISTRIBUTIONS IN EXCESS OF) NET INVESTMENT INCOME | | $ | (8,325 | ) | | $ | (2,683 | ) | | $ | 443 | | | $ | 1,016 | |
| | | | | | | | | | | | | | | | | |
| CAPITAL SHARE ACTIVITY | | | | | | | | | | | | | | | | |
| Shares sold | | | 327 | | | | 4,146 | | | | 29,967 | | | | 64,426 | |
| Shares reinvested | | | 26,370 | | | | 15,667 | | | | 4,981 | | | | 10,013 | |
| Shares redeemed | | | (36,132 | ) | | | (265,758 | ) | | | (95,203 | ) | | | (227,053 | ) |
| Net decrease in shares outstanding | | | (9,435 | ) | | | (245,945 | ) | | | (60,255 | ) | | | (152,614 | ) |
| Shares outstanding, beginning of period | | | 1,374,591 | | | | 1,620,536 | | | | 1,562,470 | | | | 1,715,084 | |
| Shares outstanding, end of period | | | 1,365,156 | | | | 1,374,591 | | | | 1,502,215 | | | | 1,562,470 | |
See accompanying notes to financial statements.
THE JAMESTOWN FUNDS STATEMENTS OF CHANGES IN NET ASSETS |
| | The Jamestown Tax Exempt Virginia Fund |
| | Six Months Ended Sept. 30, 2012 (Unaudited) | | | | |
| FROM OPERATIONS | | | | | | |
| Net investment income | | $ | 394,653 | | | $ | 828,596 | |
| Net realized gains on security transactions | | | 42,212 | | | | 37,982 | |
| Net change in unrealized appreciation/depreciation on investments | | | 146,480 | | | | 901,005 | |
| Net increase in net assets from operations | | | 583,345 | | | | 1,767,583 | |
| | | | | | | | | |
| DISTRIBUTIONS TO SHAREHOLDERS | | | | | | | | |
| From net investment income | | | (394,254 | ) | | | (828,596 | ) |
| From net realized gains from security transactions | | | (27,371 | ) | | | (11,396 | ) |
| Decrease in net assets from distributions to shareholders | | | (421,625 | ) | | | (839,992 | ) |
| | | | | | | | | |
| FROM CAPITAL SHARE TRANSACTIONS | | | | | | | | |
| Proceeds from shares sold | | | 488,596 | | | | 1,078,274 | |
Net asset value of shares issued in reinvestment of distributions to shareholders | | | 346,797 | | | | 716,177 | |
| Payments for shares redeemed | | | (589,500 | ) | | | (3,027,810 | ) |
| Net increase (decrease) in net assets from capital share transactions | | | 245,893 | | | | (1,233,359 | ) |
| | | | | | | | | |
| TOTAL INCREASE (DECREASE) IN NET ASSETS | | | 407,613 | | | | (305,768 | ) |
| | | | | | | | | |
| NET ASSETS | | | | | | | | |
| Beginning of period | | | 30,062,706 | | | | 30,368,474 | |
| End of period | | $ | 30,470,319 | | | $ | 30,062,706 | |
| | | | | | | | | |
| ACCUMULATED NET INVESTMENT INCOME | | $ | — | | | $ | — | |
| | | | | | | | | |
| CAPITAL SHARE ACTIVITY | | | | | | | | |
| Shares sold | | | 46,107 | | | | 102,093 | |
| Shares reinvested | | | 32,691 | | | | 67,988 | |
| Shares redeemed | | | (55,557 | ) | | | (288,051 | ) |
| Net increase (decrease) in shares outstanding | | | 23,241 | | | | (117,970 | ) |
| Shares outstanding, beginning of period | | | 2,844,832 | | | | 2,962,802 | |
| Shares outstanding, end of period | | | 2,868,073 | | | | 2,844,832 | |
See accompanying notes to financial statements.
THE JAMESTOWN BALANCED FUND FINANCIAL HIGHLIGHTS |
Selected Per Share Data and Ratios for a Share Outstanding Throughout Each Period |
| | | Six Months Ended Sept. 30, 2012 | | | Years Ended March 31, |
| | | (Unaudited) | | | | 2012 | | | | 2011 | | | | 2010 | | | | 2009 | | | | 2008 | |
Net asset value at beginning of period | | $ | 13.86 | | | $ | 13.16 | | | $ | 12.11 | | | $ | 10.09 | | | $ | 12.95 | | | $ | 14.53 | |
| | | | | | | | | | | | | | | | | | | | | | | | | |
Income (loss) from investment operations: | | | | | | | | | | | | | | | | | | | | | | | | |
| Net investment income | | | 0.07 | | | | 0.14 | | | | 0.16 | | | | 0.22 | | | | 0.25 | | | | 0.26 | |
| Net realized and unrealized gains (losses) on investments | | | 0.10 | | | | 0.71 | | | | 1.06 | | | | 2.04 | | | | (2.91 | ) | | | 0.27 | |
| Total from investment operations | | | 0.17 | | | | 0.85 | | | | 1.22 | | | | 2.26 | | | | (2.66 | ) | | | 0.53 | |
| | | | | | | | | | | | | | | | | | | | | | | | | |
| Less distributions: | | | | | | | | | | | | | | | | | | | | | | | | |
Dividends from net investment income | | | (0.08 | ) | | | (0.15 | ) | | | (0.17 | ) | | | (0.24 | ) | | | (0.20 | ) | | | (0.28 | ) |
Distributions from net realized gains | | | (0.19 | ) | | | — | | | | — | | | | — | | | | — | | | | (1.83 | ) |
| Total distributions | | | (0.27 | ) | | | (0.15 | ) | | | (0.17 | ) | | | (0.24 | ) | | | (0.20 | ) | | | (2.11 | ) |
| | | | | | | | | | | | | | | | | | | | | | | | | |
| Net asset value at end of period | | $ | 13.76 | | | $ | 13.86 | | | $ | 13.16 | | | $ | 12.11 | | | $ | 10.09 | | | $ | 12.95 | |
| | | | | | | | | | | | | | | | | | | | | | | | | |
Total return (a) | | | 1.31% | (b) | | | 6.56% | | | | 10.24% | | | | 22.56% | | | | (20.75% | ) | | | 2.97% | |
| | | | | | | | | | | | | | | | | | | | | | | | | |
| Net assets at end of period (000’s) | | $ | 18,790 | | | $ | 19,048 | | | $ | 21,331 | | | $ | 22,183 | | | $ | 21,072 | | | $ | 32,058 | |
| | | | | | | | | | | | | | | | | | | | | | | | | |
Ratio of total expenses to average net assets | | | 1.27% | (c) | | | 1.28% | | | | 1.24% | | | | 1.20% | | | | 1.14% | | | | 1.01% | |
| | | | | | | | | | | | | | | | | | | | | | | | | |
Ratio of net expenses to average net assets (d) | | | 1.21% | (c) | | | 1.21% | | | | 1.18% | | | | 1.11% | | | | 1.05% | | | | 0.95% | |
| | | | | | | | | | | | | | | | | | | | | | | | | |
Ratio of net investment income to average net assets (d) | | | 1.07% | (c) | | | 1.08% | | | | 1.31% | | | | 1.98% | | | | 2.10% | | | | 1.71% | |
| | | | | | | | | | | | | | | | | | | | | | | | | |
| Portfolio turnover rate | | | 15% | (b) | | | 20% | | | | 30% | | | | 40% | | | | 43% | | | | 30% | |
| (a) | Total return is a measure of the change in value of an investment in the Fund over the period covered, which assumes any dividends or capital gains distributions are reinvested in shares of the Fund. Returns do not reflect the deduction of taxes a shareholder would pay on Fund distributions or the redemption of Fund shares. |
| | |
| (b) | Not annualized. |
| | |
| (c) | Annualized. |
| | |
| (d) | Ratios were determined based on net expenses after expense reimbursements through a directed brokerage arrangement (Note 5). |
| | |
| See accompanying notes to financial statements. |
THE JAMESTOWN EQUITY FUND FINANCIAL HIGHLIGHTS |
Selected Per Share Data and Ratios for a Share Outstanding Throughout Each Period |
| | | Six Months Ended | | | Years Ended March 31, |
| | | (Unaudited) | | | | 2012 | | | | 2011 | | | | 2010 | | | | 2009 | | | | 2008 | |
Net asset value at beginning of period | | $ | 17.73 | | | $ | 16.54 | | | $ | 14.67 | | | $ | 11.01 | | | $ | 16.68 | | | $ | 18.12 | |
| | | | | | | | | | | | | | | | | | | | | | | | | |
Income (loss) from investment operations: | | | | | | | | | | | | | | | | | | | | | | | | |
| Net investment income | | | 0.06 | | | | 0.09 | | | | 0.09 | | | | 0.10 | | | | 0.08 | | | | 0.08 | |
| Net realized and unrealized gains (losses) on investments | | | 0.16 | | | | 1.21 | | | | 1.87 | | | | 3.64 | | | | (5.68 | ) | | | 0.20 | |
| Total from investment operations | | | 0.22 | | | | 1.30 | | | | 1.96 | | | | 3.74 | | | | (5.60 | ) | | | 0.28 | |
| | | | | | | | | | | | | | | | | | | | | | | | | |
| Less distributions: | | | | | | | | | | | | | | | | | | | | | | | | |
Dividends from net investment income | | | (0.06 | ) | | | (0.11 | ) | | | (0.09 | ) | | | (0.08 | ) | | | — | | | | (0.08 | ) |
Distributions from net realized gains | | | — | | | | — | | | | — | | | | — | | | | — | | | | (1.50 | ) |
| Return of capital | | | — | | | | — | | | | — | | | | — | | | | (0.07 | ) | | | (0.14 | ) |
| Total distributions | | | (0.06 | ) | | | (0.11 | ) | | | (0.09 | ) | | | (0.08 | ) | | | (0.07 | ) | | | (1.72 | ) |
| | | | | | | | | | | | | | | | | | | | | | | | | |
| Net asset value at end of period | | $ | 17.89 | | | $ | 17.73 | | | $ | 16.54 | | | $ | 14.67 | | | $ | 11.01 | | | $ | 16.68 | |
| | | | | | | | | | | | | | | | | | | | | | | | | |
Total return (a) | | | 1.25% | (b) | | | 7.89% | | | | 13.48% | | | | 33.96% | | | | (33.63% | ) | | | 0.94% | |
| | | | | | | | | | | | | | | | | | | | | | | | | |
| Net assets at end of period (000’s) | | $ | 26,877 | | | $ | 27,703 | | | $ | 28,359 | | | $ | 26,534 | | | $ | 18,790 | | | $ | 32,317 | |
| | | | | | | | | | | | | | | | | | | | | | | | | |
Ratio of total expenses to average net assets | | | 1.11% | (c) | | | 1.11% | | | | 1.13% | | | | 1.16% | | | | 1.15% | | | | 0.99% | |
| | | | | | | | | | | | | | | | | | | | | | | | | |
Ratio of net expenses to average net assets (d) | | | 1.06% | (c) | | | 1.06% | | | | 1.09% | | | | 1.12% | | | | 1.10% | | | | 0.95% | |
| | | | | | | | | | | | | | | | | | | | | | | | | |
Ratio of net investment income to average net assets (d) | | | 0.68% | (c) | | | 0.56% | | | | 0.56% | | | | 0.78% | | | | 0.56% | | | | 0.38% | |
| | | | | | | | | | | | | | | | | | | | | | | | | |
| Portfolio turnover rate | | | 19% | (b) | | | 28% | | | | 49% | | | | 59% | | | | 69% | | | | 46% | |
| (a) | Total return is a measure of the change in value of an investment in the Fund over the period covered, which assumes any dividends or capital gains distributions are reinvested in shares of the Fund. Returns do not reflect the deduction of taxes a shareholder would pay on Fund distributions or the redemption of Fund shares. |
| | |
| (b) | Not annualized. |
| | |
| (c) | Annualized. |
| | |
| (d) | Ratios were determined based on net expenses after expense reimbursements through a directed brokerage arrangement (Note 5). |
| | |
| See accompanying notes to financial statements. |
THE JAMESTOWN TAX EXEMPT VIRGINIA FUND FINANCIAL HIGHLIGHTS |
Selected Per Share Data and Ratios for a Share Outstanding Throughout Each Period |
| | | Six Months Ended Sept. 30, 2012 | | | Years Ended March 31, |
| | | (Unaudited) | | | | 2012 | | | | 2011 | | | | 2010 | | | | 2009 | | | | 2008 | |
Net asset value at beginning of period | | $ | 10.57 | | | $ | 10.25 | | | $ | 10.33 | | | $ | 10.24 | | | $ | 10.10 | | | $ | 10.06 | |
| | | | | | | | | | | | | | | | | | | | | | | | | |
Income (loss) from investment operations: | | | | | | | | | | | | | | | | | | | | | | | | |
| Net investment income | | | 0.14 | | | | 0.29 | | | | 0.29 | | | | 0.30 | | | | 0.34 | | | | 0.36 | |
| Net realized and unrealized gains (losses) on investments | | | 0.06 | | | | 0.32 | | | | (0.06 | ) | | | 0.11 | | | | 0.13 | | | | 0.05 | |
| Total from investment operations | | | 0.20 | | | | 0.61 | | | | 0.23 | | | | 0.41 | | | | 0.47 | | | | 0.41 | |
| | | | | | | | | | | | | | | | | | | | | | | | | |
| Less distributions: | | | | | | | | | | | | | | | | | | | | | | | | |
Dividends from net investment income | | | (0.14 | ) | | | (0.29 | ) | | | (0.29 | ) | | | (0.31 | ) | | | (0.33 | ) | | | (0.36 | ) |
Distributions from net realized gains | | | (0.01 | ) | | | (0.00 | )(a) | | | (0.02 | ) | | | (0.01 | ) | | | (0.00 | )(a) | | | (0.01 | ) |
| Total distributions | | | (0.15 | ) | | | (0.29 | ) | | | (0.31 | ) | | | (0.32 | ) | | | (0.33 | ) | | | (0.37 | ) |
| | | | | | | | | | | | | | | | | | | | | | | | | |
| Net asset value at end of period | | $ | 10.62 | | | $ | 10.57 | | | $ | 10.25 | | | $ | 10.33 | | | $ | 10.24 | | | $ | 10.10 | |
| | | | | | | | | | | | | | | | | | | | | | | | | |
Total return (b) | | | 1.88% | (c) | | | 6.03% | | | | 2.26% | | | | 4.04% | | | | 4.77% | | | | 4.09% | |
| | | | | | | | | | | | | | | | | | | | | | | | | |
| Net assets at end of period (000’s) | | $ | 30,470 | | | $ | 30,063 | | | $ | 30,368 | | | $ | 32,905 | | | $ | 32,730 | | | $ | 29,093 | |
| | | | | | | | | | | | | | | | | | | | | | | | | |
Ratio of total expenses to average net assets | | | 0.77% | (d) | | | 0.77% | | | | 0.76% | | | | 0.75% | | | | 0.77% | | | | 0.77% | |
| | | | | | | | | | | | | | | | | | | | | | | | | |
Ratio of net expenses to average net assets (e) | | | 0.69% | (d) | | | 0.69% | | | | 0.69% | | | | 0.69% | | | | 0.69% | | | | 0.69% | |
| | | | | | | | | | | | | | | | | | | | | | | | | |
Ratio of net investment income to average net assets (e) | | | 2.60% | (d) | | | 2.75% | | | | 2.78% | | | | 2.89% | | | | 3.31% | | | | 3.54% | |
| | | | | | | | | | | | | | | | | | | | | | | | | |
| Portfolio turnover rate | | | 8% | (c) | | | 2% | | | | 8% | | | | 16% | | | | 10% | | | | 13% | |
| (a) | Amount rounds to less than a penny per share. |
| | |
| (b) | Total return is a measure of the change in value of an investment in the Fund over the period covered, which assumes any dividends or capital gains distributions are reinvested in shares of the Fund. Returns do not reflect the deduction of taxes a shareholder would pay on Fund distributions or the redemption of Fund shares. |
| | |
| (c) | Not annualized. |
| | |
| (d) | Annualized. |
| | |
| (e) | Ratios were determined after voluntary advisory fee waivers by the Adviser (Note 4). |
| | |
| See accompanying notes to financial statements. |
THE JAMESTOWN FUNDS NOTES TO FINANCIAL STATEMENTS September 30, 2012 (Unaudited) |
1. Organization
The Jamestown Balanced Fund, The Jamestown Equity Fund and The Jamestown Tax Exempt Virginia Fund (individually, a “Fund,” and, collectively, the “Funds”) are each a no-load series of Williamsburg Investment Trust (the “Trust”), an open-end management investment company registered under the Investment Company Act of 1940. The Trust was organized as a Massachusetts business trust on July 18, 1988. Other series of the Trust are not included in this report.
The Jamestown Balanced Fund’s investment objectives are long-term growth of capital and income.
The Jamestown Equity Fund’s investment objective is long-term growth of capital.
The Jamestown Tax Exempt Virginia Fund’s investment objectives are to provide current income exempt from federal income taxes and from the personal income taxes of Virginia, to preserve capital, to limit credit risk and to take advantage of opportunities to increase and enhance the value of a shareholder’s investment.
2. Significant Accounting Policies
The following is a summary of the Funds’ significant accounting policies. The policies are in conformity with accounting principles generally accepted in the United States of America (“GAAP”).
Securities valuation — The Funds’ portfolio securities are valued as of the close of business of the regular session of the New York Stock Exchange (normally 4:00 p.m., Eastern time). Securities traded on a national stock exchange are generally valued based upon the closing price on the principal exchange where the security is traded. Securities which are quoted by NASDAQ are valued at the NASDAQ Official Closing Price. Securities which are traded over-the-counter are valued at the last sales price, if available, otherwise, at the last quoted bid price. It is expected that fixed income securities will ordinarily be traded in the over-the-counter market, and common stocks will ordinarily be traded on a national securities exchange, but may also be traded in the over-the-counter market. Short-term instruments (those with remaining maturities of 60 days or less) may be valued at amortized cost, which approximates market value.
When market quotations are not readily available, securities may be valued on the basis of prices provided by an independent pricing service. The prices provided by the pricing service are determined with consideration given to institutional bid and last sale prices and take into account securities prices, yields, maturities, call features, ratings, institutional trading in similar groups of securities and developments related to specific securities. If a pricing service cannot provide a valuation, securities will be valued in good faith at fair value using methods consistent with those established by and under the general supervision of the Board of Trustees and will be classified as Level 2 or 3 (see below) within the fair value hierarchy, depending on the inputs used. Such methods of fair valuation may include, but are not limited to: multiple of earnings, multiple of book value, discount from market of a similar freely traded security, purchase price of the security, subsequent private transactions in the security or related securities, or a combination of these and other factors.
THE JAMESTOWN FUNDS NOTES TO FINANCIAL STATEMENTS (Continued) |
GAAP establishes a single authoritative definition of fair value, sets out a framework for measuring fair value and requires additional disclosures about fair value measurements.
Various inputs are used in determining the value of each Fund’s investments. These inputs are summarized in the three broad levels listed below:
| • | Level 1 – quoted prices in active markets for identical securities |
| • | Level 2 – other significant observable inputs |
| • | Level 3 – significant unobservable inputs |
Fixed income securities, including municipal bonds, corporate bonds, obligations of the U.S. Treasury and U.S. Government agencies, and repurchase agreements held by the Funds, are classified as Level 2 since the values for such securities and the underlying collateral of the repurchase agreements are based on prices provided by an independent pricing service that utilizes various “other significant observable inputs” including bid and ask quotations, prices of similar securities and interest rates, among other factors.
The inputs or methodology used for valuing securities are not necessarily an indication of the risks associated with investing in those securities. The inputs used to measure fair value may fall into different levels of the fair value hierarchy. In such cases, for disclosure purposes, the level in the fair value hierarchy within which the fair value measurement falls in its entirety is determined based on the lowest level input that is significant to the fair value measurement.
The following is a summary of the inputs used to value each Fund’s investments as of September 30, 2012 by security type:
The Jamestown Balanced Fund | | | | | | | | | | | | |
| Common Stocks | | $ | 12,343,674 | | | $ | — | | | $ | — | | | $ | 12,343,674 | |
U.S. Treasury & Government Agency Obligations | | | — | | | | 1,755,592 | | | | — | | | | 1,755,592 | |
| Corporate Bonds | | | — | | | | 2,534,183 | | | | — | | | | 2,534,183 | |
| Mortgage-Backed Securities | | | — | | | | 645,082 | | | | — | | | | 645,082 | |
| Municipal Bonds | | | — | | | | 108,465 | | | | — | | | | 108,465 | |
| Money Market Funds | | | 418,785 | | | | — | | | | — | | | | 418,785 | |
| Repurchase Agreements | | | — | | | | 986,976 | | | | — | | | | 986,976 | |
| Total | | $ | 12,762,459 | | | $ | 6,030,298 | | | $ | — | | | $ | 18,792,757 | |
The Jamestown Equity Fund | | | | | | | | | | | | |
| Common Stocks | | $ | 25,332,288 | | | $ | — | | | $ | — | | | $ | 25,332,288 | |
| Money Market Funds | | | 229,238 | | | | — | | | | — | | | | 229,238 | |
| Repurchase Agreements | | | — | | | | 1,414,292 | | | | — | | | | 1,414,292 | |
| Total | | $ | 25,561,526 | | | $ | 1,414,292 | | | $ | — | | | $ | 26,975,818 | |
THE JAMESTOWN FUNDS NOTES TO FINANCIAL STATEMENTS (Continued) |
The Jamestown Tax Exempt Virginia Fund | | | | | | | | | | | | |
| Municipal Bonds | | $ | — | | | $ | 28,954,054 | | | $ | — | | | $ | 28,954,054 | |
| Exchange-Traded Funds | | | 245,000 | | | | — | | | | — | | | | 245,000 | |
| Money Market Funds | | | 652,288 | | | | — | | | | — | | | | 652,288 | |
| Total | | $ | 897,288 | | | $ | 28,954,054 | | | $ | — | | | $ | 29,851,342 | |
Refer to The Jamestown Balanced Fund’s and The Jamestown Equity Fund’s Schedules of Investments for a listing of the common stocks and corporate bonds valued using Level 1 and Level 2 inputs by sector type. As of September 30, 2012, the Funds did not have any transfers in and out of any Level. There were no Level 3 securities or derivative instruments held by the Funds as of September 30, 2012. It is the Funds’ policy to recognize transfers into and out of any Level at the end of the reporting period.
Repurchase agreements — The Funds may enter into repurchase agreements. A repurchase agreement, which is collateralized by U.S. Government obligations, is valued at cost which, together with accrued interest, approximates market value. At the time a Fund enters into a repurchase agreement, the seller agrees that the value of the underlying securities, including accrued interest, will at all times be equal to or exceed the face amount of the repurchase agreement. In addition, the Funds actively monitor and seek additional collateral, as needed. If the seller defaults, the fair value of the collateral may decline and realization of the collateral by the Funds may be delayed or limited.
Share valuation — The net asset value per share of each Fund is calculated daily by dividing the total value of its assets, less liabilities, by the number of shares outstanding. The offering price and redemption price per share of each Fund is equal to the net asset value per share.
Investment income — Interest income is accrued as earned. Dividend income is recorded on the ex-dividend date. Discounts and premiums on fixed income securities purchased are amortized using the interest method.
Distributions to shareholders — Dividends arising from net investment income, if any, are declared and paid quarterly to shareholders of The Jamestown Balanced Fund and The Jamestown Equity Fund. Dividends arising from net investment income are declared daily and paid monthly to shareholders of The Jamestown Tax Exempt Virginia Fund. Net realized short-term capital gains, if any, may be distributed throughout the year and net realized long-term capital gains, if any, are distributed at least once each year. The amount of distributions from net investment income and net realized gains are determined in accordance with federal income tax regulations which may differ from GAAP. These “book/tax” differences are either temporary or permanent in nature. Dividends and distributions are recorded on the ex-dividend date.
THE JAMESTOWN FUNDS NOTES TO FINANCIAL STATEMENTS (Continued) |
The tax character of distributions paid during the periods ended September 30, 2012 and March 31, 2012 was as follows:
| | | | | | | | | | | | |
| The Jamestown Balanced Fund | 9/30/12 | $ | 105,841 | | | $ | 261,444 | | | $ | — | | | $ | 367,285 | |
| | 3/31/12 | $ | 216,245 | | | $ | — | | | $ | — | | | $ | 216,245 | |
| The Jamestown Equity Fund | 9/30/12 | $ | 89,377 | | | $ | — | | | $ | — | | | $ | 89,377 | |
| | 3/31/12 | $ | 172,098 | | | $ | — | | | $ | — | | | $ | 172,098 | |
| The Jamestown Tax Exempt Virginia Fund | 9/30/12 | $ | 101 | | | $ | 27,270 | | | $ | 394,254 | | | $ | 421,625 | |
| | 3/31/12 | $ | 121 | | | $ | 11,275 | | | $ | 828,596 | | | $ | 839,992 | |
Security transactions — Security transactions are accounted for on trade date for financial reporting purposes. Gains and losses on securities sold are determined on a specific identification basis.
Securities traded on a “to-be-announced” basis — The Jamestown Balanced Fund may trade securities on a “to-be-announced” (“TBA”) basis. In a TBA transaction, the Fund has committed to purchase securities for which all specific information is not yet known at the time of the trade, particularly the face amount in mortgage-backed securities transactions. Securities purchased on a TBA basis are not settled until they are delivered to the Fund, normally 15 to 45 days later. These transactions are subject to market fluctuations and their current value is determined in the same manner as for other portfolio securities.
Common expenses — Common expenses of the Trust are allocated among the series of the Trust based on relative net assets of each series or the nature of the services performed and the relative applicability to each series.
Estimates — The preparation of financial statements in conformity with GAAP requires management to make estimates and assumptions that affect the reported amounts of assets and liabilities and the disclosure of contingent assets and liabilities as of the date of the financial statements and the reported amounts of income and expenses during the reporting period. Actual results could differ from those estimates.
Federal income tax — It is each Fund’s policy to comply with the special provisions of Subchapter M of the Internal Revenue Code applicable to regulated investment companies. As provided therein, in any fiscal year in which a Fund so qualifies and distributes at least 90% of its taxable net income, the Fund (but not the shareholders) will be relieved of federal income tax on the income distributed. Accordingly, no provision for income taxes has been made.
In order to avoid imposition of the excise tax applicable to regulated investment companies, it is also each Fund’s intention to declare as dividends in each calendar year at least 98% of its net investment income (earned during the calendar year) and 98.2% of its net realized capital gains (earned during the twelve months ended October 31) plus undistributed amounts from prior years.
THE JAMESTOWN FUNDS NOTES TO FINANCIAL STATEMENTS (Continued) |
The tax character of distributable earnings at September 30, 2012 was as follows:
| | The Jamestown Balanced Fund | | | | | | The Jamestown Tax Exempt Virginia Fund | |
| Cost of portfolio investments | | $ | 14,495,823 | | | $ | 19,460,957 | | | $ | 27,656,384 | |
| Gross unrealized appreciation | | $ | 4,455,463 | | | $ | 7,837,087 | | | $ | 2,194,970 | |
| Gross unrealized depreciation | | | (158,529 | ) | | | (322,226 | ) | | | (12 | ) |
| Net unrealized appreciation on investments | | | 4,296,934 | | | | 7,514,861 | | | | 2,194,958 | |
| Accumulated ordinary income | | | 3,048 | | | | 1,851 | | | | — | |
| Accumulated tax exempt income | | | — | | | | — | | | | 8,842 | |
| Capital loss carryforward | | | — | | | | (986,704 | ) | | | — | |
| Other gains | | | 511,329 | | | | 1,058,559 | | | | 42,558 | |
| Other temporary differences | | | (2,302 | ) | | | (1,408 | ) | | | (8,842 | ) |
| Total distributable earnings | | $ | 4,809,009 | | | $ | 7,587,159 | | | $ | 2,237,516 | |
The difference between the federal income tax cost of portfolio investments and the financial statement cost for The Jamestown Balanced Fund and The Jamestown Equity Fund is due to certain timing differences in the recognition of capital gains or losses under income tax regulations and GAAP. These “book/tax” differences are temporary in nature and are primarily due to the tax deferral of losses on wash sales and/or differing methods in the amortization of market discount and premium on fixed income securities.
As of March 31, 2012, The Jamestown Equity Fund had a short-term capital loss carryforward for federal income tax purposes of $986,704, which expires March 31, 2018. This capital loss carryforward may be utilized in the current and future years to offset net realized capital gains, if any, prior to distribution to shareholders.
Under the Regulated Investment Company Modernization Act of 2010 (the “Act”), net capital losses recognized after March 31, 2011 may be carried forward indefinitely and their character is retained as short-term and/or long-term losses. Under the law in effect prior to the Act, pre-enactment net capital losses were carried forward for eight years and treated as short-term losses. As a transition rule, the Act requires that post-enactment net capital losses be used before pre-enactment net capital losses. Therefore, there may be a greater likelihood that all or a portion of The Jamestown Equity Fund’s pre-enactment capital loss carryforward may expire without being utilized.
For the six months ended September 30, 2012, The Jamestown Balanced Fund and The Jamestown Tax Exempt Virginia Fund reclassified $1,328 and $399, respectively, of distributions in excess of net investment income against accumulated net realized gains from security transactions on the Statements of Assets and Liabilities due to permanent differences in the recognition of capital gains or losses under income tax regulations and GAAP. These differences are primarily due to the tax treatment of certain debt obligations and paydown adjustments. Such reclassification had no effect on the Fund’s net assets or net asset value per share.
THE JAMESTOWN FUNDS NOTES TO FINANCIAL STATEMENTS (Continued) |
The Funds recognize the tax benefits or expenses of uncertain tax positions only when the position is “more likely than not” to be sustained assuming examination by tax authorities. Management has reviewed the tax positions taken on Federal income tax returns for all open tax years (tax years ended March 31, 2009 through March 31, 2012) of each Fund and has concluded that no provision for unrecognized tax benefits or expenses is required in these financial statements.
3. Investment Transactions
Investment transactions, other than short-term investments and U.S. government securities, were as follows for the six months ended September 30, 2012:
| | The Jamestown Balanced Fund | | | | | | The Jamestown Tax Exempt Virginia Fund | |
| Purchase of investment securities | | $ | 2,527,146 | | | $ | 4,638,857 | | | $ | 2,308,098 | |
| Proceeds from sales and maturities of investment securities | | $ | 2,422,146 | | | $ | 4,564,251 | | | $ | 2,494,650 | |
4. Transactions with Affiliates
INVESTMENT ADVISORY AGREEMENT
Each Fund’s investments are managed by Lowe, Brockenbrough & Company, Inc. (the “Adviser”) under the terms of an Investment Advisory Agreement. The Jamestown Balanced Fund pays the Adviser a fee, which is computed and accrued daily and paid monthly, at an annual rate of .65% of its average daily net assets up to $250 million, .60% of the next $250 million of such assets and .55% of such assets in excess of $500 million. The Jamestown Equity Fund pays the Adviser a fee, which is computed and accrued daily and paid monthly, at an annual rate of .65% of its average daily net assets up to $500 million and .55% of such assets in excess of $500 million. The Jamestown Tax Exempt Virginia Fund pays the Adviser a fee, which is computed and accrued daily and paid monthly, at an annual rate of .40% of its average daily net assets up to $250 million, .35% of the next $250 million of such assets and .30% of such assets in excess of $500 million. Certain officers of the Trust are also officers of the Adviser.
During the six months ended September 30, 2012, the Adviser voluntarily undertook to limit the total annual operating expenses of The Jamestown Tax Exempt Virginia Fund to .69% of average daily net assets. Accordingly, the Adviser voluntarily waived $12,137 of its investment advisory fees during the six months ended September 30, 2012.
MUTUAL FUND SERVICES AGREEMENT
Under the terms of a Mutual Fund Services Agreement between the Trust and Ultimus Fund Solutions, LLC (“Ultimus”), Ultimus provides administrative, pricing, accounting, dividend disbursing, shareholder servicing and transfer agent services for the Funds. For these services,
THE JAMESTOWN FUNDS NOTES TO FINANCIAL STATEMENTS (Continued) |
Ultimus receives a monthly fee from each Fund at an annual rate of .15% of its average daily net assets up to $25 million; .125% of the next $25 million of such assets; and .10% of such assets in excess of $50 million. The Jamestown Balanced Fund and The Jamestown Equity Fund are each subject to a minimum monthly fee of $4,000. The Jamestown Tax Exempt Virginia Fund is subject to a minimum monthly fee of $3,500. In addition, each Fund pays out-of-pocket expenses including, but not limited to, postage, supplies and costs of pricing portfolio securities. Certain officers of the Trust are also officers of Ultimus, or of Ultimus Fund Distributors, LLC (the “Distributor”), the principal underwriter of each Fund’s shares and an affiliate of Ultimus. The Distributor is compensated by the Adviser (not the Funds) for acting as principal underwriter.
COMPLIANCE CONSULTING AGREEMENT
Under the terms of a Compliance Consulting Agreement between the Trust and Ultimus, Ultimus provides an individual to serve as the Trust’s Chief Compliance Officer and to administer the Funds’ compliance policies and procedures. For these services, the Funds pay Ultimus an annual base fee of $18,600 plus an asset-based fee equal to 0.01% per annum on the Funds’ aggregate net assets in excess of $100 million. In addition, the Funds reimburse Ultimus for reasonable out-of-pocket expenses, if any, incurred in connection with these services.
5. Brokerage Arrangement
In order to reduce the total operating expenses of The Jamestown Balanced Fund and The Jamestown Equity Fund, a portion of each Fund’s operating expenses have been paid through an arrangement with a third-party broker-dealer who is compensated through commission trades. Payment of expenses by the broker-dealer is based on a percentage of commissions earned.
Expenses reimbursed through the brokerage arrangement totaled $6,000 for each Fund for the six months ended September 30, 2012.
6. Contingencies and Commitments
The Funds indemnify the Trust’s officers and Trustees for certain liabilities that might arise from their performance of their duties to the Funds. Additionally, in the normal course of business the Funds enter into contracts that contain a variety of representations and warranties and which provide general indemnifications. The Funds’ maximum exposure under these arrangements is unknown, as this would involve future claims that may be made against the Funds that have not yet occurred. However, based on experience, the Funds expect the risk of loss to be remote.
THE JAMESTOWN FUNDS NOTES TO FINANCIAL STATEMENTS (Continued) |
7. Concentration of Credit Risk
The Jamestown Tax Exempt Virginia Fund invests primarily in debt instruments of municipal issuers in the Commonwealth of Virginia. The issuers’ abilities to meet their obligations may be affected by economic developments in the Commonwealth or its region, as well as disruptions in the credit markets and the economy, generally.
8. Subsequent Events
The Funds are required to recognize in the financial statements the effects of all subsequent events that provide additional evidence about conditions that existed as of the date of the Statements of Assets and Liabilities. For non-recognized subsequent events that must be disclosed to keep the financial statements from being misleading, the Funds are required to disclose the nature of the event as well as an estimate of its financial effect, or a statement that such an estimate cannot be made. Management has evaluated subsequent events through the issuance of these financial statements and has noted no such events.
THE JAMESTOWN FUNDS ABOUT YOUR FUNDS’ EXPENSES (Unaudited) |
We believe it is important for you to understand the impact of costs on your investment. All mutual funds have operating expenses. As a shareholder of the Funds, you incur ongoing costs, including management fees and other expenses. The following examples are intended to help you understand your ongoing costs (in dollars) of investing in the Funds and to compare these costs with the ongoing costs of investing in other mutual funds.
A mutual fund’s ongoing costs are expressed as a percentage of its average net assets. This figure is known as the expense ratio. The expenses in the table below are based on an investment of $1,000 made at the beginning of the period shown and held for the entire period (April 1, 2012 through September 30, 2012).
The table below illustrates each Fund’s costs in two ways:
Actual fund return – This section helps you to estimate the actual expenses that you paid over the period. The “Ending Account Value” shown is derived from each Fund’s actual return, and the third column shows the dollar amount of operating expenses that would have been paid by an investor who started with $1,000 in the Funds. You may use the information here, together with the amount you invested, to estimate the expenses that you paid over the period.
To do so, simply divide your account value by $1,000 (for example, an $8,600 account value divided by $1,000 = 8.6), then multiply the result by the number given for the Funds under the heading “Expenses Paid During Period.”
Hypothetical 5% return – This section is intended to help you compare the Funds’ ongoing costs with those of other mutual funds. It assumes that each Fund had an annual return of 5% before expenses during the period shown, but that the expense ratio is unchanged. In this case, because the returns used are not the Funds’ actual returns, the results do not apply to your investment. The example is useful in making comparisons because the Securities and Exchange Commission (“SEC”) requires all mutual funds to calculate expenses based on a 5% return. You can assess each Fund’s ongoing costs by comparing this hypothetical example with the hypothetical examples that appear in shareholder reports of other funds.
Note that expenses shown in the table are meant to highlight and help you compare ongoing costs only. The Funds do not charge sales loads or redemption fees.
The calculations assume no shares were bought or sold during the period. Your actual costs may have been higher or lower, depending on the amount of your investment and the timing of any purchases or redemptions.
More information about the Funds’ expenses, including annual expense ratios for the prior five fiscal years, can be found in this report. For additional information on operating expenses and other shareholder costs, please refer to the Funds’ prospectus.
THE JAMESTOWN FUNDS ABOUT YOUR FUNDS’ EXPENSES (Unaudited) (Continued) |
| | Beginning Account Value April 1, 2012 | Ending Account Value September 30, 2012 | Expenses Paid During Period* |
The Jamestown Balanced Fund |
| Based on Actual Fund Return | $1,000.00 | $1,013.10 | $6.09 |
| Based on Hypothetical 5% Return (before expenses) | $1,000.00 | $1,018.95 | $6.11 |
The Jamestown Equity Fund |
| Based on Actual Fund Return | $1,000.00 | $1,012.50 | $5.33 |
| Based on Hypothetical 5% Return (before expenses) | $1,000.00 | $1,019.70 | $5.35 |
The Jamestown Tax Exempt Virginia Fund |
| Based on Actual Fund Return | $1,000.00 | $1,018.80 | $3.48 |
| Based on Hypothetical 5% Return (before expenses) | $1,000.00 | $1,021.55 | $3.49 |
| * | Expenses are equal to the Funds’ annualized expense ratios for the period as stated below, multiplied by the average account value over the period, multiplied by 183/366 (to reflect the one-half year period). |
| The Jamestown Balanced Fund | 1.21% |
| The Jamestown Equity Fund | 1.06% |
| The Jamestown Tax Exempt Virginia Fund | 0.69% |
THE JAMESTOWN FUNDS OTHER INFORMATION (Unaudited) |
A description of the policies and procedures that the Funds use to vote proxies relating to portfolio securities is available without charge upon request by calling toll-free 1-866-738-1126, or on the SEC’s website at http://www.sec.gov. Information regarding how the Funds voted proxies relating to portfolio securities during the most recent 12-month period ended June 30 is also available without charge upon request by calling toll-free 1-866-738-1126, or on the SEC’s website at http://www.sec.gov.
The Trust files a complete listing of portfolio holdings of the Funds with the SEC as of the end of the first and third quarters of each fiscal year on Form N-Q. The filings are available upon request, by calling 1-866-738-1126. Furthermore, you may obtain a copy of these filings on the SEC’s website at http://www.sec.gov. The Trust’s Forms N-Q may also be reviewed and copied at the SEC’s Public Reference Room in Washington, DC, and information on the operation of the Public Reference Room may be obtained by calling 1-800-SEC-0330.
| | | | | | | | |
| | | | | | | | | |
| | | | | | | | | |
| | | | | THE JAMESTOWN FUNDS www.jamestownfunds.com Investment Adviser Lowe, Brockenbrough & Company, Inc. 1802 Bayberry Court Suite 400 Richmond, Virginia 23226 Administrator Ultimus Fund Solutions, LLC P.O. Box 46707 Cincinnati, Ohio 45246-0707 (Toll-Free) 1-866-738-1126 Independent Registered Public Accounting Firm Ernst & Young LLP 1900 Scripps Center 312 Walnut Street Cincinnati, Ohio 45202 Legal Counsel Sullivan & Worcester LLP One Post Office Square Boston, Massachusetts 02109 Board of Trustees John P. Ackerly, IV John T. Bruce Robert S. Harris J. Finley Lee, Jr. Richard L. Morrill Harris V. Morrissette | | | | |
| | | | | | | | | |
| | | | | | | | | |
| | | | | | | | |
Not required
| Item 3. | Audit Committee Financial Expert. |
Not required
| Item 4. | Principal Accountant Fees and Services. |
Not required
| Item 5. | Audit Committee of Listed Registrants. |
Not applicable
| Item 6. | Schedule of Investments. |
| (a) | Not applicable [schedule filed with Item 1] |
| Item 7. | Disclosure of Proxy Voting Policies and Procedures for Closed-End Management Investment Companies. |
Not applicable
| Item 8. | Portfolio Managers of Closed-End Management Investment Companies. |
Not applicable
| Item 9. | Purchases of Equity Securities by Closed-End Management Investment Company and Affiliated Purchasers. |
Not applicable
| Item 10. | Submission of Matters to a Vote of Security Holders. |
The registrant’s Nominating Committee shall review shareholder recommendations to fill vacancies on the registrant’s board of trustees if such recommendations are submitted in writing, addressed to the Committee at the registrant’s offices and meet any minimum qualifications adopted by the Committee. The Committee may adopt, by resolution, a policy regarding its procedures for considering candidates for the board of trustees, including any recommended by shareholders.
| Item 11. | Controls and Procedures. |
(a) Based on their evaluation of the registrant’s disclosure controls and procedures (as defined in Rule 30a-3(c) under the Investment Company Act of 1940) as of a date within 90 days of the filing date of this report, the registrant’s principal executive officers and principal financial officer have concluded that such disclosure controls and procedures are reasonably designed and are operating effectively to ensure that material information relating to the registrant, including its consolidated subsidiaries, is made known to them by others within those entities, particularly during the period in which this report is being prepared, and that the information required in filings on Form N-CSR is recorded, processed, summarized, and reported on a timely basis.
(b) There were no changes in the registrant’s internal control over financial reporting (as defined in Rule 30a-3(d) under the Investment Company Act of 1940) that occurred during the second fiscal quarter of the period covered by this report that have materially affected, or are reasonably likely to materially affect, the registrant’s internal control over financial reporting.
File the exhibits listed below as part of this Form. Letter or number the exhibits in the sequence indicated.
(a)(1) Any code of ethics, or amendment thereto, that is the subject of the disclosure required by Item 2, to the extent that the registrant intends to satisfy the Item 2 requirements through filing of an exhibit: Not required
(a)(2) A separate certification for each principal executive officer and principal financial officer of the registrant as required by Rule 30a-2(a) under the Act (17 CFR 270.30a-2(a)): Attached hereto
(a)(3) Any written solicitation to purchase securities under Rule 23c-1 under the Act (17 CFR 270.23c-1) sent or given during the period covered by the report by or on behalf of the registrant to 10 or more persons: Not applicable
(b) Certifications required by Rule 30a-2(b) under the Act (17 CFR 270.30a-2(b)): Attached hereto
| Exhibit 99.CERT | Certifications required by Rule 30a-2(a) under the Act |
| | |
| Exhibit 99.906CERT | Certifications required by Rule 30a-2(b) under the Act |