Exhibit 99.1

Province of Nova Scotia
(Canada)
This description of the Province of Nova Scotia is dated as of February 6, 2017, and appears as Exhibit (1) to the Province of Nova Scotia’s Annual Report on Form 18-K to the U.S. Securities and Exchange Commission for the fiscal year ended March 31, 2016.
This document (otherwise than as a prospectus contained in a registration statement filed under the Securities Act of 1933) does not constitute an offer to sell or the solicitation of an offer to buy any Securities of the Province of Nova Scotia. The delivery of this document at any time does not imply that the information herein is correct as of any time subsequent to its date.
TABLE OF CONTENTS
| | | | |
| | | Page | |
Further Information | | | 2 | |
Forward-Looking Statements | | | 3 | |
Summary | | | 4 | |
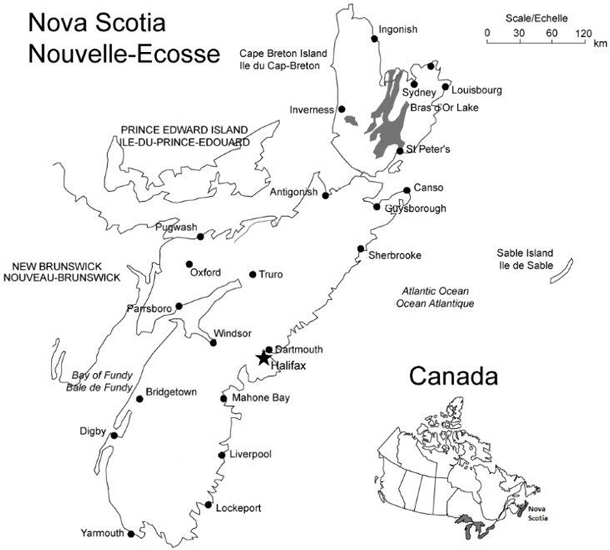
Map of Nova Scotia | | | 5 | |
Introduction | | | | |
Overview | | | 6 | |
Political System | | | 6 | |
Constitutional Framework | | | 6 | |
General Issues | | | 7 | |
Economy | | | | |
Principal Economic Indicators | | | 9 | |
Recent Developments | | | 11 | |
Economic Structure | | | 12 | |
Population and Labor Force | | | 13 | |
Income and Prices | | | 15 | |
Capital Expenditures | | | 16 | |
Goods Producing Industries | | | 17 | |
Exports | | | 20 | |
Service Sector | | | 24 | |
Energy | | | 25 | |
Government Finance | | | | |
Overview | | | 28 | |
Specific Accounting Policies | | | 28 | |
Accounting Changes | | | 30 | |
Summary of Budget Transactions and Borrowing Requirements | | | 33 | |
Revenue | | | 34 | |
Program Expenditures/Expenses | | | 40 | |
Loans and Investments | | | 44 | |
Provincial Debt | | | | |
Funded Debt | | | 47 | |
Derivative Financial Instruments | | | 48 | |
Debt Maturities and Sinking Funds | | | 48 | |
Current Liabilities | | | 51 | |
Guaranteed Debt | | | 51 | |
Pension Funds | | | 52 | |
Public Sector Debt | | | | |
Public Sector Funded Debt | | | 55 | |
Certain Crown Corporations and Agencies | | | | |
Sydney Steel Corporation and Sydney Tar Ponds Agency | | | 56 | |
Nova Scotia Municipal Finance Corporation | | | 56 | |
Nova Scotia Power Finance Corporation | | | 56 | |
Foreign Exchange | | | 57 | |
Official Statements | | | | |
Table 1 – Statement of Debentures Outstanding | | | 59 | |
FURTHER INFORMATION
This document appears as an exhibit to the Province of Nova Scotia’s Annual Report to the U.S. Securities and Exchange Commission (“SEC”) on the Form 18-K for the fiscal year ended March 31, 2016. Additional information with respect to the Province of Nova Scotia is available in such Annual Report, the other exhibits to such Annual Report, and in amendments thereto. Such Annual Report, exhibits and amendments can be inspected and copied at the public reference facility maintained by the SEC at: 100 F Street, NE, Washington, D.C. 20549. Copies of such documents may also be obtained at prescribed rates from the Public Reference Section of the Commission at its Washington address or, without charge, from Province of Nova Scotia, Department of Finance & Treasury Board, Deputy Minister of Finance & Treasury Board, PO Box 187, 7th Floor, 1723 Hollis Street, Halifax, Nova Scotia, Canada, B3J 2N3.
The SEC maintains an Internet site that contains reports, statements and other information regarding issuers that file electronically with the SEC. The address for the SEC’s Internet site is http://www.sec.gov.
In this document, unless otherwise specified or the context otherwise requires, all dollar amounts are expressed in Canadian dollars. On February 6, 2017 the closing spot rate for the U.S. dollar in Canada, as reported
2
by the Bank of Canada, expressed in Canadian dollars, and was $1.3087. See “Foreign Exchange” for information regarding the rates of conversion of U.S. dollars and other foreign currencies into Canadian dollars. The fiscal year of the Province of Nova Scotia ends March 31. “Fiscal 2016” and “2015-2016” refers to the fiscal year ending March 31, 2016, and unless otherwise indicated, ��2015” means the calendar year ended December 31, 2015. Other fiscal and calendar years are referred to in a corresponding manner. Any discrepancies between the amounts listed and their totals in the tables set forth in this document are due to rounding.
FORWARD-LOOKING STATEMENTS
This exhibit includes forward-looking statements. The Province of Nova Scotia has based these forward-looking statements on its current expectations and projections about future events. These forward-looking statements are subject to risks, uncertainties, and assumptions about the Province of Nova Scotia, including, among other things:
| | • | | the Province of Nova Scotia’s economic and political trends; and |
| | • | | the Province of Nova Scotia’s ability to control expenses and maintain revenues. |
In light of these risks, uncertainties and assumptions, the forward-looking events discussed in this annual report might not occur.
3
SUMMARY
The information below is qualified in its entirety by the detailed information provided elsewhere in this document.
PROVINCE OF NOVA SCOTIA
| | | | | | | | | | | | | | | | | | | | |
| Economy | | Year Ended December 31 | |
| | | 2011 | | | 2012 | | | 2013 | | | 2014 | | | 2015 | |
| | | (in millions unless otherwise indicated) | |
Gross Domestic Product at Market Prices | | $ | 37,652 | | | $ | 37,835 | | | $ | 38,614 | | | $ | 39,271 | | | $ | 40,225 | |
Household Income. | | | 35,668 | | | | 36,686 | | | | 37,690 | | | | 38,695 | | | | 39,924 | |
Capital Expenditures(1) | | | 4,356.5 | | | | 3,598.4 | | | | 3,575.4 | | | | 3,423.4 | | | | 3,173.2 | |
Annual Increase in Consumer Price Index | | | 3.8 | % | | | 2.0 | % | | | 1.2 | % | | | 1.7 | % | | | 0.4 | % |
Population by July 1 (in thousands) | | | 944.5 | | | | 944.9 | | | | 943.5 | | | | 943.3 | | | | 943.4 | |
Unemployment Rate | | | 9.0 | % | | | 9.1 | % | | | 9.1 | % | | | 9.0 | % | | | 8.6 | % |
| |
| Revenues and Expenses – Consolidated Entity | | Fiscal Year Ended March 31 | |
| | | Restated
2012(2) | | | Restated
2013(3) | | | Restated
2014(4) | | | 2015 | | | 2016 | |
Revenues | | $ | 9,390.9 | | | $ | 9,749.8 | | | $ | 9,708.9 | | | $ | 10,310.5 | | | $ | 10,549.8 | |
Current Expenses | | | 10,019.3 | | | | 10,407.8 | | | | 10,737.1 | | | | 10,805.6 | | | | 10,948.2 | |
| | | | | | | | | | | | | | | | | | | | |
Surplus (Deficit) from Governmental Units | | | (628.4 | ) | | | (658.0 | ) | | | (1,028.1 | ) | | | (495.1 | ) | | | (398.4 | ) |
Net Income from Government Business Enterprises | | | 369.4 | | | | 354.4 | | | | 351.3 | | | | 351.4 | | | | 387.8 | |
| | | | | | | | | | | | | | | | | | | | |
Provincial Surplus/(Deficit) | | ($ | 259.0 | ) | | ($ | 303.6 | ) | | ($ | 676.9 | ) | | ($ | 143.7 | ) | | ($ | 10.7 | ) |
| | | | | | | | | | | | | | | | | | | | |
| |
| Public Sector Funded Debt | | As at March 31 | |
| | | 2012 | | | 2013 | | | 2014 | | | 2015 | | | 2016 | |
| | | (in millions unless otherwise indicated) | |
General Revenue Fund Funded Debt | | $ | 14,983.1 | | | $ | 15,350.0 | | | $ | 15,323.4 | | | $ | 15,925.5 | | | $ | 15,942.1 | |
Miscellaneous Debt | | | 5.8 | | | | 11.3 | | | | 9.5 | | | | 8.0 | | | | 10.1 | |
Sub Total | | | 14,988.9 | | | | 15,361.3 | | | | 15,332.9 | | | | 15,933.5 | | | | 15,952.3 | |
| | | | | | | | | | | | | | | | | | | | |
Total Guaranteed Debt | | | 152.1 | | | | 143.3 | | | | 138.6 | | | | 124.0 | | | | 118.3 | |
Total Consolidated Entity Funded Debt | | | 15,141.0 | | | | 15,504.6 | | | | 15,471.5 | | | | 16,057.5 | | | | 16,070.5 | |
| | | | | | | | | | | | | | | | | | | | |
Less: Sinking Funds, Public Debt Management Fund | | | 2,539.0 | | | | 2,694.2 | | | | 2,531.1 | | | | 2,675.8 | | | | 2,595.8 | |
| | | | | | | | | | | | | | | | | | | | |
Net Public Sector Funded Debt | | $ | 12,602.0 | | | $ | 12,810.4 | | | $ | 12,940.4 | | | $ | 13,381.7 | | | $ | 13,474.8 | |
| | | | | | | | | | | | | | | | | | | | |
Per Capita ($) | | $ | 13,342.5 | | | $ | 13,557.4 | | | $ | 13,715.3 | | | $ | 14,186.1 | | | $ | 14,283.2 | |
As a Percentage of: | | | | | | | | | | | | | | | | | | | | |
Household Income(5) | | | 35.3 | % | | | 34.9 | % | | | 34.3 | % | | | 34.6 | % | | | 33.8 | % |
Gross Domestic Product at Current Market Prices | | | 33.5 | % | | | 33.9 | % | | | 33.5 | % | | | 34.1 | % | | | 33.5 | % |
| (1) | Methodology used to calculate Capital Expenditures was revised in 2015 and adjusted for all included periods. Housing has been excluded in the new methodology since the primary goal of the program is to publish capital expenditures made by private- and public-sector organization. |
| (2) | Restated to reflect accounting changes in fiscal year 2012-2013. See “Government Finance – Accounting Changes to the 2012 Accounts”. |
| (3) | Restated to reflect accounting changes in fiscal year 2013-2014. See “Government Finance – Accounting Changes to the 2013 Accounts”. |
| (4) | Restated to reflect accounting changes in fiscal year 2014-2015. See “Government Finance – Accounting Changes to the 2014 Accounts”. |
| (5) | Population as of July 1 of the preceding calendar year Household Income (Personal Income has been replaced with Household Income by Statistics Canada, the concepts are similar) and Gross Domestic Product at market prices are for the previous calendar year. |
4
MAP
5
INTRODUCTION
Overview
The Province of Nova Scotia (“Nova Scotia” or the “Province”) is the most populous of the four Atlantic Provinces of Canada (“Atlantic Canada”) and covers 20,402 square miles. It extends 360 miles in length and varies in width from 50 miles to 105 miles.
According to estimates issued by Statistics Canada, the population of Nova Scotia was 949.5 thousand as of July 1, 2016, and represented 2.6% of Canada’s population of 36.3 million. The largest urban concentration in Atlantic Canada is the Halifax Regional Municipality (“Halifax”). Halifax Census Metropolitan Area, situated centrally on the Atlantic coast of the Province, had a population of 417.8 thousand as of July 1, 2015. Halifax, the capital of Nova Scotia, is the commercial, governmental, educational, and financial center of the Province, and is also the location of an important naval base.
Political System
The Legislature of Nova Scotia consists of the Lieutenant Governor and the Nova Scotia House of Assembly. The Nova Scotia House of Assembly is elected by the people for a term not to exceed five years. The House of Assembly may be dissolved at any time by the Lieutenant Governor on the advice of the Premier of the Province, who is traditionally the leader of the majority party in the Nova Scotia House of Assembly.
The last provincial general election was held on October 8, 2013. The Liberal Party was elected to a majority government and holds 34 seats in the House of Assembly. The official opposition in the House of Assembly is the Progressive Conservative Party with 10 seats. The New Democratic Party holds 6 seats and there is 1 independent member.
The executive power in the Province is vested in the Governor-in-Council, comprising the Lieutenant Governor acting on the advice of the Executive Council. The Executive Council is responsible to the House of Assembly. The Governor General of Canada in Council appoints the Lieutenant Governor, who is the representative of the Queen in the Province. Members of the Executive Council are appointed by the Lieutenant Governor, normally from members of the House of Assembly, on the nomination of the Premier.
The Parliament of Canada is composed of the Queen represented by the Governor General, the Senate, whose members are appointed by the Governor General upon the recommendation of the Prime Minister of Canada, and the House of Commons, whose members are elected by the people. The people of Nova Scotia are entitled to send 11 elected representatives to the 338 member House of Commons. Ten Senators represent Nova Scotia in the Senate.
There are three levels of courts in Nova Scotia; provincially appointed courts are grouped together, the Supreme Court and Court of Appeal. The Provincial Court is a court of record and every judge thereof has jurisdiction throughout the Province to exercise all the power and perform all the duties conferred or imposed on a judge of the Provincial Court. In addition to hearing matters relating to provincial statutes and municipal by-laws, the Provincial Court is specifically authorized to hear certain matters under the Criminal Code of Canada. The Supreme Court of Nova Scotia is a court of original jurisdiction and as such has jurisdiction in all cases, civil and criminal, arising in the Province except those matters or cases expressly excluded by statute. The Nova Scotia Court of Appeal is the general court of appeal in both civil and criminal matters.
Constitutional Framework
Similar to the British Constitution, the Constitution of Canada (the “Constitution”) is not contained in a single document, but consists of a number of statutes, orders, and conventions. Canada is a federation of ten provinces and three Federal territories, with a constitutional division of responsibilities between the Federal and provincial governments, as set forth in The Constitution Acts, 1867 to 1982. The Constitution Acts are divided into two fundamental documents. The Constitution Act, 1867 (formerly the British North America Act, 1867), provides for the federation of British North America provinces, and the Constitution Act, 1982 (the “1982 Act”), enacted by the parliament of the United Kingdom, provides, among other things, that amendments to the Constitution be effected in Canada according to terms of an amending formula.
6
The 1982 Act also includes a Charter of Rights and Freedoms, which encompasses language rights, Aboriginal rights, principles of the reduction of regional economic disparities, and the making of fiscal equalization payments to the provinces by the Government of Canada, including an enumeration of other Acts and orders which are part of the Constitution.
Under the Constitution, each provincial government may exclusively make laws in relation to the following matters:
| | • | | municipal institutions; |
| | • | | property and civil rights; |
| | • | | forestry and non-renewable natural resources; |
| | • | | other matters of purely provincial or local concern; |
| | • | | raise revenue through direct taxation within its territorial limits; and |
| | • | | borrow monies on the credit of the province. |
The Federal Parliament of Canada is empowered to raise revenue by any system of taxation, and generally has jurisdiction over matters or subjects not assigned exclusively to the provincial legislatures. The Federal Parliament may exclusively make laws in relation to the following matters:
| | • | | the Federal public debt and property; |
| | • | | the borrowing of money on the public credit of Canada; |
| | • | | the regulation of trade and commerce; |
As a province of Canada, Nova Scotia could be affected by political events in another province. For instance, on September 7, 1995, the Government of Quebec presented a Bill to the National Assembly entitled An Act respecting the future of Quebec (the “Act”) that included, among others, provisions authorizing the National Assembly to proclaim the sovereignty of Quebec. The Act was to be enacted only following a favorable vote in a referendum. Such a referendum was held on October 30, 1995. The results were 49.4% in favor and 50.6% against.
In 1996, the Government of Canada, by way of reference to the Supreme Court of Canada (the “Supreme Court”), asked the court to determine the legality of a unilateral secession of the Province of Quebec from Canada, either under the Canadian Constitution or international law. On August 20, 1998, the Supreme Court of Canada ruled that the Province of Quebec did not have the unilateral right of secession, and that any proposal to secede authorized by a clear majority in response to a clear question in the referendum should be construed as a proposal to amend the Constitution, which would require negotiations. These negotiations would have to deal with a wide array of issues, such as the interest of the other provinces, the Federal Government, the Province of Quebec, and the rights of all Canadians both within and outside the Province of Quebec, and specifically, the rights of minorities, including Aboriginal peoples.
General Issues
Current Issues Concerning Native Persons
The Mi’kmaq are the First Nations peoples of Nova Scotia and are descendants of the aboriginal people who resided in Nova Scotia prior to European contact.
In February 2007, the Mi’kmaq of Nova Scotia, the Federal Government and the Province signed a Framework Agreement that established a long-term negotiation process to resolve issues pertaining to Mi’kmaq treaty rights, Aboriginal rights and Aboriginal title. The Framework Agreement establishes the objectives for the
7
negotiations; subject matters that are to be included in the negotiations; process parameters, such as measures or agreements, approvals, the negotiation process, funding, termination and amendments and other conditions. The Framework Agreement also provides a forum to collaboratively address Aboriginal and treaty rights issues, which has reduced reliance on the court system. As a result of the negotiations, in August 2010 the Province, Canada and the Mi’kmaq signed a Consultation Terms of Reference which provides a non-binding process to guide the parties when conducting consultation with the Mi’kmaq of Nova Scotia. In October, 2012, the Province and Canada established a Memorandum of Understanding (MOU) on Cooperation Regarding Duty to Consult. This MOU, the first of its kind in Canada, formalizes and strengthens the cooperative working relationship between Nova Scotia and Canada regarding consultation with the Mi’kmaq. In April 2015, Nova Scotia established the “Government of Nova Scotia Policy and Guidelines: Consultation with the Mi’kmaq of Nova Scotia” to provide detailed direction to Nova Scotia government departments when they have a duty to consult with the Mi’kmaq of Nova Scotia. This document outlines why and when consultation may be required and how to proceed with consultation. It ensures a consistent process that respects the established and asserted rights of the Mi’kmaq of Nova Scotia while also providing clarity and predictability for proponents considering projects in the Province. Together, these processes have created stability in the relationship between the Province and the Mi’kmaq of Nova Scotia by providing opportunities to address issues in respectful and collaborative manner.
Litigation
The Pictou Landing First Nation has commenced a lawsuit against the Province, Northern Pulp (the current owner of the pulp mill located at Abercrombie, Pictou County, Nova Scotia) and all former owners of the mill. The claim relates to effluent which has contaminated Boat Harbor near the Pictou Landing First Nation. Pictou Landing First Nation filed and served a statement of claim in 2010. In November 2013, the plaintiff issued a notice of motion to seek costs from the Province in advance to fund its future cost of litigation. After a hearing in January 2014, the Supreme Court of Nova Scotia denied the motion. Since then, the plaintiff has not pursued the litigation, and is presently involved in negotiations with the Province relating to the Boat Harbour facility. The Province is unable to assess the likelihood of loss or estimate the amount of ultimate loss at this time. At March 31, 2016, the Province had recognized expenses of $88.5 million for the remediation of Boat Harbour in Pictou County, this amount being the Province’s estimate for the removal of effluent based on environmental studies and engineering reports.
A class action has been certified on behalf of residents of nursing homes, spouses of those residents, or their estates if deceased, seeking restitution and damages as a result of the introduction by the Province of Nova Scotia of a Single-Entry Access System for nursing homes admissions in the province between February 1, 2001 and January 1, 2005. The system required both a financial and health needs assessment for all nursing home applicants, regardless of their stated ability to pay, and continued as before to require financially-able persons admitted to nursing homes to pay some or all of their health care costs in the nursing home. The claim has been brought on behalf of nursing home residents and their spouses for the health care costs they paid while in nursing homes between 2001 and 2005. The claim alleges the introduction of the Single-Entry Access System by the Province amounted to misfeasance in public office, fraudulent misrepresentation and deceit, negligence, breach of fiduciary duty, equitable fraud, unjust enrichment and unconstitutional discrimination, and seeks restoration of health care costs paid, damages and costs. Approximately 100 people have joined in the class action to date. The action is in the discovery stage. The Province is unable to assess the likelihood of loss at this time.
Residents and former residents of neighborhoods of the School for the Deaf operated in Halifax and Amherst, Nova Scotia between 1913 and 1995 have brought a class action against the Province. The claims include breach of fiduciary duty, and negligence for physical, sexual and emotional abuse and vicarious liability for the actions of its employees or agents. A certification hearing has been set for September 2017. The Province is unable to assess the likelihood of loss at this time.
8
ECONOMY
Nova Scotia has a diversified economy. The geographic location of Nova Scotia, being surrounded almost completely by water with more than 4,598 miles of coastline, has significantly contributed to the economy. The importance of the sea to the economy is witnessed in many industries such as fishing and aquaculture, oil and gas, naval defense, tourism, transportation and research.
While many of the goods and services producing industries are directly or indirectly related to the processing of Nova Scotia’s natural resources such as seafood products, pulp and paper products, and natural gas, the provincial economy is also diversified into information age technologies and other goods as diverse as motor vehicle tires and naval shipbuilding.
Export of goods are important to the economy of Nova Scotia as export of goods and services represents 39.6% of Nova Scotia’s GDP at market prices. Of international merchandise exports, approximately 71% are exported to the United States.
Nova Scotia’s economy features the general characteristics of developed economies. Nova Scotia’s service sector is disproportionately larger than that of Canada. This represents Nova Scotia’s long-established position as the principal private sector service center for Atlantic Canada and the center for regional public administration and defense.
Principal Economic Indicators
The economy of Nova Scotia is influenced by the economic situation of its principal trading partners in Canada and abroad, particularly the United States. In 2015, Nova Scotia’s gross domestic product (“GDP”) at market prices was $40.2 billion, or 2.0% of Canada’s GDP. Compared with the levels for 2014, real GDP at market prices in chained 2007 dollars for Nova Scotia increased by 1.0% while GDP in Canada increased by 0.9% in 2015. Total exports of goods and services from Nova Scotia, to international and inter-provincial destinations, in 2015 increased by 2.6%.
Manufacturing sales in 2015 increased by 6.9% for Nova Scotia compared to a decrease of 1.5% for Canada.
9
The following table sets forth certain information about economic activity in Nova Scotia and, where provided, Canada, for the calendar years 2011 through 2015.
SELECTED ECONOMIC INFORMATION
| | | | | | | | | | | | | | | | | | | | | | | | |
| | | 2011 | | | 2012 | | | 2013 | | | 2014 | | | 2015 | | | Compound
Annual rate
of growth(1) | |
| | | (In millions of $ in current prices unless otherwise indicated) | |
Gross Domestic Product (Nova Scotia) | | | | | | | | | | | | | | | | | | | | | | | | |
At Market Prices (2) | | $ | 37,652 | | | $ | 37,835 | | | $ | 38,614 | | | $ | 39,271 | | | $ | 40,225 | | | | 1.7 | % |
Chained 2007 Dollars | | | 35,884 | | | | 35,567 | | | | 35,524 | | | | 35,812 | | | | 36,168 | | | | 0.2 | % |
GDP at Basic Prices (Chained 2007) | | | 32,426 | | | | 32,116 | | | | 32,020 | | | | 32,243 | | | | 32,560 | | | | 0.1 | % |
Gross Domestic Product (Canada) | | | | | | | | | | | | | | | | | | | | | | | | |
At Market Prices (2) | | | 1,769,921 | | | | 1,822,808 | | | | 1,897,531 | | | | 1,983,117 | | | | 1,986,193 | | | | 2.9 | % |
Chained 2007 Dollars | | | 1,639,900 | | | | 1,668,524 | | | | 1,709,821 | | | | 1,753,683 | | | | 1,770,196 | | | | 1.9 | % |
Household Income (Nova Scotia) | | | 35,668 | | | | 36,686 | | | | 37,690 | | | | 38,695 | | | | 39,924 | | | | 2.9 | % |
Household Income ($ per capita) | | | 37,763.9 | | | | 38,825.3 | | | | 39,947.0 | | | | 41,020.9 | | | | 42,319.3 | | | | 2.9 | % |
Capital Expenditures (3) | | | 4,356.5 | | | | 3,598.4 | | | | 3,575.4 | | | | 3,423.4 | | | | 3,173.2 | | | | (7.6 | %) |
Retail Trade | | | 13,098.4 | | | | 13,222.8 | | | | 13,604.7 | | | | 13,914.5 | | | | 13,826.7 | | | | 1.4 | % |
Value of Manufacturing Sales | | $ | 10,631.2 | | | $ | 10,459.8 | | | $ | 9,450.2 | | | $ | 7,356.7 | | | $ | 7,741.0 | | | | (7.6 | %) |
Unemployment Rate | | | 9.0 | % | | | 9.1 | % | | | 9.1 | % | | | 9.0 | % | | | 8.6 | % | | | | |
Annual Increase in Consumer Price Index: | | | | | | | | | | | | | | | | | | | | | | | | |
Nova Scotia | | | 3.8 | % | | | 2.0 | % | | | 1.2 | % | | | 1.7 | % | | | 0.4 | % | | | | |
Canada | | | 2.9 | % | | | 1.5 | % | | | 0.9 | % | | | 2.0 | % | | | 1.1 | % | | | | |
| (1) | Compound annual rate of growth is computed by distributing the aggregate amount of growth during the period on the basis of a single annual rate of growth compounded annually. These rates are not adjusted for inflation unless otherwise indicated. |
| (2) | Gross Domestic Product (“GDP”) at market prices represents the value added by each of the factors of production plus indirect taxes less subsidies. GDP at Basic Prices represents the value added by each of the factors of production. |
| (3) | Methodology used to calculate Capital Expenditures was revised in 2015 for all periods listed. Housing has been excluded in the new methodology since the primary goal of the program is to publish capital expenditures made by private- and public-sector organization. |
| Sources: | Statistics Canada CANSIM Table 384-0037, 384-0038, 379-0030, 384-0042, 029-0045, 080-0020, 304-0015, 282-0002, and 326-0021. |
10
Recent Developments
The following table sets forth the most recently available information with respect to certain economic indicators for Nova Scotia and Canada.
RECENT DEVELOPMENTS
| | | | | | | | | | | | |
| | | | | | Percentage Change, except where
noted | |
| | Period | | | Nova Scotia | | | Canada | |
Retail Trade (1) | |
| Jan. – Nov. 2016/
Jan. – Nov. 2015 |
| | | 4.3 | % | | | 3.7 | % |
| | | |
Manufacturing Sales (1) | |
| Jan. – Nov. 2016/
Jan. – Nov. 2015 |
| | | 4.5 | % | | | 0.6 | % |
| | | |
Housing Starts (all areas) (2) | |
| Jan. – Dec. 2016/
Jan. – Dec. 2015 |
| | | -3.5 | % | | | 2.5 | % |
| | | |
Employment Growth (3) | |
| Jan. – Dec. 2016/
Jan. – Dec. 2015 |
| | | -0.4 | % | | | 0.7 | % |
| | | |
Unemployment Rate (3) | | | Jan. – Dec. 2016 | | | | 8.3 | % | | | 7.0 | % |
| | | |
Consumer Price Index | |
| Jan. – Dec. 2016/
Jan. – Dec. 2015 |
| | | 1.2 | % | | | 1.4 | % |
| (2) | These figures represent residential housing starts in both urban and rural areas, seasonally adjusted at annual rates |
| (3) | These figures reflect the seasonally adjusted rate of unemployment. |
| Sources: | Statistics Canada, CANSIM Tables 080-0020, 304-0014, 304-0015, 027-0008, 282-0087, and 326-0020. |
11
Economic Structure
Nova Scotia’s economy features the general characteristics of developed economies. Nova Scotia’s service sector is disproportionately larger than that of Canada. This represents Nova Scotia’s long-established position as the principal private sector service center for Atlantic Canada and the center for regional public administration and defense.
The following table shows the relative contribution of each sector to GDP in basic prices (chained 2007 dollars) for Nova Scotia and Canada for the calendar years indicated.
NOVA SCOTIA GROSS DOMESTIC PRODUCT BY INDUSTRY IN BASIC PRICES
(CHAINED 2007 DOLLARS)
| | | | | | | | | | | | | | | | | | | | | | | | | | | | | | | | |
| | | | | | | | | | | | | | | | | | Compound
Annual
Rate
of Growth
2011-2015 | | | % of GDP
in Basic Prices,
2015 | |
| | | 2011 | | | 2012 | | | 2013 | | | 2014 | | | 2015 | | | |
| | | (In millions) | |
| | | | | | | | | | | | | | | | | | | | | Nova
Scotia | | | Canada | |
Primary Sector: | | | | | | | | | | | | | | | | | | | | | | | | | | | | | | | | |
Agriculture, Forestry, Fishing, and Hunting | | $ | 805.2 | | | $ | 806.9 | | | $ | 792.8 | | | $ | 852.4 | | | $ | 913.3 | | | | 3.2 | % | | | 2.8 | % | | | 1.6 | % |
Mining and Oil, and Gas Extraction | | | 930.2 | | | | 689.7 | | | | 586.4 | | | | 905.4 | | | | 716.0 | | | | -6.3 | % | | | 2.2 | % | | | 8.1 | % |
Utilities | | | 633.2 | | | | 560.1 | | | | 588.4 | | | | 579.8 | | | | 570.0 | | | | -2.6 | % | | | 1.8 | % | | | 2.3 | % |
| | | | | | | | | | | | | | | | | | | | | | | | | | | | | | | | |
| | | 2,368.6 | | | | 2,056.7 | | | | 1,967.6 | | | | 2,337.6 | | | | 2,199.3 | | | | -1.8 | % | | | 6.8 | % | | | 12.0 | % |
| | | | | | | | | | | | | | | | | | | | | | | | | | | | | | | | |
Secondary Sector: | | | | | | | | | | | | | | | | | | | | | | | | | | | | | | | | |
Construction | | | 1,715.5 | | | | 1,730.3 | | | | 1,697.9 | | | | 1,551.5 | | | | 1,557.0 | | | | -2.4 | % | | | 4.8 | % | | | 7.2 | % |
Manufacturing | | | 2,762.9 | | | | 2,651.0 | | | | 2,564.4 | | | | 2,474.1 | | | | 2,566.0 | | | | -1.8 | % | | | 7.9 | % | | | 10.6 | % |
| | | | | | | | | | | | | | | | | | | | | | | | | | | | | | | | |
| | | 4,478.4 | | | | 4,381.3 | | | | 4,262.3 | | | | 4,025.6 | | | | 4,123.0 | | | | -2.0 | % | | | 12.7 | % | | | 17.7 | % |
| | | | | | | | | | | | | | | | | | | | | | | | | | | | | | | | |
Service Sector: | | | | | | | | | | | | | | | | | | | | | | | | | | | | | | | | |
Transportation and Warehousing | | | 1,127.1 | | | | 1,080.6 | | | | 1,081.4 | | | | 1,076.0 | | | | 1,109.6 | | | | -0.4 | % | | | 3.4 | % | | | 4.3 | % |
Wholesale Trade | | | 1,400.0 | | | | 1,341.6 | | | | 1,377.5 | | | | 1,396.2 | | | | 1,421.4 | | | | 0.4 | % | | | 4.4 | % | | | 5.7 | % |
Retail Trade | | | 2,196.9 | | | | 2,181.3 | | | | 2,234.2 | | | | 2,270.0 | | | | 2,275.7 | | | | 0.9 | % | | | 7.0 | % | | | 5.4 | % |
Finance and Insurance | | | 1,794.9 | | | | 1,811.3 | | | | 1,788.0 | | | | 1,806.5 | | | | 1,851.5 | | | | 0.8 | % | | | 5.7 | % | | | 7.0 | % |
Real Estate, rental and leasing(1) | | | 4,913.9 | | | | 5,056.1 | | | | 5,166.8 | | | | 5,275.5 | �� | | | 5,375.3 | | | | 2.3 | % | | | 16.5 | % | | | 12.9 | % |
Management of Companies | | | 140.0 | | | | 142.1 | | | | 141.8 | | | | 145.1 | | | | 140.0 | | | | 0.0 | % | | | 0.4 | % | | | 0.7 | % |
Professional, scientific and technical services | | | 1,312.2 | | | | 1,314.3 | | | | 1,359.3 | | | | 1,360.5 | | | | 1,383.7 | | | | 1.3 | % | | | 4.3 | % | | | 5.3 | % |
Administrative and support, waste management and remediation services | | | 696.7 | | | | 695.3 | | | | 658.4 | | | | 667.6 | | | | 652.8 | | | | -1.6 | % | | | 2.0 | % | | | 2.6 | % |
Information and Cultural Industries | | | 1,062.2 | | | | 1,084.5 | | | | 1,080.2 | | | | 1,068.4 | | | | 1,056.3 | | | | -0.1 | % | | | 3.2 | % | | | 3.1 | % |
Education Services | | | 2,218.9 | | | | 2,221.1 | | | | 2,215.1 | | | | 2,207.0 | | | | 2,217.6 | | | | 0.0 | % | | | 6.8 | % | | | 5.2 | % |
Health Care and Social Assistance | | | 3,083.1 | | | | 3,101.5 | | | | 3,124.1 | | | | 3,168.7 | | | | 3,215.1 | | | | 1.1 | % | | | 9.9 | % | | | 6.8 | % |
Accommodation and Food Services | | | 761.9 | | | | 777.4 | | | | 759.5 | | | | 780.4 | | | | 793.7 | | | | 1.0 | % | | | 2.4 | % | | | 2.1 | % |
Arts, entertainment, and recreation | | | 177.8 | | | | 173.6 | | | | 168.3 | | | | 168.1 | | | | 178.9 | | | | 0.2 | % | | | 0.5 | % | | | 0.7 | % |
Other Services (except Public Administration) | | | 657.0 | | | | 645.0 | | | | 653.1 | | | | 656.4 | | | | 653.0 | | | | -1.0 | % | | | 2.0 | % | | | 2.0 | % |
Public Administration | | | 4,035.9 | | | | 3,978.0 | | | | 3,886.2 | | | | 3,860.6 | | | | 3,881.8 | | | | 0.6 | % | | | 11.9 | % | | | 6.5 | % |
| | | | | | | | | | | | | | | | | | | | | | | | | | | | | | | | |
| | | 25,578.5 | | | | 25,603.7 | | | | 25,693.9 | | | | 25,907.0 | | | | 26,206.4 | | | | 0.6 | % | | | 80.6 | % | | | 70.5 | % |
| | | | | | | | | | | | | | | | | | | | | | | | | | | | | | | | |
Gross Domestic Product at Basic Prices | | | 32,426.4 | | | | 32,116.1 | | | | 32,019.5 | | | | 32,242.6 | | | | 32,559.9 | | | | 0.1 | % | | | 100.0 | % | | | 100.0 | % |
| | | | | | | | | | | | | | | | | | | | | | | | | | | | | | | | |
Source: Statistics Canada, CANSIM Table 379-0030, 379-0031 (Canada GDP by industry).
| (1) | Includes imputed values of output from owner-occupied housing. |
12
Population and Labor Force
According to estimates by Statistics Canada, at July 1, 2015, the population of Nova Scotia was 943.4 thousand or 2.6% of Canada’s population of 35.8 million. Over the period July 2011 to July 2015, the population of Nova Scotia fell by 0.1%, as compared to growth of 4.4% for Canada. Nova Scotia’s labor force decreased at a compounded annual rate of 0.4% compared to an increase of 0.9% for Canada for the 2011 to 2015 calendar year period.
According to Statistics Canada data for 2015, the Province’s labor force averaged 490,200 persons, representing 62.4% of the population 15 years of age and over. This level is a decrease of 0.4 percentage points in the participation rate compared to 2014. The figures for the calendar year 2015 show a decline in the unemployment rate to 8.6% from a rate of 9.0% in 2014. The labor force and the number of unemployed persons in 2015 showed declines from the levels observed in 2014, while the labor force employed increased marginally over 2014 levels.
As the baby boom cohort of Nova Scotia’s population ages, an increasing share of the population is found among age cohorts that have lower participation rates. Between 2011 and 2015, the share of the population aged 55 and older grew from 30.8 per cent to 34.2 per cent while the share aged between 25 and 54 declined from 41.6 per cent to 39.6 per cent. In 2015, the labor force participation rate of those aged 55 and up (the cohort with rising share of the population) was 33.6 per cent while the labor force participation rate of those aged 25-54 (the cohort with declining share of the population) was 86.4 per cent.
Nova Scotia’s unemployment rate decreased to 8.3% in December 2016, on a seasonally adjusted basis, versus the December 2015 level of 8.6%. The unemployment rate over the same period for Canada remained relatively unchanged at 7.0% from a year earlier. The unemployment rate for Nova Scotia in December 2016 reflects an increase of 0.2% in the labor force from a year earlier, a 4.0% decrease in the number of individuals unemployed and a 0.6% increase in the number of individuals employed, compared to the same period in 2015. With the release of the December Labour Force Survey by Statistics Canada, the preliminary figures for calendar year 2016 compared to 2015 are: labor force declined by 0.6%, employment declined by 0.4%, unemployment declined by 3.0%, and the unemployment rate was 8.4% in 2016 compared to 8.6% in 2015. These figures will be revised by Statistics Canada early in 2017.
The following table sets forth Nova Scotia’s population and labor force for the 2011 to 2015 calendar years.
POPULATION AND LABOR FORCE
| | | | | | | | | | | | | | | | | | | | | | | | |
| | | 2011 | | | 2012 | | | 2013 | | | 2014 | | | 2015 | | | Compound
Annual
Rate of
Growth | |
| | | (In thousands unless otherwise indicated) | |
Total Population (July 1) | | | 944.5 | | | | 944.9 | | | | 943.5 | | | | 943.3 | | | | 943.4 | | | | 0.0 | % |
Population 15 Years of Age and Over | | | 779.4 | | | | 781.6 | | | | 781.9 | | | | 783.0 | | | | 785.5 | | | | 0.2 | % |
Labor Force | | | 497.9 | | | | 503.5 | | | | 497.7 | | | | 491.6 | | | | 490.2 | | | | (0.4 | %) |
Labor Force Employed | | | 453.0 | | | | 457.6 | | | | 452.6 | | | | 447.6 | | | | 448.1 | | | | (0.3 | %) |
Labor Force Unemployed | | | 45.0 | | | | 46.0 | | | | 45.1 | | | | 44.0 | | | | 42.0 | | | | (1.7 | %) |
| | | | | | |
Participation Rate (%): | | | | | | | | | | | | | | | | | | | | | | | | |
Nova Scotia | | | 63.9 | % | | | 64.4 | % | | | 63.7 | % | | | 62.8 | % | | | 62.4 | % | | | | |
Canada | | | 66.7 | % | | | 66.5 | % | | | 66.5 | % | | | 66.0 | % | | | 65.8 | % | | | | |
| | | | | | |
Unemployment Rate (%): | | | | | | | | | | | | | | | | | | | | | | | | |
Nova Scotia | | | 9.0 | % | | | 9.1 | % | | | 9.1 | % | | | 9.0 | % | | | 8.6 | % | | | | |
Canada | | | 7.5 | % | | | 7.3 | % | | | 7.1 | % | | | 6.9 | % | | | 6.9 | % | | | | |
Sources: Statistics Canada, CANSIM Tables 051-0001, 282-0002 and 282-0087.
13
The following table illustrates the distribution of employment in Nova Scotia by industry for the calendar years 2012 through 2016, and the compound annual rate of growth over the period 2012 to 2016. This data is preliminary, and will be revised in early 2017.
EMPLOYMENT BY INDUSTRY
| | | | | | | | | | | | | | | | | | | | | | | | |
| | | 2012 | | | 2013 | | | 2014 | | | 2015 | | | 2016 | | | Compound
Annual
Rate of
Growth | |
| | (In thousands) | |
Agriculture | | | 6.1 | | | | 5.7 | | | | 5.2 | | | | 5.4 | | | | 4.5 | | | | -7.3 | % |
Forestry, Fishing, Mining, Oil, and Gas | | | 11.5 | | | | 11.5 | | | | 11.2 | | | | 11.8 | | | | 11.3 | | | | -0.4 | % |
Utilities | | | 3.8 | | | | 4.2 | | | | 3.8 | | | | 3.7 | | | | 3.3 | | | | -3.5 | % |
Construction | | | 32.3 | | | | 34.7 | | | | 34 | | | | 33.6 | | | | 32.9 | | | | 0.5 | % |
Manufacturing | | | 32.8 | | | | 30.6 | | | | 29.9 | | | | 28.7 | | | | 29.1 | | | | -2.9 | % |
Wholesale and Retail Trade | | | 74.8 | | | | 75.2 | | | | 73.9 | | | | 71.8 | | | | 71.9 | | | | -1.0 | % |
Wholesale Trade | | | 12.9 | | | | 12.1 | | | | 13.2 | | | | 11.9 | | | | 13.2 | | | | 0.6 | % |
Retail Trade | | | 61.9 | | | | 63 | | | | 60.7 | | | | 59.9 | | | | 58.7 | | | | -1.3 | % |
Transportation and Warehousing | | | 20.9 | | | | 19.6 | | | | 20.9 | | | | 20.5 | | | | 20.3 | | | | -0.7 | % |
Finance, Insurance, Real Estate, and Leasing | | | 21.8 | | | | 20.9 | | | | 22.2 | | | | 23.4 | | | | 23.6 | | | | 2.0 | % |
Professional, Scientific, and Technical Services | | | 23.9 | | | | 26.5 | | | | 26.1 | | | | 27.8 | | | | 27.5 | | | | 3.6 | % |
Business, Building and Other Support Services | | | 21.2 | | | | 22.8 | | | | 19.7 | | | | 20.3 | | | | 17.5 | | | | -4.7 | % |
Educational Services | | | 35.6 | | | | 34.6 | | | | 35.4 | | | | 36.4 | | | | 36.7 | | | | 0.8 | % |
Health Care and Social Assistance | | | 70.6 | | | | 69.8 | | | | 69.2 | | | | 72.4 | | | | 74.9 | | | | 1.5 | % |
Information, Culture, and Recreation | | | 19.7 | | | | 18.4 | | | | 19.2 | | | | 17.5 | | | | 16.2 | | | | -4.8 | % |
Accommodation and Food Services | | | 32.6 | | | | 31.4 | | | | 32.1 | | | | 30.9 | | | | 29.5 | | | | -2.5 | % |
Other Services | | | 20.6 | | | | 19.4 | | | | 18.3 | | | | 17.1 | | | | 19.4 | | | | -1.5 | % |
Public Administration | | | 29.2 | | | | 27.5 | | | | 26.7 | | | | 27 | | | | 27.6 | | | | -1.4 | % |
| | | | | | | | | | | | | | | | | | | | | | | | |
Total - All Industries | | | 457.6 | | | | 452.6 | | | | 447.6 | | | | 448.1 | | | | 446.2 | | | | -0.6 | % |
| | | | | | | | | | | | | | | | | | | | | | | | |
Source: Statistics Canada, Table 282-0008
14
Income and Prices
Household income in Nova Scotia increased 3.2% to $39.9 billion in 2015 from 2014, and average weekly wages in 2015 were $835.01, up 1.8% from the level in 2014.
The following table reflects the percentage increases in average weekly wages and salaries for calendar years 2011 through 2015 as well as the Consumer Price Index (“CPI”) for Nova Scotia and Canada to 2016. On an annual basis in 2016, Nova Scotia’s CPI increased by 1.2% from 2015, while Canada’s CPI increased by 1.4% from 2015.
CPI AND AVERAGE WEEKLY WAGES AND SALARIES, INDUSTRIAL
AGGREGATE (PERCENT INCREASE OVER PREVIOUS YEAR)
| | | | | | | | |
| | | Nova Scotia | | Canada |
| | | Average Weekly
Wages and Salaries | | CPI | | Average Weekly
Wages and Salaries | | CPI |
2011 | | 1.0% | | 3.8% | | 2.5% | | 2.9% |
2012 | | 3.0% | | 2.0% | | 2.5% | | 1.5% |
2013 | | 1.2% | | 1.2% | | 1.8% | | 0.9% |
2014 | | 2.8% | | 1.7% | | 2.6% | | 2.0% |
2015 | | 1.8% | | 0.4% | | 1.8% | | 1.1% |
2016 | | n/a | | 1.2% | | n/a | | 1.4% |
Sources: Statistics Canada, CANSIM Tables 281-0027 and 326-0021.
15
Capital Expenditures
Capital expenditures consist of investment in new construction, and purchases of machinery and equipment in Nova Scotia by the private sector and all levels of government.
The following table sets forth capital expenditures for the 2012 to 2015 calendar years and investment spending intentions for 2016.
CAPITAL EXPENDITURES(1,2)
| | | | | | | | | | | | | | | | | | | | |
| | | 2012 | | | 2013 | | | 2014 | | | 2015(3) | | | 2016(4) | |
| | | (in millions) | |
Agriculture, forestry, and fishing | | | x | | | $ | 106.9 | | | $ | 100.6 | | | $ | 86.9 | | | $ | 80.4 | |
Mining & oil and gas extraction | | | 64.6 | | | | 92.5 | | | | 59.5 | | | | 62.5 | | | | 87.1 | |
Utilities | | | 407.6 | | | | 290.5 | | | | 348.6 | | | | 320.4 | | | | 465.3 | |
Construction | | | 97.0 | | | | 132.6 | | | | 130.6 | | | | 116.8 | | | | 114.7 | |
Manufacturing | | | 209.9 | | | | 335.0 | | | | 441.4 | | | | 209.9 | | | | 208.3 | |
Wholesale trade | | | 56.3 | | | | 111.8 | | | | 104.4 | | | | 81.7 | | | | 78.5 | |
Retail trade | | | 219.0 | | | | 233.7 | | | | 178.8 | | | | 154.3 | | | | 168.5 | |
Transportation & warehousing | | | 239.1 | | | | 326.2 | | | | 300.3 | | | | 348.0 | | | | 381.4 | |
Information & cultural industries | | | 93.7 | | | | 276.1 | | | | 189.8 | | | | 242.3 | | | | 267.7 | |
Finance & insurance(5) | | | 269.9 | | | | x | | | | 37.5 | | | | 50.2 | | | | 46.9 | |
Real estate and rental and lending | | | 227.4 | | | | 235.8 | | | | 305.1 | | | | 275.4 | | | | 226.8 | |
Professional, scientific & technical services | | | x | | | | x | | | | 46.7 | | | | 61.4 | | | | 47.3 | |
Management of companies and enterprises | | | 4.5 | | | | x | | | | 2.7 | | | | 3.0 | | | | 2.6 | |
Administrative support, waste management and remediation services | | | 39.4 | | | | x | | | | x | | | | 26.0 | | | | 38.5 | |
Educational services | | | 289.4 | | | | 283.5 | | | | 187.6 | | | | 152.1 | | | | 156.5 | |
Health care and social assistance | | | 274.9 | | | | 157.9 | | | | 115.6 | | | | 81.9 | | | | F | |
Arts, entertainment and recreation | | | 44.7 | | | | x | | | | 44.4 | | | | 67.3 | | | | 81.2 | |
Accommodation and food services | | | 42.1 | | | | 86.7 | | | | 86.5 | | | | 58.7 | | | | 63.9 | |
Other services (except public administration) | | | 18.5 | | | | x | | | | x | | | | 22.8 | | | | 21.6 | |
Public administration | | | 861.8 | | | | 754.4 | | | | 681.7 | | | | 751.6 | | | | 1,080.9 | |
| | | | | | | | | | | | | | | | | | | | |
Total | | | 3,598.4 | | | | 3,575.4 | | | | 3,423.4 | | | | 3,173.2 | | | | 3,698.9 | |
| | | | | | | | | | | | | | | | | | | | |
Private Sector | | | 2,023.7 | | | | 2,280.6 | | | | 2,302.6 | | | | 1,961.2 | | | | 2,193.7 | |
Public Sector | | | 1,574.7 | | | | 1,294.8 | | | | 1,120.8 | | | | 1,212.0 | | | | 1,505.2 | |
| | | | | | | | | | | | | | | | | | | | |
Total | | | 3,598.4 | | | | 3,575.4 | | | | 3,423.4 | | | | 3,173.2 | | | | 3,698.9 | |
| | | | | | | | | | | | | | | | | | | | |
Construction | | | 2,113.2 | | | | 1,948.2 | | | | 1,786.3 | | | | 1,573.7 | | | | 2,055.8 | |
Machinery and Equipment | | | 1,485.2 | | | | 1,627.3 | | | | 1,637.1 | | | | 1,599.5 | | | | 1,643.0 | |
| | | | | | | | | | | | | | | | | | | | |
Total | | $ | 3,598.4 | | | $ | 3,575.4 | | | $ | 3,423.4 | | | $ | 3,173.2 | | | $ | 3,698.9 | |
| | | | | | | | | | | | | | | | | | | | |
| (1) | Capital Expenditures are classified under the North American Industrial Classification System (“NAICS”), x – suppressed by Statistics Canada to meet the confidentiality requirements of the Statistics Act, F - too unreliable to be published by Statistics Canada |
| (2) | Methodology used to calculate Capital Expenditures was revised in 2015 and adjusted back to 2012. Housing has been excluded in the new methodology since the primary goal of the program is to publish capital expenditures made by private- and public-sector organization. |
| (4) | Investment Intentions. |
| (5) | Commencing with Actual 2013, the data is not comparable with previous years due to new inclusion of capital leases. |
Source: Statistics Canada, CANSIM Tables 029-0045 and 029-0048.
16
According to the “Annual Capital and Repair Expenditures Survey,” capital expenditure intentions showed a 16.6% increase for Nova Scotia in 2016 over 2015, reflecting expectations of increased capital spending in mining, quarrying and oil and gas extraction, utilities, transportation and warehousing, information and cultural industries, and public administration. The increase was partly offset by decreases in real estate and rental and leasing. Capital Expenditures as used in this survey, released in May 2016, is defined as the collection of data on intentions for capital investment and expenditures and does not include housing.
Capital expenditures for 2015 showed a 7.3% decrease compared to 2014. The change reflected a decrease in manufacturing, utilities, real estate and rental and leasing, educational services, and accommodation and food services. Partially offsetting the above increases were increases in transportation and warehousing, information and cultural industries and public administration.
Capital expenditures for 2014 showed a 4.3% decrease compared to 2013. The change reflected a decrease in capital spending in mining, quarrying and oil and gas extraction, retail trade, transportation and warehousing, information and cultural industries, educational services and public administration. The decrease was partially offset by increases in utilities, manufacturing, real estate and rental and leasing.
Capital expenditures for 2013 showed a 0.6% decrease compared to 2012. The change reflected a decrease in capital spending in utilities and public administration. The decrease in capital spending was mostly offset by an increase in mining, quarrying, and oil and gas extraction, construction, manufacturing, wholesale trade, transportation and warehousing, information and cultural industries and accommodation and food services.
Goods Producing Industries
Manufacturing. The manufacturing industry is the largest contributor to the goods producing portion of Nova Scotia’s economy and accounted for 7.9% of real GDP (basic prices in chained 2007 dollars) in 2015. The gross selling value of manufacturing sales for Nova Scotia in the years 2011, 2012, 2013, 2014 and 2015 were as follows: $10,631 million, $10,460 million, $9,426 million, $7,293 million, and $7,795 million, a compounded annual rate of decrease of 7.5% over the period. This compares with an increase of 1.8% for Canada over the same period. In 2015, over 60% of manufacturing sales were from the food, plastics and rubber products and paper and wood products subsectors.
The employment level in the manufacturing sector in 2015 was 28,700, a decrease of 1,200 persons compared to 2014. The manufacturing sector employed 6.4% of all workers in Nova Scotia in 2015, compared to 9.5% in Canada. Most of the employment in the manufacturing sector occurs outside of the province’s largest urban center (Halifax Regional Municipality) making the sector directly and indirectly a key employer in many of the more rural areas of the Province.
The United States is the primary market for Nova Scotia’s international domestic exports of manufactured goods. In 2015, $2.8 billion or 70.5% of the value of Nova Scotia’s international exports of manufactured goods went to the United States.
Construction. The construction industry is the second largest goods-producing industry in Nova Scotia. Its contribution to real GDP (basic prices in chained 2007 dollars) was $1,557.0 million in 2015 and accounted for 4.8% of total real GDP. Construction activity accounted for 49.6% of total capital expenditures in 2015. Compounded annually capital expenditures on construction in Nova Scotia decreased 8.2% for the 2011 to 2015 period, as compared to a 2.1% increase for Canada.
Nova Scotia’s investment in residential structures increased by 7.2% in 2015. In preliminary data from January 2016 to September 2016, there has been a decrease in renovation activity, which typically accounts for approximately 60% of Nova Scotia’s residential construction investment. From January 2016 to September 2016, investment in new housing construction has been relatively stable, falling by just 0.6%. However, renovation expenditures for such period totaled $810 million, a decline of $185 million or 18.6% from the same period in 2015.
Canada Mortgage and Housing Corporation reported that housing starts in all areas of Nova Scotia increased by 25.2% in 2015 from 2014, compared to an increase of 3.3% at the national level over the same period. In 2016, housing starts in Nova Scotia declined by 1.5% compared to levels in 2015. There was an increase of 1.2% in housing starts in 2015 over 2016 at the national level.
17
The Federal government’s new mortgage policies will expand the use and stringency of stress tests in mortgage insurance and elevate insurance criteria for low-ratio mortgages/mortgage loans that constitute greater than 80% of the value of a home.
These Federal regulatory changes were directed at housing markets in Toronto and Vancouver. It is not clear that the Federal changes will have an impact on Nova Scotia homebuyers, especially those who would consider purchasing newly-built dwellings.
Although Federal government policy can have an impact on housing markets through restrictions in mortgage financing, the recent performance of the Province’s housing sector is more likely attributable to longer-term demographic trends and a shift of the market away from single-detached dwellings to multi-unit apartments.
Housing price growth in Halifax has been variable from year to year but generally flat since 2012. The Royal Bank of Canada’s measure of housing affordability shows Halifax to be one of the most affordable of the major cities in Canada suggesting that new mortgage rules may not impair housing affordability in the Halifax market.
Overall residential activity in Nova Scotia has slowed over the past decade. Nova Scotia’s aging demographics has driven a shift in demand away from single-detached housing toward multiple-unit construction intended for the rental market. Housing starts outpaced the relatively slow population growth and household formation rates in the Province over the past five years. Most of the construction has been in Halifax where population growth rates have been higher.
HOUSING STARTS, ALL AREAS, NOVA SCOTIA
| | | | | | | | | | | | | | | | | | | | |
| | | 2012 | | | 2013 | | | 2014 | | | 2015 | | | 2016 | |
Single-detached | | | 2,258 | | | | 1,639 | | | | 1,355 | | | | 1,350 | | | | 1,656 | |
Multiples. | | | 2,264 | | | | 2,280 | | | | 1,701 | | | | 2,475 | | | | 2,111 | |
Semi-detached | | | 420 | | | | 332 | | | | 220 | | | | 259 | | | | 318 | |
Row | | | 218 | | | | 259 | | | | 179 | | | | 129 | | | | 144 | |
Apartment and other unit type | | | 1,626 | | | | 1,689 | | | | 1,302 | | | | 2,087 | | | | 1,649 | |
| | | | | | | | | | | | | | | | | | | | |
Total units | | | 4,522 | | | | 3,919 | | | | 3,056 | | | | 3,825 | | | | 3,767 | |
| | | | | | | | | | | | | | | | | | | | |
Source: Statistics Canada, CANSIM Tables 027-0008.
Employment in the construction sector during 2015 was 33,600, a decrease of 400 persons from levels in 2014.
Fisheries. A large and diverse commercial fish and processing industry exists in Nova Scotia. Nova Scotia harvests over 50 different species of seafood, and exports these products to all major seafood markets. The Federal Government, through detailed stock assessment plans and quotas, manages fisheries resources. The primary fishing sector contributed $484.7 million (in chained 2007 dollars) to the Provinces’ GDP in 2015, an increase of 5.6% from 2014 levels.
The value of Nova Scotia’s fish landings for 2015 has not been released by the Federal Department of Fisheries and Oceans. Nova Scotia’s fish landings had a value of $1,030.3 million in 2014, and total volume of commercial fish landings increased by 8.7% in 2014 compared to the level in 2013. The impact of fishing on the province’s GDP is also seen in the manufacturing segment, which includes fish processing. Lobster is the predominant species and represented 53.7% of the total landed value in 2014. Scallop, Queen Crab, and Shrimp were the next predominant species in 2014 at 15.7%, 10.8%, and 7.1% respectively.
18
Nova Scotia was the largest exporter of fresh and processed seafood in 2015 among all provinces, at $1,685.4 million. The United States is Nova Scotia’s top destination, representing 56.7% of fresh and processed seafood exports in 2015. Nova Scotia exports to over 70 countries including China, Japan, South Korea, United Kingdom, Denmark, Hong Kong and France. The export value of seafood in 2015 increased by 27.8% compared to the total value in 2014.
The harvesting sector employed 5,500 persons throughout all of Nova Scotia in 2015, an increase of approximately 400 persons from 2014.
The following table sets forth information with respect to the fishing and fish processing industry in Nova Scotia for the calendar years 2011 through 2015.
FISHING AND FISH PROCESSING INDUSTRY
| | | | | | | | | | | | | | | | | | | | |
| | | 2011 | | | 2012 | | | 2013 | | | 2014 | | | 2015 | |
| | | (in Millions) | |
Value of Fish Landings | | $ | 732.0 | | | $ | 768.5 | | | $ | 844.7 | | | $ | 1,046.7 | | | $ | 1.211.5 | (1) |
(1)Capital Investment (2) | | $ | 29.4 | | | $ | 51.1 | | | | n/a | (3) | | | n/a | (3) | | $ | 16.0 | |
Value of Exports of fresh and processed fish | | $ | 907.3 | | | $ | 922.3 | | | $ | 1,052.7 | | | $ | 1,265.8 | | | $ | 1,685.4 | |
Lobster, fresh or frozen | | | 355.0 | | | | 362.9 | | | | 422.9 | | | | 549.2 | | | | 845.1 | |
Scallops, fresh or frozen | | | 105.3 | | | | 98.1 | | | | 130.5 | | | | 163.0 | | | | 168.7 | |
Crab, frozen | | | 117.3 | | | | 132.0 | | | | 139.0 | | | | 167.2 | | | | 179.1 | |
Shrimp, frozen | | | 0.0 | | | | 75.8 | | | | 102.7 | | | | 109.5 | | | | 128.1 | |
| (2) | Includes fishing, hunting, and trapping. |
| (3) | Information has either been deemed too unreliable to be published or identified to be used with caution. |
| Sources: | Department of Fisheries and Oceans, Industry Canada, and Nova Scotia Department of Agriculture and Fisheries. Statistics Canada, CANSIM Table 029-0045, Table 980-0003 |
Mining and Mineral Exploration The value of mineral production (excluding oil and gas) in Nova Scotia increased by 7.4% to $212.3 million in 2015 from 2014 levels. The major minerals reported being produced in Nova Scotia in 2015 were crushed stone, sand and gravel. Nova Scotia’s gypsum and anhydrite deposits have been reported to be among the largest workable deposits in Canada. Gypsum outcrops occur throughout the whole of the northern half of the province’s mainland and Cape Breton Island. Gypsum data has been suppressed by Natural Resources Canada for confidentiality reasons. However, according to 2012 statistics, Nova Scotia produced about 65% of gypsum for all of Canada.
Real GDP in the sector, including the oil and gas sector, decreased by 20.9% in 2015 from 2014. The industry, including the oil and gas sector, employed 4,000 persons in 2015. In August of 2013 a new oil platform called Deep Panuke started production and ramped up significantly by early 2014. This contributed an 87.0% increase in total gas equivalent volume of production in 2014. Natural gas production from the Deep Panuke project declined significantly in 2015 as the project produced on a seasonal basis.
There are currently two surface coal mines operating in Nova Scotia, at Stellarton and Point Aconi, operated by Pioneer Coal. Production information on the sector is currently unavailable due to confidentiality requirements of Statistics Canada.
Agriculture Real GDP in 2015 in the crop and animal production sector increased by 6.7% compared to 2014. Total farm cash receipts in 2015 increased by 1.4%, comprised of a rise in crop receipts of 1.1%, an increase in the receipts for livestock production of 10.6%, offset by a decline of 76.2% in total receipts from direct payments (these are primarily government support payments and crop insurance). The number of people employed in the agricultural sector stood at 5,400 persons in 2015, an increase of about 200 from 2014. The major components of agricultural production in Nova Scotia include dairy products, fruit, livestock, field vegetables, eggs and furs.
19
Forestry In 2015, the value of manufacturing shipments for wood products was $408.9 million, a increase of 4.6% from 2014. The forestry logging and logging support sector employed 2,400 workers in 2015, up over 2,100 in 2014. In 2015, the total provincial harvest of round wood was 3,748,685 cubic meters, an increase of 2.9% over 2014. Of this amount, 177,011 cubic meters or 5.0% was exported.
Lumber shipments in 2015 were suppressed by Statistics Canada due to confidentially reasons. Export sales of lumber and wood product increased 2.9% in 2015 over 2014. The largest export destination for forestry products is the United States (50.1% in 2015), and exports to the US increased by 1.7% in 2015 compared to 2014. In 2015, export sales for pulp and paper products were up 3.5% over 2014.
Since the 1980s, the U.S. and Canada have reached four agreements regarding softwood lumber exports, with the most recent agreement (including a grace period) expiring in the fall of 2016. As most wood in Atlantic Canada is cut on land owned by private business instead of land owned by the government, the latter being the case in the rest of the country, the U.S. lumber industry has not seen the softwood lumber exported from Nova Scotia as an unfairly subsidized resource. As a result, softwood exported from Nova Scotia has been exempted from tariffs in the past four softwood lumber agreements. However, with the expiration of the most recent softwood lumber agreement between Canada and the U.S., the Province cannot be certain whether any new tariffs imposed by the U.S would have a material adverse effect on exports of softwood lumber from the Province to U.S. markets.
Exports
The total value of exports of goods and services from Nova Scotia in 2015, under Statistics Canada’s Provincial Economic Accounts data system, stood at $15,940 million, giving an annual compound growth rate of 0.9% over the 2011 to 2015 period. The value of exports of goods and services represented 39.6% of the total value of GDP in 2015.
Of the $15,940 million in exports of goods and services, 46.4%, or $7,390 million, was shipped to other countries, leaving 53.6% or $8,550 million as exports to other provinces within Canada. Exports of goods accounted for 61.7% of the total exports while exports of services accounted for 38.3%. Most of the goods are exported to other countries (58.7%), while services are mostly exported to other provinces (73.6%).
Over the 2011 to 2015 period, the total value of exports of goods had an annual compound growth rate of -0.1% compared to a growth rate of 2.7% for the total value of export of services.
Statistics Canada reports in their Provincial Economic Accounts that the total value of international exports of goods in 2015 was $5,776 million, experiencing an annual compound growth rate of 0.4% since 2011. The Provincial Economic Accounts figure can be contrasted with Nova Scotia’s international merchandise domestic exports of goods based on customs clearing data that amounted to $5,389.7 million in 2015. The Provincial Economic Accounts adjusts the customs data for other costs such as transportation margins and duties. Additionally, “domestic” international exports do not include exports from the Province that originated outside the Province. During the years 2011, 2012, 2013, 2014 and 2015 the average Canadian dollar/US dollar noon exchange rate, according to the Bank of Canada, was $0.9891, $0.9996, $1.0299, $1.1045 and $1.2785 Canadian dollars per one US dollar respectively.
For 2015, the customs total merchandise export figures show an increase of 2.4% over 2014, principally due to an increase of 38.4% in exports from the fishing industry (primarily due to an almost 50% increase in the value of lobster exports) and 27.8% increase from the seafood product and packaging industry, partially offset by a 68.5% decline in exports from the oil and gas industry. The latter is the result of the decline in natural gas production, primarily from the Deep Panuke field.
20
The following table sets forth categories of Selected Trade indicators for the calendar years 2011 through 2015.
SELECTED TRADE INDICATORS
| | | | | | | | | | | | | | | | | | | | |
| | | 2011 | | | 2012 | | | 2013 | | | 2014 | | | 2015 | |
| | | (In millions $) | |
Exports of goods to other countries | | $ | 5,868 | | | $ | 5,727 | | | $ | 5,250 | | | $ | 5,580 | | | $ | 5,776 | |
Export of services to other countries | | | 1,379 | | | | 1,427 | | | | 1,468 | | | | 1,564 | | | | 1,614 | |
| | | | | | | | | | | | | | | | | | | | |
Exports to other countries | | | 7,247 | | | | 7,154 | | | | 6,718 | | | | 7,144 | | | | 7,390 | |
| | | | | | | | | | | | | | | | | | | | |
Exports of goods to other provinces | | | 4,024 | | | | 4,036 | | | | 4,262 | | | | 4,003 | | | | 4,058 | |
Export of services to other provinces | | | 4,118 | | | | 4,007 | | | | 4,246 | | | | 4,391 | | | | 4,492 | |
| | | | | | | | | | | | | | | | | | | | |
Exports to other provinces | | | 8,142 | | | | 8,043 | | | | 8,508 | | | | 8,394 | | | | 8,550 | |
| | | | | | | | | | | | | | | | | | | | |
Total Exports of goods and services: | | | 15,389 | | | | 15,197 | | | | 15,226 | | | | 15,538 | | | | 15,940 | |
| | | | | | | | | | | | | | | | | | | | |
Imports of goods from other countries | | | 11,006 | | | | 10,506 | | | | 10,979 | | | | 11,092 | | | | 11,535 | |
Import of services from other countries | | | 1,374 | | | | 1,444 | | | | 1,532 | | | | 1,565 | | | | 1,624 | |
| | | | | | | | | | | | | | | | | | | | |
Imports from other countries | | | 12,380 | | | | 11,950 | | | | 12,511 | | | | 12,657 | | | | 13,159 | |
| | | | | | | | | | | | | | | | | | | | |
Imports of goods from other provinces | | | 5,837 | | | | 5,859 | | | | 5,963 | | | | 5,689 | | | | 5,552 | |
Imports of services from other provinces | | | 7,768 | | | | 7,809 | | | | 7,970 | | | | 8,204 | | | | 8,489 | |
| | | | | | | | | | | | | | | | | | | | |
Imports from other provinces | | | 13,605 | | | | 13,668 | | | | 13,933 | | | | 13,893 | | | | 14,041 | |
| | | | | | | | | | | | | | | | | | | | |
Total Imports of goods and services: | | | 25,985 | | | | 25,618 | | | | 26,444 | | | | 26,550 | | | | 27,200 | |
| | | | | | | | | | | | | | | | | | | | |
Trade Balance | | | (10,596) | | | | (10,421) | | | | (11,218) | | | | (11,012) | | | | (11,260) | |
| | | | | | | | | | | | | | | | | | | | |
Source: Statistics Canada, CANSIM Tables 384-0038
21
The following two tables sets forth Nova Scotia’s top international merchandise exports by industry and the top imports by product for the calendar years 2011 through 2015, and the compound annual growth rate over the 2011 to 2015 period.
INTERNATIONAL MERCHANDISE EXPORTS BY INDUSTRY
| | | | | | | | | | | | | | | | | | | | | | | | |
| | | 2011 | | | 2012 | | | 2013 | | | 2014 | | | 2015 | | | Compound
Annual Rate
of Growth | |
| | | | | | | | | | | | | | | | | | | | | | | | |
| | | | | | (in millions) | | | | | | | | | | |
Tire Manufacturing | | $ | 1,023.5 | | | $ | 1,028.1 | | | $ | 1,002.7 | | | $ | 1,087.8 | | | $ | 1,182.5 | | | | 3.7 | % |
Fishing | | | 437.4 | | | | 432.9 | | | | 507.0 | | | | 639.3 | | | | 885.2 | | | | 19.3 | % |
Seafood Product Preparation and Packaging | | | 469.9 | | | | 489.4 | | | | 545.7 | | | | 626.6 | | | | 800.8 | | | | 14.3 | % |
Paper Mills | | | 441.8 | | | | 111.7 | | | | 294.7 | | | | 289.6 | | | | 287.0 | | | | (10.2 | %) |
Pulp Mills | | | 161.3 | | | | 164.9 | | | | 201.1 | | | | 221.1 | | | | 241.5 | | | | 10.6 | % |
Oil and Gas Extraction | | | 363.6 | | | | 65.5 | | | | 118.7 | | | | 695.0 | | | | 218.9 | | | | (11.9 | %) |
Frozen Food Manufacturing | | | 143.3 | | | | 120.8 | | | | 115.2 | | | | 123.4 | | | | 130.5 | | | | (2.3 | %) |
Sawmills and Wood Preservation | | | 81.8 | | | | 80.9 | | | | 99.7 | | | | 118.7 | | | | 107.0 | | | | 6.9 | % |
Other Rubber Product Manufacturing | | | 51.8 | | | | 66.0 | | | | 91.7 | | | | 116.0 | | | | 84.5 | | | | 13.0 | % |
Unsupported Plastic Film, Sheet, and Bag Manufacturing | | | 84.2 | | | | 88.3 | | | | 94.9 | | | | 107.2 | | | | 108.3 | | | | 6.5 | % |
| | | | | | | | | | | | | | | | | | | | | | | | |
Sub-total | | | 3,258.6 | | | | 2,648.5 | | | | 3,071.4 | | | | 4,024.6 | | | | 4,046.2 | | | | 5.6 | % |
| | | | | | | | | | | | | | | | | | | | | | | | |
Other | | | 1,201.7 | | | | 1,244.2 | | | | 1,320.6 | | | | 1,342.1 | | | | 1,448.3 | | | | 4.8 | % |
| | | | | | | | | | | | | | | | | | | | | | | | |
Grand total | | $ | 4,460.3 | | | $ | 3,892.7 | | | $ | 4,392.0 | | | $ | 5,366.6 | | | $ | 5,494.6 | | | | 5.3 | % |
| | | | | | | | | | | | | | | | | | | | | | | | |
Source: Industry Canada.
INTERNATIONAL MERCHANDISE IMPORTS BY PRODUCT
| | | | | | | | | | | | | | | | | | | | | | | | |
| | | 2011 | | | 2012 | | | 2013 | | | 2014 | | | 2015 | | | Compound
Annual Rate
of Growth | |
| | | | | | | | | | | | | | | | | | | | | | | | |
| | | | | | (in millions) | | | | | | | | | | |
Motor Vehicles For Passenger Transport | | $ | 2,470.7 | | | $ | 2,555.1 | | | $ | 2,600.2 | | | $ | 2,965.5 | | | $ | 3,196.2 | | | | 6.6 | % |
Preparations of non-crude petroleum oils | | | 165.6 | | | | 116.6 | | | | 284.2 | | | | 1,402.2 | | | | 1,303.2 | | | | 67.5 | % |
Coal & Solid Fuels Manufactured from Coal | | | 189.0 | | | | 143.0 | | | | 193.2 | | | | 161.9 | | | | 171.3 | | | | (2.4 | %) |
Trucks and Other Vehicles for Transport of Goods | | | 126.9 | | | | 114.1 | | | | 111.4 | | | | 150.9 | | | | 188.8 | | | | 10.4 | % |
Natural Rubber; Balata, Gutta-Percha, Guayule, Chicle and Similar Natural Gums | | | 332.6 | | | | 217.5 | | | | 173.0 | | | | 139.5 | | | | 123.4 | | | | (22.0 | %) |
Helicopters, Airplanes and Spacecraft | | | 10.4 | | | | 72.1 | | | | 2.4 | | | | 134.2 | | | | 317.2 | | | | 135.0 | % |
Motor Vehicle for Special (Non-Transport) Purposes | | | 51.6 | | | | 63.9 | | | | 115.3 | | | | 92.3 | | | | 76.0 | | | | 10.2 | % |
Fish Fillets and Other Fish Meat – Fresh, Chilled or Frozen | | | 87.8 | | | | 69.4 | | | | 71.1 | | | | 89.7 | | | | 88.2 | | | | 0.1 | % |
Self-Propelled Bulldozers, Scrapers, Graders, Levelers and the like | | | 83.3 | | | | 92.5 | | | | 58.0 | | | | 75.8 | | | | 82.9 | | | | (0.1 | %) |
Crude Petroleum | | | 1,502.0 | | | | 836.6 | | | | 96.4 | | | | 7.0 | | | | 43.8 | | | | (58.7 | %) |
| | | | | | | | | | | | | | | | | | | | | | | | |
Sub-Total | | | 5,020.0 | | | | 4,280.9 | | | | 3,705.2 | | | | 5,219.1 | | | | 5,590.9 | | | | 2.7 | % |
| | | | | | | | | | | | | | | | | | | | | | | | |
Other | | | 3,332.3 | | | | 2,349.6 | | | | 2,313.9 | | | | 2,588.7 | | | | 2,700.2 | | | | (5.1 | %) |
| | | | | | | | | | | | | | | | | | | | | | | | |
Grand Total | | $ | 8,352.2 | | | $ | 6,630.6 | | | $ | 6,019.1 | | | $ | 7,807.7 | | | $ | 8,291.2 | | | | (0.2 | %) |
| | | | | | | | | | | | | | | | | | | | | | | | |
Source: Industry Canada.
22
Merchandise imports by commodity are assessed based on their port of clearance, rather than their intended destination in Canada (or beyond). Of note in the table on imports into Nova Scotia by product grouping is the large amount of motor vehicle for passenger transport. Most of these vehicles arrive from Europe, and are then shipped across Canada.
The following tables show top export destinations and import sources. The ranking for the top countries is based on their value in 2015, but the same countries are shown for all five years.
INTERNATIONAL MERCHANDISE EXPORTS BY TOP 10 COUNTRIES
| | | | | | | | | | | | | | | | | | | | |
| | | 2011 | | | 2012 | | | 2013 | | | 2014 | | | 2015 | |
| | | | | | (in millions) | | | | | | | |
United States | | $ | 3,246.9 | | | $ | 2,780.0 | | | $ | 3,071.6 | | | $ | 3,865,2 | | | $ | 3,787.0 | |
China | | | 114.0 | | | | 149,6 | | | | 197.3 | | | | 275.6 | | | | 420.3 | |
United Kingdom | | | 86.2 | | | | 70.1 | | | | 68.9 | | | | 86.6 | | | | 103.1 | |
France (incl. Monaco, French Antilles) | | | 93.0 | | | | 80.9 | | | | 68.5 | | | | 75.9 | | | | 84.3 | |
Netherlands | | | 79.9 | | | | 59.4 | | | | 46.4 | | | | 86.2 | | | | 81.3 | |
Japan | | | 77.4 | | | | 74.5 | | | | 72.5 | | | | 79.4 | | | | 78.1 | |
Turkey | | | 14.4 | | | | 26.7 | | | | 50.5 | | | | 18.3 | | | | 68.0 | |
Mexico | | | 29.6 | | | | 31.3 | | | | 35.1 | | | | 46.6 | | | | 66.3 | |
Korea, South | | | 32.9 | | | | 35.1 | | | | 37.6 | | | | 57.8 | | | | 65.3 | |
Hong Kong | | | 45.8 | | | | 41.6 | | | | 36.1 | | | | 45.6 | | | | 59.1 | |
| | | | | | | | | | | | | | | | | | | | |
Sub-total | | | 3,820.2 | | | | 3,349.2 | | | | 3,684.5 | | | | 4,637.4 | | | | 4,812.8 | |
| | | | | | | | | | | | | | | | | | | | |
Other | | | 574.3 | | | | 485.3 | | | | 639.3 | | | | 652.1 | | | | 576.9 | |
| | | | | | | | | | | | | | | | | | | | |
Total All Countries(1) | | $ | 4,394.5 | | | $ | 3,834.5 | | | $ | 4,323.9 | | | $ | 5,289.5 | | | $ | 5,389.7 | |
| | | | | | | | | | | | | | | | | | | | |
Source: Industry Canada.
INTERNATIONAL MERCHANDISE IMPORTS BY TOP 10 COUNTRIES(1)
| | | | | | | | | | | | | | | | | | | | |
| | | 2011 | | | 2012 | | | 2013 | | | 2014 | | | 2015 | |
| | | | | (in millions) | | | | | | | |
Germany | | $ | 2,209.3 | | | $ | 2,312.2 | | | $ | 2,388.6 | | | $ | 2,389.8 | | | $ | 2,697.9 | |
United States | | | 386.6 | | | | 461.4 | | | | 564.5 | | | | 1,849.2 | | | | 1,618.7 | |
United Kingdom | | | 484.9 | | | | 588.9 | | | | 587.1 | | | | 769.8 | | | | 847.9 | |
Cuba | | | 688.3 | | | | 525.3 | | | | 470.1 | | | | 533.9 | | | | 492.6 | |
China | | | 292.8 | | | | 244.8 | | | | 262.6 | | | | 291.4 | | | | 318.2 | |
Indonesia | | | 181.6 | | | | 113.7 | | | | 104.6 | | | | 143.4 | | | | 208.1 | |
Sweden | | | 208.2 | | | | 198.2 | | | | 165.1 | | | | 198.4 | | | | 203.9 | |
Russia | | | 161.7 | | | | 18.0 | | | | 14.2 | | | | 17.0 | | | | 158.3 | |
Colombia | | | 255.4 | | | | 123.8 | | | | 113.3 | | | | 90.5 | | | | 131.4 | |
South Africa | | | 77.1 | | | | 19.6 | | | | 15.6 | | | | 130.2 | | | | 130.6 | |
| | | | | | | | | | | | | | | | | | | | |
Sub-total | | | 4,945,9 | | | | 4,605.9 | | | | 4,685.6 | | | | 6,413.5 | | | | 6,807.6 | |
| | | | | | | | | | | | | | | | | | | | |
Other | | | 3,406.4 | | | | 2,024.7 | | | | 1,333.5 | | | | 1,394.2 | | | | 1,483.6 | |
| | | | | | | | | | | | | | | | | | | | |
Total All Countries | | $ | 8,352.2 | | | $ | 6,630.6 | | | $ | 6,019.0 | | | $ | 7,807.7 | | | $ | 8,291.1 | |
| | | | | | | | | | | | | | | | | | | | |
Source: Industry Canada.
| (1) | Merchandise trade data on a customs basis reports imports based on their province of clearance. Much of the value of goods cleared at Nova Scotia ports is not in fact destined for Nova Scotia customers and as such does not reflect the nature of economic relationship between the Province and the countries listed as major import sources. For example, Halifax has a significant auto port at which a large number of high valued cars from Germany (and elsewhere in Europe) are cleared, loaded onto trains and shipped elsewhere in North America. |
23
The new U.S. Administration has announced its intention to renegotiate the North American Free Trade Agreement (“NAFTA”) with Canada and Mexico. The form and extent of the renegotiations of NAFTA are uncertain at this time. Consequently, it is unclear how this would impact Nova Scotia’s trade with the U.S.
The Comprehensive Economic and Trade Agreement with the European Union (CETA) is slated for implementation in 2017. The removal of most tariff lines from European Union imports from Canada is anticipated to make Canadian goods more competitively priced in European markets.
After the United States, the European Union is the second largest destination of Nova Scotia goods exports. The bulk of Nova Scotia exports to European Union destinations are fish and agricultural products as well as aerospace parts.
Service Sector
Overview. The Halifax metropolitan area is the largest financial and commercial service center in Atlantic Canada. The area is also one of Canada’s major medical and scientific communities, and the location of several federally sponsored scientific research institutions, including the Bedford Institute of Oceanography. The Halifax region is also home to several universities as it is a major education center for Atlantic Canada.
The Halifax region accounted for 50.0% of the total employment in Nova Scotia in 2015 producing an unemployment rate of 6.3% for 2015 compared to the 8.6% unemployment rate for the Province as a whole, and a 6.9% unemployment rate for Canada.
The following table sets forth the percentage contribution to the GDP for the service sector by component for the calendar years 2011 through 2015.
SERVICE INDUSTRIES AS A PERCENTAGE OF TOTAL SERVICE PRODUCING INDUSTRIES
| | | | | | | | | | | | | | | | | | | | |
| | | 2011 | | | 2012 | | | 2013 | | | 2014 | | | 2015 | |
Transportation and Warehousing (1) | | | 4.4 | % | | | 4.2 | % | | | 4.2 | % | | | 4.2 | % | | | 4.2 | % |
Wholesale Trade | | | 5.5 | % | | | 5.2 | % | | | 5.4 | % | | | 5.4 | % | | | 5.4 | % |
Retail Trade | | | 8.6 | % | | | 8.5 | % | | | 8.7 | % | | | 8.8 | % | | | 8.7 | % |
Finance and Insurance | | | 7.0 | % | | | 7.1 | % | | | 7.0 | % | | | 7.0 | % | | | 7.1 | % |
Real Estate, rental and leasing | | | 19.2 | % | | | 19.7 | % | | | 20.1 | % | | | 20.4 | % | | | 20.5 | % |
Management of Companies | | | 0.5 | % | | | 0.6 | % | | | 0.6 | % | | | 0.6 | % | | | 0.5 | % |
Professional , scientific and technical services | | | 5.1 | % | | | 5.1 | % | | | 5.3 | % | | | 5.3 | % | | | 5.3 | % |
Administrative and support, waste management and remediation services | | | 2.7 | % | | | 2.7 | % | | | 2.6 | % | | | 2.6 | % | | | 2.5 | % |
Information and Cultural Industries | | | 4.2 | % | | | 4.2 | % | | | 4.2 | % | | | 4.1 | % | | | 4.0 | % |
Education Services | | | 8.7 | % | | | 8.7 | % | | | 8.6 | % | | | 8.5 | % | | | 8.5 | % |
Health Care and Social Assistance | | | 12.1 | % | | | 12.1 | % | | | 12.2 | % | | | 12.2 | % | | | 12.3 | % |
Accommodation and Food Services | | | 3.0 | % | | | 3.0 | % | | | 3.0 | % | | | 3.0 | % | | | 3.0 | % |
Arts, entertainment, and recreation | | | 0.7 | % | | | 0.7 | % | | | 0.7 | % | | | 0.6 | % | | | 0.7 | % |
Other Services (except Public Administration) | | | 2.6 | % | | | 2.5 | % | | | 2.5 | % | | | 2.5 | % | | | 2.5 | % |
Public Administration | | | 15.8 | % | | | 15.5 | % | | | 15.1 | % | | | 14.9 | % | | | 14.8 | % |
Total (2) | | | 100.0 | % | | | 100.0 | % | | | 100.0 | % | | | 100.0 | % | | | 100.0 | % |
| | | | | | | | | | | | | | | | | | | | |
| (1) | Includes Pipeline Transportation – See “Offshore Exploration and Development”. |
| (2) | Numbers may not add up due to rounding. |
Source: Statistics Canada, CANSIM Table 379-0030.
24
Trade. In 2015, wholesale merchants’ sales increased 4.6% and retail sales decreased by 0.6% respectively in Nova Scotia compared to an increase of 3.7% and 1.7% respectively in Canada over 2014. The value of retail sales in 2015 in Nova Scotia was $13.8 billion. The compound annual rate of growth in retail sales was 1.4% in Nova Scotia and 3.0% in Canada during the 2011 to 2015 period. Employment in the wholesale sector and retail sector stood at 11,900 and 59,900 persons respectively in 2015. This represents a decrease of approximately 1,300 persons in the wholesale sector and a decrease of 800 persons in the retail sector compared to 2014.
The value of wholesale merchants’ sales was $9.2 billion in 2015, an increase of 4.6% compared to 2014. In 2015, the wholesale sector had a real GDP positive rate of change of 1.8%. The combined wholesale and retail trade sector accounts for 11.4% of the total value of real GDP at basic prices for the Province.
Transportation and Warehousing. Transportation and warehousing have been important factors in the economy of Nova Scotia throughout its history. Halifax harbor and the Strait of Canso are deep-water, ice-free harbors. The Port of Halifax is capable of handling vessels up to 150,000 metric tonnes, and the Strait of Canso can accommodate the world’s largest super-tankers.
The sector’s real GDP (chained 2007 dollars) in 2015 increased by 3.1% from 2014. In 2015, the sector employed about 20,500 persons, a decrease of 400 from 2014.
Port facilities at Halifax include 35 deep-water berths that are complemented by rail, air, and motor freight services. With two container terminals, each capable of berthing two container ships simultaneously, Halifax is Canada’s fourth largest container port and is capable of handling fully laden Post-Panamax vessels. Halifax’s south end container terminal is undergoing a project to simultaneously berth and service two post-Panamax vessels. The total volume of cargo handled by the Port of Halifax in 2015 was 7.6 million metric tonnes. In 2015, containerized cargo tonnage amounted for 3.4 million metric tonnes. Non-containerized cargo accounted for approximately 4.1 million metric tonnes. Non-containerized cargo consists of Bulk cargo (chiefly consisting of petroleum products and gypsum), Ro/Ro (roll-on/roll-off) and break-bulk. This port serves as a trans-shipment point for automobile distribution throughout Atlantic Canada via ship and rail. The Port of Halifax had visitation by 141 cruise vessels in 2015 with 222,309 passengers.
Tourism. Due to a methodology change in 2013, total visitation and origin results may not be directly comparable with prior years. Approximately 2.1 million tourists visited Nova Scotia during 2015. Overall in 2015, the majority of visitors, 86.7%, came from other parts of Canada, 9.4% from the United States, and 3.9% from overseas. About 69.5% of visitors to Nova Scotia travelled by road with the remaining 30.5% arriving by air.
Energy
There was one petroleum refinery operating in Nova Scotia, but it closed operations in October 2013. Crude oil for the refinery was obtained from foreign sources.
Nova Scotia is not currently a substantial oil producer. Natural gas production in Nova Scotia is from two developments: the Sable Offshore Energy Project and the Deep Panuke development. Both of these fields are beyond their peak of production and their output is declining, which is not as a result of the decline in oil prices.
The more substantial effect of lower oil prices has been on the Nova Scotia’s international trade. With lower oil prices since 2014, the Canadian dollar has depreciated significantly against the U.S. dollar since early 2013, and, in combination with rising domestic spending in the U.S. has provided support to Nova Scotia’s international exports, with the exception of energy products.
Household final consumption expenditures in Nova Scotia measured in current dollars increased by 1.3% in 2015 largely as expenditures on gas and other fuels fell by over $400 million at current prices, but was relatively unchanged in volume terms.
The majority of electricity generated in Nova Scotia is from coal and oil-fired facilities. Overall total electricity production from utilities and independent power producers in Nova Scotia for 2015 was 10,219 gigawatt hours, a 4.0% decrease in production from 2014. Total hydro, tidal, wind and solar generation was 1,829 gigawatt hours, a 3.4% decrease over 2014. The Province of Nova Scotia’s regulations require that nearly 25 per cent of the
25
province’s electricity supply come from renewable sources (wind, solar, tidal and biomass technology) in 2015, and has a target of 40% renewable electricity by 2020. The Province achieved the 2015 target, with the actual figure being 26.6 per cent as reported by Nova Scotia Power.
ELECTRIC POWER GENERATION(MEGAWATT HOURS)
| | | | | | | | | | | | | | | | | | | | |
| | | 2011 | | | 2012 | | | 2013 | | | 2014 | | | 2015 | |
Hydro, Tidal, Wind, Solar and other | | | 1,919,584 | | | | 1,677,398 | | | | 1,784,229 | | | | 1,892,847 | | | | 1,829,109 | |
Thermal generation | | | 9,694,464 | | | | 9,428,660 | | | | 8,985,526 | | | | 8,748,063 | | | | 8,389,935 | |
| | | | | | | | | | | | | | | | | | | | |
Total | | | 11,614,048 | | | | 11,106,058 | | | | 10,769,755 | | | | 10,640,910 | | | | 10,219,044 | |
| | | | | | | | | | | | | | | | | | | | |
Source: Statistics Canada, CANSIM Table 127-0007
Offshore Exploration and Development
Since the beginning of exploration activity in the late 1960’s, substantial gas reserves and modest oil reserves have been discovered, including the six fields that are part of the Sable Offshore Energy Project (“SOEP”), and also the Deep Panuke Project. As of January 17, 2017, there were 4,183,457 hectares of land in the offshore region under active exploration licenses, 76,680 hectares under significant discovery licenses and 39,441 hectares under production licenses. Since April 4, 2013, there have been no changes to significant discoveries licenses or to production licenses. SOEP’s cumulative expenditures in Canada up to December 31, 2015 on development and operations have been $4,060.2 million; 68.8% of this amount was spent in Nova Scotia.
SOEP is a natural gas project located on the Scotia Shelf that commenced production on December 31, 1999. SOEP’s natural gas production averaged 126.6 mmcf/d in 2016. The Sable Offshore Energy Project is divided into two ‘tiers’ of offshore development. The first tier was completed in December 1999 and involved the development of the Thebaud, North Triumph, and Venture fields, as well as the construction of three offshore platforms, an onshore gas plant and an onshore fractionation plant. Natural gas production from the SOEP facility commenced on December 31, 1999. Alma, the first Tier II platform was on-stream in late 2003 while production from South Venture, the second field began late in 2004.
A compression unit was installed on the SOEP project’s central processing platform in 2006, and was operational in mid-November of that year. SOEP continues to produce natural gas with production at lower levels as the compression platform only boosted production for a short period. In 2013, SOEP production fell due to limited production at one of the six fields. In 2014 and 2015, the production of natural gas from the SOEP stabilized somewhat, with the production level in 2015 declining by 3.7% compared to 2014 levels. During 2016, production levels declined a further 9.1%. In addition to the producing gas field, the SOEP project includes a gas plant at Goldboro and a fractionation plant at Point Tupper. The Maritimes & Northeast Pipeline provides transportation of SOEP gas to markets in Nova Scotia, New Brunswick, and the northeastern United States. This pipeline originates at the “tailgate” of the gas plant in Goldboro, Nova Scotia, continues in a westerly direction and crosses the New Brunswick-Nova Scotia border near Tidnish, Nova Scotia.
NATURAL GAS PRODUCTION
| | | | | | | | | | | | | | | | | | | | |
| | | 2012 | | | 2013 | | | 2014 | | | 2015 | | | 2016 | |
SOEP Production (mmcf/d) | | | 207.8 | | | | 140.2 | | | | 145.1 | | | | 139.6 | | | | 126.6 | |
Deep Panuke Production (mmcf/d) | | | — | | | | 46.2 | | | | 203.3 | | | | 69.7 | | | | 58.3 | |
| | | | | | | | | | | | | | | | | | | | |
Total Production (mmcf/d) | | | 207.8 | | | | 186.4 | | | | 348.4 | | | | 209.3 | | | | 184.9 | |
| | | | | | | | | | | | | | | | | | | | |
ExxonMobil Canada Properties Ltd., Shell Canada Ltd., Imperial Oil Reserves, Pengrowth Energy Trust and Mosbacher Operating Ltd. are interest holders in SOEP. In 1999, the project partners signed a royalty agreement for this project with the Province. The current year’s royalty income (considering current decommissioning costs as discussed below) from offshore gas and natural gas liquids for the fiscal year 2015-2016 was $14.1 million. In 2015-2016, the Province incurred Prior Years’ Adjustments (“PYA”) of negative $105.8 million – resulting in net royalty
26
revenues of negative $91.8 million for 2015-2016. These PYAs arise from two sources: a) the recalculation of actual royalty income to be paid by the interest holders, and b) when the SOEP reaches the end of its technical viability, interest holders are entitled to deduct decommissioning cost from royalties paid to the Province. The Province has been accruing a liability for the Province’s share of the costs associated with the decommissioning of the project. When royalties estimated for future years are insufficient to fully offset the Province’s share of these costs, Prior Years’ Adjustments (“PYA”) are required for royalty revenue previously recorded.
OFFSHORE ROYALTY INCOME
| | | | | | | | | | | | | | | | | | | | |
| | | Fiscal Year Ended March 31 | |
| | | 2012 | | | 2013 | | | 2014 | | | 2015 | | | 2016 | |
Current Royalty Income (‘000) | | $ | 117,955 | | | $ | 22,748 | | | $ | 20,732 | | | $ | 30,019 | | | $ | 14,068 | |
Prior Years’ Adjustments (‘000) | | | (5,275 | ) | | | (19,213 | ) | | | (145,551 | ) | | | 3,069 | | | | (105,820 | ) |
| | | | | | | | | | | | | | | | | | | | |
Total Royalty Income (‘000) | | $ | 112,680 | | | $ | 3,535 | | | ($ | 124,819 | ) | | $ | 33,088 | | | ($ | 91,752 | ) |
| | | | | | | | | | | | | | | | | | | | |
While the decline in SOEP production has been a contributing factor to the decline in current royalty income, the total royalty income is primarily being determined by the accrual of the change in abandonment costs as estimated by SOEP interest holders.
Encana’s Deep Panuke natural gas project is located approximately 109 miles off the coast of Nova Scotia. Production started in August, 2013 and production averaging 110.6 mmcf/d from start of production to the end of the calendar year. The natural gas is currently being processed on the production platform and exported to shore by a dedicated pipeline to the SOEP gas processing facility in Goldboro, and then the natural gas is fed into the Maritime and Northeast Pipeline. Total spending by EnCana on Deep Panuke in calendar year 2015 was $121 million. At the time of development, the Deep Panuke project was anticipated to have a mean production life of 13 years. The Deep Panuke project was expected to deliver between 200 million and 300 million cubic feet of natural gas per day. However, due to production challenges, Deep Panuke production averaged only 58.3 mmcf/d in 2016. The Deep Panuke project has encountered significant production challenges with water seeping into the wells. In 2015, Encana, the interest holder in Deep Panuke, decided to operate the field on a seasonal basis to capitalize on high winter gas prices in the New England market. In the spring of 2016, Encana decided to produce natural gas on a year-round basis. However, production during 2016 was 16.2% below 2015 levels.
Exploration Rights
Exploration rights are awarded for a nine-year period to the bidder making the highest work commitment. If this amount is not spent within an initial five-year period (extendable by one year more upon payment of $250,000), 25% of the deficiency is paid to the Provincial government. The exploration rights are forfeited to the Crown if an exploration well is not drilled within this initial period. On January 20, 2012, the Canada-Nova Scotia Offshore Petroleum Board (“CNSOPB”) awarded four bids on offshore Nova Scotia lands for four separate parcels resulting in $970 million in work expenditure bids, and on November 16, 2012 the Board awarded a further $1,081.9 million in work expenditure bids on 8 additional parcels. The work expenditure bid represents the amount of money the bidder intends to spend exploring the land parcels during the initial six-year period of a nine-year exploration license. Successful bidders are required to post a deposit of 25 per cent of the amount of the bid to demonstrate their commitment to conduct the intended work. The original total exploration spending commitment in the 12 active exploration license areas offshore Nova Scotia is $2,133.9 million as of January 17, 2017.
The total value of forfeitures to the Province of exploration licenses was $43.2 million for the fiscal year 2005-2006, $4.2 million for the fiscal year 2006-2007, $107.1 million for the fiscal year 2007-2008, $2.0 million for the fiscal year 2008-09, $14.8 million in fiscal year 2009-2010, and $433,000 in fiscal year 2010-2011. There were no license forfeitures in 2011-2012, and only $100,000 in 2012-2013. There have been no license forfeitures since 2012-2013.
27
GOVERNMENT FINANCE
Overview
Under the Canadian Constitution, the Province of Nova Scotia is granted certain exclusive powers, including the power to impose direct taxation within the Province to raise revenue for Provincial purposes and the power to borrow money on the sole credit of the Province. Certain responsibilities assigned to the Province are, in turn, delegated to municipal governments and other local bodies within the province, such as school boards and local service commissions, under varying degrees of Provincial control.
Municipal governments raise their own revenues from a number of sources, the most important of which is real property taxes, and also receive financial assistance from the Province. Municipal borrowing powers are strictly limited; operating deficits in any given year must be recaptured through taxation or other current revenues the following year. Under the incorporating legislation, municipalities and municipal enterprises long-term capital requirements are subject to the approval of the Minister of Municipal Affairs of the Province and must be made through the Nova Scotia Municipal Finance Corporation except for borrowings from the Federal Government, the Province, another municipality, or their agencies. The municipalities may carry debt with financial institutions until long-term financing is arranged with the MFC. (See “Certain Crown Corporations and Agencies – Nova Scotia Municipal Finance Corporation”).
The receipt of public revenues, the disbursement of public funds, the control of expenditures, and the keeping and auditing of the Public Accounts of the Province are governed by various Provincial statutes. All receipts and disbursements of public money of the Province’s departments and public service units flow through the General Revenue Fund. Such receipts and disbursements consist of revenue, expenditures, and other transactions. Any net cash requirement of the General Revenue Fund is provided for by the Province’s traditional sources of financing, including borrowings in the public and private financial markets and internal sources.
Anticipated revenue, program expenses, capital expenditures, and debt servicing costs included in the budgetary estimates of the Province are submitted for approval to the House of Assembly for each fiscal year. Authority for expenditure expires at the end of each fiscal year. Funds for expenditure may also be provided by special legislation and by order of the Lieutenant Governor in Council pursuant to the authority of the Finance Act. Loans and investments, including those to or on behalf of corporations and agencies owned or controlled by the Province, are generally made pursuant to the authority and limitations of various Provincial statutes and are not included in the annual budgetary estimates submitted to the House of Assembly for approval.
The accounts and financial operations of the Province and the financial statements of certain crown corporations and agencies are subject to audit by the Auditor General, an official appointed by the Lieutenant Governor in Council under the Auditor General Act. The Auditor General audits the Consolidated Financial Statements of the Province.
On April 19, 2016, the Minister of Finance and Treasury Board submitted the Budget for the fiscal year 2016-2017, which is referred to herein as “Estimate 2017”. See Exhibit (1) to the Province’s Form 18-K/A, Amendment No. 1 for the fiscal year ended March 31, 2015 for the Budget highlights. The most recent Forecast Update was released on December 15, 2016, and is filed as Exhibit (2) to the Province’s Form 18-K for the fiscal year ended March 31, 2016. The previous Forecast Update released on September 20, 2016 was filed as Exhibit (4) to the Province’s Form 18-K/A, Amendment No. 1 for the fiscal year ended March 31, 2015.
Specific Accounting Policies
Financial statements of the Province are prepared in accordance with Canadian generally accepted accounting principles for the public sector, which for purposes of the Province’s financial statements are represented by accounting recommendations of the Public Sector Accounting Board (“PSAB”) of the Chartered Professional Accountants (“CPA”) of Canada, supplemented where appropriate by other CPA of Canada and International Federation of Accountants accounting standards or pronouncements.
28
The Government Reporting Entity
The Government Reporting Entity is comprised of the General Revenue Fund, other Governmental Units, Government Business Enterprises, and Government Partnership Arrangements. Governmental Units and Government Business Enterprises represent the entities that are controlled by the Province. Government Partnership Arrangements represent entities for which decision making and significant risks and benefits are shared with other parties outside of the Government Reporting Entity.
Principles of Consolidation
This section describes the accounting treatment for each type of entity included in the Consolidated Financial Statements of the Province. A Governmental Unit is a government organization that is not a Government Business Enterprise. Governmental Units include government departments, public service votes, funds, agencies, service organizations, boards, government not-for-profit organizations, and government business-type organizations. The accounts of Government Units are consolidated on a line-by-line basis after adjusting for differences in significant accounting policies with the exception of capitalization thresholds and depreciation methods and rates of accounting for tangible capital assets for which no accounting policy adjustments are performed. Significant inter-organization accounts and transactions are eliminated.
A Government Business Enterprise is a self-sustaining organization that has the financial and operating authority to sell goods and services to individuals and non-government organizations as its principal activity and source of revenue. Government Business Enterprises have been accounted for on the modified equity basis that does not require any accounting policy adjustments. Net equity of Government Business Enterprises is included in government consolidated financial statements in the Consolidated Statement of Financial Position, while any net income or net loss is shown as a separate line item in the Consolidated Statement of Operations and Accumulated Deficits. The largest Government Business Enterprises, in terms of revenues, are the Nova Scotia Liquor Corporation and the Nova Scotia Provincial Lotteries and Casino Corporation.
A Government Partnership is a contractual arrangement between the government and a party or parties outside the reporting entity. The partners have clearly defined common goals, make a financial investment in the partnership, share control of decision-making, and share, on an equitable basis, the significant risks and benefits associated with the operations of the government partnership. Where significant, government’s interest in partnerships is accounted for using proportionate consolidation.
A complete overview of the organizations within the Government Reporting Entity is available within the Province’s Public Accounts, Volumes I and II for the fiscal year 2015-2016. See Exhibit (3) to the Province’s Form 18-K/A, Amendment No. 1 for the fiscal year ended March 31, 2015.
Revenues
Revenues are recorded on an accrual basis. The main components of revenue include federal transfers such as Equalization, Canada Health Transfer, and Canada Social Transfer, as well as interest, various taxes, and legislated levies. Revenues from Personal and Corporate Income Taxes and Harmonized Sales Taxes, are accrued in the year earned based on estimates using statistical models. These revenues are recorded at the net amount estimated, after considering adjustments for tax credits and administrative costs related to the collection and processing performed by the Federal Government. Petroleum Royalties may be reduced by a portion of estimated abandonment cost for the future decommissioning of restoration of offshore field assets.
Expenses
Expenses are recorded on an accrual basis. Grants are recognized in the period during which the grant is authorized and any eligibility criteria are met. Provisions are made for probable losses on certain loans, investments, loan guarantees, accounts receivable, advances, forgivable loans, and for contingent liabilities when it is likely that a liability exists and the amount can be reasonably determined. These provisions are updated as estimates and revised, at least annually.
29
Measurement Uncertainty
Uncertainty in the determination of the amount at which an item is recorded in the Province’s Consolidated Financial Statements is known as measurement uncertainty. Uncertainty exists whenever estimates are used because it is reasonably possible that there could be material difference between the recognized amount and another reasonably possible amount.
Measurement uncertainty exists in the Province’s Consolidated Financial Statements in the accruals for such items as pension, retirement and other obligations, environmental remediation obligations, and federal and provincial source revenues. The nature of the uncertainty in the accruals for pension, retirement, and other obligations arise because actual results may differ significantly from the Province’s various assumptions about plan members and economic conditions in the marketplace. Uncertainty exists for environmental remediation obligations because the actual extent of remediation activities required may differ significantly based on the actual extent of site contamination and the chosen remediation process. Uncertainty related to sales and income taxes, petroleum royalties, Canada Health Transfer and Canada Social Transfer arises because of the possible differences between estimated and actual economic growth assumptions used in statistical models by the Province to accrue these revenues.
Additional accounting policies are set forth in the Notes to the Public Accounts filed as Exhibit (3) to the Province’s Form 18-K/A Amendment No. 1 for the fiscal year ended March 31, 2015.
Accounting Changes to the 2014 Accounts
Accounting policy changes were made in fiscal year 2014-2015 resulting in restatements for fiscal year 2013-2014 as follows:
Capital District Health Authority (“CDHA”) Correction of Prior Period Error
Capital District Health Authority determined that in 2004 a building was erroneously capitalized with a service life of 10 years instead of 50 years. As a consequence, accumulated depreciation and depreciation expense for the years ended March 31, 2004 through 2014 were overstated. The service life of the asset together with the effects of accumulated depreciation were corrected retroactively by way of a prior period adjustment in 2014-2015. As a result, the opening accumulated deficits in 2013-2014 decreased by $17.9 million, amortization expense decreased by $2.0 million, and the provincial deficit decreased by $2.0 million. The 2014-2015 year impact was a decrease of $19.9 million to opening accumulated deficits and a corresponding increase in the net book value of tangible capital assets with no impact to net debt in the current or prior years.
Accounting Changes to the 2013 Accounts
Accounting policy changes were made in fiscal year 2013-2014 resulting in restatements for fiscal year 2012-2013 as follows:
Nova Scotia Teachers’ Pension Plan Deferred Gain Recognition
The gain realized upon transition of the Teachers’ Pension Plan (“TPP”) to joint trusteeship in 2006 should have been recognized immediately but was deferred and amortized over the expected average remaining service life (“EARSL”) of plan members. This was corrected retroactively during the 2013-2014 fiscal year, resulting in an increase of $1.1 million to pension valuation adjustment expense and a decrease of $12.5 million to the opening accumulated deficits and net debt for 2012-2013. The impact during 2013-2014 fiscal year was an increase of $1.1 million to the pension valuation adjustment expense and a decrease of $11.4 million to the opening accumulated deficits.
30
Accounting Changes to the 2012 Accounts
Accounting policy changes were made in fiscal year 2012-2013 resulting in restatements for fiscal year 2011-2012 as follows:
Accumulated Sick Leave Benefits
Actuarial valuations of sick leave provisions that accumulate but do not vest were completed for certain governmental units during 2013. These liabilities were recorded for the first time in the 2013 fiscal year with retroactive restatement of the comparative year. The 2011-2012 impact was an increase of $4.3 million in expenses and an increase of $50.8 million to opening accumulated deficits.
Non-Teaching Retiring Allowances – Regional School Boards
Actuarial valuations of retirement allowances for non-teaching staff at certain school boards were completed during 2013. These liabilities were recorded for the first time in the 2013 fiscal year with retroactive restatement of the comparative year. The 2011-2012 impact was an increase of $0.3 million in expenses and an increase of $4.6 million to opening accumulated deficits.
Conversion to Public Sector Accounting Standards – Government Not-For-Profit Organizations
Effective April 1, 2012, Government Not-For-Profit Organizations (“GNFPOs”) adopted public sector accounting standards (“PSAS”) on a retroactive basis with restatement of the prior year. Certain changes upon conversion resulted in adjustments to the Province’s accounts as follows:
i. Capital District Health Authority (“CDHA”)
CDHA identified and consolidated a government business enterprise (“GBE”) under its control, derecognized an unrealized gain on long-term investments, and recognized its internally restricted deferred capital grants as revenue. The 2011-2012 impact of the conversion was a decrease of $0.9 million to the Province’s investment in GBEs, a decrease of $0.7 million in net income from GBEs, a decrease of $1.5 million in both investments and investment income, a decrease of $12.3 million in deferred revenue, an increase of $8.1 million to other provincial revenue, and a decrease of $4.0 million to opening accumulated deficits. CDHA made other changes that did not impact the provincial deficit, net debt, and opening accumulated deficits for 2011-2012. Cash and short-term investments of $62.1 million were reclassified to investments. Recoveries that were previously netted against expenses were grossed up, resulting in an increase in other provincial revenue of $42.4 million with offsetting increases of $23.4 million in salaries and benefits and $19.0 million in operating expenses.
ii. Izaak Walton Killam Health Centre (“IWK”)
IWK identified certain grants and funding as externally restricted and recorded them as deferred capital and research revenue. The 2011-2012 impact of this change was a decrease of $7.9 million in other revenue and an increase of $9.3 million to opening accumulated deficits. IWK made another change that did not impact the provincial deficit, net debt, and opening accumulated deficits for 2011-2012. IWK derecognized funds held in trust on behalf of stakeholders, reducing cash and short-term investments and accounts payable both by $10.0 million.
iii. Nova Scotia Community College (“NSCC”)
Externally restricted assets and revenues were reclassified to deferred revenue, and employee future benefit plans were retroactively restated. The 2011-2012 impact of these changes was a decrease of $0.5 million in revenue, an increase of $0.8 million in salaries and benefits, an increase of $6.1 million in deferred revenue, a decrease of $3.4 million in pension, retirement and other obligations, and an increase of $1.4 million to opening accumulated deficits.
31
iv. South Shore District Health Authority (“SSDHA”)
Externally restricted capital funding was reclassified to deferred revenue. The 2011-2012 impact of this change was an increase of $2.6 million in deferred revenue, a decrease of $2.3 million in other provincial revenue, and an increase of $0.3 million to opening accumulated deficits.
Correction of Prior Period Errors
i. Two GBEs reported retroactive restatements. Nova Scotia Liquor Corporation retroactively corrected its liability for accumulating non-vesting sick leave relating to the previous year. The 2011-2012 impact of this correction was a decrease of $5.6 million to the Province’s investment in GBEs, a decrease of $0.2 million in net income from GBEs, and an increase of $5.4 million to opening accumulated deficits and net debt. Halifax-Dartmouth Bridge Commission retroactively restated its property, plant and equipment balance relating to the previous year. The 2011-2012 impact of this change was an increase of $0.4 million to the Province’s investment in GBEs, a decrease of $0.1 million in net income from GBEs, and a decrease of $0.5 million to opening accumulated deficits and net debt.
ii. Deferred capital grants revenue for a governmental unit should have been eliminated upon consolidation in the year received. This resulted in an increase of $61.5 million to the opening accumulated deficits and net debt in 2011-2012.
The Province adopted two new public sector accounting standards in 2012-2013 as follows:
PS 3410 – Government Transfers
The Province prospectively adopted this revised accounting standard effective April 1, 2012, which establishes how to account for and report government transfers to individuals, organizations, and other governments from both a transferring government and a recipient government perspective. As a result of adopting this revised standard, an additional $38.4 million in grant expenses were recorded for 2012-2013 with no impact to revenues.
PS 3510 – Tax Revenue
The Province retroactively adopted this new accounting standard effective April 1, 2012, whereby tax revenue is recognized at its gross amount, tax concessions are netted against tax revenue, and transfers through a tax system are recognized as expenses. As a result, both tax revenues and tax credits and rebates for 2012-2013 were increased by $56.7 million (2011-2012—$48.2 million) with no impact on the Provincial deficit, net debt, and accumulated deficits of either period.
The financial information with respect to the Province set forth herein has been derived from several sources, including the Consolidated Financial Statements of the Province. Unless otherwise indicated, amounts shown in this document have been restated as described above.
Unless otherwise indicated, amounts referred to as “Estimate for the year ended March 31, 2017” have been taken from the Budget 2016-2017 tabled on April 19, 2016. The Budget, however, is not prepared on the same basis as the historical financial information. Revenues and expenses in the Estimates reflect only those of the General Revenue Fund. The Provincial surplus includes results of the General Revenue Fund, consolidation and accounting adjustments for Governmental Units, and net income for Government Business Enterprises.
32
Summary of Budget Transactions and Borrowing Requirements
SUMMARY OF OPERATIONS AND NET FUNDING REQUIREMENTS
OF THE CONSOLIDATED ENTITY
| | | | | | | | | | | | | | | | | | | | |
| | | Restated | | | Restated | | | Restated | | | | | | | |
| | | 2012(1) | | | 2013(2) | | | 2014(3) | | | 2015 | | | 2016 | |
| | | (in millions) | |
Revenues | | $ | 9,390.9 | | | $ | 9,749.8 | | | $ | 9,708.9 | | | $ | 10,310.5 | | | $ | 10,549.8 | |
| | | | | | | | | | | | | | | | | | | | |
Program Expenses | | | 9,156.3 | | | | 9,486.3 | | | | 9,850.9 | | | | 9,907.6 | | | | 10,078.9 | |
Debt Servicing Costs | | | 863.0 | | | | 921.5 | | | | 886.2 | | | | 898.1 | | | | 869.3 | |
| | | | | | | | | | | | | | | | | | | | |
Total Expenses | | | 10,019.3 | | | | 10,407.8 | | | | 10,737.1 | | | | 10,805.6 | | | | 10,948.2 | |
| | | | | | | | | | | | | | | | | | | | |
Surplus/(Deficit) from Governmental Units | | | (628.4 | ) | | | (658.0 | ) | | | (1,028.1 | ) | | | (495.1 | ) | | | (398.4 | ) |
Net Income from Government Business | | | | | | | | | | | | | | | | | | | | |
Enterprises | | | 369.4 | | | | 354.4 | | | | 351.3 | | | | 351.4 | | | | 387.8 | |
| | | | | | | | | | | | | | | | | | | | |
Provincial Surplus / (Deficit)(4) | | | (259.0 | ) | | | (303.6 | ) | | | (676.9 | ) | | | (143.7 | ) | | | (10.7 | ) |
| | | | | | | | | | | | | | | | | | | | |
Net Funding Requirements | | | | | | | | | | | | | | | | | | | | |
Deficit/(Surplus) | | | 259.0 | | | | 303.6 | | | | 676.9 | | | | 143.7 | | | | 10.7 | |
Non-Cash Items (5) | | | (160.8 | ) | | | (763.8 | ) | | | (990.8 | ) | | | (340.7 | ) | | | (422.0 | ) |
| | | | | | | | | | | | | | | | | | | | |
Operating Requirements | | | 98.1 | | | | (460.2 | ) | | | (314.0 | ) | | | (197.0 | ) | | | (411.4 | ) |
Loan advances and Investing, net of repayments | | | 153.1 | | | | 68.0 | | | | 122.5 | | | | 240.3 | | | | 33.1 | |
Acquisition of Tangible Capital Assets | | | 609.6 | | | | 690.9 | | | | 545.9 | | | | 542.2 | | | | 466.5 | |
Sinking Fund Installments and Serial Retirements | | | 37.6 | | | | 44.1 | | | | (274.6 | ) | | | 40.8 | | | | (177.7 | ) |
Net Refinancing Transactions(6) | | | 1,616.6 | | | | 999.7 | | | | 1,014.0 | | | | 592.8 | | | | 1,032.1 | |
| | | | | | | | | | | | | | | | | | | | |
Net Funding Requirement | | | 2,515.1 | | | | 1,342.4 | | | | 1,093.8 | | | | 1,219.1 | | | | 942.6 | |
| | | | | | | | | | | | | | | | | | | | |
Financing of Net Funding Retirement | | | | | | | | | | | | | | | | | | | | |
Change in Cash and Short-term Investments | | | 424.0 | | | | (17.1 | ) | | | 129.0 | | | | 32.4 | | | | (97.3 | ) |
Debt Issued | | | 2,091.1 | | | | 1,359.5 | | | | 964.8 | | | | 1,186.7 | | | | 1,039.8 | |
| | | | | | | | | | | | | | | | | | | | |
Total | | $ | 2,515.1 | | | $ | 1,342.4 | | | $ | 1,093.8 | | | $ | 1,219.1 | | | $ | 942.6 | |
| | | | | | | | | | | | | | | | | | | | |
| (1) | Restated to reflect Accounting Changes during 2012-2013. See “Government Finance – Accounting Changes to the 2012 Accounts”. |
| (2) | Restated to reflect Accounting Changes during 2013-2014. See “Government Finance – Accounting Changes to the 2013 Accounts”. |
| (3) | Restated to reflect Accounting Changes during 2014-2015. See “Government Finance – Accounting Changes to the 2014 Accounts”. |
| (4) | As of December 15, 2016, the Province is forecasting a surplus of $12.1 million for fiscal year 2016-2017. |
| (5) | Includes amortization of tangible capital assets, net proceeds on disposal of tangible capital assets, foreign exchange amortization, net income from Government Business Enterprises, changes in receivables, payables, and other non-cash items, and sinking fund earnings, which are retained in the Sinking Funds and Public Debt Management Fund, and are not available for general purposes, profit distribution from Government Business Enterprises and foreign currency swaps and adjustments. Also includes the draw-downs from sinking funds and the Public Debt Management Fund. |
| (6) | Net Refinancing Transactions consist of proceeds from Sinking Funds and Repayment of Debentures and Other Long-term obligations. |
In the December 15, 2016 Forecast Update, the Province of Nova Scotia is forecasting a surplus of $12.1 million for 2016–2017. The Budget Estimate surplus was $127.4 million, including $110.3 million in one-time revenues for capital contributions from the Federal government and Halifax for the new Halifax Convention Centre. In the December Forecast Update, the recognition of the $110.3 million in revenue has been deferred to 2017-18 as the Halifax Convention Centre is not expected to reach the point of substantial completion by March 31, 2017. Compared to the Budget Estimates, revenue is down by $72.9 million (down the $110.3 million noted above, partially offset by gains in other revenues), and expenses are up $45 million, primarily due to Federal infrastructure cost-sharing programs. The December Forecast Update also notes $17.5 million in costs related to October storm damage in the Sydney area.
33
Revenue
The following table sets forth the revenue, by source, of the General Revenue Fund, as described in “Government Finance – Specific Accounting Policies” above, for fiscal years 2012 to 2016 inclusive and Budget Estimate for fiscal year 2017, each adopting the accounting policies, other than consolidation of government entities, described in “Government Finance – Specific Accounting Policies” and “Government Finance – Accounting Changes to the 2013 Accounts”.
REVENUE BY SOURCE FOR GENERAL REVENUE FUND (1)
| | | | | | | | | | | | | | | | | | | | | | | | |
| | | Restated
2012(2) | | | 2013 | | | 2014 | | | 2015 | | | 2016 | | | Budget
2017 | |
| | | (in millions) | |
Provincial Sources: | | | | |
Personal Income Taxes | | $ | 2,057.6 | | | $ | 2,142.5 | | | $ | 2,192.8 | | | $ | 2,349.7 | | | $ | 2,562.5 | | | $ | 2,671.6 | |
Corporate Income Taxes | | | 416.7 | | | | 429.5 | | | | 425.9 | | | | 474.0 | | | | 461.7 | | | | 466.6 | |
Sales Taxes | | | 1,598.2 | | | | 1,648.7 | | | | 1,660.1 | | | | 1,702.4 | | | | 1,760.2 | | | | 1,814.0 | |
Tobacco Taxes | | | 208.6 | | | | 206.3 | | | | 217.2 | | | | 206.3 | | | | 217.0 | | | | 227.3 | |
Motive Fuel Taxes | | | 250.2 | | | | 243.4 | | | | 246.8 | | | | 248.3 | | | | 254.0 | | | | 271.7 | |
Registry of Motor Vehicles | | | 117.1 | | | | 113.4 | | | | 120.5 | | | | 123.0 | | | | 130.3 | | | | 127.5 | |
Offshore Royalties | | | 118.0 | | | | 22.7 | | | | 20.7 | | | | 30.0 | | | | 14.1 | | | | 10.5 | |
Other Provincial Sources(3) | | | 308.2 | | | | 286.0 | | | | 301.0 | | | | 285.6 | | | | 308.9 | | | | 304.9 | |
TCA Cost Shared Revenue | | | 3.4 | | | | 9.1 | | | | 17.0 | | | | 8.6 | | | | 2.1 | | | | 59.9 | |
Prior Years’ Adjustments | | | (63.6 | ) | | | 57.7 | | | | (258.5 | ) | | | 110.2 | | | | (68.4 | ) | | | — | |
Fees & Other Charges | | | 70.8 | | | | 68.7 | | | | 60.0 | | | | 62.2 | | | | 61.6 | | | | 62.0 | |
Ordinary Recoveries(4) | | | 293.9 | | | | 304.0 | | | | 347.6 | | | | 340.7 | | | | 354.7 | | | | 332.1 | |
Gain on Disposal of Crown Assets | | | 2.1 | | | | 15.4 | | | | 4.6 | | | | 4.8 | | | | (0.3 | ) | | | — | |
Interest Revenues | | | 82.0 | | | | 76.3 | | | | 77.1 | | | | 83.7 | | | | 89.5 | | | | 77.9 | |
Sinking Fund Earnings | | | 106.8 | | | | 111.1 | | | | 111.5 | | | | 103.9 | | | | 96.0 | | | | 91.7 | |
| | | | | | | | | | | | | | | | | | | | | | | | |
Total Provincial Sources | | | 5,570.1 | | | | 5,734.8 | | | | 5,544.3 | | | | 6,133.3 | | | | 6,244.0 | | | | 6,517.7 | |
| | | | | | | | | | | | | | | | | | | | | | | | |
Federal Sources: | | | | | | | | | | | | | | | | | | | | | | | | |
Equalization | | | 1,407.2 | | | | 1,578.8 | | | | 1,718.2 | | | | 1,750.7 | | | | 1,777.8 | | | | 1,738.3 | |
Canada Health Transfer | | | 759.9 | | | | 795.0 | | | | 829.9 | | | | 852.2 | | | | 895.7 | | | | 942.8 | |
Canada Social Transfer | | | 315.9 | | | | 323.0 | | | | 327.4 | | | | 334.0 | | | | 341.1 | | | | 348.9 | |
Crown Share | | | 30.1 | | | | 12.9 | | | | 4.6 | | | | 14.1 | | | | (2.7 | ) | | | 1.4 | |
Offshore Accord | | | 167.8 | | | | 146.1 | | | | 89.5 | | | | 64.5 | | | | 36.8 | | | | 33.3 | |
Other Federal Sources | | | 22.9 | | | | 18.3 | | | | 15.3 | | | | 3.6 | | | | 2.1 | | | | 6.1 | |
TCA Cost Shared Revenue | | | 39.0 | | | | 24.5 | | | | 22.5 | | | | 22.0 | | | | 32.4 | | | | 73.1 | |
Prior Years’ Adjustments | | | (0.4 | ) | | | (0.8 | ) | | | 3.2 | | | | 9.0 | | | | 3.8 | | | | — | |
Ordinary Recoveries | | | 307.0 | | | | 247.4 | | | | 262.1 | | | | 204.0 | | | | 215.5 | | | | 220.5 | |
| | | | | | | | | | | | | | | | | | | | | | | | |
Total Federal Sources | | | 3,049.4 | | | | 3,145.1 | | | | 3,272.5 | | | | 3,253.9 | | | | 3,302.5 | | | | 3,364.4 | |
| | | | | | | | | | | | | | | | | | | | | | | | |
Total Revenue | | $ | 8,619.4 | | | $ | 8,879.9 | | | $ | 8,816.9 | | | $ | 9,387.2 | | | $ | 9,546.4 | | | $ | 9,882.1 | |
| | | | | | | | | | | | | | | | | | | | | | | | |
| (1) | Revenue by source is presented for the Province’s General Revenue Fund. This information does not include the revenues from other Governmental Units, Government Business Enterprises, and Government Partnership Arrangements. The revenues and expenses of these entities are included within statements prepared for the Consolidated Entity. (See “Government Finance – Summary of Budget Transactions and Borrowing Requirements”.) |
| (2) | Restated to reflect Accounting Changes during 2012-2013. See “Government Finance – Accounting Changes to the 2012 Accounts” |
| (3) | Due to minimal revenue collected, the 2015 Accounts reclassified, retrospectively to 2013-2014, the Offshore Licenses Forfeitures (“OLF”). These revenues are now incorporated into Other Provincial Sources for all comparative period, as OLF is under $1 million each year over the past 5 years. |
| (4) | The 2013-2014 figure for Ordinary Recoveries has been reclassified retrospectively to conform to the presentation format adopted in the current year. The $25.1 million increase in Ordinary Recoveries during fiscal year 2013-2014 period was previously recorded as an expense net of recoveries in the Department of Health and Wellness. |
34
Provincial Sources
Provincial own-source revenues of the General Revenue Fund for fiscal year 2015-2016 totaled $6,244.0 million (representing 65.4% of the General Revenue Fund’s revenues) and are estimated to be $6,517.7 million for fiscal year 2016-2017, representing 66.0% of the General Revenue Fund’s revenues. The largest of the Province’s own-source revenues, Personal Income Tax (“PIT”), totaled $2,562.5 million in fiscal year 2015-2016 and are estimated to increase to $2,671.6 million for 2016-2017. The second largest own-source revenue, Harmonized Sales Tax (“HST”), totaled $1,760.2 million for 2015-2016 and is estimated to increase to $1,814.0 million for fiscal year 2016-2017. Corporate Income Taxes (“CIT”) totaled $461.7 million in 2015-2016 and are estimated to increase to $466.6 million in 2016-2017.
The Federal Government collects a number of taxes on behalf of the Province, including personal and corporate income taxes, and the HST.
The Province has a tax on income system for personal income tax. The Provincial tax on income is calculated on federally defined taxable income, and consists of five income tax brackets. The rate for the first bracket, on taxable income up to $29,590, is 8.79%. The rates on the second (taxable income between $29,591 and $59,180) and third (taxable income between $59,181 and $93,000) brackets are 14.95% and 16.67% respectively. The fourth bracket for income above $93,000 is 17.5% and was revised to taxable income between $93,001 and $150,000 effective for the 2010 taxation year and beyond. A fifth bracket was added in 2010 with a rate of 21% on taxable income above $150,000. Prior to 2010 there was a surtax of 10% of provincial tax in excess of $10,000. The fifth tax bracket and the removal of the surtax were temporary measures until the Province returned to a balanced budget position, but the Province announced in the 2016-2017 Budget that the measures would remain in place for the 2016-2017 fiscal year.
The general corporate income tax rate is 16% of the corporate taxable income allocated to Nova Scotia under a federally-defined formula set out in regulations. A small business rate of 3.0% applies to the first $350,000 of active business income for Canadian Controlled Private Corporations that have capital of less than $10 million. The benefit of the small business rate is reduced for corporations with capital above $10 million and is completely phased out at $15 million. Effective January 1, 2011 the small business rate was reduced from 5.0% to 4.5%, effective January 1, 2012 the small business tax rate was reduced to 4.0%, effective January 1, 2013 the small business rate was reduced to 3.5%, and effective January 1, 2014 the small business tax was reduced to 3.0%. Also effective January 1, 2014 the threshold for the small business rate was reduced from $400,000 to $350,000. As of July 1, 2011 the Large Corporation Tax (“LCT”) was reduced to 0.05% from 0.10% as part of a multi-year plan to eliminate the capital tax on non-financial corporations. This tax applies to taxable paid up capital of corporations with capital in excess of $10 million; the tax was phased in for corporations with paid up capital between $5 million and $10 million. The Large Corporations Tax was phased out completely on July 1, 2012. The capital tax rate for financial institutions is 4%. Effective January 1, 2015, an annual cap of $12 million in capital tax payable has been established for financial institutions required to pay tax under the Corporation Capital Tax Act. The tax applies to capital employed in Nova Scotia by certain financial institutions. Also effective January 1, 2015 the Dividend Tax Credit rate for non-eligible dividends was reduced from 5.87 per cent to 3.5 per cent. The Dividend Tax Credit compensates individual shareholders for the fact that income is taxed at the corporation level and again at the personal level when dividends are distributed to shareholders. Non-eligible dividends are typically paid out by small businesses. Most Canadian jurisdictions set the non-eligible dividend tax credit rate to be equal to the small business corporate income tax rate to achieve integration between the personal and corporate income tax systems. The province’s small business tax rate is 3.0 per cent.
On April 1, 1997, HST was implemented in Nova Scotia, replacing the province’s Health Services Tax (11%) and harmonizing the tax base with the Federal Goods and Services Tax (“GST”) of 7%, which was subsequently reduced by the Federal government to 6% on July 1, 2006 and 5% effective January 1, 2008. The HST is a combined Federal and Provincial tax and is collected by the Canada Revenue Agency. Revenues are shared with the Province. The provincial component of the HST was increased from 8% to 10% on July 1, 2010 for a combined rate of 15%. The rate increase contributed about $225.0 million to 2011-2012 revenues, growing to approximately $320 million a year based upon a full-year implementation in 2012-2013.
35
The HST is a value-added tax levied on most goods and services purchased in Nova Scotia. Certain items such as basic groceries and exports are zero-rated, while others such as residential rents are exempt. Zero-rated supplies are taxable at a rate of zero percent, meaning there is no HST charged on the supply of these goods and services, but the HST registrant can claim an input tax credit. Exempt supplies are goods and services that are not subject to HST, and the registrant cannot claim an input tax credit on expenses related to making exempt goods and services. The Province provides consumer rebates on the provincial component of the HST for residential energy, printed books, first time homebuyers of new residential homes, children’s clothing, children’s footwear, children’s diapers, firefighting equipment, computers for visually and mentally challenged individuals and exterior renovations to heritage properties. Rebates are also available to municipalities, universities, schools, hospitals, charities and non-profit organizations.
Offshore petroleum royalties were $14.1 million in 2015-2016, and are estimated to be $10.5 million in 2016-2017 as royalties decrease with the Sable Offshore Energy Project (“SOEP”) project nearing its technical end date and production volumes from SOEP decline. In addition, an accrual has been made for estimated abandonment costs that interest holders in the SOEP may deduct from offshore royalties. While there are several factors contributing to the decline, it is primarily being driven by the accrual of abandonment costs estimated by SOEP interest holders.
Federal Sources
Federal sources are made up of three major transfers, Equalization ($1,777.8 million in 2015-2016), the Canada Health Transfer (“CHT”) ($895.7 million in 2015-2016) and the Canada Social Transfer (“CST”) ($341.1 million in 2015-2016). Equalization, CHT and CST are estimated to be $1,738.3 million, $942.8 million, and $348.9 million respectively, for the fiscal year 2016-2017 Budget Estimates.
Equalization. Equalization is an unconditional Federal Government transfer that is paid out of Federal Government revenues. First introduced in Canada in 1957, Equalization was subsequently entrenched in the Constitution Act, 1982. Until a new framework agreement in 2004-2005, Equalization was calculated by comparing the fiscal capacity of a province, based on 33 tax bases, to a representative standard. This standard was made up of five provinces: Quebec, Ontario, Saskatchewan, Manitoba and British Columbia. If a province’s fiscal capacity was below the per capita capacity of the standard, that province would receive Equalization entitlements. If the province’s fiscal capacity was above the per capita capacity of the standard, it would not receive Equalization entitlements.
The Equalization program has traditionally been renewed every five years, with the exception of the 1992 renewal that was for two years only. The 2004 renewal was never implemented because a transitional approach, referred to below as the “Interim Approach”, was agreed upon at a First Ministers’ Meeting in September 2004 to allow the Federal Government an opportunity to develop a new framework for the program. Under the Interim Appoach, the total entitlement to the Equalization receiving provinces was established at $10.9 billion for 2005-2006, and was to increase by 3.5% per annum in each subsequent year. Equalization payments were based on 50% of a Province’s three-year average of entitlements and 50% of a Province’s three-year average of fiscal capacity.
The Offshore Offset Agreement (Offshore Accord) between the Federal Government and the Province of Nova Scotia was signed in February 2005. Essentially, the agreement was to protect Nova Scotia’s offshore natural resource revenues from clawbacks under the Equalization program by providing an offset payment for the difference between Equalization payments with Nova Scotia’s offshore natural resource revenues included and Equalization payments with these revenues excluded. This arrangement had an estimated value of $1.1 billion at production levels expected at the time of the agreement. On June 30, 2005, Nova Scotia received an $830 million advance cash payment from the Federal Government under the Offshore Accord. The Province accounted for the annual value of the offset payment on an accrual basis until the $830 million was fully realized as income, recognizing the $830 million in revenues over the period 2005-2006 to 2011-2012. The Province earned a further $31.7 million in Offshore Accord monies above the $830 million advance cash payment, an additional amount recorded in 2011-2012. The Province qualifies for the second eight-year phase of the Offshore Accord which runs from 2012-2013 to 2019-2020; receiving $146.1 million in 2012-2013, $89.5 million in 2013-2014, $64.5 million in 2014-2015, $36.8 million in 2015-2016 and is estimated to receive $33.3 million in 2016-2017.
36
As a part of Federal Budget 2006, the Federal Government committed to resolving the issue of fiscal imbalance including a principle-based, formula-driven Equalization program. The Federal Budget documents indicated that the resolution to this issue would be guided by three reports including a Federal budget discussion paper on fiscal imbalance, the Council of the Federation Advisory Panel on Fiscal Imbalance and the Report of the Expert Panel on Equalization. The Federal Budget 2007 tabled on March 19, 2007 adopted the approach recommended by the Expert Panel on Equalization to resolve the fiscal imbalance. The new formula compares the fiscal capacity of a province to the average fiscal capacity of all provinces (a so-called “ten province” standard) using five tax bases and is calculated based on a three-year weighted moving average. The new formula was intended to make payments under the Equalization program more predictable.
A province that is below the national average fiscal capacity receives an Equalization payment while a province above the national average fiscal capacity does not. A fiscal capacity “cap” was introduced in 2007 to ensure that no Equalization-receiving province would have a post-Equalization fiscal capacity greater than the lowest fiscal capacity of the non-Equalization-receiving provinces.
The Federal Government in November 2008 announced that the annual expenditure growth in the Equalization program would be limited to the change in the three-year moving average of Canada’s nominal gross domestic product. Furthermore, the fiscal capacity cap will be set at the average post-Equalization fiscal capacity of the Equalization-receiving provinces when the population of Equalization-receiving provinces exceeds 50 per cent of the national population. If the population of Equalization-receiving provinces is less than 50 per cent of the national population the fiscal capacity cap reverts to the lowest fiscal capacity of the non-Equalization-receiving provinces.
Under the implementation of the Expert Panel on Equalization, Nova Scotia and Newfoundland and Labrador were also provided with an option to use the 2004 Renewal formula noted above, which included the benefits of the Offshore Accord Agreements. The two provinces were permitted to elect to opt into the Expert Panel approach in any fiscal year. However, once the Expert Panel approach was selected, the 2004 Renewal formula would no longer be an option. Following several months of discussions, on October 10, 2007, the Province and the Federal Government agreed upon a “clarification” of the understanding that Nova Scotia is to be the principal beneficiary of its offshore natural resources. The clarification enables the Province to opt into the Expert Panel approach commencing in 2008-2009 and provides a “Cumulative Best-of Guarantee” to ensure that the Province will in the future be treated as favorably as under the formula in place when the Offshore Accord was signed in 2005 (now referred to as the Interim Approach) over the life of the Offshore Accord. If the cumulative total of Equalization payments and Offshore Offset payments under the Expert Panel approach is less than the cumulative total of Equalization payments and Offshore Offset payments calculated under the Interim Approach formula, the Federal Government will make a payment representing the difference to the Province.
The Province received $82.7 million in 2011-2012 Equalization related to a payment under the Cumulative Best-of Guarantee. This payment was the first year that the cumulative value of the Interim Approach exceeded the cumulative value of the Expert Panel approach. In subsequent years the Province received additional payments under the Cumulative Best-of Guarantee; $297.3 million in 2012-2013, $260.3 million in 2013-2014, $131.2 million in 2014-2015, $88.2 million in 2015-2016, and $16.0 million has been included in the 2016-2017 Equalization Estimates for the Cumulative Best-of Guarantee.
As part of the October 10, 2007 clarification, the Province and the Federal Government agreed to allow a joint independent panel to determine the value of the Crown Share Adjustment Payments due to the Province. This payment arose under Canada’s National Energy Program (“NEP”), enacted by the Government of Canada in 1980. That energy policy reserved to Canada a 25 per cent share interest with respect to oil and gas resource projects, referred to as the “Federal Crown Share”. In 1982, the Province agreed to set aside ownership claims regarding offshore resources in exchange for financial compensation. Nova Scotia, having entered into the 1982 “Canada-Nova Scotia Offshore Agreement” with Canada, would receive financial compensation in a 6.25 per cent and 12.5 per cent share of Canada’s interest in oil and gas field projects, respectively. This was referred to as Nova Scotia’s “Crown Share”. With the dismantling of the NEP in 1985 and subsequent repeal of Nova Scotia’s “Crown Share” interests, the “Canada–Nova Scotia Offshore Petroleum Resources Accord”, signed by Nova Scotia and the Federal Government in 1986, introduced the Crown Share Adjustment Payments (“CSAP”). This was to ensure that, “Nova Scotia receive financial benefits equivalent to those it would have achieved had it exercised its Crown Share
37
options”. With respect to CSAP, Part VIII of the 1988 Federal Government legislation implementing the 1986 Accord provided that Canada would pay to Nova Scotia an amount equal to at least 75 per cent of the “deemed profit” in respect of a project.
On July 13, 2008, the Federal Government accepted the recommendation of the independent panel on CSAP. The Federal Government paid the Province of Nova Scotia $234.4 million for past payments up to March 31, 2008, $95.1 million in 2008-2009, $79.4 million in 2009-2010, $29.7 million in 2010-2011, $30.1 million in 2011-2012, $12.9 million for 2012-2013, $4.6 million for 2013-2014, $14.1 million for 2014-2015, and negative $2.7 million for 2015-2016. The negative CSAP revenue in 2015-2016 arises from Prior Years’ Adjustments, in effect the Province was overpaid CSAP in previous fiscal years. The Province has estimated revenues from such payments of $1.4 million in 2016-2017. The estimate reflects the underlying profitability of offshore oil and gas projects and the addition of Deep Panuke offshore natural resource royalty revenues. There may be future payments under the Crown Share Adjustment Payment for SOEP, Deep Panuke and any other offshore developments. The CSAP payments do not reduce Nova Scotia’s Equalization payments, including the application of the fiscal capacity cap, in any particular year.
In December 2009 the Federal Government announced that provinces would receive transitional protection, under a program called Total Transfer Protection (“TTP”), from any year-over year decline in transfer payments (Equalization, CHT, and CST) in 2010-2011. The Federal Government committed to maintaining the TTP in 2011-2012, 2012-2013 and 2013-2014 and as a result the Province received a payment of $157.6 million in 2011-2012 and $13.5 million in 2012-2013, included in the Equalization estimate. No TTP payment was required in 2013-2014, and the measure was discontinued beginning with the 2014-2015 fiscal year.
In subsequent years, the Province has received total equalization payments under the Expert Panel approach plus the cumulative-best-of-guarantee and Total Transfer Protection Payment as shown in the following table:
EQUALIZATION BY COMPONENT
| | | | | | | | | | | | | | | | | | | | | | | | |
| | | 2012 | | | 2013 | | | 2014 | | | 2015 | | | 2016 | | | Budget
2017 | |
| | | (in millions) | |
Components: | | | | | | | | | | | | | | | | | | | | | | | | |
Equalization – Expert Panel | | $ | 1,167.0 | | | $ | 1,268.0 | | | $ | 1,457.9 | | | $ | 1,619.5 | | | $ | 1,689.6 | | | $ | 1,722.3 | |
Cumulative Best-of-Guarantee | | | 82.7 | | | | 297.3 | | | | 260.3 | | | | 131.2 | | | | 88.2 | | | | 16.0 | |
Total Transfer Protection | | | 157.6 | | | | 13.5 | | | | — | | | | — | | | | — | | | | — | |
| | | | | | | | | | | | | | | | | | | | | | | | |
Total Equalization Receipts | | $ | 1,407.2 | | | $ | 1,578.8 | | | $ | 1,718.2 | | | $ | 1,750.7 | | | $ | 1,777.8 | | | $ | 1,738.3 | |
| | | | | | | | | | | | | | | | | | | | | | | | |
CHT and CST. The CHT and the CST are the Federal Government’s contribution to the Province in respect of its health care, post-secondary education, child care, early childhood development and social service programs. The amount of Federal assistance does not bear a direct relationship to actual program costs.
In September 2004, the Provincial and Territorial governments reached an agreement with the Federal Government for additional Federal assistance with respect to provincial and territorial health care programs. Under this agreement, the Federal Government provided an additional $41.3 billion through 2013-2014. The national cash pool for CHT was set at $19.0 billion for fiscal year 2005-2006 with an annual escalator mechanism of 6.0% from 2006-2007 through 2013-2014. In the 2007 Federal Budget, the Federal Government announced an intention to move to an equal per capita cash funding mechanism when CHT legislation expired in 2013-2014. Prior to 2014-2015, the allocation of funding across provinces was based on a per capita allocation comprised of a cash transfer portion and on a complex tax points’ transfer portion.
The 2007 Federal Budget provided an increase in funding to the CST program of $1.0 billion in 2007-2008 and legislated annual 3.0% increases in funding starting in 2009-2010. The amount of Federal assistance under the CST was not determined in relation to actual program cost; starting in fiscal year 2007-2008 it was allocated on an equal per capita cash basis.
The CHT and CST programs were renewed by the Federal Government in 2014-2015 for a 10-year period. For the first three years, the 6.0% annual escalator mechanism remains in place for the CHT. Commencing in 2017-2018,
38
the annual escalator will be a moving average of the 3-year average growth rate of national nominal GDP, with a minimum growth rate of 3.0% per year. For the CST, the annual escalator remains at 3.0% for the next ten years.
Stabilization. The Federal Government provides to provinces a stabilization formula under the Federal-Provincial Fiscal Arrangements Act. This legislation provides for Federal grants and interest-free loans to a province if revenue from the province’s own-sources plus equalization falls below 95 per cent of the previous year’s level, excluding variations of natural resource revenue. The Federal-Provincial Fiscal Arrangements Act also provides a limited guarantee arrangement to compensate provinces for certain losses incurred during the calendar year in which a national personal income tax change results in provincial income tax reductions.
Prior Years’ Adjustment (PYA). The Federal Government periodically refines and adjusts prior years’ estimates of CHT and CST based upon revised population estimates. HST and income tax payment forecasts for open taxation years are revised when actual data for the taxation years are received by the Province. PYA from both Federal and Provincial sources were a positive $217.6 million in 2010-2011; a negative $64 million in 2011-2012; a positive $56.8 million in 2012-2013, a negative $255.3 million in 2013-2014, a positive $119.2 million in 2014-2015, and a negative $64.6 million in 2015-2016. A significant upward adjustment to estimates of abandonment costs on the SOEP and other price fluctuations altered the accrual of underlying cost causing a negative $145.6 million PYA on Offshore Royalties during 2013-2014.
39
Program Expenditures / Expenses
The following table sets forth the expenses by department, interest on public debt, restructuring costs, and pension valuation adjustment of the General Revenue Fund for the fiscal years 2012, 2013, 2014, 2015 and 2016 and the Budget Estimate for the fiscal year ending March 31, 2017.
40
EXPENSES BY DEPARTMENT FOR GENERAL REVENUE FUND (1)
| | | | | | | | | | | | | | | | | | | | | | | | |
| | | Fiscal Year Ending March 31 | |
| | | Restated | | | Restated | | | Restated | | | | | | | | | Budget | |
| | | 2012(2) | | | 2013(3) | | | 2014(4) | | | 2015 | | | 2016 | | | 2017 | |
| | | (in millions) | |
Department Expenses | | | | |
Agriculture | | $ | 63.7 | | | $ | 63.8 | | | $ | 61.7 | | | $ | 73.1 | | | $ | 60.9 | | | $ | 60.2 | |
Business | | | — | | | | — | | | | — | | | | 151.9 | | | | 113.7 | | | | 137.5 | |
Communities, Culture and Heritage | | | 54.2 | | | | 57.2 | | | | 58.1 | | | | 60.6 | | | | 64.2 | | | | 81.7 | |
Community Services | | | 975.6 | | | | 941.8 | | | | 889.7 | | | | 920.0 | | | | 922.3 | | | | 930.0 | |
Economic and Rural Development & Tourism | | | 107.7 | | | | 171.9 | | | | 133.5 | | | | — | | | | — | | | | — | |
Education and Early Childhood Development | | | 1,131.1 | | | | 1,110.6 | | | | 1,169.0 | | | | 1,222.4 | | | | 1,241.2 | | | | 1,279.5 | |
Energy | | | 30.2 | | | | 29.3 | | | | 30.3 | | | | 31.7 | | | | 30.0 | | | | 29.6 | |
Environment | | | 26.7 | | | | 24.7 | | | | 24.6 | | | | 25.9 | | | | 24.8 | | | | 36.8 | |
Finance | | | 33.6 | | | | 37.7 | | | | — | | | | — | | | | — | | | | — | |
Finance and Treasury Board | | | — | | | | — | | | | 13.0 | | | | 12.7 | | | | 12.6 | | | | 22.8 | |
Fisheries & Aquaculture | | | 8.3 | | | | 8.5 | | | | 9.0 | | | | 9.4 | | | | 9.9 | | | | 12.5 | |
Health & Wellness | | | 3,757.9 | | | | 3,857.5 | | | | 3,938.5 | | | | 4,076.9 | | | | 4,106.4 | | | | 4,132.2 | |
Internal Services | | | — | | | | — | | | | 124.6 | | | | 155.5 | | | | 215.1 | | | | 185.4 | |
Justice | | | 295.5 | | | | 311.6 | | | | 305.9 | | | | 322.2 | | | | 327.4 | | | | 330.4 | |
Labor & Advanced Education | | | 339.1 | | | | 345.5 | | | | 359.5 | | | | 357.7 | | | | 358.2 | | | | 364.3 | |
Assistance to Universities | | | 387.2 | | | | 380.8 | | | | 336.7 | | | | 375.5 | | | | 374.7 | | | | 380.6 | |
Municipal Affairs | | | — | | | | — | | | | 180.7 | | | | 151.5 | | | | 158.8 | | | | 184.4 | |
Natural Resources | | | 101.2 | | | | 99.4 | | | | 84.8 | | | | 88.5 | | | | 83.0 | | | | 76.5 | |
Public Service | | | 165.8 | | | | 160.5 | | | | 224.4 | | | | 206.4 | | | | 191.9 | | | | 205.9 | |
Seniors | | | 1.9 | | | | 1.7 | | | | 1.8 | | | | 1.4 | | | | 1.5 | | | | 1.6 | |
Service NS & Municipal Relations | | | 260.0 | | | | 269.6 | | | | — | | | | — | | | | — | | | | — | |
Transportation & Infrastructure Renewal | | | 408.9 | | | | 419.3 | | | | 395.3 | | | | 433.4 | | | | 433.7 | | | | 460.8 | |
Restructuring Costs(5) | | | 86.9 | | | | 173.5 | | | | 148.7 | | | | 138.7 | | | | 98.6 | | | | 187.5 | |
| | | | | | | | | | | | | | | | | | | | | | | | |
Total Department Expenses | | | 8,235.4 | | | | 8,464.8 | | | | 8,489.9 | | | | 8,815.5 | | | | 8,829.0 | | | | 9,100.0 | |
| | | | | | | | | | | | | | | | | | | | | | | | |
Tax Credits and Rebates | | | 116.5 | | | | 127.1 | | | | 102.0 | | | | 134.0 | | | | 120.6 | | | | 137.6 | |
Pension Valuation Adjustment | | | 40.0 | | | | 108.5 | | | | 388.2 | | | | 76.2 | | | | 137.3 | | | | 66.3 | |
Debt Servicing Costs | | | 842.8 | | | | 897.4 | | | | 857.3 | | | | 876.2 | | | | 854.7 | | | | 841.7 | |
| | | | | | | | | | | | | | | | | | | | | | | | |
Total Expenses | | $ | 9,234.7 | | | $ | 9,597.8 | | | $ | 9,837.4 | | | $ | 9,901.9 | | | $ | 9,941.7 | | | $ | 10,145.6 | |
| | | | | | | | | | | | | | | | | | | | | | | | |
| (1) | Expenses by department are presented for the General Revenue Fund. The cost of tangible capital assets are capitalized and amortized to Expenses over the useful life of the assets. This information does not include the expenses from other Governmental Units, Government Business Enterprises, or Government Partnership Arrangements. The revenue and expenses of the entities are included within statements prepared for the Consolidated Entity. See “Government Finance – Summary of Budget Transactions and Borrowing Requirements.” |
| (2) | Restated to reflect changes in accounting policies during fiscal year 2012-2013. See “Government Finance –Accounting Changes to the 2012 Accounts” |
| (3) | Restated to reflect changes in accounting policies during fiscal year 2013-2014. See “Government Finance –Accounting Changes to the 2013 Accounts” |
| (4) | Restated to reflect changes in accounting policies during fiscal year 2014-2015. See “Government Finance –Accounting Changes to the 2014 Accounts” |
| (5) | Includes retroactive wage payments due to subsequent wage negotiations, provides for the current and prior years costs expended on corporate initiatives – costs that are not incurred at the discretion of a department, and would not normally be part of a department’s operations and/or may not be directly attributable to any one department. |
Departmental expenses, consisting of program expenses and the amortization of tangible capital assets, were $8,929.0 million for fiscal year 2015-2016 and are estimated to be $9,100.0 million for fiscal year 2016-2017.
41
Health, Education, and Community Services
Health and Wellness and education (including Assistance to Universities) are the two largest areas of expense from the General Revenue Fund. These amounts totaled $4,106.4 million and $1,615.9 million, respectively, for the fiscal year ended March 31, 2016, and are estimated to be $4,132.2 million and $1,660.1 million, respectively, for the fiscal year 2016-2017.
During fiscal year 2014-2015 certain expenses in the Department of Education and Early Childhood Development and the Department of Community Service have been reclassified to conform to the presentation format adopted in the current year causing a change in expenses in fiscal year 2013-2014. The resulting impact was increased expenses of approximately $52 million in the Department of Education and Early Childhood Development and a decrease of $52 million in the Department of Community Services.
In the field of health care, the Province administers a universal and comprehensive medical services and hospital care plan, a dental care program for residents less than 10 years of age, and provides pharmaceutical services for residents 65 years of age and over and Nova Scotians with no other health coverage. In the field of education, the Province makes grants to school boards and community colleges, and assists universities through operating grants.
Community Services include the provision of direct assistance to persons with disabilities and other disadvantaged individuals and families who require long-term assistance, residential care for persons with disabilities, short-term social assistance, and the provision of direct service to the public. Community Services expenses from the General Revenue Fund totaled $922.3 million for the fiscal year ending March 31, 2016, and are estimated to be $930.0 million for the fiscal year 2016-2017.
Business
The Department of Business was created effective April 1, 2015. Also effective April 1, 2015, the Department of Economic and Rural Development and Tourism has ceased to exist. The Department of Business has continued some functions of the former Department of Economic and Rural Development and Tourism while other functions were transferred to other departments or eliminated altogether. The Business department provides strategic direction and leadership to all Nova Scotia government departments, crown corporations and agencies to achieve alignment on strategy and operations for business and social enterprise growth. Tourism activities are mandated to Tourism Nova Scotia with the Department of Business assuming responsibility for the agency. Expenses from the General Revenue Fund under the Department of Business totaled $113.7 million in the fiscal year ending March 31, 2016, and are estimated to increase to $137.5 million in fiscal year 2016-2017.
Resource and Industrial Development
The Province is engaged in a wide range of resource and industrial development activities, including direct assistance grants, development and maintenance of natural resources, and consulting services to industry (the Departments of Agriculture, Fisheries & Aquaculture, and Natural Resources). Expenses from the General Revenue Fund in these areas totaled $153.8 million for the fiscal year ending March 31, 2016, and are estimated to be $149.2 million in fiscal year 2016-2017.
Internal Services
The Department of Internal Services was created effective April 1, 2014. Internal Services had taken over certain programs and services previously performed by the following departments: Communities, Culture and Heritage; Economic and Rural Development and Tourism; Finance and Treasury Board; Justice; Public Service (Chief Information Office and Communications Nova Scotia); and Transportation and Infrastructure Renewal. Expenses from the General Revenue Fund under Internal Services totaled $215.1 million in the fiscal year ending March 31, 2016, and are estimated to decrease to $185.4 million in fiscal year 2016-2017.
Public Service
The Province provides a number of essential services, statutory or other, which are necessary for the efficient and/or effective operation of government. There are also programs and activities that provide a benefit to the whole of government but cannot be specifically identified with any other function. Effective October 22, 2013, the Treasury Board Office, formerly associated with the Public Service Offices, was integrated with the Department
42
of Finance, now called Department of Finance and Treasury Board. Also, beginning April 1, 2014 Public Service was reorganized to exclude the Chief Information Office and now includes the Office of Immigration and Service Nova Scotia. The former had been transferred to a new department called Internal Services, while the latter had been transferred from the Department of Labor and Advanced Education and the Department of Service Nova Scotia and Municipal Relations, respectively. Expenses from the General Revenue Fund under Public Service totaled $191.9 million in the fiscal year ending March 31, 2016 and are estimated to increase to $205.9 million in fiscal year 2016-2017.
Justice
The Province is engaged in activities for the provision of protection of a legal nature to persons and property; public services of a general nature, which lead to a higher degree of personal safety; and the protection of the environment. Expenses from the General Revenue Fund for Justice were $327.4 million in the fiscal year ending March 31, 2016 and are estimated to be $330.4 million in fiscal year 2016-2017.
Transportation and Infrastructure Renewal
The Province is engaged in a wide range of activities to facilitate the effective and efficient movement of persons and property and general communications between people, with the associated dispersal of knowledge. Transportation and Infrastructure Renewal expenses from the General Revenue Fund are estimated to increase from $433.7 million in the fiscal year ending March 31, 2016 to $460.8 million in fiscal year 2016-2017.
Municipal Affairs
The Department of Municipal Affairs was created effective April 1, 2014. Municipal Affairs consists of programs and services transferred from various other departments. These programs and services include Municipal Services (formerly held in the Department of Service Nova Scotia and Municipal Relations); the Office of the Fire Marshal (formerly held in the Department of Labor and Advance Education); and the Emergency Management Office (formerly held in the Department of Justice). Expenses in fiscal year ending March 31, 2016 were $158.8 million and are estimated to increase to $184.4 million in fiscal year 2016-2017. Expenses in this department are primarily due to municipal grants and programs made by the Province, in part, from monies received from the Federal government through Federal Gas Tax Building Canada Fund.
Pension Valuation Adjustment
The Pension Valuation Adjustment (“PVA”) represents the accounting adjustment necessary to reflect the Province’s liability for employee retirement benefits. On April 1, 2013 responsibility for the Public Service Superannuation Plan (PSSP) transferred to a joint trustee representing both employees and employers. The Province reflected this change in the original 2013–2014 Budget Estimates by amortizing the impact over several years. The accounting adjustment required immediate recognition of the impact to joint trusteeship, resulting in the recognition of $318.3 million of net losses in 2013–2014. With an adjustment for the accounting treatment on related plans and charges, the resulting increase in the PVA was $280.3 million in 2013-2014, to a total of $388.2 million. This represents a non-cash accounting charge. There was no impact to the funded position or benefits with the PSSP with this change. ). PVA expenses in fiscal year ending March 31, 2016 were $137.3 million and are estimated to decrease to $66.3 million in fiscal year 2016-2017.
43
Loans and Investments
Under the authority of various Provincial statutes, the Province provides loans to, and makes investments in, its own corporations and agencies, and other entities. The loans and investments relate to programs for the promotion of resource and industrial development, the provision of low-cost and senior-citizen housing and the provision of funding for various Crown agencies and municipalities. Loans are repayable, and assets of Government-owned or other entities support investments.
The following table sets forth the balances of loans and investments of the Province for the Consolidated Entity, net of allowances for un-collectable amounts adopting the accounting policies described in “Government Finance – Specific Accounting Policies” above.
LOANS AND INVESTMENTS FOR CONSOLIDATED ENTITY
| | | | | | | | | | | | |
| | | As at March 31, 2016 | |
| | | (in millions) | |
| | | Gross | | | Provisions | | | Net | |
Loans of the General Revenue Fund | | | | | | | | | | | | |
Nova Scotia Farm Loan Board | | $ | 181.0 | | | $ | 11.0 | | | $ | 170.0 | |
Student Loans, direct lending | | | 220.3 | | | | 112.4 | | | | 107.9 | |
Fisheries Loan Board | | | 104.1 | | | | 1.4 | | | | 102.7 | |
Halifax Dartmouth Bridge Commission | | | 160.0 | | | | — | | | | 160.0 | |
Nova Scotia Business Incorporated | | | 55.3 | | | | 26.3 | | | | 29.0 | |
Housing Nova Scotia | | | 578.2 | | | | 4.8 | | | | 573.4 | |
Nova Scotia Innovation Corporation | | | 8.0 | | | | 4.3 | | | | 3.7 | |
Nova Scotia Jobs Fund | | | 615.5 | | | | 196.3 | | | | 419.2 | |
Market Development Initiative Fund | | | 1.1 | | | | — | | | | 1.1 | |
Nova Scotia Municipal Finance Corporation | | | 813.4 | | | | — | | | | 813.4 | |
Nova Scotia Strategic Opportunities Fund Inc | | | 20.1 | | | | — | | | | 20.1 | |
Miscellaneous | | | 1.0 | | | | 0.6 | | | | 0.5 | |
| | | | | | | | | | | | |
| | $ | 2,758.0 | | | $ | 357.1 | | | $ | 2,400.9 | |
| | | | | | | | | | | | |
Investments of the General Revenue Fund | | | | | | | | | | | | |
Art Gallery of Nova Scotia | | $ | 3.6 | | | $ | — | | | $ | 3.6 | |
Gambling Awareness Foundation | | | 3.8 | | | | — | | | | 3.8 | |
Nova Scotia Business Incorporated | | | 41.1 | | | | 28.0 | | | | 13.1 | |
Nova Scotia Community College | | | 8.9 | | | | — | | | | 8.9 | |
Nova Scotia Health Authority | | | 24.6 | | | | — | | | | 24.6 | |
Nova Scotia Innovation Corporation | | | 36.4 | | | | 12.6 | | | | 23.8 | |
Nova Scotia Jobs Fund | | | 26.4 | | | | 23.4 | | | | 3.0 | |
Nova Scotia School Insurance Program | | | 8.4 | | | | — | | | | 8.4 | |
Perennia Food and Agriculture Inc | | | 1.5 | | | | — | | | | 1.5 | |
Public Archives of Nova Scotia | | | 1.0 | | | | — | | | | 1.0 | |
| | | | | | | | | | | | |
| | $ | 155.7 | | | $ | 64.1 | | | $ | 91.6 | |
| | | | | | | | | | | | |
Total Loan and Investments | | $ | 2,913.7 | | | $ | 421.2 | | | $ | 2,492.5 | |
| | | | | | | | | | | | |
44
Agriculture and Rural Credit Act
The Nova Scotia Farm Loan Board (“Farm Loan Board”), a Provincial agency, provides loans to individuals, partnerships, and corporations engaged in the farming industry. Loans are provided for the acquisition of real estate or the improvement of existing facilities, and generally are secured by agreements of sale between the borrower and the Farm Loan Board. The Farm Loan Board establishes the interest rate on loans issued. This rate, which must be approved by the Minister of Agriculture and Fisheries, is based on the average quarterly commercial loan rates for the relevant term obtained from three or more financial institutions, adjusted by business risk and policy factors, with a minimum rate of interest equal to the all-in Province of Nova Scotia cost of borrowing plus 50 basis points.
Finance Act - Student Loans
The Finance Act provides the authority for the Minister of Finance & Treasury Board, subject to the regulations, to make loans to students enrolled in educational programs designated in the manner provided for in the regulations. These student loans are for post-secondary education, and were previously provided by two Canadian Chartered Banks and the Province guaranteed repayment to the Banks.
Fisheries and Coastal Resources Act
The Fisheries Loan Board, a Provincial agency, provides loans for the construction or purchase of vessels, machinery, and other fishing equipment. Loans are made to individuals, partnerships, and corporations and are secured by first marine mortgages. Fisheries loans bear interest at prevailing market rates repayable on a seasonal repayment schedule.
Halifax-Dartmouth Bridge Commission Act
The Halifax-Dartmouth Bridge Commission (“HDBC”), operating as Halifax Harbour Bridges, was created in 1950 by a special statute of the Province of Nova Scotia (now the Halifax-Dartmouth Bridge Commission Act). The purpose of HDBC is to construct, maintain, and operate bridges and their necessary approaches across the Halifax Harbour, between the communities of Halifax and Dartmouth, and across the North West Arm. Beginning in the spring of 2015, HDBC embarked on a significant and necessary project known as “The Big Lift”. This involves replacing the road deck, floor beams, stiffening trusses, and suspender ropes on the suspended spans of the Angus L. Macdonald Bridge. When the project is complete, a significant amount of the bridge infrastructure will be new. This will help to extend the life of the bridge and reduce future maintenance.
Nova Scotia Business Incorporated Act
The Nova Scotia Business Incorporated Act created Nova Scotia Business Incorporated (“NSBI”), a body corporate whose purpose is to make arms-length decisions respecting the provision of financial assistance within Nova Scotia for economic development. The Province funds NSBI’s activities.
Housing Act
The Housing Act enables Housing Nova Scotia, incorporated under the Housing Nova Scotia Act, to provide subsidized mortgage loans for home ownership, and low-interest loans for home repair or rehabilitation to low-to-moderate income households in Nova Scotia. Housing Nova Scotia and the Department of Community Services administer the capital housing programs, some of which are cost-shared with Canada Mortgage and Housing Corporation and municipalities. The Housing Act also enables Housing Nova Scotia to provide loan guarantees for housing projects, construct lease-purchase housing and public housing, and to develop and service land.
Innovation Corporation Act
The Province, through the Innovation Corporation Act of 1995, created the Nova Scotia Innovation Corporation to provide early stage venture capital and business advisory services targeting industries in the information technology, clean technology and life sciences sectors.
Jobs Fund Act
The Province provides financial assistance to establish, assist, develop, or expand industries in Nova Scotia. Assistance can be in the form of loans, guarantees, and other financial information. On May 1, 2014, Nova Scotia Jobs Fund was closed to new investments or increases to existing authorities on present investments.
45
Municipal Finance Act
The Province, through the Nova Scotia Municipal Finance Corporation (“MFC”), provides loans to municipalities for approved capital purposes, which can be roads, sidewalks, public works fleets, recreation facilities, water and sewer systems, and municipal buildings. Loans are secured by municipal debentures. The MFC obtains its funding through the sale of debentures to the Province and to the Federal Government. The debentures issued by the MFC to the Province are guaranteed by the Province.
Strategic Opportunity Fund Incorporated
The Strategic Opportunity Fund Incorporated (“SOFI”) was established as a Crown Corporation in 2007 to undertake economic development initiatives for Nova Scotia. SOFI received monthly allocations of funds, less administration fees, from the Government of Canada. The funds were loaned to SOFI for 5 years on an interest free basis and are repaid at maturity. During 2014, the Federal government discontinued this program. Going forward SOFI will no longer receive funds to undertake economic development initiatives in Nova Scotia and will gradually terminate the fund over the following 5 years according to its monthly repayment schedule to the Federal government.
Invest Nova Scotia Board Act
The Province provides financial assistance through the Invest Nova Scotia Fund to foster an economic environment to achieve sustained economic development and growth, with economic development incentives that have broad benefits across sectors, innovation systems or regions. Decisions with regard to the Fund are made by a board of directors independent of government.
Venture Corporations Act
The Province has provided a source of equity capital to registered venture corporations to encourage the development of small business in Nova Scotia. Venture corporations in turn provide assistance in the development of small enterprises by providing equity capital, business and managerial expertise. Outstanding assistance is currently managed under this Act, but no new funding is being provided under this program.
Finance Act
The Governor-in-Council may authorize the Minister of Finance & Treasury Board to lend money to a Government Business Enterprise or a Governmental Unit.
46
PROVINCIAL DEBT
Funded Debt
The following table sets forth the funded debt of the Province for the General Revenue Fund as described in “Government Finance – Specific Accounting Policies” above, outstanding at March 31 in each of the five fiscal years ended March 31, 2012 through to March 31, 2016, each as audited under the Province’s accounting policies in effect at the time. Figures have not been restated for accounting changes, and as a result may not be directly comparable.
FUNDED DEBT FOR THE GENERAL REVENUE FUND(1)
| | | | | | | | | | | | | | | | | | | | |
| | | 2012 | | | 2013 | | | 2014(2) | | | 2015 | | | 2016 | |
| | | (millions $) | |
General Revenue Fund Funded Debt: | | | | | | | | | | | | | | | | | | | | |
Payable in Canadian Dollars | | | | | | | | | | | | |
Canadian Pension Plan Fund (3)(4) | | $ | 1,079.4 | | | $ | 1,079.4 | | | $ | 1,079.4 | | | $ | 1,079.4 | | | $ | 1,079.4 | |
Other | | | 13,616.9 | | | | 14,005.6 | | | | 14,007.4 | | | | 14,557.4 | | | | 14,619.9 | |
| | | 14,696.3 | | | | 15,084.9 | | | | 15,086.7 | | | | 15,636.7 | | | | 15,699.3 | |
| | | | | | | | | | | | | | | | | | | | |
Other Long-term Indebtedness (5) | | | 286.8 | | | | 265.0 | | | | 236.6 | | | | 288.8 | | | | 242.9 | |
| | | | | | | | | | | | | | | | | | | | |
Total General Revenue Fund Funded Debt | | $ | 14,983.1 | | | $ | 15,350.0 | | | $ | 15,323.4 | | | $ | 15,925.5 | | | $ | 15,942.1 | |
| | | | | | | | | | | | | | | | | | | | |
Less: Sinking Funds and Public Debt Management Fund (4)(6) | | | 2,539.0 | | | | 2,694.2 | | | | 2,531.1 | | | | 2,675.8 | | | | 2,595.8 | |
| | | | | | | | | | | | | | | | | | | | |
Net Funded Debt (7) | | $ | 12,444.2 | | | $ | 12,655.8 | | | $ | 12,792.3 | | | $ | 13,249.7 | | | $ | 13,346.4 | |
| | | | | | | | | | | | | | | | | | | | |
Per Capita ($) (8) | | $ | 13,175.4 | | | $ | 13,393.8 | | | $ | 13,558.3 | | | $ | 14,046.1 | | | $ | 14,147.1 | |
As a Percentage of: | | | | | | | | | | | | | | | | | | | | |
Household Income (8) | | | 34.9 | % | | | 34.5 | % | | | 33.9 | % | | | 34.2 | % | | | 33.4 | % |
Gross Domestic Product at Market Prices (8) | | | 33.1 | % | | | 33.4 | % | | | 33.1 | % | | | 33.7 | % | | | 33.2 | % |
| (1) | As of February 6, 2017, there were debt retirements of $862.5 million, and a debt issuance of $650 million in 2016-2017. |
| (2) | During fiscal year 2014-2015, a correction resulted in a reclassification to the 2014 Accounts increasing Other General Revenue Fund Funded debt by $14.5 million and decreasing Other Long-term Indebtedness by the same amount. The reclassification had no impact on Net funded Debt |
| (3) | Debentures held by the Canada Pension Plan Fund are payable 30 years after their respective dates of issue, are not negotiable, are not transferable or assignable, but are redeemable in whole or in part before maturity at the option of the Minister of Finance of Canada, on six months’ prior notice, if deemed necessary to meet the requirements of the Canada Pension Plan. |
| (4) | Debentures payable in foreign currencies and related sinking funds invested in foreign currencies are reflected at rates of the currency-swap contracts. |
| (5) | Other long-term indebtedness includes capital leases, for the General Revenue Fund, in the amounts of $$273.9 million, $249.1 million, $223.3 million, $195.1 million and $165.0 million for the fiscal years ended, 2012, 2013, 2014, 2015 and 2016 respectively. |
| (6) | At March 31, 2016, the Public Debt Management Fund held $166.8 million that is available to repay or retire debentures of the Province at the discretion of the Governor-in-Council. |
| (7) | Funded debt does not include any unfunded pension liabilities or other retirement benefits of the Province. |
| (8) | Population at July 1 for the previous calendar year. Household Income (Personal Income has been replaced with Household Income by Statistics Canada, the concepts are similar) and Gross Domestic Product at Market Prices for the previous calendar year. |
In addition to the debt of the General Revenue Fund, there is funded debt with other entities that comprise part of the Consolidated Entity. The major entities not included in the General Revenue Fund are Nova Scotia Power Finance Inc., the Housing Nova Scotia, and the Nova Scotia Municipal Finance Corporation. As at March 31, 2016, total funded debt of the Consolidated Entity was $16,859.4 million.
47
Derivative Financial Instruments
The Province is party to financial instruments with off-balance sheet risk, either to hedge against the risks associated with fluctuations in foreign exchange rates or to manage risks associated with interest rate fluctuations. Foreign currency contracts are used by the Province to convert the liability for foreign currency borrowing and associated costs into Canadian dollars. The Province uses interest rate swap contracts to convert certain interest payments from fixed interest rates to floating interest rates, and from floating interest rates to fixed interest rates.
The Department of Finance and Treasury Board credit policy states that it executes derivative transactions only with counterparties that have a minimum credit rating of “A” with a stable outlook as determined by major credit rating agencies.
As at March 31, 2016, the Province had outstanding 37 interest rate swap contracts to convert certain interest payments from a fixed to floating, from floating to fixed, or fixed to fixed basis. These swaps have terms remaining of 0.8 to 14.6 years, a notional principal value of $1.5 billion and a mark-to-market value of ($4.4) million. (Mark to Market is an indication of the swap’s market value at a certain date. This represents the estimated realizable gain (loss), and is equivalent to the present value of future savings (losses) based on market conditions as at March 31, 2016.)
The Province has also executed numerous foreign currency swap contracts to convert foreign currency denominated debt into Canadian dollar denominated debt. The mark-to-market of these swap contracts are as follows:
| | | | | | | | | | | | | | | | | | | | |
Termination Date | | Original
Currency | | | Original
Principal | | | Current
Currency | | | Current
Principal | | | Mark to
Market | |
| | | | | | (thousands) | | | | | | (thousands
Canadian $) | | | (millions
Canadian$) | |
SWAPS: | | | | | | | | | | | | | | | | | | | | |
April 16, 2019 | | UK£ | | | | | 60,000 | | | CDN$ | | | | $ | 114,387 | | | ($ | 2.8 | ) |
| | | | | | | | | | | | | | | | | | | | |
Sub-total: | | UK£ | | | | | 60,000 | | | CDN$ | | | | | 114,387 | | | | (2.8 | ) |
| | | | | | | | | | | | | | | | | | | | |
January 26, 2017 | | US$ | | | | | 500,000 | | | CDN$ | | | | | 562,470 | | | | 108.0 | |
February 1, 2019 | | US$ | | | | | 200,000 | | | CDN$ | | | | | 198,000 | | | | 64.9 | |
July 1, 2019 | | US$ | | | | | 200,000 | | | CDN$ | | | | | 199,900 | | | | 56.7 | |
November 15, 2019 | | US$ | | | | | 244,000 | | | CDN$ | | | | | 246,318 | | | | 71.0 | |
March 1, 2020 | | US$ | | | | | 300,000 | | | CDN$ | | | | | 409,200 | | | | (24.0 | ) |
May 1, 2021 | | US$ | | | | | 300,000 | | | CDN$ | | | | | 312,002 | | | | 85.9 | |
April 1, 2022 | | US$ | | | | | 300,000 | | | CDN$ | | | | | 379,517 | | | | 14.3 | |
July 30, 2022 | | US$ | | | | | 300,000 | | | CDN$ | | | | | 329,310 | | | | 58.0 | |
| | | | | | | | | | | | | | | | | | | | |
Sub-total: | | US$ | | | | | 2,344,000 | | | CDN$ | | | | | 2,636,717 | | | $ | 434.8 | |
| | | | | | | | | | | | | | | | | | | | |
Grand total: | | | | | | | | | | | | | | $ | 2,751,104 | | | $ | 432.0 | |
| | | | | | | | | | | | | | | | | | | | |
Debt Maturities and Sinking Funds
The following table sets forth the maturities of total funded debt and related sinking fund balances, at March 31, 2016, from the General Revenue Fund as described in “Government Finance – Specific Accounting Policies” above, adopting the accounting policies, other than consolidation of government entities, described in “Government Finance – Specific Accounting Policies” above. At March 31, 2016, all debt denominated in currencies other than Canadian dollars had been swapped to Canadian dollars.
48
SCHEDULE OF DEBT MATURITIES, CAPITAL LEASE PRINCIPAL PAYMENTS
AND RELATED SINKING FUND BALANCES FOR THE GENERAL REVENUE FUND (1)
| | | | | | | | |
| Period Ending | | Total Debt in | | | | |
March 31 | | Canadian | | | | |
| | | Dollars (2) | | | Sinking Funds (3) | |
| | | (in millions) | |
Public Debt Management Fund | | | | | | $ | 166.8 | |
Sinking Fund General | | | | | | | 700.0 | |
2017 | | | 1,072.6 | | | | — | |
2018 | | | 459.7 | | | | — | |
2019 | | | 1,259.1 | | | | 166.1 | |
2020 | | | 1,970.8 | | | | 731.0 | |
2021 | | | 1,078.8 | | | | — | |
2022 | | | 1,711.6 | | | | 357.5 | |
| | | | | | | | |
2017-2022 | | | 7,552.7 | | | | 1,254.6 | |
| | | | | | | | |
2023-2027 | | | 1,398.1 | | | | 474.3 | |
2028-2032 | | | 850.0 | | | | — | |
2033-2037 | | | 1,151.4 | | | | — | |
2038-2042 | | | 2,070.2 | | | | — | |
2043-2047 | | | 1,430.8 | | | | — | |
2048-2066 | | | 1,488.8 | | | | — | |
| | | | | | | | |
| | $ | 15,942.1 | | | $ | 2,595.8 | |
| | | | | | | | |
| (1) | This includes debt of public schools, courthouses, and certain capital lease obligations. |
| (2) | Canadian dollar-equivalent at rates of exchange in effect on swap contracts at March 31, 2016. |
| (3) | In addition to these Sinking Funds, there are funds available for debt retirement in the Public Debt Management Fund that is comprised of $166.8 million in assets at March 31, 2016. During the fiscal year 2015-2016, a $26.3 million contribution was made to Sinking Funds, and total earnings of the Sinking Fund and Public Debt Management Fund were $96.0 million. There was one redemption from the restricted sinking fund of $204 million. |
Until March 31, 2003, the Province provided sinking fund installments for all of its term debt issues except Canada Pension Plan (“CPP”) and Medium Term Notes (“MTN”) issues. As of March 31, 2003, sinking funds held for public issues without a sinking fund bond covenant, as well as CPP and MTN issues, have been moved to the “Sinking Fund General”, and are available at the discretion of the Minister of Finance and Treasury Board to retire maturing debt issues. The Province continues to make sinking fund installments for those debentures that contain sinking fund bond covenants. On those issues, annual sinking fund installments generally range from one to three per cent of the original issue, but may vary slightly from year to year, based on actual and anticipated rates of return on sinking fund assets. Sinking funds are treated as restricted assets and are used solely for debt retirement.
Sinking fund assets are recorded at cost, which includes premiums and discounts associated with the purchase of these investments. These premiums and discounts are amortized on a straight-line basis over the term of the related investment. The unamortized portion of the premiums and discounts are included as part of the value of sinking funds. As of March 31, 2016, the net unamortized premium was $28.9 million.
49
Annual cash contributions into the sinking fund and Public Debt Management Fund are invested in approved securities. Assets consist primarily of debentures of the provinces and Government of Canada with floating and fixed interest rates. Regarding the latter, the fixed interest rates on funds held at March 31, 2016, ranged from 2.1% to 9.6%, for Canadian funds, and from 8.25% to 9.50%, for U.S. funds. Earnings on investments are retained and reinvested in each of the sinking funds and Public Debt Management Fund. Sinking funds for debentures payable in U.S. currency are maintained in both Canadian and U.S. dollars. Debentures payable in foreign currencies, accrued interest thereon, and related sinking funds invested in foreign currencies are reflected in the accounts of the Province at the rate associated with the swap contract.
As at March 31, 2016, the General Revenue Fund held financial assets in the sinking funds and Public Debt Management Fund totaling $2,595.8 million. Total market value of both funds was $2,900.7 million at March 31, 2016.
At March 31, 2016, the Province held $493.9 million in carrying value of its own debentures (carrying value of $559.2 million at March 31, 2015) in sinking funds and Public Debt Management Fund as investments. Of the $2,595.8 million the Province held in financial assets for debt retirement at March 31, 2016, $166.8 million is held in the Public Debt Management Fund, $700.0 million in the Sinking Fund General, and $1,728.9 million in restricted sinking funds.
The following table sets forth the sinking funds, by currency, of funded debt of the Province for the General Revenue Fund (as described in “Government Finance – Specific Accounting Policies” above) at March 31, 2016, adopting the accounting policies, other than consolidation of government entities, described in “Government Finance – Specific Accounting Policies” above.
PROVINCIAL RESTRICTED SINKING FUNDS FOR THE GENERAL REVENUE FUND
| | | | |
| | | As at March 31, 2016 | |
| | | (in millions) | |
For Issues Payable in: | | | | |
Canadian Dollars | | $ | 134.3 | |
United States Dollars(1) | | | 1,594.6 | |
| | | | |
| | $ | 1,728.9 | |
| | | | |
| (1) | Canadian dollar-equivalent at rates of exchange in effect on swap contracts at March 31, 2016. |
Based on rates of return on investments held in the sinking funds and the schedule of maturities for debt outstanding at March 31, 2016, the Province estimates debt refinancing requirements (net principal repayments, capital lease payments and sinking fund contributions) for the Consolidated Entity to be $1,101.2 million for the fiscal year 2016-2017, $507.5 million for the fiscal year 2017-2018, $1,301.2 million for the fiscal year 2018-2019, and $2,007.2 million for the fiscal year 2019-2020, and $1,110.5 for the fiscal year 2020-2021.
50
Current Liabilities
The following table sets forth the amount of short-term debt of the Consolidated Entity (as described in “Government Finance – Specific Accounting Policies” above) for the fiscal years 2012, 2013, 2014, 2015 and 2016, adopting the accounting policies as described in “Government Finance – Specific Accounting Policies” above.
SHORT-TERM DEBT FOR THE CONSOLIDATED ENTITY
| | | | | | | | | | | | | | | | | | | | |
| | | Fiscal years Ended March 31 | |
| | | Restated
2012(1) | | | Restated
2013(2) | | | 2014 | | | 2015 | | | 2016 | |
| | | (Millions $) | |
Bank Advances and Short-term Borrowings | | $ | 405.2 | | | $ | 550.4 | | | $ | 539.6 | | | $ | 549.9 | | | $ | 576.2 | |
Accounts Payable & Accrued Liabilities | | | 1,673.6 | | | | 1,796.1 | | | | 2,030.1 | | | | 1,931.6 | | | | 1,937.2 | |
Accrued Interest | | | 216.6 | | | | 221.6 | | | | 209.7 | | | | 215.8 | | | | 216.8 | |
| | | | | | | | | | | | | | | | | | | | |
| | $ | 2,295.4 | | | $ | 2,568.1 | | | $ | 2,779.4 | | | $ | 2,697.3 | | | $ | 2,730.2 | |
| | | | | | | | | | | | | | | | | | | | |
| (1) | Restated to reflect changes in accounting policies during fiscal year 2012-2013. See “Government Finance –Accounting Changes to the 2012 Accounts”. |
| (2) | Restated to reflect changes in accounting policies during fiscal year 2013-2014. See “Government Finance –Accounting Changes to the 2013 Accounts” |
Offsetting the above current liabilities, current assets (cash and short-term investments, accounts receivable, and loans receivable) for the Consolidated Entity at March 31, 2016 totaled $3,951.3 million.
Guaranteed Debt
The Province provides the guarantee of repayment on certain payment obligations to third parties. The majority of guarantees are related to social housing, economic development initiatives and student loans. All guaranteed debt is payable in Canadian dollars. The following table sets forth the guaranteed debt of the Consolidated Entity, excluding MFC debt that is guaranteed by the Province that is also owned by the Province, which is eliminated upon consolidation, for the fiscal years 2012, 2013, 2014, 2015 and 2016. All guaranteed debt is denominated in Canadian dollars.
GUARANTEED DEBT FOR CONSOLIDATED ENTITY
| | | | | | | | | | | | | | | | | | | | |
| | | Fiscal years Ended March 31 | |
| | | 2012 | | | 2013 | | | 2014 | | | 2015 | | | 2016 | |
| | | (Millions $) | |
Total Guaranteed Debt | | $ | 152.1 | | | $ | 143.3 | | | $ | 138.6 | | | $ | 124.0 | | | $ | 118.3 | |
| | | | | | | | | | | | | | | | | | | | |
Deduct: | | | | | | | | | | | | | | | | | | | | |
Provision for Guarantee Payout | | | (23.1 | ) | | | (24.1 | ) | | | (15.9 | ) | | | (11.9 | ) | | | (5.8 | ) |
| | | | | | | | | | | | | | | | | | | | |
Net Guarantees not Reflected in Statements | | $ | 129.0 | | | $ | 119.2 | | | $ | 122.7 | | | $ | 112.1 | | | $ | 112.5 | |
| | | | | | | | | | | | | | | | | | | | |
The table for guaranteed debt for the Consolidated Entity does not include the $739.1 million of gross debt, as at March 31, 2016, of the Nova Scotia Power Finance Corporation debt guaranteed by the Province of Nova Scotia, which has been fully defeased.
51
Pension Funds
The Province evaluates its pension funds using two methods. The first method, as prescribed by the CPA of Canada, measures a plan sponsor’s potential liability, with rates of return based on management’s best estimate (and gains and losses amortized over time). The financial statements of the Province’s pension plans calculated on this basis are provided in Note 7 to the Public Accounts included as Province’s Exhibit (3) to the Form 18-K/A, Amendment No. 1 for the fiscal year ended March 31, 2015. The second method, used for the purpose of determining the funded status of the plan on a going-concern basis, as well as the total current service cost and contributions to the plan for the upcoming year, uses a rate of return based on management’s best estimate less a margin for conservatism. The tables and discussions included in the following section are shown using the latter funding basis of calculation.
Public Service Superannuation Fund
The Public Service Superannuation Plan (“PSSP”) is governed by its own pension legislation, the Public Service Superannuation Act, which was extensively updated in April 2012. The PSSP transitioned to a joint governance structure on April 1, 2013. Prior to that date the Minister of Finance and Treasury Board was sole trustee. The trustee of the Public Service Superannuation Plan is the Public Service Superannuation Plan Trustee Inc (“PSSPTI”). At the direction of, and under the oversight of the trustee, the Nova Scotia Pension Services Corporation administers the PSSP.
Due to the 2012 legislative changes, the Province no longer has legal liability for the PSSP as of April 1, 2013, and therefore no longer carries an asset or liability associated with the PSSP on its financial statements. The Province’s pension expenses for the PSSP are now limited to contributions paid to the PSSP as an employer, which are equal to the employee contributions. The contribution rate is set by PSSPTI pursuant to the funding policy and is set for a five year cycle. Based on PSSPTI’s review of the PSSP’s funded health as of March 31, 2015, indexing of 0.85 per cent per year was approved for January 1, 2016 to January 1, 2020 and no changes to member and employer plan contribution. The Province’s employer contributions to the PSSP from the General Revenue Fund in 2015-2016 were $82.2 million.
Provincial legislation and regulations provide that certain payments to pensioners are charged to the General Revenue Fund rather than to the Superannuation Fund. These payments, total and net of recoveries, amounted to $22.6 million and $17.0 million, respectively, for the fiscal year ended March 31, 2016.
Teachers’ Pension Fund
Until April 1, 2006, the Minister of Finance & Treasury Board was the trustee of the Teachers’ Pension Fund (the “Teachers’ Fund”). Effective April 1, 2006, under a joint trust agreement between the Province of Nova Scotia and the Nova Scotia Teachers’ Union, the Teachers’ Pension Plan Trustee Incorporated replaced the Minister of Finance & Treasury Board as trustee.
On June 12, 2014, the Government of Nova Scotia and the Nova Scotia Teachers Union agreed to changes to the Teachers’ Pension Plan. The contribution rate increased by three percentage points and the disability pension provisions moved from the pension plan to the teachers’ long-term disability insurance plan. The contribution rate increase is to be spread over three years, with a one percentage point increase beginning August 1, 2014.
Teachers employed by the school boards and Nova Scotia Community College are entitled to receive pension benefits pursuant to the provisions of a plan established under the Teachers’ Pension Act. Employees’ and matching employer contributions are paid into the Teachers’ Fund, while pensions, refunds and transfer values are paid from it. The Teachers’ Fund is invested in Federal, provincial, municipal and corporate securities, hedge funds and real estate.
The annual financial statements of the Teachers’ Fund are audited by an auditor appointed by the trustee. The auditor for the most recent financial statements was KPMG. The following table sets the continuity of the Teachers’ Fund, as audited, for the five fiscal years ended December 31, 2015.
52
STATEMENT OF CHANGES IN NET ASSETS AVAILABLE FOR BENEFITS OF THE
TEACHERS’ PENSION FUND
| | | | | | | | | | | | | | | | | | | | |
| | | Fiscal Year Ended December 31 | |
| | | 2011 | | | 2012 | | | 2013(1) | | | 2014 | | | 2015 | |
| | | (in millions) | |
Opening Balance | | $ | 4,223.6 | | | $ | 4,024.7 | | | $ | 4,235.6 | | | $ | 4,559.3 | | | $ | 4,729.0 | |
| | | | | | | | | | | | | | | | | | | | |
Add: | | | | | | | | | | | | | | | | | | | | |
Employee Contributions | | | 67.5 | | | | 66.4 | | | | 68.8 | | | | 72.3 | | | | 83.7 | |
Employer Contributions | | | 73.7 | | | | 79.1 | | | | 73.9 | | | | 80.1 | | | | 96.6 | |
Income Earned and change in Market | | | | | | | | | | | | | | | | | | | | |
Value of Investments | | | 31.3 | | | | 454.0 | | | | 575.6 | | | | 415.8 | | | | 237.0 | |
Transfers from other pension plans | | | 2.2 | | | | 1.9 | | | | 1.1 | | | | 3.1 | | | | 1.1 | |
| | | | | | | | | | | | | | | | | | | | |
| | | 174.7 | | | | 601.4 | | | | 719.3 | | | | 571.3 | | | | 418.4 | |
| | | | | | | | | | | | | | | | | | | | |
| | | 4,398.2 | | | | 4,626.1 | | | | 4,954.9 | | | | 5,130.6 | | | | 5,147.4 | |
| | | | | | | | | | | | | | | | | | | | |
Deduct: | | | | | | | | | | | | | | | | | | | | |
Pensions Paid | | | 351.0 | | | | 361.6 | | | | 371.5 | | | | 376.7 | | | | 381.6 | |
Refunds & Transfers Out | | | 1.1 | | | | 3.4 | | | | 5.3 | | | | 4.9 | | | | 3.9 | |
Operating Expenses | | | 21.4 | | | | 25.4 | | | | 18.8 | | | | 19.9 | | | | 21.5 | |
| | | | | | | | | | | | | | | | | | | | |
| | | 373.5 | | | | 390.4 | | | | 395.6 | | | | 401.6 | | | | 406.9 | |
| | | | | | | | | | | | | | | | | | | | |
Closing Balance | | $ | 4,024.7 | | | $ | 4,235.6 | | | $ | 4,559.3 | | | $ | 4,729.0 | | | $ | 4,740.5 | |
| | | | | | | | | | | | | | | | | | | | |
| (1) | Reclassified investment management and performance fees during fiscal year ending December 31, 2014 for comparative year ending December 31, 2013. Investment management and performance fees were accounted as out-of-pocket expense under operating expense, but are now netted against the change in the value of investments to reflect consistency with other pension plans. |
The latest actuarial valuation, for funding purposes, of the Teachers’ Fund was performed by Eckler Limited as at December 31, 2015. The major economic and demographic assumption used in the December 31, 2015 valuation remained unchanged from those used in the December 31, 2014 valuation, with the exception of inflation which changed to 2.0% from 2.25% and salary increases which changed to 2.0% from 2.25% per annum. The assumption for promotional salary increases continues to range from 0.00% to 3.25%. The discount rate (total rate of return on assets) changed in the December 31, 2015 valuation to 6.25%, down from the previous assumption of 6.40%. The assumed retirement age remained unchanged from a 50% probability of active members who achieve eligibility for an unreduced pension under the rule of 85 prior to age 62 retiring when they first become eligible and the remainder of active members and all inactive members retiring at the earliest of; (i) age 65 with 2 years of services, (ii) 35 years of service, and (iii) age 62 with 10 years of service. The mortality table also remained unchanged from the 2014 Public Sector Mortality Table projected generationally with CPM Improvement Scale B. The actuarial valuation indicated that at December 31, 2015, the Teachers’ Fund had actuarial liabilities with a present value of $6,179.1 million, assets of $4,740.5 million, resulting in an unfunded liability of $1,438.6 million and a funded ratio of 76.7%.
The benefit of any actuarial surpluses or the responsibility for any actuarial deficits are shared equally by the Province and the beneficiaries of the Fund.
Sydney Steel Corporation Superannuation Fund
The Sydney Steel Corporation Superannuation Fund was established under the Sydney Steel Corporation Sale Act effective February 28, 2001. The Fund assumed responsibility for the assets and obligations of the former Sydney Steel Corporation pension plans. Under subsection 7(9) of the Sydney Steel Corporation Sale Act, the Province of Nova Scotia has assumed responsibility to fund any shortfalls arising under this Fund. Three pension plans are covered by the Fund.
| | • | | United Steelworkers of America Pension Plan is a non-contributory defined benefit plan that covers employees of Sydney Steel Corporation who are member of Locals 1064, 6516, 6537 of the United Steelworkers of America. Under the plan, contributions were made only by Sydney Steel Corporation. |
53
| | • | | Salaried Pension Plan is a partially contributory defined pension plan covering the salaried employees of Sydney Steel Corporation. Under the plan, contributions were made by plan members and by Sydney Steel Corporation. |
| | • | | Canadian Union of Public Employees’ Pension Plan is a non-contributory defined benefit plan that covers employees of Sydney Steel Corporation who are members of Local 1675 of the Canadian Union of Public Employees. Under the plan, contributions were made only by Sydney Steel Corporation. |
Grant Thornton audits the annual financial statements of the Sydney Steel Corporation Superannuation Fund.
There are no active pension plan members in the Sydney Steel Corporation Superannuation plan. As at March 31, 2007 the United Steelworkers of America Pension Plan and the Canadian Union of Public Employees’ Pension Plan were exhausted of funds. The funds of the Salaried Pension Plan were exhausted in October 2007. All benefit payments and administration expenses are funded by the Minister of Finance and Treasury Board through special payments to the Fund from the Province’s General Revenue Fund. The Province has provided the following payments in recent years: $19.2 million in 2011-2012, $18.3 million in 2012-2013, $17.3 million in 2013-2014, $16.3 million in 2014-2015, and $15.0 million in 2015-2016.
The most recent actuarial valuations of the three pension plans funded from the Sydney Steel Corporation Superannuation Fund were performed by Mercer as at September 30, 2014 and extrapolated to March 31, 2015. During 2016 Eckler Limited became the new Fund Consultant and extrapolated the March 31, 2014 actuarial valuations to March 31, 2016. The major economic and demographic assumptions used in an extrapolation to March 31, 2016 included a discount rate of 3.71%, an inflation rate of 2.0% and a 100% probability that a member would retire at the earliest age at which he or she would be eligible for an unreduced pension. The actuarial valuations performed on September 30, 2014 and extrapolated to March 31, 2016 indicate the plans had a combined unfunded pension liability of $160.0 million, allocated as follows: United Steelworkers of America Pension Plan had $114.7 million, Salaried Pension Plan had $43.3 million, and Canadian Union of Public Employees’ Pension Plan had $1.9 million.
54
PUBLIC SECTOR FUNDED DEBT
Public Sector Funded Debt
The debt burden for which the Province is responsible consists of the funded debt and guaranteed debt of the Consolidated Entity. Debt of the Consolidated Entity includes debt borrowed by the Province, the proceeds of which are lent to municipalities through the Municipal Finance Corporation (“MFC”). This debt does not include the debt of municipalities that is either borrowed from the Federal Government or third party sources. Borrowings by municipalities from the Federal Government or third party sources are not material. By law, municipalities may only incur debt with financial institutions on a short-term basis until long-term financing is arranged with the MFC. Also, Debt of the Consolidated Entity does not include debt of Government Business Enterprises totaling $70.8 million, which is deemed to be self-supporting. For further information regarding the Government Business Enterprises, see Schedule 6 to the “Public Accounts for the fiscal year 2015-2016, Volume 1,” which is Exhibit (3) to the Province’s Form 18-K/A, Amendment No. 1 for the fiscal year ended March 31, 2015.
The following table sets forth the Consolidated Entity outstanding and guaranteed funded debt for the five fiscal years ended March 31, 2012 through to March 31, 2016.
CONSOLIDATED ENTITY FUNDED DEBT (1)
| | | | | | | | | | | | | | | | | | | | |
| | | 2012 | | | 2013 | | | 2014 | | | 2015 | | | 2016 | |
| | | (in millions unless otherwise indicated) | |
General Revenue Fund Funded Debt(2) | | $ | 14,983.1 | | | $ | 15,350.0 | | | $ | 15,323.4 | | | $ | 15,925.5 | | | $ | 15,942.1 | |
Miscellaneous Debt(3) | | | 5.8 | | | | 11.3 | | | | 9.5 | | | | 8.0 | | | | 10.1 | |
Debt of the Consolidated Entity | | | 14,988.9 | | | | 15,361.3 | | | | 15,332.9 | | | | 15,933.5 | | | | 15,952.2 | |
| | | | | | | | | | | | | | | | | | | | |
Guarantees of the Consolidated Entity: | | | | | | | | | | | | | | | | | | | | |
Industrial Development and Other | | | 55.7 | | | | 56.0 | | | | 61.6 | | | | 57.1 | | | | 61.8 | |
Mortgages(4) | | | 96.4 | | | | 87.2 | | | | 77.0 | | | | 66.9 | | | | 56.5 | |
| | | | | | | | | | | | | | | | | | | | |
Total Guaranteed Debt | | | 152.1 | | | | 143.3 | | | | 138.6 | | | | 124.0 | | | | 118.3 | |
| | | | | | | | | | | | | | | | | | | | |
Total Consolidated Entity Funded Debt & Guaranteed Debt | | | 15,141.0 | | | | 15,504.6 | | | | 15,471.5 | | | | 16,057.5 | | | | 16,070.5 | |
| | | | | | | | | | | | | | | | | | | | |
Deduct Sinking Funds and Debt Management Fund | | | 2,539.0 | | | | 2,694.2 | | | | 2,531.1 | | | | 2,675.8 | | | | 2,595.8 | |
| | | | | | | | | | | | | | | | | | | | |
Net Funded Debt & Guaranteed Debt of the Consolidated Entity | | $ | 12,602.0 | | | $ | 12,810.4 | | | $ | 12,940.4 | | | $ | 13,381.7 | | | $ | 13,474.8 | |
| | | | | | | | | | | | | | | | | | | | |
Per Capita ($) (5) | | $ | 13,342.5 | | | $ | 13,557.4 | | | $ | 13,715.3 | | | $ | 14,186.1 | | | $ | 14,283.2 | |
As a Percentage of: | | | | | | | | | | | | | | | | | | | | |
Household Income (5) | | | 35.3 | % | | | 34.9 | % | | | 34.3 | % | | | 34.6 | % | | | 33.8 | % |
Gross Domestic Product at Market Prices (5) | | | 33.5 | % | | | 33.9 | % | | | 33.5 | % | | | 34.1 | % | | | 33.5 | % |
| (1) | Debentures payable in foreign currencies and related sinking funds invested in foreign currencies are reflected at rates of exchange in currency-swap contracts. This measure of debt does not include the debt of Government Business Enterprises. |
| (2) | See table on “Funded Debt for the General Revenue Fund”, for more detailed information on this figure. |
| (3) | Miscellaneous debt does not include debt of Housing Nova Scotia ($168.1 million at March 31, 2016), a Provincial crown corporation, which debt is secured by mortgages held by the Corporation, or NS Power Finance Corporation ($739.1 million at March 31, 2016), as this debt is fully defeased. |
| (4) | The Province guarantees certain debt of the student loan program and industrial development agencies, and mortgages of Housing Nova Scotia. |
| (5) | Population as of July 1 of the preceding calendar year, Household Income and Gross Domestic Product at market prices are for the previous calendar year. |
55
CERTAIN CROWN CORPORATIONS AND AGENCIES
Crown corporations and agencies are special purpose entities to which the Province has delegated responsibility for the operation of certain of its programs. These entities are subject to policy direction by the Government and have been provided with financial assistance from the Province, where required, either through debt guarantees, loans, equity investments, or grants. See “Government Finance – Loans and Investments”, and “Provincial Debt – Guaranteed Debt”. The Province prepares Consolidated Financial Statements whereby the operating results of the crown corporations and agencies became part of the consolidated Provincial surplus / (deficit).
Sydney Steel Corporation and Sydney Tar Ponds Agency
Sydney Steel Corporation (“Sysco”), a Provincial Crown Corporation established by an Act of the House of Assembly in 1967, owned a steel mill in Sydney, Nova Scotia that ceased operations in July 2000. With the Corporation’s operations being discontinued, work was undertaken to dismantle and sell the remaining assets, perform environmental cleanup, and conduct development activities for future land use. Sysco will continue to exist to address residual issues arising from historic operations.
The Sydney Tar Ponds was a hazardous chemical waste site adjacent to Sysco created by discharges from Sysco’s coke ovens into an adjacent creek. Engineering and environmental studies generated estimates for the cost of remediation of the Sydney Steel Corporation and adjacent sites as well as the Sydney Tar Ponds site. The Province recorded liabilities totaling $318.5 million in 2000, and in 2006-2007 there was a further $58.8 million contributed by Sydney Steel Corporation to the environmental site clean-up provision (Sysco Decommissioning Fund). At March 31, 2016, $70.8 million remains unspent in the Sysco Decommissioning Fund. The provision will continue to be utilized for long-term maintenance and monitoring of the Sydney Tar Ponds site. Based on currently available information, the provision, in aggregate, appears to be sufficient to cover the estimated costs to remediate these sites.
Nova Scotia Municipal Finance Corporation
Nova Scotia Municipal Finance Corporation (“MFC”) acts as a central borrowing agency for municipalities and municipal enterprises in Nova Scotia. The MFC also has two loans to provincial health authorities. Under the incorporating legislation, municipalities and municipal enterprises are required to raise their long-term capital requirements through the MFC except for borrowings from the Federal Government, the Province, another municipality, or their agencies. At March 31, 2016, the outstanding borrowings by municipalities ($607.7 million), municipal enterprises ($205.7 million) and health authorities ($5.5 million) from the MFC stood at $818.9 million.
Nova Scotia Power Finance Corporation
On August 12, 1992, the Province of Nova Scotia completed the public sale of all the common shares of Nova Scotia Power Inc. (“NSPI”), an electric utility that had assumed the net operating assets of Nova Scotia Power Corporation (“NSPC”). Prior to that date, the utility was a Provincial Crown Corporation. Neither the Province nor Nova Scotia Power Finance Corporation will guarantee, assume or otherwise be responsible for any obligations of NSPI, and NSPI agreed to indemnify Nova Scotia Power Finance Corporation and the Province against any claims arising out of the liabilities and commitments assumed by NSPI.
In accordance with the Nova Scotia Power Corporation Privatization Agreement passed in 1992, the Nova Scotia Power Finance Corporation provided for defeasance of its debt. The portfolio of defeasance assets consists of Nova Scotia Power Corporation, other provincial government and utilities, Federal Government and Federal U.S. Treasury bonds, coupons or residuals.
56
FOREIGN EXCHANGE
Canada maintains a floating exchange rate for the Canadian dollar, which permits the rate to be determined by fundamental market forces without intervention except as required to maintain orderly market conditions.
Closing spot exchange rates for the U.S. dollar in Canada, expressed in Canadian dollars per U.S. dollar, are shown in the table below for 2012 through 2016.
| | | | | | | | | | | | | | | | | | | | |
| Daily Closing Rates | | 2012 | | | 2013 | | | 2014 | | | 2015 | | | 2016 | |
High | | | 1.0397 | | | | 1.0704 | | | | 1.1656 | | | | 1.3965 | | | | 1.4559 | |
Low | | | 0.9683 | | | | 0.9838 | | | | 1.0639 | | | | 1.1749 | | | | 1.2536 | |
Close | | | 0.9949 | | | | 1.0636 | | | | 1.1601 | | | | 1.3840 | | | | 1.3427 | |
Average Noon | | | 0.9996 | | | | 1.0299 | | | | 1.1045 | | | | 1.2787 | | | | 1.3245 | |
Source: Bank of Canada
On March 31, 2016 the noon rate for the US dollar in Canada, as reported by the Bank of Canada, was $1.2971.
Unless otherwise specified or the context otherwise requires, the following table sets forth the conversion rates used in this Annual Report for foreign currency borrowings.
| | | | | | | | | | | | |
| | | | | | US | | | Pound | |
| Noon Rate | | at March 31 | | | Dollar | | | Sterling | |
| | | 2012 | | | | 0.9975 | | | | 1.5970 | |
| | | 2013 | | | | 1.0156 | | | | 1.5417 | |
| | | 2014 | | | | 1.1053 | | | | 1.8430 | |
| | | 2015 | | | | 1.2683 | | | | 1.8834 | |
| | | 2016 | | | | 1.2971 | | | | 1.8652 | |
57
OFFICIAL STATEMENTS
The Minister of Finance and Treasury Board or his authorized representatives acting in their official capacities have supplied the information set forth in this Exhibit to Form 18-K.
58
TABLE 1 - STATEMENT OF DEBENTURES OUTSTANDING AS AT MARCH 31, 2016
| | | | | | | | | | | | | | | | | | |
Public Debt Management Fund | | $ | 166,821,651 | |
Sinking Fund General | | $ | 700,022,751 | |
Canada Pension Plan Fund (A) | |
| | | | | | | | | | | | | | | | | | | | | | | | | | | | | | |
| Series | | | | Date Of Issue | | | Maturity Date | | | Amount Outstanding (in thousands) | | | | | | Coupon Rate | | | Canadian Dollars | | | Sinking Funds (B) | |
C36 | | | | | 01-Mar-99 | | | | 01-Mar-19 | | | $ | 27,102,000 | | | | CAD | | | | 5.870 | | | $ | 27,102,000 | | | | | |
C37 | | | | | 03-Mar-00 | | | | 03-Mar-20 | | | | 73,922,000 | | | | CAD | | | | 6.610 | | | | 73,922,000 | | | | | |
C38 | | | | | 02-Mar-01 | | | | 02-Mar-21 | | | | 78,277,000 | | | | CAD | | | | 6.400 | | | | 78,277,000 | | | | | |
C39 | | | | | 01-Mar-02 | | | | 01-Mar-22 | | | | 96,251,000 | | | | CAD | | | | 6.400 | | | | 96,251,000 | | | | | |
C40 | | (C) | | | 01-Mar-04 | | | | 01-Mar-24 | | | | 90,597,000 | | | | CAD | | | | 5.390 | | | | 90,597,000 | | | | | |
C41 | | | | | 02-Jan-05 | | | | 02-Jan-25 | | | | 85,762,000 | | | | CAD | | | | 5.270 | | | | 85,762,000 | | | | | |
C42 | | | | | 03-Mar-06 | | | | 03-Mar-36 | | | | 91,752,000 | | | | CAD | | | | 4.700 | | | | 91,752,000 | | | | | |
C43 | | | | | 02-Mar-07 | | | | 03-Mar-37 | | | | 109,641,000 | | | | CAD | | | | 4.570 | | | | 109,641,000 | | | | | |
C44 | | | | | 03-Mar-08 | | | | 03-Mar-38 | | | | 81,516,000 | | | | CAD | | | | 4.850 | | | | 81,516,000 | | | | | |
C45 | | | | | 01-Dec-08 | | | | 01-Dec-38 | | | | 78,450,000 | | | | CAD | | | | 5.370 | | | | 78,450,000 | | | | | |
C46 | | | | | 01-Mar-10 | | | | 01-Mar-40 | | | | 85,218,000 | | | | CAD | | | | 4.820 | | | | 85,218,000 | | | | | |
C47 | | | | | 01-Aug-10 | | | | 01-Aug-40 | | | | 46,648,000 | | | | CAD | | | | 4.720 | | | | 46,648,000 | | | | | |
C48 | | | | | 04-July-11 | | | | 04-July-41 | | | | 78,408,000 | | | | CAD | | | | 4.290 | | | | 78,408,000 | | | | | |
C49 | | | | | 03-July-12 | | | | 03-July-42 | | | | 55,808,000 | | | | CAD | | | | 3.440 | | | | 55,808,000 | | | | | |
| | | | | | | | | | | | | | | | | | | | | | | | | | | | | | |
| | | | | | | | | | | | $ | 1,079,352,000 | | | | | | | $ | 1,079,352,000 | | | $ | 866,844,402 | |
| | | | | | | | | | | | | | | | | | | | | | | | | | |
TABLE 1 – STATEMENT OF DEBENTURES OUTSTANDING AS AT MARCH 31, 2016
Medium-Term Promissory Notes
| | | | | | | | | | | | | | | | | | | | | | | | | | | | | | |
| Series | | | | Date of Original Issue | | | Maturity Date | | | Amount Outstanding | | | | | | Coupon Rate | | | Canadian Dollars | | | Sinking Funds (B) | |
P78 | | (C) | | | 02-Sep-03 | | | | 01-Jun-17 | | | $ | 50,000,000 | | | | CAD | | | | 5.460 | | | $ | 50,000,000 | | | | | |
P103 | | (C) | | | 24-Oct-06 | | | | 24-Oct-21 | | | | 200,000,000 | | | | CAD | | | | 4.450 | | | | 200,000,000 | | | | | |
P112 | | | | | 20-Jan-12 | | | | 02-Jun-62 | | | | 1,488,800,000 | | | | CAD | | | | 3.500 | | | | 1,488,800,000 | | | | | |
P113 | | (C) | | | 09-Nov-12 | | | | 09-Nov-17 | | | | 150,000,000 | | | | CAD | | | | CDOR FRN | | | | 150,000,000 | | | | | |
P114 | | | | | 15-Aug-2013 | | | | 15-Aug-18 | | | | 500,000,000 | | | | CAD | | | | CDOR FRN | | | | 500,000,000 | | | | | |
P115 | | | | | 19-Feb-14 | | | | 19-Feb-17 | | | | 100,000,000 | | | | CAD | | | | CORRA-FRN | | | | 100,000,000 | | | | | |
P116 | | | | | 19-Feb-14 | | | | 19-Feb-18 | | | | 225,000,000 | | | | CAD | | | | CORRA-FRN | | | | 225,000,000 | | | | | |
P117 | | | | | 19-Feb-14 | | | | 19-Feb-19 | | | | 500,000,000 | | | | CAD | | | | CORRA-FRN | | | | 500,000,000 | | | | | |
P118 | | | | | 06-Feb-15 | | | | 01-Jun-22 | | | | 200,000,000 | | | | CAD | | | | 1.600 | | | | 200,000,000 | | | | | |
P119 | | | | | 15-Jun-15 | | | | 15-Jun-20 | | | | 980,000,000 | | | | CAD | | | | CDOR FRN | | | | 980,000,000 | | | | | |
| | | | | | | | | | | | | | | | | | | | | | | | | | | | | | |
| | | | | | | | | | | | $ | 4,393,800,000 | | | | | | | | | | | $ | 4,393,800,000 | | | $ | 0.0 | |
| | | | | | | | | | | | | | | | | | | | | | | | | | | | | | |
59
TABLE 1 - STATEMENT OF DEBENTURES OUTSTANDING AS AT MARCH 31, 2016
Payable in Canadian Dollars
| | | | | | | | | | | | | | | | | | | | | | | | | | | | |
| Series | | Date of Original Issue | | | Maturity Date | | | Amount Outstanding | | | | | | Rate | | | Canadian Dollars | | | Sinking Funds in Canadian Dollars (B) | |
9K | | | 30-Jan-92 | | | | 30-Jan-22 | | | $ | 200,000,000 | | | | CAD | | | | 9.600 | | | $ | 200,000,000 | | | $ | 134,349,566 | |
9Z | | | 03-Oct-97 | | | | 01-Jun-27 | | | | 550,000,000 | | | | CAD | | | | 6.600 | | | | 550,000,000 | | | | | |
B2 | | | 12-Jun-01 | | | | 01-Dec-31 | | | | 300,000,000 | | | | CAD | | | | 6.600 | | | | 300,000,000 | | | | | |
B5 | | | 12-Sep-03 | | | | 01-Jun-33 | | | | 600,000,000 | | | | CAD | | | | 5.800 | | | | 600,000,000 | | | | | |
B7 | | | 03-Jun-05 | | | | 01-Jun-35 | | | | 350,000,000 | | | | CAD | | | | 4.900 | | | | 350,000,000 | | | | | |
B8 | | | 25-Jan-06 | | | | 01-Jun-37 | | | | 750,000,000 | | | | CAD | | | | 4.500 | | | | 750,000,000 | | | | | |
B9 | | | 18-Aug-06 | | | | 18-Aug-16 | | | | 300,000,000 | | | | CAD | | | | 4.600 | | | | 300,000,000 | | | | | |
D2 | | | 25-Nov-09 | | | | 25-Nov-19 | | | | 900,000,000 | | | | CAD | | | | 4.150 | | | | 900,000,000 | | | | | |
D3 | | | 14-Dec-09 | | | | 01-Jun-41 | | | | 950,000,000 | | | | CAD | | | | 4.700 | | | | 950,000,000 | | | | | |
D5 | | | 08-Mar-11 | | | | 01-Jun-21 | | | | 900,000,000 | | | | CAD | | | | 4.100 | | | | 900,000,000 | | | | | |
D6 | | | 01-Jun-11 | | | | 01-Jun-42 | | | | 1,050,000,000 | | | | CAD | | | | 4.400 | | | | 1,050,000,000 | | | | | |
D7 | | | 27-Oct-14 | | | | 01-Jun-45 | | | | 325,000,000 | | | | CAD | | | | 3.450 | | | | 325,000,000 | | | | | |
D8 | | | 06-Feb-15 | | | | 01-Jun-25 | | | | 300,000,000 | | | | CAD | | | | 2.150 | | | | 300,000,000 | | | | | |
| | | | | | | | | | | | | | | | | | | | | | | | | | | | |
Total Payable in Canadian dollars | | | $ | 7,475,000,000 | | | | | | | | | | | $ | 7,475,000,000 | | | $ | 134,349,566 | |
| | | | | | | | | | | | | | | | | | | | | |
TABLE 1 - STATEMENT OF DEBENTURES OUTSTANDING AS AT MARCH 31, 2016
Payable in Pound Sterling
| | | | | | | | | | | | | | | | | | | | | | | | | | |
| Series | | | | Date Of Issue | | | Maturity Date | | | Amount Outstanding | | | | | Rate | | Equivalent in Canadian Dollars | | | Sinking Funds in
Canadian Dollars (B) | |
8P | | (D) | | | 18-Apr-84 | | | | 18-Apr-19 | | | | 60,000,000 | | | GBP | | 11.75 | | $ | 114,386,580 | | | | | |
| | | | | | | | | | | | | | | | | | | | | | | | | | |
| | | | | | | | | | | | £ | 60,000,000 | | | | | | | $ | 114,386,580 | | | | — | |
| | | | | | | | | | | | | | | | | | | | | | | | | | |
Adjustments relating to swap agreements | | | | (£60,000,000) | | | | | | | ($ | 114,386,580 | ) | | | | |
| | | | | | | | | | | | | | | | | | | | | | | | | | |
Total Payable in Pound Sterling after swaps: | | | | — | | | | | | | | — | | | | — | |
60
TABLE 1 - STATEMENT OF DEBENTURES OUTSTANDING AS AT MARCH 31, 2016
Payable in United States Dollars
| | | | | | | | | | | | | | | | | | | | | | | | | | |
| Series | | | | Date Of Issue | | Maturity Date | | Amount
Outstanding | | | | | | Rate | | | Equivalent
in Canadian
Dollars | | | Sinking Funds in
Canadian Dollars
(B) | |
| Hedged | | | | | | | | | | | | | | | | | | | | | | | | | | |
| 9B | | (D) | | 01-Feb-89 | | 01-Feb-19 | | $ | 200,000,000 | | | | USD | | | | 9.500 | | | $ | 198,000,000 | | | $ | 166,051,513 | |
| 9C | | (D) | | 01-Jul-89 | | 01-Jul-19 | | | 200,000,000 | | | | USD | | | | 8.875 | | | | 199,900,000 | | | | 160,791,139 | |
| 9D | | (D) | | 15-Nov-89 | | 15-Nov-19 | | | 244,000,000 | | | | USD | | | | 8.250 | | | | 246,318,000 | | | | 246,318,000 | |
| 9E | | (D) | | 01-Mar-90 | | 01-Mar-20 | | | 300,000,000 | | | | USD | | | | 9.250 | | | | 409,200,000 | | | | 323,881,017 | |
| 9J | | (D) | | 01-May-91 | | 01-May-21 | | | 300,000,000 | | | | USD | | | | 9.125 | | | | 312,002,107 | | | | 223,199,630 | |
| 9L | | (D) | | 01-Apr-92 | | 01-Apr-22 | | | 300,000,000 | | | | USD | | | | 8.750 | | | | 379,516,788 | | | | 253,762,842 | |
| 9M | | (D) | | 30-Jul-92 | | 30-Jul-22 | | | 300,000,000 | | | | USD | | | | 8.250 | | | | 329,309,999 | | | | 220,551,989 | |
| D1 | | (C)(D) | | 26-Jan-07 | | 26-Jan-17 | | | 500,000,000 | | | | USD | | | | 5.125 | | | | 562,470,000 | | | | — | |
| | | | | | | | | | | | | | | | | | | | | | | | | | |
| | | | | | | | $ | 2,344,000,000 | | | | | | | | | | | $ | 2,636,716,894 | | | $ | 1,594,556,130 | |
| | | | | | | | | | | | | | | | | | | | | | | | | | |
Adjustments relating to swap agreements | | $ | (2,344,000,000 | ) | | | | | | | | | | $ | (2,636,716,894 | ) | | | | |
| | | | | | | | | | | | | | | | | | | | |
Total Payable in USD after swaps: | | | — | | | | | | | | | | | | — | | | | — | |
LONG TERM TOTAL | | | | | | | | | | | | | | $ | 15,699,255,474 | | | $ | 2,595,750,098 | |
| | | | | | | | | |
| (A) | Debentures held by the Canada Pension Plan Fund are payable up to 30 years after their respective dated of issue, are not negotiable, not transferable or assignable, but are redeemable in whole or in part before maturity at the option of the Minister of Finance of Canada, on six months’ prior notice when he deems it necessary in order to meet the requirements of the Canada Pension Plan. |
| (B) | For designated sinking funds, payments normally commence on the first anniversary date of the issue of the debenture and are designed to retire the debt over the term of the issue. Sinking Fund investments consist primarily of debentures of the Province of Nova Scotia, other provincial governments and the Government of Canada. |
| (C) | The Province has executed swap contracts to convert certain interest payments from a fixed to floating for the fiscal year ended March 31, 2016. |
| (D) | The Province has executed currency swap contracts to convert foreign denominated debt into Canadian denominated debt. |
61