Exhibit 99.2
All dollar amounts in this Exhibit are expressed in Canadian dollars.
FORWARD-LOOKING STATEMENTS
This exhibit includes forward-looking statements. The Province of Nova Scotia has based these forward-looking statements on its current expectations and projections about future events. These forward-looking statements are subject to risks, uncertainties, and assumptions about the Province of Nova Scotia, including, among other things:
| | • | | the Province of Nova Scotia’s economic and political trends; and |
| | • | | the Province of Nova Scotia’s ability to control expenses and maintain revenues. |
In light of these risks, uncertainties and assumptions, the forward-looking events discussed in this exhibit might not occur.
| | |
Forecast Update December 15, 2016 The Honourable Randy Delorey Minister of Finance and Treasury Board 
| |  |
| |
| | |
 | | Forecast Update December 2016 |
Introduction
The Forecast Update provides revised information about Nova Scotia’s fiscal outlook, including updated information about the major components of revenue and expenses as set out in the 2016-17 Budget Estimates.
Relative to Budget 2016-17, the forecasted net position is projected to decline slightly. The Province of Nova Scotia is forecasting a surplus and net position of $12.1 million for 2016-17, a decrease of $5.0 million from the budgeted net position of $17.1 million.
The forecast reflects $17.5 million in unexpected costs necessary to respond to October storm damage in Cape Breton.
The surplus has declined by $115.3 million, with $110.3 million resulting from the delay in completion of the new Halifax Convention Centre, which will push the Contribution to Fiscal Capacity to the next fiscal year. The balance comes from other changes to the fiscal plan identified in this update.
Nova Scotia’s path to sustainable finances gives it some capacity to respond to unexpected costs, fluctuations and opportunities without falling into deficit.
Revenue is down overall by $72.9 million; however, a $110.3 decrease in funding for the new convention centre is partially offset by gains in other areas.
Total Expenses are up $45.0 million, primarily because government is taking advantage of new federal-provincial cost-sharing programs to make investments in areas such as clean drinking water and wastewater projects, post-secondary institutions, transportation infrastructure, and innovative ocean research.
Most of the increase in departmental expenses is offset by increased revenue that is recoverable from the federal government.
Government continues to stick to its fiscal plan, investing in strategic sectors of the economy, in education, and creating more opportunities for young Nova Scotians.
1
| | |
| Forecast Update December 2016 | |  |
Overview
The Province of Nova Scotia is forecasting a surplus of $12.1 million and a net position of $12.1 million. This represents a decrease of $5.0 million from the 2016-17 Budgeted Net Position. The $110.3 million Contribution to Fiscal Capacity included in Budget 2016-17 is no longer planned to be recognized in 2016-17 as the timing for substantial completion of the new Halifax Convention Centre has moved to 2017-18. The $110.3 million in one-time revenue for capital contributions from federal and municipal governments towards the new Halifax Convention Centre is also no longer reflected in the 2016-17 forecast.
Total Provincial Revenue, including Ordinary Revenue and Recoveries, and Net Income from Government Business Enterprises, is forecast to be $10.2 billion, a decrease of $72.9 million from the 2016-17 Budget.
Forecast changes in Ordinary Revenue include a $45.5 million decrease in provincial tax revenue, a decrease in Other Provincial Revenue Sources of $44.3 million, and a $43.3 million decrease in Federal Revenue Sources.
Ordinary Recoveries Revenue is forecast to increase by $61.3 million from the Budget Estimates primarily due to new cost-shared federal programs. Net Income from Government Business Enterprises is forecast to decrease by $0.4 million from Budget.
Fiscal Summary 2016–17 | ($ thousands) |
| | | | | | | | | | | | | | | | |
| General Revenue Fund | | Budget | | | September
Update | | | December
Update | | | Increase (Decrease)
from Budget | |
Revenue | | | | | | | | | | | | | | | | |
Ordinary Revenue | | | 9,329,495 | | | | 9,336,834 | | | | 9,195,791 | | | | (133,704 | ) |
Ordinary Recoveries | | | 552,529 | | | | 614,909 | | | | 613,781 | | | | 61,252 | |
Net Income from Government | | | | | | | | | | | | | | | | |
Business Enterprises | | | 382,228 | | | | 377,603 | | | | 381,827 | | | | (401 | ) |
| | | | | | | | | | | | | | | | |
Total Revenue | | | 10,264,252 | | | | 10,329,346 | | | | 10,191,399 | | | | (72,853 | ) |
Expenses | | | | | | | | | | | | | | | | |
Departmental Expenses | | | 9,100,049 | | | | 9,177,558 | | | | 9,161,866 | | | | 61,817 | |
Refundable Tax Credits | | | 137,602 | | | | 137,247 | | | | 137,740 | | | | 138 | |
Pension Valuation Adjustment | | | 66,251 | | | | 66,251 | | | | 61,183 | | | | (5,068 | ) |
Debt Servicing Costs | | | 841,712 | | | | 836,895 | | | | 829,835 | | | | (11,877 | ) |
| | | | | | | | | | | | | | | | |
Total Expenses | | | 10,145,614 | | | | 10,217,951 | | | | 10,190,624 | | | | 45,010 | |
Consolidation and Accounting | | | | | | | | | | | | | | | | |
Adjustments for Government Units | | | 8,773 | | | | 17,844 | | | | 11,310 | | | | 2,537 | |
| | | | | | | | | | | | | | | | |
Provincial Surplus (Deficit) | | | 127,411 | | | | 129,239 | | | | 12,085 | | | | (115,326 | ) |
| | | | | | | | | | | | | | | | |
Contribution to Fiscal Capacity | | | (110,300 | ) | | | (110,300 | ) | | | — | | | | 110,300 | |
| | | | | | | | | | | | | | | | |
Net Position | | | 17,111 | | | | 18,939 | | | | 12,085 | | | | (5,026 | ) |
| | | | | | | | | | | | | | | | |
2
| | |
| | Forecast Update December 2016 |
Total Expenses are forecast to be $10.2 billion; $45.0 million higher than the Budget Estimates. This is mainly due to an increase in departmental expenses. These increased departmental expenses are primarily offset by recoveries revenue.
Debt Servicing costs are down $11.9 million, primarily as a result of lower interest rates. Changes in Consolidation and Accounting Adjustments result in a $2.5 million positive impact to the provincial surplus position.
Revenue
Total Revenue, including Ordinary Recoveries of $613.8 million and Net Income from Government Business Enterprises of $381.8 million, is forecast to be $10.2 billion, $72.9 million (0.7 per cent) less than the 2016–17 Budget Estimates.
This represents a $45.5 million decrease in Provincial Tax Revenue (0.8 per cent), a decrease in Other Provincial Revenue Sources of $44.3 million (10.9 per cent) and a decrease in Net Income from Government Business Enterprises of $0.4 million (0.1 per cent). Ordinary Recoveries are up by $61.3 million (11.1 per cent) and Federal Revenue Sources are down by $43.3 million (1.4 per cent).
Provincial Tax Revenue
Personal Income Tax (PIT) revenue is forecast to be down by $34.6 million or 1.3 per cent from the 2016-17 Budget Estimates as a result of declines in projected yield in both 2016 (down 0.9 per cent) and 2017 (down 0.7 per cent) as well as a decline in personal taxable income in 2016 (down 1.2 per cent) and 2017 (down 0.9 per cent) as the rate of growth for compensation of employees is slower than projected.
Corporate Income Tax (CIT) revenue is forecast to increase by $23.4 million or 5.0 per cent from the 2016-17 Budget Estimates. This is due to a forecasted increase of the province’s share of national corporate taxable income in both 2016 and 2017 (up 2.9 per cent). This is partially offset by lower levels of national corporate taxable income based upon federal estimates.
Harmonized Sales Tax (HST) revenue is forecast to decline by $34.0 million or 1.9 per cent from the 2016- 17 Budget Estimates primarily as a result of lower forecasts for the residential housing investment base – down 11.3 per cent in 2016 and 12.3 per cent in 2017. The consumer expenditure base is also projected to be down in both 2016 (down 0.3 per cent) and 2017 (down 0.7 per cent). The declines are partially offset by stronger growth in the public sector tax base.
Motive Fuel Tax revenue is forecast to be down $6.0 million or 2.2 per cent from the 2016-17 Budget Estimates based upon lower projected consumption of both gasoline and diesel oil.
Tobacco Tax revenue is forecast to increase by $2.1 million or 0.9 per cent from the 2016-17 Budget Estimates as the rate of decline in the consumption of tobacco products is slower than projected.
Other taxes are up by $3.7 million (2.3 per cent) primarily as a result of higher than expected revenue from the levy on private sale of used vehicles.
3
| | |
| Forecast Update December 2016 | | |
Total Revenue Fiscal 2016–17 | ($ thousands) |
| | | | | | | | | | | | | | | | |
| Provincial Revenue Sources | | Budget | | | September Update | | | December
Update | | | Increase (Decrease)
from Budget | |
Tax Revenue: | | | | | | | | | | | | | | | | |
Personal Income Tax | | | 2,671,599 | | | | 2,674,184 | | | | 2,636,998 | | | | (34,601 | ) |
Corporate Income Tax | | | 466,644 | | | | 477,644 | | | | 490,001 | | | | 23,357 | |
Harmonized Sales Tax | | | 1,814,007 | | | | 1,799,789 | | | | 1,780,006 | | | | (34,001 | ) |
Motive Fuel Taxes | | | 271,718 | | | | 267,224 | | | | 265,713 | | | | (6,005 | ) |
Tobacco Tax | | | 227,252 | | | | 229,620 | | | | 229,323 | | | | 2,071 | |
Other Tax Revenue | | | 158,745 | | | | 161,249 | | | | 162,449 | | | | 3,704 | |
| | | | | | | | | | | | | | | | |
| | | 5,609,965 | | | | 5,609,710 | | | | 5,564,490 | | | | (45,475 | ) |
Other Provincial Revenue: | | | | | | | | | | | | | | | | |
Registry of Motor Vehicles | | | 127,534 | | | | 131,624 | | | | 131,564 | | | | 4,030 | |
Royalties – Petroleum | | | 10,508 | | | | 9,581 | | | | 9,512 | | | | (996 | ) |
Other Provincial Sources | | | 144,736 | | | | 144,799 | | | | 148,327 | | | | 3,591 | |
TCA Cost Shared Revenue | | | 59,900 | | | | 61,228 | | | | 2,569 | | | | (57,331 | ) |
Other Fees and Charges | | | 61,978 | | | | 61,508 | | | | 61,698 | | | | (280 | ) |
Prior Years’ Adjustments | | | — | | | | — | | | | 4,698 | | | | 4,698 | |
Gain on Disposal of Crown Assests | | | 1,400 | | | | 3,471 | | | | 3,404 | | | | 2,004 | |
| | | | | | | | | | | | | | | | |
| | | 406,056 | | | | 412,211 | | | | 361,772 | | | | (44,284 | ) |
Investment Income: | | | | | | | | | | | | | | | | |
Interest Revenues | | | 77,901 | | | | 77,307 | | | | 76,771 | | | | (1,130 | ) |
Sinking Fund Earnings | | | 91,660 | | | | 91,336 | | | | 92,138 | | | | 478 | |
| | | | | | | | | | | | | | | | |
| | | 169,561 | | | | 168,643 | | | | 168,909 | | | | (652 | ) |
| | | | | | | | | | | | | | | | |
Total – Provincial Revenue Sources | | | 6,185,582 | | | | 6,190,564 | | | | 6,095,171 | | | | (90,411 | ) |
| | | | | | | | | | | | | | | | |
Federal Revenue Sources | | | | | | | | | | | | | | | | |
Equalization Payments | | | 1,738,321 | | | | 1,738,321 | | | | 1,738,321 | | | | — | |
Canada Health Transfer | | | 942,770 | | | | 942,770 | | | | 944,419 | | | | 1,649 | |
Canada Social Transfer | | | 348,901 | | | | 348,901 | | | | 349,511 | | | | 610 | |
Offshore Accord Offset Payments | | | 33,255 | | | | 33,255 | | | | 33,255 | | | | — | |
Crown Share | | | 1,427 | | | | 681 | | | | 681 | | | | (746 | ) |
Other Federal Sources | | | 6,115 | | | | 6,115 | | | | 6,115 | | | | — | |
TCA Cost Shared Revenue | | | 73,124 | | | | 76,227 | | | | 27,074 | | | | (46,050 | ) |
Prior Years’ Adjustments | | | — | | | | — | | | | 1,244 | | | | 1,244 | |
| | | | | | | | | | | | | | | | |
Total – Federal Revenue Sources | | | 3,143,913 | | | | 3,146,270 | | | | 3,100,620 | | | | (43,293 | ) |
| | | | | | | | | | | | | | | | |
Total – Ordinary Revenue | | | 9,329,495 | | | | 9,336,834 | | | | 9,195,791 | | | | (133,704 | ) |
| | | | | | | | | | | | | | | | |
Total – Ordinary Recoveries | | | 552,529 | | | | 614,909 | | | | 613,781 | | | | 61,252 | |
| | | | | | | | | | | | | | | | |
Net Income from | | | | | | | | | | | | | | | | |
Government Business Enterprises (GBE) | | | | | | | | | | | | | | | | |
Nova Scotia Liquor Corporation | | | 234,022 | | | | 234,022 | | | | 236,036 | | | | 2,014 | |
Nova Scotia Provincial Lotteries and Casino Corporation 127,700 | | | | | | | 122,700 | | | | 124,400 | | | | (3,300 | ) |
Halifax-Dartmouth Bridge Commission | | | 12,098 | | | | 12,473 | | | | 12,983 | | | | 885 | |
Highway 104 Western Alignment Corporation | | | 8,408 | | | | 8,408 | | | | 8,408 | | | | — | |
| | | | | | | | | | | | | | | | |
Total – Net Income from GBE | | | 382,228 | | | | 377,603 | | | | 381,827 | | | | (401 | ) |
| | | | | | | | | | | | | | | | |
Total Revenue | | | 10,264,252 | | | | 10,329,346 | | | | 10,191,399 | | | | (72,853 | ) |
| | | | | | | | | | | | | | | | |
4
| | |
| | Forecast Update December 2016 |
Other Provincial Sources
Other Provincial Revenues are forecast to be down by $44.3 million (10.9 per cent) as a result of a $58.9 million reduction in tangible capital asset cost-shared revenue because of a delay in the timing for substantial completion of the new Halifax Convention Centre, which is partially offset by gains in registry of motor vehicles revenue, sale of assets and prior year adjustments.
Offshore Royalty revenue is forecasted to decline by $1.0 million (9.5 per cent) from the 2016-17 Budget Estimates based upon lower production volumes for offshore energy projects.
Prior Year Adjustments (PYAs) from provincial sources are currently being forecast to be $4.7 million in decreases from PIT, HST, and offshore royalties. These are offset by gains from CIT and Capital Tax on financial institutions.
Investment Income
Investment income is $0.7 million (0.4 per cent) lower than Budget primarily as a result of lower interest rates.
Federal Revenue Sources
Equalization is based upon the Province’s election to receive payments calculated according to the Expert Panel approach. This is a one-estimate, one-payment approach and as a result the forecast is equal to the 2016-17 Budget Estimates. The Province also expects to receive a cumulative best-of guarantee payment of $16.0 million in 2016-17 pursuant to the clarification reached with the federal government in October 2007. An update to this forecast will be provided by the federal government to the Province before the end of December 2016.
Offshore Accord Payments are also based upon a one-estimate, one-payment approach and as a result the forecast is equal to the 2016-17 Budget Estimates.
The Canada Health Transfer (CHT) is forecast to be up by $1.6 million (0.2 per cent) from the 2016-17 Budget Estimates based upon revised federal estimates of the Province’s share of national population released in September.
The Canada Social Transfer (CST) is forecast to be up by $0.6 million (0.2 per cent) from the 2016-17 Budget Estimates based upon revised federal estimates of the Province’s share of national population released in September.
Crown Share Adjustment Payments are down by $0.7 million (52.3 per cent) from the 2016-17 Budget Estimates as a result of reduced profitability from offshore natural resource projects.
Prior Year Adjustments (PYAs) from federal sources are currently being forecast at $1.2 million.
Ordinary Recoveries
Ordinary Recoveries Revenue is forecast to be $61.3 million (11.1 per cent) higher than budget.
The Department of Business is forecasting $2.8 million in decreased recoveries primarily due to project delays related to the Halifax Convention Centre.
The Department of Health and Wellness is forecasting $6.5 million in increased recoveries primarily due to a $5.0 million increase in physician reciprocal billings and $3.5 million in increased utilization for auto levy recoveries charged to insurance companies. This is partially offset by $1.9 million in decreased recoveries primarily as a result of several programs that have been transferred to the Health Authorities.
The Department of Internal Services is forecasting $1.8 million in increased recoveries related to IT recoverable work and insurance claims.
5
| | |
| Forecast Update December 2016 | | |
The Department of Justice is forecasting $0.6 million in increased recoveries due to $0.5 million increased funding from the federal government for the provision of correctional services, $0.3 million for increased funding from the federal government for legal aid services, $0.4 million increases for other miscellaneous items offset by $0.6 million decrease in recoveries from municipalities due to lower than anticipated costs associated with the RCMP contract.
The Department of Labour and Advanced Education is forecasting $14.0 million in increased recoveries as a result of increased recoverable spending of $7.2 million for federal Labour Market Programs; $3.7 million for the launch of the provincially cost-shared Labour Apprenticeship Management system; $3.0 million for participation in the federal Post-Secondary Institutions Strategic Investment Fund (SIF), including the Centre for Ocean Ventures Entrepreneurship project (COVE).
Assistance to Universities is forecasting $16.6 million in increased recoveries for capital university projects approved as part of SIF. The projects include new state of the art facilities at Acadia University Science Complex, Mount Saint Vincent University - Research and Diagnostic Centre, and Dalhousie University.
The Department of Municipal Affairs is forecasting $23.2 million in increased recoveries primarily as a result of new federal programs comprised of $7.8 million under the Canada-Nova Scotia Bilateral Agreement for Clean Water and Wastewater Fund and $16.3 million for the Public Transit Infrastructure Fund. The programs include 73 clean, reliable water sources and waste-water projects across Nova Scotia and enhanced public transportation. These increases are partially offset by project delays under the New Building Canada Fund.
The Department of Transportation and Infrastructure Renewal is forecasting $0.8 million in increased recoveries as a result of $0.4 million in cost sharing from the federal government and a $0.4 million increase in other third party recoverable work.
Net Income from Government Business Enterprises (GBE)
The total Net Income from Government Business Enterprises is forecast to be $0.4 million (0.1 per cent) lower than the Budget Estimate.
The Nova Scotia Liquor Corporation is forecasting a $2.0 million (0.9 per cent) increase in net operating income as a result of higher than expected sales revenue.
The Nova Scotia Provincial Lotteries and Casinos Corporation is forecasting a decrease in net income of $3.3 million (2.6 per cent) as a result of lower than projected growth in video lottery revenue.
The Halifax-Dartmouth Bridge Commission is forecasting net income to be $0.9 million (7.3 per cent) above budget primarily because of higher than expected toll and investment revenue and lower than expected amortization charges and operating costs.
The Highway 104 Western Alignment Corporation is projecting no change in forecasted net operating income.
6
| | |
| | Forecast Update December 2016 |
Expenses
Total Expenses for 2016-17 are forecast to be $10.2 billion, $45.0 million higher than the original Budget Estimates.
An increase in Departmental Expenses of $61.8 million is partially offset by a reduction in Debt Servicing Costs of $11.9 million and a reduction of $5.1 million in Pension Valuation Adjustment.
Departmental Expenses 2016–17 | ($ thousands) |
| | | | | | | | | | | | | | | | |
| | | Budget | | | September
Update | | | December
Update | | | Increase (Decrease)
from Budget | |
Agriculture | | | 60,217 | | | | 60,360 | | | | 60,360 | | | | 143 | |
Business^ | | | 137,450 | | | | 140,503 | | | | 138,186 | | | | 736 | |
Communities, Culture and Heritage | | | 81,689 | | | | 82,131 | | | | 82,392 | | | | 703 | |
Community Services* | | | 929,957 | | | | 929,957 | | | | 933,002 | | | | 3,045 | |
Education and Early Childhood Development | | | 1,279,532 | | | | 1,279,921 | | | | 1,279,542 | | | | 10 | |
Energy | | | 29,597 | | | | 29,597 | | | | 29,597 | | | | — | |
Environment | | | 36,800 | | | | 36,800 | | | | 36,697 | | | | (103 | ) |
Finance and Treasury Board | | | 22,782 | | | | 22,782 | | | | 22,282 | | | | (500 | ) |
Fisheries and Aquaculture | | | 12,464 | | | | 12,464 | | | | 12,461 | | | | (3 | ) |
Health and Wellness | | | 4,132,209 | | | | 4,130,295 | | | | 4,130,274 | | | | (1,935 | ) |
Internal Services | | | 185,447 | | | | 186,143 | | | | 185,414 | | | | (33 | ) |
Justice | | | 330,388 | | | | 328,919 | | | | 329,096 | | | | (1,293 | ) |
Labour and Advanced Education*^ | | | 364,271 | | | | 371,763 | | | | 377,198 | | | | 12,927 | |
Assistance to Universities^ | | | 380,605 | | | | 400,271 | | | | 399,784 | | | | 19,179 | |
Municipal Affairs^ | | | 184,383 | | | | 230,479 | | | | 219,794 | | | | 35,411 | |
Natural Resources^ | | | 76,487 | | | | 79,987 | | | | 79,987 | | | | 3,500 | |
Public Service | | | 205,869 | | | | 205,388 | | | | 202,887 | | | | (2,983 | ) |
Seniors | | | 1,598 | | | | 1,598 | | | | 1,598 | | | | — | |
Transportation and Infrastructure Renewal* | | | 460,766 | | | | 460,671 | | | | 463,860 | | | | 3,094 | |
Restructuring Costs | | | 187,538 | | | | 187,538 | | | | 177,456 | | | | (10,082 | ) |
| | | | | | | | | | | | | | | | |
Total – Departmental Expenses | | | 9,100,049 | | | | 9,177,558 | | | | 9,161,866 | | | | 61,817 | |
| | | | | | | | | | | | | | | | |
| * | Requires Additional Appropriation ^Received Additional Appropriation September, 2016 |
7
| | |
| Forecast Update December 2016 | | |
Departmental Expenses
Total Departmental Expenses for 2016-17 are forecast to be $9.2 billion or $61.8 million higher than the budget.
The Department of Business is forecast to be $0.7 million over budget primarily due to increased expenditures for the provincial portion of COVE approved as part of SIF.
The Department of Communities, Culture and Heritage is forecast to be over budget by $0.7 million due to infrastructure support provided to the Newport Arena Recreational Facility of $0.4 million, and an increase in third-party recoverable spending of $0.3 million.
The Department of Community Services is forecast to be $3.0 million over budget. The department is forecasting pressures of $5.3 million in the Disability Support program, due to higher client care costs and utilization growth in the Flex program, as well as several smaller program pressures totaling $2.7 million. These increases are partially offset by forecasted under expenditures of approximately $3.0 million in Income Assistance payments due to lower caseloads, and forecasted decreases of approximately $0.9 million each in Employment Support Service program spending due to lower than expected participation in programs and NS Child Benefit payments due to decline in participants.
The Department of Finance and Treasury Board is forecast to be $0.5 million under budget primarily due to temporary vacancy savings.
The Department of Health and Wellness is forecast to be $1.9 million under budget primarily due to the following: $3.1 million in one-time savings from transitioning to the new Physician Master Agreement and Academic Funding Plan Contracts, $1.9 million savings for delays in information technology projects, and $1.9 million due to several programs that have been transferred to the Health Authorities. There is a corresponding $1.9 million decrease in recoveries
mainly related to programs transferred to the Health Authorities. These savings are partially offset by $3.8 million for increased utilization in Canadian Blood Services as well as $1.2 million net overspend in various program budgets.
The Department of Justice is forecast to be $1.3 million under budget primarily due to lower than anticipated costs associated with the RCMP contract. This is offset by a decrease of $0.6 million in recoveries from municipalities for their share of RCMP costs.
The Department of Labour and Advanced Education is forecast to be $12.9 million over budget primarily due to $7.2 million related to federally funded Labour Market Programs amendments, recoverable from the Federal Government; and $3.7 million for the launch of the provincial cost-shared Apprenticeship Management System, fully recoverable from other jurisdictions; and $3.0 million transferred from the Department of Business for participation in SIF including COVE, fully recoverable. These increases are partially offset by lower than anticipated program uptake of the Workplace Innovation and Productivity Skills Incentive program.
Assistance to Universities is forecast to be $19.2 million over budget primarily due to a $19.7 million contribution toward specified university capital projects approved as part of SIF; $16.6 million of this increase is recoverable from the federal government.
The Department of Municipal Affairs is forecast to be $35.4 million over budget primarily due to Canada-Nova Scotia Bilateral Agreement related spending including $11.6 million for Clean Water and Wastewater Fund of which $7.8 million is recoverable, $16.3 million for Public Transit Infrastructure Fund which is fully recoverable, and $14.9 million in response to the October 2016 storm and flood damage. These increases are partially offset by $6.6 million in reduced New Building Canada Fund spending as a result of project delays including National and Regional Projects of $5.1 million, Small Communities Fund of $1.5 million and $0.8 million in Building Canada Fund Communities Component.
8
| | |
| | Forecast Update December 2016 |
The Department of Natural Resources is forecast to be $3.5 million over budget primarily due to additional costs to fight August 2016 wildfires.
Public Service Offices are forecast to be $3.0 million under budget primarily due to $1.1 million for the NS Home for Coloured Children Restorative Inquiry; $0.9 million in savings for Legislative Services due to vacancy and operational savings; and $1.0 million underspend in Service Nova Scotia due to delays in Petroleum Product Volume Tracking project which is recoverable.
The Department of Transportation and Infrastructure Renewal is forecast to be $3.1 million over budget primarily due to a $2.6 million spending pressure in response to the October 2016 storm and flood damage and third party recoverable road and building work.
The Restructuring Fund is forecast to be $10.1 million under budget as an offset to the Transportation and Infrastructure Renewal and Municipal Affairs pressure in response to the October 2016 storm and flood damage.
Refundable Tax Credits
Refundable Tax Credits are forecasted almost at budget, $0.1 million (0.1 per cent) higher than originally anticipated.
Pension Valuation Adjustment
Pension Valuation Adjustment is projected to be $5.1 million (7.6 per cent) lower than budget as a result of revised plan assumptions and actuarial assessments.
Debt Servicing Costs
Total Debt Servicing Costs are forecast to be $11.9 million (1.4 per cent) lower than budget primarily as a result of lower interest rates.
Consolidation and Accounting Adjustments
Consolidation and accounting adjustments for government units are forecasted to be $2.5 million over budget primarily due to a $3.9 million increase for COVE and a federal contribution of $1.5 million for Housing Nova Scotia for the Federal investment in Affordable Housing, offset by a decrease of $2.9 million in various special purpose funds and organizations.
9
| | |
| Forecast Update December 2016 | | |
Capital
The Province is forecasting total capital spending to be under budget. Projected spending increases on highways and structures and vehicles and equipment are offset with a reduction in buildings as a result of the delay in the completion of the Halifax Convention
Centre, projected reductions on IT projects, projected decreased capital grant requirements, and a reduction in the contingency primarily to allow for participation in the Federal Strategic Infrastructure Fund.
Capital Spending 2016–17 | ($ thousands) |
| | | | | | | | | | | | | | | | |
| | | Budget | | | September
Update | | | December
Update | | | Increase (Decrease)
from Budget | |
Highways and Structures | | | 222,448 | | | | 222,517 | | | | 222,517 | | | | 69 | |
Buildings | | | 273,575 | | | | 282,449 | | | | 109,219 | | | | (164,356 | ) |
Information Technology | | | 30,154 | | | | 28,412 | | | | 24,081 | | | | (6,073 | ) |
Land Purchases | | | 2,500 | | | | 2,500 | | | | 2,500 | | | | — | |
Vehicles and Equipment | | | 18,369 | | | | 19,013 | | | | 22,483 | | | | 4,114 | |
Capital Grants | | | 61,349 | | | | 64,727 | | | | 61,336 | | | | (13 | ) |
Contingency | | | 36,605 | | | | 25,382 | | | | 22,000 | | | | (14,605 | ) |
| | | | | | | | | | | | | | | | |
Total – Capital Spending | | | 645,000 | | | | 645,000 | | | | 464,136 | | | | (180,864 | ) |
| | | | | | | | | | | | | | | | |
Economic Performance and Outlook: 2016 and 2017
Before receiving results of actual tax revenues collected, the Province relies on economic forecasts and statistical relationships with historical administrative data to estimate tax revenues. Nominal Gross Domestic Product (GDP) is the broadest measure of the economy’s tax base and components of nominal GDP, such as employee compensation, consumer expenditures and residential construction, provide an indication of the size of specific tax bases.
External Outlook
Global real GDP growth is falling short of expectations. The International Monetary Fund’s latest forecast is for global growth of 3.1 per cent in 2016, a downward
revision from earlier in the year. Global growth over the first half of the year was slower than anticipated, particularly in advanced economies. Economic growth is expected to accelerate to 3.4 per cent in 2017 although new risks are emerging.
Many advanced economies continue to operate with negative output gaps, muted wage growth and limited inflation. Monetary policy remains accommodative with unconventional measures needed in many countries in order lift demand in the business and household sectors. Growth in advanced economies has improved in the recent data for the third quarter of 2016.
The Euro Area economy continues its slow recovery from the sovereign debt crisis. Consumer and government
10
| | |
| | Forecast Update December 2016 |
spending has supported growth while the European Central Bank eased monetary policy further with increased asset purchases. The United Kingdom’s short-term prospects following the Brexit vote appear largely unchanged and fears of an immediate recession have not materialized. However, lingering uncertainty around the UK’s Brexit vote has resulted in widespread expectations of slower growth in future years. The Bank of England cut interest rates following the vote, resulting in UK exchange rate depreciation and lower bond yields. Japan’s economy has managed moderate growth as government consumption and the residential sector have expanded; though private consumption and exports have seen little growth. The Bank of Japan introduced further monetary easing and promised to push inflation above the 2 per cent target as inflation in the country has been persistently weak and slow to respond to previous measures.
China continues to transition towards domestic consumption and a market orientation, becoming less dependent on industrial and trade expansion. Fiscal stimulus helped lift growth in 2016, however risks around Chinese corporate balance sheets and banking sector liberalization will continue to into 2017.
The United States (US) and other Canadian provinces continue to be the primary markets for Nova Scotia exports.
Economic growth in the US over the first half of the year was lower than expected as inventory growth slowed and capital investment was weak (particularly related to energy). Consumer spending and residential investment continued to expand as US employment and incomes improved. Growth in the third quarter picked up to 3.2 per cent (seasonally adjusted annualized rate) with exports showing significant growth. After raising its policy interest rate in December 2015, the US Federal Reserve made no further changes to monetary policy, but noted that the case for an interest rate increase continues to strengthen as the labour market improves and inflation accelerates. US real GDP growth is projected to be slower at 1.6 per cent in 2016 before rising to 2.2 per cent in 2017.
Growth in the Canadian economy was disrupted in the second quarter as Alberta wildfires and maintenance in the oil sector led to a decline in export activity. The adjustment to lower commodity prices in the Canadian economy continues. Non-commodity exports have been slow to pick up amid weaker global growth. The Canadian economy is expected to strengthen in the second half of year; initial estimates of real GDP growth in Q3 showed a gain of 3.5 per cent on rebounding exports. Household consumption and housing activity (albeit limited to specific regions) supported growth over first three quarters of the year. Further export growth, government infrastructure spending, tax reductions and an improvement in business investment are expected to help the economy expand through 2017.
The Bank of Canada still maintains its target for the overnight rate at 0.5 per cent in 2016. Inflation has moved higher as the offsetting effects of both low energy prices and higher import costs dissipate and underlying inflation pressures slowly normalize. The slack in the Canadian economy is expected to continue to put a slight downward pressure on inflation with the Bank of Canada expecting inflation to be close to 2 per cent in 2017. The Department of Finance and Treasury Board projects that Canada’s real GDP will grow by 1.1 per cent in 2016 and by 2.0 per cent in 2017 with the Canadian dollar in a range of 75 to 80 US cents.
Current Economic Outlook for Nova Scotia
The Department of Finance and Treasury Board has revised its economic outlook incorporating information and data released through November 9, 2016. The economic outlook includes monthly and quarterly data about 2016 released on or before this date. The economic outlook also incorporates Statistics Canada’s revisions to the Provincial Economic Accounts. Overall nominal GDP saw upward revisions in 2013 and 2014 and Statistics Canada preliminary real GDP estimate for 2015 was revised up from 0.8 per cent to 1.0 per cent. Data released after November 9, 2016 is discussed in the Economic Performance and Key Risks and will be incorporated into future outlooks.
11
| | |
| Forecast Update December 2016 | |
|
Current Economic Outlook Assumptions
| | | | | | | | | | | | | | | | | | | | |
| | | Budget 2016–17 | | | | | | Revised Nov 2016 | |
| Per cent change, except where noted | | 2016 | | | 2017 | | | | | | 2016 | | | 2017 | |
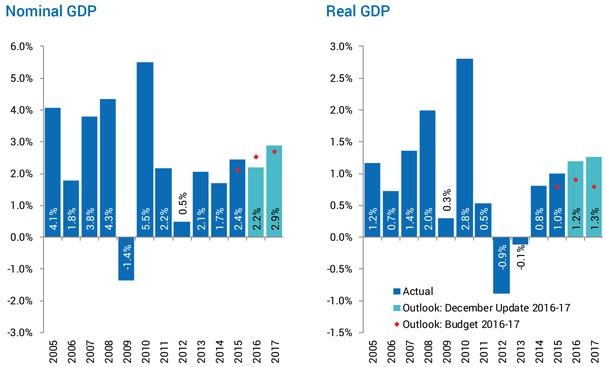
Real GDP ($2007 chained) | | | 0.9% | | | | 0.8% | | | | | | | | 1.2% | | | | 1.3% | |
Nominal GDP | | | 2.5% | | | | 2.7% | | | | | | | | 2.2% | | | | 2.9% | |
Compensation of Employees | | | 2.5% | | | | 2.4% | | | | | | | | 2.1% | | | | 2.8% | |
Household Income | | | 2.5% | | | | 2.5% | | | | | | | | 2.3% | | | | 2.6% | |
Household Final Consumption | | | 2.7% | | | | 3.2% | | | | | | | | 3.2% | | | | 2.8% | |
Retail Sales | | | 1.2% | | | | 2.4% | | | | | | | | 2.8% | | | | 2.0% | |
Consumer Price Index | | | 1.5% | | | | 1.9% | | | | | | | | 1.5% | | | | 1.9% | |
Investment in Residential Structures | | | 3.1% | | | | -3.5% | | | | | | | | -4.9% | | | | -4.6% | |
Net Operating Surplus: Corporations | | | 2.9% | | | | 2.8% | | | | | | | | 1.8% | | | | 2.1% | |
Exports of Goods to Other Countries | | | 4.7% | | | | 2.8% | | | | | | | | -1.3% | | | | 2.8% | |
Population at July 1 (thousands) | | | 945.3 | | | | 946.4 | | | | | | | | 945.3 | | | | 946.4 | |
Employment (thousands) | | | 450.8 | | | | 451.2 | | | | | | | | 446.3 | | | | 448.7 | |
Unemployment Rate, Annual Average | | | 8.4% | | | | 8.1% | | | | | | | | 8.5% | | | | 7.8% | |
Note: Budget Estimates economic forecast was made with data and information as of January 22, 2016. The revised November forecast was made with data and information as of November 9, 2016. The population forecast is only revised at the time of the Budget estimates.
The outlook for Nova Scotia’s nominal GDP growth has been revised down in 2016 as in-year indicators of labour market performance and housing renovation have been weaker than anticipated. Retail sales and household consumption are now projected to be growing faster than expected. This reflects weaker growth in 2015 historical results as well as the effects of higher transfers to families and lower income taxes. Since the 2016-17 Budget forecast, the nominal GDP forecast has been reduced from 2.5 per cent to 2.2 per cent for 2016. The outlook for real GDP growth has been revised up from 0.9 per cent to 1.2 per cent in 2016, incorporating a more muted expectation for broad price inflation.
For 2017, the outlook for GDP (both real and nominal) has been revised up as Federal infrastructure plans are
expected to ramp up next year. Other major projects that had supported activity in previous years are anticipated to slow, but export and tourism sectors should continue to expand with support from a growing US economy and favourable exchange rate. Real GDP is forecasted for growth of 1.3 per cent with nominal GDP increasing to 2.9 per cent.
The Province’s forecast for real and nominal GDP in 2016 and 2017 continues to be in line with the average private sector projections for the province.
12
| | |
| | Forecast Update December 2016 |
| | |
| Nova Scotia GDP Growth | | (Per Cent Change) |
Nova Scotia Economic Performance
GDP Growth: Nova’s Scotia real GDP growth turned around after two years of decline in 2014 with growth of 0.8 per cent. Real GDP grew another 1.0 per cent in 2015 as international exports and real household consumption expanded. Apartment construction and government also contributed to growth. Rising imports and lower interprovincial exports and business capital investments offset some of these gains in 2015. For 2016, the goods-sectors outlook is mixed. International merchandise export growth has slowed, construction indicators have turned negative, and natural gas output is down. However, there is continued growth in the manufacturing sector, particularly as shipbuilding activity ramps up. Service sector growth has been more steady in the province in recent years, and this is expected to continue into 2016. Increased tourism visitors to the province should be supportive to associated sectors.
Labour Market: For the first eleven months of 2016, employment and labour force are both down. Employment fell 0.5 per cent while the labour force declined 0.7 per cent. The unemployment rate has averaged 8.4 per cent for the first eleven months of 2016, continuing a slow downward trend as the labour force diminishes. Employment declines have been widespread across the goods-producing sector, with the exception of manufacturing. Service-producing industries have seen a decline of 700 jobs with losses in business, building and other support services, information, culture and recreation, and accommodation and food services. Average weekly earnings have grown 1.8 per cent over the first nine months of 2016 while total employee compensation is up 1.8 per cent.
13
| | |
| Forecast Update December 2016 | | |
Inflation: Nova Scotia’s Consumer Price Index inflation for all items is up an average of 1.2 per cent in the first ten months of 2016 relative to the same period in 2015. The inflation rate has trended up in recent months as energy prices are less of a drag on the index. The CPI excluding food and energy has been more stable, averaging 1.9 per cent over the first ten months of 2016.
Retail Sales: Retail activity recovered in 2016 after a sharp downturn over the winter months of 2015. Retail sales have trended upward through September of 2016. Retail sales through the first nine months of the year are 4.1 per cent higher in 2016 compared to 2015. Higher sales at motor vehicle and parts dealers account for two-thirds of the growth. Sales at building material and garden equipment and supplies dealers and department stores have also been positive while declines have occurred with food and beverage stores, electronics and appliance stores, and gasoline stations.
Construction: After growth of 7.2 per cent in 2015, residential construction has slowed in the province. The value of new dwelling construction has been steady through the first nine months of 2016 with a small shift in activity from apartments to single dwelling. However, renovation activity has declined 18.6 per cent leading to a 11.2 per cent decline in residential investment over the first three quarters of the year. A rebound in renovation activities may be expected in Q4 as Cape Breton rebuilds from flooding. Lower building permits and housing starts suggest that housing construction will slow in 2017. Non-residential buildings construction declined 4.0 per cent over the first three quarter of 2016 as a sharp decline in industrial buildings offset small increases in commercial and institutional and governmental buildings.
International Exports: In 2016, Nova Scotia’s non-energy exports continued to grow, increasing by 0.8 per cent over the first ten months of the year. Gains were reported in farm, fishing, intermediate food, motor vehicles and parts as well as consumer products. Forest products, chemicals, plastics and rubber products have declined. Energy products are down significantly as output from Deep Panuke (-22.8%) and Sable (-8.0%) platform has been lower in 2016 and their remaining output appears to be increasingly used within Canada. Overall, international merchandise exports have declined 2.5 per cent for the first ten months of 2016.
14
| | |
| | Forecast Update December 2016 |
Key Risks
Economic
The Current Economic Outlook reflects information and data up to November 9, 2016. Since then, economic indicators for recent months have been released and previous data has been revised. This data and any significant new economic events will be incorporated into future economic forecasts.
Global economic uncertainty has resulted in repeated downward revisions to economic projections since the recession of 2008. There are increasing concerns about secular stagnation due to global trade and foreign exchange imbalances. Further, the global economy will change as the UK leaves the EU and a new US administration takes office. Trade relationships may change with rising protectionism potentially affecting existing trade agreements.
The Canadian economy continues to be in a vulnerable position and destabilizing factors such as natural disasters, prolonged low oil prices, household deleveraging, shifting US trade, fiscal and monetary policies could materialize. Foreign exchange and interest rates could deviate from the forecast assumptions in response to events, changes in monetary policy, or shocks to the Canadian economy.
The proposed Canada-European Union Comprehensive Economic and Trade Agreement (CETA) is estimated to have positive economic impact on Canada’s economy. However, the responses by sector and region to new price and legal frameworks resulting from this agreement are uncertain and will be reflected only in future economic projections once these responses are better understood.
Federal initiatives around the Canadian Pension Plan, carbon pricing and mortgage rules are expected to be gradually phased in and are not reflected in the short run economic outlook. Any costs or benefits associated with these policy changes will be incorporated when their impacts are revealed in future data releases.
Within Nova Scotia, the economic forecast includes several major projects and federal infrastructure initiatives. The timing and magnitude of these projects are estimated based on information at the time of the forecast. As these projects can follow different timelines and magnitudes, their actual economic impacts are uncertain. In addition, there are a number of looming projects whose details are uncertain and so are not included in the forecast (as is always the case). These proposed projects constitute an upside risk to the medium term economic outlook for Nova Scotia.
An aging population has been a persistent source of uncertainty to the Nova Scotia economic forecast. In recent years, retirements have let to shrinking labour force and employment. These long run demographic trends will echo through replacement hiring, training, capital investments, pension earnings, and housing decisions. Although the aging demographic trend is well understood, it is uncertain exactly how the economy will respond and adapt to this change.
Data released for the third quarter on compensation of employees and residential investment was tracking below the annual forecast. If the final quarter of data (including revisions to preliminary results) do not rebound, there could be risk of further erosion of these important tax bases.
Revenue
Provincial own-source revenues are strongly influenced by several key factors in the economic outlook. In addition, the revenue models use administrative data, external factors and historical relationships between factors to arrive at forecasted revenues. All factors are subject to change throughout the fiscal year and can contribute to significant variations in revenues. Final personal and corporate income tax assessments for the 2015 taxation year will not be received until the spring of 2017 thereby creating the possibility of prior year adjustments (PYAs) for open taxation years.
15
| | |
| Forecast Update December 2016 | | |
Slower growth in the level of compensation of employees could pose a downside risk to personal income tax revenues – the Province’s largest source of revenue. The forecast of yield growth estimates for the 2015 and subsequent taxation years could be lower than expected once actual data is made available to the province, creating additional downside risk.
Growth in consumer expenditures, which accounts for more than 70 per cent of Harmonized Sales Tax (HST) revenues, has been strong. However, any further decline in the projected level of residential housing expenditures will place downward pressure on HST revenues.
The forecast of corporate income tax revenues is highly dependent upon national corporate taxable income. National taxable income has been experiencing greater volatility as the result of a low oil price environment combined with global uncertainty. This can present substantial risks to corporate income tax revenues. The province’s share has increased for the 2015 taxation year which helps to mitigate the effect of declining national corporate taxable income.
Increased decommissioning costs for the Sable Offshore Energy Project (SOEP) is a key concern for offshore royalties. Any increase in the estimated decommissioning costs is likely to create negative Prior Year Adjustments.
Tobacco tax revenues continue to be influenced by cessation, reduced consumption and substitution for e-cigarettes.
16