UNITED STATES
SECURITIES AND EXCHANGE COMMISSION
Washington, D.C. 20549
FORM N-CSR
CERTIFIED SHAREHOLDER REPORT OF REGISTERED
MANAGEMENT INVESTMENT COMPANIES
Investment Company Act file number 811-05686
AIM Investment Securities Funds (Invesco Investment Securities Funds)
(Exact name of registrant as specified in charter)
11 Greenway Plaza, Suite 1000 Houston, Texas 77046
(Address of principal executive offices) (Zip code)
Sheri Morris 11 Greenway Plaza, Suite 1000 Houston, Texas 77046
(Name and address of agent for service)
Registrant’s telephone number, including area code: (713) 626-1919
Date of fiscal year end: 2/28
Date of reporting period: 2/28/2022
| ITEM 1. | REPORTS TO STOCKHOLDERS. |
(a) The Registrant’s annual report transmitted to shareholders pursuant to Rule 30e-1 under the Investment Company Act of 1940 is as follows:
(b) Not applicable.

| | |
| | |
| Annual Report to Shareholders | | February 28, 2022 |
Invesco Corporate Bond Fund
Nasdaq:
A: ACCBX ∎ C: ACCEX ∎ R: ACCZX ∎ Y: ACCHX ∎ R5: ACCWX ∎ R6: ICBFX
Management’s Discussion of Fund Performance
| | | | |
| |
Performance summary | |
For the fiscal year ended February 28, 2022, Class A shares of Invesco Corporate Bond Fund (the Fund), at net asset value (NAV), underperformed the Bloomberg U.S. Credit Index, the Fund’s broad market/style-specific benchmark. Your Fund’s long-term performance appears later in this report. | | | | |
| |
Fund vs. Indexes | |
Total returns, 2/28/21 to 2/28/22, at net asset value (NAV). Performance shown does not include applicable contingent deferred sales charges (CDSC) or front-end sales charges, which would have reduced performance. | |
Class A Shares | | | -3.79 | % |
Class C Shares | | | -4.60 | |
Class R Shares | | | -4.16 | |
Class Y Shares | | | -3.66 | |
Class R5 Shares | | | -3.47 | |
Class R6 Shares | | | -3.54 | |
Bloomberg U.S. Credit Index▼ (Broad Market/Style-Specific Index) | | | -3.25 | |
Lipper BBB Rated Funds Index∎ (Peer Group Index) | | | -3.02 | |
| |
Source(s): ▼RIMES Technologies Corp.; ∎Lipper Inc. | | | | |
Market conditions and your Fund
In the first quarter of 2021, rising 10-year US Treasury yields increased significantly to 1.74%,1 its highest level since January 2020, reflecting higher inflation expectations. Largely a result of economic optimism, government bond yields rose globally during the first quarter of 2021 as investors began to price in higher levels of economic growth and inflation moving towards a post-pandemic world. On the fiscal front, another stimulus package was signed into law and COVID-19 vaccine approvals and administration ramped up. 30-year Treasury yields moved higher by 0.75% to end the quarter at 2.41%.1 Importantly, short-term rates, which are closely tied to Federal Reserve policy, were quite steady. Two-year US Treasury yields moved up just 0.05% to 0.16%.1
Fixed income markets settled down in the second quarter of 2021, posting gains and rebounding from negative performance experienced during the early part of the fiscal year due to a sharply rising interest rate environment. Despite higher volatility stemming from inflation concerns and the potential for rising interest rates, investors remained optimistic about the strength of the economic recovery after the Bureau of Economic Analysis reported that US gross domestic product grew at a 6.4% annualized rate for the first quarter of 2021.2 As the US COVID-19 vaccination rate neared the 50% threshold, consumers resumed pre-pandemic activities in the third quarter of 2021 and economically sensitive areas such as the consumer discretionary and industrials sectors began to recover.
In the fourth quarter of 2021, concerns about inflation heightened as US inflation rose to 7%,3 its highest level in nearly 40 years. Though the US Federal Reserve (the Fed) left policy rates unchanged in the quarter, the Fed indicated its accommodative policies were coming to an end in 2022
through a willingness to raise interest rates to combat inflation and the announced reduction of its monthly bond purchase program. Additionally, US interest rate moves and inflation risk significantly affected fixed income valuations during the quarter. The two-year Treasury yield rose moderately from 0.27% to 0.73%, while the 10-year increased slightly from 1.48% to 1.52%.1 The yield curve, as measured by the yield differential between two- and 10-year Treasuries flattened during the quarter. Despite the withdrawal of central bank support and coronavirus variants raising concerns about economic reopenings and the resumption of travel, we believe investors are cautiously optimistic and expect corporate balance sheets to continue to recover meaningfully in 2022. At the beginning of 2022, geopolitical and economic tensions between Ukraine and Russia culminated with the latter invading Ukraine. World leaders levied sanctions against Russia that we believe will likely have material effects on its fixed income markets, particularly sovereign debt, corporates and levels of liquidity. Regarding inflation concerns, political uncertainty should give central banks a reason to be cautious, with the Fed unlikely to raise rates by more than 0.25% at the March Federal Open Market Committee meeting, whereas before this crisis, a 0.50% increase was increasingly likely.
The Fund, at NAV, generated negative returns for the fiscal year and underperformed its broad market/style-specific benchmark, the Bloomberg U.S. Credit Index.
Security selection in investment-grade corporate bonds was the most notable contributor to the Fund’s relative performance. Security selection in the consumer non-cyclical, electric and banking sub-sectors contributed significantly to the Fund’s relative performance. Overweights to the communications, energy and consumer cyclical sub-sectors were the primary detractors from the Fund’s relative performance. Additionally,
underperformance from Treasuries and other government-related assets was driven by a flattening of the yield curve, signaling inflation concerns. The Fund’s duration relative to the broad market/style-specific benchmark contributed to relative performance.
The Fund may use active duration and yield curve positioning for risk management and for generating excess return versus its broad market/style-specific benchmark. Duration measures a portfolio’s price sensitivity to interest rate changes. Yield curve positioning refers to actively emphasizing particular points (maturities) along the yield curve with favorable risk-return expectations. During the fiscal year, the duration of the portfolio was maintained in line with the broad market/ style-specific benchmark, on average and the timing of changes and the degree of variance from the Fund’s broad market/style-specific benchmark had a small negative effect on relative performance. Buying and selling US Treasury futures was an important tool used for the management of interest rate risk and to maintain our targeted portfolio duration during the fiscal year.
Part of the Fund’s strategy in seeking to manage credit and currency risk during the fiscal year entailed purchasing and selling credit and currency derivatives. We sought to manage credit risk by purchasing and selling credit default swaps at various points throughout the fiscal year. Management of currency risk was carried out via currency-forwards and options on an as-needed basis and we believe it was effective in managing the currency positioning within the Fund during the fiscal year.
We wish to remind you that the Fund is subject to interest rate risk, meaning when interest rates rise, the value of fixed income securities tends to fall. The risk may be greater in the current market environment because interest rates are near historic lows. The degree to which the value of fixed income securities may decline due to rising interest rates may vary depending on the speed and magnitude of the increase in interest rates, as well as individual security characteristics, such as price, maturity, duration and coupon and market forces, such as supply and demand for similar securities. We are monitoring interest rates and the market economic and geopolitical factors that may impact the direction, speed and magnitude of changes to interest rates across the maturity spectrum, including the potential impact of monetary policy changes by the Fed and certain foreign central banks. If interest rates rise or fall faster than expected, markets may experience increased volatility, which may affect the value and/or liquidity of certain of the Fund’s investments.
Thank you for investing in Invesco Corporate Bond Fund and for sharing our long-term investment horizon.
| | |
| 2 | | Invesco Corporate Bond Fund |
| 1 | Source: US Department of the Treasury |
| 2 | Source: US Bureau of Economic Analysis |
| 3 | Source: US Bureau of Labor Statistics |
Portfolio manager(s):
Matthew Brill
Chuck Burge
Michael Hyman
Niklas Nordenfelt
Todd Schomberg
The views and opinions expressed in management’s discussion of Fund performance are those of Invesco Advisers, Inc. and its affiliates. These views and opinions are subject to change at any time based on factors such as market and economic conditions. These views and opinions may not be relied upon as investment advice or recommendations, or as an offer for a particular security. The information is not a complete analysis of every aspect of any market, country, industry, security or the Fund. Statements of fact are from sources considered reliable, but Invesco Advisers, Inc. makes no representation or warranty as to their completeness or accuracy. Although historical performance is no guarantee of future results, these insights may help you understand our investment management philosophy.
See important Fund and, if applicable, index disclosures later in this report.
| | |
| 3 | | Invesco Corporate Bond Fund |
Your Fund’s Long-Term Performance
Results of a $10,000 Investment – Oldest Share Class(es)
Fund and index data from 2/29/12
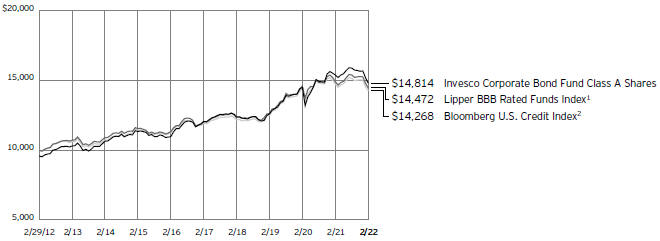
| 2 | Source: RIMES Technologies Corp. |
Past performance cannot guarantee future results.
The data shown in the chart include reinvested distributions, applicable sales charges and Fund expenses including management
fees. Index results include reinvested dividends, but they do not reflect sales charges. Performance of the peer group, if applicable, reflects Fund expenses and management fees; performance of a market index does
not. Performance shown in the chart does not reflect deduction of taxes a shareholder would pay on Fund distributions or sale of Fund shares.
| | |
| 4 | | Invesco Corporate Bond Fund |
| | | | |
| |
Average Annual Total Returns | |
As of 2/28/22, including maximum applicable sales charges | |
Class A Shares | | | | |
Inception (9/23/71) | | | 6.81 | % |
10 Years | | | 4.01 | |
5 Years | | | 3.30 | |
1 Year | | | -7.92 | |
Class C Shares | | | | |
Inception (8/30/93) | | | 5.08 | % |
10 Years | | | 3.86 | |
5 Years | | | 3.42 | |
1 Year | | | -5.51 | |
Class R Shares | | | | |
Inception (6/6/11) | | | 4.41 | % |
10 Years | | | 4.20 | |
5 Years | | | 3.94 | |
1 Year | | | -4.16 | |
Class Y Shares | | | | |
Inception (8/12/05) | | | 5.26 | % |
10 Years | | | 4.72 | |
5 Years | | | 4.45 | |
1 Year | | | -3.66 | |
Class R5 Shares | | | | |
Inception (6/1/10) | | | 5.53 | % |
10 Years | | | 4.85 | |
5 Years | | | 4.55 | |
1 Year | | | -3.47 | |
Class R6 Shares | | | | |
10 Years | | | 4.87 | % |
5 Years | | | 4.59 | |
1 Year | | | -3.54 | |
Effective June 1, 2010, Class A, Class C and Class I shares of the predecessor fund, Van Kampen Corporate Bond Fund, advised by Van Kampen Asset Management were reorganized into Class A, Class C and Class Y shares, respectively, of Invesco Van Kampen Corporate Bond Fund (renamed Invesco Corporate Bond Fund). Returns shown above, prior to June 1, 2010, for Class A, Class C and Class Y shares are those for Class A, Class C and Class I shares of the predecessor fund. Share class returns will differ from the predecessor fund because of different expenses.
Class R6 shares incepted on September 24, 2012. Performance shown prior to that date is that of the Fund’s Class A shares at net asset value and includes the 12b-1 fees applicable to Class A shares.
The performance data quoted represent past performance and cannot guarantee future results; current performance may be lower or higher. Please visit invesco.com/ performance for the most recent month-end performance. Performance figures reflect reinvested distributions, changes in net asset value and the effect of the maximum sales charge unless otherwise stated. Performance figures do not reflect deduction of taxes a shareholder would pay on Fund distributions or sale of Fund shares. Investment return and principal value will
fluctuate so that you may have a gain or loss when you sell shares.
Class A share performance reflects the maximum 4.25% sales charge, and Class C share performance reflects the applicable contingent deferred sales charge (CDSC) for the period involved. The CDSC on Class C shares is 1% for the first year after purchase. Class R, Class Y, Class R5 and Class R6 shares do not have a front-end sales charge or a CDSC; therefore, performance is at net asset value.
The performance of the Fund’s share classes will differ primarily due to different sales charge structures and class expenses.
Fund performance reflects any applicable fee waivers and/or expense reimbursements. Had the adviser not waived fees and/or reimbursed expenses currently or in the past, returns would have been lower. See current prospectus for more information.
| | |
| 5 | | Invesco Corporate Bond Fund |
Supplemental Information
Invesco Corporate Bond Fund’s primary investment objective is to seek to provide current income with preservation of capital. Capital appreciation is a secondary objective that is sought only when consistent with the Fund’s primary investment objective.
| ∎ | Unless otherwise stated, information presented in this report is as of February 28, 2022, and is based on total net assets. |
| ∎ | Unless otherwise noted, all data is provided by Invesco. |
| ∎ | To access your Fund’s reports/prospectus, visit invesco.com/fundreports. |
About indexes used in this report
| ∎ | The Bloomberg U.S. Credit Index is an unmanaged index considered representative of publicly issued, SEC-registered US corporate and specified foreign debentures and secured notes. |
| ∎ | The Lipper BBB Rated Funds Index is an unmanaged index considered representative of BBB-rated funds tracked by Lipper. |
| ∎ | The Fund is not managed to track the performance of any particular index, including the index(es) described here, and consequently, the performance of the Fund may deviate significantly from the performance of the index(es). |
| ∎ | A direct investment cannot be made in an index. Unless otherwise indicated, index results include reinvested dividends, and they do not reflect sales charges. Performance of the peer group, if applicable, reflects fund expenses; performance of a market index does not. |
|
|
This report must be accompanied or preceded by a currently effective Fund prospectus, which contains more complete information, including sales charges and expenses. Investors should read it carefully before investing. |
|
| NOT FDIC INSURED | MAY LOSE VALUE | NO BANK GUARANTEE |
| | |
| 6 | | Invesco Corporate Bond Fund |
Fund Information
| | | | | |
| Portfolio Composition | |
| By security type | | % of total net assets |
| |
U.S. Dollar Denominated Bonds & Notes | | | | 88.74 | % |
| |
U.S. Treasury Securities | | | | 5.02 | |
| |
Preferred Stocks | | | | 2.78 | |
| |
Security Types Each Less Than 1% of Portfolio | | | | 1.70 | |
| |
Money Market Funds Plus Other Assets Less Liabilities | | | | 1.76 | |
| |
| Top Five Debt Issuers* | | | | | |
| | | % of total net assets |
| |
1. U.S. Treasury | | | | 5.02 | % |
| |
2. Goldman Sachs Group, Inc. (The) | | | | 2.21 | |
| |
3. Bank of America Corp. | | | | 2.09 | |
| |
4. Kinder Morgan, Inc. | | | | 1.82 | |
| |
5. Citigroup, Inc. | | | | 1.46 | |
The Fund’s holdings are subject to change, and there is no assurance that the Fund will continue to hold any particular security.
| * | Excluding money market fund holdings, if any. |
Data presented here are as of February 28, 2022.
| | |
| 7 | | Invesco Corporate Bond Fund |
Schedule of Investments(a)
February 28, 2022
| | | | | | |
| | | Principal Amount | | | Value |
U.S. Dollar Denominated Bonds & Notes-88.74% |
Advertising-0.32% | | | | | | |
Interpublic Group of Cos., Inc. (The), 4.75%, 03/30/2030 | | $ | 4,332,000 | | | $ 4,810,409 |
Lamar Media Corp., | | | | | | |
3.75%, 02/15/2028 | | | 2,800,000 | | | 2,695,000 |
4.00%, 02/15/2030 | | | 1,319,000 | | | 1,271,819 |
3.63%, 01/15/2031 | | | 523,000 | | | 491,764 |
| | | | | | | 9,268,992 |
|
Aerospace & Defense-0.78% |
Boeing Co. (The), | | | | | | |
2.75%, 02/01/2026(b) | | | 3,569,000 | | | 3,573,484 |
2.20%, 02/04/2026 | | | 4,977,000 | | | 4,858,827 |
5.15%, 05/01/2030 | | | 4,617,000 | | | 5,102,839 |
5.81%, 05/01/2050 | | | 7,411,000 | | | 8,817,551 |
TransDigm UK Holdings PLC, 6.88%, 05/15/2026 | | | 301,000 | | | 311,210 |
TransDigm, Inc., 6.38%, 06/15/2026 | | | 141,000 | | | 143,911 |
| | | | | | | 22,807,822 |
|
Agricultural Products-0.27% |
Bunge Ltd. Finance Corp., 2.75%, 05/14/2031(b) | | | 8,227,000 | | | 7,837,211 |
|
Airlines-2.00% |
American Airlines Pass-Through Trust, | | | | | | |
Series 2016-3, Class A, 3.00%, 10/15/2028 | | | 3,257,897 | | | 3,234,196 |
Series 2017-2, Class AA, 3.35%, 10/15/2029 | | | 267,489 | | | 270,236 |
Series 2021-1, Class B, 3.95%, 07/11/2030 | | | 2,985,000 | | | 2,856,665 |
Series 2021-1, Class A, 2.88%, 07/11/2034 | | | 3,875,000 | | | 3,744,249 |
American Airlines, Inc./AAdvantage Loyalty IP Ltd., | | | | | | |
5.50%, 04/20/2026(c) | | | 1,236,000 | | | 1,266,900 |
5.75%, 04/20/2029(c) | | | 753,000 | | | 771,125 |
British Airways Pass-Through Trust (United Kingdom), | | | | | | |
Series 2019-1, Class AA, 3.30%, 12/15/2032(c) | | | 3,466,615 | | | 3,480,528 |
Series 2021-1, Class A, 2.90%, 03/15/2035(c) | | | 1,943,814 | | | 1,909,334 |
Delta Air Lines Pass-Through Trust, | | | | | | |
Series 2019-1, Class A, 3.40%, 04/25/2024 | | | 3,090,000 | | | 3,109,924 |
Series 2020-1, Class AA, 2.00%, 06/10/2028 | | | 2,671,757 | | | 2,556,602 |
Delta Air Lines, Inc., 7.38%, 01/15/2026(b) | | | 425,000 | | | 477,479 |
Delta Air Lines, Inc./SkyMiles IP Ltd., | | | | | | |
4.50%, 10/20/2025(c) | | | 3,686,775 | | | 3,786,235 |
4.75%, 10/20/2028(c) | | | 11,003,675 | | | 11,485,943 |
| | | | | | |
| | | Principal Amount | | | Value |
|
Airlines-(continued) |
United Airlines Pass-Through Trust, | | | | | | |
Series 2014-2, Class B, 4.63%, 09/03/2022 | | $ | 1,081,901 | | | $ 1,094,800 |
Series 2016-1, Class B, 3.65%, 01/07/2026 | | | 1,744,759 | | | 1,722,274 |
Series 2020-1, Class A, 5.88%, 10/15/2027 | | | 5,285,428 | | | 5,589,726 |
Series 2018-1, Class A, 3.70%, 03/01/2030 | | | 289,375 | | | 286,566 |
Series 2018-1, Class AA, 3.50%, 03/01/2030 | | | 3,467,345 | | | 3,525,197 |
Series 2019-1, Class A, 4.55%, 08/25/2031 | | | 1,679,658 | | | 1,791,548 |
Series 2019-1, Class AA, 4.15%, 08/25/2031 | | | 3,116,844 | | | 3,347,734 |
United Airlines, Inc., | | | | | | |
4.38%, 04/15/2026(c) | | | 883,000 | | | 881,852 |
4.63%, 04/15/2029(c) | | | 1,090,000 | | | 1,065,257 |
| | | | | | | 58,254,370 |
|
Alternative Carriers-0.05% |
Level 3 Financing, Inc., 3.75%, 07/15/2029(b)(c) | | | 1,285,000 | | | 1,148,096 |
Lumen Technologies, Inc.,
Series P, 7.60%, 09/15/2039 | | | 459,000 | | | 404,781 |
| | | | | | | 1,552,877 |
|
Apparel Retail-0.03% |
Gap, Inc. (The), 3.63%, 10/01/2029(b)(c) | | | 851,000 | | | 772,283 |
|
Apparel, Accessories & Luxury Goods-0.02% |
Kontoor Brands, Inc., 4.13%, 11/15/2029(c) | | | 666,000 | | | 628,844 |
|
Application Software-0.31%salesforce.com, inc., |
2.90%, 07/15/2051 | | | 6,414,000 | | | 5,829,296 |
3.05%, 07/15/2061 | | | 3,631,000 | | | 3,289,295 |
| | | | | | | 9,118,591 |
|
Asset Management & Custody Banks-1.26% |
Affiliated Managers Group, Inc., 4.25%, 02/15/2024 | | | 3,852,000 | | | 4,019,151 |
Ameriprise Financial, Inc., 3.00%, 04/02/2025 | | | 3,007,000 | | | 3,063,757 |
Apollo Management Holdings L.P., 2.65%, 06/05/2030(c) | | | 229,000 | | | 221,554 |
Ares Capital Corp., | | | | | | |
2.88%, 06/15/2028(b) | | | 4,312,000 | | | 3,996,901 |
3.20%, 11/15/2031 | | | 400,000 | | | 361,852 |
Bank of New York Mellon Corp. (The), Series I, 3.75%(b)(d)(e) | | | 5,832,000 | | | 5,440,323 |
Blackstone Secured Lending Fund, | | | | | | |
2.75%, 09/16/2026 | | | 7,027,000 | | | 6,748,284 |
2.13%, 02/15/2027(c) | | | 4,127,000 | | | 3,822,781 |
2.85%, 09/30/2028(c) | | | 2,399,000 | | | 2,211,839 |
CI Financial Corp. (Canada), 3.20%, 12/17/2030 | | | 4,309,000 | | | 4,062,638 |
See accompanying Notes to Financial Statements which are an integral part of the financial statements.
| | |
| 8 | | Invesco Corporate Bond Fund |
| | | | | | |
| | | Principal Amount | | | Value |
Asset Management & Custody Banks-(continued) |
FS KKR Capital Corp., 1.65%, 10/12/2024 | | $ | 2,555,000 | | | $ 2,451,137 |
Hercules Capital, Inc., 2.63%, 09/16/2026 | | | 375,000 | | | 357,325 |
| | | | | | | 36,757,542 |
|
Auto Parts & Equipment-0.36% |
Avis Budget Car Rental LLC/Avis Budget Finance, Inc., | | | | | | |
4.75%, 04/01/2028(b)(c) | | | 4,969,000 | | | 4,727,208 |
5.38%, 03/01/2029(b)(c) | | | 1,884,000 | | | 1,856,578 |
Clarios Global L.P./Clarios US Finance Co., 8.50%, 05/15/2027(c) | | | 178,000 | | | 185,743 |
Dana Financing Luxembourg S.a.r.l., 5.75%, 04/15/2025(c) | | | 132,000 | | | 133,820 |
Dana, Inc., 5.38%, 11/15/2027 | | | 221,000 | | | 225,697 |
Nemak S.A.B. de C.V. (Mexico), 3.63%, 06/28/2031(c) | | | 3,204,000 | | | 2,901,927 |
NESCO Holdings II, Inc., 5.50%, 04/15/2029(c) | | | 506,000 | | | 487,048 |
| | | | | | | 10,518,021 |
|
Automobile Manufacturers-1.38% |
Allison Transmission, Inc., 3.75%, 01/30/2031(c) | | | 1,046,000 | | | 972,853 |
American Honda Finance Corp., 1.30%, 09/09/2026(b) | | | 2,820,000 | | | 2,700,424 |
Ford Motor Co., | | | | | | |
3.25%, 02/12/2032(b) | | | 755,000 | | | 713,558 |
4.75%, 01/15/2043 | | | 345,000 | | | 334,315 |
Ford Motor Credit Co. LLC, | | | | | | |
4.39%, 01/08/2026 | | | 795,000 | | | 811,957 |
2.70%, 08/10/2026 | | | 2,367,000 | | | 2,269,361 |
2.90%, 02/10/2029 | | | 334,000 | | | 312,457 |
5.11%, 05/03/2029 | | | 450,000 | | | 475,130 |
4.00%, 11/13/2030 | | | 332,000 | | | 329,902 |
General Motors Financial Co., Inc., Series B, 6.50%(d)(e) | | | 200,000 | | | 206,800 |
Hyundai Capital America, | | | | | | |
4.30%, 02/01/2024(b)(c) | | | 11,151,000 | | | 11,525,191 |
2.65%, 02/10/2025(c) | | | 3,379,000 | | | 3,376,404 |
2.00%, 06/15/2028(c) | | | 4,246,000 | | | 3,951,667 |
J.B. Poindexter & Co., Inc., 7.13%, 04/15/2026(c) | | | 426,000 | | | 442,614 |
Nissan Motor Acceptance Co. LLC, 1.85%, 09/16/2026(c) | | | 10,446,000 | | | 9,800,990 |
Volkswagen Group of America Finance LLC (Germany), 1.63%, 11/24/2027(b)(c) | | | 2,251,000 | | | 2,120,806 |
| | | | | | | 40,344,429 |
|
Automotive Retail-0.49% |
Asbury Automotive Group, Inc., | | | | | | |
4.50%, 03/01/2028 | | | 137,000 | | | 134,885 |
4.63%, 11/15/2029(b)(c) | | | 658,000 | | | 642,771 |
5.00%, 02/15/2032(c) | | | 1,739,000 | | | 1,690,690 |
Group 1 Automotive, Inc., 4.00%, 08/15/2028(c) | | | 1,053,000 | | | 1,016,645 |
Lithia Motors, Inc., 3.88%, 06/01/2029(b)(c) | | | 4,401,000 | | | 4,351,049 |
| | | | | | |
| | | Principal Amount | | | Value |
Automotive Retail-(continued) |
Sonic Automotive, Inc., | | | | | | |
4.63%, 11/15/2029(c) | | $ | 3,122,000 | | | $ 2,968,538 |
4.88%, 11/15/2031(c) | | | 3,629,000 | | | 3,435,266 |
| | | | | | | 14,239,844 |
|
Biotechnology-0.18% |
AbbVie, Inc., 4.88%, 11/14/2048 | | | 1,844,000 | | | 2,122,656 |
Amgen, Inc., | | | | | | |
2.00%, 01/15/2032(b) | | | 450,000 | | | 416,819 |
3.15%, 02/21/2040 | | | 2,803,000 | | | 2,623,496 |
| | | | | | | 5,162,971 |
|
Brewers-0.26% |
Anadolu Efes Biracilik ve Malt Sanayii A.S. (Turkey), 3.38%, 06/29/2028(c) | | | 2,337,000 | | | 2,155,018 |
Anheuser-Busch InBev Worldwide, Inc. (Belgium), | | | | | | |
8.00%, 11/15/2039 | | | 2,130,000 | | | 3,207,769 |
4.35%, 06/01/2040 | | | 1,943,000 | | | 2,075,667 |
| | | | | | | 7,438,454 |
|
Broadcasting-0.02% |
Gray Television, Inc., 7.00%, 05/15/2027(c) | | | 444,000 | | | 467,563 |
|
Building Products-0.09% |
Carrier Global Corp., 2.72%, 02/15/2030 | | | 155,000 | | | 150,923 |
Johnson Controls International PLC/Tyco Fire & Security Finance S.C.A., 2.00%, 09/16/2031 | | | 1,733,000 | | | 1,581,521 |
Owens Corning, 4.30%, 07/15/2047 | | | 250,000 | | | 264,586 |
Standard Industries, Inc., 5.00%, 02/15/2027(c) | | | 508,000 | | | 511,823 |
| | | | | | | 2,508,853 |
|
Cable & Satellite-2.43% |
CCO Holdings LLC/CCO Holdings Capital Corp., | | | | | | |
5.00%, 02/01/2028(c) | | | 187,000 | | | 188,360 |
4.75%, 03/01/2030(c) | | | 607,000 | | | 597,136 |
4.50%, 08/15/2030(c) | | | 676,000 | | | 652,185 |
4.50%, 05/01/2032 | | | 809,000 | | | 769,889 |
4.50%, 06/01/2033(c) | | | 1,952,000 | | | 1,832,879 |
4.25%, 01/15/2034(c) | | | 217,000 | | | 199,872 |
Charter Communications Operating LLC/Charter Communications Operating Capital Corp., | | | | | | |
4.91%, 07/23/2025 | | | 4,413,000 | | | 4,680,479 |
5.38%, 04/01/2038 | | | 249,000 | | | 260,819 |
3.50%, 06/01/2041 | | | 3,353,000 | | | 2,901,911 |
3.50%, 03/01/2042 | | | 4,172,000 | | | 3,602,202 |
5.75%, 04/01/2048 | | | 2,146,000 | | | 2,376,564 |
3.90%, 06/01/2052 | | | 3,628,000 | | | 3,161,435 |
6.83%, 10/23/2055 | | | 3,796,000 | | | 4,764,631 |
3.85%, 04/01/2061 | | | 4,400,000 | | | 3,662,198 |
4.40%, 12/01/2061 | | | 1,787,000 | | | 1,595,731 |
See accompanying Notes to Financial Statements which are an integral part of the financial statements.
| | |
| 9 | | Invesco Corporate Bond Fund |
| | | | | | |
| | | Principal Amount | | | Value |
Cable & Satellite-(continued) |
Comcast Corp., | | | | | | |
3.45%, 02/01/2050(b) | | $ | 3,674,000 | | | $ 3,435,515 |
2.80%, 01/15/2051 | | | 7,562,000 | | | 6,328,300 |
2.89%, 11/01/2051(c) | | | 4,849,000 | | | 4,214,078 |
2.94%, 11/01/2056(c) | | | 4,622,000 | | | 3,897,977 |
2.99%, 11/01/2063(c) | | | 3,277,000 | | | 2,734,401 |
Cox Communications, Inc., | | | | | | |
2.60%, 06/15/2031(c) | | | 2,926,000 | | | 2,757,676 |
3.60%, 06/15/2051(c) | | | 7,372,000 | | | 6,841,282 |
CSC Holdings LLC, | | | | | | |
6.50%, 02/01/2029(c) | | | 727,000 | | | 737,233 |
5.75%, 01/15/2030(c) | | | 817,000 | | | 723,878 |
4.50%, 11/15/2031(c) | | | 264,000 | | | 240,610 |
5.00%, 11/15/2031(c) | | | 200,000 | | | 166,736 |
DISH DBS Corp., 7.75%, 07/01/2026 | | | 130,000 | | | 131,800 |
Gray Escrow II, Inc., 5.38%, 11/15/2031(c) | | | 391,000 | | | 376,944 |
Sirius XM Radio, Inc., | | | | | | |
4.00%, 07/15/2028(c) | | | 412,000 | | | 396,797 |
4.13%, 07/01/2030(c) | | | 1,025,000 | | | 970,444 |
3.88%, 09/01/2031(b)(c) | | | 5,085,000 | | | 4,692,616 |
Virgin Media Finance PLC (United Kingdom), 5.00%, 07/15/2030(c) | | | 296,000 | | | 280,355 |
Virgin Media Secured Finance PLC (United Kingdom), 5.50%, 05/15/2029(c) | | | 200,000 | | | 200,133 |
VZ Secured Financing B.V. (Netherlands), 5.00%, 01/15/2032(b)(c) | | | 549,000 | | | 520,998 |
| | | | | | | 70,894,064 |
|
Casinos & Gaming-0.30% |
Boyne USA, Inc., 4.75%, 05/15/2029(c) | | | 1,715,000 | | | 1,687,380 |
DraftKings, Inc., Conv., 0.00%, 03/15/2028(c)(f) | | | 5,450,000 | | | 4,133,825 |
Everi Holdings, Inc., 5.00%, 07/15/2029(c) | | | 521,000 | | | 511,563 |
MGM Resorts International, | | | | | | |
7.75%, 03/15/2022 | | | 301,000 | | | 301,974 |
6.00%, 03/15/2023 | | | 559,000 | | | 576,575 |
Mohegan Gaming & Entertainment, 8.00%, 02/01/2026(c) | | | 513,000 | | | 518,745 |
Scientific Games International, Inc., 8.25%, 03/15/2026(c) | | | 592,000 | | | 618,954 |
Wynn Resorts Finance LLC/Wynn Resorts Capital Corp., 5.13%, 10/01/2029(c) | | | 424,000 | | | 408,607 |
| | | | | | | 8,757,623 |
|
Computer & Electronics Retail-0.57% |
Dell International LLC/EMC Corp., | | | | | | |
4.00%, 07/15/2024 | | | 2,698,000 | | | 2,801,324 |
6.02%, 06/15/2026 | | | 3,627,000 | | | 4,050,031 |
4.90%, 10/01/2026 | | | 1,587,000 | | | 1,720,207 |
8.35%, 07/15/2046 | | | 940,000 | | | 1,428,371 |
3.45%, 12/15/2051(c) | | | 2,595,000 | | | 2,201,795 |
Leidos, Inc., 2.30%, 02/15/2031 | | | 4,736,000 | | | 4,272,369 |
| | | | | | | 16,474,097 |
| | | | | | |
| | | Principal Amount | | | Value |
Construction & Engineering-0.04% |
AECOM, 5.13%, 03/15/2027 | | $ | 133,000 | | | $ 136,543 |
Great Lakes Dredge & Dock Corp., 5.25%, 06/01/2029(b)(c) | | | 520,000 | | | 521,347 |
Howard Midstream Energy Partners LLC, 6.75%, 01/15/2027(c) | | | 536,000 | | | 532,698 |
| | | | | | | 1,190,588 |
|
Construction Machinery & Heavy Trucks-0.01% |
Wabtec Corp., 4.95%, 09/15/2028 | | | 209,000 | | | 227,421 |
|
Construction Materials-0.11% |
CRH America Finance, Inc. (Ireland), 3.95%,
04/04/2028(b)(c) | | | 3,123,000 | | | 3,321,148 |
|
Consumer Finance-0.56% |
Ally Financial, Inc., | | | | | | |
5.13%, 09/30/2024 | | | 434,000 | | | 460,286 |
4.63%, 03/30/2025(b) | | | 1,303,000 | | | 1,370,085 |
2.20%, 11/02/2028(b) | | | 2,473,000 | | | 2,314,280 |
Series C, 4.70%(d)(e) | | | 2,073,000 | | | 1,927,890 |
FirstCash, Inc., 5.63%, 01/01/2030(b)(c) | | | 362,000 | | | 360,058 |
Navient Corp., | | | | | | |
7.25%, 09/25/2023(b) | | | 624,000 | | | 655,340 |
5.00%, 03/15/2027 | | | 486,000 | | | 469,741 |
5.63%, 08/01/2033 | | | 221,000 | | | 192,680 |
OneMain Finance Corp., | | | | | | |
6.88%, 03/15/2025 | | | 300,000 | | | 320,499 |
7.13%, 03/15/2026 | | | 735,000 | | | 797,648 |
3.88%, 09/15/2028 | | | 3,554,000 | | | 3,297,490 |
5.38%, 11/15/2029 | | | 519,000 | | | 522,892 |
Synchrony Financial, 4.50%, 07/23/2025 | | | 3,412,000 | | | 3,583,649 |
| | | | | | | 16,272,538 |
|
Copper-0.14% |
Freeport-McMoRan, Inc., | | | | | | |
5.00%, 09/01/2027 | | | 2,626,000 | | | 2,708,273 |
4.38%, 08/01/2028 | | | 506,000 | | | 513,185 |
5.40%, 11/14/2034(b) | | | 826,000 | | | 929,489 |
| | | | | | | 4,150,947 |
|
Data Processing & Outsourced Services-0.31% |
Block, Inc., 3.50%,
06/01/2031(b)(c) | | | 3,167,000 | | | 2,978,817 |
Clarivate Science Holdings Corp., | | | | | | |
3.88%, 07/01/2028(c) | | | 3,254,000 | | | 3,079,830 |
4.88%, 07/01/2029(b)(c) | | | 531,000 | | | 500,659 |
Fidelity National Information Services, Inc., 2.25%, 03/01/2031 | | | 530,000 | | | 483,022 |
PayPal Holdings, Inc., 2.85%, 10/01/2029 | | | 1,917,000 | | | 1,911,762 |
| | | | | | | 8,954,090 |
| | |
Department Stores-0.03% | | | | | | |
Macy’s Retail Holdings LLC, | | | | | | |
5.88%, 04/01/2029(c) | | | 500,000 | | | 511,842 |
4.50%, 12/15/2034 | | | 275,000 | | | 245,163 |
| | | | | | | 757,005 |
See accompanying Notes to Financial Statements which are an integral part of the financial statements.
| | |
| 10 | | Invesco Corporate Bond Fund |
| | | | | | |
| | | Principal Amount | | | Value |
Distributors-0.19% |
Genuine Parts Co., | | | | | | |
1.88%, 11/01/2030 | | $ | 2,582,000 | | | $ 2,319,568 |
2.75%, 02/01/2032 | | | 3,467,000 | | | 3,320,762 |
| | | | | | | 5,640,330 |
|
Diversified Banks-11.63% |
Africa Finance Corp. (Supranational), 4.38%, 04/17/2026(c) | | | 7,620,000 | | | 7,948,651 |
African Export-Import Bank (The) (Supranational), | | | | | | |
2.63%, 05/17/2026(c) | | | 1,433,000 | | | 1,375,823 |
3.80%, 05/17/2031(c) | | | 1,858,000 | | | 1,810,621 |
Australia & New Zealand Banking Group Ltd. (Australia), 6.75%(b)(c)(d)(e) | | | 3,444,000 | | | 3,747,193 |
Banco do Brasil S.A. (Brazil), 3.25%, 09/30/2026(c) | | | 3,144,000 | | | 3,024,717 |
Banco Mercantil del Norte S.A. (Mexico), | | | | | | |
5.88%(c)(d)(e) | | | 2,475,000 | | | 2,286,900 |
6.63%(c)(d)(e) | | | 2,457,000 | | | 2,261,669 |
Banco Santander S.A. (Spain), | | | | | | |
1.72%, 09/14/2027(d) | | | 3,400,000 | | | 3,216,810 |
2.75%, 12/03/2030 | | | 3,000,000 | | | 2,736,404 |
Bank of America Corp., | | | | | | |
3.86%, 07/23/2024(d) | | | 7,445,000 | | | 7,616,705 |
1.10% (SOFR + 1.05%), 02/04/2028(g) | | | 4,260,000 | | | 4,261,438 |
2.69%, 04/22/2032(d) | | | 6,050,000 | | | 5,824,225 |
2.30%, 07/21/2032(d) | | | 2,970,000 | | | 2,757,755 |
2.57%, 10/20/2032(d) | | | 3,181,000 | | | 3,014,526 |
2.97%, 02/04/2033(d) | | | 3,216,000 | | | 3,153,361 |
2.48%, 09/21/2036(d) | | | 5,040,000 | | | 4,579,716 |
7.75%, 05/14/2038 | | | 2,417,000 | | | 3,500,475 |
2.68%, 06/19/2041(d) | | | 13,021,000 | | | 11,455,321 |
Series AA, 6.10%(b)(d)(e) | | | 5,695,000 | | | 5,996,237 |
Series DD, 6.30%(b)(d)(e) | | | 1,741,000 | | | 1,882,683 |
Series RR, 4.38%(d)(e) | | | 7,381,000 | | | 7,131,522 |
Bank of China Ltd. (China), 5.00%, 11/13/2024(c) | | | 2,850,000 | | | 3,035,891 |
Barclays PLC (United Kingdom), | | | | | | |
2.28%, 11/24/2027(d) | | | 2,551,000 | | | 2,462,245 |
3.33%, 11/24/2042(d) | | | 2,601,000 | | | 2,380,444 |
BBVA Bancomer S.A. (Mexico), 4.38%, 04/10/2024(c) | | | 1,666,000 | | | 1,720,045 |
BNP Paribas S.A. (France), | | | | | | |
2.16%, 09/15/2029(c)(d) | | | 2,248,000 | | | 2,083,271 |
4.38%, 03/01/2033(c)(d) | | | 250,000 | | | 257,679 |
4.63%(b)(c)(d)(e) | | | 5,265,000 | | | 5,017,545 |
BPCE S.A. (France), | | | | | | |
2.05%, 10/19/2027(c)(d) | | | 3,650,000 | | | 3,502,602 |
2.28%, 01/20/2032(c)(d) | | | 3,204,000 | | | 2,911,344 |
| | | | | | |
| | | Principal Amount | | | Value |
Diversified Banks-(continued) |
Citigroup, Inc., | | | | | | |
3.50%, 05/15/2023 | | $ | 3,395,000 | | | $ 3,474,110 |
5.50%, 09/13/2025 | | | 3,836,000 | | | 4,184,198 |
0.74% (SOFR + 0.69%), 01/25/2026(g) | | | 2,067,000 | | | 2,070,272 |
3.11%, 04/08/2026(d) | | | 3,424,000 | | | 3,470,563 |
3.98%, 03/20/2030(d) | | | 3,412,000 | | | 3,593,766 |
4.41%, 03/31/2031(d) | | | 2,787,000 | | | 3,022,163 |
2.57%, 06/03/2031(d) | | | 266,000 | | | 254,264 |
2.56%, 05/01/2032(d) | | | 3,911,000 | | | 3,715,399 |
2.52%, 11/03/2032(d) | | | 2,125,000 | | | 2,003,181 |
3.06%, 01/25/2033(d) | | | 1,789,000 | | | 1,765,286 |
2.90%, 11/03/2042(d) | | | 3,216,000 | | | 2,903,428 |
4.65%, 07/23/2048 | | | 1,693,000 | | | 1,983,528 |
3.88%(d)(e) | | | 6,892,000 | | | 6,581,860 |
Series A, 5.95%(d)(e) | | | 1,192,000 | | | 1,206,900 |
Series V, 4.70%(d)(e) | | | 2,340,000 | | | 2,296,242 |
Citizens Bank N.A., 2.25%, 04/28/2025 | | | 2,836,000 | | | 2,828,117 |
Commonwealth Bank of Australia (Australia), 2.69%, 03/11/2031(c) | | | 3,057,000 | | | 2,855,263 |
Credit Agricole S.A. (France), | | | | | | |
1.91%, 06/16/2026(b)(c)(d) | | | 1,828,000 | | | 1,779,730 |
4.75%(c)(d)(e) | | | 5,718,000 | | | 5,360,625 |
7.88%(b)(c)(d)(e) | | | 2,555,000 | | | 2,729,059 |
Danske Bank A/S (Denmark), 1.55%, 09/10/2027(c)(d) | | | 2,939,000 | | | 2,772,042 |
Federation des Caisses Desjardins du Quebec (Canada), 2.05%, 02/10/2025(c) | | | 4,680,000 | | | 4,620,406 |
HSBC Holdings PLC (United Kingdom), | | | | | | |
1.65%, 04/18/2026(d) | | | 1,970,000 | | | 1,899,966 |
2.25%, 11/22/2027(d) | | | 4,186,000 | | | 4,037,866 |
2.01%, 09/22/2028(d) | | | 5,480,000 | | | 5,146,671 |
2.36%, 08/18/2031(d) | | | 201,000 | | | 184,801 |
2.87%, 11/22/2032(d) | | | 5,727,000 | | | 5,437,479 |
6.00%(d)(e) | | | 3,938,000 | | | 4,046,295 |
ING Groep N.V. (Netherlands), | | | | | | |
3.88%(d)(e) | | | 212,000 | | | 188,415 |
6.88%(c)(d)(e) | | | 1,670,000 | | | 1,677,219 |
JPMorgan Chase & Co., | | | | | | |
1.15% (3 mo. USD LIBOR + 0.89%), 07/23/2024(g) | | | 4,962,000 | | | 5,003,804 |
2.08%, 04/22/2026(d) | | | 4,632,000 | | | 4,565,216 |
3.63%, 12/01/2027 | | | 2,348,000 | | | 2,446,840 |
3.70%, 05/06/2030(d) | | | 3,412,000 | | | 3,549,022 |
2.58%, 04/22/2032(d) | | | 4,087,000 | | | 3,918,960 |
2.96%, 01/25/2033(d) | | | 1,790,000 | | | 1,770,875 |
4.26%, 02/22/2048(d) | | | 1,651,000 | | | 1,812,576 |
Series W, 1.51% (3 mo. USD LIBOR + 1.00%), 05/15/2047(g) | | | 5,505,000 | | | 4,733,199 |
Series V, 3.53% (3 mo. USD LIBOR + 3.32%)(e)(g) | | | 1,768,000 | | | 1,759,160 |
Mitsubishi UFJ Financial Group, Inc. (Japan), | | | | | | |
2.05%, 07/17/2030 | | | 4,387,000 | | | 4,046,182 |
2.49%, 10/13/2032(d) | | | 1,815,000 | | | 1,709,617 |
See accompanying Notes to Financial Statements which are an integral part of the financial statements.
| | |
| 11 | | Invesco Corporate Bond Fund |
| | | | | | |
| | | Principal Amount | | | Value |
Diversified Banks-(continued) |
Mizuho Financial Group, Inc. (Japan), | | | | | | |
2.20%, 07/10/2031(d) | | $ | 5,865,000 | | | $ 5,436,399 |
2.56%, 09/13/2031 | | | 3,186,000 | | | 2,916,983 |
National Australia Bank Ltd. (Australia), | | | | | | |
2.33%, 08/21/2030(c) | | | 256,000 | | | 233,016 |
2.99%, 05/21/2031(c) | | | 2,367,000 | | | 2,261,603 |
NatWest Group PLC (United Kingdom), 3.50%, 05/15/2023(d) | | | 4,559,000 | | | 4,574,880 |
Nordea Bank Abp (Finland), | | | | | | |
3.75%(b)(c)(d)(e) | | | 1,221,000 | | | 1,059,218 |
6.63%(c)(d)(e) | | | 3,428,000 | | | 3,689,385 |
Royal Bank of Canada (Canada), 0.76% (SOFR + 0.71%), 01/21/2027(g) | | | 6,586,000 | | | 6,596,168 |
Standard Chartered PLC (United Kingdom), | | | | | | |
2.68%, 06/29/2032(c)(d) | | | 3,806,000 | | | 3,512,430 |
3.27%, 02/18/2036(c)(d) | | | 4,512,000 | | | 4,169,679 |
4.30%(c)(d)(e) | | | 5,262,000 | | | 4,709,490 |
7.75%(c)(d)(e) | | | 4,646,000 | | | 4,851,864 |
Sumitomo Mitsui Financial Group, Inc. (Japan), | | | | | | |
1.47%, 07/08/2025 | | | 2,924,000 | | | 2,823,429 |
3.04%, 07/16/2029 | | | 3,934,000 | | | 3,926,223 |
2.14%, 09/23/2030 | | | 6,557,000 | | | 5,982,808 |
Sumitomo Mitsui Trust Bank Ltd. (Japan), 1.35%, 09/16/2026(c) | | | 5,202,000 | | | 4,948,076 |
Turkiye Vakiflar Bankasi T.A.O. (Turkey), 5.50%, 10/01/2026(c) | | | 3,672,000 | | | 3,398,418 |
U.S. Bancorp, | | | | | | |
2.49%, 11/03/2036(d) | | | 6,629,000 | | | 6,208,043 |
3.70%(d)(e) | | | 4,204,000 | | | 3,920,230 |
UniCredit S.p.A. (Italy), | | | | | | |
1.98%, 06/03/2027(c)(d) | | | 3,337,000 | | | 3,114,342 |
3.13%, 06/03/2032(c)(d) | | | 2,828,000 | | | 2,579,906 |
Wells Fargo & Co., | | | | | | |
2.19%, 04/30/2026(d) | | | 1,374,000 | | | 1,356,525 |
4.15%, 01/24/2029 | | | 3,412,000 | | | 3,642,576 |
3.07%, 04/30/2041(d) | | | 1,988,000 | | | 1,850,383 |
5.38%, 11/02/2043 | | | 6,711,000 | | | 8,065,004 |
4.75%, 12/07/2046 | | | 1,746,000 | | | 1,963,795 |
Series BB, 3.90%(d)(e) | | | 2,918,000 | | | 2,810,399 |
Westpac Banking Corp. (Australia), | | | | | | |
2.67%, 11/15/2035(d) | | | 101,000 | | | 91,563 |
3.13%, 11/18/2041 | | | 1,996,000 | | | 1,795,903 |
| | | | | | | 338,847,121 |
|
Diversified Capital Markets-1.37% |
Credit Suisse Group AG (Switzerland), | | | | | | |
4.19%, 04/01/2031(c)(d) | | | 2,792,000 | | | 2,901,957 |
4.50%(b)(c)(d)(e) | | | 4,764,000 | | | 4,212,567 |
5.10%(b)(c)(d)(e) | | | 4,230,000 | | | 3,944,475 |
5.25%(c)(d)(e) | | | 4,357,000 | | | 4,154,182 |
7.13%(c)(d)(e) | | | 3,667,000 | | | 3,718,301 |
7.25%(c)(d)(e) | | | 330,000 | | | 341,600 |
7.50%(c)(d)(e) | | | 5,779,000 | | | 5,894,869 |
Macquarie Bank Ltd. (Australia), 6.13%(c)(d)(e) | | | 5,010,000 | | | 5,064,283 |
| | | | | | |
| | | Principal Amount | | | Value |
Diversified Capital Markets-(continued) |
UBS Group AG (Switzerland), | | | | | | |
3.13%, 08/13/2030(c)(d) | | $ | 7,105,000 | | | $ 7,028,802 |
4.38%(c)(d)(e) | | | 2,932,000 | | | 2,657,125 |
| | | | | | | 39,918,161 |
|
Diversified Metals & Mining-0.74% |
Corp. Nacional del Cobre de Chile (Chile), 3.15%, 01/15/2051(c) | | | 1,214,000 | | | 984,534 |
FMG Resources August 2006 Pty. Ltd. (Australia), 4.38%, 04/01/2031(c) | | | 2,932,000 | | | 2,849,977 |
Rio Tinto Finance USA Ltd. (Australia), 2.75%, 11/02/2051(b) | | | 4,046,000 | | | 3,563,327 |
Teck Resources Ltd. (Canada), | | | | | | |
6.13%, 10/01/2035 | | | 5,021,000 | | | 6,143,637 |
6.25%, 07/15/2041 | | | 6,504,000 | | | 7,875,083 |
| | | | | | | 21,416,558 |
|
Diversified REITs-0.87% |
CubeSmart L.P., | | | | | | |
2.25%, 12/15/2028 | | | 1,053,000 | | | 1,003,599 |
2.50%, 02/15/2032 | | | 2,181,000 | | | 2,044,080 |
iStar, Inc., | | | | | | |
4.75%, 10/01/2024 | | | 828,000 | | | 835,208 |
5.50%, 02/15/2026 | | | 191,000 | | | 195,473 |
Trust Fibra Uno (Mexico), | | | | | | |
5.25%, 12/15/2024(c) | | | 4,124,000 | | | 4,299,435 |
5.25%, 01/30/2026(c) | | | 3,705,000 | | | 3,788,492 |
4.87%, 01/15/2030(c) | | | 3,446,000 | | | 3,417,157 |
6.39%, 01/15/2050(b)(c) | | | 9,390,000 | | | 9,639,023 |
| | | | | | | 25,222,467 |
|
Drug Retail-0.10% |
CVS Pass-Through Trust, | | | | | | |
6.04%, 12/10/2028 | | | 1,044,215 | | | 1,142,897 |
5.77%, 01/10/2033(c) | | | 1,576,398 | | | 1,789,109 |
| | | | | | | 2,932,006 |
|
Education Services-0.24% |
Grand Canyon University, 3.25%, 10/01/2023 | | | 6,960,000 | | | 6,994,800 |
|
Electric Utilities-2.65% |
Alfa Desarrollo S.p.A. (Chile), 4.55%, 09/27/2051(c) | | | 3,117,000 | | | 2,643,045 |
American Electric Power Co., Inc., 3.88%, 02/15/2062(d) | | | 10,567,000 | | | 9,860,984 |
Commonwealth Edison Co., Series 127, 3.20%, 11/15/2049 | | | 3,659,000 | | | 3,462,717 |
Drax Finco PLC (United Kingdom), 6.63%, 11/01/2025(c) | | | 3,016,000 | | | 3,065,100 |
Duke Energy Corp., 3.25%, 01/15/2082(d) | | | 2,648,000 | | | 2,438,552 |
Duke Energy Progress LLC, 2.50%, 08/15/2050 | | | 8,927,000 | | | 7,386,592 |
Electricidad Firme de Mexico Holdings S.A. de C.V. (Mexico), 4.90%, 11/20/2026(c) | | | 1,453,000 | | | 1,418,063 |
Electricite de France S.A. (France), 6.00%, 01/22/2114(c) | | | 6,655,000 | | | 7,438,395 |
See accompanying Notes to Financial Statements which are an integral part of the financial statements.
| | |
| 12 | | Invesco Corporate Bond Fund |
| | | | | | |
| | | Principal Amount | | | Value |
Electric Utilities-(continued) |
Enel Finance International N.V. (Italy), 2.88%, 07/12/2041(c) | | $ | 3,560,000 | | | $ 3,072,165 |
Eversource Energy, Series R, 1.65%, 08/15/2030 | | | 88,000 | | | 78,134 |
Interconexion Electrica S.A. ESP (Colombia), 3.83%, 11/26/2033(c) | | | 1,241,000 | | | 1,215,106 |
Mercury Chile Holdco LLC (Chile), 6.50%, 01/24/2027(c) | | | 4,362,000 | | | 4,217,051 |
PacifiCorp, 2.90%, 06/15/2052 | | | 4,821,000 | | | 4,247,060 |
Southern Co. (The),
Series B, | | | | | | |
4.00%, 01/15/2051(d) | | | 13,249,000 | | | 12,769,254 |
5.50%, 03/15/2057(b)(d) | | | 10,246,000 | | | 10,118,063 |
Series 21-A, 3.75%, 09/15/2051(d) | | | 2,246,000 | | | 2,094,620 |
Talen Energy Supply LLC, 7.63%, 06/01/2028(c) | | | 587,000 | | | 526,351 |
Vistra Operations Co. LLC, | | | | | | |
5.63%, 02/15/2027(c) | | | 180,000 | | | 184,531 |
5.00%, 07/31/2027(c) | | | 324,000 | | | 326,783 |
4.38%, 05/01/2029(c) | | | 605,000 | | | 587,316 |
| | | | | | | 77,149,882 |
|
Electrical Components & Equipment-0.17% |
Acuity Brands Lighting, Inc., 2.15%, 12/15/2030 | | | 4,891,000 | | | 4,509,614 |
EnerSys, | | | | | | |
5.00%, 04/30/2023(c) | | | 476,000 | | | 483,361 |
4.38%, 12/15/2027(c) | | | 107,000 | | | 106,331 |
| | | | | | | 5,099,306 |
|
Electronic Components-0.89% |
Corning, Inc., 5.45%, 11/15/2079 | | | 21,859,000 | | | 25,293,369 |
Sensata Technologies, Inc., 3.75%, 02/15/2031(c) | | | 541,000 | | | 504,001 |
Tyco Electronics Group S.A. (Switzerland), 2.50%, 02/04/2032 | | | 125,000 | | | 121,517 |
| | | | | | | 25,918,887 |
|
Electronic Equipment & Instruments-0.10% |
Vontier Corp., | | | | | | |
2.40%, 04/01/2028 | | | 200,000 | | | 182,237 |
2.95%, 04/01/2031 | | | 3,138,000 | | | 2,848,833 |
| | | | | | | 3,031,070 |
|
Electronic Manufacturing Services-0.22% |
Jabil, Inc., 3.00%, 01/15/2031 | | | 6,809,000 | | | 6,503,001 |
|
Environmental & Facilities Services-0.22% |
Covanta Holding Corp., | | | | | | |
4.88%, 12/01/2029(c) | | | 3,667,000 | | | 3,513,476 |
5.00%, 09/01/2030 | | | 404,000 | | | 388,729 |
GFL Environmental, Inc. (Canada), 3.50%, 09/01/2028(b)(c) | | | 2,669,000 | | | 2,552,445 |
| | | | | | | 6,454,650 |
|
Fertilizers & Agricultural Chemicals-0.09% |
Consolidated Energy Finance S.A. (Switzerland), 5.63%, 10/15/2028(c) | | | 294,000 | | | 272,112 |
| | | | | | |
| | | Principal Amount | | | Value |
Fertilizers & Agricultural Chemicals-(continued) |
OCI N.V. (Netherlands), 4.63%, 10/15/2025(c) | | $ | 843,000 | | | $ 846,245 |
OCP S.A. (Morocco), 5.13%, 06/23/2051(c) | | | 1,758,000 | | | 1,423,646 |
| | | | | | | 2,542,003 |
|
Financial Exchanges & Data-1.28% |
B3 S.A. - Brasil, Bolsa, Balcao (Brazil), 4.13%, 09/20/2031(c) | | | 5,788,000 | | | 5,216,435 |
Coinbase Global, Inc., | | | | | | |
3.38%, 10/01/2028(c) | | | 1,543,000 | | | 1,408,875 |
3.63%, 10/01/2031(c) | | | 2,000,000 | | | 1,765,000 |
FactSet Research Systems, Inc., | | | | | | |
2.90%, 03/01/2027 | | | 3,009,000 | | | 3,032,055 |
3.45%, 03/01/2032 | | | 3,641,000 | | | 3,661,509 |
| | |
Intercontinental Exchange, Inc., 1.85%, 09/15/2032 | | | 170,000 | | | 151,875 |
Moody’s Corp., | | | | | | |
2.00%, 08/19/2031 | | | 3,102,000 | | | 2,844,847 |
2.75%, 08/19/2041 | | | 3,628,000 | | | 3,147,151 |
5.25%, 07/15/2044 | | | 1,421,000 | | | 1,727,364 |
3.75%, 02/25/2052 | | | 2,721,000 | | | 2,723,458 |
3.10%, 11/29/2061 | | | 6,625,000 | | | 5,615,587 |
MSCI, Inc., | | | | | | |
3.88%, 02/15/2031(b)(c) | | | 1,983,000 | | | 1,977,051 |
3.63%, 11/01/2031(b)(c) | | | 1,992,000 | | | 1,945,148 |
S&P Global, Inc., 1.25%, 08/15/2030(b) | | | 2,285,000 | | | 2,026,824 |
| | | | | | | 37,243,179 |
|
Food Distributors-0.13% |
American Builders & Contractors Supply Co., Inc., | | | | | | |
4.00%, 01/15/2028(c) | | | 512,000 | | | 501,340 |
3.88%, 11/15/2029(c) | | | 3,447,000 | | | 3,245,575 |
| | | | | | | 3,746,915 |
|
Food Retail-0.22% |
Alimentation Couche-Tard, Inc. (Canada), | | | | | | |
3.44%, 05/13/2041(b)(c) | | | 1,481,000 | | | 1,385,076 |
3.63%, 05/13/2051(c) | | | 4,124,000 | | | 3,843,871 |
PetSmart, Inc./PetSmart Finance Corp., 4.75%, 02/15/2028(c) | | | 1,045,000 | | | 1,043,882 |
| | | | | | | 6,272,829 |
|
Health Care Distributors-0.09% |
McKesson Corp., 1.30%, 08/15/2026 | | | 2,866,000 | | | 2,715,834 |
|
Health Care Facilities-0.37% |
Encompass Health Corp., 4.50%, 02/01/2028(b) | | | 506,000 | | | 493,249 |
HCA, Inc., | | | | | | |
5.00%, 03/15/2024 | | | 7,850,000 | | | 8,254,109 |
5.38%, 02/01/2025 | | | 242,000 | | | 256,551 |
5.25%, 04/15/2025 | | | 151,000 | | | 162,197 |
5.88%, 02/15/2026 | | | 166,000 | | | 179,600 |
5.38%, 09/01/2026 | | | 111,000 | | | 119,572 |
5.88%, 02/01/2029 | | | 216,000 | | | 241,729 |
3.50%, 09/01/2030 | | | 1,234,000 | | | 1,223,511 |
| | | | | | | 10,930,518 |
See accompanying Notes to Financial Statements which are an integral part of the financial statements.
| | |
| 13 | | Invesco Corporate Bond Fund |
| | | | | | |
| | | Principal Amount | | | Value |
Health Care REITs-0.43% |
CTR Partnership L.P./ CareTrust Capital Corp., 3.88%, 06/30/2028(c) | | $ | 531,000 | | | $ 507,992 |
Diversified Healthcare Trust, | | | | | | |
4.75%, 05/01/2024 | | | 257,000 | | | 252,158 |
9.75%, 06/15/2025 | | | 482,000 | | | 509,754 |
4.38%, 03/01/2031 | | | 268,000 | | | 230,599 |
Healthcare Trust of America Holdings L.P., 2.00%, 03/15/2031(b) | | | 2,390,000 | | | 2,168,944 |
MPT Operating Partnership L.P./MPT Finance Corp., 4.63%, 08/01/2029 | | | 2,064,000 | | | 2,075,362 |
Omega Healthcare Investors, Inc., | | | | | | |
3.38%, 02/01/2031 | | | 230,000 | | | 217,779 |
3.25%, 04/15/2033 | | | 4,647,000 | | | 4,272,968 |
Welltower, Inc., 3.10%, 01/15/2030(b) | | | 2,324,000 | | | 2,326,164 |
| | | | | | | 12,561,720 |
|
Health Care Services-0.95% |
Cigna Corp., | | | | | | |
7.88%, 05/15/2027 | | | 4,693,000 | | | 5,863,400 |
4.38%, 10/15/2028 | | | 1,653,000 | | | 1,793,660 |
4.80%, 08/15/2038 | | | 4,714,000 | | | 5,260,489 |
CVS Health Corp., 1.30%, 08/21/2027(b) | | | 3,492,000 | | | 3,257,087 |
Fresenius Medical Care US Finance III, Inc. (Germany), 1.88%, 12/01/2026(c) | | | 2,775,000 | | | 2,658,959 |
Global Medical Response, Inc., 6.50%, 10/01/2025(b)(c) | | | 508,000 | | | 498,975 |
Piedmont Healthcare, Inc., | | | | | | |
Series 2032, 2.04%, 01/01/2032 | | | 1,567,000 | | | 1,443,634 |
Series 2042, 2.72%, 01/01/2042 | | | 1,513,000 | | | 1,354,748 |
2.86%, 01/01/2052(b) | | | 1,729,000 | | | 1,528,443 |
Providence St. Joseph Health Obligated Group, Series 21-A, 2.70%, 10/01/2051 | | | 4,628,000 | | | 3,949,713 |
| | | | | | | 27,609,108 |
|
Health Care Supplies-0.01% |
Mozart Debt Merger Sub, Inc., 3.88%, 04/01/2029(c) | | | 273,000 | | | 259,432 |
|
Homebuilding-0.66% |
Lennar Corp., | | | | | | |
4.75%, 11/15/2022 | | | 172,000 | | | 174,497 |
4.75%, 11/29/2027(b) | | | 2,223,000 | | | 2,418,968 |
M.D.C. Holdings, Inc., | | | | | | |
3.85%, 01/15/2030 | | | 6,697,000 | | | 6,757,150 |
6.00%, 01/15/2043 | | | 3,845,000 | | | 4,168,309 |
3.97%, 08/06/2061 | | | 5,921,000 | | | 4,856,534 |
Taylor Morrison Communities, Inc., 6.63%, 07/15/2027(c) | | | 673,000 | | | 692,773 |
Taylor Morrison Communities, Inc./Taylor Morrison Holdings II, Inc., 5.88%, 04/15/2023(c) | | | 57,000 | | | 58,282 |
| | | | | | | 19,126,513 |
| | | | | | |
| | | Principal Amount | | | Value |
Hotel & Resort REITs-0.03% |
Service Properties Trust, 4.50%, 03/15/2025 | | $ | 1,062,000 | | | $ 996,910 |
|
Hotels, Resorts & Cruise Lines-0.32% |
Carnival Corp., | | | | | | |
10.50%, 02/01/2026(c) | | | 150,000 | | | 168,569 |
5.75%, 03/01/2027(b)(c) | | | 295,000 | | | 287,713 |
Expedia Group, Inc., | | | | | | |
3.60%, 12/15/2023 | | | 2,512,000 | | | 2,568,841 |
4.63%, 08/01/2027 | | | 3,884,000 | | | 4,160,554 |
2.95%, 03/15/2031 | | | 185,000 | | | 177,590 |
Hilton Domestic Operating Co., Inc., 3.63%, 02/15/2032(c) | | | 1,980,000 | | | 1,884,722 |
| | | | | | | 9,247,989 |
|
Hypermarkets & Super Centers-0.25% |
Walmart, Inc., 6.50%, 08/15/2037 | | | 5,079,000 | | | 7,313,778 |
|
Independent Power Producers & Energy Traders-0.63% |
AES Corp. (The), | | | | | | |
1.38%, 01/15/2026 | | | 2,653,000 | | | 2,522,978 |
2.45%, 01/15/2031 | | | 4,699,000 | | | 4,353,306 |
Calpine Corp., 3.75%, 03/01/2031(c) | | | 4,464,000 | | | 4,069,628 |
Clearway Energy Operating LLC, 4.75%, 03/15/2028(c) | | | 589,000 | | | 593,070 |
EnfraGen Energia Sur S.A./EnfraGen Spain S.A./Prime Energia S.p.A. (Spain), 5.38 %, 12/30/2030(c) | | | 5,671,000 | | | 4,626,146 |
Vistra Corp., 7.00%(b)(c)(d)(e) | | | 2,295,000 | | | 2,281,368 |
| | | | | | | 18,446,496 |
|
Industrial Conglomerates-0.17% |
Bidvest Group UK PLC (The) (South Africa), 3.63%, 09/23/2026(c) | | | 2,813,000 | | | 2,707,569 |
GE Capital International Funding Co. Unlimited Co., 4.42%, 11/15/2035 | | | 2,111,000 | | | 2,376,018 |
| | | | | | | 5,083,587 |
|
Industrial Machinery-0.25% |
EnPro Industries, Inc., 5.75%, 10/15/2026 | | | 489,000 | | | 507,895 |
Flowserve Corp., 2.80%, 01/15/2032(b) | | | 3,523,000 | | | 3,245,563 |
Mueller Water Products, Inc., 4.00%, 06/15/2029(c) | | | 518,000 | | | 495,379 |
Ritchie Bros. Holdings, Inc. (Canada), 4.75%,
12/15/2031(b)(c) | | | 530,000 | | | 527,427 |
Roller Bearing Co. of America, Inc., 4.38%, 10/15/2029(c) | | | 66,000 | | | 63,772 |
Weir Group PLC (The) (United Kingdom), 2.20%, 05/13/2026(c) | | | 2,501,000 | | | 2,406,646 |
| | | | | | | 7,246,682 |
|
Industrial REITs-0.08% |
LXP Industrial Trust, 2.38%, 10/01/2031 | | | 2,407,000 | | | 2,223,003 |
See accompanying Notes to Financial Statements which are an integral part of the financial statements.
| | |
| 14 | | Invesco Corporate Bond Fund |
| | | | | | |
| | | Principal Amount | | | Value |
Insurance Brokers-0.08% |
Arthur J. Gallagher & Co., 3.50%, 05/20/2051 | | $ | 2,315,000 | | | $ 2,179,116 |
Ryan Specialty Group LLC, 4.38%, 02/01/2030(c) | | | 264,000 | | | 254,311 |
| | | | | | | 2,433,427 |
|
Integrated Oil & Gas-1.75% |
BP Capital Markets America, Inc., | | | | | | |
3.06%, 06/17/2041 | | | 5,222,000 | | | 4,689,145 |
2.77%, 11/10/2050 | | | 5,526,000 | | | 4,625,870 |
2.94%, 06/04/2051 | | | 4,954,000 | | | 4,176,956 |
3.00%, 03/17/2052 | | | 4,723,000 | | | 4,023,309 |
BP Capital Markets PLC (United Kingdom), | | | | | | |
4.38%(d)(e) | | | 4,346,000 | | | 4,356,865 |
4.88%(d)(e) | | | 1,722,000 | | | 1,712,055 |
Gray Oak Pipeline LLC, 2.60%, 10/15/2025(c) | | | 2,913,000 | | | 2,882,627 |
Lukoil Capital DAC (Russia), 2.80%, 04/26/2027(c) | | | 4,204,000 | | | 2,290,694 |
Occidental Petroleum Corp., | | | | | | |
5.55%, 03/15/2026 | | | 322,000 | | | 346,461 |
8.50%, 07/15/2027 | | | 87,000 | | | 104,984 |
6.13%, 01/01/2031(b) | | | 305,000 | | | 347,282 |
6.20%, 03/15/2040 | | | 233,000 | | | 259,649 |
4.10%, 02/15/2047 | | | 315,000 | | | 291,881 |
Petroleos Mexicanos (Mexico), 6.70%, 02/16/2032(c) | | | 3,593,000 | | | 3,472,796 |
Qatar Energy (Qatar), 3.30%, 07/12/2051(c) | | | 3,664,000 | | | 3,456,757 |
SA Global Sukuk Ltd. (Saudi Arabia), 1.60%, 06/17/2026(c) | | | 1,803,000 | | | 1,729,726 |
Saudi Arabian Oil Co. (Saudi Arabia), 4.38%, 04/16/2049(c) | | | 2,407,000 | | | 2,566,608 |
Shell International Finance B.V. (Netherlands), | | | | | | |
2.88%, 11/26/2041 | | | 5,316,000 | | | 4,902,075 |
3.00%, 11/26/2051 | | | 5,316,000 | | | 4,852,962 |
| | | | | | | 51,088,702 |
|
Integrated Telecommunication Services-2.33% |
Altice France S.A. (France), | | | | | | |
8.13%, 02/01/2027(c) | | | 472,000 | | | 497,370 |
5.13%, 07/15/2029(c) | | | 253,000 | | | 229,277 |
5.50%, 10/15/2029(c) | | | 325,000 | | | 298,241 |
AT&T, Inc., | | | | | | |
1.38% (3 mo. USD LIBOR + 1.18%), 06/12/2024(b)(g) | | | 2,703,000 | | | 2,751,850 |
2.55%, 12/01/2033 | | | 200,000 | | | 185,665 |
3.10%, 02/01/2043 | | | 4,510,000 | | | 4,033,016 |
3.50%, 09/15/2053 | | | 8,695,000 | | | 7,963,032 |
3.55%, 09/15/2055 | | | 11,107,000 | | | 10,087,640 |
3.50%, 02/01/2061 | | | 2,892,000 | | | 2,553,778 |
British Telecommunications PLC (United Kingdom), 4.25%, 11/23/2081(c)(d) | | | 6,220,000 | | | 5,997,231 |
IHS Holding Ltd. (Nigeria), | | | | | | |
5.63%, 11/29/2026(c) | | | 2,169,000 | | | 2,135,901 |
6.25%, 11/29/2028(c) | | | 1,677,000 | | | 1,642,219 |
| | | | | | |
| | | Principal Amount | | | Value |
Integrated Telecommunication Services-(continued) |
Iliad Holding S.A.S. (France), | | | | | | |
6.50%, 10/15/2026(c) | | $ | 750,000 | | | $ 749,044 |
7.00%, 10/15/2028(b)(c) | | | 300,000 | | | 298,917 |
Telefonica Emisiones S.A. (Spain), 7.05%, 06/20/2036 | | | 2,445,000 | | | 3,181,297 |
Verizon Communications, Inc., | | | | | | |
1.75%, 01/20/2031(b) | | | 3,319,000 | | | 2,990,466 |
2.55%, 03/21/2031 | | | 2,059,000 | | | 1,978,253 |
2.36%, 03/15/2032(c) | | | 3,932,000 | | | 3,674,839 |
4.81%, 03/15/2039 | | | 1,935,000 | | | 2,239,912 |
2.65%, 11/20/2040 | | | 2,177,000 | | | 1,891,537 |
3.40%, 03/22/2041 | | | 2,075,000 | | | 2,001,099 |
2.88%, 11/20/2050 | | | 3,306,000 | | | 2,831,405 |
3.00%, 11/20/2060 | | | 5,951,000 | | | 4,956,781 |
3.70%, 03/22/2061 | | | 2,953,000 | | | 2,820,726 |
| | | | | | | 67,989,496 |
|
Interactive Home Entertainment-0.76% |
Electronic Arts, Inc., | | | | | | |
1.85%, 02/15/2031 | | | 4,495,000 | | | 4,106,605 |
2.95%, 02/15/2051 | | | 4,418,000 | | | 3,810,874 |
ROBLOX Corp., 3.88%, 05/01/2030(b)(c) | | | 5,757,000 | | | 5,482,391 |
WMG Acquisition Corp., | | | | | | |
3.75%, 12/01/2029(c) | | | 6,429,000 | | | 6,150,881 |
3.00%, 02/15/2031(b)(c) | | | 2,963,000 | | | 2,683,930 |
| | | | | | | 22,234,681 |
|
Interactive Media & Services-0.94% |
Alphabet, Inc., | | | | | | |
1.90%, 08/15/2040 | | | 2,247,000 | | | 1,888,292 |
2.25%, 08/15/2060 | | | 3,919,000 | | | 3,140,633 |
Audacy Capital Corp., 6.75%, 03/31/2029(b)(c) | | | 501,000 | | | 475,599 |
Baidu, Inc. (China), | | | | | | |
3.08%, 04/07/2025(b) | | | 1,175,000 | | | 1,187,676 |
1.72%, 04/09/2026 | | | 1,255,000 | | | 1,201,603 |
Match Group Holdings II LLC, | | | | | | |
4.63%, 06/01/2028(c) | | | 790,000 | | | 793,737 |
5.63%, 02/15/2029(c) | | | 4,618,000 | | | 4,797,964 |
3.63%, 10/01/2031(c) | | | 55,000 | | | 51,371 |
Scripps Escrow II, Inc., 3.88%, 01/15/2029(c) | | | 515,000 | | | 483,487 |
Tencent Holdings Ltd. (China), | | | | | | |
1.81%, 01/26/2026(b)(c) | | | 1,509,000 | | | 1,461,591 |
3.60%, 01/19/2028(c) | | | 4,305,000 | | | 4,392,050 |
3.93%, 01/19/2038(b)(c) | | | 3,137,000 | | | 3,048,160 |
Twitter, Inc., 3.88%,
12/15/2027(b)(c) | | | 4,527,000 | | | 4,458,190 |
| | | | | | | 27,380,353 |
|
Internet & Direct Marketing Retail-0.44% |
Alibaba Group Holding Ltd. (China), 3.15%, 02/09/2051 | | | 3,700,000 | | | 2,975,909 |
Amazon.com, Inc., 3.10%, 05/12/2051 | | | 4,625,000 | | | 4,479,180 |
Meituan (China), 2.13%, 10/28/2025(b)(c) | | | 3,055,000 | | | 2,810,107 |
Prosus N.V. (China), 3.26%, 01/19/2027(c) | | | 2,374,000 | | | 2,276,387 |
QVC, Inc., 5.45%, 08/15/2034 | | | 225,000 | | | 191,599 |
| | | | | | | 12,733,182 |
See accompanying Notes to Financial Statements which are an integral part of the financial statements.
| | |
| 15 | | Invesco Corporate Bond Fund |
| | | | | | |
| | | Principal Amount | | | Value |
Internet Services & Infrastructure-0.53% |
Twilio, Inc., | | | | | | |
3.63%, 03/15/2029(b) | | $ | 3,200,000 | | | $ 3,070,592 |
3.88%, 03/15/2031 | | | 3,079,000 | | | 2,895,646 |
VeriSign, Inc., 2.70%, 06/15/2031 | | | 2,641,000 | | | 2,455,060 |
ZoomInfo Technologies LLC/ ZoomInfo Finance Corp., 3.88%, 02/01/2029(c) | | | 7,289,000 | | | 6,925,206 |
| | | | | | | 15,346,504 |
|
Investment Banking & Brokerage-3.79% |
Brookfield Finance I (UK) PLC (Canada), 2.34%, 01/30/2032 | | | 3,830,000 | | | 3,533,110 |
Brookfield Finance, Inc. (Canada), | | | | | | |
3.90%, 01/25/2028 | | | 3,604,000 | | | 3,788,051 |
2.72%, 04/15/2031 | | | 229,000 | | | 219,223 |
3.63%, 02/15/2052 | | | 5,581,000 | | | 5,189,003 |
Cantor Fitzgerald L.P., 6.50%, 06/17/2022(c) | | | 2,872,000 | | | 2,915,084 |
Charles Schwab Corp. (The), | | | | | | |
Series E, 4.63% (3 mo. USD LIBOR + 3.32%)(b)(e)(g) | | | 3,891,000 | | | 3,883,374 |
Series G, 5.38%(d)(e) | | | 231,000 | | | 244,340 |
Goldman Sachs Group, Inc. (The), | | | | | | |
0.63% (SOFR + 0.58%), 03/08/2024(g) | | | 6,481,000 | | | 6,474,689 |
0.75% (SOFR + 0.70%), 01/24/2025(g) | | | 3,809,000 | | | 3,813,494 |
3.50%, 04/01/2025 | | | 2,952,000 | | | 3,035,769 |
0.84% (SOFR + 0.79%), 12/09/2026(g) | | | 6,521,000 | | | 6,498,974 |
1.09%, 12/09/2026(d) | | | 3,203,000 | | | 3,014,579 |
0.86% (SOFR + 0.81%), 03/09/2027(g) | | | 9,144,000 | | | 9,097,702 |
0.97% (SOFR + 0.92%), 10/21/2027(g) | | | 1,953,000 | | | 1,947,310 |
1.95%, 10/21/2027(d) | | | 3,134,000 | | | 3,004,871 |
1.17% (SOFR + 1.12%), 02/24/2028(g) | | | 1,872,000 | | | 1,881,676 |
1.99%, 01/27/2032(d) | | | 3,078,000 | | | 2,777,340 |
2.38%, 07/21/2032(d) | | | 2,968,000 | | | 2,753,539 |
2.65%, 10/21/2032(d) | | | 3,804,000 | | | 3,610,502 |
3.10%, 02/24/2033(d) | | | 2,213,000 | | | 2,180,272 |
6.75%, 10/01/2037 | | | 4,034,000 | | | 5,307,206 |
3.44%, 02/24/2043(d) | | | 2,667,000 | | | 2,570,559 |
4.80%, 07/08/2044 | | | 3,651,000 | | | 4,183,558 |
Series T, 3.80%(d)(e) | | | 146,000 | | | 138,700 |
Series V, 4.13%(d)(e) | | | 2,539,000 | | | 2,412,050 |
Jefferies Group LLC/Jefferies Group Capital Finance, Inc., 4.15%, 01/23/2030 | | | 3,305,000 | | | 3,473,549 |
Morgan Stanley, | | | | | | |
0.67% (SOFR + 0.63%), 01/24/2025(b)(g) | | | 2,718,000 | | | 2,721,926 |
2.19%, 04/28/2026(d) | | | 2,373,000 | | | 2,343,374 |
3.62%, 04/01/2031(d) | | | 2,833,000 | | | 2,931,336 |
2.24%, 07/21/2032(d) | | | 4,901,000 | | | 4,515,733 |
2.51%, 10/20/2032(d) | | | 2,363,000 | | | 2,233,396 |
2.94%, 01/21/2033(d) | | | 2,593,000 | | | 2,541,531 |
2.48%, 09/16/2036(d) | | | 3,162,000 | | | 2,873,536 |
| | | | | | |
| | | Principal Amount | | | Value |
Investment Banking & Brokerage-(continued) |
NFP Corp., 4.88%, 08/15/2028(c) | | $ | 202,000 | | | $ 195,128 |
Raymond James Financial, Inc., 3.75%, 04/01/2051 | | | 2,003,000 | | | 1,989,849 |
| | | | | | | 110,294,333 |
|
IT Consulting & Other Services-0.20% |
DXC Technology Co., 2.38%, 09/15/2028 | | | 5,109,000 | | | 4,860,923 |
Gartner, Inc., | | | | | | |
4.50%, 07/01/2028(c) | | | 740,000 | | | 750,538 |
3.63%, 06/15/2029(c) | | | 253,000 | | | 245,913 |
| | | | | | | 5,857,374 |
|
Life & Health Insurance-3.65% |
American Equity Investment Life Holding Co., 5.00%, 06/15/2027 | | | 5,798,000 | | | 6,302,399 |
Athene Global Funding, | | | | | | |
1.20%, 10/13/2023(c) | | | 4,515,000 | | | 4,455,929 |
2.50%, 01/14/2025(c) | | | 2,936,000 | | | 2,933,704 |
1.45%, 01/08/2026(c) | | | 2,316,000 | | | 2,213,454 |
Athene Holding Ltd., | | | | | | |
4.13%, 01/12/2028 | | | 6,136,000 | | | 6,454,958 |
6.15%, 04/03/2030 | | | 3,163,000 | | | 3,723,419 |
3.95%, 05/25/2051 | | | 723,000 | | | 691,441 |
3.45%, 05/15/2052(b) | | | 4,142,000 | | | 3,633,945 |
Brighthouse Financial Global Funding, 1.20%, 12/15/2023(c) | | | 4,460,000 | | | 4,382,045 |
Brighthouse Financial, Inc., | | | | | | |
4.70%, 06/22/2047(b) | | | 1,835,000 | | | 1,837,377 |
3.85%, 12/22/2051 | | | 5,622,000 | | | 4,920,636 |
Delaware Life Global Funding, | | | | | | |
Series 22-1,
3.31%, 03/10/2025(c) | | | 5,895,000 | | | 5,895,000 |
Series 21-1, 2.66%,
06/29/2026(c) | | | 13,992,000 | | | 13,813,042 |
F&G Global Funding, 2.00%, 09/20/2028(c) | | | 4,591,000 | | | 4,287,596 |
GA Global Funding Trust, | | | | | | |
2.25%, 01/06/2027(c) | | | 5,133,000 | | | 4,974,325 |
1.95%, 09/15/2028(c) | | | 5,572,000 | | | 5,126,684 |
2.90%, 01/06/2032(c) | | | 5,529,000 | | | 5,191,711 |
MAG Mutual Holding Co., 4.75%, 04/30/2041(h) | | | 11,777,000 | | | 11,509,549 |
Maple Grove Funding Trust I, 4.16%, 08/15/2051(c) | | | 2,428,000 | | | 2,268,654 |
MetLife, Inc., Series D,
5.88%(d)(e) | | | 300,000 | | | 313,046 |
Nationwide Financial Services, Inc., 3.90%, 11/30/2049(c) | | | 2,897,000 | | | 3,015,544 |
| | |
Pacific Life Global Funding II, 0.67% (SOFR + 0.62%), 06/04/2026(c)(g) | | | 3,494,000 | | | 3,505,660 |
Pacific LifeCorp, 3.35%, 09/15/2050(c) | | | 3,060,000 | | | 2,932,586 |
Prudential Financial, Inc., 3.91%, 12/07/2047 | | | 1,707,000 | | | 1,782,258 |
| | | | | | | 106,164,962 |
See accompanying Notes to Financial Statements which are an integral part of the financial statements.
| | |
| 16 | | Invesco Corporate Bond Fund |
| | | | | | |
| | | Principal Amount | | | Value |
Life Sciences Tools & Services-0.07% |
Illumina, Inc., 2.55%, 03/23/2031 | | $ | 2,313,000 | | | $ 2,194,706 |
|
Managed Health Care-0.47% |
Centene Corp., | | | | | | |
4.63%, 12/15/2029 | | | 526,000 | | | 542,651 |
3.38%, 02/15/2030 | | | 320,000 | | | 307,515 |
3.00%, 10/15/2030 | | | 1,000,000 | | | 954,746 |
2.50%, 03/01/2031 | | | 6,080,000 | | | 5,607,584 |
Kaiser Foundation Hospitals, Series 2021, | | | | | | |
2.81%, 06/01/2041 | | | 3,275,000 | | | 3,032,684 |
3.00%, 06/01/2051 | | | 3,415,000 | | | 3,172,898 |
| | | | | | | 13,618,078 |
|
Metal & Glass Containers-0.05% |
Ardagh Metal Packaging Finance USA LLC/Ardagh Metal Packaging Finance PLC, 3.25%, 09/01/2028(c) | | | 600,000 | | | 564,960 |
Ardagh Packaging Finance PLC/Ardagh Holdings USA, Inc., 5.25%, 04/30/2025(c) | | | 489,000 | | | 496,024 |
Ball Corp., 5.25%, 07/01/2025 | | | 359,000 | | | 380,953 |
| | | | | | | 1,441,937 |
|
Movies & Entertainment-0.18% |
Netflix, Inc., | | | | | | |
5.88%, 11/15/2028 | | | 1,017,000 | | | 1,151,600 |
5.38%, 11/15/2029(c) | | | 252,000 | | | 281,867 |
Tencent Music Entertainment Group (China), | | | | | | |
1.38%, 09/03/2025 | | | 1,560,000 | | | 1,479,164 |
2.00%, 09/03/2030 | | | 2,480,000 | | | 2,214,056 |
| | | | | | | 5,126,687 |
|
Multi-line Insurance-0.27% |
Allianz SE (Germany),
3.20%(c)(d)(e) | | | 2,807,000 | | | 2,426,651 |
American International Group, Inc., 4.50%, 07/16/2044 | | | 1,929,000 | | | 2,144,317 |
Nationwide Mutual Insurance Co., 4.95%, 04/22/2044(c) | | | 2,964,000 | | | 3,296,577 |
| | | | | | | 7,867,545 |
|
Multi-Utilities-0.39% |
Algonquin Power & Utilities Corp. (Canada), 4.75%, 01/18/2082(d) | | | 9,298,000 | | | 8,834,402 |
Dominion Energy, Inc., Series C, 2.25%, 08/15/2031 | | | 354,000 | | | 327,952 |
WEC Energy Group, Inc., 1.38%, 10/15/2027 | | | 2,313,000 | | | 2,153,303 |
| | | | | | | 11,315,657 |
|
Office REITs-0.86% |
Alexandria Real Estate Equities, Inc., | | | | | | |
3.95%, 01/15/2027 | | | 2,329,000 | | | 2,479,064 |
1.88%, 02/01/2033 | | | 11,614,000 | | | 10,280,587 |
2.95%, 03/15/2034(b) | | | 1,998,000 | | | 1,955,222 |
Highwoods Realty L.P., 2.60%, 02/01/2031 | | | 1,917,000 | | | 1,824,689 |
| | | | | | |
| | | Principal Amount | | | Value |
Office REITs-(continued) |
Office Properties Income Trust, | | | | | | |
4.50%, 02/01/2025 | | $ | 4,778,000 | | | $ 4,900,354 |
2.65%, 06/15/2026 | | | 782,000 | | | 744,351 |
2.40%, 02/01/2027 | | | 3,149,000 | | | 2,916,920 |
| | | | | | | 25,101,187 |
|
Oil & Gas Drilling-0.12% |
Delek Logistics Partners L.P./Delek Logistics Finance Corp., 7.13%, 06/01/2028(c) | | | 523,000 | | | 512,242 |
Nabors Industries, Inc., 7.38%, 05/15/2027(c) | | | 509,000 | | | 526,181 |
NGL Energy Operating LLC/NGL Energy Finance Corp., 7.50%, 02/01/2026(c) | | | 405,000 | | | 407,146 |
Precision Drilling Corp. (Canada), | | | | | | |
7.13%, 01/15/2026(c) | | | 100,000 | | | 101,320 |
6.88%, 01/15/2029(c) | | | 395,000 | | | 396,997 |
Rockies Express Pipeline LLC, | | | | | | |
4.95%, 07/15/2029(c) | | | 222,000 | | | 215,156 |
4.80%, 05/15/2030(c) | | | 430,000 | | | 416,747 |
6.88%, 04/15/2040(c) | | | 339,000 | | | 346,309 |
Valaris Ltd., | | | | | | |
12.00% PIK Rate, 8.25% Cash Rate, 04/30/2028(c)(i) | | | 182,000 | | | 190,008 |
Series 1145, 12.00% PIK Rate, 8.25% Cash Rate, 04/30/2028(i) | | | 342,000 | | | 357,048 |
| | | | | | | 3,469,154 |
|
Oil & Gas Equipment & Services-0.26% |
Baker Hughes Holdings LLC/Baker Hughes Co-Obligor, Inc., 3.34%, 12/15/2027 | | | 2,968,000 | | | 3,061,999 |
Bristow Group, Inc., 6.88%, 03/01/2028(c) | | | 761,000 | | | 770,900 |
Petrofac Ltd. (United Kingdom), 9.75%, 11/15/2026(c) | | | 3,614,000 | | | 3,386,083 |
USA Compression Partners L.P./USA Compression Finance Corp., 6.88%, 09/01/2027 | | | 485,000 | | | 486,145 |
| | | | | | | 7,705,127 |
|
Oil & Gas Exploration & Production-1.48% |
Aethon United BR L.P./Aethon United Finance Corp., 8.25%, 02/15/2026(c) | | | 1,046,000 | | | 1,109,137 |
Callon Petroleum Co., | | | | | | |
9.00%, 04/01/2025(c) | | | 192,000 | | | 206,171 |
8.00%, 08/01/2028(b)(c) | | | 501,000 | | | 521,649 |
Cameron LNG LLC, | | | | | | |
3.30%, 01/15/2035(c) | | | 3,617,000 | | | 3,561,919 |
3.40%, 01/15/2038(c) | | | 3,961,000 | | | 3,821,371 |
Civitas Resources, Inc., 5.00%, 10/15/2026(c) | | | 520,000 | | | 513,110 |
ConocoPhillips, 2.40%, 02/15/2031(c) | | | 66,000 | | | 65,002 |
Continental Resources, Inc., | | | | | | |
2.27%, 11/15/2026(c) | | | 1,416,000 | | | 1,351,494 |
2.88%, 04/01/2032(b)(c) | | | 1,771,000 | | | 1,621,846 |
Devon Energy Corp., 5.25%, 10/15/2027 | | | 8,334,000 | | | 8,641,389 |
See accompanying Notes to Financial Statements which are an integral part of the financial statements.
| | |
| 17 | | Invesco Corporate Bond Fund |
| | | | | | |
| | | Principal Amount | | | Value |
Oil & Gas Exploration & Production-(continued) |
Galaxy Pipeline Assets Bidco Ltd. (United Arab Emirates), | | | | | | |
2.16%, 03/31/2034(c) | | $ | 3,520,000 | | | $ 3,281,030 |
2.94%, 09/30/2040(c) | | | 5,170,000 | | | 4,773,034 |
Gazprom PJSC Via Gaz Finance PLC (Russia), 2.95%, 01/27/2029(c) | | | 5,299,000 | | | 2,702,384 |
Genesis Energy L.P./Genesis Energy Finance Corp., | | | | | | |
6.25%, 05/15/2026 | | | 255,000 | | | 245,682 |
8.00%, 01/15/2027 | | | 546,000 | | | 552,825 |
7.75%, 02/01/2028 | | | 304,000 | | | 300,633 |
Hilcorp Energy I L.P./Hilcorp Finance Co., 6.25%, 11/01/2028(c) | | | 482,000 | | | 492,204 |
Lundin Energy Finance B.V. (Netherlands), | | | | | | |
2.00%, 07/15/2026(c) | | | 2,566,000 | | | 2,479,203 |
3.10%, 07/15/2031(c) | | | 2,566,000 | | | 2,450,702 |
Murphy Oil Corp., | | | | | | |
6.38%, 07/15/2028(b) | | | 2,418,000 | | | 2,508,615 |
6.38%, 12/01/2042 | | | 180,000 | | | 169,040 |
Northern Oil and Gas, Inc., 8.13%, 03/01/2028(c) | | | 811,000 | | | 853,578 |
Ovintiv Exploration, Inc., 5.63%, 07/01/2024 | | | 314,000 | | | 335,985 |
SM Energy Co., 10.00%, 01/15/2025(b)(c) | | | 509,000 | | | 558,724 |
| | | | | | | 43,116,727 |
|
Oil & Gas Refining & Marketing-0.33% |
Parkland Corp. (Canada), 4.50%, 10/01/2029(c) | | | 1,951,000 | | | 1,842,905 |
Petronas Capital Ltd. (Malaysia), | | | | | | |
2.48%, 01/28/2032(c) | | | 2,247,000 | | | 2,106,427 |
3.40%, 04/28/2061(c) | | | 6,289,000 | | | 5,602,776 |
| | | | | | | 9,552,108 |
|
Oil & Gas Storage & Transportation-6.44% |
Boardwalk Pipelines L.P., | | | | | | |
3.40%, 02/15/2031 | | | 2,911,000 | | | 2,844,898 |
3.60%, 09/01/2032 | | | 5,115,000 | | | 5,064,312 |
Cheniere Corpus Christi Holdings LLC, 2.74%, 12/31/2039(c) | | | 3,143,000 | | | 2,873,861 |
CNX Midstream Partners L.P., 4.75%, 04/15/2030(c) | | | 374,000 | | | 362,047 |
Crestwood Midstream Partners L.P./Crestwood Midstream Finance Corp.,
8.00%, 04/01/2029(c) | | | 838,000 | | | 892,721 |
El Paso Natural Gas Co. LLC, 8.38%, 06/15/2032 | | | 1,575,000 | | | 2,106,195 |
Enbridge, Inc. (Canada), | | | | | | |
0.68% (SOFR + 0.63%), 02/16/2024(b)(g) | | | 838,000 | | | 840,394 |
1.60%, 10/04/2026 | | | 1,861,000 | | | 1,775,822 |
3.40%, 08/01/2051 | | | 1,875,000 | | | 1,700,173 |
| | | | | | |
| | | Principal Amount | | | Value |
Oil & Gas Storage & Transportation-(continued) |
Energy Transfer L.P., | | | | | | |
5.88%, 01/15/2024 | | $ | 508,000 | | | $ 537,135 |
2.90%, 05/15/2025 | | | 3,709,000 | | | 3,727,383 |
3.75%, 05/15/2030 | | | 6,281,000 | | | 6,387,407 |
4.90%, 03/15/2035 | | | 9,976,000 | | | 10,448,639 |
5.00%, 05/15/2050 | | | 6,690,000 | | | 6,972,862 |
Series A, 6.25%(d)(e) | | | 342,000 | | | 288,135 |
Enterprise Products Operating LLC, | | | | | | |
3.13%, 07/31/2029 | | | 350,000 | | | 354,123 |
4.80%, 02/01/2049 | | | 2,022,000 | | | 2,208,043 |
4.20%, 01/31/2050 | | | 2,378,000 | | | 2,394,782 |
3.70%, 01/31/2051 | | | 11,472,000 | | | 10,715,663 |
3.30%, 02/15/2053 | | | 2,585,000 | | | 2,269,899 |
Series D,
6.88%, 03/01/2033 | | | 2,270,000 | | | 2,919,175 |
4.88%, 08/16/2077(d) | | | 9,666,000 | | | 8,288,707 |
EQM Midstream Partners L.P., 6.50%, 07/01/2027(c) | | | 197,000 | | | 206,348 |
Hess Midstream Operations L.P., 5.63%, 02/15/2026(c) | | | 729,000 | | | 748,147 |
Kinder Morgan Energy Partners L.P., 4.30%, 05/01/2024 | | | 1,820,000 | | | 1,890,599 |
Kinder Morgan, Inc., | | | | | | |
7.80%, 08/01/2031 | | | 15,785,000 | | | 20,733,169 |
7.75%, 01/15/2032 | | | 16,317,000 | | | 21,635,871 |
3.25%, 08/01/2050(b) | | | 12,666,000 | | | 10,667,539 |
MPLX L.P., | | | | | | |
1.75%, 03/01/2026 | | | 3,164,000 | | | 3,034,075 |
4.80%, 02/15/2029 | | | 2,009,000 | | | 2,203,502 |
4.70%, 04/15/2048 | | | 2,374,000 | | | 2,457,757 |
5.50%, 02/15/2049 | | | 3,234,000 | | | 3,696,446 |
NGL Energy Partners L.P./NGL Energy Finance Corp., 7.50%, 04/15/2026 | | | 357,000 | | | 309,389 |
NGPL PipeCo LLC, 7.77%, 12/15/2037(c) | | | 11,275,000 | | | 15,010,997 |
Northern Natural Gas Co., 3.40%, 10/16/2051(c) | | | 2,162,000 | | | 1,979,319 |
ONEOK Partners L.P., 6.85%, 10/15/2037 | | | 3,593,000 | | | 4,439,914 |
ONEOK, Inc., 6.35%, 01/15/2031 | | | 4,892,000 | | | 5,809,928 |
Plains All American Pipeline L.P., Series B, 6.13%(d)(e) | | | 385,000 | | | 320,397 |
Plains All American Pipeline L.P./PAA Finance Corp., 3.55%, 12/15/2029 | | | 200,000 | | | 197,623 |
Sunoco L.P./Sunoco Finance Corp., 5.88%, 03/15/2028 | | | 723,000 | | | 736,527 |
Tallgrass Energy Partners L.P./Tallgrass Energy Finance Corp., 5.50%, 01/15/2028(c) | | | 562,000 | | | 542,454 |
Targa Resources Partners L.P./Targa Resources Partners Finance Corp., | | | | | | |
5.88%, 04/15/2026 | | | 677,000 | | | 699,764 |
5.00%, 01/15/2028 | | | 201,000 | | | 207,481 |
5.50%, 03/01/2030 | | | 63,000 | | | 66,780 |
Venture Global Calcasieu Pass LLC, 3.88%, 11/01/2033(b)(c) | | | 3,751,000 | | | 3,617,858 |
See accompanying Notes to Financial Statements which are an integral part of the financial statements.
| | |
| 18 | | Invesco Corporate Bond Fund |
| | | | | | |
| | | Principal Amount | | | Value |
Oil & Gas Storage & Transportation-(continued) |
Williams Cos., Inc. (The), | | | | | | |
4.55%, 06/24/2024 | | $ | 399,000 | | | $ 418,068 |
3.50%, 11/15/2030 | | | 1,858,000 | | | 1,890,455 |
2.60%, 03/15/2031(b) | | | 5,802,000 | | | 5,485,180 |
3.50%, 10/15/2051 | | | 2,763,000 | | | 2,456,091 |
| | | | | | | 187,434,054 |
|
Other Diversified Financial Services-2.94% |
AerCap Ireland Capital DAC/AerCap Global Aviation Trust (Ireland), | | | | | | |
4.50%, 09/15/2023 | | | 2,796,000 | | | 2,881,329 |
2.45%, 10/29/2026 | | | 5,084,000 | | | 4,907,909 |
3.00%, 10/29/2028 | | | 3,232,000 | | | 3,115,906 |
3.30%, 01/30/2032 | | | 3,879,000 | | | 3,685,482 |
3.40%, 10/29/2033 | | | 4,187,000 | | | 3,957,335 |
3.85%, 10/29/2041 | | | 3,957,000 | | | 3,671,505 |
Avolon Holdings Funding Ltd. (Ireland), | | | | | | |
2.13%, 02/21/2026(c) | | | 2,956,000 | | | 2,858,901 |
4.25%, 04/15/2026(c) | | | 1,855,000 | | | 1,907,438 |
2.75%, 02/21/2028(c) | | | 3,436,000 | | | 3,243,270 |
Blackstone Holdings Finance Co. LLC, | | | | | | |
1.60%, 03/30/2031(c) | | | 2,714,000 | | | 2,397,537 |
2.55%, 03/30/2032(c) | | | 2,071,000 | | | 1,966,911 |
2.80%, 09/30/2050(c) | | | 1,984,000 | | | 1,656,910 |
3.20%, 01/30/2052(c) | | | 4,241,000 | | | 3,829,602 |
Blackstone Private Credit Fund, | | | | | | |
1.75%, 09/15/2024(c) | | | 1,114,000 | | | 1,074,071 |
2.35%, 11/22/2024(c) | | | 3,364,000 | | | 3,273,378 |
2.63%, 12/15/2026(c) | | | 7,751,000 | | | 7,219,211 |
3.25%, 03/15/2027(c) | | | 4,084,000 | | | 3,906,688 |
Blue Owl Finance LLC, 3.13%, 06/10/2031(c) | | | 3,963,000 | | | 3,586,289 |
Carlyle Finance LLC, 5.65%, 09/15/2048(c) | | | 360,000 | | | 439,738 |
Fuqing Investment Management Ltd. (China), 4.00%, 06/12/2022(c) | | | 1,849,000 | | | 1,843,453 |
Jane Street Group/JSG Finance, Inc., 4.50%, 11/15/2029(c) | | | 794,000 | | | 775,631 |
KKR Group Finance Co. VIII LLC, 3.50%, 08/25/2050(c) | | | 2,006,000 | | | 1,861,141 |
LSEGA Financing PLC (United Kingdom), | | | | | | |
1.38%, 04/06/2026(c) | | | 2,907,000 | | | 2,771,127 |
2.00%, 04/06/2028(c) | | | 2,683,000 | | | 2,556,600 |
2.50%, 04/06/2031(c) | | | 1,634,000 | | | 1,562,417 |
OWL Rock Core Income Corp., 4.70%, 02/08/2027(c) | | | 3,350,000 | | | 3,317,973 |
Pershing Square Holdings Ltd., | | | | | | |
3.25%, 11/15/2030(c) | | | 4,800,000 | | | 4,622,894 |
3.25%, 10/01/2031(c) | | | 6,400,000 | | | 6,146,336 |
Scientific Games Holdings L.P./Scientific Games US FinCo, Inc., 6.63%, 03/01/2030(c) | | | 635,000 | | | 631,666 |
| | | | | | | 85,668,648 |
|
Packaged Foods & Meats-0.67% |
General Mills, Inc., 2.25%, 10/14/2031(b) | | | 1,730,000 | | | 1,628,064 |
JBS Finance Luxembourg S.a.r.l., 3.63%, 01/15/2032(c) | | | 3,156,000 | | | 2,868,299 |
| | | | | | |
| | | Principal Amount | | | Value |
Packaged Foods & Meats-(continued) |
JDE Peet’s N.V. (Netherlands), | | | | | | |
1.38%, 01/15/2027(c) | | $ | 2,419,000 | | | $ 2,248,183 |
2.25%, 09/24/2031(c) | | | 1,957,000 | | | 1,775,696 |
Kraft Heinz Foods Co. (The), | | | | | | |
6.88%, 01/26/2039 | | | 340,000 | | | 450,500 |
5.00%, 06/04/2042 | | | 352,000 | | | 388,520 |
4.38%, 06/01/2046 | | | 472,000 | | | 484,390 |
5.50%, 06/01/2050 | | | 540,000 | | | 649,350 |
Minerva Luxembourg S.A. (Brazil), 4.38%, 03/18/2031(c) | | | 9,776,000 | | | 8,949,782 |
| | | | | | | 19,442,784 |
|
Paper Packaging-0.64% |
Berry Global, Inc., 1.65%, 01/15/2027 | | | 17,673,000 | | | 16,493,231 |
Sealed Air Corp., 1.57%, 10/15/2026(c) | | | 2,387,000 | | | 2,249,063 |
| | | | | | | 18,742,294 |
|
Paper Products-0.26% |
Georgia-Pacific LLC, 2.10%, 04/30/2027(c) | | | 2,818,000 | | | 2,755,163 |
Schweitzer-Mauduit International, Inc., 6.88%, 10/01/2026(c) | | | 1,493,000 | | | 1,409,803 |
Suzano Austria GmbH (Brazil), | | | | | | |
2.50%, 09/15/2028 | | | 1,519,000 | | | 1,386,087 |
3.13%, 01/15/2032 | | | 2,139,000 | | | 1,901,667 |
| | | | | | | 7,452,720 |
|
Pharmaceuticals-1.29% |
Bausch Health Cos., Inc., | | | | | | |
6.13%, 04/15/2025(c) | | | 153,000 | | | 153,861 |
9.00%, 12/15/2025(c) | | | 152,000 | | | 156,922 |
5.75%, 08/15/2027(c) | | | 500,000 | | | 497,445 |
Bristol-Myers Squibb Co., | | | | | | |
2.95%, 03/15/2032 | | | 5,291,000 | | | 5,364,627 |
3.55%, 03/15/2042 | | | 9,966,000 | | | 10,167,144 |
3.70%, 03/15/2052 | | | 8,974,000 | | | 9,266,801 |
Mayo Clinic, Series 2021, | | | | | | |
3.20%, 11/15/2061 | | | 2,444,000 | | | 2,386,388 |
Merck & Co., Inc., | | | | | | |
2.15%, 12/10/2031(b) | | | 3,585,000 | | | 3,427,930 |
2.75%, 12/10/2051 | | | 2,971,000 | | | 2,653,093 |
2.90%, 12/10/2061 | | | 2,971,000 | | | 2,624,065 |
Par Pharmaceutical, Inc., 7.50%, 04/01/2027(c) | | | 785,000 | | | 787,198 |
Royalty Pharma PLC, 2.20%, 09/02/2030 | | | 82,000 | | | 74,473 |
| | | | | | | 37,559,947 |
|
Property & Casualty Insurance-0.60% |
Assured Guaranty US Holdings, Inc., 3.60%, 09/15/2051 | | | 1,597,000 | | | 1,450,766 |
Chubb INA Holdings, Inc., | | | | | | |
2.85%, 12/15/2051 | | | 1,026,000 | | | 918,785 |
3.05%, 12/15/2061 | | | 2,327,000 | | | 2,084,657 |
Fairfax Financial Holdings Ltd. (Canada), | | | | | | |
4.85%, 04/17/2028(b) | | | 2,568,000 | | | 2,736,139 |
4.63%, 04/29/2030 | | | 300,000 | | | 323,005 |
Fidelity National Financial, Inc., 3.20%, 09/17/2051 | | | 1,622,000 | | | 1,360,282 |
See accompanying Notes to Financial Statements which are an integral part of the financial statements.
| | |
| 19 | | Invesco Corporate Bond Fund |
| | | | | | |
| | | Principal Amount | | | Value |
Property & Casualty Insurance-(continued) |
First American Financial Corp., 2.40%, 08/15/2031 | | $ | 2,981,000 | | | $ 2,723,630 |
Stewart Information Services Corp., 3.60%, 11/15/2031 | | | 3,615,000 | | | 3,492,739 |
W.R. Berkley Corp., 3.15%, 09/30/2061 | | | 2,791,000 | | | 2,314,471 |
| | | | | | | 17,404,474 |
|
Railroads-1.89% |
Canadian Pacific Railway Co. (Canada), | | | | | | |
1.75%, 12/02/2026(b) | | | 2,835,000 | | | 2,751,287 |
6.13%, 09/15/2115 | | | 15,272,000 | | | 19,963,344 |
Empresa de los Ferrocarriles del Estado (Chile), 3.83%, 09/14/2061(c) | | | 3,030,000 | | | 2,538,928 |
Norfolk Southern Corp., | | | | | | |
3.00%, 03/15/2032(b) | | | 6,415,000 | | | 6,544,588 |
3.40%, 11/01/2049 | | | 3,046,000 | | | 2,955,798 |
3.70%, 03/15/2053 | | | 3,777,000 | | | 3,874,975 |
Union Pacific Corp., | | | | | | |
2.15%, 02/05/2027(b) | | | 3,224,000 | | | 3,187,399 |
2.80%, 02/14/2032 | | | 2,308,000 | | | 2,316,839 |
3.38%, 02/14/2042(b) | | | 1,681,000 | | | 1,680,253 |
3.50%, 02/14/2053 | | | 6,019,000 | | | 6,051,852 |
3.85%, 02/14/2072(b) | | | 3,017,000 | | | 3,053,447 |
| | | | | | | 54,918,710 |
|
Real Estate Development-0.77% |
Agile Group Holdings Ltd. (China), | | | | | | |
5.75%, 01/02/2025(c) | | | 200,000 | | | 80,000 |
5.50%, 04/21/2025(c) | | | 1,950,000 | | | 755,625 |
6.05%, 10/13/2025(c) | | | 1,493,000 | | | 582,270 |
5.50%, 05/17/2026(c) | | | 376,000 | | | 139,120 |
Arabian Centres Sukuk II Ltd. (Saudi Arabia), 5.63%, 10/07/2026(c) | | | 4,192,000 | | | 4,114,993 |
Country Garden Holdings Co. Ltd. (China), | | | | | | |
4.75%, 07/25/2022(b)(c) | | | 2,091,000 | | | 1,991,678 |
5.40%, 05/27/2025(c) | | | 614,000 | | | 475,850 |
3.13%, 10/22/2025(c) | | | 1,730,000 | | | 1,240,410 |
5.63%, 12/15/2026(c) | | | 676,000 | | | 517,140 |
Essential Properties L.P., 2.95%, 07/15/2031 | | | 2,845,000 | | | 2,617,215 |
Greentown China Holdings Ltd. (China), 4.70%, 04/29/2025(c) | | | 899,000 | | | 878,323 |
Logan Group Co. Ltd. (China), | | | | | | |
7.50%, 08/25/2022(c) | | | 426,000 | | | 200,220 |
4.25%, 07/12/2025(c) | | | 961,000 | | | 288,300 |
Piedmont Operating Partnership L.P., 3.15%, 08/15/2030 | | | 2,301,000 | | | 2,255,418 |
Shimao Group Holdings Ltd. (China), 4.75%, 07/03/2022(c) | | | 1,610,000 | | | 773,605 |
Sino-Ocean Land Treasure Finance I Ltd. (China), 6.00%, 07/30/2024(c) | | | 2,915,000 | | | 2,816,510 |
Sino-Ocean Land Treasure IV Ltd. (China), | | | | | | |
5.25%, 04/30/2022(c) | | | 728,000 | | | 726,214 |
3.25%, 05/05/2026(c) | | | 2,470,000 | | | 2,039,459 |
| | | | | | | 22,492,350 |
| | | | | | |
| | | Principal Amount | | | Value |
Regional Banks-1.95% |
Citizens Financial Group, Inc., | | | | | | |
2.50%, 02/06/2030 | | $ | 3,116,000 | | | $ 2,988,527 |
3.25%, 04/30/2030 | | | 210,000 | | | 212,901 |
Series G, 4.00%(d)(e) | | | 3,379,000 | | | 3,184,707 |
Fifth Third Bancorp, | | | | | | |
4.30%, 01/16/2024 | | | 2,329,000 | | | 2,422,640 |
2.38%, 01/28/2025 | | | 6,558,000 | | | 6,572,904 |
2.55%, 05/05/2027 | | | 2,010,000 | | | 2,009,972 |
Huntington Bancshares, Inc., 2.49%, 08/15/2036(c)(d) | | | 2,657,000 | | | 2,434,214 |
KeyCorp, 2.25%, 04/06/2027 | | | 4,530,000 | | | 4,463,439 |
M&T Bank Corp., 3.50%(d)(e) | | | 2,903,000 | | | 2,656,245 |
SVB Financial Group, | | | | | | |
2.10%, 05/15/2028(b) | | | 2,193,000 | | | 2,103,371 |
1.80%, 02/02/2031 | | | 4,284,000 | | | 3,881,396 |
Series C, 4.00%(b)(d)(e) | | | 6,884,000 | | | 6,479,565 |
Series D, 4.25%(d)(e) | | | 7,204,000 | | | 6,938,352 |
Series E, 4.70%(d)(e) | | | 4,585,000 | | | 4,338,556 |
Synovus Financial Corp., 3.13%, 11/01/2022 | | | 2,167,000 | | | 2,180,837 |
Zions Bancorporation N.A., 3.25%, 10/29/2029 | | | 3,884,000 | | | 3,903,033 |
| | | | | | | 56,770,659 |
|
Reinsurance-0.69% |
Berkshire Hathaway Finance Corp., 2.85%, 10/15/2050 | | | 2,985,000 | | | 2,625,115 |
Global Atlantic Fin Co., | | | | | | |
4.40%, 10/15/2029(c) | | | 8,842,000 | | | 9,188,537 |
3.13%, 06/15/2031(c) | | | 2,134,000 | | | 1,991,272 |
4.70%, 10/15/2051(c)(d) | | | 6,477,000 | | | 6,194,603 |
| | | | | | | 19,999,527 |
|
Renewable Electricity-0.11% |
Adani Green Energy Ltd. (India), 4.38%, 09/08/2024(c) | | | 3,156,000 | | | 3,122,231 |
|
Research & Consulting Services-0.00% |
Dun & Bradstreet Corp. (The), 5.00%, 12/15/2029(c) | | | 108,000 | | | 103,825 |
|
Residential REITs-0.56% |
American Campus Communities Operating Partnership L.P., 2.25%, 01/15/2029 | | | 1,971,000 | | | 1,857,427 |
American Homes 4 Rent L.P., | | | | | | |
2.38%, 07/15/2031 | | | 801,000 | | | 737,109 |
3.38%, 07/15/2051 | | | 787,000 | | | 676,150 |
Invitation Homes Operating Partnership L.P., | | | | | | |
2.30%, 11/15/2028 | | | 1,205,000 | | | 1,139,362 |
2.70%, 01/15/2034 | | | 3,466,000 | | | 3,160,623 |
Mid-America Apartments L.P., 2.88%, 09/15/2051 | | | 798,000 | | | 706,106 |
Spirit Realty L.P., | | | | | | |
3.40%, 01/15/2030 | | | 4,601,000 | | | 4,592,275 |
2.70%, 02/15/2032 | | | 352,000 | | | 332,996 |
Sun Communities Operating L.P., 2.70%, 07/15/2031 | | | 842,000 | | | 792,798 |
UDR, Inc., 3.00%, 08/15/2031(b) | | | 2,436,000 | | | 2,402,394 |
| | | | | | | 16,397,240 |
See accompanying Notes to Financial Statements which are an integral part of the financial statements.
| | |
| 20 | | Invesco Corporate Bond Fund |
| | | | | | |
| | | Principal Amount | | | Value |
Restaurants-0.35% |
1011778 BC ULC/New Red Finance, Inc. (Canada), 4.00%, 10/15/2030(c) | | $ | 4,574,000 | | | $ 4,231,339 |
Aramark Services, Inc., 5.00%, 04/01/2025(c) | | | 515,000 | | | 519,280 |
IRB Holding Corp., 6.75%, 02/15/2026(c) | | | 690,000 | | | 695,865 |
Papa John’s International, Inc., 3.88%, 09/15/2029(c) | | | 541,000 | | | 503,887 |
Starbucks Corp., 3.00%, 02/14/2032(b) | | | 4,379,000 | | | 4,357,973 |
| | | | | | | 10,308,344 |
|
Retail REITs-1.06% |
Agree L.P., 2.60%, 06/15/2033 | | | 2,557,000 | | | 2,358,767 |
Brixmor Operating Partnership L.P., | | | | | | |
4.05%, 07/01/2030 | | | 2,630,000 | | | 2,730,880 |
2.50%, 08/16/2031 | | | 1,925,000 | | | 1,780,930 |
Kimco Realty Corp., | | | | | | |
1.90%, 03/01/2028 | | | 3,929,000 | | | 3,717,774 |
2.70%, 10/01/2030 | | | 2,252,000 | | | 2,191,132 |
2.25%, 12/01/2031 | | | 1,933,000 | | | 1,785,884 |
Kite Realty Group Trust, 4.75%, 09/15/2030 | | | 2,428,000 | | | 2,620,403 |
National Retail Properties, Inc., 3.50%, 04/15/2051 | | | 3,003,000 | | | 2,815,229 |
NMG Holding Co., Inc./Neiman Marcus Group LLC, 7.13%, 04/01/2026(c) | | | 246,000 | | | 253,626 |
Realty Income Corp., | | | | | | |
2.20%, 06/15/2028 | | | 1,846,000 | | | 1,790,922 |
3.25%, 01/15/2031 | | | 2,888,000 | | | 2,931,547 |
Regency Centers L.P., 4.13%, 03/15/2028 | | | 2,044,000 | | | 2,181,124 |
Simon Property Group L.P., 1.38%, 01/15/2027(b) | | | 3,948,000 | | | 3,735,743 |
| | | | | | | 30,893,961 |
|
Semiconductor Equipment-0.01% |
NXP B.V./NXP Funding LLC/NXP USA, Inc. (China), 3.40%, 05/01/2030(c) | | | 289,000 | | | 291,969 |
|
Semiconductors-1.16% |
Broadcom, Inc., | | | | | | |
2.45%, 02/15/2031(c) | | | 2,460,000 | | | 2,274,123 |
3.47%, 04/15/2034(c) | | | 5,648,000 | | | 5,459,050 |
3.14%, 11/15/2035(c) | | | 2,488,000 | | | 2,306,807 |
3.19%, 11/15/2036(c) | | | 7,529,000 | | | 6,999,655 |
Marvell Technology, Inc., 2.95%, 04/15/2031 | | | 5,880,000 | | | 5,668,639 |
Micron Technology, Inc., | | | | | | |
4.98%, 02/06/2026 | | | 1,736,000 | | | 1,866,434 |
4.19%, 02/15/2027 | | | 5,248,000 | | | 5,550,180 |
2.70%, 04/15/2032 | | | 2,493,000 | | | 2,335,156 |
3.37%, 11/01/2041 | | | 1,420,000 | | | 1,280,989 |
Skyworks Solutions, Inc., 3.00%, 06/01/2031 | | | 125,000 | | | 116,155 |
| | | | | | | 33,857,188 |
| | | | | | |
| | | Principal Amount | | | Value |
Soft Drinks-0.28% |
Coca-Cola FEMSA S.A.B. de C.V. (Mexico), 1.85%, 09/01/2032 | | $ | 155,000 | | | $ 135,539 |
Coca-Cola Icecek A.S. (Turkey), 4.50%, 01/20/2029(c) | | | 8,012,000 | | | 7,890,938 |
| | | | | | | 8,026,477 |
|
Sovereign Debt-2.27% |
Airport Authority (Hong Kong), 3.25%, 01/12/2052(c) | | | 5,354,000 | | | 5,039,328 |
Banque Ouest Africaine de Developpement (Supranational), 5.00%, 07/27/2027(c) | | | 8,000,000 | | | 8,313,440 |
China Government International Bond (China), 2.50%, 10/26/2051(c) | | | 5,478,000 | | | 5,081,669 |
Dominican Republic International Bond (Dominican Republic), 5.30%, 01/21/2041(c) | | | 2,320,000 | | | 1,998,123 |
Egypt Government International Bond (Egypt), | | | | | | |
3.88%, 02/16/2026(c) | | | 3,583,000 | | | 3,102,341 |
5.88%, 02/16/2031(b)(c) | | | 2,762,000 | | | 2,151,186 |
7.50%, 02/16/2061(c) | | | 3,075,000 | | | 2,200,661 |
Ghana Government International Bond (Ghana), 7.75%, 04/07/2029(c) | | | 1,905,000 | | | 1,306,830 |
Guatemala Government Bond (Guatemala), 3.70%, 10/07/2033(c) | | | 3,197,000 | | | 2,903,675 |
Indonesia Government International Bond (Indonesia), 3.20%, 09/23/2061(b) | | | 3,826,000 | | | 3,223,830 |
Mexico Government International Bond (Mexico), | | | | | | |
3.50%, 02/12/2034 | | | 4,579,000 | | | 4,318,043 |
4.40%, 02/12/2052 | | | 6,164,000 | | | 5,688,293 |
Morocco Government International Bond (Morocco), 4.00%, 12/15/2050(c) | | | 1,625,000 | | | 1,286,797 |
Oman Government International Bond (Oman), 6.25%, 01/25/2031(c) | | | 1,140,000 | | | 1,186,165 |
Perusahaan Penerbit SBSN
Indonesia III (Indonesia), 3.55%, 06/09/2051(c) | | | 3,149,000 | | | 2,898,434 |
Turkey Government International Bond (Turkey), 4.75%, 01/26/2026 | | | 3,652,000 | | | 3,346,879 |
UAE International Government Bond (United Arab Emirates), | | | | | | |
2.00%, 10/19/2031(c) | | | 2,189,000 | | | 2,086,321 |
2.88%, 10/19/2041(c) | | | 3,229,000 | | | 3,028,218 |
3.25%, 10/19/2061(c) | | | 4,061,000 | | | 3,812,345 |
Uzbekneftegaz JSC (Uzbekistan), 4.75%, 11/16/2028(c) | | | 3,661,000 | | | 3,196,298 |
| | | | | | | 66,168,876 |
|
Specialized Consumer Services-0.05% |
Carriage Services, Inc., 4.25%, 05/15/2029(c) | | | 1,078,000 | | | 1,018,683 |
See accompanying Notes to Financial Statements which are an integral part of the financial statements.
| | |
| 21 | | Invesco Corporate Bond Fund |
| | | | | | |
| | | Principal Amount | | | Value |
Specialized Consumer Services-(continued) |
Terminix Co. LLC (The), 7.45%, 08/15/2027 | | $ | 463,000 | | | $ 543,428 |
| | | | | | | 1,562,111 |
|
Specialized Finance-0.38% |
Mitsubishi HC Capital, Inc. (Japan), 3.64%, 04/13/2025(c) | | | 5,514,000 | | | 5,680,150 |
National Rural Utilities Cooperative Finance Corp.,
2.40%, 03/15/2030 | | | 2,236,000 | | | 2,153,895 |
2.75%, 04/15/2032 | | | 3,363,000 | | | 3,299,403 |
| | | | | | | 11,133,448 |
| | |
Specialized REITs-0.94% | | | | | | |
American Tower Corp.,
2.70%, 04/15/2031 | | | 5,956,000 | | | 5,606,126 |
3.10%, 06/15/2050 | | | 4,412,000 | | | 3,707,443 |
2.95%, 01/15/2051 | | | 2,749,000 | | | 2,259,430 |
Crown Castle International Corp.,
2.50%, 07/15/2031 | | | 4,691,000 | | | 4,361,434 |
Equinix, Inc., 3.20%,
11/18/2029 | | | 120,000 | | | 118,518 |
Extra Space Storage L.P.,
2.55%, 06/01/2031 | | | 2,171,000 | | | 2,062,125 |
2.35%, 03/15/2032 | | | 2,161,000 | | | 1,993,332 |
Life Storage L.P., 2.40%,
10/15/2031 | | | 3,466,000 | | | 3,226,123 |
SBA Communications Corp.,
3.88%, 02/15/2027 | | | 255,000 | | | 254,841 |
3.13%, 02/01/2029 | | | 4,116,000 | | | 3,828,168 |
| | | | | | | 27,417,540 |
|
Specialty Chemicals-0.63% |
Braskem Idesa S.A.P.I. (Mexico),
7.45%, 11/15/2029(c) | | | 3,457,000 | | | 3,436,863 |
6.99%, 02/20/2032(c) | | | 4,356,000 | | | 4,167,908 |
Rayonier A.M. Products, Inc.,
7.63%, 01/15/2026(c) | | | 690,000 | | | 691,297 |
Sasol Financing USA LLC (South Africa),
4.38%, 09/18/2026 | | | 4,049,000 | | | 3,965,368 |
5.50%, 03/18/2031 | | | 5,790,000 | | | 5,556,055 |
SCIL IV LLC/SCIL USA Holdings LLC,
5.38%, 11/01/2026(b)(c) | | | 520,000 | | | 519,896 |
| | | | | | | 18,337,387 |
|
Specialty Stores-0.02% |
Bath & Body Works, Inc., 6.75%,
07/01/2036 | | | 436,000 | | | 476,184 |
| | |
Steel-0.04% | | | | | | |
Cleveland-Cliffs, Inc., 9.88%,
10/17/2025(c) | | | 470,000 | | | 522,273 |
SunCoke Energy, Inc.,
4.88%, 06/30/2029(c) | | | 531,000 | | | 510,153 |
| | | | | | | 1,032,426 |
|
Systems Software-0.65% |
Camelot Finance S.A.,
4.50%, 11/01/2026(c) | | | 1,546,000 | | | 1,549,208 |
Crowdstrike Holdings, Inc.,
3.00%, 02/15/2029(b) | | | 2,891,000 | | | 2,715,502 |
| | | | | | |
| | | Principal Amount | | | Value |
Systems Software-(continued) | | | |
Oracle Corp.,
3.60%, 04/01/2050 | | $ | 10,400,000 | | | $ 9,060,581 |
3.85%, 04/01/2060 | | | 4,022,000 | | | 3,474,657 |
VMware, Inc., 2.20%,
08/15/2031 | | | 2,254,000 | | | 2,066,478 |
| | | | | | | 18,866,426 |
|
Technology Distributors-0.07% |
Avnet, Inc., 4.63%,
04/15/2026 | | | 1,920,000 | | | 2,035,685 |
|
Technology Hardware, Storage & Peripherals-0.39% |
Apple, Inc., | | | | | | |
2.65%, 05/11/2050 | | | 3,974,000 | | | 3,534,910 |
2.80%, 02/08/2061 | | | 8,925,000 | | | 7,797,278 |
| | | | | | | 11,332,188 |
| | |
Textiles-0.01% | | | | | | |
Eagle Intermediate Global Holding B.V./Ruyi US Finance LLC (China),
7.50%, 05/01/2025(c) | | | 214,000 | | | 194,042 |
|
Thrifts & Mortgage Finance-0.01% |
Rocket Mortgage LLC/Rocket Mortgage Co-Issuer, Inc.,
2.88%, 10/15/2026(c) | | | 236,000 | | | 222,114 |
| | |
Tobacco-0.96% | | | | | | |
Altria Group, Inc.,
4.40%, 02/14/2026 | | | 2,965,000 | | | 3,150,792 |
2.45%, 02/04/2032 | | | 5,087,000 | | | 4,545,814 |
3.40%, 02/04/2041 | | | 4,666,000 | | | 3,869,688 |
3.70%, 02/04/2051 | | | 13,350,000 | | | 10,935,549 |
4.00%, 02/04/2061 | | | 6,502,000 | | | 5,423,466 |
BAT Capital Corp. (United Kingdom), 2.73%, 03/25/2031 | | | 143,000 | | | 131,153 |
| | | | | | | 28,056,462 |
| |
Trading Companies & Distributors-0.50% | | | |
AerCap Global Aviation Trust (Ireland), 6.50%,
06/15/2045(b)(c)(d) | | | 7,903,000 | | | 8,337,942 |
Air Lease Corp., 3.00%,
09/15/2023 | | | 1,734,000 | | | 1,752,783 |
Aircastle Ltd.,
5.00%, 04/01/2023 | | | 534,000 | | | 548,668 |
4.40%, 09/25/2023 | | | 3,412,000 | | | 3,501,447 |
Fortress Transportation and Infrastructure Investors LLC,
5.50%, 05/01/2028(c) | | | 301,000 | | | 287,995 |
| | | | | | | 14,428,835 |
| | |
Trucking-1.53% | | | | | | |
Aviation Capital Group LLC,
4.13%, 08/01/2025(c) | | | 4,772,000 | | | 4,870,421 |
3.50%, 11/01/2027(c) | | | 13,856,000 | | | 13,704,793 |
Ryder System, Inc., 4.63%,
06/01/2025(b) | | | 3,107,000 | | | 3,301,333 |
See accompanying Notes to Financial Statements which are an integral part of the financial statements.
| | |
| 22 | | Invesco Corporate Bond Fund |
| | | | | | |
| | | Principal Amount | | | Value |
Trucking-(continued) | | | | | | |
SMBC Aviation Capital Finance DAC (Ireland), 3.00%, 07/15/2022(c) | | $ | 2,947,000 | | | $2,961,706 |
4.13%, 07/15/2023(c) | | | 3,266,000 | | | 3,354,427 |
1.90%, 10/15/2026(c) | | | 2,457,000 | | | 2,360,104 |
Triton Container International Ltd. (Bermuda),
2.05%, 04/15/2026(c) | | | 5,705,000 | | | 5,512,588 |
3.15%, 06/15/2031(c) | | | 2,955,000 | | | 2,841,207 |
Uber Technologies, Inc., 4.50%,
08/15/2029(b)(c) | | | 6,022,000 | | | 5,776,453 |
| | | | | | | 44,683,032 |
|
Wireless Telecommunication Services-2.00% |
Empresa Nacional de
Telecomunicaciones S.A.
(Chile), 3.05%,
09/14/2032(c) | | | 1,644,000 | | | 1,516,130 |
Rogers Communications, Inc. (Canada),
4.50%, 03/15/2043 | | | 330,000 | | | 343,096 |
5.00%, 03/15/2044 | | | 4,126,000 | | | 4,481,711 |
Sprint Capital Corp., 8.75%,
03/15/2032 | | | 315,000 | | | 437,522 |
Sprint Corp.,
7.88%, 09/15/2023 | | | 84,000 | | | 90,405 |
7.63%, 02/15/2025 | | | 394,000 | | | 436,848 |
7.63%, 03/01/2026 | | | 389,000 | | | 443,927 |
Sprint Spectrum Co. LLC/Sprint
Spectrum Co. II LLC/Sprint Spectrum Co. III LLC,
4.74%, 03/20/2025(c) | | | 8,730,312 | | | 8,995,393 |
5.15%, 03/20/2028(c) | | | 10,773,000 | | | 11,595,132 |
T-Mobile USA, Inc.,
2.25%, 02/15/2026(c) | | | 3,076,000 | | | 2,971,862 |
2.63%, 04/15/2026 | | | 3,413,000 | | | 3,354,808 |
3.50%, 04/15/2031 | | | 925,000 | | | 911,994 |
2.70%, 03/15/2032(c) | | | 259,000 | | | 243,764 |
4.50%, 04/15/2050 | | | 2,405,000 | | | 2,511,470 |
3.40%, 10/15/2052(c) | | | 9,897,000 | | | 8,784,757 |
VEON Holdings B.V. (Netherlands),
3.38%, 11/25/2027(c) | | | 2,347,000 | | | 1,032,680 |
Vodafone Group PLC (United Kingdom), | | | | | | |
3.25%, 06/04/2081(d) | | | 2,081,000 | | | 1,933,790 |
4.13%, 06/04/2081(d) | | | 3,580,000 | | | 3,299,919 |
5.13%, 06/04/2081(d) | | | 3,503,000 | | | 3,131,822 |
Xiaomi Best Time International
Ltd. (China), 4.10%,
07/14/2051(c) | | | 1,841,000 | | | 1,675,677 |
| | | | | | | 58,192,707 |
Total U.S. Dollar Denominated Bonds & Notes
(Cost $2,686,152,058) | | | | | | 2,584,431,715 |
| |
U.S. Treasury Securities-5.02% | | | |
U.S. Treasury Bills-0.24% | | | | | | |
0.41%, 05/26/2022(j)(k) | | | 7,088,000 | | | 7,082,793 |
U.S. Treasury Bonds-1.44% | | | | | | |
2.38%, 02/15/2042 | | | 16,106,400 | | | 16,451,178 |
1.88%, 11/15/2051 | | | 27,199,900 | | | 25,385,157 |
| | | | | | | 41,836,335 |
| | | | | | |
| | | Principal Amount | | | Value |
| | |
U.S. Treasury Notes-3.34% | | | | | | |
1.50%, 02/29/2024 | | $ | 2,328,000 | | | $ 2,330,046 |
1.50%, 02/15/2025 | | | 9,851,000 | | | 9,812,519 |
1.88%, 02/28/2027 | | | 8,714,200 | | | 8,772,751 |
1.88%, 02/28/2029 | | | 3,746,200 | | | 3,759,372 |
1.88%, 02/15/2032(b) | | | 72,376,800 | | | 72,653,867 |
| | | | | | | 97,328,555 |
Total U.S. Treasury Securities (Cost $144,068,275) | | | | | | 146,247,683 |
| | |
| | | Shares | | | |
Preferred Stocks-2.78% | | | | | | |
Asset Management & Custody Banks-0.13% |
Bank of New York Mellon Corp. (The), 4.70%, Series G, Pfd.(d) | | | 3,717,000 | | | 3,823,864 |
| | |
Diversified Banks-1.58% | | | | | | |
Bank of America Corp., 7.25%,
Series L, Conv. Pfd. | | | 100 | | | 131,756 |
Bank of America Corp., 6.50%,
Series Z, Pfd.(b)(d) | | | 3,839,000 | | | 4,102,931 |
Citigroup, Inc., 6.25%, Series T,
Pfd.(d) | | | 2,110,000 | | | 2,273,525 |
Citigroup, Inc., 5.00%, Series U,
Pfd.(b)(d) | | | 7,500,000 | | | 7,605,000 |
Citigroup, Inc., 4.00%, Series W,
Pfd.(d) | | | 3,879,000 | | | 3,757,199 |
JPMorgan Chase & Co., 3.77% (3 mo. USD LIBOR + 3.47%),
Series I, Pfd.(g) | | | 8,498,000 | | | 8,473,982 |
Wells Fargo & Co., 7.50%, Class A, Series L, Conv. Pfd. | | | 14,554 | | | 19,678,755 |
| | | | | | | 46,023,148 |
|
Integrated Telecommunication Services-0.17% |
AT&T, Inc., 2.88%, Series B, Pfd.(d) | | | 4,400,000 | | | 4,764,388 |
|
Investment Banking & Brokerage-0.60% |
Charles Schwab Corp. (The), 4.00%, Series H, Pfd.(d) | | | 3,619,000 | | | 3,354,162 |
Goldman Sachs Group, Inc. (The), 5.00%, Series P, Pfd.(b)(d) | | | 3,255,000 | | | 3,143,679 |
Morgan Stanley, 7.13%, Series E, Pfd.(d) | | | 256,997 | | | 6,946,629 |
Morgan Stanley, 6.88%, Series F, Pfd.(d) | | | 150,000 | | | 4,053,000 |
| | | | | | | 17,497,470 |
|
Life & Health Insurance-0.10% |
MetLife, Inc., 3.85%, Series G,
Pfd.(b)(d) | | | 2,866,000 | | | 2,851,670 |
| | |
Multi-Utilities-0.06% | | | | | | |
CenterPoint Energy, Inc., 6.13%, Series A, Pfd.(d) | | | 1,866,000 | | | 1,843,841 |
|
Other Diversified Financial Services-0.06% |
Equitable Holdings, Inc., 4.95%, Series B, Pfd.(d) | | | 1,724,000 | | | 1,737,792 |
| | |
Regional Banks-0.08% | | | | | | |
PNC Financial Services Group, Inc. (The), 6.13%, Series P, Pfd.(d) | | | 92,134 | | | 2,322,698 |
Total Preferred Stocks
(Cost $78,891,193) | | | | | | 80,864,871 |
See accompanying Notes to Financial Statements which are an integral part of the financial statements.
| | |
| 23 | | Invesco Corporate Bond Fund |
| | | | | | |
| | | Principal Amount | | | Value |
Asset-Backed Securities-0.92% |
IP Lending III Ltd., Series 2022- 3A, Class SNR, 3.38%,
11/02/2026(c)(h) | | $ | 3,923,000 | | | $ 3,914,435 |
Jimmy Johns Funding LLC, Series 2017-1A, Class A2II, 4.85%, 07/30/2047(c) | | | 2,690,686 | | | 2,759,858 |
Sonic Capital LLC,
Series 2020-1A, Class A2I,
3.85%, 01/20/2050(c) | | | 10,530,635 | | | 10,771,803 |
Series 2021-1A, Class A2I, 2.19%, 08/20/2051(c) | | | 2,539,375 | | | 2,402,972 |
Series 2021-1A, Class A2II, 2.64%, 08/20/2051(c) | | | 2,499,542 | | | 2,341,341 |
Wendy’s Funding LLC,
Series 2018-1A, Class A2II, 3.88%, 03/15/2048(c) | | | 4,368,000 | | | 4,456,307 |
Total Asset-Backed Securities (Cost $26,671,560) | | | | | | 26,646,716 |
| | |
Municipal Obligations-0.21% | | | | | | |
California State University,
Series 2021 B, Ref. RB,
2.72%, 11/01/2052 | | | 2,340,000 | | | 2,188,135 |
Series 2021 B, Ref. RB,
2.94%, 11/01/2052 | | | 3,495,000 | | | 3,256,249 |
Florida Development Finance Corp. (Palm Bay Academy, Inc.),
Series 2017, Ref. RB, 9.00%,
05/15/2024(c) | | | 735,000 | | | 733,412 |
Series 2017, Ref. RB, 0.00%,
05/15/2037(c)(h) | | | 360,000 | | | 4 |
Series 2017, Ref. RB, 0.00%,
05/15/2037(c)(h) | | | 350,000 | | | 70,000 |
Total Municipal Obligations (Cost $6,910,786) | | | | | | 6,247,800 |
| | |
| | | Shares | | | |
Exchange-Traded Funds-0.19% |
Invesco Total Return Bond ETF (Cost $5,830,000)(l) | | | 100,000 | | | 5,394,000 |
| | |
| | | Principal Amount | | | |
Variable Rate Senior Loan Interests-0.17%(m)(n) |
Diversified REITs-0.17% | | | |
Asterix, Inc. (Canada), Term Loan, 3.90%, 03/31/2023
(Cost $4,744,930)(h) | | $ | 6,344,447 | | | 5,065,045 |
| | |
| Investment Abbreviations: |
| |
| Conv. | | - Convertible |
| ETF | | - Exchange-Traded Fund |
| EUR | | - Euro |
| LIBOR | | - London Interbank Offered Rate |
| Pfd. | | - Preferred |
| PIK | | - Pay-in-Kind |
| RB | | - Revenue Bonds |
| Ref. | | - Refunding |
| REIT | | - Real Estate Investment Trust |
| SOFR | | - Secured Overnight Financing Rate |
| USD | | - U.S. Dollar |
| | | | | | | | |
| | | Principal Amount | | | Value | |
Non-U.S. Dollar Denominated Bonds & Notes-0.15%(o) | |
Movies & Entertainment-0.11% | |
Netflix, Inc., 3.88%, 11/15/2029(c) | | | EUR 2,600,000 | | | $ | 3,196,994 | |
|
| |
| | |
Sovereign Debt-0.04% | | | | | | | | |
Ukraine Government International Bond (Ukraine), 4.38%, 01/27/2030(c) | | | EUR 2,765,000 | | | | 1,069,588 | |
|
| |
Total Non-U.S. Dollar Denominated Bonds & Notes
(Cost $5,967,768) | | | | 4,266,582 | |
|
| |
| | |
| | | Shares | | | | |
Money Market Funds-0.85% | |
Invesco Government & Agency Portfolio, Institutional Class, 0.03%(l)(p) | | | 6,719,731 | | | | 6,719,731 | |
|
| |
Invesco Liquid Assets Portfolio, Institutional Class, 0.01%(l)(p) | | | 10,479,780 | | | | 10,479,780 | |
|
| |
Invesco Treasury Portfolio, Institutional Class,
0.01%(l)(p) | | | 7,679,693 | | | | 7,679,693 | |
|
| |
Total Money Market Funds (Cost $24,879,520) | | | | | | | 24,879,204 | |
|
| |
|
Options Purchased-0.06% | |
(Cost $1,966,432)(q) | | | | | | | 1,690,629 | |
|
| |
TOTAL INVESTMENTS IN SECURITIES (excluding investments purchased with cash collateral from securities on loan)-99.09% (Cost $2,986,082,522) | | | | | | | 2,885,734,245 | |
|
| |
|
Investments Purchased with Cash Collateral from Securities on Loan | |
Money Market Funds-8.33% | |
Invesco Private Government Fund, 0.12%(l)(p)(r) | | | 72,323,771 | | | | 72,323,771 | |
|
| |
Invesco Private Prime Fund, 0.08%(l)(p)(r) | | | 170,213,555 | | | | 170,230,580 | |
|
| |
Total Investments Purchased with Cash Collateral from Securities on Loan
(Cost $242,570,065) | | | | 242,554,351 | |
|
| |
TOTAL INVESTMENTS IN
SECURITIES-107.42%
(Cost $3,228,652,587) | | | | 3,128,288,596 | |
|
| |
OTHER ASSETS LESS LIABILITIES-(7.42)% | | | | (216,051,583 | ) |
|
| |
NET ASSETS-100.00% | | | | | | $ | 2,912,237,013 | |
|
| |
See accompanying Notes to Financial Statements which are an integral part of the financial statements.
| | |
| 24 | | Invesco Corporate Bond Fund |
Notes to Schedule of Investments:
| (a) | Industry and/or sector classifications used in this report are generally according to the Global Industry Classification Standard, which was developed by and is the exclusive property and a service mark of MSCI Inc. and Standard & Poor’s. |
| (b) | All or a portion of this security was out on loan at February 28, 2022. |
| (c) | Security purchased or received in a transaction exempt from registration under the Securities Act of 1933, as amended (the “1933 Act”). The security may be resold pursuant to an exemption from registration under the 1933 Act, typically to qualified institutional buyers. The aggregate value of these securities at February 28, 2022 was $974,410,867, which represented 33.46% of the Fund’s Net Assets. |
| (d) | Security issued at a fixed rate for a specific period of time, after which it will convert to a variable rate. |
| (e) | Perpetual bond with no specified maturity date. |
| (f) | Zero coupon bond issued at a discount. |
| (g) | Interest or dividend rate is redetermined periodically. Rate shown is the rate in effect on February 28, 2022. |
| (h) | Security valued using significant unobservable inputs (Level 3). See Note 3. |
| (i) | All or a portion of this security is Pay-in-Kind. Pay-in-Kind securities pay interest income in the form of securities. |
| (j) | All or a portion of the value was pledged as collateral to cover margin requirements for open futures contracts. See Note 1L. |
| (k) | Security traded on a discount basis. The interest rate shown represents the discount rate at the time of purchase by the Fund. |
| (l) | Affiliated issuer. The issuer and/or the Fund is a wholly-owned subsidiary of Invesco Ltd., or is affiliated by having an investment adviser that is under common control of Invesco Ltd. The table below shows the Fund’s transactions in, and earnings from, its investments in affiliates for the fiscal year ended February 28, 2022. |
| | | | | | | | | | | | | | | | | | | | | | | | | | | | | | | | | | | | | | | | | | | | | | | | | | | | | | | | | | | | | | | | | | | | | | | | | | | | | | | | | | | | | | | | | | | | | | | | | | | | | | | | | |
| | | Value February 28, 2021 | | Purchases at Cost | | Proceeds from Sales | | Change in Unrealized Appreciation (Depreciation) | | Realized Gain (Loss) | | Value February 28, 2022 | | Dividend Income |
Invesco Total Return Bond ETF | | | | | | | | $ | 5,686,000 | | | | | | | | | | | | | | $ | - | | | | | | | | | | | | | | $ | - | | | | | | | | | | | | | | $ | (292,000 | ) | | | | | | | | | | | | | $ | - | | | | | | | | | | | | | | $ | 5,394,000 | | | | | | | | | | | | | | $ | 113,438 | | | | | | |
| Investments in Affiliated Money Market Funds: | | | | | | | | | | | | | | | | | | | | | | | | | | | | | | | | | | | | | | | | | | | | | | | | | | | | | | | | | | | | | | | | | | | | | | | | | | | | | | | | | | | | | | | | | | | | | | | | | | | | | | | | | |
Invesco Government & Agency Portfolio, Institutional Class | | | | | | | | | 38,593,273 | | | | | | | | | | | | | | | 287,638,559 | | | | | | | | | | | | | | | (319,512,101 | ) | | | | | | | | | | | | | | - | | | | | | | | | | | | | | | - | | | | | | | | | | | | | | | 6,719,731 | | | | | | | | | | | | | | | 3,307 | | | | | | |
Invesco Liquid Assets Portfolio, Institutional Class | | | | | | | | | 27,566,599 | | | | | | | | | | | | | | | 205,456,113 | | | | | | | | | | | | | | | (222,538,803 | ) | | | | | | | | | | | | | | (416 | ) | | | | | | | | | | | | | | (3,713 | ) | | | | | | | | | | | | | | 10,479,780 | | | | | | | | | | | | | | | 1,562 | | | | | | |
Invesco Treasury Portfolio, Institutional Class | | | | | | | | | 44,106,598 | | | | | | | | | | | | | | | 328,729,781 | | | | | | | | | | | | | | | (365,156,686 | ) | | | | | | | | | | | | | | - | | | | | | | | | | | | | | | - | | | | | | | | | | | | | | | 7,679,693 | | | | | | | | | | | | | | | 1,434 | | | | | | |
| Investments Purchased with Cash Collateral from Securities on Loan: | | | | | | | | | | | | | | | | | | | | | | | | | | | | | | | | | | | | | | | | | | | | | | | | | | | | | | | | | | | | | | | | | | | | | | | | | | | | | | | | | | | | | | | | | | | | | | | | | | | | | | | | | |
Invesco Private Government Fund | | | | | | | | | 2,748,998 | | | | | | | | | | | | | | | 364,371,433 | | | | | | | | | | | | | | | (294,796,660 | ) | | | | | | | | | | | | | | - | | | | | | | | | | | | | | | - | | | | | | | | | | | | | | | 72,323,771 | | | | | | | | | | | | | | | 8,576 | * | | | | | |
Invesco Private Prime Fund | | | | | | | | | 4,123,497 | | | | | | | | | | | | | | | 748,927,745 | | | | | | | | | | | | | | | (582,787,439 | ) | | | | | | | | | | | | | | (15,714 | ) | | | | | | | | | | | | | | (17,509 | ) | | | | | | | | | | | | | | 170,230,580 | | | | | | | | | | | | | | | 82,496 | * | | | | | |
Total | | | | | | | | $ | 122,824,965 | | | | | | | | | | | | | | $ | 1,935,123,631 | | | | | | | | | | | | | | $ | (1,784,791,689 | ) | | | | | | | | | | | | | $ | (308,130 | ) | | | | | | | | | | | | | $ | (21,222 | ) | | | | | | | | | | | | | $ | 272,827,555 | | | | | | | | | | | | | | $ | 210,813 | | | | | | |
| | * | Represents the income earned on the investment of cash collateral, which is included in securities lending income on the Statement of Operations. Does not include rebates and fees paid to lending agent or premiums received from borrowers, if any. |
| (m) | Variable rate senior loan interests often require prepayments from excess cash flow or permit the borrower to repay at its election. The degree to which borrowers repay, whether as a contractual requirement or at their election, cannot be predicted with any accuracy. As a result, the actual remaining maturity may be substantially less than the stated maturities shown. However, it is anticipated that the variable rate senior loan interests will have an expected average life of three to five years. |
| (n) | Variable rate senior loan interests are, at present, not readily marketable, not registered under the 1933 Act and may be subject to contractual and legal restrictions on sale. Variable rate senior loan interests in the Fund’s portfolio generally have variable rates which adjust to a base, such as the London Interbank Offered Rate (“LIBOR”), on set dates, typically every 30 days, but not greater than one year, and/or have interest rates that float at margin above a widely recognized base lending rate such as the Prime Rate of a designated U.S. bank. |
| (o) | Foreign denominated security. Principal amount is denominated in the currency indicated. |
| (p) | The rate shown is the 7-day SEC standardized yield as of February 28, 2022. |
| (q) | The table below details options purchased. |
| (r) | The security has been segregated to satisfy the commitment to return the cash collateral received in securities lending transactions upon the borrower’s return of the securities loaned. See Note 1I. |
| | | | | | | | | | | | | | | | | | | | | | | | | | | | | | |
| Open Exchange-Traded Equity Options Purchased |
| Description | | Type of
Contract | | | Expiration
Date | | | Number of
Contracts | | | Exercise Price | | | Notional Value* | | | Value |
| | | | | | | | |
Equity Risk | | | | | | | | | | | | | | | | | | | | | | | | | | | | | | |
| | | | | | | | |
Alphabet, Inc. | | | Call | | | | 09/16/2022 | | | | 3 | | | | USD | | | | 3,150.00 | | | | USD | | | | 945,000 | | | $ 25,995 |
| | | | | | | | |
Amazon.com, Inc. | | | Call | | | | 09/16/2022 | | | | 1 | | | | USD | | | | 3,260.00 | | | | USD | | | | 326,000 | | | 21,343 |
| | | | | | | | |
Apple, Inc. | | | Call | | | | 09/16/2022 | | | | 24 | | | | USD | | | | 185.00 | | | | USD | | | | 444,000 | | | 16,800 |
| | | | | | | | |
iShares China Large-Cap ETF | | | Call | | | | 01/20/2023 | | | | 2,889 | | | | USD | | | | 41.00 | | | | USD | | | | 11,844,900 | | | 356,791 |
| | | | | | | | |
Microsoft Corp. | | | Call | | | | 09/16/2022 | | | | 15 | | | | USD | | | | 315.00 | | | | USD | | | | 472,500 | | | 27,900 |
Total Open Exchange-Traded Equity Options Purchased | | | | | | | | | | | | | | | | | | | | | | | | | | | | | | $ 448,829 |
| * | Notional Value is calculated by multiplying the Number of Contracts by the Exercise Price by the multiplier. |
See accompanying Notes to Financial Statements which are an integral part of the financial statements.
| | |
| 25 | | Invesco Corporate Bond Fund |
| | | | | | | | | | | | | | | | | | | | | | | | | | | | | | | | |
| Open Exchange-Traded Index Options Purchased | |
| Description | | Type of Contract | | | Expiration
Date | | | Number of
Contracts | | | Exercise Price | | | Notional Value* | | | Value | |
| | | | | | | | |
Equity Risk | | | | | | | | | | | | | | | | | | | | | | | | | | | | | | | | |
| | | | | | | | |
S&P 500 Index | | | Call | | | | 09/16/2022 | | | | 56 | | | | USD | | | | 4,475.00 | | | | USD | | | | 25,060,000 | | | $ | 1,241,800 | |
| * | Notional Value is calculated by multiplying the Number of Contracts by the Exercise Price by the multiplier. |
| | | | | | | | | | | | | | | | | | | | | | | | | | | | | | | | |
| Open Exchange-Traded Index Options Written | |
|
| |
| Description | | Type of
Contract | | | Expiration
Date | | | Number of
Contracts | | | Exercise Price | | | Notional Value* | | | Value | |
|
| |
Equity Risk | | | | | | | | | | | | | | | | | | | | | | | | | | | | | | | | |
|
| |
S&P 500 Index | | | Call | | | | 09/16/2022 | | | | 56 | | | | USD | | | | 4,775.00 | | | | USD | | | | 26,740,000 | | | $ | (487,480 | ) |
|
| |
| * | Notional Value is calculated by multiplying the Number of Contracts by the Exercise Price by the multiplier. |
| | | | | | | | | | | | | | | | | | | | |
| Open Futures Contracts | |
|
| |
| Long Futures Contracts | | Number of
Contracts | | | Expiration
Month | | | Notional Value | | | Value | | | Unrealized
Appreciation
(Depreciation) | |
|
| |
Interest Rate Risk | | | | | | | | | | | | | | | | | | | | |
|
| |
U.S. Treasury 2 Year Notes | | | 945 | | | | June-2022 | | | $ | 203,389,101 | | | $ | 642,303 | | | $ | 642,303 | |
|
| |
U.S. Treasury 5 Year Notes | | | 1,425 | | | | June-2022 | | | | 168,550,781 | | | | 875,486 | | | | 875,486 | |
|
| |
U.S. Treasury 10 Year Notes | | | 1,020 | | | | June-2022 | | | | 129,986,250 | | | | 871,250 | | | | 871,250 | |
|
| |
U.S. Treasury Long Bonds | | | 742 | | | | June-2022 | | | | 116,262,125 | | | | 1,512,984 | | | | 1,512,984 | |
|
| |
Subtotal–Long Futures Contracts | | | | | | | | | | | | | | | 3,902,023 | | | | 3,902,023 | |
|
| |
| | | | | |
Short Futures Contracts | | | | | | | | | | | | | | | | | | | | |
|
| |
Interest Rate Risk | | | | | | | | | | | | | | | | | | | | |
|
| |
U.S. Treasury 10 Year Ultra Notes | | | 2,296 | | | | June-2022 | | | | (324,489,375 | ) | | | (3,300,500 | ) | | | (3,300,500 | ) |
|
| |
U.S. Treasury Ultra Bonds | | | 558 | | | | June-2022 | | | | (103,753,125 | ) | | | (1,054,969 | ) | | | (1,054,969 | ) |
|
| |
Subtotal–Short Futures Contracts | | | | | | | | | | | | | | | (4,355,469 | ) | | | (4,355,469 | ) |
|
| |
Total Futures Contracts | | | | | | | | | | | | | | $ | (453,446 | ) | | $ | (453,446 | ) |
|
| |
| | | | | | | | | | | | | | | | | | | | | | |
| Open Forward Foreign Currency Contracts | |
| | | | | | | | | | | | | | | | | Unrealized | |
| Settlement | | | | Contract to | | | Appreciation | |
| | | | | | | | | | |
| Date | | Counterparty | | Deliver | | | Receive | | | (Depreciation) | |
|
| |
Currency Risk | | | | | | | | | | | | | | | | | | | | |
|
| |
05/17/2022 | | Citibank, N.A. | | | EUR | | | | 852,000 | | | | USD | | | | 979,543 | | | $ | 21,454 | |
|
| |
05/17/2022 | | Goldman Sachs International | | | CAD | | | | 11,226,000 | | | | USD | | | | 8,860,300 | | | | 2,003 | |
|
| |
05/17/2022 | | Goldman Sachs International | | | EUR | | | | 7,940,000 | | | | USD | | | | 9,125,886 | | | | 197,224 | |
|
| |
05/17/2022 | | Goldman Sachs International | | | GBP | | | | 289,000 | | | | USD | | | | 393,231 | | | | 5,496 | |
|
| |
07/12/2022 | | Goldman Sachs International | | | JPY | | | | 2,232,354,123 | | | | AUD | | | | 27,080,000 | | | | 223,621 | |
|
| |
07/12/2022 | | Goldman Sachs International | | | USD | | | | 34,546,016 | | | | AUD | | | | 48,500,000 | | | | 753,222 | |
|
| |
Subtotal–Appreciation | | | | | | | | | | | | | | | | | | | 1,203,020 | |
|
| |
| | | | | |
Currency Risk | | | | | | | | | | | | | | | | | | | | |
|
| |
07/12/2022 | | Citibank, N.A. | | | AUD | | | | 13,540,000 | | | | JPY | | | | 1,121,962,041 | | | | (61,314 | ) |
|
| |
07/12/2022 | | Citibank, N.A. | | | AUD | | | | 24,250,000 | | | | USD | | | | 17,487,376 | | | | (162,244 | ) |
|
| |
07/12/2022 | | Goldman Sachs International | | | AUD | | | | 13,540,000 | | | | JPY | | | | 1,122,415,902 | | | | (57,353 | ) |
|
| |
07/12/2022 | | Goldman Sachs International | | | AUD | | | | 24,250,000 | | | | USD | | | | 17,493,142 | | | | (156,477 | ) |
|
| |
Subtotal–Depreciation | | | | | | | | | | | | | | | | | | | (437,388 | ) |
|
| |
Total Forward Foreign Currency Contracts | | | | | | | | | | | | | | | | | | $ | 765,632 | |
|
| |
See accompanying Notes to Financial Statements which are an integral part of the financial statements.
| | |
| 26 | | Invesco Corporate Bond Fund |
Abbreviations:
AUD – Australian Dollar
CAD – Canadian Dollar
EUR – Euro
GBP – British Pound Sterling
JPY – Japanese Yen
USD – U.S. Dollar
See accompanying Notes to Financial Statements which are an integral part of the financial statements.
| | |
| 27 | | Invesco Corporate Bond Fund |
Statement of Assets and Liabilities
February 28, 2022
| | | | |
Assets: | | | | |
Investments in unaffiliated securities, at value
(Cost $2,955,373,002)* | | $ | 2,855,461,041 | |
|
| |
Investments in affiliates, at value
(Cost $273,279,585) | | | 272,827,555 | |
|
| |
Other investments: | | | | |
Unrealized appreciation on forward foreign currency contracts outstanding | | | 1,203,020 | |
|
| |
Foreign currencies, at value (Cost $8,251,322) | | | 8,236,487 | |
|
| |
Receivable for: | | | | |
Investments sold | | | 57,279,599 | |
|
| |
Fund shares sold | | | 4,377,862 | |
|
| |
Dividends | | | 296,183 | |
|
| |
Interest | | | 24,895,931 | |
|
| |
Investment for trustee deferred compensation and retirement plans | | | 200,298 | |
|
| |
Other assets | | | 110,051 | |
|
| |
Total assets | | | 3,224,888,027 | |
|
| |
| |
Liabilities: | | | | |
Other investments: | | | | |
Options written, at value (premiums received $353,480) | | | 487,480 | |
|
| |
Variation margin payable - futures contracts | | | 1,678,296 | |
|
| |
Unrealized depreciation on forward foreign currency contracts outstanding | | | 437,388 | |
|
| |
Payable for: | | | | |
Investments purchased | | | 59,659,124 | |
|
| |
Dividends | | | 1,104,319 | |
|
| |
Fund shares reacquired | | | 5,481,569 | |
|
| |
Amount due custodian | | | 272 | |
|
| |
Collateral upon return of securities loaned | | | 242,570,065 | |
|
| |
Accrued fees to affiliates | | | 823,779 | |
|
| |
Accrued trustees’ and officers’ fees and benefits | | | 6,210 | |
|
| |
Accrued other operating expenses | | | 178,920 | |
|
| |
Trustee deferred compensation and retirement plans | | | 223,592 | |
|
| |
Total liabilities | | | 312,651,014 | |
|
| |
Net assets applicable to shares outstanding | | $ | 2,912,237,013 | |
|
| |
| | | | |
Net assets consist of: | | | | |
| |
Shares of beneficial interest | | $ | 3,029,879,459 | |
|
| |
Distributable earnings (loss) | | | (117,642,446 | ) |
|
| |
| | $ | 2,912,237,013 | |
|
| |
|
Net Assets: | |
| |
Class A | | $ | 1,295,987,428 | |
|
| |
Class C | | $ | 51,443,706 | |
|
| |
Class R | | $ | 13,750,273 | |
|
| |
| |
Class Y | | $ | 576,511,641 | |
|
| |
Class R5 | | $ | 14,978,050 | |
|
| |
Class R6 | | $ | 959,565,915 | |
|
| |
|
Shares outstanding, no par value, with an unlimited number of shares authorized: | |
| |
Class A | | | 181,326,037 | |
|
| |
Class C | | | 7,142,787 | |
|
| |
Class R | | | 1,922,820 | |
|
| |
Class Y | | | 80,491,727 | |
|
| |
Class R5 | | | 2,093,026 | |
|
| |
Class R6 | | | 133,953,092 | |
|
| |
Class A: | | | | |
Net asset value per share | | $ | 7.15 | |
|
| |
Maximum offering price per share
(Net asset value of $7.15 ÷ 95.75%) | | $ | 7.47 | |
|
| |
Class C: | | | | |
Net asset value and offering price per share | | $ | 7.20 | |
|
| |
Class R: | | | | |
Net asset value and offering price per share | | $ | 7.15 | |
|
| |
Class Y: | | | | |
Net asset value and offering price per share | | $ | 7.16 | |
|
| |
Class R5: | | | | |
Net asset value and offering price per share | | $ | 7.16 | |
|
| |
Class R6: | | | | |
Net asset value and offering price per share | | $ | 7.16 | |
|
| |
| * | At February 28, 2022, securities with an aggregate value of $237,641,668 were on loan to brokers. |
See accompanying Notes to Financial Statements which are an integral part of the financial statements.
| | |
| 28 | | Invesco Corporate Bond Fund |
Statement of Operations
For the year ended February 28, 2022
| | | | |
Investment income: | | | | |
| |
Interest (net of foreign withholding taxes of $28,401) | | $ | 93,432,572 | |
|
| |
| |
Dividends | | | 1,974,112 | |
|
| |
Dividends from affiliates (includes securities lending income of $181,899) | | | 301,640 | |
|
| |
Total investment income | | | 95,708,324 | |
|
| |
| |
Expenses: | | | | |
| |
Advisory fees | | | 8,200,798 | |
|
| |
Administrative services fees | | | 400,269 | |
|
| |
Custodian fees | | | 76,869 | |
|
| |
Distribution fees: | | | | |
Class A | | | 3,386,378 | |
|
| |
Class C | | | 606,864 | |
|
| |
Class R | | | 64,409 | |
|
| |
Transfer agent fees – A, C, R and Y | | | 2,801,045 | |
|
| |
Transfer agent fees – R5 | | | 15,667 | |
|
| |
Transfer agent fees – R6 | | | 200,855 | |
|
| |
Trustees’ and officers’ fees and benefits | | | 47,372 | |
|
| |
Registration and filing fees | | | 219,737 | |
|
| |
Reports to shareholders | | | 159,375 | |
|
| |
Professional services fees | | | 93,813 | |
|
| |
Other | | | 37,317 | |
|
| |
Total expenses | | | 16,310,768 | |
|
| |
Less: Fees waived and/or expense offset arrangement(s) | | | (43,155 | ) |
|
| |
Net expenses | | | 16,267,613 | |
|
| |
Net investment income | | | 79,440,711 | |
|
| |
| |
Realized and unrealized gain (loss) from: | | | | |
Net realized gain (loss) from: | | | | |
Unaffiliated investment securities | | | 11,004,702 | |
|
| |
Affiliated investment securities | | | (21,222 | ) |
|
| |
Foreign currencies | | | (233,575 | ) |
|
| |
Forward foreign currency contracts | | | 837,632 | |
|
| |
Futures contracts | | | (6,654,299 | ) |
|
| |
Option contracts written | | | 617,129 | |
|
| |
Swap agreements | | | (342,703 | ) |
|
| |
| | | 5,207,664 | |
|
| |
Change in net unrealized appreciation (depreciation) of: | | | | |
Unaffiliated investment securities | | | (206,248,288 | ) |
|
| |
Affiliated investment securities | | | (308,130 | ) |
|
| |
Foreign currencies | | | (15,013 | ) |
|
| |
Forward foreign currency contracts | | | 697,062 | |
|
| |
Futures contracts | | | (1,888,954 | ) |
|
| |
Option contracts written | | | (255,401 | ) |
|
| |
| | | (208,018,724 | ) |
|
| |
Net realized and unrealized gain (loss) | | | (202,811,060 | ) |
|
| |
Net increase (decrease) in net assets resulting from operations | | $ | (123,370,349 | ) |
|
| |
See accompanying Notes to Financial Statements which are an integral part of the financial statements.
| | |
| 29 | | Invesco Corporate Bond Fund |
Statement of Changes in Net Assets
For the years ended February 28, 2022 and 2021
| | | | | | | | |
| | | 2022 | | | 2021 | |
|
| |
Operations: | | | | | | | | |
| | |
Net investment income | | $ | 79,440,711 | | | $ | 69,397,448 | |
|
| |
Net realized gain | | | 5,207,664 | | | | 100,097,393 | |
|
| |
Change in net unrealized appreciation (depreciation) | | | (208,018,724 | ) | | | (34,247,244 | ) |
|
| |
Net increase (decrease) in net assets resulting from operations | | | (123,370,349 | ) | | | 135,247,597 | |
|
| |
| | |
Distributions to shareholders from distributable earnings: | | | | | | | | |
| | |
Class A | | | (66,050,560 | ) | | | (75,965,080 | ) |
|
| |
Class C | | | (2,426,197 | ) | | | (3,630,108 | ) |
|
| |
Class R | | | (609,685 | ) | | | (673,911 | ) |
|
| |
| | |
Class Y | | | (28,233,702 | ) | | | (26,565,725 | ) |
|
| |
Class R5 | | | (859,252 | ) | | | (714,077 | ) |
|
| |
Class R6 | | | (46,805,423 | ) | | | (37,802,611 | ) |
|
| |
Total distributions from distributable earnings | | | (144,984,819 | ) | | | (145,351,512 | ) |
|
| |
| | |
Share transactions-net: | | | | | | | | |
| | |
Class A | | | 73,499,790 | | | | 121,480,031 | |
|
| |
Class C | | | (8,959,819 | ) | | | (1,174,577 | ) |
|
| |
Class R | | | 3,148,823 | | | | (531,997 | ) |
|
| |
| | |
Class Y | | | 132,781,189 | | | | 157,159,060 | |
|
| |
Class R5 | | | 1,904,087 | | | | 6,083,742 | |
|
| |
Class R6 | | | 369,459,920 | | | | 121,518,498 | |
|
| |
Net increase in net assets resulting from share transactions | | | 571,833,990 | | | | 404,534,757 | |
|
| |
Net increase in net assets | | | 303,478,822 | | | | 394,430,842 | |
|
| |
| | |
Net assets: | | | | | | | | |
| | |
Beginning of year | | | 2,608,758,191 | | | | 2,214,327,349 | |
|
| |
End of year | | $ | 2,912,237,013 | | | $ | 2,608,758,191 | |
|
| |
See accompanying Notes to Financial Statements which are an integral part of the financial statements.
| | |
| 30 | | Invesco Corporate Bond Fund |
Financial Highlights
The following schedule presents financial highlights for a share of the Fund outstanding throughout the periods indicated.
| | | | | | | | | | | | | | | | | | | | | | | | | | | | | | | | | | | | | | | | | | | | | | | | | | | | | | | | | | | | | | | | | | | | | | |
| | | Net asset value, beginning of period | | Net investment income(a) | | Net gains (losses) on securities (both realized and unrealized) | | Total from investment operations | | Dividends from net investment income | | Distributions from net realized gains | | Total distributions | | Net asset value, end of period | | Total return (b) | | Net assets, end of period (000’s omitted) | | Ratio of expenses to average net assets with fee waivers and/or expenses absorbed | | Ratio of expenses to average net assets without fee waivers and/or expenses absorbed | | Ratio of net investment income to average net assets | | Portfolio turnover (c) |
Class A | | | | | | | | | | | | | | | | | | | | | | | | | | | | | | | | | | | | | | | | | | | | | | | | | | | | | | | | | | | | | | | | | | | | | | |
Year ended 02/28/22 | | | | $7.80 | | | | | $0.21 | | | | | $(0.49 | ) | | | | $(0.28 | ) | | | | $(0.21 | ) | | | | $(0.16 | ) | | | | $(0.37 | ) | | | | $7.15 | | | | | (3.79 | )% | | | | $1,295,987 | | | | | 0.72 | % | | | | 0.72 | % | | | | 2.66 | % | | | | 133 | % |
Year ended 02/28/21 | | | | 7.80 | | | | | 0.22 | | | | | 0.25 | | | | | 0.47 | | | | | (0.24 | ) | | | | (0.23 | ) | | | | (0.47 | ) | | | | 7.80 | | | | | 6.14 | | | | | 1,342,071 | | | | | 0.74 | | | | | 0.74 | | | | | 2.87 | | | | | 182 | |
Year ended 02/29/20 | | | | 7.02 | | | | | 0.25 | | | | | 0.80 | | | | | 1.05 | | | | | (0.27 | ) | | | | – | | | | | (0.27 | ) | | | | 7.80 | | | | | 15.20 | | | | | 1,224,248 | | | | | 0.80 | | | | | 0.80 | | | | | 3.30 | | | | | 192 | |
Year ended 02/28/19 | | | | 7.20 | | | | | 0.28 | | | | | (0.17 | ) | | | | 0.11 | | | | | (0.29 | ) | | | | (0.00 | ) | | | | (0.29 | ) | | | | 7.02 | | | | | 1.65 | | | | | 968,160 | | | | | 0.83 | | | | | 0.83 | | | | | 4.00 | | | | | 145 | |
Year ended 02/28/18 | | | | 7.31 | | | | | 0.26 | | | | | (0.06 | ) | | | | 0.20 | | | | | (0.27 | ) | | | | (0.04 | ) | | | | (0.31 | ) | | | | 7.20 | | | | | 2.68 | | | | | 1,001,173 | | | | | 0.85 | | | | | 0.85 | | | | | 3.58 | | | | | 180 | |
Class C | | | | | | | | | | | | | | | | | | | | | | | | | | | | | | | | | | | | | | | | | | | | | | | | | | | | | | | | | | | | | | | | | | | | | | |
Year ended 02/28/22 | | | | 7.86 | | | | | 0.15 | | | | | (0.49 | ) | | | | (0.34 | ) | | | | (0.16 | ) | | | | (0.16 | ) | | | | (0.32 | ) | | | | 7.20 | | | | | (4.60 | ) | | | | 51,444 | | | | | 1.47 | | | | | 1.47 | | | | | 1.91 | | | | | 133 | |
Year ended 02/28/21 | | | | 7.87 | | | | | 0.17 | | | | | 0.24 | | | | | 0.41 | | | | | (0.19 | ) | | | | (0.23 | ) | | | | (0.42 | ) | | | | 7.86 | | | | | 5.23 | | | | | 65,404 | | | | | 1.49 | | | | | 1.49 | | | | | 2.12 | | | | | 182 | |
Year ended 02/29/20 | | | | 7.08 | | | | | 0.19 | | | | | 0.82 | | | | | 1.01 | | | | | (0.22 | ) | | | | – | | | | | (0.22 | ) | | | | 7.87 | | | | | 14.43 | | | | | 66,662 | | | | | 1.55 | | | | | 1.55 | | | | | 2.55 | | | | | 192 | |
Year ended 02/28/19 | | | | 7.26 | | | | | 0.23 | | | | | (0.17 | ) | | | | 0.06 | | | | | (0.24 | ) | | | | (0.00 | ) | | | | (0.24 | ) | | | | 7.08 | | | | | 0.91 | (d) | | | | 37,280 | | | | | 1.53 | (d) | | | | 1.53 | (d) | | | | 3.30 | (d) | | | | 145 | |
Year ended 02/28/18 | | | | 7.36 | | | | | 0.21 | | | | | (0.06 | ) | | | | 0.15 | | | | | (0.21 | ) | | | | (0.04 | ) | | | | (0.25 | ) | | | | 7.26 | | | | | 2.07 | (d) | | | | 82,939 | | | | | 1.58 | (d) | | | | 1.58 | (d) | | | | 2.85 | (d) | | | | 180 | |
Class R | | | | | | | | | | | | | | | | | | | | | | | | | | | | | | | | | | | | | | | | | | | | | | | | | | | | | | | | | | | | | | | | | | | | | | |
Year ended 02/28/22 | | | | 7.81 | | | | | 0.19 | | | | | (0.49 | ) | | | | (0.30 | ) | | | | (0.20 | ) | | | | (0.16 | ) | | | | (0.36 | ) | | | | 7.15 | | | | | (4.16 | ) | | | | 13,750 | | | | | 0.97 | | | | | 0.97 | | | | | 2.41 | | | | | 133 | |
Year ended 02/28/21 | | | | 7.81 | | | | | 0.20 | | | | | 0.25 | | | | | 0.45 | | | | | (0.22 | ) | | | | (0.23 | ) | | | | (0.45 | ) | | | | 7.81 | | | | | 5.87 | | | | | 11,819 | | | | | 0.99 | | | | | 0.99 | | | | | 2.62 | | | | | 182 | |
Year ended 02/29/20 | | | | 7.02 | | | | | 0.23 | | | | | 0.81 | | | | | 1.04 | | | | | (0.25 | ) | | | | – | | | | | (0.25 | ) | | | | 7.81 | | | | | 15.06 | | | | | 12,435 | | | | | 1.05 | | | | | 1.05 | | | | | 3.05 | | | | | 192 | |
Year ended 02/28/19 | | | | 7.21 | | | | | 0.26 | | | | | (0.17 | ) | | | | 0.09 | | | | | (0.28 | ) | | | | (0.00 | ) | | | | (0.28 | ) | | | | 7.02 | | | | | 1.30 | | | | | 6,889 | | | | | 1.08 | | | | | 1.08 | | | | | 3.75 | | | | | 145 | |
Year ended 02/28/18 | | | | 7.31 | | | | | 0.25 | | | | | (0.06 | ) | | | | 0.19 | | | | | (0.25 | ) | | | | (0.04 | ) | | | | (0.29 | ) | | | | 7.21 | | | | | 2.57 | | | | | 7,196 | | | | | 1.10 | | | | | 1.10 | | | | | 3.33 | | | | | 180 | |
Class Y | | | | | | | | | | | | | | | | | | | | | | | | | | | | | | | | | | | | | | | | | | | | | | | | | | | | | | | | | | | | | | | | | | | | | | |
Year ended 02/28/22 | | | | 7.82 | | | | | 0.23 | | | | | (0.50 | ) | | | | (0.27 | ) | | | | (0.23 | ) | | | | (0.16 | ) | | | | (0.39 | ) | | | | 7.16 | | | | | (3.66 | ) | | | | 576,512 | | | | | 0.47 | | | | | 0.47 | | | | | 2.91 | | | | | 133 | |
Year ended 02/28/21 | | | | 7.82 | | | | | 0.24 | | | | | 0.25 | | | | | 0.49 | | | | | (0.26 | ) | | | | (0.23 | ) | | | | (0.49 | ) | | | | 7.82 | | | | | 6.40 | | | | | 497,643 | | | | | 0.49 | | | | | 0.49 | | | | | 3.12 | | | | | 182 | |
Year ended 02/29/20 | | | | 7.03 | | | | | 0.27 | | | | | 0.81 | | | | | 1.08 | | | | | (0.29 | ) | | | | – | | | | | (0.29 | ) | | | | 7.82 | | | | | 15.62 | | | | | 343,580 | | | | | 0.55 | | | | | 0.55 | | | | | 3.55 | | | | | 192 | |
Year ended 02/28/19 | | | | 7.22 | | | | | 0.30 | | | | | (0.18 | ) | | | | 0.12 | | | | | (0.31 | ) | | | | (0.00 | ) | | | | (0.31 | ) | | | | 7.03 | | | | | 1.76 | | | | | 86,657 | | | | | 0.58 | | | | | 0.58 | | | | | 4.25 | | | | | 145 | |
Year ended 02/28/18 | | | | 7.32 | | | | | 0.28 | | | | | (0.05 | ) | | | | 0.23 | | | | | (0.29 | ) | | | | (0.04 | ) | | | | (0.33 | ) | | | | 7.22 | | | | | 3.08 | | | | | 87,895 | | | | | 0.60 | | | | | 0.60 | | | | | 3.83 | | | | | 180 | |
Class R5 | | | | | | | | | | | | | | | | | | | | | | | | | | | | | | | | | | | | | | | | | | | | | | | | | | | | | | | | | | | | | | | | | | | | | | |
Year ended 02/28/22 | | | | 7.81 | | | | | 0.23 | | | | | (0.48 | ) | | | | (0.25 | ) | | | | (0.24 | ) | | | | (0.16 | ) | | | | (0.40 | ) | | | | 7.16 | | | | | (3.47 | ) | | | | 14,978 | | | | | 0.42 | | | | | 0.42 | | | | | 2.96 | | | | | 133 | |
Year ended 02/28/21 | | | | 7.81 | | | | | 0.25 | | | | | 0.24 | | | | | 0.49 | | | | | (0.26 | ) | | | | (0.23 | ) | | | | (0.49 | ) | | | | 7.81 | | | | | 6.45 | | | | | 14,418 | | | | | 0.44 | | | | | 0.44 | | | | | 3.17 | | | | | 182 | |
Year ended 02/29/20 | | | | 7.03 | | | | | 0.27 | | | | | 0.80 | | | | | 1.07 | | | | | (0.29 | ) | | | | – | | | | | (0.29 | ) | | | | 7.81 | | | | | 15.55 | | | | | 8,537 | | | | | 0.49 | | | | | 0.49 | | | | | 3.61 | | | | | 192 | |
Year ended 02/28/19 | | | | 7.21 | | | | | 0.30 | | | | | (0.17 | ) | | | | 0.13 | | | | | (0.31 | ) | | | | (0.00 | ) | | | | (0.31 | ) | | | | 7.03 | | | | | 2.00 | | | | | 6,841 | | | | | 0.49 | | | | | 0.49 | | | | | 4.34 | | | | | 145 | |
Year ended 02/28/18 | | | | 7.31 | | | | | 0.29 | | | | | (0.06 | ) | | | | 0.23 | | | | | (0.29 | ) | | | | (0.04 | ) | | | | (0.33 | ) | | | | 7.21 | | | | | 3.16 | | | | | 3,829 | | | | | 0.53 | | | | | 0.53 | | | | | 3.90 | | | | | 180 | |
Class R6 | | | | | | | | | | | | | | | | | | | | | | | | | | | | | | | | | | | | | | | | | | | | | | | | | | | | | | | | | | | | | | | | | | | | | | |
Year ended 02/28/22 | | | | 7.82 | | | | | 0.23 | | | | | (0.49 | ) | | | | (0.26 | ) | | | | (0.24 | ) | | | | (0.16 | ) | | | | (0.40 | ) | | | | 7.16 | | | | | (3.54 | ) | | | | 959,566 | | | | | 0.35 | | | | | 0.35 | | | | | 3.03 | | | | | 133 | |
Year ended 02/28/21 | | | | 7.82 | | | | | 0.25 | | | | | 0.25 | | | | | 0.50 | | | | | (0.27 | ) | | | | (0.23 | ) | | | | (0.50 | ) | | | | 7.82 | | | | | 6.54 | | | | | 677,403 | | | | | 0.36 | | | | | 0.36 | | | | | 3.25 | | | | | 182 | |
Year ended 02/29/20 | | | | 7.04 | | | | | 0.28 | | | | | 0.80 | | | | | 1.08 | | | | | (0.30 | ) | | | | – | | | | | (0.30 | ) | | | | 7.82 | | | | | 15.62 | | | | | 558,866 | | | | | 0.41 | | | | | 0.41 | | | | | 3.69 | | | | | 192 | |
Year ended 02/28/19 | | | | 7.22 | | | | | 0.31 | | | | | (0.17 | ) | | | | 0.14 | | | | | (0.32 | ) | | | | (0.00 | ) | | | | (0.32 | ) | | | | 7.04 | | | | | 2.01 | | | | | 388,221 | | | | | 0.43 | | | | | 0.43 | | | | | 4.40 | | | | | 145 | |
Year ended 02/28/18 | | | | 7.32 | | | | | 0.30 | | | | | (0.06 | ) | | | | 0.24 | | | | | (0.30 | ) | | | | (0.04 | ) | | | | (0.34 | ) | | | | 7.22 | | | | | 3.25 | | | | | 413,844 | | | | | 0.44 | | | | | 0.44 | | | | | 3.99 | | | | | 180 | |
| (a) | Calculated using average shares outstanding. |
| (b) | Includes adjustments in accordance with accounting principles generally accepted in the United States of America and as such, the net asset value for financial reporting purposes and the returns based upon those net asset values may differ from the net asset value and returns for shareholder transactions. Does not include sales charges and is not annualized for periods less than one year, if applicable. |
| (c) | Portfolio turnover is calculated at the fund level and is not annualized for periods less than one year, if applicable. |
| (d) | The total return, ratio of expenses to average net assets and ratio of net investment income (loss) to average net assets reflect actual 12b-1 fees of 0.95% and 0.98% for the years ended February 28, 2019 and 2018, respectively. |
See accompanying Notes to Financial Statements which are an integral part of the financial statements.
| | |
| 31 | | Invesco Corporate Bond Fund |
Notes to Financial Statements
February 28, 2022
NOTE 1–Significant Accounting Policies
Invesco Corporate Bond Fund (the “Fund”), is a series portfolio of AIM Investment Securities Funds (Invesco Investment Securities Funds) (the “Trust”). The Trust is organized as a Delaware statutory trust and is registered under the Investment Company Act of 1940, as amended (the “1940 Act”), as an open-end series management investment company authorized to issue an unlimited number of shares of beneficial interest. Information presented in these financial statements pertains only to the Fund. Matters affecting the Fund or each class will be voted on exclusively by the shareholders of the Fund or each class.
The Fund’s primary investment objective is to seek to provide current income with preservation of capital. Capital appreciation is a secondary objective that is sought only when consistent with the Fund’s primary investment objective.
The Fund currently consists of six different classes of shares: Class A, Class C, Class R, Class Y, Class R5 and Class R6. Class Y shares are available only to certain investors. Class A shares are sold with a front-end sales charge unless certain waiver criteria are met. Under certain circumstances, load waived shares may be subject to contingent deferred sales charges (“CDSC”). Class C shares are sold with a CDSC. Class R, Class Y, Class R5 and Class R6 shares are sold at net asset value. Class C shares held for eight years after purchase are eligible for automatic conversion into Class A shares of the same Fund (the “Conversion Feature”). The automatic conversion pursuant to the Conversion Feature will generally occur at the end of the month following the eighth anniversary after a purchase of Class C shares.
The Fund is an investment company and accordingly follows the investment company accounting and reporting guidance in accordance with Financial Accounting Standards Board Accounting Standards Codification Topic 946, Financial Services - Investment Companies.
The following is a summary of the significant accounting policies followed by the Fund in the preparation of its financial statements.
| A. | Security Valuations - Securities, including restricted securities, are valued according to the following policy. |
Debt obligations (including convertible securities) and unlisted equities are fair valued using an evaluated quote provided by an independent pricing service. Evaluated quotes provided by the pricing service may be determined without exclusive reliance on quoted prices, and may reflect appropriate factors such as institution-size trading in similar groups of securities, developments related to specific securities, dividend rate (for unlisted equities), yield (for debt obligations), quality, type of issue, coupon rate (for debt obligations), maturity (for debt obligations), individual trading characteristics and other market data. Pricing services generally value debt obligations assuming orderly transactions of institutional round lot size, but a fund may hold or transact in the same securities in smaller, odd lot sizes. Odd lots often trade at lower prices than institutional round lots. Debt obligations are subject to interest rate and credit risks. In addition, all debt obligations involve some risk of default with respect to interest and/or principal payments.
Variable rate senior loan interests are fair valued using quotes provided by an independent pricing service. Quotes provided by the pricing service may reflect appropriate factors such as ratings, tranche type, industry, company performance, spread, individual trading characteristics, institution-size trading in similar groups of securities and other market data.
A security listed or traded on an exchange (except convertible securities) is valued at its last sales price or official closing price as of the close of the customary trading session on the exchange where the security is principally traded, or lacking any sales or official closing price on a particular day, the security may be valued at the closing bid price on that day. Securities traded in the over-the-counter market are valued based on prices furnished by independent pricing services or market makers. When such securities are valued by an independent pricing service they may be considered fair valued. Futures contracts are valued at the final settlement price set by an exchange on which they are principally traded. Listed options are valued at the mean between the last bid and asked prices from the exchange on which they are principally traded. Options not listed on an exchange are valued by an independent source at the mean between the last bid and asked prices. For purposes of determining net asset value (“NAV”) per share, futures and option contracts generally are valued 15 minutes after the close of the customary trading session of the New York Stock Exchange (“NYSE”).
Investments in open-end and closed-end registered investment companies that do not trade on an exchange are valued at the end-of-day net asset value per share. Investments in open-end and closed-end registered investment companies that trade on an exchange are valued at the last sales price or official closing price as of the close of the customary trading session on the exchange where the security is principally traded.
Swap agreements are fair valued using an evaluated quote, if available, provided by an independent pricing service. Evaluated quotes provided by the pricing service are valued based on a model which may include end-of-day net present values, spreads, ratings, industry, company performance and returns of referenced assets. Centrally cleared swap agreements are valued at the daily settlement price determined by the relevant exchange or clearinghouse.
Foreign securities’ (including foreign exchange contracts) prices are converted into U.S. dollar amounts using the applicable exchange rates as of the close of the NYSE. If market quotations are available and reliable for foreign exchange-traded equity securities, the securities will be valued at the market quotations. Because trading hours for certain foreign securities end before the close of the NYSE, closing market quotations may become unreliable. If between the time trading ends on a particular security and the close of the customary trading session on the NYSE, events occur that the investment adviser determines are significant and make the closing price unreliable, the Fund may fair value the security. If the event is likely to have affected the closing price of the security, the security will be valued at fair value in good faith using procedures approved by the Board of Trustees. Adjustments to closing prices to reflect fair value may also be based on a screening process of an independent pricing service to indicate the degree of certainty, based on historical data, that the closing price in the principal market where a foreign security trades is not the current value as of the close of the NYSE. Foreign securities’ prices meeting the approved degree of certainty that the price is not reflective of current value will be priced at the indication of fair value from the independent pricing service. Multiple factors may be considered by the independent pricing service in determining adjustments to reflect fair value and may include information relating to sector indices, American Depositary Receipts and domestic and foreign index futures. Foreign securities may have additional risks including exchange rate changes, potential for sharply devalued currencies and high inflation, political and economic upheaval, the relative lack of issuer information, relatively low market liquidity and the potential lack of strict financial and accounting controls and standards.
Securities for which market prices are not provided by any of the above methods may be valued based upon quotes furnished by independent sources. The last bid price may be used to value equity securities. The mean between the last bid and asked prices is used to value debt obligations, including corporate loans.
Securities for which market quotations are not readily available or became unreliable are valued at fair value as determined in good faith by or under the supervision of the Trust’s officers following procedures approved by the Board of Trustees. Issuer specific events, market trends, bid/asked quotes of brokers and information providers and other market data may be reviewed in the course of making a good faith determination of a security’s fair value.
The Fund may invest in securities that are subject to interest rate risk, meaning the risk that the prices will generally fall as interest rates rise and, conversely, the prices will generally rise as interest rates fall. Specific securities differ in their sensitivity to changes in interest rates depending on their individual characteristics. Changes in interest rates may result in increased market volatility, which may affect the value and/or liquidity of certain Fund investments.
Valuations change in response to many factors including the historical and prospective earnings of the issuer, the value of the issuer’s assets, general market conditions which are not specifically related to the particular issuer, such as real or perceived adverse economic conditions, changes in the general outlook for revenues or corporate earnings, changes in interest or currency rates, regional or global instability, natural or environmental disasters, widespread disease or other public health issues, war, acts of terrorism or adverse investor sentiment generally and market liquidity. Because of the inherent uncertainties of valuation, the values reflected in the financial statements may materially differ from the value received upon actual sale of those investments.
| B. | Securities Transactions and Investment Income - Securities transactions are accounted for on a trade date basis. Realized gains or losses on sales are computed on the basis of specific identification of the securities sold. Interest income (net of withholding tax, if any) is recorded on an accrual basis from |
| | |
| 32 | | Invesco Corporate Bond Fund |
| | settlement date and includes coupon interest and amortization of premium and accretion of discount on debt securities as applicable. Pay-in-kind interest income and non-cash dividend income received in the form of securities in-lieu of cash are recorded at the fair value of the securities received. Paydown gains and losses on mortgage and asset-backed securities are recorded as adjustments to interest income. Dividend income (net of withholding tax, if any) is recorded on the ex-dividend date. |
The Fund may periodically participate in litigation related to Fund investments. As such, the Fund may receive proceeds from litigation settlements. Any proceeds received are included in the Statement of Operations as realized gain (loss) for investments no longer held and as unrealized gain (loss) for investments still held.
Brokerage commissions and mark ups are considered transaction costs and are recorded as an increase to the cost basis of securities purchased and/or a reduction of proceeds on a sale of securities. Such transaction costs are included in the determination of net realized and unrealized gain (loss) from investment securities reported in the Statement of Operations and the Statement of Changes in Net Assets and the net realized and unrealized gains (losses) on securities per share in the Financial Highlights. Transaction costs are included in the calculation of the Fund’s net asset value and, accordingly, they reduce the Fund’s total returns. These transaction costs are not considered operating expenses and are not reflected in net investment income reported in the Statement of Operations and the Statement of Changes in Net Assets, or the net investment income per share and the ratios of expenses and net investment income reported in the Financial Highlights, nor are they limited by any expense limitation arrangements between the Fund and the investment adviser.
The Fund allocates realized and unrealized capital gains and losses to a class based on the relative net assets of each class. The Fund allocates income to a class based on the relative value of the settled shares of each class.
| C. | Country Determination - For the purposes of making investment selection decisions and presentation in the Schedule of Investments, the investment adviser may determine the country in which an issuer is located and/or credit risk exposure based on various factors. These factors include the laws of the country under which the issuer is organized, where the issuer maintains a principal office, the country in which the issuer derives 50% or more of its total revenues and the country that has the primary market for the issuer’s securities, as well as other criteria. Among the other criteria that may be evaluated for making this determination are the country in which the issuer maintains 50% or more of its assets, the type of security, financial guarantees and enhancements, the nature of the collateral and the sponsor organization. Country of issuer and/or credit risk exposure has been determined to be the United States of America, unless otherwise noted. |
| D. | Distributions - Distributions from net investment income, if any, are declared daily and paid monthly. Distributions from net realized capital gain, if any, are generally declared and paid annually and recorded on the ex-dividend date. The Fund may elect to treat a portion of the proceeds from redemptions as distributions for federal income tax purposes. |
| E. | Federal Income Taxes - The Fund intends to comply with the requirements of Subchapter M of the Internal Revenue Code of 1986, as amended (the “Internal Revenue Code”), necessary to qualify as a regulated investment company and to distribute substantially all of the Fund’s taxable earnings to shareholders. As such, the Fund will not be subject to federal income taxes on otherwise taxable income (including net realized capital gain) that is distributed to shareholders. Therefore, no provision for federal income taxes is recorded in the financial statements. |
The Fund recognizes the tax benefits of uncertain tax positions only when the position is more likely than not to be sustained. Management has analyzed the Fund’s uncertain tax positions and concluded that no liability for unrecognized tax benefits should be recorded related to uncertain tax positions. Management is not aware of any tax positions for which it is reasonably possible that the total amounts of unrecognized tax benefits will change materially in the next 12 months.
The Fund files tax returns in the U.S. Federal jurisdiction and certain other jurisdictions. Generally, the Fund is subject to examinations by such taxing authorities for up to three years after the filing of the return for the tax period.
| F. | Expenses - Fees provided for under the Rule 12b-1 plan of a particular class of the Fund are charged to the operations of such class. Transfer agency fees and expenses and other shareholder recordkeeping fees and expenses attributable to Class R5 and Class R6 are allocated based on relative net assets of Class R5 and Class R6. Sub-accounting fees attributable to Class R5 are charged to the operations of the class. Transfer agency fees and expenses and other shareholder recordkeeping fees and expenses relating to all other classes are allocated among those classes based on relative net assets. All other expenses are allocated among the classes based on relative net assets. |
| G. | Accounting Estimates - The preparation of financial statements in conformity with accounting principles generally accepted in the United States of America (“GAAP”) requires management to make estimates and assumptions that affect the reported amounts of assets and liabilities at the date of the financial statements and the reported amounts of revenues and expenses during the reporting period including estimates and assumptions related to taxation. Actual results could differ from those estimates by a significant amount. In addition, the Fund monitors for material events or transactions that may occur or become known after the period-end date and before the date the financial statements are released to print. |
| H. | Indemnifications - Under the Trust’s organizational documents, each Trustee, officer, employee or other agent of the Trust is indemnified against certain liabilities that may arise out of the performance of their duties to the Fund. Additionally, in the normal course of business, the Fund enters into contracts, including the Fund’s servicing agreements, that contain a variety of indemnification clauses. The Fund’s maximum exposure under these arrangements is unknown as this would involve future claims that may be made against the Fund that have not yet occurred. The risk of material loss as a result of such indemnification claims is considered remote. |
| I. | Securities Lending - The Fund may lend portfolio securities having a market value up to one-third of the Fund’s total assets. Such loans are secured by collateral equal to no less than the market value of the loaned securities determined daily by the securities lending provider. Such collateral will be cash or debt securities issued or guaranteed by the U.S. Government or any of its sponsored agencies. Cash collateral received in connection with these loans is invested in short-term money market instruments or affiliated, unregistered investment companies that comply with Rule 2a-7 under the 1940 Act and money market funds (collectively, “affiliated money market funds”) and is shown as such on the Schedule of Investments. The Fund bears the risk of loss with respect to the investment of collateral. It is the Fund’s policy to obtain additional collateral from or return excess collateral to the borrower by the end of the next business day, following the valuation date of the securities loaned. Therefore, the value of the collateral held may be temporarily less than the value of the securities on loan. When loaning securities, the Fund retains certain benefits of owning the securities, including the economic equivalent of dividends or interest generated by the security. Lending securities entails a risk of loss to the Fund if, and to the extent that, the market value of the securities loaned were to increase and the borrower did not increase the collateral accordingly, and the borrower failed to return the securities. The securities loaned are subject to termination at the option of the borrower or the Fund. Upon termination, the borrower will return to the Fund the securities loaned and the Fund will return the collateral. Upon the failure of the borrower to return the securities, collateral may be liquidated and the securities may be purchased on the open market to replace the loaned securities. The Fund could experience delays and costs in gaining access to the collateral and the securities may lose value during the delay which could result in potential losses to the Fund. Some of these losses may be indemnified by the lending agent. The Fund bears the risk of any deficiency in the amount of the collateral available for return to the borrower due to any loss on the collateral invested. Dividends received on cash collateral investments for securities lending transactions, which are net of compensation to counterparties, are included in Dividends from affiliates on the Statement of Operations. The aggregate value of securities out on loan, if any, is shown as a footnote on the Statement of Assets and Liabilities. |
On September 29, 2021, the Board of Trustees appointed Invesco Advisers, Inc. (the “Adviser” or “Invesco”) to serve as an affiliated securities lending agent for the Fund. Prior to September 29, 2021, the Bank of New York Mellon (“BNYM”) served as the sole securities lending agent for the Fund under the securities lending program. BNYM also continues to serve as a lending agent. To the extent the Fund utilizes the Adviser as an affiliated securities lending agent, the Fund conducts its securities lending in accordance with, and in reliance upon, no-action letters issued by the SEC staff that provide guidance on how an affiliate may act
| | |
| 33 | | Invesco Corporate Bond Fund |
as a direct agent lender and receive compensation for those services in a manner consistent with the federal securities laws. For the year ended February 28, 2022, fees paid to the Adviser were less than $500.
| J. | Foreign Currency Translations - Foreign currency is valued at the close of the NYSE based on quotations posted by banks and major currency dealers. Portfolio securities and other assets and liabilities denominated in foreign currencies are translated into U.S. dollar amounts at the date of valuation. Purchases and sales of portfolio securities (net of foreign taxes withheld on disposition) and income items denominated in foreign currencies are translated into U.S. dollar amounts on the respective dates of such transactions. The Fund does not separately account for the portion of the results of operations resulting from changes in foreign exchange rates on investments and the fluctuations arising from changes in market prices of securities held. The combined results of changes in foreign exchange rates and the fluctuation of market prices on investments (net of estimated foreign tax withholding) are included with the net realized and unrealized gain or loss from investments in the Statement of Operations. Reported net realized foreign currency gains or losses arise from (1) sales of foreign currencies, (2) currency gains or losses realized between the trade and settlement dates on securities transactions, and (3) the difference between the amounts of dividends, interest, and foreign withholding taxes recorded on the Fund’s books and the U.S. dollar equivalent of the amounts actually received or paid. Net unrealized foreign currency gains and losses arise from changes in the fair values of assets and liabilities, other than investments in securities at fiscal period end, resulting from changes in exchange rates. |
The Fund may invest in foreign securities, which may be subject to foreign taxes on income, gains on investments or currency repatriation, a portion of which may be recoverable. Foreign taxes, if any, are recorded based on the tax regulations and rates that exist in the foreign markets in which the Fund invests and are shown in the Statement of Operations.
| K. | Forward Foreign Currency Contracts - The Fund may engage in foreign currency transactions either on a spot (i.e. for prompt delivery and settlement) basis, or through forward foreign currency contracts, to manage or minimize currency or exchange rate risk. |
The Fund may also enter into forward foreign currency contracts for the purchase or sale of a security denominated in a foreign currency in order to “lock in” the U.S. dollar price of that security, or the Fund may also enter into forward foreign currency contracts that do not provide for physical settlement of the two currencies, but instead are settled by a single cash payment calculated as the difference between the agreed upon exchange rate and the spot rate at settlement based upon an agreed upon notional amount (non-deliverable forwards). The Fund will set aside liquid assets in an amount equal to the daily mark-to-market obligation for forward foreign currency contracts.
A forward foreign currency contract is an obligation between two parties (“Counterparties”) to purchase or sell a specific currency for an agreed-upon price at a future date. The use of forward foreign currency contracts does not eliminate fluctuations in the price of the underlying securities the Fund owns or intends to acquire but establishes a rate of exchange in advance. Fluctuations in the value of these contracts are measured by the difference in the contract date and reporting date exchange rates and are recorded as unrealized appreciation (depreciation) until the contracts are closed. When the contracts are closed, realized gains (losses) are recorded. Realized and unrealized gains (losses) on the contracts are included in the Statement of Operations. The primary risks associated with forward foreign currency contracts include failure of the Counterparty to meet the terms of the contract and the value of the foreign currency changing unfavorably. These risks may be in excess of the amounts reflected in the Statement of Assets and Liabilities.
| L. | Futures Contracts - The Fund may enter into futures contracts to manage exposure to interest rate, equity and market price movements and/or currency risks. A futures contract is an agreement between Counterparties to purchase or sell a specified underlying security, currency or commodity (or delivery of a cash settlement price, in the case of an index future) for a fixed price at a future date. The Fund currently invests only in exchange-traded futures and they are standardized as to maturity date and underlying financial instrument. Initial margin deposits required upon entering into futures contracts are satisfied by the segregation of specific securities or cash as collateral at the futures commission merchant (broker). During the period the futures contracts are open, changes in the value of the contracts are recognized as unrealized gains or losses by recalculating the value of the contracts on a daily basis. Subsequent or variation margin payments are received or made depending upon whether unrealized gains or losses are incurred. These amounts are reflected as receivables or payables on the Statement of Assets and Liabilities. When the contracts are closed or expire, the Fund recognizes a realized gain or loss equal to the difference between the proceeds from, or cost of, the closing transaction and the Fund’s basis in the contract. The net realized gain (loss) and the change in unrealized gain (loss) on futures contracts held during the period is included on the Statement of Operations. The primary risks associated with futures contracts are market risk and the absence of a liquid secondary market. If the Fund were unable to liquidate a futures contract and/or enter into an offsetting closing transaction, the Fund would continue to be subject to market risk with respect to the value of the contracts and continue to be required to maintain the margin deposits on the futures contracts. Futures contracts have minimal Counterparty risk since the exchange’s clearinghouse, as Counterparty to all exchange-traded futures, guarantees the futures against default. Risks may exceed amounts recognized in the Statement of Assets and Liabilities. |
| M. | Call Options Purchased and Written - The Fund may write covered call options and/or buy call options. A covered call option gives the purchaser of such option the right to buy, and the writer the obligation to sell, the underlying security or foreign currency at the stated exercise price during the option period. Options written by the Fund normally will have expiration dates between three and nine months from the date written. The exercise price of a call option may be below, equal to, or above the current market value of the underlying security at the time the option is written. |
When the Fund writes a covered call option, an amount equal to the premium received by the Fund is recorded as an asset and an equivalent liability in the Statement of Assets and Liabilities. The amount of the liability is subsequently “marked-to-market” to reflect the current market value of the option written. If a written covered call option expires on the stipulated expiration date, or if the Fund enters into a closing purchase transaction, the Fund realizes a gain (or a loss if the closing purchase transaction exceeds the premium received when the option was written) without regard to any unrealized gain or loss on the underlying security, and the liability related to such option is extinguished. If a written covered call option is exercised, the Fund realizes a gain or a loss from the sale of the underlying security and the proceeds of the sale are increased by the premium originally received. Realized and unrealized gains and losses on call options written are included in the Statement of Operations as Net realized gain (loss) from and Change in net unrealized appreciation (depreciation) of Option contracts written. A risk in writing a covered call option is that the Fund gives up the opportunity for profit if the market price of the security increases and the option is exercised.
When the Fund buys a call option, an amount equal to the premium paid by the Fund is recorded as an investment on the Statement of Assets and Liabilities. The amount of the investment is subsequently “marked-to-market” to reflect the current value of the option purchased. Realized and unrealized gains and losses on call options purchased are included in the Statement of Operations as Net realized gain (loss) from and Change in net unrealized appreciation (depreciation) of Investment securities. A risk in buying an option is that the Fund pays a premium whether or not the option is exercised. In addition, there can be no assurance that a liquid secondary market will exist for any option purchased.
| N. | Swap Agreements - The Fund may enter into various swap transactions, including interest rate, total return, index, currency and credit default swap contracts (“CDS”) for investment purposes or to manage interest rate, currency or credit risk. Such transactions are agreements between Counterparties. A swap agreement may be negotiated bilaterally and traded over-the-counter (“OTC”) between two parties (“uncleared/ OTC”) or, in some instances, must be transacted through a future commission merchant (“FCM”) and cleared through a clearinghouse that serves as a central Counterparty (“centrally cleared swap”). These agreements may contain among other conditions, events of default and termination events, and various covenants and representations such as provisions that require the Fund to maintain a pre-determined level of net assets, and/ or provide limits regarding the decline of the Fund’s NAV over specific periods of time. If the Fund were to trigger such provisions and have open derivative positions at that time, the Counterparty may be able to terminate such agreement and request immediate payment in an amount equal to the net liability positions, if any. |
Interest rate, total return, index, and currency swap agreements are two-party contracts entered into primarily to exchange the returns (or differentials in rates of returns) earned or realized on particular predetermined investments or instruments. The gross returns to be exchanged or “swapped” between the parties
| | |
| 34 | | Invesco Corporate Bond Fund |
are calculated with respect to a notional amount, i.e., the return on or increase in value of a particular dollar amount invested at a particular interest rate or return of an underlying asset, in a particular foreign currency, or in a “basket” of securities representing a particular index.
In a centrally cleared swap, the Fund’s ultimate Counterparty is a central clearinghouse. The Fund initially will enter into centrally cleared swaps through an executing broker. When a fund enters into a centrally cleared swap, it must deliver to the central Counterparty (via the FCM) an amount referred to as “initial margin.” Initial margin requirements are determined by the central Counterparty, but an FCM may require additional initial margin above the amount required by the central Counterparty. Initial margin deposits required upon entering into centrally cleared swaps are satisfied by cash or securities as collateral at the FCM. Securities deposited as initial margin are designated on the Schedule of Investments and cash deposited is recorded on the Statement of Assets and Liabilities. During the term of a cleared swap agreement, a “variation margin” amount may be required to be paid by the Fund or may be received by the Fund, based on the daily change in price of the underlying reference instrument subject to the swap agreement and is recorded as a receivable or payable for variation margin in the Statement of Assets and Liabilities until the centrally cleared swap is terminated at which time a realized gain or loss is recorded.
A CDS is an agreement between Counterparties to exchange the credit risk of an issuer. A buyer of a CDS is said to buy protection by paying a fixed payment over the life of the agreement and in some situations an upfront payment to the seller of the CDS. If a defined credit event occurs (such as payment default or bankruptcy), the Fund as a protection buyer would cease paying its fixed payment, the Fund would deliver eligible bonds issued by the reference entity to the seller, and the seller would pay the full notional value, or the “par value”, of the referenced obligation to the Fund. A seller of a CDS is said to sell protection and thus would receive a fixed payment over the life of the agreement and an upfront payment, if applicable. If a credit event occurs, the Fund as a protection seller would cease to receive the fixed payment stream, the Fund would pay the buyer “par value” or the full notional value of the referenced obligation, and the Fund would receive the eligible bonds issued by the reference entity. In turn, these bonds may be sold in order to realize a recovery value. Alternatively, the seller of the CDS and its Counterparty may agree to net the notional amount and the market value of the bonds and make a cash payment equal to the difference to the buyer of protection. If no credit event occurs, the Fund receives the fixed payment over the life of the agreement. As the seller, the Fund would effectively add leverage to its portfolio because, in addition to its total net assets, the Fund would be subject to investment exposure on the notional amount of the CDS. In connection with these agreements, cash and securities may be identified as collateral in accordance with the terms of the respective swap agreements to provide assets of value and recourse in the event of default under the swap agreement or bankruptcy/insolvency of a party to the swap agreement. If a Counterparty becomes bankrupt or otherwise fails to perform its obligations due to financial difficulties, the Fund may experience significant delays in obtaining any recovery in a bankruptcy or other reorganization proceeding. The Fund may obtain only limited recovery or may obtain no recovery in such circumstances. The Fund’s maximum risk of loss from Counterparty risk, either as the protection seller or as the protection buyer, is the value of the contract. The risk may be mitigated by having a master netting arrangement between the Fund and the Counterparty and by the designation of collateral by the Counterparty to cover the Fund’s exposure to the Counterparty.
Implied credit spreads represent the current level at which protection could be bought or sold given the terms of the existing CDS contract and serve as an indicator of the current status of the payment/performance risk of the CDS. An implied spread that has widened or increased since entry into the initial contract may indicate a deteriorating credit profile and increased risk of default for the reference entity. A declining or narrowing spread may indicate an improving credit profile or decreased risk of default for the reference entity. Alternatively, credit spreads may increase or decrease reflecting the general tolerance for risk in the credit markets.
An interest rate swap is an agreement between Counterparties pursuant to which the parties exchange a floating rate payment for a fixed rate payment based on a specified notional amount.
Changes in the value of centrally cleared and OTC swap agreements are recognized as unrealized gains (losses) in the Statement of Operations by “marking to market” on a daily basis to reflect the value of the swap agreement at the end of each trading day. Payments received or paid at the beginning of the agreement are reflected as such on the Statement of Assets and Liabilities and may be referred to as upfront payments. The Fund accrues for the fixed payment stream and amortizes upfront payments, if any, on swap agreements on a daily basis with the net amount, recorded as a component of realized gain (loss) on the Statement of Operations. A liquidation payment received or made at the termination of a swap agreement is recorded as realized gain (loss) on the Statement of Operations. The Fund segregates cash or liquid securities having a value at least equal to the amount of the potential obligation of a Fund under any swap transaction. Cash held as collateral is recorded as deposits with brokers on the Statement of Assets and Liabilities. Entering into these agreements involves, to varying degrees, lack of liquidity and elements of credit, market, and Counterparty risk in excess of amounts recognized on the Statement of Assets and Liabilities. Such risks involve the possibility that a swap is difficult to sell or liquidate; the Counterparty does not honor its obligations under the agreement and unfavorable interest rates and market fluctuations. It is possible that developments in the swaps market, including potential government regulation, could adversely affect the Fund’s ability to terminate existing swap agreements or to realize amounts to be received under such agreements. Additionally, an International Swaps and Derivatives Association Master Agreement (“ISDA Master Agreement”) includes credit related contingent features which allow Counterparties to OTC derivatives to terminate derivative contracts prior to maturity in the event that, for example, the Fund’s net assets decline by a stated percentage or the Fund fails to meet the terms of its ISDA Master Agreement, which would cause the Fund to accelerate payment of any net liability owed to the Counterparty. A short position in a security poses more risk than holding the same security long. As there is no limit on how much the price of the security can increase, the Fund’s exposure is unlimited.
Notional amounts of each individual credit default swap agreement outstanding as of February 28, 2022, if any, for which the Fund is the seller of protection are disclosed in the open swap agreements table. These potential amounts would be partially offset by any recovery values of the respective referenced obligations, upfront payments received upon entering into the agreement, or net amounts received from the settlement of buy protection credit default swap agreements entered into by the Fund for the same referenced entity or entities.
| O. | LIBOR Risk - The Fund may have investments in financial instruments that utilize the London Interbank Offered Rate (“LIBOR”) as the reference or benchmark rate for variable interest rate calculations. LIBOR is intended to measure the rate generally at which banks can lend and borrow from one another in the relevant currency on an unsecured basis. The UK Financial Conduct Authority (FCA), the regulator that oversees LIBOR, announced that the majority of LIBOR rates would cease to be published or would no longer be representative on January 1, 2022. Although the publication of most LIBOR rates ceased at the end of 2021, a selection of widely used USD LIBOR rates continues to be published until June 2023 to allow for an orderly transition away from these rates. |
There remains uncertainty and risks relating to the continuing LIBOR transition and its effects on the Fund and the instruments in which the Fund invests. There can be no assurance that the composition or characteristics of any alternative reference rates (“ARRs”) or financial instruments in which the Fund invests that utilize ARRs will be similar to or produce the same value or economic equivalence as LIBOR or that these instruments will have the same volume or liquidity. Additionally, there remains uncertainty and risks relating to certain “legacy” USD LIBOR instruments that were issued or entered into before December 31, 2021 and the process by which a replacement interest rate will be identified and implemented into these instruments when USD LIBOR is ultimately discontinued. The effects of such uncertainty and risks in “legacy” USD LIBOR instruments held by the Fund could result in losses to the Fund.
| P. | Leverage Risk - Leverage exists when the Fund can lose more than it originally invests because it purchases or sells an instrument or enters into a transaction without investing an amount equal to the full economic exposure of the instrument or transaction. |
| Q. | Collateral - To the extent the Fund has designated or segregated a security as collateral and that security is subsequently sold, it is the Fund’s practice to replace such collateral no later than the next business day. This practice does not apply to securities pledged as collateral for securities lending transactions. |
| R. | Other Risks - Active trading of portfolio securities may result in added expenses, a lower return and increased tax liability. |
The current low interest rate environment was created in part by the Federal Reserve Board (FRB) and certain foreign central banks keeping the federal funds and equivalent foreign rates near historical lows. Increases in the federal funds and equivalent foreign rates may expose fixed income markets to heightened volatility and reduced liquidity for certain fixed income investments, particularly those with longer maturities. In addition, decreases in fixed income dealer
| | |
| 35 | | Invesco Corporate Bond Fund |
market-making capacity may also potentially lead to heightened volatility and reduced liquidity in the fixed income markets. As a result, the value of the Fund’s investments and share price may decline. Changes in central bank policies could also result in higher than normal shareholder redemptions, which could potentially increase portfolio turnover and the Fund’s transaction costs. Additionally, from time to time, uncertainty regarding the status of negotiations in the U.S. Government to increase the statutory debt limit, commonly called the “debt ceiling”, could increase the risk that the U.S. Government may default on payments on certain U.S. Government securities, cause the credit rating of the U.S. Government to be downgraded, increase volatility in the stock and bond markets, result in higher interest rates, reduce prices of U.S. Treasury securities, and/or increase the costs of various kinds of debt. If a U.S. Government-sponsored entity is negatively impacted by legislative or regulatory action, is unable to meet its obligations, or its creditworthiness declines, the performance of a Fund that holds securities of that entity will be adversely impacted.
| S. | COVID-19 Risk - The COVID-19 strain of coronavirus has resulted in instances of market closures and dislocations, extreme volatility, liquidity constraints and increased trading costs. Efforts to contain its spread have resulted in travel restrictions, disruptions of healthcare systems, business operations (including business closures) and supply chains, layoffs, lower consumer demand and employee availability, and defaults and credit downgrades, among other significant economic impacts that have disrupted global economic activity across many industries. Such economic impacts may exacerbate other pre-existing political, social and economic risks locally or globally and cause general concern and uncertainty. |
The full economic impact and ongoing effects of COVID-19 (or other future epidemics or pandemics) at the macro-level and on individual businesses are unpredictable and may result in significant and prolonged effects on the Fund’s performance.
NOTE 2–Advisory Fees and Other Fees Paid to Affiliates
The Trust has entered into a master investment advisory agreement with the Adviser. Under the terms of the investment advisory agreement, the Fund accrues daily and pays monthly an advisory fee to the Adviser based on the annual rate of the Fund’s average daily net assets as follows:
| | | | |
| Average Daily Net Assets | | Rate | |
|
| |
First $500 million | | | 0.420% | |
|
| |
Next $750 million | | | 0.350% | |
|
| |
Over $1.25 billion | | | 0.220% | |
|
| |
For the year ended February 28, 2022, the effective advisory fee rate incurred by the Fund was 0.29%.
Under the terms of a master sub-advisory agreement between the Adviser and each of Invesco Asset Management Deutschland GmbH, Invesco Asset Management Limited, Invesco Asset Management (Japan) Limited, Invesco Hong Kong Limited, Invesco Senior Secured Management, Inc. and Invesco Canada Ltd. (collectively, the “Affiliated Sub-Advisers”) the Adviser, not the Fund, will pay 40% of the fees paid to the Adviser to any such Affiliated Sub-Adviser(s) that provide(s) discretionary investment management services to the Fund based on the percentage of assets allocated to such Affiliated Sub-Adviser(s).
The Adviser has contractually agreed, through at least June 30, 2022, to waive advisory fees and/or reimburse expenses of all shares to the extent necessary to limit total annual fund operating expenses after fee waiver and/or expense reimbursement (excluding certain items discussed below) of Class A, Class C, Class R, Class Y, Class R5 and Class R6 shares to 1.50%, 2.25%, 1.75%, 1.25%, 1.25% and 1.25%, respectively, of the Fund’s average daily net assets (the “expense limits”). In determining the Adviser’s obligation to waive advisory fees and/or reimburse expenses, the following expenses are not taken into account, and could cause the total annual fund operating expenses after fee waiver and/or reimbursement to exceed the numbers reflected above: (1) interest; (2) taxes; (3) dividend expense on short sales; (4) extraordinary or non-routine items, including litigation expenses; and (5) expenses that the Fund has incurred but did not actually pay because of an expense offset arrangement. Unless Invesco continues the fee waiver agreement, it will terminate on June 30, 2022. During its term, the fee waiver agreement cannot be terminated or amended to increase the expense limits or reduce the advisory fee waivers without approval of the Board of Trustees. The Adviser did not waive fees and/or reimburse expenses during the period under this expense limit.
Further, the Adviser has contractually agreed, through at least June 30, 2023, to waive the advisory fee payable by the Fund in an amount equal to 100% of the net advisory fees the Adviser receives from the affiliated money market funds on investments by the Fund of uninvested cash (excluding investments of cash collateral from securities lending) in such affiliated money market funds.
For the year ended February 28, 2022, the Adviser waived advisory fees of $42,278.
The Trust has entered into a master administrative services agreement with Invesco pursuant to which the Fund has agreed to pay Invesco for certain administrative costs incurred in providing accounting services to the Fund. For the year ended February 28, 2022, expenses incurred under the agreement are shown in the Statement of Operations as Administrative services fees. Invesco has entered into a sub-administration agreement whereby State Street Bank and Trust Company (“SSB”) serves as fund accountant and provides certain administrative services to the Fund. Pursuant to a custody agreement with the Trust on behalf of the Fund, SSB also serves as the Fund’s custodian.
The Trust has entered into a transfer agency and service agreement with Invesco Investment Services, Inc. (“IIS”) pursuant to which the Fund has agreed to pay IIS a fee for providing transfer agency and shareholder services to the Fund and reimburse IIS for certain expenses incurred by IIS in the course of providing such services. IIS may make payments to intermediaries that provide omnibus account services, sub-accounting services and/or networking services. All fees payable by IIS to intermediaries that provide omnibus account services or sub-accounting services are charged back to the Fund, subject to certain limitations approved by the Trust’s Board of Trustees. For the year ended February 28, 2022, expenses incurred under the agreement are shown in the Statement of Operations as Transfer agent fees.
Shares of the Fund are distributed by Invesco Distributors, Inc. (“IDI”). The Fund has adopted a distribution plan pursuant to Rule 12b-1 under the 1940 Act, and a service plan (collectively, the “Plans”) for Class A, Class C and Class R shares. The Fund, pursuant to the Plans, pays IDI compensation at the annual rate of 0.50% of the Fund’s average daily net assets of Class R shares. The Fund, pursuant to the Plans, reimburses IDI for its allocated share of expenses incurred for the period, up to a maximum annual rate of 25% of the Fund’s average daily net assets of Class A shares and up to a maximum annual rate of 1.00% of the Fund’s average daily net assets of Class C shares. The fees are accrued daily and paid monthly. Of the Plan payments, up to 0.25% of the average daily net assets of each class of shares may be paid to furnish continuing personal shareholder services to customers who purchase and own shares of such classes. Any amounts not paid as a service fee under the Plan would constitute an asset-based sales charge. Rules of the Financial Industry Regulatory Authority (“FINRA”) impose a cap on the total sales charges, including asset-based sales charges, that may be paid by any class of shares of the Fund.
For the year ended February 28, 2022, expenses incurred under these agreements are shown in the Statement of Operations as Distribution fees.
Front-end sales commissions and CDSC (collectively, the “sales charges”) are not recorded as expenses of the Fund. Front-end sales commissions are deducted from proceeds from the sales of Fund shares prior to investment in Class A shares of the Fund. CDSC are deducted from redemption proceeds prior to remittance to the shareholder. During the year ended February 28, 2022, IDI advised the Fund that IDI retained $176,002 in front-end sales commissions from the sale of Class A shares and $13,636 and $4,993 from Class A and Class C shares, respectively, for CDSC imposed upon redemptions by shareholders.
Certain officers and trustees of the Trust are officers and directors of the Adviser, IIS and/or IDI.
NOTE 3–Additional Valuation Information
GAAP defines fair value as the price that would be received to sell an asset or paid to transfer a liability in an orderly transaction between market participants at the measurement date, under current market conditions. GAAP establishes a hierarchy that prioritizes the inputs to valuation methods, giving the highest priority to readily
| | |
| 36 | | Invesco Corporate Bond Fund |
available unadjusted quoted prices in an active market for identical assets (Level 1) and the lowest priority to significant unobservable inputs (Level 3), generally when market prices are not readily available or are unreliable. Based on the valuation inputs, the securities or other investments are tiered into one of three levels. Changes in valuation methods may result in transfers in or out of an investment’s assigned level:
| | |
| Level 1 – | | Prices are determined using quoted prices in an active market for identical assets. |
| Level 2 – | | Prices are determined using other significant observable inputs. Observable inputs are inputs that other market participants may use in pricing a security. These may include quoted prices for similar securities, interest rates, prepayment speeds, credit risk, yield curves, loss severities, default rates, discount rates, volatilities and others. |
| Level 3 – | | Prices are determined using significant unobservable inputs. In situations where quoted prices or observable inputs are unavailable (for example, when there is little or no market activity for an investment at the end of the period), unobservable inputs may be used. Unobservable inputs reflect the Fund’s own assumptions about the factors market participants would use in determining fair value of the securities or instruments and would be based on the best available information. |
The following is a summary of the tiered valuation input levels, as of February 28, 2022. The level assigned to the securities valuations may not be an indication of the risk or liquidity associated with investing in those securities. Because of the inherent uncertainties of valuation, the values reflected in the financial statements may materially differ from the value received upon actual sale of those investments.
| | | | | | | | | | | | | | | | |
| | | Level 1 | | | Level 2 | | | Level 3 | | | Total | |
|
| |
Investments in Securities | | | | | | | | | | | | | | | | |
|
| |
U.S. Dollar Denominated Bonds & Notes | | $ | – | | | $ | 2,572,922,166 | | | $ | 11,509,549 | | | $ | 2,584,431,715 | |
|
| |
U.S. Treasury Securities | | | – | | | | 146,247,683 | | | | – | | | | 146,247,683 | |
|
| |
Preferred Stocks | | | 33,132,838 | | | | 47,732,033 | | | | – | | | | 80,864,871 | |
|
| |
Asset-Backed Securities | | | – | | | | 22,732,281 | | | | 3,914,435 | | | | 26,646,716 | |
|
| |
Municipal Obligations | | | – | | | | 6,177,796 | | | | 70,004 | | | | 6,247,800 | |
|
| |
Exchange-Traded Funds | | | 5,394,000 | | | | – | | | | – | | | | 5,394,000 | |
|
| |
Variable Rate Senior Loan Interests | | | – | | | | – | | | | 5,065,045 | | | | 5,065,045 | |
|
| |
Non-U.S. Dollar Denominated Bonds & Notes | | | – | | | | 4,266,582 | | | | – | | | | 4,266,582 | |
|
| |
Money Market Funds | | | 24,879,204 | | | | 242,554,351 | | | | – | | | | 267,433,555 | |
|
| |
Options Purchased | | | 1,690,629 | | | | – | | | | – | | | | 1,690,629 | |
|
| |
Total Investments in Securities | | | 65,096,671 | | | | 3,042,632,892 | | | | 20,559,033 | | | | 3,128,288,596 | |
|
| |
| | | | |
Other Investments - Assets* | | | | | | | | | | | | | | | | |
|
| |
Futures Contracts | | | 3,902,023 | | | | – | | | | – | | | | 3,902,023 | |
|
| |
Forward Foreign Currency Contracts | | | – | | | | 1,203,020 | | | | – | | | | 1,203,020 | |
|
| |
| | | 3,902,023 | | | | 1,203,020 | | | | – | | | | 5,105,043 | |
|
| |
| | | | |
Other Investments - Liabilities* | | | | | | | | | | | | | | | | |
|
| |
Futures Contracts | | | (4,355,469 | ) | | | – | | | | – | | | | (4,355,469 | ) |
|
| |
Forward Foreign Currency Contracts | | | – | | | | (437,388 | ) | | | – | | | | (437,388 | ) |
|
| |
Options Written | | | (487,480 | ) | | | – | | | | – | | | | (487,480 | ) |
|
| |
| | | (4,842,949 | ) | | | (437,388 | ) | | | – | | | | (5,280,337 | ) |
|
| |
Total Other Investments | | | (940,926 | ) | | | 765,632 | | | | – | | | | (175,294 | ) |
|
| |
Total Investments | | $ | 64,155,745 | | | $ | 3,043,398,524 | | | $ | 20,559,033 | | | $ | 3,128,113,302 | |
|
| |
| * | Futures contracts and forward foreign currency contracts are valued at unrealized appreciation (depreciation). Options written are shown at value. |
NOTE 4–Derivative Investments
The Fund may enter into an ISDA Master Agreement under which a fund may trade OTC derivatives. An OTC transaction entered into under an ISDA Master Agreement typically involves a collateral posting arrangement, payment netting provisions and close-out netting provisions. These netting provisions allow for reduction of credit risk through netting of contractual obligations. The enforceability of the netting provisions of the ISDA Master Agreement depends on the governing law of the ISDA Master Agreement, among other factors.
For financial reporting purposes, the Fund does not offset OTC derivative assets or liabilities that are subject to ISDA Master Agreements in the Statement of Assets and Liabilities.
Value of Derivative Investments at Period-End
The table below summarizes the value of the Fund’s derivative investments, detailed by primary risk exposure, held as of February 28, 2022:
| | | | | | | | | | | | | | | | |
| | | Value | |
| Derivative Assets | | Currency
Risk | | | Equity Risk | | | Interest
Rate Risk | | | Total | |
|
| |
Unrealized appreciation on futures contracts – Exchange-Traded(a) | | $ | - | | | $ | - | | | $ | 3,902,023 | | | $ | 3,902,023 | |
|
| |
Unrealized appreciation on forward foreign currency contracts outstanding | | | 1,203,020 | | | | - | | | | - | | | | 1,203,020 | |
|
| |
Options purchased, at value – Exchange-Traded(b) | | | - | | | | 1,690,629 | | | | - | | | | 1,690,629 | |
|
| |
Total Derivative Assets | | | 1,203,020 | | | | 1,690,629 | | | | 3,902,023 | | | | 6,795,672 | |
|
| |
Derivatives not subject to master netting agreements | | | - | | | | (1,690,629 | ) | | | (3,902,023 | ) | | | (5,592,652 | ) |
|
| |
Total Derivative Assets subject to master netting agreements | | $ | 1,203,020 | | | $ | - | | | $ | - | | | $ | 1,203,020 | |
|
| |
| | |
| 37 | | Invesco Corporate Bond Fund |
| | | | | | | | | | | | | | | | |
| | | Value | |
| Derivative Liabilities | | Currency
Risk | | | Equity
Risk | | | Interest
Rate Risk | | | Total | |
|
| |
Unrealized depreciation on futures contracts – Exchange-Traded(a) | | $ | - | | | $ | - | | | $ | (4,355,469 | ) | | $ | (4,355,469 | ) |
|
| |
Unrealized depreciation on forward foreign currency contracts outstanding | | | (437,388 | ) | | | - | | | | - | | | | (437,388 | ) |
|
| |
Options written, at value – Exchange-Traded | | | - | | | | (487,480 | ) | | | - | | | | (487,480 | ) |
|
| |
Total Derivative Liabilities | | | (437,388 | ) | | | (487,480 | ) | | | (4,355,469 | ) | | | (5,280,337 | ) |
|
| |
Derivatives not subject to master netting agreements | | | - | | | | 487,480 | | | | 4,355,469 | | | | 4,842,949 | |
|
| |
Total Derivative Liabilities subject to master netting agreements | | $ | (437,388 | ) | | $ | - | | | $ | - | | | $ | (437,388 | ) |
|
| |
| (a) | The daily variation margin receivable (payable) at period-end is recorded in the Statement of Assets and Liabilities. |
| (b) | Options purchased, at value as reported in the Schedule of Investments. |
Offsetting Assets and Liabilities
The table below reflects the Fund’s exposure to Counterparties subject to either an ISDA Master Agreement or other agreement for OTC derivative transactions as of February 28, 2022.
| | | | | | | | | | | | | | | | | | |
| | | Financial
Derivative
Assets | | | Financial
Derivative
Liabilities | | | | | Collateral
(Received)/Pledged | | | |
| Counterparty | | Forward Foreign
Currency Contracts | | | Forward Foreign
Currency Contracts | | Net Value of
Derivatives | | | Non-Cash | | Cash | | Net
Amount | |
|
| |
Citibank, N.A. | | | $ 21,454 | | | $(223,558) | | $ | (202,104 | ) | | $– | | $– | | $ | (202,104 | ) |
|
| |
Goldman Sachs International | | | 1,181,566 | | | (213,830) | | | 967,736 | | | – | | – | | | 967,736 | |
|
| |
Total | | | $1,203,020 | | | $(437,388) | | $ | 765,632 | | | $– | | $– | | $ | 765,632 | |
|
| |
Effect of Derivative Investments for the year ended February 28, 2022
The table below summarizes the gains (losses) on derivative investments, detailed by primary risk exposure, recognized in earnings during the period:
| | | | | | | | | | | | | | | | | | | | |
| | | Location of Gain (Loss) on
Statement of Operations | |
| | | Credit Risk | | | Currency Risk | | | Equity Risk | | | Interest Rate Risk | | | Total | |
|
| |
Realized Gain (Loss): | | | | | | | | | | | | | | | | | | | | |
Forward foreign currency contracts | | $ | - | | | $ | 837,632 | | | $ | - | | | $ | - | | | $ | 837,632 | |
|
| |
Futures contracts | | | - | | | | - | | | | - | | | | (6,654,299 | ) | | | (6,654,299 | ) |
|
| |
Options purchased(a) | | | - | | | | (706,401 | ) | | | 3,856,680 | | | | - | | | | 3,150,279 | |
|
| |
Options written | | | - | | | | 84,037 | | | | (576,337 | ) | | | 1,109,429 | | | | 617,129 | |
|
| |
Swap agreements | | | (342,703 | ) | | | - | | | | - | | | | - | | | | (342,703 | ) |
|
| |
Change in Net Unrealized Appreciation (Depreciation): | | | | | | | | | | | | | | | | | | | | |
Forward foreign currency contracts | | | - | | | | 697,062 | | | | - | | | | - | | | | 697,062 | |
|
| |
Futures contracts | | | - | | | | - | | | | - | | | | (1,888,954 | ) | | | (1,888,954 | ) |
|
| |
Options purchased(a) | | | - | | | | - | | | | 1,229,975 | | | | - | | | | 1,229,975 | |
|
| |
Options written | | | - | | | | - | | | | (255,401 | ) | | | - | | | | (255,401 | ) |
|
| |
Total | | $ | (342,703 | ) | | $ | 912,330 | | | $ | 4,254,917 | | | $ | (7,433,824 | ) | | $ | (2,609,280 | ) |
|
| |
| (a) | Options purchased are included in the net realized gain (loss) from investment securities and the change in net unrealized appreciation (depreciation) of investment securities. |
The table below summarizes the average notional value of derivatives held during the period.
| | | | | | | | | | | | | | | | | | | | | | | | | | | | | | | | | | | | | | | | |
| | | Forward
Foreign Currency
Contracts | | | Futures
Contracts | | | Equity
Options
Purchased | | | Index
Options
Purchased | | | Foreign
Currency
Options
Purchased | | | Equity
Options
Written | | | Index
Options
Written | | | Swaptions
Written | | | Foreign
Currency
Options
Written | | | Swap
Agreements | |
|
| |
Average notional value | | | $41,864,021 | | | $ | 1,098,561,199 | | | $ | 26,283,163 | | | $ | 35,576,042 | | | $ | 108,083,645 | | | $ | 27,302,909 | | | $ | 34,010,000 | | | $ | 62,336,800 | | | $ | 56,250,000 | | | $ | 54,398,403 | |
|
| |
Average contracts | | | – | | | | – | | | | 4,723 | | | | 80 | | | | – | | | | 4,227 | | | | 71 | | | | – | | | | – | | | | – | |
|
| |
NOTE 5–Expense Offset Arrangement(s)
The expense offset arrangement is comprised of transfer agency credits which result from balances in demand deposit accounts used by the transfer agent for clearing shareholder transactions. For the year ended February 28, 2022, the Fund received credits from this arrangement, which resulted in the reduction of the Fund’s total expenses of $877.
| | |
| 38 | | Invesco Corporate Bond Fund |
NOTE 6–Trustees’ and Officers’ Fees and Benefits
Trustees’ and Officers’ Fees and Benefits include amounts accrued by the Fund to pay remuneration to certain Trustees and Officers of the Fund. Trustees have the option to defer compensation payable by the Fund, and Trustees’ and Officers’ Fees and Benefits also include amounts accrued by the Fund to fund such deferred compensation amounts. Those Trustees who defer compensation have the option to select various Invesco Funds in which their deferral accounts shall be deemed to be invested. Finally, certain current Trustees were eligible to participate in a retirement plan that provided for benefits to be paid upon retirement to Trustees over a period of time based on the number of years of service. The Fund may have certain former Trustees who also participate in a retirement plan and receive benefits under such plan. Trustees’ and Officers’ Fees and Benefits include amounts accrued by the Fund to fund such retirement benefits. Obligations under the deferred compensation and retirement plans represent unsecured claims against the general assets of the Fund.
NOTE 7–Cash Balances
The Fund is permitted to temporarily carry a negative or overdrawn balance in its account with SSB, the custodian bank. Such balances, if any at period-end, are shown in the Statement of Assets and Liabilities under the payable caption Amount due custodian. To compensate the custodian bank for such overdrafts, the overdrawn Fund may either (1) leave funds as a compensating balance in the account so the custodian bank can be compensated by earning the additional interest; or (2) compensate by paying the custodian bank at a rate agreed upon by the custodian bank and Invesco, not to exceed the contractually agreed upon rate. The Fund may not purchase additional securities when any borrowings from banks or broker-dealers exceed 5% of the Fund’s total assets, or when any borrowings from an Invesco Fund are outstanding.
NOTE 8–Distributions to Shareholders and Tax Components of Net Assets
Tax Character of Distributions to Shareholders Paid During the Fiscal Years Ended February 28, 2022 and 2021:
| | | | | | | | |
| | | 2022 | | | 2021 | |
|
| |
Ordinary income* | | $ | 106,646,519 | | | $ | 139,786,948 | |
|
| |
Long-term capital gain | | | 38,338,300 | | | | 5,564,564 | |
|
| |
Total distributions | | $ | 144,984,819 | | | $ | 145,351,512 | |
|
| |
| * | Includes short-term capital gain distributions, if any. |
Tax Components of Net Assets at Period-End:
| | | | |
| | | 2022 | |
|
| |
Undistributed ordinary income | | $ | 637,104 | |
|
| |
Net unrealized appreciation (depreciation) – investments | | | (108,065,660 | ) |
|
| |
Net unrealized appreciation (depreciation) – foreign currencies | | | (11,478 | ) |
|
| |
Temporary book/tax differences | | | (139,895 | ) |
|
| |
Post-October capital loss deferral | | | (10,062,517 | ) |
|
| |
Shares of beneficial interest | | | 3,029,879,459 | |
|
| |
Total net assets | | $ | 2,912,237,013 | |
|
| |
The difference between book-basis and tax-basis unrealized appreciation (depreciation) is due to differences in the timing of recognition of gains and losses on investments for tax and book purposes. The Fund’s net unrealized appreciation (depreciation) difference is attributable primarily to derivative instruments, straddles, amortization and accretion on debt securities.
The temporary book/tax differences are a result of timing differences between book and tax recognition of income and/or expenses. The Fund’s temporary book/tax differences are the result of the trustee deferral of compensation and retirement plan benefits.
Capital loss carryforward is calculated and reported as of a specific date. Results of transactions and other activity after that date may affect the amount of capital loss carryforward actually available for the Fund to utilize. The ability to utilize capital loss carryforward in the future may be limited under the Internal Revenue Code and related regulations based on the results of future transactions.
The Fund does not have a capital loss carryforward as of February 28, 2022.
NOTE 9–Investment Transactions
The aggregate amount of investment securities (other than short-term securities, U.S. Government obligations and money market funds, if any) purchased and sold by the Fund during the year ended February 28, 2022 was $2,165,009,131 and $1,660,894,901, respectively. Cost of investments, including any derivatives, on a tax basis includes the adjustments for financial reporting purposes as of the most recently completed federal income tax reporting period-end.
| | | | |
Unrealized Appreciation (Depreciation) of Investments on a Tax Basis | |
Aggregate unrealized appreciation of investments | | | $56,091,508 | |
|
| |
Aggregate unrealized (depreciation) of investments | | | (164,157,168 | ) |
|
| |
Net unrealized appreciation (depreciation) of investments | | | $(108,065,660 | ) |
|
| |
Cost of investments for tax purposes is $3,236,178,962. | | | | |
NOTE 10–Reclassification of Permanent Differences
Primarily as a result of differing book/tax treatment of distributions, foreign currency transactions, derivative instruments, amortization and accretion on debt securities, on February 28, 2022, undistributed net investment income was increased by $1,363,663 and undistributed net realized gain (loss) was decreased by $1,363,663. This reclassification had no effect on the net assets or the distributable earnings (loss) of the Fund.
| | |
| 39 | | Invesco Corporate Bond Fund |
NOTE 11–Share Information
| | | | | | | | | | | | | | | | |
| | | Summary of Share Activity | |
|
| |
| | |
| | | Year ended | | | Year ended | |
| | | February 28, 2022(a) | | | February 28, 2021 | |
| | | Shares | | | Amount | | | Shares | | | Amount | |
|
| |
Sold: | | | | | | | | | | | | | | | | |
Class A | | | 32,438,345 | | | $ | 251,450,399 | | | | 42,426,949 | | | $ | 329,987,090 | |
|
| |
Class C | | | 1,188,953 | | | | 9,315,146 | | | | 3,264,279 | | | | 25,393,841 | |
|
| |
Class R | | | 758,550 | | | | 5,846,005 | | | | 773,452 | | | | 5,957,853 | |
|
| |
Class Y | | | 51,395,738 | | | | 398,167,587 | | | | 57,457,299 | | | | 442,795,202 | |
|
| |
Class R5 | | | 795,926 | | | | 6,160,820 | | | | 1,104,999 | | | | 8,728,618 | |
|
| |
Class R6 | | | 66,002,220 | | | | 512,181,475 | | | | 27,744,665 | | | | 216,580,860 | |
|
| |
| | | | |
Issued as reinvestment of dividends: | | | | | | | | | | | | | | | | |
Class A | | | 7,608,578 | | | | 58,333,573 | | | | 8,590,964 | | | | 67,200,792 | |
|
| |
Class C | | | 252,111 | | | | 1,947,156 | | | | 373,451 | | | | 2,949,384 | |
|
| |
Class R | | | 79,476 | | | | 608,989 | | | | 85,384 | | | | 667,766 | |
|
| |
Class Y | | | 2,832,647 | | | | 21,743,742 | | | | 2,560,753 | | | | 20,141,227 | |
|
| |
Class R5 | | | 111,498 | | | | 857,095 | | | | 90,723 | | | | 712,329 | |
|
| |
Class R6 | | | 5,709,398 | | | | 43,825,549 | | | | 4,509,781 | | | | 35,354,372 | |
|
| |
| | | | |
Automatic conversion of Class C shares to Class A shares: | | | | | | | | | | | | | | | | |
Class A | | | 584,512 | | | | 4,493,163 | | | | 1,357,383 | | | | 10,710,890 | |
|
| |
Class C | | | (580,247 | ) | | | (4,493,163 | ) | | | (1,345,849 | ) | | | (10,710,890 | ) |
|
| |
| | | | |
Reacquired: | | | | | | | | | | | | | | | | |
Class A | | | (31,292,482 | ) | | | (240,777,345 | ) | | | (37,298,221 | ) | | | (286,418,741 | ) |
|
| |
Class C | | | (2,035,330 | ) | | | (15,728,958 | ) | | | (2,449,613 | ) | | | (18,806,912 | ) |
|
| |
Class R | | | (428,914 | ) | | | (3,306,171 | ) | | | (937,974 | ) | | | (7,157,616 | ) |
|
| |
Class Y | | | (37,370,286 | ) | | | (287,130,140 | ) | | | (40,319,234 | ) | | | (305,777,369 | ) |
|
| |
Class R5 | | | (659,521 | ) | | | (5,113,828 | ) | | | (443,245 | ) | | | (3,357,205 | ) |
|
| |
Class R6 | | | (24,361,546 | ) | | | (186,547,104 | ) | | | (17,109,553 | ) | | | (130,416,734 | ) |
|
| |
Net increase in share activity | | | 73,029,626 | | | $ | 571,833,990 | | | | 50,436,393 | | | $ | 404,534,757 | |
|
| |
| (a) | There are entities that are record owners of more than 5% of the outstanding shares of the Fund and in the aggregate own 68% of the outstanding shares of the Fund. IDI has an agreement with these entities to sell Fund shares. The Fund, Invesco and/or Invesco affiliates may make payments to these entities, which are considered to be related to the Fund, for providing services to the Fund, Invesco and/or Invesco affiliates including but not limited to services such as securities brokerage, distribution, third party record keeping and account servicing. The Fund has no knowledge as to whether all or any portion of the shares owned of record by these entities are also owned beneficially. |
| | |
| 40 | | Invesco Corporate Bond Fund |
Report of Independent Registered Public Accounting Firm
To the Board of Trustees of AIM Investment Securities Funds (Invesco Investment Securities Funds) and Shareholders of Invesco Corporate Bond Fund
Opinion on the Financial Statements
We have audited the accompanying statement of assets and liabilities, including the schedule of investments, of Invesco Corporate Bond Fund (one of the funds constituting AIM Investment Securities Funds (Invesco Investment Securities Funds), referred to hereafter as the “Fund”) as of February 28, 2022, the related statement of operations for the year ended February 28, 2022, the statement of changes in net assets for each of the two years in the period ended February 28, 2022, including the related notes, and the financial highlights for each of the five years in the period ended February 28, 2022 (collectively referred to as the “financial statements”). In our opinion, the financial statements present fairly, in all material respects, the financial position of the Fund as of February 28, 2022, the results of its operations for the year then ended, the changes in its net assets for each of the two years in the period ended February 28, 2022 and the financial highlights for each of the five years in the period ended February 28, 2022 in conformity with accounting principles generally accepted in the United States of America.
Basis for Opinion
These financial statements are the responsibility of the Fund’s management. Our responsibility is to express an opinion on the Fund’s financial statements based on our audits. We are a public accounting firm registered with the Public Company Accounting Oversight Board (United States) (PCAOB) and are required to be independent with respect to the Fund in accordance with the U.S. federal securities laws and the applicable rules and regulations of the Securities and Exchange Commission and the PCAOB.
We conducted our audits of these financial statements in accordance with the standards of the PCAOB. Those standards require that we plan and perform the audit to obtain reasonable assurance about whether the financial statements are free of material misstatement, whether due to error or fraud.
Our audits included performing procedures to assess the risks of material misstatement of the financial statements, whether due to error or fraud, and performing procedures that respond to those risks. Such procedures included examining, on a test basis, evidence regarding the amounts and disclosures in the financial statements. Our audits also included evaluating the accounting principles used and significant estimates made by management, as well as evaluating the overall presentation of the financial statements. Our procedures included confirmation of securities owned as of February 28, 2022 by correspondence with the custodian, transfer agent and brokers; when replies were not received from brokers, we performed other auditing procedures. We believe that our audits provide a reasonable basis for our opinion.
/s/PricewaterhouseCoopers LLP
Houston, Texas
April 28, 2022
We have served as the auditor of one or more of the investment companies in the Invesco group of investment companies since at least 1995. We have not been able to determine the specific year we began serving as auditor.
| | |
| 41 | | Invesco Corporate Bond Fund |
Calculating your ongoing Fund expenses
Example
As a shareholder of the Fund, you incur two types of costs: (1) transaction costs, which may include sales charges (loads) on purchase payments or contingent deferred sales charges on redemptions, if any; and (2) ongoing costs, including management fees, distribution and/or service (12b-1) fees, and other Fund expenses. This example is intended to help you understand your ongoing costs (in dollars) of investing in the Fund and to compare these costs with ongoing costs of investing in other mutual funds. The example is based on an investment of $1,000 invested at the beginning of the period and held for the entire period September 1, 2021 through February 28, 2022.
Actual expenses
The table below provides information about actual account values and actual expenses. You may use the information in this table, together with the amount you invested, to estimate the expenses that you paid over the period. Simply divide your account value by $1,000 (for example, an $8,600 account value divided by $1,000 = 8.6), then multiply the result by the number in the table under the heading entitled “Actual Expenses Paid During Period” to estimate the expenses you paid on your account during this period.
Hypothetical example for comparison purposes
The table below also provides information about hypothetical account values and hypothetical expenses based on the Fund’s actual expense ratio and an assumed rate of return of 5% per year before expenses, which is not the Fund’s actual return.
The hypothetical account values and expenses may not be used to estimate the actual ending account balance or expenses you paid for the period. You may use this information to compare the ongoing costs of investing in the Fund and other funds. To do so, compare this 5% hypothetical example with the 5% hypothetical examples that appear in the shareholder reports of the other funds.
Please note that the expenses shown in the table are meant to highlight your ongoing costs only and do not reflect any transaction costs, such as sales charges (loads) on purchase payments or contingent deferred sales charges on redemptions, if any. Therefore, the hypothetical information is useful in comparing ongoing costs only, and will not help you determine the relative total costs of owning different funds. In addition, if these transaction costs were included, your costs would have been higher.
| | | | | | | | | | | | |
| | | | | | | | | HYPOTHETICAL (5% annual return before | | |
| | | | | ACTUAL | | expenses) | | |
| | | Beginning | | Ending | | Expenses | | Ending | | Expenses | | Annualized |
| | | Account Value | | Account Value | | Paid During | | Account Value | | Paid During | | Expense |
| | | (09/01/21) | | (02/28/22)1 | | Period2 | | (02/28/22) | | Period2 | | Ratio |
Class A | | $1,000.00 | | $932.30 | | $3.45 | | $1,021.22 | | $3.61 | | 0.72% |
Class C | | 1,000.00 | | 928.00 | | 7.03 | | 1,017.50 | | 7.35 | | 1.47 |
Class R | | 1,000.00 | | 929.90 | | 4.64 | | 1,019.98 | | 4.86 | | 0.97 |
Class Y | | 1,000.00 | | 932.40 | | 2.25 | | 1,022.46 | | 2.36 | | 0.47 |
Class R5 | | 1,000.00 | | 934.00 | | 1.97 | | 1,022.76 | | 2.06 | | 0.41 |
Class R6 | | 1,000.00 | | 933.00 | | 1.68 | | 1,023.06 | | 1.76 | | 0.35 |
| 1 | The actual ending account value is based on the actual total return of the Fund for the period September 1, 2021 through February 28, 2022, after actual expenses and will differ from the hypothetical ending account value which is based on the Fund’s expense ratio and a hypothetical annual return of 5% before expenses. |
| 2 | Expenses are equal to the Fund’s annualized expense ratio as indicated above multiplied by the average account value over the period, multiplied by 181/365 to reflect the most recent fiscal half year. |
| | |
| 42 | | Invesco Corporate Bond Fund |
Tax Information
Form 1099-DIV, Form 1042-S and other year-end tax information provide shareholders with actual calendar year amounts that should be included in their tax returns. Shareholders should consult their tax advisers.
The following distribution information is being provided as required by the Internal Revenue Code or to meet a specific state’s requirement.
The Fund designates the following amounts or, if subsequently determined to be different, the maximum amount allowable for its fiscal year ended February 28, 2022:
| | | | | | | | |
Federal and State Income Tax | | | | | | |
Long-Term Capital Gain Distributions | | | $38,338,300 | | | | | |
Qualified Dividend Income* | | | 7.96 | % | | | | |
Corporate Dividends Received Deduction* | | | 7.39 | % | | | | |
U.S. Treasury Obligations* | | | 1.74 | % | | | | |
Qualified Business Income* | | | 0.00 | % | | | | |
Business Interest Income* | | | 82.78 | % | | | | |
|
| * The above percentages are based on ordinary income dividends paid to shareholders during the Fund’s fiscal year. | |
| | | | | | | | |
Non-Resident Alien Shareholders | | | | | | |
Short-Term Capital Gain Distributions | | | $23,550,912 | | | | | |
| | |
| 43 | | Invesco Corporate Bond Fund |
Trustees and Officers
The address of each trustee and officer is AIM Investment Securities Funds (Invesco Investment Securities Funds) (the “Trust”), 11 Greenway Plaza, Suite 1000, Houston, Texas 77046-1173. The trustees serve for the life of the Trust, subject to their earlier death, incapacitation, resignation, retirement or removal as more specifically provided in the Trust’s organizational documents. Each officer serves for a one year term or until their successors are elected and qualified. Column two below includes length of time served with predecessor entities, if any.
| | | | | | | | |
Name, Year of Birth and Position(s) Held with the Trust | | Trustee and/or Officer Since | | Principal Occupation(s) During Past 5 Years | | Number of Funds in Fund Complex Overseen by Trustee | | Other Directorship(s) Held by Trustee During Past 5 Years |
| Interested Trustee | | | | | | | | |
Martin L. Flanagan1 – 1960 Trustee and Vice Chair | | 2007 | | Executive Director, Chief Executive Officer and President, Invesco Ltd. (ultimate parent of Invesco and a global investment management firm); Trustee and Vice Chair, The Invesco Funds; Vice Chair, Investment Company Institute; and Member of Executive Board, SMU Cox School of Business Formerly: Advisor to the Board, Invesco Advisers, Inc. (formerly known as Invesco Institutional (N.A.), Inc.); Chairman and Chief Executive Officer, Invesco Advisers, Inc. (registered investment adviser); Director, Chairman, Chief Executive Officer and President, Invesco Holding Company (US), Inc. (formerly IVZ Inc.) (holding company), Invesco Group Services, Inc. (service provider) and Invesco North American Holdings, Inc. (holding company); Director, Chief Executive Officer and President, Invesco Holding Company Limited (parent of Invesco and a global investment management firm); Director, Invesco Ltd.; Chairman, Investment Company Institute and President, Co-Chief Executive Officer, Co-President, Chief Operating Officer and Chief Financial Officer, Franklin Resources, Inc. (global investment management organization) | | 188 | | None |
| 1 | Mr. Flanagan is considered an interested person (within the meaning of Section 2(a)(19) of the 1940 Act) of the Trust because he is an officer of the Adviser to the Trust, and an officer and a director of Invesco Ltd., ultimate parent of the Adviser. |
| | |
| T-1 | | Invesco Corporate Bond Fund |
Trustees and Officers–(continued)
| | | | | | | | |
Name, Year of Birth and Position(s) Held with the Trust | | Trustee and/or Officer Since | | Principal Occupation(s) During Past 5 Years | | Number of Funds in Fund Complex Overseen by Trustee | | Other Directorship(s) Held by Trustee During Past 5 Years |
| Independent Trustees | | | | | | | | |
Christopher L. Wilson – 1957 Trustee and Chair | | 2017 | | Retired Formerly: Director, TD Asset Management USA Inc. (mutual fund complex) (22 portfolios); Managing Partner, CT2, LLC (investing and consulting firm); President/Chief Executive Officer, Columbia Funds, Bank of America Corporation; President/Chief Executive Officer, CDC IXIS Asset Management Services, Inc.; Principal & Director of Operations, Scudder Funds, Scudder, Stevens & Clark, Inc.; Assistant Vice President, Fidelity Investments | | 188 | | Formerly: enaible, Inc. (artificial intelligence technology) Director, ISO New England, Inc. (non-profit organization managing regional electricity market) |
Beth Ann Brown – 1968 Trustee | | 2019 | | Independent Consultant Formerly: Head of Intermediary Distribution, Managing Director, Strategic Relations, Managing Director, Head of National Accounts, Senior Vice President, National Account Manager and Senior Vice President, Key Account Manager, Columbia Management Investment Advisers LLC; Vice President, Key Account Manager, Liberty Funds Distributor, Inc.; and Trustee of certain Oppenheimer Funds | | 188 | | Director, Board of Directors of Caron Engineering Inc.; Advisor, Board of Advisors of Caron Engineering Inc.; President and Director, Acton Shapleigh Youth Conservation Corps (non-profit) Formerly: President and Director of Grahamtastic Connection (non-profit) |
Cynthia Hostetler –1962 Trustee | | 2017 | | Non-Executive Director and Trustee of a number of public and private business corporations Formerly: Director, Aberdeen Investment Funds (4 portfolios); Director, Artio Global Investment LLC (mutual fund complex); Director, Edgen Group, Inc. (specialized energy and infrastructure products distributor); Director, Genesee & Wyoming, Inc. (railroads); Head of Investment Funds and Private Equity, Overseas Private Investment Corporation; President, First Manhattan Bancorporation, Inc.; Attorney, Simpson Thacher & Bartlett LLP | | 188 | | Resideo Technologies, Inc. (smart home technology); Vulcan Materials Company (construction materials company); Trilinc Global Impact Fund; Textainer Group Holdings, (shipping container leasing company); Investment Company Institute (professional organization); Independent Directors Council (professional organization) |
Eli Jones – 1961 Trustee | | 2016 | | Professor and Dean Emeritus, Mays Business School - Texas A&M University Formerly: Dean of Mays Business School-Texas A&M University; Professor and Dean, Walton College of Business, University of Arkansas and E.J. Ourso College of Business, Louisiana State University; Director, Arvest Bank | | 188 | | Insperity, Inc. (formerly known as Administaff) (human resources provider); Member of Regional Board of Directors and Board of Directors, First Financial Bancorp (regional bank) |
Elizabeth Krentzman – 1959 Trustee | | 2019 | | Formerly: Principal and Chief Regulatory Advisor for Asset Management Services and U.S. Mutual Fund Leader of Deloitte & Touche LLP; General Counsel of the Investment Company Institute (trade association); National Director of the Investment Management Regulatory Consulting Practice, Principal, Director and Senior Manager of Deloitte & Touche LLP; Assistant Director of the Division of Investment Management - Office of Disclosure and Investment Adviser Regulation of the U.S. Securities and Exchange Commission and various positions with the Division of Investment Management - Office of Regulatory Policy of the U.S. Securities and Exchange Commission; Associate at Ropes & Gray LLP; and Trustee of certain Oppenheimer Funds | | 188 | | Trustee of the University of Florida National Board Foundation; Member of the Cartica Funds Board of Directors (private investment funds) Formerly: Member of the University of Florida Law Center Association, Inc. Board of Trustees, Audit Committee and Membership Committee |
Anthony J. LaCava, Jr. – 1956 Trustee | | 2019 | | Formerly: Director and Member of the Audit Committee, Blue Hills Bank (publicly traded financial institution) and Managing Partner, KPMG LLP | | 188 | | Blue Hills Bank; Chairman, Bentley University; Member, Business School Advisory Council; and Nominating Committee, KPMG LLP |
Prema Mathai-Davis – 1950 Trustee | | 1998 | | Retired Formerly: Co-Founder & Partner of Quantalytics Research, LLC, (a FinTech Investment Research Platform for the Self-Directed Investor); Trustee of YWCA Retirement Fund; CEO of YWCA of the USA; Board member of the NY Metropolitan Transportation Authority; Commissioner of the NYC Department of Aging; Board member of Johns Hopkins Bioethics Institute | | 188 | | Member of Board of Positive Planet US (non-profit) and HealthCare Chaplaincy Network (non-profit) |
| | |
| T-2 | | Invesco Corporate Bond Fund |
Trustees and Officers–(continued)
| | | | | | | | |
Name, Year of Birth and Position(s) Held with the Trust | | Trustee and/or Officer Since | | Principal Occupation(s) During Past 5 Years | | Number of Funds in Fund Complex Overseen by Trustee | | Other Directorship(s) Held by Trustee During Past 5 Years |
| Independent Trustees–(continued) | | | | | | |
Joel W. Motley – 1952 Trustee | | 2019 | | Director of Office of Finance, Federal Home Loan Bank System; Managing Director of Carmona Motley Inc. (privately held financial advisor); Member of the Council on Foreign Relations and its Finance and Budget Committee; Chairman Emeritus of Board of Human Rights Watch and Member of its Investment Committee; and Member of Investment Committee Board of Historic Hudson Valley (non-profit cultural organization); and Member of the Board, Blue Ocean Acquisition Corp. Formerly: Managing Director of Public Capital Advisors, LLC (privately held financial advisor); Managing Director of Carmona Motley Hoffman, Inc. (privately held financial advisor); Trustee of certain Oppenheimer Funds; Director of Columbia Equity Financial Corp. (privately held financial advisor); and Member of the Vestry of Trinity Church Wall Street | | 188 | | Member of Board of Trust for Mutual Understanding (non-profit promoting the arts and environment); Member of Board of Greenwall Foundation (bioethics research foundation) and its Investment Committee; Member of Board of Friends of the LRC (non-profit legal advocacy); Board Member and Investment Committee Member of Pulitzer Center for Crisis Reporting (non-profit journalism)Positive Planet US |
Teresa M. Ressel – 1962 Trustee | | 2017 | | Non-executive director and trustee of a number of public and private business corporations Formerly: Chief Executive Officer, UBS Securities LLC (investment banking); Chief Operating Officer, UBS AG Americas (investment banking); Sr. Management Team Olayan America, The Olayan Group (international investor/commercial/industrial); Assistant Secretary for Management & Budget and Designated Chief Financial Officer, U.S. Department of Treasury; Director, Atlantic Power Corporation (power generation company) and ON Semiconductor Corporation (semiconductor manufacturing) | | 188 | | None |
Ann Barnett Stern – 1957 Trustee | | 2017 | | President, Chief Executive Officer and Board Member, Houston Endowment, Inc. a private philanthropic institution Formerly: Executive Vice President, Texas Children’s Hospital; Vice President, General Counsel and Corporate Compliance Officer, Texas Children’s Hospital; Attorney at Beck, Redden and Secrest, LLP and Andrews and Kurth LLP | | 188 | | Trustee and Board Vice Chair of Holdsworth Center Trustee and Chair of Nomination/Governance Committee, Good Reason Houston, (non-profit); Trustee and Investment Committee member of University of Texas Law School Foundation (non-profit); Board Member of Greater Houston Partnership (non-profit); Advisory Board member, Baker Institute for Public Policy at Rice University (non-profit) Formerly: Director and Audit Committee Member of Federal Reserve Bank of Dallas |
Robert C. Troccoli – 1949 Trustee | | 2016 | | Retired Formerly: Adjunct Professor, University of Denver - Daniels College of Business; and Managing Partner, KPMG LLP | | 188 | | None |
Daniel S. Vandivort – 1954 Trustee | | 2019 | | President, Flyway Advisory Services LLC (consulting and property management) | | 188 | | Formerly: Trustee, Board of Trustees, Treasurer and Chairman of the Audit and Committee, Huntington Disease Foundation of America; Trustee and Governance Chair, of certain Oppenheimer Funds |
| | |
| T-3 | | Invesco Corporate Bond Fund |
Trustees and Officers–(continued)
| | | | | | | | |
Name, Year of Birth and Position(s) Held with the Trust | | Trustee and/or Officer Since | | Principal Occupation(s) During Past 5 Years | | Number of Funds in Fund Complex Overseen by Trustee | | Other Directorship(s) Held by Trustee During Past 5 Years |
| Officers | | | | | | |
Sheri Morris – 1964 President and Principal Executive Officer | | 1999 | | Head of Global Fund Services, Invesco Ltd.; President and Principal Executive Officer, The Invesco Funds; Vice President, Invesco Exchange-Traded Fund Trust, Invesco Exchange-Traded Fund Trust II, Invesco India Exchange-Traded Fund Trust, Invesco Actively Managed Exchange-Traded Fund Trust, Invesco Actively Managed Exchange-Traded Commodity Fund Trust and Invesco Exchange-Traded Self-Indexed Fund Trust; and Vice President, OppenheimerFunds, Inc. Formerly: Vice President, Treasurer and Principal Financial Officer, The Invesco Funds; Vice President, Invesco AIM Advisers, Inc., Invesco AIM Capital Management, Inc. and Invesco AIM Private Asset Management, Inc.; Assistant Vice President and Assistant Treasurer, The Invesco Funds; Vice President and Assistant Vice President, Invesco Advisers, Inc.; Assistant Vice President, Invesco AIM Capital Management, Inc. and Invesco AIM Private Asset Management, Inc.; Treasurer, Invesco Exchange-Traded Fund Trust, Invesco Exchange-Traded Fund Trust II, Invesco India Exchange-Traded Fund Trust and Invesco Actively Managed Exchange-Traded Fund Trust and Senior Vice President, Invesco Advisers, Inc. (formerly known as Invesco Institutional (N.A.), Inc.) (registered investment adviser) | | N/A | | N/A |
Jeffrey H. Kupor – 1968 Senior Vice President, Chief Legal Officer and Secretary | | 2018 | | Head of Legal of the Americas, Invesco Ltd.; Senior Vice President and Secretary, Invesco Advisers, Inc. (formerly known as Invesco Institutional (N.A.), Inc.) (registered investment adviser); Senior Vice President and Secretary, Invesco Distributors, Inc. (formerly known as Invesco AIM Distributors, Inc.); Vice President and Secretary, Invesco Investment Services, Inc. (formerly known as Invesco AIM Investment Services, Inc.) Senior Vice President, Chief Legal Officer and Secretary, The Invesco Funds; Secretary and General Counsel, Invesco Investment Advisers LLC (formerly known as Van Kampen Asset Management); Secretary and General Counsel, Invesco Capital Markets, Inc. (formerly known as Van Kampen Funds Inc.) and Chief Legal Officer, Invesco Exchange-Traded Fund Trust, Invesco Exchange-Traded Fund Trust II, Invesco India Exchange-Traded Fund Trust, Invesco Actively Managed Exchange-Traded Fund Trust, Invesco Actively Managed Exchange-Traded Commodity Fund Trust and Invesco Exchange-Traded Self-Indexed Fund Trust;; Secretary and Vice President, Harbourview Asset Management Corporation; Secretary and Vice President, OppenheimerFunds, Inc. and Invesco Managed Accounts, LLC; Secretary and Senior Vice President, OFI Global Institutional, Inc.; Secretary and Vice President, OFI SteelPath, Inc.; Secretary and Vice President, Oppenheimer Acquisition Corp.; Secretary and Vice President, Shareholder Services, Inc.; Secretary and Vice President, Trinity Investment Management Corporation Formerly: Secretary and Vice President, Jemstep, Inc.; Head of Legal, Worldwide Institutional, Invesco Ltd.; Secretary and General Counsel, INVESCO Private Capital Investments, Inc.; Senior Vice President, Secretary and General Counsel, Invesco Management Group, Inc. (formerly known as Invesco AIM Management Group, Inc.); Assistant Secretary, INVESCO Asset Management (Bermuda) Ltd.; Secretary and General Counsel, Invesco Private Capital, Inc.; Assistant Secretary and General Counsel, INVESCO Realty, Inc.; Secretary and General Counsel, Invesco Senior Secured Management, Inc.; Secretary, Sovereign G./P. Holdings Inc.; and Secretary, Invesco Indexing LLC; Secretary, W.L. Ross & Co., LLC | | N/A | | N/A |
Andrew R. Schlossberg – 1974 Senior Vice President | | 2019 | | Head of the Americas and Senior Managing Director, Invesco Ltd.; Director and Senior Vice President, Invesco Advisers, Inc. (formerly known as Invesco Institutional (N.A.), Inc.) (registered investment adviser); Director and Chairman, Invesco Investment Services, Inc. (formerly known as Invesco AIM Investment Services, Inc.) (registered transfer agent); Senior Vice President, The Invesco Funds; Director, Invesco Investment Advisers LLC (formerly known as Van Kampen Asset Management) Formerly: Director, President and Chairman, Invesco Insurance Agency, Inc.; Director, Invesco UK Limited; Director and Chief Executive, Invesco Asset Management Limited and Invesco Fund Managers Limited; Assistant Vice President, The Invesco Funds; Senior Vice President, Invesco Advisers, Inc. (formerly known as Invesco Institutional (N.A.), Inc.) (registered investment adviser); Director and Chief Executive, Invesco Administration Services Limited and Invesco Global Investment Funds Limited; Director, Invesco Distributors, Inc.; Head of EMEA, Invesco Ltd.; President, Invesco Actively Managed Exchange-Traded Commodity Fund Trust, Invesco Actively Managed Exchange-Traded Fund Trust, Invesco Exchange-Traded Fund Trust, Invesco Exchange-Traded Fund Trust II and Invesco India Exchange-Traded Fund Trust; Managing Director and Principal Executive Officer, Invesco Capital Management LLC | | N/A | | N/A |
| | |
| T-4 | | Invesco Corporate Bond Fund |
Trustees and Officers–(continued)
| | | | | | | | |
Name, Year of Birth and Position(s) Held with the Trust | | Trustee and/or Officer Since | | Principal Occupation(s) During Past 5 Years | | Number of Funds in Fund Complex Overseen by Trustee | | Other Directorship(s) Held by Trustee During Past 5 Years |
| Officers–(continued) | | | | | | |
John M. Zerr – 1962 Senior Vice President | | 2006 | | Chief Operating Officer of the Americas; Senior Vice President, Invesco Advisers, Inc. (formerly known as Invesco Institutional (N.A.), Inc.) (registered investment adviser); Senior Vice President, Invesco Distributors, Inc. (formerly known as Invesco AIM Distributors, Inc.); Director and Vice President, Invesco Investment Services, Inc. (formerly known as Invesco AIM Investment Services, Inc.) Senior Vice President, The Invesco Funds; Managing Director, Invesco Capital Management LLC; Director, Invesco Investment Advisers LLC (formerly known as Van Kampen Asset Management); Senior Vice President, Invesco Capital Markets, Inc. (formerly known as Van Kampen Funds Inc.); Manager, Invesco Indexing LLC; Manager, Invesco Specialized Products, LLC; Member, Invesco Canada Funds Advisory Board; Director, President and Chief Executive Officer, Invesco Corporate Class Inc. (corporate mutual fund company); and Director, Chairman, President and Chief Executive Officer, Invesco Canada Ltd. (formerly known as Invesco Trimark Ltd./Invesco Trimark Ltèe) (registered investment adviser and registered transfer agent); President, Invesco, Inc.; President, Invesco Global Direct Real Estate Feeder GP Ltd.; President, Invesco IP Holdings (Canada) Ltd; President, Invesco Global Direct Real Estate GP Ltd.; President, Invesco Financial Services Ltd. /Services Financiers Invesco Ltée; and Director and Chairman, Invesco Trust Company Formerly: President, Trimark Investments Ltd/Services Financiers Invesco Ltee; Director and Senior Vice President, Invesco Insurance Agency, Inc.; Director and Senior Vice President, Invesco Management Group, Inc. (formerly known as Invesco AIM Management Group, Inc.); Secretary and General Counsel, Invesco Management Group, Inc. (formerly known as Invesco AIM Management Group, Inc.); Secretary, Invesco Investment Services, Inc. (formerly known as Invesco AIM Investment Services, Inc.); Chief Legal Officer and Secretary, The Invesco Funds; Secretary and General Counsel, Invesco Investment Advisers LLC (formerly known as Van Kampen Asset Management); Secretary and General Counsel, Invesco Capital Markets, Inc. (formerly known as Van Kampen Funds Inc.); Chief Legal Officer, Invesco Exchange-Traded Fund Trust, Invesco Exchange-Traded Fund Trust II, Invesco India Exchange-Traded Fund Trust, Invesco Actively Managed Exchange-Traded Fund Trust, Invesco Actively Managed Exchange-Traded Commodity Fund Trust and Invesco Exchange-Traded Self-Indexed Fund Trust; Secretary, Invesco Indexing LLC; Director, Secretary, General Counsel and Senior Vice President, Van Kampen Exchange Corp.; Director, Vice President and Secretary, IVZ Distributors, Inc. (formerly known as INVESCO Distributors, Inc.); Director and Vice President, INVESCO Funds Group, Inc.; Director and Vice President, Van Kampen Advisors Inc.; Director, Vice President, Secretary and General Counsel, Van Kampen Investor Services Inc.; Director and Secretary, Invesco Distributors, Inc. (formerly known as Invesco AIM Distributors, Inc.); Director, Senior Vice President, General Counsel and Secretary, Invesco AIM Advisers, Inc. and Van Kampen Investments Inc.; Director, Vice President and Secretary, Fund Management Company; Director, Senior Vice President, Secretary, General Counsel and Vice President, Invesco AIM Capital Management, Inc.; Chief Operating Officer and General Counsel, Liberty Ridge Capital, Inc. (an investment adviser) | | N/A | | N/A |
Gregory G. McGreevey – 1962 Senior Vice President | | 2012 | | Senior Managing Director, Invesco Ltd.; Director, Chairman, President, and Chief Executive Officer, Invesco Advisers, Inc. (formerly known as Invesco Institutional (N.A.), Inc.) (registered investment adviser); Director, Invesco Mortgage Capital, Inc. and Invesco Senior Secured Management, Inc.; Senior Vice President, The Invesco Funds; President, SNW Asset Management Corporation and Invesco Managed Accounts, LLC; Chairman and Director, Invesco Private Capital, Inc.; Chairman and Director, INVESCO Private Capital Investments, Inc.; Chairman and Director, INVESCO Realty, Inc.; and Senior Vice President, Invesco Group Services, Inc. Formerly: Senior Vice President, Invesco Management Group, Inc. and Invesco Advisers, Inc.; Assistant Vice President, The Invesco Funds | | N/A | | N/A |
Adrien Deberghes – 1967 Principal Financial Officer, Treasurer and Vice President | | 2020 | | Head of the Fund Office of the CFO and Fund Administration; Vice President, Invesco Advisers, Inc.; Principal Financial Officer, Treasurer and Vice President, The Invesco Funds; Vice President, Invesco Exchange-Traded Fund Trust, Invesco Exchange-Traded Fund Trust II, Invesco India Exchange-Traded Fund Trust, Invesco Actively Managed Exchange-Traded Fund Trust, Invesco Actively Managed Exchange-Traded Commodity Fund Trust and Invesco Exchange-Traded Self-Indexed Fund Trust Formerly: Senior Vice President and Treasurer, Fidelity Investments | | N/A | | N/A |
Crissie M. Wisdom – 1969 Anti-Money Laundering Compliance Officer | | 2013 | | Anti-Money Laundering and OFAC Compliance Officer for Invesco U.S. entities including: Invesco Advisers, Inc. and its affiliates, Invesco Capital Markets, Inc., Invesco Distributors, Inc., Invesco Investment Services, Inc., The Invesco Funds, Invesco Capital Management, LLC, Invesco Trust Company; and Fraud Prevention Manager for Invesco Investment Services, Inc. | | N/A | | N/A |
| | |
| T-5 | | Invesco Corporate Bond Fund |
Trustees and Officers–(continued)
| | | | | | | | |
Name, Year of Birth and Position(s) Held with the Trust | | Trustee and/or Officer Since | | Principal Occupation(s) During Past 5 Years | | Number of Funds in Fund Complex Overseen by Trustee | | Other Directorship(s) Held by Trustee During Past 5 Years |
| Officers–(continued) | | | | | | |
Todd F. Kuehl – 1969 Chief Compliance Officer and Senior Vice President | | 2020 | | Chief Compliance Officer, Invesco Advisers, Inc. (registered investment adviser); and Chief Compliance Officer, The Invesco Funds and Senior Vice President Formerly: Managing Director and Chief Compliance Officer, Legg Mason (Mutual Funds); Chief Compliance Officer, Legg Mason Private Portfolio Group (registered investment adviser) | | N/A | | N/A |
Michael McMaster – 1962 Chief Tax Officer, Vice President and Assistant Treasurer | | 2020 | | Head of Global Fund Services Tax; Chief Tax Officer, Vice President and Assistant Treasurer, The Invesco Funds; Vice President, Invesco Advisers, Inc.; Assistant Treasurer, Invesco Capital Management LLC, Assistant Treasurer and Chief Tax Officer, Invesco Exchange-Traded Fund Trust, Invesco Exchange-Traded Fund Trust II, Invesco India Exchange-Traded Fund Trust, Invesco Actively Managed Exchange-Traded Fund Trust, Invesco Actively Managed Exchange-Traded Commodity Fund Trust and Invesco Exchange-Traded Self-Indexed Fund Trust; Assistant Treasurer, Invesco Specialized Products, LLC Formerly: Senior Vice President - Managing Director of Tax Services, U.S. Bank Global Fund Services (GFS) | | N/A | | N/A |
The Statement of Additional Information of the Trust includes additional information about the Fund’s Trustees and is available upon request, without charge, by calling 1.800.959.4246. Please refer to the Fund’s Statement of Additional Information for information on the Fund’s sub-advisers.
| | | | | | |
| Office of the Fund | | Investment Adviser | | Distributor | | Auditors |
| 11 Greenway Plaza, Suite 1000 | | Invesco Advisers, Inc. | | Invesco Distributors, Inc. | | PricewaterhouseCoopers LLP |
| Houston, TX 77046-1173 | | 1555 Peachtree Street, N.E. | | 11 Greenway Plaza, Suite 1000 | | 1000 Louisiana Street, Suite 5800 |
| | Atlanta, GA 30309 | | Houston, TX 77046-1173 | | Houston, TX 77002-5678 |
| | | |
| Counsel to the Fund | | Counsel to the Independent Trustees | | Transfer Agent | | Custodian |
| Stradley Ronon Stevens & Young, LLP | | Goodwin Procter LLP | | Invesco Investment Services, Inc. | | State Street Bank and Trust Company |
| 2005 Market Street, Suite 2600 | | 901 New York Avenue, N.W. | | 11 Greenway Plaza, Suite 1000 | | 225 Franklin Street |
| Philadelphia, PA 19103-7018 | | Washington, D.C. 20001 | | Houston, TX 77046-1173 | | Boston, MA 02110-2801 |
| | |
| T-6 | | Invesco Corporate Bond Fund |
(This page intentionally left blank)
(This page intentionally left blank)

Go paperless with eDelivery
Visit invesco.com/edelivery to enjoy the convenience and security of anytime electronic access to your investment documents.
With eDelivery, you can elect to have any or all of the following materials delivered straight to your inbox to download, save and print from your own computer:
∎ Fund reports and prospectuses
∎ Quarterly statements
∎ Daily confirmations
∎ Tax forms
Invesco mailing information
Send general correspondence to Invesco Investment Services, Inc., P.O. Box 219078, Kansas City, MO 64121-9078.
Important notice regarding delivery of security holder documents
To reduce Fund expenses, only one copy of most shareholder documents may be mailed to shareholders with multiple accounts at the same address (Householding). Mailing of your shareholder documents may be householded indefinitely unless you instruct us otherwise. If you do not want the mailing of these documents to be combined with those for other members of your household, please contact Invesco Investment Services, Inc. at 800 959 4246 or contact your financial institution. We will begin sending you individual copies for each account within 30 days after receiving your request.
Fund holdings and proxy voting information
The Fund provides a complete list of its portfolio holdings four times each year, at the end of each fiscal quarter. For the second and fourth quarters, the list appears, respectively, in the Fund’s semiannual and annual reports to shareholders. For the first and third quarters, the Fund files the list with the Securities and Exchange Commission (SEC) as an exhibit to its reports on Form N-PORT. The most recent list of portfolio holdings is available at invesco.com/completeqtrholdings. Shareholders can also look up the Fund’s Form N-PORT filings on the SEC website, sec.gov. The SEC file numbers for the Fund are shown below.
A description of the policies and procedures that the Fund uses to determine how to vote proxies relating to portfolio securities is available without charge, upon request, from our Client Services department at 800 959 4246, or at invesco.com/ corporate/about-us/esg. The information is also available on the SEC website, sec.gov.
Information regarding how the Fund voted proxies related to its portfolio securities during the most recent 12-month period ended June 30 is available at invesco.com/proxysearch. This information is also available on the SEC website, sec.gov.
Invesco Advisers, Inc. is an investment adviser; it provides investment advisory services to individual and institutional clients and does not sell securities. Invesco Distributors, Inc. is the US distributor for Invesco Ltd.’s retail mutual funds, exchange-traded funds and institutional money market funds. Both are wholly owned, indirect subsidiaries of Invesco Ltd.

| | | | |
| SEC file number(s): 811-05686 and 033-39519 | | Invesco Distributors, Inc. | | VK-CBD-AR-1 |

| | |
| | |
| Annual Report to Shareholders | | February 28, 2022 |
Invesco Global Real Estate Fund
Nasdaq:
A: AGREX ∎ C: CGREX ∎ R: RGREX ∎ Y: ARGYX ∎ R5: IGREX ∎ R6: FGREX
Management’s Discussion of Fund Performance
| | | | |
| |
Performance summary | |
For the fiscal year ended February 28, 2022, Class A shares of Invesco Global Real Estate Fund (the Fund), at net asset value (NAV), underperformed the Custom Invesco Global Real Estate Index, the Fund’s style-specific benchmark. | |
Your Fund’s long-term performance appears later in this report. | |
| |
Fund vs. Indexes | |
Total returns, 2/28/21 to 2/28/22, at net asset value (NAV). Performance shown does not include applicable contingent deferred sales charges (CDSC) or front-end sales charges, which would have reduced performance. | |
Class A Shares | | | 10.80 | % |
Class C Shares | | | 9.96 | |
Class R Shares | | | 10.53 | |
Class Y Shares | | | 11.08 | |
Class R5 Shares | | | 11.17 | |
Class R6 Shares | | | 11.26 | |
MSCI World Index▼ (Broad Market Index) | | | 10.74 | |
Custom Invesco Global Real Estate Index∎ (Style-Specific Index) | | | 10.94 | |
Lipper Global Real Estate Funds Classification Average◆ (Peer Group) | | | 13.02 | |
Source(s):▼ RIMES Technologies Corp.; ∎Invesco, RIMES Technologies Corp.; ◆Lipper Inc. | |
Market conditions and your Fund
Global equity markets started the fiscal year in positive territory amid concerns about rising bond yields and inflation, with value and cyclical recovery stocks outperforming growth stocks. The successful rollout of coro-navirus (COVID-19) vaccinations in the US and UK benefited equity markets. Listed real estate performed well, with performance led by the US, Hong Kong and Japan, while Euro-pean and Australian listed real estate lagged.
During the second quarter of 2021, global equity markets were again bolstered by the continued acceleration of vaccination rollouts and the easing of COVID-19-related restrictions in most developed markets. In a reversal from the first quarter, growth stocks outperformed value stocks in most regions. Emerging market equities were led by Brazil which benefited from global tailwinds, while regulatory concerns weighed on Chinese equities. Listed real estate generated returns in line with broader global equities. US REITs performed the best, followed by Europe, while Asia lagged.
Developed global equity markets were flat in the third quarter of 2021 amid concerns about rising inflation, supply disruptions and the economic growth rate. Emerging market equities declined during the fiscal year, primarily due to weak performance from Chi-nese equities, which were affected by significant regulatory changes in the private tutoring industry, increased regulation in the technology sector and the potential default of a large Chinese property developer. Performance for listed real estate was volatile during the fiscal year, consistent with the broader macro cross-currents impacting equities.
Most developed global equity markets ended the fourth quarter of 2021 in positive territory despite rising inflation and the emergence of Omicron, a new COVID-19 variant.
Pandemic-related supply chain disruptions and labor shortages intensified during the fiscal year, resulting in higher costs for companies and consumers. Emerging market equities declined due to COVID-19 concerns and China’s ongoing regulatory tightening and slowing economic growth. Overall, developed listed real estate outperformed emerging market listed real estate for the fiscal year.
The market environment on a year-to-date basis from January 1, 2022 through February 28, 2022 was volatile through the end of the fiscal year. Uncertainties over inflation prospects, interest rate policy normalization and the sustainability of the post COVID-19 economic recovery have been complicated by the negative impact of war in Eastern Europe. In our view, the current base case suggests moderated economic growth and more sustained food and energy inflation. However, uncertainty could prevail for some time and a wide range of outcomes is possible. We believe capital markets are expected to remain volatile with credit spreads and government bond yields rising for both long and short duration bonds. General equity indices have fallen. Listed real estate has been more defensive but has still seen price declines alongside global equities.
From a country perspective, key contributors to the Fund’s relative performance in the fiscal year were stock selection and an overweight exposure to both the US and United Kingdom. Key detractors to relative Fund performance included an overweight and stock selection in Germany, overweight exposure in Spain and stock selection in Singapore.
From a sector perspective, the largest contributors to the Fund’s relative performance versus its style-specific benchmark during the fiscal year were overweight exposure and security selection to residential, with key contributions from US multi-family properties. Additional relative contributors included
overweight exposure to industrial and stock selection within retail. The largest detractors to the Fund’s relative performance versus its style-specific benchmark included overweight exposure in lodging and infrastructure, along with underweight exposure to self-storage. The portfolio’s cash exposure also detracted relatively as the index has no cash exposure.
Top individual detractors relative to the Fund’s style specific benchmark included Pro-logis and AvalonBay Communities. Prologis owns a portfolio of high-quality industrial assets which are primarily located in global gateway markets. Fundamentals for the industrial sector were strong during the fiscal year, driven by e-commerce and investment in tenant supply chains. The company outperformed partly driven by its strong operating fundamentals, increasing external growth drivers and access to low-cost capital. Avalon-Bay Communities owns multi-family assets primarily in the coastal markets of the US. The overall apartment sector outperformed the style-specific benchmark during the fiscal year as the market rewarded sectors as they expected to experience improving operating results amidst a continued economic recovery.
Top individual detractors relative to the Fund’s style-specific benchmark included Public Storage and Americold Realty. Public Storage is the largest owner of self-storage assets in the US. During the fiscal year, the Fund’s underweight position to Public Storage detracted from Fund performance. The self-storage sector has continued to exhibit strong operating trends with high occupancy allowing for positive rent increases, although low barriers to entry and new supply coming to the market are likely to weigh on future growth. We exited our position during the fiscal year. Americold Realty owns a dominant position in cold storage and retains above-average long-term growth characteristics. The stock underperformed during the fiscal year as the company reduced guidance due to higher labor costs and a slow rebound of inventory levels. Longer-term demand trends and a favorable growth outlook remain intact. We exited our position during the fiscal year.
The portfolio added exposure to structural growth sectors during the fiscal year, including industrial and residential. The portfolio’s industrial exposure normally benefits from high levels of demand for industrial assets, which is driving more capital value growth. Demand for large modern warehouses is expanding rapidly and the supply of new assets is dominated by high levels of tenant demand. The portfolio also added residential exposure, focusing on single-family residential and apartments. Residential real estate is under-supplied in most countries around the world, which continues to form a solid base for investment. In contrast, the portfolio reduced exposure to the office sector. Office markets remain somewhat in limbo with working from home still common. We believe the sector
| | |
| 2 | | Invesco Global Real Estate Fund |
faces long-term headwinds such as demand deceleration, supply headwinds and rising cap-ex burdens. We anticipate these issues will remain very evident in larger office occupiers’ minds and investor preferences for many years to come.
The overall portfolio is biased toward companies that we believe have higher-quality assets, supply-constrained real estate market exposure, lower leveraged balance sheets and better governance characteristics. The unpredictable macro and geopolitical environments suggest caution in taking significant active factors, country and currency exposures. As such, portfolio risk is still most likely to be allocated to stock-specific opportunities where there is a belief that attractive relative value exists.
We thank you for your continued investment in Invesco Global Real Estate Fund.
Portfolio manager(s):
Mark Blackburn
James Cowen - Lead
Grant Jackson
Chip McKinley
Joe Rodriguez, Jr. - Lead
Darin Turner
Ping-Ying Wang - Lead
The views and opinions expressed in management’s discussion of Fund performance are those of Invesco Advisers, Inc. and its affiliates. These views and opinions are subject to change at any time based on factors such as market and economic conditions. These views and opinions may not be relied upon as investment advice or recommendations, or as an offer for a particular security. The information is not a complete analysis of every aspect of any market, country, industry, security or the Fund. Statements of fact are from sources considered reliable, but Invesco Advisers, Inc. makes no representation or warranty as to their completeness or accuracy. Although historical performance is no guarantee of future results, these insights may help you understand our investment management philosophy.
See important Fund and, if applicable, index disclosures later in this report.
| | |
| 3 | | Invesco Global Real Estate Fund |
Your Fund’s Long-Term Performance
Results of a $10,000 Investment – Oldest Share Class(es)
Fund and index data from 2/29/12
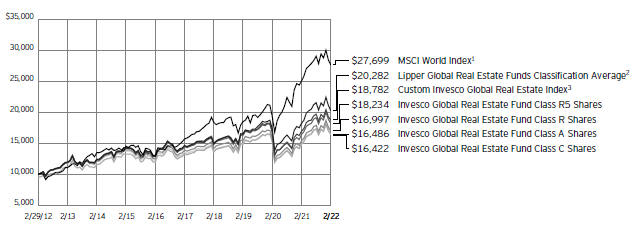
1 Source: RIMES Technologies Corp.
2 Source: Lipper Inc.
3 Source: Invesco, RIMES Technologies Corp.
Past performance cannot guarantee future results.
The data shown in the chart include reinvested distributions, applicable sales charges and Fund expenses including management
fees. Index results include reinvested dividends, but they do not reflect sales charges. Performance of the peer group, if applicable, reflects fund expenses and management fees;
performance of a market index does not. Performance shown in the chart does not reflect deduction of taxes a shareholder would pay on Fund distributions or sale of Fund shares.
| | |
| 4 | | Invesco Global Real Estate Fund |
| | | | |
| |
Average Annual Total Returns | |
As of 2/28/22, including maximum applicable sales charges | |
| |
Class A Shares | | | | |
Inception (4/29/05) | | | 4.88 | % |
10 Years | | | 5.13 | |
5 Years | | | 3.23 | |
1 Year | | | 4.67 | |
| |
Class C Shares | | | | |
Inception (4/29/05) | | | 4.86 | % |
10 Years | | | 5.09 | |
5 Years | | | 3.63 | |
1 Year | | | 8.96 | |
| |
Class R Shares | | | | |
Inception (4/29/05) | | | 4.97 | % |
10 Years | | | 5.45 | |
5 Years | | | 4.13 | |
1 Year | | | 10.53 | |
| |
Class Y Shares | | | | |
Inception (10/3/08) | | | 5.99 | % |
10 Years | | | 5.98 | |
5 Years | | | 4.66 | |
1 Year | | | 11.08 | |
| |
Class R5 Shares | | | | |
Inception (4/29/05) | | | 5.71 | % |
10 Years | | | 6.19 | |
5 Years | | | 4.77 | |
1 Year | | | 11.17 | |
| |
Class R6 Shares | | | | |
10 Years | | | 6.22 | % |
5 Years | | | 4.86 | |
1 Year | | | 11.26 | |
Class R6 shares incepted on September 24, 2012. Performance shown prior to that date is that of Class A shares at net asset value and includes the 12b-1 fees applicable to Class A shares.
The performance data quoted represent past performance and cannot guarantee future results; current performance may be lower or higher. Please visit invesco.com/ performance for the most recent month-end performance. Performance figures reflect reinvested distributions, changes in net asset value and the effect of the maximum sales charge unless otherwise stated. Performance figures do not reflect deduction of taxes a shareholder would pay on Fund distributions or sale of Fund shares. Investment return and principal value will fluctuate so that you may have a gain or loss when you sell shares.
Class A share performance reflects the maximum 5.50% sales charge, and Class C share performance reflects the applicable contingent deferred sales charge (CDSC) for the period involved. The CDSC on Class C shares is 1% for the first year after purchase. Class R, Class Y, Class R5 and Class R6 shares do not have a front-end sales charge or a CDSC; therefore, performance is at net asset value.
The performance of the Fund’s share classes will differ primarily due to different sales charge structures and class expenses.
Fund performance reflects any applicable fee waivers and/or expense reimbursements. Had the adviser not waived fees and/or reimbursed expenses currently or in the past, returns would have been lower. See current prospectus for more information.
| | |
| 5 | | Invesco Global Real Estate Fund |
Supplemental Information
Invesco Global Real Estate Fund’s investment objective is total return through growth of capital and current income.
| ∎ | Unless otherwise stated, information presented in this report is as of February 28, 2022, and is based on total net assets. |
| ∎ | Unless otherwise noted, all data is provided by Invesco. |
| ∎ | To access your Fund’s reports/prospectus, visit invesco.com/fundreports. |
About indexes used in this report
| ∎ | The MSCI World IndexSM is an unmanaged index considered representative of stocks of developed countries. The index is computed using the net return, which withholds applicable taxes for non-resident investors. |
| ∎ | The Custom Invesco Global Real Estate Index is composed of the FTSE EPRA/ NAREIT Developed Index (gross) from fund inception through February 17, 2005; the FTSE EPRA/NAREIT Developed Index (net) from February 18, 2005, through June 30, 2014; the FTSE EPRA NAREIT Global Index (Net) from July 1, 2014 through June 30, 2021, and the FTSE EPRA NAREIT Developed Index (Net) from July 1, 2021 onward. The FTSE EPRA/NAREIT Developed index is considered representative of global real estate companies and REITs. The FTSE EPRA/ NAREIT Global Index is designed to track the performance of listed real estate companies and REITS in developed and emerging markets. The net version of indexes is computed using the net return, which withholds taxes for non-resident investors. |
| ∎ | The Lipper Global Real Estate Funds Classification Average represents an average of all funds in the Lipper Global Real Estate Funds classification. |
| ∎ | The Fund is not managed to track the performance of any particular index, including the index(es) described here, and consequently, the performance of the Fund may deviate significantly from the performance of the index(es). |
| ∎ | A direct investment cannot be made in an index. Unless otherwise indicated, index results include reinvested dividends, and they do not reflect sales charges. Performance of the peer group, if applicable, reflects fund expenses; performance of a market index does not. |
|
|
This report must be accompanied or preceded by a currently effective Fund prospectus, which contains more complete information, including sales charges and expenses. Investors should read it carefully before investing. |
|
| NOT FDIC INSURED | MAY LOSE VALUE | NO BANK GUARANTEE |
| | |
| 6 | | Invesco Global Real Estate Fund |
Fund Information
Portfolio Composition
| | | | | |
| By country | | % of total net assets |
| |
United States | | | | 60.99 | % |
| |
Japan | | | | 9.82 | |
| |
Germany | | | | 5.99 | |
| |
Hong Kong | | | | 4.57 | |
| |
United Kingdom | | | | 4.16 | |
| |
Australia | | | | 3.74 | |
| |
Singapore | | | | 2.51 | |
| |
Canada | | | | 2.02 | |
| |
Countries, each less than 2% of portfolio | | | | 5.27 | |
| |
Money Market Funds Plus Other Assets Less Liabilities | | | | 0.93 | |
Top 10 Equity Holdings*
| | | | | | | |
| | | | | % of total net assets |
| | |
| 1. | | Prologis, Inc. | | | | 7.15 | % |
| | |
| 2. | | AvalonBay Communities, Inc. | | | | 4.64 | |
| | |
| 3. | | UDR, Inc. | | | | 4.11 | |
| | |
| 4. | | Invitation Homes, Inc. | | | | 3.95 | |
| | |
| 5. | | VICI Properties, Inc. | | | | 3.29 | |
| | |
| 6. | | Vonovia SE | | | | 3.29 | |
| | |
| 7. | | Welltower, Inc. | | | | 3.23 | |
| | |
| 8. | | Equinix, Inc. | | | | 3.23 | |
| | |
| 9. | | Kimco Realty Corp. | | | | 2.54 | |
| | |
| 10. | | Ventas, Inc. | | | | 2.53 | |
The Fund’s holdings are subject to change, and there is no assurance that the Fund will continue to hold any particular security.
| * | Excluding money market fund holdings, if any. |
Data presented here are as of February 28, 2022.
| | |
| 7 | | Invesco Global Real Estate Fund |
Schedule of Investments
February 28, 2022
| | | | | | | | |
| | | Shares | | | Value | |
|
| |
Common Stocks & Other Equity Interests-99.07% | |
Australia-3.74% | | | | | | | | |
Charter Hall Group | | | 134,680 | | | $ | 1,648,484 | |
|
| |
GPT Group (The) | | | 1,486,710 | | | | 5,358,665 | |
|
| |
Mirvac Group | | | 1,395,623 | | | | 2,636,363 | |
|
| |
National Storage REIT | | | 1,258,910 | | | | 2,382,431 | |
|
| |
NEXTDC Ltd.(a) | | | 254,272 | | | | 2,009,732 | |
|
| |
Stockland | | | 1,008,552 | | | | 3,097,099 | |
|
| |
| | | | | | | 17,132,774 | |
|
| |
| | |
Belgium-1.51% | | | | | | | | |
Aedifica S.A. | | | 30,282 | | | | 3,433,230 | |
|
| |
Cofinimmo S.A. | | | 18,432 | | | | 2,416,163 | |
|
| |
VGP N.V. | | | 4,271 | | | | 1,079,326 | |
|
| |
| | | | | | | 6,928,719 | |
|
| |
| | |
Canada-2.02% | | | | | | | | |
Chartwell Retirement Residences | | | 521,352 | | | | 5,005,802 | |
|
| |
Summit Industrial Income REIT | | | 251,446 | | | | 4,271,110 | |
|
| |
| | | | | | | 9,276,912 | |
|
| |
| | |
France-0.81% | | | | | | | | |
Covivio | | | 28,516 | | | | 2,329,351 | |
|
| |
Gecina S.A. | | | 10,967 | | | | 1,392,790 | |
|
| |
| | | | | | | 3,722,141 | |
|
| |
| | |
Germany-5.99% | | | | | | | | |
Aroundtown S.A. | | | 929,948 | | | | 5,763,626 | |
|
| |
Instone Real Estate Group SE(b) | | | 101,532 | | | | 1,950,720 | |
|
| |
LEG Immobilien SE | | | 11,107 | | | | 1,435,116 | |
|
| |
Sirius Real Estate Ltd. | | | 1,946,865 | | | | 3,256,583 | |
|
| |
Vonovia SE | | | 283,109 | | | | 15,065,734 | |
|
| |
| | | | | | | 27,471,779 | |
|
| |
| | |
Hong Kong-4.57% | | | | | | | | |
Hang Lung Properties Ltd. | | | 2,269,000 | | | | 4,756,050 | |
|
| |
Hongkong Land Holdings Ltd. | | | 464,400 | | | | 2,514,202 | |
|
| |
Kerry Properties Ltd. | | | 926,500 | | | | 2,535,685 | |
|
| |
New World Development Co. Ltd. | | | 1,021,000 | | | | 4,082,796 | |
|
| |
Sun Hung Kai Properties Ltd. | | | 484,100 | | | | 5,631,272 | |
|
| |
Wharf Real Estate Investment Co. Ltd. | | | 324,000 | | | | 1,451,535 | |
|
| |
| | | | | | | 20,971,540 | |
|
| |
| | |
Japan-9.82% | | | | | | | | |
Advance Residence Investment Corp. | | | 981 | | | | 2,761,108 | |
|
| |
GLP J-Reit | | | 703 | | | | 1,049,162 | |
|
| |
Japan Metropolitan Fund Investment Corp. | | | 3,922 | | | | 3,175,399 | |
|
| |
Japan Prime Realty Investment Corp. | | | 513 | | | | 1,668,781 | |
|
| |
Kenedix Office Investment Corp. | | | 387 | | | | 2,299,843 | |
|
| |
Mitsubishi Estate Co. Ltd. | | | 173,300 | | | | 2,647,803 | |
|
| |
Mitsubishi Estate Logistics REIT Investment Corp. | | | 319 | | | | 1,186,079 | |
|
| |
Mitsui Fudosan Co. Ltd. | | | 287,400 | | | | 6,403,670 | |
|
| |
Mitsui Fudosan Logistics Park, Inc. | | | 505 | | | | 2,305,971 | |
|
| |
Nippon Accommodations Fund, Inc. | | | 361 | | | | 1,900,212 | |
|
| |
Nomura Real Estate Master Fund, Inc. | | | 1,248 | | | | 1,655,829 | |
|
| |
ORIX JREIT, Inc. | | | 1,538 | | | | 2,153,874 | |
|
| |
| | | | | | | | |
| | | Shares | | | Value | |
|
| |
Japan-(continued) | | | | | | | | |
Sumitomo Realty & Development Co. Ltd. | | | 236,000 | | | $ | 6,969,189 | |
|
| |
Tokyo Tatemono Co. Ltd. | | | 132,300 | | | | 2,033,488 | |
|
| |
Tokyu Fudosan Holdings Corp. | | | 854,700 | | | | 4,764,306 | |
|
| |
United Urban Investment Corp. | | | 1,766 | | | | 2,027,556 | |
|
| |
| | | | | | | 45,002,270 | |
|
| |
| | |
Malta-0.00% | | | | | | | | |
BGP Holdings PLC(c) | | | 9,888,325 | | | | 11 | |
|
| |
| | |
Singapore-2.51% | | | | | | | | |
CapitaLand Integrated Commercial Trust | | | 2,704,500 | | | | 4,224,518 | |
|
| |
Digital Core REIT Management Pte
Ltd.(a) | | | 2,321,600 | | | | 2,605,606 | |
|
| |
Mapletree Commercial Trust | | | 1,230,300 | | | | 1,643,390 | |
|
| |
Mapletree Industrial Trust | | | 1,613,980 | | | | 3,046,326 | |
|
| |
| | | | | | | 11,519,840 | |
|
| |
| | |
Spain-1.21% | | | | | | | | |
Cellnex Telecom S.A.(b) | | | 122,159 | | | | 5,526,295 | |
|
| |
| | |
Sweden-1.74% | | | | | | | | |
Castellum AB | | | 115,664 | | | | 2,553,191 | |
|
| |
Samhallsbyggnadsbolaget i Norden AB, Class B(d) | | | 378,530 | | | | 1,738,111 | |
|
| |
Wihlborgs Fastigheter AB | | | 186,149 | | | | 3,684,938 | |
|
| |
| | | | | | | 7,976,240 | |
|
| |
| | |
United Kingdom-4.16% | | | | | | | | |
Capital & Counties Properties PLC | | | 1,220,031 | | | | 2,698,082 | |
|
| |
Derwent London PLC | | | 19,745 | | | | 804,065 | |
|
| |
Grainger PLC | | | 662,591 | | | | 2,489,775 | |
|
| |
Safestore Holdings PLC | | | 128,655 | | | | 2,187,248 | |
|
| |
Segro PLC | | | 267,748 | | | | 4,661,508 | |
|
| |
Tritax Big Box REIT PLC | | | 1,303,729 | | | | 4,092,349 | |
|
| |
UNITE Group PLC (The) | | | 149,976 | | | | 2,137,525 | |
|
| |
| | | | | | | 19,070,552 | |
|
| |
| | |
United States-60.99% | | | | | | | | |
American Homes 4 Rent, Class A | | | 152,503 | | | | 5,796,639 | |
|
| |
AvalonBay Communities, Inc. | | | 89,186 | | | | 21,278,888 | |
|
| |
Brixmor Property Group, Inc. | | | 194,824 | | | | 4,893,979 | |
|
| |
Camden Property Trust(d) | | | 33,150 | | | | 5,473,396 | |
|
| |
Duke Realty Corp. | | | 175,623 | | | | 9,308,019 | |
|
| |
Equinix, Inc. | | | 20,875 | | | | 14,815,614 | |
|
| |
Equity LifeStyle Properties, Inc. | | | 31,103 | | | | 2,320,906 | |
|
| |
Equity Residential | | | 39,850 | | | | 3,399,205 | |
|
| |
Essential Properties Realty Trust, Inc. | | | 142,903 | | | | 3,612,588 | |
|
| |
First Industrial Realty Trust, Inc. | | | 60,881 | | | | 3,505,528 | |
|
| |
Gaming and Leisure Properties, Inc. | | | 69,529 | | | | 3,157,312 | |
|
| |
Healthcare Realty Trust, Inc. | | | 67,735 | | | | 1,766,529 | |
|
| |
Hilton Worldwide Holdings, Inc.(a) | | | 23,407 | | | | 3,484,366 | |
|
| |
Invitation Homes, Inc. | | | 478,795 | | | | 18,098,451 | |
|
| |
Kimco Realty Corp. | | | 494,571 | | | | 11,637,256 | |
|
| |
Lamar Advertising Co., Class A | | | 26,072 | | | | 2,843,412 | |
|
| |
Life Storage, Inc. | | | 58,524 | | | | 7,408,553 | |
|
| |
Mid-America Apartment Communities, Inc. | | | 49,372 | | | | 10,102,005 | |
|
| |
NETSTREIT Corp.(d) | | | 64,712 | | | | 1,432,724 | |
|
| |
Outfront Media, Inc. | | | 34,795 | | | | 929,026 | |
|
| |
See accompanying Notes to Financial Statements which are an integral part of the financial statements.
| | |
| 8 | | Invesco Global Real Estate Fund |
| | | | | | | | |
| | | Shares | | | Value | |
|
| |
United States-(continued) | | | | | | | | |
PotlatchDeltic Corp. | | | 33,657 | | | $ | 1,847,769 | |
|
| |
Prologis, Inc. | | | 224,765 | | | | 32,781,975 | |
|
| |
Realty Income Corp. | | | 18,560 | | | | 1,226,630 | |
|
| |
Rexford Industrial Realty, Inc. | | | 164,225 | | | | 11,517,099 | |
|
| |
Ryman Hospitality Properties, Inc.(a) | | | 59,388 | | | | 5,232,677 | |
|
| |
SBA Communications Corp., Class A | | | 18,989 | | | | 5,761,073 | |
|
| |
Simon Property Group, Inc. | | | 75,776 | | | | 10,423,747 | |
|
| |
SITE Centers Corp. | | | 217,972 | | | | 3,389,465 | |
|
| |
Sun Communities, Inc.(d) | | | 52,236 | | | | 9,454,716 | |
|
| |
UDR, Inc. | | | 343,128 | | | | 18,827,433 | |
|
| |
Urban Edge Properties | | | 134,657 | | | | 2,453,451 | |
|
| |
Ventas, Inc. | | | 214,683 | | | | 11,592,882 | |
|
| |
VICI Properties, Inc. | | | 539,112 | | | | 15,073,571 | |
|
| |
Welltower, Inc. | | | 178,062 | | | | 14,830,784 | |
|
| |
| | | | | | | 279,677,668 | |
|
| |
Total Common Stocks & Other Equity Interests (Cost $392,601,371) | | | | 454,276,741 | |
|
| |
| | |
Money Market Funds-1.16% | | | | | | | | |
Invesco Government & Agency Portfolio, Institutional Class,
0.03%(e)(f) | | | 1,892,614 | | | | 1,892,614 | |
|
| |
Invesco Liquid Assets Portfolio, Institutional Class, 0.01%(e)(f) | | | 1,265,303 | | | | 1,265,303 | |
|
| |
| | | | | | | | |
| | | Shares | | | Value | |
|
| |
Money Market Funds-(continued) | | | | | |
Invesco Treasury Portfolio, Institutional Class, 0.01%(e)(f) | | | 2,162,988 | | | $ | 2,162,988 | |
|
| |
Total Money Market Funds (Cost $5,320,894) | | | | | | | 5,320,905 | |
|
| |
TOTAL INVESTMENTS IN SECURITIES (excluding Investments purchased with cash collateral from securities on loan)-100.23% (Cost $397,922,265) | | | | | | | 459,597,646 | |
|
| |
|
Investments Purchased with Cash Collateral from Securities on Loan | |
Money Market Funds-2.98% | | | | | | | | |
Invesco Private Government Fund, 0.12%(e)(f)(g) | | | 4,102,625 | | | | 4,102,625 | |
|
| |
Invesco Private Prime Fund,
0.08%(e)(f)(g) | | | 9,571,834 | | | | 9,572,791 | |
|
| |
Total Investments Purchased with Cash Collateral from Securities on Loan (Cost $13,676,208) | | | | | | | 13,675,416 | |
|
| |
TOTAL INVESTMENTS IN SECURITIES-103.21% (Cost $411,598,473) | | | | | | | 473,273,062 | |
|
| |
OTHER ASSETS LESS LIABILITIES-(3.21)% | | | | | | | (14,734,800 | ) |
|
| |
NET ASSETS-100.00% | | | | | | $ | 458,538,262 | |
|
| |
Investment Abbreviations:
REIT - Real Estate Investment Trust
Notes to Schedule of Investments:
| (a) | Non-income producing security. |
| (b) | Security purchased or received in a transaction exempt from registration under the Securities Act of 1933, as amended (the “1933 Act”). The security may be resold pursuant to an exemption from registration under the 1933 Act, typically to qualified institutional buyers. The aggregate value of these securities at February 28, 2022 was $7,477,015, which represented 1.63% of the Fund’s Net Assets. |
| (c) | Security valued using significant unobservable inputs (Level 3). See Note 3. |
| (d) | All or a portion of this security was out on loan at February 28, 2022. |
| (e) | Affiliated issuer. The issuer and/or the Fund is a wholly-owned subsidiary of Invesco Ltd., or is affiliated by having an investment adviser that is under common control of Invesco Ltd. The table below shows the Fund’s transactions in, and earnings from, its investments in affiliates for the fiscal year ended February 28, 2022. |
| | | | | | | | | | | | | | | | | | | | | | | | | | | | | | | | | | | |
| | | Value
February 28, 2021 | | Purchases
at Cost | | Proceeds from
Sales | | Change in
Unrealized
Appreciation
(Depreciation) | | Realized
Gain
(Loss) | | Value
February 28, 2022 | | Dividend Income |
| Investments in Affiliated Money Market Funds: | | | | | | | | | | | | | | | | | | | | | | | | | | | | | | | | | | | |
Invesco Government & Agency Portfolio, Institutional Class | | | $ | 2,531,994 | | | | $ | 41,656,098 | | | | $ | (42,295,478 | ) | | | $ | - | | | | $ | - | | | | $ | 1,892,614 | | | | $ | 259 | |
Invesco Liquid Assets Portfolio, Institutional Class | | | | 1,808,371 | | | | | 29,563,076 | | | | | (30,105,759 | ) | | | | 11 | | | | | (396 | ) | | | | 1,265,303 | | | | | 91 | |
Invesco Treasury Portfolio, Institutional Class | | | | 2,893,707 | | | | | 47,606,968 | | | | | (48,337,687 | ) | | | | - | | | | | - | | | | | 2,162,988 | | | | | 127 | |
| Investments Purchased with Cash Collateral from Securities on Loan: | | | | | | | | | | | | | | | | | | | | | | | | | | | | | | | | | | | |
Invesco Private Government Fund | | | | - | | | | | 62,814,735 | | | | | (58,712,110 | ) | | | | - | | | | | - | | | | | 4,102,625 | | | | | 492* | |
Invesco Private Prime Fund | | | | - | | | | | 130,743,462 | | | | | (121,168,368 | ) | | | | (792 | ) | | | | (1,511 | ) | | | | 9,572,791 | | | | | 4,370* | |
Total | | | $ | 7,234,072 | | | | $ | 312,384,339 | | | | $ | (300,619,402 | ) | | | $ | (781 | ) | | | $ | (1,907 | ) | | | $ | 18,996,321 | | | | $ | 5,339 | |
| | * | Represents the income earned on the investment of cash collateral, which is included in securities lending income on the Statement of Operations. Does not include rebates and fees paid to lending agent or premiums received from borrowers, if any. |
| (f) | The rate shown is the 7-day SEC standardized yield as of February 28, 2022. |
| (g) | The security has been segregated to satisfy the commitment to return the cash collateral received in securities lending transactions upon the borrower’s return of the securities loaned. See Note 1I. |
See accompanying Notes to Financial Statements which are an integral part of the financial statements.
| | |
| 9 | | Invesco Global Real Estate Fund |
Statement of Assets and Liabilities
February 28, 2022
| | | | |
Assets: | | | | |
| |
Investments in unaffiliated securities, at value (Cost $392,601,371)* | | $ | 454,276,741 | |
|
| |
Investments in affiliated money market funds, at value (Cost $18,997,102) | | | 18,996,321 | |
|
| |
Foreign currencies, at value (Cost $586,181) | | | 583,508 | |
|
| |
Receivable for: | | | | |
Investments sold | | | 10,038,578 | |
|
| |
Fund shares sold | | | 401,635 | |
|
| |
Dividends | | | 732,515 | |
|
| |
Investment for trustee deferred compensation and retirement plans | | | 138,156 | |
|
| |
Other assets | | | 35,753 | |
|
| |
Total assets | | | 485,203,207 | |
|
| |
| |
Liabilities: | | | | |
Payable for: | | | | |
Investments purchased | | | 8,944,625 | |
|
| |
Fund shares reacquired | | | 3,617,080 | |
|
| |
Collateral upon return of securities loaned | | | 13,676,208 | |
|
| |
Accrued fees to affiliates | | | 185,924 | |
|
| |
Accrued trustees’ and officers’ fees and benefits | | | 3,769 | |
|
| |
Accrued other operating expenses | | | 86,037 | |
|
| |
Trustee deferred compensation and retirement plans | | | 151,302 | |
|
| |
Total liabilities | | | 26,664,945 | |
|
| |
Net assets applicable to shares outstanding | | $ | 458,538,262 | |
|
| |
| |
Net assets consist of: | | | | |
Shares of beneficial interest | | $ | 396,068,103 | |
|
| |
Distributable earnings | | | 62,470,159 | |
|
| |
| | $ | 458,538,262 | |
|
| |
| | | | |
Net Assets: | | | | |
Class A | | $ | 107,879,875 | |
|
| |
Class C | | $ | 5,057,084 | |
|
| |
Class R | | $ | 24,518,568 | |
|
| |
Class Y | | $ | 67,783,023 | |
|
| |
Class R5 | | $ | 87,664,159 | |
|
| |
Class R6 | | $ | 165,635,553 | |
|
| |
|
Shares outstanding, no par value, with an unlimited number of shares authorized: | |
Class A | | | 9,277,914 | |
|
| |
Class C | | | 434,576 | |
|
| |
Class R | | | 2,109,683 | |
|
| |
Class Y | | | 5,833,278 | |
|
| |
Class R5 | | | 7,569,907 | |
|
| |
Class R6 | | | 14,304,877 | |
|
| |
| |
Class A: | | | | |
Net asset value per share | | $ | 11.63 | |
|
| |
Maximum offering price per share (Net asset value of $11.63 ÷ 94.50%) | | $ | 12.31 | |
|
| |
Class C: | | | | |
Net asset value and offering price per share | | $ | 11.64 | |
|
| |
Class R: | | | | |
Net asset value and offering price per share | | $ | 11.62 | |
|
| |
Class Y: | | | | |
Net asset value and offering price per share | | $ | 11.62 | |
|
| |
Class R5: | | | | |
Net asset value and offering price per share | | $ | 11.58 | |
|
| |
Class R6: | | | | |
Net asset value and offering price per share | | $ | 11.58 | |
|
| |
| * | At February 28, 2022, securities with an aggregate value of $13,169,715 were on loan to brokers. |
See accompanying Notes to Financial Statements which are an integral part of the financial statements.
| | |
| 10 | | Invesco Global Real Estate Fund |
Statement of Operations
For the year ended February 28, 2022
| | | | |
Investment income: | | | | |
| |
Dividends (net of foreign withholding taxes of $436,600) | | $ | 12,006,050 | |
|
| |
Dividends from affiliated money market funds (includes securities lending income of $5,625) | | | 6,102 | |
|
| |
Total investment income | | | 12,012,152 | |
|
| |
| |
Expenses: | | | | |
Advisory fees | | | 3,877,190 | |
|
| |
Administrative services fees | | | 72,046 | |
|
| |
Distribution fees: | | | | |
Class A | | | 286,735 | |
|
| |
Class C | | | 56,277 | |
|
| |
Class R | | | 129,203 | |
|
| |
Transfer agent fees – A, C, R and Y | | | 525,766 | |
|
| |
Transfer agent fees – R5 | | | 103,393 | |
|
| |
Transfer agent fees – R6 | | | 22,619 | |
|
| |
Trustees’ and officers’ fees and benefits | | | 26,800 | |
|
| |
Registration and filing fees | | | 109,330 | |
|
| |
Reports to shareholders | | | 41,163 | |
|
| |
Professional services fees | | | 113,559 | |
|
| |
Other | | | 9,182 | |
|
| |
Total expenses | | | 5,373,263 | |
|
| |
Less: Fees waived and/or expense offset arrangement(s) | | | (1,064 | ) |
|
| |
Net expenses | | | 5,372,199 | |
|
| |
Net investment income | | | 6,639,953 | |
|
| |
| |
Realized and unrealized gain (loss) from: | | | | |
Net realized gain (loss) from: | | | | |
Unaffiliated investment securities (net of foreign taxes of $61,446) | | | 64,760,554 | |
|
| |
Affiliated investment securities | | | (1,907 | ) |
|
| |
Foreign currencies | | | (73,544 | ) |
|
| |
| | | 64,685,103 | |
|
| |
Change in net unrealized appreciation (depreciation) of: | | | | |
Unaffiliated investment securities (net of foreign taxes of $72,325) | | | (11,973,100 | ) |
|
| |
Affiliated investment securities | | | (781 | ) |
|
| |
Foreign currencies | | | (18,436 | ) |
|
| |
| | | (11,992,317 | ) |
|
| |
Net realized and unrealized gain | | | 52,692,786 | |
|
| |
Net increase in net assets resulting from operations | | $ | 59,332,739 | |
|
| |
See accompanying Notes to Financial Statements which are an integral part of the financial statements.
| | |
| 11 | | Invesco Global Real Estate Fund |
Statement of Changes in Net Assets
For the years ended February 28, 2022 and 2021
| | | | | | | | |
| | | 2022 | | | 2021 | |
|
| |
Operations: | | | | | | | | |
Net investment income | | $ | 6,639,953 | | | $ | 11,201,510 | |
|
| |
Net realized gain (loss) | | | 64,685,103 | | | | (26,474,240 | ) |
|
| |
Change in net unrealized appreciation (depreciation) | | | (11,992,317 | ) | | | (14,610,343 | ) |
|
| |
Net increase (decrease) in net assets resulting from operations | | | 59,332,739 | | | | (29,883,073 | ) |
|
| |
| | |
Distributions to shareholders from distributable earnings: | | | | | | | | |
Class A | | | (2,928,183 | ) | | | (5,185,414 | ) |
|
| |
Class C | | | (102,987 | ) | | | (290,832 | ) |
|
| |
Class R | | | (596,650 | ) | | | (987,347 | ) |
|
| |
Class Y | | | (2,580,238 | ) | | | (5,961,613 | ) |
|
| |
Class R5 | | | (3,281,554 | ) | | | (6,282,253 | ) |
|
| |
Class R6 | | | (5,367,899 | ) | | | (9,584,906 | ) |
|
| |
Total distributions from distributable earnings | | | (14,857,511 | ) | | | (28,292,365 | ) |
|
| |
| | |
Share transactions-net: | | | | | | | | |
Class A | | | (9,486,671 | ) | | | (22,413,244 | ) |
|
| |
Class C | | | (890,718 | ) | | | (5,309,439 | ) |
|
| |
Class R | | | (847,531 | ) | | | 2,307,536 | |
|
| |
Class Y | | | (54,497,517 | ) | | | (37,004,226 | ) |
|
| |
Class R5 | | | (48,145,806 | ) | | | (25,144,365 | ) |
|
| |
Class R6 | | | (14,940,083 | ) | | | (19,368,398 | ) |
|
| |
Net increase (decrease) in net assets resulting from share transactions | | | (128,808,326 | ) | | | (106,932,136 | ) |
|
| |
Net increase (decrease) in net assets | | | (84,333,098 | ) | | | (165,107,574 | ) |
|
| |
| | |
Net assets: | | | | | | | | |
Beginning of year | | | 542,871,360 | | | | 707,978,934 | |
|
| |
End of year | | $ | 458,538,262 | | | $ | 542,871,360 | |
|
| |
See accompanying Notes to Financial Statements which are an integral part of the financial statements.
| | |
| 12 | | Invesco Global Real Estate Fund |
Financial Highlights
The following schedule presents financial highlights for a share of the Fund outstanding throughout the periods indicated.
| | | | | | | | | | | | | | | | | | | | | | | | | | | | | | | | | | | | | | | | | | | | | | | | | | | | | | | | |
| | | Net asset
value,
beginning
of period | | Net
investment
income(a) | | Net gains
(losses)
on securities
(both
realized and
unrealized) | | Total from
investment
operations | | Dividends
from net
investment
income | | Distributions
from net
realized
gains | | Total
Distributions | | Net asset
value, end
of period | | Total
return(b) | | Net assets,
end of period
(000’s omitted) | | Ratio of
expenses
to average
net assets
with fee waivers
and/or
expenses
absorbed | | Ratio of
expenses
to average net
assets without
fee waivers
and/or
expenses
absorbed | | Ratio of net
investment
income
to average
net assets | | Portfolio
turnover(c) |
Class A | | | | | | | | | | | | | | | | | | | | | | | | | | | | | | | | | | | | | | | | | | | | | | | | | | | | | | | | |
Year ended 02/28/22 | | $ | 10.77 | | | $ | 0.12 | | | $ | 1.04 | | | $ | 1.16 | | | $ | (0.30 | ) | | $ | – | | | $ | (0.30 | ) | | $ | 11.63 | | | | 10.80 | % | | $ | 107,880 | | | | 1.30 | % | | | 1.30 | % | | | 1.01 | % | | | 88 | % |
Year ended 02/28/21 | | | 11.65 | | | | 0.17 | | | | (0.56 | ) | | | (0.39 | ) | | | (0.21 | ) | | | (0.28 | ) | | | (0.49 | ) | | | 10.77 | | | | (2.96 | ) | | | 108,687 | | | | 1.32 | | | | 1.32 | | | | 1.70 | | | | 160 | |
Year ended 02/29/20 | | | 12.59 | | | | 0.24 | | | | 0.22 | | | | 0.46 | | | | (0.54 | ) | | | (0.86 | ) | | | (1.40 | ) | | | 11.65 | | | | 3.20 | | | | 143,448 | | | | 1.27 | | | | 1.27 | | | | 1.87 | | | | 60 | |
Year ended 02/28/19 | | | 12.76 | | | | 0.29 | | | | 0.84 | | | | 1.13 | | | | (0.60 | ) | | | (0.70 | ) | | | (1.30 | ) | | | 12.59 | | | | 9.46 | | | | 154,173 | | | | 1.26 | | | | 1.26 | | | | 2.26 | | | | 47 | |
Year ended 02/28/18 | | | 12.83 | | | | 0.30 | (d) | | | (0.01 | ) | | | 0.29 | | | | (0.28 | ) | | | (0.08 | ) | | | (0.36 | ) | | | 12.76 | | | | 2.17 | | | | 156,543 | | | | 1.27 | | | | 1.27 | | | | 2.31 | (d) | | | 51 | |
Class C | | | | | | | | | | | | | | | | | | | | | | | | | | | | | | | | | | | | | | | | | | | | | | | | | | | | | | | | |
Year ended 02/28/22 | | | 10.78 | | | | 0.03 | | | | 1.05 | | | | 1.08 | | | | (0.22 | ) | | | – | | | | (0.22 | ) | | | 11.64 | | | | 9.96 | | | | 5,057 | | | | 2.05 | | | | 2.05 | | | | 0.26 | | | | 88 | |
Year ended 02/28/21 | | | 11.65 | | | | 0.10 | | | | (0.56 | ) | | | (0.46 | ) | | | (0.13 | ) | | | (0.28 | ) | | | (0.41 | ) | | | 10.78 | | | | (3.68 | ) | | | 5,493 | | | | 2.07 | | | | 2.07 | | | | 0.95 | | | | 160 | |
Year ended 02/29/20 | | | 12.59 | | | | 0.15 | | | | 0.21 | | | | 0.36 | | | | (0.44 | ) | | | (0.86 | ) | | | (1.30 | ) | | | 11.65 | | | | 2.43 | | | | 12,169 | | | | 2.02 | | | | 2.02 | | | | 1.12 | | | | 60 | |
Year ended 02/28/19 | | | 12.75 | | | | 0.20 | | | | 0.84 | | | | 1.04 | | | | (0.50 | ) | | | (0.70 | ) | | | (1.20 | ) | | | 12.59 | | | | 8.71 | | | | 14,673 | | | | 2.01 | | | | 2.01 | | | | 1.51 | | | | 47 | |
Year ended 02/28/18 | | | 12.83 | | | | 0.21 | (d) | | | (0.03 | ) | | | 0.18 | | | | (0.18 | ) | | | (0.08 | ) | | | (0.26 | ) | | | 12.75 | | | | 1.33 | | | | 27,654 | | | | 2.02 | | | | 2.02 | | | | 1.56 | (d) | | | 51 | |
Class R | | | | | | | | | | | | | | | | | | | | | | | | | | | | | | | | | | | | | | | | | | | | | | | | | | | | | | | | |
Year ended 02/28/22 | | | 10.77 | | | | 0.09 | | | | 1.03 | | | | 1.12 | | | | (0.27 | ) | | | – | | | | (0.27 | ) | | | 11.62 | | | | 10.42 | | | | 24,519 | | | | 1.55 | | | | 1.55 | | | | 0.76 | | | | 88 | |
Year ended 02/28/21 | | | 11.64 | | | | 0.15 | | | | (0.56 | ) | | | (0.41 | ) | | | (0.18 | ) | | | (0.28 | ) | | | (0.46 | ) | | | 10.77 | | | | (3.14 | ) | | | 23,490 | | | | 1.57 | | | | 1.57 | | | | 1.45 | | | | 160 | |
Year ended 02/29/20 | | | 12.58 | | | | 0.21 | | | | 0.21 | | | | 0.42 | | | | (0.50 | ) | | | (0.86 | ) | | | (1.36 | ) | | | 11.64 | | | | 2.94 | | | | 22,293 | | | | 1.52 | | | | 1.52 | | | | 1.62 | | | | 60 | |
Year ended 02/28/19 | | | 12.75 | | | | 0.26 | | | | 0.84 | | | | 1.10 | | | | (0.57 | ) | | | (0.70 | ) | | | (1.27 | ) | | | 12.58 | | | | 9.18 | | | | 24,003 | | | | 1.51 | | | | 1.51 | | | | 2.01 | | | | 47 | |
Year ended 02/28/18 | | | 12.83 | | | | 0.27 | (d) | | | (0.02 | ) | | | 0.25 | | | | (0.25 | ) | | | (0.08 | ) | | | (0.33 | ) | | | 12.75 | | | | 1.84 | | | | 23,658 | | | | 1.52 | | | | 1.52 | | | | 2.06 | (d) | | | 51 | |
Class Y | | | | | | | | | | | | | | | | | | | | | | | | | | | | | | | | | | | | | | | | | | | | | | | | | | | | | | | | |
Year ended 02/28/22 | | | 10.77 | | | | 0.15 | | | | 1.03 | | | | 1.18 | | | | (0.33 | ) | | | – | | | | (0.33 | ) | | | 11.62 | | | | 10.98 | | | | 67,783 | | | | 1.05 | | | | 1.05 | | | | 1.26 | | | | 88 | |
Year ended 02/28/21 | | | 11.65 | | | | 0.20 | | | | (0.57 | ) | | | (0.37 | ) | | | (0.23 | ) | | | (0.28 | ) | | | (0.51 | ) | | | 10.77 | | | | (2.69 | ) | | | 113,549 | | | | 1.07 | | | | 1.07 | | | | 1.95 | | | | 160 | |
Year ended 02/29/20 | | | 12.59 | | | | 0.28 | | | | 0.21 | | | | 0.49 | | | | (0.57 | ) | | | (0.86 | ) | | | (1.43 | ) | | | 11.65 | | | | 3.46 | | | | 166,069 | | | | 1.02 | | | | 1.02 | | | | 2.12 | | | | 60 | |
Year ended 02/28/19 | | | 12.76 | | | | 0.33 | | | | 0.83 | | | | 1.16 | | | | (0.63 | ) | | | (0.70 | ) | | | (1.33 | ) | | | 12.59 | | | | 9.74 | | | | 191,757 | | | | 1.01 | | | | 1.01 | | | | 2.51 | | | | 47 | |
Year ended 02/28/18 | | | 12.83 | | | | 0.34 | (d) | | | (0.02 | ) | | | 0.32 | | | | (0.31 | ) | | | (0.08 | ) | | | (0.39 | ) | | | 12.76 | | | | 2.42 | | | | 623,470 | | | | 1.02 | | | | 1.02 | | | | 2.56 | (d) | | | 51 | |
Class R5 | | | | | | | | | | | | | | | | | | | | | | | | | | | | | | | | | | | | | | | | | | | | | | | | | | | | | | | | |
Year ended 02/28/22 | | | 10.73 | | | | 0.17 | | | | 1.03 | | | | 1.20 | | | | (0.35 | ) | | | – | | | | (0.35 | ) | | | 11.58 | | | | 11.17 | | | | 87,664 | | | | 0.91 | | | | 0.91 | | | | 1.40 | | | | 88 | |
Year ended 02/28/21 | | | 11.61 | | | | 0.21 | | | | (0.56 | ) | | | (0.35 | ) | | | (0.25 | ) | | | (0.28 | ) | | | (0.53 | ) | | | 10.73 | | | | (2.57 | ) | | | 124,597 | | | | 0.94 | | | | 0.94 | | | | 2.08 | | | | 160 | |
Year ended 02/29/20 | | | 12.55 | | | | 0.29 | | | | 0.21 | | | | 0.50 | | | | (0.58 | ) | | | (0.86 | ) | | | (1.44 | ) | | | 11.61 | | | | 3.59 | | | | 164,048 | | | | 0.91 | | | | 0.91 | | | | 2.23 | | | | 60 | |
Year ended 02/28/19 | | | 12.72 | | | | 0.34 | | | | 0.84 | | | | 1.18 | | | | (0.65 | ) | | | (0.70 | ) | | | (1.35 | ) | | | 12.55 | | | | 9.87 | | | | 208,742 | | | | 0.92 | | | | 0.92 | | | | 2.60 | | | | 47 | |
Year ended 02/28/18 | | | 12.81 | | | | 0.35 | (d) | | | (0.03 | ) | | | 0.32 | | | | (0.33 | ) | | | (0.08 | ) | | | (0.41 | ) | | | 12.72 | | | | 2.40 | | | | 260,397 | | | | 0.93 | | | | 0.93 | | | | 2.65 | (d) | | | 51 | |
Class R6 | | | | | | | | | | | | | | | | | | | | | | | | | | | | | | | | | | | | | | | | | | | | | | | | | | | | | | | | |
Year ended 02/28/22 | | | 10.73 | | | | 0.18 | | | | 1.03 | | | | 1.21 | | | | (0.36 | ) | | | – | | | | (0.36 | ) | | | 11.58 | | | | 11.26 | | | | 165,636 | | | | 0.83 | | | | 0.83 | | | | 1.48 | | | | 88 | |
Year ended 02/28/21 | | | 11.61 | | | | 0.22 | | | | (0.56 | ) | | | (0.34 | ) | | | (0.26 | ) | | | (0.28 | ) | | | (0.54 | ) | | | 10.73 | | | | (2.48 | ) | | | 167,055 | | | | 0.85 | | | | 0.85 | | | | 2.17 | | | | 160 | |
Year ended 02/29/20 | | | 12.55 | | | | 0.30 | | | | 0.22 | | | | 0.52 | | | | (0.60 | ) | | | (0.86 | ) | | | (1.46 | ) | | | 11.61 | | | | 3.68 | | | | 199,952 | | | | 0.82 | | | | 0.82 | | | | 2.32 | | | | 60 | |
Year ended 02/28/19 | | | 12.72 | | | | 0.35 | | | | 0.84 | | | | 1.19 | | | | (0.66 | ) | | | (0.70 | ) | | | (1.36 | ) | | | 12.55 | | | | 9.97 | | | | 207,085 | | | | 0.83 | | | | 0.83 | | | | 2.69 | | | | 47 | |
Year ended 02/28/18 | | | 12.81 | | | | 0.36 | (d) | | | (0.03 | ) | | | 0.33 | | | | (0.34 | ) | | | (0.08 | ) | | | (0.42 | ) | | | 12.72 | | | | 2.49 | | | | 197,835 | | | | 0.85 | | | | 0.85 | | | | 2.73 | (d) | | | 51 | |
| (a) | Calculated using average shares outstanding. |
| (b) | Includes adjustments in accordance with accounting principles generally accepted in the United States of America and as such, the net asset value for financial reporting purposes and the returns based upon those net asset values may differ from the net asset value and returns for shareholder transactions. Does not include sales charges and is not annualized for periods less than one year, if applicable. |
| (c) | Portfolio turnover is calculated at the fund level and is not annualized for periods less than one year, if applicable. |
| (d) | Net investment income per share and the ratio of net investment income to average net assets includes significant dividends received during the year ended February 28, 2018. Net investment income per share and the ratio of net investment income to average net assets excluding the significant dividends are $0.25 and 1.92%, $0.16 and 1.17%, $0.22 and 1.67%, $0.29 and 2.17%, $0.30 and 2.26%, $0.31 and 2.34% for Class A, Class C, Class R, Class Y, Class R5 and Class R6 shares, respectively. |
See accompanying Notes to Financial Statements which are an integral part of the financial statements.
| | |
| 13 | | Invesco Global Real Estate Fund |
Notes to Financial Statements
February 28, 2022
NOTE 1–Significant Accounting Policies
Invesco Global Real Estate Fund (the “Fund”), is a series portfolio of AIM Investment Securities Funds (Invesco Investment Securities Funds) (the “Trust”). The Trust is organized as a Delaware statutory trust and is registered under the Investment Company Act of 1940, as amended (the “1940 Act”), as an open-end series management investment company authorized to issue an unlimited number of shares of beneficial interest. Information presented in these financial statements pertains only to the Fund. Matters affecting the Fund or each class will be voted on exclusively by the shareholders of the Fund or each class.
The Fund’s investment objective is total return through growth of capital and current income.
The Fund currently consists of six different classes of shares: Class A, Class C, Class R, Class Y, Class R5 and Class R6. Class Y shares are available only to certain investors. Class A shares are sold with a front-end sales charge unless certain waiver criteria are met. Under certain circumstances, load waived shares may be subject to contingent deferred sales charges (“CDSC”). Class C shares are sold with a CDSC. Class R, Class Y, Class R5 and Class R6 shares are sold at net asset value. Class C shares held for eight years after purchase are eligible for automatic conversion into Class A shares of the same Fund (the “Conversion Feature”). The automatic conversion pursuant to the Conversion Feature will generally occur at the end of the month following the eighth anniversary after a purchase of Class C shares.
The Fund is an investment company and accordingly follows the investment company accounting and reporting guidance in accordance with Financial Accounting Standards Board Accounting Standards Codification Topic 946, Financial Services – Investment Companies.
The following is a summary of the significant accounting policies followed by the Fund in the preparation of its financial statements.
| A. | Security Valuations – Securities, including restricted securities, are valued according to the following policy. |
A security listed or traded on an exchange (except convertible securities) is valued at its last sales price or official closing price as of the close of the customary trading session on the exchange where the security is principally traded, or lacking any sales or official closing price on a particular day, the security may be valued at the closing bid price on that day. Securities traded in the over-the-counter market are valued based on prices furnished by independent pricing services or market makers. When such securities are valued by an independent pricing service they may be considered fair valued. Futures contracts are valued at the final settlement price set by an exchange on which they are principally traded. Listed options are valued at the mean between the last bid and asked prices from the exchange on which they are principally traded. Options not listed on an exchange are valued by an independent source at the mean between the last bid and asked prices. For purposes of determining net asset value (“NAV”) per share, futures and option contracts generally are valued 15 minutes after the close of the customary trading session of the New York Stock Exchange (“NYSE”).
Investments in open-end and closed-end registered investment companies that do not trade on an exchange are valued at the end-of-day net asset value per share. Investments in open-end and closed-end registered investment companies that trade on an exchange are valued at the last sales price or official closing price as of the close of the customary trading session on the exchange where the security is principally traded.
Debt obligations (including convertible securities) and unlisted equities are fair valued using an evaluated quote provided by an independent pricing service. Evaluated quotes provided by the pricing service may be determined without exclusive reliance on quoted prices, and may reflect appropriate factors such as institution-size trading in similar groups of securities, developments related to specific securities, dividend rate (for unlisted equities), yield (for debt obligations), quality, type of issue, coupon rate (for debt obligations), maturity (for debt obligations), individual trading characteristics and other market data. Pricing services generally value debt obligations assuming orderly transactions of institutional round lot size, but a fund may hold or transact in the same securities in smaller, odd lot sizes. Odd lots often trade at lower prices than institutional round lots. Debt obligations are subject to interest rate and credit risks. In addition, all debt obligations involve some risk of default with respect to interest and/or principal payments.
Foreign securities’ (including foreign exchange contracts) prices are converted into U.S. dollar amounts using the applicable exchange rates as of the close of the NYSE. If market quotations are available and reliable for foreign exchange-traded equity securities, the securities will be valued at the market quotations. Because trading hours for certain foreign securities end before the close of the NYSE, closing market quotations may become unreliable. If between the time trading ends on a particular security and the close of the customary trading session on the NYSE, events occur that the investment adviser determines are significant and make the closing price unreliable, the Fund may fair value the security. If the event is likely to have affected the closing price of the security, the security will be valued at fair value in good faith using procedures approved by the Board of Trustees. Adjustments to closing prices to reflect fair value may also be based on a screening process of an independent pricing service to indicate the degree of certainty, based on historical data, that the closing price in the principal market where a foreign security trades is not the current value as of the close of the NYSE. Foreign securities’ prices meeting the approved degree of certainty that the price is not reflective of current value will be priced at the indication of fair value from the independent pricing service. Multiple factors may be considered by the independent pricing service in determining adjustments to reflect fair value and may include information relating to sector indices, American Depositary Receipts and domestic and foreign index futures. Foreign securities may have additional risks including exchange rate changes, potential for sharply devalued currencies and high inflation, political and economic upheaval, the relative lack of issuer information, relatively low market liquidity and the potential lack of strict financial and accounting controls and standards.
Securities for which market prices are not provided by any of the above methods may be valued based upon quotes furnished by independent sources. The last bid price may be used to value equity securities. The mean between the last bid and asked prices is used to value debt obligations, including corporate loans.
Securities for which market quotations are not readily available or became unreliable are valued at fair value as determined in good faith by or under the supervision of the Trust’s officers following procedures approved by the Board of Trustees. Issuer specific events, market trends, bid/asked quotes of brokers and information providers and other market data may be reviewed in the course of making a good faith determination of a security’s fair value.
The Fund may invest in securities that are subject to interest rate risk, meaning the risk that the prices will generally fall as interest rates rise and, conversely, the prices will generally rise as interest rates fall. Specific securities differ in their sensitivity to changes in interest rates depending on their individual characteristics. Changes in interest rates may result in increased market volatility, which may affect the value and/or liquidity of certain Fund investments.
Valuations change in response to many factors including the historical and prospective earnings of the issuer, the value of the issuer’s assets, general market conditions which are not specifically related to the particular issuer, such as real or perceived adverse economic conditions, changes in the general outlook for revenues or corporate earnings, changes in interest or currency rates, regional or global instability, natural or environmental disasters, widespread disease or other public health issues, war, acts of terrorism or adverse investor sentiment generally and market liquidity. Because of the inherent uncertainties of valuation, the values reflected in the financial statements may materially differ from the value received upon actual sale of those investments.
| B. | Securities Transactions and Investment Income – Securities transactions are accounted for on a trade date basis. Realized gains or losses on sales are computed on the basis of specific identification of the securities sold. Interest income (net of withholding tax, if any) is recorded on an accrual basis from settlement date and includes coupon interest and amortization of premium and accretion of discount on debt securities as applicable. Dividend income (net of withholding tax, if any) is recorded on the ex-dividend date. |
The Fund may periodically participate in litigation related to Fund investments. As such, the Fund may receive proceeds from litigation settlements. Any proceeds received are included in the Statement of Operations as realized gain (loss) for investments no longer held and as unrealized gain (loss) for investments still held.
Brokerage commissions and mark ups are considered transaction costs and are recorded as an increase to the cost basis of securities purchased and/or a reduction of proceeds on a sale of securities. Such transaction costs are included in the determination of net realized and unrealized gain (loss) from investment
| | |
| 14 | | Invesco Global Real Estate Fund |
securities reported in the Statement of Operations and the Statement of Changes in Net Assets and the net realized and unrealized gains (losses) on securities per share in the Financial Highlights. Transaction costs are included in the calculation of the Fund’s net asset value and, accordingly, they reduce the Fund’s total returns. These transaction costs are not considered operating expenses and are not reflected in net investment income reported in the Statement of Operations and the Statement of Changes in Net Assets, or the net investment income per share and the ratios of expenses and net investment income reported in the Financial Highlights, nor are they limited by any expense limitation arrangements between the Fund and the investment adviser.
The Fund allocates income and realized and unrealized capital gains and losses to a class based on the relative net assets of each class.
The Fund recharacterizes distributions received from REIT investments based on information provided by the REIT into the following categories: ordinary income, long-term and short-term capital gains, and return of capital. If information is not available on a timely basis from the REIT, the recharacterization will be based on available information which may include the previous year’s allocation. If new or additional information becomes available from the REIT at a later date, a recharacterization will be made in the following year. The Fund records as dividend income the amount recharacterized as ordinary income and as realized gain the amount recharacterized as capital gain in the Statement of Operations, and the amount recharacterized as return of capital as a reduction of the cost of the related investment. These recharacterizations are reflected in the accompanying financial statements.
| C. | Country Determination - For the purposes of making investment selection decisions and presentation in the Schedule of Investments, the investment adviser may determine the country in which an issuer is located and/or credit risk exposure based on various factors. These factors include the laws of the country under which the issuer is organized, where the issuer maintains a principal office, the country in which the issuer derives 50% or more of its total revenues and the country that has the primary market for the issuer’s securities, as well as other criteria. Among the other criteria that may be evaluated for making this determination are the country in which the issuer maintains 50% or more of its assets, the type of security, financial guarantees and enhancements, the nature of the collateral and the sponsor organization. Country of issuer and/or credit risk exposure has been determined to be the United States of America, unless otherwise noted. |
| D. | Distributions - Distributions from net investment income, if any, are declared and paid quarterly and are recorded on the ex-dividend date. Distributions from net realized capital gain, if any, are generally declared and paid annually and recorded on the ex-dividend date. The Fund may elect to treat a portion of the proceeds from redemptions as distributions for federal income tax purposes. |
| E. | Federal Income Taxes - The Fund intends to comply with the requirements of Subchapter M of the Internal Revenue Code of 1986, as amended (the “Internal Revenue Code”), necessary to qualify as a regulated investment company and to distribute substantially all of the Fund’s taxable earnings to shareholders. As such, the Fund will not be subject to federal income taxes on otherwise taxable income (including net realized capital gain) that is distributed to shareholders. Therefore, no provision for federal income taxes is recorded in the financial statements. |
The Fund recognizes the tax benefits of uncertain tax positions only when the position is more likely than not to be sustained. Management has analyzed the Fund’s uncertain tax positions and concluded that no liability for unrecognized tax benefits should be recorded related to uncertain tax positions. Management is not aware of any tax positions for which it is reasonably possible that the total amounts of unrecognized tax benefits will change materially in the next 12 months.
The Fund files tax returns in the U.S. Federal jurisdiction and certain other jurisdictions. Generally, the Fund is subject to examinations by such taxing authorities for up to three years after the filing of the return for the tax period.
| F. | Expenses - Fees provided for under the Rule 12b-1 plan of a particular class of the Fund are charged to the operations of such class. Transfer agency fees and expenses and other shareholder recordkeeping fees and expenses attributable to Class R5 and Class R6 are allocated based on relative net assets of Class R5 and Class R6. Sub-accounting fees attributable to Class R5 are charged to the operations of the class. Transfer agency fees and expenses and other shareholder recordkeeping fees and expenses relating to all other classes are allocated among those classes based on relative net assets. All other expenses are allocated among the classes based on relative net assets. |
| G. | Accounting Estimates - The preparation of financial statements in conformity with accounting principles generally accepted in the United States of America (“GAAP”) requires management to make estimates and assumptions that affect the reported amounts of assets and liabilities at the date of the financial statements and the reported amounts of revenues and expenses during the reporting period including estimates and assumptions related to taxation. Actual results could differ from those estimates by a significant amount. In addition, the Fund monitors for material events or transactions that may occur or become known after the period-end date and before the date the financial statements are released to print. |
| H. | Indemnifications - Under the Trust’s organizational documents, each Trustee, officer, employee or other agent of the Trust is indemnified against certain liabilities that may arise out of the performance of their duties to the Fund. Additionally, in the normal course of business, the Fund enters into contracts, including the Fund’s servicing agreements, that contain a variety of indemnification clauses. The Fund’s maximum exposure under these arrangements is unknown as this would involve future claims that may be made against the Fund that have not yet occurred. The risk of material loss as a result of such indemnification claims is considered remote. |
| I. | Securities Lending - The Fund may lend portfolio securities having a market value up to one-third of the Fund’s total assets. Such loans are secured by collateral equal to no less than the market value of the loaned securities determined daily by the securities lending provider. Such collateral will be cash or debt securities issued or guaranteed by the U.S. Government or any of its sponsored agencies. Cash collateral received in connection with these loans is invested in short-term money market instruments or affiliated, unregistered investment companies that comply with Rule 2a-7 under the 1940 Act and money market funds (collectively, “affiliated money market funds”) and is shown as such on the Schedule of Investments. The Fund bears the risk of loss with respect to the investment of collateral. It is the Fund’s policy to obtain additional collateral from or return excess collateral to the borrower by the end of the next business day, following the valuation date of the securities loaned. Therefore, the value of the collateral held may be temporarily less than the value of the securities on loan. When loaning securities, the Fund retains certain benefits of owning the securities, including the economic equivalent of dividends or interest generated by the security. Lending securities entails a risk of loss to the Fund if, and to the extent that, the market value of the securities loaned were to increase and the borrower did not increase the collateral accordingly, and the borrower failed to return the securities. The securities loaned are subject to termination at the option of the borrower or the Fund. Upon termination, the borrower will return to the Fund the securities loaned and the Fund will return the collateral. Upon the failure of the borrower to return the securities, collateral may be liquidated and the securities may be purchased on the open market to replace the loaned securities. The Fund could experience delays and costs in gaining access to the collateral and the securities may lose value during the delay which could result in potential losses to the Fund. |
Some of these losses may be indemnified by the lending agent. The Fund bears the risk of any deficiency in the amount of the collateral available for return to the borrower due to any loss on the collateral invested. Dividends received on cash collateral investments for securities lending transactions, which are net of compensation to counterparties, are included in Dividends from affiliated money market funds on the Statement of Operations. The aggregate value of securities out on loan, if any, is shown as a footnote on the Statement of Assets and Liabilities.
On September 29, 2021, the Board of Trustees appointed Invesco Advisers, Inc. (the “Adviser” or “Invesco”) to serve as an affiliated securities lending agent for the Fund. Prior to September 29, 2021, the Bank of New York Mellon (“BNYM”) served as the sole securities lending agent for the Fund under the securities lending program. BNYM also continues to serve as a lending agent. To the extent the Fund utilizes the Adviser as an affiliated securities lending agent, the Fund conducts its securities lending in accordance with, and in reliance upon, no-action letters issued by the SEC staff that provide guidance on how an affiliate may act as a direct agent lender and receive compensation for those services in a manner consistent with the federal securities laws. For the year ended February 28, 2022, fees paid to the Adviser were less than $500.
| J. | Foreign Currency Translations - Foreign currency is valued at the close of the NYSE based on quotations posted by banks and major currency dealers. Portfolio securities and other assets and liabilities denominated in foreign currencies are translated into U.S. dollar amounts at the date of valuation. Purchases and sales of portfolio securities (net of foreign taxes withheld on disposition) and income items denominated in foreign currencies are translated into U.S. dollar |
| | |
| 15 | | Invesco Global Real Estate Fund |
| | amounts on the respective dates of such transactions. The Fund does not separately account for the portion of the results of operations resulting from changes in foreign exchange rates on investments and the fluctuations arising from changes in market prices of securities held. The combined results of changes in foreign exchange rates and the fluctuation of market prices on investments (net of estimated foreign tax withholding) are included with the net realized and unrealized gain or loss from investments in the Statement of Operations. Reported net realized foreign currency gains or losses arise from (1) sales of foreign currencies, (2) currency gains or losses realized between the trade and settlement dates on securities transactions, and (3) the difference between the amounts of dividends, interest, and foreign withholding taxes recorded on the Fund’s books and the U.S. dollar equivalent of the amounts actually received or paid. Net unrealized foreign currency gains and losses arise from changes in the fair values of assets and liabilities, other than investments in securities at fiscal period end, resulting from changes in exchange rates. |
The Fund may invest in foreign securities, which may be subject to foreign taxes on income, gains on investments or currency repatriation, a portion of which may be recoverable. Foreign taxes, if any, are recorded based on the tax regulations and rates that exist in the foreign markets in which the Fund invests and are shown in the Statement of Operations.
| K. | Forward Foreign Currency Contracts - The Fund may engage in foreign currency transactions either on a spot (i.e. for prompt delivery and settlement) basis, or through forward foreign currency contracts, to manage or minimize currency or exchange rate risk. |
The Fund may also enter into forward foreign currency contracts for the purchase or sale of a security denominated in a foreign currency in order to “lock in” the U.S. dollar price of that security, or the Fund may also enter into forward foreign currency contracts that do not provide for physical settlement of the two currencies, but instead are settled by a single cash payment calculated as the difference between the agreed upon exchange rate and the spot rate at settlement based upon an agreed upon notional amount (non-deliverable forwards). The Fund will set aside liquid assets in an amount equal to the daily mark-to-market obligation for forward foreign currency contracts.
A forward foreign currency contract is an obligation between two parties (“Counterparties”) to purchase or sell a specific currency for an agreed-upon price at a future date. The use of forward foreign currency contracts does not eliminate fluctuations in the price of the underlying securities the Fund owns or intends to acquire but establishes a rate of exchange in advance. Fluctuations in the value of these contracts are measured by the difference in the contract date and reporting date exchange rates and are recorded as unrealized appreciation (depreciation) until the contracts are closed. When the contracts are closed, realized gains (losses) are recorded. Realized and unrealized gains (losses) on the contracts are included in the Statement of Operations. The primary risks associated with forward foreign currency contracts include failure of the Counterparty to meet the terms of the contract and the value of the foreign currency changing unfavorably. These risks may be in excess of the amounts reflected in the Statement of Assets and Liabilities.
| L. | Other Risks - The Fund’s investments are concentrated in a comparatively narrow segment of the economy. Consequently, the Fund may tend to be more volatile than other mutual funds, and the value of the Fund’s investments may tend to rise and fall more rapidly. |
Because the Fund concentrates its assets in the real estate industry, an investment in the Fund will be closely linked to the performance of the real estate markets. Property values may fall due to increasing vacancies or declining rents resulting from economic, legal, cultural or technological developments.
Active trading of portfolio securities may result in added expenses, a lower return and increased tax liability.
Emerging markets (also referred to as developing markets) are generally subject to greater market volatility, political, social and economic instability, uncertainty regarding the existence of trading markets and more governmental limitations on foreign investment than more developed markets. In addition, companies operating in emerging markets may be subject to lower trading volume and greater price fluctuations than companies in more developed markets. Securities law in many emerging market countries is relatively new and unsettled. Therefore, laws regarding foreign investment in emerging market securities, securities regulation, title to securities, and shareholder rights may change quickly and unpredictably. In addition, the enforcement of systems of taxation at federal, regional and local levels in emerging market countries may be inconsistent, and subject to sudden change. Other risks of investing in emerging markets securities may include additional transaction costs, delays in settlement procedures, and lack of timely information.
| M. | COVID-19 Risk - The COVID-19 strain of coronavirus has resulted in instances of market closures and dislocations, extreme volatility, liquidity constraints and increased trading costs. Efforts to contain its spread have resulted in travel restrictions, disruptions of healthcare systems, business operations (including business closures) and supply chains, layoffs, lower consumer demand and employee availability, and defaults and credit downgrades, among other significant economic impacts that have disrupted global economic activity across many industries. Such economic impacts may exacerbate other pre-existing political, social and economic risks locally or globally and cause general concern and uncertainty. |
The full economic impact and ongoing effects of COVID-19 (or other future epidemics or pandemics) at the macro-level and on individual businesses are unpredictable and may result in significant and prolonged effects on the Fund’s performance.
NOTE 2–Advisory Fees and Other Fees Paid to Affiliates
The Trust has entered into a master investment advisory agreement with the Adviser. Under the terms of the investment advisory agreement, the Fund accrues daily and pays monthly an advisory fee to the Adviser based on the annual rate of the Fund’s average daily net assets as follows:
| | | | |
| Average Daily Net Assets | | Rate | |
|
| |
First $ 250 million | | | 0.750% | |
|
| |
Next $250 million | | | 0.740% | |
|
| |
Next $500 million | | | 0.730% | |
|
| |
Next $1.5 billion | | | 0.720% | |
|
| |
Next $2.5 billion | | | 0.710% | |
|
| |
Next $2.5 billion | | | 0.700% | |
|
| |
Next $2.5 billion | | | 0.690% | |
|
| |
Over $10 billion | | | 0.680% | |
|
| |
For the year ended February 28, 2022, the effective advisory fee rate incurred by the Fund was 0.74%.
Under the terms of a master sub-advisory agreement between the Adviser and each of Invesco Asset Management Deutschland GmbH, Invesco Asset Management Limited, Invesco Asset Management (Japan) Limited, Invesco Hong Kong Limited, Invesco Senior Secured Management, Inc. and Invesco Canada Ltd. and separate sub-advisory agreements with Invesco Capital Management LLC and Invesco Asset Management (India) Private Limited (collectively, the “Affiliated Sub-Advisers”) the Adviser, not the Fund, will pay 40% of the fees paid to the Adviser to any such Affiliated Sub-Adviser(s) that provide(s) discretionary investment management services to the Fund based on the percentage of assets allocated to such Affiliated Sub-Adviser(s).
The Adviser has contractually agreed, through at least June 30, 2022, to waive advisory fees and/or reimburse expenses of all shares to the extent necessary to limit total annual fund operating expenses after fee waiver and/or expense reimbursement (excluding certain items discussed below) of Class A, Class C, Class R, Class Y, Class R5 and Class R6 shares to 2.00%, 2.75%, 2.25%, 1.75%, 1.75% and 1.75%, respectively, of the Fund’s average daily net assets (the “expense limits”). In determining the Adviser’s obligation to waive advisory fees and/or reimburse expenses, the following expenses are not taken into account, and could cause the total annual fund operating expenses after fee waiver and/or reimbursement to exceed the numbers reflected above: (1) interest; (2) taxes; (3) dividend expense on short sales; (4) extraordinary or non-routine items, including litigation expenses; and (5) expenses that the Fund has incurred but did not actually pay because of an
| | |
| 16 | | Invesco Global Real Estate Fund |
expense offset arrangement. Unless Invesco continues the fee waiver agreement, it will terminate on June 30, 2022. During its term, the fee waiver agreement cannot be terminated or amended to increase the expense limits or reduce the advisory fee waivers without approval of the Board of Trustees. The Adviser did not waive fees and/or reimburse expenses during the period under this expense limit.
Further, the Adviser has contractually agreed, through at least June 30, 2023, to waive the advisory fee payable by the Fund in an amount equal to 100% of the net advisory fees the Adviser receives from the affiliated money market funds on investments by the Fund of uninvested cash (excluding investments of cash collateral from securities lending) in such affiliated money market funds.
For the year ended February 28, 2022, the Adviser waived advisory fees of $807.
The Trust has entered into a master administrative services agreement with Invesco pursuant to which the Fund has agreed to pay Invesco for certain administrative costs incurred in providing accounting services to the Fund. For the year ended February 28, 2022, expenses incurred under the agreement are shown in the Statement of Operations as Administrative services fees. Invesco has entered into a sub-administration agreement whereby State Street Bank and Trust Company (“SSB”) serves as fund accountant and provides certain administrative services to the Fund. Pursuant to a custody agreement with the Trust on behalf of the Fund, SSB also serves as the Fund’s custodian.
The Trust has entered into a transfer agency and service agreement with Invesco Investment Services, Inc. (“IIS”) pursuant to which the Fund has agreed to pay IIS a fee for providing transfer agency and shareholder services to the Fund and reimburse IIS for certain expenses incurred by IIS in the course of providing such services. IIS may make payments to intermediaries that provide omnibus account services, sub-accounting services and/or networking services. All fees payable by IIS to intermediaries that provide omnibus account services or sub-accounting services are charged back to the Fund, subject to certain limitations approved by the Trust’s Board of Trustees. For the year ended February 28, 2022, expenses incurred under the agreement are shown in the Statement of Operations as Transfer agent fees.
The Trust has entered into master distribution agreements with Invesco Distributors, Inc. (“IDI”) to serve as the distributor for the Class A, Class C, Class R, Class Y, Class R5 and Class R6 shares of the Fund. The Trust has adopted plans pursuant to Rule 12b-1 under the 1940 Act with respect to the Fund’s Class A, Class C and Class R shares (collectively, the “Plans”). The Fund, pursuant to the Plans, pays IDI compensation at the annual rate of 0.25% of the Fund’s average daily net assets of Class A shares, 1.00% of the average daily net assets of Class C shares and 0.50% of the average daily net assets of Class R shares. The fees are accrued daily and paid monthly. Of the Plan payments, up to 0.25% of the average daily net assets of each class of shares may be paid to furnish continuing personal shareholder services to customers who purchase and own shares of such classes. Any amounts not paid as a service fee under the Plans would constitute an asset-based sales charge. Rules of the Financial Industry Regulatory Authority (“FINRA”) impose a cap on the total sales charges, including asset-based sales charges, that may be paid by any class of shares of the Fund. For the year ended February 28, 2022, expenses incurred under the Plans are shown in the Statement of Operations as Distribution fees.
Front-end sales commissions and CDSC (collectively, the “sales charges”) are not recorded as expenses of the Fund. Front-end sales commissions are deducted from proceeds from the sales of Fund shares prior to investment in Class A shares of the Fund. CDSC are deducted from redemption proceeds prior to remittance to the shareholder. During the year ended February 28, 2022, IDI advised the Fund that IDI retained $12,488 in front-end sales commissions from the sale of Class A shares and $84 and $120 from Class A and Class C shares, respectively, for CDSC imposed upon redemptions by shareholders.
Certain officers and trustees of the Trust are officers and directors of the Adviser, IIS and/or IDI.
NOTE 3–Additional Valuation Information
GAAP defines fair value as the price that would be received to sell an asset or paid to transfer a liability in an orderly transaction between market participants at the measurement date, under current market conditions. GAAP establishes a hierarchy that prioritizes the inputs to valuation methods, giving the highest priority to readily available unadjusted quoted prices in an active market for identical assets (Level 1) and the lowest priority to significant unobservable inputs (Level 3), generally when market prices are not readily available or are unreliable. Based on the valuation inputs, the securities or other investments are tiered into one of three levels. Changes in valuation methods may result in transfers in or out of an investment’s assigned level:
| | |
| Level 1 – | | Prices are determined using quoted prices in an active market for identical assets. |
| Level 2 – | | Prices are determined using other significant observable inputs. Observable inputs are inputs that other market participants may use in pricing a security. These may include quoted prices for similar securities, interest rates, prepayment speeds, credit risk, yield curves, loss severities, default rates, discount rates, volatilities and others. |
| Level 3 – | | Prices are determined using significant unobservable inputs. In situations where quoted prices or observable inputs are unavailable (for example, when there is little or no market activity for an investment at the end of the period), unobservable inputs may be used. Unobservable inputs reflect the Fund’s own assumptions about the factors market participants would use in determining fair value of the securities or instruments and would be based on the best available information. |
The following is a summary of the tiered valuation input levels, as of February 28, 2022. The level assigned to the securities valuations may not be an indication of the risk or liquidity associated with investing in those securities. Because of the inherent uncertainties of valuation, the values reflected in the financial statements may materially differ from the value received upon actual sale of those investments.
| | | | | | | | | | | | | | | | |
| | | Level 1 | | | Level 2 | | | Level 3 | | | Total | |
|
| |
Investments in Securities | | | | | | | | | | | | | | | | |
|
| |
Australia | | $ | – | | | $ | 17,132,774 | | | | $– | | | $ | 17,132,774 | |
|
| |
Belgium | | | – | | | | 6,928,719 | | | | – | | | | 6,928,719 | |
|
| |
Canada | | | 9,276,912 | | | | – | | | | – | | | | 9,276,912 | |
|
| |
France | | | – | | | | 3,722,141 | | | | – | | | | 3,722,141 | |
|
| |
Germany | | | – | | | | 27,471,779 | | | | – | | | | 27,471,779 | |
|
| |
Hong Kong | | | – | | | | 20,971,540 | | | | – | | | | 20,971,540 | |
|
| |
Japan | | | – | | | | 45,002,270 | | | | – | | | | 45,002,270 | |
|
| |
Malta | | | – | | | | – | | | | 11 | | | | 11 | |
|
| |
Singapore | | | – | | | | 11,519,840 | | | | – | | | | 11,519,840 | |
|
| |
Spain | | | – | | | | 5,526,295 | | | | – | | | | 5,526,295 | |
|
| |
Sweden | | | – | | | | 7,976,240 | | | | – | | | | 7,976,240 | |
|
| |
United Kingdom | | | – | | | | 19,070,552 | | | | – | | | | 19,070,552 | |
|
| |
United States | | | 279,677,668 | | | | – | | | | – | | | | 279,677,668 | |
|
| |
Money Market Funds | | | 5,320,905 | | | | 13,675,416 | | | | – | | | | 18,996,321 | |
|
| |
Total Investments | | $ | 294,275,485 | | | $ | 178,997,566 | | | | $11 | | | $ | 473,273,062 | |
|
| |
| | |
| 17 | | Invesco Global Real Estate Fund |
NOTE 4–Expense Offset Arrangement(s)
The expense offset arrangement is comprised of transfer agency credits which result from balances in demand deposit accounts used by the transfer agent for clearing shareholder transactions. For the year ended February 28, 2022, the Fund received credits from this arrangement, which resulted in the reduction of the Fund’s total expenses of $257.
NOTE 5–Trustees’ and Officers’ Fees and Benefits
Trustees’ and Officers’ Fees and Benefits include amounts accrued by the Fund to pay remuneration to certain Trustees and Officers of the Fund. Trustees have the option to defer compensation payable by the Fund, and Trustees’ and Officers’ Fees and Benefits also include amounts accrued by the Fund to fund such deferred compensation amounts. Those Trustees who defer compensation have the option to select various Invesco Funds in which their deferral accounts shall be deemed to be invested. Finally, certain current Trustees were eligible to participate in a retirement plan that provided for benefits to be paid upon retirement to Trustees over a period of time based on the number of years of service. The Fund may have certain former Trustees who also participate in a retirement plan and receive benefits under such plan. Trustees’ and Officers’ Fees and Benefits include amounts accrued by the Fund to fund such retirement benefits. Obligations under the deferred compensation and retirement plans represent unsecured claims against the general assets of the Fund.
NOTE 6–Cash Balances
The Fund is permitted to temporarily carry a negative or overdrawn balance in its account with SSB, the custodian bank. Such balances, if any at period-end, are shown in the Statement of Assets and Liabilities under the payable caption Amount due custodian. To compensate the custodian bank for such overdrafts, the overdrawn Fund may either (1) leave funds as a compensating balance in the account so the custodian bank can be compensated by earning the additional interest; or (2) compensate by paying the custodian bank at a rate agreed upon by the custodian bank and Invesco, not to exceed the contractually agreed upon rate. The Fund may not purchase additional securities when any borrowings from banks or broker-dealers exceed 5% of the Fund’s total assets, or when any borrowings from an Invesco Fund are outstanding.
NOTE 7–Distributions to Shareholders and Tax Components of Net Assets
Tax Character of Distributions to Shareholders Paid During the Fiscal Years Ended February 28, 2022 and 2021:
| | | | | | | | | | | | |
| | | 2022 | | | | | | 2021 | |
|
| |
Ordinary income* | | $ | 14,857,511 | | | | | | | $ | 13,455,296 | |
|
| |
Long-term capital gain | | | — | | | | | | | | 14,837,069 | |
|
| |
Total distributions | | $ | 14,857,511 | | | | | | | $ | 28,292,365 | |
|
| |
| * | Includes short-term capital gain distributions, if any. |
Tax Components of Net Assets at Period-End:
| | | | |
| | | 2022 | |
|
| |
Undistributed ordinary income | | $ | 817,760 | |
|
| |
Undistributed long-term capital gain | | | 7,482,928 | |
|
| |
Net unrealized appreciation – investments | | | 54,276,117 | |
|
| |
Net unrealized appreciation (depreciation) – foreign currencies | | | (11,739 | ) |
|
| |
Temporary book/tax differences | | | (94,907 | ) |
|
| |
Shares of beneficial interest | | | 396,068,103 | |
|
| |
Total net assets | | $ | 458,538,262 | |
|
| |
The difference between book-basis and tax-basis unrealized appreciation (depreciation) is due to differences in the timing of recognition of gains and losses on investments for tax and book purposes. The Fund’s net unrealized appreciation (depreciation) difference is attributable primarily to wash sales and passive foreign investment companies.
The temporary book/tax differences are a result of timing differences between book and tax recognition of income and/or expenses. The Fund’s temporary book/tax differences are the result of the trustee deferral of compensation and retirement plan benefits.
Capital loss carryforward is calculated and reported as of a specific date. Results of transactions and other activity after that date may affect the amount of capital loss carryforward actually available for the Fund to utilize. The ability to utilize capital loss carryforward in the future may be limited under the Internal Revenue Code and related regulations based on the results of future transactions.
The Fund does not have a capital loss carryforward as of February 28, 2022.
NOTE 8–Investment Transactions
The aggregate amount of investment securities (other than short-term securities, U.S. Government obligations and money market funds, if any) purchased and sold by the Fund during the year ended February 28, 2022 was $449,733,449 and $581,248,774, respectively. Cost of investments, including any derivatives, on a tax basis includes the adjustments for financial reporting purposes as of the most recently completed federal income tax reporting period-end.
| | | | |
Unrealized Appreciation (Depreciation) of Investments on a Tax Basis | |
Aggregate unrealized appreciation of investments | | | $66,143,407 | |
|
| |
Aggregate unrealized (depreciation) of investments | | | (11,867,290 | ) |
|
| |
Net unrealized appreciation of investments | | | $54,276,117 | |
|
| |
Cost of investments for tax purposes is $418,996,945.
| | |
| 18 | | Invesco Global Real Estate Fund |
NOTE 9–Reclassification of Permanent Differences
Primarily as a result of differing book/tax treatment of passive foreign investment companies, on February 28, 2022, undistributed net investment income was increased by $9,263,606 and undistributed net realized gain was decreased by $9,263,606. This reclassification had no effect on the net assets or the distributable earnings of the Fund.
NOTE 10–Share Information
| | | | | | | | | | | | | | | | |
| | | Summary of Share Activity | |
|
| |
| | |
| | | Year ended | | | Year ended | |
| | | February 28, 2022(a) | | | February 28, 2021 | |
| | | Shares | | | Amount | | | Shares | | | Amount | |
|
| |
Sold: | | | | | | | | | | | | | | | | |
Class A | | | 1,070,428 | | | $ | 12,747,642 | | | | 1,349,484 | | | $ | 13,071,621 | |
|
| |
Class C | | | 94,122 | | | | 1,128,552 | | | | 89,374 | | | | 913,658 | |
|
| |
Class R | | | 573,756 | | | | 6,828,350 | | | | 858,679 | | | | 8,250,509 | |
|
| |
Class Y | | | 1,057,626 | | | | 12,365,470 | | | | 3,660,820 | | | | 35,900,779 | |
|
| |
Class R5 | | | 1,892,974 | | | | 22,276,270 | | | | 2,840,633 | | | | 28,148,666 | |
|
| |
Class R6 | | | 2,322,240 | | | | 27,388,791 | | | | 5,088,501 | | | | 48,468,462 | |
|
| |
| | | | |
Issued as reinvestment of dividends: | | | | | | | | | | | | | | | | |
Class A | | | 226,269 | | | | 2,670,148 | | | | 482,379 | | | | 4,790,055 | |
|
| |
Class C | | | 7,866 | | | | 93,000 | | | | 25,955 | | | | 259,864 | |
|
| |
Class R | | | 50,494 | | | | 596,149 | | | | 98,537 | | | | 987,130 | |
|
| |
Class Y | | | 126,802 | | | | 1,493,421 | | | | 343,183 | | | | 3,376,720 | |
|
| |
Class R5 | | | 269,883 | | | | 3,153,094 | | | | 625,118 | | | | 6,153,843 | |
|
| |
Class R6 | | | 452,413 | | | | 5,308,016 | | | | 963,658 | | | | 9,522,735 | |
|
| |
| | | | |
Automatic conversion of Class C shares to Class A shares: | | | | | | | | | | | | | | | | |
Class A | | | 57,167 | | | | 675,193 | | | | 263,600 | | | | 2,643,502 | |
|
| |
Class C | | | (57,084 | ) | | | (675,193 | ) | | | (263,139 | ) | | | (2,643,502 | ) |
|
| |
| | | | |
Reacquired: | | | | | | | | | | | | | | | | |
Class A | | | (2,165,101 | ) | | | (25,579,654 | ) | | | (4,316,104 | ) | | | (42,918,422 | ) |
|
| |
Class C | | | (119,811 | ) | | | (1,437,077 | ) | | | (386,968 | ) | | | (3,839,459 | ) |
|
| |
Class R | | | (696,095 | ) | | | (8,272,030 | ) | | | (690,057 | ) | | | (6,930,103 | ) |
|
| |
Class Y | | | (5,896,319 | ) | | | (68,356,408 | ) | | | (7,712,404 | ) | | | (76,281,725 | ) |
|
| |
Class R5 | | | (6,204,845 | ) | | | (73,575,170 | ) | | | (5,981,799 | ) | | | (59,446,874 | ) |
|
| |
Class R6 | | | (4,040,623 | ) | | | (47,636,890 | ) | | | (7,702,425 | ) | | | (77,359,595 | ) |
|
| |
Net increase (decrease) in share activity | | | (10,977,838 | ) | | $ | (128,808,326 | ) | | | (10,362,975 | ) | | $ | (106,932,136 | ) |
|
| |
| (a) | There are entities that are record owners of more than 5% of the outstanding shares of the Fund and in the aggregate own 56% of the outstanding shares of the Fund. IDI has an agreement with these entities to sell Fund shares. The Fund, Invesco and/or Invesco affiliates may make payments to these entities, which are considered to be related to the Fund, for providing services to the Fund, Invesco and/or Invesco affiliates including but not limited to services such as securities brokerage, distribution, third party record keeping and account servicing. The Fund has no knowledge as to whether all or any portion of the shares owned of record by these entities are also owned beneficially. |
| | |
| 19 | | Invesco Global Real Estate Fund |
Report of Independent Registered Public Accounting Firm
To the Board of Trustees of AIM Investment Securities Funds (Invesco Investment Securities Funds) and Shareholders of Invesco Global Real Estate Fund
Opinion on the Financial Statements
We have audited the accompanying statement of assets and liabilities, including the schedule of investments, of Invesco Global Real Estate Fund (one of the funds constituting AIM Investment Securities Funds (Invesco Investment Securities Funds), referred to hereafter as the “Fund”) as of February 28, 2022, the related statement of operations for the year ended February 28, 2022, the statement of changes in net assets for each of the two years in the period ended February 28, 2022, including the related notes, and the financial highlights for each of the five years in the period ended February 28, 2022 (collectively referred to as the “financial statements”). In our opinion, the financial statements present fairly, in all material respects, the financial position of the Fund as of February 28, 2022, the results of its operations for the year then ended, the changes in its net assets for each of the two years in the period ended February 28, 2022 and the financial highlights for each of the five years in the period ended February 28, 2022 in conformity with accounting principles generally accepted in the United States of America.
Basis for Opinion
These financial statements are the responsibility of the Fund’s management. Our responsibility is to express an opinion on the Fund’s financial statements based on our audits. We are a public accounting firm registered with the Public Company Accounting Oversight Board (United States) (PCAOB) and are required to be independent with respect to the Fund in accordance with the U.S. federal securities laws and the applicable rules and regulations of the Securities and Exchange Commission and the PCAOB.
We conducted our audits of these financial statements in accordance with the standards of the PCAOB. Those standards require that we plan and perform the audit to obtain reasonable assurance about whether the financial statements are free of material misstatement, whether due to error or fraud.
Our audits included performing procedures to assess the risks of material misstatement of the financial statements, whether due to error or fraud, and performing procedures that respond to those risks. Such procedures included examining, on a test basis, evidence regarding the amounts and disclosures in the financial statements. Our audits also included evaluating the accounting principles used and significant estimates made by management, as well as evaluating the overall presentation of the financial statements. Our procedures included confirmation of securities owned as of February 28, 2022 by correspondence with the custodian, transfer agent and brokers; when replies were not received from brokers, we performed other auditing procedures. We believe that our audits provide a reasonable basis for our opinion.
/s/PricewaterhouseCoopers LLP
Houston, Texas
April 28, 2022
We have served as the auditor of one or more of the investment companies in the Invesco group of investment companies since at least 1995. We have not been able to determine the specific year we began serving as auditor.
| | |
| 20 | | Invesco Global Real Estate Fund |
Calculating your ongoing Fund expenses
Example
As a shareholder of the Fund, you incur two types of costs: (1) transaction costs, which may include sales charges (loads) on purchase payments or contingent deferred sales charges on redemptions, if any; and (2) ongoing costs, including management fees, distribution and/or service (12b-1) fees, and other Fund expenses. This example is intended to help you understand your ongoing costs (in dollars) of investing in the Fund and to compare these costs with ongoing costs of investing in other mutual funds. The example is based on an investment of $1,000 invested at the beginning of the period and held for the entire period September 1, 2021 through February 28, 2022.
Actual expenses
The table below provides information about actual account values and actual expenses. You may use the information in this table, together with the amount you invested, to estimate the expenses that you paid over the period. Simply divide your account value by $1,000 (for example, an $8,600 account value divided by $1,000 = 8.6), then multiply the result by the number in the table under the heading entitled “Actual Expenses Paid During Period” to estimate the expenses you paid on your account during this period.
Hypothetical example for comparison purposes
The table below also provides information about hypothetical account values and hypothetical expenses based on the Fund’s actual expense ratio and an assumed rate of return of 5% per year before expenses, which is not the Fund’s actual return.
The hypothetical account values and expenses may not be used to estimate the actual ending account balance or expenses you paid for the period. You may use this information to compare the ongoing costs of investing in the Fund and other funds. To do so, compare this 5% hypothetical example with the 5% hypothetical examples that appear in the shareholder reports of the other funds.
Please note that the expenses shown in the table are meant to highlight your ongoing costs only and do not reflect any transaction costs, such as sales charges (loads) on purchase payments or contingent deferred sales charges on redemptions, if any. Therefore, the hypothetical information is useful in comparing ongoing costs only, and will not help you determine the relative total costs of owning different funds. In addition, if these transaction costs were included, your costs would have been higher.
| | | | | | | | | | | | |
| | | | | ACTUAL | | HYPOTHETICAL
(5% annual return before
expenses) | | |
| | | Beginning
Account Value
(09/01/21) | | Ending
Account Value
(02/28/22)1 | | Expenses
Paid During
Period2 | | Ending
Account Value
(02/28/22) | | Expenses
Paid During
Period2 | | Annualized
Expense
Ratio |
Class A | | $1,000.00 | | $951.90 | | $6.05 | | $1,018.60 | | $6.26 | | 1.25% |
Class C | | 1,000.00 | | 948.30 | | 9.66 | | 1,014.88 | | 9.99 | | 2.00 |
Class R | | 1,000.00 | | 950.60 | | 7.25 | | 1,017.36 | | 7.50 | | 1.50 |
Class Y | | 1,000.00 | | 953.00 | | 4.84 | | 1,019.84 | | 5.01 | | 1.00 |
Class R5 | | 1,000.00 | | 953.40 | | 4.31 | | 1,020.38 | | 4.46 | | 0.89 |
Class R6 | | 1,000.00 | | 953.80 | | 3.92 | | 1,020.78 | | 4.06 | | 0.81 |
| 1 | The actual ending account value is based on the actual total return of the Fund for the period September 1, 2021 through February 28, 2022, after actual expenses and will differ from the hypothetical ending account value which is based on the Fund’s expense ratio and a hypothetical annual return of 5% before expenses. |
| 2 | Expenses are equal to the Fund’s annualized expense ratio as indicated above multiplied by the average account value over the period, multiplied by 181/365 to reflect the most recent fiscal half year. |
| | |
| 21 | | Invesco Global Real Estate Fund |
Tax Information
Form 1099-DIV, Form 1042-S and other year – end tax information provide shareholders with actual calendar year amounts that should be included in their tax returns. Shareholders should consult their tax advisers.
The following distribution information is being provided as required by the Internal Revenue Code or to meet a specific state’s requirement.
The Fund designates the following amounts or, if subsequently determined to be different, the maximum amount allowable for its fiscal year ended February 28, 2022:
| | | | |
Federal and State Income Tax | | | |
Qualified Dividend Income* | | | 32.48 | % |
Corporate Dividends Received Deduction* | | | 0.00 | % |
U.S. Treasury Obligations* | | | 0.00 | % |
Qualified Business Income* | | | 29.08 | % |
Business Interest Income* | | | 0.00 | % |
* The above percentages are based on ordinary income dividends paid to shareholders during the Fund’s fiscal year.
| | |
| 22 | | Invesco Global Real Estate Fund |
Trustees and Officers
The address of each trustee and officer is AIM Investment Securities Funds (Invesco Investment Securities Funds) (the “Trust”), 11 Greenway Plaza, Suite 1000, Houston, Texas 77046-1173. The trustees serve for the life of the Trust, subject to their earlier death, incapacitation, resignation, retirement or removal as more specifically provided in the Trust’s organizational documents. Each officer serves for a one year term or until their successors are elected and qualified. Column two below includes length of time served with predecessor entities, if any.
| | | | | | | | |
Name, Year of Birth and Position(s) Held with the Trust | | Trustee and/or Officer Since | | Principal Occupation(s) During Past 5 Years | | Number of Funds in Fund Complex Overseen by Trustee | | Other Directorship(s) Held by Trustee During Past 5 Years |
| Interested Trustee | | | | | | | | |
Martin L. Flanagan1 - 1960 Trustee and Vice Chair | | 2007 | | Executive Director, Chief Executive Officer and President, Invesco Ltd. (ultimate parent of Invesco and a global investment management firm); Trustee and Vice Chair, The Invesco Funds; Vice Chair, Investment Company Institute; and Member of Executive Board, SMU Cox School of Business Formerly: Advisor to the Board, Invesco Advisers, Inc. (formerly known as Invesco Institutional (N.A.), Inc.); Chairman and Chief Executive Officer, Invesco Advisers, Inc. (registered investment adviser); Director, Chairman, Chief Executive Officer and President, Invesco Holding Company (US), Inc. (formerly IVZ Inc.) (holding company), Invesco Group Services, Inc. (service provider) and Invesco North American Holdings, Inc. (holding company); Director, Chief Executive Officer and President, Invesco Holding Company Limited (parent of Invesco and a global investment management firm); Director, Invesco Ltd.; Chairman, Investment Company Institute and President, Co-Chief Executive Officer, Co-President, Chief Operating Officer and Chief Financial Officer, Franklin Resources, Inc. (global investment management organization) | | 188 | | None |
| 1 | Mr. Flanagan is considered an interested person (within the meaning of Section 2(a)(19) of the 1940 Act) of the Trust because he is an officer of the Adviser to the Trust, and an officer and a director of Invesco Ltd., ultimate parent of the Adviser. |
| | |
| T-1 | | Invesco Global Real Estate Fund |
Trustees and Officers–(continued)
| | | | | | | | |
Name, Year of Birth and Position(s) Held with the Trust | | Trustee and/or Officer Since | | Principal Occupation(s) During Past 5 Years | | Number of Funds in Fund Complex Overseen by Trustee | | Other Directorship(s) Held by Trustee During Past 5 Years |
| Independent Trustees | | | | | | | | |
Christopher L. Wilson - 1957 Trustee and Chair | | 2017 | | Retired Formerly: Director, TD Asset Management USA Inc. (mutual fund complex) (22 portfolios); Managing Partner, CT2, LLC (investing and consulting firm); President/Chief Executive Officer, Columbia Funds, Bank of America Corporation; President/Chief Executive Officer, CDC IXIS Asset Management Services, Inc.; Principal & Director of Operations, Scudder Funds, Scudder, Stevens & Clark, Inc.; Assistant Vice President, Fidelity Investments | | 188 | | Formerly: enaible, Inc. (artificial intelligence technology) Director, ISO New England, Inc. (non-profit organization managing regional electricity market) |
Beth Ann Brown - 1968 Trustee | | 2019 | | Independent Consultant Formerly: Head of Intermediary Distribution, Managing Director, Strategic Relations, Managing Director, Head of National Accounts, Senior Vice President, National Account Manager and Senior Vice President, Key Account Manager, Columbia Management Investment Advisers LLC; Vice President, Key Account Manager, Liberty Funds Distributor, Inc.; and Trustee of certain Oppenheimer Funds | | 188 | | Director, Board of Directors of Caron Engineering Inc.; Advisor, Board of Advisors of Caron Engineering Inc.; President and Director, Acton Shapleigh Youth Conservation Corps (non-profit) Formerly: President and Director of Grahamtastic Connection (non-profit) |
Cynthia Hostetler - 1962 Trustee | | 2017 | | Non-Executive Director and Trustee of a number of public and private business corporations Formerly: Director, Aberdeen Investment Funds (4 portfolios); Director, Artio Global Investment LLC (mutual fund complex); Director, Edgen Group, Inc. (specialized energy and infrastructure products distributor); Director, Genesee & Wyoming, Inc. (railroads); Head of Investment Funds and Private Equity, Overseas Private Investment Corporation; President, First Manhattan Bancorporation, Inc.; Attorney, Simpson Thacher & Bartlett LLP | | 188 | | Resideo Technologies, Inc. (smart home technology); Vulcan Materials Company (construction materials company); Trilinc Global Impact Fund; Textainer Group Holdings, (shipping container leasing company); Investment Company Institute (professional organization); Independent Directors Council (professional organization) |
Eli Jones - 1961 Trustee | | 2016 | | Professor and Dean Emeritus, Mays Business School - Texas A&M University Formerly: Dean of Mays Business School-Texas A&M University; Professor and Dean, Walton College of Business, University of Arkansas and E.J. Ourso College of Business, Louisiana State University; Director, Arvest Bank | | 188 | | Insperity, Inc. (formerly known as Administaff) (human resources provider); Member of Regional Board of Directors and Board of Directors, First Financial Bancorp (regional bank) |
Elizabeth Krentzman - 1959 Trustee | | 2019 | | Formerly: Principal and Chief Regulatory Advisor for Asset Management Services and U.S. Mutual Fund Leader of Deloitte & Touche LLP; General Counsel of the Investment Company Institute (trade association); National Director of the Investment Management Regulatory Consulting Practice, Principal, Director and Senior Manager of Deloitte & Touche LLP; Assistant Director of the Division of Investment Management - Office of Disclosure and Investment Adviser Regulation of the U.S. Securities and Exchange Commission and various positions with the Division of Investment Management - Office of Regulatory Policy of the U.S. Securities and Exchange Commission; Associate at Ropes & Gray LLP; and Trustee of certain Oppenheimer Funds | | 188 | | Trustee of the University of Florida National Board Foundation; Member of the Cartica Funds Board of Directors (private investment funds) Formerly: Member of the University of Florida Law Center Association, Inc. Board of Trustees, Audit Committee and Membership Committee |
Anthony J. LaCava, Jr. - 1956 Trustee | | 2019 | | Formerly: Director and Member of the Audit Committee, Blue Hills Bank (publicly traded financial institution) and Managing Partner, KPMG LLP | | 188 | | Blue Hills Bank; Chairman, Bentley University; Member, Business School Advisory Council; and Nominating Committee, KPMG LLP |
Prema Mathai-Davis - 1950 Trustee | | 1998 | | Retired Formerly: Co-Founder & Partner of Quantalytics Research, LLC, (a FinTech Investment Research Platform for the Self-Directed Investor); Trustee of YWCA Retirement Fund; CEO of YWCA of the USA; Board member of the NY Metropolitan Transportation Authority; Commissioner of the NYC Department of Aging; Board member of Johns Hopkins Bioethics Institute | | 188 | | Member of Board of Positive Planet US (non-profit) and HealthCare Chaplaincy Network (non-profit) |
| | |
| T-2 | | Invesco Global Real Estate Fund |
Trustees and Officers–(continued)
| | | | | | | | |
Name, Year of Birth and Position(s) Held with the Trust | | Trustee and/or Officer Since | | Principal Occupation(s) During Past 5 Years | | Number of Funds in Fund Complex Overseen by Trustee | | Other Directorship(s) Held by Trustee During Past 5 Years |
| Independent Trustees–(continued) | | | | | | |
Joel W. Motley - 1952 Trustee | | 2019 | | Director of Office of Finance, Federal Home Loan Bank System; Managing Director of Carmona Motley Inc. (privately held financial advisor); Member of the Council on Foreign Relations and its Finance and Budget Committee; Chairman Emeritus of Board of Human Rights Watch and Member of its Investment Committee; and Member of Investment Committee Board of Historic Hudson Valley (non-profit cultural organization); and Member of the Board, Blue Ocean Acquisition Corp. Formerly: Managing Director of Public Capital Advisors, LLC (privately held financial advisor); Managing Director of Carmona Motley Hoffman, Inc. (privately held financial advisor); Trustee of certain Oppenheimer Funds; Director of Columbia Equity Financial Corp. (privately held financial advisor); and Member of the Vestry of Trinity Church Wall Street | | 188 | | Member of Board of Trust for Mutual Understanding (non-profit promoting the arts and environment); Member of Board of Greenwall Foundation (bioethics research foundation) and its Investment Committee; Member of Board of Friends of the LRC (non-profit legal advocacy); Board Member and Investment Committee Member of Pulitzer Center for Crisis Reporting (non-profit journalism)Positive Planet US |
Teresa M. Ressel - 1962 Trustee | | 2017 | | Non-executive director and trustee of a number of public and private business corporations Formerly: Chief Executive Officer, UBS Securities LLC (investment banking); Chief Operating Officer, UBS AG Americas (investment banking); Sr. Management Team Olayan America, The Olayan Group (international investor/commercial/industrial); Assistant Secretary for Management & Budget and Designated Chief Financial Officer, U.S. Department of Treasury; Director, Atlantic Power Corporation (power generation company) and ON Semiconductor Corporation (semiconductor manufacturing) | | 188 | | None |
Ann Barnett Stern - 1957 Trustee | | 2017 | | President, Chief Executive Officer and Board Member, Houston Endowment, Inc. a private philanthropic institution Formerly: Executive Vice President, Texas Children’s Hospital; Vice President, General Counsel and Corporate Compliance Officer, Texas Children’s Hospital; Attorney at Beck, Redden and Secrest, LLP and Andrews and Kurth LLP | | 188 | | Trustee and Board Vice Chair of Holdsworth Center Trustee and Chair of Nomination/Governance Committee, Good Reason Houston, (non-profit); Trustee and Investment Committee member of University of Texas Law School Foundation (non-profit); Board Member of Greater Houston Partnership (non-profit); Advisory Board member, Baker Institute for Public Policy at Rice University (non-profit) Formerly: Director and Audit Committee Member of Federal Reserve Bank of Dallas |
Robert C. Troccoli - 1949 Trustee | | 2016 | | Retired Formerly: Adjunct Professor, University of Denver - Daniels College of Business; and Managing Partner, KPMG LLP | | 188 | | None |
Daniel S. Vandivort –1954 Trustee | | 2019 | | President, Flyway Advisory Services LLC (consulting and property management) | | 188 | | Formerly: Trustee, Board of Trustees, Treasurer and Chairman of the Audit and Committee, Huntington Disease Foundation of America; Trustee and Governance Chair, of certain Oppenheimer Funds |
| | |
| T-3 | | Invesco Global Real Estate Fund |
Trustees and Officers–(continued)
| | | | | | | | |
Name, Year of Birth and Position(s) Held with the Trust | | Trustee and/or Officer Since | | Principal Occupation(s) During Past 5 Years | | Number of Funds in Fund Complex Overseen by Trustee | | Other Directorship(s) Held by Trustee During Past 5 Years |
| Officers | | | | | | | | |
Sheri Morris - 1964 President and Principal Executive Officer | | 1999 | | Head of Global Fund Services, Invesco Ltd.; President and Principal Executive Officer, The Invesco Funds; Vice President, Invesco Exchange-Traded Fund Trust, Invesco Exchange-Traded Fund Trust II, Invesco India Exchange-Traded Fund Trust, Invesco Actively Managed Exchange-Traded Fund Trust, Invesco Actively Managed Exchange-Traded Commodity Fund Trust and Invesco Exchange-Traded Self-Indexed Fund Trust; and Vice President, OppenheimerFunds, Inc. Formerly: Vice President, Treasurer and Principal Financial Officer, The Invesco Funds; Vice President, Invesco AIM Advisers, Inc., Invesco AIM Capital Management, Inc. and Invesco AIM Private Asset Management, Inc.; Assistant Vice President and Assistant Treasurer, The Invesco Funds; Vice President and Assistant Vice President, Invesco Advisers, Inc.; Assistant Vice President, Invesco AIM Capital Management, Inc. and Invesco AIM Private Asset Management, Inc.; Treasurer, Invesco Exchange-Traded Fund Trust, Invesco Exchange-Traded Fund Trust II, Invesco India Exchange-Traded Fund Trust and Invesco Actively Managed Exchange-Traded Fund Trust and Senior Vice President, Invesco Advisers, Inc. (formerly known as Invesco Institutional (N.A.), Inc.) (registered investment adviser) | | N/A | | N/A |
Jeffrey H. Kupor - 1968 Senior Vice President, Chief Legal Officer and Secretary | | 2018 | | Head of Legal of the Americas, Invesco Ltd.; Senior Vice President and Secretary, Invesco Advisers, Inc. (formerly known as Invesco Institutional (N.A.), Inc.) (registered investment adviser); Senior Vice President and Secretary, Invesco Distributors, Inc. (formerly known as Invesco AIM Distributors, Inc.); Vice President and Secretary, Invesco Investment Services, Inc. (formerly known as Invesco AIM Investment Services, Inc.) Senior Vice President, Chief Legal Officer and Secretary, The Invesco Funds; Secretary and General Counsel, Invesco Investment Advisers LLC (formerly known as Van Kampen Asset Management); Secretary and General Counsel, Invesco Capital Markets, Inc. (formerly known as Van Kampen Funds Inc.) and Chief Legal Officer, Invesco Exchange-Traded Fund Trust, Invesco Exchange-Traded Fund Trust II, Invesco India Exchange-Traded Fund Trust, Invesco Actively Managed Exchange-Traded Fund Trust, Invesco Actively Managed Exchange-Traded Commodity Fund Trust and Invesco Exchange-Traded Self-Indexed Fund Trust;; Secretary and Vice President, Harbourview Asset Management Corporation; Secretary and Vice President, OppenheimerFunds, Inc. and Invesco Managed Accounts, LLC; Secretary and Senior Vice President, OFI Global Institutional, Inc.; Secretary and Vice President, OFI SteelPath, Inc.; Secretary and Vice President, Oppenheimer Acquisition Corp.; Secretary and Vice President, Shareholder Services, Inc.; Secretary and Vice President, Trinity Investment Management Corporation Formerly: Secretary and Vice President, Jemstep, Inc.; Head of Legal, Worldwide Institutional, Invesco Ltd.; Secretary and General Counsel, INVESCO Private Capital Investments, Inc.; Senior Vice President, Secretary and General Counsel, Invesco Management Group, Inc. (formerly known as Invesco AIM Management Group, Inc.); Assistant Secretary, INVESCO Asset Management (Bermuda) Ltd.; Secretary and General Counsel, Invesco Private Capital, Inc.; Assistant Secretary and General Counsel, INVESCO Realty, Inc.; Secretary and General Counsel, Invesco Senior Secured Management, Inc.; Secretary, Sovereign G./P. Holdings Inc.; and Secretary, Invesco Indexing LLC; Secretary, W.L. Ross & Co., LLC | | N/A | | N/A |
Andrew R. Schlossberg - 1974 Senior Vice President | | 2019 | | Head of the Americas and Senior Managing Director, Invesco Ltd.; Director and Senior Vice President, Invesco Advisers, Inc. (formerly known as Invesco Institutional (N.A.), Inc.) (registered investment adviser); Director and Chairman, Invesco Investment Services, Inc. (formerly known as Invesco AIM Investment Services, Inc.) (registered transfer agent); Senior Vice President, The Invesco Funds; Director, Invesco Investment Advisers LLC (formerly known as Van Kampen Asset Management) Formerly: Director, President and Chairman, Invesco Insurance Agency, Inc.; Director, Invesco UK Limited; Director and Chief Executive, Invesco Asset Management Limited and Invesco Fund Managers Limited; Assistant Vice President, The Invesco Funds; Senior Vice President, Invesco Advisers, Inc. (formerly known as Invesco Institutional (N.A.), Inc.) (registered investment adviser); Director and Chief Executive, Invesco Administration Services Limited and Invesco Global Investment Funds Limited; Director, Invesco Distributors, Inc.; Head of EMEA, Invesco Ltd.; President, Invesco Actively Managed Exchange-Traded Commodity Fund Trust, Invesco Actively Managed Exchange-Traded Fund Trust, Invesco Exchange-Traded Fund Trust, Invesco Exchange-Traded Fund Trust II and Invesco India Exchange-Traded Fund Trust; Managing Director and Principal Executive Officer, Invesco Capital Management LLC | | N/A | | N/A |
| | |
| T-4 | | Invesco Global Real Estate Fund |
Trustees and Officers–(continued)
| | | | | | | | |
Name, Year of Birth and Position(s) Held with the Trust | | Trustee and/or Officer Since | | Principal Occupation(s) During Past 5 Years | | Number of Funds in Fund Complex Overseen by Trustee | | Other Directorship(s) Held by Trustee During Past 5 Years |
| Officers–(continued) | | | | | | | | |
John M. Zerr - 1962 Senior Vice President | | 2006 | | Chief Operating Officer of the Americas; Senior Vice President, Invesco Advisers, Inc. (formerly known as Invesco Institutional (N.A.), Inc.) (registered investment adviser); Senior Vice President, Invesco Distributors, Inc. (formerly known as Invesco AIM Distributors, Inc.); Director and Vice President, Invesco Investment Services, Inc. (formerly known as Invesco AIM Investment Services, Inc.) Senior Vice President, The Invesco Funds; Managing Director, Invesco Capital Management LLC; Director, Invesco Investment Advisers LLC (formerly known as Van Kampen Asset Management); Senior Vice President, Invesco Capital Markets, Inc. (formerly known as Van Kampen Funds Inc.); Manager, Invesco Indexing LLC; Manager, Invesco Specialized Products, LLC; Member, Invesco Canada Funds Advisory Board; Director, President and Chief Executive Officer, Invesco Corporate Class Inc. (corporate mutual fund company); and Director, Chairman, President and Chief Executive Officer, Invesco Canada Ltd. (formerly known as Invesco Trimark Ltd./Invesco Trimark Ltèe) (registered investment adviser and registered transfer agent); President, Invesco, Inc.; President, Invesco Global Direct Real Estate Feeder GP Ltd.; President, Invesco IP Holdings (Canada) Ltd; President, Invesco Global Direct Real Estate GP Ltd.; President, Invesco Financial Services Ltd. / Services Financiers Invesco Ltée; and Director and Chairman, Invesco Trust Company Formerly: President, Trimark Investments Ltd/Services Financiers Invesco Ltee; Director and Senior Vice President, Invesco Insurance Agency, Inc.; Director and Senior Vice President, Invesco Management Group, Inc. (formerly known as Invesco AIM Management Group, Inc.); Secretary and General Counsel, Invesco Management Group, Inc. (formerly known as Invesco AIM Management Group, Inc.); Secretary, Invesco Investment Services, Inc. (formerly known as Invesco AIM Investment Services, Inc.); Chief Legal Officer and Secretary, The Invesco Funds; Secretary and General Counsel, Invesco Investment Advisers LLC (formerly known as Van Kampen Asset Management); Secretary and General Counsel, Invesco Capital Markets, Inc. (formerly known as Van Kampen Funds Inc.); Chief Legal Officer, Invesco Exchange-Traded Fund Trust, Invesco Exchange-Traded Fund Trust II, Invesco India Exchange-Traded Fund Trust, Invesco Actively Managed Exchange-Traded Fund Trust, Invesco Actively Managed Exchange-Traded Commodity Fund Trust and Invesco Exchange-Traded Self-Indexed Fund Trust; Secretary, Invesco Indexing LLC; Director, Secretary, General Counsel and Senior Vice President, Van Kampen Exchange Corp.; Director, Vice President and Secretary, IVZ Distributors, Inc. (formerly known as INVESCO Distributors, Inc.); Director and Vice President, INVESCO Funds Group, Inc.; Director and Vice President, Van Kampen Advisors Inc.; Director, Vice President, Secretary and General Counsel, Van Kampen Investor Services Inc.; Director and Secretary, Invesco Distributors, Inc. (formerly known as Invesco AIM Distributors, Inc.); Director, Senior Vice President, General Counsel and Secretary, Invesco AIM Advisers, Inc. and Van Kampen Investments Inc.; Director, Vice President and Secretary, Fund Management Company; Director, Senior Vice President, Secretary, General Counsel and Vice President, Invesco AIM Capital Management, Inc.; Chief Operating Officer and General Counsel, Liberty Ridge Capital, Inc. (an investment adviser) | | N/A | | N/A |
Gregory G. McGreevey - 1962 Senior Vice President | | 2012 | | Senior Managing Director, Invesco Ltd.; Director, Chairman, President, and Chief Executive Officer, Invesco Advisers, Inc. (formerly known as Invesco Institutional (N.A.), Inc.) (registered investment adviser); Director, Invesco Mortgage Capital, Inc. and Invesco Senior Secured Management, Inc.; Senior Vice President, The Invesco Funds; President, SNW Asset Management Corporation and Invesco Managed Accounts, LLC; Chairman and Director, Invesco Private Capital, Inc.; Chairman and Director, INVESCO Private Capital Investments, Inc.; Chairman and Director, INVESCO Realty, Inc.; and Senior Vice President, Invesco Group Services, Inc. Formerly: Senior Vice President, Invesco Management Group, Inc. and Invesco Advisers, Inc.; Assistant Vice President, The Invesco Funds | | N/A | | N/A |
Adrien Deberghes - 1967 Principal Financial Officer, Treasurer and Vice President | | 2020 | | Head of the Fund Office of the CFO and Fund Administration; Vice President, Invesco Advisers, Inc.; Principal Financial Officer, Treasurer and Vice President, The Invesco Funds; Vice President, Invesco Exchange-Traded Fund Trust, Invesco Exchange-Traded Fund Trust II, Invesco India Exchange-Traded Fund Trust, Invesco Actively Managed Exchange-Traded Fund Trust, Invesco Actively Managed Exchange-Traded Commodity Fund Trust and Invesco Exchange-Traded Self-Indexed Fund Trust Formerly: Senior Vice President and Treasurer, Fidelity Investments | | N/A | | N/A |
Crissie M. Wisdom - 1969 Anti-Money Laundering Compliance Officer | | 2013 | | Anti-Money Laundering and OFAC Compliance Officer for Invesco U.S. entities including: Invesco Advisers, Inc. and its affiliates, Invesco Capital Markets, Inc., Invesco Distributors, Inc., Invesco Investment Services, Inc., The Invesco Funds, Invesco Capital Management, LLC, Invesco Trust Company; and Fraud Prevention Manager for Invesco Investment Services, Inc. | | N/A | | N/A |
| | |
| T-5 | | Invesco Global Real Estate Fund |
Trustees and Officers–(continued)
| | | | | | | | |
Name, Year of Birth and Position(s) Held with the Trust | | Trustee and/or Officer Since | | Principal Occupation(s) During Past 5 Years | | Number of Funds in Fund Complex Overseen by Trustee | | Other Directorship(s) Held by Trustee During Past 5 Years |
| Officers–(continued) | | | | | | | | |
Todd F. Kuehl - 1969 Chief Compliance Officer and Senior Vice President | | 2020 | | Chief Compliance Officer, Invesco Advisers, Inc. (registered investment adviser); and Chief Compliance Officer, The Invesco Funds and Senior Vice President Formerly: Managing Director and Chief Compliance Officer, Legg Mason (Mutual Funds); Chief Compliance Officer, Legg Mason Private Portfolio Group (registered investment adviser) | | N/A | | N/A |
Michael McMaster - 1962 Chief Tax Officer, Vice President and Assistant Treasurer | | 2020 | | Head of Global Fund Services Tax; Chief Tax Officer, Vice President and Assistant Treasurer, The Invesco Funds; Vice President, Invesco Advisers, Inc.; Assistant Treasurer, Invesco Capital Management LLC, Assistant Treasurer and Chief Tax Officer, Invesco Exchange-Traded Fund Trust, Invesco Exchange-Traded Fund Trust II, Invesco India Exchange-Traded Fund Trust, Invesco Actively Managed Exchange-Traded Fund Trust, Invesco Actively Managed Exchange-Traded Commodity Fund Trust and Invesco Exchange-Traded Self-Indexed Fund Trust; Assistant Treasurer, Invesco Specialized Products, LLC Formerly: Senior Vice President - Managing Director of Tax Services, U.S. Bank Global Fund Services (GFS) | | N/A | | N/A |
The Statement of Additional Information of the Trust includes additional information about the Fund’s Trustees and is available upon request, without charge, by calling 1.800.959.4246. Please refer to the Fund’s Statement of Additional Information for information on the Fund’s sub-advisers.
| | | | | | |
| Office of the Fund | | Investment Adviser | | Distributor | | Auditors |
11 Greenway Plaza, Suite 1000 Houston, TX 77046-1173 | | Invesco Advisers, Inc. 1555 Peachtree Street, N.E. Atlanta, GA 30309 | | Invesco Distributors, Inc. 11 Greenway Plaza, Suite 1000 Houston, TX 77046-1173 | | PricewaterhouseCoopers LLP 1000 Louisiana Street, Suite 5800 Houston, TX 77002-5678 |
| | | |
| Counsel to the Fund | | Counsel to the Independent Trustees | | Transfer Agent | | Custodian |
Stradley Ronon Stevens & Young, LLP 2005 Market Street, Suite 2600 Philadelphia, PA 19103-7018 | | Goodwin Procter LLP 901 New York Avenue, N.W. Washington, D.C. 20001 | | Invesco Investment Services, Inc. 11 Greenway Plaza, Suite 1000 Houston, TX 77046-1173 | | State Street Bank and Trust Company 225 Franklin Street Boston, MA 02110-2801 |
| | |
| T-6 | | Invesco Global Real Estate Fund |
(This page intentionally left blank)
(This page intentionally left blank)
(This page intentionally left blank)

Go paperless with eDelivery
Visit invesco.com/edelivery to enjoy the convenience and security of anytime electronic access to your investment documents.
With eDelivery, you can elect to have any or all of the following materials delivered straight to your inbox to download, save and print from your own computer:
∎ Fund reports and prospectuses
∎ Quarterly statements
∎ Daily confirmations
∎ Tax forms
Invesco mailing information
Send general correspondence to Invesco Investment Services, Inc., P.O. Box 219078, Kansas City, MO 64121-9078.
Important notice regarding delivery of security holder documents
To reduce Fund expenses, only one copy of most shareholder documents may be mailed to shareholders with multiple accounts at the same address (Householding). Mailing of your shareholder documents may be householded indefinitely unless you instruct us otherwise. If you do not want the mailing of these documents to be combined with those for other members of your household, please contact Invesco Investment Services, Inc. at 800 959 4246 or contact your financial institution. We will begin sending you individual copies for each account within 30 days after receiving your request.
Fund holdings and proxy voting information
The Fund provides a complete list of its portfolio holdings four times each year, at the end of each fiscal quarter. For the second and fourth quarters, the list appears, respectively, in the Fund’s semiannual and annual reports to shareholders. For the first and third quarters, the Fund files the list with the Securities and Exchange Commission (SEC) as an exhibit to its reports on Form N-PORT. The most recent list of portfolio holdings is available at invesco.com/completeqtrholdings. Shareholders can also look up the Fund’s Form N-PORT filings on the SEC website, sec.gov. The SEC file numbers for the Fund are shown below.
A description of the policies and procedures that the Fund uses to determine how to vote proxies relating to portfolio securities is available without charge, upon request, from our Client Services department at 800 959 4246, or at invesco.com/ corporate/about-us/esg. The information is also available on the SEC website, sec.gov.
Information regarding how the Fund voted proxies related to its portfolio securities during the most recent 12-month period ended June 30 is available at invesco.com/proxysearch. This information is also available on the SEC website, sec.gov.
Invesco Advisers, Inc. is an investment adviser; it provides investment advisory services to individual and institutional clients and does not sell securities. Invesco Distributors, Inc. is the US distributor for Invesco Ltd.’s retail mutual funds, exchange-traded funds and institutional money market funds. Both are wholly owned, indirect subsidiaries of Invesco Ltd.

| | | | |
| SEC file number(s): 811-05686 and 033-39519 | | Invesco Distributors, Inc. | | GRE-AR-1 |

| | |
| | |
| Annual Report to Shareholders | | February 28, 2022 |
Invesco Government Money Market Fund
Nasdaq:
Invesco Cash Reserve: AIMXX ∎ A: ADAXX ∎ AX: ACZXX ∎ C: ACNXX ∎ CX: ACXXX
∎ R: AIRXX ∎ Y: AIYXX ∎ Investor: INAXX ∎ R6: INVXX
Management’s Discussion of your Fund
About your Fund
This annual report for Invesco Government Money Market Fund covers the fiscal year ended February 28, 2022. As of that date, the Fund’s net assets totaled $3.3 billion. As of the same date, the Fund’s weighted average maturity was 47 days and the Fund’s weighted average life was 110 days.1
Market conditions affecting money market funds
In the first quarter of 2021, rising 10-year US Treasury yields increased significantly to 1.74%,2 its highest level since January 2020, reflecting higher inflation expectations. Largely a result of economic optimism, government bond yields rose globally during the first quarter of 2021 as investors began to price in higher levels of economic growth and inflation moving towards a post-pandemic world. Short-term rates, which are closely tied to US Federal Reserve (Fed) policy, remained steady, as the Fed remained accommodative and maintained the federal funds target range at 0.00% to 0.25% throughout 2021 and into 2022.3 As a result, yields on money market funds remained close to the zero bound for the year.
During the second quarter of 2021, the Federal Open Markets Committee (FOMC) moved to increase the rates of interest on excess reserves (IOER) and reverse repo (RRP) by 0.05% to 0.15% and 0.05%3 respectively at the June FOMC meeting, to mitigate the downward pressure on front-end rates given the surge in government money market funds assets in the first half of 2021, which coincided with diminishing supply over the same time frame. Despite higher volatility stemming from inflation concerns and the potential for rising interest rates, investors remained optimistic about the strength of the economic recovery after the Bureau of Economic Analysis reported that US gross domestic product grew at a 6.4% annualized rate for the first quarter of 2021.4 As the US COVID-19 vaccination rate neared the 50% threshold, consumers resumed pre-pandemic activities in the third quarter of 2021 and economically sensitive areas such as the consumer discretionary and industrials sectors began to recover.
In the fourth quarter of 2021, concerns about inflation heightened as US inflation rose to 7%,5 its highest level in nearly 40 years, and money market curves steepened as markets began to anticipate the start of a Fed hiking cycle. The Fed indicated its accommodative policies were coming to an end in 2022 through a willingness to raise
interest rates to combat inflation in 2022 and also announced it would ramp up its tapering of asset purchases.
At the beginning of 2022, geopolitical and economic tensions dominated headlines as Russia invaded Ukraine. Regarding inflation concerns, political uncertainty should give central banks a reason to be cautious. Following the end of the fiscal year, the Fed raised interest rates by 0.25% at the March 2022 Federal Open Market Committee meeting, whereas before this crisis, a 0.50% increase appeared to be increasingly likely.
Thank you for investing in Invesco Government Money Market Fund. We believe our long-term approach to short-term investing makes us a strong partner for investors seeking premier liquidity management.
1 Weighted average maturity (WAM) is an average of the maturities of all securities held in the portfolio, weighted by each security’s percentage of net assets. The days to maturity for WAM is the lower of the stated maturity date or next interest rate reset date. WAM reflects how a portfolio would react to interest rate changes. Weighted average life (WAL) is an average of all the maturities of all securities held in the portfolio, weighted by each security’s percentage of net assets. The days to maturity for WAL is the lower of the stated maturity date or next demand feature date. WAL reflects how a portfolio would react to deteriorating credit (widening spreads) or tightening liquidity conditions.
| 2 | Source: US Department of the Treasury |
| 3 | Source: US Federal Reserve |
| 4 | Source: US Bureau of Economic Statistics |
| 5 | Source: US Bureau of Labor Statistics |
Team managed by Invesco Advisers, Inc.
The views and opinions expressed in management’s discussion of Fund performance are those of Invesco Advisers, Inc. and its affiliates. These views and opinions are subject to change at any time based on factors such as market and economic conditions. These views and opinions may not be relied upon as investment advice or recommendations, or as an offer for a particular security. The information is not a complete analysis of every aspect of any market, country, industry, security or the Fund. Statements of fact are from sources considered reliable, but Invesco Advisers, Inc. makes no representation or warranty as to their completeness or accuracy. Although historical performance is no guarantee of future results, these insights may help you understand our investment management philosophy.
See important Fund and, if applicable, index disclosures later in this report.
| | | | |
Portfolio Composition by Maturity* In days, as of 02/28/2022 | | | | |
| |
| 1-7 | | | 25.7 | % |
| 8-30 | | | 6.1 | |
| 31-60 | | | 8.8 | |
| 61-90 | | | 16.5 | |
| 91-180 | | | 26.7 | |
| 181+ | | | 16.2 | |
* The number of days to maturity of each holding is determined in accordance with the provisions of Rule 2a-7 under the Investment Company Act of 1940.
You could lose money by investing in the Fund. Although the Fund seeks to preserve your investment at $1.00 per share, it cannot guarantee it will do so. An investment in the Fund is not insured or guaranteed by the Federal Deposit Insurance Corporation or any other government agency. The Fund’s sponsor has no legal obligation to provide financial support to the Fund, and you should not expect that the sponsor will provide financial support to the Fund at any time.
| | |
| 2 | | Invesco Government Money Market Fund |
Invesco Government Money Market Fund’s investment objective is to provide current income consistent with preservation of capital and liquidity.
| ∎ | Unless otherwise stated, information presented in this report is as of February 28, 2022, and is based on total net assets. |
| ∎ | Unless otherwise noted, all data is provided by Invesco. |
| ∎ | To access your Fund’s reports/prospectus, visit invesco.com/fundreports. |
|
|
This report must be accompanied or preceded by a currently effective Fund prospectus, which contains more complete information, including sales charges and expenses. Investors should read it carefully before investing. |
|
| NOT FDIC INSURED | MAY LOSE VALUE | NO BANK GUARANTEE |
| | |
| 3 | | Invesco Government Money Market Fund |
Schedule of Investments
February 28, 2022
| | | | | | | | | | | | | | | | |
| | | Interest Rate | | | Maturity
Date | | | Principal
Amount
(000) | | | Value | |
|
| |
U.S. Treasury Securities-55.89% | | | | | | | | | |
U.S. Treasury Bills-37.31%(a) | | | | | | | | | |
U.S. Treasury Bills | | | 0.06 | % | | | 03/01/2022 | | | $ | 75,000 | | | $ | 75,000,000 | |
|
| |
U.S. Treasury Bills | | | 0.07 | % | | | 03/10/2022 | | | | 25,000 | | | | 24,999,562 | |
|
| |
U.S. Treasury Bills | | | 0.08 | % | | | 03/24/2022 | | | | 25,000 | | | | 24,998,802 | |
|
| |
U.S. Treasury Bills | | | 0.07 | % | | | 03/29/2022 | | | | 20,000 | | | | 19,998,911 | |
|
| |
U.S. Treasury Bills | | | 0.09 | % | | | 03/31/2022 | | | | 50,000 | | | | 49,996,458 | |
|
| |
U.S. Treasury Bills | | | 0.25 | % | | | 04/12/2022 | | | | 150,000 | | | | 149,956,250 | |
|
| |
U.S. Treasury Bills | | | 0.11 | % | | | 04/26/2022 | | | | 50,000 | | | | 49,991,328 | |
|
| |
U.S. Treasury Bills | | | 0.24 | % | | | 05/05/2022 | | | | 40,000 | | | | 39,982,667 | |
|
| |
U.S. Treasury Bills | | | 0.29 | % | | | 05/12/2022 | | | | 75,000 | | | | 74,956,500 | |
|
| |
U.S. Treasury Bills | | | 0.23 | % | | | 05/17/2022 | | | | 35,000 | | | | 34,982,782 | |
|
| |
U.S. Treasury Bills | | | 0.24 | % | | | 05/24/2022 | | | | 75,000 | | | | 74,958,438 | |
|
| |
U.S. Treasury Bills | | | 0.29 | % | | | 05/31/2022 | | | | 120,000 | | | | 119,913,146 | |
|
| |
U.S. Treasury Bills | | | 0.09 | % | | | 06/02/2022 | | | | 45,000 | | | | 44,972,600 | |
|
| |
U.S. Treasury Bills | | | 0.34 | % | | | 06/07/2022 | | | | 95,000 | | | | 94,912,719 | |
|
| |
U.S. Treasury Bills | | | 0.11 | % | | | 06/09/2022 | | | | 20,000 | | | | 19,994,167 | |
|
| |
U.S. Treasury Bills | | | 0.50 | % | | | 06/14/2022 | | | | 25,000 | | | | 24,963,833 | |
|
| |
U.S. Treasury Bills | | | 0.07 | % | | | 06/16/2022 | | | | 10,000 | | | | 9,997,919 | |
|
| |
U.S. Treasury Bills | | | 0.55 | % | | | 06/21/2022 | | | | 100,000 | | | | 99,828,889 | |
|
| |
U.S. Treasury Bills | | | 0.57 | % | | | 06/28/2022 | | | | 40,000 | | | | 39,924,633 | |
|
| |
U.S. Treasury Bills | | | 0.08 | % | | | 08/11/2022 | | | | 17,000 | | | | 16,993,842 | |
|
| |
U.S. Treasury Bills | | | 0.61%-0.71 | % | | | 08/25/2022 | | | | 80,000 | | | | 79,749,791 | |
|
| |
U.S. Treasury Bills | | | 0.09%-0.10 | % | | | 10/06/2022 | | | | 50,000 | | | | 49,972,199 | |
|
| |
| | | | | | | | | | | | | | | 1,221,045,436 | |
|
| |
| | |
U.S. Treasury Floating Rate Notes-8.31% | | | | | | | | | |
U.S. Treasury Floating Rate Notes (3 mo. U.S. Treasury Bill Money Market Yield Rate + 0.11%)(b) | | | 0.47 | % | | | 04/30/2022 | | | | 25,000 | | | | 25,001,798 | |
|
| |
U.S. Treasury Floating Rate Notes (3 mo. U.S. Treasury Bill Money Market Yield Rate + 0.06%)(b) | | | 0.42 | % | | | 07/31/2022 | | | | 38,000 | | | | 38,001,855 | |
|
| |
U.S. Treasury Floating Rate Notes (3 mo. U.S. Treasury Bill Money Market Yield Rate + 0.06%)(b) | | | 0.42 | % | | | 10/31/2022 | | | | 45,000 | | | | 44,999,201 | |
|
| |
U.S. Treasury Floating Rate Notes (3 mo. U.S. Treasury Bill Money Market Yield Rate + 0.05%)(b) | | | 0.41 | % | | | 01/31/2023 | | | | 20,000 | | | | 20,000,112 | |
|
| |
U.S. Treasury Floating Rate Notes (3 mo. U.S. Treasury Bill Money Market Yield Rate + 0.03%)(b) | | | 0.39 | % | | | 04/30/2023 | | | | 40,000 | | | | 40,002,006 | |
|
| |
U.S. Treasury Floating Rate Notes (3 mo. U.S. Treasury Bill Money Market Yield Rate + 0.03%)(b) | | | 0.39 | % | | | 07/31/2023 | | | | 64,000 | | | | 64,001,377 | |
|
| |
U.S. Treasury Floating Rate Notes (3 mo. U.S. Treasury Bill Money Market Yield Rate + 0.04%)(b) | | | 0.40 | % | | | 10/31/2023 | | | | 40,000 | | | | 39,999,830 | |
|
| |
| | | | | | | | | | | | | | | 272,006,179 | |
|
| |
| | |
U.S. Treasury Notes-10.27% | | | | | | | | | |
U.S. Treasury Notes | | | 1.88 | % | | | 03/31/2022 | | | | 9,800 | | | | 9,814,410 | |
|
| |
U.S. Treasury Notes | | | 1.75 | % | | | 04/30/2022 | | | | 10,000 | | | | 10,027,687 | |
|
| |
U.S. Treasury Notes | | | 1.88 | % | | | 04/30/2022 | | | | 90,000 | | | | 90,266,750 | |
|
| |
U.S. Treasury Notes | | | 1.75 | % | | | 05/15/2022 | | | | 10,000 | | | | 10,033,819 | |
|
| |
U.S. Treasury Notes | | | 2.13 | % | | | 05/15/2022 | | | | 45,000 | | | | 45,181,910 | |
|
| |
U.S. Treasury Notes | | | 1.88 | % | | | 05/31/2022 | | | | 25,000 | | | | 25,102,332 | |
|
| |
U.S. Treasury Notes | | | 0.13 | % | | | 06/30/2022 | | | | 40,000 | | | | 40,005,901 | |
|
| |
U.S. Treasury Notes | | | 1.75 | % | | | 07/15/2022 | | | | 20,000 | | | | 20,123,958 | |
|
| |
U.S. Treasury Notes | | | 0.13 | % | | | 07/31/2022 | | | | 25,000 | | | | 25,001,926 | |
|
| |
U.S. Treasury Notes | | | 2.00 | % | | | 07/31/2022 | | | | 10,000 | | | | 10,079,523 | |
|
| |
U.S. Treasury Notes | | | 1.88 | % | | | 08/31/2022 | | | | 30,000 | | | | 30,238,360 | |
|
| |
See accompanying Notes to Financial Statements which are an integral part of the financial statements.
| | |
| 4 | | Invesco Government Money Market Fund |
| | | | | | | | | | | | | | | | |
| | | Interest Rate | | | Maturity
Date | | | Principal
Amount (000) | | | Value | |
|
| |
U.S. Treasury Notes-(continued) | | | | | | | | | | | | | | | | |
U.S. Treasury Notes | | | 1.50 | % | | | 09/15/2022 | | | $ | 20,000 | | | $ | 20,151,942 | |
|
| |
| | | | | | | | | | | | | | | 336,028,518 | |
|
| |
Total U.S. Treasury Securities (Cost $1,829,080,133) | | | | | | | | | | | | 1,829,080,133 | |
|
| |
| | |
U.S. Government Sponsored Agency Securities-17.90% | | | | | | | | | |
Federal Farm Credit Bank (FFCB)-7.87% | | | | | | | | | |
Federal Farm Credit Bank (SOFR + 0.08%)(b) | | | 0.13 | % | | | 03/10/2022 | | | | 4,000 | | | | 4,000,000 | |
|
| |
Federal Farm Credit Bank(a) | | | 0.08 | % | | | 03/23/2022 | | | | 25,000 | | | | 24,998,778 | |
|
| |
Federal Farm Credit Bank | | | 0.25 | % | | | 06/02/2022 | | | | 2,075 | | | | 2,075,844 | |
|
| |
Federal Farm Credit Bank (SOFR + 0.09%)(b) | | | 0.13 | % | | | 06/17/2022 | | | | 10,000 | | | | 10,000,000 | |
|
| |
Federal Farm Credit Bank (SOFR + 0.04%)(b) | | | 0.09 | % | | | 07/11/2022 | | | | 15,000 | | | | 14,999,541 | |
|
| |
Federal Farm Credit Bank (SOFR + 0.15%)(b) | | | 0.19 | % | | | 07/28/2022 | | | | 6,000 | | | | 6,000,000 | |
|
| |
Federal Farm Credit Bank (SOFR + 0.07%)(b) | | | 0.12 | % | | | 08/11/2022 | | | | 20,000 | | | | 19,999,997 | |
|
| |
Federal Farm Credit Bank (SOFR + 0.04%)(b) | | | 0.09 | % | | | 08/22/2022 | | | | 10,000 | | | | 9,999,879 | |
|
| |
Federal Farm Credit Bank (SOFR + 0.08%)(b) | | | 0.13 | % | | | 10/14/2022 | | | | 16,000 | | | | 16,000,000 | |
|
| |
Federal Farm Credit Bank (SOFR + 0.01%)(b) | | | 0.06 | % | | | 11/16/2022 | | | | 10,000 | | | | 9,999,856 | |
|
| |
Federal Farm Credit Bank (SOFR + 0.07%)(b) | | | 0.12 | % | | | 11/18/2022 | | | | 8,000 | | | | 8,000,000 | |
|
| |
Federal Farm Credit Bank (SOFR + 0.06%)(b) | | | 0.11 | % | | | 12/01/2022 | | | | 14,000 | | | | 14,000,000 | |
|
| |
Federal Farm Credit Bank (SOFR + 0.06%)(b) | | | 0.11 | % | | | 01/20/2023 | | | | 16,000 | | | | 16,000,000 | |
|
| |
Federal Farm Credit Bank (SOFR + 0.06%)(b) | | | 0.11 | % | | | 02/09/2023 | | | | 12,000 | | | | 12,000,000 | |
|
| |
Federal Farm Credit Bank (SOFR + 0.02%)(b) | | | 0.07 | % | | | 06/12/2023 | | | | 5,000 | | | | 5,000,000 | |
|
| |
Federal Farm Credit Bank (SOFR + 0.02%)(b) | | | 0.07 | % | | | 06/23/2023 | | | | 2,500 | | | | 2,499,859 | |
|
| |
Federal Farm Credit Bank (SOFR + 0.03%)(b) | | | 0.08 | % | | | 07/07/2023 | | | | 8,000 | | | | 8,000,000 | |
|
| |
Federal Farm Credit Bank (SOFR + 0.03%)(b) | | | 0.07 | % | | | 09/08/2023 | | | | 5,000 | | | | 5,000,000 | |
|
| |
Federal Farm Credit Bank (SOFR + 0.03%)(b) | | | 0.08 | % | | | 09/18/2023 | | | | 10,000 | | | | 10,000,000 | |
|
| |
Federal Farm Credit Bank (SOFR + 0.04%)(b) | | | 0.09 | % | | | 09/20/2023 | | | | 28,000 | | | | 28,000,000 | |
|
| |
Federal Farm Credit Bank (SOFR + 0.03%)(b) | | | 0.07 | % | | | 09/27/2023 | | | | 5,000 | | | | 5,000,000 | |
|
| |
Federal Farm Credit Bank (SOFR + 0.06%)(b) | | | 0.10 | % | | | 11/07/2023 | | | | 4,000 | | | | 4,000,000 | |
|
| |
Federal Farm Credit Bank (SOFR + 0.06%)(b) | | | 0.11 | % | | | 12/13/2023 | | | | 7,000 | | | | 7,000,000 | |
|
| |
Federal Farm Credit Bank (SOFR + 0.04%)(b) | | | 0.09 | % | | | 01/25/2024 | | | | 15,000 | | | | 15,000,000 | |
|
| |
| | | | | | | | | | | | | | | 257,573,754 | |
|
| |
| | |
Federal Home Loan Bank (FHLB)-7.77% | | | | | | | | | |
Federal Home Loan Bank | | | 0.05 | % | | | 03/17/2022 | | | | 15,000 | | | | 14,999,930 | |
|
| |
Federal Home Loan Bank (SOFR + 0.07%)(b) | | | 0.11 | % | | | 04/28/2022 | | | | 20,000 | | | | 20,000,000 | |
|
| |
Federal Home Loan Bank(a) | | | 0.40 | % | | | 05/20/2022 | | | | 75,000 | | | | 74,933,334 | |
|
| |
Federal Home Loan Bank(a) | | | 0.28 | % | | | 05/23/2022 | | | | 25,000 | | | | 24,983,861 | |
|
| |
Federal Home Loan Bank(a) | | | 0.09 | % | | | 05/27/2022 | | | | 34,516 | | | | 34,508,493 | |
|
| |
Federal Home Loan Bank | | | 2.13 | % | | | 06/10/2022 | | | | 4,725 | | | | 4,751,643 | |
|
| |
Federal Home Loan Bank (SOFR + 0.13%)(b) | | | 0.18 | % | | | 08/05/2022 | | | | 5,000 | | | | 5,000,000 | |
|
| |
Federal Home Loan Bank (SOFR + 0.09%)(b) | | | 0.14 | % | | | 08/19/2022 | | | | 35,000 | | | | 35,000,472 | |
|
| |
Federal Home Loan Bank (SOFR + 0.09%)(b) | | | 0.14 | % | | | 09/08/2022 | | | | 10,000 | | | | 10,000,000 | |
|
| |
Federal Home Loan Bank (SOFR + 0.09%)(b) | | | 0.13 | % | | | 10/05/2022 | | | | 20,000 | | | | 20,000,000 | |
|
| |
Federal Home Loan Bank (SOFR + 0.06%)(b) | | | 0.11 | % | | | 12/08/2022 | | | | 10,000 | | | | 10,000,000 | |
|
| |
| | | | | | | | | | | | | | | 254,177,733 | |
|
| |
| | |
Federal Home Loan Mortgage Corp. (FHLMC)-1.60% | | | | | | | | | |
Federal Home Loan Mortgage Corp. | | | 0.25 | % | | | 06/08/2022 | | | | 11,213 | | | | 11,212,553 | |
|
| |
Federal Home Loan Mortgage Corp. (SOFR + 0.07%)(b) | | | 0.12 | % | | | 08/12/2022 | | | | 26,000 | | | | 26,000,000 | |
|
| |
Federal Home Loan Mortgage Corp. (SOFR + 0.09%)(b) | | | 0.14 | % | | | 09/16/2022 | | | | 15,000 | | | | 15,000,000 | |
|
| |
| | | | | | | | | | | | | | | 52,212,553 | |
|
| |
| | |
Federal National Mortgage Association (FNMA)-0.35% | | | | | | | | | |
Federal National Mortgage Association | | | 2.25 | % | | | 04/12/2022 | | | | 6,535 | | | | 6,551,394 | |
|
| |
Federal National Mortgage Association (SOFR + 0.20%)(b) | | | 0.25 | % | | | 06/15/2022 | | | | 5,000 | | | | 5,000,000 | |
|
| |
| | | | | | | | | | | | | | | 11,551,394 | |
|
| |
See accompanying Notes to Financial Statements which are an integral part of the financial statements.
| | |
| 5 | | Invesco Government Money Market Fund |
| | | | | | | | | | | | | | | | |
| | | Interest Rate | | | Maturity
Date | | | Principal
Amount (000) | | | Value | |
|
| |
U.S. International Development Finance Corp. (DFC)-0.31% | | | | | | | | | |
U.S. International Development Finance Corp. VRD Bonds (3 mo. U.S. Treasury Bill Rate)(c) | | | 0.17 | % | | | 06/15/2025 | | | $ | 3,500 | | | $ | 3,500,000 | |
|
| |
U.S. International Development Finance Corp. VRD Bonds (3 mo. U.S. Treasury Bill Rate)(c) | | | 0.17 | % | | | 02/15/2028 | | | | 6,667 | | | | 6,666,667 | |
|
| |
| | | | | | | | | | | | | | | 10,166,667 | |
|
| |
Total U.S. Government Sponsored Agency Securities (Cost $585,682,101) | | | | | | | | | | | | 585,682,101 | |
|
| |
TOTAL INVESTMENTS IN SECURITIES (excluding Repurchase Agreements)-73.79%
(Cost $2,414,762,234) | | | | | | | | | | | | 2,414,762,234 | |
|
| |
| | | | |
| | | | | | | | | Repurchase
Amount | | | | |
| | | | |
Repurchase Agreements-28.12%(d) | | | | | | | | | | | | | | | | |
BNP Paribas Securities Corp., joint term agreement dated 02/22/2022, aggregate maturing value of $500,004,861 (collateralized by domestic agency mortgage-backed securities and U.S. Treasury obligations valued at $510,000,007; 0.00% - 7.00%; 06/21/2022 - 02/01/2052)(e) | | | 0.05 | % | | | 03/01/2022 | | | | 40,000,389 | | | | 40,000,000 | |
|
| |
CIBC World Markets Corp., joint term agreement dated 01/24/2022, aggregate maturing value of $500,043,333 (collateralized by domestic agency mortgage-backed securities valued at $510,000,000; 1.50% - 4.50%; 10/01/2036 - 03/01/2052)(e) | | | 0.06 | % | | | 03/17/2022 | | | | 50,004,333 | | | | 50,000,000 | |
|
| |
Credit Agricole Corporate & Investment Bank, joint open agreement dated 12/01/2021 (collateralized by U.S. Treasury obligations valued at $2,032,860,462; 0.13% - 3.13%; 04/15/2024 - 11/15/2050)(b)(f) | | | 0.05 | % | | | 03/01/2022 | | | | 65,002,510 | | | | 65,000,000 | |
|
| |
Goldman Sachs & Co., term agreement dated 02/22/2022, maturing value of $40,000,428 (collateralized by domestic agency mortgage-backed securities valued at $40,800,000; 0.41% - 5.50%; 02/15/2026 - 09/16/2054)(e) | | | 0.06 | % | | | 03/01/2022 | | | | 40,000,428 | | | | 40,000,000 | |
|
| |
ING Financial Markets, LLC, joint term agreement dated 02/22/2022, aggregate maturing value of $200,008,944 (collateralized by domestic agency mortgage-backed securities valued at $204,000,000; 1.50% - 4.50%; 10/01/2029 - 05/01/2058) | | | 0.07 | % | | | 03/17/2022 | | | | 35,001,565 | | | | 35,000,000 | |
|
| |
ING Financial Markets, LLC, joint term agreement dated 12/28/2021, aggregate maturing value of $350,070,000 (collateralized by U.S. government sponsored agency obligations and domestic agency mortgage-backed securities valued at $357,000,395; 0.00% - 7.50%; 12/28/2022 - 05/01/2058) | | | 0.08 | % | | | 03/28/2022 | | | | 10,002,000 | | | | 10,000,000 | |
|
| |
ING Financial Markets, LLC, term agreement dated 02/10/2022, maturing value of $40,001,933 (collateralized by domestic agency mortgage-backed securities valued at $40,800,000; 1.50% - 4.50%; 08/01/2028 - 02/01/2052) | | | 0.06 | % | | | 03/11/2022 | | | | 40,001,933 | | | | 40,000,000 | |
|
| |
J.P. Morgan Securities LLC, joint open agreement dated 03/27/2020 (collateralized by U.S. Treasury obligations valued at $867,001,467; 0.00% - 2.38%; 03/03/2022 - 05/15/2050)(b)(f) | | | 0.05 | % | | | 03/01/2022 | | | | 15,000,579 | | | | 15,000,000 | |
|
| |
J.P. Morgan Securities LLC, open agreement dated 01/24/2022 (collateralized by domestic agency mortgage-backed securities valued at $15,300,000; 1.87% - 6.00%; 05/01/2027 - 11/01/2059)(b)(f) | | | 0.07 | % | | | 03/01/2022 | | | | 15,000,813 | | | | 15,000,000 | |
|
| |
J.P. Morgan Securities LLC, open agreement dated 01/24/2022 (collateralized by domestic agency mortgage-backed securities valued at $15,300,000; 1.94% - 7.00%; 07/01/2026 - 11/20/2050)(b)(f) | | | 0.06 | % | | | 03/01/2022 | | | | 15,000,696 | | | | 15,000,000 | |
|
| |
J.P. Morgan Securities LLC, open agreement dated 01/24/2022 (collateralized by domestic agency mortgage-backed securities valued at $25,500,001; 2.50% - 6.50%; 05/15/2028 - 02/15/2047)(b)(f) | | | 0.07 | % | | | 03/01/2022 | | | | 25,001,354 | | | | 25,000,000 | |
|
| |
Metropolitan Life Insurance Co., joint term agreement dated 02/23/2022, aggregate maturing value of $350,014,295 (collateralized by U.S. Treasury obligations valued at $358,935,903; 0.00%; 08/15/2027 - 11/15/2045)(e) | | | 0.07 | % | | | 03/02/2022 | | | | 25,001,628 | | | | 25,001,288 | |
|
| |
Mitsubishi UFJ Trust & Banking Corp., joint term agreement dated 02/23/2022, aggregate maturing value of $768,135,455 (collateralized by U.S. Treasury obligations valued at $788,525,747; 1.13%; 02/28/2025 - 02/28/2027)(e) | | | 0.07 | % | | | 03/02/2022 | | | | 57,975,789 | | | | 57,975,000 | |
|
| |
RBC Capital Markets LLC, joint term agreement dated 02/28/2022, aggregate maturing value of $750,001,875 (collateralized by U.S. government sponsored agency obligations, domestic agency mortgage-backed securities and U.S. Treasury obligations valued at $765,000,244; 0.13% - 8.00%; 03/01/2022 - 08/20/2065)(b)(e) | | | 0.09 | % | | | 03/01/2022 | | | | 35,000,088 | | | | 35,000,000 | |
|
| |
RBC Dominion Securities Inc., joint term agreement dated 01/11/2022, aggregate maturing value of $500,049,167 (collateralized by domestic agency mortgage-backed securities and U.S. Treasury obligations valued at $510,000,022; 0.00% - 6.00%; 03/31/2022 - 01/15/2052)(e) | | | 0.06 | % | | | 03/11/2022 | | | | 75,007,375 | | | | 75,000,000 | |
|
| |
See accompanying Notes to Financial Statements which are an integral part of the financial statements.
| | |
| 6 | | Invesco Government Money Market Fund |
| | | | | | | | | | | | | | | | |
| | | Interest Rate | | | Maturity
Date | | | Repurchase
Amount | | | Value | |
|
| |
RBC Dominion Securities Inc., joint term agreement dated 02/08/2022, aggregate maturing value of $500,016,667 (collateralized by U.S. Treasury obligations valued at $510,000,124; 0.13% - 6.00%; 07/15/2024 - 02/15/2050)(e) | | | 0.05 | % | | | 03/04/2022 | | | $ | 75,002,500 | | | $ | 75,000,000 | |
|
| |
Societe Generale, joint agreement dated 02/28/2022, aggregate maturing value of $1,600,002,222 (collateralized by U.S. government sponsored agency obligations, domestic agency mortgage-backed securities and U.S. Treasury obligations valued at $1,632,000,047; 0.00% - 7.13%; 03/15/2022 - 02/01/2052) | | | 0.05 | % | | | 03/01/2022 | | | | 50,000,069 | | | | 50,000,000 | |
|
| |
Societe Generale, joint open agreement dated 01/05/2022 (collateralized by U.S. Treasury obligations valued at $1,020,000,098; 0.00% - 7.63%; 03/01/2022 - 02/15/2052)(b)(f) | | | 0.05 | % | | | 03/01/2022 | | | | 35,000,049 | | | | 35,000,000 | |
|
| |
Societe Generale, joint open agreement dated 01/12/2022 (collateralized by U.S. government sponsored agency obligations, domestic agency mortgage-backed securities and U.S. Treasury obligations valued at $1,530,000,206; 0.00% -7.63%; 03/01/2022 - 10/01/2051)(b)(f) | | | 0.05 | % | | | 03/01/2022 | | | | 50,000,069 | | | | 50,000,000 | |
|
| |
Sumitomo Mitsui Banking Corp., joint agreement dated 02/28/2022, aggregate maturing value of $2,300,003,833 (collateralized by domestic agency mortgage-backed securities valued at $2,346,000,000; 2.00% - 5.00%; 12/15/2039 - 02/01/2052) | | | 0.06 | % | | | 03/01/2022 | | | | 167,422,588 | | | | 167,422,309 | |
|
| |
Total Repurchase Agreements (Cost $920,398,597) | | | | | | | | | | | | 920,398,597 | |
|
| |
TOTAL INVESTMENTS IN SECURITIES(g) -101.91% (Cost $3,335,160,831) | | | | | | | | | | | | 3,335,160,831 | |
|
| |
OTHER ASSETS LESS LIABILITIES-(1.91)% | | | | | | | | | | | | (62,510,093 | ) |
|
| |
NET ASSETS-100.00% | | | | | | | | | | | $ | 3,272,650,738 | |
|
| |
Investment Abbreviations:
| | |
| SOFR | | -Secured Overnight Financing Rate |
| VRD | | -Variable Rate Demand |
Notes to Schedule of Investments:
| (a) | Security traded on a discount basis. The interest rate shown represents the discount rate at the time of purchase by the Fund. |
| (b) | Interest or dividend rate is redetermined periodically. Rate shown is the rate in effect on February 28, 2022. |
| (c) | Demand security payable upon demand by the Fund at specified time intervals no greater than thirteen months. Interest rate is redetermined periodically based on current market interest rates. Rate shown is the rate in effect on February 28, 2022. |
| (d) | Principal amount equals value at period end. See Note 1I. |
| (e) | The Fund may demand payment of the term repurchase agreement upon one to seven business days’ notice depending on the timing of the demand. |
| (f) | Either party may terminate the agreement upon demand. Interest rate, principal amount and collateral are redetermined periodically. The Maturity Date represents the next reset date, and the Repurchase Amount is calculated based on the next reset date. |
| (g) | Also represents cost for federal income tax purposes. |
See accompanying Notes to Financial Statements which are an integral part of the financial statements.
| | |
| 7 | | Invesco Government Money Market Fund |
Statement of Assets and Liabilities
February 28, 2022
| | | | |
Assets: | | | | |
| |
Investments in unaffiliated securities, excluding repurchase agreements, at value and cost | | $ | 2,414,762,234 | |
|
| |
Repurchase agreements, at value and cost | | | 920,398,597 | |
|
| |
Cash | | | 1,126 | |
|
| |
Receivable for: | | | | |
Fund shares sold | | | 9,972,815 | |
|
| |
Interest | | | 1,608,375 | |
|
| |
Investment for trustee deferred compensation and retirement plans | | | 374,413 | |
|
| |
Other assets | | | 3,912 | |
|
| |
Total assets | | | 3,347,121,472 | |
|
| |
| |
Liabilities: | | | | |
| |
Payable for: | | | | |
Investments purchased | | | 64,901,883 | |
|
| |
Fund shares reacquired | | | 8,114,737 | |
|
| |
Accrued fees to affiliates | | | 864,675 | |
|
| |
Accrued trustees’ and officers’ fees and benefits | | | 7,109 | |
|
| |
Accrued operating expenses | | | 172,832 | |
|
| |
Trustee deferred compensation and retirement plans | | | 409,498 | |
|
| |
Total liabilities | | | 74,470,734 | |
|
| |
Net assets applicable to shares outstanding | | $ | 3,272,650,738 | |
|
| |
| |
Net assets consist of: | | | | |
Shares of beneficial interest | | $ | 3,272,878,402 | |
|
| |
Distributable earnings | | | (227,664 | ) |
|
| |
| | $ | 3,272,650,738 | |
|
| |
| | | | |
Net Assets: | | | | |
| |
Invesco Cash Reserve | | $ | 2,390,849,982 | |
|
| |
| |
Class A | | $ | 340,936,603 | |
|
| |
| |
Class AX | | $ | 70,035,168 | |
|
| |
| |
Class C | | $ | 122,056,655 | |
|
| |
| |
Class CX | | $ | 243,633 | |
|
| |
| |
Class R | | $ | 159,912,365 | |
|
| |
| |
Class Y | | $ | 67,999,340 | |
|
| |
Investor Class | | $ | 120,490,817 | |
|
| |
Class R6 | | $ | 126,175 | |
|
| |
|
Shares outstanding, no par value,
unlimited number of shares authorized: | |
| |
Invesco Cash Reserve | | | 2,390,959,344 | |
|
| |
| |
Class A | | | 340,952,695 | |
|
| |
| |
Class AX | | | 70,038,615 | |
|
| |
| |
Class C | | | 122,062,299 | |
|
| |
| |
Class CX | | | 243,646 | |
|
| |
| |
Class R | | | 159,919,745 | |
|
| |
| |
Class Y | | | 68,002,518 | |
|
| |
| |
Investor Class | | | 120,496,487 | |
|
| |
| |
Class R6 | | | 126,181 | |
|
| |
Net asset value and offering price per share for each class | | $ | 1.00 | |
|
| |
See accompanying Notes to Financial Statements which are an integral part of the financial statements.
| | |
| 8 | | Invesco Government Money Market Fund |
Statement of Operations
For the year ended February 28, 2022
| | | | |
Investment income: | | | | |
| |
Interest | | $ | 2,474,258 | |
|
| |
| |
Expenses: | | | | |
| |
Advisory fees | | | 4,776,586 | |
|
| |
Administrative services fees | | | 1,396,743 | |
|
| |
Custodian fees | | | 41,402 | |
|
| |
Distribution fees: | | | | |
Invesco Cash Reserve | | | 3,446,469 | |
|
| |
Class A | | | 702,048 | |
|
| |
Class AX | | | 108,431 | |
|
| |
Class C | | | 926,934 | |
|
| |
Class CX | | | 2,976 | |
|
| |
Class R | | | 655,783 | |
|
| |
Transfer agent fees - Invesco Cash Reserve, A, AX, C, CX, R, Y and Investor | | | 4,620,563 | |
|
| |
Transfer agent fees - R6 | | | 63 | |
|
| |
Trustees’ and officers’ fees and benefits | | | 41,978 | |
|
| |
Registration and filing fees | | | 263,318 | |
|
| |
Reports to shareholders | | | 235,192 | |
|
| |
Professional services fees | | | 87,236 | |
|
| |
Other | | | 93,826 | |
|
| |
Total expenses | | | 17,399,548 | |
|
| |
Less: Fees waived and expenses reimbursed | | | (15,108,926 | ) |
|
| |
Net expenses | | | 2,290,622 | |
|
| |
Net investment income | | | 183,636 | |
|
| |
Net realized gain from unaffiliated investment securities | | | 13,825 | |
|
| |
Net increase in net assets resulting from operations | | $ | 197,461 | |
|
| |
See accompanying Notes to Financial Statements which are an integral part of the financial statements.
| | |
| 9 | | Invesco Government Money Market Fund |
Statement of Changes in Net Assets
For the years ended February 28, 2022 and 2021
| | | | | | | | |
| | | 2022 | | | 2021 | |
|
| |
Operations: | | | | | | | | |
Net investment income | | $ | 183,636 | | | $ | 1,864,288 | |
|
| |
Net realized gain | | | 13,825 | | | | 46,199 | |
|
| |
Net increase in net assets resulting from operations | | | 197,461 | | | | 1,910,487 | |
|
| |
| | |
Distributions to shareholders from distributable earnings: | | | | | | | | |
Invesco Cash Reserve | | | (134,956 | ) | | | (1,600,645 | ) |
|
| |
Class A | | | (19,204 | ) | | | (31,795 | ) |
|
| |
Class AX | | | (3,633 | ) | | | (46,020 | ) |
|
| |
Class C | | | (6,863 | ) | | | (17,050 | ) |
|
| |
Class CX | | | (16 | ) | | | (75 | ) |
|
| |
Class R | | | (9,586 | ) | | | (24,046 | ) |
|
| |
Class Y | | | (3,841 | ) | | | (44,686 | ) |
|
| |
Investor Class | | | (5,530 | ) | | | (99,944 | ) |
|
| |
Class R6 | | | (7 | ) | | | (27 | ) |
|
| |
Total distributions from distributable earnings | | | (183,636 | ) | | | (1,864,288 | ) |
|
| |
| | |
Share transactions-net: | | | | | | | | |
Invesco Cash Reserve | | | (308,616,596 | ) | | | 293,307,446 | |
|
| |
Class A | | | (60,295,189 | ) | | | 401,127,580 | |
|
| |
Class AX | | | (3,966,263 | ) | | | (2,164,991 | ) |
|
| |
Class C | | | (22,275,650 | ) | | | 100,829,760 | |
|
| |
Class CX | | | (125,638 | ) | | | (137,291 | ) |
|
| |
Class R | | | (23,146,020 | ) | | | 150,735,224 | |
|
| |
Class Y | | | 12,187,061 | | | | 13,129,184 | |
|
| |
Investor Class | | | 5,825,443 | | | | 3,462,654 | |
|
| |
Class R6 | | | (1,296 | ) | | | 107,237 | |
|
| |
Net increase (decrease) in net assets resulting from share transactions | | | (400,414,148 | ) | | | 960,396,803 | |
|
| |
Net increase (decrease) in net assets | | | (400,400,323 | ) | | | 960,443,002 | |
|
| |
| | |
Net assets: | | | | | | | | |
Beginning of year | | | 3,673,051,061 | | | | 2,712,608,059 | |
|
| |
End of year | | $ | 3,272,650,738 | | | $ | 3,673,051,061 | |
|
| |
See accompanying Notes to Financial Statements which are an integral part of the financial statements.
| | |
| 10 | | Invesco Government Money Market Fund |
Financial Highlights
The following schedule presents financial highlights for a share of the Fund outstanding throughout the periods indicated.
| | | | | | | | | | | | | | | | | | | | | | | | | | | | | | | | | | | | | | | | | | | | |
| | | Net asset
value,
beginning
of period | | Net
investment
income(a) | | Net gains
(losses)
on securities
(realized) | | Total from
investment
operations | | Dividends
from net
investment
income | | Net asset
value, end
of period | | Total
return(b) | | Net assets,
end of period
(000’s omitted) | | Ratio of
expenses
to average net
assets
with fee waivers
and/or expenses
absorbed | | Ratio of
expenses
to average net
assets without
fee waivers
and/or expenses
absorbed | | Ratio of net
investment
income
(loss)
to average
net assets |
Invesco Cash Reserve | | | | | | | | | | | | | | | | | | | | | | | | | | | | | | | | | | | | | | | | | | | | |
Year ended 02/28/22 | | $ | 1.00 | | | $ | 0.00 | | | $ | (0.00 | )(c) | | $ | 0.00 | | | $ | (0.00 | ) | | $ | 1.00 | | | | 0.01 | % | | $ | 2,390,850 | | | | 0.07 | % | | | 0.51 | % | | | 0.01 | % |
Year ended 02/28/21 | | | 1.00 | | | | 0.00 | | | | (0.00 | ) | | | 0.00 | | | | (0.00 | ) | | | 1.00 | | | | 0.06 | | | | 2,699,457 | | | | 0.23 | | | | 0.50 | | | | 0.05 | |
Year ended 02/29/20 | | | 1.00 | | | | 0.02 | | | | 0.00 | | | | 0.02 | | | | (0.02 | ) | | | 1.00 | | | | 1.61 | | | | 2,406,243 | | | | 0.51 | | | | 0.51 | | | | 1.55 | |
Year ended 02/28/19 | | | 1.00 | | | | 0.02 | | | | (0.00 | ) | | | 0.02 | | | | (0.02 | ) | | | 1.00 | | | | 1.50 | | | | 1,299,414 | | | | 0.58 | | | | 0.58 | | | | 1.52 | |
Year ended 02/28/18 | | | 1.00 | | | | 0.00 | | | | (0.00 | ) | | | 0.00 | | | | (0.00 | ) | | | 1.00 | | | | 0.40 | | | | 815,631 | | | | 0.68 | | | | 0.68 | | | | 0.39 | |
Class A | | | | | | | | | | | | | | | | | | | | | | | | | | | | | | | | | | | | | | | | | | | | |
Year ended 02/28/22 | | | 1.00 | | | | 0.00 | | | | (0.00 | )(c) | | | 0.00 | | | | (0.00 | ) | | | 1.00 | | | | 0.01 | | | | 340,937 | | | | 0.07 | | | | 0.56 | | | | 0.01 | |
Period ended 02/28/21(d) | | | 1.00 | | | | 0.00 | | | | (0.00 | ) | | | (0.00 | ) | | | (0.00 | ) | | | 1.00 | | | | 0.01 | | | | 401,229 | | | | 0.20 | (e) | | | 0.54 | (e) | | | 0.08 | (e) |
Class AX | | | | | | | | | | | | | | | | | | | | | | | | | | | | | | | | | | | | | | | | | | | | |
Year ended 02/28/22 | | | 1.00 | | | | 0.00 | | | | (0.00 | )(c) | | | 0.00 | | | | (0.00 | ) | | | 1.00 | | | | 0.01 | | | | 70,035 | | | | 0.07 | | | | 0.51 | | | | 0.01 | |
Year ended 02/28/21 | | | 1.00 | | | | 0.00 | | | | (0.00 | ) | | | 0.00 | | | | (0.00 | ) | | | 1.00 | | | | 0.06 | | | | 74,001 | | | | 0.23 | | | | 0.50 | | | | 0.05 | |
Year ended 02/29/20 | | | 1.00 | | | | 0.02 | | | | 0.00 | | | | 0.02 | | | | (0.02 | ) | | | 1.00 | | | | 1.61 | | | | 76,169 | | | | 0.51 | | | | 0.51 | | | | 1.55 | |
Year ended 02/28/19 | | | 1.00 | | | | 0.02 | | | | (0.00 | ) | | | 0.02 | | | | (0.02 | ) | | | 1.00 | | | | 1.50 | | | | 81,110 | | | | 0.58 | | | | 0.58 | | | | 1.52 | |
Year ended 02/28/18 | | | 1.00 | | | | 0.00 | | | | (0.00 | ) | | | 0.00 | | | | (0.00 | ) | | | 1.00 | | | | 0.40 | | | | 91,906 | | | | 0.68 | | | | 0.68 | | | | 0.39 | |
Class C | | | | | | | | | | | | | | | | | | | | | | | | | | | | | | | | | | | | | | | | | | | | |
Year ended 02/28/22 | | | 1.00 | | | | 0.00 | | | | (0.00 | )(c) | | | 0.00 | | | | (0.00 | ) | | | 1.00 | | | | 0.01 | | | | 122,057 | | | | 0.07 | | | | 1.11 | | | | 0.01 | |
Year ended 02/28/21 | | | 1.00 | | | | 0.00 | | | | (0.00 | ) | | | 0.00 | | | | (0.00 | ) | | | 1.00 | | | | 0.02 | | | | 144,331 | | | | 0.23 | | | | 1.11 | | | | 0.05 | |
Year ended 02/29/20 | | | 1.00 | | | | 0.01 | | | | 0.00 | | | | 0.01 | | | | (0.01 | ) | | | 1.00 | | | | 0.85 | | | | 43,478 | | | | 1.26 | | | | 1.26 | | | | 0.80 | |
Year ended 02/28/19 | | | 1.00 | | | | 0.01 | | | | (0.00 | ) | | | 0.01 | | | | (0.01 | ) | | | 1.00 | | | | 0.76 | | | | 38,700 | | | | 1.31 | | | | 1.33 | | | | 0.79 | |
Year ended 02/28/18 | | | 1.00 | | | | 0.00 | | | | (0.00 | ) | | | 0.00 | | | | (0.00 | ) | | | 1.00 | | | | 0.27 | | | | 65,411 | | | | 0.81 | | | | 1.43 | | | | 0.26 | |
Class CX | | | | | | | | | | | | | | | | | | | | | | | | | | | | | | | | | | | | | | | | | | | | |
Year ended 02/28/22 | | | 1.00 | | | | 0.00 | | | | (0.00 | )(c) | | | 0.00 | | | | (0.00 | ) | | | 1.00 | | | | 0.01 | | | | 244 | | | | 0.07 | | | | 1.26 | | | | 0.01 | |
Year ended 02/28/21 | | | 1.00 | | | | 0.00 | | | | (0.00 | ) | | | 0.00 | | | | (0.00 | ) | | | 1.00 | | | | 0.02 | | | | 369 | | | | 0.29 | | | | 1.25 | | | | (0.01 | ) |
Year ended 02/29/20 | | | 1.00 | | | | 0.01 | | | | 0.00 | | | | 0.01 | | | | (0.01 | ) | | | 1.00 | | | | 0.85 | | | | 507 | | | | 1.26 | | | | 1.26 | | | | 0.80 | |
Year ended 02/28/19 | | | 1.00 | | | | 0.01 | | | | (0.00 | ) | | | 0.01 | | | | (0.01 | ) | | | 1.00 | | | | 0.77 | | | | 669 | | | | 1.31 | | | | 1.33 | | | | 0.79 | |
Year ended 02/28/18 | | | 1.00 | | | | 0.00 | | | | (0.00 | ) | | | 0.00 | | | | (0.00 | ) | | | 1.00 | | | | 0.27 | | | | 4,114 | | | | 0.81 | | | | 1.43 | | | | 0.26 | |
Class R | | | | | | | | | | | | | | | | | | | | | | | | | | | | | | | | | | | | | | | | | | | | |
Year ended 02/28/22 | | | 1.00 | | | | 0.00 | | | | (0.00 | )(c) | | | 0.00 | | | | (0.00 | ) | | | 1.00 | | | | 0.01 | | | | 159,912 | | | | 0.07 | | | | 0.76 | | | | 0.01 | |
Year ended 02/28/21 | | | 1.00 | | | | 0.00 | | | | 0.00 | | | | 0.00 | | | | (0.00 | ) | | | 1.00 | | | | 0.04 | | | | 183,057 | | | | 0.22 | | | | 0.74 | | | | 0.06 | |
Year ended 02/29/20 | | | 1.00 | | | | 0.01 | | | | 0.00 | | | | 0.01 | | | | (0.01 | ) | | | 1.00 | | | | 1.35 | | | | 32,297 | | | | 0.76 | | | | 0.76 | | | | 1.30 | |
Year ended 02/28/19 | | | 1.00 | | | | 0.01 | | | | (0.00 | ) | | | 0.01 | | | | (0.01 | ) | | | 1.00 | | | | 1.25 | | | | 25,871 | | | | 0.83 | | | | 0.83 | | | | 1.27 | |
Year ended 02/28/18 | | | 1.00 | | | | 0.00 | | | | (0.00 | ) | | | 0.00 | | | | (0.00 | ) | | | 1.00 | | | | 0.27 | | | | 27,387 | | | | 0.80 | | | | 0.93 | | | | 0.27 | |
Class Y | | | | | | | | | | | | | | | | | | | | | | | | | | | | | | | | | | | | | | | | | | | | |
Year ended 02/28/22 | | | 1.00 | | | | 0.00 | | | | (0.00 | )(c) | | | 0.00 | | | | (0.00 | ) | | | 1.00 | | | | 0.01 | | | | 67,999 | | | | 0.07 | | | | 0.36 | | | | 0.01 | |
Year ended 02/28/21 | | | 1.00 | | | | 0.00 | | | | 0.00 | | | | 0.00 | | | | (0.00 | ) | | | 1.00 | | | | 0.08 | | | | 55,813 | | | | 0.21 | | | | 0.35 | | | | 0.07 | |
Year ended 02/29/20 | | | 1.00 | | | | 0.02 | | | | 0.00 | | | | 0.02 | | | | (0.02 | ) | | | 1.00 | | | | 1.76 | | | | 42,686 | | | | 0.36 | | | | 0.36 | | | | 1.70 | |
Year ended 02/28/19 | | | 1.00 | | | | 0.02 | | | | (0.00 | ) | | | 0.02 | | | | (0.02 | ) | | | 1.00 | | | | 1.65 | | | | 34,105 | | | | 0.43 | | | | 0.43 | | | | 1.67 | |
Year ended 02/28/18 | | | 1.00 | | | | 0.01 | | | | (0.00 | ) | | | 0.01 | | | | (0.01 | ) | | | 1.00 | | | | 0.55 | | | | 30,080 | | | | 0.53 | | | | 0.53 | | | | 0.54 | |
Investor Class | | | | | | | | | | | | | | | | | | | | | | | | | | | | | | | | | | | | | | | | | | | | |
Year ended 02/28/22 | | | 1.00 | | | | 0.00 | | | | (0.00 | )(c) | | | 0.00 | | | | (0.00 | ) | | | 1.00 | | | | 0.01 | | | | 120,491 | | | | 0.07 | | | | 0.36 | | | | 0.01 | |
Year ended 02/28/21 | | | 1.00 | | | | 0.00 | | | | (0.00 | ) | | | 0.00 | | | | (0.00 | ) | | | 1.00 | | | | 0.08 | | | | 114,665 | | | | 0.21 | | | | 0.35 | | | | 0.07 | |
Year ended 02/29/20 | | | 1.00 | | | | 0.02 | | | | 0.00 | | | | 0.02 | | | | (0.02 | ) | | | 1.00 | | | | 1.76 | | | | 111,208 | | | | 0.36 | | | | 0.36 | | | | 1.70 | |
Year ended 02/28/19 | | | 1.00 | | | | 0.02 | | | | (0.00 | ) | | | 0.02 | | | | (0.02 | ) | | | 1.00 | | | | 1.65 | | | | 125,886 | | | | 0.43 | | | | 0.43 | | | | 1.67 | |
Year ended 02/28/18 | | | 1.00 | | | | 0.01 | | | | (0.00 | ) | | | 0.01 | | | | (0.01 | ) | | | 1.00 | | | | 0.55 | | | | 117,630 | | | | 0.53 | | | | 0.53 | | | | 0.54 | |
Class R6 | | | | | | | | | | | | | | | | | | | | | | | | | | | | | | | | | | | | | | | | | | | | |
Year ended 02/28/22 | | | 1.00 | | | | 0.00 | | | | (0.00 | )(c) | | | 0.00 | | | | (0.00 | ) | | | 1.00 | | | | 0.01 | | | | 126 | | | | 0.07 | | | | 0.27 | | | | 0.01 | |
Year ended 02/28/21 | | | 1.00 | | | | 0.00 | | | | 0.00 | | | | 0.00 | | | | (0.00 | ) | | | 1.00 | | | | 0.10 | | | | 127 | | | | 0.18 | | | | 0.31 | | | | 0.10 | |
Year ended 02/29/20 | | | 1.00 | | | | 0.02 | | | | 0.00 | | | | 0.02 | | | | (0.02 | ) | | | 1.00 | | | | 1.81 | | | | 20 | | | | 0.32 | | | | 0.32 | | | | 1.74 | |
Year ended 02/28/19 | | | 1.00 | | | | 0.02 | | | | (0.00 | ) | | | 0.02 | | | | (0.02 | ) | | | 1.00 | | | | 1.80 | | | | 12 | | | | 0.36 | | | | 0.38 | | | | 1.74 | |
Period ended 02/28/18(f) | | | 1.00 | | | | 0.01 | | | | (0.00 | ) | | | 0.01 | | | | (0.01 | ) | | | 1.00 | | | | 0.69 | | | | 10 | | | | 0.37 | (e) | | | 0.37 | (e) | | | 0.70 | (e) |
| (a) | Calculated using average shares outstanding. |
| (b) | Includes adjustments in accordance with accounting principles generally accepted in the United States of America and does not include sales charges and is not annualized for periods less than one year, if applicable. |
| (c) | Net gains (losses) on securities (both realized and unrealized) per share may not correlate with the Fund’s net realized and unrealized gain (loss) due to timing of shareholder transactions in relation to the fluctuating market values of the Fund’s investments. |
| (d) | Commencement date of May 15, 2020. |
| (f) | Commencement date of April 04, 2017. |
See accompanying Notes to Financial Statements which are an integral part of the financial statements.
| | |
| 11 | | Invesco Government Money Market Fund |
Notes to Financial Statements
February 28, 2022
NOTE 1–Significant Accounting Policies
Invesco Government Money Market Fund (the “Fund”), is a series portfolio of AIM Investment Securities Funds (Invesco Investment Securities Funds) (the “Trust”). The Trust is a Delaware statutory trust registered under the Investment Company Act of 1940, as amended (the “1940 Act”), as an open-end series management investment company authorized to issue an unlimited number of shares of beneficial interest. Information presented in these financial statements pertains only to the Fund. Matters affecting the Fund or each class will be voted on exclusively by the shareholders of the Fund or each class.
The Fund’s investment objective is to provide current income consistent with preservation of capital and liquidity.
The Fund currently consists of nine different classes of shares: Invesco Cash Reserve, Class A , Class AX, Class C, Class CX, Class R, Class Y, Investor Class and Class R6. Class A, Class AX and Class CX shares are closed to new investors. Class Y and Investor Class shares are available only to certain investors. Class C and Class CX shares are sold with a contingent deferred sales charges (“CDSC”). Invesco Cash Reserve, Class A, Class AX, Class R, Class Y, Investor Class and Class R6 shares are sold at net asset value. Class C shares held for eight years after purchase are eligible for automatic conversion into Invesco Cash Reserve shares of the same Fund (the “Conversion Feature”). The automatic conversion pursuant to the Conversion Feature will generally occur at the end of the month following the eighth anniversary after a purchase of Class C shares.
The Fund is an investment company and accordingly follows the investment company accounting and reporting guidance in accordance with Financial Accounting Standards Board Accounting Standards Codification Topic 946, Financial Services - Investment Companies.
The Fund is a “government money market fund” as defined in Rule 2a-7 under the 1940 Act and seeks to maintain a stable or constant NAV of $1.00 per share using an amortized cost method of valuation. “Government money market funds” are required to invest at least 99.5% of their total assets in cash, Government Securities (as defined in the 1940 Act), and/ or repurchase agreements collateralized fully by cash or Government Securities. The Board of Trustees has elected not to subject the Fund to the liquidity fee and redemption gate requirement at this time, as permitted by Rule 2a-7.
The following is a summary of the significant accounting policies followed by the Fund in the preparation of its financial statements.
| A. | Security Valuations – The Fund’s securities are recorded on the basis of amortized cost which approximates value as permitted by Rule 2a-7 under the 1940 Act. This method values a security at its cost on the date of purchase and, thereafter, assumes a constant amortization to maturity of any premiums or accretion of any discounts. |
Because of the inherent uncertainties of valuation, the values reflected in the financial statements may materially differ from the value received upon actual sale of those investments.
The Fund may invest in securities that are subject to interest rate risk, meaning the risk that the prices will generally fall as interest rates rise and, conversely, the prices will generally rise as interest rates fall. Specific securities differ in their sensitivity to changes in interest rates depending on their individual characteristics. Changes in interest rates may result in increased market volatility, which may affect the value and/or liquidity of certain Fund investments.
| B. | Securities Transactions and Investment Income – Securities transactions are accounted for on a trade date basis. Realized gains or losses on sales are computed on the basis of specific identification of the securities sold. Interest income (net of withholding tax, if any) is recorded on the accrual basis from settlement date and includes coupon interest and amortization of premium and accretion of discount on debt securities as applicable. |
The Fund may periodically participate in litigation related to Fund investments. As such, the Fund may receive proceeds from litigation settlements. Any proceeds received are included in the Statement of Operations as realized gain (loss) for investments no longer held and as unrealized gain (loss) for investments still held.
Brokerage commissions and mark ups are considered transaction costs and are recorded as an increase to the cost basis of securities purchased and/or a reduction of proceeds on a sale of securities. Such transaction costs are included in the determination of net realized gain (loss) from investment securities reported in the Statement of Operations and the Statement of Changes in Net Assets and the net realized gains (losses) on securities per share in the Financial Highlights. Transaction costs are included in the calculation of the Fund’s net asset value and, accordingly, they reduce the Fund’s total returns. These transaction costs are not considered operating expenses and are not reflected in net investment income reported in the Statement of Operations and the Statement of Changes in Net Assets, or the net investment income per share and the ratios of expenses and net investment income reported in the Financial Highlights, nor are they limited by any expense limitation arrangements between the Fund and the investment adviser.
The Fund allocates realized capital gains and losses to a class based on the relative net assets of each class. The Fund allocates income to a class based on the relative value of the settled shares of each class.
| C. | Country Determination – For the purposes of making investment selection decisions and presentation in the Schedule of Investments, the investment adviser may determine the country in which an issuer is located and/or credit risk exposure based on various factors. These factors include the laws of the country under which the issuer is organized, where the issuer maintains a principal office, the country in which the issuer derives 50% or more of its total revenues and the country that has the primary market for the issuer’s securities, as well as other criteria. Among the other criteria that may be evaluated for making this determination are the country in which the issuer maintains 50% or more of its assets, the type of security, financial guarantees and enhancements, the nature of the collateral and the sponsor organization. Country of issuer and/or credit risk exposure has been determined to be the United States of America, unless otherwise noted. |
| D. | Distributions – Distributions from net investment income, if any, are declared daily and paid monthly. Distributions from net realized capital gain, if any, are generally declared and paid annually and recorded on the ex-dividend date. |
| E. | Federal Income Taxes – The Fund intends to comply with the requirements of Subchapter M of the Internal Revenue Code of 1986, as amended (the “Internal Revenue Code”), necessary to qualify as a regulated investment company and to distribute substantially all of the Fund’s taxable earnings to shareholders. As such, the Fund will not be subject to federal income taxes on otherwise taxable income (including net realized capital gain) that is distributed to shareholders. |
Therefore, no provision for federal income taxes is recorded in the financial statements.
The Fund recognizes the tax benefits of uncertain tax positions only when the position is more likely than not to be sustained. Management has analyzed the Fund’s uncertain tax positions and concluded that no liability for unrecognized tax benefits should be recorded related to uncertain tax positions. Management is not aware of any tax positions for which it is reasonably possible that the total amounts of unrecognized tax benefits will change materially in the next 12 months.
The Fund files tax returns in the U.S. Federal jurisdiction and certain other jurisdictions. Generally, the Fund is subject to examinations by such taxing authorities for up to three years after the filing of the return for the tax period.
| F. | Expenses – Fees provided for under the Rule 12b-1 plan of a particular class of the Fund are charged to the operations of such class. Transfer agency fees and expenses and other shareholder recordkeeping fees and expenses attributable to Class R6 are charged to such class. Transfer agency fees and expenses and other shareholder recordkeeping fees and expenses relating to all other classes are allocated among those classes based on relative net assets. All other expenses are allocated among the classes based on relative net assets. |
| G. | Accounting Estimates – The preparation of financial statements in conformity with accounting principles generally accepted in the United States of America (“GAAP”) requires management to make estimates and assumptions that affect the reported amounts of assets and liabilities at the date of the financial statements and the reported amounts of revenues and expenses during the reporting period including estimates and assumptions related to taxation. Actual |
| | |
| 12 | | Invesco Government Money Market Fund |
| | results could differ from those estimates by a significant amount. In addition, the Fund monitors for material events or transactions that may occur or become known after the period-end date and before the date the financial statements are released to print. |
| H. | Indemnifications – Under the Trust’s organizational documents, each Trustee, officer, employee or other agent of the Trust is indemnified against certain liabilities that may arise out of the performance of their duties to the Fund. Additionally, in the normal course of business, the Fund enters into contracts, including the Fund’s servicing agreements, that contain a variety of indemnification clauses. The Fund’s maximum exposure under these arrangements is unknown as this would involve future claims that may be made against the Fund that have not yet occurred. The risk of material loss as a result of such indemnification claims is considered remote. |
| I. | Repurchase Agreements – The Fund may enter into repurchase agreements. Collateral on repurchase agreements, including the Fund’s pro-rata interest in joint repurchase agreements, is taken into possession by the Fund upon entering into the repurchase agreement. Collateral consisting of U.S. Government Securities and U.S. Government Sponsored Agency Securities is marked to market daily to ensure its market value is at least 102% of the sales price of the repurchase agreement. The investments in some repurchase agreements, pursuant to procedures approved by the Board of Trustees, are through participation with other mutual funds, private accounts and certain non-registered investment companies managed by the investment adviser or its affiliates (“Joint repurchase agreements”). The principal amount of the repurchase agreement is equal to the value at period-end. If the seller of a repurchase agreement fails to repurchase the security in accordance with the terms of the agreement, the Fund might incur expenses in enforcing its rights, and could experience losses, including a decline in the value of the collateral and loss of income. |
| J. | Other Risks – Investments in obligations issued by agencies and instrumentalities of the U.S. Government may vary in the level of support they receive from the government. The government may choose not to provide financial support to government sponsored agencies or instrumentalities if it is not legally obligated to do so. In this case, if the issuer defaulted, the Fund may not be able to recover its investment in such issuer from the U.S. Government. Additionally, from time to time, uncertainty regarding the status of negotiations in the U.S. Government to increase the statutory debt limit, commonly called the “debt ceiling”, could increase the risk that the U.S. Government may default on payments on certain U.S. Government securities, cause the credit rating of the U.S. Government to be downgraded, increase volatility in the stock and bond markets, result in higher interest rates, reduce prices of U.S. Treasury securities, and/or increase the costs of various kinds of debt. If a U.S. Government-sponsored entity is negatively impacted by legislative or regulatory action, is unable to meet its obligations, or its creditworthiness declines, the performance of the Fund that holds securities of that entity will be adversely impacted. |
| K. | COVID-19 Risk – The COVID-19 strain of coronavirus has resulted in instances of market closures and dislocations, extreme volatility, liquidity constraints and increased trading costs. Efforts to contain its spread have resulted in travel restrictions, disruptions of healthcare systems, business operations (including business closures) and supply chains, layoffs, lower consumer demand and employee availability, and defaults and credit downgrades, among other significant economic impacts that have disrupted global economic activity across many industries. Such economic impacts may exacerbate other pre-existing political, social and economic risks locally or globally and cause general concern and uncertainty. |
The full economic impact and ongoing effects of COVID-19 (or other future epidemics or pandemics) at the macro-level and on individual businesses are unpredictable and may result in significant and prolonged effects on the Fund’s performance.
NOTE 2–Advisory Fees and Other Fees Paid to Affiliates
The Trust has entered into a master investment advisory agreement with Invesco Advisers, Inc. (the “Adviser” or “Invesco”). Under the terms of the investment advisory agreement, the Fund accrues daily and pays monthly an advisory fee to the Adviser based on the annual rate of 0.15% of the Fund’s average daily net assets.
Under the terms of a master sub-advisory agreement between the Adviser and each of Invesco Asset Management Deutschland GmbH, Invesco Asset Management Limited, Invesco Asset Management (Japan) Limited, Invesco Hong Kong Limited, Invesco Senior Secured Management, Inc. and Invesco Canada Ltd. (collectively, the “Affiliated Sub-Advisers”) the Adviser, not the Fund, will pay 40% of the fees paid to the Adviser to any such Affiliated Sub-Adviser(s) that provide(s) discretionary investment management services to the Fund based on the percentage of assets allocated to such Affiliated Sub-Adviser(s).
The Adviser has contractually agreed, through at least, June 30, 2022, to waive advisory fees and/or reimburse expenses to the extent necessary to limit total annual operating expenses after fee waivers and/or expense reimbursements (excluding certain items discussed below) of Invesco Cash Reserve, Class A, Class AX, Class C, Class CX, Class R, Class Y, Investor Class and Class R6 shares to 1.40%, 1.45%, 1.40%, 2.00%, 2.15%, 1.65%, 1.25%, 1.25% and 1.25%, respectively, of the Fund’s average daily net assets (the “expense limits”). In determining the Adviser’s obligation to waive advisory fees and/or reimburse expenses, the following expenses are not taken into account, and could cause the total annual operating expenses after fee waivers and/or expense reimbursements to exceed the numbers reflected above: (1) interest; (2) taxes; (3) dividend expense on short sales; (4) extraordinary or non-routine items, including litigation expenses; and (5) expenses that the Fund has incurred but did not actually pay because of an expense offset arrangement. Unless Invesco continues the fee waiver agreement, it will terminate on June 30, 2022. During its term, the fee waiver agreement cannot be terminated or amended to increase the expense limits or reduce the advisory fee waiver without approval of the Board of Trustees. The Adviser did not waive fees and/or reimburse expenses during the period under these expense limits.
Further, Invesco and/or Invesco Distributors, Inc. (“IDI”) voluntarily waived fees and/or reimbursed expenses in order to increase the Fund’s yield. Voluntary fee waivers and/or reimbursements may be modified or discontinued at any time upon consultation with the Board of Trustees without further notice to investors.
For the year ended February 28, 2022, Invesco voluntarily waived advisory fees of $4,646,208 and reimbursed class level expenses of $6,780,107, $960,564, $213,309, $773,042, $3,456, $663,302, $93,568, $160,998 and $63 for Invesco Cash Reserve, Class A, Class AX, Class C, Class CX, Class R, Class Y, Investor Class and Class R6 shares, respectively, in order to increase the yield.
The Trust has entered into a master administrative services agreement with Invesco pursuant to which the Fund has agreed to pay Invesco for certain administrative costs incurred in providing accounting services to the Fund. For the year ended February 28, 2022, expenses incurred under the agreement are shown in the Statement of Operations as Administrative services fees. Also, Invesco has entered into a sub-administration agreement whereby The Bank of New York Mellon (“BNY Mellon”) serves as custodian and fund accountant and provides certain administrative services to the Fund.
The Trust has entered into a transfer agency and service agreement with Invesco Investment Services, Inc. (“IIS”) pursuant to which the Fund has agreed to pay IIS a fee for providing transfer agency and shareholder services to the Fund and reimburse IIS for certain expenses incurred by IIS in the course of providing such services. IIS may make payments to intermediaries that provide omnibus account services, sub-accounting services and/or networking services. All fees payable by IIS to intermediaries that provide omnibus account services or sub-accounting services are charged back to the Fund, subject to certain limitations approved by the Trust’s Board of Trustees. For the year ended February 28, 2022, expenses incurred under the agreement are shown in the Statement of Operations as Transfer agent fees.
The Trust has entered into master distribution agreements with IDI to serve as the distributor for the Invesco Cash Reserve, Class A, Class AX, Class C, Class CX, Class R, Class Y, Investor Class and Class R6 shares of the Fund. The Trust has adopted plans pursuant to Rule 12b-1 under the 1940 Act with respect to the Fund’s Invesco Cash Reserve, Class A, Class AX, Class C, Class CX and Class R shares (collectively, the “Plans”). The Fund, pursuant to the Plans, pays IDI compensation at the annual rate of 0.15% of the Fund’s average daily net assets of Invesco Cash Reserve shares, 0.75% of the Fund’s average daily net assets of Class C shares and 0.40% of the Fund’s average daily net assets of Class R shares. The Fund, pursuant to the Plans, reimburses IDI for its allocated share of expenses incurred for the period, up to a maximum annual rate of 0.20% of the Fund’s average daily net assets of Class A shares, up to a maximum annual rate of 0.15% of the Fund’s average daily net assets of Class AX shares and up to a maximum annual rate of 0.90% of the average daily net assets of Class CX shares. The fees are accrued daily and paid monthly. Of the Plan payments, up to 0.25% of the average daily net assets of each class of shares may be paid to furnish continuing personal shareholder services to customers who purchase and own shares of such classes. Any amounts not paid as a service fee under the Plans would constitute an asset-based sales charge. Rules of the Financial Industry Regulatory Authority (“FINRA”) impose a cap on the total sales charges, including asset-based sales charges, that may be paid by any class of
| | |
| 13 | | Invesco Government Money Market Fund |
shares of the Fund. Prior to July 1, 2021, IDI had contractually agreed, through June 30, 2021, to limit 12b-1 fees to 0.00% of average daily net assets for Class A, Class C and Class R shares. Prior to July 1, 2021, $250,760, $333,206 and $230,343 were waived for Class A, Class C and Class R shares, respectively. The Expenses before fee waivers under this agreement are shown as Distribution fees in the Statement of Operations. For the the year ended February 28, 2022, expenses incurred after combined contractual waivers and voluntary yield waivers and reimbursements were $0, $0, $0, $1, $0 and $0 for Invesco Cash Reserve, Class A, Class AX, Class C, Class CX, and Class R shares, respectively.
CDSC are not recorded as expenses of the Fund. CDSC are deducted from redemption proceeds prior to remittance to the shareholder. During the year ended February 28, 2022, IDI advised the Fund that IDI retained $886, $286, $9,906 and $0 from Invesco Cash Reserve, Class A, Class C and Class CX shares, respectively, for CDSC imposed on redemptions by shareholders.
Certain officers and trustees of the Trust are officers and directors of the Adviser, IIS and/or IDI.
NOTE 3–Additional Valuation Information
GAAP defines fair value as the price that would be received to sell an asset or paid to transfer a liability in an orderly transaction between market participants at the measurement date, under current market conditions. GAAP establishes a hierarchy that prioritizes the inputs to valuation methods, giving the highest priority to readily available unadjusted quoted prices in an active market for identical assets (Level 1) and the lowest priority to significant unobservable inputs (Level 3), generally when market prices are not readily available or are unreliable. Based on the valuation inputs, the securities or other investments are tiered into one of three levels. Changes in valuation methods may result in transfers in or out of an investment’s assigned level:
| | |
| Level 1 – | | Prices are determined using quoted prices in an active market for identical assets. |
| Level 2 – | | Prices are determined using other significant observable inputs. Observable inputs are inputs that other market participants may use in pricing a security. These may include quoted prices for similar securities, interest rates, prepayment speeds, credit risk, yield curves, loss severities, default rates, discount rates, volatilities and others. |
| Level 3 – | | Prices are determined using significant unobservable inputs. In situations where quoted prices or observable inputs are unavailable (for example, when there is little or no market activity for an investment at the end of the period), unobservable inputs may be used. Unobservable inputs reflect the Fund’s own assumptions about the factors market participants would use in determining fair value of the securities or instruments and would be based on the best available information. |
As of February 28, 2022, all of the securities in this Fund were valued based on Level 2 inputs (see the Schedule of Investments for security categories). The level assigned to the securities valuations may not be an indication of the risk or liquidity associated with investing in those securities. Because of the inherent uncertainties of valuation, the values reflected in the financial statements may materially differ from the value received upon actual sale of those investments.
NOTE 4–Trustees’ and Officers’ Fees and Benefits
Trustees’ and Officers’ Fees and Benefits include amounts accrued by the Fund to pay remuneration to certain Trustees and Officers of the Fund. Trustees have the option to defer compensation payable by the Fund, and Trustees’ and Officers’ Fees and Benefits also include amounts accrued by the Fund to fund such deferred compensation amounts. Those Trustees who defer compensation have the option to select various Invesco Funds in which their deferral accounts shall be deemed to be invested. Finally, certain current Trustees were eligible to participate in a retirement plan that provided for benefits to be paid upon retirement to Trustees over a period of time based on the number of years of service. The Fund may have certain former Trustees who also participate in a retirement plan and receive benefits under such plan. Trustees’ and Officers’ Fees and Benefits include amounts accrued by the Fund to fund such retirement benefits. Obligations under the deferred compensation and retirement plans represent unsecured claims against the general assets of the Fund.
NOTE 5–Cash Balances
The Fund is permitted to temporarily carry a negative or overdrawn balance in its account with BNY Mellon, the custodian bank. Such balances, if any at period-end, are shown in the Statement of Assets and Liabilities under the payable caption Amount due custodian. To compensate the custodian bank for such overdrafts, the overdrawn Fund may either (1) leave funds as a compensating balance in the account so the custodian bank can be compensated by earning the additional interest; or (2) compensate by paying the custodian bank at a rate agreed upon by the custodian bank and Invesco, not to exceed the contractually agreed upon rate.
NOTE 6–Distributions to Shareholders and Tax Components of Net Assets
Tax Character of Distributions to Shareholders Paid During the Years Ended February 28, 2022 and February 28, 2021:
| | | | | | | | | | | | |
| | | 2022 | | | | | | 2021 | |
|
| |
Ordinary income* | | $ | 183,636 | | | | | | | $ | 1,864,288 | |
|
| |
| * | Includes short-term capital gain distributions, if any. |
Tax Components of Net Assets at Period-End:
| | | | |
| | | 2022 | |
|
| |
Undistributed ordinary income | | $ | 87,126 | |
|
| |
Temporary book/tax differences | | | (314,790 | ) |
|
| |
Shares of beneficial interest | | | 3,272,878,402 | |
|
| |
Total net assets | | $ | 3,272,650,738 | |
|
| |
The temporary book/tax differences are a result of timing differences between book and tax recognition of income and/or expenses. The Fund’s temporary book/tax differences are the result of the trustee deferral of compensation and retirement plan benefits.
Capital loss carryforward is calculated and reported as of a specific date. Results of transactions and other activity after that date may affect the amount of capital loss carryforward actually available for the Fund to utilize. The ability to utilize capital loss carryforward in the future may be limited under the Internal Revenue Code and related regulations based on the results of future transactions.
The Fund does not have a capital loss carryforward as of February 28, 2022.
| | |
| 14 | | Invesco Government Money Market Fund |
NOTE 7–Reclassification of Permanent Differences
Primarily as a result of differing book/tax treatment of equalization, on February 28, 2022, undistributed net investment income was decreased by $385,174, undistributed net realized gain (loss) was decreased by $13,826 and shares of beneficial interest was increased by $399,000. This reclassification had no effect on the net assets or the distributable earnings of the Fund.
NOTE 8–Share Information
| | | | | | | | | | | | | | | | |
| | | Summary of Share Activity | |
|
| |
| | | Years ended February 28, | |
| | | Year ended February 28, 2022(a) | | | Year ended February 28, 2021 | |
| | | Shares | | | Amount | | | Shares | | | Amount | |
|
| |
Sold: | | | | | | | | | | | | | | | | |
Invesco Cash Reserve | | | 1,782,722,725 | | | $ | 1,782,722,725 | | | | 3,427,519,770 | | | $ | 3,427,519,770 | |
|
| |
Class A(b) | | | 100,774,227 | | | | 100,774,227 | | | | 134,655,336 | | | | 134,655,336 | |
|
| |
Class AX | | | 11,478,496 | | | | 11,478,496 | | | | 13,358,152 | | | | 13,358,152 | |
|
| |
Class C | | | 74,697,650 | | | | 74,697,650 | | | | 160,645,349 | | | | 160,645,349 | |
|
| |
Class CX | | | 19,228 | | | | 19,228 | | | | 69,393 | | | | 69,393 | |
|
| |
Class R | | | 77,680,745 | | | | 77,680,745 | | | | 126,016,149 | | | | 126,016,149 | |
|
| |
Class Y | | | 53,892,255 | | | | 53,892,255 | | | | 72,123,028 | | | | 72,123,028 | |
|
| |
Investor Class | | | 42,473,954 | | | | 42,473,954 | | | | 63,786,957 | | | | 63,786,957 | |
|
| |
Class R6 | | | 63,781 | | | | 63,781 | | | | 64,249 | | | | 64,249 | |
|
| |
| | | | |
Issued as reinvestment of dividends: | | | | | | | | | | | | | | | | |
Invesco Cash Reserve | | | 134,956 | | | | 134,956 | | | | 1,600,523 | | | | 1,600,523 | |
|
| |
Class A | | | 18,714 | | | | 18,714 | | | | 23,660 | | | | 23,660 | |
|
| |
Class AX | | | 3,468 | | | | 3,468 | | | | 43,927 | | | | 43,927 | |
|
| |
Class C | | | 6,863 | | | | 6,863 | | | | 17,050 | | | | 17,050 | |
|
| |
Class CX | | | 10 | | | | 10 | | | | 56 | | | | 56 | |
|
| |
Class R | | | 9,586 | | | | 9,586 | | | | 24,046 | | | | 24,046 | |
|
| |
Class Y | | | 3,841 | | | | 3,841 | | | | 44,686 | | | | 44,686 | |
|
| |
Investor Class | | | 5,530 | | | | 5,530 | | | | 99,944 | | | | 99,944 | |
|
| |
Class R6 | | | 5 | | | | 5 | | | | 15 | | | | 15 | |
|
| |
| | | | |
Automatic Conversion of Class C and CX shares to Invesco | | | | | | | | | | | | | | | | |
Cash Reserve shares: | | | | | | | | | | | | | | | | |
Invesco Cash Reserve | | | 11,821,653 | | | | 11,821,653 | | | | 29,351,146 | | | | 29,351,146 | |
|
| |
Class C | | | (11,793,413 | ) | | | (11,793,413 | ) | | | (29,199,920 | ) | | | (29,199,920 | ) |
|
| |
Class CX | | | (28,240 | ) | | | (28,240 | ) | | | (151,226 | ) | | | (151,226 | ) |
|
| |
| | | | |
Issued in connection with acquisitions:(c) | | | | | | | | | | | | | | | | |
Class A | | | - | | | | - | | | | 451,606,343 | | | | 451,486,039 | |
|
| |
Class C | | | - | | | | - | | | | 110,567,396 | | | | 110,537,809 | |
|
| |
Class R | | | - | | | | - | | | | 127,042,511 | | | | 127,008,626 | |
|
| |
Class Y | | | - | | | | - | | | | 358,538 | | | | 358,442 | |
|
| |
Class R6 | | | - | | | | - | | | | 101,127 | | | | 101,102 | |
|
| |
| | | | |
Reacquired: | | | | | | | | | | | | | | | | |
Invesco Cash Reserve | | | (2,103,295,930 | ) | | | (2,103,295,930 | ) | | | (3,165,163,993 | ) | | | (3,165,163,993 | ) |
|
| |
Class A | | | (161,088,130 | ) | | | (161,088,130 | ) | | | (185,037,455 | ) | | | (185,037,455 | ) |
|
| |
Class AX | | | (15,448,227 | ) | | | (15,448,227 | ) | | | (15,567,070 | ) | | | (15,567,070 | ) |
|
| |
Class C | | | (85,186,750 | ) | | | (85,186,750 | ) | | | (141,170,528 | ) | | | (141,170,528 | ) |
|
| |
Class CX | | | (116,636 | ) | | | (116,636 | ) | | | (55,514 | ) | | | (55,514 | ) |
|
| |
Class R | | | (100,836,351 | ) | | | (100,836,351 | ) | | | (102,313,597 | ) | | | (102,313,597 | ) |
|
| |
Class Y | | | (41,709,035 | ) | | | (41,709,035 | ) | | | (59,396,972 | ) | | | (59,396,972 | ) |
|
| |
Investor Class | | | (36,654,041 | ) | | | (36,654,041 | ) | | | (60,424,247 | ) | | | (60,424,247 | ) |
|
| |
Class R6 | | | (65,082 | ) | | | (65,082 | ) | | | (58,129 | ) | | | (58,129 | ) |
|
| |
Net increase (decrease) in share activity | | | (400,414,148 | ) | | $ | (400,414,148 | ) | | | 960,580,700 | | | $ | 960,396,803 | |
|
| |
| (a) | There are entities that are record owners of more than 5% of the outstanding shares of the Fund and in the aggregate own 42% of the outstanding shares of the Fund. IDI has an agreement with these entities to sell Fund shares. The Fund, Invesco and/or Invesco affiliates may make payments to these entities, which are considered to be related to the Fund, for providing services to the Fund, Invesco and/or Invesco affiliates including but not limited to services such as securities brokerage, distribution, third party record keeping and account servicing. The Fund has no knowledge as to whether all or any portion of the shares owned of record by these entities are also owned beneficially. |
| (b) | Commencement date of May 15, 2020. |
| | |
| 15 | | Invesco Government Money Market Fund |
| (c) | After the close of business on May 15, 2020, the Fund acquired all the net assets of Invesco Oppenheimer Government Cash Reserves Fund (the “Target Fund”) pursuant to a plan of reorganization approved by the Board of Trustees of the Fund on February 14, 2020. The reorganization was executed in order to reduce overlap and increase efficiencies in the Adviser’s product line. The acquisition was accomplished by a tax-free exchange of 689,675,915 shares of the Fund for 689,675,915 shares outstanding of the Target Fund as of the close of business on May 15, 2020. Shares of the Target Fund were exchanged for the like class of shares of the Fund, based on the relative net asset value of the Target Fund to the net asset value of the Fund on the close of business, May 15, 2020. The Target Fund’s net assets as of the close of business on May 15, 2020 of $689,492,018, including $0 of unrealized appreciation (depreciation), were combined with those of the Fund. The net assets of the Fund immediately before the acquisition were $3,297,363,876 and $3,986,855,894 immediately after the acquisition. |
The pro forma results of operations for the year ended February 28, 2021 assuming the reorganization had been completed on March 1, 2020, the beginning of the annual reporting period are as follows:
| | | | |
Net investment income | | $ | 2,070,178 | |
|
| |
Net realized gain from investment securities | | | 55,136 | |
|
| |
Net increase in net assets resulting from operations | | $ | 2,125,314 | |
|
| |
As the combined investment portfolios have been managed as a single integrated portfolio since the acquisition was completed, it is not practicable to separate the amounts of revenue and earnings of the Target Fund that has been included in the Fund’s Statement of Operations since May 16, 2020.
| | |
| 16 | | Invesco Government Money Market Fund |
Report of Independent Registered Public Accounting Firm
To the Board of Trustees of AIM Investment Securities Funds (Invesco Investment Securities Funds) and Shareholders of Invesco Government Money Market Fund
Opinion on the Financial Statements
We have audited the accompanying statement of assets and liabilities, including the schedule of investments, of Invesco Government Money Market Fund (one of the funds constituting AIM Investment Securities Funds (Invesco Investment Securities Funds), referred to hereafter as the “Fund”) as of February 28, 2022, the related statement of operations for the year ended February 28, 2022, the statement of changes in net assets for each of the two years in the period ended February 28, 2022, including the related notes, and the financial highlights for each of the periods indicated therein (collectively referred to as the “financial statements”). In our opinion, the financial statements present fairly, in all material respects, the financial position of the Fund as of February 28, 2022, the results of its operations for the year then ended, the changes in its net assets for each of the two years in the period ended February 28, 2022 and the financial highlights for each of the periods indicated therein in conformity with accounting principles generally accepted in the United States of America.
Basis for Opinion
These financial statements are the responsibility of the Fund’s management. Our responsibility is to express an opinion on the Fund’s financial statements based on our audits. We are a public accounting firm registered with the Public Company Accounting Oversight Board (United States) (PCAOB) and are required to be independent with respect to the Fund in accordance with the U.S. federal securities laws and the applicable rules and regulations of the Securities and Exchange Commission and the PCAOB.
We conducted our audits of these financial statements in accordance with the standards of the PCAOB. Those standards require that we plan and perform the audit to obtain reasonable assurance about whether the financial statements are free of material misstatement, whether due to error or fraud.
Our audits included performing procedures to assess the risks of material misstatement of the financial statements, whether due to error or fraud, and performing procedures that respond to those risks. Such procedures included examining, on a test basis, evidence regarding the amounts and disclosures in the financial statements. Our audits also included evaluating the accounting principles used and significant estimates made by management, as well as evaluating the overall presentation of the financial statements. Our procedures included confirmation of securities owned as of February 28, 2022 by correspondence with the custodian and brokers; when replies were not received from the brokers, we performed other auditing procedures. We believe that our audits provide a reasonable basis for our opinion.
/s/PricewaterhouseCoopers LLP
Houston, TX
April 28, 2022
We have served as the auditor of one or more of the investment companies in the Invesco group of investment companies since at least 1995. We have not been able to determine the specific year we began serving as auditor.
| | |
| 17 | | Invesco Government Money Market Fund |
Calculating your ongoing Fund expenses
Example
As a shareholder of the Fund, you incur two types of costs: (1) transaction costs, which may include sales charges (loads) on purchase payments or contingent deferred sales charges on redemptions, if any; and (2) ongoing costs, including management fees, distribution and/or service (12b-1) fees, and other Fund expenses. This example is intended to help you understand your ongoing costs (in dollars) of investing in the Fund and to compare these costs with ongoing costs of investing in other mutual funds. The example is based on an investment of $1,000 invested at the beginning of the period and held for the entire period September 1, 2021 through February 28, 2022.
Actual expenses
The table below provides information about actual account values and actual expenses. You may use the information in this table, together with the amount you invested, to estimate the expenses that you paid over the period. Simply divide your account value by $1,000 (for example, an $8,600 account value divided by $1,000 = 8.6), then multiply the result by the number in the table under the heading entitled “Actual Expenses Paid During Period” to estimate the expenses you paid on your account during this period.
Hypothetical example for comparison purposes
The table below also provides information about hypothetical account values and hypothetical expenses based on the Fund’s actual expense ratio and an assumed rate of return of 5% per year before expenses, which is not the Fund’s actual return.
The hypothetical account values and expenses may not be used to estimate the actual ending account balance or expenses you paid for the period. You may use this information to compare the ongoing costs of investing in the Fund and other funds. To do so, compare this 5% hypothetical example with the 5% hypothetical examples that appear in the shareholder reports of the other funds.
Please note that the expenses shown in the table are meant to highlight your ongoing costs only and do not reflect any transaction costs, such as sales charges (loads) on purchase payments or contingent deferred sales charges on redemptions, if any. Therefore, the hypothetical information is useful in comparing ongoing costs only, and will not help you determine the relative total costs of owning different funds. In addition, if these transaction costs were included, your costs would have been higher.
| | | | | | | | | | | | |
| | | | | ACTUAL | | HYPOTHETICAL (5% annual return before expenses) | | |
| Class | | Beginning
Account Value
(09/01/21) | | Ending
Account Value
(02/28/22)1 | | Expenses
Paid During
Period | | Ending
Account Value
(02/28/22) | | Expenses
Paid During
Period | | Annualized
Expense Ratio |
Invesco Cash Reserve | | $1,000.00 | | $1,000.02 | | $0.40 | | $1,024.40 | | $0.40 | | 0.08% |
A | | 1,000.00 | | 1,000.02 | | 0.40 | | 1,024.40 | | 0.40 | | 0.08 |
AX | | 1,000.00 | | 1,000.02 | | 0.40 | | 1,024.40 | | 0.40 | | 0.08 |
C | | 1,000.00 | | 1,000.02 | | 0.40 | | 1,024.40 | | 0.40 | | 0.08 |
CX | | 1,000.00 | | 1,000.02 | | 0.40 | | 1,024.40 | | 0.40 | | 0.08 |
R | | 1,000.00 | | 1,000.02 | | 0.40 | | 1,024.40 | | 0.40 | | 0.08 |
Y | | 1,000.00 | | 1,000.02 | | 0.40 | | 1,024.40 | | 0.40 | | 0.08 |
Investor | | 1,000.00 | | 1,000.02 | | 0.40 | | 1,024.40 | | 0.40 | | 0.08 |
R6 | | 1,000.00 | | 1,000.02 | | 0.40 | | 1,024.40 | | 0.40 | | 0.08 |
| 1 | The actual ending account value is based on the actual total return of the Fund for the period September 1, 2021 through February 28, 2022, after actual expenses and will differ from the hypothetical ending account value which is based on the Fund’s expense ratio and a hypothetical annual return of 5% before expenses. |
| | |
| 18 | | Invesco Government Money Market Fund |
Tax Information
Form 1099-DIV, Form 1042-S and other year-end tax information provide shareholders with actual calendar year amounts that should be included in their tax returns. Shareholders should consult their tax advisers.
The following distribution information is being provided as required by the Internal Revenue Code or to meet a specific state’s requirement.
The Fund designates the following amounts or, if subsequently determined to be different, the maximum amount allowable for its fiscal year ended February 28, 2022:
| | | | |
Federal and State Income Tax | | | |
Qualified Business Income* | | | 0.00 | % |
Qualified Dividend Income* | | | 0.00 | % |
Corporate Dividends Received Deduction* | | | 0.00 | % |
Business Interest Income* | | | 95.07 | % |
U.S. Treasury Obligations* | | | 100.00 | % |
| * The above percentages are based on ordinary income dividends paid to shareholders during the Fund’s fiscal year. |
| |
Non-Resident Alien Shareholders | | | |
Qualified Short-Term Gains | | $ | 13,824 | |
| | |
| 19 | | Invesco Government Money Market Fund |
Trustees and Officers
The address of each trustee and officer is AIM Investment Securities Funds (Invesco Investment Securities Funds) (the “Trust”), 11 Greenway Plaza, Suite 1000, Houston, Texas 77046-1173. The trustees serve for the life of the Trust, subject to their earlier death, incapacitation, resignation, retirement or removal as more specifically provided in the Trust’s organizational documents. Each officer serves for a one year term or until their successors are elected and qualified. Column two below includes length of time served with predecessor entities, if any.
| | | | | | | | |
Name, Year of Birth and Position(s) Held with the Trust | | Trustee and/or Officer Since | | Principal Occupation(s) During Past 5 Years | | Number of Funds in Fund Complex Overseen by Trustee | | Other Directorship(s) Held by Trustee During Past 5 Years |
| Interested Trustee | | | | | | | | |
| | | | | |
| Martin L. Flanagan1 – 1960 Trustee and Vice Chair | | 2007 | | Executive Director, Chief Executive Officer and President, Invesco Ltd. (ultimate parent of Invesco and a global investment management firm); Trustee and Vice Chair, The Invesco Funds; Vice Chair, Investment Company Institute; and Member of Executive Board, SMU Cox School of Business Formerly: Advisor to the Board, Invesco Advisers, Inc. (formerly known as Invesco Institutional (N.A.), Inc.); Chairman and Chief Executive Officer, Invesco Advisers, Inc. (registered investment adviser); Director, Chairman, Chief Executive Officer and President, Invesco Holding Company (US), Inc. (formerly IVZ Inc.) (holding company), Invesco Group Services, Inc. (service provider) and Invesco North American Holdings, Inc. (holding company); Director, Chief Executive Officer and President, Invesco Holding Company Limited (parent of Invesco and a global investment management firm); Director, Invesco Ltd.; Chairman, Investment Company Institute and President, Co-Chief Executive Officer, Co-President, Chief Operating Officer and Chief Financial Officer, Franklin Resources, Inc. (global investment management organization) | | 188 | | None |
| 1 | Mr. Flanagan is considered an interested person (within the meaning of Section 2(a)(19) of the 1940 Act) of the Trust because he is an officer of the Adviser to the Trust, and an officer and a director of Invesco Ltd., ultimate parent of the Adviser. |
| | |
| T-1 | | Invesco Government Money Market Fund |
Trustees and Officers–(continued)
| | | | | | | | |
Name, Year of Birth and Position(s) Held with the Trust | | Trustee and/or Officer Since | | Principal Occupation(s) During Past 5 Years | | Number of Funds in Fund Complex Overseen by
Trustee | | Other Directorship(s) Held by Trustee During Past 5 Years |
| Independent Trustees | | | | | | | | |
| | | | | |
| Christopher L. Wilson - 1957 Trustee and Chair | | 2017 | | Retired Formerly: Director, TD Asset Management USA Inc. (mutual fund complex) (22 portfolios); Managing Partner, CT2, LLC (investing and consulting firm); President/Chief Executive Officer, Columbia Funds, Bank of America Corporation; President/Chief Executive Officer, CDC IXIS Asset Management Services, Inc.; Principal & Director of Operations, Scudder Funds, Scudder, Stevens & Clark, Inc.; Assistant Vice President, Fidelity Investments | | 188 | | Formerly: enaible, Inc. (artificial intelligence technology) Director, ISO New England, Inc. (non-profit organization managing regional electricity market) |
| | | | | |
Beth Ann Brown - 1968 Trustee | | 2019 | | Independent Consultant Formerly: Head of Intermediary Distribution, Managing Director, Strategic Relations, Managing Director, Head of National Accounts, Senior Vice President, National Account Manager and Senior Vice President, Key Account Manager, Columbia Management Investment Advisers LLC; Vice President, Key Account Manager, Liberty Funds Distributor, Inc.; and Trustee of certain Oppenheimer Funds | | 188 | | Director, Board of Directors of Caron Engineering Inc.; Advisor, Board of Advisors of Caron Engineering Inc.; President and Director, Acton Shapleigh Youth Conservation Corps (non-profit) Formerly: President and Director of Grahamtastic Connection (non-profit) |
| | | | | |
Cynthia Hostetler - 1962 Trustee | | 2017 | | Non-Executive Director and Trustee of a number of public and private business corporations Formerly: Director, Aberdeen Investment Funds (4 portfolios); Director, Artio Global Investment LLC (mutual fund complex); Director, Edgen Group, Inc. (specialized energy and infrastructure products distributor); Director, Genesee & Wyoming, Inc. (railroads); Head of Investment Funds and Private Equity, Overseas Private Investment Corporation; President, First Manhattan Bancorporation, Inc.; Attorney, Simpson Thacher & Bartlett LLP | | 188 | | Resideo Technologies, Inc. (smart home technology); Vulcan Materials Company (construction materials company); Trilinc Global Impact Fund; Textainer Group Holdings, (shipping container leasing company); Investment Company Institute (professional organization); Independent Directors Council (professional organization) |
| | | | | |
Eli Jones - 1961 Trustee | | 2016 | | Professor and Dean Emeritus, Mays Business School - Texas A&M University Formerly: Dean of Mays Business School-Texas A&M University; Professor and Dean, Walton College of Business, University of Arkansas and E.J. Ourso College of Business, Louisiana State University; Director, Arvest Bank | | 188 | | Insperity, Inc. (formerly known as Administaff) (human resources provider); Member of Regional Board of Directors and Board of Directors, First Financial Bancorp (regional bank) |
| | | | | |
| Elizabeth Krentzman - 1959 Trustee | | 2019 | | Formerly: Principal and Chief Regulatory Advisor for Asset Management Services and U.S. Mutual Fund Leader of Deloitte & Touche LLP; General Counsel of the Investment Company Institute (trade association); National Director of the Investment Management Regulatory Consulting Practice, Principal, Director and Senior Manager of Deloitte & Touche LLP; Assistant Director of the Division of Investment Management - Office of Disclosure and Investment Adviser Regulation of the U.S. Securities and Exchange Commission and various positions with the Division of Investment Management - Office of Regulatory Policy of the U.S. Securities and Exchange Commission; Associate at Ropes & Gray LLP; and Trustee of certain Oppenheimer Funds | | 188 | | Trustee of the University of Florida National Board Foundation; Member of the Cartica Funds Board of Directors (private investment funds) Formerly: Member of the University of Florida Law Center Association, Inc. Board of Trustees, Audit Committee and Membership Committee |
| | | | | |
| Anthony J. LaCava, Jr. - 1956 Trustee | | 2019 | | Formerly: Director and Member of the Audit Committee, Blue Hills Bank (publicly traded financial institution) and Managing Partner, KPMG LLP | | 188 | | Blue Hills Bank; Chairman, Bentley University; Member, Business School Advisory Council; and Nominating Committee, KPMG LLP |
| | | | | |
| Prema Mathai-Davis - 1950 Trustee | | 1998 | | Retired Formerly: Co-Founder & Partner of Quantalytics Research, LLC, (a FinTech Investment Research Platform for the Self-Directed Investor); Trustee of YWCA Retirement Fund; CEO of YWCA of the USA; Board member of the NY Metropolitan Transportation Authority; Commissioner of the NYC Department of Aging; Board member of Johns Hopkins Bioethics Institute | | 188 | | Member of Board of Positive Planet US (non-profit) and HealthCare Chaplaincy Network (non-profit) |
| | |
| T-2 | | Invesco Government Money Market Fund |
Trustees and Officers–(continued)
| | | | | | | | |
Name, Year of Birth and Position(s) Held with the Trust | | Trustee and/or Officer Since | | Principal Occupation(s) During Past 5 Years | | Number of Funds in Fund Complex Overseen by
Trustee | | Other Directorship(s) Held by Trustee During Past 5 Years |
| Independent Trustees–(continued) | | | | | | |
| | | | | |
Joel W. Motley - 1952 Trustee | | 2019 | | Director of Office of Finance, Federal Home Loan Bank System; Managing Director of Carmona Motley Inc. (privately held financial advisor); Member of the Council on Foreign Relations and its Finance and Budget Committee; Chairman Emeritus of Board of Human Rights Watch and Member of its Investment Committee; and Member of Investment Committee Board of Historic Hudson Valley (non-profit cultural organization); and Member of the Board, Blue Ocean Acquisition Corp. Formerly: Managing Director of Public Capital Advisors, LLC (privately held financial advisor); Managing Director of Carmona Motley Hoffman, Inc. (privately held financial advisor); Trustee of certain Oppenheimer Funds; Director of Columbia Equity Financial Corp. (privately held financial advisor); and Member of the Vestry of Trinity Church Wall Street | | 188 | | Member of Board of Trust for Mutual Understanding (non-profit promoting the arts and environment); Member of Board of Greenwall Foundation (bioethics research foundation) and its Investment Committee; Member of Board of Friends of the LRC (non-profit legal advocacy); Board Member and Investment Committee Member of Pulitzer Center for Crisis Reporting (non-profit journalism)Positive Planet US |
| | | | | |
Teresa M. Ressel - 1962 Trustee | | 2017 | | Non-executive director and trustee of a number of public and private business corporations Formerly: Chief Executive Officer, UBS Securities LLC (investment banking); Chief Operating Officer, UBS AG Americas (investment banking); Sr. Management Team Olayan America, The Olayan Group (international investor/commercial/industrial); Assistant Secretary for Management & Budget and Designated Chief Financial Officer, U.S. Department of Treasury; Director, Atlantic Power Corporation (power generation company) and ON Semiconductor Corporation (semiconductor manufacturing) | | 188 | | None |
| | | | | |
Ann Barnett Stern - 1957 Trustee | | 2017 | | President, Chief Executive Officer and Board Member, Houston Endowment, Inc. a private philanthropic institution Formerly: Executive Vice President, Texas Children’s Hospital; Vice President, General Counsel and Corporate Compliance Officer, Texas Children’s Hospital; Attorney at Beck, Redden and Secrest, LLP and Andrews and Kurth LLP | | 188 | | Trustee and Board Vice Chair of Holdsworth Center Trustee and Chair of Nomination/Governance Committee, Good Reason Houston, (non-profit); Trustee and Investment Committee member of University of Texas Law School Foundation (non-profit); Board Member of Greater Houston Partnership (non-profit); Advisory Board member, Baker Institute for Public Policy at Rice University (non-profit) Formerly: Director and Audit Committee Member of Federal Reserve Bank of Dallas |
| | | | | |
Robert C. Troccoli - 1949 Trustee | | 2016 | | Retired Formerly: Adjunct Professor, University of Denver - Daniels College of Business; and Managing Partner, KPMG LLP | | 188 | | None |
| | | | | |
Daniel S. Vandivort –1954 Trustee | | 2019 | | President, Flyway Advisory Services LLC (consulting and property management) | | 188 | | Formerly: Trustee, Board of Trustees, Treasurer and Chairman of the Audit and Committee, Huntington Disease Foundation of America; Trustee and Governance Chair, of certain Oppenheimer Funds |
| | |
| T-3 | | Invesco Government Money Market Fund |
Trustees and Officers–(continued)
| | | | | | | | |
Name, Year of Birth and Position(s) Held with the Trust | | Trustee and/or Officer Since | | Principal Occupation(s) During Past 5 Years | | Number of Funds in Fund Complex Overseen by
Trustee | | Other Directorship(s) Held by Trustee During Past 5 Years |
| Officers | | | | | | | | |
| | | | | |
Sheri Morris - 1964 President and Principal Executive Officer | | 1999 | | Head of Global Fund Services, Invesco Ltd.; President and Principal Executive Officer, The Invesco Funds; Vice President, Invesco Exchange-Traded Fund Trust, Invesco Exchange-Traded Fund Trust II, Invesco India Exchange-Traded Fund Trust, Invesco Actively Managed Exchange-Traded Fund Trust, Invesco Actively Managed Exchange-Traded Commodity Fund Trust and Invesco Exchange-Traded Self-Indexed Fund Trust; and Vice President, OppenheimerFunds, Inc. Formerly: Vice President, Treasurer and Principal Financial Officer, The Invesco Funds; Vice President, Invesco AIM Advisers, Inc., Invesco AIM Capital Management, Inc. and Invesco AIM Private Asset Management, Inc.; Assistant Vice President and Assistant Treasurer, The Invesco Funds; Vice President and Assistant Vice President, Invesco Advisers, Inc.; Assistant Vice President, Invesco AIM Capital Management, Inc. and Invesco AIM Private Asset Management, Inc.; Treasurer, Invesco Exchange-Traded Fund Trust, Invesco Exchange-Traded Fund Trust II, Invesco India Exchange-Traded Fund Trust and Invesco Actively Managed Exchange-Traded Fund Trust and Senior Vice President, Invesco Advisers, Inc. (formerly known as Invesco Institutional (N.A.), Inc.) (registered investment adviser) | | N/A | | N/A |
| | | | | |
Jeffrey H. Kupor - 1968 Senior Vice President, Chief Legal Officer and Secretary | | 2018 | | Head of Legal of the Americas, Invesco Ltd.; Senior Vice President and Secretary, Invesco Advisers, Inc. (formerly known as Invesco Institutional (N.A.), Inc.) (registered investment adviser); Senior Vice President and Secretary, Invesco Distributors, Inc. (formerly known as Invesco AIM Distributors, Inc.); Vice President and Secretary, Invesco Investment Services, Inc. (formerly known as Invesco AIM Investment Services, Inc.) Senior Vice President, Chief Legal Officer and Secretary, The Invesco Funds; Secretary and General Counsel, Invesco Investment Advisers LLC (formerly known as Van Kampen Asset Management); Secretary and General Counsel, Invesco Capital Markets, Inc. (formerly known as Van Kampen Funds Inc.) and Chief Legal Officer, Invesco Exchange-Traded Fund Trust, Invesco Exchange-Traded Fund Trust II, Invesco India Exchange-Traded Fund Trust, Invesco Actively Managed Exchange-Traded Fund Trust, Invesco Actively Managed Exchange-Traded Commodity Fund Trust and Invesco Exchange-Traded Self-Indexed Fund Trust;; Secretary and Vice President, Harbourview Asset Management Corporation; Secretary and Vice President, OppenheimerFunds, Inc. and Invesco Managed Accounts, LLC; Secretary and Senior Vice President, OFI Global Institutional, Inc.; Secretary and Vice President, OFI SteelPath, Inc.; Secretary and Vice President, Oppenheimer Acquisition Corp.; Secretary and Vice President, Shareholder Services, Inc.; Secretary and Vice President, Trinity Investment Management Corporation Formerly: Secretary and Vice President, Jemstep, Inc.; Head of Legal, Worldwide Institutional, Invesco Ltd.; Secretary and General Counsel, INVESCO Private Capital Investments, Inc.; Senior Vice President, Secretary and General Counsel, Invesco Management Group, Inc. (formerly known as Invesco AIM Management Group, Inc.); Assistant Secretary, INVESCO Asset Management (Bermuda) Ltd.; Secretary and General Counsel, Invesco Private Capital, Inc.; Assistant Secretary and General Counsel, INVESCO Realty, Inc.; Secretary and General Counsel, Invesco Senior Secured Management, Inc.; Secretary, Sovereign G./P. Holdings Inc.; and Secretary, Invesco Indexing LLC; Secretary, W.L. Ross & Co., LLC | | N/A | | N/A |
| | | | | |
Andrew R. Schlossberg - 1974 Senior Vice President | | 2019 | | Head of the Americas and Senior Managing Director, Invesco Ltd.; Director and Senior Vice President, Invesco Advisers, Inc. (formerly known as Invesco Institutional (N.A.), Inc.) (registered investment adviser); Director and Chairman, Invesco Investment Services, Inc. (formerly known as Invesco AIM Investment Services, Inc.) (registered transfer agent); Senior Vice President, The Invesco Funds; Director, Invesco Investment Advisers LLC (formerly known as Van Kampen Asset Management) Formerly: Director, President and Chairman, Invesco Insurance Agency, Inc.; Director, Invesco UK Limited; Director and Chief Executive, Invesco Asset Management Limited and Invesco Fund Managers Limited; Assistant Vice President, The Invesco Funds; Senior Vice President, Invesco Advisers, Inc. (formerly known as Invesco Institutional (N.A.), Inc.) (registered investment adviser); Director and Chief Executive, Invesco Administration Services Limited and Invesco Global Investment Funds Limited; Director, Invesco Distributors, Inc.; Head of EMEA, Invesco Ltd.; President, Invesco Actively Managed Exchange-Traded Commodity Fund Trust, Invesco Actively Managed Exchange-Traded Fund Trust, Invesco Exchange-Traded Fund Trust, Invesco Exchange-Traded Fund Trust II and Invesco India Exchange-Traded Fund Trust; Managing Director and Principal Executive Officer, Invesco Capital Management LLC | | N/A | | N/A |
| | |
| T-4 | | Invesco Government Money Market Fund |
Trustees and Officers–(continued)
| | | | | | | | |
Name, Year of Birth and Position(s) Held with the Trust | | Trustee and/or Officer Since | | Principal Occupation(s) During Past 5 Years | | Number of Funds in Fund Complex Overseen by
Trustee | | Other Directorship(s) Held by Trustee During Past 5 Years |
| Officers–(continued) | | | | | | |
| | | | | |
John M. Zerr - 1962 Senior Vice President | | 2006 | | Chief Operating Officer of the Americas; Senior Vice President, Invesco Advisers, Inc. (formerly known as Invesco Institutional (N.A.), Inc.) (registered investment adviser); Senior Vice President, Invesco Distributors, Inc. (formerly known as Invesco AIM Distributors, Inc.); Director and Vice President, Invesco Investment Services, Inc. (formerly known as Invesco AIM Investment Services, Inc.) Senior Vice President, The Invesco Funds; Managing Director, Invesco Capital Management LLC; Director, Invesco Investment Advisers LLC (formerly known as Van Kampen Asset Management); Senior Vice President, Invesco Capital Markets, Inc. (formerly known as Van Kampen Funds Inc.); Manager, Invesco Indexing LLC; Manager, Invesco Specialized Products, LLC; Member, Invesco Canada Funds Advisory Board; Director, President and Chief Executive Officer, Invesco Corporate Class Inc. (corporate mutual fund company); and Director, Chairman, President and Chief Executive Officer, Invesco Canada Ltd. (formerly known as Invesco Trimark Ltd./Invesco Trimark Ltèe) (registered investment adviser and registered transfer agent); President, Invesco, Inc.; President, Invesco Global Direct Real Estate Feeder GP Ltd.; President, Invesco IP Holdings (Canada) Ltd; President, Invesco Global Direct Real Estate GP Ltd.; President, Invesco Financial Services Ltd. / Services Financiers Invesco Ltée; and Director and Chairman, Invesco Trust Company Formerly: President, Trimark Investments Ltd/Services Financiers Invesco Ltee; Director and Senior Vice President, Invesco Insurance Agency, Inc.; Director and Senior Vice President, Invesco Management Group, Inc. (formerly known as Invesco AIM Management Group, Inc.); Secretary and General Counsel, Invesco Management Group, Inc. (formerly known as Invesco AIM Management Group, Inc.); Secretary, Invesco Investment Services, Inc. (formerly known as Invesco AIM Investment Services, Inc.); Chief Legal Officer and Secretary, The Invesco Funds; Secretary and General Counsel, Invesco Investment Advisers LLC (formerly known as Van Kampen Asset Management); Secretary and General Counsel, Invesco Capital Markets, Inc. (formerly known as Van Kampen Funds Inc.); Chief Legal Officer, Invesco Exchange-Traded Fund Trust, Invesco Exchange-Traded Fund Trust II, Invesco India Exchange-Traded Fund Trust, Invesco Actively Managed Exchange-Traded Fund Trust, Invesco Actively Managed Exchange-Traded Commodity Fund Trust and Invesco Exchange-Traded Self-Indexed Fund Trust; Secretary, Invesco Indexing LLC; Director, Secretary, General Counsel and Senior Vice President, Van Kampen Exchange Corp.; Director, Vice President and Secretary, IVZ Distributors, Inc. (formerly known as INVESCO Distributors, Inc.); Director and Vice President, INVESCO Funds Group, Inc.; Director and Vice President, Van Kampen Advisors Inc.; Director, Vice President, Secretary and General Counsel, Van Kampen Investor Services Inc.; Director and Secretary, Invesco Distributors, Inc. (formerly known as Invesco AIM Distributors, Inc.); Director, Senior Vice President, General Counsel and Secretary, Invesco AIM Advisers, Inc. and Van Kampen Investments Inc.; Director, Vice President and Secretary, Fund Management Company; Director, Senior Vice President, Secretary, General Counsel and Vice President, Invesco AIM Capital Management, Inc.; Chief Operating Officer and General Counsel, Liberty Ridge Capital, Inc. (an investment adviser) | | N/A | | N/A |
| | | | | |
Gregory G. McGreevey - 1962 Senior Vice President | | 2012 | | Senior Managing Director, Invesco Ltd.; Director, Chairman, President, and Chief Executive Officer, Invesco Advisers, Inc. (formerly known as Invesco Institutional (N.A.), Inc.) (registered investment adviser); Director, Invesco Mortgage Capital, Inc. and Invesco Senior Secured Management, Inc.; Senior Vice President, The Invesco Funds; President, SNW Asset Management Corporation and Invesco Managed Accounts, LLC; Chairman and Director, Invesco Private Capital, Inc.; Chairman and Director, INVESCO Private Capital Investments, Inc.; Chairman and Director, INVESCO Realty, Inc.; and Senior Vice President, Invesco Group Services, Inc. Formerly: Senior Vice President, Invesco Management Group, Inc. and Invesco Advisers, Inc.; Assistant Vice President, The Invesco Funds | | N/A | | N/A |
| | | | | |
Adrien Deberghes- 1967 Principal Financial Officer, Treasurer and Vice President | | 2020 | | Head of the Fund Office of the CFO and Fund Administration; Vice President, Invesco Advisers, Inc.; Principal Financial Officer, Treasurer and Vice President, The Invesco Funds; Vice President, Invesco Exchange-Traded Fund Trust, Invesco Exchange-Traded Fund Trust II, Invesco India Exchange-Traded Fund Trust, Invesco Actively Managed Exchange-Traded Fund Trust, Invesco Actively Managed Exchange-Traded Commodity Fund Trust and Invesco Exchange-Traded Self-Indexed Fund Trust Formerly: Senior Vice President and Treasurer, Fidelity Investments | | N/A | | N/A |
| | | | | |
Crissie M. Wisdom - 1969 Anti-Money Laundering Compliance Officer | | 2013 | | Anti-Money Laundering and OFAC Compliance Officer for Invesco U.S. entities including: Invesco Advisers, Inc. and its affiliates, Invesco Capital Markets, Inc., Invesco Distributors, Inc., Invesco Investment Services, Inc., The Invesco Funds, Invesco Capital Management, LLC, Invesco Trust Company; and Fraud Prevention Manager for Invesco Investment Services, Inc. | | N/A | | N/A |
| | |
| T-5 | | Invesco Government Money Market Fund |
Trustees and Officers–(continued)
| | | | | | | | |
Name, Year of Birth and Position(s) Held with the Trust | | Trustee and/or Officer Since | | Principal Occupation(s) During Past 5 Years | | Number of Funds in Fund Complex Overseen by
Trustee | | Other Directorship(s) Held by Trustee During Past 5 Years |
| Officers–(continued) | | | | | | |
| | | | | |
Todd F. Kuehl - 1969 Chief Compliance Officer and Senior Vice President | | 2020 | | Chief Compliance Officer, Invesco Advisers, Inc. (registered investment adviser); and Chief Compliance Officer, The Invesco Funds and Senior Vice President Formerly: Managing Director and Chief Compliance Officer, Legg Mason (Mutual Funds); Chief Compliance Officer, Legg Mason Private Portfolio Group (registered investment adviser) | | N/A | | N/A |
| | | | | |
Michael McMaster - 1962 Chief Tax Officer, Vice President and Assistant Treasurer | | 2020 | | Head of Global Fund Services Tax; Chief Tax Officer, Vice President and Assistant Treasurer, The Invesco Funds; Vice President, Invesco Advisers, Inc.; Assistant Treasurer, Invesco Capital Management LLC, Assistant Treasurer and Chief Tax Officer, Invesco Exchange-Traded Fund Trust, Invesco Exchange-Traded Fund Trust II, Invesco India Exchange-Traded Fund Trust, Invesco Actively Managed Exchange-Traded Fund Trust, Invesco Actively Managed Exchange-Traded Commodity Fund Trust and Invesco Exchange-Traded Self-Indexed Fund Trust; Assistant Treasurer, Invesco Specialized Products, LLC Formerly: Senior Vice President - Managing Director of Tax Services, U.S. Bank Global Fund Services (GFS) | | N/A | | N/A |
The Statement of Additional Information of the Trust includes additional information about the Fund’s Trustees and is available upon request, without charge, by calling 1.800.959.4246. Please refer to the Fund’s Statement of Additional Information for information on the Fund’s sub-advisers.
| | | | | | |
| Office of the Fund | | Investment Adviser | | Distributor | | Auditors |
| 11 Greenway Plaza, Suite 1000 | | Invesco Advisers, Inc. | | Invesco Distributors, Inc. | | PricewaterhouseCoopers LLP |
| Houston, TX 77046-1173 | | 1555 Peachtree Street, N.E. | | 11 Greenway Plaza, Suite 1000 | | 1000 Louisiana Street, Suite 5800 |
| | Atlanta, GA 30309 | | Houston, TX 77046-1173 | | Houston, TX 77002-5678 |
| | | |
| Counsel to the Fund | | Counsel to the Independent Trustees | | Transfer Agent | | Custodian |
| Stradley Ronon Stevens & Young, LLP | | Goodwin Procter LLP | | Invesco Investment Services, Inc. | | Bank of New York Mellon |
| 2005 Market Street, Suite 2600 | | 901 New York Avenue, N.W. | | 11 Greenway Plaza, Suite 1000 | | 2 Hanson Place |
| Philadelphia, PA 19103-7018 | | Washington, D.C. 20001 | | Houston, TX 77046-1173 | | Brooklyn, NY 11217-1431 |
| | |
| T-6 | | Invesco Government Money Market Fund |
(This page intentionally left blank)
(This page intentionally left blank)

Go paperless with eDelivery
Visit invesco.com/edelivery to enjoy the convenience and security of anytime electronic access to your investment documents.
With eDelivery, you can elect to have any or all of the following materials delivered straight to your inbox to download, save and print from your own computer:
∎ Fund reports and prospectuses
∎ Quarterly statements
∎ Daily confirmations
∎ Tax forms
Invesco mailing information
Send general correspondence to Invesco Investment Services, Inc., P.O. Box 219078, Kansas City, MO 64121-9078.
Important notice regarding delivery of security holder documents
To reduce Fund expenses, only one copy of most shareholder documents may be mailed to shareholders with multiple accounts at the same address (Householding). Mailing of your shareholder documents may be householded indefinitely unless you instruct us otherwise. If you do not want the mailing of these documents to be combined with those for other members of your household, please contact Invesco Investment Services, Inc. at 800 959 4246 or contact your financial institution. We will begin sending you individual copies for each account within 30 days after receiving your request.
Fund holdings and proxy voting information
The Fund provides a complete list of its portfolio holdings in various monthly and quarterly regulatory filings. The Fund files a complete schedule of portfolio holdings with the Securities and Exchange Commission (SEC) monthly on Form N-MFP. For the second and fourth quarters, the list appears, respectively, in the Fund’s semiannual and annual reports to shareholders. The most recent list of portfolio holdings is available at invesco.com/us. Shareholders can also look up the Fund’s Form N-MFP filings on the SEC website, sec.gov. The SEC file numbers for the Fund are shown below.
A description of the policies and procedures that the Fund uses to determine how to vote proxies relating to portfolio securities is available without charge, upon request, from our Client Services department at 800 959 4246, or at invesco.com/ corporate/about-us/esg. The information is also available on the SEC website, sec.gov.
Information regarding how the Fund voted proxies related to its portfolio securities during the most recent 12-month period ended June 30 is available at invesco.com/proxysearch. This information is also available on the SEC website, sec.gov.
Invesco Advisers, Inc. is an investment adviser; it provides investment advisory services to individual and institutional clients and does not sell securities. Invesco Distributors, Inc. is the US distributor for Invesco Ltd.’s retail mutual funds, exchange-traded funds and institutional money market funds. Both are wholly owned, indirect subsidiaries of Invesco Ltd.
| | |
| SEC file number(s): 811-05686 and 033-39519 Invesco Distributors, Inc. | | GMKT-AR-1 |

| | |
| | |
| Annual Report to Shareholders | | February 28, 2022 |
Invesco High Yield Fund
Nasdaq:
A: AMHYX ∎ C: AHYCX ∎ Y: AHHYX ∎ Investor: HYINX ∎ R5: AHIYX ∎ R6: HYIFX
Management’s Discussion of Fund Performance
| | | | |
| |
Performance summary | |
For the fiscal year ended February 28, 2022, Class A shares of Invesco High Yield Fund (the Fund), at net asset value (NAV), underperformed the Bloomberg U.S. Corporate High Yield 2% Issuer Cap Index, the Fund’s style-specific benchmark. | |
Your Fund’s long-term performance appears later in this report. | |
| | |
Fund vs. Indexes | | | | |
Total returns, 2/28/21 to 2/28/22, at net asset value (NAV). Performance shown does not include applicable contingent deferred sales charges (CDSC) or front-end sales charges, which would have reduced performance. | |
Class A Shares | | | 0.11 | % |
Class C Shares | | | -0.65 | |
Class Y Shares | | | 0.38 | |
Investor Class Shares | | | 0.36 | |
Class R5 Shares | | | 0.67 | |
Class R6 Shares | | | 0.75 | |
Bloomberg U.S. Aggregate Bond Index▼ (Broad Market Index) | | | -2.64 | |
Bloomberg U.S. Corporate High Yield 2% Issuer Cap Index▼ (Style-Specific Index) | | | 0.64 | |
Lipper High Current Yield Bond Funds Index∎ (Peer Group Index) | | | 1.24 | |
| |
Source(s): ▼RIMES Technologies Corp.; ∎Lipper Inc. | | | | |
Market conditions and your Fund
In the first quarter of 2021, rising 10-year US Treasury yields increased significantly to 1.74%,1 its highest level since January 2020, reflecting higher inflation expectations. Largely a result of economic optimism, government bond yields rose globally during the first quarter of 2021 as investors began to price in higher levels of economic growth and inflation moving towards a post-pandemic world. On the fiscal front, another stimulus package was signed into law and COVID-19 vaccine approvals and administration ramped up. 30-year Treasury yields moved higher by 0.75% to end the quarter at 2.41%.1 Importantly, short-term rates, which are closely tied to Federal Reserve policy, were quite steady. Two-year US Treasury yields moved up just 0.05% to 0.16%.1
Fixed income markets settled down in the second quarter of 2021, posting gains and rebounding from negative performance experienced during the early part of the fiscal year due to a sharply rising interest rate environment. Despite higher volatility stemming from inflation concerns and the potential for rising interest rates, investors remained optimistic about the strength of the economic recovery after the Bureau of Economic Analysis reported that US gross domestic product grew at a 6.4% annualized rate for the first quarter of 2021.2 As the US COVID-19 vaccination rate neared the 50% threshold, consumers resumed pre-pandemic activities in the third quarter of 2021 and economically sensitive areas such as the consumer discretionary and industrials sectors began to recover.
In the fourth quarter of 2021, concerns about inflation heightened as US inflation rose to 7%,3 its highest level in nearly 40 years. Though the US Federal Reserve (the Fed) left policy rates unchanged in the
quarter, the Fed indicated its accommodative policies were coming to an end in 2022 through a willingness to raise interest rates to combat inflation and the announced reduction of its monthly bond purchase program. Additionally, US interest rate moves and inflation risk significantly affected fixed income valuations during the quarter. The two-year Treasury yield rose moderately from 0.27% to 0.73%, while the 10-year increased slightly from 1.48% to 1.52%.1 The yield curve, as measured by the yield differential between two- and 10-year Treasuries flattened during the quarter. Despite the withdrawal of central bank support and coronavirus variants raising concerns about economic reopenings and the resumption of travel, we believe investors are cautiously optimistic and expect corporate balance sheets to continue to recover meaningfully in 2022.
At the beginning of 2022, geopolitical and economic tensions between Ukraine and Russia culminated with the latter invading Ukraine. World leaders levied sanctions against Russia that we believe will likely have material effects on its fixed income markets, particularly sovereign debt, corporates and levels of liquidity. Regarding inflation concerns, political uncertainty should give central banks a reason to be cautious, with the Fed unlikely to raise rates by more than 0.25% at the March Federal Open Market Committee meeting, whereas before this crisis, a 0.50% increase was increasingly likely.
Against this backdrop, the high-yield market experienced strong returns heading into 2022 but quickly reversed course as geopolitical concerns intensified at the beginning of the fiscal year. That said, a strong US economy and fundamental backdrop for high-yield fixed income helped push the par-weighted, trailing twelve months, high-yield
default rate to 0.24%; roughly 3% lower than the twenty-five year average of 3.02%.4
The Bloomberg U.S. Corporate High Yield 2% Issuer Cap Index, which measures the performance of the US high-yield bond market and is the Funds style-specific index, generated a positive return for the fiscal year.5 Likewise, the Fund, at NAV, generated a positive return for the fiscal year.
During the fiscal year, the Fund benefited from its security selection in the independent energy and electric sectors. The Fund had an overweight allocation to oil field services and underweight to wireless, relative to the style-specific index, which also contributed positively. An allocation to bank loans was also beneficial to relative performance as bank loans, floating rate securities and interest rates increased. During the fiscal year, security selection in the health care and supermarket sectors detracted from performance relative to the style-specific index.
During the fiscal year, we used derivatives to mitigate overall portfolio risk. These instruments include credit default swaps (CDX), options on CDX (known as swaptions) and total return swaps, which offer greater efficiency and lower transaction costs than cash bonds. However, derivatives may amplify traditional investment risks through the creation of leverage and may be less liquid than traditional securities. For the fiscal year, derivatives employed by the Fund had a small positive impact on the Fund’s relative performance.
We also used currency-forward contracts during the fiscal year to hedge currency exposure of our non-US dollar-denominated positions. The use of currency-forward contracts had a negligible impact on the Fund’s relative performance.
At the close of the fiscal year, the outlook was positive for risk assets, including high-yield, though we believe the upside is far more limited following the strong rally in both equities and credit spreads since the lows of mid-March 2020. We expect an uneven but solid economic recovery as the COVID-19 vaccine gets rolled out. Of course, the speed and breadth of vaccinations will determine how quickly and to what extent the global economy can recover to pre-pandemic levels. As that unfolds, we expect a rotation in investor focus from technology and consumer noncyclicals to sectors impacted by COVID-19. Further support is likely to come from a weaker dollar, still low rates and an upward sloping yield curve which tends to support credit markets. Meanwhile, inflationary pressures are mounting, most evident in commodity prices. And, with fiscal stimulus in the outlook, we expect rate-sensitive segments of fixed income to feel a greater pressure than high-yield should interest rates rise in response. Importantly for high-yield, the default outlook appears much more favorable with defaults potentially half what was experienced in 2020. We expect issuance to remain
| | |
| 2 | | Invesco High Yield Fund |
strong, though not at the record-breaking level seen in 2020, providing a solid technical backdrop. In short, the positive momentum leads us to have a constructive view on portfolio risk positioning though that view is significantly tempered by the tighter spreads and lesser compensation for taking on risk at current levels. We believe careful security selection will drive relative performance in an environment less conducive to simply expressing a view on broad-based risk and that total returns will be more muted compared to the past couple of quarters.
We wish to remind you that the Fund is subject to interest rate risk, meaning when interest rates rise, the value of fixed income securities tends to fall. The degree to which the value of fixed income securities may decline due to rising interest rates may vary depending on the speed and magnitude of the increase in interest rates, as well as individual security characteristics, such as price, maturity, duration and coupon and market forces, such as supply and demand for similar securities. We are monitoring interest rates and the market, economic and geopolitical factors that may impact the direction, speed and magnitude of changes to interest rates across the maturity spectrum, including the potential impact of monetary policy changes by the Fed and certain foreign central banks. If interest rates rise faster than expected, markets may experience increased volatility which may affect the value and/or liquidity of certain of the Fund’s investments.
Thank you for investing in Invesco High Yield Fund and for sharing our long-term investment horizon.
| 1 | Source: US Federal Reserve |
| 2 | Source: US Bureau of Labor Statistics |
| 3 | Source: US Bureau of Economic Analysis |
| 4 | Source: JP Morgan Markets |
Portfolio manager(s):
Niklas Nordenfelt
Rahim Shad
Philip Susser
The views and opinions expressed in management’s discussion of Fund performance are those of Invesco Advisers, Inc. and its affiliates. These views and opinions are subject to change at any time based on factors such as market and economic conditions. These views and opinions may not be relied upon as investment advice or recommendations, or as an offer for a particular security. The information is not a complete analysis of every aspect of any market, country, industry, security or the Fund. Statements of fact are from sources considered reliable, but Invesco Advisers, Inc. makes no representation or warranty as to their completeness or accuracy. Although historical performance is no guarantee of future results, these insights may help you understand our investment management philosophy.
See important Fund and, if applicable, index disclosures later in this report.
| | |
| 3 | | Invesco High Yield Fund |
Your Fund’s Long-Term Performance
Results of a $10,000 Investment – Oldest Share Class(es)
Fund and index data from 2/29/12
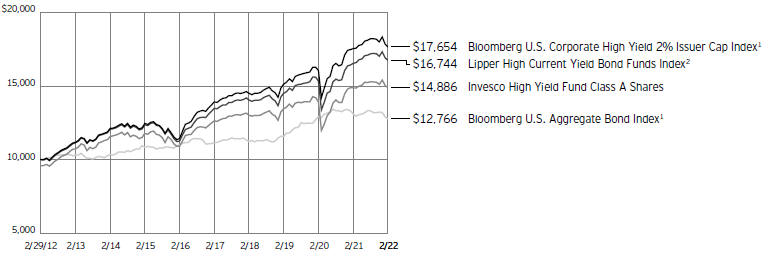
1 Source: RIMES Technologies Corp.
2 Source: Lipper Inc.
Past performance cannot guarantee future results.
The data shown in the chart include reinvested distributions, applicable sales charges and Fund expenses including management
fees. Index results include reinvested dividends, but they do not reflect sales charges. Performance of the peer group, if applicable, reflects fund expenses and management fees;
performance of a market index does not. Performance shown in the chart does not reflect deduction of taxes a shareholder would pay on Fund distributions or sale of Fund shares.
| | |
| 4 | | Invesco High Yield Fund |
| | | | |
| | |
Average Annual Total Returns | | | | |
As of 2/28/22, including maximum applicable sales charges | |
Class A Shares | | | | |
Inception (7/11/78) | | | 7.07 | % |
10 Years | | | 4.06 | |
5 Years | | | 2.44 | |
1 Year | | | -4.22 | |
Class C Shares | | | | |
Inception (8/4/97) | | | 3.47 | % |
10 Years | | | 3.89 | |
5 Years | | | 2.57 | |
1 Year | | | -1.61 | |
Class Y Shares | | | | |
Inception (10/3/08) | | | 7.21 | % |
10 Years | | | 4.78 | |
5 Years | | | 3.56 | |
1 Year | | | 0.38 | |
Investor Class Shares | | | | |
Inception (9/30/03) | | | 6.22 | % |
10 Years | | | 4.54 | |
5 Years | | | 3.36 | |
1 Year | | | 0.36 | |
Class R5 Shares | | | | |
Inception (4/30/04) | | | 6.24 | % |
10 Years | | | 4.86 | |
5 Years | | | 3.70 | |
1 Year | | | 0.67 | |
Class R6 Shares | | | | |
10 Years | | | 4.93 | % |
5 Years | | | 3.82 | |
1 Year | | | 0.75 | |
Class R6 shares incepted on September 24, 2012. Performance shown prior to that date is that of Class A shares at net asset value and includes the 12b-1 fees applicable to Class A shares.
The performance data quoted represent past performance and cannot guarantee future results; current performance may be lower or higher. Please visit invesco.com/ performance for the most recent month-end performance. Performance figures reflect reinvested distributions, changes in net asset value and the effect of the maximum sales charge unless otherwise stated. Performance figures do not reflect deduction of taxes a shareholder would pay on Fund distributions or sale of Fund shares. Investment return and principal value will fluctuate so that you may have a gain or loss when you sell shares.
Class A share performance reflects the maximum 4.25% sales charge, and Class C share performance reflects the applicable contingent deferred sales charge (CDSC) for the period involved. The CDSC on Class C shares is 1% for the first year after purchase. Class Y, Investor Class, Class R5 and Class R6 shares do not have a front-end sales charge or a CDSC; therefore, performance is at net asset value.
The performance of the Fund’s share classes will differ primarily due to different sales charge structures and class expenses.
Fund performance reflects any applicable fee waivers and/or expense reimbursements. Had the adviser not waived fees and/or reimbursed expenses currently or in the past, returns would have been lower. See current prospectus for more information.
| | |
| 5 | | Invesco High Yield Fund |
Supplemental Information
Invesco High Yield Fund’s investment objective is total return through growth of capital and current income.
| ∎ | Unless otherwise stated, information presented in this report is as of February 28, 2022, and is based on total net assets. |
| ∎ | Unless otherwise noted, all data is provided by Invesco. |
| ∎ | To access your Fund’s reports/prospectus, visit invesco.com/fundreports. |
About indexes used in this report
| ∎ | The Bloomberg U.S. Aggregate Bond Index is an unmanaged index considered representative of the US investment-grade, fixed-rate bond market. |
| ∎ | The Bloomberg U.S. Corporate High Yield 2% Issuer Cap Index is an unmanaged index considered representative of the US high-yield, fixed-rate corporate bond market. Index weights for each issuer are capped at 2%. |
| ∎ | The Lipper High Current Yield Bond Funds Index is an unmanaged index considered representative of high-yield bond funds tracked by Lipper. |
| ∎ | The Fund is not managed to track the performance of any particular index, including the index(es) described here, and consequently, the performance of the Fund may deviate significantly from the performance of the index(es). |
| ∎ | A direct investment cannot be made in an index. Unless otherwise indicated, index results include reinvested dividends, and they do not reflect sales charges. Performance of the peer group, if applicable, reflects fund expenses; performance of a market index does not. |
|
|
This report must be accompanied or preceded by a currently effective Fund prospectus, which contains more complete information, including sales charges and expenses. Investors should read it carefully before investing. |
|
| NOT FDIC INSURED | MAY LOSE VALUE | NO BANK GUARANTEE |
| | |
| 6 | | Invesco High Yield Fund |
Fund Information
Portfolio Composition†
| | | | | |
| By credit quality | | % of total investments |
| |
AAA | | | | 0.19 | % |
| |
BBB | | | | 2.91 | |
| |
BB | | | | 57.18 | |
| |
B | | | | 31.93 | |
| |
CCC | | | | 5.25 | |
| |
Non-Rated | | | | 0.73 | |
| |
Cash | | | | 1.81 | |
†Source: Standard & Poor’s. A credit rating is an assessment provided by a nationally recognized statistical rating organization (NRSRO) of the creditworthiness of an issuer with respect to debt obligations, including specific securities, money market instruments or other debts. Ratings are measured on a scale that generally ranges from AAA (highest) to D (lowest); ratings are subject to change without notice. “Non- Rated” indicates the debtor was not rated, and should not be interpreted as indicating low quality. For more information on Standard & Poor’s rating methodology, please visit standardandpoors.com and select “Understanding Ratings” under Rating Resources on the homepage.
Top Five Debt Issuers*
| | | | | | | |
| | | | | % of total net assets |
| | |
1. | | CCO Holdings LLC/CCO Holdings Capital Corp. | | | | 2.27 | % |
| | |
2. | | Ford Motor Credit Co. LLC | | | | 1.96 | |
| | |
3. | | Occidental Petroleum Corp. | | | | 1.80 | |
| | |
4. | | Callon Petroleum Co. | | | | 1.73 | |
| | |
5. | | CSC Holdings LLC | | | | 1.70 | |
The Fund’s holdings are subject to change, and there is no assurance that the Fund will continue to hold any particular security.
* Excluding money market fund holdings, if any.
Data presented here are as of February 28, 2022.
| | |
| 7 | | Invesco High Yield Fund |
Schedule of Investments(a)
February 28, 2022
| | | | | | | | |
| | | Principal
Amount | | | Value | |
|
| |
U.S. Dollar Denominated Bonds & Notes-89.41% | |
Advertising-0.52% | | | | | | | | |
Lamar Media Corp.,
4.00%, 02/15/2030 | | $ | 300,000 | | | $ | 289,269 | |
|
| |
3.63%, 01/15/2031 | | | 4,604,000 | | | | 4,329,026 | |
|
| |
| | | | | | | 4,618,295 | |
|
| |
| | |
Aerospace & Defense-0.55% | | | | | | | | |
TransDigm UK Holdings PLC, 6.88%, 05/15/2026 | | | 4,677,000 | | | | 4,835,644 | |
|
| |
| | |
Airlines-1.67% | | | | | | | | |
American Airlines, Inc./AAdvantage
Loyalty IP Ltd.,
5.50%, 04/20/2026(b) | | | 10,971,000 | | | | 11,245,275 | |
|
| |
5.75%, 04/20/2029(b) | | | 1,960,000 | | | | 2,007,177 | |
|
| |
United Airlines, Inc., 4.38%, 04/15/2026(b) | | | 1,518,000 | | | | 1,516,027 | |
|
| |
| | | | | | | 14,768,479 | |
|
| |
| | |
Alternative Carriers-1.11% | | | | | | | | |
Level 3 Financing, Inc., 3.75%, 07/15/2029(b) | | | 6,965,000 | | | | 6,222,949 | |
|
| |
Lumen Technologies, Inc., Series P, 7.60%, 09/15/2039 | | | 4,050,000 | | | | 3,571,594 | |
|
| |
| | | | | | | 9,794,543 | |
|
| |
| | |
Apparel Retail-0.75% | | | | | | | | |
Gap, Inc. (The), 3.63%, 10/01/2029(b) | | | 7,358,000 | | | | 6,677,385 | |
|
| |
| |
Apparel, Accessories & Luxury Goods-0.75% | | | | | |
Kontoor Brands, Inc., 4.13%, 11/15/2029(b) | | | 7,030,000 | | | | 6,637,796 | |
|
| |
| | |
Auto Parts & Equipment-2.07% | | | | | | | | |
Clarios Global L.P.,
6.75%, 05/15/2025(b) | | | 1,032,000 | | | | 1,072,072 | |
|
| |
Clarios Global L.P./Clarios US Finance Co., 8.50%, 05/15/2027(b) | | | 5,596,000 | | | | 5,839,426 | |
|
| |
Dana, Inc.,
5.38%, 11/15/2027 | | | 4,172,000 | | | | 4,260,676 | |
|
| |
5.63%, 06/15/2028 | | | 629,000 | | | | 643,942 | |
|
| |
NESCO Holdings II, Inc., 5.50%, 04/15/2029(b) | | | 6,803,000 | | | | 6,548,194 | |
|
| |
| | | | | | | 18,364,310 | |
|
| |
| | |
Automobile Manufacturers-4.17% | | | | | | | | |
Allison Transmission, Inc.,
4.75%, 10/01/2027(b) | | | 5,085,000 | | | | 5,063,338 | |
|
| |
3.75%, 01/30/2031(b) | | | 6,440,000 | | | | 5,989,651 | |
|
| |
Ford Motor Co.,
3.25%, 02/12/2032 | | | 2,329,000 | | | | 2,201,161 | |
|
| |
4.75%, 01/15/2043 | | | 441,000 | | | | 427,342 | |
|
| |
Ford Motor Credit Co. LLC,
5.13%, 06/16/2025 | | | 1,418,000 | | | | 1,484,802 | |
|
| |
3.38%, 11/13/2025 | | | 1,644,000 | | | | 1,621,214 | |
|
| |
4.39%, 01/08/2026 | | | 4,693,000 | | | | 4,793,102 | |
|
| |
5.11%, 05/03/2029 | | | 4,746,000 | | | | 5,011,040 | |
|
| |
4.00%, 11/13/2030 | | | 4,562,000 | | | | 4,533,168 | |
|
| |
| | | | | | | | |
| | | Principal
Amount | | | Value | |
|
| |
Automobile Manufacturers-(continued) | | | | | |
J.B. Poindexter & Co., Inc., 7.13%,
04/15/2026(b) | | $ | 5,609,000 | | | $ | 5,827,751 | |
|
| |
| | | | | | | 36,952,569 | |
|
| |
| | |
Automotive Retail-3.82% | | | | | | | | |
Asbury Automotive Group, Inc.,
4.50%, 03/01/2028 | | | 1,175,000 | | | | 1,156,858 | |
|
| |
4.63%, 11/15/2029(b) | | | 5,796,000 | | | | 5,661,852 | |
|
| |
Group 1 Automotive, Inc., 4.00%,
08/15/2028(b) | | | 9,368,000 | | | | 9,044,570 | |
|
| |
LCM Investments Holdings II LLC,
4.88%, 05/01/2029(b) | | | 6,997,000 | | | | 6,676,502 | |
|
| |
Lithia Motors, Inc., 3.88%, 06/01/2029(b) | | | 6,859,000 | | | | 6,781,150 | |
|
| |
Sonic Automotive, Inc., 4.63%, 11/15/2029(b) | | | 4,741,000 | | | | 4,507,956 | |
|
| |
| | | | | | | 33,828,888 | |
|
| |
| | |
Broadcasting-0.58% | | | | | | | | |
Gray Television, Inc., 7.00%, 05/15/2027(b) | | | 4,851,000 | | | | 5,108,443 | |
|
| |
| | |
Building Products-0.51% | | | | | | | | |
Standard Industries, Inc., 5.00%, 02/15/2027(b) | | | 4,469,000 | | | | 4,502,629 | |
|
| |
| | |
Cable & Satellite-7.76% | | | | | | | | |
CCO Holdings LLC/CCO Holdings Capital Corp.,
5.00%, 02/01/2028(b) | | | 3,857,000 | | | | 3,885,040 | |
|
| |
4.75%, 03/01/2030(b) | | | 3,494,000 | | | | 3,437,223 | |
|
| |
4.50%, 08/15/2030(b) | | | 10,996,000 | | | | 10,608,611 | |
|
| |
4.25%, 01/15/2034(b) | | | 2,350,000 | | | | 2,164,515 | |
|
| |
CSC Holdings LLC,
6.50%, 02/01/2029(b) | | | 4,670,000 | | | | 4,735,730 | |
|
| |
5.75%, 01/15/2030(b) | | | 6,581,000 | | | | 5,830,898 | |
|
| |
4.63%, 12/01/2030(b) | | | 1,991,000 | | | | 1,661,465 | |
|
| |
4.50%, 11/15/2031(b) | | | 2,330,000 | | | | 2,123,562 | |
|
| |
5.00%, 11/15/2031(b) | | | 836,000 | | | | 696,956 | |
|
| |
DISH DBS Corp., 7.75%, 07/01/2026 | | | 2,600,000 | | | | 2,635,997 | |
|
| |
DISH Network Corp., Conv., 3.38%, 08/15/2026 | | | 7,514,000 | | | | 6,833,983 | |
|
| |
Gray Escrow II, Inc.,
5.38%, 11/15/2031(b) | | | 4,040,000 | | | | 3,894,762 | |
|
| |
Sirius XM Radio, Inc.,
3.13%, 09/01/2026(b) | | | 8,019,000 | | | | 7,669,052 | |
|
| |
4.00%, 07/15/2028(b) | | | 3,673,000 | | | | 3,537,466 | |
|
| |
Virgin Media Finance PLC (United Kingdom), 5.00%, 07/15/2030(b) | | | 1,939,000 | | | | 1,836,514 | |
|
| |
Virgin Media Secured Finance PLC (United Kingdom), 5.50%, 05/15/2029(b) | | | 2,440,000 | | | | 2,441,621 | |
|
| |
VZ Secured Financing B.V. (Netherlands), 5.00%, 01/15/2032(b) | | | 5,040,000 | | | | 4,782,935 | |
|
| |
| | | | | | | 68,776,330 | |
|
| |
See accompanying Notes to Financial Statements which are an integral part of the financial statements.
| | |
| 8 | | Invesco High Yield Fund |
| | | | | | | | |
| | | Principal
Amount | | | Value | |
|
| |
Casinos & Gaming-2.99% | | | | | | | | |
Codere Finance 2 (Luxembourg) S.A.
(Spain), 11.63% PIK Rate, 2.00% Cash Rate, 11/30/2027(b)(c) | | $ | 568,775 | | | $ | 560,243 | |
|
| |
Everi Holdings, Inc., 5.00%, 07/15/2029(b) | | | 4,610,000 | | | | 4,526,501 | |
|
| |
Midwest Gaming Borrower LLC/ Midwest Gaming Finance Corp., 4.88%, 05/01/2029(b) | | | 4,718,000 | | | | 4,605,948 | |
|
| |
Mohegan Gaming & Entertainment, 8.00%, 02/01/2026(b) | | | 8,762,000 | | | | 8,860,135 | |
|
| |
Scientific Games International, Inc., 8.25%, 03/15/2026(b) | | | 2,044,000 | | | | 2,137,063 | |
|
| |
7.25%, 11/15/2029(b) | | | 2,145,000 | | | | 2,281,208 | |
|
| |
Wynn Resorts Finance LLC/Wynn Resorts Capital Corp., 5.13%, 10/01/2029(b) | | | 3,642,000 | | | | 3,509,777 | |
|
| |
| | | | | | | 26,480,875 | |
|
| |
| | |
Construction & Engineering-1.06% | | | | | | | | |
Great Lakes Dredge & Dock Corp., 5.25%, 06/01/2029(b) | | | 4,691,000 | | | | 4,703,150 | |
|
| |
Howard Midstream Energy Partners LLC, 6.75%, 01/15/2027(b) | | | 4,695,000 | | | | 4,666,079 | |
|
| |
| | | | | | | 9,369,229 | |
|
| |
| | |
Consumer Finance-1.27% | | | | | | | | |
FirstCash, Inc., 5.63%, 01/01/2030(b) | | | 4,720,000 | | | | 4,694,677 | |
|
| |
OneMain Finance Corp.,
7.13%, 03/15/2026 | | | 3,525,000 | | | | 3,825,454 | |
|
| |
5.38%, 11/15/2029 | | | 2,720,000 | | | | 2,740,400 | |
|
| |
| | | | | | | 11,260,531 | |
|
| |
| | |
Copper-0.79% | | | | | | | | |
First Quantum Minerals Ltd. (Zambia), 6.88%, 10/15/2027(b) | | | 6,575,000 | | | | 6,995,011 | |
|
| |
| |
Data Processing & Outsourced Services-0.50% | | | | | |
Clarivate Science Holdings Corp., 4.88%, 07/01/2029(b) | | | 4,724,000 | | | | 4,454,071 | |
|
| |
| | |
Department Stores-0.76% | | | | | | | | |
Macy’s Retail Holdings LLC,
5.88%, 04/01/2029(b) | | | 4,450,000 | | | | 4,555,398 | |
|
| |
4.50%, 12/15/2034 | | | 2,460,000 | | | | 2,193,090 | |
|
| |
| | | | | | | 6,748,488 | |
|
| |
| | |
Diversified REITs-1.28% | | | | | | | | |
DigitalBridge Group, Inc., Conv., 5.00%, 04/15/2023 | | | 2,624,000 | | | | 2,682,536 | |
|
| |
iStar, Inc.,
4.75%, 10/01/2024 | | | 6,842,000 | | | | 6,901,560 | |
|
| |
5.50%, 02/15/2026 | | | 1,695,000 | | | | 1,734,697 | |
|
| |
| | | | | | | 11,318,793 | |
|
| |
| | |
Electric Utilities-1.50% | | | | | | | | |
Talen Energy Supply LLC,
10.50%, 01/15/2026(b) | | | 6,761,000 | | | | 3,054,214 | |
|
| |
7.63%, 06/01/2028(b) | | | 3,976,000 | | | | 3,565,200 | |
|
| |
| | | | | | | | |
| | | Principal
Amount | | | Value | |
|
| |
Electric Utilities-(continued) | | | | | | | | |
Vistra Operations Co. LLC,
5.63%, 02/15/2027(b) | | $ | 1,600,000 | | | $ | 1,640,272 | |
|
| |
5.00%, 07/31/2027(b) | | | 2,911,000 | | | | 2,936,005 | |
|
| |
4.38%, 05/01/2029(b) | | | 2,150,000 | | | | 2,087,156 | |
|
| |
| | | | | | | 13,282,847 | |
|
| |
| |
Electrical Components & Equipment-1.01% | | | | | |
EnerSys,
5.00%, 04/30/2023(b) | | | 3,225,000 | | | | 3,274,875 | |
|
| |
4.38%, 12/15/2027(b) | | | 1,342,000 | | | | 1,333,606 | |
|
| |
Sensata Technologies B.V.,
4.88%, 10/15/2023(b) | | | 3,665,000 | | | | 3,760,638 | |
|
| |
4.00%, 04/15/2029(b) | | | 643,000 | | | | 618,408 | |
|
| |
| | | | | | | 8,987,527 | |
|
| |
| | |
Electronic Components-0.27% | | | | | | | | |
Sensata Technologies, Inc.,
4.38%, 02/15/2030(b) | | | 1,348,000 | | | | 1,313,201 | |
|
| |
3.75%, 02/15/2031(b) | | | 1,136,000 | | | | 1,058,309 | |
|
| |
| | | | | | | 2,371,510 | |
|
| |
| |
Environmental & Facilities Services-1.23% | | | | | |
Covanta Holding Corp.,
4.88%, 12/01/2029(b) | | | 3,182,000 | | | | 3,048,781 | |
|
| |
5.00%, 09/01/2030 | | | 1,358,000 | | | | 1,306,668 | |
|
| |
Waste Pro USA, Inc., 5.50%, 02/15/2026(b) | | | 6,941,000 | | | | 6,552,304 | |
|
| |
| | | | | | | 10,907,753 | |
|
| |
| |
Fertilizers & Agricultural Chemicals-0.97% | | | | | |
Consolidated Energy Finance S.A. (Switzerland),
6.50%, 05/15/2026(b) | | | 1,875,000 | | | | 1,877,128 | |
|
| |
5.63%, 10/15/2028(b) | | | 2,883,000 | | | | 2,668,361 | |
|
| |
OCI N.V. (Netherlands), 4.63%, 10/15/2025(b) | | | 4,041,000 | | | | 4,056,558 | |
|
| |
| | | | | | | 8,602,047 | |
|
| |
| | |
Food Distributors-0.61% | | | | | | | | |
American Builders & Contractors Supply Co., Inc., 4.00%, 01/15/2028(b) | | | 5,505,000 | | | | 5,390,386 | |
|
| |
| | |
Food Retail-0.23% | | | | | | | | |
PetSmart, Inc./PetSmart Finance Corp., 7.75%, 02/15/2029(b) | | | 1,971,000 | | | | 2,074,014 | |
|
| |
| | |
Health Care Facilities-1.33% | | | | | | | | |
Encompass Health Corp., 4.50%, 02/01/2028 | | | 4,516,000 | | | | 4,402,197 | |
|
| |
HCA, Inc.,
5.38%, 02/01/2025 | | | 2,458,000 | | | | 2,605,800 | |
|
| |
5.88%, 02/15/2026 | | | 699,000 | | | | 756,266 | |
|
| |
5.38%, 09/01/2026 | | | 1,344,000 | | | | 1,447,797 | |
|
| |
5.88%, 02/01/2029 | | | 2,281,000 | | | | 2,552,701 | |
|
| |
| | | | | | | 11,764,761 | |
|
| |
| | |
Health Care REITs-1.47% | | | | | | | | |
CTR Partnership L.P./
CareTrust Capital Corp., 3.88%, 06/30/2028(b) | | | 4,712,000 | | | | 4,507,829 | |
|
| |
See accompanying Notes to Financial Statements which are an integral part of the financial statements.
| | |
| 9 | | Invesco High Yield Fund |
| | | | | | | | |
| | | Principal
Amount | | | Value | |
|
| |
Health Care REITs-(continued) | | | | | | | | |
Diversified Healthcare Trust,
4.75%, 05/01/2024 | | $ | 2,354,000 | | | $ | 2,309,651 | |
|
| |
9.75%, 06/15/2025 | | | 169,000 | | | | 178,731 | |
|
| |
4.38%, 03/01/2031 | | | 6,990,000 | | | | 6,014,510 | |
|
| |
| | | | | | | 13,010,721 | |
|
| |
| | |
Health Care Services-1.41% | | | | | | | | |
Community Health Systems, Inc.,
8.00%, 03/15/2026(b) | | | 4,268,000 | | | | 4,434,111 | |
|
| |
6.13%, 04/01/2030(b) | | | 4,680,000 | | | | 4,358,203 | |
|
| |
Hadrian Merger Sub, Inc., 8.50%,
05/01/2026(b) | | | 3,683,000 | | | | 3,725,741 | |
|
| |
| | | | | | | 12,518,055 | |
|
| |
| | |
Homebuilding-0.60% | | | | | | | | |
Taylor Morrison Communities, Inc.,
6.63%, 07/15/2027(b) | | | 5,159,000 | | | | 5,310,571 | |
|
| |
| | |
Hotel & Resort REITs-0.51% | | | | | | | | |
Service Properties Trust,
4.50%, 03/15/2025 | | | 2,890,000 | | | | 2,712,872 | |
|
| |
4.95%, 10/01/2029 | | | 1,975,000 | | | | 1,788,985 | |
|
| |
| | | | | | | 4,501,857 | |
|
| |
| |
Hotels, Resorts & Cruise Lines-0.51% | | | | | |
Carnival Corp., 10.50%, 02/01/2026(b) | | | 4,011,000 | | | | 4,507,522 | |
|
| |
| | |
Household Products-0.74% | | | | | | | | |
Prestige Brands, Inc., 3.75%, 04/01/2031(b) | | | 7,094,000 | | | | 6,546,343 | |
|
| |
|
Independent Power Producers & Energy Traders-1.26% | |
Calpine Corp., 3.75%,
03/01/2031(b) | | | 4,782,000 | | | | 4,359,534 | |
|
| |
Clearway Energy Operating LLC, 4.75%, 03/15/2028(b) | | | 4,411,000 | | | | 4,441,480 | |
|
| |
Vistra Corp., 7.00%(b)(d)(e) | | | 2,372,000 | | | | 2,357,911 | |
|
| |
| | | | | | | 11,158,925 | |
|
| |
| | |
Industrial Machinery-2.04% | | | | | | | | |
EnPro Industries, Inc., 5.75%, 10/15/2026 | | | 4,136,000 | | | | 4,295,815 | |
|
| |
Mueller Water Products, Inc., 4.00%, 06/15/2029(b) | | | 4,904,000 | | | | 4,689,842 | |
|
| |
Ritchie Bros. Holdings, Inc. (Canada), 4.75%, 12/15/2031(b) | | | 4,648,000 | | | | 4,625,434 | |
|
| |
Roller Bearing Co. of America, Inc., 4.38%, 10/15/2029(b) | | | 4,639,000 | | | | 4,482,434 | |
|
| |
| | | | | | | 18,093,525 | |
|
| |
| | |
Insurance Brokers-0.25% | | | | | | | | |
Ryan Specialty Group LLC, 4.38%, 02/01/2030(b) | | | 2,327,000 | | | | 2,241,599 | |
|
| |
| | |
Integrated Oil & Gas-1.80% | | | | | | | | |
Occidental Petroleum Corp.,
3.20%, 08/15/2026 | | | 1,684,000 | | | | 1,686,492 | |
|
| |
8.50%, 07/15/2027 | | | 1,314,000 | | | | 1,585,617 | |
|
| |
6.13%, 01/01/2031 | | | 5,894,000 | | | | 6,711,085 | |
|
| |
6.20%, 03/15/2040 | | | 2,474,000 | | | | 2,756,964 | |
|
| |
4.10%, 02/15/2047 | | | 3,430,000 | | | | 3,178,255 | |
|
| |
| | | | | | | 15,918,413 | |
|
| |
| | | | | | | | |
| | | Principal
Amount | | | Value | |
|
| |
Integrated Telecommunication Services-1.73% | | | | | |
Altice France S.A. (France),
8.13%, 02/01/2027(b) | | $ | 1,337,000 | | | $ | 1,408,864 | |
|
| |
5.13%, 07/15/2029(b) | | | 2,760,000 | | | | 2,501,209 | |
|
| |
5.50%, 10/15/2029(b) | | | 2,885,000 | | | | 2,647,463 | |
|
| |
Iliad Holding S.A.S. (France),
6.50%, 10/15/2026(b) | | | 2,417,000 | | | | 2,413,918 | |
|
| |
7.00%, 10/15/2028(b) | | | 6,343,000 | | | | 6,320,102 | |
|
| |
| | | | | | | 15,291,556 | |
|
| |
| |
Interactive Home Entertainment-1.27% | | | | | |
Cinemark USA, Inc., 5.88%, 03/15/2026(b) | | | 4,544,000 | | | | 4,480,384 | |
|
| |
Sea Ltd. (Taiwan), Conv., 0.25%, 09/15/2026 | | | 2,680,000 | | | | 2,239,408 | |
|
| |
WMG Acquisition Corp., 3.75%, 12/01/2029(b) | | | 4,740,000 | | | | 4,534,948 | |
|
| |
| | | | | | | 11,254,740 | |
|
| |
| | |
Interactive Media & Services-2.03% | | | | | | | | |
Audacy Capital Corp., 6.75%, 03/31/2029(b) | | | 4,765,000 | | | | 4,523,415 | |
|
| |
Match Group Holdings II LLC, 4.63%, 06/01/2028(b) | | | 6,810,000 | | | | 6,842,211 | |
|
| |
Scripps Escrow II, Inc.,
3.88%, 01/15/2029(b) | | | 4,667,000 | | | | 4,381,426 | |
|
| |
5.38%, 01/15/2031(b) | | | 2,350,000 | | | | 2,237,224 | |
|
| |
| | | | | | | 17,984,276 | |
|
| |
| |
Investment Banking & Brokerage-0.71% | | | | | |
NFP Corp.,
4.88%, 08/15/2028(b) | | | 1,789,000 | | | | 1,728,138 | |
|
| |
6.88%, 08/15/2028(b) | | | 4,874,000 | | | | 4,539,278 | |
|
| |
| | | | | | | 6,267,416 | |
|
| |
| |
IT Consulting & Other Services-1.02% | | | | | |
Gartner, Inc.,
4.50%, 07/01/2028(b) | | | 6,734,000 | | | | 6,829,892 | |
|
| |
3.63%, 06/15/2029(b) | | | 2,248,000 | | | | 2,185,034 | |
|
| |
| | | | | | | 9,014,926 | |
|
| |
| | |
Managed Health Care-0.78% | | | | | | | | |
Centene Corp., 3.00%, 10/15/2030 | | | 7,228,000 | | | | 6,900,904 | |
|
| |
| | |
Metal & Glass Containers-1.00% | | | | | | | | |
Ardagh Metal Packaging Finance USA LLC/Ardagh Metal Packaging
Finance PLC, 3.25%, 09/01/2028(b) | | | 4,683,000 | | | | 4,409,513 | |
|
| |
Ardagh Packaging Finance
PLC/Ardagh Holdings USA, Inc., 5.25%, 04/30/2025(b) | | | 4,377,000 | | | | 4,439,875 | |
|
| |
| | | | | | | 8,849,388 | |
|
| |
| | |
Oil & Gas Drilling-4.04% | | | | | | | | |
Delek Logistics Partners L.P./Delek Logistics Finance Corp., 7.13%, 06/01/2028(b) | | | 4,633,000 | | | | 4,537,699 | |
|
| |
Nabors Industries Ltd.,
7.25%, 01/15/2026(b) | | | 2,530,000 | | | | 2,470,887 | |
|
| |
7.50%, 01/15/2028(b) | | | 2,116,000 | | | | 2,024,187 | |
|
| |
Nabors Industries, Inc., 7.38%, 05/15/2027(b) | | | 4,533,000 | | | | 4,686,011 | |
|
| |
See accompanying Notes to Financial Statements which are an integral part of the financial statements.
| | |
| 10 | | Invesco High Yield Fund |
| | | | | | | | |
| | | Principal
Amount | | | Value | |
|
| |
Oil & Gas Drilling-(continued) | | | | | | | | |
NGL Energy Operating LLC/NGL Energy Finance Corp., 7.50%, 02/01/2026(b) | | $ | 4,731,000 | | | $ | 4,756,074 | |
|
| |
Precision Drilling Corp. (Canada), 7.13%, 01/15/2026(b) | | | 1,108,000 | | | | 1,122,620 | |
|
| |
6.88%, 01/15/2029(b) | | | 3,497,000 | | | | 3,514,677 | |
|
| |
Rockies Express Pipeline LLC, 4.95%, 07/15/2029(b) | | | 1,876,000 | | | | 1,818,163 | |
|
| |
6.88%, 04/15/2040(b) | | | 4,173,000 | | | | 4,262,970 | |
|
| |
Valaris Ltd.,
12.00% PIK Rate, 8.25% Cash Rate, 04/30/2028(b)(c) | | | 1,651,000 | | | | 1,723,644 | |
|
| |
Series 1145, 12.00% PIK Rate, 8.25% Cash Rate, 04/30/2028(c) | | | 4,655,000 | | | | 4,859,820 | |
|
| |
| | | | | | | 35,776,752 | |
|
| |
| |
Oil & Gas Equipment & Services-1.23% | | | | | |
Bristow Group, Inc., 6.88%, 03/01/2028(b) | | | 6,558,000 | | | | 6,643,319 | |
|
| |
USA Compression Partners L.P./USA
Compression Finance Corp., 6.88%, 09/01/2027 | | | 4,279,000 | | | | 4,289,099 | |
|
| |
| | | | | | | 10,932,418 | |
|
| |
| |
Oil & Gas Exploration & Production-8.21% | | | | | |
Aethon United BR L.P./Aethon United Finance Corp., 8.25%, 02/15/2026(b) | | | 12,472,000 | | | | 13,224,810 | |
|
| |
Baytex Energy Corp. (Canada), 8.75%, 04/01/2027(b) | | | 4,075,000 | | | | 4,373,086 | |
|
| |
Callon Petroleum Co.,
6.13%, 10/01/2024 | | | 4,428,000 | | | | 4,415,823 | |
|
| |
9.00%, 04/01/2025(b) | | | 1,242,000 | | | | 1,333,666 | |
|
| |
8.00%, 08/01/2028(b)(f) | | | 9,161,000 | | | | 9,538,571 | |
|
| |
Civitas Resources, Inc., 5.00%, 10/15/2026(b) | | | 4,382,000 | | | | 4,323,938 | |
|
| |
Genesis Energy L.P./Genesis Energy Finance Corp.,
6.25%, 05/15/2026 | | | 6,199,000 | | | | 5,972,489 | |
|
| |
8.00%, 01/15/2027 | | | 3,877,000 | | | | 3,925,462 | |
|
| |
7.75%, 02/01/2028 | | | 1,313,000 | | | | 1,298,459 | |
|
| |
Hilcorp Energy I L.P./Hilcorp Finance Co.,
6.25%, 11/01/2028(b) | | | 2,862,000 | | | | 2,922,589 | |
|
| |
5.75%, 02/01/2029(b) | | | 1,556,000 | | | | 1,566,495 | |
Northern Oil and Gas, Inc., 8.13%, 03/01/2028(b) | | | 8,319,000 | | | | 8,755,747 | |
|
| |
SM Energy Co.,
6.75%, 09/15/2026 | | | 4,083,000 | | | | 4,129,015 | |
|
| |
6.63%, 01/15/2027 | | | 4,586,000 | | | | 4,660,729 | |
|
| |
6.50%, 07/15/2028 | | | 2,221,000 | | | | 2,279,224 | |
|
| |
| | | | | | | 72,720,103 | |
|
| |
| |
Oil & Gas Storage & Transportation-2.55% | | | | | |
CNX Midstream Partners L.P., 4.75%, 04/15/2030(b) | | | 3,133,000 | | | | 3,032,869 | |
|
| |
Crestwood Midstream Partners L.P./Crestwood Midstream Finance Corp. (),
8.00%, 04/01/2029(b) | | | 8,384,000 | | | | 8,931,475 | |
|
| |
EQM Midstream Partners L.P., 6.50%, 07/01/2027(b) | | | 1,691,000 | | | | 1,771,238 | |
|
| |
| | | | | | | | |
| | | Principal
Amount | | | Value | |
|
| |
Oil & Gas Storage & Transportation-(continued) | |
NGL Energy Partners L.P./NGL Energy
Finance Corp., 7.50%, 04/15/2026 | | $ | 4,695,000 | | | $ | 4,068,851 | |
|
| |
Tallgrass Energy Partners
L.P./Tallgrass Energy Finance Corp., 5.50%, 01/15/2028(b) | | | 4,975,000 | | | | 4,801,970 | |
|
| |
| | | | | | | 22,606,403 | |
|
| |
| |
Other Diversified Financial Services-1.14% | | | | | |
Jane Street Group/JSG Finance, Inc., 4.50%, 11/15/2029(b) | | | 4,754,000 | | | | 4,644,016 | |
|
| |
Scientific Games Holdings
L.P./Scientific Games US FinCo, Inc., 6.63%, 03/01/2030(b) | | | 5,448,000 | | | | 5,419,398 | |
|
| |
| | | | | | | 10,063,414 | |
|
| |
| | |
Packaged Foods & Meats-0.50% | | | | | | | | |
Kraft Heinz Foods Co. (The), 4.38%, 06/01/2046 | | | 4,351,000 | | | | 4,465,214 | |
|
| |
| | |
Paper Products-0.47% | | | | | | | | |
Schweitzer-Mauduit International, Inc., 6.88%, 10/01/2026(b) | | | 4,364,000 | | | | 4,120,816 | |
|
| |
| | |
Pharmaceuticals-0.83% | | | | | | | | |
Bausch Health Americas, Inc., 9.25%, 04/01/2026(b) | | | 1,692,000 | | | | 1,752,455 | |
|
| |
Bausch Health Cos., Inc.,
9.00%, 12/15/2025(b) | | | 2,234,000 | | | | 2,306,348 | |
|
| |
5.75%, 08/15/2027(b) | | | 1,021,000 | | | | 1,015,783 | |
|
| |
Par Pharmaceutical, Inc., 7.50%, 04/01/2027(b) | | | 2,293,000 | | | | 2,299,420 | |
|
| |
| | | | | | | 7,374,006 | |
|
| |
| |
Research & Consulting Services-0.51% | | | | | |
Dun & Bradstreet Corp. (The), 5.00%, 12/15/2029(b) | | | 4,682,000 | | | | 4,500,994 | |
|
| |
| | |
Restaurants-1.50% | | | | | | | | |
1011778 BC ULC/New Red Finance,
Inc. (Canada), 4.00%, 10/15/2030(b) | | | 4,916,000 | | | | 4,547,718 | |
|
| |
Papa John’s International, Inc., 3.88%, 09/15/2029(b) | | | 9,397,000 | | | | 8,752,366 | |
|
| |
| | | | | | | 13,300,084 | |
|
| |
| | |
Retail REITs-0.53% | | | | | | | | |
NMG Holding Co., Inc./Neiman Marcus
Group LLC, 7.13%, 04/01/2026(b) | | | 4,593,000 | | | | 4,735,383 | |
|
| |
| |
Specialized Consumer Services-1.72% | | | | | |
Carriage Services, Inc., 4.25%, 05/15/2029(b) | | | 9,331,000 | | | | 8,817,562 | |
|
| |
Terminix Co. LLC (The), 7.45%, 08/15/2027 | | | 5,474,000 | | | | 6,424,888 | |
|
| |
| | | | | | | 15,242,450 | |
|
| |
| | |
Specialized REITs-0.99% | | | | | | | | |
SBA Communications Corp., 3.88%, 02/15/2027 | | | 8,762,000 | | | | 8,756,524 | |
|
| |
See accompanying Notes to Financial Statements which are an integral part of the financial statements.
| | |
| 11 | | Invesco High Yield Fund |
| | | | | | | | |
| | | Principal
Amount | | | Value | |
|
| |
Specialty Chemicals-1.99% | | | | | | | | |
Braskem Idesa S.A.P.I. (Mexico), 7.45%, 11/15/2029(b) | | $ | 1,929,000 | | | $ | 1,917,764 | |
|
| |
6.99%, 02/20/2032(b) | | | 2,643,000 | | | | 2,528,875 | |
|
| |
Rayonier A.M. Products, Inc., 7.63%, 01/15/2026(b) | | | 8,672,000 | | | | 8,688,303 | |
|
| |
SCIL IV LLC/SCIL USA Holdings LLC, 5.38%, 11/01/2026(b) | | | 4,495,000 | | | | 4,494,101 | |
|
| |
| | | | | | | 17,629,043 | |
|
| |
| | |
Specialty Stores-0.52% | | | | | | | | |
Bath & Body Works, Inc., 6.75%, 07/01/2036 | | | 4,196,000 | | | | 4,582,724 | |
|
| |
| | |
Steel-0.51% | | | | | | | | |
SunCoke Energy, Inc., 4.88%, 06/30/2029(b) | | | 4,688,000 | | | | 4,503,949 | |
|
| |
| | |
Systems Software-1.47% | | | | | | | | |
Camelot Finance S.A., 4.50%, 11/01/2026(b) | | | 13,014,000 | | | | 13,041,004 | |
|
| |
| | |
Textiles-0.75% | | | | | | | | |
Eagle Intermediate Global Holding
B.V./Ruyi US Finance LLC (China), 7.50%, 05/01/2025(b) | | | 7,353,000 | | | | 6,667,259 | |
|
| |
| |
Trading Companies & Distributors-0.28% | | | | | |
Fortress Transportation and Infrastructure Investors LLC, 5.50%, 05/01/2028(b) | | | 2,622,000 | | | | 2,508,716 | |
|
| |
| |
Wireless Telecommunication Services-0.48% | | | | | |
Vodafone Group PLC (United Kingdom), 4.13%, 06/04/2081(d) | | | 4,624,000 | | | | 4,262,241 | |
|
| |
Total U.S. Dollar Denominated Bonds & Notes
(Cost $814,281,064) | | | | 792,033,388 | |
|
| |
|
Variable Rate Senior Loan Interests-6.72%(h)(i) | |
Environmental & Facilities Services-0.11% | | | | | |
Covanta Holding Corp.,
Term Loan B, -%, 11/17/2028(j) | | | 892,531 | | | | 886,395 | |
|
| |
Term Loan C, -%, 11/17/2028(j) | | | 66,856 | | | | 66,396 | |
|
| |
| | | | | | | 952,791 | |
|
| |
| | |
Food Distributors-0.50% | | | | | | | | |
United Natural Foods, Inc., Term Loan B, 3.46% (1 mo. USD LIBOR + 3.25%), 10/22/2025 | | | 4,444,508 | | | | 4,430,619 | |
|
| |
| | |
Health Care Services-1.01% | | | | | | | | |
Global Medical Response, Inc., Term Loan, 5.25% (1 mo. USD LIBOR + 4.25%), 10/02/2025 | | | 4,478,760 | | | | 4,463,084 | |
|
| |
Surgery Center Holdings, Inc., Term Loan, 4.50% (1 mo. USD LIBOR + 3.75%), 09/03/2026 | | | 4,478,468 | | | | 4,445,686 | |
|
| |
| | | | | | | 8,908,770 | |
|
| |
| |
Hotels, Resorts & Cruise Lines-0.51% | | | | | |
Four Seasons Hotels Ltd. (Canada), First Lien Term Loan, 2.21% (1 mo. USD LIBOR + 2.00%), 11/30/2023 | | | 4,591,667 | | | | 4,566,642 | |
|
| |
| | | | | | | | |
| | | Principal
Amount | | | Value | |
|
| |
Metal & Glass Containers-0.51% | | | | | |
Flex Acquisition Co., Inc., Incremental Term Loan B, 3.21% (3 mo. USD LIBOR + 3.00%), 06/29/2025 | | $ | 4,499,077 | | | $ | 4,483,983 | |
|
| |
| | |
Paper Products-1.05% | | | | | | | | |
Schweitzer-Mauduit International, Inc. (SWM International), Term Loan B, 4.50% (1 mo. USD LIBOR + 3.75%), 04/20/2028(g) | | | 9,465,765 | | | | 9,276,450 | |
|
| |
| | |
Pharmaceuticals-1.21% | | | | | | | | |
Bausch Health Americas, Inc., First
Lien Incremental Term Loan, 2.96% (1 mo. USD LIBOR + 2.75%), 11/27/2025 | | | 6,304,653 | | | | 6,225,845 | |
|
| |
Endo LLC, Term Loan, 5.75% (3 mo. USD LIBOR + 5.00%), 03/27/2028 | | | 4,595,275 | | | | 4,455,326 | |
|
| |
| | | | | | | 10,681,171 | |
|
| |
| | |
Restaurants-1.05% | | | | | | | | |
IRB Holding Corp., First Lien Term Loan B, 3.75% (3 mo. SOFR + 3.00%), 12/01/2027 | | | 9,420,858 | | | | 9,344,313 | |
|
| |
| | |
Specialty Stores-0.77% | | | | | | | | |
PetSmart, Inc., Term Loan, 4.50% (3 mo. USD LIBOR + 3.75%), 02/11/2028 | | | 6,872,133 | | | | 6,847,085 | |
|
| |
Total Variable Rate Senior Loan Interests
(Cost $60,041,957) | | | | 59,491,824 | |
|
| |
| | |
| | | Shares | | | | |
Common Stocks & Other Equity Interests-0.29% | |
| | |
Cable & Satellite-0.19% | | | | | | | | |
Altice USA, Inc., Class A(k) | | | 146,000 | | | | 1,687,760 | |
|
| |
| | |
Leisure Products-0.00% | | | | | | | | |
HF Holdings, Inc.(g) | | | 36,820 | | | | 0 | |
|
| |
| | |
Oil & Gas Drilling-0.10% | | | | | | | | |
Valaris Ltd.(k) | | | 21,400 | | | | 871,836 | |
|
| |
| |
Other Diversified Financial Services-0.00% | | | | | |
Codere New Topco S.A.
(Spain)(g) | | | 22,979 | | | | 0 | |
|
| |
Total Common Stocks & Other Equity Interests (Cost $9,529,881) | | | | 2,559,596 | |
|
| |
| | |
| | | Principal
Amount | | | | |
Non-U.S. Dollar Denominated Bonds & Notes-0.27%(l) | |
| | |
Casinos & Gaming-0.16% | | | | | | | | |
Codere Finance 2 (Luxembourg) S.A. (Spain), 3.00% PIK Rate, 8.00% Cash Rate,
09/30/2026(b)(c) | | EUR | 1,190,000 | | | | 1,410,588 | |
|
| |
| |
Other Diversified Financial Services-0.07% | | | | | |
Codere New Holdco S.A. (Spain), 7.50% PIK Rate, 0.00% Cash
Rate, 11/30/2027(b)(c) | | EUR | 616,581 | | | | 620,479 | |
|
| |
| | |
Paper Packaging-0.01% | | | | | | | | |
Mossi & Ghisolfi Finance Luxembourg S.A. (Brazil), 5.06%(3 mo. EURIBOR +
5.63%)(e)(m)(n) | | EUR | 4,100,000 | | | | 91,942 | |
|
| |
See accompanying Notes to Financial Statements which are an integral part of the financial statements.
| | |
| 12 | | Invesco High Yield Fund |
| | | | | | | | |
| | | Principal
Amount | | | Value | |
|
| |
Textiles-0.03% | | | | | | | | |
Eagle Intermediate Global Holding
B.V./Ruyi US Finance LLC (China), 5.38%, 05/01/2023(b) | | EUR | 200,000 | | | $ | 214,577 | |
|
| |
Total Non-U.S. Dollar Denominated Bonds & Notes
(Cost $3,432,449) | | | | 2,337,586 | |
|
| |
| |
U.S. Treasury Securities-0.19% | | | | | |
U.S. Treasury Bills-0.19% | | | | | | | | |
0.30%, 05/26/2022 | | | | | | | | |
(Cost $1,689,588)(o) | | $ | 1,690,000 | | | | 1,688,758 | |
|
| |
| | |
| | | Shares | | | | |
| |
Money Market Funds-1.52% | | | | | |
Invesco Government & Agency Portfolio, Institutional Class, 0.03%(p)(q) 3,552,487 | | | | 3,552,487 | |
|
| |
Invesco Liquid Assets Portfolio, Institutional Class, 0.01%(p)(q) | | | 5,859,107 | | | | 5,859,107 | |
|
| |
Invesco Treasury Portfolio, Institutional Class, 0.01%(p)(q) | | | 4,059,986 | | | | 4,059,986 | |
|
| |
Total Money Market Funds (Cost $13,475,180) | | | | 13,471,580 | |
|
| |
Investment Abbreviations:
| EURIBOR | - Euro Interbank Offered Rate |
| LIBOR | - London Interbank Offered Rate |
| REIT | - Real Estate Investment Trust |
| SOFR | - Secured Overnight Financing Rate |
| | | | | | | | |
| | |
Shares | | | Value | |
|
| |
Options Purchased-0.18% | | | | | | | | |
(Cost $1,192,473)(r) | | | | | | $ | 1,623,008 | |
|
| |
TOTAL INVESTMENTS IN SECURITIES
(excluding investments purchased with cash collateral from securities on loan)-98.58%
(Cost $903,642,592) | | | | 873,205,740 | |
|
| |
|
Investments Purchased with Cash Collateral from Securities on Loan | |
Money Market Funds-0.34% | | | | | | | | |
Invesco Private Government Fund, 0.12%(p)(q)(s) | | | 909,625 | | | | 909,625 | |
|
| |
Invesco Private Prime Fund,
0.08%(p)(q)(s) | | | 2,122,245 | | | | 2,122,457 | |
|
| |
Total Investments Purchased with Cash Collateral from Securities on Loan
(Cost $3,032,161) | | | | 3,032,082 | |
|
| |
TOTAL INVESTMENTS IN SECURITIES-98.92%
(Cost $906,674,753) | | | | 876,237,822 | |
|
| |
OTHER ASSETS LESS LIABILITIES-1.08% | | | | 9,582,272 | |
|
| |
NET ASSETS-100.00% | | | | | | $ | 885,820,094 | |
|
| |
See accompanying Notes to Financial Statements which are an integral part of the financial statements.
| | |
| 13 | | Invesco High Yield Fund |
Notes to Schedule of Investments:
| (a) | Industry and/or sector classifications used in this report are generally according to the Global Industry Classification Standard, which was developed by and is the exclusive property and a service mark of MSCI Inc. and Standard & Poor’s. |
| (b) | Security purchased or received in a transaction exempt from registration under the Securities Act of 1933, as amended (the “1933 Act”). The security may be resold pursuant to an exemption from registration under the 1933 Act, typically to qualified institutional buyers. The aggregate value of these securities at February 28, 2022 was $601,751,197, which represented 67.93% of the Fund’s Net Assets. |
| (c) | All or a portion of this security is Pay-in-Kind. Pay-in-Kind securities pay interest income in the form of securities. |
| (d) | Security issued at a fixed rate for a specific period of time, after which it will convert to a variable rate. |
| (e) | Perpetual bond with no specified maturity date. |
| (f) | All or a portion of this security was out on loan at February 28, 2022. |
| (g) | Security valued using significant unobservable inputs (Level 3). See Note 3. |
| (h) | Variable rate senior loan interests often require prepayments from excess cash flow or permit the borrower to repay at its election. The degree to which borrowers repay, whether as a contractual requirement or at their election, cannot be predicted with any accuracy. As a result, the actual remaining maturity may be substantially less than the stated maturities shown. However, it is anticipated that the variable rate senior loan interests will have an expected average life of three to five years. |
| (i) | Variable rate senior loan interests are, at present, not readily marketable, not registered under the 1933 Act and may be subject to contractual and legal restrictions on sale. Variable rate senior loan interests in the Fund’s portfolio generally have variable rates which adjust to a base, such as the London Interbank Offered Rate (“LIBOR”), on set dates, typically every 30 days, but not greater than one year, and/or have interest rates that float at margin above a widely recognized base lending rate such as the Prime Rate of a designated U.S. bank. |
| (j) | This variable rate interest will settle after February 28, 2022, at which time the interest rate will be determined. |
| (k) | Non-income producing security. |
| (l) | Foreign denominated security. Principal amount is denominated in the currency indicated. |
| (m) | Defaulted security. Currently, the issuer is in default with respect to principal and/or interest payments. The value of this security at February 28, 2022 represented less than 1% of the Fund’s Net Assets. |
| (n) | Interest or dividend rate is redetermined periodically. Rate shown is the rate in effect on February 28, 2022. |
| (o) | Security traded on a discount basis. The interest rate shown represents the discount rate at the time of purchase by the Fund. |
| (p) | Affiliated issuer. The issuer and/or the Fund is a wholly-owned subsidiary of Invesco Ltd., or is affiliated by having an investment adviser that is under common control of Invesco Ltd. The table below shows the Fund’s transactions in, and earnings from, its investments in affiliates for the fiscal year ended February 28, 2022. |
| | | | | | | | | | | | | | | | | | | | | | | | | | | | | | | | | | | |
| | | Value
February 28, 2021 | | Purchases
at Cost | | Proceeds
from Sales | | Change in
Unrealized
Appreciation
(Depreciation) | | Realized
Gain
(Loss) | | Value
February 28, 2022 | | Dividend Income |
| Investments in Affiliated Money Market Funds: | | | | | | | | | | | | | | | | | | | | | | | | | | | | | | | | | | | |
Invesco Government & Agency Portfolio, Institutional Class | | | $ | 6,858,550 | | | | $ | 160,326,950 | | | | $ | (163,633,013 | ) | | | $ | - | | | | $ | - | | | | $ | 3,552,487 | | | | $ | 1,610 | |
Invesco Liquid Assets Portfolio, Institutional Class | | | | 9,742,049 | | | | | 114,081,397 | | | | | (117,961,224 | ) | | | | (977 | ) | | | | (2,138 | ) | | | | 5,859,107 | | | | | 1,003 | |
Invesco Treasury Portfolio, Institutional Class | | | | 7,838,342 | | | | | 183,230,801 | | | | | (187,009,157 | ) | | | | - | | | | | - | | | | | 4,059,986 | | | | | 694 | |
| Investments Purchased with Cash Collateral from Securities on Loan: | | | | | | | | | | | | | | | | | | | | | | | | | | | | | | | | | | | |
Invesco Private Government Fund | | | | - | | | | | 3,426,574 | | | | | (2,516,949 | ) | | | | - | | | | | - | | | | | 909,625 | | | | | 49* | |
Invesco Private Prime Fund | | | | - | | | | | 7,110,537 | | | | | (4,988,001 | ) | | | | (79 | ) | | | | - | | | | | 2,122,457 | | | | | 279* | |
Total | | | $ | 24,438,941 | | | | $ | 468,176,259 | | | | $ | (476,108,344 | ) | | | $ | (1,056 | ) | | | $ | (2,138 | ) | | | $ | 16,503,662 | | | | $ | 3,635 | |
| | * | Represents the income earned on the investment of cash collateral, which is included in securities lending income on the Statement of Operations. Does not include rebates and fees paid to lending agent or premiums received from borrowers, if any. |
| (q) | The rate shown is the 7-day SEC standardized yield as of February 28, 2022. |
| (r) | The table below details options purchased. |
| (s) | The security has been segregated to satisfy the commitment to return the cash collateral received in securities lending transactions upon the borrower’s return of the securities loaned. See Note 1I. |
| | | | | | | | | | | | | | | | | | | | | | | | |
| | | Open Exchange-Traded Equity Options Purchased | |
| Description | | Type of
Contract | | | Expiration
Date | | | Number of
Contracts | | | Exercise
Price | | | Notional
Value(a) | | | Value | |
| Equity Risk | | | | | | | | | | | | | | | | | | | | | | | | |
Ford Motor Co. | | | Call | | | | 09/16/2022 | | | | 415 | | | USD | 22.00 | | | USD | 913,000 | | | $ | 40,255 | |
iShares China Large-Cap ETF | | | Call | | | | 01/20/2023 | | | | 886 | | | USD | 41.00 | | | USD | 3,632,600 | | | | 109,421 | |
iShares China Large-Cap ETF | | | Call | | | | 01/20/2023 | | | | 548 | | | USD | 38.00 | | | USD | 2,082,400 | | | | 113,162 | |
Occidental Petroleum Corp. | | | Call | | | | 01/20/2023 | | | | 1,524 | | | USD | 42.00 | | | USD | 6,400,800 | | | | 1,360,170 | |
Total Open Exchange-Traded Equity Options Purchased | | | | | | | | | | | | | | | | | | | | | | $ | 1,623,008 | |
| (a) | Notional Value is calculated by multiplying the Number of Contracts by the Exercise Price by the multiplier. |
See accompanying Notes to Financial Statements which are an integral part of the financial statements.
| | |
| 14 | | Invesco High Yield Fund |
| | | | | | | | | | | | | | | | | | | | | | | | |
| Open Exchange-Traded Equity Options Written | |
| Description | | Type of
Contract | | | Expiration
Date | | | Number of
Contracts | | | Exercise
Price | | | Notional
Value(a) | | | Value | |
| Equity Risk | | | | | | | | | | | | | | | | | | | | | | | | |
Ford Motor Co. | | | Call | | | | 09/16/2022 | | | | 415 | | | USD | 29.00 | | | USD | 1,203,500 | | | $ | (9,338 | ) |
Occidental Petroleum Corp. | | | Call | | | | 01/20/2023 | | | | 1,524 | | | USD | 50.00 | | | USD | 7,620,000 | | | | (910,590 | ) |
Total Open Exchange-Traded Equity Options Written | | | | | | | | | | | | | | | | | | | | | | $ | (919,928 | ) |
| (a) | Notional Value is calculated by multiplying the Number of Contracts by the Exercise Price by the multiplier. |
| | | | | | | | | | | | | | |
| Open Forward Foreign Currency Contracts | |
| | | |
| | | | | Contract to | | | | |
Settlement
Date | | Counterparty | | Deliver | | | Receive | | | Unrealized
Appreciation | |
| Currency Risk | | | | | | | | | | | | | | |
| 05/17/2022 | | Goldman Sachs International | | EUR | 1,522,000 | | | USD | 1,749,320 | | | | $37,805 | |
| 05/17/2022 | | Goldman Sachs International | | GBP | 100,000 | | | USD | 136,066 | | | | 1,902 | |
Total Forward Foreign Currency Contracts | | | | $39,707 | |
Abbreviations:
EUR –Euro
GBP –British Pound Sterling
USD –U.S. Dollar
See accompanying Notes to Financial Statements which are an integral part of the financial statements.
| | |
| 15 | | Invesco High Yield Fund |
Statement of Assets and Liabilities
February 28, 2022
| | | | |
Assets: | | | | |
Investments in unaffiliated securities, at value (Cost $890,167,412)* | | $ | 859,734,160 | |
|
| |
Investments in affiliated money market funds, at value (Cost $16,507,341) | | | 16,503,662 | |
|
| |
Other investments: | | | | |
Variation margin receivable–centrally cleared swap agreements | | | 118,291 | |
|
| |
Unrealized appreciation on forward foreign currency contracts outstanding | | | 39,707 | |
|
| |
Foreign currencies, at value (Cost $371,168) | | | 366,956 | |
|
| |
Receivable for: | | | | |
Investments sold | | | 6,078,383 | |
|
| |
Fund shares sold | | | 882,181 | |
|
| |
Dividends | | | 12,708 | |
|
| |
Interest | | | 11,994,836 | |
|
| |
Cash segregated as collateral | | | 500,015 | |
|
| |
Investment for trustee deferred compensation and retirement plans | | | 283,180 | |
|
| |
Other assets | | | 62,799 | |
|
| |
Total assets | | | 896,576,878 | |
|
| |
| |
Liabilities: | | | | |
| |
Other investments: | | | | |
Options written, at value (premiums received $485,349) | | | 919,928 | |
|
| |
Payable for: | | | | |
Investments purchased | | | 3,232,636 | |
|
| |
Dividends | | | 764,231 | |
|
| |
Fund shares reacquired | | | 613,094 | |
|
| |
Amount due custodian | | | 1,354,188 | |
|
| |
Collateral upon return of securities loaned | | | 3,032,161 | |
|
| |
Accrued fees to affiliates | | | 399,805 | |
|
| |
Accrued trustees’ and officers’ fees and benefits | | | 4,240 | |
|
| |
Accrued other operating expenses | | | 90,720 | |
|
| |
Trustee deferred compensation and retirement plans | | | 345,781 | |
|
| |
Total liabilities | | | 10,756,784 | |
|
| |
Net assets applicable to shares outstanding | | $ | 885,820,094 | |
|
| |
| | | | |
Net assets consist of: | | | | |
Shares of beneficial interest | | $ | 1,143,277,498 | |
|
| |
Distributable earnings (loss) | | | (257,457,404 | ) |
|
| |
| | $ | 885,820,094 | |
|
| |
| |
Net Assets: | | | | |
Class A | | $ | 640,948,443 | |
|
| |
Class C | | $ | 22,625,882 | |
|
| |
Class Y | | $ | 45,483,363 | |
|
| |
Investor Class | | $ | 68,374,924 | |
|
| |
Class R5 | | $ | 27,997,071 | |
|
| |
Class R6 | | $ | 80,390,411 | |
|
| |
|
Shares outstanding, no par value, with an unlimited number of shares authorized: | |
Class A | | | 168,087,254 | |
|
| |
Class C | | | 5,947,530 | |
|
| |
Class Y | | | 11,900,670 | |
|
| |
Investor Class | | | 17,951,460 | |
|
| |
Class R5 | | | 7,369,883 | |
|
| |
Class R6 | | | 21,102,663 | |
|
| |
Class A: | | | | |
Net asset value per share | | $ | 3.81 | |
|
| |
Maximum offering price per share
(Net asset value of $3.81 ÷ 95.75%) | | $ | 3.98 | |
|
| |
Class C: | | | | |
Net asset value and offering price per share | | $ | 3.80 | |
|
| |
Class Y: | | | | |
Net asset value and offering price per share | | $ | 3.82 | |
|
| |
Investor Class: | | | | |
Net asset value and offering price per share | | $ | 3.81 | |
|
| |
Class R5: | | | | |
Net asset value and offering price per share | | $ | 3.80 | |
|
| |
Class R6: | | | | |
Net asset value and offering price per share | | $ | 3.81 | |
|
| |
| * | At February 28, 2022, securities with an aggregate value of $2,994,513 were on loan to brokers. |
See accompanying Notes to Financial Statements which are an integral part of the financial statements.
| | |
| 16 | | Invesco High Yield Fund |
Statement of Operations
For the year ended February 28, 2022
| | | | | | | | |
Investment income: | | | | | | | | |
Interest | | | | | | $ | 46,094,758 | |
|
| |
Dividends | | | | | | | 8,245 | |
|
| |
Dividends from affiliated money market funds (includes securities lending income of $12,455) | | | | | | | 15,762 | |
|
| |
Total investment income | | | | | | | 46,118,765 | |
|
| |
| | |
Expenses: | | | | | | | | |
Advisory fees | | | | | | | 5,093,370 | |
|
| |
Administrative services fees | | | | | | | 129,450 | |
|
| |
Custodian fees | | | | | | | 25,091 | |
|
| |
Distribution fees: | | | | | | | | |
Class A | | | | | | | 1,657,631 | |
|
| |
Class C | | | | | | | 251,383 | |
|
| |
Investor Class | | | | | | | 184,353 | |
|
| |
Transfer agent fees – A, C, Y and Investor | | | | | | | 1,262,383 | |
|
| |
Transfer agent fees – R5 | | | | | | | 34,192 | |
|
| |
Transfer agent fees – R6 | | | | | | | 22,076 | |
|
| |
Trustees’ and officers’ fees and benefits | | | | | | | 31,914 | |
|
| |
Registration and filing fees | | | | | | | 112,319 | |
|
| |
Reports to shareholders | | | | | | | 110,333 | |
|
| |
Professional services fees | | | | | | | 289,451 | |
|
| |
Other | | | | | | | 23,349 | |
|
| |
Total expenses | | | | | | | 9,227,295 | |
|
| |
Less: Fees waived and/or expense offset arrangement(s) | | | | | | | (9,986 | ) |
|
| |
Net expenses | | | | | | | 9,217,309 | |
|
| |
Net investment income | | | | | | | 36,901,456 | |
|
| |
| | |
Realized and unrealized gain (loss) from: | | | | | | | | |
Net realized gain (loss) from: | | | | | | | | |
Unaffiliated investment securities | | | | | | | 14,972,278 | |
|
| |
Affiliated investment securities | | | | | | | (2,138 | ) |
|
| |
Foreign currencies | | | | | | | (228,909 | ) |
|
| |
Forward foreign currency contracts | | | | | | | 668,014 | |
|
| |
Futures contracts | | | | | | | (254,005 | ) |
|
| |
Option contracts written | | | | | | | (665,109 | ) |
|
| |
Swap agreements | | | | | | | (198,840 | ) |
|
| |
| | | | | | | 14,291,291 | |
|
| |
Change in net unrealized appreciation (depreciation) of: | | | | | | | | |
Unaffiliated investment securities | | | | | | | (46,476,096 | ) |
|
| |
Affiliated investment securities | | | | | | | (1,056 | ) |
|
| |
Foreign currencies | | | | | | | (11,990 | ) |
|
| |
Forward foreign currency contracts | | | | | | | 10,221 | |
|
| |
Option contracts written | | | | | | | (445,088 | ) |
|
| |
| | | | | | | (46,924,009 | ) |
|
| |
Net realized and unrealized gain (loss) | | | | | | | (32,632,718 | ) |
|
| |
Net increase in net assets resulting from operations | | | | | | $ | 4,268,738 | |
|
| |
See accompanying Notes to Financial Statements which are an integral part of the financial statements.
| | |
| 17 | | Invesco High Yield Fund |
Statement of Changes in Net Assets
For the years ended February 28, 2022 and 2021
| | | | | | | | |
| | | 2022 | | | 2021 | |
|
| |
Operations: | | | | | | | | |
Net investment income | | $ | 36,901,456 | | | $ | 46,982,352 | |
|
| |
Net realized gain (loss) | | | 14,291,291 | | | | (56,740,108 | ) |
|
| |
Change in net unrealized appreciation (depreciation) | | | (46,924,009 | ) | | | 64,918,746 | |
|
| |
Net increase in net assets resulting from operations | | | 4,268,738 | | | | 55,160,990 | |
|
| |
| | |
Distributions to shareholders from distributable earnings: | | | | | | | | |
Class A | | | (29,655,741 | ) | | | (36,337,213 | ) |
|
| |
Class C | | | (935,438 | ) | | | (1,605,096 | ) |
|
| |
Class Y | | | (2,411,889 | ) | | | (3,453,422 | ) |
|
| |
Investor Class | | | (3,293,321 | ) | | | (4,324,940 | ) |
|
| |
Class R5 | | | (1,673,240 | ) | | | (2,615,850 | ) |
|
| |
Class R6 | | | (4,399,047 | ) | | | (7,661,843 | ) |
|
| |
Total distributions from distributable earnings | | | (42,368,676 | ) | | | (55,998,364 | ) |
|
| |
| | |
Return of capital: | | | | | | | | |
Class A | | | - | | | | (1,772,865 | ) |
|
| |
Class C | | | - | | | | (78,311 | ) |
|
| |
Class Y | | | - | | | | (168,490 | ) |
|
| |
Investor Class | | | - | | | | (211,011 | ) |
|
| |
Class R5 | | | - | | | | (127,625 | ) |
|
| |
Class R6 | | | - | | | | (373,816 | ) |
|
| |
Total return of capital | | | - | | | | (2,732,118 | ) |
|
| |
Total distributions | | | (42,368,676 | ) | | | (58,730,482 | ) |
|
| |
| | |
Share transactions-net: | | | | | | | | |
Class A | | | 10,360,973 | | | | (6,810,503 | ) |
|
| |
Class C | | | (3,255,144 | ) | | | (8,814,544 | ) |
|
| |
Class Y | | | (3,584,636 | ) | | | (10,179,218 | ) |
|
| |
Investor Class | | | (3,689,781 | ) | | | (5,412,983 | ) |
|
| |
Class R5 | | | (9,426,910 | ) | | | (16,233,844 | ) |
|
| |
Class R6 | | | 1,080,660 | | | | (102,497,843 | ) |
|
| |
Net increase (decrease) in net assets resulting from share transactions | | | (8,514,838 | ) | | | (149,948,935 | ) |
|
| |
Net increase (decrease) in net assets | | | (46,614,776 | ) | | | (153,518,427 | ) |
|
| |
| | |
Net assets: | | | | | | | | |
Beginning of year | | | 932,434,870 | | | | 1,085,953,297 | |
|
| |
End of year | | $ | 885,820,094 | | | $ | 932,434,870 | |
|
| |
See accompanying Notes to Financial Statements which are an integral part of the financial statements.
| | |
| 18 | | Invesco High Yield Fund |
Financial Highlights
The following schedule presents financial highlights for a share of the Fund outstanding throughout the periods indicated.
| | | | | | | | | | | | | | | | | | | | | | | | | | | | | | | | | | | | | | | | | | | | | | | | | | | | | | | | |
| | | Net asset value, beginning of period | | | Net investment income(a) | | | Net gains (losses) on securities (both realized and unrealized) | | | Total from investment operations | | | Dividends from net investment income | | | Return of
capital | | | Total distributions | | | Net asset value, end of period | | | Total return (b) | | | Net assets, end of period (000’s omitted) | | | Ratio of expenses to average net assets with fee waivers and/or expenses absorbed | | | Ratio of expenses to average net assets without fee waivers and/or expenses absorbed | | | Ratio of net investment income to average net assets | | | Portfolio turnover (c) | |
Class A | | | | | | | | | | | | | | | | | | | | | | | | | | | | | | | | | | | | | | | | | | | | | | | | | | | | | | | | |
Year ended 02/28/22 | | $ | 3.97 | | | $ | 0.15 | | | $ | (0.13 | ) | | $ | 0.02 | | | $ | (0.18 | ) | | $ | – | | | $ | (0.18 | ) | | $ | 3.81 | | | | 0.36 | % | | $ | 640,948 | | | | 1.03 | % | | | 1.03 | % | | | 3.90 | % | | | 88 | % |
Year ended 02/28/21 | | | 3.96 | | | | 0.19 | | | | 0.05 | | | | 0.24 | | | | (0.22 | ) | | | (0.01 | ) | | | (0.23 | ) | | | 3.97 | | | | 6.59 | | | | 657,549 | | | | 1.07 | | | | 1.07 | | | | 4.89 | | | | 101 | |
Year ended 02/29/20 | | | 4.05 | | | | 0.21 | | | | (0.07 | ) | | | 0.14 | | | | (0.23 | ) | | | – | | | | (0.23 | ) | | | 3.96 | | | | 3.53 | | | | 663,578 | | | | 1.01 | | | | 1.02 | | | | 5.09 | | | | 62 | |
Year ended 02/28/19 | | | 4.13 | | | | 0.20 | | | | (0.07 | ) | | | 0.13 | | | | (0.21 | ) | | | – | | | | (0.21 | ) | | | 4.05 | | | | 3.28 | | | | 685,222 | | | | 1.15 | | | | 1.15 | | | | 4.96 | | | | 34 | |
Year ended 02/28/18 | | | 4.21 | | | | 0.20 | | | | (0.07 | ) | | | 0.13 | | | | (0.21 | ) | | | – | | | | (0.21 | ) | | | 4.13 | | | | 3.07 | | | | 701,560 | | | | 1.07 | | | | 1.08 | | | | 4.69 | | | | 56 | |
Class C | | | | | | | | | | | | | | | | | | | | | | | | | | | | | | | | | | | | | | | | | | | | | | | | | | | | | | | | |
Year ended 02/28/22 | | | 3.96 | | | | 0.12 | | | | (0.13 | ) | | | (0.01 | ) | | | (0.15 | ) | | | – | | | | (0.15 | ) | | | 3.80 | | | | (0.40 | ) | | | 22,626 | | | | 1.78 | | | | 1.78 | | | | 3.15 | | | | 88 | |
Year ended 02/28/21 | | | 3.95 | | | | 0.16 | | | | 0.05 | | | | 0.21 | | | | (0.19 | ) | | | (0.01 | ) | | | (0.20 | ) | | | 3.96 | | | | 5.79 | | | | 26,860 | | | | 1.82 | | | | 1.82 | | | | 4.14 | | | | 101 | |
Year ended 02/29/20 | | | 4.04 | | | | 0.18 | | | | (0.07 | ) | | | 0.11 | | | | (0.20 | ) | | | – | | | | (0.20 | ) | | | 3.95 | | | | 2.75 | | | | 35,743 | | | | 1.76 | | | | 1.77 | | | | 4.34 | | | | 62 | |
Year ended 02/28/19 | | | 4.12 | | | | 0.17 | | | | (0.07 | ) | | | 0.10 | | | | (0.18 | ) | | | – | | | | (0.18 | ) | | | 4.04 | | | | 2.50 | | | | 37,607 | | | | 1.90 | | | | 1.90 | | | | 4.21 | | | | 34 | |
Year ended 02/28/18 | | | 4.20 | | | | 0.16 | | | | (0.06 | ) | | | 0.10 | | | | (0.18 | ) | | | – | | | | (0.18 | ) | | | 4.12 | | | | 2.29 | | | | 88,812 | | | | 1.82 | | | | 1.83 | | | | 3.94 | | | | 56 | |
Class Y | | | | | | | | | | | | | | | | | | | | | | | | | | | | | | | | | | | | | | | | | | | | | | | | | | | | | | | | |
Year ended 02/28/22 | | | 3.98 | | | | 0.16 | | | | (0.13 | ) | | | 0.03 | | | | (0.19 | ) | | | – | | | | (0.19 | ) | | | 3.82 | | | | 0.63 | | | | 45,483 | | | | 0.78 | | | | 0.78 | | | | 4.15 | | | | 88 | |
Year ended 02/28/21 | | | 3.97 | | | | 0.19 | | | | 0.06 | | | | 0.25 | | | | (0.23 | ) | | | (0.01 | ) | | | (0.24 | ) | | | 3.98 | | | | 6.85 | | | | 51,180 | | | | 0.82 | | | | 0.82 | | | | 5.14 | | | | 101 | |
Year ended 02/29/20 | | | 4.07 | | | | 0.22 | | | | (0.08 | ) | | | 0.14 | | | | (0.24 | ) | | | – | | | | (0.24 | ) | | | 3.97 | | | | 3.54 | | | | 61,065 | | | | 0.76 | | | | 0.77 | | | | 5.34 | | | | 62 | |
Year ended 02/28/19 | | | 4.14 | | | | 0.21 | | | | (0.06 | ) | | | 0.15 | | | | (0.22 | ) | | | – | | | | (0.22 | ) | | | 4.07 | | | | 3.79 | | | | 112,350 | | | | 0.90 | | | | 0.90 | | | | 5.21 | | | | 34 | |
Year ended 02/28/18 | | | 4.23 | | | | 0.21 | | | | (0.08 | ) | | | 0.13 | | | | (0.22 | ) | | | – | | | | (0.22 | ) | | | 4.14 | | | | 3.09 | | | | 116,954 | | | | 0.82 | | | | 0.83 | | | | 4.94 | | | | 56 | |
Investor Class | | | | | | | | | | | | | | | | | | | | | | | | | | | | | | | | | | | | | | | | | | | | | | | | | | | | | | | | |
Year ended 02/28/22 | | | 3.97 | | | | 0.15 | | | | (0.13 | ) | | | 0.02 | | | | (0.18 | ) | | | – | | | | (0.18 | ) | | | 3.81 | | | | 0.36 | | | | 68,375 | | | | 1.03 | | | | 1.03 | | | | 3.90 | | | | 88 | |
Year ended 02/28/21 | | | 3.96 | | | | 0.18 | | | | 0.06 | | | | 0.24 | | | | (0.22 | ) | | | (0.01 | ) | | | (0.23 | ) | | | 3.97 | | | | 6.59 | | | | 74,887 | | | | 1.07 | | | | 1.07 | | | | 4.89 | | | | 101 | |
Year ended 02/29/20 | | | 4.05 | | | | 0.21 | | | | (0.07 | ) | | | 0.14 | | | | (0.23 | ) | | | – | | | | (0.23 | ) | | | 3.96 | | | | 3.53 | | | | 80,043 | | | | 1.01 | | | | 1.02 | | | | 5.09 | | | | 62 | |
Year ended 02/28/19 | | | 4.13 | | | | 0.20 | | | | (0.07 | ) | | | 0.13 | | | | (0.21 | ) | | | – | | | | (0.21 | ) | | | 4.05 | | | | 3.31 | | | | 79,404 | | | | 1.15 | | | | 1.15 | | | | 4.96 | | | | 34 | |
Year ended 02/28/18 | | | 4.21 | | | | 0.20 | | | | (0.07 | ) | | | 0.13 | | | | (0.21 | ) | | | – | | | | (0.21 | ) | | | 4.13 | | | | 3.11 | (d) | | | 97,913 | | | | 1.01 | (d) | | | 1.02 | (d) | | | 4.75 | (d) | | | 56 | |
Class R5 | | | | | | | | | | | | | | | | | | | | | | | | | | | | | | | | | | | | | | | | | | | | | | | | | | | | | | | | |
Year ended 02/28/22 | | | 3.96 | | | | 0.17 | | | | (0.14 | ) | | | 0.03 | | | | (0.19 | ) | | | – | | | | (0.19 | ) | | | 3.80 | | | | 0.67 | | | | 27,997 | | | | 0.72 | | | | 0.72 | | | | 4.21 | | | | 88 | |
Year ended 02/28/21 | | | 3.94 | | | | 0.20 | | | | 0.06 | | | | 0.26 | | | | (0.23 | ) | | | (0.01 | ) | | | (0.24 | ) | | | 3.96 | | | | 7.21 | | | | 38,676 | | | | 0.74 | | | | 0.74 | | | | 5.22 | | | | 101 | |
Year ended 02/29/20 | | | 4.04 | | | | 0.22 | | | | (0.07 | ) | | | 0.15 | | | | (0.25 | ) | | | – | | | | (0.25 | ) | | | 3.94 | | | | 3.75 | | | | 55,520 | | | | 0.68 | | | | 0.69 | | | | 5.42 | | | | 62 | |
Year ended 02/28/19 | | | 4.12 | | | | 0.21 | | | | (0.07 | ) | | | 0.14 | | | | (0.22 | ) | | | – | | | | (0.22 | ) | | | 4.04 | | | | 3.59 | | | | 64,804 | | | | 0.84 | | | | 0.84 | | | | 5.27 | | | | 34 | |
Year ended 02/28/18 | | | 4.20 | | | | 0.21 | | | | (0.07 | ) | | | 0.14 | | | | (0.22 | ) | | | – | | | | (0.22 | ) | | | 4.12 | | | | 3.40 | | | | 75,185 | | | | 0.75 | | | | 0.76 | | | | 5.01 | | | | 56 | |
Class R6 | | | | | | | | | | | | | | | | | | | | | | | | | | | | | | | | | | | | | | | | | | | | | | | | | | | | | | | | |
Year ended 02/28/22 | | | 3.97 | | | | 0.17 | | | | (0.14 | ) | | | 0.03 | | | | (0.19 | ) | | | – | | | | (0.19 | ) | | | 3.81 | | | | 0.75 | | | | 80,390 | | | | 0.64 | | | | 0.64 | | | | 4.29 | | | | 88 | |
Year ended 02/28/21 | | | 3.95 | | | | 0.20 | | | | 0.07 | | | | 0.27 | | | | (0.24 | ) | | | (0.01 | ) | | | (0.25 | ) | | | 3.97 | | | | 7.29 | | | | 83,282 | | | | 0.65 | | | | 0.65 | | | | 5.31 | | | | 101 | |
Year ended 02/29/20 | | | 4.05 | | | | 0.22 | | | | (0.07 | ) | | | 0.15 | | | | (0.25 | ) | | | – | | | | (0.25 | ) | | | 3.95 | | | | 3.70 | | | | 190,003 | | | | 0.59 | | | | 0.60 | | | | 5.51 | | | | 62 | |
Year ended 02/28/19 | | | 4.12 | | | | 0.22 | | | | (0.06 | ) | | | 0.16 | | | | (0.23 | ) | | | – | | | | (0.23 | ) | | | 4.05 | | | | 3.94 | | | | 186,913 | | | | 0.75 | | | | 0.75 | | | | 5.36 | | | | 34 | |
Year ended 02/28/18 | | | 4.20 | | | | 0.21 | | | | (0.07 | ) | | | 0.14 | | | | (0.22 | ) | | | – | | | | (0.22 | ) | | | 4.12 | | | | 3.49 | | | | 195,027 | | | | 0.66 | | | | 0.67 | | | | 5.10 | | | | 56 | |
| (a) | Calculated using average shares outstanding. |
| (b) | Includes adjustments in accordance with accounting principles generally accepted in the United States of America and as such, the net asset value for financial reporting purposes and the returns based upon those net asset values may differ from the net asset value and returns for shareholder transactions. Does not include sales charges and is not annualized for periods less than one year, if applicable. |
| (c) | Portfolio turnover is calculated at the fund level and is not annualized for periods less than one year, if applicable. |
| (d) | The total return, ratio of expenses to average net assets and ratio of net investment income to average net assets reflect actual 12b-1 fees of 0.19% for the year ended February 28, 2018. |
See accompanying Notes to Financial Statements which are an integral part of the financial statements.
| | |
| 19 | | Invesco High Yield Fund |
Notes to Financial Statements
February 28, 2022
NOTE 1–Significant Accounting Policies
Invesco High Yield Fund (the “Fund”), is a series portfolio of AIM Investment Securities Funds (Invesco Investment Securities Funds) (the “Trust”). The Trust is organized as a Delaware statutory trust and is registered under the Investment Company Act of 1940, as amended (the “1940 Act”), as an open-end series management investment company authorized to issue an unlimited number of shares of beneficial interest. Information presented in these financial statements pertains only to the Fund. Matters affecting the Fund or each class will be voted on exclusively by the shareholders of the Fund or each class.
The Fund’s investment objective is total return through growth of capital and current income.
The Fund currently consists of six different classes of shares: Class A, Class C, Class Y, Investor Class, Class R5 and Class R6. Class Y and Investor Class shares are available only to certain investors. Class A shares are sold with a front-end sales charge unless certain waiver criteria are met and under certain circumstances load waived shares may be subject to contingent deferred sales charges (“CDSC”). Class C shares are sold with a CDSC. Class Y, Investor Class, Class R5 and Class R6 shares are sold at net asset value. Class C shares held for eight years after purchase are eligible for automatic conversion into Class A shares of the same Fund (the “Conversion Feature”). The automatic conversion pursuant to the Conversion Feature will generally occur at the end of the month following the eighth anniversary after a purchase of Class C shares.
The Fund is an investment company and accordingly follows the investment company accounting and reporting guidance in accordance with Financial Accounting Standards Board Accounting Standards Codification Topic 946, Financial Services - Investment Companies.
The following is a summary of the significant accounting policies followed by the Fund in the preparation of its financial statements.
| A. | Security Valuations - Securities, including restricted securities, are valued according to the following policy. |
Debt obligations (including convertible securities) and unlisted equities are fair valued using an evaluated quote provided by an independent pricing service. Evaluated quotes provided by the pricing service may be determined without exclusive reliance on quoted prices, and may reflect appropriate factors such as institution-size trading in similar groups of securities, developments related to specific securities, dividend rate (for unlisted equities), yield (for debt obligations), quality, type of issue, coupon rate (for debt obligations), maturity (for debt obligations), individual trading characteristics and other market data. Pricing services generally value debt obligations assuming orderly transactions of institutional round lot size, but a fund may hold or transact in the same securities in smaller, odd lot sizes. Odd lots often trade at lower prices than institutional round lots. Debt obligations are subject to interest rate and credit risks. In addition, all debt obligations involve some risk of default with respect to interest and/or principal payments.
Variable rate senior loan interests are fair valued using quotes provided by an independent pricing service. Quotes provided by the pricing service may reflect appropriate factors such as ratings, tranche type, industry, company performance, spread, individual trading characteristics, institution-size trading in similar groups of securities and other market data.
A security listed or traded on an exchange (except convertible securities) is valued at its last sales price or official closing price as of the close of the customary trading session on the exchange where the security is principally traded, or lacking any sales or official closing price on a particular day, the security may be valued at the closing bid price on that day. Securities traded in the over-the-counter market are valued based on prices furnished by independent pricing services or market makers. When such securities are valued by an independent pricing service they may be considered fair valued. Futures contracts are valued at the final settlement price set by an exchange on which they are principally traded. Listed options are valued at the mean between the last bid and asked prices from the exchange on which they are principally traded. Options not listed on an exchange are valued by an independent source at the mean between the last bid and asked prices. For purposes of determining net asset value (“NAV”) per share, futures and option contracts generally are valued 15 minutes after the close of the customary trading session of the New York Stock Exchange (“NYSE”).
Investments in open-end and closed-end registered investment companies that do not trade on an exchange are valued at the end-of-day net asset value per share. Investments in open-end and closed-end registered investment companies that trade on an exchange are valued at the last sales price or official closing price as of the close of the customary trading session on the exchange where the security is principally traded.
Swap agreements are fair valued using an evaluated quote, if available, provided by an independent pricing service. Evaluated quotes provided by the pricing service are valued based on a model which may include end-of-day net present values, spreads, ratings, industry, company performance and returns of referenced assets. Centrally cleared swap agreements are valued at the daily settlement price determined by the relevant exchange or clearinghouse.
Foreign securities’ (including foreign exchange contracts) prices are converted into U.S. dollar amounts using the applicable exchange rates as of the close of the NYSE. If market quotations are available and reliable for foreign exchange-traded equity securities, the securities will be valued at the market quotations. Because trading hours for certain foreign securities end before the close of the NYSE, closing market quotations may become unreliable. If between the time trading ends on a particular security and the close of the customary trading session on the NYSE, events occur that the investment adviser determines are significant and make the closing price unreliable, the Fund may fair value the security. If the event is likely to have affected the closing price of the security, the security will be valued at fair value in good faith using procedures approved by the Board of Trustees. Adjustments to closing prices to reflect fair value may also be based on a screening process of an independent pricing service to indicate the degree of certainty, based on historical data, that the closing price in the principal market where a foreign security trades is not the current value as of the close of the NYSE. Foreign securities’ prices meeting the approved degree of certainty that the price is not reflective of current value will be priced at the indication of fair value from the independent pricing service. Multiple factors may be considered by the independent pricing service in determining adjustments to reflect fair value and may include information relating to sector indices, American Depositary Receipts and domestic and foreign index futures. Foreign securities may have additional risks including exchange rate changes, potential for sharply devalued currencies and high inflation, political and economic upheaval, the relative lack of issuer information, relatively low market liquidity and the potential lack of strict financial and accounting controls and standards.
Securities for which market prices are not provided by any of the above methods may be valued based upon quotes furnished by independent sources. The last bid price may be used to value equity securities. The mean between the last bid and asked prices is used to value debt obligations, including corporate loans.
Securities for which market quotations are not readily available or became unreliable are valued at fair value as determined in good faith by or under the supervision of the Trust’s officers following procedures approved by the Board of Trustees. Issuer specific events, market trends, bid/asked quotes of brokers and information providers and other market data may be reviewed in the course of making a good faith determination of a securitys fair value.
The Fund may invest in securities that are subject to interest rate risk, meaning the risk that the prices will generally fall as interest rates rise and, conversely, the prices will generally rise as interest rates fall. Specific securities differ in their sensitivity to changes in interest rates depending on their individual characteristics. Changes in interest rates may result in increased market volatility, which may affect the value and/or liquidity of certain Fund investments.
Valuations change in response to many factors including the historical and prospective earnings of the issuer, the value of the issuer’s assets, general market conditions which are not specifically related to the particular issuer, such as real or perceived adverse economic conditions, changes in the general outlook for revenues or corporate earnings, changes in interest or currency rates, regional or global instability, natural or environmental disasters, widespread disease or other public health issues, war, acts of terrorism or adverse investor sentiment generally and market liquidity. Because of the inherent uncertainties of valuation, the values reflected in the financial statements may materially differ from the value received upon actual sale of those investments.
| B. | Securities Transactions and Investment Income - Securities transactions are accounted for on a trade date basis. Realized gains or losses on sales are computed on the basis of specific identification of the securities sold. Interest income (net of withholding tax, if any) is recorded on an accrual basis from |
| | |
| 20 | | Invesco High Yield Fund |
| | settlement date and includes coupon interest and amortization of premium and accretion of discount on debt securities as applicable. Pay-in-kind interest income and non-cash dividend income received in the form of securities in-lieu of cash are recorded at the fair value of the securities received. Paydown gains and losses on mortgage and asset-backed securities are recorded as adjustments to interest income. Dividend income (net of withholding tax, if any) is recorded on the ex-dividend date. |
The Fund may periodically participate in litigation related to Fund investments. As such, the Fund may receive proceeds from litigation settlements. Any proceeds received are included in the Statement of Operations as realized gain (loss) for investments no longer held and as unrealized gain (loss) for investments still held.
Brokerage commissions and mark ups are considered transaction costs and are recorded as an increase to the cost basis of securities purchased and/or a reduction of proceeds on a sale of securities. Such transaction costs are included in the determination of net realized and unrealized gain (loss) from investment securities reported in the Statement of Operations and the Statement of Changes in Net Assets and the net realized and unrealized gains (losses) on securities per share in the Financial Highlights. Transaction costs are included in the calculation of the Fund’s net asset value and, accordingly, they reduce the Fund’s total returns. These transaction costs are not considered operating expenses and are not reflected in net investment income reported in the Statement of Operations and the Statement of Changes in Net Assets, or the net investment income per share and the ratios of expenses and net investment income reported in the Financial Highlights, nor are they limited by any expense limitation arrangements between the Fund and the investment adviser.
The Fund allocates realized and unrealized capital gains and losses to a class based on the relative net assets of each class. The Fund allocates income to a class based on the relative value of the settled shares of each class.
| C. | Country Determination - For the purposes of making investment selection decisions and presentation in the Schedule of Investments, the investment adviser may determine the country in which an issuer is located and/or credit risk exposure based on various factors. These factors include the laws of the country under which the issuer is organized, where the issuer maintains a principal office, the country in which the issuer derives 50% or more of its total revenues and the country that has the primary market for the issuer’s securities, as well as other criteria. Among the other criteria that may be evaluated for making this determination are the country in which the issuer maintains 50% or more of its assets, the type of security, financial guarantees and enhancements, the nature of the collateral and the sponsor organization. Country of issuer and/or credit risk exposure has been determined to be the United States of America, unless otherwise noted. |
| D. | Distributions - Distributions from net investment income, if any, are declared daily and paid monthly. Distributions from net realized capital gain, if any, are generally declared and paid annually and recorded on the ex-dividend date. The Fund may elect to treat a portion of the proceeds from redemptions as distributions for federal income tax purposes. |
| E. | Federal Income Taxes - The Fund intends to comply with the requirements of Subchapter M of the Internal Revenue Code of 1986, as amended (the “Internal Revenue Code”), necessary to qualify as a regulated investment company and to distribute substantially all of the Fund’s taxable earnings to shareholders. As such, the Fund will not be subject to federal income taxes on otherwise taxable income (including net realized capital gain) that is distributed to shareholders. Therefore, no provision for federal income taxes is recorded in the financial statements. |
The Fund recognizes the tax benefits of uncertain tax positions only when the position is more likely than not to be sustained. Management has analyzed the Funds uncertain tax positions and concluded that no liability for unrecognized tax benefits should be recorded related to uncertain tax positions. Management is not aware of any tax positions for which it is reasonably possible that the total amounts of unrecognized tax benefits will change materially in the next 12 months.
The Fund files tax returns in the U.S. Federal jurisdiction and certain other jurisdictions. Generally, the Fund is subject to examinations by such taxing authorities for up to three years after the filing of the return for the tax period.
| F. | Expenses - Fees provided for under the Rule 12b-1 plan of a particular class of the Fund are charged to the operations of such class. Transfer agency fees and expenses and other shareholder recordkeeping fees and expenses attributable to Class R5 and Class R6 are allocated based on relative net assets of Class R5 and Class R6. Sub-accounting fees attributable to Class R5 are charged to the operations of the class. Transfer agency fees and expenses and other shareholder recordkeeping fees and expenses relating to all other classes are allocated among those classes based on relative net assets. All other expenses are allocated among the classes based on relative net assets. |
| G. | Accounting Estimates - The preparation of financial statements in conformity with accounting principles generally accepted in the United States of America (“GAAP”) requires management to make estimates and assumptions that affect the reported amounts of assets and liabilities at the date of the financial statements and the reported amounts of revenues and expenses during the reporting period including estimates and assumptions related to taxation. Actual results could differ from those estimates by a significant amount. In addition, the Fund monitors for material events or transactions that may occur or become known after the period-end date and before the date the financial statements are released to print. |
| H. | Indemnifications - Under the Trust’s organizational documents, each Trustee, officer, employee or other agent of the Trust is indemnified against certain liabilities that may arise out of the performance of their duties to the Fund. Additionally, in the normal course of business, the Fund enters into contracts, including the Fund’s servicing agreements, that contain a variety of indemnification clauses. The Fund’s maximum exposure under these arrangements is unknown as this would involve future claims that may be made against the Fund that have not yet occurred. The risk of material loss as a result of such indemnification claims is considered remote. |
| I. | Securities Lending - The Fund may lend portfolio securities having a market value up to one-third of the Fund’s total assets. Such loans are secured by collateral equal to no less than the market value of the loaned securities determined daily by the securities lending provider. Such collateral will be cash or debt securities issued or guaranteed by the U.S. Government or any of its sponsored agencies. Cash collateral received in connection with these loans is invested in short-term money market instruments or affiliated, unregistered investment companies that comply with Rule 2a-7 under the 1940 Act and money market funds (collectively, “affiliated money market funds”) and is shown as such on the Schedule of Investments. The Fund bears the risk of loss with respect to the investment of collateral. It is the Fund’s policy to obtain additional collateral from or return excess collateral to the borrower by the end of the next business day, following the valuation date of the securities loaned. Therefore, the value of the collateral held may be temporarily less than the value of the securities on loan. When loaning securities, the Fund retains certain benefits of owning the securities, including the economic equivalent of dividends or interest generated by the security. Lending securities entails a risk of loss to the Fund if, and to the extent that, the market value of the securities loaned were to increase and the borrower did not increase the collateral accordingly, and the borrower failed to return the securities. The securities loaned are subject to termination at the option of the borrower or the Fund. Upon termination, the borrower will return to the Fund the securities loaned and the Fund will return the collateral. Upon the failure of the borrower to return the securities, collateral may be liquidated and the securities may be purchased on the open market to replace the loaned securities. The Fund could experience delays and costs in gaining access to the collateral and the securities may lose value during the delay which could result in potential losses to the Fund. |
Some of these losses may be indemnified by the lending agent. The Fund bears the risk of any deficiency in the amount of the collateral available for return to the borrower due to any loss on the collateral invested. Dividends received on cash collateral investments for securities lending transactions, which are net of compensation to counterparties, are included in Dividends from affiliated money market funds on the Statement of Operations. The aggregate value of securities out on loan, if any, is shown as a footnote on the Statement of Assets and Liabilities.
On September 29, 2021, the Board of Trustees appointed Invesco Advisers, Inc. (the “Adviser” or “Invesco”) to serve as an affiliated securities lending agent for the Fund. Prior to September 29, 2021, the Bank of New York Mellon (BNYM) served as the sole securities lending agent for the Fund under the securities lending program. BNYM also continues to serve as a lending agent. To the extent the Fund utilizes the Adviser as an affiliated securities lending agent, the Fund conducts its securities lending in accordance with, and in reliance upon, no-action letters issued by the SEC staff that provide guidance on how an affiliate may act
| | |
| 21 | | Invesco High Yield Fund |
as a direct agent lender and receive compensation for those services in a manner consistent with the federal securities laws. For the year ended February 28, 2022, there were no securities lending transactions with the Adviser.
| J. | Foreign Currency Translations - Foreign currency is valued at the close of the NYSE based on quotations posted by banks and major currency dealers. Portfolio securities and other assets and liabilities denominated in foreign currencies are translated into U.S. dollar amounts at the date of valuation. Purchases and sales of portfolio securities (net of foreign taxes withheld on disposition) and income items denominated in foreign currencies are translated into U.S. dollar amounts on the respective dates of such transactions. The Fund does not separately account for the portion of the results of operations resulting from changes in foreign exchange rates on investments and the fluctuations arising from changes in market prices of securities held. The combined results of changes in foreign exchange rates and the fluctuation of market prices on investments (net of estimated foreign tax withholding) are included with the net realized and unrealized gain or loss from investments in the Statement of Operations. Reported net realized foreign currency gains or losses arise from (1) sales of foreign currencies, (2) currency gains or losses realized between the trade and settlement dates on securities transactions, and (3) the difference between the amounts of dividends, interest, and foreign withholding taxes recorded on the Fund’s books and the U.S. dollar equivalent of the amounts actually received or paid. Net unrealized foreign currency gains and losses arise from changes in the fair values of assets and liabilities, other than investments in securities at fiscal period end, resulting from changes in exchange rates. |
The Fund may invest in foreign securities, which may be subject to foreign taxes on income, gains on investments or currency repatriation, a portion of which may be recoverable. Foreign taxes, if any, are recorded based on the tax regulations and rates that exist in the foreign markets in which the Fund invests and are shown in the Statement of Operations.
| K. | Forward Foreign Currency Contracts - The Fund may engage in foreign currency transactions either on a spot (i.e. for prompt delivery and settlement) basis, or through forward foreign currency contracts, to manage or minimize currency or exchange rate risk. |
The Fund may also enter into forward foreign currency contracts for the purchase or sale of a security denominated in a foreign currency in order to lock in the U.S. dollar price of that security, or the Fund may also enter into forward foreign currency contracts that do not provide for physical settlement of the two currencies, but instead are settled by a single cash payment calculated as the difference between the agreed upon exchange rate and the spot rate at settlement based upon an agreed upon notional amount (non-deliverable forwards). The Fund will set aside liquid assets in an amount equal to the daily mark-to-market obligation for forward foreign currency contracts.
A forward foreign currency contract is an obligation between two parties (Counterparties) to purchase or sell a specific currency for an agreed-upon price at a future date. The use of forward foreign currency contracts does not eliminate fluctuations in the price of the underlying securities the Fund owns or intends to acquire but establishes a rate of exchange in advance. Fluctuations in the value of these contracts are measured by the difference in the contract date and reporting date exchange rates and are recorded as unrealized appreciation (depreciation) until the contracts are closed. When the contracts are closed, realized gains (losses) are recorded. Realized and unrealized gains (losses) on the contracts are included in the Statement of Operations. The primary risks associated with forward foreign currency contracts include failure of the Counterparty to meet the terms of the contract and the value of the foreign currency changing unfavorably. These risks may be in excess of the amounts reflected in the Statement of Assets and Liabilities.
| L. | Call Options Purchased and Written - The Fund may write call options and/or buy call options. A covered call option gives the purchaser of such option the right to buy, and the writer the obligation to sell, the underlying security or foreign currency at the stated exercise price during the option period. An uncovered call option exists without the ownership of the underlying security. Options written by the Fund normally will have expiration dates between three and nine months from the date written. The exercise price of a call option may be below, equal to, or above the current market value of the underlying security at the time the option is written. |
Additionally, the Fund may enter into an option on a swap agreement, also called a swaption. A swaption is an option that gives the buyer the right, but not the obligation, to enter into a swap on a future date in exchange for paying a market-based premium. A receiver swaption gives the owner the right to receive the total return of a specified asset, reference rate or index. Swaptions also include options that allow an existing swap to be terminated or extended by one of the Counterparties.
When the Fund writes a covered call option, an amount equal to the premium received by the Fund is recorded as an asset and an equivalent liability in the Statement of Assets and Liabilities. The amount of the liability is subsequently marked-to-market to reflect the current market value of the option written. If a written covered call option expires on the stipulated expiration date, or if the Fund enters into a closing purchase transaction, the Fund realizes a gain (or a loss if the closing purchase transaction exceeds the premium received when the option was written) without regard to any unrealized gain or loss on the underlying security, and the liability related to such option is extinguished. If a written covered call option is exercised, the Fund realizes a gain or a loss from the sale of the underlying security and the proceeds of the sale are increased by the premium originally received. Realized and unrealized gains and losses on call options written are included in the Statement of Operations as Net realized gain (loss) from and Change in net unrealized appreciation (depreciation) of Option contracts written. A risk in writing a covered call option is that the Fund gives up the opportunity for profit if the market price of the security increases and the option is exercised. The risk in writing an uncovered call option is that the Fund may incur significant losses if the value of the written security exceeds the exercise price of the option.
When the Fund buys a call option, an amount equal to the premium paid by the Fund is recorded as an investment on the Statement of Assets and Liabilities. The amount of the investment is subsequently marked-to-market to reflect the current value of the option purchased. Realized and unrealized gains and losses on call options purchased are included in the Statement of Operations as Net realized gain (loss) from and Change in net unrealized appreciation (depreciation) of Investment securities. A risk in buying an option is that the Fund pays a premium whether or not the option is exercised. In addition, there can be no assurance that a liquid secondary market will exist for any option purchased.
| M. | Put Options Purchased and Written - The Fund may purchase and write put options including options on securities indexes, or foreign currency and/or futures contracts. By purchasing a put option, the Fund obtains the right (but not the obligation) to sell the option’s underlying instrument at a fixed strike price. In return for this right, the Fund pays an option premium. The option’s underlying instrument may be a security, securities index, or a futures contract. |
Additionally, the Fund may enter into an option on a swap agreement, also called a swaption. A swaption is an option that gives the buyer the right, but not the obligation, to enter into a swap on a future date in exchange for paying a market-based premium. A receiver swaption gives the owner the right to receive the total return of a specified asset, reference rate or index. Swaptions also include options that allow an existing swap to be terminated or extended by one of the Counterparties.
Put options may be used by the Fund to hedge securities it owns by locking in a minimum price at which the Fund can sell. If security prices fall, the put option could be exercised to offset all or a portion of the Funds resulting losses. At the same time, because the maximum the Fund has at risk is the cost of the option, purchasing put options does not eliminate the potential for the Fund to profit from an increase in the value of the underlying portfolio securities. The Fund may write put options to earn additional income in the form of option premiums if it expects the price of the underlying instrument to remain stable or rise during the option period so that the option will not be exercised. The risk in this strategy is that the price of the underlying securities may decline by an amount greater than the premium received. Put options written are reported as a liability in the Statement of Assets and Liabilities. Realized and unrealized gains and losses on put options purchased and put options written are included in the Statement of Operations as Net realized gain (loss) from and Change in net unrealized appreciation (depreciation) of Investment securities and Option contracts written, respectively. A risk in buying an option is that the Fund pays a premium whether or not the option is exercised. In addition, there can be no assurance that a liquid secondary market will exist for any option purchased.
| N. | Swap Agreements - The Fund may enter into various swap transactions, including interest rate, total return, index, currency and credit default swap contracts (“CDS”) for investment purposes or to manage interest rate, currency or credit risk. Such transactions are agreements between Counterparties. A swap agreement may be negotiated bilaterally and traded over-the-counter (“OTC”) between two parties (“uncleared/ OTC”) or, in some instances, must be transacted |
| | |
| 22 | | Invesco High Yield Fund |
| | through a future commission merchant ("FCM") and cleared through a clearinghouse that serves as a central Counterparty (centrally cleared swap). These agreements may contain among other conditions, events of default and termination events, and various covenants and representations such as provisions that require the Fund to maintain a pre-determined level of net assets, and/ or provide limits regarding the decline of the Funds NAV over specific periods of time. If the Fund were to trigger such provisions and have open derivative positions at that time, the Counterparty may be able to terminate such agreement and request immediate payment in an amount equal to the net liability positions, if any. |
Interest rate, total return, index, and currency swap agreements are two-party contracts entered into primarily to exchange the returns (or differentials in rates of returns) earned or realized on particular predetermined investments or instruments. The gross returns to be exchanged or "swapped" between the parties are calculated with respect to a notional amount, i.e., the return on or increase in value of a particular dollar amount invested at a particular interest rate or return of an underlying asset, in a particular foreign currency, or in a "basket" of securities representing a particular index.
In a centrally cleared swap, the Fund’s ultimate Counterparty is a central clearinghouse. The Fund initially will enter into centrally cleared swaps through an executing broker. When a fund enters into a centrally cleared swap, it must deliver to the central Counterparty (via the FCM) an amount referred to as "initial margin." Initial margin requirements are determined by the central Counterparty, but an FCM may require additional initial margin above the amount required by the central Counterparty. Initial margin deposits required upon entering into centrally cleared swaps are satisfied by cash or securities as collateral at the FCM. Securities deposited as initial margin are designated on the Schedule of Investments and cash deposited is recorded on the Statement of Assets and Liabilities. During the term of a cleared swap agreement, a "variation margin" amount may be required to be paid by the Fund or may be received by the Fund, based on the daily change in price of the underlying reference instrument subject to the swap agreement and is recorded as a receivable or payable for variation margin in the Statement of Assets and Liabilities until the centrally cleared swap is terminated at which time a realized gain or loss is recorded.
A CDS is an agreement between Counterparties to exchange the credit risk of an issuer. A buyer of a CDS is said to buy protection by paying a fixed payment over the life of the agreement and in some situations an upfront payment to the seller of the CDS. If a defined credit event occurs (such as payment default or bankruptcy), the Fund as a protection buyer would cease paying its fixed payment, the Fund would deliver eligible bonds issued by the reference entity to the seller, and the seller would pay the full notional value, or the "par value", of the referenced obligation to the Fund. A seller of a CDS is said to sell protection and thus would receive a fixed payment over the life of the agreement and an upfront payment, if applicable. If a credit event occurs, the Fund as a protection seller would cease to receive the fixed payment stream, the Fund would pay the buyer "par value" or the full notional value of the referenced obligation, and the Fund would receive the eligible bonds issued by the reference entity. In turn, these bonds may be sold in order to realize a recovery value. Alternatively, the seller of the CDS and its Counterparty may agree to net the notional amount and the market value of the bonds and make a cash payment equal to the difference to the buyer of protection. If no credit event occurs, the Fund receives the fixed payment over the life of the agreement. As the seller, the Fund would effectively add leverage to its portfolio because, in addition to its total net assets, the Fund would be subject to investment exposure on the notional amount of the CDS. In connection with these agreements, cash and securities may be identified as collateral in accordance with the terms of the respective swap agreements to provide assets of value and recourse in the event of default under the swap agreement or bankruptcy/insolvency of a party to the swap agreement. If a Counterparty becomes bankrupt or otherwise fails to perform its obligations due to financial difficulties, the Fund may experience significant delays in obtaining any recovery in a bankruptcy or other reorganization proceeding. The Fund may obtain only limited recovery or may obtain no recovery in such circumstances. The Funds maximum risk of loss from Counterparty risk, either as the protection seller or as the protection buyer, is the value of the contract. The risk may be mitigated by having a master netting arrangement between the Fund and the Counterparty and by the designation of collateral by the Counterparty to cover the Funds exposure to the Counterparty.
Implied credit spreads represent the current level at which protection could be bought or sold given the terms of the existing CDS contract and serve as an indicator of the current status of the payment/performance risk of the CDS. An implied spread that has widened or increased since entry into the initial contract may indicate a deteriorating credit profile and increased risk of default for the reference entity. A declining or narrowing spread may indicate an improving credit profile or decreased risk of default for the reference entity. Alternatively, credit spreads may increase or decrease reflecting the general tolerance for risk in the credit markets.
An interest rate swap is an agreement between Counterparties pursuant to which the parties exchange a floating rate payment for a fixed rate payment based on a specified notional amount.
Changes in the value of centrally cleared and OTC swap agreements are recognized as unrealized gains (losses) in the Statement of Operations by marking to market on a daily basis to reflect the value of the swap agreement at the end of each trading day. Payments received or paid at the beginning of the agreement are reflected as such on the Statement of Assets and Liabilities and may be referred to as upfront payments. The Fund accrues for the fixed payment stream and amortizes upfront payments, if any, on swap agreements on a daily basis with the net amount, recorded as a component of realized gain (loss) on the Statement of Operations. A liquidation payment received or made at the termination of a swap agreement is recorded as realized gain (loss) on the Statement of Operations. The Fund segregates cash or liquid securities having a value at least equal to the amount of the potential obligation of a Fund under any swap transaction. Cash held as collateral is recorded as deposits with brokers on the Statement of Assets and Liabilities. Entering into these agreements involves, to varying degrees, lack of liquidity and elements of credit, market, and Counterparty risk in excess of amounts recognized on the Statement of Assets and Liabilities. Such risks involve the possibility that a swap is difficult to sell or liquidate; the Counterparty does not honor its obligations under the agreement and unfavorable interest rates and market fluctuations. It is possible that developments in the swaps market, including potential government regulation, could adversely affect the Funds ability to terminate existing swap agreements or to realize amounts to be received under such agreements. Additionally, an International Swaps and Derivatives Association Master Agreement (ISDA Master Agreement) includes credit related contingent features which allow Counterparties to OTC derivatives to terminate derivative contracts prior to maturity in the event that, for example, the Funds net assets decline by a stated percentage or the Fund fails to meet the terms of its ISDA Master Agreement, which would cause the Fund to accelerate payment of any net liability owed to the Counterparty. A short position in a security poses more risk than holding the same security long. As there is no limit on how much the price of the security can increase, the Funds exposure is unlimited.
Notional amounts of each individual credit default swap agreement outstanding as of February 28, 2022, if any, for which the Fund is the seller of protection are disclosed in the open swap agreements table. These potential amounts would be partially offset by any recovery values of the respective referenced obligations, upfront payments received upon entering into the agreement, or net amounts received from the settlement of buy protection credit default swap agreements entered into by the Fund for the same referenced entity or entities.
| O. | Bank Loan Risk - Although the resale, or secondary market for floating rate loans has grown substantially over the past decade, both in overall size and number of market participants, there is no organized exchange or board of trade on which floating rate loans are traded. Instead, the secondary market for floating rate loans is a private, unregulated interdealer or interbank resale market. Such a market may therefore be subject to irregular trading activity, wide bid/ask spreads, and extended trade settlement periods, which may impair the Fund’s ability to sell bank loans within its desired time frame or at an acceptable price and its ability to accurately value existing and prospective investments. Extended trade settlement periods may result in cash not being immediately available to the Fund. As a result, the Fund may have to sell other investments or engage in borrowing transactions to raise cash to meet its obligations. Similar to other asset classes, bank loan funds may be exposed to counterparty credit risk, or the risk than an entity with which the Fund has unsettled or open transactions may fail to or be unable to perform on its commitments. The Fund seeks to manage counterparty credit risk by entering into transactions only with counterparties that it believes have the financial resources to honor their obligations and by monitoring the financial stability of those counterparties. |
| P. | LIBOR Risk - The Fund may have investments in financial instruments that utilize the London Interbank Offered Rate (“LIBOR”) as the reference or benchmark rate for variable interest rate calculations. LIBOR is intended to measure the rate generally at which banks can lend and borrow from one another in the relevant currency on an unsecured basis. The UK Financial Conduct Authority (FCA), the regulator that oversees LIBOR, announced that the majority of LIBOR rates would |
| | |
| 23 | | Invesco High Yield Fund |
| | cease to be published or would no longer be representative on January 1, 2022. Although the publication of most LIBOR rates ceased at the end of 2021, a selection of widely used USD LIBOR rates continues to be published until June 2023 to allow for an orderly transition away from these rates. |
There remains uncertainty and risks relating to the continuing LIBOR transition and its effects on the Fund and the instruments in which the Fund invests. There can be no assurance that the composition or characteristics of any alternative reference rates (“ARRs”) or financial instruments in which the Fund invests that utilize ARRs will be similar to or produce the same value or economic equivalence as LIBOR or that these instruments will have the same volume or liquidity. Additionally, there remains uncertainty and risks relating to certain “legacy” USD LIBOR instruments that were issued or entered into before December 31, 2021 and the process by which a replacement interest rate will be identified and implemented into these instruments when USD LIBOR is ultimately discontinued. The effects of such uncertainty and risks in “legacy” USD LIBOR instruments held by the Fund could result in losses to the Fund.
| Q. | Leverage Risk - Leverage exists when the Fund can lose more than it originally invests because it purchases or sells an instrument or enters into a transaction without investing an amount equal to the full economic exposure of the instrument or transaction. |
| R. | Other Risks - The current low interest rate environment was created in part by the Federal Reserve Board (FRB) and certain foreign central banks keeping the federal funds and equivalent foreign rates near historical lows. Increases in the federal funds and equivalent foreign rates may expose fixed income markets to heightened volatility and reduced liquidity for certain fixed income investments, particularly those with longer maturities. In addition, decreases in fixed income dealer market-making capacity may also potentially lead to heightened volatility and reduced liquidity in the fixed income markets. As a result, the value of the Fund’s investments and share price may decline. Changes in central bank policies could also result in higher than normal shareholder redemptions, which could potentially increase portfolio turnover and the Fund’s transaction costs. Additionally, from time to time, uncertainty regarding the status of negotiations in the U. S. Government to increase the statutory debt limit, commonly called the “debt ceiling”, could increase the risk that the U.S. Government may default on payments on certain U.S. Government securities, cause the credit rating of the U.S. Government to be downgraded, increase volatility in the stock and bond markets, result in higher interest rates, reduce prices of U.S. Treasury securities, and/or increase the costs of various kinds of debt. If a U.S. Government- sponsored entity is negatively impacted by legislative or regulatory action, is unable to meet its obligations, or its creditworthiness declines, the performance of a Fund that holds securities of that entity will be adversely impacted. |
The Fund may invest in lower-quality debt securities, i.e., junk bonds. Investments in lower-rated securities or unrated securities of comparable quality tend to be more sensitive to economic conditions than higher rated securities. Junk bonds involve a greater risk of default by the issuer because such securities are generally unsecured and are often subordinated to other creditors claims. Junk bonds are less liquid than investment grade debt securities and their prices tend to be more volatile.
| S. | COVID-19 Risk - The COVID-19 strain of coronavirus has resulted in instances of market closures and dislocations, extreme volatility, liquidity constraints and increased trading costs. Efforts to contain its spread have resulted in travel restrictions, disruptions of healthcare systems, business operations (including business closures) and supply chains, layoffs, lower consumer demand and employee availability, and defaults and credit downgrades, among other significant economic impacts that have disrupted global economic activity across many industries. Such economic impacts may exacerbate other pre-existing political, social and economic risks locally or globally and cause general concern and uncertainty. |
The full economic impact and ongoing effects of COVID-19 (or other future epidemics or pandemics) at the macro-level and on individual businesses are unpredictable and may result in significant and prolonged effects on the Funds performance.
NOTE 2–Advisory Fees and Other Fees Paid to Affiliates
The Trust has entered into a master investment advisory agreement with the Adviser. Under the terms of the investment advisory agreement, the Fund accrues daily and pays monthly an advisory fee to the Adviser based on the annual rate of the Funds average daily net assets as follows:
| | | | |
| Average Daily Net Assets | | Rate | |
|
| |
First $200 million | | | 0.625% | |
|
| |
Next $300 million | | | 0.550% | |
|
| |
Next $500 million | | | 0.500% | |
|
| |
Over $1 billion | | | 0.450% | |
|
| |
For the year ended February 28, 2022, the effective advisory fee rate incurred by the Fund was 0.54%.
Under the terms of a master sub-advisory agreement between the Adviser and each of Invesco Asset Management Deutschland GmbH, Invesco Asset Management Limited, Invesco Asset Management (Japan) Limited, Invesco Hong Kong Limited, Invesco Senior Secured Management, Inc. and Invesco Canada Ltd. and separate sub-advisory agreements with Invesco Capital Management LLC and Invesco Asset Management (India) Private Limited (collectively, the “Affiliated Sub-Advisers”) the Adviser, not the Fund, will pay 40% of the fees paid to the Adviser to any such Affiliated Sub-Adviser(s) that provide(s) discretionary investment management services to the Fund based on the percentage of assets allocated to such Affiliated Sub-Adviser(s).
The Adviser has contractually agreed, through at least June 30, 2022, to waive advisory fees and/or reimburse expenses of all shares to the extent necessary to limit total annual fund operating expenses after fee waiver and/or expense reimbursement (excluding certain items discussed below) of Class A, Class C, Class Y, Investor Class, Class R5 and Class R6 shares to 1.50%, 2.25%, 1.25%, 1.50%, 1.25% and 1.25%, respectively, of the Funds average daily net assets (the “expense limits”). In determining the Advisers obligation to waive advisory fees and/or reimburse expenses, the following expenses are not taken into account, and could cause the total annual fund operating expenses after fee waiver and/or reimbursement to exceed the numbers reflected above: (1) interest; (2) taxes; (3) dividend expense on short sales; (4) extraordinary or non-routine items, including litigation expenses; and (5) expenses that the Fund has incurred but did not actually pay because of an expense offset arrangement. Unless Invesco continues the fee waiver agreement, it will terminate on June 30, 2022. During its term, the fee waiver agreement cannot be terminated or amended to increase the expense limits or reduce the advisory fee waivers without approval of the Board of Trustees. The Adviser did not waive fees and/or reimburse expenses during the period under this expense limit.
Further, the Adviser has contractually agreed, through at least June 30, 2023, to waive the advisory fee payable by the Fund in an amount equal to 100% of the net advisory fees the Adviser receives from the affiliated money market funds on investments by the Fund of uninvested cash (excluding investments of cash collateral from securities lending) in such affiliated money market funds.
For the year ended February 28, 2022, the Adviser waived advisory fees of $9,065.
The Trust has entered into a master administrative services agreement with Invesco pursuant to which the Fund has agreed to pay Invesco for certain administrative costs incurred in providing accounting services to the Fund. For the year ended February 28, 2022, expenses incurred under the agreement are shown in the Statement of Operations as Administrative services fees. Invesco has entered into a sub-administration agreement whereby State Street Bank and Trust Company (SSB) serves as fund accountant and provides certain administrative services to the Fund. Pursuant to a custody agreement with the Trust on behalf of the Fund, SSB also serves as the Funds custodian.
The Trust has entered into a transfer agency and service agreement with Invesco Investment Services, Inc. (IIS) pursuant to which the Fund has agreed to pay IIS a fee for providing transfer agency and shareholder services to the Fund and reimburse IIS for certain expenses incurred by IIS in the course of providing such services. IIS may make payments to intermediaries that provide omnibus account services, sub-accounting services and/or networking services. All fees payable by IIS to
| | |
| 24 | | Invesco High Yield Fund |
intermediaries that provide omnibus account services or sub-accounting services are charged back to the Fund, subject to certain limitations approved by the Trusts Board of Trustees. For the year ended February 28, 2022, expenses incurred under the agreement are shown in the Statement of Operations as Transfer agent fees.
The Trust has entered into master distribution agreements with Invesco Distributors, Inc. ("IDI") to serve as the distributor for the Class A, Class C, Class R, Class Y, Investor Class, Class R5 and Class R6 shares of the Fund. The Trust has adopted plans pursuant to Rule 12b-1 under the 1940 Act with respect to the Funds Class A, Class C, Class R and Investor Class shares (collectively, the "Plans"). The Fund, pursuant to the Plans, pays IDI compensation at the annual rate of 0.25% of the Funds average daily net assets of Class A shares, 1.00% of the average daily net assets of Class C shares and 0.50% of the average daily net assets of Class R shares. The Fund, pursuant to the Investor Class Plan, reimburses IDI for its allocated share of expenses incurred pursuant to the Investor Class Plan for the period, up to a maximum annual rate of 0.25% of the average daily net assets of Investor Class shares. The fees are accrued daily and paid monthly. Of the Plan payments, up to 0.25% of the average daily net assets of each class of shares may be paid to furnish continuing personal shareholder services to customers who purchase and own shares of such classes. Any amounts not paid as a service fee under the Plans would constitute an asset-based sales charge. Rules of the Financial Industry Regulatory Authority ("FINRA") impose a cap on the total sales charges, including asset-based sales charges, that may be paid by any class of shares of the Fund. For the year ended February 28, 2022, expenses incurred under the Plans are shown in the Statement of Operations as Distribution fees.
Front-end sales commissions and CDSC (collectively, the "sales charges") are not recorded as expenses of the Fund. Front-end sales commissions are deducted from proceeds from the sales of Fund shares prior to investment in Class A shares of the Fund. CDSC are deducted from redemption proceeds prior to remittance to the shareholder. During the year ended February 28, 2022, IDI advised the Fund that IDI retained $60,479 in front-end sales commissions from the sale of Class A shares and $1,761 and $1,005 from Class A and Class C shares, respectively, for CDSC imposed upon redemptions by shareholders.
Certain officers and trustees of the Trust are officers and directors of the Adviser, IIS and/or IDI.
NOTE 3–Additional Valuation Information
GAAP defines fair value as the price that would be received to sell an asset or paid to transfer a liability in an orderly transaction between market participants at the measurement date, under current market conditions. GAAP establishes a hierarchy that prioritizes the inputs to valuation methods, giving the highest priority to readily available unadjusted quoted prices in an active market for identical assets (Level 1) and the lowest priority to significant unobservable inputs (Level 3), generally when market prices are not readily available or are unreliable. Based on the valuation inputs, the securities or other investments are tiered into one of three levels. Changes in valuation methods may result in transfers in or out of an investments assigned level:
| | |
| Level 1 - | | Prices are determined using quoted prices in an active market for identical assets. |
| Level 2 - | | Prices are determined using other significant observable inputs. Observable inputs are inputs that other market participants may use in pricing a security. These may include quoted prices for similar securities, interest rates, prepayment speeds, credit risk, yield curves, loss severities, default rates, discount rates, volatilities and others. |
| Level 3 - | | Prices are determined using significant unobservable inputs. In situations where quoted prices or observable inputs are unavailable (for example, when there is little or no market activity for an investment at the end of the period), unobservable inputs may be used. Unobservable inputs reflect the Funds own assumptions about the factors market participants would use in determining fair value of the securities or instruments and would be based on the best available information. |
The following is a summary of the tiered valuation input levels, as of February 28, 2022. The level assigned to the securities valuations may not be an indication of the risk or liquidity associated with investing in those securities. Because of the inherent uncertainties of valuation, the values reflected in the financial statements may materially differ from the value received upon actual sale of those investments.
| | | | | | | | | | | | | | | | |
| | | Level 1 | | | Level 2 | | | Level 3 | | | Total | |
|
| |
Investments in Securities | | | | | | | | | | | | | | | | |
|
| |
U.S. Dollar Denominated Bonds & Notes | | $ | – | | | $ | 792,033,388 | | | $ | – | | | $ | 792,033,388 | |
|
| |
Variable Rate Senior Loan Interests | | | – | | | | 50,215,374 | | | | 9,276,450 | | | | 59,491,824 | |
|
| |
Common Stocks & Other Equity Interests | | | 2,559,596 | | | | – | | | | 0 | | | | 2,559,596 | |
|
| |
Non-U.S. Dollar Denominated Bonds & Notes | | | – | | | | 2,337,586 | | | | – | | | | 2,337,586 | |
|
| |
U.S. Treasury Securities | | | – | | | | 1,688,758 | | | | – | | | | 1,688,758 | |
|
| |
Money Market Funds | | | 13,471,580 | | | | 3,032,082 | | | | – | | | | 16,503,662 | |
|
| |
Options Purchased | | | 1,623,008 | | | | – | | | | – | | | | 1,623,008 | |
|
| |
Total Investments in Securities | | | 17,654,184 | | | | 849,307,188 | | | | 9,276,450 | | | | 876,237,822 | |
|
| |
Other Investments - Assets* | | | | | | | | | | | | | | | | |
|
| |
Forward Foreign Currency Contracts | | | – | | | | 39,707 | | | | – | | | | 39,707 | |
|
| |
Other Investments - Liabilities* | | | | | | | | | | | | | | | | |
|
| |
Options Written | | | (919,928 | ) | | | – | | | | – | | | | (919,928 | ) |
|
| |
Total Other Investments | | | (919,928 | ) | | | 39,707 | | | | – | | | | (880,221 | ) |
|
| |
Total Investments | | $ | 16,734,256 | | | $ | 849,346,895 | | | $ | 9,276,450 | | | $ | 875,357,601 | |
|
| |
| * | Forward foreign currency contracts are valued at unrealized appreciation. Options written are shown at value. |
A reconciliation of Level 3 investments is presented when the Fund had a significant amount of Level 3 investments at the beginning and/or end of the reporting period in relation to net assets.
The following is a reconciliation of the fair valuations using significant unobservable inputs (Level 3) during the year ended February 28, 2022:
| | | | | | | | | | | | | | | | | | | | | | | | | | | | | | | | | | | | | | | | | | | | | |
| | | Value
02/28/21 | | Purchases
at Cost | | Proceeds
from Sales | | Accrued
Discounts/
Premiums | | Realized
Gain | | Change in
Unrealized
Appreciation
(Depreciation) | | Transfers
into
Level 3 | | Transfers
out of
Level 3 | | Value
02/28/22 |
Variable Rate Senior Loan Interests | | | $ | 4,633,332 | | | | $ | 4,855,600 | | | | $ | (47,567 | ) | | | $ | – | | | | $ | 476 | | | | $ | (165,391 | ) | | | $ | – | | | | $ | – | | | | $ | 9,276,450 | |
Common Stocks & Other Equity Interests | | | | 0 | | | | | – | | | | | – | | | | | – | | | | | – | | | | | 0 | | | | | – | | | | | – | | | | | 0 | |
U.S. Dollar Denominated Bonds & Notes | | | | 0 | | | | | – | | | | | (2,111 | ) | | | | – | | | | | 2,111 | | | | | 0 | | | | | – | | | | | – | | | | | – | |
Total | | | $ | 4,633,332 | | | | $ | 4,855,600 | | | | $ | (49,678 | ) | | | $ | – | | | | $ | 2,587 | | | | $ | (165,391 | ) | | | $ | – | | | | $ | – | | | | $ | 9,276,450 | |
| | |
| 25 | | Invesco High Yield Fund |
Securities determined to be Level 3 at the end of the reporting period were valued primarily by utilizing quotes from a third-party vendor pricing service. A significant change in third-party pricing information could result in a significantly lower or higher value in Level 3 investments.
The following table summarizes the valuation techniques and significant unobservable inputs used in determining fair value measurements for those investments classified as level 3 at period end:
| | | | | | | | | | | | |
| | | Fair Value
at 02/28/22 | | Valuation
Technique | | Unobservable
Inputs | | Range of
Unobservable
Inputs | | Unobservable
Input Used | | |
| Schweitzer-Mauduit International, Inc. (SWM International), Term Loan B | | $9,276,450 | | Valuation Service | | N/A | | N/A | | N/A | | (a) |
| (a) | Securities classified as Level 3 whose unadjusted values were provided by a pricing service and for which such inputs are unobservable. The Adviser periodically reviews pricing vendor methodologies and inputs to confirm they are determined using unobservable inputs and have been appropriately classified. Such securities’ fair valuations could change significantly based on changes in unobservable inputs used by the pricing service. |
NOTE 4–Derivative Investments
The Fund may enter into an International Swaps and Derivatives Association Master Agreement (ISDA Master Agreement) under which a fund may trade OTC derivatives. An OTC transaction entered into under an ISDA Master Agreement typically involves a collateral posting arrangement, payment netting provisions and close-out netting provisions. These netting provisions allow for reduction of credit risk through netting of contractual obligations. The enforceability of the netting provisions of the ISDA Master Agreement depends on the governing law of the ISDA Master Agreement, among other factors.
For financial reporting purposes, the Fund does not offset OTC derivative assets or liabilities that are subject to ISDA Master Agreements in the Statement of Assets and Liabilities.
Value of Derivative Investments at Period-End
The table below summarizes the value of the Funds derivative investments, detailed by primary risk exposure, held as of February 28, 2022:
| | | | | | | | | | | | |
| | | Value | |
| Derivative Assets | | Currency
Risk | | | Equity
Risk | | | Total | |
Unrealized appreciation on forward foreign currency contracts outstanding | | $ | 39,707 | | | $ | - | | | $ | 39,707 | |
Options purchased, at value – Exchange-Traded(a) | | | - | | | | 1,623,008 | | | | 1,623,008 | |
Total Derivative Assets | | | 39,707 | | | | 1,623,008 | | | | 1,662,715 | |
Derivatives not subject to master netting agreements | | | - | | | | (1,623,008 | ) | | | (1,623,008 | ) |
Total Derivative Assets subject to master netting agreements | | $ | 39,707 | | | $ | - | | | $ | 39,707 | |
| (a) | Options purchased, at value as reported in the Schedule of Investments. |
| | | | | | | | | | |
| | | Value | |
| Derivative Liabilities | | Currency
Risk | | Equity
Risk | | | Total | |
Options written, at value – Exchange-Traded | | $- | | $ | (919,928 | ) | | $ | (919,928 | ) |
Derivatives not subject to master netting agreements | | - | | | 919,928 | | | | 919,928 | |
Total Derivative Liabilities subject to master netting agreements | | $- | | $ | - | | | $ | - | |
Offsetting Assets and Liabilities
The table below reflects the Funds exposure to Counterparties subject to either an ISDA Master Agreement or other agreement for OTC derivative transactions as of February 28, 2022.
| | | | | | | | | | |
| | | Financial
Derivative Assets | | | | Collateral
(Received)/Pledged | | |
| Counterparty | | Forward Foreign
Currency Contracts | | Net Value of
Derivatives | | Non-Cash | | Cash | | Net
Amount |
Goldman Sachs International | | $39,707 | | $39,707 | | $– | | $– | | $39,707 |
Effect of Derivative Investments for the year ended February 28, 2022
The table below summarizes the gains (losses) on derivative investments, detailed by primary risk exposure, recognized in earnings during the period:
| | | | | | | | | | | | | | | | | | | | |
| | | Location of Gain (Loss) on
Statement of Operations | |
| | | Credit
Risk | | | Currency
Risk | | | Equity
Risk | | | Interest
Rate Risk | | | Total | |
Realized Gain (Loss): | | | | | | | | | | | | | | | | | | | | |
Forward foreign currency contracts | | $ | - | | | $ | 668,014 | | | $ | - | | | $ | - | | | $ | 668,014 | |
Futures contracts | | | - | | | | - | | | | - | | | | (254,005 | ) | | | (254,005 | ) |
Options purchased(a) | | | - | | | | - | | | | 1,309,766 | | | | - | | | | 1,309,766 | |
Options written | | | - | | | | - | | | | (665,109 | ) | | | - | | | | (665,109 | ) |
Swap agreements | | | (198,840 | ) | | | - | | | | - | | | | - | | | | (198,840 | ) |
| | |
| 26 | | Invesco High Yield Fund |
| | | | | | | | | | | | | | | | | | | | |
| | | Location of Gain (Loss) on
Statement of Operations | |
| | | Credit
Risk | | | Currency
Risk | | | Equity
Risk | | | Interest
Rate Risk | | | Total | |
Change in Net Unrealized Appreciation (Depreciation): | | | | | | | | | | | | | | | | | | | | |
Forward foreign currency contracts | | $ | - | | | $ | 10,221 | | | $ | - | | | $ | - | | | $ | 10,221 | |
Options purchased(a) | | | - | | | | - | | | | 467,237 | | | | - | | | | 467,237 | |
Options written | | | - | | | | - | | | | (445,088 | ) | | | - | | | | (445,088 | ) |
Total | | $ | (198,840 | ) | | $ | 678,235 | | | $ | 666,806 | | | $ | (254,005 | ) | | $ | 892,196 | |
| (a) | Options purchased are included in the net realized gain (loss) from investment securities and the change in net unrealized appreciation (depreciation) on investment securities. |
The table below summarizes the average notional value of derivatives held during the period.
| | | | | | | | | | | | | | | | | | | | |
| | | Forward
Foreign Currency
Contracts | | | Futures
Contracts | | | Equity
Options
Purchased | | | Equity
Options
Written | | | Swap
Agreements | |
Average notional value | | $ | 12,974,911 | | | $ | 13,280,313 | | | $ | 10,305,067 | | | $ | 10,050,625 | | | $ | 37,500,000 | |
Average contracts | | | – | | | | – | | | | 4,390 | | | | 3,758 | | | | – | |
NOTE 5–Expense Offset Arrangement(s)
The expense offset arrangement is comprised of transfer agency credits which result from balances in demand deposit accounts used by the transfer agent for clearing shareholder transactions. For the year ended February 28, 2022, the Fund received credits from this arrangement, which resulted in the reduction of the Funds total expenses of $921.
NOTE 6–Trustees and Officers Fees and Benefits
Trustees and Officers Fees and Benefits include amounts accrued by the Fund to pay remuneration to certain Trustees and Officers of the Fund. Trustees have the option to defer compensation payable by the Fund, and Trustees and Officers Fees and Benefits also include amounts accrued by the Fund to fund such deferred compensation amounts. Those Trustees who defer compensation have the option to select various Invesco Funds in which their deferral accounts shall be deemed to be invested. Finally, certain current Trustees were eligible to participate in a retirement plan that provided for benefits to be paid upon retirement to Trustees over a period of time based on the number of years of service. The Fund may have certain former Trustees who also participate in a retirement plan and receive benefits under such plan. Trustees and Officers Fees and Benefits include amounts accrued by the Fund to fund such retirement benefits. Obligations under the deferred compensation and retirement plans represent unsecured claims against the general assets of the Fund.
NOTE 7–Cash Balances
The Fund may borrow for leveraging in an amount up to 5% of the Funds total assets (excluding the amount borrowed) at the time the borrowing is made. In doing so, the Fund is permitted to temporarily carry a negative or overdrawn balance in its account with SSB, the custodian bank. Such balances, if any at period end, are shown in the Statement of Assets and Liabilities under the payable caption Amount due custodian. To compensate the custodian bank for such overdrafts, the overdrawn Fund may either (1) leave funds as a compensating balance in the account so the custodian bank can be compensated by earning the additional interest; or (2) compensate by paying the custodian bank at a rate agreed upon by the custodian bank and Invesco, not to exceed the contractually agreed upon rate. The Fund may not purchase additional securities when any borrowings from banks or broker-dealers exceed 5% of the Funds total assets, or when any borrowings from an Invesco Fund are outstanding.
NOTE 8–Distributions to Shareholders and Tax Components of Net Assets
Tax Character of Distributions to Shareholders Paid During the Fiscal Years Ended February 28, 2022 and 2021:
| | | | | | | | |
| | | 2022 | | | 2021 | |
Ordinary income* | | $ | 42,368,676 | | | $ | 55,998,364 | |
Return of capital | | | – | | | | 2,732,118 | |
Total distributions | | $ | 42,368,676 | | | $ | 58,730,482 | |
| * | Includes short-term capital gain distributions, if any. |
Tax Components of Net Assets at Period-End:
| | | | |
| | | 2022 | |
Undistributed ordinary income | | $ | 425,687 | |
Net unrealized appreciation (depreciation) – investments | | | (34,579,904 | ) |
Net unrealized appreciation (depreciation) – foreign currencies | | | (5,363 | ) |
Temporary book/tax differences | | | (231,803 | ) |
Capital loss carryforward | | | (223,066,021 | ) |
Shares of beneficial interest | | | 1,143,277,498 | |
Total net assets | | $ | 885,820,094 | |
| | |
| 27 | | Invesco High Yield Fund |
The difference between book-basis and tax-basis unrealized appreciation (depreciation) is due to differences in the timing of recognition of gains and losses on investments for tax and book purposes. The Funds net unrealized appreciation (depreciation) difference is attributable primarily to wash sales, amortization and accretion on debt securities.
The temporary book/tax differences are a result of timing differences between book and tax recognition of income and/or expenses. The Funds temporary book/tax differences are the result of the trustee deferral of compensation and retirement plan benefits.
Capital loss carryforward is calculated and reported as of a specific date. Results of transactions and other activity after that date may affect the amount of capital loss carryforward actually available for the Fund to utilize. The ability to utilize capital loss carryforward in the future may be limited under the Internal Revenue Code and related regulations based on the results of future transactions.
The Fund has a capital loss carryforward as of February 28, 2022, as follows:
| | | | | | | | | | | | | | |
| Capital Loss Carryforward* | |
| Expiration | | | | Short-Term | | | Long-Term | | | Total | |
Not subject to expiration | | | | $ | 54,411,386 | | | $ | 168,654,635 | | | $ | 223,066,021 | |
| * | Capital loss carryforward is reduced for limitations, if any, to the extent required by the Internal Revenue Code and may be further limited depending upon a variety of factors, including the realization of net unrealized gains or losses as of the date of any reorganization. |
NOTE 9–Investment Transactions
The aggregate amount of investment securities (other than short-term securities, U.S. Government obligations and money market funds, if any) purchased and sold by the Fund during the year ended February 28, 2022 was $801,728,460 and $838,347,251, respectively. Cost of investments, including any derivatives, on a tax basis includes the adjustments for financial reporting purposes as of the most recently completed federal income tax reporting period-end.
| | | | |
| Unrealized Appreciation (Depreciation) of Investments on a Tax Basis | |
Aggregate unrealized appreciation of investments | | $ | 12,342,217 | |
Aggregate unrealized (depreciation) of investments | | | (46,922,121 | ) |
Net unrealized appreciation (depreciation) of investments | | $ | (34,579,904 | ) |
Cost of investments for tax purposes is $909,937,505.
NOTE 10–Reclassification of Permanent Differences
Primarily as a result of differing book/tax treatment of foreign currency transactions, amortization and accretion on debt securities, on February 28, 2022, undistributed net investment income was increased by $5,999,674, undistributed net realized gain (loss) was decreased by $6,031,822 and shares of beneficial interest was increased by $32,148. This reclassification had no effect on the net assets of the Fund.
NOTE 11–Share Information
| | | | | | | | | | | | | | | | |
| | | Summary of Share Activity | |
| | | Year ended
February 28, 2022(a) | | | Year ended
February 28, 2021 | |
| | | Shares | | | Amount | | | Shares | | | Amount | |
Sold: | | | | | | | | | | | | | | | | |
Class A | | | 36,290,763 | | | $ | 143,829,705 | | | | 29,195,845 | | | $ | 110,136,013 | |
Class C | | | 1,503,055 | | | | 5,955,768 | | | | 2,347,529 | | | | 8,647,952 | |
Class Y | | | 5,913,568 | | | | 23,509,650 | | | | 11,252,740 | | | | 40,046,832 | |
Investor Class | | | 16,538,567 | | | | 65,705,922 | | | | 9,686,952 | | | | 36,495,466 | |
Class R5 | | | 1,438,848 | | | | 5,659,073 | | | | 3,319,296 | | | | 12,755,668 | |
Class R6 | | | 8,860,823 | | | | 35,102,627 | | | | 8,091,930 | | | | 30,114,155 | |
| | | | |
Issued as reinvestment of dividends: | | | | | | | | | | | | | | | | |
Class A | | | 5,564,336 | | | | 21,993,448 | | | | 7,484,797 | | | | 28,184,475 | |
Class C | | | 160,718 | | | | 633,994 | | | | 318,397 | | | | 1,192,841 | |
Class Y | | | 403,328 | | | | 1,598,498 | | | | 670,224 | | | | 2,521,039 | |
Investor Class | | | 686,860 | | | | 2,713,877 | | | | 989,542 | | | | 3,722,290 | |
Class R5 | | | 422,999 | | | | 1,667,465 | | | | 732,116 | | | | 2,735,497 | |
Class R6 | | | 1,052,348 | | | | 4,156,051 | | | | 2,060,063 | | | | 7,624,253 | |
| | | | |
Automatic conversion of Class C shares to Class A shares: | | | | | | | | | | | | | | | | |
Class A | | | 555,275 | | | | 2,198,379 | | | | 1,947,548 | | | | 7,557,588 | |
Class C | | | (556,681 | ) | | | (2,198,379 | ) | | | (1,949,808 | ) | | | (7,557,588 | ) |
| | |
| 28 | | Invesco High Yield Fund |
| | | | | | | | | | | | | | | | |
| | | Summary of Share Activity | |
|
| |
| | | Year ended | | | Year ended | |
| | | February 28, 2022(a) | | | February 28, 2021 | |
| | | Shares | | | Amount | | | Shares | | | Amount | |
| | | | |
Reacquired: | | | | | | | | | | | | | | | | |
Class A | | | (39,798,531 | ) | | $ | (157,660,559 | ) | | | (40,759,509 | ) | | $ | (152,688,579 | ) |
|
| |
Class C | | | (1,936,919 | ) | | | (7,646,527 | ) | | | (2,988,920 | ) | | | (11,097,749 | ) |
|
| |
Class Y | | | (7,264,253 | ) | | | (28,692,784 | ) | | | (14,458,192 | ) | | | (52,747,089 | ) |
|
| |
Investor Class | | | (18,134,741 | ) | | | (72,109,580 | ) | | | (12,042,096 | ) | | | (45,630,739 | ) |
|
| |
Class R5 | | | (4,263,782 | ) | | | (16,753,448 | ) | | | (8,360,698 | ) | | | (31,725,009 | ) |
|
| |
Class R6 | | | (9,793,276 | ) | | | (38,178,018 | ) | | | (37,259,909 | ) | | | (140,236,251 | ) |
|
| |
Net increase (decrease) in share activity | | | (2,356,695 | ) | | $ | (8,514,838 | ) | | | (39,722,153 | ) | | $ | (149,948,935 | ) |
|
| |
| (a) | There are entities that are record owners of more than 5% of the outstanding shares of the Fund and in the aggregate own 41% of the outstanding shares of the Fund. IDI has an agreement with these entities to sell Fund shares. The Fund, Invesco and/or Invesco affiliates may make payments to these entities, which are considered to be related to the Fund, for providing services to the Fund, Invesco and/or Invesco affiliates including but not limited to services such as securities brokerage, distribution, third party record keeping and account servicing. The Fund has no knowledge as to whether all or any portion of the shares owned of record by these entities are also owned beneficially. |
| | |
| 29 | | Invesco High Yield Fund |
Report of Independent Registered Public Accounting Firm
To the Board of Trustees of AIM Investment Securities Funds (Invesco Investment Securities Funds) and Shareholders of Invesco High Yield Fund
Opinion on the Financial Statements
We have audited the accompanying statement of assets and liabilities, including the schedule of investments, of Invesco High Yield Fund (one of the funds constituting AIM Investment Securities Funds (Invesco Investment Securities Funds), referred to hereafter as the “Fund”) as of February 28, 2022, the related statement of operations for the year ended February 28, 2022, the statement of changes in net assets for each of the two years in the period ended February 28, 2022, including the related notes, and the financial highlights for each of the five years in the period ended February 28, 2022 (collectively referred to as the “financial statements”). In our opinion, the financial statements present fairly, in all material respects, the financial position of the Fund as of February 28, 2022, the results of its operations for the year then ended, the changes in its net assets for each of the two years in the period ended February 28, 2022 and the financial highlights for each of the five years in the period ended February 28, 2022 in conformity with accounting principles generally accepted in the United States of America.
Basis for Opinion
These financial statements are the responsibility of the Funds management. Our responsibility is to express an opinion on the Funds financial statements based on our audits. We are a public accounting firm registered with the Public Company Accounting Oversight Board (United States) (PCAOB) and are required to be independent with respect to the Fund in accordance with the U.S. federal securities laws and the applicable rules and regulations of the Securities and Exchange Commission and the PCAOB.
We conducted our audits of these financial statements in accordance with the standards of the PCAOB. Those standards require that we plan and perform the audit to obtain reasonable assurance about whether the financial statements are free of material misstatement, whether due to error or fraud.
Our audits included performing procedures to assess the risks of material misstatement of the financial statements, whether due to error or fraud, and performing procedures that respond to those risks. Such procedures included examining, on a test basis, evidence regarding the amounts and disclosures in the financial statements. Our audits also included evaluating the accounting principles used and significant estimates made by management, as well as evaluating the overall presentation of the financial statements. Our procedures included confirmation of securities owned as of February 28, 2022 by correspondence with the custodian, transfer agent, brokers, and agent banks; when replies were not received from brokers or agent banks, we performed other auditing procedures. We believe that our audits provide a reasonable basis for our opinion.
/s/PricewaterhouseCoopers LLP
Houston, Texas
April 28, 2022
We have served as the auditor of one or more of the investment companies in the Invesco group of investment companies since at least 1995. We have not been able to determine the specific year we began serving as auditor.
| | |
| 30 | | Invesco High Yield Fund |
Calculating your ongoing Fund expenses
Example
As a shareholder of the Fund, you incur two types of costs: (1) transaction costs, which may include sales charges (loads) on purchase payments or contingent deferred sales charges on redemptions, if any; and (2) ongoing costs, including management fees, distribution and/or service (12b-1) fees, and other Fund expenses. This example is intended to help you understand your ongoing costs (in dollars) of investing in the Fund and to compare these costs with ongoing costs of investing in other mutual funds. The example is based on an investment of $1,000 invested at the beginning of the period and held for the entire period September 1, 2021 through February 28, 2022.
Actual expenses
The table below provides information about actual account values and actual expenses. You may use the information in this table, together with the amount you invested, to estimate the expenses that you paid over the period. Simply divide your account value by $1,000 (for example, an $8,600 account value divided by $1,000 = 8.6), then multiply the result by the number in the table under the heading entitled Actual Expenses Paid During Period to estimate the expenses you paid on your account during this period.
Hypothetical example for comparison purposes
The table below also provides information about hypothetical account values and hypothetical expenses based on the Funds actual expense ratio and an assumed rate of return of 5% per year before expenses, which is not the Funds actual return.
The hypothetical account values and expenses may not be used to estimate the actual ending account balance or expenses you paid for the period. You may use this information to compare the ongoing costs of investing in the Fund and other funds. To do so, compare this 5% hypothetical example with the 5% hypothetical examples that appear in the shareholder reports of the other funds.
Please note that the expenses shown in the table are meant to highlight your ongoing costs only and do not reflect any transaction costs, such as sales charges (loads) on purchase payments or contingent deferred sales charges on redemptions, if any. Therefore, the hypothetical information is useful in comparing ongoing costs only, and will not help you determine the relative total costs of owning different funds. In addition, if these transaction costs were included, your costs would have been higher.
| | | | | | | | | | | | |
| | | | | ACTUAL | | HYPOTHETICAL (5% annual return before expenses) | | |
| | | Beginning
Account Value
(09/01/21) | | Ending
Account Value
(02/28/22)1 | | Expenses
Paid During
Period2 | | Ending
Account Value
(02/28/22) | | Expenses
Paid During
Period2 | | Annualized
Expense
Ratio |
Class A | | $1,000.00 | | $973.80 | | $5.04 | | $1,019.69 | | $5.16 | | 1.03% |
Class C | | 1,000.00 | | 970.00 | | 8.69 | | 1,015.97 | | 8.90 | | 1.78 |
Class Y | | 1,000.00 | | 975.20 | | 3.82 | | 1,020.93 | | 3.91 | | 0.78 |
Investor Class | | 1,000.00 | | 976.20 | | 5.05 | | 1,019.69 | | 5.16 | | 1.03 |
Class R5 | | 1,000.00 | | 977.60 | | 3.53 | | 1,021.22 | | 3.61 | | 0.72 |
Class R6 | | 1,000.00 | | 978.00 | | 3.14 | | 1,021.62 | | 3.21 | | 0.64 |
| 1 | The actual ending account value is based on the actual total return of the Fund for the period September 1, 2021 through February 28, 2022, after actual expenses and will differ from the hypothetical ending account value which is based on the Fund’s expense ratio and a hypothetical annual return of 5% before expenses. |
| 2 | Expenses are equal to the Fund’s annualized expense ratio as indicated above multiplied by the average account value over the period, multiplied by 181/365 to reflect the most recent fiscal half year. |
| | |
| 31 | | Invesco High Yield Fund |
Tax Information
Form 1099-DIV, Form 1042-S and other year-end tax information provide shareholders with actual calendar year amounts that should be included in their tax returns. Shareholders should consult their tax advisers.
The following distribution information is being provided as required by the Internal Revenue Code or to meet a specific states requirement.
The Fund designates the following amounts or, if subsequently determined to be different, the maximum amount allowable for its fiscal year ended February 28, 2022:
| | | | |
Federal and State Income Tax | | | |
Qualified Dividend Income* | | | 1.13 | % |
Corporate Dividends Received Deduction* | | | 0.00 | % |
U.S. Treasury Obligations* | | | 0.00 | % |
Qualified Business Income* | | | 0.00 | % |
Business Interest Income* | | | 93.14 | % |
* The above percentages are based on ordinary income dividends paid to shareholders during the Funds fiscal year.
| | |
| 32 | | Invesco High Yield Fund |
Trustees and Officers
The address of each trustee and officer is AIM Investment Securities Funds (Invesco Investment Securities Funds) (the Trust), 11 Greenway Plaza, Suite 1000, Houston, Texas 77046-1173. The trustees serve for the life of the Trust, subject to their earlier death, incapacitation, resignation, retirement or removal as more specifically provided in the Trusts organizational documents. Each officer serves for a one year term or until their successors are elected and qualified. Column two below includes length of time served with predecessor entities, if any.
| | | | | | | | |
Name, Year of Birth and Position(s) Held with the Trust | | Trustee and/or Officer Since | | Principal Occupation(s) During Past 5 Years | | Number of Funds in Fund Complex Overseen by
Trustee | | Other Directorship(s) Held by Trustee During Past 5 Years |
| Interested Trustee | | | | | | | | |
Martin L. Flanagan1 - 1960 Trustee and Vice Chair | | 2007 | | Executive Director, Chief Executive Officer and President, Invesco Ltd. (ultimate parent of Invesco and a global investment management firm); Trustee and Vice Chair, The Invesco Funds; Vice Chair, Investment Company Institute; and Member of Executive Board, SMU Cox School of Business Formerly: Advisor to the Board, Invesco Advisers, Inc. (formerly known as Invesco Institutional (N.A.), Inc.); Chairman and Chief Executive Officer, Invesco Advisers, Inc. (registered investment adviser); Director, Chairman, Chief Executive Officer and President, Invesco Holding Company (US), Inc. (formerly IVZ Inc.) (holding company), Invesco Group Services, Inc. (service provider) and Invesco North American Holdings, Inc. (holding company); Director, Chief Executive Officer and President, Invesco Holding Company Limited (parent of Invesco and a global investment management firm); Director, Invesco Ltd.; Chairman, Investment Company Institute and President, Co-Chief Executive Officer, Co-President, Chief Operating Officer and Chief Financial Officer, Franklin Resources, Inc. (global investment management organization) | | 188 | | None |
| 1 | Mr. Flanagan is considered an interested person (within the meaning of Section 2(a)(19) of the 1940 Act) of the Trust because he is an officer of the Adviser to the Trust, and an officer and a director of Invesco Ltd., ultimate parent of the Adviser. |
| | |
| T-1 | | Invesco High Yield Fund |
Trustees and Officers–(continued)
| | | | | | | | |
Name, Year of Birth and Position(s) Held with the Trust | | Trustee and/or Officer Since | | Principal Occupation(s) During Past 5 Years | | Number of Funds in Fund Complex Overseen by
Trustee | | Other Directorship(s) Held by Trustee During Past 5 Years |
| Independent Trustees | | | | | | | | |
Christopher L. Wilson - 1957 Trustee and Chair | | 2017 | | Retired Formerly: Director, TD Asset Management USA Inc. (mutual fund complex) (22 portfolios); Managing Partner, CT2, LLC (investing and consulting firm); President/Chief Executive Officer, Columbia Funds, Bank of America Corporation; President/Chief Executive Officer, CDC IXIS Asset Management Services, Inc.; Principal & Director of Operations, Scudder Funds, Scudder, Stevens & Clark, Inc.; Assistant Vice President, Fidelity Investments | | 188 | | Formerly: enaible, Inc. (artificial intelligence technology) Director, ISO New England, Inc. (non-profit organization managing regional electricity market) |
Beth Ann Brown - 1968 Trustee | | 2019 | | Independent Consultant Formerly: Head of Intermediary Distribution, Managing Director, Strategic Relations, Managing Director, Head of National Accounts, Senior Vice President, National Account Manager and Senior Vice President, Key Account Manager, Columbia Management Investment Advisers LLC; Vice President, Key Account Manager, Liberty Funds Distributor, Inc.; and Trustee of certain Oppenheimer Funds | | 188 | | Director, Board of Directors of Caron Engineering Inc.; Advisor, Board of Advisors of Caron Engineering Inc.; President and Director, Acton Shapleigh Youth Conservation Corps (non-profit) Formerly: President and Director of Grahamtastic Connection (non-profit) |
Cynthia Hostetler -1962 Trustee | | 2017 | | Non-Executive Director and Trustee of a number of public and private business corporations Formerly: Director, Aberdeen Investment Funds (4 portfolios); Director, Artio Global Investment LLC (mutual fund complex); Director, Edgen Group, Inc. (specialized energy and infrastructure products distributor); Director, Genesee & Wyoming, Inc. (railroads); Head of Investment Funds and Private Equity, Overseas Private Investment Corporation; President, First Manhattan Bancorporation, Inc.; Attorney, Simpson Thacher & Bartlett LLP | | 188 | | Resideo Technologies, Inc. (smart home technology); Vulcan Materials Company (construction materials company); Trilinc Global Impact Fund; Textainer Group Holdings, (shipping container leasing company); Investment Company Institute (professional organization); Independent Directors Council (professional organization) |
Eli Jones - 1961 Trustee | | 2016 | | Professor and Dean Emeritus, Mays Business School—Texas A&M University Formerly: Dean of Mays Business School-Texas A&M University; Professor and Dean, Walton College of Business, University of Arkansas and E.J. Ourso College of Business, Louisiana State University; Director, Arvest Bank | | 188 | | Insperity, Inc. (formerly known as Administaff) (human resources provider); Member of Regional Board of Directors and Board of Directors, First Financial Bancorp (regional bank) |
Elizabeth Krentzman - 1959 Trustee | | 2019 | | Formerly: Principal and Chief Regulatory Advisor for Asset Management Services and U.S. Mutual Fund Leader of Deloitte & Touche LLP; General Counsel of the Investment Company Institute (trade association); National Director of the Investment Management Regulatory Consulting Practice, Principal, Director and Senior Manager of Deloitte & Touche LLP; Assistant Director of the Division of Investment Management—Office of Disclosure and Investment Adviser Regulation of the U.S. Securities and Exchange Commission and various positions with the Division of Investment Management – Office of Regulatory Policy of the U.S. Securities and Exchange Commission; Associate at Ropes & Gray LLP; and Trustee of certain Oppenheimer Funds | | 188 | | Trustee of the University of Florida National Board Foundation; Member of the Cartica Funds Board of Directors (private investment funds) Formerly: Member of the University of Florida Law Center Association, Inc. Board of Trustees, Audit Committee and Membership Committee |
Anthony J. LaCava, Jr. - 1956 Trustee | | 2019 | | Formerly: Director and Member of the Audit Committee, Blue Hills Bank (publicly traded financial institution) and Managing Partner, KPMG LLP | | 188 | | Blue Hills Bank; Chairman, Bentley University; Member, Business School Advisory Council; and Nominating Committee, KPMG LLP |
Prema Mathai-Davis - 1950 Trustee | | 1998 | | Retired Formerly: Co-Founder & Partner of Quantalytics Research, LLC, (a FinTech Investment Research Platform for the Self-Directed Investor); Trustee of YWCA Retirement Fund; CEO of YWCA of the USA; Board member of the NY Metropolitan Transportation Authority; Commissioner of the NYC Department of Aging; Board member of Johns Hopkins Bioethics Institute | | 188 | | Member of Board of Positive Planet US (non-profit) and HealthCare Chaplaincy Network (non-profit) |
| | |
| T-2 | | Invesco High Yield Fund |
Trustees and Officers–(continued)
| | | | | | | | |
Name, Year of Birth and Position(s) Held with the Trust | | Trustee and/or Officer Since | | Principal Occupation(s) During Past 5 Years | | Number of Funds in Fund Complex Overseen by
Trustee | | Other Directorship(s) Held by Trustee During Past 5 Years |
| Independent Trustees–(continued) | | | | | | |
Joel W. Motley - 1952 Trustee | | 2019 | | Director of Office of Finance, Federal Home Loan Bank System; Managing Director of Carmona Motley Inc. (privately held financial advisor); Member of the Council on Foreign Relations and its Finance and Budget Committee; Chairman Emeritus of Board of Human Rights Watch and Member of its Investment Committee; and Member of Investment Committee Board of Historic Hudson Valley (non-profit cultural organization); and Member of the Board, Blue Ocean Acquisition Corp. Formerly: Managing Director of Public Capital Advisors, LLC (privately held financial advisor); Managing Director of Carmona Motley Hoffman, Inc. (privately held financial advisor); Trustee of certain Oppenheimer Funds; Director of Columbia Equity Financial Corp. (privately held financial advisor); and Member of the Vestry of Trinity Church Wall Street | | 188 | | Member of Board of Trust for Mutual Understanding (non-profit promoting the arts and environment); Member of Board of Greenwall Foundation (bioethics research foundation) and its Investment Committee; Member of Board of Friends of the LRC (non-profit legal advocacy); Board Member and Investment Committee Member of Pulitzer Center for Crisis Reporting (non-profit journalism)Positive Planet US |
Teresa M. Ressel - 1962 Trustee | | 2017 | | Non-executive director and trustee of a number of public and private business corporations Formerly: Chief Executive Officer, UBS Securities LLC (investment banking); Chief Operating Officer, UBS AG Americas (investment banking); Sr. Management Team Olayan America, The Olayan Group (international investor/commercial/industrial); Assistant Secretary for Management & Budget and Designated Chief Financial Officer, U.S. Department of Treasury; Director, Atlantic Power Corporation (power generation company) and ON Semiconductor Corporation (semiconductor manufacturing) | | 188 | | None |
Ann Barnett Stern - 1957 Trustee | | 2017 | | President, Chief Executive Officer and Board Member, Houston Endowment, Inc. a private philanthropic institution Formerly: Executive Vice President, Texas Children’s Hospital; Vice President, General Counsel and Corporate Compliance Officer, Texas Children’s Hospital; Attorney at Beck, Redden and Secrest, LLP and Andrews and Kurth LLP | | 188 | | Trustee and Board Vice Chair of Holdsworth Center Trustee and Chair of Nomination/Governance Committee, Good Reason Houston, (non-profit); Trustee and Investment Committee member of University of Texas Law School Foundation (non-profit); Board Member of Greater Houston Partnership (non-profit); Advisory Board member, Baker Institute for Public Policy at Rice University (non-profit) Formerly: Director and Audit Committee Member of Federal Reserve Bank of Dallas |
Robert C. Troccoli - 1949 Trustee | | 2016 | | Retired Formerly: Adjunct Professor, University of Denver – Daniels College of Business; and Managing Partner, KPMG LLP | | 188 | | None |
Daniel S. Vandivort - 1954 Trustee | | 2019 | | President, Flyway Advisory Services LLC (consulting and property management) | | 188 | | Formerly: Trustee, Board of Trustees, Treasurer and Chairman of the Audit and Committee, Huntington Disease Foundation of America; Trustee and Governance Chair, of certain Oppenheimer Funds |
| | |
| T-3 | | Invesco High Yield Fund |
Trustees and Officers–(continued)
| | | | | | | | |
Name, Year of Birth and Position(s) Held with the Trust | | Trustee and/or Officer Since | | Principal Occupation(s) During Past 5 Years | | Number of Funds in Fund Complex Overseen by
Trustee | | Other Directorship(s) Held by Trustee During Past 5 Years |
| Officers | | | | | | | | |
Sheri Morris - 1964 President and Principal Executive Officer | | 1999 | | Head of Global Fund Services, Invesco Ltd.; President and Principal Executive Officer, The Invesco Funds; Vice President, Invesco Exchange-Traded Fund Trust, Invesco Exchange-Traded Fund Trust II, Invesco India Exchange-Traded Fund Trust, Invesco Actively Managed Exchange-Traded Fund Trust, Invesco Actively Managed Exchange-Traded Commodity Fund Trust and Invesco Exchange-Traded Self-Indexed Fund Trust; and Vice President, OppenheimerFunds, Inc. Formerly: Vice President, Treasurer and Principal Financial Officer, The Invesco Funds; Vice President, Invesco AIM Advisers, Inc., Invesco AIM Capital Management, Inc. and Invesco AIM Private Asset Management, Inc.; Assistant Vice President and Assistant Treasurer, The Invesco Funds; Vice President and Assistant Vice President, Invesco Advisers, Inc.; Assistant Vice President, Invesco AIM Capital Management, Inc. and Invesco AIM Private Asset Management, Inc.; Treasurer, Invesco Exchange-Traded Fund Trust, Invesco Exchange-Traded Fund Trust II, Invesco India Exchange-Traded Fund Trust and Invesco Actively Managed Exchange-Traded Fund Trust and Senior Vice President, Invesco Advisers, Inc. (formerly known as Invesco Institutional (N.A.), Inc.) (registered investment adviser) | | N/A | | N/A |
Jeffrey H. Kupor - 1968 Senior Vice President, Chief Legal Officer and Secretary | | 2018 | | Head of Legal of the Americas, Invesco Ltd.; Senior Vice President and Secretary, Invesco Advisers, Inc. (formerly known as Invesco Institutional (N.A.), Inc.) (registered investment adviser); Senior Vice President and Secretary, Invesco Distributors, Inc. (formerly known as Invesco AIM Distributors, Inc.); Vice President and Secretary, Invesco Investment Services, Inc. (formerly known as Invesco AIM Investment Services, Inc.) Senior Vice President, Chief Legal Officer and Secretary, The Invesco Funds; Secretary and General Counsel, Invesco Investment Advisers LLC (formerly known as Van Kampen Asset Management); Secretary and General Counsel, Invesco Capital Markets, Inc. (formerly known as Van Kampen Funds Inc.) and Chief Legal Officer, Invesco Exchange-Traded Fund Trust, Invesco Exchange-Traded Fund Trust II, Invesco India Exchange-Traded Fund Trust, Invesco Actively Managed Exchange-Traded Fund Trust, Invesco Actively Managed Exchange-Traded Commodity Fund Trust and Invesco Exchange-Traded Self-Indexed Fund Trust;; Secretary and Vice President, Harbourview Asset Management Corporation; Secretary and Vice President, OppenheimerFunds, Inc. and Invesco Managed Accounts, LLC; Secretary and Senior Vice President, OFI Global Institutional, Inc.; Secretary and Vice President, OFI SteelPath, Inc.; Secretary and Vice President, Oppenheimer Acquisition Corp.; Secretary and Vice President, Shareholder Services, Inc.; Secretary and Vice President, Trinity Investment Management Corporation Formerly: Secretary and Vice President, Jemstep, Inc.; Head of Legal, Worldwide Institutional, Invesco Ltd.; Secretary and General Counsel, INVESCO Private Capital Investments, Inc.; Senior Vice President, Secretary and General Counsel, Invesco Management Group, Inc. (formerly known as Invesco AIM Management Group, Inc.); Assistant Secretary, INVESCO Asset Management (Bermuda) Ltd.; Secretary and General Counsel, Invesco Private Capital, Inc.; Assistant Secretary and General Counsel, INVESCO Realty, Inc.; Secretary and General Counsel, Invesco Senior Secured Management, Inc.; Secretary, Sovereign G./P. Holdings Inc.; and Secretary, Invesco Indexing LLC; Secretary, W.L. Ross & Co., LLC | | N/A | | N/A |
Andrew R. Schlossberg - 1974 Senior Vice President | | 2019 | | Head of the Americas and Senior Managing Director, Invesco Ltd.; Director and Senior Vice President, Invesco Advisers, Inc. (formerly known as Invesco Institutional (N.A.), Inc.) (registered investment adviser); Director and Chairman, Invesco Investment Services, Inc. (formerly known as Invesco AIM Investment Services, Inc.) (registered transfer agent); Senior Vice President, The Invesco Funds; Director, Invesco Investment Advisers LLC (formerly known as Van Kampen Asset Management) Formerly: Director, President and Chairman, Invesco Insurance Agency, Inc.; Director, Invesco UK Limited; Director and Chief Executive, Invesco Asset Management Limited and Invesco Fund Managers Limited; Assistant Vice President, The Invesco Funds; Senior Vice President, Invesco Advisers, Inc. (formerly known as Invesco Institutional (N.A.), Inc.) (registered investment adviser); Director and Chief Executive, Invesco Administration Services Limited and Invesco Global Investment Funds Limited; Director, Invesco Distributors, Inc.; Head of EMEA, Invesco Ltd.; President, Invesco Actively Managed Exchange-Traded Commodity Fund Trust, Invesco Actively Managed Exchange-Traded Fund Trust, Invesco Exchange-Traded Fund Trust, Invesco Exchange-Traded Fund Trust II and Invesco India Exchange-Traded Fund Trust; Managing Director and Principal Executive Officer, Invesco Capital Management LLC | | N/A | | N/A |
| | |
| T-4 | | Invesco High Yield Fund |
Trustees and Officers–(continued)
| | | | | | | | |
Name, Year of Birth and Position(s) Held with the Trust | | Trustee and/or Officer Since | | Principal Occupation(s) During Past 5 Years | | Number of Funds in Fund Complex Overseen by
Trustee | | Other Directorship(s) Held by Trustee During Past 5 Years |
| Officers–(continued) | | | | | | | | |
John M. Zerr - 1962 Senior Vice President | | 2006 | | Chief Operating Officer of the Americas; Senior Vice President, Invesco Advisers, Inc. (formerly known as Invesco Institutional (N.A.), Inc.) (registered investment adviser); Senior Vice President, Invesco Distributors, Inc. (formerly known as Invesco AIM Distributors, Inc.); Director and Vice President, Invesco Investment Services, Inc. (formerly known as Invesco AIM Investment Services, Inc.) Senior Vice President, The Invesco Funds; Managing Director, Invesco Capital Management LLC; Director, Invesco Investment Advisers LLC (formerly known as Van Kampen Asset Management); Senior Vice President, Invesco Capital Markets, Inc. (formerly known as Van Kampen Funds Inc.); Manager, Invesco Indexing LLC; Manager, Invesco Specialized Products, LLC; Member, Invesco Canada Funds Advisory Board; Director, President and Chief Executive Officer, Invesco Corporate Class Inc. (corporate mutual fund company); and Director, Chairman, President and Chief Executive Officer, Invesco Canada Ltd. (formerly known as Invesco Trimark Ltd./Invesco Trimark Ltèe) (registered investment adviser and registered transfer agent); President, Invesco, Inc.; President, Invesco Global Direct Real Estate Feeder GP Ltd.; President, Invesco IP Holdings (Canada) Ltd; President, Invesco Global Direct Real Estate GP Ltd.; President, Invesco Financial Services Ltd. / Services Financiers Invesco Ltée; and Director and Chairman, Invesco Trust Company Formerly: President, Trimark Investments Ltd/Services Financiers Invesco Ltee; Director and Senior Vice President, Invesco Insurance Agency, Inc.; Director and Senior Vice President, Invesco Management Group, Inc. (formerly known as Invesco AIM Management Group, Inc.); Secretary and General Counsel, Invesco Management Group, Inc. (formerly known as Invesco AIM Management Group, Inc.); Secretary, Invesco Investment Services, Inc. (formerly known as Invesco AIM Investment Services, Inc.); Chief Legal Officer and Secretary, The Invesco Funds; Secretary and General Counsel, Invesco Investment Advisers LLC (formerly known as Van Kampen Asset Management); Secretary and General Counsel, Invesco Capital Markets, Inc. (formerly known as Van Kampen Funds Inc.); Chief Legal Officer, Invesco Exchange-Traded Fund Trust, Invesco Exchange-Traded Fund Trust II, Invesco India Exchange-Traded Fund Trust, Invesco Actively Managed Exchange-Traded Fund Trust, Invesco Actively Managed Exchange-Traded Commodity Fund Trust and Invesco Exchange-Traded Self-Indexed Fund Trust; Secretary, Invesco Indexing LLC; Director, Secretary, General Counsel and Senior Vice President, Van Kampen Exchange Corp.; Director, Vice President and Secretary, IVZ Distributors, Inc. (formerly known as INVESCO Distributors, Inc.); Director and Vice President, INVESCO Funds Group, Inc.; Director and Vice President, Van Kampen Advisors Inc.; Director, Vice President, Secretary and General Counsel, Van Kampen Investor Services Inc.; Director and Secretary, Invesco Distributors, Inc. (formerly known as Invesco AIM Distributors, Inc.); Director, Senior Vice President, General Counsel and Secretary, Invesco AIM Advisers, Inc. and Van Kampen Investments Inc.; Director, Vice President and Secretary, Fund Management Company; Director, Senior Vice President, Secretary, General Counsel and Vice President, Invesco AIM Capital Management, Inc.; Chief Operating Officer and General Counsel, Liberty Ridge Capital, Inc. (an investment adviser) | | N/A | | N/A |
Gregory G. McGreevey - 1962 Senior Vice President | | 2012 | | Senior Managing Director, Invesco Ltd.; Director, Chairman, President, and Chief Executive Officer, Invesco Advisers, Inc. (formerly known as Invesco Institutional (N.A.), Inc.) (registered investment adviser); Director, Invesco Mortgage Capital, Inc. and Invesco Senior Secured Management, Inc.; Senior Vice President, The Invesco Funds; President, SNW Asset Management Corporation and Invesco Managed Accounts, LLC; Chairman and Director, Invesco Private Capital, Inc.; Chairman and Director, INVESCO Private Capital Investments, Inc.; Chairman and Director, INVESCO Realty, Inc.; and Senior Vice President, Invesco Group Services, Inc. Formerly: Senior Vice President, Invesco Management Group, Inc. and Invesco Advisers, Inc.; Assistant Vice President, The Invesco Funds | | N/A | | N/A |
Adrien Deberghes - 1967 Principal Financial Officer, Treasurer and Vice President | | 2020 | | Head of the Fund Office of the CFO and Fund Administration; Vice President, Invesco Advisers, Inc.; Principal Financial Officer, Treasurer and Vice President, The Invesco Funds; Vice President, Invesco Exchange-Traded Fund Trust, Invesco Exchange-Traded Fund Trust II, Invesco India Exchange-Traded Fund Trust, Invesco Actively Managed Exchange-Traded Fund Trust, Invesco Actively Managed Exchange-Traded Commodity Fund Trust and Invesco Exchange-Traded Self-Indexed Fund Trust Formerly: Senior Vice President and Treasurer, Fidelity Investments | | N/A | | N/A |
Crissie M. Wisdom - 1969 Anti-Money Laundering Compliance Officer | | 2013 | | Anti-Money Laundering and OFAC Compliance Officer for Invesco U.S. entities including: Invesco Advisers, Inc. and its affiliates, Invesco Capital Markets, Inc., Invesco Distributors, Inc., Invesco Investment Services, Inc., The Invesco Funds, Invesco Capital Management, LLC, Invesco Trust Company; and Fraud Prevention Manager for Invesco Investment Services, Inc. | | N/A | | N/A |
| | |
| T-5 | | Invesco High Yield Fund |
Trustees and Officers–(continued)
| | | | | | | | |
Name, Year of Birth and Position(s) Held with the Trust | | Trustee and/or Officer Since | | Principal Occupation(s) During Past 5 Years | | Number of Funds in Fund Complex Overseen by
Trustee | | Other Directorship(s) Held by Trustee During Past 5 Years |
| Officers–(continued) | | | | | | | | |
Todd F. Kuehl - 1969 Chief Compliance Officer and Senior Vice President | | 2020 | | Chief Compliance Officer, Invesco Advisers, Inc. (registered investment adviser); and Chief Compliance Officer, The Invesco Funds and Senior Vice President Formerly: Managing Director and Chief Compliance Officer, Legg Mason (Mutual Funds); Chief Compliance Officer, Legg Mason Private Portfolio Group (registered investment adviser) | | N/A | | N/A |
Michael McMaster - 1962 Chief Tax Officer, Vice President and Assistant Treasurer | | 2020 | | Head of Global Fund Services Tax; Chief Tax Officer, Vice President and Assistant Treasurer, The Invesco Funds; Vice President, Invesco Advisers, Inc.; Assistant Treasurer, Invesco Capital Management LLC, Assistant Treasurer and Chief Tax Officer, Invesco Exchange-Traded Fund Trust, Invesco Exchange-Traded Fund Trust II, Invesco India Exchange-Traded Fund Trust, Invesco Actively Managed Exchange-Traded Fund Trust, Invesco Actively Managed Exchange-Traded Commodity Fund Trust and Invesco Exchange-Traded Self-Indexed Fund Trust; Assistant Treasurer, Invesco Specialized Products, LLC Formerly: Senior Vice President – Managing Director of Tax Services, U.S. Bank Global Fund Services (GFS) | | N/A | | N/A |
The Statement of Additional Information of the Trust includes additional information about the Funds Trustees and is available upon request, without charge, by calling 1.800.959.4246. Please refer to the Funds Statement of Additional Information for information on the Funds sub-advisers.
| | | | | | |
| Office of the Fund | | Investment Adviser | | Distributor | | Auditors |
| 11 Greenway Plaza, Suite 1000 | | Invesco Advisers, Inc. | | Invesco Distributors, Inc. | | PricewaterhouseCoopers LLP |
| Houston, TX 77046-1173 | | 1555 Peachtree Street, N.E. | | 11 Greenway Plaza, Suite 1000 | | 1000 Louisiana Street, Suite 5800 |
| | Atlanta, GA 30309 | | Houston, TX 77046-1173 | | Houston, TX 77002-5678 |
| | | |
| Counsel to the Fund | | Counsel to the Independent Trustees | | Transfer Agent | | Custodian |
| Stradley Ronon Stevens & Young, LLP | | Goodwin Procter LLP | | Invesco Investment Services, Inc. | | State Street Bank and Trust Company |
| 2005 Market Street, Suite 2600 | | 901 New York Avenue, N.W. | | 11 Greenway Plaza, Suite 1000 | | 225 Franklin Street |
| Philadelphia, PA 19103-7018 | | Washington, D.C. 20001 | | Houston, TX 77046-1173 | | Boston, MA 02110-2801 |
| | |
| T-6 | | Invesco High Yield Fund |
(This page intentionally left blank)

Go paperless with eDelivery
Visit invesco.com/edelivery to enjoy the convenience and security of anytime electronic access to your investment documents.
With eDelivery, you can elect to have any or all of the following materials delivered straight to your inbox to download, save and print from your own computer:
∎ Fund reports and prospectuses
∎ Quarterly statements
∎ Daily confirmations
∎ Tax forms
Invesco mailing information
Send general correspondence to Invesco Investment Services, Inc., P.O. Box 219078, Kansas City, MO 64121-9078.
Important notice regarding delivery of security holder documents
To reduce Fund expenses, only one copy of most shareholder documents may be mailed to shareholders with multiple accounts at the same address (Householding). Mailing of your shareholder documents may be householded indefinitely unless you instruct us otherwise. If you do not want the mailing of these documents to be combined with those for other members of your household, please contact Invesco Investment Services, Inc. at 800 959 4246 or contact your financial institution. We will begin sending you individual copies for each account within 30 days after receiving your request.
Fund holdings and proxy voting information
The Fund provides a complete list of its portfolio holdings four times each year, at the end of each fiscal quarter. For the second and fourth quarters, the list appears, respectively, in the Funds semiannual and annual reports to shareholders. For the first and third quarters, the Fund files the list with the Securities and Exchange Commission (SEC) as an exhibit to its reports on Form N-PORT. The most recent list of portfolio holdings is available at invesco.com/completeqtrholdings. Shareholders can also look up the Funds Form N-PORT filings on the SEC website, sec.gov. The SEC file numbers for the Fund are shown below.
A description of the policies and procedures that the Fund uses to determine how to vote proxies relating to portfolio securities is available without charge, upon request, from our Client Services department at 800 959 4246, or at invesco.com/ corporate/about-us/esg. The information is also available on the SEC website, sec.gov.
Information regarding how the Fund voted proxies related to its portfolio securities during the most recent 12-month period ended June 30 is available at invesco.com/proxysearch. This information is also available on the SEC website, sec.gov.
Invesco Advisers, Inc. is an investment adviser; it provides investment advisory services to individual and institutional clients and does not sell securities. Invesco Distributors, Inc. is the US distributor for Invesco Ltd.s retail mutual funds, exchange-traded funds and institutional money market funds. Both are wholly owned, indirect subsidiaries of Invesco Ltd.

| | | | |
| SEC file number(s): 811-05686 and 033-39519 | | Invesco Distributors, Inc. | | HYI-AR-1 |

| | |
| | |
| Annual Report to Shareholders | | February 28, 2022 |
Invesco High Yield Bond Factor Fund
Nasdaq:
A: OGYAX ∎ C: OGYCX ∎ R: OGYNX ∎ Y: OGYYX ∎ R5: GBHYX ∎ R6: OGYIX
Management’s Discussion of Fund Performance
| | | | |
| |
Performance summary | |
For the fiscal year ended February 28, 2022, Class A shares of Invesco High Yield Bond Factor Fund (the Fund), at net asset value (NAV), underperformed the Bloomberg U.S. Corporate High Yield 2% Issuer Cap Index, the Fund’s broad market/style-specific benchmark. | |
Your Fund’s long-term performance appears later in this report. | |
| |
Fund vs. Indexes | |
Total returns, 2/28/21 to 2/28/22, at net asset value (NAV). Performance shown does not include applicable contingent deferred sales charges (CDSC) or front-end sales charges, which would have reduced performance. | |
Class A Shares | | | 0.06 | % |
Class C Shares | | | -0.69 | |
Class R Shares | | | -0.19 | |
Class Y Shares | | | 0.31 | |
Class R5 Shares | | | 0.31 | |
Class R6 Shares | | | 0.31 | |
Bloomberg U.S. Corporate High Yield 2% Issuer Cap Index▼ (Broad Market/Style-Specific Index) | | | 0.64 | |
| |
Source(s): ▼RIMES Technologies Corp. | | | | |
Market conditions and your Fund
The US high yield market, as measured by the Bloomberg US High Yield Bond Index, was positive for the year 2021 driven by tighter credit spreads.
Despite overall positive performance for the fiscal year, the US high yield bond market saw pockets of volatility in the fourth quarter of 2021 due to the uncertainties around inflation and the rise in cases of the coronavirus (COVID-19) Omicron variant. November 2021 saw credit spreads widen meaningfully on risk-off sentiment. The trend reversed in December 2021 as credit spreads tightened and risky assets in general rallied.
The Invesco High Yield Bond Factor Fund changed strategies on February 28, 2020, to utilize a systematic, quantitative, factor-based approach to investing. The Fund generated positive returns since the strategy change, at NAV. It underperformed its broad market/ style specific benchmark (Bloomberg U.S. Corporate High Yield 2% Issuer Cap Index) but was in the top half of its peer group (40th percentile) since inception.
The Fund attempts to outperform its benchmark and peers by tilting toward bonds within the high yield universe that tended to have higher returns over a cycle. These bonds have the following positive characteristics:
∎ Carry bonds are the highest spread bonds in a universe, excluding those rated† CCC and below.
∎ Value bonds are those with the highest spread relative to other securities with similar credit ratings and sectors.
∎ Low volatility bonds are those with lower duration and higher credit quality in a universe.
Though the Fund does not explicitly target rating categories, an overweight to higher
credit quality bonds tends to be an outcome of the Fund’s investment process.
Since the strategy change, value and carry bonds contributed to benchmark relative to outperformance and low volatility bonds had a negligible contribution to Fund performance, in line with expectations given the environment in 2021.
Please note that we implemented our strategy using derivative instruments, including futures, forwards and swaps. Therefore, a portion of the performance of the strategy, both positive and negative, can be attributed to these instruments. Derivatives can be a cost-effective way to gain or hedge exposure to certain risks.
Part of the Funds strategy to manage credit, interest rate and currency risk during the fiscal year entailed purchasing and selling credit, interest rate and currency derivatives. Generally, derivative exposure is to mitigate active risk relative to the benchmark. We sought to manage credit market risk by purchasing and selling protection through credit default swaps at various points throughout the fiscal year. The currency management was carried out via currency forwards and we believe this strategy was effective in managing the currency positioning within the Fund. Interest rate exposure was managed utilizing interest rate futures.
The investment team does not attempt to time the credit market, interest rates, sectors, or factors and therefore maintains its allocations versus the index. Over time, we believe this has the potential to deliver positive relative performance over a market cycle.
We wish to remind you that the Fund is subject to interest rate risk, meaning when interest rates rise, the value of fixed income securities tends to fall. The risk may be greater in the current market environment because interest rates are near historic lows.
The degree to which the value of fixed income securities may decline due to rising interest rates may vary depending on the speed and magnitude of the increase in interest rates, as well as individual security characteristics such as price, maturity, duration and coupon and market forces such as supply and demand for similar securities. We are monitoring interest rates and the market, economic and geopolitical factors that may impact the direction, speed and magnitude of changes to interest rates across the maturity spectrum, including the potential impact of monetary policy changes by the Fed and certain foreign central banks. If interest rates rise or fall faster than expected, markets may experience increased volatility, which may affect the value and/or liquidity of certain investments held by the Fund.
Thank you for investing in Invesco High Yield Bond Factor Fund and for sharing our long-term investment horizon.
† A credit rating is an assessment provided by a NRSRO of the creditworthiness of an issuer with respect to debt obligations, including specific securities, money market instruments or other debts. Ratings are measured on a scale that generally ranges from AAA (highest) to D (lowest); ratings are subject to change without notice. For more information on rating methodology, please visit www.standardandpoors.com and select “Understanding Ratings” under Rating Resources on the homepage; www.fitchratings.com and select “Understanding Credit Ratings” from the drop-down menu on the homepage; and www.moodys.com and select “Methodology,” then “Rating Methodologies” under Research Type on the left-hand side.
Portfolio manager(s):
Noelle Corum
James Ong
Jay Raol
The views and opinions expressed in management’s discussion of Fund performance are those of Invesco Advisers, Inc. and its affiliates. These views and opinions are subject to change at any time based on factors such as market and economic conditions. These views and opinions may not be relied upon as investment advice or recommendations, or as an offer for a particular security. The information is not a complete analysis of every aspect of any market, country, industry, security or the Fund. Statements of fact are from sources considered reliable, but Invesco Advisers, Inc. makes no representation or warranty as to their completeness or accuracy. Although historical performance is no guarantee of future results, these insights may help you understand our investment management philosophy.
See important Fund and, if applicable, index disclosures later in this report.
| | |
| 2 | | Invesco High Yield Bond Factor Fund |
Your Fund’s Long-Term Performance
Results of a $10,000 Investment – Oldest Share Class(es)
Fund and index data from 11/8/13
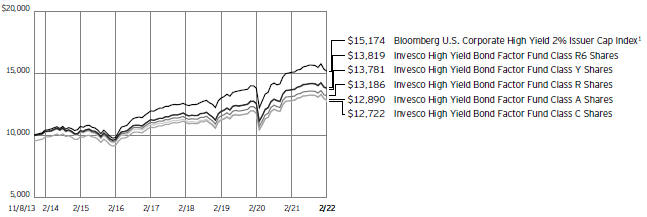
1 Source: RIMES Technologies Corp.
Past performance cannot guarantee future results.
The data shown in the chart include reinvested distributions, applicable sales charges and Fund expenses including management
fees. Index results include reinvested dividends, but they do not reflect sales charges. Performance of the peer group, if applicable, reflects fund expenses and management fees;
performance of a market index does not. Performance shown in the chart does not reflect deduction of taxes a shareholder would pay on Fund distributions or sale of Fund shares.
| | |
| 3 | | Invesco High Yield Bond Factor Fund |
| | | | |
| |
Average Annual Total Returns | |
As of 2/28/22, including maximum applicable sales charges | |
| |
Class A Shares | | | | |
Inception (11/8/13) | | | 3.10 | % |
5 Years | | | 2.85 | |
1 Year | | | -4.19 | |
| |
Class C Shares | | | | |
Inception (11/8/13) | | | 2.94 | % |
5 Years | | | 2.99 | |
1 Year | | | -1.65 | |
| |
Class R Shares | | | | |
Inception (11/8/13) | | | 3.39 | % |
5 Years | | | 3.48 | |
1 Year | | | -0.19 | |
| |
Class Y Shares | | | | |
Inception (11/8/13) | | | 3.94 | % |
5 Years | | | 4.03 | |
1 Year | | | 0.31 | |
| |
Class R5 Shares | | | | |
Inception | | | 3.72 | % |
5 Years | | | 3.87 | |
1 Year | | | 0.31 | |
| |
Class R6 Shares | | | | |
Inception (11/8/13) | | | 3.97 | % |
5 Years | | | 4.05 | |
1 Year | | | 0.31 | |
Effective May 24, 2019, Class A, Class C, Class R, Class Y and Class I shares of the Oppenheimer Global High Yield Fund, (the predecessor fund), were reorganized into Class A, Class C, Class R, Class Y and Class R6 shares, respectively, of the Invesco Oppenheimer Global High Yield Fund. The Fund was subsequently renamed the Invesco High Yield Bond Factor Fund (the Fund). Returns shown above, for periods ending on or prior to May 24, 2019, for Class A, Class C, Class R, Class Y and Class R6 shares are those for Class A, Class C, Class R, Class Y and Class I shares of the predecessor fund. Share class returns will differ from the predecessor fund because of different expenses. For periods prior to February 28, 2020, performance shown is that of the Fund using its previous investment strategy. Therefore, the past performance shown for periods prior to February 28, 2020 may have differed had the Fund’s current investment strategy been in effect.
Class R5 shares incepted on May 24, 2019. Performance shown on and prior to that date is that of the predecessor fund’s Class A shares at net asset value and includes the 12b-1 fees applicable to Class A shares.
The performance data quoted represent past performance and cannot guarantee future results; current performance may be lower or higher. Please visit invesco.com/ performance for the most recent month-end performance. Performance figures reflect reinvested distributions, changes in
net asset value and the effect of the maximum sales charge unless otherwise stated. Performance figures do not reflect deduction of taxes a shareholder would pay on Fund distributions or sale of Fund shares. Investment return and principal value will fluctuate so that you may have a gain or loss when you sell shares.
Class A share performance reflects the maximum 4.25% sales charge, and Class C share performance reflects the applicable contingent deferred sales charge (CDSC) for the period involved. The CDSC on Class C shares is 1% for the first year after purchase. Class R, Class Y, Class R5 and Class R6 shares do not have a front-end sales charge or a CDSC; therefore, performance is at net asset value.
The performance of the Fund’s share classes will differ primarily due to different sales charge structures and class expenses.
Fund performance reflects any applicable fee waivers and/or expense reimbursements. Had the adviser not waived fees and/or reimbursed expenses currently or in the past, returns would have been lower. See current prospectus for more information.
| | |
| 4 | | Invesco High Yield Bond Factor Fund |
Supplemental Information
Invesco High Yield Bond Factor Fund’s investment objective is to seek total return.
| ∎ | Unless otherwise stated, information presented in this report is as of February 28, 2022, and is based on total net assets. |
| ∎ | Unless otherwise noted, all data is provided by Invesco. |
| ∎ | To access your Fund’s reports/prospectus, visit invesco.com/fundreports. |
About indexes used in this report
| ∎ | The Bloomberg U.S. Corporate High Yield 2% Issuer Cap Index is an unman-aged index considered representative of the US high-yield, fixed-rate corporate bond market. Index weights for each issuer are capped at 2%. |
| ∎ | The Fund is not managed to track the performance of any particular index, including the index(es) described here, and consequently, the performance of the Fund may deviate significantly from the performance of the index(es). |
| ∎ | A direct investment cannot be made in an index. Unless otherwise indicated, index results include reinvested dividends, and they do not reflect sales charges. Performance of the peer group, if applicable, reflects fund expenses; performance of a market index does not. |
|
|
This report must be accompanied or preceded by a currently effective Fund prospectus, which contains more complete information, including sales charges and expenses. Investors should read it carefully before investing. |
|
| NOT FDIC INSURED | MAY LOSE VALUE | NO BANK GUARANTEE |
| | |
| 5 | | Invesco High Yield Bond Factor Fund |
Fund Information
Portfolio Composition†
| | | | | |
| By credit quality | | % of total investments |
| |
AAA | | | | 0.25 | % |
| |
BBB | | | | 9.88 | |
| |
BB | | | | 60.74 | |
| |
B | | | | 25.71 | |
| |
CCC | | | | 1.36 | |
| |
Non-Rated | | | | 0.26 | |
| |
Cash | | | | 1.80 | |
†Source: Standard & Poor’s. A credit rating is an assessment provided by a nationally recognized statistical rating organization (NRSRO) of the creditworthiness of an issuer with respect to debt obligations, including specific securities, money market instruments or other debts. Ratings are measured on a scale that generally ranges from AAA (highest) to D (lowest); ratings are subject to change without notice. “Non- Rated” indicates the debtor was not rated, and should not be interpreted as indicating low quality. For more information on Standard & Poor’s rating methodology, please visit standardandpoors.com and select “Understanding Ratings” under Rating Resources on the homepage.
Top Five Debt Issuers*
| | | | | |
| | | % of total net assets |
| |
1. Bausch Health Cos., Inc. | | | | 2.07 | % |
| |
2. Ford Motor Co. | | | | 1.83 | |
| |
3. Sprint Corp. | | | | 1.59 | |
| |
4. Wynn Las Vegas LLC/Wynn Las Vegas Capital Corp. | | | | 1.24 | |
| |
5. Service Properties Trust | | | | 1.16 | |
The Fund’s holdings are subject to change, and there is no assurance that the Fund will continue to hold any particular security.
| * | Excluding money market fund holdings, if any. |
Data presented here are as of February 28, 2022.
| | |
| 6 | | Invesco High Yield Bond Factor Fund |
Schedule of Investments(a)
February 28, 2022
| | | | | | | | |
| | | Principal Amount | | | Value | |
|
| |
U.S. Dollar Denominated Bonds & Notes–93.19% | |
Aerospace & Defense–2.49% | |
Bombardier, Inc. (Canada),
7.50%, 03/15/2025(b) | | $ | 31,000 | | | $ | 31,343 | |
|
| |
7.88%, 04/15/2027(b) | | | 42,000 | | | | 42,635 | |
|
| |
Howmet Aerospace, Inc.,
5.13%, 10/01/2024 | | | 166,000 | | | | 174,836 | |
|
| |
5.90%, 02/01/2027 | | | 100,000 | | | | 108,789 | |
|
| |
Rolls-Royce PLC (United Kingdom), 5.75%, 10/15/2027(b) | | | 200,000 | | | | 206,397 | |
|
| |
TransDigm, Inc., 5.50%, 11/15/2027 | | | 150,000 | | | | 149,570 | |
|
| |
Triumph Group, Inc., 8.88%, 06/01/2024(b) | | | 133,000 | | | | 142,061 | |
|
| |
| | | | | | | 855,631 | |
|
| |
| | |
Airlines–1.32% | | | | | | | | |
American Airlines, Inc., 11.75%, 07/15/2025(b) | | | 93,000 | | | | 112,896 | |
|
| |
American Airlines, Inc./AAdvantage Loyalty IP Ltd., 5.75%, 04/20/2029(b) | | | 135,000 | | | | 138,249 | |
|
| |
Delta Air Lines, Inc., 2.90%, 10/28/2024 | | | 177,000 | | | | 174,963 | |
|
| |
United Airlines, Inc., 4.38%, 04/15/2026(b) | | | 28,000 | | | | 27,964 | |
|
| |
| | | | | | | 454,072 | |
|
| |
| | |
Alternative Carriers–0.93% | | | | | | | | |
Lumen Technologies, Inc., | | | | | | | | |
Series W, 6.75%, 12/01/2023 | | | 131,000 | | | | 137,052 | |
|
| |
Series P, 7.60%, 09/15/2039 | | | 121,000 | | | | 106,707 | |
|
| |
Series U, 7.65%, 03/15/2042 | | | 86,000 | | | | 75,621 | |
|
| |
| | | | | | | 319,380 | |
|
| |
| | |
Apparel Retail–0.30% | | | | | | | | |
Abercrombie & Fitch Management Co., 8.75%, 07/15/2025(b) | | | 97,000 | | | | 102,453 | |
|
| |
| |
Apparel, Accessories & Luxury Goods–0.64% | | | | | |
G-III Apparel Group Ltd., 7.88%, 08/15/2025(b) | | | 66,000 | | | | 69,626 | |
|
| |
Hanesbrands, Inc., 4.63%, 05/15/2024(b) | | | 150,000 | | | | 152,233 | |
|
| |
| | | | | | | 221,859 | |
|
| |
| | |
Auto Parts & Equipment–0.97% | | | | | | | | |
Adient US LLC, 9.00%, 04/15/2025(b) | | | 127,000 | | | | 134,291 | |
|
| |
Clarios Global L.P./Clarios US Finance Co., 8.50%, 05/15/2027(b) | | | 32,000 | | | | 33,392 | |
|
| |
Tenneco, Inc., 7.88%, 01/15/2029(b) | | | 158,000 | | | | 167,050 | |
|
| |
| | | | | | | 334,733 | |
|
| |
| | |
Automobile Manufacturers–3.26% | | | | | | | | |
Ford Motor Co.,
7.13%, 11/15/2025 | | | 75,000 | | | | 82,622 | |
|
| |
6.63%, 10/01/2028 | | | 400,000 | | | | 449,692 | |
|
| |
9.98%, 02/15/2047 | | | 65,000 | | | | 95,925 | |
|
| |
Ford Motor Credit Co. LLC, 4.13%, 08/04/2025 | | | 350,000 | | | | 354,375 | |
|
| |
Winnebago Industries, Inc., 6.25%, 07/15/2028(b) | | | 132,000 | | | | 136,786 | |
|
| |
| | | | | | | 1,119,400 | |
|
| |
| | | | | | | | |
| | | Principal Amount | | | Value | |
|
| |
Biotechnology–0.19% | | | | | | | | |
Emergent BioSolutions, Inc., 3.88%, 08/15/2028(b) | | $ | 74,000 | | | $ | 66,315 | |
|
| |
| | |
Broadcasting–2.51% | | | | | | | | |
AMC Networks, Inc.,
5.00%, 04/01/2024 | | | 63,000 | | | | 63,008 | |
|
| |
4.25%, 02/15/2029(c) | | | 109,000 | | | | 102,222 | |
|
| |
iHeartCommunications, Inc., 8.38%, 05/01/2027 | | | 64,671 | | | | 67,434 | |
|
| |
Liberty Interactive LLC, 8.25%, 02/01/2030 | | | 195,000 | | | | 191,483 | |
|
| |
Sinclair Television Group, Inc., 4.13%, 12/01/2030(b) | | | 142,000 | | | | 127,314 | |
|
| |
TEGNA, Inc., 5.00%, 09/15/2029(c) | | | 310,000 | | | | 309,668 | |
|
| |
| | | | | | | 861,129 | |
|
| |
| | |
Building Products–1.55% | | | | | | | | |
Builders FirstSource, Inc., 6.75%, 06/01/2027(b) | | | 146,000 | | | | 151,913 | |
|
| |
North Queensland Export Terminal Pty. Ltd. (Australia), 4.45%, 12/15/2022(b) | | | 200,000 | | | | 179,439 | |
|
| |
SRM Escrow Issuer LLC, 6.00%, 11/01/2028(b) | | | 201,000 | | | | 201,157 | |
|
| |
| | | | | | | 532,509 | |
|
| |
| | |
Cable & Satellite–3.46% | | | | | | | | |
CSC Holdings LLC, 6.50%, 02/01/2029(b) | | | 287,000 | | | | 291,039 | |
|
| |
DIRECTV Holdings LLC/DIRECTV Financing Co., Inc, 5.88%, 08/15/2027(b) | | | 312,000 | | | | 312,390 | |
|
| |
LCPR Senior Secured Financing DAC, 6.75%, 10/15/2027(b) | | | 180,000 | | | | 186,169 | |
|
| |
Telenet Finance Luxembourg Notes S.a r.l. (Belgium), 5.50%, 03/01/2028(b) | | | 70,000 | | | | 70,000 | |
|
| |
Telesat Canada/Telesat LLC (Canada), 5.63%, 12/06/2026(b) | | | 188,000 | | | | 138,536 | |
|
| |
UPC Broadband Finco B.V. (Netherlands), 4.88%, 07/15/2031(b) | | | 200,000 | | | | 191,302 | |
|
| |
| | | | | | | 1,189,436 | |
|
| |
| | |
Casinos & Gaming–5.02% | | | | | | | | |
Affinity Gaming, 6.88%, 12/15/2027(b) | | | 170,000 | | | | 167,667 | |
|
| |
Caesars Entertainment, Inc., 8.13%, 07/01/2027(b) | | | 40,000 | | | | 43,162 | |
|
| |
International Game Technology PLC, 6.50%, 02/15/2025(b) | | | 200,000 | | | | 212,735 | |
|
| |
Melco Resorts Finance Ltd. (Hong Kong), 5.75%, 07/21/2028(b) | | | 200,000 | | | | 182,398 | |
|
| |
MGM China Holdings Ltd. (Macau), 5.38%, 05/15/2024(b) | | | 200,000 | | | | 194,271 | |
|
| |
MGM Resorts International, 5.75%, 06/15/2025 | | | 175,000 | | | | 183,531 | |
|
| |
Sabre GLBL, Inc.,
9.25%, 04/15/2025(b) | | | 86,000 | | | | 97,098 | |
|
| |
7.38%, 09/01/2025(b) | | | 210,000 | | | | 217,875 | |
|
| |
Wynn Las Vegas LLC/Wynn Las Vegas Capital Corp.,
4.25%, 05/30/2023(b) | | | 150,000 | | | | 150,764 | |
|
| |
5.50%, 03/01/2025(b) | | | 270,000 | | | | 274,131 | |
|
| |
| | | | | | | 1,723,632 | |
|
| |
See accompanying Notes to Financial Statements which are an integral part of the financial statements.
| | |
| 7 | | Invesco High Yield Bond Factor Fund |
| | | | | | | | |
| | | Principal
Amount | | | Value | |
|
| |
Coal & Consumable Fuels–0.57% | | | | | | | | |
Alliance Resource Operating Partners L.P./Alliance Resource Finance Corp., 7.50%, 05/01/2025(b) | | $ | 196,000 | | | $ | 196,225 | |
|
| |
Murray Energy Corp., 3.00% PIK Rate, 9.00% Cash Rate, 04/15/2024(b)(d)(e) | | | 130,760 | | | | 667 | |
|
| |
| | | | | | | 196,892 | |
|
| |
| | |
Commodity Chemicals–0.84% | | | | | | | | |
Methanex Corp. (Canada),
5.13%, 10/15/2027 | | | 138,000 | | | | 140,336 | |
|
| |
5.25%, 12/15/2029 | | | 147,000 | | | | 148,749 | |
|
| |
| | | | | | | 289,085 | |
|
| |
| | |
Communications Equipment–1.14% | | | | | | | | |
CommScope Technologies LLC, 6.00%, 06/15/2025(b) | | | 99,000 | | | | 96,945 | |
|
| |
Plantronics, Inc., 4.75%, 03/01/2029(b) | | | 180,000 | | | | 159,523 | |
|
| |
ViaSat, Inc., 5.63%, 04/15/2027(b) | | | 136,000 | | | | 136,015 | |
|
| |
| | | | | | | 392,483 | |
|
| |
| | |
Construction & Engineering–0.94% | | | | | | | | |
Artera Services LLC, 9.03%, 12/04/2025(b) | | | 75,000 | | | | 75,347 | |
|
| |
Dycom Industries, Inc., 4.50%, 04/15/2029(b) | | | 72,000 | | | | 69,427 | |
|
| |
Fluor Corp., 4.25%, 09/15/2028 | | | 181,000 | | | | 177,465 | |
|
| |
| | | | | | | 322,239 | |
|
| |
| |
Construction Machinery & Heavy Trucks–0.24% | | | | | |
Trinity Industries, Inc., 4.55%, 10/01/2024 | | | 82,000 | | | | 83,729 | |
|
| |
| | |
Consumer Finance–2.27% | | | | | | | | |
ASG Finance Designated Activity Co. (Cyprus), 7.88%, 12/03/2024(b) | | | 200,000 | | | | 194,500 | |
|
| |
Credit Acceptance Corp., 5.13%, 12/31/2024(b) | | | 139,000 | | | | 140,973 | |
|
| |
Navient Corp.,
5.88%, 10/25/2024 | | | 101,000 | | | | 104,587 | |
|
| |
6.75%, 06/25/2025 | | | 160,000 | | | | 167,101 | |
|
| |
5.63%, 08/01/2033 | | | 79,000 | | | | 68,877 | |
|
| |
OneMain Finance Corp., 6.13%, 03/15/2024 | | | 101,000 | | | | 104,154 | |
|
| |
| | | | | | | 780,192 | |
|
| |
| | |
Department Stores–1.31% | | | | | | | | |
Macy’s Retail Holdings LLC, 3.63%, 06/01/2024 | | | 352,000 | | | | 360,402 | |
|
| |
Nordstrom, Inc., 6.95%, 03/15/2028 | | | 85,000 | | | | 89,816 | |
|
| |
| | | | | | | 450,218 | |
|
| |
| | |
Diversified Banks–1.04% | | | | | | | | |
Banco Mercantil del Norte S.A. (Mexico), 7.50%(b)(f)(g) | | | 160,000 | | | | 156,624 | |
|
| |
UniCredit S.p.A. (Italy), 5.46%, 06/30/2035(b)(f) | | | 200,000 | | | | 199,466 | |
|
| |
| | | | | | | 356,090 | |
|
| |
|
Diversified Chemicals–0.44% | |
NOVA Chemicals Corp. (Canada), 4.25%, 05/15/2029(b) | | | 160,000 | | | | 150,202 | |
|
| |
| | | | | | | | |
| | | Principal
Amount | | | Value | |
|
| |
Diversified Metals & Mining–0.29% | | | | | | | | |
Mineral Resources Ltd. (Australia), 8.13%, 05/01/2027(b) | | $ | 95,000 | | | $ | 100,484 | |
|
| |
| | |
Diversified REITs–1.21% | | | | | | | | |
iStar, Inc., 4.75%, 10/01/2024 | | | 153,000 | | | | 154,332 | |
|
| |
MGM Growth Properties Operating Partnership L.P./MGP Finance Co-Issuer, Inc., 5.63%, 05/01/2024 | | | 115,000 | | | | 119,522 | |
|
| |
VICI Properties L.P./VICI Note Co., Inc., 3.50%, 02/15/2025(b) | | | 140,000 | | | | 140,501 | |
|
| |
| | | | | | | 414,355 | |
|
| |
| | |
Diversified Support Services–0.49% | | | | | | | | |
MPH Acquisition Holdings LLC, 5.75%, 11/01/2028(b) | | | 60,000 | | | | 54,217 | |
|
| |
Ritchie Bros. Auctioneers, Inc. (Canada), 5.38%, 01/15/2025(b) | | | 111,000 | | | | 112,790 | |
|
| |
| | | | | | | 167,007 | |
|
| |
| | |
Drug Retail–0.36% | | | | | | | | |
Rite Aid Corp.,
7.50%, 07/01/2025(b) | | | 74,000 | | | | 71,190 | |
|
| |
8.00%, 11/15/2026(b) | | | 55,000 | | | | 52,464 | |
|
| |
| | | | | | | 123,654 | |
|
| |
| | |
Education Services–0.03% | | | | | | | | |
Graham Holdings Co., 5.75%,
06/01/2026(b) | | | 9,000 | | | | 9,265 | |
|
| |
| | |
Electric Utilities–1.49% | | | | | | | | |
FirstEnergy Transmission LLC, 4.35%, 01/15/2025(b) | | | 123,000 | | | | 126,526 | |
|
| |
InterGen N.V. (Netherlands), 7.00%, 06/30/2023(b) | | | 200,000 | | | | 196,830 | |
|
| |
Talen Energy Supply LLC, 7.25%, 05/15/2027(b) | | | 127,000 | | | | 113,260 | |
|
| |
Vistra Operations Co. LLC, 4.38%, 05/01/2029(b) | | | 77,000 | | | | 74,749 | |
|
| |
| | | | | | | 511,365 | |
|
| |
| |
Electrical Components & Equipment–0.72% | | | | | |
Sensata Technologies B.V., 5.63%, 11/01/2024(b) | | | 128,000 | | | | 135,014 | |
|
| |
WESCO Distribution, Inc., 7.13%, 06/15/2025(b) | | | 107,000 | | | | 112,186 | |
|
| |
| | | | | | | 247,200 | |
|
| |
| | |
Electronic Components–0.17% | | | | | | | | |
Likewize Corp., 9.75%, 10/15/2025(b) | | | 55,000 | | | | 57,297 | |
|
| |
| |
Environmental & Facilities Services–1.02% | | | | | |
GFL Environmental, Inc. (Canada), 4.25%, 06/01/2025(b) | | | 170,000 | | | | 170,621 | |
|
| |
Stericycle, Inc.,
5.38%, 07/15/2024(b) | | | 105,000 | | | | 107,479 | |
|
| |
3.88%, 01/15/2029(b) | | | 78,000 | | | | 72,747 | |
|
| |
| | | | | | | 350,847 | |
|
| |
| |
Fertilizers & Agricultural Chemicals–0.39% | | | | | |
Eurochem Finance DAC (Russia), 5.50%, 03/13/2024(b) | | | 200,000 | | | | 134,734 | |
|
| |
| | |
Financial Exchanges & Data–0.29% | | | | | | | | |
S&P Global, Inc., 4.75%, 02/15/2025(b) | | | 95,000 | | | | 100,794 | |
|
| |
See accompanying Notes to Financial Statements which are an integral part of the financial statements.
| | |
| 8 | | Invesco High Yield Bond Factor Fund |
| | | | | | | | |
| | | Principal
Amount | | | Value | |
|
| |
Food Distributors–0.38% | | | | | | | | |
C&S Group Enterprises LLC, 5.00%, 12/15/2028(b) | | $ | 150,000 | | | $ | 130,664 | |
|
| |
| | |
Gas Utilities–0.41% | | | | | | | | |
AmeriGas Partners L.P./AmeriGas Finance Corp., 5.63%, 05/20/2024 | | | 138,000 | | | | 140,947 | |
|
| |
| | |
Health Care Equipment–0.46% | | | | | | | | |
Varex Imaging Corp., 7.88%, 10/15/2027(b) | | | 146,000 | | | | 157,551 | |
|
| |
| | |
Health Care Facilities–1.66% | | | | | | | | |
Change Healthcare Holdings LLC/Change Healthcare Finance, Inc., 5.75%, 03/01/2025(b) | | | 33,000 | | | | 32,885 | |
|
| |
HCA, Inc.,
5.38%, 02/01/2025 | | | 129,000 | | | | 136,757 | |
|
| |
7.50%, 11/15/2095 | | | 30,000 | | | | 37,650 | |
|
| |
RegionalCare Hospital Partners Holdings, Inc./LifePoint Health, Inc., 9.75%, 12/01/2026(b) | | | 31,000 | | | | 32,547 | |
|
| |
Tenet Healthcare Corp.,
6.75%, 06/15/2023 | | | 35,000 | | | | 36,437 | |
|
| |
4.63%, 07/15/2024 | | | 72,000 | | | | 72,302 | |
|
| |
4.63%, 09/01/2024(b) | | | 120,000 | | | | 121,758 | |
|
| |
6.13%, 10/01/2028(b) | | | 99,000 | | | | 100,391 | |
|
| |
| | | | | | | 570,727 | |
|
| |
| | |
Health Care REITs–0.29% | | | | | | | | |
Diversified Healthcare Trust, 4.75%, 02/15/2028 | | | 110,000 | | | | 99,623 | |
|
| |
| | |
Health Care Services–1.36% | | | | | | | | |
Community Health Systems, Inc.,
6.88%, 04/15/2029(b) | | | 33,000 | | | | 32,037 | |
|
| |
6.13%, 04/01/2030(b) | | | 33,000 | | | | 30,731 | |
|
| |
Omnicare, Inc., 4.75%, 12/01/2022 | | | 30,000 | | | | 30,496 | |
|
| |
Prime Healthcare Services, Inc., 7.25%, 11/01/2025(b) | | | 195,000 | | | | 199,655 | |
|
| |
US Acute Care Solutions LLC, 6.38%, 03/01/2026(b) | | | 178,000 | | | | 175,508 | |
|
| |
| | | | | | | 468,427 | |
|
| |
| | |
Homebuilding–1.07% | | | | | | | | |
LGI Homes, Inc., 4.00%, 07/15/2029(b) | | | 187,000 | | | | 174,789 | |
|
| |
New Home Co., Inc. (The), 7.25%, 10/15/2025(b) | | | 100,000 | | | | 99,359 | |
|
| |
TRI Pointe Group, Inc./TRI Pointe Homes, Inc., 5.88%, 06/15/2024 | | | 90,000 | | | | 93,712 | |
|
| |
| | | | | | | 367,860 | |
|
| |
| | |
Homefurnishing Retail–0.29% | | | | | | | | |
Bed Bath & Beyond, Inc., 3.75%, 08/01/2024 | | | 100,000 | | | | 99,351 | |
|
| |
| | |
Hotel & Resort REITs–1.16% | | | | | | | | |
Service Properties Trust,
4.65%, 03/15/2024 | | | 159,000 | | | | 155,208 | |
|
| |
4.35%, 10/01/2024 | | | 177,000 | | | | 170,842 | |
|
| |
4.95%, 02/15/2027 | | | 78,000 | | | | 72,673 | |
|
| |
| | | | | | | 398,723 | |
|
| |
| | | | | | | | |
| | | Principal
Amount | | | Value | |
|
| |
Hotels, Resorts & Cruise Lines–2.52% | |
Carnival Corp.,
7.63%, 03/01/2026(b) | | $ | 185,000 | | | $ | 190,364 | |
|
| |
9.88%, 08/01/2027(b) | | | 92,000 | | | | 103,399 | |
|
| |
Royal Caribbean Cruises Ltd.,
9.13%, 06/15/2023(b) | | | 150,000 | | | | 157,032 | |
|
| |
11.50%, 06/01/2025(b) | | | 73,000 | | | | 80,729 | |
|
| |
Travel + Leisure Co.,
5.65%, 04/01/2024 | | | 7,000 | | | | 7,271 | |
|
| |
Series J, 6.00%, 04/01/2027 | | | 174,000 | | | | 182,110 | |
|
| |
VOC Escrow Ltd., 5.00%, 02/15/2028(b) | | | 151,000 | | | | 144,006 | |
|
| |
| | | | | | | 864,911 | |
|
| |
|
Independent Power Producers & Energy Traders–0.47% | |
EnfraGen Energia Sur S.A./EnfraGen Spain S.A./Prime Energia S.p.A. (Spain), 5.38%, 12/30/2030(b) | | | 200,000 | | | | 163,151 | |
|
| |
| | |
Industrial Conglomerates–0.38% | | | | | | | | |
Icahn Enterprises L.P./Icahn Enterprises Finance Corp., 4.75%, 09/15/2024 | | | 131,000 | | | | 130,825 | |
|
| |
| | |
Insurance Brokers–0.19% | | | | | | | | |
Alliant Holdings Intermediate LLC/Alliant Holdings Co-Issuer, 6.75%, 10/15/2027(b) | | | 32,000 | | | | 31,316 | |
|
| |
HUB International Ltd., 7.00%, 05/01/2026(b) | | | 33,000 | | | | 33,254 | |
|
| |
| | | | | | | 64,570 | |
|
| |
| | |
Integrated Oil & Gas–0.85% | | | | | | | | |
Occidental Petroleum Corp.,
6.95%, 07/01/2024 | | | 100,000 | | | | 108,624 | |
|
| |
2.90%, 08/15/2024 | | | 184,000 | | | | 184,445 | |
|
| |
| | | | | | | 293,069 | |
|
| |
|
Integrated Telecommunication Services–3.39% | |
Connect Finco S.a.r.l./Connect US Finco LLC (United Kingdom), 6.75%, 10/01/2026(b) | | | 200,000 | | | | 202,700 | |
|
| |
Embarq Corp., 8.00%, 06/01/2036 | | | 162,000 | | | | 160,249 | |
|
| |
Frontier Communications Holdings LLC,
5.00%, 05/01/2028(b) | | | 170,000 | | | | 165,283 | |
|
| |
5.88%, 11/01/2029 | | | 72,000 | | | | 66,370 | |
|
| |
Ligado Networks LLC, 15.50% PIK Rate, 0.00% Cash Rate, 11/01/2023(b)(d) | | | 40,765 | | | | 31,355 | |
|
| |
Telecom Italia S.p.A. (Italy), 5.30%, 05/30/2024(b) | | | 305,000 | | | | 314,242 | |
|
| |
Windstream Escrow LLC/Windstream Escrow Finance Corp., 7.75%, 08/15/2028(b) | | | 221,000 | | | | 223,329 | |
|
| |
| | | | | | | 1,163,528 | |
|
| |
| |
Interactive Home Entertainment–0.70% | | | | | |
Cinemark USA, Inc.,
8.75%, 05/01/2025(b) | | | 100,000 | | | | 104,937 | |
|
| |
5.88%, 03/15/2026(b) | | | 20,000 | | | | 19,720 | |
|
| |
5.25%, 07/15/2028(b) | | | 120,000 | | | | 114,600 | |
|
| |
| | | | | | | 239,257 | |
|
| |
| | |
Interactive Media & Services–0.60% | | | | | | | | |
Audacy Capital Corp., 6.50%, 05/01/2027(b) | | | 102,000 | | | | 97,026 | |
|
| |
Cumulus Media New Holdings, Inc., 6.75%, 07/01/2026(b) | | | 69,000 | | | | 70,277 | |
|
| |
See accompanying Notes to Financial Statements which are an integral part of the financial statements.
| | |
| 9 | | Invesco High Yield Bond Factor Fund |
| | | | | | | | |
| | | Principal
Amount | | | Value | |
|
| |
Interactive Media & Services–(continued) | | | | | |
Diamond Sports Group LLC/Diamond Sports Finance Co., 5.38%, 08/15/2026(b) | | $ | 94,000 | | | $ | 38,702 | |
|
| |
| | | | | | | 206,005 | |
|
| |
| |
Internet & Direct Marketing Retail–0.78% | | | | | |
Photo Holdings Merger Sub, Inc., 8.50%, 10/01/2026(b) | | | 271,000 | | | | 269,612 | |
|
| |
| |
Investment Banking & Brokerage–0.43% | | | | | |
FS Energy and Power Fund, 7.50%, 08/15/2023(b) | | | 115,000 | | | | 118,885 | |
|
| |
NFP Corp., 6.88%, 08/15/2028(b) | | | 32,000 | | | | 29,802 | |
|
| |
| | | | | | | 148,687 | |
|
| |
| | |
Leisure Facilities–0.30% | | | | | | | | |
Vail Resorts, Inc., 6.25%, 05/15/2025(b) | | | 100,000 | | | | 103,133 | |
|
| |
| | |
Metal & Glass Containers–0.85% | | | | | | | | |
Ardagh Packaging Finance PLC/Ardagh Holdings USA, Inc., 5.25%, 08/15/2027(b) | | | 200,000 | | | | 190,335 | |
|
| |
Mauser Packaging Solutions Holding Co., 7.25%, 04/15/2025(b) | | | 34,000 | | | | 33,466 | |
|
| |
TriMas Corp., 4.13%, 04/15/2029(b) | | | 73,000 | | | | 68,832 | |
|
| |
| | | | | | | 292,633 | |
|
| |
| | |
Mortgage REITs–0.31% | | | | | | | | |
New Residential Investment Corp., 6.25%, 10/15/2025(b) | | | 109,000 | | | | 107,026 | |
|
| |
| | |
Movies & Entertainment–0.86% | | | | | | | | |
Banijay Entertainment S.A.S.U. (France), 5.38%, 03/01/2025(b) | | | 200,000 | | | | 198,200 | |
|
| |
Netflix, Inc., 5.75%, 03/01/2024 | | | 92,000 | | | | 97,867 | |
|
| |
| | | | | | | 296,067 | |
|
| |
| | |
Office Services & Supplies–0.98% | | | | | | | | |
ACCO Brands Corp., 4.25%, 03/15/2029(b) | | | 184,000 | | | | 171,920 | |
|
| |
Pitney Bowes, Inc.,
6.88%, 03/15/2027(b) | | | 70,000 | | | | 66,015 | |
|
| |
7.25%, 03/15/2029(b) | | | 105,000 | | | | 99,869 | |
|
| |
| | | | | | | 337,804 | |
|
| |
| | |
Oil & Gas Drilling–0.38% | | | | | | | | |
Harvest Midstream I L.P., 7.50%, 09/01/2028(b) | | | 130,000 | | | | 131,389 | |
|
| |
| |
Oil & Gas Equipment & Services–0.29% | | | | | |
Oceaneering International, Inc., 4.65%, 11/15/2024 | | | 100,000 | | | | 98,540 | |
|
| |
| |
Oil & Gas Exploration & Production–6.32% | | | | | |
Baytex Energy Corp. (Canada), 8.75%, 04/01/2027(b) | | | 114,000 | | | | 122,339 | |
|
| |
CNX Resources Corp., 6.00%, 01/15/2029(b) | | | 110,000 | | | | 112,508 | |
|
| |
CrownRock L.P./CrownRock Finance, Inc., 5.63%, 10/15/2025(b) | | | 103,000 | | | | 104,294 | |
|
| |
Encino Acquisition Partners Holdings LLC, 8.50%, 05/01/2028(b) | | | 148,000 | | | | 150,156 | |
|
| |
Endeavor Energy Resources L.P./EER Finance, Inc., 6.63%, 07/15/2025(b) | | | 68,000 | | | | 71,148 | |
|
| |
EQT Corp., 6.63%, 02/01/2025 | | | 123,000 | | | | 133,007 | |
|
| |
| | | | | | | | |
| | | Principal
Amount | | | Value | |
|
| |
Oil & Gas Exploration & Production–(continued) | |
Genesis Energy L.P./Genesis Energy Finance Corp.,
5.63%, 06/15/2024 | | $ | 185,000 | | | $ | 182,410 | |
|
| |
8.00%, 01/15/2027 | | | 124,000 | | | | 125,550 | |
|
| |
Gulfport Energy Corp.,
8.00%, 05/17/2026 | | | 1,756 | | | | 1,859 | |
|
| |
8.00%, 05/17/2026(b) | | | 39,502 | | | | 41,821 | |
|
| |
Gulfport Energy Operating Corp., 6.38%, 05/15/2025 | | | 135,000 | | | | 682 | |
|
| |
Hilcorp Energy I L.P./Hilcorp Finance Co., 6.25%, 11/01/2028(b) | | | 265,000 | | | | 270,610 | |
|
| |
MEG Energy Corp. (Canada), 6.50%, 01/15/2025(b) | | | 59,000 | | | | 59,992 | |
|
| |
Murphy Oil Corp.,
6.88%, 08/15/2024 | | | 45,000 | | | | 45,561 | |
|
| |
7.05%, 05/01/2029 | | | 80,000 | | | | 84,453 | |
|
| |
6.38%, 12/01/2042 | | | 110,000 | | | | 103,302 | |
|
| |
Par Petroleum LLC/Par Petroleum Finance Corp., 7.75%, 12/15/2025(b) | | | 83,000 | | | | 83,952 | |
|
| |
PDC Energy, Inc.,
6.13%, 09/15/2024 | | | 66,000 | | | | 66,582 | |
|
| |
5.75%, 05/15/2026 | | | 145,000 | | | | 147,362 | |
|
| |
Southwestern Energy Co., 5.95%, 01/23/2025 | | | 71,000 | | | | 74,101 | |
|
| |
Vermilion Energy, Inc. (Canada), 5.63%, 03/15/2025(b) | | | 186,000 | | | | 188,412 | |
|
| |
| | | | | | | 2,170,101 | |
|
| |
|
Oil & Gas Refining & Marketing–2.48% | |
CVR Energy, Inc.,
5.25%, 02/15/2025(b) | | | 97,000 | | | | 94,029 | |
|
| |
5.75%, 02/15/2028(b) | | | 181,000 | | | | 170,842 | |
|
| |
EnLink Midstream Partners L.P.,
4.15%, 06/01/2025 | | | 75,000 | | | | 75,193 | |
|
| |
4.85%, 07/15/2026 | | | 175,000 | | | | 177,403 | |
|
| |
PBF Holding Co. LLC/PBF Finance Corp., 7.25%, 06/15/2025(c) | | | 350,000 | | | | 294,635 | |
|
| |
Weatherford International Ltd., 11.00%, 12/01/2024(b) | | | 40,000 | | | | 41,470 | |
|
| |
| | | | | | | 853,572 | |
|
| |
| |
Oil & Gas Storage & Transportation–2.35% | | | | | |
Buckeye Partners L.P., 4.13%, 03/01/2025(b) | | | 100,000 | | | | 99,821 | |
|
| |
EnLink Midstream LLC, 5.38%,
06/01/2029 | | | 109,000 | | | | 108,627 | |
|
| |
EQM Midstream Partners L.P., 4.00%, 08/01/2024 | | | 100,000 | | | | 98,126 | |
|
| |
Tallgrass Energy Partners L.P./Tallgrass Energy Finance Corp.,
6.00%, 03/01/2027(b) | | | 70,000 | | | | 70,115 | |
|
| |
5.50%, 01/15/2028(b) | | | 269,000 | | | | 259,644 | |
|
| |
Western Midstream Operating L.P., 3.60%, 02/01/2025 | | | 172,000 | | | | 172,646 | |
|
| |
| | | | | | | 808,979 | |
|
| |
| |
Other Diversified Financial Services–1.90% | | | | | |
CNG Holdings, Inc., 12.50%, 06/15/2024(b) | | | 43,000 | | | | 40,524 | |
|
| |
Global Aircraft Leasing Co. Ltd. (Cayman Islands), 7.25% PIK Rate, 6.50% Cash Rate, 09/15/2024(b)(d) | | | 275,642 | | | | 262,322 | |
|
| |
See accompanying Notes to Financial Statements which are an integral part of the financial statements.
| | |
| 10 | | Invesco High Yield Bond Factor Fund |
| | | | | | | | |
| | | Principal
Amount | | | Value | |
|
| |
Other Diversified Financial Services–(continued) | |
Midcap Financial Issuer Trust, 5.63%, 01/15/2030(b) | | $ | 200,000 | | | $ | 182,869 | |
|
| |
Operadora de Servicios Mega S.A. de C.V. Sofom ER (Mexico), 8.25%, 02/11/2025(b) | | | 200,000 | | | | 168,133 | |
|
| |
| | | | | | | 653,848 | |
|
| |
| | |
Packaged Foods & Meats–0.37% | | | | | | | | |
Kraft Heinz Foods Co. (The), 3.00%, 06/01/2026 | | | 129,000 | | | | 129,074 | |
|
| |
| | |
Paper Packaging–0.57% | | | | | | | | |
Graphic Packaging International LLC, 4.13%, 08/15/2024 | | | 68,000 | | | | 70,274 | |
|
| |
Sealed Air Corp., 5.13%, 12/01/2024(b) | | | 120,000 | | | | 124,342 | |
|
| |
| | | | | | | 194,616 | |
|
| |
| | |
Paper Products–0.70% | | | | | | | | |
Clearwater Paper Corp., 5.38%, 02/01/2025(b) | | | 68,000 | | | | 70,403 | |
|
| |
Domtar Corp., 6.75%, 10/01/2028(b)(c) | | | 93,000 | | | | 93,073 | |
|
| |
Sylvamo Corp., 7.00%, 09/01/2029(b) | | | 76,000 | | | | 76,285 | |
|
| |
| | | | | | | 239,761 | |
|
| |
| | |
Personal Products–2.08% | | | | | | | | |
Avon Products, Inc. (United Kingdom), 8.45%, 03/15/2043 | | | 107,000 | | | | 127,486 | |
|
| |
Edgewell Personal Care Co.,
5.50%, 06/01/2028(b) | | | 134,000 | | | | 134,863 | |
|
| |
4.13%, 04/01/2029(b) | | | 77,000 | | | | 72,439 | |
|
| |
Herbalife Nutrition Ltd./HLF Financing, Inc., 7.88%, 09/01/2025(b) | | | 199,000 | | | | 208,939 | |
|
| |
Oriflame Investment Holding PLC (Switzerland), 5.13%, 05/04/2026(b) | | | 200,000 | | | | 169,500 | |
|
| |
| | | | | | | 713,227 | |
|
| |
| | |
Pharmaceuticals–3.30% | | | | | | | | |
Bausch Health Cos., Inc.,
5.50%, 11/01/2025(b) | | | 173,000 | | | | 173,825 | |
|
| |
5.00%, 01/30/2028(b) | | | 153,000 | | | | 128,398 | |
|
| |
6.25%, 02/15/2029(b) | | | 195,000 | | | | 166,593 | |
|
| |
7.25%, 05/30/2029(b) | | | 60,000 | | | | 52,611 | |
|
| |
5.25%, 01/30/2030(b) | | | 233,000 | | | | 188,248 | |
|
| |
Elanco Animal Health, Inc., 6.40%, 08/28/2028 | | | 16,000 | | | | 17,365 | |
|
| |
Endo Luxembourg Finance Co. I S.a.r.l./Endo US, Inc., 6.13%, 04/01/2029(b) | | | 160,000 | | | | 150,631 | |
|
| |
P&L Development LLC/PLD Finance Corp., 7.75%, 11/15/2025(b) | | | 130,000 | | | | 124,380 | |
|
| |
Par Pharmaceutical, Inc., 7.50%, 04/01/2027(b) | | | 130,000 | | | | 130,364 | |
|
| |
| | | | | | | 1,132,415 | |
|
| |
| | |
Precious Metals & Minerals–0.00% | | | | | | | | |
Northwest Acquisitions ULC/Dominion Finco, Inc., 7.13%, 11/01/2022(b)(e) | | | 142,000 | | | | 9 | |
|
| |
| | |
Property & Casualty Insurance–0.21% | | | | | | | | |
MBIA, Inc., 5.70%, 12/01/2034 | | | 73,000 | | | | 71,167 | |
|
| |
| | |
Regional Banks–0.37% | | | | | | | | |
Synovus Financial Corp., 5.90%, 02/07/2029(f) | | | 120,000 | | | | 125,908 | |
|
| |
| | | | | | | | |
| | | Principal
Amount | | | Value | |
|
| |
Restaurants–1.59% | | | | | | | | |
Aramark Services, Inc.,
5.00%, 04/01/2025(b) | | $ | 196,000 | | | $ | 197,629 | |
|
| |
6.38%, 05/01/2025(b) | | | 143,000 | | | | 148,269 | |
|
| |
Brinker International, Inc., 5.00%, 10/01/2024(b) | | | 70,000 | | | | 71,781 | |
|
| |
Yum! Brands, Inc., 7.75%, 04/01/2025(b) | | | 123,000 | | | | 128,236 | |
|
| |
| | | | | | | 545,915 | |
|
| |
| | |
Security & Alarm Services–1.19% | | | | | | | | |
CoreCivic, Inc.,
4.63%, 05/01/2023 | | | 192,000 | | | | 192,285 | |
|
| |
4.75%, 10/15/2027 | | | 75,000 | | | | 66,538 | |
|
| |
Prime Security Services Borrower LLC/Prime Finance, Inc., 5.25%, 04/15/2024(b) | | | 147,000 | | | | 150,133 | |
|
| |
| | | | | | | 408,956 | |
|
| |
| | |
Specialized REITs–0.90% | | | | | | | | |
Iron Mountain, Inc.,
4.88%, 09/15/2029(b) | | | 147,000 | | | | 142,453 | |
|
| |
5.25%, 07/15/2030(b) | | | 167,000 | | | | 165,948 | |
|
| |
| | | | | | | 308,401 | |
|
| |
| | |
Specialty Chemicals–0.65% | | | | | | | | |
Rayonier A.M. Products, Inc., 7.63%, 01/15/2026(b) | | | 222,000 | | | | 222,417 | |
|
| |
| | |
Specialty Stores–1.16% | | | | | | | | |
LSF9 Atlantis Holdings LLC/Victra Finance Corp., 7.75%, 02/15/2026(b) | | | 118,000 | | | | 113,799 | |
|
| |
Michaels Cos., Inc. (The), 7.88%, 05/01/2029(b) | | | 36,000 | | | | 31,567 | |
|
| |
Staples, Inc., 7.50%, 04/15/2026(b) | | | 257,000 | | | | 254,396 | |
|
| |
| | | | | | | 399,762 | |
|
| |
| | |
Steel–1.79% | | | | | | | | |
Carpenter Technology Corp., 6.38%, 07/15/2028 | | | 204,000 | | | | 206,010 | |
|
| |
Cleveland-Cliffs, Inc., 6.75%, 03/15/2026(b) | | | 237,000 | | | | 250,059 | |
|
| |
Infrabuild Australia Pty. Ltd. (Australia), 12.00%, 10/01/2024(b) | | | 69,000 | | | | 70,758 | |
|
| |
SunCoke Energy, Inc., 4.88%, 06/30/2029(b) | | | 92,000 | | | | 88,388 | |
|
| |
| | | | | | | 615,215 | |
|
| |
| | |
Systems Software–0.48% | | | | | | | | |
Veritas US, Inc./Veritas Bermuda Ltd., 7.50%, 09/01/2025(b) | | | 166,000 | | | | 164,390 | |
|
| |
|
Technology Hardware, Storage & Peripherals–1.29% | |
Diebold Nixdorf, Inc., 9.38%, 07/15/2025(b) | | | 107,000 | | | | 110,907 | |
|
| |
Xerox Corp., 6.75%, 12/15/2039 | | | 266,000 | | | | 266,485 | |
|
| |
Xerox Holdings Corp., 5.50%, 08/15/2028(b) | | | 65,000 | | | | 64,950 | |
|
| |
| | | | | | | 442,342 | |
|
| |
| | |
Thrifts & Mortgage Finance–1.12% | | | | | | | | |
Enact Holdings, Inc., 6.50%, 08/15/2025(b) | | | 90,000 | | | | 93,258 | |
|
| |
MGIC Investment Corp., 5.75%, 08/15/2023 | | | 88,000 | | | | 91,852 | |
|
| |
NMI Holdings, Inc., 7.38%, 06/01/2025(b) | | | 82,000 | | | | 88,243 | |
|
| |
See accompanying Notes to Financial Statements which are an integral part of the financial statements.
| | |
| 11 | | Invesco High Yield Bond Factor Fund |
| | | | | | | | |
| | | Principal
Amount | | | Value | |
|
| |
Thrifts & Mortgage Finance–(continued) | |
Radian Group, Inc., 6.63%, 03/15/2025 | | $ | 104,000 | | | $ | 110,238 | |
|
| |
| | | | | | | 383,591 | |
|
| |
| | |
Tobacco–0.32% | | | | | | | | |
Vector Group Ltd., 5.75%, 02/01/2029(b) | | | 118,000 | | | | 109,061 | |
|
| |
|
Wireless Telecommunication Services–2.80% | |
Sprint Corp.,
7.88%, 09/15/2023 | | | 155,000 | | | | 166,818 | |
|
| |
7.13%, 06/15/2024 | | | 200,000 | | | | 216,500 | |
|
| |
7.63%, 02/15/2025 | | | 145,000 | | | | 160,769 | |
|
| |
T-Mobile USA, Inc., 2.25%, 02/15/2026 | | | 51,000 | | | | 49,273 | |
|
| |
VEON Holdings B.V. (Netherlands), 4.95%, 06/16/2024(b) | | | 200,000 | | | | 112,000 | |
|
| |
Vmed O2 UK Financing I PLC (United Kingdom), 4.25%, 01/31/2031(b) | | | 277,000 | | | | 255,253 | |
|
| |
| | | | | | | 960,613 | |
|
| |
Total U.S. Dollar Denominated Bonds & Notes (Cost $33,127,560) | | | | 32,016,101 | |
|
| |
| | |
| | | Shares | | | | |
|
Exchange-Traded Funds–3.09% | |
Invesco High Yield Bond Factor ETF
(Cost $1,109,352)(h) | | | 43,455 | | | | 1,059,867 | |
|
| |
|
Common Stocks & Other Equity Interests–0.46% | |
Advertising–0.00% | |
Cxloyalty Group, Inc., Wts., expiring 04/10/2024(i) | | | 39 | | | | 0 | |
|
| |
|
Apparel, Accessories & Luxury Goods–0.02% | |
Claire’s Holdings LLC | | | 20 | | | | 6,550 | |
|
| |
| | |
Coal & Consumable Fuels–0.03% | | | | | | | | |
ACNR Holdings, Inc.(i) | | | 232 | | | | 12,064 | |
|
| |
| |
Oil & Gas Equipment & Services–0.10% | | | | | |
Superior Energy Services, Inc.(i) | | | 761 | | | | 34,245 | |
|
| |
| |
Oil & Gas Exploration & Production–0.31% | | | | | |
Gulfport Energy Corp.(j) | | | 1,549 | | | | 106,850 | |
|
| |
Total Common Stocks & Other Equity Interests
(Cost $101,607) | | | | 159,709 | |
|
| |
Investment Abbreviations:
| | |
| ETF | | – Exchange-Traded Fund |
| LIBOR | | – London Interbank Offered Rate |
| Pfd. | | – Preferred |
| PIK | | – Pay-in-Kind |
| REIT | | – Real Estate Investment Trust |
| USD | | – U.S. Dollar |
| Wts. | | – Warrants |
| | | | | | | | |
| | | Principal
Amount | | | Value | |
|
| |
U.S. Treasury Securities–0.24% | |
U.S. Treasury Bills–0.24% | | | | | | | | |
0.41%, 05/26/2022 | | | | | | | | |
(Cost $83,917)(k)(l) | | $ | 84,000 | | | $ | 83,938 | |
|
| |
|
Variable Rate Senior Loan Interests–0.04%(m)(n) | |
Apparel, Accessories & Luxury Goods–0.04% | |
Claire’s Stores, Inc., Term Loan, 6.71% (1 mo. USD LIBOR + 6.50%), 12/18/2026
(Cost $10,661) | | | 12,360 | | | | 12,274 | |
|
| |
| | |
| | | Shares | | | | |
Preferred Stocks–0.00% | | | | | | | | |
Apparel, Accessories & Luxury Goods–0.00% | |
Claire’s Holdings LLC, Series A, Pfd.
(Cost $3,125) | | | 5 | | | | 1,294 | |
|
| |
| |
Money Market Funds–0.68% | | | | | |
Invesco Government & Agency Portfolio, Institutional Class, 0.03%(h)(o) | | | 82,499 | | | | 82,499 | |
|
| |
Invesco Liquid Assets Portfolio, Institutional Class, 0.01%(h)(o) | | | 57,351 | | | | 57,351 | |
|
| |
Invesco Treasury Portfolio, Institutional Class, 0.01%(h)(o) | | | 94,285 | | | | 94,285 | |
|
| |
Total Money Market Funds (Cost $234,135) | | | | 234,135 | |
|
| |
TOTAL INVESTMENTS IN SECURITIES
(excluding investments purchased with cash collateral from securities on loan)–97.70% (Cost $34,670,357) | | | | | | | 33,567,318 | |
|
| |
|
Investments Purchased with Cash Collateral from Securities on Loan | |
Money Market Funds–1.89% | |
Invesco Private Government Fund,
0.12%(h)(o)(p) | | | 194,457 | | | | 194,457 | |
|
| |
Invesco Private Prime Fund,
0.08%(h)(o)(p) | | | 453,688 | | | | 453,733 | |
|
| |
Total Investments Purchased with Cash Collateral from Securities on Loan
(Cost $648,192) | | | | 648,190 | |
|
| |
TOTAL INVESTMENTS IN SECURITIES–99.59%
(Cost $35,318,549) | | | | 34,215,508 | |
|
| |
OTHER ASSETS LESS LIABILITIES–0.41% | | | | 139,378 | |
|
| |
NET ASSETS–100.00% | | | $ | 34,354,886 | |
|
| |
See accompanying Notes to Financial Statements which are an integral part of the financial statements.
| | |
| 12 | | Invesco High Yield Bond Factor Fund |
Notes to Schedule of Investments:
| (a) | Industry and/or sector classifications used in this report are generally according to the Global Industry Classification Standard, which was developed by and is the exclusive property and a service mark of MSCI Inc. and Standard & Poor’s. |
| (b) | Security purchased or received in a transaction exempt from registration under the Securities Act of 1933, as amended (the “1933 Act”). The security may be resold pursuant to an exemption from registration under the 1933 Act, typically to qualified institutional buyers. The aggregate value of these securities at February 28, 2022 was $21,327,693, which represented 62.08% of the Fund’s Net Assets. |
| (c) | All or a portion of this security was out on loan at February 28, 2022. |
| (d) | All or a portion of this security is Pay-in-Kind. Pay-in-Kind securities pay interest income in the form of securities. |
| (e) | Defaulted security. Currently, the issuer is in default with respect to principal and/or interest payments. The aggregate value of these securities at February 28, 2022 was $676, which represented less than 1% of the Fund’s Net Assets. |
| (f) | Security issued at a fixed rate for a specific period of time, after which it will convert to a variable rate. |
| (g) | Perpetual bond with no specified maturity date. |
| (h) | Affiliated issuer. The issuer and/or the Fund is a wholly-owned subsidiary of Invesco Ltd., or is affiliated by having an investment adviser that is under common control of Invesco Ltd. The table below shows the Fund’s transactions in, and earnings from, its investments in affiliates for the fiscal year ended February 28, 2022. |
| | | | | | | | | | | | | | | | | | | | | | | | | | | | | | | | | | | |
| | | Value
February 28, 2021 | | Purchases
at Cost | | Proceeds
from Sales | | Change in
Unrealized
Appreciation
(Depreciation) | | Realized
Gain
(Loss) | | Value
February 28, 2022 | | Dividend Income |
| Invesco High Yield Bond Factor ETF | | | | $ 988,545 | | | | | $ 792,089 | | | | | $ (673,639 | ) | | | | $(40,513 | ) | | | | $(6,615 | ) | | | | $1,059,867 | | | | | $52,267 | |
| Investments in Affiliated Money Market Funds: | | | | | | | | | | | | | | | | | | | | | | | | | | | | | | | | | | | |
Invesco Government & Agency Portfolio, Institutional Class | | | | 156,793 | | | | | 5,244,031 | | | | | (5,318,325 | ) | | | | - | | | | | - | | | | | 82,499 | | | | | 30 | |
Invesco Liquid Assets Portfolio, Institutional Class | | | | 111,978 | | | | | 3,732,713 | | | | | (3,787,312 | ) | | | | - | | | | | (28) | | | | | 57,351 | | | | | 12 | |
Invesco Treasury Portfolio, Institutional Class | | | | 179,192 | | | | | 5,993,178 | | | | | (6,078,085 | ) | | | | - | | | | | - | | | | | 94,285 | | | | | 14 | |
| Investments Purchased with Cash Collateral from Securities on Loan: | | | | | | | | | | | | | | | | | | | | | | | | | | | | | | | | | | | |
Invesco Private Government Fund | | | | - | | | | | 1,294,674 | | | | | (1,100,217 | ) | | | | - | | | | | - | | | | | 194,457 | | | | | 18* | |
Invesco Private Prime Fund | | | | - | | | | | 2,237,598 | | | | | (1,783,784 | ) | | | | (2 | ) | | | | (79 | ) | | | | 453,733 | | | | | 121* | |
Total | | | | $1,436,508 | | | | | $19,294,283 | | | | | $(18,741,362 | ) | | | | $(40,515 | ) | | | | $(6,722 | ) | | | | $1,942,192 | | | | | $52,462 | |
| | * | Represents the income earned on the investment of cash collateral, which is included in securities lending income on the Statement of Operations. Does not include rebates and fees paid to lending agent or premiums received from borrowers, if any. |
| (i) | Security valued using significant unobservable inputs (Level 3). See Note 3. |
| (j) | Non-income producing security. |
| (k) | All or a portion of the value was pledged as collateral to cover margin requirements for open futures contracts. See Note 1K. |
| (l) | Security traded on a discount basis. The interest rate shown represents the discount rate at the time of purchase by the Fund. |
| (m) | Variable rate senior loan interests often require prepayments from excess cash flow or permit the borrower to repay at its election. The degree to which borrowers repay, whether as a contractual requirement or at their election, cannot be predicted with any accuracy. As a result, the actual remaining maturity may be substantially less than the stated maturities shown. However, it is anticipated that the variable rate senior loan interests will have an expected average life of three to five years. |
| (n) | Variable rate senior loan interests are, at present, not readily marketable, not registered under the 1933 Act and may be subject to contractual and legal restrictions on sale. Variable rate senior loan interests in the Fund’s portfolio generally have variable rates which adjust to a base, such as the London Interbank Offered Rate (“LIBOR”), on set dates, typically every 30 days, but not greater than one year, and/or have interest rates that float at margin above a widely recognized base lending rate such as the Prime Rate of a designated U.S. bank. |
| (o) | The rate shown is the 7-day SEC standardized yield as of February 28, 2022. |
| (p) | The security has been segregated to satisfy the commitment to return the cash collateral received in securities lending transactions upon the borrower’s return of the securities loaned. See Note 1J. |
| | | | | | | | | | | | | | | | | | | | |
| Open Futures Contracts | |
| Long Futures Contracts | | Number of
Contracts | | | Expiration
Month | | | Notional
Value | | | Value | | | Unrealized
Appreciation
(Depreciation) | |
| Interest Rate Risk | | | | | | | | | | | | | | | | | | | | |
U.S. Treasury 5 Year Notes | | | 9 | | | | June-2022 | | | $ | 1,064,531 | | | $ | 4,859 | | | | $ 4,859 | |
U.S. Treasury 10 Year Notes | | | 17 | | | | June-2022 | | | | 2,166,437 | | | | 18,328 | | | | 18,328 | |
U.S. Treasury 10 Year Ultra Notes | | | 11 | | | | June-2022 | | | | 1,554,609 | | | | 18,059 | | | | 18,059 | |
U.S. Treasury Long Bonds | | | 1 | | | | June-2022 | | | | 156,688 | | | | 2,352 | | | | 2,352 | |
U.S. Treasury Ultra Bonds | | | 1 | | | | June-2022 | | | | 185,938 | | | | 2,211 | | | | 2,211 | |
Subtotal–Long Futures Contracts | | | | | | | | | | | | | | | 45,809 | | | | 45,809 | |
| | | | | |
| Short Futures Contracts | | | | | | | | | | | | | | | | | | | | |
| Interest Rate Risk | | | | | | | | | | | | | | | | | | | | |
U.S. Treasury 2 Year Notes | | | 16 | | | | June-2022 | | | | (3,443,625 | ) | | | (11,750 | ) | | | (11,750 | ) |
Total Futures Contracts | | | | | | | | | | | | | | $ | 34,059 | | | | $34,059 | |
See accompanying Notes to Financial Statements which are an integral part of the financial statements.
| | |
| 13 | | Invesco High Yield Bond Factor Fund |
| | | | | | | | | | | | | | | | | | | | | | | | | | | | | | | | | | | | | | | | | | | | | |
| Open Centrally Cleared Credit Default Swap Agreements(a) |
| Reference Entity | | Buy/Sell
Protection | | (Pay)/
Receive
Fixed
Rate | | Payment
Frequency | | Maturity Date | | Implied
Credit
Spread(b) | | Notional Value | | Upfront
Payments Paid
(Received) | | Value | | Unrealized
Appreciation
(Depreciation) |
Credit Risk | | | | | | | | | | | | | | | | | | | | | | | | | | | | | | | | | | | | | | | | | | | | | |
Markit CDX North America High Yield Index, Series 37, Version 1 | | | | Sell | | | | | 5.00 | % | | | | Quarterly | | | | | 12/20/2026 | | | | | 3.636 | % | | | | USD 1,000,000 | | | | $ | 65,064 | | | | $ | 55,637 | | | | | $ | (9,427) |
| (a) | Centrally cleared swap agreements collateralized by $57,815 cash held with Citigroup Global Markets Inc. |
| (b) | Implied credit spreads represent the current level, as of February 28, 2022, at which protection could be bought or sold given the terms of the existing credit default swap agreement and serve as an indicator of the current status of the payment/performance risk of the credit default swap agreement. An implied credit spread that has widened or increased since entry into the initial agreement may indicate a deteriorating credit profile and increased risk of default for the reference entity. A declining or narrowing spread may indicate an improving credit profile or decreased risk of default for the reference entity. Alternatively, credit spreads may increase or decrease reflecting the general tolerance for risk in the credit markets generally. |
Abbreviations:
USD – U.S. Dollar
See accompanying Notes to Financial Statements which are an integral part of the financial statements.
| | |
| 14 | | Invesco High Yield Bond Factor Fund |
Statement of Assets and Liabilities
February 28, 2022
| | | | |
Assets: | | | | |
| |
Investments in unaffiliated securities, at value
(Cost $ 33,326,870)* | | $ | 32,273,316 | |
|
| |
Investments in affiliates, at value
(Cost $ 1,991,679) | | | 1,942,192 | |
|
| |
Other investments: | | | | |
Variation margin receivable – futures contracts | | | 45,171 | |
|
| |
Deposits with brokers: | | | | |
Cash collateral – centrally cleared swap agreements | | | 57,815 | |
|
| |
Cash | | | 304,959 | |
|
| |
Receivable for: | | | | |
Investments sold | | | 106,072 | |
|
| |
Fund shares sold | | | 22,371 | |
|
| |
Dividends | | | 724 | |
|
| |
Interest | | | 527,933 | |
|
| |
Investment for trustee deferred compensation and retirement plans | | | 23,795 | |
|
| |
Other assets | | | 18,925 | |
|
| |
Total assets | | | 35,323,273 | |
|
| |
| |
Liabilities: | | | | |
Other investments: | | | | |
Variation margin payable – centrally cleared swap agreements | | | 28,824 | |
|
| |
| |
Payable for: | | | | |
Investments purchased | | | 101,007 | |
|
| |
Dividends | | | 25,406 | |
|
| |
Fund shares reacquired | | | 31,356 | |
|
| |
Collateral upon return of securities loaned | | | 648,192 | |
|
| |
Accrued fees to affiliates | | | 14,881 | |
|
| |
Accrued trustees’ and officers’ fees and benefits | | | 3,155 | |
|
| |
Accrued other operating expenses | | | 91,771 | |
|
| |
Trustee deferred compensation and retirement plans | | | 23,795 | |
|
| |
Total liabilities | | | 968,387 | |
|
| |
Net assets applicable to shares outstanding | | $ | 34,354,886 | |
|
| |
| | | | |
Net assets consist of: | | | | |
| |
Shares of beneficial interest | | $ | 39,690,856 | |
|
| |
Distributable earnings (loss) | | | (5,335,970 | ) |
|
| |
| | $ | 34,354,886 | |
|
| |
| |
Net Assets: | | | | |
| |
Class A | | $ | 23,142,845 | |
|
| |
Class C | | $ | 4,416,525 | |
|
| |
Class R | | $ | 3,806,888 | |
|
| |
Class Y | | $ | 2,898,571 | |
|
| |
Class R5 | | $ | 9,812 | |
|
| |
Class R6 | | $ | 80,245 | |
|
| |
|
Shares outstanding, no par value, with an unlimited number of shares authorized: | |
| |
Class A | | | 2,616,053 | |
|
| |
Class C | | | 499,376 | |
|
| |
Class R | | | 430,179 | |
|
| |
Class Y | | | 327,532 | |
|
| |
Class R5 | | | 1,109 | |
|
| |
Class R6 | | | 9,068 | |
|
| |
Class A: | | | | |
Net asset value per share | | $ | 8.85 | |
|
| |
Maximum offering price per share
(Net asset value of $8.85 ÷ 95.75%) | | $ | 9.24 | |
|
| |
Class C: | | | | |
Net asset value and offering price per share | | $ | 8.84 | |
|
| |
Class R: | | | | |
Net asset value and offering price per share | | $ | 8.85 | |
|
| |
Class Y: | | | | |
Net asset value and offering price per share | | $ | 8.85 | |
|
| |
Class R5: | | | | |
Net asset value and offering price per share | | $ | 8.85 | |
|
| |
Class R6: | | | | |
Net asset value and offering price per share | | $ | 8.85 | |
|
| |
| * | At February 28, 2022, securities with an aggregate value of $620,334 were on loan to brokers. |
See accompanying Notes to Financial Statements which are an integral part of the financial statements.
| | |
| 15 | | Invesco High Yield Bond Factor Fund |
Statement of Operations
For the year ended February 28, 2022
| | | | |
Investment income: | | | | |
| |
Interest | | $ | 1,808,671 | |
|
| |
Dividends from affiliates (includes securities lending income of $3,180) | | | 55,503 | |
|
| |
Other income | | | 8,288 | |
|
| |
Total investment income | | | 1,872,462 | |
|
| |
| |
Expenses: | | | | |
| |
Advisory fees | | | 137,585 | |
|
| |
Administrative services fees | | | 5,321 | |
|
| |
Distribution fees: | | | | |
Class A | | | 60,371 | |
|
| |
Class C | | | 51,027 | |
|
| |
Class R | | | 17,541 | |
|
| |
Transfer agent fees – A, C, R and Y | | | 46,053 | |
|
| |
Transfer agent fees – R5 | | | 5 | |
|
| |
Transfer agent fees – R6 | | | 30 | |
|
| |
Trustees’ and officers’ fees and benefits | | | 23,078 | |
|
| |
Registration and filing fees | | | 84,847 | |
|
| |
Professional services fees | | | 104,246 | |
|
| |
Other | | | (35,891 | ) |
|
| |
Total expenses | | | 494,213 | |
|
| |
Less: Fees waived, expenses reimbursed and/or expense offset arrangement(s) | | | (220,270 | ) |
|
| |
Net expenses | | | 273,943 | |
|
| |
Net investment income | | | 1,598,519 | |
|
| |
| |
Realized and unrealized gain (loss) from: | | | | |
| |
Net realized gain (loss) from: | | | | |
Unaffiliated investment securities | | | 474,191 | |
|
| |
Affiliated investment securities | | | (6,722 | ) |
|
| |
Futures contracts | | | (51,239 | ) |
|
| |
Swap agreements | | | 19,966 | |
|
| |
| | | 436,196 | |
|
| |
Change in net unrealized appreciation (depreciation) of: | | | | |
Unaffiliated investment securities | | | (2,025,629 | ) |
|
| |
Affiliated investment securities | | | (40,515 | ) |
|
| |
Futures contracts | | | 67,999 | |
|
| |
Swap agreements | | | (9,427 | ) |
|
| |
| | | (2,007,572 | ) |
|
| |
Net realized and unrealized gain (loss) | | | (1,571,376 | ) |
|
| |
Net increase in net assets resulting from operations | | $ | 27,143 | |
|
| |
See accompanying Notes to Financial Statements which are an integral part of the financial statements.
| | |
| 16 | | Invesco High Yield Bond Factor Fund |
Statement of Changes in Net Assets
For the years ended February 28, 2022 and 2021
| | | | | | | | |
| | | 2022 | | | 2021 | |
|
| |
Operations: | | | | | | | | |
| | |
Net investment income | | $ | 1,598,519 | | | $ | 1,676,813 | |
|
| |
Net realized gain (loss) | | | 436,196 | | | | (842,053 | ) |
|
| |
Change in net unrealized appreciation (depreciation) | | | (2,007,572 | ) | | | 1,740,510 | |
|
| |
Net increase in net assets resulting from operations | | | 27,143 | | | | 2,575,270 | |
|
| |
| | |
Distributions to shareholders from distributable earnings: | | | | | | | | |
| | |
Class A | | | (1,131,081 | ) | | | (1,247,439 | ) |
|
| |
Class C | | | (184,884 | ) | | | (250,179 | ) |
|
| |
Class R | | | (144,223 | ) | | | (152,928 | ) |
|
| |
Class Y | | | (119,542 | ) | | | (72,282 | ) |
|
| |
Class R5 | | | (474 | ) | | | (552 | ) |
|
| |
Class R6 | | | (2,667 | ) | | | (3,056 | ) |
|
| |
Total distributions from distributable earnings | | | (1,582,871 | ) | | | (1,726,436 | ) |
|
| |
| | |
Return of capital: | | | | | | | | |
| | |
Class A | | | – | | | | (47,219 | ) |
|
| |
Class C | | | – | | | | (9,470 | ) |
|
| |
Class R | | | – | | | | (5,789 | ) |
|
| |
Class Y | | | – | | | | (2,736 | ) |
|
| |
Class R5 | | | – | | | | (21 | ) |
|
| |
Class R6 | | | – | | | | (116 | ) |
|
| |
Total return of capital | | | – | | | | (65,351 | ) |
|
| |
Total distributions | | | (1,582,871 | ) | | | (1,791,787 | ) |
|
| |
| | |
Share transactions–net: | | | | | | | | |
| | |
Class A | | | (1,629,812 | ) | | | 1,798,731 | |
|
| |
Class C | | | (606,991 | ) | | | (580,687 | ) |
|
| |
Class R | | | 817,615 | | | | (32,303 | ) |
|
| |
Class Y | | | 1,631,535 | | | | 266,472 | |
|
| |
Class R6 | | | 61,568 | | | | (86,123 | ) |
|
| |
Net increase in net assets resulting from share transactions | | | 273,915 | | | | 1,366,090 | |
|
| |
Net increase (decrease) in net assets | | | (1,281,813 | ) | | | 2,149,573 | |
|
| |
| | |
Net assets: | | | | | | | | |
| | |
Beginning of year | | | 35,636,699 | | | | 33,487,126 | |
|
| |
End of year | | $ | 34,354,886 | | | $ | 35,636,699 | |
|
| |
See accompanying Notes to Financial Statements which are an integral part of the financial statements.
| | |
| 17 | | Invesco High Yield Bond Factor Fund |
Financial Highlights
The following schedule presents financial highlights for a share of the Fund outstanding throughout the periods indicated.
| | | | | | | | | | | | | | | | | | | | | | | | | | | | | | | | | | | | | | | | | | | | | | | | | | | | | | | | |
| | | Net asset value, beginning of period | | Net investment income(a) | | Net gains (losses) on securities (both realized and unrealized) | | Total from investment operations | | Dividends from net investment income | | Return of
capital | | Total distributions | | Net asset value, end of period | | Total return(b) | | Net assets, end of period (000’s omitted) | | Ratio of expenses to average net assets with fee waivers and/or expenses absorbed | | Ratio of expenses to average net assets without fee waivers and/or expenses absorbed | | Ratio of net investment income to average net assets | | Portfolio turnover (c) |
Class A | | | | | | | | | | | | | | | | | | | | | | | | | | | | | | | | | | | | | | | | | | | | | | | | | | | | | | | | |
Year ended 02/28/22 | | | $9.24 | | | | $0.41 | | | | $(0.40 | ) | | | $0.01 | | | | $(0.40 | ) | | | $ – | | | | $(0.40 | ) | | | $8.85 | | | | 0.06 | %(d) | | | $23,143 | | | | 0.63 | %(d) | | | 1.21 | %(d) | | | 4.41 | %(d) | | | 63 | % |
Year ended 02/28/21 | | | 8.99 | | | | 0.46 | | | | 0.29 | | | | 0.75 | | | | (0.48 | ) | | | (0.02 | ) | | | (0.50 | ) | | | 9.24 | | | | 8.73 | (d) | | | 25,804 | | | | 0.64 | (d) | | | 2.07 | (d) | | | 5.29 | (d) | | | 161 | |
Nine months ended 02/29/20 | | | 8.96 | | | | 0.32 | | | | 0.04 | | | | 0.36 | | | | (0.31 | ) | | | (0.02 | ) | | | (0.33 | ) | | | 8.99 | | | | 4.04 | | | | 23,445 | | | | 2.40 | (e) | | | 2.40 | (e) | | | 4.72 | (e) | | | 127 | |
Year ended 05/31/19 | | | 9.17 | | | | 0.51 | | | | (0.21 | ) | | | 0.30 | | | | (0.51 | ) | | | – | | | | (0.51 | ) | | | 8.96 | | | | 3.42 | | | | 22,791 | | | | 1.78 | | | | 1.78 | | | | 5.61 | | | | 56 | |
Year ended 05/31/18 | | | 9.51 | | | | 0.49 | | | | (0.34 | ) | | | 0.15 | | | | (0.49 | ) | | | – | | | | (0.49 | ) | | | 9.17 | | | | 1.61 | | | | 21,669 | | | | 1.68 | | | | 1.68 | | | | 5.19 | | | | 71 | |
Year ended 05/31/17 | | | 9.07 | | | | 0.45 | | | | 0.45 | | | | 0.90 | | | | (0.46 | ) | | | – | | | | (0.46 | ) | | | 9.51 | | | | 10.08 | | | | 27,376 | | | | 1.59 | | | | 1.59 | | | | 4.85 | | | | 89 | |
Class C | | | | | | | | | | | | | | | | | | | | | | | | | | | | | | | | | | | | | | | | | | | | | | | | | | | | | | | | |
Year ended 02/28/22 | | | 9.23 | | | | 0.34 | | | | (0.40 | ) | | | (0.06 | ) | | | (0.33 | ) | | | – | | | | (0.33 | ) | | | 8.84 | | | | (0.69 | ) | | | 4,417 | | | | 1.38 | | | | 1.98 | | | | 3.66 | | | | 63 | |
Year ended 02/28/21 | | | 8.98 | | | | 0.40 | | | | 0.28 | | | | 0.68 | | | | (0.41 | ) | | | (0.02 | ) | | | (0.43 | ) | | | 9.23 | | | | 7.93 | | | | 5,224 | | | | 1.39 | | | | 2.84 | | | | 4.54 | | | | 161 | |
Nine months ended 02/29/20 | | | 8.96 | | | | 0.27 | | | | 0.03 | | | | 0.30 | | | | (0.27 | ) | | | (0.01 | ) | | | (0.28 | ) | | | 8.98 | | | | 3.39 | | | | 5,719 | | | | 3.17 | (e) | | | 3.17 | (e) | | | 4.02 | (e) | | | 127 | |
Year ended 05/31/19 | | | 9.16 | | | | 0.44 | | | | (0.19 | ) | | | 0.25 | | | | (0.45 | ) | | | – | | | | (0.45 | ) | | | 8.96 | | | | 2.81 | | | | 6,484 | | | | 2.57 | | | | 2.57 | | | | 4.91 | | | | 56 | |
Year ended 05/31/18 | | | 9.50 | | | | 0.42 | | | | (0.33 | ) | | | 0.09 | | | | (0.43 | ) | | | – | | | | (0.43 | ) | | | 9.16 | | | | 0.90 | | | | 6,972 | | | | 2.47 | | | | 2.47 | | | | 4.50 | | | | 71 | |
Year ended 05/31/17 | | | 9.06 | | | | 0.39 | | | | 0.44 | | | | 0.83 | | | | (0.39 | ) | | | – | | | | (0.39 | ) | | | 9.50 | | | | 9.33 | | | | 7,070 | | | | 2.55 | | | | 2.55 | | | | 4.18 | | | | 89 | |
Class R | | | | | | | | | | | | | | | | | | | | | | | | | | | | | | | | | | | | | | | | | | | | | | | | | | | | | | | | |
Year ended 02/28/22 | | | 9.24 | | | | 0.38 | | | | (0.39 | ) | | | (0.01 | ) | | | (0.38 | ) | | | – | | | | (0.38 | ) | | | 8.85 | | | | (0.19 | ) | | | 3,807 | | | | 0.88 | | | | 1.48 | | | | 4.16 | | | | 63 | |
Year ended 02/28/21 | | | 8.99 | | | | 0.44 | | | | 0.28 | | | | 0.72 | | | | (0.45 | ) | | | (0.02 | ) | | | (0.47 | ) | | | 9.24 | | | | 8.46 | | | | 3,151 | | | | 0.89 | | | | 2.34 | | | | 5.04 | | | | 161 | |
Nine months ended 02/29/20 | | | 8.96 | | | | 0.31 | | | | 0.03 | | | | 0.34 | | | | (0.29 | ) | | | (0.02 | ) | | | (0.31 | ) | | | 8.99 | | | | 3.85 | | | | 3,098 | | | | 2.67 | (e) | | | 2.67 | (e) | | | 4.48 | (e) | | | 127 | |
Year ended 05/31/19 | | | 9.17 | | | | 0.48 | | | | (0.20 | ) | | | 0.28 | | | | (0.49 | ) | | | – | | | | (0.49 | ) | | | 8.96 | | | | 3.17 | | | | 2,839 | | | | 2.20 | | | | 2.20 | | | | 5.36 | | | | 56 | |
Year ended 05/31/18 | | | 9.51 | | | | 0.47 | | | | (0.34 | ) | | | 0.13 | | | | (0.47 | ) | | | – | | | | (0.47 | ) | | | 9.17 | | | | 1.36 | | | | 2,185 | | | | 2.07 | | | | 2.07 | | | | 4.96 | | | | 71 | |
Year ended 05/31/17 | | | 9.07 | | | | 0.44 | | | | 0.43 | | | | 0.87 | | | | (0.43 | ) | | | – | | | | (0.43 | ) | | | 9.51 | | | | 9.81 | | | | 1,542 | | | | 2.39 | | | | 2.39 | | | | 4.66 | | | | 89 | |
Class Y | | | | | | | | | | | | | | | | | | | | | | | | | | | | | | | | | | | | | | | | | | | | | | | | | | | | | | | | |
Year ended 02/28/22 | | | 9.24 | | | | 0.43 | | | | (0.39 | ) | | | 0.04 | | | | (0.43 | ) | | | – | | | | (0.43 | ) | | | 8.85 | | | | 0.31 | | | | 2,899 | | | | 0.38 | | | | 0.98 | | | | 4.66 | | | | 63 | |
Year ended 02/28/21 | | | 8.99 | | | | 0.49 | | | | 0.28 | | | | 0.77 | | | | (0.50 | ) | | | (0.02 | ) | | | (0.52 | ) | | | 9.24 | | | | 9.00 | | | | 1,425 | | | | 0.39 | | | | 1.84 | | | | 5.54 | | | | 161 | |
Nine months ended 02/29/20 | | | 8.97 | | | | 0.34 | | | | 0.03 | | | | 0.37 | | | | (0.33 | ) | | | (0.02 | ) | | | (0.35 | ) | | | 8.99 | | | | 4.16 | | | | 1,105 | | | | 2.17 | (e) | | | 2.17 | (e) | | | 5.01 | (e) | | | 127 | |
Year ended 05/31/19 | | | 9.17 | | | | 0.53 | | | | (0.19 | ) | | | 0.34 | | | | (0.54 | ) | | | – | | | | (0.54 | ) | | | 8.97 | | | | 3.85 | | | | 1,505 | | | | 1.50 | | | | 1.50 | | | | 5.91 | | | | 56 | |
Year ended 05/31/18 | | | 9.51 | | | | 0.52 | | | | (0.34 | ) | | | 0.18 | | | | (0.52 | ) | | | – | | | | (0.52 | ) | | | 9.17 | | | | 1.92 | | | | 1,534 | | | | 1.44 | | | | 1.44 | | | | 5.50 | | | | 71 | |
Year ended 05/31/17 | | | 9.07 | | | | 0.48 | | | | 0.45 | | | | 0.93 | | | | (0.49 | ) | | | – | | | | (0.49 | ) | | | 9.51 | | | | 10.41 | | | | 2,235 | | | | 1.42 | | | | 1.42 | | | | 5.18 | | | | 89 | |
Class R5 | | | | | | | | | | | | | | | | | | | | | | | | | | | | | | | | | | | | | | | | | | | | | | | | | | | | | | | | |
Year ended 02/28/22 | | | 9.24 | | | | 0.43 | | | | (0.39 | ) | | | 0.04 | | | | (0.43 | ) | | | – | | | | (0.43 | ) | | | 8.85 | | | | 0.31 | | | | 10 | | | | 0.38 | | | | 0.91 | | | | 4.66 | | | | 63 | |
Year ended 02/28/21 | | | 8.99 | | | | 0.49 | | | | 0.28 | | | | 0.77 | | | | (0.50 | ) | | | (0.02 | ) | | | (0.52 | ) | | | 9.24 | | | | 9.00 | | | | 10 | | | | 0.39 | | | | 1.52 | | | | 5.54 | | | | 161 | |
Nine months ended 02/29/20 | | | 8.97 | | | | 0.34 | | | | 0.03 | | | | 0.37 | | | | (0.33 | ) | | | (0.02 | ) | | | (0.35 | ) | | | 8.99 | | | | 4.16 | | | | 10 | | | | 1.84 | (e) | | | 1.84 | (e) | | | 5.02 | (e) | | | 127 | |
Period ended 05/31/19(f) | | | 9.02 | | | | 0.01 | | | | (0.06 | ) | | | (0.05 | ) | | | (0.00 | ) | | | – | | | | (0.00 | ) | | | 8.97 | | | | 3.48 | | | | 10 | | | | 1.22 | (e) | | | 1.22 | (e) | | | 5.91 | (e) | | | 56 | |
Class R6 | | | | | | | | | | | | | | | | | | | | | | | | | | | | | | | | | | | | | | | | | | | | | | | | | | | | | | | | |
Year ended 02/28/22 | | | 9.24 | | | | 0.42 | | | | (0.38 | ) | | | 0.04 | | | | (0.43 | ) | | | – | | | | (0.43 | ) | | | 8.85 | | | | 0.31 | | | | 80 | | | | 0.38 | | | | 0.91 | | | | 4.66 | | | | 63 | |
Year ended 02/28/21 | | | 9.00 | | | | 0.48 | | | | 0.28 | | | | 0.76 | | | | (0.50 | ) | | | (0.02 | ) | | | (0.52 | ) | | | 9.24 | | | | 8.88 | | | | 23 | | | | 0.39 | | | | 1.52 | | | | 5.54 | | | | 161 | |
Nine months ended 02/29/20 | | | 8.97 | | | | 0.35 | | | | 0.04 | | | | 0.39 | | | | (0.34 | ) | | | (0.02 | ) | | | (0.36 | ) | | | 9.00 | | | | 4.32 | | | | 110 | | | | 1.81 | (e) | | | 1.81 | (e) | | | 5.05 | (e) | | | 127 | |
Year ended 05/31/19 | | | 9.16 | | | | 0.54 | | | | (0.19 | ) | | | 0.35 | | | | (0.54 | ) | | | – | | | | (0.54 | ) | | | 8.97 | | | | 3.98 | | | | 123 | | | | 1.31 | | | | 1.31 | | | | 5.96 | | | | 56 | |
Year ended 05/31/18 | | | 9.50 | | | | 0.52 | | | | (0.33 | ) | | | 0.19 | | | | (0.53 | ) | | | – | | | | (0.53 | ) | | | 9.16 | | | | 1.97 | | | | 13,165 | | | | 1.24 | | | | 1.24 | | | | 5.56 | | | | 71 | |
Year ended 05/31/17 | | | 9.07 | | | | 0.48 | | | | 0.44 | | | | 0.92 | | | | (0.49 | ) | | | – | | | | (0.49 | ) | | | 9.50 | | | | 10.34 | | | | 9,843 | | | | 1.18 | | | | 1.18 | | | | 5.12 | | | | 89 | |
| (a) | Calculated using average shares outstanding. |
| (b) | Includes adjustments in accordance with accounting principles generally accepted in the United States of America and as such, the net asset value for financial reporting purposes and the returns based upon those net asset values may differ from the net asset value and returns for shareholder transactions. Does not include sales charges and is not annualized for periods less than one year, if applicable. |
| (c) | Portfolio turnover is calculated at the fund level and is not annualized for periods less than one year, if applicable. |
| (d) | The total return, ratio of expenses to average net assets and ratio of net investment income to average net assets reflect actual 12b-1 fees of 0.23% for the years ended February 28, 2022 and 2021. |
| (f) | Commencement date after the close of business on May 24, 2019. |
See accompanying Notes to Financial Statements which are an integral part of the financial statements.
| | |
| 18 | | Invesco High Yield Bond Factor Fund |
Notes to Financial Statements
February 28, 2022
NOTE 1–Significant Accounting Policies
Invesco High Yield Bond Factor Fund (the “Fund”), is a series portfolio of AIM Investment Securities Funds (Invesco Investment Securities Funds) (the “Trust”). The Trust is organized as a Delaware statutory trust and is registered under the Investment Company Act of 1940, as amended (the “1940 Act”), as an open-end series management investment company authorized to issue an unlimited number of shares of beneficial interest. Information presented in these financial statements pertains only to the Fund. Matters affecting the Fund or each class will be voted on exclusively by the shareholders of the Fund or each class.
The Fund’s investment objective is to seek total return.
Prior to February 28, 2020, the Fund sought to gain exposure to Regulation S securities primarily through investments in a wholly-owned and controlled subsidiary of the Fund organized under the laws of the Cayman Islands (the “Subsidiary”). The Subsidiary was organized by the Fund to invest in Regulation S securities. The Fund could invest up to 25% of its total assets in the Subsidiary under its previous strategy. Effective February 28, 2020, the Fund no longer invests in Regulation S securities or the Subsidiary, and the Subsidiary was liquidated. For periods prior to February 28, 2020, the Financial Highlights report the operations of the Fund and the Subsidiary on a consolidated basis.
The Fund currently consists of six different classes of shares: Class A, Class C, Class R, Class Y, Class R5 and Class R6. Class Y shares are available only to certain investors. Class A shares are sold with a front-end sales charge unless certain waiver criteria are met. Under certain circumstances, load waived shares may be subject to contingent deferred sales charges (“CDSC”). Class C shares are sold with a CDSC. Class R, Class Y, Class R5 and Class R6 shares are sold at net asset value. Class C shares held for eight years after purchase are eligible for automatic conversion into Class A shares of the same Fund (the “Conversion Feature”). The automatic conversion pursuant to the Conversion Feature will generally occur at the end of the month following the eighth anniversary after a purchase of Class C shares.
The Fund is an investment company and accordingly follows the investment company accounting and reporting guidance in accordance with Financial Accounting Standards Board Accounting Standards Codification Topic 946, Financial Services - Investment Companies.
The following is a summary of the significant accounting policies followed by the Fund in the preparation of its financial statements.
| A. | Security Valuations - Securities, including restricted securities, are valued according to the following policy. |
Debt obligations (including convertible securities) and unlisted equities are fair valued using an evaluated quote provided by an independent pricing service. Evaluated quotes provided by the pricing service may be determined without exclusive reliance on quoted prices, and may reflect appropriate factors such as institution-size trading in similar groups of securities, developments related to specific securities, dividend rate (for unlisted equities), yield (for debt obligations), quality, type of issue, coupon rate (for debt obligations), maturity (for debt obligations), individual trading characteristics and other market data. Pricing services generally value debt obligations assuming orderly transactions of institutional round lot size, but a fund may hold or transact in the same securities in smaller, odd lot sizes. Odd lots often trade at lower prices than institutional round lots. Debt obligations are subject to interest rate and credit risks. In addition, all debt obligations involve some risk of default with respect to interest and/or principal payments.
Variable rate senior loan interests are fair valued using quotes provided by an independent pricing service. Quotes provided by the pricing service may reflect appropriate factors such as ratings, tranche type, industry, company performance, spread, individual trading characteristics, institution-size trading in similar groups of securities and other market data.
A security listed or traded on an exchange (except convertible securities) is valued at its last sales price or official closing price as of the close of the customary trading session on the exchange where the security is principally traded, or lacking any sales or official closing price on a particular day, the security may be valued at the closing bid price on that day. Securities traded in the over-the-counter market are valued based on prices furnished by independent pricing services or market makers. When such securities are valued by an independent pricing service they may be considered fair valued. Futures contracts are valued at the final settlement price set by an exchange on which they are principally traded. Listed options are valued at the mean between the last bid and asked prices from the exchange on which they are principally traded. Options not listed on an exchange are valued by an independent source at the mean between the last bid and asked prices. For purposes of determining net asset value (“NAV”) per share, futures and option contracts generally are valued 15 minutes after the close of the customary trading session of the New York Stock Exchange (“NYSE”).
Investments in open-end and closed-end registered investment companies that do not trade on an exchange are valued at the end-of-day net asset value per share. Investments in open-end and closed-end registered investment companies that trade on an exchange are valued at the last sales price or official closing price as of the close of the customary trading session on the exchange where the security is principally traded.
Swap agreements are fair valued using an evaluated quote, if available, provided by an independent pricing service. Evaluated quotes provided by the pricing service are valued based on a model which may include end-of-day net present values, spreads, ratings, industry, company performance and returns of referenced assets. Centrally cleared swap agreements are valued at the daily settlement price determined by the relevant exchange or clearinghouse.
Foreign securities’ (including foreign exchange contracts) prices are converted into U.S. dollar amounts using the applicable exchange rates as of the close of the NYSE. If market quotations are available and reliable for foreign exchange-traded equity securities, the securities will be valued at the market quotations. Because trading hours for certain foreign securities end before the close of the NYSE, closing market quotations may become unreliable. If between the time trading ends on a particular security and the close of the customary trading session on the NYSE, events occur that the investment adviser determines are significant and make the closing price unreliable, the Fund may fair value the security. If the event is likely to have affected the closing price of the security, the security will be valued at fair value in good faith using procedures approved by the Board of Trustees. Adjustments to closing prices to reflect fair value may also be based on a screening process of an independent pricing service to indicate the degree of certainty, based on historical data, that the closing price in the principal market where a foreign security trades is not the current value as of the close of the NYSE. Foreign securities’ prices meeting the approved degree of certainty that the price is not reflective of current value will be priced at the indication of fair value from the independent pricing service. Multiple factors may be considered by the independent pricing service in determining adjustments to reflect fair value and may include information relating to sector indices, American Depositary Receipts and domestic and foreign index futures. Foreign securities may have additional risks including exchange rate changes, potential for sharply devalued currencies and high inflation, political and economic upheaval, the relative lack of issuer information, relatively low market liquidity and the potential lack of strict financial and accounting controls and standards.
Securities for which market prices are not provided by any of the above methods may be valued based upon quotes furnished by independent sources. The last bid price may be used to value equity securities. The mean between the last bid and asked prices is used to value debt obligations, including corporate loans.
Securities for which market quotations are not readily available or became unreliable are valued at fair value as determined in good faith by or under the supervision of the Trust’s officers following procedures approved by the Board of Trustees. Issuer specific events, market trends, bid/asked quotes of brokers and information providers and other market data may be reviewed in the course of making a good faith determination of a security’s fair value.
The Fund may invest in securities that are subject to interest rate risk, meaning the risk that the prices will generally fall as interest rates rise and, conversely, the prices will generally rise as interest rates fall. Specific securities differ in their sensitivity to changes in interest rates depending on their individual characteristics. Changes in interest rates may result in increased market volatility, which may affect the value and/or liquidity of certain Fund investments.
Valuations change in response to many factors including the historical and prospective earnings of the issuer, the value of the issuer’s assets, general market conditions which are not specifically related to the particular issuer, such as real or perceived adverse economic conditions, changes in the general outlook for revenues or corporate earnings, changes in interest or currency rates, regional or global instability, natural or environmental disasters, widespread disease or
| | |
| 19 | | Invesco High Yield Bond Factor Fund |
other public health issues, war, acts of terrorism or adverse investor sentiment generally and market liquidity. Because of the inherent uncertainties of valuation, the values reflected in the financial statements may materially differ from the value received upon actual sale of those investments.
| B. | Securities Transactions and Investment Income - Securities transactions are accounted for on a trade date basis. Realized gains or losses on sales are computed on the basis of specific identification of the securities sold. Interest income (net of withholding tax, if any) is recorded on an accrual basis from settlement date and includes coupon interest and amortization of premium and accretion of discount on debt securities as applicable. Pay-in-kind interest income and non-cash dividend income received in the form of securities in-lieu of cash are recorded at the fair value of the securities received. Paydown gains and losses on mortgage and asset-backed securities are recorded as adjustments to interest income. Dividend income (net of withholding tax, if any) is recorded on the ex-dividend date. |
The Fund may periodically participate in litigation related to Fund investments. As such, the Fund may receive proceeds from litigation settlements. Any proceeds received are included in the Statement of Operations as realized gain (loss) for investments no longer held and as unrealized gain (loss) for investments still held.
Brokerage commissions and mark ups are considered transaction costs and are recorded as an increase to the cost basis of securities purchased and/or a reduction of proceeds on a sale of securities. Such transaction costs are included in the determination of net realized and unrealized gain (loss) from investment securities reported in the Statement of Operations and the Statement of Changes in Net Assets and the net realized and unrealized gains (losses) on securities per share in the Financial Highlights. Transaction costs are included in the calculation of the Fund’s net asset value and, accordingly, they reduce the Fund’s total returns. These transaction costs are not considered operating expenses and are not reflected in net investment income reported in the Statement of Operations and the Statement of Changes in Net Assets, or the net investment income per share and the ratios of expenses and net investment income reported in the Financial Highlights, nor are they limited by any expense limitation arrangements between the Fund and the investment adviser.
The Fund allocates realized and unrealized capital gains and losses to a class based on the relative net assets of each class. The Fund allocates income to a class based on the relative value of the settled shares of each class.
| C. | Country Determination - For the purposes of making investment selection decisions and presentation in the Schedule of Investments, the investment adviser may determine the country in which an issuer is located and/or credit risk exposure based on various factors. These factors include the laws of the country under which the issuer is organized, where the issuer maintains a principal office, the country in which the issuer derives 50% or more of its total revenues and the country that has the primary market for the issuer’s securities, as well as other criteria. Among the other criteria that may be evaluated for making this determination are the country in which the issuer maintains 50% or more of its assets, the type of security, financial guarantees and enhancements, the nature of the collateral and the sponsor organization. Country of issuer and/or credit risk exposure has been determined to be the United States of America, unless otherwise noted. |
| D. | Distributions - Distributions from net investment income, if any, are declared daily and paid monthly. Distributions from net realized capital gain, if any, are generally declared and paid annually and recorded on the ex-dividend date. The Fund may elect to treat a portion of the proceeds from redemptions as distributions for federal income tax purposes. |
| E. | Federal Income Taxes - The Fund intends to comply with the requirements of Subchapter M of the Internal Revenue Code of 1986, as amended (the “Internal Revenue Code”), necessary to qualify as a regulated investment company and to distribute substantially all of the Fund’s taxable earnings to shareholders. As such, the Fund will not be subject to federal income taxes on otherwise taxable income (including net realized capital gain) that is distributed to shareholders. Therefore, no provision for federal income taxes is recorded in the financial statements. |
The Fund recognizes the tax benefits of uncertain tax positions only when the position is more likely than not to be sustained. Management has analyzed the Fund’s uncertain tax positions and concluded that no liability for unrecognized tax benefits should be recorded related to uncertain tax positions. Management is not aware of any tax positions for which it is reasonably possible that the total amounts of unrecognized tax benefits will change materially in the next 12 months.
The Fund files tax returns in the U.S. Federal jurisdiction and certain other jurisdictions. Generally, the Fund is subject to examinations by such taxing authorities for up to three years after the filing of the return for the tax period.
| F. | Expenses - Fees provided for under the Rule 12b-1 plan of a particular class of the Fund are charged to the operations of such class. Transfer agency fees and expenses and other shareholder recordkeeping fees and expenses attributable to Class R5 and Class R6 are allocated based on relative net assets of Class R5 and Class R6. Sub-accounting fees attributable to Class R5 are charged to the operations of the class. Transfer agency fees and expenses and other shareholder recordkeeping fees and expenses relating to all other classes are allocated among those classes based on relative net assets. All other expenses are allocated among the classes based on relative net assets. |
| G. | Accounting Estimates - The preparation of financial statements in conformity with accounting principles generally accepted in the United States of America (“GAAP”) requires management to make estimates and assumptions that affect the reported amounts of assets and liabilities at the date of the financial statements and the reported amounts of revenues and expenses during the reporting period including estimates and assumptions related to taxation. Actual results could differ from those estimates by a significant amount. In addition, the Fund monitors for material events or transactions that may occur or become known after the period-end date and before the date the financial statements are released to print. |
| H. | Indemnifications - Under the Trust’s organizational documents, each Trustee, officer, employee or other agent of the Trust is indemnified against certain liabilities that may arise out of the performance of their duties to the Fund. Additionally, in the normal course of business, the Fund enters into contracts, including the Fund’s servicing agreements, that contain a variety of indemnification clauses. The Fund’s maximum exposure under these arrangements is unknown as this would involve future claims that may be made against the Fund that have not yet occurred. The risk of material loss as a result of such indemnification claims is considered remote. |
| I. | Securities Purchased on a When-Issued and Delayed Delivery Basis - The Fund may purchase and sell interests in corporate loans and corporate debt securities and other portfolio securities on a when-issued and delayed delivery basis, with payment and delivery scheduled for a future date. No income accrues to the Fund on such interests or securities in connection with such transactions prior to the date the Fund actually takes delivery of such interests or securities. These transactions are subject to market fluctuations and are subject to the risk that the value at delivery may be more or less than the trade date purchase price. Although the Fund will generally purchase these securities with the intention of acquiring such securities, they may sell such securities prior to the settlement date. |
| J. | Securities Lending - The Fund may lend portfolio securities having a market value up to one-third of the Fund’s total assets. Such loans are secured by collateral equal to no less than the market value of the loaned securities determined daily by the securities lending provider. Such collateral will be cash or debt securities issued or guaranteed by the U.S. Government or any of its sponsored agencies. Cash collateral received in connection with these loans is invested in short-term money market instruments or affiliated, unregistered investment companies that comply with Rule 2a-7 under the 1940 Act and money market funds (collectively, “affiliated money market funds”) and is shown as such on the Schedule of Investments. The Fund bears the risk of loss with respect to the investment of collateral. It is the Fund’s policy to obtain additional collateral from or return excess collateral to the borrower by the end of the next business day, following the valuation date of the securities loaned. Therefore, the value of the collateral held may be temporarily less than the value of the securities on loan. When loaning securities, the Fund retains certain benefits of owning the securities, including the economic equivalent of dividends or interest generated by the security. Lending securities entails a risk of loss to the Fund if, and to the extent that, the market value of the securities loaned were to increase and the borrower did not increase the collateral accordingly, and the borrower failed to return the securities. The securities loaned are subject to termination at the option of the borrower or the Fund. Upon termination, the borrower will return to the Fund the securities loaned and the Fund will return the collateral. Upon the failure of the borrower to return the securities, collateral may be liquidated and the securities may be purchased on the open market to replace the loaned securities. The Fund could |
| | |
| 20 | | Invesco High Yield Bond Factor Fund |
| | experience delays and costs in gaining access to the collateral and the securities may lose value during the delay which could result in potential losses to the Fund. Some of these losses may be indemnified by the lending agent. The Fund bears the risk of any deficiency in the amount of the collateral available for return to the borrower due to any loss on the collateral invested. Dividends received on cash collateral investments for securities lending transactions, which are net of compensation to counterparties, are included in Dividends from affiliates on the Statement of Operations. The aggregate value of securities out on loan, if any, is shown as a footnote on the Statement of Assets and Liabilities. |
On September 29, 2021, the Board of Trustees appointed Invesco Advisers, Inc. (the “Adviser” or “Invesco”) to serve as an affiliated securities lending agent for the Fund. Prior to September 29, 2021, the Bank of New York Mellon (“BNYM”) served as the sole securities lending agent for the Fund under the securities lending program. BNYM also continues to serve as a lending agent. To the extent the Fund utilizes the Adviser as an affiliated securities lending agent, the Fund conducts its securities lending in accordance with, and in reliance upon, no-action letters issued by the SEC staff that provide guidance on how an affiliate may act as a direct agent lender and receive compensation for those services in a manner consistent with the federal securities laws. For the year ended February 28, 2022, there were no securities lending transactions with the Adviser.
| K. | Futures Contracts - The Fund may enter into futures contracts to manage exposure to interest rate, equity and market price movements and/or currency risks. A futures contract is an agreement between two parties (“Counterparties”) to purchase or sell a specified underlying security, currency or commodity (or delivery of a cash settlement price, in the case of an index future) for a fixed price at a future date. The Fund currently invests only in exchange-traded futures and they are standardized as to maturity date and underlying financial instrument. Initial margin deposits required upon entering into futures contracts are satisfied by the segregation of specific securities or cash as collateral at the futures commission merchant (broker). During the period the futures contracts are open, changes in the value of the contracts are recognized as unrealized gains or losses by recalculating the value of the contracts on a daily basis. Subsequent or variation margin payments are received or made depending upon whether unrealized gains or losses are incurred. These amounts are reflected as receivables or payables on the Statement of Assets and Liabilities. When the contracts are closed or expire, the Fund recognizes a realized gain or loss equal to the difference between the proceeds from, or cost of, the closing transaction and the Fund’s basis in the contract. The net realized gain (loss) and the change in unrealized gain (loss) on futures contracts held during the period is included on the Statement of Operations. The primary risks associated with futures contracts are market risk and the absence of a liquid secondary market. If the Fund were unable to liquidate a futures contract and/or enter into an offsetting closing transaction, the Fund would continue to be subject to market risk with respect to the value of the contracts and continue to be required to maintain the margin deposits on the futures contracts. Futures contracts have minimal Counterparty risk since the exchange’s clearinghouse, as Counterparty to all exchange-traded futures, guarantees the futures against default. Risks may exceed amounts recognized in the Statement of Assets and Liabilities. |
| L. | Swap Agreements - The Fund may enter into various swap transactions, including interest rate, total return, index, currency and credit default swap contracts (“CDS”) for investment purposes or to manage interest rate, currency or credit risk. Such transactions are agreements between Counterparties. A swap agreement may be negotiated bilaterally and traded over-the-counter (“OTC”) between two parties (“uncleared/ OTC”) or, in some instances, must be transacted through a future commission merchant (“FCM”) and cleared through a clearinghouse that serves as a central Counterparty (“centrally cleared swap”). These agreements may contain among other conditions, events of default and termination events, and various covenants and representations such as provisions that require the Fund to maintain a pre-determined level of net assets, and/ or provide limits regarding the decline of the Fund’s NAV over specific periods of time. If the Fund were to trigger such provisions and have open derivative positions at that time, the Counterparty may be able to terminate such agreement and request immediate payment in an amount equal to the net liability positions, if any. |
Interest rate, total return, index, and currency swap agreements are two-party contracts entered into primarily to exchange the returns (or differentials in rates of returns) earned or realized on particular predetermined investments or instruments. The gross returns to be exchanged or “swapped” between the parties are calculated with respect to a notional amount, i.e., the return on or increase in value of a particular dollar amount invested at a particular interest rate or return of an underlying asset, in a particular foreign currency, or in a “basket” of securities representing a particular index.
In a centrally cleared swap, the Fund’s ultimate Counterparty is a central clearinghouse. The Fund initially will enter into centrally cleared swaps through an executing broker. When a fund enters into a centrally cleared swap, it must deliver to the central Counterparty (via the FCM) an amount referred to as “initial margin.” Initial margin requirements are determined by the central Counterparty, but an FCM may require additional initial margin above the amount required by the central Counterparty. Initial margin deposits required upon entering into centrally cleared swaps are satisfied by cash or securities as collateral at the FCM. Securities deposited as initial margin are designated on the Schedule of Investments and cash deposited is recorded on the Statement of Assets and Liabilities. During the term of a cleared swap agreement, a “variation margin” amount may be required to be paid by the Fund or may be received by the Fund, based on the daily change in price of the underlying reference instrument subject to the swap agreement and is recorded as a receivable or payable for variation margin in the Statement of Assets and Liabilities until the centrally cleared swap is terminated at which time a realized gain or loss is recorded.
A CDS is an agreement between Counterparties to exchange the credit risk of an issuer. A buyer of a CDS is said to buy protection by paying a fixed payment over the life of the agreement and in some situations an upfront payment to the seller of the CDS. If a defined credit event occurs (such as payment default or bankruptcy), the Fund as a protection buyer would cease paying its fixed payment, the Fund would deliver eligible bonds issued by the reference entity to the seller, and the seller would pay the full notional value, or the “par value”, of the referenced obligation to the Fund. A seller of a CDS is said to sell protection and thus would receive a fixed payment over the life of the agreement and an upfront payment, if applicable. If a credit event occurs, the Fund as a protection seller would cease to receive the fixed payment stream, the Fund would pay the buyer “par value” or the full notional value of the referenced obligation, and the Fund would receive the eligible bonds issued by the reference entity. In turn, these bonds may be sold in order to realize a recovery value. Alternatively, the seller of the CDS and its Counterparty may agree to net the notional amount and the market value of the bonds and make a cash payment equal to the difference to the buyer of protection. If no credit event occurs, the Fund receives the fixed payment over the life of the agreement. As the seller, the Fund would effectively add leverage to its portfolio because, in addition to its total net assets, the Fund would be subject to investment exposure on the notional amount of the CDS. In connection with these agreements, cash and securities may be identified as collateral in accordance with the terms of the respective swap agreements to provide assets of value and recourse in the event of default under the swap agreement or bankruptcy/insolvency of a party to the swap agreement. If a Counterparty becomes bankrupt or otherwise fails to perform its obligations due to financial difficulties, the Fund may experience significant delays in obtaining any recovery in a bankruptcy or other reorganization proceeding. The Fund may obtain only limited recovery or may obtain no recovery in such circumstances. The Fund’s maximum risk of loss from Counterparty risk, either as the protection seller or as the protection buyer, is the value of the contract. The risk may be mitigated by having a master netting arrangement between the Fund and the Counterparty and by the designation of collateral by the Counterparty to cover the Fund’s exposure to the Counterparty.
Implied credit spreads represent the current level at which protection could be bought or sold given the terms of the existing CDS contract and serve as an indicator of the current status of the payment/performance risk of the CDS. An implied spread that has widened or increased since entry into the initial contract may indicate a deteriorating credit profile and increased risk of default for the reference entity. A declining or narrowing spread may indicate an improving credit profile or decreased risk of default for the reference entity. Alternatively, credit spreads may increase or decrease reflecting the general tolerance for risk in the credit markets.
An interest rate swap is an agreement between Counterparties pursuant to which the parties exchange a floating rate payment for a fixed rate payment based on a specified notional amount.
Changes in the value of centrally cleared and OTC swap agreements are recognized as unrealized gains (losses) in the Statement of Operations by “marking to market” on a daily basis to reflect the value of the swap agreement at the end of each trading day. Payments received or paid at the beginning of the agreement are reflected as such on the Statement of Assets and Liabilities and may be referred to as upfront payments. The Fund accrues for the fixed payment stream and
| | |
| 21 | | Invesco High Yield Bond Factor Fund |
amortizes upfront payments, if any, on swap agreements on a daily basis with the net amount, recorded as a component of realized gain (loss) on the Statement of Operations. A liquidation payment received or made at the termination of a swap agreement is recorded as realized gain (loss) on the Statement of Operations. The Fund segregates cash or liquid securities having a value at least equal to the amount of the potential obligation of a Fund under any swap transaction. Cash held as collateral is recorded as deposits with brokers on the Statement of Assets and Liabilities. Entering into these agreements involves, to varying degrees, lack of liquidity and elements of credit, market, and Counterparty risk in excess of amounts recognized on the Statement of Assets and Liabilities. Such risks involve the possibility that a swap is difficult to sell or liquidate; the Counterparty does not honor its obligations under the agreement and unfavorable interest rates and market fluctuations. It is possible that developments in the swaps market, including potential government regulation, could adversely affect the Fund’s ability to terminate existing swap agreements or to realize amounts to be received under such agreements. Additionally, an International Swaps and Derivatives Association Master Agreement (“ISDA Master Agreement”) includes credit related contingent features which allow Counterparties to OTC derivatives to terminate derivative contracts prior to maturity in the event that, for example, the Fund’s net assets decline by a stated percentage or the Fund fails to meet the terms of its ISDA Master Agreement, which would cause the Fund to accelerate payment of any net liability owed to the Counterparty. A short position in a security poses more risk than holding the same security long. As there is no limit on how much the price of the security can increase, the Fund’s exposure is unlimited.
Notional amounts of each individual credit default swap agreement outstanding as of February 28, 2022, if any, for which the Fund is the seller of protection are disclosed in the open swap agreements table. These potential amounts would be partially offset by any recovery values of the respective referenced obligations, upfront payments received upon entering into the agreement, or net amounts received from the settlement of buy protection credit default swap agreements entered into by the Fund for the same referenced entity or entities.
| M. | Leverage Risk - Leverage exists when the Fund can lose more than it originally invests because it purchases or sells an instrument or enters into a transaction without investing an amount equal to the full economic exposure of the instrument or transaction. |
| N. | Collateral - To the extent the Fund has designated or segregated a security as collateral and that security is subsequently sold, it is the Fund’s practice to replace such collateral no later than the next business day. This practice does not apply to securities pledged as collateral for securities lending transactions. |
| O. | Other Risks - The Fund may invest in lower-quality debt securities, i.e., “junk bonds”. Investments in lower-rated securities or unrated securities of comparable quality tend to be more sensitive to economic conditions than higher rated securities. Junk bonds involve a greater risk of default by the issuer because such securities are generally unsecured and are often subordinated to other creditors’ claims. Junk bonds are less liquid than investment grade debt securities and their prices tend to be more volatile. |
Active trading of portfolio securities may result in added expenses, a lower return and increased tax liability.
The current low interest rate environment was created in part by the Federal Reserve Board (FRB) and certain foreign central banks keeping the federal funds and equivalent foreign rates near historical lows. Increases in the federal funds and equivalent foreign rates may expose fixed income markets to heightened volatility and reduced liquidity for certain fixed income investments, particularly those with longer maturities. In addition, decreases in fixed income dealer market-making capacity may also potentially lead to heightened volatility and reduced liquidity in the fixed income markets. As a result, the value of the Fund’s investments and share price may decline. Changes in central bank policies could also result in higher than normal shareholder redemptions, which could potentially increase portfolio turnover and the Fund’s transaction costs. Additionally, from time to time, uncertainty regarding the status of negotiations in the U.S. Government to increase the statutory debt limit, commonly called the “debt ceiling”, could increase the risk that the U.S. Government may default on payments on certain U.S. Government securities, cause the credit rating of the U.S. Government to be downgraded, increase volatility in the stock and bond markets, result in higher interest rates, reduce prices of U.S. Treasury securities, and/or increase the costs of various kinds of debt. If a U.S. Government-sponsored entity is negatively impacted by legislative or regulatory action, is unable to meet its obligations, or its creditworthiness declines, the performance of a Fund that holds securities of that entity will be adversely impacted.
| P. | COVID-19 Risk - The COVID-19 strain of coronavirus has resulted in instances of market closures and dislocations, extreme volatility, liquidity constraints and increased trading costs. Efforts to contain its spread have resulted in travel restrictions, disruptions of healthcare systems, business operations (including business closures) and supply chains, layoffs, lower consumer demand and employee availability, and defaults and credit downgrades, among other significant economic impacts that have disrupted global economic activity across many industries. Such economic impacts may exacerbate other pre-existing political, social and economic risks locally or globally and cause general concern and uncertainty. |
The full economic impact and ongoing effects of COVID-19 (or other future epidemics or pandemics) at the macro-level and on individual businesses are unpredictable and may result in significant and prolonged effects on the Fund’s performance.
NOTE 2–Advisory Fees and Other Fees Paid to Affiliates
The Trust has entered into a master investment advisory agreement with the Adviser. Under the terms of the investment advisory agreement, the Fund accrues daily and pays monthly an advisory fee to the Adviser based on the annual rate of the Fund’s average daily net assets as follows:
| | | | |
| Average Daily Net Assets | | Rate | |
|
| |
First $2 billion | | | 0.370% | |
|
| |
Over $2 billion | | | 0.350% | |
|
| |
For the year ended February 28, 2022, the effective advisory fee rate incurred by the Fund was 0.37%.
Under the terms of a master sub-advisory agreement between the Adviser and each of Invesco Asset Management Deutschland GmbH, Invesco Asset Management Limited, Invesco Asset Management (Japan) Limited, Invesco Hong Kong Limited, Invesco Senior Secured Management, Inc. and Invesco Canada Ltd. and separate sub-advisory agreements with Invesco Capital Management LLC and Invesco Asset Management (India) Private Limited (collectively, the “Affiliated Sub-Advisers”) the Adviser, not the Fund, will pay 40% of the fees paid to the Adviser to any such Affiliated Sub-Adviser(s) that provide(s) discretionary investment management services to the Fund based on the percentage of assets allocated to such Affiliated Sub-Adviser(s). Invesco has also entered into a sub-advisory agreement with OppenheimerFunds, Inc. to provide discretionary management services to the Fund.
The Adviser has contractually agreed, through at least June 30, 2022, to waive advisory fees and/or reimburse expenses of all shares to the extent necessary to limit total annual fund operating expenses after fee waiver and/or expense reimbursement (excluding certain items discussed below) of Class A, Class C, Class R, Class Y, Class R5 and Class R6 shares to 0.64%, 1.39%, 0.89%, 0.39%, 0.39% and 0.39%, respectively, of the Fund’s average daily net assets (the “expense limits”). In determining the Adviser’s obligation to waive advisory fees and/or reimburse expenses, the following expenses are not taken into account, and could cause the total annual fund operating expenses after fee waiver and/or reimbursement to exceed the numbers reflected above: (1) interest; (2) taxes; (3) dividend expense on short sales; (4) extraordinary or non-routine items, including litigation expenses; and (5) expenses that the Fund has incurred but did not actually pay because of an expense offset arrangement. Unless Invesco continues the fee waiver agreement, it will terminate on June 30, 2022. During its term, the fee waiver agreement cannot be terminated or amended to increase the expense limits or reduce the advisory fee waivers without approval of the Board of Trustees.
Further, the Adviser has contractually agreed, through at least June 30, 2023, to waive the advisory fee payable by the Fund in an amount equal to 100% of the net advisory fees the Adviser receives from the affiliated money market funds on investments by the Fund of uninvested cash (excluding investments of cash collateral from securities lending) in such affiliated money market funds.
For the year ended February 28, 2022, the Adviser waived advisory fees of $137,585, reimbursed fund level expenses of $36,410 and reimbursed class level expenses of $32,149, $6,264, $4,360, $3,280, $5 and $30 of Class A, Class C, Class R, Class Y, Class R5 and Class R6 shares, respectively.
| | |
| 22 | | Invesco High Yield Bond Factor Fund |
The Trust has entered into a master administrative services agreement with Invesco pursuant to which the Fund has agreed to pay Invesco for certain administrative costs incurred in providing accounting services to the Fund. For the year ended February 28, 2022, expenses incurred under the agreement are shown in the Statement of Operations as Administrative services fees. Invesco has entered into a sub-administration agreement whereby State Street Bank and Trust Company (“SSB”) serves as fund accountant and provides certain administrative services to the Fund. Pursuant to a custody agreement with the Trust on behalf of the Fund, SSB also serves as the Fund’s custodian.
The Trust has entered into a transfer agency and service agreement with Invesco Investment Services, Inc. (“IIS”) pursuant to which the Fund has agreed to pay IIS a fee for providing transfer agency and shareholder services to the Fund and reimburse IIS for certain expenses incurred by IIS in the course of providing such services. IIS may make payments to intermediaries that provide omnibus account services, sub-accounting services and/or networking services. All fees payable by IIS to intermediaries that provide omnibus account services or sub-accounting services are charged back to the Fund, subject to certain limitations approved by the Trust’s Board of Trustees. For the year ended February 28, 2022, expenses incurred under the agreement are shown in the Statement of Operations as Transfer agent fees.
The Trust has entered into master distribution agreements with Invesco Distributors, Inc. (“IDI”) to serve as the distributor for the Class A, Class C, Class R, Class Y, Class R5 and Class R6 shares of the Fund. The Trust has adopted plans pursuant to Rule 12b-1 under the 1940 Act with respect to the Fund’s Class A, Class C and Class R shares (collectively, the “Plans”). The Fund, pursuant to the Class A Plan, reimburses IDI for its allocated share of expenses incurred for the period, up to a maximum annual rate of 0.25% of the average daily net assets of Class A shares. The Fund pursuant to the Class C and Class R Plan, pays IDI compensation at the annual rate of 1.00% of the average daily net assets of Class C shares and 0.50% of the average daily net assets of Class R shares. The fees are accrued daily and paid monthly. Of the Plan payments, up to 0.25% of the average daily net assets of each class of shares may be paid to furnish continuing personal shareholder services to customers who purchase and own shares of such classes. Any amounts not paid as a service fee under the Plans would constitute an asset-based sales charge. Rules of the Financial Industry Regulatory Authority (“FINRA”) impose a cap on the total sales charges, including asset-based sales charges, that may be paid by any class of shares of the Fund. For the year ended February 28, 2022, expenses incurred under the Plans are shown in the Statement of Operations as Distribution fees.
Front-end sales commissions and CDSC (collectively, the “sales charges”) are not recorded as expenses of the Fund. Front-end sales commissions are deducted from proceeds from the sales of Fund shares prior to investment in Class A shares of the Fund. CDSC are deducted from redemption proceeds prior to remittance to the shareholder. During the year ended February 28, 2022, IDI advised the Fund that IDI retained $8,930 in front-end sales commissions from the sale of Class A shares and $0 and $185 from Class A and Class C shares, respectively, for CDSC imposed upon redemptions by shareholders.
Certain officers and trustees of the Trust are officers and directors of the Adviser, IIS and/or IDI.
NOTE 3–Additional Valuation Information
GAAP defines fair value as the price that would be received to sell an asset or paid to transfer a liability in an orderly transaction between market participants at the measurement date, under current market conditions. GAAP establishes a hierarchy that prioritizes the inputs to valuation methods, giving the highest priority to readily available unadjusted quoted prices in an active market for identical assets (Level 1) and the lowest priority to significant unobservable inputs (Level 3), generally when market prices are not readily available or are unreliable. Based on the valuation inputs, the securities or other investments are tiered into one of three levels. Changes in valuation methods may result in transfers in or out of an investment’s assigned level:
| | |
| Level 1 - | | Prices are determined using quoted prices in an active market for identical assets. |
| Level 2 - | | Prices are determined using other significant observable inputs. Observable inputs are inputs that other market participants may use in pricing a security. These may include quoted prices for similar securities, interest rates, prepayment speeds, credit risk, yield curves, loss severities, default rates, discount rates, volatilities and others. |
| Level 3 - | | Prices are determined using significant unobservable inputs. In situations where quoted prices or observable inputs are unavailable (for example, when there is little or no market activity for an investment at the end of the period), unobservable inputs may be used. Unobservable inputs reflect the Fund’s own assumptions about the factors market participants would use in determining fair value of the securities or instruments and would be based on the best available information. |
The following is a summary of the tiered valuation input levels, as of February 28, 2022. The level assigned to the securities valuations may not be an indication of the risk or liquidity associated with investing in those securities. Because of the inherent uncertainties of valuation, the values reflected in the financial statements may materially differ from the value received upon actual sale of those investments.
| | | | | | | | | | | | | | | | |
| | | Level 1 | | | Level 2 | | | Level 3 | | | Total | |
|
| |
Investments in Securities | | | | | | | | | | | | | | | | |
|
| |
U.S. Dollar Denominated Bonds & Notes | | $ | – | | | $ | 32,016,101 | | | $ | – | | | $ | 32,016,101 | |
|
| |
Exchange-Traded Funds | | | 1,059,867 | | | | – | | | | – | | | | 1,059,867 | |
|
| |
Common Stocks & Other Equity Interests | | | 106,850 | | | | 6,550 | | | | 46,309 | | | | 159,709 | |
|
| |
U.S. Treasury Securities | | | – | | | | 83,938 | | | | – | | | | 83,938 | |
|
| |
Variable Rate Senior Loan Interests | | | – | | | | 12,274 | | | | – | | | | 12,274 | |
|
| |
Preferred Stocks | | | – | | | | 1,294 | | | | – | | | | 1,294 | |
|
| |
Money Market Funds | | | 234,135 | | | | 648,190 | | | | – | | | | 882,325 | |
|
| |
Total Investments in Securities | | | 1,400,852 | | | | 32,768,347 | | | | 46,309 | | | | 34,215,508 | |
|
| |
| | | | |
Other Investments - Assets* | | | | | | | | | | | | | | | | |
|
| |
Futures Contracts | | | 45,809 | | | | – | | | | – | | | | 45,809 | |
|
| |
| | | | |
Other Investments - Liabilities* | | | | | | | | | | | | | | | | |
|
| |
Futures Contracts | | | (11,750 | ) | | | – | | | | – | | | | (11,750 | ) |
|
| |
Swap Agreements | | | – | | | | (9,427 | ) | | | – | | | | (9,427 | ) |
|
| |
| | | (11,750 | ) | | | (9,427 | ) | | | – | | | | (21,177 | ) |
|
| |
Total Other Investments | | | 34,059 | | | | (9,427 | ) | | | – | | | | 24,632 | |
|
| |
Total Investments | | $ | 1,434,911 | | | $ | 32,758,920 | | | $ | 46,309 | | | $ | 34,240,140 | |
|
| |
| * | Unrealized appreciation (depreciation). |
NOTE 4–Derivative Investments
The Fund may enter into an ISDA Master Agreement under which a fund may trade OTC derivatives. An OTC transaction entered into under an ISDA Master Agreement typically involves a collateral posting arrangement, payment netting provisions and close-out netting provisions. These netting provisions allow for reduction of credit risk
| | |
| 23 | | Invesco High Yield Bond Factor Fund |
through netting of contractual obligations. The enforceability of the netting provisions of the ISDA Master Agreement depends on the governing law of the ISDA Master Agreement, among other factors.
For financial reporting purposes, the Fund does not offset OTC derivative assets or liabilities that are subject to ISDA Master Agreements in the Statement of Assets and Liabilities.
Value of Derivative Investments at Period-End
The table below summarizes the value of the Fund’s derivative investments, detailed by primary risk exposure, held as of February 28, 2022:
| | | | | | | | | | | | | | | | | | | | |
| | | Value | |
| Derivative Assets | | Credit
Risk | | | | | | Interest
Rate Risk | | | | | | Total | |
Unrealized appreciation on futures contracts – Exchange-Traded(a) | | $ | - | | | | | | | $ | 45,809 | | | | | | | $ | 45,809 | |
|
| |
Derivatives not subject to master netting agreements | | | - | | | | | | | | (45,809 | ) | | | | | | | (45,809 | ) |
|
| |
Total Derivative Assets subject to master netting agreements | | $ | - | | | | | | | $ | - | | | | | | | $ | - | |
|
| |
| | | | | |
| | | | | | | | | Value | | | | | | | |
| |
| | | | |
| Derivative Liabilities | | Credit
Risk | | | | | | Interest
Rate Risk | | | | | | Total | |
Unrealized depreciation on futures contracts – Exchange-Traded(a) | | $ | - | | | | | | | $ | (11,750 | ) | | | | | | $ | (11,750 | ) |
|
| |
Unrealized depreciation on swap agreements – Centrally Cleared(a) | | | (9,427 | ) | | | | | | | - | | | | | | | | (9,427 | ) |
|
| |
Total Derivative Liabilities | | | (9,427 | ) | | | | | | | (11,750 | ) | | | | | | | (21,177 | ) |
|
| |
Derivatives not subject to master netting agreements | | | 9,427 | | | | | | | | 11,750 | | | | | | | | 21,177 | |
|
| |
Total Derivative Liabilities subject to master netting agreements | | $ | - | | | | | | | $ | - | | | | | | | $ | - | |
|
| |
| (a) | The daily variation margin receivable (payable) at period-end is recorded in the Statement of Assets and Liabilities. |
Effect of Derivative Investments for the year ended February 28, 2022
The table below summarizes the gains (losses) on derivative investments, detailed by primary risk exposure, recognized in earnings during the period:
| | | | | | | | | | | | | | | | | | | | |
| | | Location of Gain (Loss) on Statement of Operations | |
| |
| | | | |
| | | Credit
Risk | | | | | | Interest
Rate Risk | | | | | | Total | |
Realized Gain (Loss): | | | | | | | | | | | | | | | | | | | | |
Futures contracts | | $ | - | | | | | | | $ | (51,239 | ) | | | | | | $ | (51,239 | ) |
|
| |
Swap agreements | | | 19,966 | | | | | | | | - | | | | | | | | 19,966 | |
|
| |
Change in Net Unrealized Appreciation (Depreciation): | | | | | | | | | | | | | | | | | | | | |
Futures contracts | | | - | | | | | | | | 67,999 | | | | | | | | 67,999 | |
|
| |
Swap agreements | | | (9,427 | ) | | | | | | | - | | | | | | | | (9,427 | ) |
|
| |
Total | | $ | 10,539 | | | | | | | $ | 16,760 | | | | | | | $ | 27,299 | |
|
| |
The table below summarizes the average notional value of derivatives held during the period.
| | | | | | | | | | | | |
| | | Futures
Contracts | | | | | | Swap
Agreements | |
|
| |
Average notional value | | | $7,840,572 | | | | | | | | $662,500 | |
|
| |
NOTE 5–Expense Offset Arrangement(s)
The expense offset arrangement is comprised of transfer agency credits which result from balances in demand deposit accounts used by the transfer agent for clearing shareholder transactions. For the year ended February 28, 2022, the Fund received credits from this arrangement, which resulted in the reduction of the Fund’s total expenses of $187.
NOTE 6–Trustees’ and Officers’ Fees and Benefits
Trustees’ and Officers’ Fees and Benefits include amounts accrued by the Fund to pay remuneration to certain Trustees and Officers of the Fund. Trustees have the option to defer compensation payable by the Fund, and Trustees’ and Officers’ Fees and Benefits also include amounts accrued by the Fund to fund such deferred compensation amounts. Those Trustees who defer compensation have the option to select various Invesco Funds in which their deferral accounts shall be deemed to be invested. Finally, certain current Trustees were eligible to participate in a retirement plan that provided for benefits to be paid upon retirement to Trustees over a period of time based on the number of years of service. The Fund may have certain former Trustees who also participate in a retirement plan and receive benefits under such plan. Trustees’ and Officers’ Fees and Benefits include amounts accrued by the Fund to fund such retirement benefits. Obligations under the deferred compensation and retirement plans represent unsecured claims against the general assets of the Fund.
NOTE 7–Cash Balances
The Fund may borrow for leveraging in an amount up to 5% of the Fund’s total assets (excluding the amount borrowed) at the time the borrowing is made. In doing so, the Fund is permitted to temporarily carry a negative or overdrawn balance in its account with SSB, the custodian bank. Such balances, if any at period end, are shown in the Statement of Assets and Liabilities under the payable caption Amount due custodian. To compensate the custodian bank for such overdrafts, the overdrawn Fund
| | |
| 24 | | Invesco High Yield Bond Factor Fund |
may either (1) leave funds as a compensating balance in the account so the custodian bank can be compensated by earning the additional interest; or (2) compensate by paying the custodian bank at a rate agreed upon by the custodian bank and Invesco, not to exceed the contractually agreed upon rate. The Fund may not purchase additional securities when any borrowings from banks or broker-dealers exceed 5% of the Fund’s total assets, or when any borrowings from an Invesco Fund are outstanding.
NOTE 8–Distributions to Shareholders and Tax Components of Net Assets
Tax Character of Distributions to Shareholders Paid During the Fiscal Years Ended February 28, 2022 and 2021:
| | | | | | | | | | | | |
| | | 2022 | | | | | | 2021 | |
|
| |
Ordinary income* | | $ | 1,582,871 | | | | | | | $ | 1,726,436 | |
|
| |
Return of capital | | | – | | | | | | | | 65,351 | |
|
| |
Total distributions | | $ | 1,582,871 | | | | | | | $ | 1,791,787 | |
|
| |
| * | Includes short-term capital gain distributions, if any. |
Tax Components of Net Assets at Period-End:
| | | | |
| | | 2022 | |
|
| |
Undistributed ordinary income | | $ | 17,060 | |
|
| |
Net unrealized appreciation (depreciation) – investments | | | (1,107,022 | ) |
|
| |
Temporary book/tax differences | | | (17,206 | ) |
|
| |
Capital loss carryforward | | | (4,228,802 | ) |
|
| |
Shares of beneficial interest | | | 39,690,856 | |
|
| |
Total net assets | | $ | 34,354,886 | |
|
| |
The difference between book-basis and tax-basis unrealized appreciation (depreciation) is due to differences in the timing of recognition of gains and losses on investments for tax and book purposes. The Fund’s net unrealized appreciation (depreciation) difference is attributable primarily to wash sales and derivative instruments.
The temporary book/tax differences are a result of timing differences between book and tax recognition of income and/or expenses. The Fund’s temporary book/tax differences are the result of the trustee deferral of compensation and retirement plan benefits.
Capital loss carryforward is calculated and reported as of a specific date. Results of transactions and other activity after that date may affect the amount of capital loss carryforward actually available for the Fund to utilize. The ability to utilize capital loss carryforward in the future may be limited under the Internal Revenue Code and related regulations based on the results of future transactions.
The Fund has a capital loss carryforward as of February 28, 2022, as follows:
Capital Loss Carryforward*
| | | | | | | | | | | | | | | | | | | | |
|
| |
| Expiration | | Short-Term | | | | | | Long-Term | | | | | | Total | |
|
| |
Not subject to expiration | | $ | 1,294,896 | | | | | | | $ | 2,933,906 | | | | | | | $ | 4,228,802 | |
|
| |
| * | Capital loss carryforward is reduced for limitations, if any, to the extent required by the Internal Revenue Code and may be further limited depending upon a variety of factors, including the realization of net unrealized gains or losses as of the date of any reorganization. |
NOTE 9–Investment Transactions
The aggregate amount of investment securities (other than short-term securities, U.S. Government obligations and money market funds, if any) purchased and sold by the Fund during the year ended February 28, 2022 was $22,567,671 and $22,522,898, respectively. Cost of investments, including any derivatives, on a tax basis includes the adjustments for financial reporting purposes as of the most recently completed federal income tax reporting period-end.
| | | | |
Unrealized Appreciation (Depreciation) of Investments on a Tax Basis | |
Aggregate unrealized appreciation of investments | | | $ 648,741 | |
|
| |
Aggregate unrealized (depreciation) of investments | | | (1,755,763 | ) |
|
| |
Net unrealized appreciation (depreciation) of investments | | | $(1,107,022 | ) |
|
| |
Cost of investments for tax purposes is $35,347,162.
NOTE 10–Reclassification of Permanent Differences
Primarily as a result of differing book/tax treatment of derivative instruments, on February 28, 2022, undistributed net investment income was increased by $11,333, undistributed net realized gain (loss) was decreased by $11,329 and shares of beneficial interest was decreased by $4. This reclassification had no effect on the net assets of the Fund.
| | |
| 25 | | Invesco High Yield Bond Factor Fund |
NOTE 11–Share Information
| | | | | | | | | | | | | | | | |
| | | Summary of Share Activity | |
|
| |
| | |
| | | Year ended | | | Year ended | |
| | | February 28, 2022(a) | | | February 28, 2021 | |
| | | Shares | | | Amount | | | Shares | | | Amount | |
|
| |
Sold: | | | | | | | | | | | | | | | | |
Class A | | | 689,863 | | | $ | 6,375,087 | | | | 712,810 | | | $ | 6,278,805 | |
|
| |
Class C | | | 126,528 | | | | 1,169,030 | | | | 182,202 | | | | 1,598,201 | |
|
| |
Class R | | | 163,457 | | | | 1,501,493 | | | | 97,058 | | | | 844,750 | |
|
| |
Class Y | | | 256,496 | | | | 2,387,754 | | | | 54,911 | | | | 474,206 | |
|
| |
Class R6 | | | 10,371 | | | | 96,882 | | | | 233 | | | | 2,128 | |
|
| |
| | | | |
Issued as reinvestment of dividends: | | | | | | | | | | | | | | | | |
Class A | | | 99,297 | | | | 916,194 | | | | 121,947 | | | | 1,071,974 | |
|
| |
Class C | | | 15,850 | | | | 146,223 | | | | 22,864 | | | | 200,494 | |
|
| |
Class R | | | 15,519 | | | | 143,078 | | | | 17,841 | | | | 156,458 | |
|
| |
Class Y | | | 7,059 | | | | 65,148 | | | | 6,774 | | | | 59,610 | |
|
| |
Class R6 | | | 281 | | | | 2,577 | | | | 204 | | | | 1,758 | |
|
| |
| | | | |
Automatic conversion of Class C shares to Class A shares: | | | | | | | | | | | | | | | | |
Class A | | | 46,045 | | | | 424,513 | | | | 61,830 | | | | 558,432 | |
|
| |
Class C | | | (46,056 | ) | | | (424,513 | ) | | | (61,843 | ) | | | (558,432 | ) |
|
| |
| | | | |
Reacquired: | | | | | | | | | | | | | | | | |
Class A | | | (1,012,748 | ) | | | (9,345,606 | ) | | | (711,775 | ) | | | (6,110,480 | ) |
|
| |
Class C | | | (162,685 | ) | | | (1,497,731 | ) | | | (214,155 | ) | | | (1,820,950 | ) |
|
| |
Class R | | | (89,820 | ) | | | (826,956 | ) | | | (118,572 | ) | | | (1,033,511 | ) |
|
| |
Class Y | | | (90,213 | ) | | | (821,367 | ) | | | (30,413 | ) | | | (267,344 | ) |
|
| |
Class R6 | | | (4,089 | ) | | | (37,891 | ) | | | (10,188 | ) | | | (90,009 | ) |
|
| |
Net increase in share activity | | | 25,155 | | | $ | 273,915 | | | | 131,728 | | | $ | 1,366,090 | |
|
| |
| (a) | There are entities that are record owners of more than 5% of the outstanding shares of the Fund and in the aggregate own 17% of the outstanding shares of the Fund. IDI has an agreement with these entities to sell Fund shares. The Fund, Invesco and/or Invesco affiliates may make payments to these entities, which are considered to be related to the Fund, for providing services to the Fund, Invesco and/or Invesco affiliates including but not limited to services such as securities brokerage, distribution, third party record keeping and account servicing. The Fund has no knowledge as to whether all or any portion of the shares owned of record by these entities are also owned beneficially. |
| | |
| 26 | | Invesco High Yield Bond Factor Fund |
Report of Independent Registered Public Accounting Firm
To the Board of Trustees of AIM Investment Securities Funds (Invesco Investment Securities Funds) and Shareholders of Invesco High Yield Bond Factor Fund
Opinion on the Financial Statements
We have audited the accompanying statement of assets and liabilities, including the schedule of investments, of Invesco High Yield Bond Factor Fund (one of the funds constituting AIM Investment Securities Funds (Invesco Investment Securities Funds), referred to hereafter as the “Fund”) as of February 28, 2022, the related statement of operations for the year ended February 28, 2022, the statement of changes in net assets for each of the two years in the period ended February 28, 2022, including the related notes, and the financial highlights for each of the periods indicated in the table below (collectively referred to as the “financial statements”). In our opinion, the financial statements present fairly, in all material respects, the financial position of the Fund as of February 28, 2022, the results of its operations for the year then ended, the changes in its net assets for each of the two years in the period ended February 28, 2022 and the financial highlights for each of the periods indicated in the table below, in conformity with accounting principles generally accepted in the United States of America.
|
| |
Financial Highlights |
For each of the two years in the period ended February 28, 2022, the nine months ended February 29, 2020 and the year ended May 31, 2019 for Class A, Class C, Class R, Class Y and Class R6 For each of the two years in the period ended February 28, 2022, the nine months ended February 29, 2020 and the period May 24, 2019 (commencement date) through May 31, 2019 for Class R5 |
The financial statements of Oppenheimer Global High Yield Fund (subsequently renamed Invesco High Yield Bond Factor Fund) as of and for the year ended May 31, 2018 and the financial highlights for each of the periods ended on or prior to May 31, 2018 (not presented herein, other than the financial highlights) were audited by other auditors whose report dated July 25, 2018 expressed an unqualified opinion on those financial statements and financial highlights.
Basis for Opinion
These financial statements are the responsibility of the Fund’s management. Our responsibility is to express an opinion on the Fund’s financial statements based on our audits. We are a public accounting firm registered with the Public Company Accounting Oversight Board (United States) (PCAOB) and are required to be independent with respect to the Fund in accordance with the U.S. federal securities laws and the applicable rules and regulations of the Securities and Exchange Commission and the PCAOB.
We conducted our audits of these financial statements in accordance with the standards of the PCAOB. Those standards require that we plan and perform the audit to obtain reasonable assurance about whether the financial statements are free of material misstatement, whether due to error or fraud.
Our audits included performing procedures to assess the risks of material misstatement of the financial statements, whether due to error or fraud, and performing procedures that respond to those risks. Such procedures included examining, on a test basis, evidence regarding the amounts and disclosures in the financial statements. Our audits also included evaluating the accounting principles used and significant estimates made by management, as well as evaluating the overall presentation of the financial statements. Our procedures included confirmation of securities owned as of February 28, 2022 by correspondence with the custodian, transfer agent, brokers and agent banks; when replies were not received from brokers or agent banks, we performed other auditing procedures. We believe that our audits provide a reasonable basis for our opinion.
/s/PricewaterhouseCoopers LLP
Houston, Texas
April 28, 2022
We have served as the auditor of one or more of the investment companies in the Invesco group of investment companies since at least 1995. We have not been able to determine the specific year we began serving as auditor.
| | |
| 27 | | Invesco High Yield Bond Factor Fund |
Calculating your ongoing Fund expenses
Example
As a shareholder of the Fund, you incur two types of costs: (1) transaction costs, which may include sales charges (loads) on purchase payments or contingent deferred sales charges on redemptions, if any; and (2) ongoing costs, including management fees, distribution and/or service (12b-1) fees, and other Fund expenses. This example is intended to help you understand your ongoing costs (in dollars) of investing in the Fund and to compare these costs with ongoing costs of investing in other mutual funds. The example is based on an investment of $1,000 invested at the beginning of the period and held for the entire period September 1, 2021 through February 28, 2022.
Actual expenses
The table below provides information about actual account values and actual expenses. You may use the information in this table, together with the amount you invested, to estimate the expenses that you paid over the period. Simply divide your account value by $1,000 (for example, an $8,600 account value divided by $1,000 = 8.6), then multiply the result by the number in the table under the heading entitled “Actual Expenses Paid During Period” to estimate the expenses you paid on your account during this period.
Hypothetical example for comparison purposes
The table below also provides information about hypothetical account values and hypothetical expenses based on the Fund’s actual expense ratio and an assumed rate of return of 5% per year before expenses, which is not the Fund’s actual return.
The hypothetical account values and expenses may not be used to estimate the actual ending account balance or expenses you paid for the period. You may use this information to compare the ongoing costs of investing in the Fund and other funds. To do so, compare this 5% hypothetical example with the 5% hypothetical examples that appear in the shareholder reports of the other funds.
Please note that the expenses shown in the table are meant to highlight your ongoing costs only and do not reflect any transaction costs, such as sales charges (loads) on purchase payments or contingent deferred sales charges on redemptions, if any. Therefore, the hypothetical information is useful in comparing ongoing costs only, and will not help you determine the relative total costs of owning different funds. In addition, if these transaction costs were included, your costs would have been higher.
| | | | | | | | | | | | |
| | | | | ACTUAL | | HYPOTHETICAL (5% annual return before expenses) | | |
| | | Beginning
Account Value
(09/01/21) | | Ending
Account Value
(02/28/22)1 | | Expenses
Paid During
Period2 | | Ending
Account Value
(02/28/22) | | Expenses
Paid During
Period2 | | Annualized
Expense Ratio |
Class A | | $1,000.00 | | $968.10 | | $3.07 | | $1,021.67 | | $3.16 | | 0.63% |
Class C | | 1,000.00 | | 963.30 | | 6.72 | | 1,017.95 | | 6.90 | | 1.38 |
Class R | | 1,000.00 | | 965.80 | | 4.29 | | 1,020.43 | | 4.41 | | 0.88 |
Class Y | | 1,000.00 | | 968.30 | | 1.85 | | 1,022.91 | | 1.91 | | 0.38 |
Class R5 | | 1,000.00 | | 968.30 | | 1.85 | | 1,022.91 | | 1.91 | | 0.38 |
Class R6 | | 1,000.00 | | 969.30 | | 1.86 | | 1,022.91 | | 1.91 | | 0.38 |
| 1 | The actual ending account value is based on the actual total return of the Fund for the period September 1, 2021 through February 28, 2022, after actual expenses and will differ from the hypothetical ending account value which is based on the Fund’s expense ratio and a hypothetical annual return of 5% before expenses. |
| 2 | Expenses are equal to the Fund’s annualized expense ratio as indicated above multiplied by the average account value over the period, multiplied by 181/365 to reflect the most recent fiscal half year. |
| | |
| 28 | | Invesco High Yield Bond Factor Fund |
Tax Information
Form 1099-DIV, Form 1042-S and other year-end tax information provide shareholders with actual calendar year amounts that should be included in their tax returns. Shareholders should consult their tax advisers.
The following distribution information is being provided as required by the Internal Revenue Code or to meet a specific state’s requirement.
The Fund designates the following amounts or, if subsequently determined to be different, the maximum amount allowable for its fiscal year ended February 28, 2022:
| | | | | | | | |
Federal and State Income Tax | | | | | | |
Qualified Dividend Income* | | | 0.00 | % | | | | |
Corporate Dividends Received Deduction* | | | 0.00 | % | | | | |
U.S. Treasury Obligations* | | | 0.00 | % | | | | |
Qualified Business Income* | | | 0.00 | % | | | | |
Business Interest Income* | | | 95.79 | % | | | | |
|
| * The above percentages are based on ordinary income dividends paid to shareholders during the Fund’s fiscal year. | |
| | |
| 29 | | Invesco High Yield Bond Factor Fund |
Trustees and Officers
The address of each trustee and officer is AIM Investment Securities Funds (Invesco Investment Securities Funds) (the “Trust”), 11 Greenway Plaza, Suite 1000, Houston, Texas 77046-1173. The trustees serve for the life of the Trust, subject to their earlier death, incapacitation, resignation, retirement or removal as more specifically provided in the Trust’s organizational documents. Each officer serves for a one year term or until their successors are elected and qualified. Column two below includes length of time served with predecessor entities, if any.
| | | | | | | | |
Name, Year of Birth and Position(s) Held with the Trust | | Trustee and/or Officer Since | | Principal Occupation(s) During Past 5 Years | | Number of Funds in Fund Complex Overseen by Trustee | | Other Directorship(s) Held by Trustee During Past 5 Years |
| Interested Trustee | | | | | | | | |
Martin L. Flanagan1 - 1960 Trustee and Vice Chair | | 2007 | | Executive Director, Chief Executive Officer and President, Invesco Ltd. (ultimate parent of Invesco and a global investment management firm); Trustee and Vice Chair, The Invesco Funds; Vice Chair, Investment Company Institute; and Member of Executive Board, SMU Cox School of Business Formerly: Advisor to the Board, Invesco Advisers, Inc. (formerly known as Invesco Institutional (N.A.), Inc.); Chairman and Chief Executive Officer, Invesco Advisers, Inc. (registered investment adviser); Director, Chairman, Chief Executive Officer and President, Invesco Holding Company (US), Inc. (formerly IVZ Inc.) (holding company), Invesco Group Services, Inc. (service provider) and Invesco North American Holdings, Inc. (holding company); Director, Chief Executive Officer and President, Invesco Holding Company Limited (parent of Invesco and a global investment management firm); Director, Invesco Ltd.; Chairman, Investment Company Institute and President, Co-Chief Executive Officer, Co-President, Chief Operating Officer and Chief Financial Officer, Franklin Resources, Inc. (global investment management organization) | | 188 | | None |
| 1 | Mr. Flanagan is considered an interested person (within the meaning of Section 2(a)(19) of the 1940 Act) of the Trust because he is an officer of the Adviser to the Trust, and an officer and a director of Invesco Ltd., ultimate parent of the Adviser. |
| | |
| T-1 | | Invesco High Yield Bond Factor Fund |
Trustees and Officers–(continued)
| | | | | | | | |
Name, Year of Birth and Position(s) Held with the Trust | | Trustee and/or Officer Since | | Principal Occupation(s) During Past 5 Years | | Number of Funds in Fund Complex Overseen by Trustee | | Other Directorship(s) Held by Trustee During Past 5 Years |
| Independent Trustees | | | | | | | | |
Christopher L. Wilson - 1957 Trustee and Chair | | 2017 | | Retired Formerly: Director, TD Asset Management USA Inc. (mutual fund complex) (22 portfolios); Managing Partner, CT2, LLC (investing and consulting firm); President/Chief Executive Officer, Columbia Funds, Bank of America Corporation; President/Chief Executive Officer, CDC IXIS Asset Management Services, Inc.; Principal & Director of Operations, Scudder Funds, Scudder, Stevens & Clark, Inc.; Assistant Vice President, Fidelity Investments | | 188 | | Formerly: enaible, Inc. (artificial intelligence technology) Director, ISO New England, Inc. (non-profit organization managing regional electricity market) |
Beth Ann Brown - 1968 Trustee | | 2019 | | Independent Consultant Formerly: Head of Intermediary Distribution, Managing Director, Strategic Relations, Managing Director, Head of National Accounts, Senior Vice President, National Account Manager and Senior Vice President, Key Account Manager, Columbia Management Investment Advisers LLC; Vice President, Key Account Manager, Liberty Funds Distributor, Inc.; and Trustee of certain Oppenheimer Funds | | 188 | | Director, Board of Directors of Caron Engineering Inc.; Advisor, Board of Advisors of Caron Engineering Inc.; President and Director, Acton Shapleigh Youth Conservation Corps (non-profit) Formerly: President and Director of Grahamtastic Connection (non-profit) |
Cynthia Hostetler - 1962 Trustee | | 2017 | | Non-Executive Director and Trustee of a number of public and private business corporations Formerly: Director, Aberdeen Investment Funds (4 portfolios); Director, Artio Global Investment LLC (mutual fund complex); Director, Edgen Group, Inc. (specialized energy and infrastructure products distributor); Director, Genesee & Wyoming, Inc. (railroads); Head of Investment Funds and Private Equity, Overseas Private Investment Corporation; President, First Manhattan Bancorporation, Inc.; Attorney, Simpson Thacher & Bartlett LLP | | 188 | | Resideo Technologies, Inc. (smart home technology); Vulcan Materials Company (construction materials company); Trilinc Global Impact Fund; Textainer Group Holdings, (shipping container leasing company); Investment Company Institute (professional organization); Independent Directors Council (professional organization) |
Eli Jones - 1961 Trustee | | 2016 | | Professor and Dean Emeritus, Mays Business School - Texas A&M University Formerly: Dean of Mays Business School-Texas A&M University; Professor and Dean, Walton College of Business, University of Arkansas and E.J. Ourso College of Business, Louisiana State University; Director, Arvest Bank | | 188 | | Insperity, Inc. (formerly known as Administaff) (human resources provider); Member of Regional Board of Directors and Board of Directors, First Financial Bancorp (regional bank) |
Elizabeth Krentzman - 1959 Trustee | | 2019 | | Formerly: Principal and Chief Regulatory Advisor for Asset Management Services and U.S. Mutual Fund Leader of Deloitte & Touche LLP; General Counsel of the Investment Company Institute (trade association); National Director of the Investment Management Regulatory Consulting Practice, Principal, Director and Senior Manager of Deloitte & Touche LLP; Assistant Director of the Division of Investment Management - Office of Disclosure and Investment Adviser Regulation of the U.S. Securities and Exchange Commission and various positions with the Division of Investment Management - Office of Regulatory Policy of the U.S. Securities and Exchange Commission; Associate at Ropes & Gray LLP; and Trustee of certain Oppenheimer Funds | | 188 | | Trustee of the University of Florida National Board Foundation; Member of the Cartica Funds Board of Directors (private investment funds) Formerly: Member of the University of Florida Law Center Association, Inc. Board of Trustees, Audit Committee and Membership Committee |
Anthony J. LaCava, Jr. - 1956 Trustee | | 2019 | | Formerly: Director and Member of the Audit Committee, Blue Hills Bank (publicly traded financial institution) and Managing Partner, KPMG LLP | | 188 | | Blue Hills Bank; Chairman, Bentley University; Member, Business School Advisory Council; and Nominating Committee, KPMG LLP |
Prema Mathai-Davis - 1950 Trustee | | 1998 | | Retired Formerly: Co-Founder & Partner of Quantalytics Research, LLC, (a FinTech Investment Research Platform for the Self-Directed Investor); Trustee of YWCA Retirement Fund; CEO of YWCA of the USA; Board member of the NY Metropolitan Transportation Authority; Commissioner of the NYC Department of Aging; Board member of Johns Hopkins Bioethics Institute | | 188 | | Member of Board of Positive Planet US (non-profit) and HealthCare Chaplaincy Network (non-profit) |
| | |
| T-2 | | Invesco High Yield Bond Factor Fund |
Trustees and Officers–(continued)
| | | | | | | | |
Name, Year of Birth and Position(s) Held with the Trust | | Trustee and/or Officer Since | | Principal Occupation(s) During Past 5 Years | | Number of Funds in Fund Complex Overseen by Trustee | | Other Directorship(s) Held by Trustee During Past 5 Years |
| Independent Trustees–(continued) | | | | | | |
Joel W. Motley - 1952 Trustee | | 2019 | | Director of Office of Finance, Federal Home Loan Bank System; Managing Director of Carmona Motley Inc. (privately held financial advisor); Member of the Council on Foreign Relations and its Finance and Budget Committee; Chairman Emeritus of Board of Human Rights Watch and Member of its Investment Committee; and Member of Investment Committee Board of Historic Hudson Valley (non-profit cultural organization); and Member of the Board, Blue Ocean Acquisition Corp. Formerly: Managing Director of Public Capital Advisors, LLC (privately held financial advisor); Managing Director of Carmona Motley Hoffman, Inc. (privately held financial advisor); Trustee of certain Oppenheimer Funds; Director of Columbia Equity Financial Corp. (privately held financial advisor); and Member of the Vestry of Trinity Church Wall Street | | 188 | | Member of Board of Trust for Mutual Understanding (non-profit promoting the arts and environment); Member of Board of Greenwall Foundation (bioethics research foundation) and its Investment Committee; Member of Board of Friends of the LRC (non-profit legal advocacy); Board Member and Investment Committee Member of Pulitzer Center for Crisis Reporting (non-profit journalism)Positive Planet US |
Teresa M. Ressel - 1962 Trustee | | 2017 | | Non-executive director and trustee of a number of public and private business corporations Formerly: Chief Executive Officer, UBS Securities LLC (investment banking); Chief Operating Officer, UBS AG Americas (investment banking); Sr. Management Team Olayan America, The Olayan Group (international investor/commercial/industrial); Assistant Secretary for Management & Budget and Designated Chief Financial Officer, U.S. Department of Treasury; Director, Atlantic Power Corporation (power generation company) and ON Semiconductor Corporation (semiconductor manufacturing) | | 188 | | None |
Ann Barnett Stern - 1957 Trustee | | 2017 | | President, Chief Executive Officer and Board Member, Houston Endowment, Inc. a private philanthropic institution Formerly: Executive Vice President, Texas Children’s Hospital; Vice President, General Counsel and Corporate Compliance Officer, Texas Children’s Hospital; Attorney at Beck, Redden and Secrest, LLP and Andrews and Kurth LLP | | 188 | | Trustee and Board Vice Chair of Holdsworth Center Trustee and Chair of Nomination/Governance Committee, Good Reason Houston, (non-profit); Trustee and Investment Committee member of University of Texas Law School Foundation (non-profit); Board Member of Greater Houston Partnership (non-profit); Advisory Board member, Baker Institute for Public Policy at Rice University (non-profit) Formerly: Director and Audit Committee Member of Federal Reserve Bank of Dallas |
Robert C. Troccoli - 1949 Trustee | | 2016 | | Retired Formerly: Adjunct Professor, University of Denver - Daniels College of Business; and Managing Partner, KPMG LLP | | 188 | | None |
Daniel S. Vandivort - 1954 Trustee | | 2019 | | President, Flyway Advisory Services LLC (consulting and property management) | | 188 | | Formerly: Trustee, Board of Trustees, Treasurer and Chairman of the Audit and Committee, Huntington Disease Foundation of America; Trustee and Governance Chair, of certain Oppenheimer Funds |
| | |
| T-3 | | Invesco High Yield Bond Factor Fund |
Trustees and Officers–(continued)
| | | | | | | | |
Name, Year of Birth and Position(s) Held with the Trust | | Trustee and/or Officer Since | | Principal Occupation(s) During Past 5 Years | | Number of Funds in Fund Complex Overseen by Trustee | | Other Directorship(s) Held by Trustee During Past 5 Years |
| Officers | | | | | | | | |
Sheri Morris - 1964 President and Principal Executive Officer | | 1999 | | Head of Global Fund Services, Invesco Ltd.; President and Principal Executive Officer, The Invesco Funds; Vice President, Invesco Exchange-Traded Fund Trust, Invesco Exchange-Traded Fund Trust II, Invesco India Exchange-Traded Fund Trust, Invesco Actively Managed Exchange-Traded Fund Trust, Invesco Actively Managed Exchange-Traded Commodity Fund Trust and Invesco Exchange-Traded Self-Indexed Fund Trust; and Vice President, OppenheimerFunds, Inc. Formerly: Vice President, Treasurer and Principal Financial Officer, The Invesco Funds; Vice President, Invesco AIM Advisers, Inc., Invesco AIM Capital Management, Inc. and Invesco AIM Private Asset Management, Inc.; Assistant Vice President and Assistant Treasurer, The Invesco Funds; Vice President and Assistant Vice President, Invesco Advisers, Inc.; Assistant Vice President, Invesco AIM Capital Management, Inc. and Invesco AIM Private Asset Management, Inc.; Treasurer, Invesco Exchange-Traded Fund Trust, Invesco Exchange-Traded Fund Trust II, Invesco India Exchange-Traded Fund Trust and Invesco Actively Managed Exchange-Traded Fund Trust and Senior Vice President, Invesco Advisers, Inc. (formerly known as Invesco Institutional (N.A.), Inc.) (registered investment adviser) | | N/A | | N/A |
Jeffrey H. Kupor - 1968 Senior Vice President, Chief Legal Officer and Secretary | | 2018 | | Head of Legal of the Americas, Invesco Ltd.; Senior Vice President and Secretary, Invesco Advisers, Inc. (formerly known as Invesco Institutional (N.A.), Inc.) (registered investment adviser); Senior Vice President and Secretary, Invesco Distributors, Inc. (formerly known as Invesco AIM Distributors, Inc.); Vice President and Secretary, Invesco Investment Services, Inc. (formerly known as Invesco AIM Investment Services, Inc.) Senior Vice President, Chief Legal Officer and Secretary, The Invesco Funds; Secretary and General Counsel, Invesco Investment Advisers LLC (formerly known as Van Kampen Asset Management); Secretary and General Counsel, Invesco Capital Markets, Inc. (formerly known as Van Kampen Funds Inc.) and Chief Legal Officer, Invesco Exchange-Traded Fund Trust, Invesco Exchange-Traded Fund Trust II, Invesco India Exchange-Traded Fund Trust, Invesco Actively Managed Exchange-Traded Fund Trust, Invesco Actively Managed Exchange-Traded Commodity Fund Trust and Invesco Exchange-Traded Self-Indexed Fund Trust;; Secretary and Vice President, Harbourview Asset Management Corporation; Secretary and Vice President, OppenheimerFunds, Inc. and Invesco Managed Accounts, LLC; Secretary and Senior Vice President, OFI Global Institutional, Inc.; Secretary and Vice President, OFI SteelPath, Inc.; Secretary and Vice President, Oppenheimer Acquisition Corp.; Secretary and Vice President, Shareholder Services, Inc.; Secretary and Vice President, Trinity Investment Management Corporation Formerly: Secretary and Vice President, Jemstep, Inc.; Head of Legal, Worldwide Institutional, Invesco Ltd.; Secretary and General Counsel, INVESCO Private Capital Investments, Inc.; Senior Vice President, Secretary and General Counsel, Invesco Management Group, Inc. (formerly known as Invesco AIM Management Group, Inc.); Assistant Secretary, INVESCO Asset Management (Bermuda) Ltd.; Secretary and General Counsel, Invesco Private Capital, Inc.; Assistant Secretary and General Counsel, INVESCO Realty, Inc.; Secretary and General Counsel, Invesco Senior Secured Management, Inc.; Secretary, Sovereign G./P. Holdings Inc.; and Secretary, Invesco Indexing LLC; Secretary, W.L. Ross & Co., LLC | | N/A | | N/A |
Andrew R. Schlossberg - 1974 Senior Vice President | | 2019 | | Head of the Americas and Senior Managing Director, Invesco Ltd.; Director and Senior Vice President, Invesco Advisers, Inc. (formerly known as Invesco Institutional (N.A.), Inc.) (registered investment adviser); Director and Chairman, Invesco Investment Services, Inc. (formerly known as Invesco AIM Investment Services, Inc.) (registered transfer agent); Senior Vice President, The Invesco Funds; Director, Invesco Investment Advisers LLC (formerly known as Van Kampen Asset Management) Formerly: Director, President and Chairman, Invesco Insurance Agency, Inc.; Director, Invesco UK Limited; Director and Chief Executive, Invesco Asset Management Limited and Invesco Fund Managers Limited; Assistant Vice President, The Invesco Funds; Senior Vice President, Invesco Advisers, Inc. (formerly known as Invesco Institutional (N.A.), Inc.) (registered investment adviser); Director and Chief Executive, Invesco Administration Services Limited and Invesco Global Investment Funds Limited; Director, Invesco Distributors, Inc.; Head of EMEA, Invesco Ltd.; President, Invesco Actively Managed Exchange-Traded Commodity Fund Trust, Invesco Actively Managed Exchange-Traded Fund Trust, Invesco Exchange-Traded Fund Trust, Invesco Exchange-Traded Fund Trust II and Invesco India Exchange-Traded Fund Trust; Managing Director and Principal Executive Officer, Invesco Capital Management LLC | | N/A | | N/A |
| | |
| T-4 | | Invesco High Yield Bond Factor Fund |
Trustees and Officers–(continued)
| | | | | | | | |
Name, Year of Birth and Position(s) Held with the Trust | | Trustee and/or Officer Since | | Principal Occupation(s) During Past 5 Years | | Number of Funds in Fund Complex Overseen by Trustee | | Other Directorship(s) Held by Trustee During Past 5 Years |
| Officers–(continued) | | | | | | | | |
John M. Zerr - 1962 Senior Vice President | | 2006 | | Chief Operating Officer of the Americas; Senior Vice President, Invesco Advisers, Inc. (formerly known as Invesco Institutional (N.A.), Inc.) (registered investment adviser); Senior Vice President, Invesco Distributors, Inc. (formerly known as Invesco AIM Distributors, Inc.); Director and Vice President, Invesco Investment Services, Inc. (formerly known as Invesco AIM Investment Services, Inc.) Senior Vice President, The Invesco Funds; Managing Director, Invesco Capital Management LLC; Director, Invesco Investment Advisers LLC (formerly known as Van Kampen Asset Management); Senior Vice President, Invesco Capital Markets, Inc. (formerly known as Van Kampen Funds Inc.); Manager, Invesco Indexing LLC; Manager, Invesco Specialized Products, LLC; Member, Invesco Canada Funds Advisory Board; Director, President and Chief Executive Officer, Invesco Corporate Class Inc. (corporate mutual fund company); and Director, Chairman, President and Chief Executive Officer, Invesco Canada Ltd. (formerly known as Invesco Trimark Ltd./Invesco Trimark Ltèe) (registered investment adviser and registered transfer agent); President, Invesco, Inc.; President, Invesco Global Direct Real Estate Feeder GP Ltd.; President, Invesco IP Holdings (Canada) Ltd; President, Invesco Global Direct Real Estate GP Ltd.; President, Invesco Financial Services Ltd. / Services Financiers Invesco Ltée; and Director and Chairman, Invesco Trust Company Formerly: President, Trimark Investments Ltd/Services Financiers Invesco Ltee; Director and Senior Vice President, Invesco Insurance Agency, Inc.; Director and Senior Vice President, Invesco Management Group, Inc. (formerly known as Invesco AIM Management Group, Inc.); Secretary and General Counsel, Invesco Management Group, Inc. (formerly known as Invesco AIM Management Group, Inc.); Secretary, Invesco Investment Services, Inc. (formerly known as Invesco AIM Investment Services, Inc.); Chief Legal Officer and Secretary, The Invesco Funds; Secretary and General Counsel, Invesco Investment Advisers LLC (formerly known as Van Kampen Asset Management); Secretary and General Counsel, Invesco Capital Markets, Inc. (formerly known as Van Kampen Funds Inc.); Chief Legal Officer, Invesco Exchange-Traded Fund Trust, Invesco Exchange-Traded Fund Trust II, Invesco India Exchange-Traded Fund Trust, Invesco Actively Managed Exchange-Traded Fund Trust, Invesco Actively Managed Exchange-Traded Commodity Fund Trust and Invesco Exchange-Traded Self-Indexed Fund Trust; Secretary, Invesco Indexing LLC; Director, Secretary, General Counsel and Senior Vice President, Van Kampen Exchange Corp.; Director, Vice President and Secretary, IVZ Distributors, Inc. (formerly known as INVESCO Distributors, Inc.); Director and Vice President, INVESCO Funds Group, Inc.; Director and Vice President, Van Kampen Advisors Inc.; Director, Vice President, Secretary and General Counsel, Van Kampen Investor Services Inc.; Director and Secretary, Invesco Distributors, Inc. (formerly known as Invesco AIM Distributors, Inc.); Director, Senior Vice President, General Counsel and Secretary, Invesco AIM Advisers, Inc. and Van Kampen Investments Inc.; Director, Vice President and Secretary, Fund Management Company; Director, Senior Vice President, Secretary, General Counsel and Vice President, Invesco AIM Capital Management, Inc.; Chief Operating Officer and General Counsel, Liberty Ridge Capital, Inc. (an investment adviser) | | N/A | | N/A |
Gregory G. McGreevey - 1962 Senior Vice President | | 2012 | | Senior Managing Director, Invesco Ltd.; Director, Chairman, President, and Chief Executive Officer, Invesco Advisers, Inc. (formerly known as Invesco Institutional (N.A.), Inc.) (registered investment adviser); Director, Invesco Mortgage Capital, Inc. and Invesco Senior Secured Management, Inc.; Senior Vice President, The Invesco Funds; President, SNW Asset Management Corporation and Invesco Managed Accounts, LLC; Chairman and Director, Invesco Private Capital, Inc.; Chairman and Director, INVESCO Private Capital Investments, Inc.; Chairman and Director, INVESCO Realty, Inc.; and Senior Vice President, Invesco Group Services, Inc. Formerly: Senior Vice President, Invesco Management Group, Inc. and Invesco Advisers, Inc.; Assistant Vice President, The Invesco Funds | | N/A | | N/A |
Adrien Deberghes - 1967 Principal Financial Officer, Treasurer and Vice President | | 2020 | | Head of the Fund Office of the CFO and Fund Administration; Vice President, Invesco Advisers, Inc.; Principal Financial Officer, Treasurer and Vice President, The Invesco Funds; Vice President, Invesco Exchange-Traded Fund Trust, Invesco Exchange-Traded Fund Trust II, Invesco India Exchange-Traded Fund Trust, Invesco Actively Managed Exchange-Traded Fund Trust, Invesco Actively Managed Exchange-Traded Commodity Fund Trust and Invesco Exchange-Traded Self-Indexed Fund Trust Formerly: Senior Vice President and Treasurer, Fidelity Investments | | N/A | | N/A |
Crissie M. Wisdom - 1969 Anti-Money Laundering Compliance Officer | | 2013 | | Anti-Money Laundering and OFAC Compliance Officer for Invesco U.S. entities including: Invesco Advisers, Inc. and its affiliates, Invesco Capital Markets, Inc., Invesco Distributors, Inc., Invesco Investment Services, Inc., The Invesco Funds, Invesco Capital Management, LLC, Invesco Trust Company; and Fraud Prevention Manager for Invesco Investment Services, Inc. | | N/A | | N/A |
| | |
| T-5 | | Invesco High Yield Bond Factor Fund |
Trustees and Officers–(continued)
| | | | | | | | |
Name, Year of Birth and Position(s) Held with the Trust | | Trustee and/or Officer Since | | Principal Occupation(s) During Past 5 Years | | Number of Funds in Fund Complex Overseen by Trustee | | Other Directorship(s) Held by Trustee During Past 5 Years |
| Officers–(continued) | | | | | | | | |
Todd F. Kuehl - 1969 Chief Compliance Officer and Senior Vice President | | 2020 | | Chief Compliance Officer, Invesco Advisers, Inc. (registered investment adviser); and Chief Compliance Officer, The Invesco Funds and Senior Vice President Formerly: Managing Director and Chief Compliance Officer, Legg Mason (Mutual Funds); Chief Compliance Officer, Legg Mason Private Portfolio Group (registered investment adviser) | | N/A | | N/A |
Michael McMaster - 1962 Chief Tax Officer, Vice President and Assistant Treasurer | | 2020 | | Head of Global Fund Services Tax; Chief Tax Officer, Vice President and Assistant Treasurer, The Invesco Funds; Vice President, Invesco Advisers, Inc.; Assistant Treasurer, Invesco Capital Management LLC, Assistant Treasurer and Chief Tax Officer, Invesco Exchange-Traded Fund Trust, Invesco Exchange-Traded Fund Trust II, Invesco India Exchange-Traded Fund Trust, Invesco Actively Managed Exchange-Traded Fund Trust, Invesco Actively Managed Exchange-Traded Commodity Fund Trust and Invesco Exchange-Traded Self-Indexed Fund Trust; Assistant Treasurer, Invesco Specialized Products, LLC Formerly: Senior Vice President – Managing Director of Tax Services, U.S. Bank Global Fund Services (GFS) | | N/A | | N/A |
The Statement of Additional Information of the Trust includes additional information about the Fund’s Trustees and is available upon request, without charge, by calling 1.800.959.4246. Please refer to the Fund’s Statement of Additional Information for information on the Fund’s sub-advisers.
| | | | | | |
| Office of the Fund | | Investment Adviser | | Distributor | | Auditors |
| 11 Greenway Plaza, Suite 1000 | | Invesco Advisers, Inc. | | Invesco Distributors, Inc. | | PricewaterhouseCoopers LLP |
| Houston, TX 77046-1173 | | 1555 Peachtree Street, N.E. | | 11 Greenway Plaza, Suite 1000 | | 1000 Louisiana Street, Suite 5800 |
| | Atlanta, GA 30309 | | Houston, TX 77046-1173 | | Houston, TX 77002-5678 |
| | | |
| Counsel to the Fund | | Counsel to the Independent Trustees | | Transfer Agent | | Custodian |
| Stradley Ronon Stevens & Young, LLP | | Goodwin Procter LLP | | Invesco Investment Services, Inc. | | State Street Bank and Trust Company |
| 2005 Market Street, Suite 2600 | | 901 New York Avenue, N.W. | | 11 Greenway Plaza, Suite 1000 | | 225 Franklin Street |
| Philadelphia, PA 19103-7018 | | Washington, D.C. 20001 | | Houston, TX 77046-1173 | | Boston, MA 02110-2801 |
| | |
| T-6 | | Invesco High Yield Bond Factor Fund |

Go paperless with eDelivery
Visit invesco.com/edelivery to enjoy the convenience and security of anytime electronic access to your investment documents. With eDelivery, you can elect to have any or all of the following materials delivered straight to your inbox to download, save and print from your own computer:
∎ Fund reports and prospectuses
∎ Quarterly statements
∎ Daily confirmations
∎ Tax forms
Invesco mailing information
Send general correspondence to Invesco Investment Services, Inc., P.O. Box 219078, Kansas City, MO 64121-9078.
Important notice regarding delivery of security holder documents
To reduce Fund expenses, only one copy of most shareholder documents may be mailed to shareholders with multiple accounts at the same address (Householding). Mailing of your shareholder documents may be householded indefinitely unless you instruct us otherwise. If you do not want the mailing of these documents to be combined with those for other members of your household, please contact Invesco Investment Services, Inc. at 800 959 4246 or contact your financial institution. We will begin sending you individual copies for each account within 30 days after receiving your request.
Fund holdings and proxy voting information
The Fund provides a complete list of its portfolio holdings four times each year, at the end of each fiscal quarter. For the second and fourth quarters, the list appears, respectively, in the Fund’s semiannual and annual reports to shareholders. For the first and third quarters, the Fund files the list with the Securities and Exchange Commission (SEC) as an exhibit to its reports on Form N-PORT. The most recent list of portfolio holdings is available at invesco.com/completeqtrholdings. Shareholders can also look up the Fund’s Form N-PORT filings on the SEC website, sec.gov. The SEC file numbers for the Fund are shown below.
A description of the policies and procedures that the Fund uses to determine how to vote proxies relating to portfolio securities is available without charge, upon request, from our Client Services department at 800 959 4246, or at invesco.com/ corporate/about-us/esg. The information is also available on the SEC website, sec.gov.
Information regarding how the Fund voted proxies related to its portfolio securities during the most recent 12-month period ended June 30 is available at invesco.com/proxysearch. This information is also available on the SEC website, sec.gov.
Invesco Advisers, Inc. is an investment adviser; it provides investment advisory services to individual and institutional clients and does not sell securities. Invesco Distributors, Inc. is the US distributor for Invesco Ltd.’s retail mutual funds, exchange-traded funds and institutional money market funds. Both are wholly owned, indirect subsidiaries of Invesco Ltd.
| | | | |
| SEC file number(s): 811-05686 and 033-39519 | | Invesco Distributors, Inc. | | O-GLHY-AR-1 |

| | |
| | |
| Annual Report to Shareholders | | February 28, 2022 |
Invesco Income Fund
Nasdaq:
A: AGOVX ∎ C: AGVCX ∎ R: AGVRX ∎ Y: AGVYX ∎ Investor: AGIVX ∎ R5: AGOIX ∎ R6: AGVSX
Management’s Discussion of Fund Performance
| | | | |
| |
Performance summary | |
For the year ended February 28, 2022, Class A shares of Invesco Income Fund (the Fund), at net asset value (NAV), outperformed the Bloomberg U.S. Aggregate Bond Index, the Fund’s broad market benchmark. | |
Your Fund’s long-term performance appears later in this report. | |
| |
Fund vs. Indexes | |
Total returns, 2/28/21 to 2/28/22, at net asset value (NAV). Performance shown does not include applicable contingent deferred sales charges (CDSC) or front-end sales charges, which would have reduced performance. | |
Class A Shares | | | -0.06 | % |
Class C Shares | | | -0.81 | |
Class R Shares | | | -0.40 | |
Class Y Shares | | | 0.19 | |
Investor Class Shares | | | 0.01 | |
Class R5 Shares | | | 0.28 | |
Class R6 Shares | | | 0.36 | |
Bloomberg U.S. Aggregate Bond Index▼ (Broad Market Index) | | | -2.64 | |
| |
Source(s): ▼RIMES Technologies Corp. | | | | |
Market conditions and your Fund
In the first quarter of 2021, rising 10-year US Treasury yields increased significantly to 1.74%,1 its highest level since January 2020, reflecting higher inflation expectations. Largely a result of economic optimism, government bond yields rose globally during the first quarter of 2021 as investors began to price in higher levels of economic growth and inflation moving towards a post-pandemic world. On the fiscal front, another stimulus package was signed into law and COVID-19 vaccine approvals and administration ramped up. 30-year Treasury yields moved higher by 0.75% to end the quarter at 2.41%.1 Importantly, short-term rates, which are closely tied to Federal Reserve policy, were quite steady. Two-year US Treasury yields moved up just 0.05% to 0.16%.1
Fixed income markets settled down in the second quarter of 2021, posting gains and rebounding from negative performance experienced during the early part of the fiscal year due to a sharply rising interest rate environment. Despite higher volatility stemming from inflation concerns and the potential for rising interest rates, investors remained optimistic about the strength of the economic recovery after the Bureau of Economic Analysis reported that US gross domestic product grew at a 6.4% annualized rate for the first quarter of 2021.2 As the US COVID-19 vaccination rate neared the 50% threshold, consumers resumed pre-pandemic activities in the third quarter of 2021 and economically sensitive areas such as the consumer discretionary and industrials sectors began to recover.
In the fourth quarter of 2021, concerns about inflation heightened as US inflation rose to 7%,3 its highest level in nearly 40 years. Though the US Federal Reserve (the Fed) left policy rates unchanged in the quarter, the Fed indicated its accommodative policies were coming to an end in 2022
through a willingness to raise interest rates to combat inflation and the announced reduction of its monthly bond purchase program. Additionally, US interest rate moves and inflation risk significantly affected fixed income valuations during the fiscal year. The two-year Treasury yield rose moderately from 0.27% to 0.73%, while the 10-year increased slightly from 1.48% to 1.52%.1 The yield curve, as measured by the yield differential between two- and 10-year Treasuries flattened during the fiscal year. Despite the withdrawal of central bank support and coronavirus variants raising concerns about economic reopenings and the resumption of travel, we believe investors are cautiously optimistic and expect corporate balance sheets to continue to recover meaningfully in 2022.
At the beginning of 2022, geopolitical and economic tensions between Ukraine and Russia culminated with the latter invading Ukraine. World leaders levied sanctions against Russia that we believe will likely have material effects on its fixed income markets, particularly sovereign debt, corporates and levels of liquidity. Regarding inflation concerns, political uncertainty should give central banks a reason to be cautious, with the Fed unlikely to raise rates by more than 0.25% at the March Federal Open Market Committee meeting, whereas before this crisis, a 0.50% increase was increasingly likely.
During the fiscal year, structured credit securities such as commercial mortgage-backed securities (CMBS), non-agency residential mortgage-backed securities (RMBS) and asset-backed securities (ABS) comprised the majority of the holdings for the Fund. Structured credit securities experienced spread widening during the fiscal year as broad market volatility caused by inflation concerns and anticipation of a more aggressive Fed weighed on spreads. Heavy issuance within structured credit also contributed to spread widening during the fiscal year.
Given this market backdrop, Class A shares of Invesco Income Fund, at NAV, generated a negative return but outperformed its Broad Market Index, the Bloomberg U.S. Aggregate Bond Index. During the fiscal year, the Fund’s duration and yield curve positioning, which was shorter than the index, was a contributor to the Fund’s relative performance. The Fund’s out-of-index exposure to RMBS was also a contributor to relative performance for the fiscal year. The Fund’s security selection within CMBS was a detractor for the fiscal year.
We wish to remind you that the Fund is subject to interest rate risk, meaning when interest rates rise, the value of fixed income securities tends to fall. This risk may be greater in the current market environment because interest rates are at or near historic lows. The degree to which the value of fixed income securities may decline due to rising interest rates may vary depending on the speed and magnitude of the increase in interest rates, as well as individual security characteristics such as price, maturity, duration and coupon and market forces such as supply and demand for similar securities. During the fiscal year, the Fund used active duration and yield curve positioning for risk management and for generating returns. Duration measures a portfolio’s price sensitivity to interest rate changes, with a shorter-duration portfolio tending to be less sensitive to these changes. Buying and selling US Treasury futures contracts was an important tool we used for the management of interest rate risk and to maintain our targeted portfolio duration. We are monitoring interest rates and the market, economic and geopolitical factors that may impact the direction, speed and magnitude of changes to interest rates across the maturity spectrum, including the potential impact of monetary policy changes by the Fed and certain foreign central banks. If interest rates rise, or fall faster than expected, markets may experience increased volatility, which may affect the value and/or liquidity of certain of the Fund’s investments.
We welcome new investors who joined the Fund during the fiscal year and thank you for your investment in Invesco Income Fund.
| 1 | Source: US Department of the Treasury |
| 2 | Source: US Bureau of Economic Analysis |
| 3 | Source: US Bureau of Labor Statistics |
Portfolio manager(s):
Philip Armstrong
Mario Clemente
Kevin Collins
Clint Dudley
David Lyle
Brian Norris
The views and opinions expressed in management’s discussion of Fund performance are those of Invesco Advisers, Inc. and its affiliates. These views
and opinions are subject to change at any time based on factors such as market and economic conditions. These views and opinions may not be relied upon as investment advice or recommendations, or as an offer for a particular security. The information is not a complete analysis of every aspect of any market, country, industry, security or the Fund. Statements of fact are from sources considered reliable, but Invesco Advisers, Inc. makes no representation or warranty as to their completeness or accuracy. Although historical performance is no guarantee of future results, these insights may help you understand our investment management philosophy.
See important Fund and, if applicable, index disclosures later in this report.
Your Fund’s Long-Term Performance
Results of a $10,000 Investment – Oldest Share Class(es)
Fund and index data from 2/29/12
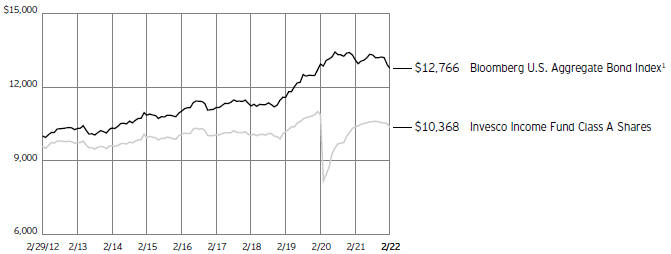
1 Source: RIMES Technologies Corp.
Past performance cannot guarantee future results.
The data shown in the chart include reinvested distributions, applicable sales charges and Fund expenses including management
fees. Index results include reinvested dividends, but they do not reflect sales charges. Performance of the peer group, if applicable, reflects Fund expenses and management fees; performance of a market index does
not. Performance shown in the chart does not reflect deduction of taxes a shareholder would pay on Fund distributions or sale of Fund shares.
| | | | |
| |
Average Annual Total Returns | |
As of 2/28/22, including maximum applicable sales charges | |
| |
Class A Shares | | | | |
Inception (4/28/87) | | | 4.38 | % |
10 Years | | | 0.36 | |
5 Years | | | -0.25 | |
1 Year | | | -4.28 | |
| |
Class C Shares | | | | |
Inception (8/4/97) | | | 3.05 | % |
10 Years | | | 0.20 | |
5 Years | | | -0.14 | |
1 Year | | | -1.78 | |
| |
Class R Shares | | | | |
Inception (6/3/02) | | | 2.43 | % |
10 Years | | | 0.54 | |
5 Years | | | 0.35 | |
1 Year | | | -0.40 | |
| |
Class Y Shares | | | | |
Inception (10/3/08) | | | 2.25 | % |
10 Years | | | 1.05 | |
5 Years | | | 0.85 | |
1 Year | | | 0.19 | |
| |
Investor Class Shares | | | | |
Inception (9/30/03) | | | 2.48 | % |
10 Years | | | 0.84 | |
5 Years | | | 0.67 | |
1 Year | | | 0.01 | |
| |
Class R5 Shares | | | | |
Inception (4/29/05) | | | 2.90 | % |
10 Years | | | 1.15 | |
5 Years | | | 0.94 | |
1 Year | | | 0.28 | |
| |
Class R6 Shares | | | | |
10 Years | | | 0.96 | % |
5 Years | | | 0.95 | |
1 Year | | | 0.36 | |
Class R6 shares incepted on April 4, 2017. Performance shown prior to that date is that of Class A shares at net asset value and includes the 12b-1 fees applicable to Class A shares.
The performance data quoted represent past performance and cannot guarantee future results; current performance may be lower or higher. Please visit invesco.com/ performance for the most recent month-end performance. Performance figures reflect reinvested distributions, changes in net asset value and the effect of the maximum sales charge unless otherwise stated. Performance figures do not reflect deduction of taxes a shareholder would pay on Fund distributions or sale of Fund shares. Investment return and principal value will fluctuate so that you may have a gain or loss when you sell shares.
Class A share performance reflects the maximum 4.25% sales charge, and Class C share performance reflects the applicable contingent deferred sales charge (CDSC) for the period involved. The CDSC on Class C shares is 1% for the first year after purchase. Class R, Class Y, Investor Class,
Class R5 and Class R6 shares do not have a front-end sales charge or a CDSC; therefore, performance is at net asset value.
The performance of the Fund’s share classes will differ primarily due to different sales charge structures and class expenses.
Fund performance reflects any applicable fee waivers and/or expense reimbursements. Had the adviser not waived fees and/or reimbursed expenses currently or in the past, returns would have been lower. See current prospectus for more information.
Supplemental Information
Invesco Income Fund’s investment objective is current income and, secondarily, capital appreciation.
| ∎ | Unless otherwise stated, information presented in this report is as of February 28, 2022, and is based on total net assets. |
| ∎ | Unless otherwise noted, all data is provided by Invesco. |
| ∎ | To access your Fund’s reports/prospectus, visit invesco.com/fundreports. |
About indexes used in this report
| ∎ | The Bloomberg U.S. Aggregate Bond Index is an unmanaged index considered representative of the US investment-grade, fixed-rate bond market. |
| ∎ | The Fund is not managed to track the performance of any particular index, including the index(es) described here, and consequently, the performance of the Fund may deviate significantly from the performance of the index(es). |
| ∎ | A direct investment cannot be made in an index. Unless otherwise indicated, index results include reinvested dividends, and they do not reflect sales charges. Performance of the peer group, if applicable, reflects fund expenses; performance of a market index does not. |
|
|
This report must be accompanied or preceded by a currently effective Fund prospectus, which contains more complete information, including sales charges and expenses. Investors should read it carefully before investing. |
|
| NOT FDIC INSURED | MAY LOSE VALUE | NO BANK GUARANTEE |
Fund Information
Portfolio Composition
| | | | | |
| By security type | | % of total investments |
| |
Asset-Backed Securities | | | | 78.25 | % |
| |
Agency Credit Risk Transfer Notes | | | | 8.62 | |
| |
Preferred Stocks | | | | 5.26 | |
| |
U.S. Government Sponsored Agency Mortgage-Backed Securities | | | | 1.61 | |
| |
Security types each less than 1% portfolio | | | | 0.32 | |
| |
Money Market Funds | | | | 5.94 | |
Top Five Debt Issuers*
| | | | | |
| | | % of total net assets |
| |
1. Benchmark Mortgage Trust | | | | 4.32 | % |
| |
2. Angel Oak Mortgage Trust | | | | 3.40 | |
| |
3. Wells Fargo Commercial Mortgage Trust | | | | 3.37 | |
| |
4. Progress Residential Trust | | | | 3.37 | |
| |
5. CSAIL Commercial Mortgage Trust | | | | 2.87 | |
The Fund’s holdings are subject to change, and there is no assurance that the Fund will continue to hold any particular security.
| * | Excluding money market fund holdings, if any. |
Data presented here are as of February 28, 2022.
Schedule of Investments
February 28, 2022
| | | | | | | | |
| | | Principal
Amount | | | Value | |
|
| |
Asset-Backed Securities–78.22% | |
AMSR Trust,
Series 2020-SFR2, Class E1, 4.03%, 07/17/2037(a) | | $ | 2,412,000 | | | $ | 2,420,213 | |
|
| |
Series 2020-SFR5, Class D, 2.18%, 11/17/2037(a) | | | 5,000,000 | | | | 4,719,070 | |
|
| |
Angel Oak Mortgage Trust, Series 2019-5, Class B1, 3.96%, 10/25/2049(a)(b) | | | 2,361,000 | | | | 2,350,722 | |
|
| |
Series 2020-3, Class M1, 3.81%, 04/25/2065(a)(b) | | | 5,000,000 | | | | 5,008,090 | |
|
| |
Series 2020-6, Class A3, 1.78%, 05/25/2065(a)(b) | | | 1,709,105 | | | | 1,693,007 | |
|
| |
Series 2021-1, Class M1, 2.22%, 01/25/2066(a)(b) | | | 3,164,000 | | | | 3,094,542 | |
|
| |
Series 2021-7, Class M1, 3.26%, 10/25/2066(a)(b) | | | 5,000,000 | | | | 4,857,800 | |
|
| |
Arroyo Mortgage Trust, Series 2020-1, Class A3, 3.33%, 03/25/2055(a) | | | 4,463,000 | | | | 4,505,638 | |
|
| |
Banc of America Commercial Mortgage Trust, Series 2015-UBS7, Class XA, IO, 0.79%, 09/15/2048(c) | | | 17,451,315 | | | | 427,318 | |
|
| |
Bank, Series 2018-BNK14, Class E, 3.00%, 09/15/2060(a) | | | 5,750,000 | | | | 4,244,678 | |
|
| |
BBCMS Mortgage Trust, Series 2018-C2, Class C, 4.97%, 12/15/2051(b) | | | 2,500,000 | | | | 2,659,894 | |
|
| |
Bear Stearns Adjustable Rate Mortgage Trust, Series 2004-10, Class 12A1, 2.76%, 01/25/2035(b) | | | 298,730 | | | | 305,997 | |
|
| |
Benchmark Mortgage Trust,
Series 2018-B3, Class C, 4.54%, 04/10/2051(b) | | | 4,375,000 | | | | 4,498,297 | |
|
| |
Series 2019-B11, Class D, 3.00%, 05/15/2052(a) | | | 5,250,000 | | | | 4,498,170 | |
|
| |
Series 2019-B14, Class C, 3.77%, 12/15/2062(b) | | | 4,650,000 | | | | 4,555,683 | |
|
| |
Series 2019-B15, Class C, 3.72%, 12/15/2072(b) | | | 1,000,000 | | | | 974,018 | |
|
| |
Series 2019-B9, Class C, 4.97%, 03/15/2052(b) | | | 4,000,000 | | | | 4,240,556 | |
|
| |
Series 2020-B17, Class C, 3.37%, 03/15/2053(b) | | | 3,000,000 | | | | 2,876,835 | |
|
| |
Blackbird Capital Aircraft Lease Securitization Ltd., Series 2016-1A, Class B, 5.68%, 12/16/2041(a)(d) | | | 4,564,779 | | | | 4,280,564 | |
|
| |
BRAVO Residential Funding Trust, Series 2019-NQM2, Class A3, 3.11%, 11/25/2059(a)(b) | | | 1,448,647 | | | | 1,437,248 | |
|
| |
Cantor Commercial Real Estate Lending, Series 2019-CF1, Class 65D, 4.66%, 05/15/2052(a)(b) | | | 4,517,000 | | | | 4,019,144 | |
|
| |
CBAM LLC, Series 2021-15A, Class C, 2.37% (3 mo. USD LIBOR + 2.25%), 01/15/2036(a)(e) | | | 5,000,000 | | | | 4,981,720 | |
|
| |
Cerberus Loan Funding XXV L.P., Series 2018-4RA, Class DR, 3.92% (3 mo. USD LIBOR + 3.80%), 10/15/2030(a)(e) | | | 2,100,000 | | | | 2,075,147 | |
|
| |
| | | | | | | | |
| | | Principal Amount | | | Value | |
|
| |
Chase Mortgage Finance Corp.,
Series 2016-SH1, Class M3, 3.75%, 04/25/2045(a)(b) | | $ | 1,351,734 | | | $ | 1,344,520 | |
|
| |
Series 2016-SH2, Class M3, 3.73%, 12/25/2045(a)(b) | | | 1,880,545 | | | | 1,870,009 | |
|
| |
Citigroup Commercial Mortgage Trust,
Series 2013-GC11, Class D, 4.42%, 04/10/2046(a)(b) | | | 4,885,000 | | | | 4,886,993 | |
|
| |
Series 2015-GC29, Class D, 3.11%, 04/10/2048(a) | | | 5,000,000 | | | | 4,669,519 | |
|
| |
COLT Mortgage Loan Trust,
Series 2020-1, Class A3, 2.90%, 02/25/2050(a)(b) | | | 525,600 | | | | 525,600 | |
|
| |
Series 2020-2, Class A3, 3.70%, 03/25/2065(a)(b) | | | 2,664,000 | | | | 2,677,303 | |
|
| |
Series 2020-3, Class A3, 2.38%, 04/27/2065(a)(b) | | | 815,620 | | | | 813,775 | |
|
| |
Series 2021-1, Class M1, 2.29%, 06/25/2066(a)(b) | | | 4,500,000 | | | | 4,311,701 | |
|
| |
Commercial Mortgage Trust,
Series 2014-CR19, Class C, 4.70%, 08/10/2024(b) | | | 4,578,800 | | | | 4,608,441 | |
|
| |
Series 2014-UBS4, Class C, IO, 4.65%, 07/10/2024(c) | | | 5,000,000 | | | | 4,969,727 | |
|
| |
Series 2015-CR26, Class C, 4.48%, 10/10/2048(b) | | | 4,000,000 | | | | 4,055,555 | |
|
| |
Credit Suisse Mortgage Capital Ctfs., Series 2020-SPT1, Class A3, 2.73%, 04/25/2065(a)(d) | | | 5,000,000 | | | | 4,975,139 | |
|
| |
Credit Suisse Mortgage Capital Trust, Series 2021-NQM2, Class M1, 2.28%, 02/25/2066(a)(b) | | | 6,000,000 | | | | 5,825,737 | |
|
| |
CSAIL Commercial Mortgage Trust,
Series 2016-C6, Class E, 3.92%, 01/15/2049(a)(b) | | | 3,000,000 | | | | 2,008,817 | |
|
| |
Series 2017-CX9, Class D, 4.14%, 09/15/2050(a)(b) | | | 6,304,000 | | | | 5,444,914 | |
|
| |
Series 2019-C16, Class C, 4.24%, 06/15/2052(b) | | | 2,000,000 | | | | 1,983,972 | |
|
| |
Series 2019-C17, Class C, 3.93%, 09/15/2052 | | | 5,000,000 | | | | 4,925,133 | |
|
| |
Dryden 53 CLO Ltd., Series 2017- 53A, Class A, 1.36% (3 mo. USD LIBOR + 1.12%), 01/15/2031(a)(e) | | | 2,000,000 | | | | 1,993,492 | |
|
| |
Dryden 76 CLO Ltd., Series 2019- 76A, Class CR, 2.25% (3 mo. USD LIBOR + 2.00%), 10/20/2034(a)(e) | | | 3,000,000 | | | | 2,986,188 | |
|
| |
FirstKey Homes Trust, Series 2020- SFR2, Class D, 1.97%, 10/19/2037(a) | | | 5,000,000 | | | | 4,781,913 | |
|
| |
Flagstar Mortgage Trust,
Series 2018-5, Class B1, 4.50%, 09/25/2048(a)(b) | | | 1,581,178 | | | | 1,560,433 | |
|
| |
Series 2018-5, Class B2, 4.50%, 09/25/2048(a)(b) | | | 1,894,624 | | | | 1,858,935 | |
|
| |
Series 2018-6RR, Class B2, 4.94%, 10/25/2048(a)(b) | | | 2,794,360 | | | | 2,797,978 | |
|
| |
Series 2018-6RR, Class B3, 4.94%, 10/25/2048(a)(b) | | | 2,794,360 | | | | 2,794,223 | |
|
| |
See accompanying Notes to Financial Statements which are an integral part of the financial statements.
| | | | | | | | |
| | | Principal Amount | | | Value | |
|
| |
FREMF Mortgage Trust,
Series 2019-KF68, Class B, 2.31% (1 mo. USD LIBOR + 2.20%), 07/25/2026(a)(e) | | $ | 1,282,620 | | | $ | 1,273,303 | |
|
| |
Series 2019-KF72, Class B, 2.21% (1 mo. USD LIBOR + 2.10%), 11/25/2026(a)(e) | | | 4,161,430 | | | | 4,129,938 | |
|
| |
FRTKL, Series 2021-SFR1, Class E2, 2.52%, 09/17/2038(a) | | | 3,250,000 | | | | 2,991,107 | |
|
| |
Galton Funding Mortgage Trust, Series 2019-H1, Class B1, 3.89%, 10/25/2059(a)(b) | | | 5,480,000 | | | | 5,417,426 | |
|
| |
GCAT Trust,
Series 2019-NQM3, Class B1, 3.95%, 11/25/2059(a)(b) | | | 4,000,000 | | | | 4,056,287 | |
|
| |
Series 2020-NQM2, Class M1, 3.59%, 04/25/2065(a)(b) | | | 3,500,000 | | | | 3,487,227 | |
|
| |
Golub Capital Partners CLO 34(M) Ltd., Series 2017-34A, Class CR, 3.79% (3 mo. USD LIBOR + 3.65%), 03/14/2031(a)(e) | | | 5,000,000 | | | | 4,974,465 | |
|
| |
GS Mortgage Securities Corp. Trust, Series 2017-SLP, Class E, 4.59%, 10/10/2032(a)(b) | | | 5,050,000 | | | | 4,956,597 | |
|
| |
Series 2018-TWR, Class G, 4.12% (1 mo. USD LIBOR + 3.92%), 07/15/2022(a)(e) | | | 3,000,000 | | | | 2,631,117 | |
|
| |
GS Mortgage Securities Trust, Series 2017-GS6, Class C, 4.32%, 05/10/2050(b) | | | 2,774,000 | | | | 2,830,208 | |
|
| |
GS Mortgage-Backed Securities Trust, Series 2020-NQM1, Class A3, 2.35%, 09/27/2060(a)(b) | | | 736,766 | | | | 739,195 | |
|
| |
Imperial Fund Mortgage Trust, Series 2022-NQM1, Class M1, 4.08%, 02/25/2067(a)(b) | | | 7,053,000 | | | | 6,900,129 | |
|
| |
Invitation Homes Trust,
Series 2018-SFR2, Class C, 1.47% (1 mo. USD LIBOR + 1.28%), 06/17/2037(a)(e) | | | 1,249,804 | | | | 1,240,006 | |
|
| |
Series 2018-SFR3, Class C, 1.42% (1 mo. USD LIBOR + 1.30%), 07/17/2037(a)(e) | | | 921,943 | | | | 916,343 | |
|
| |
Jimmy Johns Funding LLC, Series 2017-1A, Class A2II, 4.85%, 07/30/2047(a) | | | 3,997,500 | | | | 4,100,266 | |
|
| |
JP Morgan Chase Commercial Mortgage Securities Trust,
Series 2018-PHH, Class E, 4.06% (1 mo. USD LIBOR + 2.56%), 06/15/2022(a)(e) | | | 2,000,000 | | | | 725,400 | |
|
| |
Series 2018-PHH, Class F, 4.66% (1 mo. USD LIBOR + 3.16%), 06/15/2022(a)(e) | | | 2,000,000 | | | | 430,500 | |
|
| |
JPMBB Commercial Mortgage Securities Trust, Series 2013-C12, Class C, 4.09%, 07/15/2045(b) | | | 4,760,000 | | | | 4,793,629 | |
|
| |
JPMDB Commercial Mortgage Securities Trust, Series 2020- COR7, Class C, 3.72%, 05/13/2053(b) | | | 4,779,000 | | | | 4,764,776 | |
|
| |
Life Mortgage Trust, Series 2021-BMR, Class D, 1.59% (1 mo. USD LIBOR + 1.40%), 03/15/2038(a)(e) | | | 5,701,227 | | | | 5,534,617 | |
|
| |
MACH 1 Cayman Ltd., Series 2019-1, Class B, 4.34%, 10/15/2039(a) | | | 1,953,845 | | | | 1,837,530 | |
|
| |
| | | | | | | | |
| | | Principal Amount | | | Value | |
|
| |
Morgan Stanley Bank of America Merrill Lynch Trust,
Series 2015-C20, Class D, 3.07%, 02/15/2048(a) | | $ | 3,200,000 | | | $ | 2,989,285 | |
|
| |
Series 2015-C24, Class D, 3.26%, 07/15/2025(a) | | | 5,000,000 | | | | 4,619,071 | |
|
| |
Morgan Stanley Capital I Trust, Series 2018-H4, Class C, 5.07%, 12/15/2051(b) | | | 5,000,000 | | | | 5,104,104 | |
|
| |
New Residential Mortgage Loan Trust, Series 2021-NQ1R, Class M1, 2.27%, 07/25/2055(a)(b) | | | 2,250,000 | | | | 2,222,584 | |
|
| |
Octagon Investment Partners 48 Ltd., Series 2020-3A, Class CR, 2.30% (3 mo. USD LIBOR + 2.05%), 10/20/2034(a)(e) | | | 3,000,000 | | | | 2,982,945 | |
|
| |
OHA Loan Funding Ltd. (Cayman Islands),
Series 2015-1A, Class CR3, 3.26% (3 mo. USD LIBOR + 2.05%), 01/19/2037(a)(e) | | | 5,000,000 | | | | 4,979,550 | |
|
| |
Series 2016-1A, Class AR, 1.51% (3 mo. USD LIBOR + 1.26%), 01/20/2033(a)(e) | | | 2,400,000 | | | | 2,389,644 | |
|
| |
PRKCM Trust, Series 2021-AFC1, Class M1, 3.11%, 08/25/2056(a)(b) | | | 6,966,000 | | | | 6,682,158 | |
|
| |
Progress Residential Trust, Series 2021-SFR10, Class E1, 3.57%, 12/17/2040(a) | | | 5,000,000 | | | | 4,742,608 | |
|
| |
Series 2021-SFR11, Class E1, 3.38%, 01/17/2039(a) | | | 4,000,000 | | | | 3,762,581 | |
|
| |
Series 2021-SFR2, Class E2, 2.65%, 04/19/2038(a) | | | 4,500,000 | | | | 4,188,676 | |
|
| |
Series 2021-SFR5, Class E2, 2.36%, 07/17/2038(a) | | | 4,570,000 | | | | 4,172,537 | |
|
| |
Residential Mortgage Loan Trust, Series 2019-3, Class B1, 3.81%, 09/25/2059(a)(b) | | | 3,276,000 | | | | 3,263,520 | |
|
| |
Sapphire Aviation Finance II Ltd., Series 2020-1A, Class B, 4.34%, 03/15/2040(a) | | | 3,039,185 | | | | 2,602,105 | |
|
| |
Seasoned Credit Risk Transfer Trust, Series 2017-4, Class M, 4.75%, 06/25/2057(a)(b) | | | 3,000,000 | | | | 3,047,432 | |
|
| |
SG Residential Mortgage Trust, Series 2021-2, Class M1, 3.05%, 12/25/2061(a)(b) | | | 5,634,000 | | | | 5,424,607 | |
|
| |
Sonic Capital LLC,
Series 2020-1A, Class A2I, 3.85%, 01/20/2050(a) | | | 5,627,305 | | | | 5,756,179 | |
|
| |
Series 2021-1A, Class A2II, 2.64%, 08/20/2051(a) | | | 1,364,292 | | | | 1,277,943 | |
|
| |
STAR Trust, Series 2021-SFR1, Class D, 1.42% (1 mo. USD LIBOR + 1.30%), 04/17/2038(a)(e) | | | 6,665,000 | | | | 6,624,183 | |
|
| |
Starwood Mortgage Residential Trust, Series 2020-2, Class A2, 3.97%, 04/25/2060(a)(b) | | | 4,000,000 | | | | 4,017,524 | |
|
| |
Series 2020-3, Class A3, 2.59%, 04/25/2065(a)(b) | | | 3,000,000 | | | | 2,988,655 | |
|
| |
Series 2022-1, Class M1, 3.69%, 12/25/2066(a)(b) | | | 6,000,000 | | | | 5,952,421 | |
|
| |
Strata CLO I Ltd., Series 2018-1A, Class D, 4.30% (3 mo. USD LIBOR + 4.06%), 01/15/2031(a)(e) | | | 5,000,000 | | | | 4,942,070 | |
|
| |
See accompanying Notes to Financial Statements which are an integral part of the financial statements.
| | | | | | | | |
| | | Principal Amount | | | Value | |
|
| |
Textainer Marine Containers Ltd., Series 2021-3A, Class B, 2.43%, 08/20/2046(a) | | $ | 4,800,000 | | | $ | 4,563,658 | |
|
| |
Textainer Marine Containers VII Ltd. (China),
Series 2020-1A, Class B, 4.94%, 08/21/2045(a) | | | 3,382,370 | | | | 3,400,608 | |
|
| |
Series 2021-2A, Class B, 2.82%, 04/20/2046(a) | | | 4,666,993 | | | | 4,539,005 | |
|
| |
TICP CLO IX Ltd., Series 2017-9A, Class A, 1.39% (3 mo. USD LIBOR + 1.14%), 01/20/2031(a)(e) | | | 7,000,000 | | | | 6,966,778 | |
|
| |
TIF Funding II LLC, Series 2021-1A, Class B, 2.54%, 02/20/2046(a) | | | 1,694,677 | | | | 1,634,938 | |
|
| |
Tricon American Homes Trust,
Series 2018-SFR1, Class D, 4.17%, 05/17/2037(a) | | | 2,000,000 | | | | 2,003,507 | |
|
| |
Series 2020-SFR1, Class D, 2.55%, 07/17/2038(a) | | | 8,900,000 | | | | 8,432,482 | |
|
| |
Series 2020-SFR1, Class E, 3.54%, 07/17/2038(a) | | | 1,600,000 | | | | 1,553,902 | |
|
| |
Series 2020-SFR2, Class D, 2.28%, 11/17/2039(a) | | | 2,000,000 | | | | 1,822,911 | |
|
| |
TRK Trust, Series 2022-INV1, Class M1, 4.08%, 02/25/2057(a)(b) | | | 8,000,000 | | | | 7,942,406 | |
|
| |
Verus Securitization Trust, Series 2020-INV1, Class A3, 3.89%, 03/25/2060(a)(b) | | | 2,800,000 | | | | 2,833,053 | |
|
| |
Series 2021-R2, Class M1, 2.24%, 02/25/2064(a) | | | 4,281,000 | | | | 4,207,686 | |
|
| |
Vista Point Securitization Trust, Series 2020-1, Class M1, 4.15%, 03/25/2065(a)(b) | | | 2,100,000 | | | | 2,115,469 | |
|
| |
Series 2020-2, Class A3, 2.50%, 04/25/2065(a)(b) | | | 1,184,651 | | | | 1,171,944 | |
|
| |
Series 2020-2, Class M1, 3.40%, 04/25/2065(a)(b) | | | 1,650,000 | | | | 1,636,795 | |
|
| |
Voya CLO Ltd., Series 2014-1A, Class CR2, 3.04% (3 mo. USD LIBOR + 2.80%), 04/18/2031(a)(e) | | | 1,300,000 | | | | 1,208,806 | |
|
| |
Wells Fargo Commercial Mortgage Trust,
Series 2014-LC18, Class D, 3.96%, 12/15/2024(a)(b) | | | 6,000,000 | | | | 5,620,913 | |
|
| |
Series 2015-NXS2, Class D, 4.29%, 07/15/2025(b) | | | 6,000,000 | | | | 5,428,910 | |
|
| |
Series 2017-C39, Class C, 4.12%, 09/15/2050 | | | 2,309,000 | | | | 2,307,905 | |
|
| |
Series 2017-RC1, Class D, 3.25%, 01/15/2060(a) | | | 4,000,000 | | | | 3,544,004 | |
|
| |
Zaxby’s Funding LLC, Series 2021-1A, Class A2, 3.24%, 07/30/2051(a) | | | 2,388,000 | | | | 2,329,725 | |
|
| |
Total Asset-Backed Securities (Cost $404,776,273) | | | | 392,122,221 | |
|
| |
|
Agency Credit Risk Transfer Notes–8.62% | |
Fannie Mae Connecticut Avenue Securities,
Series 2017-C03, Class 1M2, 3.19% (1 mo. USD LIBOR + 3.00%), 10/25/2029(e) | | | 4,873,876 | | | | 4,980,329 | |
|
| |
Series 2017-C05, Class 1M2, 2.39% (1 mo. USD LIBOR + 2.20%), 01/25/2030(e) | | | 3,165,366 | | | | 3,215,290 | |
|
| |
Series 2018-C03, Class 1M2, 2.34% (1 mo. USD LIBOR + 2.15%), 10/25/2030(e) | | | 3,552,978 | | | | 3,603,342 | |
|
| |
| | | | | | | | |
| | | Principal Amount | | | Value | |
|
| |
Freddie Mac,
Series 2018-HQA1, Class M2, STACR ® , 2.49% (1 mo. USD LIBOR + 2.30%), 09/25/2030(e) | | $ | 3,794,566 | | | $ | 3,830,687 | |
|
| |
Series 2018-DNA2, Class M2, STACR ® , 2.34% (1 mo. USD LIBOR + 2.15%), 12/25/2030(a)(e) | | | 5,000,000 | | | | 5,040,326 | |
|
| |
Series 2021-DNA2, Class M2, STACR ® , 2.35% (30 Day Average SOFR + 2.30%), 08/25/2033(a)(e) | | | 6,630,000 | | | | 6,711,212 | |
|
| |
Series 2021-DNA5, Class M2, STACR ® , 1.70% (30 Day Average SOFR + 1.65%), 01/25/2034(a)(e) | | | 915,000 | | | | 899,490 | |
|
| |
Series 2021-HQA3, Class M2, STACR ® , 2.15% (30 Day Average SOFR + 2.10%), 09/25/2041(a)(e) | | | 4,250,000 | | | | 4,096,269 | |
|
| |
Series 2018-HRP2, Class M3, STACR ® , 2.59% (1 mo. USD LIBOR + 2.40%), 02/25/2047(a)(e) | | | 5,000,000 | | | | 5,053,681 | |
|
| |
Series 2020-DNA5, Class M2, STACR ® , 2.85% (30 Day Average SOFR + 2.80%), 10/25/2050(a)(e) | | | 3,076,123 | | | | 3,096,884 | |
|
| |
Freddie Mac Multifamily Connecticut Avenue Securities Trust, Series 2019-01, Class M10, 3.44% (1 mo. USD LIBOR + 3.25%), 10/15/2049(a)(e) | | | 1,333,000 | | | | 1,279,097 | |
|
| |
Series 2019-01, Class B10, 5.69% (1 mo. USD LIBOR + 5.50%), 10/15/2049(a)(e) | | | 1,500,000 | | | | 1,414,872 | |
|
| |
Total Agency Credit Risk Transfer Notes
(Cost $42,817,598) | | | | 43,221,479 | |
|
| |
| | |
| | | Shares | | | | |
| | |
Preferred Stocks–5.26% | | | | | | | | |
Mortgage REITs–5.26% | | | | | | | | |
AG Mortgage Investment Trust, Inc., 8.00%, Series C, Pfd.(f) | | | 150,000 | | | | 3,450,000 | |
|
| |
Annaly Capital Management, Inc., 6.50%, Series G, Pfd.(f) | | | 150,000 | | | | 3,411,000 | |
|
| |
Chimera Investment Corp., 8.00%, Series B, Pfd.(f) | | | 150,000 | | | | 3,721,500 | |
|
| |
Dynex Capital, Inc., 6.90%, Series C, Pfd.(f) | | | 160,000 | | | | 3,936,000 | |
|
| |
MFA Financial, Inc., 6.50%, Series C, Pfd.(f) | | | 150,000 | | | | 3,427,500 | |
|
| |
New Residential Investment Corp., 7.13%, Series B, Pfd.(f) | | | 100,000 | | | | 2,360,000 | |
|
| |
PennyMac Mortgage Investment Trust, 8.00%, Series B, Pfd.(f) | | | 100,000 | | | | 2,562,000 | |
|
| |
Two Harbors Investment Corp., 7.25%, Series C, Pfd.(f) | | | 150,000 | | | | 3,489,000 | |
|
| |
Total Preferred Stocks (Cost $25,541,506) | | | | 26,357,000 | |
|
| |
See accompanying Notes to Financial Statements which are an integral part of the financial statements.
| | | | | | | | |
| | | Principal Amount | | | Value | |
|
| |
U.S. Government Sponsored Agency Mortgage-Backed Securities–1.61% | |
Collateralized Mortgage Obligations–1.45% | |
Freddie Mac Multifamily Structured Credit Risk,
Series 2021-MN2, Class M1, 1.85% (30 Day Average SOFR + 1.80%), 07/25/2041(a)(e) | | $ | 4,699,572 | | | $ | 4,487,213 | |
|
| |
Series 2021-MN1, Class M1, 2.05% (30 Day Average SOFR + 2.00%), 01/25/2051(a)(e) | | | 1,395,078 | | | | 1,351,618 | |
|
| |
Series 2021-MN1, Class M2, 3.80% (30 Day Average SOFR + 3.75%), 01/25/2051(a)(e) | | | 1,500,000 | | | | 1,433,112 | |
|
| |
| | | | | | | 7,271,943 | |
|
| |
|
Federal Home Loan Mortgage Corp. (FHLMC)–0.00% | |
9.00%, 04/01/2025 | | | 11,162 | | | | 11,828 | |
|
| |
9.50%, 04/01/2025 | | | 3,084 | | | | 3,106 | |
|
| |
6.50%, 06/01/2029 to 08/01/2032 | | | 2,630 | | | | 2,897 | |
|
| |
7.00%, 03/01/2032 to 05/01/2032 | | | 884 | | | | 930 | |
|
| |
| | | | | | | 18,761 | |
|
| |
|
Federal National Mortgage Association (FNMA)–0.01% | |
6.00%, 04/01/2024 | | | 83 | | | | 90 | |
|
| |
6.75%, 07/01/2024 | | | 31,238 | | | | 34,095 | |
|
| |
6.95%, 07/01/2025 to 10/01/2025 | | | 17,159 | | | | 17,307 | |
|
| |
6.50%, 01/01/2026 to 10/01/2036 | | | 3,812 | | | | 4,187 | |
|
| |
7.00%, 06/01/2029 to 02/01/2032 | | | 837 | | | | 864 | |
|
| |
8.00%, 10/01/2029 | | | 21 | | | | 23 | |
|
| |
| | | | | | | 56,566 | |
|
| |
Investment Abbreviations:
| | |
| Ctfs. | | – Certificates |
| IO | | – Interest Only |
| LIBOR | | – London Interbank Offered Rate |
| Pfd. | | – Preferred |
| REIT | | – Real Estate Investment Trust |
| SOFR | | – Secured Overnight Financing Rate |
| STACR® | | – Structured Agency Credit Risk |
| USD | | – U.S. Dollar |
| | | | | | | | |
| | | Principal
Amount | | | Value | |
|
| |
Government National Mortgage Association
(GNMA)–0.15% | |
8.00%, 04/15/2022 to 02/15/2036 | | $ | 324,953 | | | $ | 360,653 | |
|
| |
7.00%, 01/15/2023 to 12/15/2036 | | | 287,035 | | | | 297,457 | |
|
| |
6.50%, 07/15/2024 to 09/15/2032 | | | 21,090 | | | | 21,441 | |
|
| |
6.95%, 07/20/2025 to 11/20/2026 | | | 39,833 | | | | 40,171 | |
|
| |
8.50%, 01/15/2037 | | | 14,489 | | | | 14,904 | |
|
| |
| | | | | | | 734,626 | |
|
| |
Total U.S. Government Sponsored Agency Mortgage-Backed Securities (Cost $8,389,091) | | | | 8,081,896 | |
|
| |
|
U.S. Treasury Securities–0.32% | |
U.S. Treasury Bills–0.32% | |
0.41%, 05/26/2022 (Cost $1,601,420)(g)(h) | | | 1,603,000 | | | | 1,601,823 | |
|
| |
| | |
| | | Shares | | | | |
| | |
Money Market Funds–5.93% | | | | | | | | |
Invesco Government & Agency Portfolio, Institutional Class, 0.03%(i)(j) | | | 17,855,736 | | | | 17,855,736 | |
|
| |
Invesco Treasury Portfolio, Institutional Class, 0.01%(i)(j) | | | 11,903,824 | | | | 11,903,824 | |
|
| |
Total Money Market Funds
(Cost $29,759,560) | | | | | | | 29,759,560 | |
|
| |
TOTAL INVESTMENTS IN SECURITIES–99.96% (Cost $512,885,448) | | | | 501,143,979 | |
|
| |
OTHER ASSETS LESS LIABILITIES–0.04% | | | | 181,608 | |
|
| |
NET ASSETS–100.00% | | | $ | 501,325,587 | |
|
| |
See accompanying Notes to Financial Statements which are an integral part of the financial statements.
Notes to Schedule of Investments:
| (a) | Security purchased or received in a transaction exempt from registration under the Securities Act of 1933, as amended (the “1933 Act”). The security may be resold pursuant to an exemption from registration under the 1933 Act, typically to qualified institutional buyers. The aggregate value of these securities at February 28, 2022 was $360,675,037, which represented 71.94% of the Fund’s Net Assets. |
| (b) | Interest rate is redetermined periodically based on the cash flows generated by the pool of assets backing the security, less any applicable fees. The rate shown is the rate in effect on February 28, 2022. |
| (c) | Interest only security. Principal amount shown is the notional principal and does not reflect the maturity value of the security. Interest rate is redetermined periodically based on the cash flows generated by the pool of assets backing the security, less any applicable fees. The rate shown is the rate in effect on February 28, 2022. |
| (d) | Step coupon bond. The interest rate represents the coupon rate at which the bond will accrue at a specified future date. |
| (e) | Interest or dividend rate is redetermined periodically. Rate shown is the rate in effect on February 28, 2022. |
| (f) | Security issued at a fixed rate for a specific period of time, after which it will convert to a variable rate. |
| (g) | All or a portion of the value was pledged as collateral to cover margin requirements for open futures contracts. See Note 1M. |
| (h) | Security traded on a discount basis. The interest rate shown represents the discount rate at the time of purchase by the Fund. |
| (i) | Affiliated issuer. The issuer and/or the Fund is a wholly-owned subsidiary of Invesco Ltd., or is affiliated by having an investment adviser that is under common control of Invesco Ltd. The table below shows the Fund’s transactions in, and earnings from, its investments in affiliates for the fiscal year ended February 28, 2022. |
| | | | | | | | | | | | | | | | | | | | | | | | | | | | |
| | | Value
February 28, 2021 | | | Purchases
at Cost | | | Proceeds
from Sales | | | Change in
Unrealized
Appreciation | | | Realized
Gain | | | Value
February 28, 2022 | | | Dividend Income | |
| Investments in Affiliated Money Market Funds: | | | | | | | | | | | | | | | | | | | | | | | | | | | | |
Invesco Government & Agency Portfolio, Institutional Class | | | $32,800,718 | | | | $162,671,234 | | | | $(177,616,216) | | | | $- | | | | $- | | | | $17,855,736 | | | | $4,254 | |
Invesco Treasury Portfolio, Institutional Class | | | 21,867,146 | | | | 108,447,489 | | | | (118,410,811) | | | | - | | | | - | | | | 11,903,824 | | | | 1,073 | |
| Investments Purchased with Cash Collateral from Securities on Loan: | | | | | | | | | | | | | | | | | | | | | | | | | | | | |
Invesco Private Government Fund | | | - | | | | 6,752,726 | | | | (6,752,726) | | | | - | | | | - | | | | - | | | | 20* | |
Invesco Private Prime Fund | | | - | | | | 10,652,834 | | | | (10,652,834) | | | | - | | | | - | | | | - | | | | 312* | |
Total | | | $54,667,864 | | | | $288,524,283 | | | | $(313,432,587) | | | | $- | | | | $- | | | | $29,759,560 | | | | $5,659 | |
| | * | Represents the income earned on the investment of cash collateral, which is included in securities lending income on the Statement of Operations. Does not include rebates and fees paid to lending agent or premiums received from borrowers, if any. |
| (j) | The rate shown is the 7-day SEC standardized yield as of February 28, 2022. |
| | | | | | | | | | | | | | | | | | | | |
| Open Futures Contracts | |
| Short Futures Contracts | | Number of
Contracts | | | Expiration
Month | | | Notional
Value | | | Value | | | Unrealized
Appreciation
(Depreciation) | |
| Interest Rate Risk | | | | | | | | | | | | | | | | | | | | |
U.S. Treasury 10 Year Ultra Notes | | | 208 | | | | June-2022 | | | | $(29,396,250) | | | | $(375,048) | | | | $(375,048) | |
U.S. Treasury Long Bonds | | | 77 | | | | June-2022 | | | | (12,064,938) | | | | (88,904) | | | | (88,904) | |
U.S. Treasury Ultra Bonds | | | 42 | | | | June-2022 | | | | (7,809,375) | | | | (134,531) | | | | (134,531) | |
Total Futures Contracts | | | | | | | | | | | | | | | $(598,483) | | | | $(598,483) | |
| | | | | | | | | | | | | | | | | | | | | | | | | | | | | | | | | | | | | | |
| Open Over-The-Counter Credit Default Swap Agreements | |
| Counterparty | | Reference Entity | | Buy/Sell
Protection | | | (Pay)/
Receive
Fixed Rate | | | Payment
Frequency | | | Maturity
Date | | | Implied
Credit
Spread(a) | | | Notional Value | | | Upfront
Payments Paid
(Received) | | | Value | | | Unrealized
Appreciation
(Depreciation) | |
| Credit Risk | | | | | | | | | | | | | | | | | | | | | | | | | | | | | | | | | | | | | | |
| Merrill Lynch International | | Markit CMBX North America A
Index, Series 12, Version 1 | | | Sell | | | | 2.00% | | | | Monthly | | | | 08/17/2061 | | | | 2.203 | % | | | USD 10,000,000 | | | | $67,556 | | | | $(116,979) | | | | $(184,535) | |
| (a) | Implied credit spreads represent the current level, as of February 28, 2022, at which protection could be bought or sold given the terms of the existing credit default swap agreement and serve as an indicator of the current status of the payment/performance risk of the credit default swap agreement. An implied credit spread that has widened or increased since entry into the initial agreement may indicate a deteriorating credit profile and increased risk of default for the reference entity. A declining or narrowing spread may indicate an improving credit profile or decreased risk of default for the reference entity. Alternatively, credit spreads may increase or decrease reflecting the general tolerance for risk in the credit markets generally. |
Abbreviations:
USD – U.S. Dollar
See accompanying Notes to Financial Statements which are an integral part of the financial statements.
Statement of Assets and Liabilities
February 28, 2022
| | | | |
Assets: | | | | |
| |
Investments in unaffiliated securities, at value (Cost $483,125,888) | | $ | 471,384,419 | |
|
| |
Investments in affiliated money market funds, at value
(Cost $29,759,560) | | | 29,759,560 | |
|
| |
Other investments: | | | | |
Swaps receivable – OTC | | | 2,222 | |
|
| |
Premiums paid on swap agreements – OTC | | | 67,556 | |
|
| |
Cash | | | 279,505 | |
|
| |
Foreign currencies, at value (Cost $962) | | | 910 | |
|
| |
Receivable for: | | | | |
Fund shares sold | | | 21,149 | |
|
| |
Dividends | | | 247,162 | |
|
| |
Interest | | | 1,223,643 | |
|
| |
Principal paydowns | | | 14,091 | |
|
| |
Investment for trustee deferred compensation and retirement plans | | | 192,112 | |
|
| |
Other assets | | | 43,710 | |
|
| |
Total assets | | | 503,236,039 | |
|
| |
| |
Liabilities: | | | | |
Other investments: | | | | |
Variation margin payable - futures contracts | | | 747,211 | |
|
| |
Unrealized depreciation on swap agreements – OTC | | | 184,535 | |
|
| |
Payable for: | | | | |
Dividends | | | 124,120 | |
|
| |
Fund shares reacquired | | | 134,871 | |
|
| |
Accrued fees to affiliates | | | 190,274 | |
|
| |
Accrued trustees’ and officers’ fees and benefits | | | 3,801 | |
|
| |
Accrued other operating expenses | | | 320,325 | |
|
| |
Trustee deferred compensation and retirement plans | | | 205,315 | |
|
| |
Total liabilities | | | 1,910,452 | |
|
| |
Net assets applicable to shares outstanding | | $ | 501,325,587 | |
|
| |
| |
Net assets consist of: | | | | |
Shares of beneficial interest | | $ | 562,645,235 | |
|
| |
Distributable earnings (loss) | | | (61,319,648 | ) |
|
| |
| | $ | 501,325,587 | |
|
| |
| | | | |
Net Assets: | | | | |
Class A | | $ | 303,030,376 | |
|
| |
Class C | | $ | 6,585,783 | |
|
| |
Class R | | $ | 4,042,659 | |
|
| |
Class Y | | $ | 7,658,988 | |
|
| |
Investor Class | | $ | 17,587,904 | |
|
| |
Class R5 | | $ | 404,586 | |
|
| |
Class R6 | | $ | 162,015,291 | |
|
| |
|
Shares outstanding, no par value, with an unlimited number of shares authorized: | |
Class A | | | 39,304,617 | |
|
| |
Class C | | | 853,692 | |
|
| |
Class R | | | 523,987 | |
|
| |
Class Y | | | 992,093 | |
|
| |
Investor Class | | | 2,277,593 | |
|
| |
Class R5 | | | 52,437 | |
|
| |
Class R6 | | | 21,036,764 | |
|
| |
Class A: | | | | |
Net asset value per share | | $ | 7.71 | |
|
| |
Maximum offering price per share
(Net asset value of $7.71 ÷ 95.75%) | | $ | 8.05 | |
|
| |
Class C: | | | | |
Net asset value and offering price per share | | $ | 7.71 | |
|
| |
Class R: | | | | |
Net asset value and offering price per share | | $ | 7.72 | |
|
| |
Class Y: | | | | |
Net asset value and offering price per share | | $ | 7.72 | |
|
| |
Investor Class: | | | | |
Net asset value and offering price per share | | $ | 7.72 | |
|
| |
Class R5: | | | | |
Net asset value and offering price per share | | $ | 7.72 | |
|
| |
Class R6: | | | | |
Net asset value and offering price per share | | $ | 7.70 | |
|
| |
See accompanying Notes to Financial Statements which are an integral part of the financial statements.
Statement of Operations
For the year ended February 28, 2022
| | | | |
Investment income: | | | | |
Interest | | $ | 17,508,304 | |
|
| |
Dividends | | | 2,068,194 | |
|
| |
Dividends from affiliated money market funds (includes securities lending income of $3,729) | | | 9,056 | |
|
| |
Total investment income | | | 19,585,554 | |
|
| |
| |
Expenses: | | | | |
Advisory fees | | | 2,424,685 | |
|
| |
Administrative services fees | | | 84,233 | |
|
| |
Custodian fees | | | 46,270 | |
|
| |
Distribution fees: | | | | |
Class A | | | 809,392 | |
|
| |
Class C | | | 65,959 | |
|
| |
Class R | | | 20,719 | |
|
| |
Investor Class | | | 31,635 | |
|
| |
Transfer agent fees – A, C, R, Y and Investor | | | 662,054 | |
|
| |
Transfer agent fees – R5 | | | 218 | |
|
| |
Transfer agent fees – R6 | | | 5,760 | |
|
| |
Trustees’ and officers’ fees and benefits | | | 27,437 | |
|
| |
Registration and filing fees | | | 100,264 | |
|
| |
Reports to shareholders | | | 1,612 | |
|
| |
Professional services fees | | | 58,370 | |
|
| |
Other | | | 16,592 | |
|
| |
Total expenses | | | 4,355,200 | |
|
| |
Less: Fees waived and/or expense offset arrangement(s) | | | (1,267 | ) |
|
| |
Net expenses | | | 4,353,933 | |
|
| |
Net investment income | | | 15,231,621 | |
|
| |
| |
Realized and unrealized gain (loss) from: | | | | |
| |
Net realized gain (loss) from: | | | | |
Unaffiliated investment securities | | | (3,053,707 | ) |
|
| |
Futures contracts | | | 5,596,839 | |
|
| |
Swap agreements | | | 33,505 | |
|
| |
| | | 2,576,637 | |
|
| |
Change in net unrealized appreciation (depreciation) of: | | | | |
Unaffiliated investment securities | | | (13,754,717 | ) |
|
| |
Foreign currencies | | | (69 | ) |
|
| |
Futures contracts | | | (2,511,673 | ) |
|
| |
Swap agreements | | | 172,644 | |
|
| |
| | | (16,093,815 | ) |
|
| |
Net realized and unrealized gain (loss) | | | (13,517,178 | ) |
|
| |
Net increase in net assets resulting from operations | | $ | 1,714,443 | |
|
| |
See accompanying Notes to Financial Statements which are an integral part of the financial statements.
Statement of Changes in Net Assets
For the years ended February 28, 2022 and 2021
| | | | | | | | |
| | | 2022 | | | 2021 | |
|
| |
Operations: | | | | | | | | |
Net investment income | | $ | 15,231,621 | | | $ | 17,040,907 | |
|
| |
Net realized gain (loss) | | | 2,576,637 | | | | (5,350,941 | ) |
|
| |
Change in net unrealized appreciation (depreciation) | | | (16,093,815 | ) | | | (11,003,510 | ) |
|
| |
Net increase in net assets resulting from operations | | | 1,714,443 | | | | 686,456 | |
|
| |
| | |
Distributions to shareholders from distributable earnings: | | | | | | | | |
| | |
Class A | | | (9,324,418 | ) | | | (13,360,948 | ) |
|
| |
Class C | | | (139,919 | ) | | | (235,881 | ) |
|
| |
Class R | | | (110,349 | ) | | | (129,518 | ) |
|
| |
Class Y | | | (1,057,242 | ) | | | (979,490 | ) |
|
| |
Investor Class | | | (557,785 | ) | | | (812,329 | ) |
|
| |
Class R5 | | | (13,740 | ) | | | (18,061 | ) |
|
| |
Class R6 | | | (5,839,584 | ) | | | (5,455,684 | ) |
|
| |
Total distributions from distributable earnings | | | (17,043,037 | ) | | | (20,991,911 | ) |
|
| |
| | |
Return of capital: | | | | | | | | |
| | |
Class A | | | – | | | | (239,615 | ) |
|
| |
Class C | | | – | | | | (4,230 | ) |
|
| |
Class R | | | – | | | | (2,323 | ) |
|
| |
Class Y | | | – | | | | (17,566 | ) |
|
| |
Investor Class | | | – | | | | (14,569 | ) |
|
| |
Class R5 | | | – | | | | (324 | ) |
|
| |
Class R6 | | | – | | | | (97,842 | ) |
|
| |
Total return of capital | | | – | | | | (376,469 | ) |
|
| |
Total distributions | | | (17,043,037 | ) | | | (21,368,380 | ) |
|
| |
| | |
Share transactions–net: | | | | | | | | |
| | |
Class A | | | (24,264,150 | ) | | | (31,361,922 | ) |
|
| |
Class C | | | 1,304,560 | | | | (2,933,812 | ) |
|
| |
Class R | | | 335,353 | | | | (159,887 | ) |
|
| |
Class Y | | | (41,290,606 | ) | | | 38,035,058 | |
|
| |
Investor Class | | | (1,442,967 | ) | | | (2,926,497 | ) |
|
| |
Class R5 | | | 28,957 | | | | (74,157 | ) |
|
| |
Class R6 | | | (60,422,394 | ) | | | 207,578,458 | |
|
| |
Net increase (decrease) in net assets resulting from share transactions | | | (125,751,247 | ) | | | 208,157,241 | |
|
| |
Net increase (decrease) in net assets | | | (141,079,841 | ) | | | 187,475,317 | |
|
| |
| | |
Net assets: | | | | | | | | |
| | |
Beginning of year | | | 642,405,428 | | | | 454,930,111 | |
|
| |
End of year | | $ | 501,325,587 | | | $ | 642,405,428 | |
|
| |
See accompanying Notes to Financial Statements which are an integral part of the financial statements.
Financial Highlights
The following schedule presents financial highlights for a share of the Fund outstanding throughout the periods indicated.
| | | | | | | | | | | | | | | | | | | | | | | | | | | | | | | | | | | | | | | | | | | | | | | | | | | | | | | | |
| | | Net asset value,
beginning
of period | | | Net
investment
income(a) | | | Net gains (losses) on securities (both
realized and
unrealized) | | | Total from
investment
operations | | | Dividends
from net
investment
income | | | Return of
capital | | | Total
distributions | | | Net asset
value, end
of period | | | Total
return(b) | | | Net assets, end of period
(000’s omitted) | | | Ratio of expenses to average net assets with fee waivers and/or expenses absorbed | | | Ratio of expenses to average net assets without fee waivers and/or expenses absorbed | | | Ratio of net investment income
to average
net assets | | | Portfolio
turnover(c) | |
Class A | | | | | | | | | | | | | | | | | | | | | | | | | | | | | | | | | | | | | | | | | | | | | | | | | | | | | | | | |
Year ended 02/28/22 | | $ | 7.94 | | | $ | 0.20 | | | $ | (0.20 | ) | | $ | 0.00 | | | $ | (0.23 | ) | | $ | – | | | $ | (0.23 | ) | | $ | 7.71 | | | | (0.06 | )% | | $ | 303,030 | | | | 0.91 | % | | | 0.91 | % | | | 2.56 | % | | | 220 | % |
Year ended 02/28/21 | | | 8.68 | | | | 0.23 | | | | (0.66 | ) | | | (0.43 | ) | | | (0.30 | ) | | | (0.01 | ) | | | (0.31 | ) | | | 7.94 | | | | (4.62 | ) | | | 336,319 | | | | 0.97 | | | | 0.97 | | | | 3.16 | | | | 276 | |
Year ended 02/29/20 | | | 8.51 | | | | 0.35 | | | | 0.22 | | | | 0.57 | | | | (0.40 | ) | | | – | | | | (0.40 | ) | | | 8.68 | | | | 6.75 | | | | 405,061 | | | | 1.00 | | | | 1.00 | | | | 4.08 | | | | 97 | |
Year ended 02/28/19 | | | 8.65 | | | | 0.27 | (d) | | | (0.13 | ) | | | 0.14 | | | | (0.28 | ) | | | – | | | | (0.28 | ) | | | 8.51 | | | | 1.66 | | | | 424,003 | | | | 1.01 | | | | 1.08 | | | | 3.12 | (d) | | | 119 | (d) |
Year ended 02/28/18 | | | 8.84 | | | | 0.12 | | | | (0.15 | ) | | | (0.03 | ) | | | (0.16 | ) | | | – | | | | (0.16 | ) | | | 8.65 | | | | (0.34 | ) | | | 482,902 | | | | 0.98 | | | | 0.98 | | | | 1.34 | | | | 25 | |
Class C | | | | | | | | | | | | | | | | | | | | | | | | | | | | | | | | | | | | | | | | | | | | | | | | | | | | | | | | |
Year ended 02/28/22 | | | 7.94 | | | | 0.14 | | | | (0.20 | ) | | | (0.06 | ) | | | (0.17 | ) | | | – | | | | (0.17 | ) | | | 7.71 | | | | (0.81 | ) | | | 6,586 | | | | 1.66 | | | | 1.66 | | | | 1.81 | | | | 220 | |
Year ended 02/28/21 | | | 8.68 | | | | 0.18 | | | | (0.67 | ) | | | (0.49 | ) | | | (0.25 | ) | | | (0.00 | ) | | | (0.25 | ) | | | 7.94 | | | | (5.35 | ) | | | 5,489 | | | | 1.72 | | | | 1.72 | | | | 2.41 | | | | 276 | |
Year ended 02/29/20 | | | 8.50 | | | | 0.29 | | | | 0.22 | | | | 0.51 | | | | (0.33 | ) | | | – | | | | (0.33 | ) | | | 8.68 | | | | 6.09 | | | | 9,556 | | | | 1.75 | | | | 1.75 | | | | 3.33 | | | | 97 | |
Year ended 02/28/19 | | | 8.65 | | | | 0.20 | (d) | | | (0.13 | ) | | | 0.07 | | | | (0.22 | ) | | | – | | | | (0.22 | ) | | | 8.50 | | | | 0.78 | | | | 9,862 | | | | 1.76 | | | | 1.83 | | | | 2.37 | (d) | | | 119 | (d) |
Year ended 02/28/18 | | | 8.83 | | | | 0.05 | | | | (0.13 | ) | | | (0.08 | ) | | | (0.10 | ) | | | – | | | | (0.10 | ) | | | 8.65 | | | | (0.97 | ) | | | 30,223 | | | | 1.73 | | | | 1.73 | | | | 0.59 | | | | 25 | |
Class R | | | | | | | | | | | | | | | | | | | | | | | | | | | | | | | | | | | | | | | | | | | | | | | | | | | | | | | | |
Year ended 02/28/22 | | | 7.95 | | | | 0.18 | | | | (0.20 | ) | | | (0.02 | ) | | | (0.21 | ) | | | – | | | | (0.21 | ) | | | 7.72 | | | | (0.27 | ) | | | 4,043 | | | | 1.16 | | | | 1.16 | | | | 2.31 | | | | 220 | |
Year ended 02/28/21 | | | 8.69 | | | | 0.22 | | | | (0.67 | ) | | | (0.45 | ) | | | (0.28 | ) | | | (0.01 | ) | | | (0.29 | ) | | | 7.95 | | | | (4.85 | ) | | | 3,832 | | | | 1.22 | | | | 1.22 | | | | 2.91 | | | | 276 | |
Year ended 02/29/20 | | | 8.52 | | | | 0.33 | | | | 0.21 | | | | 0.54 | | | | (0.37 | ) | | | – | | | | (0.37 | ) | | | 8.69 | | | | 6.48 | | | | 4,443 | | | | 1.25 | | | | 1.25 | | | | 3.83 | | | | 97 | |
Year ended 02/28/19 | | | 8.66 | | | | 0.25 | (d) | | | (0.13 | ) | | | 0.12 | | | | (0.26 | ) | | | – | | | | (0.26 | ) | | | 8.52 | | | | 1.41 | | | | 5,557 | | | | 1.26 | | | | 1.33 | | | | 2.87 | (d) | | | 119 | (d) |
Year ended 02/28/18 | | | 8.85 | | | | 0.10 | | | | (0.15 | ) | | | (0.05 | ) | | | (0.14 | ) | | | – | | | | (0.14 | ) | | | 8.66 | | | | (0.58 | ) | | | 5,427 | | | | 1.23 | | | | 1.23 | | | | 1.09 | | | | 25 | |
Class Y | | | | | | | | | | | | | | | | | | | | | | | | | | | | | | | | | | | | | | | | | | | | | | | | | | | | | | | | |
Year ended 02/28/22 | | | 7.95 | | | | 0.23 | | | | (0.21 | ) | | | 0.02 | | | | (0.25 | ) | | | – | | | | (0.25 | ) | | | 7.72 | | | | 0.19 | | | | 7,659 | | | | 0.66 | | | | 0.66 | | | | 2.81 | | | | 220 | |
Year ended 02/28/21 | | | 8.69 | | | | 0.26 | | | | (0.67 | ) | | | (0.41 | ) | | | (0.32 | ) | | | (0.01 | ) | | | (0.33 | ) | | | 7.95 | | | | (4.37 | ) | | | 49,578 | | | | 0.72 | | | | 0.72 | | | | 3.41 | | | | 276 | |
Year ended 02/29/20 | | | 8.52 | | | | 0.38 | | | | 0.21 | | | | 0.59 | | | | (0.42 | ) | | | – | | | | (0.42 | ) | | | 8.69 | | | | 7.02 | | | | 10,540 | | | | 0.75 | | | | 0.75 | | | | 4.33 | | | | 97 | |
Year ended 02/28/19 | | | 8.67 | | | | 0.29 | (d) | | | (0.14 | ) | | | 0.15 | | | | (0.30 | ) | | | – | | | | (0.30 | ) | | | 8.52 | | | | 1.80 | | | | 9,674 | | | | 0.76 | | | | 0.83 | | | | 3.37 | (d) | | | 119 | (d) |
Year ended 02/28/18 | | | 8.86 | | | | 0.14 | | | | (0.15 | ) | | | (0.01 | ) | | | (0.18 | ) | | | – | | | | (0.18 | ) | | | 8.67 | | | | (0.08 | ) | | | 10,671 | | | | 0.73 | | | | 0.73 | | | | 1.59 | | | | 25 | |
Investor Class | | | | | | | | | | | | | | | | | | | | | | | | | | | | | | | | | | | | | | | | | | | | | | | | | | | | | | | | |
Year ended 02/28/22 | | | 7.95 | | | | 0.21 | | | | (0.21 | ) | | | 0.00 | | | | (0.23 | ) | | | – | | | | (0.23 | ) | | | 7.72 | | | | 0.01 | (e) | | | 17,588 | | | | 0.83 | (e) | | | 0.83 | (e) | | | 2.64 | (e) | | | 220 | |
Year ended 02/28/21 | | | 8.69 | | | | 0.24 | | | | (0.67 | ) | | | (0.43 | ) | | | (0.30 | ) | | | (0.01 | ) | | | (0.31 | ) | | | 7.95 | | | | (4.55 | )(e) | | | 19,552 | | | | 0.89 | (e) | | | 0.89 | (e) | | | 3.24 | (e) | | | 276 | |
Year ended 02/29/20 | | | 8.52 | | | | 0.36 | | | | 0.21 | | | | 0.57 | | | | (0.40 | ) | | | – | | | | (0.40 | ) | | | 8.69 | | | | 6.81 | (e) | | | 24,787 | | | | 0.93 | (e) | | | 0.93 | (e) | | | 4.15 | (e) | | | 97 | |
Year ended 02/28/19 | | | 8.66 | | | | 0.27 | (d) | | | (0.13 | ) | | | 0.14 | | | | (0.28 | ) | | | – | | | | (0.28 | ) | | | 8.52 | | | | 1.71 | (e) | | | 25,692 | | | | 0.95 | (e) | | | 1.02 | (e) | | | 3.18 | (d)(e) | | | 119 | (d) |
Year ended 02/28/18 | | | 8.85 | | | | 0.12 | | | | (0.14 | ) | | | (0.02 | ) | | | (0.17 | ) | | | – | | | | (0.17 | ) | | | 8.66 | | | | (0.29 | )(e) | | | 30,085 | | | | 0.96 | (e) | | | 0.96 | (e) | | | 1.36 | (e) | | | 25 | |
Class R5 | | | | | | | | | | | | | | | | | | | | | | | | | | | | | | | | | | | | | | | | | | | | | | | | | | | | | | | | |
Year ended 02/28/22 | | | 7.94 | | | | 0.23 | | | | (0.19 | ) | | | 0.04 | | | | (0.26 | ) | | | – | | | | (0.26 | ) | | | 7.72 | | | | 0.41 | | | | 405 | | | | 0.54 | | | | 0.54 | | | | 2.93 | | | | 220 | |
Year ended 02/28/21 | | | 8.68 | | | | 0.26 | | | | (0.67 | ) | | | (0.41 | ) | | | (0.32 | ) | | | (0.01 | ) | | | (0.33 | ) | | | 7.94 | | | | (4.26 | ) | | | 388 | | | | 0.57 | | | | 0.57 | | | | 3.56 | | | | 276 | |
Year ended 02/29/20 | | | 8.51 | | | | 0.38 | | | | 0.22 | | | | 0.60 | | | | (0.43 | ) | | | – | | | | (0.43 | ) | | | 8.68 | | | | 7.11 | | | | 508 | | | | 0.64 | | | | 0.64 | | | | 4.44 | | | | 97 | |
Year ended 02/28/19 | | | 8.66 | | | | 0.30 | (d) | | | (0.14 | ) | | | 0.16 | | | | (0.31 | ) | | | – | | | | (0.31 | ) | | | 8.51 | | | | 1.87 | | | | 946 | | | | 0.70 | | | | 0.73 | | | | 3.43 | (d) | | | 119 | (d) |
Year ended 02/28/18 | | | 8.85 | | | | 0.15 | | | | (0.14 | ) | | | 0.01 | | | | (0.20 | ) | | | – | | | | (0.20 | ) | | | 8.66 | | | | 0.04 | | | | 615 | | | | 0.58 | | | | 0.58 | | | | 1.74 | | | | 25 | |
Class R6 | | | | | | | | | | | | | | | | | | | | | | | | | | | | | | | | | | | | | | | | | | | | | | | | | | | | | | | | |
Year ended 02/28/22 | | | 7.93 | | | | 0.24 | | | | (0.21 | ) | | | 0.03 | | | | (0.26 | ) | | | – | | | | (0.26 | ) | | | 7.70 | | | | 0.36 | | | | 162,015 | | | | 0.49 | | | | 0.49 | | | | 2.98 | | | | 220 | |
Year ended 02/28/21 | | | 8.67 | | | | 0.27 | | | | (0.67 | ) | | | (0.40 | ) | | | (0.33 | ) | | | (0.01 | ) | | | (0.34 | ) | | | 7.93 | | | | (4.23 | ) | | | 227,247 | | | | 0.52 | | | | 0.52 | | | | 3.61 | | | | 276 | |
Year ended 02/29/20 | | | 8.51 | | | | 0.39 | | | | 0.20 | | | | 0.59 | | | | (0.43 | ) | | | – | | | | (0.43 | ) | | | 8.67 | | | | 7.00 | | | | 36 | | | | 0.63 | | | | 0.63 | | | | 4.45 | | | | 97 | |
Year ended 02/28/19 | | | 8.66 | | | | 0.30 | (d) | | | (0.14 | ) | | | 0.16 | | | | (0.31 | ) | | | – | | | | (0.31 | ) | | | 8.51 | | | | 1.88 | | | | 42 | | | | 0.69 | | | | 0.70 | | | | 3.44 | (d) | | | 119 | (d) |
Period ended 02/28/18(f) | | | 8.84 | | | | 0.14 | | | | (0.14 | ) | | | (0.00 | ) | | | (0.18 | ) | | | – | | | | (0.18 | ) | | | 8.66 | | | | (0.03 | ) | | | 6,663 | | | | 0.57 | (g) | | | 0.57 | (g) | | | 1.75 | (g) | | | 25 | |
| (a) | Calculated using average shares outstanding. |
| (b) | Includes adjustments in accordance with accounting principles generally accepted in the United States of America and as such, the net asset value for financial reporting purposes and the returns based upon those net asset values may differ from the net asset value and returns for shareholder transactions. Does not include sales charges and is not annualized for periods less than one year, if applicable. |
| (c) | Portfolio turnover is calculated at the fund level and is not annualized for periods less than one year, if applicable. |
| (d) | Effective July 26, 2018, the Fund modified certain investment policies utilized in achieving its investment objective throughout the period. The Fund’s net investment income and portfolio turnover have increased significantly due to the realignment of the Fund’s portfolio of investments as a result of these changes. |
| (e) | The total return, ratio of expenses to average net assets and ratio of net investment income to average net assets reflect actual 12b-1 fees of 0.17%,0.17%, 0.19%, 0.19% and 0.23% for the years ended February 28, 2022, February 28, 2021, February 29, 2020, February 28, 2019 and February 28, 2018, respectively. |
| (f) | Commencement date of April 4, 2017. |
See accompanying Notes to Financial Statements which are an integral part of the financial statements.
Notes to Financial Statements
February 28, 2022
NOTE 1–Significant Accounting Policies
Invesco Income Fund (the “Fund”), is a series portfolio of AIM Investment Securities Funds (Invesco Investment Securities Funds) (the “Trust”). The Trust is organized as a Delaware statutory trust and is registered under the Investment Company Act of 1940, as amended (the “1940 Act”), as an open-end series management investment company authorized to issue an unlimited number of shares of beneficial interest. Information presented in these financial statements pertains only to the Fund. Matters affecting the Fund or each class will be voted on exclusively by the shareholders of the Fund or each class.
The Fund’s investment objective is current income, and secondarily, capital appreciation.
The Fund currently consists of seven different classes of shares: Class A, Class C, Class R, Class Y, Investor Class, Class R5 and Class R6. Class Y and Investor Class shares are available only to certain investors. Class A shares are sold with a front-end sales charge unless certain waiver criteria are met. Under certain circumstances, load waived shares may be subject to contingent deferred sales charges (“CDSC”). Class C shares are sold with a CDSC. Class R, Class Y, Investor Class, Class R5 and Class R6 shares are sold at net asset value. Class C shares held for eight years after purchase are eligible for automatic conversion into Class A shares of the same Fund (the “Conversion Feature”). The automatic conversion pursuant to the Conversion Feature will generally occur at the end of the month following the eighth anniversary after a purchase of Class C shares.
The Fund is an investment company and accordingly follows the investment company accounting and reporting guidance in accordance with Financial Accounting Standards Board Accounting Standards Codification Topic 946, Financial Services – Investment Companies.
The following is a summary of the significant accounting policies followed by the Fund in the preparation of its financial statements.
| A. | Security Valuations – Securities, including restricted securities, are valued according to the following policy. |
Debt obligations (including convertible securities) and unlisted equities are fair valued using an evaluated quote provided by an independent pricing service. Evaluated quotes provided by the pricing service may be determined without exclusive reliance on quoted prices, and may reflect appropriate factors such as institution-size trading in similar groups of securities, developments related to specific securities, dividend rate (for unlisted equities), yield (for debt obligations), quality, type of issue, coupon rate (for debt obligations), maturity (for debt obligations), individual trading characteristics and other market data. Pricing services generally value debt obligations assuming orderly transactions of institutional round lot size, but a fund may hold or transact in the same securities in smaller, odd lot sizes. Odd lots often trade at lower prices than institutional round lots. Debt obligations are subject to interest rate and credit risks. In addition, all debt obligations involve some risk of default with respect to interest and/or principal payments.
A security listed or traded on an exchange (except convertible securities) is valued at its last sales price or official closing price as of the close of the customary trading session on the exchange where the security is principally traded, or lacking any sales or official closing price on a particular day, the security may be valued at the closing bid price on that day. Securities traded in the over-the-counter market are valued based on prices furnished by independent pricing services or market makers. When such securities are valued by an independent pricing service they may be considered fair valued. Futures contracts are valued at the final settlement price set by an exchange on which they are principally traded. Listed options are valued at the mean between the last bid and asked prices from the exchange on which they are principally traded. Options not listed on an exchange are valued by an independent source at the mean between the last bid and asked prices. For purposes of determining net asset value (“NAV”) per share, futures and option contracts generally are valued 15 minutes after the close of the customary trading session of the New York Stock Exchange (“NYSE”).
Investments in open-end and closed-end registered investment companies that do not trade on an exchange are valued at the end-of-day net asset value per share. Investments in open-end and closed-end registered investment companies that trade on an exchange are valued at the last sales price or official closing price as of the close of the customary trading session on the exchange where the security is principally traded.
Swap agreements are fair valued using an evaluated quote, if available, provided by an independent pricing service. Evaluated quotes provided by the pricing service are valued based on a model which may include end-of-day net present values, spreads, ratings, industry, company performance and returns of referenced assets. Centrally cleared swap agreements are valued at the daily settlement price determined by the relevant exchange or clearinghouse.
Foreign securities’ (including foreign exchange contracts) prices are converted into U.S. dollar amounts using the applicable exchange rates as of the close of the NYSE. If market quotations are available and reliable for foreign exchange-traded equity securities, the securities will be valued at the market quotations. Because trading hours for certain foreign securities end before the close of the NYSE, closing market quotations may become unreliable. If between the time trading ends on a particular security and the close of the customary trading session on the NYSE, events occur that the investment adviser determines are significant and make the closing price unreliable, the Fund may fair value the security. If the event is likely to have affected the closing price of the security, the security will be valued at fair value in good faith using procedures approved by the Board of Trustees. Adjustments to closing prices to reflect fair value may also be based on a screening process of an independent pricing service to indicate the degree of certainty, based on historical data, that the closing price in the principal market where a foreign security trades is not the current value as of the close of the NYSE. Foreign securities’ prices meeting the approved degree of certainty that the price is not reflective of current value will be priced at the indication of fair value from the independent pricing service. Multiple factors may be considered by the independent pricing service in determining adjustments to reflect fair value and may include information relating to sector indices, American Depositary Receipts and domestic and foreign index futures. Foreign securities may have additional risks including exchange rate changes, potential for sharply devalued currencies and high inflation, political and economic upheaval, the relative lack of issuer information, relatively low market liquidity and the potential lack of strict financial and accounting controls and standards.
Securities for which market prices are not provided by any of the above methods may be valued based upon quotes furnished by independent sources. The last bid price may be used to value equity securities. The mean between the last bid and asked prices is used to value debt obligations, including corporate loans.
Securities for which market quotations are not readily available or became unreliable are valued at fair value as determined in good faith by or under the supervision of the Trust’s officers following procedures approved by the Board of Trustees. Issuer specific events, market trends, bid/asked quotes of brokers and information providers and other market data may be reviewed in the course of making a good faith determination of a security’s fair value.
The Fund may invest in securities that are subject to interest rate risk, meaning the risk that the prices will generally fall as interest rates rise and, conversely, the prices will generally rise as interest rates fall. Specific securities differ in their sensitivity to changes in interest rates depending on their individual characteristics. Changes in interest rates may result in increased market volatility, which may affect the value and/or liquidity of certain Fund investments.
Valuations change in response to many factors including the historical and prospective earnings of the issuer, the value of the issuer’s assets, general market conditions which are not specifically related to the particular issuer, such as real or perceived adverse economic conditions, changes in the general outlook for revenues or corporate earnings, changes in interest or currency rates, regional or global instability, natural or environmental disasters, widespread disease or other public health issues, war, acts of terrorism or adverse investor sentiment generally and market liquidity. Because of the inherent uncertainties of valuation, the values reflected in the financial statements may materially differ from the value received upon actual sale of those investments.
| B. | Securities Transactions and Investment Income – Securities transactions are accounted for on a trade date basis. Realized gains or losses on sales are computed on the basis of specific identification of the securities sold. Interest income (net of withholding tax, if any) is recorded on an accrual basis from settlement date and includes coupon interest and amortization of premium and accretion of discount on debt securities as applicable. Pay-in-kind interest income and non-cash dividend income received in the form of securities in-lieu of cash are recorded at the fair value of the securities received. Paydown gains and losses |
on mortgage and asset-backed securities are recorded as adjustments to interest income. Dividend income (net of withholding tax, if any) is recorded on the ex-dividend date.
The Fund may periodically participate in litigation related to Fund investments. As such, the Fund may receive proceeds from litigation settlements. Any proceeds received are included in the Statement of Operations as realized gain (loss) for investments no longer held and as unrealized gain (loss) for investments still held.
Brokerage commissions and mark ups are considered transaction costs and are recorded as an increase to the cost basis of securities purchased and/or a reduction of proceeds on a sale of securities. Such transaction costs are included in the determination of net realized and unrealized gain (loss) from investment securities reported in the Statement of Operations and the Statement of Changes in Net Assets and the net realized and unrealized gains (losses) on securities per share in the Financial Highlights. Transaction costs are included in the calculation of the Fund’s net asset value and, accordingly, they reduce the Fund’s total returns. These transaction costs are not considered operating expenses and are not reflected in net investment income reported in the Statement of Operations and the Statement of Changes in Net Assets, or the net investment income per share and the ratios of expenses and net investment income reported in the Financial Highlights, nor are they limited by any expense limitation arrangements between the Fund and the investment adviser.
The Fund allocates income and realized and unrealized capital gains and losses to a class based on the relative net assets of each class.
The Fund recharacterizes distributions received from REIT investments based on information provided by the REIT into the following categories: ordinary income, long-term and short-term capital gains, and return of capital. If information is not available on a timely basis from the REIT, the recharacterization will be based on available information which may include the previous year’s allocation. If new or additional information becomes available from the REIT at a later date, a recharacterization will be made in the following year. The Fund records as dividend income the amount recharacterized as ordinary income and as realized gain the amount recharacterized as capital gain in the Statement of Operations, and the amount recharacterized as return of capital as a reduction of the cost of the related investment. These recharacterizations are reflected in the accompanying financial statements.
| C. | Country Determination – For the purposes of making investment selection decisions and presentation in the Schedule of Investments, the investment adviser may determine the country in which an issuer is located and/or credit risk exposure based on various factors. These factors include the laws of the country under which the issuer is organized, where the issuer maintains a principal office, the country in which the issuer derives 50% or more of its total revenues and the country that has the primary market for the issuer’s securities, as well as other criteria. Among the other criteria that may be evaluated for making this determination are the country in which the issuer maintains 50% or more of its assets, the type of security, financial guarantees and enhancements, the nature of the collateral and the sponsor organization. Country of issuer and/or credit risk exposure has been determined to be the United States of America, unless otherwise noted. |
| D. | Distributions – Distributions from net investment income, if any, are declared daily and paid monthly. Distributions from net realized capital gain, if any, are generally declared and paid annually and recorded on the ex-dividend date. The Fund may elect to treat a portion of the proceeds from redemptions as distributions for federal income tax purposes. |
| E. | Federal Income Taxes – The Fund intends to comply with the requirements of Subchapter M of the Internal Revenue Code of 1986, as amended (the “Internal Revenue Code”), necessary to qualify as a regulated investment company and to distribute substantially all of the Fund’s taxable earnings to shareholders. As such, the Fund will not be subject to federal income taxes on otherwise taxable income (including net realized capital gain) that is distributed to shareholders. Therefore, no provision for federal income taxes is recorded in the financial statements. |
The Fund recognizes the tax benefits of uncertain tax positions only when the position is more likely than not to be sustained. Management has analyzed the Fund’s uncertain tax positions and concluded that no liability for unrecognized tax benefits should be recorded related to uncertain tax positions. Management is not aware of any tax positions for which it is reasonably possible that the total amounts of unrecognized tax benefits will change materially in the next 12 months.
The Fund files tax returns in the U.S. Federal jurisdiction and certain other jurisdictions. Generally, the Fund is subject to examinations by such taxing authorities for up to three years after the filing of the return for the tax period.
| F. | Expenses – Fees provided for under the Rule 12b-1 plan of a particular class of the Fund are charged to the operations of such class. Transfer agency fees and expenses and other shareholder recordkeeping fees and expenses attributable to Class R5 and Class R6 are allocated based on relative net assets of Class R5 and Class R6. Sub-accounting fees attributable to Class R5 are charged to the operations of the class. Transfer agency fees and expenses and other shareholder recordkeeping fees and expenses relating to all other classes are allocated among those classes based on relative net assets. All other expenses are allocated among the classes based on relative net assets. |
| G. | Accounting Estimates – The preparation of financial statements in conformity with accounting principles generally accepted in the United States of America (“GAAP”) requires management to make estimates and assumptions that affect the reported amounts of assets and liabilities at the date of the financial statements and the reported amounts of revenues and expenses during the reporting period including estimates and assumptions related to taxation. Actual results could differ from those estimates by a significant amount. In addition, the Fund monitors for material events or transactions that may occur or become known after the period-end date and before the date the financial statements are released to print. |
| H. | Indemnifications – Under the Trust’s organizational documents, each Trustee, officer, employee or other agent of the Trust is indemnified against certain liabilities that may arise out of the performance of their duties to the Fund. Additionally, in the normal course of business, the Fund enters into contracts, including the Fund’s servicing agreements, that contain a variety of indemnification clauses. The Fund’s maximum exposure under these arrangements is unknown as this would involve future claims that may be made against the Fund that have not yet occurred. The risk of material loss as a result of such indemnification claims is considered remote. |
| I. | Commercial Mortgage-Backed Securities – The Fund may invest in both single and multi-issuer Commercial Mortgage-Backed Securities (“CMBS”). This includes both investment grade and non-investment grade CMBS as well as other non-rated CMBS. A CMBS is a type of mortgage-backed security that is secured by one or more mortgage loans on interests in commercial real estate property. CMBS differ from conventional debt securities because principal is paid back over the life of the security rather than at maturity. Investments in CMBS are subject to the various risks which relate to the pool of underlying assets in which the CMBS represents an interest. Securities backed by commercial real estate assets are subject to securities market risks as well as risks similar to those of direct ownership of commercial real estate loans. Risks include the ability of a borrower to meet its obligations on the loan which could lead to default or foreclosure of the property. Such actions may impact the amount of proceeds ultimately derived from the loan, and the timing of receipt of such proceeds. |
Management estimates future expected cash flows at the time of purchase based on the anticipated repayment dates on the CMBS. Subsequent changes in expected cash flow projection may result in a prospective change in the timing or character of income recognized on these securities, or the amortized cost of these securities. The Fund amortizes premiums and/or accretes discounts based on the projected cash flows. Realized and unrealized gains and losses on CMBS are included in the Statement of Operations as Net realized gain (loss) from unaffiliated investment securities and Change in net unrealized appreciation (depreciation)of unaffiliated investment securities, respectively.
| J. | Securities Lending – The Fund may lend portfolio securities having a market value up to one-third of the Fund’s total assets. Such loans are secured by collateral equal to no less than the market value of the loaned securities determined daily by the securities lending provider. Such collateral will be cash or debt securities issued or guaranteed by the U.S. Government or any of its sponsored agencies. Cash collateral received in connection with these loans is invested in short-term money market instruments or affiliated, unregistered investment companies that comply with Rule 2a-7 under the 1940 Act and money market funds (collectively, “affiliated money market funds”) and is shown as such on the Schedule of Investments. The Fund bears the risk of loss with respect to the investment of collateral. It is the Fund’s policy to obtain additional collateral from or return excess collateral to the borrower by the end of the next business day, following the valuation date of the securities loaned. Therefore, the value of the collateral held may be temporarily less than the value of the securities on loan. When |
loaning securities, the Fund retains certain benefits of owning the securities, including the economic equivalent of dividends or interest generated by the security. Lending securities entails a risk of loss to the Fund if, and to the extent that, the market value of the securities loaned were to increase and the borrower did not increase the collateral accordingly, and the borrower failed to return the securities. The securities loaned are subject to termination at the option of the borrower or the Fund. Upon termination, the borrower will return to the Fund the securities loaned and the Fund will return the collateral. Upon the failure of the borrower to return the securities, collateral may be liquidated and the securities may be purchased on the open market to replace the loaned securities. The Fund could experience delays and costs in gaining access to the collateral and the securities may lose value during the delay which could result in potential losses to the Fund. Some of these losses may be indemnified by the lending agent. The Fund bears the risk of any deficiency in the amount of the collateral available for return to the borrower due to any loss on the collateral invested. Dividends received on cash collateral investments for securities lending transactions, which are net of compensation to counterparties, are included in Dividends from affiliated money market funds on the Statement of Operations. The aggregate value of securities out on loan, if any, is shown as a footnote on the Statement of Assets and Liabilities.
On September 29, 2021, the Board of Trustees appointed Invesco Advisers, Inc. (the “Adviser” or “Invesco”) to serve as an affiliated securities lending agent for the Fund. Prior to September 29, 2021, the Bank of New York Mellon (“BNYM”) served as the sole securities lending agent for the Fund under the securities lending program. BNYM also continues to serve as a lending agent. To the extent the Fund utilizes the Adviser as an affiliated securities lending agent, the Fund conducts its securities lending in accordance with, and in reliance upon, no-action letters issued by the SEC staff that provide guidance on how an affiliate may act as a direct agent lender and receive compensation for those services in a manner consistent with the federal securities laws. For the year ended February 28, 2022, there were no securities lending transactions with the Adviser.
| K. | Foreign Currency Translations – Foreign currency is valued at the close of the NYSE based on quotations posted by banks and major currency dealers. Portfolio securities and other assets and liabilities denominated in foreign currencies are translated into U.S. dollar amounts at the date of valuation. Purchases and sales of portfolio securities (net of foreign taxes withheld on disposition) and income items denominated in foreign currencies are translated into U.S. dollar amounts on the respective dates of such transactions. The Fund does not separately account for the portion of the results of operations resulting from changes in foreign exchange rates on investments and the fluctuations arising from changes in market prices of securities held. The combined results of changes in foreign exchange rates and the fluctuation of market prices on investments (net of estimated foreign tax withholding) are included with the net realized and unrealized gain or loss from investments in the Statement of Operations. Reported net realized foreign currency gains or losses arise from (1) sales of foreign currencies, (2) currency gains or losses realized between the trade and settlement dates on securities transactions, and (3) the difference between the amounts of dividends, interest, and foreign withholding taxes recorded on the Fund’s books and the U.S. dollar equivalent of the amounts actually received or paid. Net unrealized foreign currency gains and losses arise from changes in the fair values of assets and liabilities, other than investments in securities at fiscal period end, resulting from changes in exchange rates. |
The Fund may invest in foreign securities, which may be subject to foreign taxes on income, gains on investments or currency repatriation, a portion of which may be recoverable. Foreign taxes, if any, are recorded based on the tax regulations and rates that exist in the foreign markets in which the Fund invests and are shown in the Statement of Operations.
| L. | Forward Foreign Currency Contracts – The Fund may engage in foreign currency transactions either on a spot (i.e. for prompt delivery and settlement) basis, or through forward foreign currency contracts, to manage or minimize currency or exchange rate risk. |
The Fund may also enter into forward foreign currency contracts for the purchase or sale of a security denominated in a foreign currency in order to “lock in” the U.S. dollar price of that security, or the Fund may also enter into forward foreign currency contracts that do not provide for physical settlement of the two currencies, but instead are settled by a single cash payment calculated as the difference between the agreed upon exchange rate and the spot rate at settlement based upon an agreed upon notional amount (non-deliverable forwards). The Fund will set aside liquid assets in an amount equal to the daily mark-to-market obligation for forward foreign currency contracts.
A forward foreign currency contract is an obligation between two parties (“Counterparties”) to purchase or sell a specific currency for an agreed-upon price at a future date. The use of forward foreign currency contracts does not eliminate fluctuations in the price of the underlying securities the Fund owns or intends to acquire but establishes a rate of exchange in advance. Fluctuations in the value of these contracts are measured by the difference in the contract date and reporting date exchange rates and are recorded as unrealized appreciation (depreciation) until the contracts are closed. When the contracts are closed, realized gains (losses) are recorded. Realized and unrealized gains (losses) on the contracts are included in the Statement of Operations. The primary risks associated with forward foreign currency contracts include failure of the Counterparty to meet the terms of the contract and the value of the foreign currency changing unfavorably. These risks may be in excess of the amounts reflected in the Statement of Assets and Liabilities.
| M. | Futures Contracts – The Fund may enter into futures contracts to manage exposure to interest rate, equity and market price movements and/or currency risks. A futures contract is an agreement between Counterparties to purchase or sell a specified underlying security, currency or commodity (or delivery of a cash settlement price, in the case of an index future) for a fixed price at a future date. The Fund currently invests only in exchange-traded futures and they are standardized as to maturity date and underlying financial instrument. Initial margin deposits required upon entering into futures contracts are satisfied by the segregation of specific securities or cash as collateral at the futures commission merchant (broker). During the period the futures contracts are open, changes in the value of the contracts are recognized as unrealized gains or losses by recalculating the value of the contracts on a daily basis. Subsequent or variation margin payments are received or made depending upon whether unrealized gains or losses are incurred. These amounts are reflected as receivables or payables on the Statement of Assets and Liabilities. When the contracts are closed or expire, the Fund recognizes a realized gain or loss equal to the difference between the proceeds from, or cost of, the closing transaction and the Fund’s basis in the contract. The net realized gain (loss) and the change in unrealized gain (loss) on futures contracts held during the period is included on the Statement of Operations. The primary risks associated with futures contracts are market risk and the absence of a liquid secondary market. If the Fund were unable to liquidate a futures contract and/or enter into an offsetting closing transaction, the Fund would continue to be subject to market risk with respect to the value of the contracts and continue to be required to maintain the margin deposits on the futures contracts. Futures contracts have minimal Counterparty risk since the exchange’s clearinghouse, as Counterparty to all exchange-traded futures, guarantees the futures against default. Risks may exceed amounts recognized in the Statement of Assets and Liabilities. |
| N. | Swap Agreements – The Fund may enter into various swap transactions, including interest rate, total return, index, currency and credit default swap contracts (“CDS”) for investment purposes or to manage interest rate, currency or credit risk. Such transactions are agreements between Counterparties. A swap agreement may be negotiated bilaterally and traded over-the-counter (“OTC”) between two parties (“uncleared/ OTC”) or, in some instances, must be transacted through a future commission merchant (“FCM”) and cleared through a clearinghouse that serves as a central Counterparty (“centrally cleared swap”). These agreements may contain among other conditions, events of default and termination events, and various covenants and representations such as provisions that require the Fund to maintain a pre-determined level of net assets, and/ or provide limits regarding the decline of the Fund’s NAV over specific periods of time. If the Fund were to trigger such provisions and have open derivative positions at that time, the Counterparty may be able to terminate such agreement and request immediate payment in an amount equal to the net liability positions, if any. |
Interest rate, total return, index, and currency swap agreements are two-party contracts entered into primarily to exchange the returns (or differentials in rates of returns) earned or realized on particular predetermined investments or instruments. The gross returns to be exchanged or “swapped” between the parties are calculated with respect to a notional amount, i.e., the return on or increase in value of a particular dollar amount invested at a particular interest rate or return of an underlying asset, in a particular foreign currency, or in a “basket” of securities representing a particular index.
In a centrally cleared swap, the Fund’s ultimate Counterparty is a central clearinghouse. The Fund initially will enter into centrally cleared swaps through an executing broker. When a fund enters into a centrally cleared swap, it must deliver to the central Counterparty (via the FCM) an amount referred to as “initial
margin.” Initial margin requirements are determined by the central Counterparty, but an FCM may require additional initial margin above the amount required by the central Counterparty. Initial margin deposits required upon entering into centrally cleared swaps are satisfied by cash or securities as collateral at the FCM. Securities deposited as initial margin are designated on the Schedule of Investments and cash deposited is recorded on the Statement of Assets and Liabilities. During the term of a cleared swap agreement, a “variation margin” amount may be required to be paid by the Fund or may be received by the Fund, based on the daily change in price of the underlying reference instrument subject to the swap agreement and is recorded as a receivable or payable for variation margin in the Statement of Assets and Liabilities until the centrally cleared swap is terminated at which time a realized gain or loss is recorded.
A CDS is an agreement between Counterparties to exchange the credit risk of an issuer. A buyer of a CDS is said to buy protection by paying a fixed payment over the life of the agreement and in some situations an upfront payment to the seller of the CDS. If a defined credit event occurs (such as payment default or bankruptcy), the Fund as a protection buyer would cease paying its fixed payment, the Fund would deliver eligible bonds issued by the reference entity to the seller, and the seller would pay the full notional value, or the “par value”, of the referenced obligation to the Fund. A seller of a CDS is said to sell protection and thus would receive a fixed payment over the life of the agreement and an upfront payment, if applicable. If a credit event occurs, the Fund as a protection seller would cease to receive the fixed payment stream, the Fund would pay the buyer “par value” or the full notional value of the referenced obligation, and the Fund would receive the eligible bonds issued by the reference entity. In turn, these bonds may be sold in order to realize a recovery value. Alternatively, the seller of the CDS and its Counterparty may agree to net the notional amount and the market value of the bonds and make a cash payment equal to the difference to the buyer of protection. If no credit event occurs, the Fund receives the fixed payment over the life of the agreement. As the seller, the Fund would effectively add leverage to its portfolio because, in addition to its total net assets, the Fund would be subject to investment exposure on the notional amount of the CDS. In connection with these agreements, cash and securities may be identified as collateral in accordance with the terms of the respective swap agreements to provide assets of value and recourse in the event of default under the swap agreement or bankruptcy/insolvency of a party to the swap agreement. If a Counterparty becomes bankrupt or otherwise fails to perform its obligations due to financial difficulties, the Fund may experience significant delays in obtaining any recovery in a bankruptcy or other reorganization proceeding. The Fund may obtain only limited recovery or may obtain no recovery in such circumstances. The Fund’s maximum risk of loss from Counterparty risk, either as the protection seller or as the protection buyer, is the value of the contract. The risk may be mitigated by having a master netting arrangement between the Fund and the Counterparty and by the designation of collateral by the Counterparty to cover the Fund’s exposure to the Counterparty.
Implied credit spreads represent the current level at which protection could be bought or sold given the terms of the existing CDS contract and serve as an indicator of the current status of the payment/performance risk of the CDS. An implied spread that has widened or increased since entry into the initial contract may indicate a deteriorating credit profile and increased risk of default for the reference entity. A declining or narrowing spread may indicate an improving credit profile or decreased risk of default for the reference entity. Alternatively, credit spreads may increase or decrease reflecting the general tolerance for risk in the credit markets.
An interest rate swap is an agreement between Counterparties pursuant to which the parties exchange a floating rate payment for a fixed rate payment based on a specified notional amount.
Changes in the value of centrally cleared and OTC swap agreements are recognized as unrealized gains (losses) in the Statement of Operations by “marking to market” on a daily basis to reflect the value of the swap agreement at the end of each trading day. Payments received or paid at the beginning of the agreement are reflected as such on the Statement of Assets and Liabilities and may be referred to as upfront payments. The Fund accrues for the fixed payment stream and amortizes upfront payments, if any, on swap agreements on a daily basis with the net amount, recorded as a component of realized gain (loss) on the Statement of Operations. A liquidation payment received or made at the termination of a swap agreement is recorded as realized gain (loss) on the Statement of Operations. The Fund segregates cash or liquid securities having a value at least equal to the amount of the potential obligation of a Fund under any swap transaction. Cash held as collateral is recorded as deposits with brokers on the Statement of Assets and Liabilities. Entering into these agreements involves, to varying degrees, lack of liquidity and elements of credit, market, and Counterparty risk in excess of amounts recognized on the Statement of Assets and Liabilities. Such risks involve the possibility that a swap is difficult to sell or liquidate; the Counterparty does not honor its obligations under the agreement and unfavorable interest rates and market fluctuations. It is possible that developments in the swaps market, including potential government regulation, could adversely affect the Fund’s ability to terminate existing swap agreements or to realize amounts to be received under such agreements. Additionally, an International Swaps and Derivatives Association Master Agreement (“ISDA Master Agreement”) includes credit related contingent features which allow Counterparties to OTC derivatives to terminate derivative contracts prior to maturity in the event that, for example, the Fund’s net assets decline by a stated percentage or the Fund fails to meet the terms of its ISDA Master Agreement, which would cause the Fund to accelerate payment of any net liability owed to the Counterparty. A short position in a security poses more risk than holding the same security long. As there is no limit on how much the price of the security can increase, the Fund’s exposure is unlimited.
Notional amounts of each individual credit default swap agreement outstanding as of February 28, 2022, if any, for which the Fund is the seller of protection are disclosed in the open swap agreements table. These potential amounts would be partially offset by any recovery values of the respective referenced obligations, upfront payments received upon entering into the agreement, or net amounts received from the settlement of buy protection credit default swap agreements entered into by the Fund for the same referenced entity or entities.
| O. | Dollar Rolls and Forward Commitment Transactions - The Fund may enter into dollar roll transactions to enhance the Fund’s performance. The Fund executes its dollar roll transactions in the to be announced (“TBA”) market whereby the Fund makes a forward commitment to purchase a security and, instead of accepting delivery, the position is offset by the sale of the security with a simultaneous agreement to repurchase at a future date. |
The Fund accounts for dollar roll transactions as purchases and sales and realizes gains and losses on these transactions. These transactions increase the Fund’s portfolio turnover rate. The Fund will segregate liquid assets in an amount equal to its dollar roll commitments.
Dollar roll transactions involve the risk that a Counterparty to the transaction may fail to complete the transaction. If this occurs, the Fund may lose the opportunity to purchase or sell the security at the agreed upon price. Dollar roll transactions also involve the risk that the value of the securities retained by the Fund may decline below the price of the securities that the Fund has sold but is obligated to purchase under the agreement. Dollar roll transactions covered in this manner are not treated as senior securities for purposes of a Fund’s fundamental investment limitation on senior securities and borrowings.
| P. | LIBOR Risk – The Fund may have investments in financial instruments that utilize the London Interbank Offered Rate (“LIBOR”) as the reference or benchmark rate for variable interest rate calculations. LIBOR is intended to measure the rate generally at which banks can lend and borrow from one another in the relevant currency on an unsecured basis. The UK Financial Conduct Authority (FCA), the regulator that oversees LIBOR, announced that the majority of LIBOR rates would cease to be published or would no longer be representative on January 1, 2022. Although the publication of most LIBOR rates ceased at the end of 2021, a selection of widely used USD LIBOR rates continues to be published until June 2023 to allow for an orderly transition away from these rates. |
There remains uncertainty and risks relating to the continuing LIBOR transition and its effects on the Fund and the instruments in which the Fund invests. There can be no assurance that the composition or characteristics of any alternative reference rates (“ARRs”) or financial instruments in which the Fund invests that utilize ARRs will be similar to or produce the same value or economic equivalence as LIBOR or that these instruments will have the same volume or liquidity. Additionally, there remains uncertainty and risks relating to certain “legacy” USD LIBOR instruments that were issued or entered into before December 31, 2021 and the process by which a replacement interest rate will be identified and implemented into these instruments when USD LIBOR is ultimately discontinued. The effects of such uncertainty and risks in “legacy” USD LIBOR instruments held by the Fund could result in losses to the Fund.
| Q. | Collateral – To the extent the Fund has designated or segregated a security as collateral and that security is subsequently sold, it is the Fund’s practice to replace such collateral no later than the next business day. This practice does not apply to securities pledged as collateral for securities lending transactions. |
| R. | Other Risks - The Fund may invest in obligations issued by agencies and instrumentalities of the U.S. Government that may vary in the level of support they |
receive from the government. The government may choose not to provide financial support to government sponsored agencies or instrumentalities if it is not legally obligated to do so. In this case, if the issuer defaulted, the Fund may not be able to recover its investment in such issuer from the U.S. Government. Many securities purchased by the Fund are not guaranteed by the U.S. Government.
The current low interest rate environment was created in part by the Federal Reserve Board (FRB) and certain foreign central banks keeping the federal funds and equivalent foreign rates near historical lows. Increases in the federal funds and equivalent foreign rates may expose fixed income markets to heightened volatility and reduced liquidity for certain fixed income investments, particularly those with longer maturities. In addition, decreases in fixed income dealer market-making capacity may also potentially lead to heightened volatility and reduced liquidity in the fixed income markets. As a result, the value of the Fund’s investments and share price may decline. Changes in central bank policies could also result in higher than normal shareholder redemptions, which could potentially increase portfolio turnover and the Fund’s transaction costs. Additionally, from time to time, uncertainty regarding the status of negotiations in the U.S. Government to increase the statutory debt limit, commonly called the “debt ceiling”, could increase the risk that the U.S. Government may default on payments on certain U.S. Government securities, cause the credit rating of the U.S. Government to be downgraded, increase volatility in the stock and bond markets, result in higher interest rates, reduce prices of U.S. Treasury securities, and/or increase the costs of various kinds of debt. If a U.S. Government-sponsored entity is negatively impacted by legislative or regulatory action, is unable to meet its obligations, or its creditworthiness declines, the performance of a Fund that holds securities of that entity will be adversely impacted.
CLOs are subject to the risks of substantial losses due to actual defaults by underlying borrowers, which will be greater during periods of economic or financial stress. CLOs may also lose value due to collateral defaults and disappearance of subordinate tranches, market anticipation of defaults, and investor aversion to CLO securities as a class. The risks of CLOs will be greater if the Fund invests in CLOs that hold loans of uncreditworthy borrowers or if the Fund holds subordinate tranches of the CLO that absorbs losses from the defaults before senior tranches. In addition, CLOs are subject to interest rate risk and credit risk.
The market values of convertible securities are affected by market interest rates, the risk of actual issuer default on interest or principal payments and the value of the underlying common stock into which the convertible security may be converted. Additionally, a convertible security is subject to the same types of market and issuer risks as apply to the underlying common stock. In addition, certain convertible securities are subject to involuntary conversions and may undergo principal write-downs upon the occurrence of certain triggering events, and, as a result, are subject to an increased risk of loss. Convertible securities may be rated below investment grade.
Emerging markets (also referred to as developing markets) are generally subject to greater market volatility, political, social and economic instability, uncertainty regarding the existence of trading markets and more governmental limitations on foreign investment than more developed markets. In addition, companies operating in emerging markets may be subject to lower trading volume and greater price fluctuations than companies in more developed markets. Securities law in many emerging market countries is relatively new and unsettled. Therefore, laws regarding foreign investment in emerging market securities, securities regulation, title to securities, and shareholder rights may change quickly and unpredictably. In addition, the enforcement of systems of taxation at federal, regional and local levels in emerging market countries may be inconsistent, and subject to sudden change. Other risks of investing in emerging markets securities may include additional transaction costs, delays in settlement procedures, and lack of timely information.
The Fund may invest in lower-quality debt securities, i.e., “junk bonds”. Investments in lower-rated securities or unrated securities of comparable quality tend to be more sensitive to economic conditions than higher rated securities. Junk bonds involve a greater risk of default by the issuer because such securities are generally unsecured and are often subordinated to other creditors’ claims. Junk bonds are less liquid than investment grade debt securities and their prices tend to be more volatile.
Mortgage- and asset-backed securities, including collateralized debt obligations and collateralized mortgage obligations, are subject to prepayment or call risk, which is the risk that a borrower’s payments may be received earlier or later than expected due to changes in prepayment rates on underlying loans. This could result in the Fund reinvesting these early payments at lower interest rates, thereby reducing the Fund’s income. Mortgage- and asset-backed securities also are subject to extension risk, which is the risk that an unexpected rise in interest rates could reduce the rate of prepayments, causing the price of the mortgage- and asset-backed securities and the Fund’s share price to fall. An unexpectedly high rate of defaults on the mortgages held by a mortgage pool may adversely affect the value of mortgage-backed securities and could result in losses to the Fund. Privately-issued mortgage-backed securities and asset-backed securities may be less liquid than other types of securities and the Fund may be unable to sell these securities at the time or price it desires.
The risk of a municipal obligation generally depends on the financial and credit status of the issuer. Constitutional amendments, legislative enactments, executive orders, administrative regulations, voter initiatives, and the issuer’s regional economic conditions may affect the municipal security’s value, interest payments, repayment of principal and the Fund’s ability to sell the security. Failure of a municipal security issuer to comply with applicable tax requirements may make income paid thereon taxable, resulting in a decline in the security’s value. In addition, there could be changes in applicable tax laws or tax treatments that reduce or eliminate the current federal income tax exemption on municipal securities or otherwise adversely affect the current federal or state tax status of municipal securities.
Preferred securities are subject to issuer-specific and market risks applicable generally to equity securities. Preferred securities also may be subordinated to bonds or other debt instruments, subjecting them to a greater risk of non-payment, may be less liquid than many other securities, such as common stocks, and generally offer no voting rights with respect to the issuer.
The Fund’s investments are concentrated in a comparatively narrow segment of the economy. Consequently, the Fund may tend to be more volatile than other mutual funds, and the value of the Fund’s investments may tend to rise and fall more rapidly.
Because the Fund concentrates its assets in the real estate industry, an investment in the Fund will be closely linked to the performance of the real estate markets. Property values may fall due to increasing vacancies or declining rents resulting from economic, legal, cultural or technological developments.
Active trading of portfolio securities may result in added expenses, a lower return and increased tax liability.
| S. | COVID-19 Risk - The COVID-19 strain of coronavirus has resulted in instances of market closures and dislocations, extreme volatility, liquidity constraints and increased trading costs. Efforts to contain its spread have resulted in travel restrictions, disruptions of healthcare systems, business operations (including business closures) and supply chains, layoffs, lower consumer demand and employee availability, and defaults and credit downgrades, among other significant economic impacts that have disrupted global economic activity across many industries. Such economic impacts may exacerbate other pre-existing political, social and economic risks locally or globally and cause general concern and uncertainty. |
The full economic impact and ongoing effects of COVID-19 (or other future epidemics or pandemics) at the macro-level and on individual businesses are unpredictable and may result in significant and prolonged effects on the Fund’s performance.
NOTE 2–Advisory Fees and Other Fees Paid to Affiliates
The Trust has entered into a master investment advisory agreement with the Adviser. Under the terms of the investment advisory agreement, the Fund accrues daily and pays monthly an advisory fee to the Adviser based on the annual rate of the Fund’s average daily net assets as follows:
| | | | |
| Average Daily Net Assets | | Rate | |
|
| |
First $ 200 million | | | 0.500% | |
|
| |
Next $300 million | | | 0.400% | |
|
| |
Next $500 million | | | 0.350% | |
|
| |
Next $19.5 billion | | | 0.300% | |
|
| |
Over $20.5 billion | | | 0.240% | |
|
| |
For the year ended February 28, 2022, the effective advisory fee rate incurred by the Fund was 0.43%.
Under the terms of a master sub-advisory agreement between the Adviser and each of Invesco Asset Management Deutschland GmbH, Invesco Asset Management Limited, Invesco Asset Management (Japan) Limited, Invesco Hong Kong Limited, Invesco Senior Secured Management, Inc. and Invesco Canada Ltd. (collectively, the “Affiliated Sub-Advisers”) the Adviser, not the Fund, will pay 40% of the fees paid to the Adviser to any such Affiliated Sub-Adviser(s) that provide(s) discretionary investment management services to the Fund based on the percentage of assets allocated to such Affiliated Sub-Adviser(s).
The Adviser has contractually agreed, through at least June 30, 2022, to waive advisory fees and/or reimburse expenses of all shares to the extent necessary to limit total annual fund operating expenses after fee waiver and/or expense reimbursement (excluding certain items discussed below) of Class A, Class C, Class R, Class Y, Investor Class, Class R5 and Class R6 shares to 1.50%, 2.25%, 1.75%, 1.25%, 1.50%, 1.25% and 1.25%, respectively, of the Fund’s average daily net assets (the “expense limits”). In determining the Adviser’s obligation to waive advisory fees and/or reimburse expenses, the following expenses are not taken into account, and could cause the total annual fund operating expenses after fee waiver and/or reimbursement to exceed the numbers reflected above: (1) interest; (2) taxes; (3) dividend expense on short sales; (4) extraordinary or non-routine items, including litigation expenses; and (5) expenses that the Fund has incurred but did not actually pay because of an expense offset arrangement. Unless Invesco continues the fee waiver agreement, it will terminate on June 30, 2022. During its term, the fee waiver agreement cannot be terminated or amended to increase the expense limits or reduce the advisory fee waivers without approval of the Board of Trustees. The Adviser did not waive fees and/or reimburse expenses during the period under these expense limits.
Further, the Adviser has contractually agreed, through at least June 30, 2023, to waive the advisory fee payable by the Fund in an amount equal to 100% of the net advisory fees the Adviser receives from the affiliated money market funds on investments by the Fund of uninvested cash (excluding investments of cash collateral from securities lending) in such affiliated money market funds.
For the year ended February 28, 2022, the Adviser waived advisory fees of $418.
The Trust has entered into a master administrative services agreement with Invesco pursuant to which the Fund has agreed to pay Invesco for certain administrative costs incurred in providing accounting services to the Fund. For the year ended February 28, 2022, expenses incurred under the agreement are shown in the Statement of Operations as Administrative services fees. Invesco has entered into a sub-administration agreement whereby State Street Bank and Trust Company (“SSB”) serves as fund accountant and provides certain administrative services to the Fund. Pursuant to a custody agreement with the Trust on behalf of the Fund, SSB also serves as the Fund’s custodian.
The Trust has entered into a transfer agency and service agreement with Invesco Investment Services, Inc. (“IIS”) pursuant to which the Fund has agreed to pay IIS a fee for providing transfer agency and shareholder services to the Fund and reimburse IIS for certain expenses incurred by IIS in the course of providing such services. IIS may make payments to intermediaries that provide omnibus account services, sub-accounting services and/or networking services. All fees payable by IIS to intermediaries that provide omnibus account services or sub-accounting services are charged back to the Fund, subject to certain limitations approved by the Trust’s Board of Trustees. For the year ended February 28, 2022, expenses incurred under the agreement are shown in the Statement of Operations as Transfer agent fees.
The Trust has entered into master distribution agreements with Invesco Distributors, Inc. (“IDI”) to serve as the distributor for the Class A, Class C, Class R, Class Y, Investor Class, Class R5 and Class R6 shares of the Fund. The Trust has adopted plans pursuant to Rule 12b-1 under the 1940 Act with respect to the Fund’s Class A, Class C, Class R and Investor Class shares (collectively, the “Plans”). The Fund, pursuant to the Plans, pays IDI compensation at the annual rate of 0.25% of the Fund’s average daily net assets of Class A shares, 1.00% of the average daily net assets of Class C shares and 0.50% of the average daily net assets of Class R shares. The Fund, pursuant to the Investor Class Plan, reimburses IDI for its allocated share of expenses incurred pursuant to the Investor Class Plan for the period, up to a maximum annual rate of 0.25% of the average daily net assets of Investor Class shares. The fees are accrued daily and paid monthly. Of the Plan payments, up to 0.25% of the average daily net assets of each class of shares may be paid to furnish continuing personal shareholder services to customers who purchase and own shares of such classes. Any amounts not paid as a service fee under the Plans would constitute an asset-based sales charge. Rules of the Financial Industry Regulatory Authority (“FINRA”) impose a cap on the total sales charges, including asset-based sales charges, that may be paid by any class of shares of the Fund. For the year ended February 28, 2022, expenses incurred under the Plans are shown in the Statement of Operations as Distribution fees.
Front-end sales commissions and CDSC (collectively, the “sales charges”) are not recorded as expenses of the Fund. Front-end sales commissions are deducted from proceeds from the sales of Fund shares prior to investment in Class A shares of the Fund. CDSC are deducted from redemption proceeds prior to remittance to the shareholder. During the year ended February 28, 2022, IDI advised the Fund that IDI retained $15,084 in front-end sales commissions from the sale of Class A shares and $216 and $1,066 from Class A and Class C shares, respectively, for CDSC imposed upon redemptions by shareholders.
Certain officers and trustees of the Trust are officers and directors of the Adviser, IIS and/or IDI.
NOTE 3–Additional Valuation Information
GAAP defines fair value as the price that would be received to sell an asset or paid to transfer a liability in an orderly transaction between market participants at the measurement date, under current market conditions. GAAP establishes a hierarchy that prioritizes the inputs to valuation methods, giving the highest priority to readily available unadjusted quoted prices in an active market for identical assets (Level 1) and the lowest priority to significant unobservable inputs (Level 3), generally when market prices are not readily available or are unreliable. Based on the valuation inputs, the securities or other investments are tiered into one of three levels. Changes in valuation methods may result in transfers in or out of an investment’s assigned level:
| | |
| Level 1 - | | Prices are determined using quoted prices in an active market for identical assets. |
| Level 2 - | | Prices are determined using other significant observable inputs. Observable inputs are inputs that other market participants may use in pricing a security. These may include quoted prices for similar securities, interest rates, prepayment speeds, credit risk, yield curves, loss severities, default rates, discount rates, volatilities and others. |
| Level 3 - | | Prices are determined using significant unobservable inputs. In situations where quoted prices or observable inputs are unavailable (for example, when there is little or no market activity for an investment at the end of the period), unobservable inputs may be used. Unobservable inputs reflect the Fund’s own assumptions about the factors market participants would use in determining fair value of the securities or instruments and would be based on the best available information. |
The following is a summary of the tiered valuation input levels, as of February 28, 2022. The level assigned to the securities valuations may not be an indication of the risk or liquidity associated with investing in those securities. Because of the inherent uncertainties of valuation, the values reflected in the financial statements may materially differ from the value received upon actual sale of those investments.
| | | | | | | | | | | | | | | | |
| | | Level 1 | | | Level 2 | | | Level 3 | | | Total | |
|
| |
Investments in Securities | | | | | | | | | | | | | | | | |
|
| |
Asset-Backed Securities | | $ | – | | | $ | 392,122,221 | | | | $– | | | $ | 392,122,221 | |
|
| |
Agency Credit Risk Transfer Notes | | | – | | | | 43,221,479 | | | | – | | | | 43,221,479 | |
|
| |
Preferred Stocks | | | 26,357,000 | | | | – | | | | – | | | | 26,357,000 | |
|
| |
U.S. Government Sponsored Agency Mortgage-Backed Securities | | | – | | | | 8,081,896 | | | | – | | | | 8,081,896 | |
|
| |
U.S. Treasury Securities | | | – | | | | 1,601,823 | | | | – | | | | 1,601,823 | |
|
| |
Money Market Funds | | | 29,759,560 | | | | – | | | | – | | | | 29,759,560 | |
|
| |
Total Investments in Securities | | | 56,116,560 | | | | 445,027,419 | | | | – | | | | 501,143,979 | |
|
| |
| | | | |
Other Investments - Liabilities* | | | | | | | | | | | | | | | | |
|
| |
Futures Contracts | | | (598,483 | ) | | | – | | | | – | | | | (598,483 | ) |
|
| |
Swap Agreements | | | – | | | | (184,535 | ) | | | – | | | | (184,535 | ) |
|
| |
Total Other Investments | | | (598,483 | ) | | | (184,535 | ) | | | – | | | | (783,018 | ) |
|
| |
Total Investments | | $ | 55,518,077 | | | $ | 444,842,884 | | | | $– | | | $ | 500,360,961 | |
|
| |
| * | Unrealized appreciation (depreciation). |
NOTE 4–Derivative Investments
The Fund may enter into an ISDA Master Agreement under which a fund may trade OTC derivatives. An OTC transaction entered into under an ISDA Master Agreement typically involves a collateral posting arrangement, payment netting provisions and close-out netting provisions. These netting provisions allow for reduction of credit risk through netting of contractual obligations. The enforceability of the netting provisions of the ISDA Master Agreement depends on the governing law of the ISDA Master Agreement, among other factors.
For financial reporting purposes, the Fund does not offset OTC derivative assets or liabilities that are subject to ISDA Master Agreements in the Statement of Assets and Liabilities.
Value of Derivative Investments at Period-End
The table below summarizes the value of the Fund’s derivative investments, detailed by primary risk exposure, held as of February 28, 2022:
| | | | | | | | | | | | |
| | | Value | |
| Derivative Liabilities | | Credit Risk | | | Interest
Rate Risk | | | Total | |
|
| |
Unrealized depreciation on futures contracts – Exchange-Traded(a) | | $ | - | | | $ | (598,483 | ) | | $ | (598,483 | ) |
|
| |
Unrealized depreciation on swap agreements – OTC | | | (184,535 | ) | | | - | | | | (184,535 | ) |
|
| |
Total Derivative Liabilities | | | (184,535 | ) | | | (598,483 | ) | | | (783,018 | ) |
|
| |
Derivatives not subject to master netting agreements | | | - | | | | 598,483 | | | | 598,483 | |
|
| |
Total Derivative Liabilities subject to master netting agreements | | $ | (184,535 | ) | | $ | - | | | $ | (184,535 | ) |
|
| |
| (a) | The daily variation margin receivable (payable) at period-end is recorded in the Statement of Assets and Liabilities. |
Offsetting Assets and Liabilities
The table below reflects the Fund’s exposure to Counterparties subject to either an ISDA Master Agreement or other agreement for OTC derivative transactions as of February 28, 2022.
| | | | | | | | | | | | | | | | | | |
| | | Financial Derivative Assets | | Financial
Derivative
Liabilities | | | | | | Collateral
(Received)/Pledged | | | |
| Counterparty | | Swap Agreements | | Swap
Agreements | | | Net Value of
Derivatives | | | Non-Cash | | Cash | | Net
Amount | |
|
| |
Merrill Lynch International | | $69,778 | | | $(184,535) | | | | $(114,757) | | | $– | | $– | | | $(114,757) | |
|
| |
Effect of Derivative Investments for the year ended February 28, 2022
The table below summarizes the gains (losses) on derivative investments, detailed by primary risk exposure, recognized in earnings during the period:
| | | | | | | | | | | | |
| | | Location of Gain (Loss) on
Statement of Operations | |
| | | Credit
Risk | | | Interest
Rate Risk | | | Total | |
|
| |
Realized Gain: | | | | | | | | | | | | |
Futures contracts | | $ | - | | | $ | 5,596,839 | | | $ | 5,596,839 | |
|
| |
Swap agreements | | | 33,505 | | | | - | | | | 33,505 | |
|
| |
| | | | | | | | | | | | |
| | | Location of Gain (Loss) on
Statement of Operations | |
| | | Credit
Risk | | | Interest
Rate Risk | | | Total | |
|
| |
Change in Net Unrealized Appreciation (Depreciation): | | | | | | | | | | | | |
Futures contracts | | $ | - | | | $ | (2,511,673 | ) | | $ | (2,511,673 | ) |
|
| |
Swap agreements | | | 172,644 | | | | - | | | | 172,644 | |
|
| |
Total | | $ | 206,149 | | | $ | 3,085,166 | | | $ | 3,291,315 | |
|
| |
The table below summarizes the average notional value of derivatives held during the period.
| | | | | | | | |
| | | Futures
Contracts | | | Swap
Agreements | |
|
| |
Average notional value | | $ | 118,479,193 | | | $ | 15,833,333 | |
|
| |
NOTE 5–Expense Offset Arrangement(s)
The expense offset arrangement is comprised of transfer agency credits which result from balances in demand deposit accounts used by the transfer agent for clearing shareholder transactions. For the year ended February 28, 2022, the Fund received credits from this arrangement, which resulted in the reduction of the Fund’s total expenses of $849.
NOTE 6–Trustees’ and Officers’ Fees and Benefits
Trustees’ and Officers’ Fees and Benefits include amounts accrued by the Fund to pay remuneration to certain Trustees and Officers of the Fund. Trustees have the option to defer compensation payable by the Fund, and Trustees’ and Officers’ Fees and Benefits also include amounts accrued by the Fund to fund such deferred compensation amounts. Those Trustees who defer compensation have the option to select various Invesco Funds in which their deferral accounts shall be deemed to be invested. Finally, certain current Trustees were eligible to participate in a retirement plan that provided for benefits to be paid upon retirement to Trustees over a period of time based on the number of years of service. The Fund may have certain former Trustees who also participate in a retirement plan and receive benefits under such plan. Trustees’ and Officers’ Fees and Benefits include amounts accrued by the Fund to fund such retirement benefits. Obligations under the deferred compensation and retirement plans represent unsecured claims against the general assets of the Fund.
NOTE 7–Cash Balances
The Fund may borrow for leveraging in an amount up to 5% of the Fund’s total assets (excluding the amount borrowed) at the time the borrowing is made. In doing so, the Fund is permitted to temporarily carry a negative or overdrawn balance in its account with SSB, the custodian bank. Such balances, if any at period end, are shown in the Statement of Assets and Liabilities under the payable caption Amount due custodian. To compensate the custodian bank for such overdrafts, the overdrawn Fund may either (1) leave funds as a compensating balance in the account so the custodian bank can be compensated by earning the additional interest; or (2) compensate by paying the custodian bank at a rate agreed upon by the custodian bank and Invesco, not to exceed the contractually agreed upon rate. The Fund may not purchase additional securities when any borrowings from banks or broker-dealers exceed 5% of the Fund’s total assets, or when any borrowings from an Invesco Fund are outstanding.
NOTE 8–Distributions to Shareholders and Tax Components of Net Assets
Tax Character of Distributions to Shareholders Paid During the Fiscal Years Ended February 28, 2022 and 2021:
| | | | | | | | | | | | |
| | | 2022 | | | | | | 2021 | |
|
| |
Ordinary income* | | $ | 17,043,037 | | | | | | | $ | 20,991,911 | |
|
| |
Return of capital | | | – | | | | | | | | 376,469 | |
|
| |
Total distributions | | $ | 17,043,037 | | | | | | | $ | 21,368,380 | |
|
| |
| * | Includes short-term capital gain distributions, if any. |
Tax Components of Net Assets at Period-End:
| | | | |
| | | 2022 | |
|
| |
Undistributed ordinary income | | $ | 300,583 | |
|
| |
Net unrealized appreciation (depreciation) – investments | | | (11,694,471 | ) |
|
| |
Net unrealized appreciation (depreciation) – foreign currencies | | | (52 | ) |
|
| |
Temporary book/tax differences | | | (127,313 | ) |
|
| |
Capital loss carryforward | | | (49,798,395 | ) |
|
| |
Shares of beneficial interest | | | 562,645,235 | |
|
| |
Total net assets | | $ | 501,325,587 | |
|
| |
The difference between book-basis and tax-basis unrealized appreciation (depreciation) is due to differences in the timing of recognition of gains and losses on investments for tax and book purposes. The Fund’s net unrealized appreciation (depreciation) difference is attributable primarily to lower-rated debt securities and derivative instruments.
The temporary book/tax differences are a result of timing differences between book and tax recognition of income and/or expenses. The Fund’s temporary book/tax differences are the result of the trustee deferral of compensation and retirement plan benefits.
Capital loss carryforward is calculated and reported as of a specific date. Results of transactions and other activity after that date may affect the amount of capital loss carryforward actually available for the Fund to utilize. The ability to utilize capital loss carryforward in the future may be limited under the Internal Revenue Code and related regulations based on the results of future transactions.
The Fund has a capital loss carryforward as of February 28, 2022, as follows:
| | | | | | | | | | | | |
| Capital Loss Carryforward* | |
|
| |
| Expiration | | Short-Term | | | Long-Term | | | Total | |
|
| |
Not subject to expiration | | $ | 19,230,342 | | | $ | 30,568,053 | | | $ | 49,798,395 | |
|
| |
| * | Capital loss carryforward is reduced for limitations, if any, to the extent required by the Internal Revenue Code and may be further limited depending upon a variety of factors, including the realization of net unrealized gains or losses as of the date of any reorganization. |
NOTE 9–Investment Transactions
The aggregate amount of investment securities (other than short-term securities, U.S. Government obligations and money market funds, if any) purchased and sold by the Fund during the year ended February 28, 2022 was $148,812,200 and $247,546,120, respectively. Cost of investments, including any derivatives, on a tax basis includes the adjustments for financial reporting purposes as of the most recently completed federal income tax reporting period-end.
| | | | |
Unrealized Appreciation (Depreciation) of Investments on a Tax Basis | |
Aggregate unrealized appreciation of investments | | $ | 3,601,155 | |
|
| |
Aggregate unrealized (depreciation) of investments | | | (15,295,626 | ) |
|
| |
Net unrealized appreciation (depreciation) of investments | | $ | (11,694,471 | ) |
|
| |
Cost of investments for tax purposes is $512,055,432.
NOTE 10–Reclassification of Permanent Differences
Primarily as a result of differing book/tax treatment of dollar rolls, on February 28, 2022, undistributed net investment income was increased by $2,452,223 and undistributed net realized gain (loss) was decreased by $2,452,223. This reclassification had no effect on the net assets or the distributable earnings (loss) of the Fund.
NOTE 11–Share Information
| | | | | | | | | | | | | | | | |
| | | Summary of Share Activity | |
|
| |
| | |
| | | Year ended | | | Year ended | |
| | | February 28, 2022(a) | | | February 28, 2021 | |
| | | Shares | | | Amount | | | Shares | | | Amount | |
|
| |
Sold: | | | | | | | | | | | | | | | | |
Class A | | | 2,000,705 | | | $ | 15,883,291 | | | | 2,226,448 | | | $ | 16,564,185 | |
|
| |
Class C | | | 460,079 | | | | 3,662,748 | | | | 320,565 | | | | 2,429,814 | |
|
| |
Class R | | | 131,792 | | | | 1,047,079 | | | | 174,836 | | | | 1,301,117 | |
|
| |
Class Y | | | 896,090 | | | | 7,142,843 | | | | 5,982,713 | | | | 45,144,577 | |
|
| |
Investor Class | | | 159,687 | | | | 1,271,948 | | | | 259,252 | | | | 1,966,461 | |
|
| |
Class R5 | | | 11,542 | | | | 91,956 | | | | 18,795 | | | | 137,686 | |
|
| |
Class R6 | | | 1,360,830 | | | | 10,809,981 | | | | 29,040,117 | | | | 210,551,966 | |
|
| |
| | | | |
Issued as reinvestment of dividends: | | | | | | | | | | | | | | | | |
Class A | | | 1,026,350 | | | | 8,139,244 | | | | 1,607,668 | | | | 11,729,640 | |
|
| |
Class C | | | 15,638 | | | | 124,019 | | | | 27,388 | | | | 198,770 | |
|
| |
Class R | | | 13,892 | | | | 110,198 | | | | 17,923 | | | | 130,650 | |
|
| |
Class Y | | | 93,717 | | | | 745,863 | | | | 79,902 | | | | 600,249 | |
|
| |
Investor Class | | | 65,950 | | | | 523,837 | | | | 108,678 | | | | 793,219 | |
|
| |
Class R5 | | | 1,676 | | | | 13,301 | | | | 2,466 | | | | 17,939 | |
|
| |
Class R6 | | | 737,062 | | | | 5,839,296 | | | | 725,842 | | | | 5,553,111 | |
|
| |
| | | | |
Automatic conversion of Class C shares to Class A shares: | | | | | | | | | | | | | | | | |
Class A | | | 91,478 | | | | 725,785 | | | | 234,191 | | | | 1,778,837 | |
|
| |
Class C | | | (91,436 | ) | | | (725,785 | ) | | | (234,132 | ) | | | (1,778,837 | ) |
|
| |
| | | | | | | | | | | | | | | | |
| | | Summary of Share Activity | |
|
| |
| | |
| | | Year ended | | | Year ended | |
| | | February 28, 2022(a) | | | February 28, 2021 | |
| | | Shares | | | Amount | | | Shares | | | Amount | |
|
| |
| | | | |
Reacquired: | | | | | | | | | | | | | | | | |
Class A | | | (6,175,388 | ) | | $ | (49,012,470 | ) | | | (8,378,628 | ) | | $ | (61,434,584 | ) |
|
| |
Class C | | | (221,508 | ) | | | (1,756,422 | ) | | | (523,859 | ) | | | (3,783,559 | ) |
|
| |
Class R | | | (103,913 | ) | | | (821,924 | ) | | | (221,744 | ) | | | (1,591,654 | ) |
|
| |
Class Y | | | (6,232,419 | ) | | | (49,179,312 | ) | | | (1,040,220 | ) | | | (7,709,768 | ) |
|
| |
Investor Class | | | (406,988 | ) | | | (3,238,752 | ) | | | (761,076 | ) | | | (5,686,177 | ) |
|
| |
Class R5 | | | (9,620 | ) | | | (76,300 | ) | | | (30,899 | ) | | | (229,782 | ) |
|
| |
Class R6 | | | (9,709,952 | ) | | | (77,071,671 | ) | | | (1,121,320 | ) | | | (8,526,619 | ) |
|
| |
Net increase (decrease) in share activity | | | (15,884,736 | ) | | $ | (125,751,247 | ) | | | 28,514,906 | | | $ | 208,157,241 | |
|
| |
| (a) | There are entities that are record owners of more than 5% of the outstanding shares of the Fund and in the aggregate own 9% of the outstanding shares of the Fund. IDI has an agreement with these entities to sell Fund shares. The Fund, Invesco and/or Invesco affiliates may make payments to these entities, which are considered to be related to the Fund, for providing services to the Fund, Invesco and/or Invesco affiliates including but not limited to services such as securities brokerage, distribution, third party record keeping and account servicing. The Fund has no knowledge as to whether all or any portion of the shares owned of record by these entities are also owned beneficially. |
In addition, 30% of the outstanding shares of the Fund are owned by the Adviser or an affiliate of the Adviser.
Report of Independent Registered Public Accounting Firm
To the Board of Trustees of AIM Investment Securities Funds (Invesco Investment Securities Funds) and Shareholders of Invesco Income Fund
Opinion on the Financial Statements
We have audited the accompanying statement of assets and liabilities, including the schedule of investments, of Invesco Income Fund (one of the funds constituting AIM Investment Securities Funds (Invesco Investment Securities Funds), referred to hereafter as the “Fund”) as of February 28, 2022, the related statement of operations for the year ended February 28, 2022, the statement of changes in net assets for each of the two years in the period ended February 28, 2022, including the related notes, and the financial highlights for each of the periods indicated therein (collectively referred to as the “financial statements”). In our opinion, the financial statements present fairly, in all material respects, the financial position of the Fund as of February 28, 2022, the results of its operations for the year then ended, the changes in its net assets for each of the two years in the period ended February 28, 2022 and the financial highlights for each of the periods indicated therein in conformity with accounting principles generally accepted in the United States of America.
Basis for Opinion
These financial statements are the responsibility of the Fund’s management. Our responsibility is to express an opinion on the Fund’s financial statements based on our audits. We are a public accounting firm registered with the Public Company Accounting Oversight Board (United States) (PCAOB) and are required to be independent with respect to the Fund in accordance with the U.S. federal securities laws and the applicable rules and regulations of the Securities and Exchange Commission and the PCAOB.
We conducted our audits of these financial statements in accordance with the standards of the PCAOB. Those standards require that we plan and perform the audit to obtain reasonable assurance about whether the financial statements are free of material misstatement, whether due to error or fraud.
Our audits included performing procedures to assess the risks of material misstatement of the financial statements, whether due to error or fraud, and performing procedures that respond to those risks. Such procedures included examining, on a test basis, evidence regarding the amounts and disclosures in the financial statements. Our audits also included evaluating the accounting principles used and significant estimates made by management, as well as evaluating the overall presentation of the financial statements. Our procedures included confirmation of securities owned as of February 28, 2022 by correspondence with the custodian, transfer agent and brokers; when replies were not received from brokers, we performed other auditing procedures. We believe that our audits provide a reasonable basis for our opinion.
/s/PricewaterhouseCoopers LLP
Houston, Texas
April 28, 2022
We have served as the auditor of one or more of the investment companies in the Invesco group of investment companies since at least 1995. We have not been able to determine the specific year we began serving as auditor.
Calculating your ongoing Fund expenses
Example
As a shareholder of the Fund, you incur two types of costs: (1) transaction costs, which may include sales charges (loads) on purchase payments or contingent deferred sales charges on redemptions, if any; and (2) ongoing costs, including management fees, distribution and/or service (12b-1) fees, and other Fund expenses. This example is intended to help you understand your ongoing costs (in dollars) of investing in the Fund and to compare these costs with ongoing costs of investing in other mutual funds. The example is based on an investment of $1,000 invested at the beginning of the period and held for the entire period September 1, 2021 through February 28, 2022.
Actual expenses
The table below provides information about actual account values and actual expenses. You may use the information in this table, together with the amount you invested, to estimate the expenses that you paid over the period. Simply divide your account value by $1,000 (for example, an $8,600 account value divided by $1,000 = 8.6), then multiply the result by the number in the table under the heading entitled “Actual Expenses Paid During Period” to estimate the expenses you paid on your account during this period.
Hypothetical example for comparison purposes
The table below also provides information about hypothetical account values and hypothetical expenses based on the Fund’s actual expense ratio and an assumed rate of return of 5% per year before expenses, which is not the Fund’s actual return.
The hypothetical account values and expenses may not be used to estimate the actual ending account balance or expenses you paid for the period. You may use this information to compare the ongoing costs of investing in the Fund and other funds. To do so, compare this 5% hypothetical example with the 5% hypothetical examples that appear in the shareholder reports of the other funds.
Please note that the expenses shown in the table are meant to highlight your ongoing costs only and do not reflect any transaction costs, such as sales charges (loads) on purchase payments or contingent deferred sales charges on redemptions, if any. Therefore, the hypothetical information is useful in comparing ongoing costs only, and will not help you determine the relative total costs of owning different funds. In addition, if these transaction costs were included, your costs would have been higher.
| | | | | | | | | | | | |
| | | | | ACTUAL | | HYPOTHETICAL (5% annual return before
expenses) | | |
| | | Beginning
Account Value
(09/01/21) | | Ending
Account Value
(02/28/22)1 | | Expenses
Paid During
Period2 | | Ending
Account Value
(02/28/22) | | Expenses
Paid During
Period2 | | Annualized
Expense Ratio |
Class A | | $1,000.00 | | $978.80 | | $4.42 | | $1,020.33 | | $4.51 | | 0.90% |
Class C | | 1,000.00 | | 975.10 | | 8.08 | | 1,016.61 | | 8.25 | | 1.65 |
Class R | | 1,000.00 | | 977.50 | | 5.64 | | 1,019.09 | | 5.76 | | 1.15 |
Class Y | | 1,000.00 | | 980.10 | | 3.19 | | 1,021.57 | | 3.26 | | 0.65 |
Investor Class | | 1,000.00 | | 979.20 | | 4.02 | | 1,020.73 | | 4.11 | | 0.82 |
Class R5 | | 1,000.00 | | 980.40 | | 2.85 | | 1,021.92 | | 2.91 | | 0.58 |
Class R6 | | 1,000.00 | | 980.70 | | 2.41 | | 1,022.36 | | 2.46 | | 0.49 |
| 1 | The actual ending account value is based on the actual total return of the Fund for the period September 1, 2021 through February 28, 2022, after actual expenses and will differ from the hypothetical ending account value which is based on the Fund’s expense ratio and a hypothetical annual return of 5% before expenses. |
| 2 | Expenses are equal to the Fund’s annualized expense ratio as indicated above multiplied by the average account value over the period, multiplied by 181/365 to reflect the most recent fiscal half year. |
Tax Information
Form 1099-DIV, Form 1042-S and other year–end tax information provide shareholders with actual calendar year amounts that should be included in their tax returns. Shareholders should consult their tax advisers.
The following distribution information is being provided as required by the Internal Revenue Code or to meet a specific state’s requirement.
The Fund designates the following amounts or, if subsequently determined to be different, the maximum amount allowable for its fiscal year ended February 28, 2022:
| | | | | | | | |
Federal and State Income Tax | | | | | | |
Qualified Dividend Income* | | | 0.00 | % | | | | |
Corporate Dividends Received Deduction* | | | 0.00 | % | | | | |
U.S. Treasury Obligations* | | | 0.03 | % | | | | |
Qualified Business Income* | | | 8.92 | % | | | | |
Business Interest Income* | | | 80.38 | % | | | | |
Tax-Exempt Interest Dividends* | | | 0.00 | % | | | | |
|
| * The above percentages are based on ordinary income dividends paid to shareholders during the Fund’s fiscal year. | |
Trustees and Officers
The address of each trustee and officer is AIM Investment Securities Funds (Invesco Investment Securities Funds) (the “Trust”), 11 Greenway Plaza, Suite 1000, Houston, Texas 77046-1173. The trustees serve for the life of the Trust, subject to their earlier death, incapacitation, resignation, retirement or removal as more specifically provided in the Trust’s organizational documents. Each officer serves for a one year term or until their successors are elected and qualified. Column two below includes length of time served with predecessor entities, if any.
| | | | | | | | |
Name, Year of Birth and
Position(s) Held with the Trust | | Trustee and/or Officer Since | | Principal Occupation(s) During Past 5 Years | | Number of
Funds in Fund Complex Overseen by Trustee | | Other Directorship(s) Held by Trustee During Past 5 Years |
| Interested Trustee | | | | | | | | |
| Martin L. Flanagan1 – 1960 Trustee and Vice Chair | | 2007 | | Executive Director, Chief Executive Officer and President, Invesco Ltd. (ultimate parent of Invesco and a global investment management firm); Trustee and Vice Chair, The Invesco Funds; Vice Chair, Investment Company Institute; and Member of Executive Board, SMU Cox School of Business Formerly: Advisor to the Board, Invesco Advisers, Inc. (formerly known as Invesco Institutional (N.A.), Inc.); Chairman and Chief Executive Officer, Invesco Advisers, Inc. (registered investment adviser); Director, Chairman, Chief Executive Officer and President, Invesco Holding Company (US), Inc. (formerly IVZ Inc.) (holding company), Invesco Group Services, Inc. (service provider) and Invesco North American Holdings, Inc. (holding company); Director, Chief Executive Officer and President, Invesco Holding Company Limited (parent of Invesco and a global investment management firm); Director, Invesco Ltd.; Chairman, Investment Company Institute and President, Co-Chief Executive Officer, Co-President, Chief Operating Officer and Chief Financial Officer, Franklin Resources, Inc. (global investment management organization) | | 188 | | None |
| 1 | Mr. Flanagan is considered an interested person (within the meaning of Section 2(a)(19) of the 1940 Act) of the Trust because he is an officer of the Adviser to the Trust, and an officer and a director of Invesco Ltd., ultimate parent of the Adviser. |
Trustees and Officers–(continued)
| | | | | | | | |
Name, Year of Birth and Position(s) Held with the Trust | | Trustee and/or Officer Since | | Principal Occupation(s) During Past 5 Years | | Number of Funds in Fund Complex Overseen by Trustee | | Other Directorship(s) Held by Trustee During Past 5 Years |
| Independent Trustees | | | | | | | | |
Christopher L. Wilson – 1957 Trustee and Chair | | 2017 | | Retired Formerly: Director, TD Asset Management USA Inc. (mutual fund complex) (22 portfolios); Managing Partner, CT2, LLC (investing and consulting firm); President/Chief Executive Officer, Columbia Funds, Bank of America Corporation; President/Chief Executive Officer, CDC IXIS Asset Management Services, Inc.; Principal & Director of Operations, Scudder Funds, Scudder, Stevens & Clark, Inc.; Assistant Vice President, Fidelity Investments | | 188 | | Formerly: enaible, Inc. (artificial intelligence technology) Director, ISO New England, Inc. (non-profit organization managing regional electricity market) |
Beth Ann Brown – 1968 Trustee | | 2019 | | Independent Consultant Formerly: Head of Intermediary Distribution, Managing Director, Strategic Relations, Managing Director, Head of National Accounts, Senior Vice President, National Account Manager and Senior Vice President, Key Account Manager, Columbia Management Investment Advisers LLC; Vice President, Key Account Manager, Liberty Funds Distributor, Inc.; and Trustee of certain Oppenheimer Funds | | 188 | | Director, Board of Directors of Caron Engineering Inc.; Advisor, Board of Advisors of Caron Engineering Inc.; President and Director, Acton Shapleigh Youth Conservation Corps (non-profit) Formerly: President and Director of Grahamtastic Connection (non-profit) |
Cynthia Hostetler –1962 Trustee | | 2017 | | Non-Executive Director and Trustee of a number of public and private business corporations Formerly: Director, Aberdeen Investment Funds (4 portfolios); Director, Artio Global Investment LLC (mutual fund complex); Director, Edgen Group, Inc. (specialized energy and infrastructure products distributor); Director, Genesee & Wyoming, Inc. (railroads); Head of Investment Funds and Private Equity, Overseas Private Investment Corporation; President, First Manhattan Bancorporation, Inc.; Attorney, Simpson Thacher & Bartlett LLP | | 188 | | Resideo Technologies, Inc. (smart home technology); Vulcan Materials Company (construction materials company); Trilinc Global Impact Fund; Textainer Group Holdings, (shipping container leasing company); Investment Company Institute (professional organization); Independent Directors Council (professional organization) |
Eli Jones – 1961 Trustee | | 2016 | | Professor and Dean Emeritus, Mays Business School – Texas A&M University Formerly: Dean of Mays Business School-Texas A&M University; Professor and Dean, Walton College of Business, University of Arkansas and E.J. Ourso College of Business, Louisiana State University; Director, Arvest Bank | | 188 | | Insperity, Inc. (formerly known as Administaff) (human resources provider); Member of Regional Board of Directors and Board of Directors, First Financial Bancorp (regional bank) |
Elizabeth Krentzman – 1959 Trustee | | 2019 | | Formerly: Principal and Chief Regulatory Advisor for Asset Management Services and U.S. Mutual Fund Leader of Deloitte & Touche LLP; General Counsel of the Investment Company Institute (trade association); National Director of the Investment Management Regulatory Consulting Practice, Principal, Director and Senior Manager of Deloitte & Touche LLP; Assistant Director of the Division of Investment Management – Office of Disclosure and Investment Adviser Regulation of the U.S. Securities and Exchange Commission and various positions with the Division of Investment Management – Office of Regulatory Policy of the U.S. Securities and Exchange Commission; Associate at Ropes & Gray LLP; and Trustee of certain Oppenheimer Funds | | 188 | | Trustee of the University of Florida National Board Foundation; Member of the Cartica Funds Board of Directors (private investment funds) Formerly: Member of the University of Florida Law Center Association, Inc. Board of Trustees, Audit Committee and Membership Committee |
| Anthony J. LaCava, Jr. – 1956 Trustee | | 2019 | | Formerly: Director and Member of the Audit Committee, Blue Hills Bank (publicly traded financial institution) and Managing Partner, KPMG LLP | | 188 | | Blue Hills Bank; Chairman, Bentley University; Member, Business School Advisory Council; and Nominating Committee, KPMG LLP |
| Prema Mathai-Davis – 1950 Trustee | | 1998 | | Retired Formerly: Co-Founder & Partner of Quantalytics Research, LLC, (a FinTech Investment Research Platform for the Self-Directed Investor); Trustee of YWCA Retirement Fund; CEO of YWCA of the USA; Board member of the NY Metropolitan Transportation Authority; Commissioner of the NYC Department of Aging; Board member of Johns Hopkins Bioethics Institute | | 188 | | Member of Board of Positive Planet US (non-profit) and HealthCare Chaplaincy Network (non-profit) |
Trustees and Officers–(continued)
| | | | | | | | |
Name, Year of Birth and Position(s) Held with the Trust | | Trustee and/or Officer Since | | Principal Occupation(s) During Past 5 Years | | Number of Funds in Fund Complex Overseen by Trustee | | Other Directorship(s) Held by Trustee During Past 5 Years |
| Independent Trustees–(continued) | | | | | | |
Joel W. Motley – 1952 Trustee | | 2019 | | Director of Office of Finance, Federal Home Loan Bank System; Managing Director of Carmona Motley Inc. (privately held financial advisor); Member of the Council on Foreign Relations and its Finance and Budget Committee; Chairman Emeritus of Board of Human Rights Watch and Member of its Investment Committee; and Member of Investment Committee Board of Historic Hudson Valley (non-profit cultural organization); and Member of the Board, Blue Ocean Acquisition Corp. Formerly: Managing Director of Public Capital Advisors, LLC (privately held financial advisor); Managing Director of Carmona Motley Hoffman, Inc. (privately held financial advisor); Trustee of certain Oppenheimer Funds; Director of Columbia Equity Financial Corp. (privately held financial advisor); and Member of the Vestry of Trinity Church Wall Street | | 188 | | Member of Board of Trust for Mutual Understanding (non-profit promoting the arts and environment); Member of Board of Greenwall Foundation (bioethics research foundation) and its Investment Committee; Member of Board of Friends of the LRC (non-profit legal advocacy); Board Member and Investment Committee Member of Pulitzer Center for Crisis Reporting (non-profit journalism)Positive Planet US |
Teresa M. Ressel – 1962 Trustee | | 2017 | | Non-executive director and trustee of a number of public and private business corporations Formerly: Chief Executive Officer, UBS Securities LLC (investment banking); Chief Operating Officer, UBS AG Americas (investment banking); Sr. Management Team Olayan America, The Olayan Group (international investor/commercial/industrial); Assistant Secretary for Management & Budget and Designated Chief Financial Officer, U.S. Department of Treasury; Director, Atlantic Power Corporation (power generation company) and ON Semiconductor Corporation (semiconductor manufacturing) | | 188 | | None |
Ann Barnett Stern – 1957 Trustee | | 2017 | | President, Chief Executive Officer and Board Member, Houston Endowment, Inc. a private philanthropic institution Formerly: Executive Vice President, Texas Children’s Hospital; Vice President, General Counsel and Corporate Compliance Officer, Texas Children’s Hospital; Attorney at Beck, Redden and Secrest, LLP and Andrews and Kurth LLP | | 188 | | Trustee and Board Vice Chair of Holdsworth Center Trustee and Chair of Nomination/Governance Committee, Good Reason Houston, (non-profit); Trustee and Investment Committee member of University of Texas Law School Foundation (non-profit); Board Member of Greater Houston Partnership (non-profit); Advisory Board member, Baker Institute for Public Policy at Rice University (non-profit) Formerly: Director and Audit Committee Member of Federal Reserve Bank of Dallas |
Robert C. Troccoli – 1949 Trustee | | 2016 | | Retired Formerly: Adjunct Professor, University of Denver – Daniels College of Business; and Managing Partner, KPMG LLP | | 188 | | None |
Daniel S. Vandivort – 1954 Trustee | | 2019 | | President, Flyway Advisory Services LLC (consulting and property management) | | 188 | | Formerly: Trustee, Board of Trustees, Treasurer and Chairman of the Audit and Committee, Huntington Disease Foundation of America; Trustee and Governance Chair, of certain Oppenheimer Funds |
Trustees and Officers–(continued)
| | | | | | | | |
Name, Year of Birth and Position(s) Held with the Trust | | Trustee and/or Officer Since | | Principal Occupation(s) During Past 5 Years | | Number of Funds in Fund Complex Overseen by Trustee | | Other Directorship(s) Held by Trustee During Past 5 Years |
| Officers | | | | | | | | |
Sheri Morris – 1964 President and Principal Executive Officer | | 1999 | | Head of Global Fund Services, Invesco Ltd.; President and Principal Executive Officer, The Invesco Funds; Vice President, Invesco Exchange-Traded Fund Trust, Invesco Exchange-Traded Fund Trust II, Invesco India Exchange-Traded Fund Trust, Invesco Actively Managed Exchange-Traded Fund Trust, Invesco Actively Managed Exchange-Traded Commodity Fund Trust and Invesco Exchange-Traded Self-Indexed Fund Trust; and Vice President, OppenheimerFunds, Inc. Formerly: Vice President, Treasurer and Principal Financial Officer, The Invesco Funds; Vice President, Invesco AIM Advisers, Inc., Invesco AIM Capital Management, Inc. and Invesco AIM Private Asset Management, Inc.; Assistant Vice President and Assistant Treasurer, The Invesco Funds; Vice President and Assistant Vice President, Invesco Advisers, Inc.; Assistant Vice President, Invesco AIM Capital Management, Inc. and Invesco AIM Private Asset Management, Inc.; Treasurer, Invesco Exchange-Traded Fund Trust, Invesco Exchange-Traded Fund Trust II, Invesco India Exchange-Traded Fund Trust and Invesco Actively Managed Exchange-Traded Fund Trust and Senior Vice President, Invesco Advisers, Inc. (formerly known as Invesco Institutional (N.A.), Inc.) (registered investment adviser) | | N/A | | N/A |
Jeffrey H. Kupor – 1968 Senior Vice President, Chief Legal Officer and Secretary | | 2018 | | Head of Legal of the Americas, Invesco Ltd.; Senior Vice President and Secretary, Invesco Advisers, Inc. (formerly known as Invesco Institutional (N.A.), Inc.) (registered investment adviser); Senior Vice President and Secretary, Invesco Distributors, Inc. (formerly known as Invesco AIM Distributors, Inc.); Vice President and Secretary, Invesco Investment Services, Inc. (formerly known as Invesco AIM Investment Services, Inc.) Senior Vice President, Chief Legal Officer and Secretary, The Invesco Funds; Secretary and General Counsel, Invesco Investment Advisers LLC (formerly known as Van Kampen Asset Management); Secretary and General Counsel, Invesco Capital Markets, Inc. (formerly known as Van Kampen Funds Inc.) and Chief Legal Officer, Invesco Exchange-Traded Fund Trust, Invesco Exchange-Traded Fund Trust II, Invesco India Exchange-Traded Fund Trust, Invesco Actively Managed Exchange-Traded Fund Trust, Invesco Actively Managed Exchange-Traded Commodity Fund Trust and Invesco Exchange-Traded Self-Indexed Fund Trust;; Secretary and Vice President, Harbourview Asset Management Corporation; Secretary and Vice President, OppenheimerFunds, Inc. and Invesco Managed Accounts, LLC; Secretary and Senior Vice President, OFI Global Institutional, Inc.; Secretary and Vice President, OFI SteelPath, Inc.; Secretary and Vice President, Oppenheimer Acquisition Corp.; Secretary and Vice President, Shareholder Services, Inc.; Secretary and Vice President, Trinity Investment Management Corporation Formerly: Secretary and Vice President, Jemstep, Inc.; Head of Legal, Worldwide Institutional, Invesco Ltd.; Secretary and General Counsel, INVESCO Private Capital Investments, Inc.; Senior Vice President, Secretary and General Counsel, Invesco Management Group, Inc. (formerly known as Invesco AIM Management Group, Inc.); Assistant Secretary, INVESCO Asset Management (Bermuda) Ltd.; Secretary and General Counsel, Invesco Private Capital, Inc.; Assistant Secretary and General Counsel, INVESCO Realty, Inc.; Secretary and General Counsel, Invesco Senior Secured Management, Inc.; Secretary, Sovereign G./P. Holdings Inc.; and Secretary, Invesco Indexing LLC; Secretary, W.L. Ross & Co., LLC | | N/A | | N/A |
Andrew R. Schlossberg – 1974 Senior Vice President | | 2019 | | Head of the Americas and Senior Managing Director, Invesco Ltd.; Director and Senior Vice President, Invesco Advisers, Inc. (formerly known as Invesco Institutional (N.A.), Inc.) (registered investment adviser); Director and Chairman, Invesco Investment Services, Inc. (formerly known as Invesco AIM Investment Services, Inc.) (registered transfer agent); Senior Vice President, The Invesco Funds; Director, Invesco Investment Advisers LLC (formerly known as Van Kampen Asset Management) Formerly: Director, President and Chairman, Invesco Insurance Agency, Inc.; Director, Invesco UK Limited; Director and Chief Executive, Invesco Asset Management Limited and Invesco Fund Managers Limited; Assistant Vice President, The Invesco Funds; Senior Vice President, Invesco Advisers, Inc. (formerly known as Invesco Institutional (N.A.), Inc.) (registered investment adviser); Director and Chief Executive, Invesco Administration Services Limited and Invesco Global Investment Funds Limited; Director, Invesco Distributors, Inc.; Head of EMEA, Invesco Ltd.; President, Invesco Actively Managed Exchange-Traded Commodity Fund Trust, Invesco Actively Managed Exchange-Traded Fund Trust, Invesco Exchange-Traded Fund Trust, Invesco Exchange-Traded Fund Trust II and Invesco India Exchange-Traded Fund Trust; Managing Director and Principal Executive Officer, Invesco Capital Management LLC | | N/A | | N/A |
Trustees and Officers–(continued)
| | | | | | | | |
Name, Year of Birth and Position(s) Held with the Trust | | Trustee and/or Officer Since | | Principal Occupation(s) During Past 5 Years | | Number of Funds in Fund Complex Overseen by Trustee | | Other Directorship(s) Held by Trustee During Past 5 Years |
| Officers–(continued) | | | | | | | | |
John M. Zerr – 1962 Senior Vice President | | 2006 | | Chief Operating Officer of the Americas; Senior Vice President, Invesco Advisers, Inc. (formerly known as Invesco Institutional (N.A.), Inc.) (registered investment adviser); Senior Vice President, Invesco Distributors, Inc. (formerly known as Invesco AIM Distributors, Inc.); Director and Vice President, Invesco Investment Services, Inc. (formerly known as Invesco AIM Investment Services, Inc.) Senior Vice President, The Invesco Funds; Managing Director, Invesco Capital Management LLC; Director, Invesco Investment Advisers LLC (formerly known as Van Kampen Asset Management); Senior Vice President, Invesco Capital Markets, Inc. (formerly known as Van Kampen Funds Inc.); Manager, Invesco Indexing LLC; Manager, Invesco Specialized Products, LLC; Member, Invesco Canada Funds Advisory Board; Director, President and Chief Executive Officer, Invesco Corporate Class Inc. (corporate mutual fund company); and Director, Chairman, President and Chief Executive Officer, Invesco Canada Ltd. (formerly known as Invesco Trimark Ltd./Invesco Trimark Ltèe) (registered investment adviser and registered transfer agent); President, Invesco, Inc.; President, Invesco Global Direct Real Estate Feeder GP Ltd.; President, Invesco IP Holdings (Canada) Ltd; President, Invesco Global Direct Real Estate GP Ltd.; President, Invesco Financial Services Ltd. / Services Financiers Invesco Ltée; and Director and Chairman, Invesco Trust Company Formerly: President, Trimark Investments Ltd/Services Financiers Invesco Ltee; Director and Senior Vice President, Invesco Insurance Agency, Inc.; Director and Senior Vice President, Invesco Management Group, Inc. (formerly known as Invesco AIM Management Group, Inc.); Secretary and General Counsel, Invesco Management Group, Inc. (formerly known as Invesco AIM Management Group, Inc.); Secretary, Invesco Investment Services, Inc. (formerly known as Invesco AIM Investment Services, Inc.); Chief Legal Officer and Secretary, The Invesco Funds; Secretary and General Counsel, Invesco Investment Advisers LLC (formerly known as Van Kampen Asset Management); Secretary and General Counsel, Invesco Capital Markets, Inc. (formerly known as Van Kampen Funds Inc.); Chief Legal Officer, Invesco Exchange-Traded Fund Trust, Invesco Exchange-Traded Fund Trust II, Invesco India Exchange-Traded Fund Trust, Invesco Actively Managed Exchange-Traded Fund Trust, Invesco Actively Managed Exchange-Traded Commodity Fund Trust and Invesco Exchange-Traded Self-Indexed Fund Trust; Secretary, Invesco Indexing LLC; Director, Secretary, General Counsel and Senior Vice President, Van Kampen Exchange Corp.; Director, Vice President and Secretary, IVZ Distributors, Inc. (formerly known as INVESCO Distributors, Inc.); Director and Vice President, INVESCO Funds Group, Inc.; Director and Vice President, Van Kampen Advisors Inc.; Director, Vice President, Secretary and General Counsel, Van Kampen Investor Services Inc.; Director and Secretary, Invesco Distributors, Inc. (formerly known as Invesco AIM Distributors, Inc.); Director, Senior Vice President, General Counsel and Secretary, Invesco AIM Advisers, Inc. and Van Kampen Investments Inc.; Director, Vice President and Secretary, Fund Management Company; Director, Senior Vice President, Secretary, General Counsel and Vice President, Invesco AIM Capital Management, Inc.; Chief Operating Officer and General Counsel, Liberty Ridge Capital, Inc. (an investment adviser) | | N/A | | N/A |
| Gregory G. McGreevey – 1962 Senior Vice President | | 2012 | | Senior Managing Director, Invesco Ltd.; Director, Chairman, President, and Chief Executive Officer, Invesco Advisers, Inc. (formerly known as Invesco Institutional (N.A.), Inc.) (registered investment adviser); Director, Invesco Mortgage Capital, Inc. and Invesco Senior Secured Management, Inc.; Senior Vice President, The Invesco Funds; President, SNW Asset Management Corporation and Invesco Managed Accounts, LLC; Chairman and Director, Invesco Private Capital, Inc.; Chairman and Director, INVESCO Private Capital Investments, Inc.; Chairman and Director, INVESCO Realty, Inc.; and Senior Vice President, Invesco Group Services, Inc. Formerly: Senior Vice President, Invesco Management Group, Inc. and Invesco Advisers, Inc.; Assistant Vice President, The Invesco Funds | | N/A | | N/A |
| Adrien Deberghes – 1967 Principal Financial Officer, Treasurer and Vice President | | 2020 | | Head of the Fund Office of the CFO and Fund Administration; Vice President, Invesco Advisers, Inc.; Principal Financial Officer, Treasurer and Vice President, The Invesco Funds; Vice President, Invesco Exchange-Traded Fund Trust, Invesco Exchange-Traded Fund Trust II, Invesco India Exchange-Traded Fund Trust, Invesco Actively Managed Exchange-Traded Fund Trust, Invesco Actively Managed Exchange-Traded Commodity Fund Trust and Invesco Exchange-Traded Self-Indexed Fund Trust Formerly: Senior Vice President and Treasurer, Fidelity Investments | | N/A | | N/A |
| Crissie M. Wisdom – 1969 Anti-Money Laundering Compliance Officer | | 2013 | | Anti-Money Laundering and OFAC Compliance Officer for Invesco U.S. entities including: Invesco Advisers, Inc. and its affiliates, Invesco Capital Markets, Inc., Invesco Distributors, Inc., Invesco Investment Services, Inc., The Invesco Funds, Invesco Capital Management, LLC, Invesco Trust Company; and Fraud Prevention Manager for Invesco Investment Services, Inc. | | N/A | | N/A |
Trustees and Officers–(continued)
| | | | | | | | |
Name, Year of Birth and Position(s) Held with the Trust | | Trustee and/or Officer Since | | Principal Occupation(s) During Past 5 Years | | Number of Funds in Fund Complex Overseen by Trustee | | Other Directorship(s) Held by Trustee During Past 5 Years |
| Officers–(continued) | | | | | | | | |
Todd F. Kuehl – 1969 Chief Compliance Officer and Senior Vice President | | 2020 | | Chief Compliance Officer, Invesco Advisers, Inc. (registered investment adviser); and Chief Compliance Officer, The Invesco Funds and Senior Vice President Formerly: Managing Director and Chief Compliance Officer, Legg Mason (Mutual Funds); Chief Compliance Officer, Legg Mason Private Portfolio Group (registered investment adviser) | | N/A | | N/A |
Michael McMaster – 1962 Chief Tax Officer, Vice President and Assistant Treasurer | | 2020 | | Head of Global Fund Services Tax; Chief Tax Officer, Vice President and Assistant Treasurer, The Invesco Funds; Vice President, Invesco Advisers, Inc.; Assistant Treasurer, Invesco Capital Management LLC, Assistant Treasurer and Chief Tax Officer, Invesco Exchange-Traded Fund Trust, Invesco Exchange-Traded Fund Trust II, Invesco India Exchange-Traded Fund Trust, Invesco Actively Managed Exchange-Traded Fund Trust, Invesco Actively Managed Exchange-Traded Commodity Fund Trust and Invesco Exchange-Traded Self-Indexed Fund Trust; Assistant Treasurer, Invesco Specialized Products, LLC Formerly: Senior Vice President – Managing Director of Tax Services, U.S. Bank Global Fund Services (GFS) | | N/A | | N/A |
The Statement of Additional Information of the Trust includes additional information about the Fund’s Trustees and is available upon request, without charge, by calling 1.800.959.4246. Please refer to the Fund’s Statement of Additional Information for information on the Fund’s sub-advisers.
| | | | | | |
| Office of the Fund | | Investment Adviser | | Distributor | | Auditors |
11 Greenway Plaza, Suite 1000 Houston, TX 77046-1173 | | Invesco Advisers, Inc. 1555 Peachtree Street, N.E. Atlanta, GA 30309 | | Invesco Distributors, Inc. 11 Greenway Plaza, Suite 1000 Houston, TX 77046-1173 | | PricewaterhouseCoopers LLP 1000 Louisiana Street, Suite 5800 Houston, TX 77002-5678 |
| | | |
| Counsel to the Fund | | Counsel to the Independent Trustees | | Transfer Agent | | Custodian |
Stradley Ronon Stevens & Young, LLP 2005 Market Street, Suite 2600 Philadelphia, PA 19103-7018 | | Goodwin Procter LLP 901 New York Avenue, N.W. Washington, D.C. 20001 | | Invesco Investment Services, Inc. 11 Greenway Plaza, Suite 1000 Houston, TX 77046-1173 | | State Street Bank and Trust Company 225 Franklin Street Boston, MA 02110-2801 |

Go paperless with eDelivery
Visit invesco.com/edelivery to enjoy the convenience and security of anytime electronic access to your investment documents. With eDelivery, you can elect to have any or all of the following materials delivered straight to your inbox to download, save and print from your own computer:
∎ Fund reports and prospectuses
∎ Quarterly statements
∎ Daily confirmations
∎ Tax forms
Invesco mailing information
Send general correspondence to Invesco Investment Services, Inc., P.O. Box 219078, Kansas City, MO 64121-9078.
Important notice regarding delivery of security holder documents
To reduce Fund expenses, only one copy of most shareholder documents may be mailed to shareholders with multiple accounts at the same address (Householding). Mailing of your shareholder documents may be householded indefinitely unless you instruct us otherwise. If you do not want the mailing of these documents to be combined with those for other members of your household, please contact Invesco Investment Services, Inc. at 800 959 4246 or contact your financial institution. We will begin sending you individual copies for each account within 30 days after receiving your request.
Fund holdings and proxy voting information
The Fund provides a complete list of its portfolio holdings four times each year, at the end of each fiscal quarter. For the second and fourth quarters, the list appears, respectively, in the Fund’s semiannual and annual reports to shareholders. For the first and third quarters, the Fund files the list with the Securities and Exchange Commission (SEC) as an exhibit to its reports on Form N-PORT. The most recent list of portfolio holdings is available at invesco.com/completeqtrholdings. Shareholders can also look up the Fund’s Form N-PORT filings on the SEC website, sec.gov. The SEC file numbers for the Fund are shown below.
A description of the policies and procedures that the Fund uses to determine how to vote proxies relating to portfolio securities is available without charge, upon request, from our Client Services department at 800 959 4246, or at invesco.com/ corporate/about-us/esg. The information is also available on the SEC website, sec.gov.
Information regarding how the Fund voted proxies related to its portfolio securities during the most recent 12-month period ended June 30 is available at invesco.com/proxysearch. This information is also available on the SEC website, sec.gov.
Invesco Advisers, Inc. is an investment adviser; it provides investment advisory services to individual and institutional clients and does not sell securities. Invesco Distributors, Inc. is the US distributor for Invesco Ltd.’s retail mutual funds, exchange-traded funds and institutional money market funds. Both are wholly owned, indirect subsidiaries of Invesco Ltd.
| | | | |
| SEC file number(s): 811-05686 and 033-39519 | | Invesco Distributors, Inc. | | INC-AR-1 |

| | |
| Annual Report to Shareholders | | February 28, 2022 |
Invesco Intermediate Bond Factor Fund
Nasdaq:
A: OFIAX ∎ C: OFICX ∎ R: OFINX ∎ Y: OFIYX ∎ R5: IOTEX ∎ R6: OFIIX
Management’s Discussion of Fund Performance
| | | | |
Performance summary | |
For the fiscal year ended February 28, 2022, Class A shares of Invesco Intermediate Bond Factor Fund (the Fund), at net asset value (NAV), underperformed the Bloomberg U.S. Aggregate Bond Index. | |
Your Fund’s long-term performance appears later in this report. | |
Fund vs. Indexes | |
Total returns, 2/28/21 to 2/28/22, at net asset value (NAV). Performance shown does not include applicable contingent deferred sales charges (CDSC) or front-end sales charges, which would have reduced performance. | |
Class A Shares | | | -2.80 | % |
Class C Shares | | | -3.53 | |
Class R Shares | | | -3.13 | |
Class Y Shares | | | -2.56 | |
Class R5 Shares | | | -2.65 | |
Class R6 Shares | | | -2.56 | |
Bloomberg U.S. Aggregate Bond Indexq | | | -2.64 | |
|
Source(s): qRIMES Technologies Corp. | |
Market conditions and your Fund
The US fixed income market, as measured by the Bloomberg U.S. Aggregate Bond Index, was negative for the year 2021. The market was driven by the slight underperformance of corporate bonds as well as the increase in interest rates. The strongest performing component of the Bloomberg U.S. Aggregate Bond Index was corporate bonds. US treasuries, which include less credit risk than the other components of the Bloomberg U.S. Aggregate Bond Index, was the weakest performing component of the index again due to the rise in interest rates.
In the first quarter of 2021, government bond yields rose globally as investors started to price in economic growth and inflation expectations as the economy emerged from the pandemic. However, the bond market seemed to settle down in the second quarter of the fiscal year with positive returns that would continue through the end of the third quarter as investors started to see the return to normal positively affecting the more economically sensitive areas of the market. In the fourth quarter of 2021 concerns about inflation rose as the economy saw inflation prints at the highest levels in nearly 40 years. The US Federal Reserve (the Fed) began to signal their intentions to tighten in early 2022 which caused the short-end of the interest curve to move higher relative to the long-end.
The Invesco Intermediate Bond Factor Fund changed strategies on February 28, 2020, to utilize a systematic, quantitative, factor-based approach to investing. The Fund generated positive returns since the strategy change and at NAV, outperformed its benchmark (Bloomberg U.S. Aggregate Bond Index).
The Fund attempts to outperform its benchmark and peers by overweighting the higher-yielding component of the fixed income market (i.e. corporate bonds), allocating away from treasuries and mortgages
relative to the broad market. Within corporates, the investment team targets bonds from the Bloomberg U.S. Corporate Bond Index that tended to have higher returns over a cycle. These bonds have the following positive characteristics:
∎ Carry bonds are the highest spread bonds in a universe.
∎ Value bonds are those with the highest spread relative to other securities with similar credit ratings and sectors.
∎ Low volatility bonds are those with lower duration and higher credit quality in a universe.
Since the strategy change, value and carry bonds contributed to benchmark relative outperformance and low volatility bonds slightly detracted from relative performance, in line with expectations given the environment in 2021. Overall, bonds with attractive factor characteristics positively impacted the Fund’s relative performance.
Please note that we implemented our strategy using derivative instruments, including futures, forwards and swaps. Therefore, a portion of the performance of the strategy, both positive and negative, can be attributed to these instruments. Derivatives can be a cost-effective way to gain or hedge exposure to certain risks.
Part of the Funds strategy to manage credit, interest rate and currency risk during the fiscal year entailed purchasing and selling credit, interest rate and currency derivatives. Generally, derivative exposure is to mitigate active risk relative to the benchmark. We sought to manage credit market risk by purchasing and selling protection through credit default swaps at various points throughout the fiscal year. The currency management was carried out via currency-forwards and we believe this strategy was effective in managing the currency positioning within the Funds. Interest rate exposure was managed utilizing interest rate futures.
The investment team does not attempt to time the credit market, interest rates, sectors, or factors and therefore maintains its allocations. Over time, we believe this has the potential to deliver positive relative performance over a market cycle.
We wish to remind you that the Fund is subject to interest rate risk, meaning when interest rates rise, the value of fixed income securities tends to fall. The risk may be greater in the current market environment because interest rates are near historic lows. The degree to which the value of fixed income securities may decline due to rising interest rates may vary depending on the speed and magnitude of the increase in interest rates, as well as individual security characteristics such as price, maturity, duration and coupon and market forces such as supply and demand for similar securities. We are monitoring interest rates and the market, economic and geopolitical factors that may impact the direction, speed and magnitude of changes to interest rates across the maturity spectrum, including the potential impact of monetary policy changes by the Fed and certain foreign central banks. If interest rates rise or fall faster than expected, markets may experience increased volatility, which may affect the value and/or liquidity of certain investments held by the Fund.
Thank you for investing in Invesco Intermediate Bond Factor Fund and for sharing our long-term investment horizon.
Portfolio manager(s):
Noelle Corum
James Ong
Jay Raol
The views and opinions expressed in management’s discussion of Fund performance are those of Invesco Advisers, Inc. and its affiliates. These views and opinions are subject to change at any time based on factors such as market and economic conditions. These views and opinions may not be relied upon as investment advice or recommendations, or as an offer for a particular security. The information is not a complete analysis of every aspect of any market, country, industry, security or the Fund. Statements of fact are from sources considered reliable, but Invesco Advisers, Inc. makes no representation or warranty as to their completeness or accuracy. Although historical performance is no guarantee of future results, these insights may help you understand our investment management philosophy.
See important Fund and, if applicable, index disclosures later in this report.
2 Invesco Intermediate Bond Factor Fund
Your Fund’s Long-Term Performance
Results of a $10,000 Investment – Oldest Share Class(es)
Fund and index data from 2/29/12
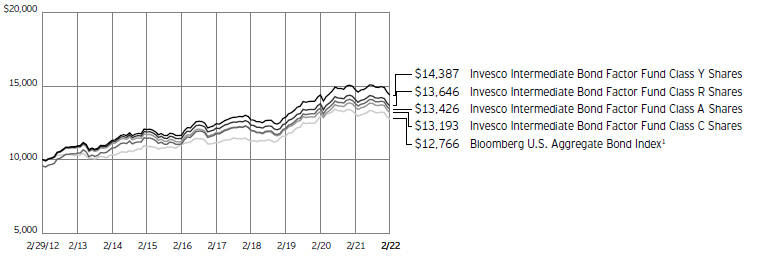
1 Source: RIMES Technologies Corp.
Past performance cannot guarantee future results.
The data shown in the chart include reinvested distributions, applicable sales charges and Fund expenses including management
fees. Index results include reinvested dividends, but they do not reflect sales charges. Performance of the peer group, if applicable, reflects Fund expenses and management fees; performance of a market index does
not. Performance shown in the chart does not reflect deduction of taxes a shareholder would pay on Fund distributions or sale of Fund shares.
3 Invesco Intermediate Bond Factor Fund
| | |
Average Annual Total Returns |
As of 2/28/22, including maximum applicable sales charges |
| |
Class A Shares | | |
Inception (8/2/10) | | 3.70% |
10 Years | | 2.99 |
5 Years | | 1.79 |
1 Year | | -6.97 |
| |
Class C Shares | | |
Inception (8/2/10) | | 3.51% |
10 Years | | 2.81 |
5 Years | | 1.86 |
1 Year | | -4.49 |
| |
Class R Shares | | |
Inception (8/2/10) | | 3.78% |
10 Years | | 3.16 |
5 Years | | 2.36 |
1 Year | | -3.13 |
| |
Class Y Shares | | |
Inception (8/2/10) | | 4.33% |
10 Years | | 3.70 |
5 Years | | 2.95 |
1 Year | | -2.56 |
| |
Class R5 Shares | | |
10 Years | | 3.50% |
5 Years | | 2.80 |
1 Year | | -2.65 |
| |
Class R6 Shares | | |
Inception (11/28/12) | | 3.24% |
5 Years | | 3.01 |
1 Year | | -2.56 |
Effective May 24, 2019, Class A, Class C, Class R, Class Y and Class I shares of the Oppenheimer Intermediate Income Fund, (the predecessor fund), were reorganized into Class A, Class C, Class R, Class Y and Class R6 shares, respectively, of the Invesco Oppenheimer Intermediate Income Fund. The Fund was subsequently renamed the Invesco Intermediate Bond Factor Fund (the Fund). Returns shown above, for periods ending on or prior to May 24, 2019, for Class A, Class C, Class R, Class Y and Class R6 shares are those for Class A, Class C, Class R, Class Y and Class I shares of the predecessor fund. Share class returns will differ from the predecessor fund because of different expenses. For periods prior to February 28, 2020, performance shown is that of the Fund using its previous past performance investment strategy. Therefore, the past performance shown for periods prior to February 28, 2020 may have differed had the Fund’s current investment strategy been in effect.
Class R5 shares incepted on May 24, 2019. Performance shown on and prior to that date is that of the predecessor fund’s Class A shares at net asset value and includes the 12b-1 fees applicable to Class A shares.
The performance data quoted represent past performance and cannot guarantee future results; current performance may be
lower or higher. Please visit invesco.com/ performance for the most recent month-end performance. Performance figures reflect reinvested distributions, changes in net asset value and the effect of the maximum sales charge unless otherwise stated. Performance figures do not reflect deduction of taxes a shareholder would pay on Fund distributions or sale of Fund shares. Investment return and principal value will fluctuate so that you may have a gain or loss when you sell shares.
Class A share performance reflects the maximum 4.25% sales charge, and Class C share performance reflects the applicable contingent deferred sales charge (CDSC) for the period involved. The CDSC on Class C shares is 1% for the first year after purchase. Class R, Class Y, Class R5 and Class R6 shares do not have a front-end sales charge or a CDSC; therefore, performance is at net asset value.
The performance of the Fund’s share classes will differ primarily due to different sales charge structures and class expenses.
Fund performance reflects any applicable fee waivers and/or expense reimbursements. Had the adviser not waived fees and/or reimbursed expenses currently or in the past, returns would have been lower. See current prospectus for more information.
4 Invesco Intermediate Bond Factor Fund
Supplemental Information
Invesco Intermediate Bond Factor Fund’s investment objective is to seek total return.
| ∎ | | Unless otherwise stated, information presented in this report is as of February 28, 2022, and is based on total net assets. |
| ∎ | | Unless otherwise noted, all data is provided by Invesco. |
| ∎ | | To access your Fund’s reports/prospectus, visit invesco.com/fundreports. |
About indexes used in this report
| ∎ | | The Bloomberg U.S. Aggregate Bond Index is an unmanaged index considered representative of the US investment-grade, fixed-rate bond market. |
| ∎ | | The Fund is not managed to track the performance of any particular index, including the index(es) described here, and consequently, the performance of the Fund may deviate significantly from the performance of the index(es). |
| ∎ | | A direct investment cannot be made in an index. Unless otherwise indicated, index results include reinvested dividends, and they do not reflect sales charges. Performance of the peer group, if applicable, reflects fund expenses; performance of a market index does not. |
| | |
This report must be accompanied or preceded by a currently effective Fund prospectus, which contains more complete information, including sales charges and expenses. Investors should read it carefully before investing. | | |
| | |
| NOT FDIC INSURED | MAY LOSE VALUE | NO BANK GUARANTEE | | |
5 Invesco Intermediate Bond Factor Fund
Fund Information
Portfolio Composition
| | | | | |
| By security type | | % of total investments |
U.S. Dollar Denominated Bonds & Notes | | | | 38.19 | % |
U.S. Treasury Securities | | | | 24.93 | |
U.S. Government Sponsored Agency Mortgage- Backed Securities | | | | 21.69 | |
Non-U.S. Dollar Denominated Bonds & Notes | | | | 9.00 | |
Security types each less than 1% portfolio | | | | 0.18 | |
Money Market Funds | | | | 6.01 | |
| |
| Top Five Debt Issuers* | | | | | |
| |
| | | % of total net assets |
1. U.S. Treasury | | | | 29.63% | |
2. Uniform Mortgage-Backed Securities | | | | 18.77 | |
3. Federal National Mortgage Association | | | | 3.51 | |
4. Federal Home Loan Mortgage Corp. | | | | 3.18 | |
5. Norway Government Bond | | | | 2.85 | |
The Fund’s holdings are subject to change, and there is no assurance that the Fund will continue to hold any particular security.
* Excluding money market fund holdings, if any.
Data presented here are as of February 28, 2022.
6 Invesco Intermediate Bond Factor Fund
Schedule of Investments(a)
February 28, 2022
| | | | | | |
| | | Principal
Amount | | | Value |
U.S. Dollar Denominated Bonds & Notes–45.39% |
Advertising–0.10% | | | | | | |
Omnicom Group, Inc./Omnicom Capital, Inc., 3.65%, 11/01/2024 | | $ | 200,000 | | | $ 206,977 |
| | |
Aerospace & Defense–0.75% | | | | | | |
Boeing Co. (The), 3.10%, 05/01/2026 | | | 725,000 | | | 731,770 |
Raytheon Technologies Corp., 3.50%, 03/15/2027 | | | 292,000 | | | 305,793 |
Rockwell Collins, Inc., 3.20%, 03/15/2024 | | | 441,000 | | | 451,781 |
| | | | | | | 1,489,344 |
|
Agricultural Products–0.29% |
Bunge Ltd. Finance Corp., 3.25%, 08/15/2026 | | | 553,000 | | | 565,512 |
|
Air Freight & Logistics–0.70% |
FedEx Corp.,
4.75%, 11/15/2045 | | | 600,000 | | | 665,842 |
4.55%, 04/01/2046 | | | 668,000 | | | 728,675 |
| | | | | | | 1,394,517 |
| | |
Airlines–0.52% | | | | | | |
Southwest Airlines Co., 3.00%, 11/15/2026 | | | 500,000 | | | 507,084 |
Spirit Airlines Pass-Through Trust,
Series 2015-1A, 4.10%, 10/01/2029 | | | 94,352 | | | 95,127 |
United Airlines Pass-Through Trust,
Series 2019-1, Class AA, 4.15%, 08/25/2031 | | | 396,573 | | | 425,951 |
| | | | | | | 1,028,162 |
| | |
Apparel Retail–0.71% | | | | | | |
TJX Cos., Inc. (The), 3.88%, 04/15/2030 | | | 1,312,000 | | | 1,414,124 |
| |
Asset Management & Custody Banks–0.44% | | | |
Affiliated Managers Group, Inc., 4.25%, 02/15/2024 | | | 106,000 | | | 110,600 |
Ameriprise Financial, Inc., 4.00%, 10/15/2023 | | | 241,000 | | | 248,894 |
FS KKR Capital Corp., 4.13%, 02/01/2025 | | | 119,000 | | | 120,480 |
Golub Capital BDC, Inc., 3.38%, 04/15/2024 | | | 240,000 | | | 240,054 |
Main Street Capital Corp., 5.20%, 05/01/2024 | | | 150,000 | | | 154,945 |
| | | | | | | 874,973 |
|
Automobile Manufacturers–0.98% |
American Honda Finance Corp., 3.50%, 02/15/2028 | | | 848,000 | | | 890,017 |
| | | | | | |
| | | Principal
Amount | | | Value |
Automobile Manufacturers–(continued) | | | |
General Motors Co., 6.60%, 04/01/2036 | | $ | 100,000 | | | $ 124,258 |
5.15%, 04/01/2038 | | | 49,000 | | | 53,148 |
6.25%, 10/02/2043 | | | 403,000 | | | 490,429 |
6.75%, 04/01/2046 | | | 259,000 | | | 328,225 |
5.95%, 04/01/2049 | | | 44,000 | | | 52,674 |
| | | | | | | 1,938,751 |
| | |
Biotechnology–0.48% | | | | | | |
Amgen, Inc.,
3.63%, 05/22/2024(b) | | | 425,000 | | | 439,344 |
2.20%, 02/21/2027 | | | 17,000 | | | 16,788 |
Biogen, Inc., 2.25%, 05/01/2030 | | | 250,000 | | | 228,641 |
Gilead Sciences, Inc., 3.70%, 04/01/2024 | | | 250,000 | | | 258,079 |
| | | | | | | 942,852 |
| | |
Brewers–0.36% | | | | | | |
Anheuser-Busch InBev Worldwide, Inc. (Belgium), 8.20%, 01/15/2039 | | | 262,000 | | | 400,734 |
Molson Coors Beverage Co., 5.00%, 05/01/2042 | | | 165,000 | | | 181,248 |
4.20%, 07/15/2046 | | | 140,000 | | | 139,461 |
| | | | | | | 721,443 |
| | |
Broadcasting–0.15% | | | | | | |
Discovery Communications LLC, 4.13%, 05/15/2029 | | | 289,000 | | | 299,634 |
| | |
Building Products–0.04% | | | | | | |
Owens Corning, 7.00%, 12/01/2036 | | | 62,000 | | | 81,742 |
| | |
Cable & Satellite–1.01% | | | | | | |
Charter Communications Operating LLC/ Charter Communications Operating Capital Corp.,
5.05%, 03/30/2029 | | | 419,000 | | | 455,923 |
5.13%, 07/01/2049 | | | 50,000 | | | 50,989 |
Grupo Televisa S.A.B. (Mexico), 4.63%, 01/30/2026(b) | | | 450,000 | | | 475,583 |
Time Warner Cable LLC,
7.30%, 07/01/2038 | | | 106,000 | | | 132,870 |
5.50%, 09/01/2041 | | | 408,000 | | | 435,613 |
4.50%, 09/15/2042 | | | 420,000 | | | 396,403 |
Time Warner Entertainment Co. L.P., 8.38%, 07/15/2033 | | | 35,000 | | | 47,807 |
| | | | | | | 1,995,188 |
| | |
Commodity Chemicals–0.02% | | | | | | |
Westlake Corp., 5.00%, 08/15/2046 | | | 27,000 | | | 30,700 |
| |
Communications Equipment–0.02% | | | |
Juniper Networks, Inc., 5.95%, 03/15/2041 | | | 14,000 | | | 16,942 |
Motorola Solutions, Inc., 5.50%, 09/01/2044 | | | 14,000 | | | 16,471 |
| | | | | | | 33,413 |
See accompanying Notes to Financial Statements which are an integral part of the financial statements.
7 Invesco Intermediate Bond Factor Fund
| | | | | | | | |
| | | Principal
Amount | | | Value | |
Computer & Electronics Retail–0.27% | | | | | |
Dell International LLC/EMC Corp., 6.02%, 06/15/2026 | | $ | 400,000 | | | $ | 446,653 | |
8.10%, 07/15/2036 | | | 29,000 | | | | 40,218 | |
8.35%, 07/15/2046 | | | 35,000 | | | | 53,184 | |
| | | | | | | | 540,055 | |
|
Construction & Engineering–0.04% | |
Valmont Industries, Inc., 5.25%, 10/01/2054 | | | 73,000 | | | | 86,886 | |
|
Construction Machinery & Heavy Trucks–0.80% | |
Caterpillar Financial Services Corp., 3.25%, 12/01/2024 | | | 637,000 | | | | 659,916 | |
Cummins, Inc., 3.65%, 10/01/2023 | | | 479,000 | | | | 491,064 | |
nVent Finance S.a.r.l. (United | | | | | | | | |
Kingdom), 4.55%, 04/15/2028 | | | 400,000 | | | | 429,936 | |
| | | | | | | | 1,580,916 | |
| | |
Consumer Finance–0.73% | | | | | | | | |
Ally Financial, Inc., 8.00%, 11/01/2031 | | | 218,000 | | | | 287,412 | |
American Express Co.,
3.40%, 02/22/2024 | | | 350,000 | | | | 360,287 | |
3.00%, 10/30/2024 | | | 75,000 | | | | 76,684 | |
Capital One Bank USA N.A., 3.38%, 02/15/2023 | | | 250,000 | | | | 253,969 | |
Capital One Financial Corp., 3.75%, 04/24/2024 | | | 453,000 | | | | 467,003 | |
| | | | | | | | 1,445,355 | |
| | |
Distillers & Vintners–0.47% | | | | | | | | |
Diageo Capital PLC (United Kingdom),
2.13%, 10/24/2024 | | | 574,000 | | | | 574,892 | |
3.88%, 05/18/2028 | | | 330,000 | | | | 354,327 | |
| | | | | | | | 929,219 | |
| | |
Diversified Banks–7.18% | | | | | | | | |
Australia & New Zealand Banking | | | | | | | | |
Group Ltd. (Australia), 3.70%, 11/16/2025 | | | 400,000 | | | | 422,165 | |
Banco Santander S.A. (Spain), 5.18%, 11/19/2025 | | | 600,000 | | | | 639,546 | |
4.25%, 04/11/2027 | | | 400,000 | | | | 422,655 | |
4.38%, 04/12/2028 | | | 200,000 | | | | 212,903 | |
Bancolombia S.A. (Colombia), 3.00%, 01/29/2025 | | | 213,000 | | | | 205,250 | |
Bank of America Corp.,
4.45%, 03/03/2026 | | | 430,000 | | | | 458,510 | |
1.32%, 06/19/2026(c) | | | 405,000 | | | | 387,178 | |
3.56%, 04/23/2027(c) | | | 221,000 | | | | 227,013 | |
2.48%, 09/21/2036(c) | | | 489,000 | | | | 444,341 | |
Series DD, 6.30%(c)(d) | | | 257,000 | | | | 277,915 | |
Bank of Montreal (Canada), 3.80%, 12/15/2032(c) | | | 300,000 | | | | 308,105 | |
Barclays Bank PLC (United Kingdom), 3.75%, 05/15/2024 | | | 240,000 | | | | 248,017 | |
Barclays PLC (United Kingdom), 5.20%, 05/12/2026 | | | 284,000 | | | | 305,043 | |
3.56%, 09/23/2035(c) | | | 400,000 | | | | 382,676 | |
7.88%(c)(d)(e) | | | 75,000 | | | | 75,159 | |
8.00%(c)(d) | | | 94,000 | | | | 100,462 | |
BPCE S.A. (France), 4.50%, 03/15/2025(e) | | | 195,000 | | | | 202,633 | |
| | | | | | | | |
| | | Principal
Amount | | | Value | |
Diversified Banks–(continued) | | | | | | | | |
Citigroup, Inc.,
4.04%, 06/01/2024(b)(c) | | $ | 300,000 | | | $ | 307,846 | |
3.67%, 07/24/2028(c) | | | 100,000 | | | | 103,581 | |
8.13%, 07/15/2039 | | | 200,000 | | | | 313,380 | |
Cooperatieve Rabobank U.A. (Netherlands), 3.38%, 05/21/2025 | | | 300,000 | | | | 311,528 | |
HSBC Bank USA N.A., 5.88%, 11/01/2034 | | | 700,000 | | | | 849,877 | |
HSBC Holdings PLC (United Kingdom),
4.25%, 03/14/2024 | | | 454,000 | | | | 470,627 | |
3.95%, 05/18/2024(c) | | | 300,000 | | | | 306,759 | |
4.29%, 09/12/2026(c) | | | 325,000 | | | | 339,206 | |
4.58%, 06/19/2029(c) | | | 165,000 | | | | 175,728 | |
6.10%, 01/14/2042 | | | 342,000 | | | | 450,510 | |
JPMorgan Chase & Co.,
3.80%, 07/23/2024(c) | | | 258,000 | | | | 264,298 | |
3.88%, 09/10/2024 | | | 502,000 | | | | 521,020 | |
7.75%, 07/15/2025 | | | 250,000 | | | | 292,374 | |
Lloyds Banking Group PLC (United Kingdom),
4.50%, 11/04/2024 | | | 350,000 | | | | 365,528 | |
4.45%, 05/08/2025 | | | 755,000 | | | | 795,139 | |
3.87%, 07/09/2025(c) | | | 201,000 | | | | 206,960 | |
3.75%, 01/11/2027 | | | 375,000 | | | | 389,456 | |
National Australia Bank Ltd. (Australia),
3.38%, 01/14/2026 | | | 300,000 | | | | 313,400 | |
2.50%, 07/12/2026 | | | 250,000 | | | | 253,623 | |
Sumitomo Mitsui Financial Group, Inc. (Japan), 2.35%, 01/15/2025 | | | 200,000 | | | | 199,465 | |
Svenska Handelsbanken AB (Sweden), 3.90%, 11/20/2023(b) | | | 474,000 | | | | 491,974 | |
U.S. Bancorp, Series W, 3.10%, 04/27/2026 | | | 160,000 | | | | 164,464 | |
Westpac Banking Corp. (Australia),
3.30%, 02/26/2024 | | | 147,000 | | | | 151,315 | |
2.85%, 05/13/2026 | | | 451,000 | | | | 463,063 | |
2.70%, 08/19/2026 | | | 400,000 | | | | 407,120 | |
| | | | | | | | 14,227,812 | |
|
Diversified Capital Markets–0.34% | |
Credit Suisse Group AG (Switzerland), 3.87%, 01/12/2029(c)(e) | | | 189,000 | | | | 191,584 | |
Deutsche Bank AG (Germany), 3.95%, 02/27/2023 | | | 343,000 | | | | 348,515 | |
UBS Group AG (Switzerland), 7.00%(c)(d)(e) | | | 125,000 | | | | 130,225 | |
| | | | | | | | 670,324 | |
| | |
Diversified Chemicals–0.03% | | | | | | | | |
Dow Chemical Co. (The), 9.40%, 05/15/2039 | | | 32,000 | | | | 53,853 | |
| | |
Diversified REITs–0.02% | | | | | | | | |
CyrusOne L.P./CyrusOne Finance Corp., 3.45%, 11/15/2029 | | | 33,000 | | | | 34,755 | |
| | |
Drug Retail–0.14% | | | | | | | | |
Walgreens Boots Alliance, Inc., 4.80%, 11/18/2044 | | | 245,000 | | | | 268,354 | |
See accompanying Notes to Financial Statements which are an integral part of the financial statements.
8 Invesco Intermediate Bond Factor Fund
| | | | | | |
| | | Principal
Amount | | | Value |
Education Services–0.02% | | | | | | |
California Institute of Technology, 4.70%, 11/01/2111 | | $ | 27,000 | | | $ 34,622 |
| | |
Electric Utilities–2.96% | | | | | | |
AEP Texas, Inc., 3.95%, 06/01/2028(e) | | | 806,000 | | | 849,538 |
Duke Energy Corp., 3.75%, 04/15/2024 | | | 290,000 | | | 299,342 |
Edison International,
5.75%, 06/15/2027 | | | 150,000 | | | 166,652 |
4.13%, 03/15/2028 | | | 228,000 | | | 234,867 |
EDP Finance B.V. (Portugal), 3.63%, 07/15/2024(e) | | | 349,000 | | | 357,827 |
Eversource Energy, Series L, 2.90%, 10/01/2024 | | | 230,000 | | | 233,359 |
ITC Holdings Corp., 5.30%, 07/01/2043 | | | 323,000 | | | 386,443 |
National Grid USA, 5.80%, 04/01/2035 | | | 146,000 | | | 172,281 |
NextEra Energy Capital Holdings, Inc., 5.65%, 05/01/2079(c) | | | 235,000 | | | 248,678 |
Oglethorpe Power Corp., 5.95%, 11/01/2039 | | | 374,000 | | | 462,646 |
Southern California Edison Co.,
6.65%, 04/01/2029 | | | 500,000 | | | 605,069 |
6.00%, 01/15/2034 | | | 168,000 | | | 206,834 |
Southern Power Co., 5.15%, 09/15/2041 | | | 435,000 | | | 490,812 |
Union Electric Co., 8.45%, 03/15/2039 | | | 400,000 | | | 637,506 |
Virginia Electric & Power Co., 8.88%, 11/15/2038 | | | 316,000 | | | 514,111 |
| | | | | | | 5,865,965 |
| | |
Electronic Components–0.16% | | | | | | |
Amphenol Corp., 3.20%, 04/01/2024 | | | 111,000 | | | 113,478 |
Corning, Inc.,
5.35%, 11/15/2048 | | | 50,000 | | | 62,667 |
5.85%, 11/15/2068 | | | 110,000 | | | 141,590 |
| | | | | | | 317,735 |
| |
Fertilizers & Agricultural Chemicals–0.03% | | | |
Mosaic Co. (The),
5.45%, 11/15/2033 | | | 19,000 | | | 22,434 |
5.63%, 11/15/2043 | | | 24,000 | | | 29,725 |
| | | | | | | 52,159 |
| | |
Health Care Equipment–0.17% | | | | | | |
Baxter International, Inc., 3.95%, 04/01/2030 | | | 318,000 | | | 342,841 |
| | |
Health Care Facilities–0.99% | | | | | | |
CommonSpirit Health,
1.55%, 10/01/2025 | | | 314,000 | | | 303,186 |
3.35%, 10/01/2029 | | | 375,000 | | | 379,055 |
HCA, Inc.,
5.25%, 04/15/2025 | | | 197,000 | | | 211,608 |
5.25%, 06/15/2049 | | | 300,000 | | | 342,001 |
SSM Health Care Corp., Series 2018, 3.69%, 06/01/2023 | | | 715,000 | | | 728,202 |
| | | | | | | 1,964,052 |
| | | | | | |
| | | Principal
Amount | | | Value |
Health Care REITs–0.31% | | | | | | |
Omega Healthcare Investors, Inc., 3.38%, 02/01/2031 | | $ | 615,000 | | | $ 582,322 |
Sabra Health Care L.P., 5.13%, 08/15/2026 | | | 28,000 | | | 29,770 |
| | | | | | | 612,092 |
| | |
Health Care Services–0.77% | | | | | | |
CHRISTUS Health, Series C, 4.34%, 07/01/2028 | | | 430,000 | | | 466,072 |
Cigna Corp., 4.50%, 02/25/2026 | | | 200,000 | | | 214,195 |
CVS Health Corp., 5.05%, 03/25/2048 | | | 302,000 | | | 353,168 |
Dignity Health, 5.27%, 11/01/2064 | | | 248,000 | | | 311,339 |
Toledo Hospital (The), 6.02%, 11/15/2048 | | | 154,000 | | | 181,729 |
| | | | | | | 1,526,503 |
| |
Home Improvement Retail–0.10% | | | |
Lowe’s Cos., Inc., 3.13%, 09/15/2024 | | | 200,000 | | | 204,278 |
| | |
Hotel & Resort REITs–0.11% | | | | | | |
Host Hotels & Resorts L.P., Series H, 3.38%, 12/15/2029 | | | 125,000 | | | 123,144 |
Service Properties Trust,
4.35%, 10/01/2024 | | | 61,000 | | | 58,878 |
4.95%, 10/01/2029 | | | 50,000 | | | 45,291 |
| | | | | | | 227,313 |
| |
Hotels, Resorts & Cruise Lines–0.30% | | | |
Booking Holdings, Inc., 3.55%, 03/15/2028 | | | 399,000 | | | 423,625 |
Expedia Group, Inc., 4.63%, 08/01/2027 | | | 122,000 | | | 130,687 |
Marriott International, Inc., Series EE, 5.75%, 05/01/2025 | | | 39,000 | | | 42,702 |
| | | | | | | 597,014 |
|
Independent Power Producers & Energy Traders–0.12% |
Enel Generacion Chile S.A. (Chile), 4.25%, 04/15/2024 | | | 226,000 | | | 230,520 |
| |
Industrial Conglomerates–0.46% | | | |
General Electric Co., 5.88%, 01/14/2038 | | | 725,000 | | | 904,778 |
| | |
Industrial Machinery–0.67% | | | | | | |
Parker-Hannifin Corp., 3.25%, 03/01/2027 | | | 675,000 | | | 699,271 |
Stanley Black & Decker, Inc., 4.25%, 11/15/2028 | | | 570,000 | | | 624,321 |
| | | | | | | 1,323,592 |
| | |
Insurance Brokers–0.30% | | | | | | |
Aon Corp., 8.21%, 01/01/2027 | | | 100,000 | | | 120,319 |
Marsh & McLennan Cos., Inc., 3.88%, 03/15/2024 | | | 456,000 | | | 472,132 |
| | | | | | | 592,451 |
| | |
Integrated Oil & Gas–1.65% | | | | | | |
BP Capital Markets PLC (United | | | | | | |
Kingdom), 3.81%, 02/10/2024 | | | 321,000 | | | 332,939 |
Chevron Corp., 2.90%, 03/03/2024 | | | 324,000 | | | 330,871 |
See accompanying Notes to Financial Statements which are an integral part of the financial statements.
9 Invesco Intermediate Bond Factor Fund
| | | | | | |
| | | Principal
Amount | | | Value |
Integrated Oil & Gas–(continued) |
Chevron USA, Inc., 5.25%, 11/15/2043 | | $ | 370,000 | | | $ 471,683 |
Exxon Mobil Corp.,
2.99%, 03/19/2025 | | | 450,000 | | | 462,252 |
4.11%, 03/01/2046 | | | 410,000 | | | 448,402 |
4.33%, 03/19/2050 | | | 400,000 | | | 453,207 |
Shell International Finance B.V. (Netherlands),
3.25%, 05/11/2025 | | | 90,000 | | | 93,412 |
4.55%, 08/12/2043 | | | 315,000 | | | 359,897 |
4.38%, 05/11/2045 | | | 205,000 | | | 227,576 |
Total Energies Capital International S.A. (France), 2.70%, 01/25/2023 | | | 82,000 | | | 82,904 |
| | | | | | | 3,263,143 |
|
Integrated Telecommunication Services–0.92% |
TCI Communications, Inc., 7.13%, 02/15/2028 | | | 1,100,000 | | | 1,354,343 |
Verizon Communications, Inc., 0.85%, 11/20/2025 | | | 500,000 | | | 475,841 |
| | | | | | | 1,830,184 |
|
Interactive Media & Services–1.15% |
Alphabet, Inc., 3.38%, 02/25/2024 | | | 274,000 | | | 282,340 |
Baidu, Inc. (China),
3.50%, 11/28/2022 | | | 865,000 | | | 875,501 |
4.38%, 05/14/2024 | | | 400,000 | | | 416,200 |
4.38%, 03/29/2028 | | | 300,000 | | | 319,270 |
2.38%, 08/23/2031 | | | 200,000 | | | 183,574 |
Weibo Corp. (China), 3.50%, 07/05/2024 | | | 200,000 | | | 201,854 |
| | | | | | | 2,278,739 |
|
Internet & Direct Marketing Retail–0.63% |
Alibaba Group Holding Ltd. (China), 3.40%, 12/06/2027 | | | 330,000 | | | 335,276 |
4.50%, 11/28/2034 | | | 570,000 | | | 602,838 |
Amazon.com, Inc., 4.25%, 08/22/2057 | | | 275,000 | | | 318,934 |
| | | | | | | 1,257,048 |
|
Investment Banking & Brokerage–1.87% |
Brookfield Finance, Inc. (Canada), 4.00%, 04/01/2024 | | | 240,000 | | | 248,363 |
4.70%, 09/20/2047 | | | 101,000 | | | 110,408 |
Goldman Sachs Group, Inc. (The), 4.00%, 03/03/2024 | | | 1,077,000 | | | 1,115,928 |
3.50%, 11/16/2026 | | | 301,000 | | | 308,413 |
Morgan Stanley,
3.74%, 04/24/2024(c) | | | 726,000 | | | 739,813 |
3.88%, 01/27/2026 | | | 415,000 | | | 433,331 |
Series F, 3.88%, 04/29/2024 | | | 538,000 | | | 556,652 |
Nomura Holdings, Inc. (Japan), 2.65%, 01/16/2025 | | | 200,000 | | | 200,746 |
| | | | | | | 3,713,654 |
|
IT Consulting & Other Services–0.32% |
International Business Machines Corp., 7.13%, 12/01/2096 | | | 383,000 | | | 633,398 |
| | | | | | |
| | | Principal
Amount | | | Value |
Leisure Products–0.28% | | | | | | |
Hasbro, Inc.,
6.35%, 03/15/2040 | | $ | 300,000 | | | $ 382,376 |
5.10%, 05/15/2044 | | | 147,000 | | | 166,110 |
| | | | | | | 548,486 |
| | |
Life & Health Insurance–1.26% | | | | | | |
Brighthouse Financial, Inc.,
3.70%, 06/22/2027 | | | 257,000 | | | 266,392 |
4.70%, 06/22/2047 | | | 236,000 | | | 236,306 |
MetLife, Inc.,
3.60%, 04/10/2024 | | | 692,000 | | | 716,761 |
Series D, 5.88%(c)(d) | | | 100,000 | | | 104,349 |
Prudential Financial, Inc.,
5.63%, 06/15/2043(c) | | | 342,000 | | | 351,405 |
5.20%, 03/15/2044(c) | | | 225,000 | | | 226,969 |
5.38%, 05/15/2045(c) | | | 135,000 | | | 138,700 |
Reliance Standard Life Global Funding II, 2.75%, 01/21/2027(e) | | | 441,000 | | | 441,109 |
Unum Group, 5.75%, 08/15/2042 | | | 13,000 | | | 14,542 |
| | | | | | | 2,496,533 |
| | |
Managed Health Care–0.12% | | | | | | |
Kaiser Foundation Hospitals,
3.15%, 05/01/2027 | | | 225,000 | | | 233,383 |
| | |
Motorcycle Manufacturers–0.23% | | | | | | |
Harley-Davidson, Inc.,
3.50%, 07/28/2025 | | | 187,000 | | | 190,900 |
4.63%, 07/28/2045 | | | 279,000 | | | 272,953 |
| | | | | | | 463,853 |
| | |
Movies & Entertainment–0.22% | | | | | | |
Walt Disney Co. (The), 5.40%, 10/01/2043 | | | 350,000 | | | 438,825 |
| | |
Multi-line Insurance–0.06% | | | | | | |
American International Group, Inc., | | | | | | |
Series A-9,
5.75%, 04/01/2048(c) | | | 20,000 | | | 20,600 |
8.18%, 05/15/2058(c) | | | 11,000 | | | 15,507 |
XLIT Ltd. (Bermuda), 4.45%, 03/31/2025 | | | 75,000 | | | 79,249 |
| | | | | | | 115,356 |
| | |
Multi-Utilities–0.26% | | | | | | |
Black Hills Corp.,
4.25%, 11/30/2023 | | | 216,000 | | | 223,516 |
3.95%, 01/15/2026 | | | 277,000 | | | 290,424 |
| | | | | | | 513,940 |
|
Oil & Gas Equipment & Services–0.38% |
Baker Hughes Holdings LLC, 5.13%, 09/15/2040 | | | 152,000 | | | 172,406 |
Baker Hughes Holdings LLC/Baker Hughes Co-Obligor, Inc., 4.08%, 12/15/2047 | | | 181,000 | | | 183,394 |
Halliburton Co., 7.45%, 09/15/2039 | | | 113,000 | | | 154,617 |
NOV, Inc., 3.60%, 12/01/2029(b) | | | 243,000 | | | 243,904 |
| | | | | | | 754,321 |
|
Oil & Gas Exploration & Production–0.24% |
Hess Corp., 5.60%, 02/15/2041 | | | 140,000 | | | 160,862 |
See accompanying Notes to Financial Statements which are an integral part of the financial statements.
10 Invesco Intermediate Bond Factor Fund
| | | | | | |
| | | Principal
Amount | | | Value |
Oil & Gas Exploration & Production–(continued) |
Marathon Oil Corp., 6.60%, 10/01/2037 | | $ | 250,000 | | | $ 314,810 |
| | | | | | | 475,672 |
|
Oil & Gas Storage & Transportation–1.12% |
Boardwalk Pipelines L.P., 4.45%, 07/15/2027 | | | 56,000 | | | 59,077 |
Cheniere Corpus Christi Holdings LLC, 7.00%, 06/30/2024 | | | 370,000 | | | 400,363 |
Columbia Pipeline Group, Inc., 5.80%, 06/01/2045 | | | 143,000 | | | 171,767 |
Energy Transfer L.P.,
3.90%, 05/15/2024 | | | 250,000 | | | 256,645 |
4.95%, 05/15/2028 | | | 51,000 | | | 54,629 |
5.30%, 04/15/2047 | | | 389,000 | | | 407,335 |
5.40%, 10/01/2047 | | | 167,000 | | | 179,081 |
Enterprise Products Operating LLC, 3.75%, 02/15/2025 | | | 165,000 | | | 171,657 |
Kinder Morgan Energy Partners L.P., 6.95%, 01/15/2038 | | | 131,000 | | | 166,688 |
Spectra Energy Partners L.P., 3.50%, 03/15/2025 | | | 175,000 | | | 179,625 |
Williams Cos., Inc. (The), 6.30%, 04/15/2040 | | | 136,000 | | | 167,468 |
| | | | | | | 2,214,335 |
|
Other Diversified Financial Services–0.55% |
Avolon Holdings Funding Ltd. (Ireland), 3.25%, 02/15/2027(e) | | | 265,000 | | | 260,216 |
Blackstone Holdings Finance Co. LLC, 3.15%, 10/02/2027(e) | | | 125,000 | | | 127,095 |
Equitable Holdings, Inc., 5.00%, 04/20/2048 | | | 44,000 | | | 48,989 |
Jefferies Group LLC, 6.25%, 01/15/2036 | | | 182,000 | | | 222,237 |
ORIX Corp. (Japan),
4.05%, 01/16/2024 | | | 322,000 | | | 333,951 |
3.70%, 07/18/2027 | | | 72,000 | | | 75,724 |
Voya Financial, Inc., 5.65%, 05/15/2053(c) | | | 20,000 | | | 20,220 |
| | | | | | | 1,088,432 |
| | |
Paper Packaging–0.16% | | | | | | |
International Paper Co., 4.80%, 06/15/2044 | | | 280,000 | | | 315,100 |
| | |
Paper Products–0.12% | | | | | | |
Fibria Overseas Finance Ltd. (Brazil), 5.50%, 01/17/2027 | | | 27,000 | | | 29,097 |
Suzano Austria GmbH (Brazil), 6.00%, 01/15/2029 | | | 200,000 | | | 219,335 |
| | | | | | | 248,432 |
| | |
Pharmaceuticals–0.36% | | | | | | |
Mylan, Inc., 4.55%, 04/15/2028 | | | 225,000 | | | 240,045 |
Novartis Capital Corp. (Switzerland), 3.10%, 05/17/2027 | | | 450,000 | | | 466,029 |
| | | | | | | 706,074 |
|
Property & Casualty Insurance–0.40% |
Allied World Assurance Co. Holdings | | | | | | |
Ltd., 4.35%, 10/29/2025 | | | 76,000 | | | 79,599 |
Assured Guaranty US Holdings, Inc., 5.00%, 07/01/2024 | | | 176,000 | | | 185,879 |
| | | | | | |
| | | Principal
Amount | | | Value |
Property & Casualty Insurance–(continued) |
CNA Financial Corp., 3.95%, 05/15/2024 | | $ | 297,000 | | | $ 306,572 |
Stewart Information Services Corp., 3.60%, 11/15/2031 | | | 225,000 | | | 217,391 |
| | | | | | | 789,441 |
| | |
Regional Banks–0.56% | | | | | | |
Fifth Third Bancorp, 2.38%, 01/28/2025 | | | 235,000 | | | 235,534 |
Huntington Bancshares, Inc., 2.63%, 08/06/2024 | | | 230,000 | | | 232,109 |
KeyBank N.A., 3.40%, 05/20/2026 | | | 230,000 | | | 237,392 |
PNC Financial Services Group, Inc. (The), 3.90%, 04/29/2024 | | | 270,000 | | | 281,062 |
Truist Bank,
4.05%, 11/03/2025 | | | 10,000 | | | 10,605 |
3.30%, 05/15/2026 | | | 115,000 | | | 118,961 |
| | | | | | | 1,115,663 |
| | |
Reinsurance–0.02% | | | | | | |
RenaissanceRe Finance, Inc. (Bermuda), 3.70%, 04/01/2025 | | | 34,000 | | | 35,292 |
| | |
Residential REITs–0.31% | | | | | | |
American Campus Communities Operating Partnership L.P., 3.88%, 01/30/2031 | | | 100,000 | | | 105,004 |
AvalonBay Communities, Inc., 4.20%, 12/15/2023 | | | 325,000 | | | 336,305 |
Spirit Realty L.P., 3.20%, 02/15/2031 | | | 175,000 | | | 170,870 |
| | | | | | | 612,179 |
| | |
Restaurants–0.24% | | | | | | |
Starbucks Corp., 3.85%, 10/01/2023 | | | 467,000 | | | 480,500 |
| | |
Retail REITs–0.37% | | | | | | |
Federal Realty Investment Trust, 4.50%, 12/01/2044 | | | 61,000 | | | 66,391 |
Kite Realty Group L.P., 4.00%, 10/01/2026 | | | 326,000 | | | 341,098 |
Simon Property Group L.P., 6.75%, 02/01/2040 | | | 244,000 | | | 335,169 |
| | | | | | | 742,658 |
| | |
Semiconductors–0.98% | | | | | | |
Broadcom Corp./Broadcom Cayman Finance Ltd., 3.88%, 01/15/2027 | | | 173,000 | | | 180,260 |
Broadcom, Inc., 4.11%, 09/15/2028 | | | 265,000 | | | 278,699 |
Intel Corp., 2.88%, 05/11/2024 | | | 275,000 | | | 281,594 |
Microchip Technology, Inc., 4.33%, 06/01/2023 | | | 200,000 | | | 205,790 |
QUALCOMM, Inc., 2.90%, 05/20/2024 | | | 681,000 | | | 696,192 |
Xilinx, Inc., 2.95%, 06/01/2024 | | | 300,000 | | | 305,474 |
| | | | | | | 1,948,009 |
| | |
Soft Drinks–0.26% | | | | | | |
Coca-Cola FEMSA S.A.B. de C.V. (Mexico), 2.75%, 01/22/2030 | | | 526,000 | | | 510,236 |
See accompanying Notes to Financial Statements which are an integral part of the financial statements.
11 Invesco Intermediate Bond Factor Fund
| | | | | | |
| | | Principal
Amount | | | Value |
Specialized Finance–0.27% | | | | | | |
National Rural Utilities Cooperative Finance Corp.,
3.40%, 11/15/2023 | | $ | 305,000 | | | $ 312,184 |
8.00%, 03/01/2032 | | | 148,000 | | | 207,954 |
5.25%, 04/20/2046(c) | | | 12,000 | | | 12,493 |
| | | | | | | 532,631 |
| | |
Specialty Chemicals–0.52% | | | | | | |
DuPont de Nemours, Inc., 4.49%, 11/15/2025 | | | 610,000 | | | 650,182 |
Ecolab, Inc., 5.50%, 12/08/2041 | | | 90,000 | | | 118,608 |
PPG Industries, Inc., 2.40%, 08/15/2024 | | | 261,000 | | | 263,322 |
| | | | | | | 1,032,112 |
| | |
Steel–0.14% | | | | | | |
ArcelorMittal S.A. (Luxembourg), 4.25%, 07/16/2029 | | | 240,000 | | | 246,294 |
7.00%, 10/15/2039 | | | 27,000 | | | 32,916 |
| | | | | | | 279,210 |
| | |
Systems Software–1.20% | | | | | | |
Microsoft Corp.,
2.88%, 02/06/2024 | | | 295,000 | | | 302,236 |
2.70%, 02/12/2025(b) | | | 647,000 | | | 666,094 |
3.13%, 11/03/2025 | | | 425,000 | | | 442,786 |
3.95%, 08/08/2056 | | | 406,000 | | | 458,495 |
Oracle Corp., 2.50%, 04/01/2025 | | | 500,000 | | | 499,561 |
| | | | | | | 2,369,172 |
|
Technology Hardware, Storage & Peripherals–1.33% |
Apple, Inc.,
3.00%, 02/09/2024 | | | 379,000 | | | 388,355 |
1.13%, 05/11/2025 | | | 500,000 | | | 487,821 |
3.25%, 02/23/2026 | | | 355,000 | | | 370,878 |
4.45%, 05/06/2044 | | | 476,000 | | | 556,100 |
4.65%, 02/23/2046 | | | 220,000 | | | 267,400 |
Hewlett Packard Enterprise Co., 6.35%, 10/15/2045 | | | 220,000 | | | 262,866 |
HP, Inc., 6.00%, 09/15/2041(b) | | | 245,000 | | | 293,231 |
| | | | | | | 2,626,651 |
| | |
Tobacco–2.15% | | | | | | |
Altria Group, Inc.,
4.80%, 02/14/2029 | | | 353,000 | | | 381,772 |
3.40%, 05/06/2030 | | | 460,000 | | | 453,212 |
2.45%, 02/04/2032 | | | 300,000 | | | 268,084 |
4.50%, 05/02/2043 | | | 557,000 | | | 521,460 |
3.88%, 09/16/2046 | | | 225,000 | | | 193,774 |
5.95%, 02/14/2049 | | | 41,000 | | | 45,642 |
BAT Capital Corp. (United Kingdom), 3.22%, 08/15/2024 | | | 200,000 | | | 202,536 |
3.56%, 08/15/2027 | | | 407,000 | | | 409,960 |
4.54%, 08/15/2047 | | | 87,000 | | | 80,484 |
4.76%, 09/06/2049 | | | 35,000 | | | 33,196 |
Philip Morris International, Inc., 6.38%, 05/16/2038 | | | 280,000 | | | 362,120 |
4.50%, 03/20/2042 | | | 418,000 | | | 436,499 |
| | | | | | |
| | | Principal
Amount | | | Value |
Tobacco–(continued) | | | | | | |
Reynolds American, Inc. (United Kingdom),
5.70%, 08/15/2035 | | $ | 256,000 | | | $ 280,128 |
5.85%, 08/15/2045 | | | 545,000 | | | 590,835 |
| | | | | | | 4,259,702 |
|
Trading Companies & Distributors–0.27% |
Air Lease Corp., 3.00%, 02/01/2030 | | | 560,000 | | | 535,392 |
| | |
Water Utilities–0.15% | | | | | | |
American Water Capital Corp.,
3.85%, 03/01/2024 | | | 174,000 | | | 179,954 |
6.59%, 10/15/2037 | | | 84,000 | | | 113,616 |
| | | | | | | 293,570 |
|
Wireless Telecommunication Services–0.26% |
America Movil S.A.B. de C.V. (Mexico), 6.38%, 03/01/2035 | | | 400,000 | | | 517,087 |
Total U.S. Dollar Denominated Bonds & Notes (Cost $92,290,189) | | | | | | 89,919,189 |
|
U.S. Treasury Securities–29.63% |
U.S. Treasury Bills–0.19% | | | | | | |
0.41%, 05/26/2022(f)(g) | | | 376,000 | | | 375,724 |
| | |
U.S. Treasury Bonds–2.07% | | | | | | |
2.00%, 11/15/2041 | | | 900,000 | | | 861,890 |
2.38%, 11/15/2049 | | | 1,037,600 | | | 1,076,186 |
2.00%, 02/15/2050 | | | 2,250,000 | | | 2,155,342 |
| | | | | | | 4,093,418 |
| | |
U.S. Treasury Notes–27.37% | | | | | | |
0.13%, 07/31/2022 | | | 2,535,000 | | | 2,529,904 |
0.13%, 01/31/2023 | | | 1,750,000 | | | 1,735,040 |
1.38%, 02/15/2023 | | | 563,000 | | | 564,588 |
0.50%, 11/30/2023 | | | 5,000,000 | | | 4,921,094 |
0.88%, 01/31/2024 | | | 9,300,000 | | | 9,200,098 |
1.38%, 01/31/2025 | | | 8,521,000 | | | 8,460,421 |
1.13%, 02/28/2025 | | | 3,577,000 | | | 3,523,624 |
0.75%, 03/31/2026 | | | 3,900,000 | | | 3,748,875 |
1.50%, 08/15/2026 | | | 5,980,000 | | | 5,916,930 |
1.50%, 01/31/2027 | | | 8,215,500 | | | 8,119,866 |
0.50%, 06/30/2027 | | | 2,100,000 | | | 1,965,633 |
1.38%, 10/31/2028 | | | 2,650,000 | | | 2,574,537 |
1.38%, 11/15/2031 | | | 1,000,000 | | | 958,828 |
| | | | | | | 54,219,438 |
Total U.S. Treasury Securities (Cost $60,004,230) | | | 58,688,580 |
|
U.S. Government Sponsored Agency Mortgage-Backed Securities–25.78% |
Collateralized Mortgage Obligations–0.29% | | | |
Fannie Mae ACES, IO, 0.19%, 12/25/2022(h) | | | 9,897,324 | | | 5,216 |
Fannie Mae REMICs, IO,
3.50%, 08/25/2035(i) | | | 277,120 | | | 34,802 |
5.50%, 07/25/2046(i) | | | 75,835 | | | 12,141 |
4.00%, 08/25/2047(i) | | | 53,496 | | | 7,011 |
5.00% (5.90% - (1.00 x 1 mo. USD LIBOR)), 09/25/2047(i)(j) | | | 682,691 | | | 123,723 |
See accompanying Notes to Financial Statements which are an integral part of the financial statements.
12 Invesco Intermediate Bond Factor Fund
| | | | | | | | | | |
| | | | | | Principal
Amount | | | Value |
Collateralized Mortgage Obligations–(continued) |
Freddie Mac Multifamily Structured Pass-Through Ctfs.,
Series KC03, Class X1, IO, 0.63%, 11/25/2024(h) | | | | | | $ | 4,152,066 | | | $48,251 |
Series K734, Class X1, IO, 0.65%, 02/25/2026(h) | | | | | | | 3,041,202 | | | 66,703 |
Series K735, Class X1, IO, 1.10%, 05/25/2026(h) | | | | | | | 3,057,046 | | | 107,255 |
Series K093, Class X1, IO, 0.95%, 05/25/2029(h) | | | | | | | 2,546,741 | | | 151,906 |
Freddie Mac REMICs, IO, 5.91%(6.10% - (1.00 x 1 mo. USD LIBOR)), 01/15/2044(i)(j) | | | | | | | 150,620 | | | 18,422 |
Freddie Mac STRIPS, IO, 3.00%, 12/15/2027(i) | | | | | | | 72,539 | | | 3,651 |
| | | | | | | | | | | 579,081 |
|
Federal Home Loan Mortgage Corp. (FHLMC)–3.18% |
4.50%, 09/01/2049 to 01/01/2050 | | | | | | | 326,573 | | | 345,598 |
3.00%, 01/01/2050 to 05/01/2050 | | | | | | | 2,877,046 | | | 2,941,625 |
2.50%, 07/01/2050 to 08/01/2050 | | | | | | | 3,021,472 | | | 2,999,947 |
| | | | | | | | | | | 6,287,170 |
|
Federal National Mortgage Association (FNMA)–3.51% |
4.50%, 06/01/2049 | | | | | | | 145,796 | | | 153,829 |
3.00%, 10/01/2049 to 11/01/2051 | | | | | | | 2,330,806 | | | 2,369,442 |
2.50%, 03/01/2050 to 08/01/2051 | | | | | | | 1,952,825 | | | 1,935,681 |
2.00%, 03/01/2051 to 08/01/2051 | | | | | | | 2,599,037 | | | 2,499,829 |
| | | | | | | | | | | 6,958,781 |
|
Government National Mortgage Association (GNMA)–0.03% |
IO, | | | | | | | | | | |
6.07% (6.20% - (1.00 x 1 mo. USD LIBOR)), 10/16/2047(i)(j) | | | | | | | 332,758 | | | 54,929 |
|
Uniform Mortgage-Backed Securities–18.77% |
TBA, | | | | | | | | | | |
1.50%, 03/01/2037(k) | | | | | | | 1,064,000 | | | 1,035,405 |
2.00%, 03/01/2037 to 03/01/2052(k) | | | | | | | 13,032,000 | | | 12,644,402 |
2.50%, 03/01/2037 to 03/01/2052(k) | | | | | | | 16,750,000 | | | 16,545,720 |
3.00%, 03/01/2052(k) | | | | | | | 5,742,000 | | | 5,799,868 |
3.50%, 03/01/2052(k) | | | | | | | 1,125,000 | | | 1,158,662 |
| | | | | | | | | | | 37,184,057 |
Total U.S. Government Sponsored Agency Mortgage-Backed Securities (Cost $51,900,260) | | | 51,064,018 |
|
Non-U.S. Dollar Denominated Bonds & Notes–10.70%(l) |
Sovereign Debt–10.70% | | | | | | | | | | |
Australia Government Bond (Australia), Series 142, 4.25%, 04/21/2026(e) | | | AUD | | | | 1,785,000 | | | 1,426,653 |
Series 155, 2.50%, 05/21/2030(e) | | | AUD | | | | 1,086,000 | | | 814,739 |
Bundesobligation (Germany), Series 183, 0.01%, 04/10/2026(e) | | | EUR | | | | 3,068,000 | | | 3,474,697 |
| | | | | | | | | | |
| | | | | | Principal
Amount | | | Value |
Sovereign Debt–(continued) |
Bundesrepublik Deutschland Bundesanleihe (Germany), 0.01%, 02/15/2031(e) | | | EUR | | | | 1,138,000 | | | $ 1,266,416 |
Canadian Government Bond (Canada),
0.50%, 09/01/2025 | | | CAD | | | | 2,544,000 | | | 1,933,715 |
0.50%, 12/01/2030 | | | CAD | | | | 1,357,000 | | | 958,557 |
Norway Government Bond (Norway),
Series 477, 1.75%, 03/13/2025(e) | | | NOK | | | | 34,790,000 | | | 3,934,706 |
Series 482, 1.38%, 08/19/2030(e) | | | NOK | | | | 15,811,000 | | | 1,705,191 |
Sweden Government Bond (Sweden),
Series 1058, 2.50%, 05/12/2025 | | | SEK | | | | 12,275,000 | | | 1,389,606 |
Series 1061, 0.75%, 11/12/2029(e) | | | SEK | | | | 6,480,000 | | | 697,707 |
Swiss Confederation Government Bond (Switzerland), | | | | | | | | | | |
1.25%, 06/11/2024(e) | | | CHF | | | | 2,167,000 | | | 2,453,972 |
0.50%, 05/27/2030(e) | | | CHF | | | | 989,000 | | | 1,110,212 |
United Kingdom Gilt (United Kingdom), | | | | | | | | | | |
0.13%, 01/30/2026(e) | | | GBP | | | | 11,637 | | | 15,062 |
0.25%, 07/31/2031(e) | | | GBP | | | | 5,441 | | | 6,561 |
Total Non-U.S. Dollar Denominated Bonds & Notes (Cost $21,703,388) | | | | | | | | | | 21,187,794 |
|
Asset-Backed Securities–0.21% |
Banc of America Mortgage Trust, Series 2007-1, Class 1A24,
6.00%, 03/25/2037 | | | | | | $ | 13,365 | | | 12,500 |
Bank, Series 2019-BNK16, Class XA, IO, 0.94%, 02/15/2052(h) | | | | | | | 2,321,227 | | | 124,857 |
Citigroup Commercial Mortgage Trust,
Series 2017-C4, Class XA, IO, 1.08%, 10/12/2050(h) | | | | | | | 6,100,403 | | | 254,411 |
WaMu Mortgage Pass-Through Ctfs. Trust,
Series 2005-AR14, Class 1A4, 2.83%, 12/25/2035(m) | | | | | | | 22,371 | | | 22,690 |
Total Asset-Backed Securities (Cost $458,355) | | | 414,458 |
Total U.S. Government Sponsored Agency Mortgage-Backed Securities (Cost $51,900,260) | | | 51,064,018 |
| | | |
| | | | | | Shares | | | |
|
Money Market Funds–6.13% |
Invesco Government & Agency Portfolio, Institutional Class,
0.03%(n)(o) | | | | 4,218,297 | | | 4,218,297 |
Invesco Liquid Assets Portfolio, Institutional Class,
0.01%(n)(o) | | | | | | | 3,100,868 | | | 3,100,868 |
Invesco Treasury Portfolio, Institutional Class,
0.01%(n)(o) | | | | | | | 4,820,910 | | | 4,820,910 |
Total Money Market Funds (Cost $12,140,104) | | | | | | | | | | 12,140,075 |
TOTAL INVESTMENTS IN SECURITIES
(excluding investments purchased with cash collateral from securities on loan)-117.84% (Cost $238,496,526) | | | | | | | 233,414,114 |
|
Investments Purchased with Cash Collateral from Securities on Loan |
|
Money Market Funds–1.01% |
Invesco Private Government Fund, 0.12%(n)(o)(p) | | | | | | | 600,824 | | | 600,824 |
See accompanying Notes to Financial Statements which are an integral part of the financial statements.
13 Invesco Intermediate Bond Factor Fund
| | | | | | | | |
| | | Shares | | | Value | |
|
Money Market Funds–(continued) | | | | | | | | |
Invesco Private Prime Fund, 0.08%(n)(o)(p) | | | 1,401,783 | | | $ | 1,401,923 | |
|
Total Investments Purchased with Cash Collateral from Securities on Loan (Cost $2,002,947) | | | | 2,002,747 | |
|
TOTAL INVESTMENTS IN SECURITIES–118.85%
(Cost $240,499,473) | | | | 235,416,861 | |
|
OTHER ASSETS LESS LIABILITIES–(18.85)% | | | | (37,333,747 | ) |
|
NET ASSETS–100.00% | | | $ | 198,083,114 | |
|
| | |
| Investment Abbreviations: |
| |
| ACES | | – Automatically Convertible Extendable Security |
| AUD | | – Australian Dollar |
| CAD | | – Canadian Dollar |
| CHF | | – Swiss Franc |
| Ctfs. | | – Certificates |
| EUR | | – Euro |
| GBP | | – British Pound Sterling |
| IO | | – Interest Only |
| LIBOR | | – London Interbank Offered Rate |
| NOK | | – Norwegian Krone |
| REIT | | – Real Estate Investment Trust |
| REMICs | | – Real Estate Mortgage Investment Conduits |
| SEK | | – Swedish Krona |
| STRIPS | | – Separately Traded Registered Interest and Principal Security |
| TBA | | – To Be Announced |
| USD | | – U.S. Dollar |
Notes to Schedule of Investments:
| (a) | Industry and/or sector classifications used in this report are generally according to the Global Industry Classification Standard, which was developed by and is the exclusive property and a service mark of MSCI Inc. and Standard & Poor’s. |
| (b) | All or a portion of this security was out on loan at February 28, 2022. |
| (c) | Security issued at a fixed rate for a specific period of time, after which it will convert to a variable rate. |
| (d) | Perpetual bond with no specified maturity date. |
| (e) | Security purchased or received in a transaction exempt from registration under the Securities Act of 1933, as amended (the “1933 Act”). The security may be resold pursuant to an exemption from registration under the 1933 Act, typically to qualified institutional buyers. The aggregate value of these securities at February 28, 2022 was $19,541,302, which represented 9.87% of the Fund’s Net Assets. |
| (f) | All or a portion of the value was pledged as collateral to cover margin requirements for open futures contracts. See Note 1L. |
| (g) | Security traded on a discount basis. The interest rate shown represents the discount rate at the time of purchase by the Fund. |
| (h) | Interest only security. Principal amount shown is the notional principal and does not reflect the maturity value of the security. Interest rate is redetermined periodically based on the cash flows generated by the pool of assets backing the security, less any applicable fees. The rate shown is the rate in effect on February 28, 2022. |
| (i) | Interest only security. Principal amount shown is the notional principal and does not reflect the maturity value of the security. |
| (j) | Interest or dividend rate is redetermined periodically. Rate shown is the rate in effect on February 28, 2022. |
| (k) | Security purchased on a forward commitment basis. This security is subject to dollar roll transactions. See Note 1M. |
| (l) | Foreign denominated security. Principal amount is denominated in the currency indicated. |
| (m) | Interest rate is redetermined periodically based on the cash flows generated by the pool of assets backing the security, less any applicable fees. The rate shown is the rate in effect on February 28, 2022. |
| (n) | Affiliated issuer. The issuer and/or the Fund is a wholly-owned subsidiary of Invesco Ltd., or is affiliated by having an investment adviser that is under common control of Invesco Ltd. The table below shows the Fund’s transactions in, and earnings from, its investments in affiliates for the fiscal year ended February 28, 2022. |
| | | | | | | | | | | | | | | | | | | | | | | | | | | | |
| | | | | | | | | | | | Change in | | | | | | | | | | |
| | | | | | | | | | | | Unrealized | | | Realized | | | | | | | |
| | | Value | | | Purchases | | | Proceeds | | | Appreciation | | | Gain | | | Value | | | | |
| | | February 28, 2021 | | | at Cost | | | from Sales | | | (Depreciation) | | | (Loss) | | | February 28, 2022 | | | Dividend Income | |
Investments in Affiliated Money Market Funds: | | | | | | | | | | | | | | | | | | | | | | | | | | | | |
Invesco Government & Agency Portfolio, | | | | | | | | | | | | | | | | | | | | | | | | | | | | |
Institutional Class | | | $ 554,525 | | | | $24,832,173 | | | | $(21,168,401) | | | | $ - | | | | $ - | | | | $ 4,218,297 | | | | $ 245 | |
Invesco Liquid Assets Portfolio, Institutional Class | | | 396,028 | | | | 17,737,264 | | | | (15,031,920) | | | | (29) | | | | (475) | | | | 3,100,868 | | | | 92 | |
Invesco Treasury Portfolio, Institutional Class | | | 633,743 | | | | 28,379,625 | | | | (24,192,458) | | | | - | | | | - | | | | 4,820,910 | | | | 117 | |
See accompanying Notes to Financial Statements which are an integral part of the financial statements.
14 Invesco Intermediate Bond Factor Fund
| | | | | | | | | | | | | | | | | | | | | | | | | | | | | | | | | | | |
| | | Value February 28, 2021 | | Purchases at Cost | | Proceeds from Sales | | Change in Unrealized Appreciation (Depreciation) | | Realized Gain (Loss) | | Value February 28, 2022 | | Dividend Income |
| Investments Purchased with Cash Collateral from Securities on Loan: | | | | | | | | | | | | | | | | | | | | | | | | | | | | | | | | | | | |
| Invesco Private Government Fund | | | $ | - | | | | $ | 3,400,124 | | | | $ | (2,799,300 | ) | | | $ | - | | | | $ | - | | | | $ | 600,824 | | | | $ | 71 | * |
| Invesco Private Prime Fund | | | | - | | | | | 6,684,194 | | | | | (5,281,800 | ) | | | | (200 | ) | | | | (271 | ) | | | | 1,401,923 | | | | | 518 | * |
Total | | | $ | 1,584,296 | | | | $ | 81,033,380 | | | | $ | (68,473,879 | ) | | | $ | (229 | ) | | | $ | (746 | ) | | | $ | 14,142,822 | | | | $ | 1,043 | |
| | * | Represents the income earned on the investment of cash collateral, which is included in securities lending income on the Statement of Operations. Does not include rebates and fees paid to lending agent or premiums received from borrowers, if any. |
| (o) | The rate shown is the 7-day SEC standardized yield as of February 28, 2022. |
| (p) | The security has been segregated to satisfy the commitment to return the cash collateral received in securities lending transactions upon the borrower’s return of the securities loaned. See Note 1I. |
| | | | | | | | | | | | | | | | | | |
| Open Futures Contracts |
| Long Futures Contracts | | Number of
Contracts | | | Expiration Month | | | Notional
Value | | | Value | | | Unrealized
Appreciation
(Depreciation) |
Interest Rate Risk | | | | | | | | | | | | | | | | | | |
U.S. Treasury 10 Year Notes | | | 7 | | | | June-2022 | | | $ | 892,063 | | | $ | 7,547 | | | $ 7,547 |
U.S. Treasury 10 Year Ultra Notes | | | 9 | | | | June-2022 | | | | 1,271,953 | | | | 14,775 | | | 14,775 |
U.S. Treasury Long Bonds | | | 10 | | | | June-2022 | | | | 1,566,875 | | | | 23,516 | | | 23,516 |
U.S. Treasury Ultra Bonds | | | 52 | | | | June-2022 | | | | 9,668,750 | | | | 114,969 | | | 114,969 |
Subtotal–Long Futures Contracts | | | | | | | | | | | | | | | 160,807 | | | 160,807 |
| | | | | |
Short Futures Contracts | | | | | | | | | | | | | | | | | | |
Interest Rate Risk | | | | | | | | | | | | | | | | | | |
U.S. Treasury 2 Year Notes | | | 39 | | | | June-2022 | | | | (8,393,836 | ) | | | (28,641 | ) | | (28,641) |
U.S. Treasury 5 Year Notes | | | 160 | | | | June-2022 | | | | (18,925,000 | ) | | | (146,477 | ) | | (146,477) |
Subtotal–Short Futures Contracts | | | | | | | | | | | | | | | (175,118 | ) | | (175,118) |
Total Futures Contracts | | | | | | | | | | | | | | $ | | (14,311) | | $ (14,311) |
| | | | | | | | | | | | | | | | | | | | | | | | |
| Open Forward Foreign Currency Contracts |
Settlement
Date | | | | Counterparty | | | | | | | Unrealized
Appreciation
(Depreciation) |
| | | | Contract to | |
| | | | | | | Deliver | | | | | | Receive | |
Currency Risk | | | | | | | | | | | | | | | | | | | | | | |
03/16/2022 | | | | Bank of America, N.A. | | | | | AUD | | | | 3,273,000 | | | | USD | | | | 2,431,642 | | | $ 54,015 |
03/16/2022 | | | | Bank of America, N.A. | | | | | GBP | | | | 1,334,913 | | | | USD | | | | 1,810,599 | | | 19,599 |
03/16/2022 | | | | Bank of America, N.A. | | | | | NOK | | | | 806 | | | | USD | | | | 93 | | | 1 |
03/16/2022 | | | | Bank of America, N.A. | | | | | SEK | | | | 20,419,820 | | | | USD | | | | 2,385,839 | | | 229,284 |
03/16/2022 | | | | Bank of America, N.A. | | | | | USD | | | | 60,576 | | | | AUD | | | | 85,000 | | | 1,171 |
03/16/2022 | | | | Barclays Bank PLC | | | | | USD | | | | 76,910 | | | | CHF | | | | 71,000 | | | 556 |
03/16/2022 | | | | Barclays Bank PLC | | | | | USD | | | | 81,829 | | | | NOK | | | | 723,000 | | | 176 |
03/16/2022 | | | | BNP Paribas S.A. | | | | | EUR | | | | 2,615,564 | | | | USD | | | | 2,960,854 | | | 26,514 |
03/16/2022 | | | | Deutsche Bank AG | | | | | NOK | | | | 1,768,362 | | | | USD | | | | 207,458 | | | 6,884 |
03/16/2022 | | | | Deutsche Bank AG | | | | | USD | | | | 3,052,966 | | | | CHF | | | | 2,803,522 | | | 5,843 |
03/16/2022 | | | | Goldman Sachs International | | | | | CAD | | | | 6,093,553 | | | | USD | | | | 4,895,319 | | | 87,472 |
03/16/2022 | | | | Goldman Sachs International | | | | | USD | | | | 2,581,097 | | | | CAD | | | | 3,282,107 | | | 8,504 |
03/16/2022 | | | | Morgan Stanley and Co. International PLC | | | | | CHF | | | | 2,545,433 | | | | USD | | | | 2,797,717 | | | 20,500 |
03/16/2022 | | | | Morgan Stanley and Co. International PLC | | | | | EUR | | | | 1,667,000 | | | | USD | | | | 1,937,815 | | | 67,647 |
03/16/2022 | | | | Morgan Stanley and Co. International PLC | | | | | NOK | | | | 60,288,802 | | | | USD | | | | 7,075,251 | | | 237,057 |
03/16/2022 | | | | Morgan Stanley and Co. International PLC | | | | | USD | | | | 36,617 | | | | AUD | | | | 51,506 | | | 799 |
03/16/2022 | | | | UBS AG | | | | | CHF | | | | 3,648,374 | | | | USD | | | | 3,992,212 | | | 11,620 |
Subtotal–Appreciation | | | | | | | | | | | | | | | | | | 777,642 |
See accompanying Notes to Financial Statements which are an integral part of the financial statements.
15 Invesco Intermediate Bond Factor Fund
| | | | | | | | | | | | | | | | | | | | | | | | |
| Open Forward Foreign Currency Contracts-(continued) |
Settlement
Date | | | | Counterparty | | | | | | | Unrealized
Appreciation
(Depreciation) |
| | | | Contract to | |
| | | | | | | Deliver | | | | | | Receive | |
| | | | | | |
Currency Risk | | | | | | | | | | | | | | | | | | | | |
03/16/2022 | | | | Bank of America, N.A. | | | | | USD | | | | 1,757,752 | | | | GBP | | | | 1,295,950 | | | $(19,027) |
03/16/2022 | | | | BNP Paribas S.A. | | | | | NOK | | | | 6,820,679 | | | | USD | | | | 748,705 | | | (24,923) |
03/16/2022 | | | | BNP Paribas S.A. | | | | | USD | | | | 5,387 | | | | SEK | | | | 48,600 | | | (255) |
03/16/2022 | | | | Goldman Sachs International | | | | | USD | | | | 80,330 | | | | CAD | | | | 100,000 | | | (1,430) |
03/16/2022 | | | | J.P. Morgan Chase Bank, N.A. | | | | | USD | | | | 102,732 | | | | EUR | | | | 90,000 | | | (1,763) |
03/16/2022 | | | | Morgan Stanley and Co. International PLC | | | | | CAD | | | | 998,965 | | | | USD | | | | 779,563 | | | (8,626) |
03/16/2022 | | | | Morgan Stanley and Co. International PLC | | | | | USD | | | | 54,960 | | | | CHF | | | | 50,000 | | | (407) |
03/16/2022 | | | | Morgan Stanley and Co. International PLC | | | | | USD | | | | 2,106,930 | | | | NOK | | | | 17,953,326 | | | (70,592) |
03/16/2022 | | | | UBS AG | | | | | USD | | | | 53,330 | | | | SEK | | | | 488,000 | | | (1,792) |
Subtotal–Depreciation | | | | | | | | | | | | | | | | | | (128,815) |
Total Forward Foreign Currency Contracts | | | | | | | | | | | | | | | | | | $648,827 |
| | |
| Abbreviations: |
| |
| AUD | | - Australian Dollar |
| CAD | | - Canadian Dollar |
| CHF | | - Swiss Franc |
| EUR | | - Euro |
| GBP | | - British Pound Sterling |
| NOK | | - Norwegian Krone |
| SEK | | - Swedish Krona |
| USD | | - U.S. Dollar |
See accompanying Notes to Financial Statements which are an integral part of the financial statements.
16 Invesco Intermediate Bond Factor Fund
Statement of Assets and Liabilities
February 28, 2022
| | | | |
Assets: | | | | |
Investments in unaffiliated securities, at value
(Cost $ 226,356,422)* | | $ | 221,274,039 | |
Investments in affiliated money market funds, at value
(Cost $ 14,143,051) | | | 14,142,822 | |
Other investments: | | | | |
Variation margin receivable – futures contracts | | | 87,130 | |
Unrealized appreciation on forward foreign currency contracts outstanding | | | 777,642 | |
Cash | | | 549,951 | |
Foreign currencies, at value and cost | | | 63 | |
Receivable for: | | | | |
Fund shares sold | | | 599,289 | |
Dividends | | | 263 | |
Interest | | | 1,281,753 | |
Investment for trustee deferred compensation and retirement plans | | | 36,988 | |
Other assets | | | 24,623 | |
Total assets | | | 238,774,563 | |
| |
Liabilities: | | | | |
Other investments: | | | | |
Unrealized depreciation on forward foreign currency contracts outstanding | | | 128,815 | |
Payable for: | | | | |
Investments purchased | | | 37,409,153 | |
Dividends | | | 20,155 | |
Fund shares reacquired | | | 878,916 | |
Collateral upon return of securities loaned | | | 2,002,947 | |
Accrued fees to affiliates | | | 86,917 | |
Accrued trustees’ and officers’ fees and benefits | | | 3,250 | |
Accrued other operating expenses | | | 124,308 | |
Trustee deferred compensation and retirement plans | | | 36,988 | |
Total liabilities | | | 40,691,449 | |
Net assets applicable to shares outstanding | | $ | 198,083,114 | |
| | | | |
Net assets consist of: | | | | |
Shares of beneficial interest | | $ | 205,324,288 | |
Distributable earnings (loss) | | | (7,241,174 | ) |
| | | $ | 198,083,114 | |
| |
Net Assets: | | | | |
Class A | | $ | 118,156,363 | |
Class C | | $ | 14,724,215 | |
Class R | | $ | 18,986,847 | |
Class Y | | $ | 29,184,185 | |
Class R5 | | $ | 9,786 | |
Class R6 | | $ | 17,021,718 | |
| |
Shares outstanding, no par value, with an unlimited number of shares authorized: | | | | |
Class A | | | 11,310,021 | |
Class C | | | 1,409,278 | |
Class R | | | 1,816,082 | |
Class Y | | | 2,795,943 | |
Class R5 | | | 937 | |
Class R6 | | | 1,630,114 | |
Class A: | | | | |
Net asset value per share | | $ | 10.45 | |
Maximum offering price per share
(Net asset value of $10.45 ÷ 95.75%) | | $ | 10.91 | |
Class C: | | | | |
Net asset value and offering price per share | | $ | 10.45 | |
Class R: | | | | |
Net asset value and offering price per share | | $ | 10.45 | |
Class Y: | | | | |
Net asset value and offering price per share | | $ | 10.44 | |
Class R5: | | | | |
Net asset value and offering price per share | | $ | 10.44 | |
Class R6: | | | | |
Net asset value and offering price per share | | $ | 10.44 | |
| * | At February 28, 2022, securities with an aggregate value of $1,950,932 were on loan to brokers. |
See accompanying Notes to Financial Statements which are an integral part of the financial statements.
17 Invesco Intermediate Bond Factor Fund
Statement of Operations
For the year ended February 28, 2022
| | | | |
Investment income: | | | | |
Interest (net of foreign withholding taxes of $1,455) | | $ | 3,358,360 | |
| |
Dividends from affiliated money market funds (includes securities lending income of $676) | | | 1,130 | |
| |
Total investment income | | | 3,359,490 | |
| |
| |
Expenses: | | | | |
Advisory fees | | | 493,512 | |
| |
Administrative services fees | | | 27,338 | |
| |
Distribution fees: | | | | |
Class A | | | 307,354 | |
| |
Class C | | | 170,796 | |
| |
Class R | | | 97,952 | |
| |
Transfer agent fees - A, C, R and Y | | | 219,412 | |
| |
Transfer agent fees - R5 | | | 2 | |
| |
Transfer agent fees - R6 | | | 3,321 | |
| |
Trustees’ and officers’ fees and benefits | | | 24,812 | |
| |
Registration and filing fees | | | 92,019 | |
| |
Professional services fees | | | 60,770 | |
| |
Other | | | (15,232 | ) |
| |
Total expenses | | | 1,482,056 | |
| |
Less: Fees waived, expenses reimbursed and/or expense offset arrangement(s) | | | (364,200 | ) |
| |
Net expenses | | | 1,117,856 | |
| |
Net investment income | | | 2,241,634 | |
| |
| |
Realized and unrealized gain (loss) from: | | | | |
Net realized gain (loss) from: | | | | |
Unaffiliated investment securities | | | (895,508 | ) |
| |
Affiliated investment securities | | | (746 | ) |
| |
Foreign currencies | | | (9,627 | ) |
| |
Forward foreign currency contracts | | | 398,817 | |
| |
Futures contracts | | | 747,241 | |
| |
| | | 240,177 | |
| |
Change in net unrealized appreciation (depreciation) of: | | | | |
Unaffiliated investment securities | | | (8,623,249 | ) |
| |
Affiliated investment securities | | | (229 | ) |
| |
Foreign currencies | | | (4,807 | ) |
| |
Forward foreign currency contracts | | | 447,598 | |
| |
Futures contracts | | | (193,744 | ) |
| |
| | | (8,374,431 | ) |
| |
Net realized and unrealized gain (loss) | | | (8,134,254 | ) |
| |
Net increase (decrease) in net assets resulting from operations | | $ | (5,892,620 | ) |
| |
See accompanying Notes to Financial Statements which are an integral part of the financial statements.
18 Invesco Intermediate Bond Factor Fund
Statement of Changes in Net Assets
For the years ended February 28, 2022 and 2021
| | | | | | | | |
| | | 2022 | | | 2021 | |
| |
Operations: | |
Net investment income | | $ | 2,241,634 | | | $ | 2,657,103 | |
| |
Net realized gain | | | 240,177 | | | | 6,948,203 | |
| |
Change in net unrealized appreciation (depreciation) | | | (8,374,431 | ) | | | (5,435,020 | ) |
| |
Net increase (decrease) in net assets resulting from operations | | | (5,892,620 | ) | | | 4,170,286 | |
| |
|
Distributions to shareholders from distributable earnings: | |
Class A | | | (2,087,511 | ) | | | (6,950,181 | ) |
| |
Class C | | | (151,868 | ) | | | (1,035,568 | ) |
| |
Class R | | | (274,295 | ) | | | (980,705 | ) |
| |
Class Y | | | (388,273 | ) | | | (1,024,796 | ) |
| |
Class R5 | | | (193 | ) | | | (596 | ) |
| |
Class R6 | | | (266,034 | ) | | | (431,934 | ) |
| |
Total distributions from distributable earnings | | | (3,168,174 | ) | | | (10,423,780 | ) |
| |
|
Share transactions–net: | |
Class A | | | (9,215,388 | ) | | | 14,644,016 | |
| |
Class C | | | (3,582,815 | ) | | | (3,458,732 | ) |
| |
Class R | | | 27,745 | | | | 132,575 | |
| |
Class Y | | | 12,656,401 | | | | (697,837 | ) |
| |
Class R6 | | | 9,362,612 | | | | 2,840,209 | |
| |
Net increase in net assets resulting from share transactions | | | 9,248,555 | | | | 13,460,231 | |
| |
Net increase in net assets | | | 187,761 | | | | 7,206,737 | |
| |
|
Net assets: | |
Beginning of year | | | 197,895,353 | | | | 190,688,616 | |
| |
End of year | | $ | 198,083,114 | | | $ | 197,895,353 | |
| |
See accompanying Notes to Financial Statements which are an integral part of the financial statements.
19 Invesco Intermediate Bond Factor Fund
Financial Highlights
The following schedule presents financial highlights for a share of the Fund outstanding throughout the periods indicated.
| | | | | | | | | | | | | | | | | | | | | | | | | | | | | | | | | | | | | | | | | | | | | | | | | | | | | | | | | | | | | | | | | | | | | | |
| | | Net asset value,
beginning of period | | Net
investment
income(a) | | Net gains
(losses) on securities
(both
realized and unrealized) | | Total from
investment
operations | | Dividends
from net
investment
income | | Distributions
from net
realized
gains | | Total
distributions | | Net asset
value, end
of period | | Total
return(b) | | Net assets,
end of period
(000’s omitted) | | Ratio of
expenses
to average
net assets
with fee waivers
and/or
expenses
absorbed | | Ratio of
expenses
to average net
assets without
fee waivers and/or expenses absorbed(c) | | Ratio of net
investment
income to average net assets | | Portfolio turnover (d) |
Class A | | | | | | | | | | | | | | | | | | | | | | | | | | | | | | | | | | | | | | | | | | | | | | | | | | | | | | | | | | | | | | | | | | | | | | |
Year ended 02/28/22 | | | $ | 10.93 | | | | $ | 0.13 | | | | $ | (0.43 | ) | | | $ | (0.30 | ) | | | $ | (0.18 | ) | | | $ | - | | | | $ | (0.18 | ) | | | $ | 10.45 | | | | | (2.80 | )%(e) | | | $ | 118,156 | | | | | 0.52 | %(e) | | | | 0.71 | %(e) | | | | 1.18 | %(e) | | | | 207 | % |
Year ended 02/28/21 | | | | 11.27 | | | | | 0.16 | | | | | 0.10 | | | | | 0.26 | | | | | (0.21 | ) | | | | (0.39 | ) | | | | (0.60 | ) | | | | 10.93 | | | | | 2.30 | (e) | | | | 132,856 | | | | | 0.52 | (e) | | | | 0.96 | (e) | | | | 1.42 | (e) | | | | 292 | |
Seven months ended 02/29/20 | | | | 10.88 | | | | | 0.18 | | | | | 0.40 | | | | | 0.58 | | | | | (0.19 | ) | | | | - | | | | | (0.19 | ) | | | | 11.27 | | | | | 5.39 | | | | | 122,371 | | | | | 1.05 | (f) | | | | 1.05 | (f) | | | | 2.80 | (f) | | | | 64 | |
Year ended 07/31/19 | | | | 10.43 | | | | | 0.32 | | | | | 0.45 | | | | | 0.77 | | | | | (0.32 | ) | | | | - | | | | | (0.32 | ) | | | | 10.88 | | | | | 7.52 | | | | | 119,300 | | | | | 0.97 | | | | | 0.97 | | | | | 3.07 | | | | | 108 | |
Year ended 07/31/18 | | | | 10.92 | | | | | 0.31 | | | | | (0.49 | ) | | | | (0.18 | ) | | | | (0.31 | ) | | | | - | | | | | (0.31 | ) | | | | 10.43 | | | | | (1.67 | ) | | | | 119,119 | | | | | 0.97 | | | | | 0.97 | | | | | 2.89 | | | | | 57 | |
Year ended 07/31/17 | | | | 11.03 | | | | | 0.29 | | | | | (0.10 | ) | | | | 0.19 | | | | | (0.30 | ) | | | | - | | | | | (0.30 | ) | | | | 10.92 | | | | | 1.82 | | | | | 129,985 | | | | | 1.00 | | | | | 1.00 | | | | | 2.68 | | | | | 80 | |
Class C | | | | | | | | | | | | | | | | | | | | | | | | | | | | | | | | | | | | | | | | | | | | | | | | | | | | | | | | | | | | | | | | | | | | | | |
Year ended 02/28/22 | | | | 10.93 | | | | | 0.05 | | | | | (0.43 | ) | | | | (0.38 | ) | | | | (0.10 | ) | | | | - | | | | | (0.10 | ) | | | | 10.45 | | | | | (3.53 | ) | | | | 14,724 | | | | | 1.27 | | | | | 1.47 | | | | | 0.43 | | | | | 207 | |
Year ended 02/28/21 | | | | 11.26 | | | | | 0.08 | | | | | 0.10 | | | | | 0.18 | | | | | (0.12 | ) | | | | (0.39 | ) | | | | (0.51 | ) | | | | 10.93 | | | | | 1.56 | | | | | 19,013 | | | | | 1.27 | | | | | 1.72 | | | | | 0.67 | | | | | 292 | |
Seven months ended 02/29/20 | | | | 10.87 | | | | | 0.12 | | | | | 0.40 | | | | | 0.52 | | | | | (0.13 | ) | | | | - | | | | | (0.13 | ) | | | | 11.26 | | | | | 4.80 | | | | | 23,114 | | | | | 1.81 | (f) | | | | 1.81 | (f) | | | | 1.90 | (f) | | | | 64 | |
Year ended 07/31/19 | | | | 10.43 | | | | | 0.23 | | | | | 0.44 | | | | | 0.67 | | | | | (0.23 | ) | | | | - | | | | | (0.23 | ) | | | | 10.87 | | | | | 6.52 | | | | | 23,487 | | | | | 1.72 | | | | | 1.72 | | | | | 2.17 | | | | | 108 | |
Year ended 07/31/18 | | | | 10.91 | | | | | 0.23 | | | | | (0.48 | ) | | | | (0.25 | ) | | | | (0.23 | ) | | | | - | | | | | (0.23 | ) | | | | 10.43 | | | | | (2.32 | ) | | | | 31,250 | | | | | 1.72 | | | | | 1.72 | | | | | 2.14 | | | | | 57 | |
Year ended 07/31/17 | | | | 11.03 | | | | | 0.21 | | | | | (0.11 | ) | | | | 0.10 | | | | | (0.22 | ) | | | | - | | | | | (0.22 | ) | | | | 10.91 | | | | | 0.97 | | | | | 33,420 | | | | | 1.75 | | | | | 1.75 | | | | | 1.92 | | | | | 80 | |
Class R | | | | | | | | | | | | | | | | | | | | | | | | | | | | | | | | | | | | | | | | | | | | | | | | | | | | | | | | | | | | | | | | | | | | | | |
Year ended 02/28/22 | | | | 10.93 | | | | | 0.10 | | | | | (0.43 | ) | | | | (0.33 | ) | | | | (0.15 | ) | | | | - | | | | | (0.15 | ) | | | | 10.45 | | | | | (3.04 | ) | | | | 18,987 | | | | | 0.77 | | | | | 0.97 | | | | | 0.93 | | | | | 207 | |
Year ended 02/28/21 | | | | 11.27 | | | | | 0.13 | | | | | 0.10 | | | | | 0.23 | | | | | (0.18 | ) | | | | (0.39 | ) | | | | (0.57 | ) | | | | 10.93 | | | | | 2.02 | | | | | 19,876 | | | | | 0.77 | | | | | 1.22 | | | | | 1.17 | | | | | 292 | |
Seven months ended 02/29/20 | | | | 10.88 | | | | | 0.15 | | | | | 0.40 | | | | | 0.55 | | | | | (0.16 | ) | | | | - | | | | | (0.16 | ) | | | | 11.27 | | | | | 5.09 | | | | | 20,366 | | | | | 1.31 | (f) | | | | 1.31 | (f) | | | | 2.40 | (f) | | | | 64 | |
Year ended 07/31/19 | | | | 10.44 | | | | | 0.28 | | | | | 0.44 | | | | | 0.72 | | | | | (0.28 | ) | | | | - | | | | | (0.28 | ) | | | | 10.88 | | | | | 7.06 | | | | | 20,511 | | | | | 1.22 | | | | | 1.22 | | | | | 2.67 | | | | | 108 | |
Year ended 07/31/18 | | | | 10.93 | | | | | 0.28 | | | | | (0.49 | ) | | | | (0.21 | ) | | | | (0.28 | ) | | | | - | | | | | (0.28 | ) | | | | 10.44 | | | | | (1.91 | ) | | | | 19,416 | | | | | 1.21 | | | | | 1.21 | | | | | 2.65 | | | | | 57 | |
Year ended 07/31/17 | | | | 11.04 | | | | | 0.26 | | | | | (0.09 | ) | | | | 0.17 | | | | | (0.28 | ) | | | | - | | | | | (0.28 | ) | | | | 10.93 | | | | | 1.58 | | | | | 15,318 | | | | | 1.25 | | | | | 1.25 | | | | | 2.45 | | | | | 80 | |
Class Y | | | | | | | | | | | | | | | | | | | | | | | | | | | | | | | | | | | | | | | | | | | | | | | | | | | | | | | | | | | | | | | | | | | | | | |
Year ended 02/28/22 | | | | 10.92 | | | | | 0.15 | | | | | (0.42 | ) | | | | (0.27 | ) | | | | (0.21 | ) | | | | - | | | | | (0.21 | ) | | | | 10.44 | | | | | (2.56 | ) | | | | 29,184 | | | | | 0.27 | | | | | 0.47 | | | | | 1.43 | | | | | 207 | |
Year ended 02/28/21 | | | | 11.26 | | | | | 0.19 | | | | | 0.10 | | | | | 0.29 | | | | | (0.24 | ) | | | | (0.39 | ) | | | | (0.63 | ) | | | | 10.92 | | | | | 2.58 | | | | | 17,750 | | | | | 0.27 | | | | | 0.72 | | | | | 1.67 | | | | | 292 | |
Seven months ended 02/29/20 | | | | 10.88 | | | | | 0.20 | | | | | 0.40 | | | | | 0.60 | | | | | (0.22 | ) | | | | - | | | | | (0.22 | ) | | | | 11.26 | | | | | 5.55 | | | | | 19,032 | | | | | 0.81 | (f) | | | | 0.81 | (f) | | | | 3.09 | (f) | | | | 64 | |
Year ended 07/31/19 | | | | 10.43 | | | | | 0.35 | | | | | 0.45 | | | | | 0.80 | | | | | (0.35 | ) | | | | - | | | | | (0.35 | ) | | | | 10.88 | | | | | 7.81 | | | | | 20,940 | | | | | 0.73 | | | | | 0.73 | | | | | 3.37 | | | | | 108 | |
Year ended 07/31/18 | | | | 10.91 | | | | | 0.33 | | | | | (0.47 | ) | | | | (0.14 | ) | | | | (0.34 | ) | | | | - | | | | | (0.34 | ) | | | | 10.43 | | | | | (1.35 | ) | | | | 27,430 | | | | | 0.72 | | | | | 0.72 | | | | | 3.14 | | | | | 57 | |
Year ended 07/31/17 | | | | 11.03 | | | | | 0.32 | | | | | (0.11 | ) | | | | 0.21 | | | | | (0.33 | ) | | | | - | | | | | (0.33 | ) | | | | 10.91 | | | | | 1.98 | | | | | 17,748 | | | | | 0.75 | | | | | 0.75 | | | | | 2.95 | | | | | 80 | |
Class R5 | | | | | | | | | | | | | | | | | | | | | | | | | | | | | | | | | | | | | | | | | | | | | | | | | | | | | | | | | | | | | | | | | | | | | | |
Year ended 02/28/22 | | | | 10.92 | | | | | 0.16 | | | | | (0.43 | ) | | | | (0.27 | ) | | | | (0.21 | ) | | | | - | | | | | (0.21 | ) | | | | 10.44 | | | | | (2.56 | ) | | | | 10 | | | | | 0.27 | | | | | 0.37 | | | | | 1.43 | | | | | 207 | |
Year ended 02/28/21 | | | | 11.27 | | | | | 0.19 | | | | | 0.09 | | | | | 0.28 | | | | | (0.24 | ) | | | | (0.39 | ) | | | | (0.63 | ) | | | | 10.92 | | | | | 2.49 | | | | | 10 | | | | | 0.27 | | | | | 0.47 | | | | | 1.67 | | | | | 292 | |
Seven months ended 02/29/20 | | | | 10.87 | | | | | 0.20 | | | | | 0.40 | | | | | 0.60 | | | | | (0.20 | ) | | | | - | | | | | (0.20 | ) | | | | 11.27 | | | | | 5.59 | | | | | 11 | | | | | 0.60 | (f) | | | | 0.60 | (f) | | | | 3.09 | (f) | | | | 64 | |
Period ended 07/31/19(g) | | | | 10.67 | | | | | 0.07 | | | | | 0.19 | | | | | 0.26 | | | | | (0.06 | ) | | | | - | | | | | (0.06 | ) | | | | 10.87 | | | | | 2.44 | | | | | 10 | | | | | 0.62 | (f) | | | | 0.62 | (f) | | | | 3.39 | (f) | | | | 108 | |
Class R6 | | | | | | | | | | | | | | | | | | | | | | | | | | | | | | | | | | | | | | | | | | | | | | | | | | | | | | | | | | | | | | | | | | | | | | |
Year ended 02/28/22 | | | | 10.92 | | | | | 0.16 | | | | | (0.43 | ) | | | | (0.27 | ) | | | | (0.21 | ) | | | | - | | | | | (0.21 | ) | | | | 10.44 | | | | | (2.56 | ) | | | | 17,022 | | | | | 0.27 | | | | | 0.37 | | | | | 1.43 | | | | | 207 | |
Year ended 02/28/21 | | | | 11.27 | | | | | 0.19 | | | | | 0.09 | | | | | 0.28 | | | | | (0.24 | ) | | | | (0.39 | ) | | | | (0.63 | ) | | | | 10.92 | | | | | 2.49 | | | | | 8,392 | | | | | 0.27 | | | | | 0.47 | | | | | 1.67 | | | | | 292 | |
Seven months ended 02/29/20 | | | | 10.88 | | | | | 0.20 | | | | | 0.40 | | | | | 0.60 | | | | | (0.21 | ) | | | | - | | | | | (0.21 | ) | | | | 11.27 | | | | | 5.60 | | | | | 5,795 | | | | | 0.58 | (f) | | | | 0.58 | (f) | | | | 3.14 | (f) | | | | 64 | |
Year ended 07/31/19 | | | | 10.44 | | | | | 0.36 | | | | | 0.43 | | | | | 0.79 | | | | | (0.35 | ) | | | | - | | | | | (0.35 | ) | | | | 10.88 | | | | | 7.80 | | | | | 5,662 | | | | | 0.56 | | | | | 0.56 | | | | | 3.41 | | | | | 108 | |
Year ended 07/31/18 | | | | 10.92 | | | | | 0.35 | | | | | (0.48 | ) | | | | (0.13 | ) | | | | (0.35 | ) | | | | - | | | | | (0.35 | ) | | | | 10.44 | | | | | (1.18 | ) | | | | 7,783 | | | | | 0.56 | | | | | 0.56 | | | | | 3.30 | | | | | 57 | |
Year ended 07/31/17 | | | | 11.03 | | | | | 0.35 | | | | | (0.11 | ) | | | | 0.24 | | | | | (0.35 | ) | | | | - | | | | | (0.35 | ) | | | | 10.92 | | | | | 2.27 | | | | | 2,189 | | | | | 0.56 | | | | | 0.56 | | | | | 3.23 | | | | | 80 | |
| (a) | Calculated using average shares outstanding. |
| (b) | Includes adjustments in accordance with accounting principles generally accepted in the United States of America and as such, the net asset value for financial reporting purposes and the returns based upon those net asset values may differ from the net asset value and returns for shareholder transactions. Does not include sales charges and is not annualized for periods less than one year, if applicable. |
| (c) | Does not include indirect expenses from affiliated fund fees and expenses of 0.02% for the seven months ended February 29, 2020 and the years ended July 31, 2019, 2018 and 2017. |
| (d) | Portfolio turnover is calculated at the fund level and is not annualized for periods less than one year, if applicable. For the seven months ended February 29, 2020, the portfolio turnover calculation excludes purchase and sale transactions of To Be Announced (TBA) mortgage-related securities of $11,531,839 and 13,476,801, respectively. For the year ended July 31, 2019, the portfolio turnover calculation excludes purchase and sale transactions of TBA mortgage-related securities of $129,169,490 and $127,412,648, respectively. |
| (e) | The total return, ratio of expenses to average net assets and ratio of net investment income to average net assets reflect actual 12b-1 fees of 0.24% for the years ended February 28, 2022 and 2021. |
| (g) | Commencement date after the close of business on May 24, 2019. |
See accompanying Notes to Financial Statements which are an integral part of the financial statements.
20 Invesco Intermediate Bond Factor Fund
Notes to Financial Statements
February 28, 2022
NOTE 1–Significant Accounting Policies
Invesco Intermediate Bond Factor Fund (the “Fund”), is a series portfolio of AIM Investment Securities Funds (Invesco Investment Securities Funds) (the “Trust”). The Trust is organized as a Delaware statutory trust and is registered under the Investment Company Act of 1940, as amended (the “1940 Act”), as an open-end series management investment company authorized to issue an unlimited number of shares of beneficial interest. Information presented in these financial statements pertains only to the Fund. Matters affecting the Fund or each class will be voted on exclusively by the shareholders of the Fund or each class.
The Fund’s investment objective is to seek total return.
Prior to February 28, 2020, the Fund sought to gain exposure to Regulation S securities primarily through investments in a wholly-owned and controlled subsidiary of the Fund organized under the laws of the Cayman Islands (the “Subsidiary”). The Subsidiary was organized by the Fund to invest in Regulation S securities. The Fund could invest up to 25% of its total assets in the Subsidiary under its previous strategy. Effective February 28, 2020, the Fund no longer invests in Regulation S securities or the Subsidiary, and the Subsidiary was liquidated. For periods prior to February 28, 2020, the Financial Highlights report the operations of the Fund and the Subsidiary on a consolidated basis.
The Fund currently consists of six different classes of shares: Class A, Class C, Class R, Class Y, Class R5 and Class R6. Class Y shares are available only to certain investors. Class A shares are sold with a front-end sales charge unless certain waiver criteria are met. Under certain circumstances, load waived shares may be subject to contingent deferred sales charges (“CDSC”). Class C shares are sold with a CDSC. Class R, Class Y, Class R5 and Class R6 shares are sold at net asset value. Class C shares held for eight years after purchase are eligible for automatic conversion into Class A shares of the same Fund (the “Conversion Feature”). The automatic conversion pursuant to the Conversion Feature will generally occur at the end of the month following the eighth anniversary after a purchase of Class C shares.
The Fund is an investment company and accordingly follows the investment company accounting and reporting guidance in accordance with Financial Accounting Standards Board Accounting Standards Codification Topic 946, Financial Services – Investment Companies.
The following is a summary of the significant accounting policies followed by the Fund in the preparation of its financial statements.
| A. | Security Valuations – Securities, including restricted securities, are valued according to the following policy. |
Debt obligations (including convertible securities) and unlisted equities are fair valued using an evaluated quote provided by an independent pricing service. Evaluated quotes provided by the pricing service may be determined without exclusive reliance on quoted prices, and may reflect appropriate factors such as institution-size trading in similar groups of securities, developments related to specific securities, dividend rate (for unlisted equities), yield (for debt obligations), quality, type of issue, coupon rate (for debt obligations), maturity (for debt obligations), individual trading characteristics and other market data. Pricing services generally value debt obligations assuming orderly transactions of institutional round lot size, but a fund may hold or transact in the same securities in smaller, odd lot sizes. Odd lots often trade at lower prices than institutional round lots. Debt obligations are subject to interest rate and credit risks. In addition, all debt obligations involve some risk of default with respect to interest and/or principal payments.
Variable rate senior loan interests are fair valued using quotes provided by an independent pricing service. Quotes provided by the pricing service may reflect appropriate factors such as ratings, tranche type, industry, company performance, spread, individual trading characteristics, institution-size trading in similar groups of securities and other market data.
A security listed or traded on an exchange (except convertible securities) is valued at its last sales price or official closing price as of the close of the customary trading session on the exchange where the security is principally traded, or lacking any sales or official closing price on a particular day, the security may be valued at the closing bid price on that day. Securities traded in the over-the-counter market are valued based on prices furnished by independent pricing services or market makers. When such securities are valued by an independent pricing service they may be considered fair valued. Futures contracts are valued at the final settlement price set by an exchange on which they are principally traded. Listed options are valued at the mean between the last bid and asked prices from the exchange on which they are principally traded. Options not listed on an exchange are valued by an independent source at the mean between the last bid and asked prices. For purposes of determining net asset value (“NAV”) per share, futures and option contracts generally are valued 15 minutes after the close of the customary trading session of the New York Stock Exchange (“NYSE”).
Investments in open-end and closed-end registered investment companies that do not trade on an exchange are valued at the end-of-day net asset value per share. Investments in open-end and closed-end registered investment companies that trade on an exchange are valued at the last sales price or official closing price as of the close of the customary trading session on the exchange where the security is principally traded.
Swap agreements are fair valued using an evaluated quote, if available, provided by an independent pricing service. Evaluated quotes provided by the pricing service are valued based on a model which may include end-of-day net present values, spreads, ratings, industry, company performance and returns of referenced assets. Centrally cleared swap agreements are valued at the daily settlement price determined by the relevant exchange or clearinghouse.
Foreign securities’ (including foreign exchange contracts) prices are converted into U.S. dollar amounts using the applicable exchange rates as of the close of the NYSE. If market quotations are available and reliable for foreign exchange-traded equity securities, the securities will be valued at the market quotations. Because trading hours for certain foreign securities end before the close of the NYSE, closing market quotations may become unreliable. If between the time trading ends on a particular security and the close of the customary trading session on the NYSE, events occur that the investment adviser determines are significant and make the closing price unreliable, the Fund may fair value the security. If the event is likely to have affected the closing price of the security, the security will be valued at fair value in good faith using procedures approved by the Board of Trustees. Adjustments to closing prices to reflect fair value may also be based on a screening process of an independent pricing service to indicate the degree of certainty, based on historical data, that the closing price in the principal market where a foreign security trades is not the current value as of the close of the NYSE. Foreign securities’ prices meeting the approved degree of certainty that the price is not reflective of current value will be priced at the indication of fair value from the independent pricing service. Multiple factors may be considered by the independent pricing service in determining adjustments to reflect fair value and may include information relating to sector indices, American Depositary Receipts and domestic and foreign index futures. Foreign securities may have additional risks including exchange rate changes, potential for sharply devalued currencies and high inflation, political and economic upheaval, the relative lack of issuer information, relatively low market liquidity and the potential lack of strict financial and accounting controls and standards.
Securities for which market prices are not provided by any of the above methods may be valued based upon quotes furnished by independent sources. The last bid price may be used to value equity securities. The mean between the last bid and asked prices is used to value debt obligations, including corporate loans.
Securities for which market quotations are not readily available or became unreliable are valued at fair value as determined in good faith by or under the supervision of the Trust’s officers following procedures approved by the Board of Trustees. Issuer specific events, market trends, bid/asked quotes of brokers and information providers and other market data may be reviewed in the course of making a good faith determination of a security’s fair value.
The Fund may invest in securities that are subject to interest rate risk, meaning the risk that the prices will generally fall as interest rates rise and, conversely, the prices will generally rise as interest rates fall. Specific securities differ in their sensitivity to changes in interest rates depending on their individual characteristics. Changes in interest rates may result in increased market volatility, which may affect the value and/or liquidity of certain Fund investments.
Valuations change in response to many factors including the historical and prospective earnings of the issuer, the value of the issuer’s assets, general market conditions which are not specifically related to the particular issuer, such as real or perceived adverse economic conditions, changes in the general outlook for revenues or corporate earnings, changes in interest or currency rates, regional or global instability, natural or environmental disasters, widespread disease or
21 Invesco Intermediate Bond Factor Fund
other public health issues, war, acts of terrorism or adverse investor sentiment generally and market liquidity. Because of the inherent uncertainties of valuation, the values reflected in the financial statements may materially differ from the value received upon actual sale of those investments.
| B. | Securities Transactions and Investment Income – Securities transactions are accounted for on a trade date basis. Realized gains or losses on sales are computed on the basis of specific identification of the securities sold. Interest income (net of withholding tax, if any) is recorded on an accrual basis from settlement date and includes coupon interest and amortization of premium and accretion of discount on debt securities as applicable. Pay-in-kind interest income and non-cash dividend income received in the form of securities in-lieu of cash are recorded at the fair value of the securities received. Paydown gains and losses on mortgage and asset-backed securities are recorded as adjustments to interest income. Dividend income (net of withholding tax, if any) is recorded on the ex-dividend date. |
The Fund may periodically participate in litigation related to Fund investments. As such, the Fund may receive proceeds from litigation settlements. Any proceeds received are included in the Statement of Operations as realized gain (loss) for investments no longer held and as unrealized gain (loss) for investments still held.
Brokerage commissions and mark ups are considered transaction costs and are recorded as an increase to the cost basis of securities purchased and/or a reduction of proceeds on a sale of securities. Such transaction costs are included in the determination of net realized and unrealized gain (loss) from investment securities reported in the Statement of Operations and the Statement of Changes in Net Assets and the net realized and unrealized gains (losses) on securities per share in the Financial Highlights. Transaction costs are included in the calculation of the Fund’s net asset value and, accordingly, they reduce the Fund’s total returns. These transaction costs are not considered operating expenses and are not reflected in net investment income reported in the Statement of Operations and the Statement of Changes in Net Assets, or the net investment income per share and the ratios of expenses and net investment income reported in the Financial Highlights, nor are they limited by any expense limitation arrangements between the Fund and the investment adviser.
The Fund allocates income and realized and unrealized capital gains and losses to a class based on the relative net assets of each class.
| C. | Country Determination – For the purposes of making investment selection decisions and presentation in the Schedule of Investments, the investment adviser may determine the country in which an issuer is located and/or credit risk exposure based on various factors. These factors include the laws of the country under which the issuer is organized, where the issuer maintains a principal office, the country in which the issuer derives 50% or more of its total revenues and the country that has the primary market for the issuer’s securities, as well as other criteria. Among the other criteria that may be evaluated for making this determination are the country in which the issuer maintains 50% or more of its assets, the type of security, financial guarantees and enhancements, the nature of the collateral and the sponsor organization. Country of issuer and/or credit risk exposure has been determined to be the United States of America, unless otherwise noted. |
| D. | Distributions – Distributions from net investment income, if any, are declared and paid monthly. Distributions from net realized capital gain, if any, are generally declared and paid annually and recorded on the ex-dividend date. The Fund may elect to treat a portion of the proceeds from redemptions as distributions for federal income tax purposes. |
| E. | Federal Income Taxes – The Fund intends to comply with the requirements of Subchapter M of the Internal Revenue Code of 1986, as amended (the “Internal Revenue Code”), necessary to qualify as a regulated investment company and to distribute substantially all of the Fund’s taxable earnings to shareholders. As such, the Fund will not be subject to federal income taxes on otherwise taxable income (including net realized capital gain) that is distributed to shareholders. Therefore, no provision for federal income taxes is recorded in the financial statements. |
The Fund recognizes the tax benefits of uncertain tax positions only when the position is more likely than not to be sustained. Management has analyzed the Fund’s uncertain tax positions and concluded that no liability for unrecognized tax benefits should be recorded related to uncertain tax positions. Management is not aware of any tax positions for which it is reasonably possible that the total amounts of unrecognized tax benefits will change materially in the next 12 months.
The Fund files tax returns in the U.S. Federal jurisdiction and certain other jurisdictions. Generally, the Fund is subject to examinations by such taxing authorities for up to three years after the filing of the return for the tax period.
| F. | Expenses – Fees provided for under the Rule 12b-1 plan of a particular class of the Fund are charged to the operations of such class. Transfer agency fees and expenses and other shareholder recordkeeping fees and expenses attributable to Class R5 and Class R6 are allocated based on relative net assets of Class R5 and Class R6. Sub-accounting fees attributable to Class R5 are charged to the operations of the class. Transfer agency fees and expenses and other shareholder recordkeeping fees and expenses relating to all other classes are allocated among those classes based on relative net assets. All other expenses are allocated among the classes based on relative net assets. |
| G. | Accounting Estimates – The preparation of financial statements in conformity with accounting principles generally accepted in the United States of America (“GAAP”) requires management to make estimates and assumptions that affect the reported amounts of assets and liabilities at the date of the financial statements and the reported amounts of revenues and expenses during the reporting period including estimates and assumptions related to taxation. Actual results could differ from those estimates by a significant amount. In addition, the Fund monitors for material events or transactions that may occur or become known after the period-end date and before the date the financial statements are released to print. |
| H. | Indemnifications – Under the Trust’s organizational documents, each Trustee, officer, employee or other agent of the Trust is indemnified against certain liabilities that may arise out of the performance of their duties to the Fund. Additionally, in the normal course of business, the Fund enters into contracts, including the Fund’s servicing agreements, that contain a variety of indemnification clauses. The Fund’s maximum exposure under these arrangements is unknown as this would involve future claims that may be made against the Fund that have not yet occurred. The risk of material loss as a result of such indemnification claims is considered remote. |
| I. | Securities Lending – The Fund may lend portfolio securities having a market value up to one-third of the Fund’s total assets. Such loans are secured by collateral equal to no less than the market value of the loaned securities determined daily by the securities lending provider. Such collateral will be cash or debt securities issued or guaranteed by the U.S. Government or any of its sponsored agencies. Cash collateral received in connection with these loans is invested in short-term money market instruments or affiliated, unregistered investment companies that comply with Rule 2a-7 under the 1940 Act and money market funds (collectively, “affiliated money market funds”) and is shown as such on the Schedule of Investments. The Fund bears the risk of loss with respect to the investment of collateral. It is the Fund’s policy to obtain additional collateral from or return excess collateral to the borrower by the end of the next business day, following the valuation date of the securities loaned. Therefore, the value of the collateral held may be temporarily less than the value of the securities on loan. When loaning securities, the Fund retains certain benefits of owning the securities, including the economic equivalent of dividends or interest generated by the security. Lending securities entails a risk of loss to the Fund if, and to the extent that, the market value of the securities loaned were to increase and the borrower did not increase the collateral accordingly, and the borrower failed to return the securities. The securities loaned are subject to termination at the option of the borrower or the Fund. Upon termination, the borrower will return to the Fund the securities loaned and the Fund will return the collateral. Upon the failure of the borrower to return the securities, collateral may be liquidated and the securities may be purchased on the open market to replace the loaned securities. The Fund could experience delays and costs in gaining access to the collateral and the securities may lose value during the delay which could result in potential losses to the Fund. Some of these losses may be indemnified by the lending agent. The Fund bears the risk of any deficiency in the amount of the collateral available for return to the borrower due to any loss on the collateral invested. Dividends received on cash collateral investments for securities lending transactions, which are net of compensation to counterparties, are included in Dividends from affiliated money market funds on the Statement of Operations. The aggregate value of securities out on loan, if any, is shown as a footnote on the Statement of Assets and Liabilities. |
On September 29, 2021, the Board of Trustees appointed Invesco Advisers, Inc. (the “Adviser” or “Invesco”) to serve as an affiliated securities lending agent for the Fund. Prior to September 29, 2021, the Bank of New York Mellon (“BNYM”) served as the sole securities lending agent for the Fund under the securities
22 Invesco Intermediate Bond Factor Fund
lending program. BNYM also continues to serve as a lending agent. To the extent the Fund utilizes the Adviser as an affiliated securities lending agent, the Fund conducts its securities lending in accordance with, and in reliance upon, no-action letters issued by the SEC staff that provide guidance on how an affiliate may act as a direct agent lender and receive compensation for those services in a manner consistent with the federal securities laws. For the year ended February 28, 2022, there were no securities lending transactions with the Adviser.
| J. | Foreign Currency Translations – Foreign currency is valued at the close of the NYSE based on quotations posted by banks and major currency dealers. Portfolio securities and other assets and liabilities denominated in foreign currencies are translated into U.S. dollar amounts at the date of valuation. Purchases and sales of portfolio securities (net of foreign taxes withheld on disposition) and income items denominated in foreign currencies are translated into U.S. dollar amounts on the respective dates of such transactions. The Fund does not separately account for the portion of the results of operations resulting from changes in foreign exchange rates on investments and the fluctuations arising from changes in market prices of securities held. The combined results of changes in foreign exchange rates and the fluctuation of market prices on investments (net of estimated foreign tax withholding) are included with the net realized and unrealized gain or loss from investments in the Statement of Operations. Reported net realized foreign currency gains or losses arise from (1) sales of foreign currencies, (2) currency gains or losses realized between the trade and settlement dates on securities transactions, and (3) the difference between the amounts of dividends, interest, and foreign withholding taxes recorded on the Fund’s books and the U.S. dollar equivalent of the amounts actually received or paid. Net unrealized foreign currency gains and losses arise from changes in the fair values of assets and liabilities, other than investments in securities at fiscal period end, resulting from changes in exchange rates. |
The Fund may invest in foreign securities, which may be subject to foreign taxes on income, gains on investments or currency repatriation, a portion of which may be recoverable. Foreign taxes, if any, are recorded based on the tax regulations and rates that exist in the foreign markets in which the Fund invests and are shown in the Statement of Operations.
| K. | Forward Foreign Currency Contracts – The Fund may engage in foreign currency transactions either on a spot (i.e. for prompt delivery and settlement) basis, or through forward foreign currency contracts, to manage or minimize currency or exchange rate risk. |
The Fund may also enter into forward foreign currency contracts for the purchase or sale of a security denominated in a foreign currency in order to “lock in” the U.S. dollar price of that security, or the Fund may also enter into forward foreign currency contracts that do not provide for physical settlement of the two currencies, but instead are settled by a single cash payment calculated as the difference between the agreed upon exchange rate and the spot rate at settlement based upon an agreed upon notional amount (non-deliverable forwards). The Fund will set aside liquid assets in an amount equal to the daily mark-to-market obligation for forward foreign currency contracts.
A forward foreign currency contract is an obligation between two parties (“Counterparties”) to purchase or sell a specific currency for an agreed-upon price at a future date. The use of forward foreign currency contracts does not eliminate fluctuations in the price of the underlying securities the Fund owns or intends to acquire but establishes a rate of exchange in advance. Fluctuations in the value of these contracts are measured by the difference in the contract date and reporting date exchange rates and are recorded as unrealized appreciation (depreciation) until the contracts are closed. When the contracts are closed, realized gains (losses) are recorded. Realized and unrealized gains (losses) on the contracts are included in the Statement of Operations. The primary risks associated with forward foreign currency contracts include failure of the Counterparty to meet the terms of the contract and the value of the foreign currency changing unfavorably. These risks may be in excess of the amounts reflected in the Statement of Assets and Liabilities.
| L. | Futures Contracts – The Fund may enter into futures contracts to manage exposure to interest rate, equity and market price movements and/or currency risks. A futures contract is an agreement between Counterparties to purchase or sell a specified underlying security, currency or commodity (or delivery of a cash settlement price, in the case of an index future) for a fixed price at a future date. The Fund currently invests only in exchange-traded futures and they are standardized as to maturity date and underlying financial instrument. Initial margin deposits required upon entering into futures contracts are satisfied by the segregation of specific securities or cash as collateral at the futures commission merchant (broker). During the period the futures contracts are open, changes in the value of the contracts are recognized as unrealized gains or losses by recalculating the value of the contracts on a daily basis. Subsequent or variation margin payments are received or made depending upon whether unrealized gains or losses are incurred. These amounts are reflected as receivables or payables on the Statement of Assets and Liabilities. When the contracts are closed or expire, the Fund recognizes a realized gain or loss equal to the difference between the proceeds from, or cost of, the closing transaction and the Fund’s basis in the contract. The net realized gain (loss) and the change in unrealized gain (loss) on futures contracts held during the period is included on the Statement of Operations. The primary risks associated with futures contracts are market risk and the absence of a liquid secondary market. If the Fund were unable to liquidate a futures contract and/or enter into an offsetting closing transaction, the Fund would continue to be subject to market risk with respect to the value of the contracts and continue to be required to maintain the margin deposits on the futures contracts. Futures contracts have minimal Counterparty risk since the exchange’s clearinghouse, as Counterparty to all exchange-traded futures, guarantees the futures against default. Risks may exceed amounts recognized in the Statement of Assets and Liabilities. |
| M. | Dollar Rolls and Forward Commitment Transactions - The Fund may enter into dollar roll transactions to enhance the Fund’s performance. The Fund executes its dollar roll transactions in the to be announced (“TBA”) market whereby the Fund makes a forward commitment to purchase a security and, instead of accepting delivery, the position is offset by the sale of the security with a simultaneous agreement to repurchase at a future date. |
The Fund accounts for dollar roll transactions as purchases and sales and realizes gains and losses on these transactions. These transactions increase the Fund’s portfolio turnover rate. The Fund will segregate liquid assets in an amount equal to its dollar roll commitments.
Dollar roll transactions involve the risk that a Counterparty to the transaction may fail to complete the transaction. If this occurs, the Fund may lose the opportunity to purchase or sell the security at the agreed upon price. Dollar roll transactions also involve the risk that the value of the securities retained by the Fund may decline below the price of the securities that the Fund has sold but is obligated to purchase under the agreement. Dollar roll transactions covered in this manner are not treated as senior securities for purposes of a Fund’s fundamental investment limitation on borrowings.
| N. | Leverage Risk – Leverage exists when the Fund can lose more than it originally invests because it purchases or sells an instrument or enters into a transaction without investing an amount equal to the full economic exposure of the instrument or transaction. |
| O. | Collateral –To the extent the Fund has designated or segregated a security as collateral and that security is subsequently sold, it is the Fund’s practice to replace such collateral no later than the next business day. This practice does not apply to securities pledged as collateral for securities lending transactions. |
| P. | Other Risks - Active trading of portfolio securities may result in added expenses, a lower return and increased tax liability. |
The Fund may invest in obligations issued by agencies and instrumentalities of the U.S. Government that may vary in the level of support they receive from the government. The government may choose not to provide financial support to government sponsored agencies or instrumentalities if it is not legally obligated to do so. In this case, if the issuer defaulted, the Fund may not be able to recover its investment in such issuer from the U.S. Government. Many securities purchased by the Fund are not guaranteed by the U.S. Government.
The current low interest rate environment was created in part by the Federal Reserve Board (FRB) and certain foreign central banks keeping the federal funds and equivalent foreign rates near historical lows. Increases in the federal funds and equivalent foreign rates may expose fixed income markets to heightened volatility and reduced liquidity for certain fixed income investments, particularly those with longer maturities. In addition, decreases in fixed income dealer market-making capacity may also potentially lead to heightened volatility and reduced liquidity in the fixed income markets. As a result, the value of the Fund’s investments and share price may decline. Changes in central bank policies could also result in higher than normal shareholder redemptions, which could potentially increase portfolio turnover and the Fund’s transaction costs. Additionally, from time to time, uncertainty regarding the status of negotiations in the U.S. Government to increase the statutory debt limit, commonly called the “debt ceiling”, could increase the risk that the U.S. Government may default on payments on certain U.S. Government securities, cause the credit rating of the U.S. Government to be downgraded, increase volatility in the stock and bond
23 Invesco Intermediate Bond Factor Fund
| | markets, result in higher interest rates, reduce prices of U.S. Treasury securities, and/or increase the costs of various kinds of debt. If a U.S. Government-sponsored entity is negatively impacted by legislative or regulatory action, is unable to meet its obligations, or its creditworthiness declines, the performance of a Fund that holds securities of that entity will be adversely impacted. |
| Q. | COVID-19 Risk - The COVID-19 strain of coronavirus has resulted in instances of market closures and dislocations, extreme volatility, liquidity constraints and increased trading costs. Efforts to contain its spread have resulted in travel restrictions, disruptions of healthcare systems, business operations (including business closures) and supply chains, layoffs, lower consumer demand and employee availability, and defaults and credit downgrades, among other significant economic impacts that have disrupted global economic activity across many industries. Such economic impacts may exacerbate other pre-existing political, social and economic risks locally or globally and cause general concern and uncertainty. |
The full economic impact and ongoing effects of COVID-19 (or other future epidemics or pandemics) at the macro-level and on individual businesses are unpredictable and may result in significant and prolonged effects on the Fund’s performance.
NOTE 2–Advisory Fees and Other Fees Paid to Affiliates
The Trust has entered into a master investment advisory agreement with the Adviser. Under the terms of the investment advisory agreement, the Fund accrues daily and pays monthly an advisory fee to the Adviser based on the annual rate of the Fund’s average daily net assets as follows:
| | |
| Average Daily Net Assets* | | Rate |
First $ 2 billion | | 0.250% |
Over $2 billion | | 0.230% |
| * | The advisory fee paid by the Fund shall be reduced by any amounts paid by the Fund under the administrative services agreement with the Adviser. |
For the year ended February 28, 2022, the effective advisory fee rate incurred by the Fund was 0.25%.
Under the terms of a master sub-advisory agreement between the Adviser and each of Invesco Asset Management Deutschland GmbH, Invesco Asset Management Limited, Invesco Asset Management (Japan) Limited, Invesco Hong Kong Limited, Invesco Senior Secured Management, Inc. and Invesco Canada Ltd. and separate sub-advisory agreements with Invesco Capital Management LLC and Invesco Asset Management (India) Private Limited (collectively, the “Affiliated Sub-Advisers”) the Adviser, not the Fund, will pay 40% of the fees paid to the Adviser to any such Affiliated Sub-Adviser(s) that provide(s) discretionary investment management services to the Fund based on the percentage of assets allocated to such Affiliated Sub-Adviser(s). Invesco has also entered into a sub-advisory agreement with OppenheimerFunds, Inc. to provide discretionary management services to the Fund.
The Adviser has contractually agreed, through at least June 30, 2022, to waive advisory fees and/or reimburse expenses of all shares to the extent necessary to limit total annual fund operating expenses after fee waiver and/or expense reimbursement (excluding certain items discussed below) of Class A, Class C, Class R, Class Y, Class R5 and Class R6 shares to 0.52%, 1.27%, 0.77%, 0.27%, 0.27% and 0.27%, respectively, of the Fund’s average daily net assets (the “expense limits”). In determining the Adviser’s obligation to waive advisory fees and/or reimburse expenses, the following expenses are not taken into account, and could cause the total annual fund operating expenses after fee waiver and/or reimbursement to exceed the numbers reflected above: (1) interest; (2) taxes; (3) dividend expense on short sales; (4) extraordinary or non-routine items, including litigation expenses; and (5) expenses that the Fund has incurred but did not actually pay because of an expense offset arrangement. Unless Invesco continues the fee waiver agreement, it will terminate on June 30, 2022. During its term, the fee waiver agreement cannot be terminated or amended to increase the expense limits or reduce the advisory fee waivers without approval of the Board of Trustees.
Further, the Adviser has contractually agreed, through at least June 30, 2023, to waive the advisory fee payable by the Fund in an amount equal to 100% of the net advisory fees the Adviser receives from the affiliated money market funds on investments by the Fund of uninvested cash (excluding investments of cash collateral from securities lending) in such affiliated money market funds.
For the year ended February 28, 2022, the Adviser waived advisory fees of $140,940 and reimbursed class level expenses of $151,686, $19,956, $23,644, $24,127, $2 and $3,321 of Class A, Class C, Class R, Class Y, Class R5 and Class R6 shares, respectively.
The Trust has entered into a master administrative services agreement with Invesco pursuant to which the Fund has agreed to pay Invesco for certain administrative costs incurred in providing accounting services to the Fund. For the year ended February 28, 2022, expenses incurred under the agreement are shown in the Statement of Operations as Administrative services fees. Invesco has entered into a sub-administration agreement whereby State Street Bank and Trust Company (“SSB”) serves as fund accountant and provides certain administrative services to the Fund. Pursuant to a custody agreement with the Trust on behalf of the Fund, SSB also serves as the Fund’s custodian.
The Trust has entered into a transfer agency and service agreement with Invesco Investment Services, Inc. (“IIS”) pursuant to which the Fund has agreed to pay IIS a fee for providing transfer agency and shareholder services to the Fund and reimburse IIS for certain expenses incurred by IIS in the course of providing such services. IIS may make payments to intermediaries that provide omnibus account services, sub-accounting services and/or networking services. All fees payable by IIS to intermediaries that provide omnibus account services or sub-accounting services are charged back to the Fund, subject to certain limitations approved by the Trust’s Board of Trustees. For the year ended February 28, 2022, expenses incurred under the agreement are shown in the Statement of Operations as Transfer agent fees.
The Trust has entered into master distribution agreements with Invesco Distributors, Inc. (“IDI”) to serve as the distributor for the Class A, Class C, Class R, Class Y, Class R5 and Class R6 shares of the Fund. The Trust has adopted plans pursuant to Rule 12b-1 under the 1940 Act with respect to the Fund’s Class A, Class C and Class R shares (collectively, the “Plans”). The Fund, pursuant to the Class A Plan, reimburses IDI for its allocated share of expenses incurred for the period, up to a maximum annual rate of 0.25% of the average daily net assets of Class A shares. The Fund pursuant to the Class C and Class R Plan, pays IDI compensation at the annual rate of 1.00% of the average daily net assets of Class C shares and 0.50% of the average daily net assets of Class R shares. The fees are accrued daily and paid monthly. Of the Plan payments, up to 0.25% of the average daily net assets of each class of shares may be paid to furnish continuing personal shareholder services to customers who purchase and own shares of such classes. Any amounts not paid as a service fee under the Plans would constitute an asset-based sales charge. Rules of the Financial Industry Regulatory Authority (“FINRA”) impose a cap on the total sales charges, including asset-based sales charges, that may be paid by any class of shares of the Fund. For the year ended February 28, 2022, expenses incurred under the Plans are shown in the Statement of Operations as Distribution fees.
Front-end sales commissions and CDSC (collectively, the “sales charges”) are not recorded as expenses of the Fund. Front-end sales commissions are deducted from proceeds from the sales of Fund shares prior to investment in Class A shares of the Fund. CDSC are deducted from redemption proceeds prior to remittance to the shareholder. During the year ended February 28, 2022, IDI advised the Fund that IDI retained $16,601 in front-end sales commissions from the sale of Class A shares and $5,543 and $1,388 from Class A and Class C shares, respectively, for CDSC imposed upon redemptions by shareholders.
Certain officers and trustees of the Trust are officers and directors of the Adviser, IIS and/or IDI.
NOTE 3–Additional Valuation Information
GAAP defines fair value as the price that would be received to sell an asset or paid to transfer a liability in an orderly transaction between market participants at the measurement date, under current market conditions. GAAP establishes a hierarchy that prioritizes the inputs to valuation methods, giving the highest priority to readily available unadjusted quoted prices in an active market for identical assets (Level 1) and the lowest priority to significant unobservable inputs (Level 3), generally when
24 Invesco Intermediate Bond Factor Fund
market prices are not readily available or are unreliable. Based on the valuation inputs, the securities or other investments are tiered into one of three levels. Changes in valuation methods may result in transfers in or out of an investment’s assigned level:
| | |
| Level 1 – | | Prices are determined using quoted prices in an active market for identical assets. |
| Level 2 – | | Prices are determined using other significant observable inputs. Observable inputs are inputs that other market participants may use in pricing a security. These may include quoted prices for similar securities, interest rates, prepayment speeds, credit risk, yield curves, loss severities, default rates, discount rates, volatilities and others. |
| Level 3 – | | Prices are determined using significant unobservable inputs. In situations where quoted prices or observable inputs are unavailable (for example, when there is little or no market activity for an investment at the end of the period), unobservable inputs may be used. Unobservable inputs reflect the Fund’s own assumptions about the factors market participants would use in determining fair value of the securities or instruments and would be based on the best available information. |
The following is a summary of the tiered valuation input levels, as of February 28, 2022. The level assigned to the securities valuations may not be an indication of the risk or liquidity associated with investing in those securities. Because of the inherent uncertainties of valuation, the values reflected in the financial statements may materially differ from the value received upon actual sale of those investments.
| | | | | | | | | | | | | | | | | | | | | | | | | | | | |
| | | Level 1 | | | | | | Level 2 | | | | | | Level 3 | | | | | | Total | |
| |
Investments in Securities | | | | | | | | | | | | | | | | | | | | | | | | | | | | |
| |
U.S. Dollar Denominated Bonds & Notes | | | $ – | | | | | | | | $ 89,919,189 | | | | | | | | $– | | | | | | | | $ 89,919,189 | |
| |
U.S. Treasury Securities | | | – | | | | | | | | 58,688,580 | | | | | | | | – | | | | | | | | 58,688,580 | |
| |
U.S. Government Sponsored Agency Mortgage-Backed Securities | | | – | | | | | | | | 51,064,018 | | | | | | | | – | | | | | | | | 51,064,018 | |
| |
Non-U.S. Dollar Denominated Bonds & Notes | | | – | | | | | | | | 21,187,794 | | | | | | | | – | | | | | | | | 21,187,794 | |
| |
Asset-Backed Securities | | | – | | | | | | | | 414,458 | | | | | | | | – | | | | | | | | 414,458 | |
| |
Money Market Funds | | | 12,140,075 | | | | | | | | 2,002,747 | | | | | | | | – | | | | | | | | 14,142,822 | |
| |
Total Investments in Securities | | | 12,140,075 | | | | | | | | 223,276,786 | | | | | | | | – | | | | | | | | 235,416,861 | |
| |
| | | | | | | |
Other Investments - Assets* | | | | | | | | | | | | | | | | | | | | | | | | | | | | |
| |
Futures Contracts | | | 160,807 | | | | | | | | – | | | | | | | | – | | | | | | | | 160,807 | |
| |
Forward Foreign Currency Contracts | | | – | | | | | | | | 777,642 | | | | | | | | – | | | | | | | | 777,642 | |
| |
| | | 160,807 | | | | | | | | 777,642 | | | | | | | | – | | | | | | | | 938,449 | |
| |
| | | | | | | |
Other Investments - Liabilities* | | | | | | | | | | | | | | | | | | | | | | | | | | | | |
| |
Futures Contracts | | | (175,118 | ) | | | | | | | – | | | | | | | | – | | | | | | | | (175,118 | ) |
| |
Forward Foreign Currency Contracts | | | – | | | | | | | | (128,815 | ) | | | | | | | – | | | | | | | | (128,815 | ) |
| |
| | | (175,118 | ) | | | | | | | (128,815 | ) | | | | | | | – | | | | | | | | (303,933 | ) |
| |
Total Other Investments | | | (14,311 | ) | | | | | | | 648,827 | | | | | | | | – | | | | | | | | 634,516 | |
| |
Total Investments | | | $12,125,764 | | | | | | | | $223,925,613 | | | | | | | | $– | | | | | | | | $236,051,377 | |
| |
| * | Forward foreign currency contracts and futures contracts are valued at unrealized appreciation (depreciation). |
NOTE 4–Derivative Investments
The Fund may enter into an International Swaps and Derivatives Association Master Agreement (“ISDA Master Agreement”) under which a fund may trade OTC derivatives. An OTC transaction entered into under an ISDA Master Agreement typically involves a collateral posting arrangement, payment netting provisions and close-out netting provisions. These netting provisions allow for reduction of credit risk through netting of contractual obligations. The enforceability of the netting provisions of the ISDA Master Agreement depends on the governing law of the ISDA Master Agreement, among other factors.
For financial reporting purposes, the Fund does not offset OTC derivative assets or liabilities that are subject to ISDA Master Agreements in the Statement of Assets and Liabilities.
Value of Derivative Investments at Period-End
The table below summarizes the value of the Fund’s derivative investments, detailed by primary risk exposure, held as of February 28, 2022:
| | | | | | | | | | | | |
| | | Value | |
| Derivative Assets | | Currency
Risk | | | Interest
Rate Risk | | | Total | |
| |
Unrealized appreciation on futures contracts – Exchange-Traded(a) | | $ | - | | | $ | 160,807 | | | $ | 160,807 | |
| |
Unrealized appreciation on forward foreign currency contracts outstanding | | | 777,642 | | | | - | | | | 777,642 | |
| |
Total Derivative Assets | | | 777,642 | | | | 160,807 | | | | 938,449 | |
| |
Derivatives not subject to master netting agreements | | | - | | | | (160,807 | ) | | | (160,807 | ) |
| |
Total Derivative Assets subject to master netting agreements | | $ | 777,642 | | | $ | - | | | $ | 777,642 | |
| |
25 Invesco Intermediate Bond Factor Fund
| | | | | | | | | | | | |
| | | Value | |
Derivative Liabilities | |
| Currency
Risk |
| |
| Interest
Rate Risk |
| | | Total | |
| |
Unrealized depreciation on futures contracts – Exchange-Traded(a) | | $ | - | | | $ | (175,118) | | | $ | (175,118) | |
| |
Unrealized depreciation on forward foreign currency contracts outstanding | | | (128,815 | ) | | | - | | | | (128,815 | ) |
| |
Total Derivative Liabilities | | | (128,815 | ) | | | (175,118 | ) | | | (303,933 | ) |
| |
Derivatives not subject to master netting agreements | | | - | | | | 175,118 | | | | 175,118 | |
| |
Total Derivative Liabilities subject to master netting agreements | | $ | (128,815) | | | $ | - | | | $ | (128,815) | |
| |
(a) The daily variation margin receivable at period-end is recorded in the Statement of Assets and Liabilities.
Offsetting Assets and Liabilities
The table below reflects the Fund’s exposure to Counterparties subject to either an ISDA Master Agreement or other agreement for OTC derivative transactions as of February 28, 2022.
| | | | | | | | | | | | | | | | | | | | | | | | | | | | | | |
| | | Financial
Derivative Assets | | | | Financial
Derivative
Liabilities | | | | | | | | | | | Collateral
(Received)/Pledged | | | |
| Counterparty | | Forward Foreign
Currency Contracts | | | | Forward Foreign
Currency Contracts | | | | | Net Value of
Derivatives | | | | | | Non-Cash | | Cash | | Net
Amount | |
| |
Bank of America, N.A. | | $304,070 | | | | $(19,027) | | | | | | | $285,043 | | | | | | | | $– | | | | $– | | | $ | 285,043 | |
| |
Barclays Bank PLC | | 732 | | | | – | | | | | | | 732 | | | | | | | | – | | | | – | | | | 732 | |
| |
BNP Paribas S.A. | | 26,514 | | | | (25,178) | | | | | | | 1,336 | | | | | | | | – | | | | – | | | | 1,336 | |
| |
Deutsche Bank AG | | 12,727 | | | | – | | | | | | | 12,727 | | | | | | | | – | | | | – | | | | 12,727 | |
| |
Goldman Sachs International | | 95,976 | | | | (1,430) | | | | | | | 94,546 | | | | | | | | – | | | | – | | | | 94,546 | |
| |
J.P. Morgan Chase Bank, N.A. | | – | | | | (1,763) | | | | | | | (1,763 | ) | | | | | | | – | | | | – | | | | (1,763 | ) |
| |
Morgan Stanley and Co. International PLC | | 326,003 | | | | (79,625) | | | | | | | 246,378 | | | | | | | | – | | | | – | | | | 246,378 | |
| |
UBS AG | | 11,620 | | | | (1,792) | | | | | | | 9,828 | | | | | | | | – | | | | – | | | | 9,828 | |
| |
Total | | $777,642 | | | | $(128,815) | | | | | | | $648,827 | | | | | | | | $– | | | | $– | | | $ | 648,827 | |
| |
Effect of Derivative Investments for the year ended February 28, 2022
The table below summarizes the gains (losses) on derivative investments, detailed by primary risk exposure, recognized in earnings during the period:
| | | | | | | | | | | | |
| | | Location of Gain (Loss) on
Statement of Operations | |
| | | Currency
Risk | | | Interest
Rate Risk | | | Total | |
| |
Realized Gain: | | | | | | | | | | | | |
Forward foreign currency contracts | | $ | 398,817 | | | $ | - | | | $ | 398,817 | |
| |
Futures contracts | | | - | | | | 747,241 | | | | 747,241 | |
| |
Change in Net Unrealized Appreciation (Depreciation): | | | | | | | | | | | | |
Forward foreign currency contracts | | | 447,598 | | | | - | | | | 447,598 | |
| |
Futures contracts | | | - | | | | (193,744 | ) | | | (193,744 | ) |
| |
Total | | $ | 846,415 | | | $ | 553,497 | | | $ | 1,399,912 | |
| |
The table below summarizes the average notional value of derivatives held during the period.
| | | | | | | | |
| | | Forward
Foreign Currency
Contracts | | | Futures
Contracts | |
| |
Average notional value | | $ | 26,887,714 | | | $ | 40,414,278 | |
| |
NOTE 5–Expense Offset Arrangement(s)
The expense offset arrangement is comprised of transfer agency credits which result from balances in demand deposit accounts used by the transfer agent for clearing shareholder transactions. For the year ended February 28, 2022, the Fund received credits from this arrangement, which resulted in the reduction of the Fund’s total expenses of $524.
NOTE 6–Trustees’ and Officers’ Fees and Benefits
Trustees’ and Officers’ Fees and Benefits include amounts accrued by the Fund to pay remuneration to certain Trustees and Officers of the Fund. Trustees have the option to defer compensation payable by the Fund, and Trustees’ and Officers’ Fees and Benefits also include amounts accrued by the Fund to fund such deferred compensation amounts. Those Trustees who defer compensation have the option to select various Invesco Funds in which their deferral accounts shall be deemed to be invested. Finally, certain current Trustees were eligible to participate in a retirement plan that provided for benefits to be paid upon retirement to Trustees over a period of time based on the number of years of service. The Fund may have certain former Trustees who also participate in a retirement plan and receive benefits under
26 Invesco Intermediate Bond Factor Fund
such plan. Trustees’ and Officers’ Fees and Benefits include amounts accrued by the Fund to fund such retirement benefits. Obligations under the deferred compensation and retirement plans represent unsecured claims against the general assets of the Fund.
NOTE 7–Cash Balances
The Fund is permitted to temporarily carry a negative or overdrawn balance in its account with SSB, the custodian bank. Such balances, if any at period-end, are shown in the Statement of Assets and Liabilities under the payable caption Amount due custodian. To compensate the custodian bank for such overdrafts, the overdrawn Fund may either (1) leave funds as a compensating balance in the account so the custodian bank can be compensated by earning the additional interest; or (2) compensate by paying the custodian bank at a rate agreed upon by the custodian bank and Invesco, not to exceed the contractually agreed upon rate. The Fund may not purchase additional securities when any borrowings from banks or broker-dealers exceed 5% of the Fund’s total assets, or when any borrowings from an Invesco Fund are outstanding.
NOTE 8–Distributions to Shareholders and Tax Components of Net Assets
| | | | | | | | |
| Tax Character of Distributions to Shareholders Paid During the Fiscal Years Ended February 28, 2022 and 2021: |
| | |
| | | 2022 | | | 2021 | |
|
Ordinary income* | | $ | 3,168,174 | | | $ | 5,635,840 | |
|
Long-term capital gain | | | – | | | | 4,787,940 | |
|
Total distributions | | $ | 3,168,174 | | | $ | 10,423,780 | |
|
| * | Includes short-term capital gain distributions, if any. |
Tax Components of Net Assets at Period-End:
| | | | |
| | | 2022 | |
| |
Undistributed ordinary income | | $ | 512,706 | |
| |
Net unrealized appreciation (depreciation) – investments | | | (5,374,394 | ) |
| |
Net unrealized appreciation (depreciation) – foreign currencies | | | (2,582 | ) |
| |
Temporary book/tax differences | | | (29,912 | ) |
| |
Capital loss carryforward | | | (2,346,992 | ) |
| |
Shares of beneficial interest | | | 205,324,288 | |
| |
Total net assets | | $ | 198,083,114 | |
| |
The difference between book-basis and tax-basis unrealized appreciation (depreciation) is due to differences in the timing of recognition of gains and losses on investments for tax and book purposes. The Fund’s net unrealized appreciation (depreciation) difference is attributable primarily to wash sales, derivative instruments and straddles.
The temporary book/tax differences are a result of timing differences between book and tax recognition of income and/or expenses. The Fund’s temporary book/tax differences are the result of the trustee deferral of compensation and retirement plan benefits.
Capital loss carryforward is calculated and reported as of a specific date. Results of transactions and other activity after that date may affect the amount of capital loss carryforward actually available for the Fund to utilize. The ability to utilize capital loss carryforward in the future may be limited under the Internal Revenue Code and related regulations based on the results of future transactions.
The Fund has a capital loss carryforward as of February 28, 2022, as follows:
| | | | | | | | | | |
| Capital Loss Carryforward* |
|
| Expiration | | Short-Term | | | Long-Term | | Total | |
| |
Not subject to expiration | | $ | 2,346,992 | | | $– | | $ | 2,346,992 | |
| |
| * | Capital loss carryforward is reduced for limitations, if any, to the extent required by the Internal Revenue Code and may be further limited depending upon a variety of factors, including the realization of net unrealized gains or losses as of the date of any reorganization. |
NOTE 9–Investment Transactions
The aggregate amount of investment securities (other than short-term securities, U.S. Government obligations and money market funds, if any) purchased and sold by the Fund during the year ended February 28, 2022 was $41,604,422 and $38,308,902, respectively. Cost of investments, including any derivatives, on a tax basis includes the adjustments for financial reporting purposes as of the most recently completed federal income tax reporting period-end.
| | | | |
| Unrealized Appreciation (Depreciation) of Investments on a Tax Basis | | | |
| |
Aggregate unrealized appreciation of investments | | $ | 2,043,186 | |
| |
Aggregate unrealized (depreciation) of investments | | | (7,417,580 | ) |
| |
Net unrealized appreciation (depreciation) of investments | | $ | (5,374,394 | ) |
| |
Cost of investments for tax purposes is $241,425,771.
NOTE 10–Reclassification of Permanent Differences
Primarily as a result of differing book/tax treatment of partnerships, foreign currency transactions, dollar rolls and paydowns, on February 28, 2022, undistributed net investment income was increased by $1,432,276 and undistributed net realized gain (loss) was decreased by $1,432,276. This reclassification had no effect on the net assets or the distributable earnings (loss) of the Fund.
27 Invesco Intermediate Bond Factor Fund
NOTE 11–Share Information
| | | | | | | | | | | | | | | | |
| | | Summary of Share Activity | |
|
| | | Year ended
February 28, 2022(a) | | | Year ended
February 28, 2021 | |
| | | Shares | | | Amount | | | Shares | | | Amount | |
|
Sold: | | | | | | | | | | | | | | | | |
Class A | | | 1,988,918 | | | $ | 21,596,160 | | | | 3,508,888 | | | $ | 39,534,028 | |
|
Class C | | | 292,538 | | | | 3,179,090 | | | | 626,399 | | | | 7,093,784 | |
|
Class R | | | 667,931 | | | | 7,274,119 | | | | 616,374 | | | | 6,947,974 | |
|
Class Y | | | 1,935,566 | | | | 20,924,099 | | | | 1,012,270 | | | | 11,367,384 | |
|
Class R6 | | | 1,217,759 | | | | 13,202,683 | | | | 601,313 | | | | 6,748,921 | |
|
| | | | |
Issued as reinvestment of dividends: | | | | | | | | | | | | | | | | |
Class A | | | 176,075 | | | | 1,910,695 | | | | 578,748 | | | | 6,484,001 | |
|
Class C | | | 13,167 | | | | 142,961 | | | | 86,432 | | | | 966,642 | |
|
Class R | | | 24,974 | | | | 271,081 | | | | 87,372 | | | | 978,807 | |
|
Class Y | | | 30,166 | | | | 326,072 | | | | 82,988 | | | | 929,251 | |
|
Class R6 | | | 24,161 | | | | 261,697 | | | | 38,370 | | | | 429,973 | |
|
| | | | |
Automatic conversion of Class C shares to Class A shares: | | | | | | | | | | | | | | | | |
Class A | | | 168,348 | | | | 1,823,223 | | | | 426,650 | | | | 4,774,247 | |
|
Class C | | | (168,348 | ) | | | (1,823,223 | ) | | | (426,677 | ) | | | (4,774,247 | ) |
|
| | | | |
Reacquired: | | | | | | | | | | | | | | | | |
Class A | | | (3,183,885 | ) | | | (34,545,466 | ) | | | (3,214,756 | ) | | | (36,148,260 | ) |
|
Class C | | | (468,259 | ) | | | (5,081,643 | ) | | | (598,609 | ) | | | (6,744,911 | ) |
|
Class R | | | (694,794 | ) | | | (7,517,455 | ) | | | (692,456 | ) | | | (7,794,206 | ) |
|
Class Y | | | (795,681 | ) | | | (8,593,770 | ) | | | (1,159,492 | ) | | | (12,994,472 | ) |
|
Class R6 | | | (380,212 | ) | | | (4,101,768 | ) | | | (385,631 | ) | | | (4,338,685 | ) |
|
Net increase in share activity | | | 848,424 | | | $ | 9,248,555 | | | | 1,188,183 | | | $ | 13,460,231 | |
|
| (a) | There are entities that are record owners of more than 5% of the outstanding shares of the Fund and in the aggregate own 23% of the outstanding shares of the Fund. IDI has an agreement with these entities to sell Fund shares. The Fund, Invesco and/or Invesco affiliates may make payments to these entities, which are considered to be related to the Fund, for providing services to the Fund, Invesco and/or Invesco affiliates including but not limited to services such as securities brokerage, distribution, third party record keeping and account servicing. The Fund has no knowledge as to whether all or any portion of the shares owned of record by these entities are also owned beneficially. |
28 Invesco Intermediate Bond Factor Fund
Report of Independent Registered Public Accounting Firm
To the Board of Trustees of AIM Investment Securities Funds (Invesco Investment Securities Funds) and Shareholders of Invesco Intermediate Bond Factor Fund
Opinion on the Financial Statements
We have audited the accompanying statement of assets and liabilities, including the schedule of investments, of Invesco Intermediate Bond Factor Fund (one of the funds constituting AIM Investment Securities Funds (Invesco Investment Securities Funds), referred to hereafter as the “Fund”) as of February 28, 2022, the related statement of operations for the year ended February 28, 2022, the statement of changes in net assets for each of the two years in the period ended February 28, 2022, including the related notes, and the financial highlights for each of the periods indicated in the table below (collectively referred to as the “financial statements”). In our opinion, the financial statements present fairly, in all material respects, the financial position of the Fund as of February 28, 2022, the results of its operations for the year then ended, the changes in its net assets for each of the two years in the period ended February 28, 2022 and the financial highlights for each of the periods indicated in the table below, in conformity with accounting principles generally accepted in the United States of America.
|
| Financial Highlights |
| For each of the two years in the period ended February 28, 2022, the seven months ended February 29, 2020 and the year ended July 31, 2019 for Class A, Class C, Class R, Class Y and Class R6 |
| For each of the two years in the period ended February 28, 2022, the seven months ended February 29, 2020 and the period May 24, 2019 (commencement date) through July 31, 2019 for Class R5 |
The financial statements of Oppenheimer Intermediate Income Fund (subsequently renamed Invesco Intermediate Bond Factor Fund) as of and for the year ended July 31, 2018 and the financial highlights for each of the periods ended on or prior to July 31, 2018 (not presented herein, other than the financial highlights) were audited by other auditors whose report dated September 26, 2018 expressed an unqualified opinion on those financial statements and financial highlights.
Basis for Opinion
These financial statements are the responsibility of the Fund’s management. Our responsibility is to express an opinion on the Fund’s financial statements based on our audits. We are a public accounting firm registered with the Public Company Accounting Oversight Board (United States) (PCAOB) and are required to be independent with respect to the Fund in accordance with the U.S. federal securities laws and the applicable rules and regulations of the Securities and Exchange Commission and the PCAOB.
We conducted our audits of these financial statements in accordance with the standards of the PCAOB. Those standards require that we plan and perform the audit to obtain reasonable assurance about whether the financial statements are free of material misstatement, whether due to error or fraud.
Our audits included performing procedures to assess the risks of material misstatement of the financial statements, whether due to error or fraud, and performing procedures that respond to those risks. Such procedures included examining, on a test basis, evidence regarding the amounts and disclosures in the financial statements. Our audits also included evaluating the accounting principles used and significant estimates made by management, as well as evaluating the overall presentation of the financial statements. Our procedures included confirmation of securities owned as of February 28, 2022 by correspondence with the custodian, transfer agent and brokers; when replies were not received from brokers, we performed other auditing procedures. We believe that our audits provide a reasonable basis for our opinion.
/s/PricewaterhouseCoopers LLP
Houston, Texas
April 28, 2022
We have served as the auditor of one or more of the investment companies in the Invesco group of investment companies since at least 1995. We have not been able to determine the specific year we began serving as auditor.
29 Invesco Intermediate Bond Factor Fund
Calculating your ongoing Fund expenses
Example
As a shareholder of the Fund, you incur two types of costs: (1) transaction costs, which may include sales charges (loads) on purchase payments or contingent deferred sales charges on redemptions, if any; and (2) ongoing costs, including management fees, distribution and/or service (12b-1) fees, and other Fund expenses. This example is intended to help you understand your ongoing costs (in dollars) of investing in the Fund and to compare these costs with ongoing costs of investing in other mutual funds. The example is based on an investment of $1,000 invested at the beginning of the period and held for the entire period September 1, 2021 through February 28, 2022.
Actual expenses
The table below provides information about actual account values and actual expenses. You may use the information in this table, together with the amount you invested, to estimate the expenses that you paid over the period. Simply divide your account value by $1,000 (for example, an $8,600 account value divided by $1,000 = 8.6), then multiply the result by the number in the table under the heading entitled “Actual Expenses Paid During Period” to estimate the expenses you paid on your account during this period.
Hypothetical example for comparison purposes
The table below also provides information about hypothetical account values and hypothetical expenses based on the Fund’s actual expense ratio and an assumed rate of return of 5% per year before expenses, which is not the Fund’s actual return.
The hypothetical account values and expenses may not be used to estimate the actual ending account balance or expenses you paid for the period. You may use this information to compare the ongoing costs of investing in the Fund and other funds. To do so, compare this 5% hypothetical example with the 5% hypothetical examples that appear in the shareholder reports of the other funds.
Please note that the expenses shown in the table are meant to highlight your ongoing costs only and do not reflect any transaction costs, such as sales charges (loads) on purchase payments or contingent deferred sales charges on redemptions, if any. Therefore, the hypothetical information is useful in comparing ongoing costs only, and will not help you determine the relative total costs of owning different funds. In addition, if these transaction costs were included, your costs would have been higher.
| | | | | | | | | | | | |
| | | | | ACTUAL | | HYPOTHETICAL (5% annual return before expenses) | | |
| | | Beginning
Account Value
(09/01/21) | | Ending
Account Value
(02/28/22)1 | | Expenses
Paid During
Period2 | | Ending
Account Value
(02/28/22) | | Expenses
Paid During
Period2 | | Annualized
Expense
Ratio |
| Class A | | $1,000.00 | | $954.70 | | $2.52 | | $1,022.22 | | $2.61 | | 0.52% |
| Class C | | 1,000.00 | | 951.00 | | 6.14 | | 1,018.50 | | 6.36 | | 1.27 |
| Class R | | 1,000.00 | | 953.50 | | 3.73 | | 1,020.98 | | 3.86 | | 0.77 |
| Class Y | | 1,000.00 | | 955.80 | | 1.31 | | 1,023.46 | | 1.35 | | 0.27 |
| Class R5 | | 1,000.00 | | 955.80 | | 1.31 | | 1,023.46 | | 1.35 | | 0.27 |
| Class R6 | | 1,000.00 | | 955.80 | | 1.31 | | 1,023.46 | | 1.35 | | 0.27 |
| 1 | The actual ending account value is based on the actual total return of the Fund for the period September 1, 2021 through February 28, 2022, after actual expenses and will differ from the hypothetical ending account value which is based on the Fund’s expense ratio and a hypothetical annual return of 5% before expenses. |
| 2 | Expenses are equal to the Fund’s annualized expense ratio as indicated above multiplied by the average account value over the period, multiplied by 181/365 to reflect the most recent fiscal half year. |
30 Invesco Intermediate Bond Factor Fund
Tax Information
Form 1099-DIV, Form 1042-S and other year-end tax information provide shareholders with actual calendar year amounts that should be included in their tax returns. Shareholders should consult their tax advisers.
The following distribution information is being provided as required by the Internal Revenue Code or to meet a specific state’s requirement.
The Fund designates the following amounts or, if subsequently determined to be different, the maximum amount allowable for its fiscal year ended February 28, 2022:
| | | | |
Federal and State Income Tax | | | | |
Qualified Dividend Income* | | | 1.12 | % |
Corporate Dividends Received Deduction* | | | 0.00 | % |
U.S. Treasury Obligations* | | | 15.35 | % |
Qualified Business Income* | | | 0.00 | % |
Business Interest Income* | | | 77.18 | % |
| * | The above percentages are based on ordinary income dividends paid to shareholders during the Fund’s fiscal year. |
31 Invesco Intermediate Bond Factor Fund
Trustees and Officers
The address of each trustee and officer is AIM Investment Securities Funds (Invesco Investment Securities Funds) (the “Trust”), 11 Greenway Plaza, Suite 1000, Houston, Texas 77046-1173. The trustees serve for the life of the Trust, subject to their earlier death, incapacitation, resignation, retirement or removal as more specifically provided in the Trust’s organizational documents. Each officer serves for a one year term or until their successors are elected and qualified. Column two below includes length of time served with predecessor entities, if any.
| | | | | | | | |
Name, Year of Birth and
Position(s) Held with the Trust | | Trustee and/or Officer Since | | Principal Occupation(s) During Past 5 Years | | Number of
Funds in Fund Complex
Overseen by
Trustee | | Other Directorship(s) Held by Trustee
During Past 5 Years |
| Interested Trustee | | | | | | | | |
| Martin L. Flanagan1 — 1960 Trustee and Vice Chair | | 2007 | | Executive Director, Chief Executive Officer and President, Invesco Ltd. (ultimate parent of Invesco and a global investment management firm); Trustee and Vice Chair, The Invesco Funds; Vice Chair, Investment Company Institute; and Member of Executive Board, SMU Cox School of Business Formerly: Advisor to the Board, Invesco Advisers, Inc. (formerly known as Invesco Institutional (N.A.), Inc.); Chairman and Chief Executive Officer, Invesco Advisers, Inc. (registered investment adviser); Director, Chairman, Chief Executive Officer and President, Invesco Holding Company (US), Inc. (formerly IVZ Inc.) (holding company), Invesco Group Services, Inc. (service provider) and Invesco North American Holdings, Inc. (holding company); Director, Chief Executive Officer and President, Invesco Holding Company Limited (parent of Invesco and a global investment management firm); Director, Invesco Ltd.; Chairman, Investment Company Institute and President, Co-Chief Executive Officer, Co-President, Chief Operating Officer and Chief Financial Officer, Franklin Resources, Inc. (global investment management organization) | | 188 | | None |
| 1 | Mr. Flanagan is considered an interested person (within the meaning of Section 2(a)(19) of the 1940 Act) of the Trust because he is an officer of the Adviser to the Trust, and an officer and a director of Invesco Ltd., ultimate parent of the Adviser. |
T-1 Invesco Intermediate Bond Factor Fund
Trustees and Officers–(continued)
| | | | | | | | |
Name, Year of Birth and
Position(s) Held with the Trust | | Trustee and/or Officer Since | | Principal Occupation(s) During Past 5 Years | | Number of
Funds in Fund Complex
Overseen by
Trustee | | Other Directorship(s) Held by Trustee During Past 5 Years |
| Independent Trustees | | | | | | | | |
| Christopher L. Wilson – 1957 Trustee and Chair | | 2017 | | Retired Formerly: Director, TD Asset Management USA Inc. (mutual fund complex) (22 portfolios); Managing Partner, CT2, LLC (investing and consulting firm); President/Chief Executive Officer, Columbia Funds, Bank of America Corporation; President/Chief Executive Officer, CDC IXIS Asset Management Services, Inc.; Principal & Director of Operations, Scudder Funds, Scudder, Stevens & Clark, Inc.; Assistant Vice President, Fidelity Investments | | 188 | | Formerly: enaible, Inc. (artificial intelligence technology) Director, ISO New England, Inc. (non-profit organization managing regional electricity market) |
| Beth Ann Brown – 1968 Trustee | | 2019 | | Independent Consultant Formerly: Head of Intermediary Distribution, Managing Director, Strategic Relations, Managing Director, Head of National Accounts, Senior Vice President, National Account Manager and Senior Vice President, Key Account Manager, Columbia Management Investment Advisers LLC; Vice President, Key Account Manager, Liberty Funds Distributor, Inc.; and Trustee of certain Oppenheimer Funds | | 188 | | Director, Board of Directors of Caron Engineering Inc.; Advisor, Board of Advisors of Caron Engineering Inc.; President and Director, Acton Shapleigh Youth Conservation Corps (non-profit) Formerly: President and Director of Grahamtastic Connection (non-profit) |
| Cynthia Hostetler –1962 Trustee | | 2017 | | Non-Executive Director and Trustee of a number of public and private business corporations Formerly: Director, Aberdeen Investment Funds (4 portfolios); Director, Artio Global Investment LLC (mutual fund complex); Director, Edgen Group, Inc. (specialized energy and infrastructure products distributor); Director, Genesee & Wyoming, Inc. (railroads); Head of Investment Funds and Private Equity, Overseas Private Investment Corporation; President, First Manhattan Bancorporation, Inc.; Attorney, Simpson Thacher & Bartlett LLP | | 188 | | Resideo Technologies, Inc. (smart home technology); Vulcan Materials Company (construction materials company); Trilinc Global Impact Fund; Textainer Group Holdings, (shipping container leasing company); Investment Company Institute (professional organization); Independent Directors Council (professional organization) |
Eli Jones – 1961 Trustee | | 2016 | | Professor and Dean Emeritus, Mays Business School - Texas A&M University Formerly: Dean of Mays Business School-Texas A&M University; Professor and Dean, Walton College of Business, University of Arkansas and E.J. Ourso College of Business, Louisiana State University; Director, Arvest Bank | | 188 | | Insperity, Inc. (formerly known as Administaff) (human resources provider); Member of Regional Board of Directors and Board of Directors, First Financial Bancorp (regional bank) |
| Elizabeth Krentzman – 1959 Trustee | | 2019 | | Formerly: Principal and Chief Regulatory Advisor for Asset Management Services and U.S. Mutual Fund Leader of Deloitte & Touche LLP; General Counsel of the Investment Company Institute (trade association); National Director of the Investment Management Regulatory Consulting Practice, Principal, Director and Senior Manager of Deloitte & Touche LLP; Assistant Director of the Division of Investment Management - Office of Disclosure and Investment Adviser Regulation of the U.S. Securities and Exchange Commission and various positions with the Division of Investment Management – Office of Regulatory Policy of the U.S. Securities and Exchange Commission; Associate at Ropes & Gray LLP; and Trustee of certain Oppenheimer Funds | | 188 | | Trustee of the University of Florida National Board Foundation; Member of the Cartica Funds Board of Directors (private investment funds) Formerly: Member of the University of Florida Law Center Association, Inc. Board of Trustees, Audit Committee and Membership Committee |
| Anthony J. LaCava, Jr. – 1956 Trustee | | 2019 | | Formerly: Director and Member of the Audit Committee, Blue Hills Bank (publicly traded financial institution) and Managing Partner, KPMG LLP | | 188 | | Blue Hills Bank; Chairman, Bentley University; Member, Business School Advisory Council; and Nominating Committee, KPMG LLP |
| Prema Mathai-Davis – 1950 Trustee | | 1998 | | Retired Formerly: Co-Founder & Partner of Quantalytics Research, LLC, (a FinTech Investment Research Platform for the Self-Directed Investor); Trustee of YWCA Retirement Fund; CEO of YWCA of the USA; Board member of the NY Metropolitan Transportation Authority; Commissioner of the NYC Department of Aging; Board member of Johns Hopkins Bioethics Institute | | 188 | | Member of Board of Positive Planet US (non-profit) and HealthCare Chaplaincy Network (non-profit) |
T-2 Invesco Intermediate Bond Factor Fund
Trustees and Officers–(continued)
| | | | | | | | |
Name, Year of Birth and
Position(s) Held with the Trust | | Trustee and/or Officer Since | | Principal Occupation(s) During Past 5 Years | | Number of
Funds in Fund Complex
Overseen by
Trustee | | Other Directorship(s) Held by Trustee During Past 5 Years |
| Independent Trustees–(continued) | | | | | | |
Joel W. Motley – 1952 Trustee | | 2019 | | Director of Office of Finance, Federal Home Loan Bank System; Managing Director of Carmona Motley Inc. (privately held financial advisor); Member of the Council on Foreign Relations and its Finance and Budget Committee; Chairman Emeritus of Board of Human Rights Watch and Member of its Investment Committee; and Member of Investment Committee Board of Historic Hudson Valley (non-profit cultural organization); and Member of the Board, Blue Ocean Acquisition Corp. Formerly: Managing Director of Public Capital Advisors, LLC (privately held financial advisor); Managing Director of Carmona Motley Hoffman, Inc. (privately held financial advisor); Trustee of certain Oppenheimer Funds; Director of Columbia Equity Financial Corp. (privately held financial advisor); and Member of the Vestry of Trinity Church Wall Street | | 188 | | Member of Board of Trust for Mutual Understanding (non-profit promoting the arts and environment); Member of Board of Greenwall Foundation (bioethics research foundation) and its Investment Committee; Member of Board of Friends of the LRC (non-profit legal advocacy); Board Member and Investment Committee Member of Pulitzer Center for Crisis Reporting (non-profit journalism)Positive Planet US |
Teresa M. Ressel – 1962 Trustee | | 2017 | | Non-executive director and trustee of a number of public and private business corporations Formerly: Chief Executive Officer, UBS Securities LLC (investment banking); Chief Operating Officer, UBS AG Americas (investment banking); Sr. Management Team Olayan America, The Olayan Group (international investor/commercial/industrial); Assistant Secretary for Management & Budget and Designated Chief Financial Officer, U.S. Department of Treasury; Director, Atlantic Power Corporation (power generation company) and ON Semiconductor Corporation (semiconductor manufacturing) | | 188 | | None |
Ann Barnett Stern – 1957 Trustee | | 2017 | | President, Chief Executive Officer and Board Member, Houston Endowment, Inc. a private philanthropic institution Formerly: Executive Vice President, Texas Children’s Hospital; Vice President, General Counsel and Corporate Compliance Officer, Texas Children’s Hospital; Attorney at Beck, Redden and Secrest, LLP and Andrews and Kurth LLP | | 188 | | Trustee and Board Vice Chair of Holdsworth Center Trustee and Chair of Nomination/Governance Committee, Good Reason Houston, (non-profit); Trustee and Investment Committee member of University of Texas Law School Foundation (non-profit); Board Member of Greater Houston Partnership (non-profit); Advisory Board member, Baker Institute for Public Policy at Rice University (non-profit) Formerly: Director and Audit Committee Member of Federal Reserve Bank of Dallas |
Robert C. Troccoli – 1949 Trustee | | 2016 | | Retired Formerly: Adjunct Professor, University of Denver – Daniels College of Business; and Managing Partner, KPMG LLP | | 188 | | None |
Daniel S. Vandivort –1954 Trustee | | 2019 | | President, Flyway Advisory Services LLC (consulting and property management) | | 188 | | Formerly: Trustee, Board of Trustees, Treasurer and Chairman of the Audit and Committee, Huntington Disease Foundation of America; Trustee and Governance Chair, of certain Oppenheimer Funds |
T-3 Invesco Intermediate Bond Factor Fund
Trustees and Officers–(continued)
| | | | | | | | |
Name, Year of Birth and
Position(s) Held with the Trust | | Trustee and/or Officer Since | | Principal Occupation(s) During Past 5 Years | | Number of
Funds in Fund Complex
Overseen by
Trustee | | Other Directorship(s) Held by Trustee During Past 5 Years |
| Officers | | | | | | |
Sheri Morris – 1964 President and Principal Executive Officer | | 1999 | | Head of Global Fund Services, Invesco Ltd.; President and Principal Executive Officer, The Invesco Funds; Vice President, Invesco Exchange-Traded Fund Trust, Invesco Exchange-Traded Fund Trust II, Invesco India Exchange-Traded Fund Trust, Invesco Actively Managed Exchange-Traded Fund Trust, Invesco Actively Managed Exchange-Traded Commodity Fund Trust and Invesco Exchange-Traded Self-Indexed Fund Trust; and Vice President, OppenheimerFunds, Inc. Formerly: Vice President, Treasurer and Principal Financial Officer, The Invesco Funds; Vice President, Invesco AIM Advisers, Inc., Invesco AIM Capital Management, Inc. and Invesco AIM Private Asset Management, Inc.; Assistant Vice President and Assistant Treasurer, The Invesco Funds; Vice President and Assistant Vice President, Invesco Advisers, Inc.; Assistant Vice President, Invesco AIM Capital Management, Inc. and Invesco AIM Private Asset Management, Inc.; Treasurer, Invesco Exchange-Traded Fund Trust, Invesco Exchange-Traded Fund Trust II, Invesco India Exchange-Traded Fund Trust and Invesco Actively Managed Exchange-Traded Fund Trust and Senior Vice President, Invesco Advisers, Inc. (formerly known as Invesco Institutional (N.A.), Inc.) (registered investment adviser) | | N/A | | N/A |
Jeffrey H. Kupor – 1968 Senior Vice President, Chief Legal Officer and Secretary | | 2018 | | Head of Legal of the Americas, Invesco Ltd.; Senior Vice President and Secretary, Invesco Advisers, Inc. (formerly known as Invesco Institutional (N.A.), Inc.) (registered investment adviser); Senior Vice President and Secretary, Invesco Distributors, Inc. (formerly known as Invesco AIM Distributors, Inc.); Vice President and Secretary, Invesco Investment Services, Inc. (formerly known as Invesco AIM Investment Services, Inc.) Senior Vice President, Chief Legal Officer and Secretary, The Invesco Funds; Secretary and General Counsel, Invesco Investment Advisers LLC (formerly known as Van Kampen Asset Management); Secretary and General Counsel, Invesco Capital Markets, Inc. (formerly known as Van Kampen Funds Inc.) and Chief Legal Officer, Invesco Exchange-Traded Fund Trust, Invesco Exchange-Traded Fund Trust II, Invesco India Exchange-Traded Fund Trust, Invesco Actively Managed Exchange-Traded Fund Trust, Invesco Actively Managed Exchange-Traded Commodity Fund Trust and Invesco Exchange-Traded Self-Indexed Fund Trust;; Secretary and Vice President, Harbourview Asset Management Corporation; Secretary and Vice President, OppenheimerFunds, Inc. and Invesco Managed Accounts, LLC; Secretary and Senior Vice President, OFI Global Institutional, Inc.; Secretary and Vice President, OFI SteelPath, Inc.; Secretary and Vice President, Oppenheimer Acquisition Corp.; Secretary and Vice President, Shareholder Services, Inc.; Secretary and Vice President, Trinity Investment Management Corporation Formerly: Secretary and Vice President, Jemstep, Inc.; Head of Legal, Worldwide Institutional, Invesco Ltd.; Secretary and General Counsel, INVESCO Private Capital Investments, Inc.; Senior Vice President, Secretary and General Counsel, Invesco Management Group, Inc. (formerly known as Invesco AIM Management Group, Inc.); Assistant Secretary, INVESCO Asset Management (Bermuda) Ltd.; Secretary and General Counsel, Invesco Private Capital, Inc.; Assistant Secretary and General Counsel, INVESCO Realty, Inc.; Secretary and General Counsel, Invesco Senior Secured Management, Inc.; Secretary, Sovereign G./P. Holdings Inc.; and Secretary, Invesco Indexing LLC; Secretary, W.L. Ross & Co., LLC | | N/A | | N/A |
Andrew R. Schlossberg – 1974 Senior Vice President | | 2019 | | Head of the Americas and Senior Managing Director, Invesco Ltd.; Director and Senior Vice President, Invesco Advisers, Inc. (formerly known as Invesco Institutional (N.A.), Inc.) (registered investment adviser); Director and Chairman, Invesco Investment Services, Inc. (formerly known as Invesco AIM Investment Services, Inc.) (registered transfer agent); Senior Vice President, The Invesco Funds; Director, Invesco Investment Advisers LLC (formerly known as Van Kampen Asset Management) Formerly: Director, President and Chairman, Invesco Insurance Agency, Inc.; Director, Invesco UK Limited; Director and Chief Executive, Invesco Asset Management Limited and Invesco Fund Managers Limited; Assistant Vice President, The Invesco Funds; Senior Vice President, Invesco Advisers, Inc. (formerly known as Invesco Institutional (N.A.), Inc.) (registered investment adviser); Director and Chief Executive, Invesco Administration Services Limited and Invesco Global Investment Funds Limited; Director, Invesco Distributors, Inc.; Head of EMEA, Invesco Ltd.; President, Invesco Actively Managed Exchange-Traded Commodity Fund Trust, Invesco Actively Managed Exchange-Traded Fund Trust, Invesco Exchange-Traded Fund Trust, Invesco Exchange-Traded Fund Trust II and Invesco India Exchange-Traded Fund Trust; Managing Director and Principal Executive Officer, Invesco Capital Management LLC | | N/A | | N/A |
T-4 Invesco Intermediate Bond Factor Fund
Trustees and Officers–(continued)
| | | | | | | | |
Name, Year of Birth and
Position(s) Held with the Trust | | Trustee and/or Officer Since | | Principal Occupation(s) During Past 5 Years | | Number of
Funds in Fund Complex
Overseen by
Trustee | | Other Directorship(s) Held by Trustee During Past 5 Years |
| Officers–(continued) | | | | | | | | |
John M. Zerr – 1962 Senior Vice President | | 2006 | | Chief Operating Officer of the Americas; Senior Vice President, Invesco Advisers, Inc. (formerly known as Invesco Institutional (N.A.), Inc.) (registered investment adviser); Senior Vice President, Invesco Distributors, Inc. (formerly known as Invesco AIM Distributors, Inc.); Director and Vice President, Invesco Investment Services, Inc. (formerly known as Invesco AIM Investment Services, Inc.) Senior Vice President, The Invesco Funds; Managing Director, Invesco Capital Management LLC; Director, Invesco Investment Advisers LLC (formerly known as Van Kampen Asset Management); Senior Vice President, Invesco Capital Markets, Inc. (formerly known as Van Kampen Funds Inc.); Manager, Invesco Indexing LLC; Manager, Invesco Specialized Products, LLC; Member, Invesco Canada Funds Advisory Board; Director, President and Chief Executive Officer, Invesco Corporate Class Inc. (corporate mutual fund company); and Director, Chairman, President and Chief Executive Officer, Invesco Canada Ltd. (formerly known as Invesco Trimark Ltd./Invesco Trimark Ltèe) (registered investment adviser and registered transfer agent); President, Invesco, Inc.; President, Invesco Global Direct Real Estate Feeder GP Ltd.; President, Invesco IP Holdings (Canada) Ltd; President, Invesco Global Direct Real Estate GP Ltd.; President, Invesco Financial Services Ltd. / Services Financiers Invesco Ltée; and Director and Chairman, Invesco Trust Company Formerly: President, Trimark Investments Ltd/Services Financiers Invesco Ltee; Director and Senior Vice President, Invesco Insurance Agency, Inc.; Director and Senior Vice President, Invesco Management Group, Inc. (formerly known as Invesco AIM Management Group, Inc.); Secretary and General Counsel, Invesco Management Group, Inc. (formerly known as Invesco AIM Management Group, Inc.); Secretary, Invesco Investment Services, Inc. (formerly known as Invesco AIM Investment Services, Inc.); Chief Legal Officer and Secretary, The Invesco Funds; Secretary and General Counsel, Invesco Investment Advisers LLC (formerly known as Van Kampen Asset Management); Secretary and General Counsel, Invesco Capital Markets, Inc. (formerly known as Van Kampen Funds Inc.); Chief Legal Officer, Invesco Exchange-Traded Fund Trust, Invesco Exchange-Traded Fund Trust II, Invesco India Exchange-Traded Fund Trust, Invesco Actively Managed Exchange-Traded Fund Trust, Invesco Actively Managed Exchange-Traded Commodity Fund Trust and Invesco Exchange-Traded Self-Indexed Fund Trust; Secretary, Invesco Indexing LLC; Director, Secretary, General Counsel and Senior Vice President, Van Kampen Exchange Corp.; Director, Vice President and Secretary, IVZ Distributors, Inc. (formerly known as INVESCO Distributors, Inc.); Director and Vice President, INVESCO Funds Group, Inc.; Director and Vice President, Van Kampen Advisors Inc.; Director, Vice President, Secretary and General Counsel, Van Kampen Investor Services Inc.;Director and Secretary, Invesco Distributors, Inc. (formerly known as Invesco AIM Distributors, Inc.); Director, Senior Vice President, General Counsel and Secretary, Invesco AIM Advisers, Inc. and Van Kampen Investments Inc.; Director, Vice President and Secretary, Fund Management Company; Director, Senior Vice President, Secretary, General Counsel and Vice President, Invesco AIM Capital Management, Inc.; Chief Operating Officer and General Counsel, Liberty Ridge Capital, Inc. (an investment adviser) | | N/A | | N/A |
Gregory G. McGreevey – 1962 Senior Vice President | | 2012 | | Senior Managing Director, Invesco Ltd.; Director, Chairman, President, and Chief Executive Officer, Invesco Advisers, Inc. (formerly known as Invesco Institutional (N.A.), Inc.) (registered investment adviser); Director, Invesco Mortgage Capital, Inc. and Invesco Senior Secured Management, Inc.; Senior Vice President, The Invesco Funds; President, SNW Asset Management Corporation and Invesco Managed Accounts, LLC; Chairman and Director, Invesco Private Capital, Inc.; Chairman and Director, INVESCO Private Capital Investments, Inc.; Chairman and Director, INVESCO Realty, Inc.; and Senior Vice President, Invesco Group Services, Inc. Formerly: Senior Vice President, Invesco Management Group, Inc. and Invesco Advisers, Inc.; Assistant Vice President, The Invesco Funds | | N/A | | N/A |
Adrien Deberghes – 1967 Principal Financial Officer, Treasurer and Vice President | | 2020 | | Head of the Fund Office of the CFO and Fund Administration; Vice President, Invesco Advisers, Inc.; Principal Financial Officer, Treasurer and Vice President, The Invesco Funds; Vice President, Invesco Exchange-Traded Fund Trust, Invesco Exchange-Traded Fund Trust II, Invesco India Exchange-Traded Fund Trust, Invesco Actively Managed Exchange-Traded Fund Trust, Invesco Actively Managed Exchange-Traded Commodity Fund Trust and Invesco Exchange-Traded Self-Indexed Fund Trust Formerly: Senior Vice President and Treasurer, Fidelity Investments | | N/A | | N/A |
Crissie M. Wisdom – 1969 Anti-Money Laundering Compliance Officer | | 2013 | | Anti-Money Laundering and OFAC Compliance Officer for Invesco U.S. entities including: Invesco Advisers, Inc. and its affiliates, Invesco Capital Markets, Inc., Invesco Distributors, Inc., Invesco Investment Services, Inc., The Invesco Funds, Invesco Capital Management, LLC, Invesco Trust Company; and Fraud Prevention Manager for Invesco Investment Services, Inc. | | N/A | | N/A |
T-5 Invesco Intermediate Bond Factor Fund
Trustees and Officers–(continued)
| | | | | | | | |
Name, Year of Birth and
Position(s) Held with the Trust | | Trustee and/or Officer Since | | Principal Occupation(s) During Past 5 Years | | Number of
Funds in Fund Complex
Overseen by
Trustee | | Other Directorship(s) Held by Trustee During Past 5 Years |
| Officers–(continued) | | | | | | | | |
Todd F. Kuehl – 1969 Chief Compliance Officer and Senior Vice President | | 2020 | | Chief Compliance Officer, Invesco Advisers, Inc. (registered investment adviser); and Chief Compliance Officer, The Invesco Funds and Senior Vice President Formerly: Managing Director and Chief Compliance Officer, Legg Mason (Mutual Funds); Chief Compliance Officer, Legg Mason Private Portfolio Group (registered investment adviser) | | N/A | | N/A |
Michael McMaster – 1962 Chief Tax Officer, Vice President and Assistant Treasurer | | 2020 | | Head of Global Fund Services Tax; Chief Tax Officer, Vice President and Assistant Treasurer, The Invesco Funds; Vice President, Invesco Advisers, Inc.; Assistant Treasurer, Invesco Capital Management LLC, Assistant Treasurer and Chief Tax Officer, Invesco Exchange-Traded Fund Trust, Invesco Exchange-Traded Fund Trust II, Invesco India Exchange-Traded Fund Trust, Invesco Actively Managed Exchange-Traded Fund Trust, Invesco Actively Managed Exchange-Traded Commodity Fund Trust and Invesco Exchange-Traded Self-Indexed Fund Trust; Assistant Treasurer, Invesco Specialized Products, LLC Formerly: Senior Vice President – Managing Director of Tax Services, U.S. Bank Global Fund Services (GFS) | | N/A | | N/A |
The Statement of Additional Information of the Trust includes additional information about the Fund’s Trustees and is available upon request, without charge, by calling 1.800.959.4246. Please refer to the Fund’s Statement of Additional Information for information on the Fund’s sub-advisers.
| | | | | | |
| Office of the Fund | | Investment Adviser | | Distributor | | Auditors |
11 Greenway Plaza, Suite 1000 Houston, TX 77046-1173 | | Invesco Advisers, Inc. 1555 Peachtree Street, N.E. Atlanta, GA 30309 | | Invesco Distributors, Inc. 11 Greenway Plaza, Suite 1000 Houston, TX 77046-1173 | | PricewaterhouseCoopers LLP 1000 Louisiana Street, Suite 5800 Houston, TX 77002-5678 |
| | | |
| Counsel to the Fund | | Counsel to the Independent
Trustees | | Transfer Agent | | Custodian |
Stradley Ronon Stevens & Young, LLP 2005 Market Street, Suite 2600 Philadelphia, PA 19103-7018 | | Goodwin Procter LLP 901 New York Avenue, N.W. Washington, D.C. 20001 | | Invesco Investment Services, Inc. 11 Greenway Plaza, Suite 1000 Houston, TX 77046-1173 | | State Street Bank and Trust Company 225 Franklin Street Boston, MA 02110-2801 |
T-6 Invesco Intermediate Bond Factor Fund
(This page intentionally left blank)
(This page intentionally left blank)

Go paperless with eDelivery
Visit invesco.com/edelivery to enjoy the convenience and security of anytime electronic access to your investment documents. With eDelivery, you can elect to have any or all of the following materials delivered straight to your inbox to download, save and print from your own computer:
| ∎ | | Fund reports and prospectuses |
Invesco mailing information
Send general correspondence to Invesco Investment Services, Inc., P.O. Box 219078, Kansas City, MO 64121-9078.
Important notice regarding delivery of security holder documents
To reduce Fund expenses, only one copy of most shareholder documents may be mailed to shareholders with multiple accounts at the same address (Householding). Mailing of your shareholder documents may be householded indefinitely unless you instruct us otherwise. If you do not want the mailing of these documents to be combined with those for other members of your household, please contact Invesco Investment Services, Inc. at 800 959 4246 or contact your financial institution. We will begin sending you individual copies for each account within 30 days after receiving your request.
Fund holdings and proxy voting information
The Fund provides a complete list of its portfolio holdings four times each year, at the end of each fiscal quarter. For the second and fourth quarters, the list appears, respectively, in the Fund’s semiannual and annual reports to shareholders. For the first and third quarters, the Fund files the list with the Securities and Exchange Commission (SEC) as an exhibit to its reports on Form N-PORT. The most recent list of portfolio holdings is available at invesco.com/completeqtrholdings. Shareholders can also look up the Fund’s Form N-PORT filings on the SEC website, sec.gov. The SEC file numbers for the Fund are shown below.
A description of the policies and procedures that the Fund uses to determine how to vote proxies relating to portfolio securities is available without charge, upon request, from our Client Services department at 800 959 4246, or at invesco.com/ corporate/about-us/esg. The information is also available on the SEC website, sec.gov.
Information regarding how the Fund voted proxies related to its portfolio securities during the most recent 12-month period ended June 30 is available at invesco.com/proxysearch. This information is also available on the SEC website, sec.gov.
Invesco Advisers, Inc. is an investment adviser; it provides investment advisory services to individual and institutional clients and does not sell securities. Invesco Distributors, Inc. is the US distributor for Invesco Ltd.’s retail mutual funds, exchange-traded funds and institutional money market funds. Both are wholly owned, indirect subsidiaries of Invesco Ltd.
| | | | |
| SEC file number(s): 811-05686 and 033-39519 | | Invesco Distributors, Inc. | | O-INTI-AR-1 |

| | |
| | |
| Annual Report to Shareholders | | February 28, 2022 |
Invesco Real Estate Fund
Nasdaq:
A: IARAX ∎ C: IARCX ∎ R: IARRX ∎ Y: IARYX ∎ Investor: REINX ∎ R5: IARIX ∎ R6: IARFX
Management’s Discussion of Fund Performance
| | | | |
| |
Performance summary | |
For the fiscal year ended February 28, 2022, Class A shares of Invesco Real Estate Fund (the Fund), at net asset value (NAV), underperformed the FTSE NAREIT All Equity REITs Index, the Fund’s style-specific benchmark. | |
Your Fund’s long-term performance appears later in this report. | |
| |
Fund vs. Indexes | |
Total returns, 2/28/21 to 2/28/22, at net asset value (NAV). Performance shown doesnot include applicable contingent deferred sales charges (CDSC) or front-end sales charges, which would have reduced performance. | |
Class A Shares | | | 20.12 | % |
Class C Shares | | | 19.25 | |
Class R Shares | | | 19.84 | |
Class Y Shares | | | 20.43 | |
Investor Class Shares | | | 20.23 | |
Class R5 Shares | | | 20.58 | |
Class R6 Shares | | | 20.67 | |
S&P 500 Index▼(Broad Market Index) | | | 16.39 | |
FTSE NAREIT All Equity REITs Index▼(Style-Specific Index) | | | 21.80 | |
Lipper Real Estate Funds Index∎ (Peer Group Index) | | | 19.69 | |
| |
Source(s):▼RIMES Technologies Corp.; ∎Lipper Inc. | | | | |
Market conditions and your Fund
Equity markets started the fiscal year in positive territory amid concerns about rising bond yields and inflation, with value and cyclical recovery stocks outperforming growth stocks. The successful rollout of coronavirus (COVID-19) vaccinations benefited equity markets including listed real estate.
During the second quarter of 2021, equity markets were again bolstered by the continued acceleration of vaccination rollouts and the easing of COVID-19-related restrictions. In a reversal from the first quarter, growth stocks outperformed value stocks as accommodative monetary policy continued to support economic recovery during the fiscal year. REITs delivered a positive quarter of performance, led by REITs with exposure to self-storage, apartments and regional malls. Latterly, data center REITs outperformed relative to other REITSs following the announcement of privatization activity in the sector. REITs with exposure to the lodging and health care sectors tended to under-perform relative to other REITs.
Economic data in the US continued to trend positively in the third quarter of 2021, with the unemployment rate edging lower and gross domestic product (GDP) moving higher as the economy continued to heal following the rollout of vaccines. Both fiscal and monetary policies remained accommodative with increasing expectations that the US Federal Reserve (the Fed) might tighten some of its accommodative monetary policies and taper the level of bond buying. Capital market activity for REITs remained strong with secondary equity issuance and above normal merger and acquisition activity. Earnings growth remained above long-term average, with sectors which are beneficiaries of structural growth continuing to deliver growth and sec-
tors impacted by the pandemic showing recovery in rents and occupancy.
The economic recovery in the US continued in the last quarter of 2021, although markets were impacted by concerns over inflation as well as the potential impact from the COVID-19 Omicron variant. The Fed switched from stimulative to flexible monetary policy during the fiscal year but was still supportive of the economic recovery and capital markets remained strong. Inflation levels in the US remained high as aggressive consumer demand outstripped inventory levels amidst supply chain disruptions. Against this backdrop, REIT fundamental performance delivered its trend above its 2021 growth, as most sectors continued to benefit from fundamental recovery and strong pricing power. Strong demand forecasts persisted in sectors like industrial and residential, driving cash flow growth rates above their historic averages. Retail and senior housing remained on a path to normalized occupancy levels, however the timing to reach pre-COVID-19 cash flow levels was clouded by ongoing mutations. Additionally, the timing for full recovery in office and lodging became even less certain as long-term demand seemed likely impaired.
The market environment on a year-to-date basis from January 1, 2022 to February 28, 2022 and through the end of the fiscal year remained volatile. Uncertainties over inflation prospects, interest rate policy normalization and the sustainability of the post COVID-19 economic recovery have been complicated by the negative impact of war in Eastern Europe. In our view, the current base case suggests moderated economic growth and more sustained food and energy inflation. However, uncertainty could prevail for some time and a wide range of outcomes is possible. We believe capital markets are expected to remain volatile with credit spreads and government
bond yields rising for both long and short duration bonds. General equity indices have fallen. Listed real estate has been more defensive but has still seen price declines alongside general equities.
For the fiscal year, the Fund underper-formed its style-specific benchmark, the FTSE NAREIT All Equity REITs Index. Both market allocation and stock selection detracted from the Fund’s relative performance during the fiscal year. From a real estate sector perspective, the largest detractors from the Fund’s relative performance included overweight exposure to the lodging sector as well as underweights to the outperforming self-storage and manufactured homes sectors. Key positive relative contributors included overweights to the industrial, apartment and data center sectors. Additionally, stock selection in the health care sector also benefited relative Fund performance.
Top individual detractors from the Fund’s relative performance compared to the Style-Specific Index included Public Storage and
Sunstone Hotel Investors. Public Storage is the largest owner of self-storage assets in the US. During the fiscal year, the Fund’s underweight position to Public Storage detracted from Fund performance. The self-storage sector has continued to exhibit strong operating trends with high occupancy allowing for positive rent increases, although in our view low barriers to entry and new supply coming to the market should weigh on future growth. We exited our position during the fiscal year. Sunstone Hotel Investors is a lodging REIT that focuses on the renovation or repositioning of hotels which are operated under nationally recognized brands. Sunstone Hotel Investors, as with many lodging companies, suffered from COVID-19-related travel bans. We exited our position during the fiscal year.
Top individual contributors to the Fund’s relative performance compared to the Style-Specific Index during the fiscal year included
Rexford Industrial Realty and UDR. Rexford Industrial Realty owns a portfolio of high-quality industrial assets in the Southern Cali-fornia region. Fundamentals for the industrial sector were strong during the fiscal year, driven by e-commerce and investment in tenant supply chains. The company’s outperformance was partly driven by its strong operating fundamentals and increasing growth prospects. UDR is a multi-family REIT that owns, operates and develops a diversified portfolio of apartment homes across top-tier US markets. The overall apartment sector outperformed during the fiscal year as the market rewarded sectors expected to experience improving operating results amidst a continued economic recovery.
With a changing macroeconomic and geopolitical backdrop as well as expected changes in monetary policy, the Fund seeks a balanced position, with exposure to companies we believe are able to capture near-term growth opportunities, companies with more defensive
| | |
| 2 | | Invesco Real Estate Fund |
characteristics trading at attractive valuations and sectors with long-term structural growth characteristics. At the end of the fiscal year, the Fund held overweight exposure to property types such as apartments and senior housing, which offer fundamental recovery opportunity. To gain exposure to structural growth, the Fund held overweight exposure to industrial REITs and single family residential. The Fund also held underweight exposure to some sectors that proved more durable during the fiscal year of peak COVID-19 disruption but trade at less attractive valuations or have more muted growth profiles relative to peers. This included triple net retail, medical office and self-storage REITs.
The overall portfolio is biased toward companies we believe have higher-quality assets, supply-constrained real estate market exposure, lower-leveraged balance sheets and better governance characteristics. The unpredictable macro and geopolitical environments suggest caution in taking significant active factors and macro exposures. As such, portfolio risk is still most likely to be allocated to stock or sector specific opportunities where there is a belief that attractive relative value exists.
We thank you for your continued investment in Invesco Real Estate Fund.
Portfolio manager(s):
Mark Blackburn
James Cowen
Grant Jackson – Lead
Chip McKinley
Joe Rodriguez, Jr. – Lead
Darin Turner
Ping-Ying Wang
The views and opinions expressed in management’s discussion of Fund performance are those of Invesco Advisers, Inc. and its affiliates. These views and opinions are subject to change at any time based on factors such as market and economic conditions. These views and opinions may not be relied upon as investment advice or recommendations, or as an offer for a particular security. The information is not a complete analysis of every aspect of any market, country, industry, security or the Fund. Statements of fact are from sources considered reliable, but Invesco Advisers, Inc. makes no representation or warranty as to their completeness or accuracy. Although historical performance is no guarantee of future results, these insights may help you understand our investment management philosophy.
See important Fund and, if applicable, index disclosures later in this report.
| | |
| 3 | | Invesco Real Estate Fund |
Your Fund’s Long-Term Performance
Results of a $10,000 Investment – Oldest Share Class(es)
Fund and index data from 2/29/12
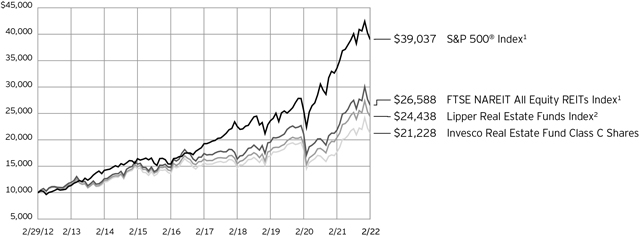
1 Source: RIMES Technologies Corp.
2 Source: Lipper Inc.
Past performance cannot guarantee future results.
The data shown in the chart include reinvested distributions, applicable sales charges and Fund expenses including management
fees. Index results include reinvested dividends, but they do not reflect sales charges. Performance of the peer group, if applicable, reflects Fund expenses and management fees; performance of a market index does
not. Performance shown in the chart does not reflect deduction of taxes a shareholder would pay on Fund distributions or sale of Fund shares.
| | |
| 4 | | Invesco Real Estate Fund |
| | | | |
| |
Average Annual Total Returns | |
As of 2/28/22, including maximum applicable sales charges | |
| |
Class A Shares | | | | |
Inception (12/31/96) | | | 8.88 | % |
10 Years | | | 7.86 | |
5 Years | | | 5.58 | |
1 Year | | | 13.49 | |
| |
Class C Shares | | | | |
Inception (5/1/95) | | | 9.97 | % |
10 Years | | | 7.82 | |
5 Years | | | 5.97 | |
1 Year | | | 18.25 | |
| |
Class R Shares | | | | |
Inception (4/30/04) | | | 8.87 | % |
10 Years | | | 8.21 | |
5 Years | | | 6.52 | |
1 Year | | | 19.84 | |
| |
Class Y Shares | | | | |
Inception (10/3/08) | | | 8.63 | % |
10 Years | | | 8.75 | |
5 Years | | | 7.04 | |
1 Year | | | 20.43 | |
| |
Investor Class Shares | | | | |
Inception (9/30/03) | | | 9.30 | % |
10 Years | | | 8.50 | |
5 Years | | | 6.83 | |
1 Year | | | 20.23 | |
| |
Class R5 Shares | | | | |
Inception (4/30/04) | | | 9.60 | % |
10 Years | | | 8.88 | |
5 Years | | | 7.18 | |
1 Year | | | 20.58 | |
| |
Class R6 Shares | | | | |
10 Years | | | 8.95 | % |
5 Years | | | 7.28 | |
1 Year | | | 20.67 | |
Class R6 shares incepted on September 24, 2012. Performance shown prior to that date is that of Class A shares at net asset value and includes the 12b-1 fees applicable to Class A shares.
The performance data quoted represent past performance and cannot guarantee future results; current performance may be lower or higher. Please visit invesco.com/ performance for the most recent month-end performance. Performance figures reflect reinvested distributions, changes in net asset value and the effect of the maximum sales charge unless otherwise stated. Performance figures do not reflect deduction of taxes a shareholder would pay on Fund distributions or sale of Fund shares. Investment return and principal value will fluctuate so that you may have a gain or loss when you sell shares.
Class A share performance reflects the maximum 5.50% sales charge, and Class C share performance reflects the applicable contingent deferred sales charge (CDSC) for the period involved. The CDSC on Class C shares is 1% for the first year after purchase. Class R, Class Y, Investor Class,
Class R5 and Class R6 shares do not have a front-end sales charge or a CDSC; therefore, performance is at net asset value.
The performance of the Fund’s share classes will differ primarily due to different sales charge structures and class expenses.
Fund performance reflects any applicable fee waivers and/or expense reimbursements. Had the adviser not waived fees and/or reimbursed expenses currently or in the past, returns would have been lower. See current prospectus for more information.
| | |
| 5 | | Invesco Real Estate Fund |
Supplemental Information
Invesco Real Estate Fund’s investment objective is total return through growth of capital and current income.
| ∎ | Unless otherwise stated, information presented in this report is as of February 28, 2022, and is based on total net assets. |
| ∎ | Unless otherwise noted, all data is provided by Invesco. |
| ∎ | To access your Fund’s reports/prospectus, visit invesco.com/fundreports. |
About indexes used in this report
| ∎ | The S&P 500® Index is an unmanaged index considered representative of the US stock market. |
| ∎ | The FTSE NAREIT All Equity REITs |
Index is an unmanaged index considered representative of US REITs.
| ∎ | The Lipper Real Estate Funds Index is an unmanaged index considered representative of real estate funds tracked by Lipper. |
| ∎ | The Fund is not managed to track the performance of any particular index, including the index(es) described here, and consequently, the performance of the Fund may deviate significantly from the performance of the index(es). |
| ∎ | A direct investment cannot be made in an index. Unless otherwise indicated, index results include reinvested dividends, and they do not reflect sales charges. Performance of the peer group, if applicable, reflects fund expenses; performance of a market index does not. |
|
|
This report must be accompanied or preceded by a currently effective Fund prospectus, which contains more complete information, including sales charges and expenses. Investors should read it carefully before investing. |
|
| NOT FDIC INSURED | MAY LOSE VALUE | NO BANK GUARANTEE |
| | |
| 6 | | Invesco Real Estate Fund |
Fund Information
Portfolio Composition
| | | | | |
| By property type | | % of total net assets |
| |
Apartments | | | | 16.51 | % |
| |
Infrastructure REITs | | | | 16.29 | |
| |
Industrial | | | | 15.31 | |
| |
Health Care | | | | 7.64 | |
| |
Shopping Centers | | | | 6.91 | |
| |
Single Family Homes | | | | 6.33 | |
| |
Specialty | | | | 6.21 | |
| |
Data Centers | | | | 4.83 | |
| |
Manufactured Homes | | | | 4.34 | |
| |
Timber REITs | | | | 3.62 | |
| |
Self Storage | | | | 3.18 | |
| |
Regional Malls | | | | 3.17 | |
| |
Free Standing | | | | 2.50 | |
| |
Lodging Resorts | | | | 2.47 | |
| |
Money Market Funds Plus Other Assets Less Liabilities | | | | 0.69 | |
Top 10 Equity Holdings*
| | | | | | | |
| | | | | % of total net assets |
| | |
| 1. | | Prologis, Inc. | | | | 8.25 | % |
| | |
| 2. | | American Tower Corp. | | | | 7.60 | |
| | |
| 3. | | SBA Communications Corp., Class A | | | | 5.48 | |
| | |
| 4. | | UDR, Inc. | | | | 4.95 | |
| | |
| 5. | | Equinix, Inc. | | | | 4.84 | |
| | |
| 6. | | AvalonBay Communities, Inc. | | | | 4.65 | |
| | |
| 7. | | Invitation Homes, Inc. | | | | 4.57 | |
| | |
| 8. | | Welltower, Inc. | | | | 4.05 | |
| | |
| 9. | | Rexford Industrial Realty, Inc. | | | | 3.77 | |
| | |
| 10. | | VICI Properties, Inc. | | | | 3.40 | |
The Fund’s holdings are subject to change, and there is no assurance that the Fund will continue to hold any particular security.
| * | Excluding money market fund holdings, if any. |
Data presented here are as of February 28, 2022.
| | |
| 7 | | Invesco Real Estate Fund |
Schedule of Investments(a)
February 28, 2022
| | | | | | | | |
| | | Shares | | | Value | |
|
| |
Common Stocks & Other Equity Interests–99.31% | |
Apartments – 16.51% | |
AvalonBay Communities, Inc. | | | 378,002 | | | $ | 90,187,498 | |
|
| |
Camden Property Trust | | | 273,160 | | | | 45,101,448 | |
|
| |
Equity Residential | | | 499,444 | | | | 42,602,573 | |
|
| |
Mid-America Apartment Communities, Inc. | | | 227,807 | | | | 46,611,590 | |
|
| |
UDR, Inc. | | | 1,752,324 | | | | 96,150,018 | |
|
| |
| | | | | | | 320,653,127 | |
|
| |
|
Data Centers–4.83% | |
Equinix, Inc. | | | 132,256 | | | | 93,866,051 | |
|
| |
|
Diversified–0.00% | |
BGP Holdings PLC(b)(c) | | | 3,547,941 | | | | 4 | |
|
| |
|
Free Standing – 2.50% | |
Agree Realty Corp. | | | 243,341 | | | | 15,610,325 | |
|
| |
Essential Properties Realty Trust, Inc. | | | 790,077 | | | | 19,973,147 | |
|
| |
NETSTREIT Corp.(d) | | | 271,282 | | | | 6,006,184 | |
|
| |
Realty Income Corp. | | | 104,594 | | | | 6,912,617 | |
|
| |
| | | | | | | 48,502,273 | |
|
| |
|
Health Care–7.64% | |
Healthcare Realty Trust, Inc. | | | 334,755 | | | | 8,730,411 | |
|
| |
Ventas, Inc. | | | 1,131,617 | | | | 61,107,318 | |
|
| |
Welltower, Inc. | | | 942,591 | | | | 78,508,404 | |
|
| |
| | | | | | | 148,346,133 | |
|
| |
|
Industrial–15.31% | |
Duke Realty Corp. | | | 1,199,075 | | | | 63,550,975 | |
|
| |
Exeter Industrial Value Fund
L.P.(b)(c)(e) | | | 4,185,000 | | | | 236,021 | |
|
| |
Prologis, Inc. | | | 1,098,559 | | | | 160,224,830 | |
|
| |
Rexford Industrial Realty, Inc. | | | 1,043,520 | | | | 73,182,058 | |
|
| |
| | | | | | | 297,193,884 | |
|
| |
|
Infrastructure REITs–16.29% | |
American Tower Corp. | | | 650,191 | | | | 147,508,832 | |
|
| |
Crown Castle International Corp. | | | 374,217 | | | | 62,340,810 | |
|
| |
SBA Communications Corp., Class A | | | 350,870 | | | | 106,450,449 | |
|
| |
| | | | | | | 316,300,091 | |
|
| |
|
Lodging Resorts–2.47% | |
Hilton Worldwide Holdings, Inc.(f) | | | 106,394 | | | | 15,837,811 | |
|
| |
RLJ Lodging Trust | | | 490,846 | | | | 6,866,935 | |
|
| |
Ryman Hospitality Properties, Inc.(d)(f) | | | 286,926 | | | | 25,281,050 | |
|
| |
| | | | | | | 47,985,796 | |
|
| |
|
Manufactured Homes–4.34% | |
Equity LifeStyle Properties, Inc. | | | 357,156 | | | | 26,650,981 | |
|
| |
Sun Communities, Inc.(d) | | | 318,471 | | | | 57,643,251 | |
|
| |
| | | | | | | 84,294,232 | |
|
| |
|
Regional Malls–3.17% | |
Simon Property Group, Inc. | | | 447,636 | | | | 61,576,808 | |
|
| |
| | |
Self Storage–3.18% | | | | | | | | |
CubeSmart | | | 337,036 | | | | 16,248,506 | |
|
| |
| | | | | | | | |
| | | Shares | | | Value | |
|
| |
Self Storage–(continued) | |
Life Storage, Inc. | | | 358,804 | | | $ | 45,420,998 | |
|
| |
| | | | 61,669,504 | |
|
| |
| | |
Shopping Centers–6.91% | | | | | | | | |
Brixmor Property Group, Inc. | | | 1,748,409 | | | | 43,920,034 | |
|
| |
Kimco Realty Corp. | | | 2,258,952 | | | | 53,153,141 | |
|
| |
SITE Centers Corp. | | | 1,054,584 | | | | 16,398,781 | |
|
| |
Urban Edge Properties | | | 1,134,941 | | | | 20,678,625 | |
|
| |
| | | | | | | 134,150,581 | |
|
| |
| | |
Single Family Homes–6.33% | | | | | | | | |
American Homes 4 Rent, Class A | | | 898,175 | | | | 34,139,632 | |
|
| |
Invitation Homes, Inc. | | | 2,348,262 | | | | 88,764,303 | |
|
| |
| | | | | | | 122,903,935 | |
|
| |
| | |
Specialty–6.21% | | | | | | | | |
Gaming and Leisure Properties, Inc. | | | 333,729 | | | | 15,154,634 | |
|
| |
Lamar Advertising Co., Class A | | | 184,335 | | | | 20,103,575 | |
|
| |
Outfront Media, Inc. | | | 725,611 | | | | 19,373,814 | |
|
| |
VICI Properties, Inc. | | | 2,361,363 | | | | 66,023,709 | |
|
| |
| | | | | | | 120,655,732 | |
|
| |
| | |
Timber REITs–3.62% | | | | | | | | |
PotlatchDeltic Corp. | | | 174,307 | | | | 9,569,454 | |
|
| |
Weyerhaeuser Co. | | | 1,560,970 | | | | 60,690,514 | |
|
| |
| | | | | | | 70,259,968 | |
|
| |
Total Common Stocks & Other Equity Interests
(Cost $1,425,480,805) | | | | | | | 1,928,358,119 | |
|
| |
|
Money Market Funds–0.84% | |
Invesco Government & Agency Portfolio, Institutional Class, 0.03%(g)(h) | | | 5,425,636 | | | | 5,425,636 | |
|
| |
Invesco Liquid Assets Portfolio, Institutional Class, 0.01%(g)(h) | | | 4,623,479 | | | | 4,623,479 | |
|
| |
Invesco Treasury Portfolio, Institutional Class, 0.01%(g)(h) | | | 6,200,726 | | | | 6,200,726 | |
|
| |
Total Money Market Funds (Cost $16,249,242) | | | | 16,249,841 | |
|
| |
TOTAL INVESTMENTS IN SECURITIES
(excluding investments purchased with cash collateral from securities on loan)-100.15% (Cost $1,441,730,047) | | | | | | | 1,944,607,960 | |
|
| |
|
Investments Purchased with Cash Collateral from Securities on Loan | |
Money Market Funds–2.17% | |
Invesco Private Government Fund, 0.12%(g)(h)(i) | | | 12,633,272 | | | | 12,633,272 | |
|
| |
Invesco Private Prime Fund, 0.08%(g)(h)(i) | | | 29,474,689 | | | | 29,477,637 | |
|
| |
Total Investments Purchased with Cash Collateral from Securities on Loan
(Cost $42,113,964) | | | | 42,110,909 | |
|
| |
TOTAL INVESTMENTS IN SECURITIES–102.32%
(Cost $1,483,844,011) | | | | 1,986,718,869 | |
|
| |
OTHER ASSETS LESS LIABILITIES–(2.32)% | | | | (44,998,809 | ) |
|
| |
NET ASSETS–100.00% | | | $ | 1,941,720,060 | |
|
| |
See accompanying Notes to Financial Statements which are an integral part of the financial statements.
| | |
| 8 | | Invesco Real Estate Fund |
Investment Abbreviations:
REIT – Real Estate Investment Trust
Notes to Schedule of Investments:
| (a) | Property type classifications used in this report are generally according to FTSE National Association of Real Estate Investment Trusts (“NAREIT”) Equity REITs Index, which is exclusively owned by NAREIT. |
| (b) | Security purchased or received in a transaction exempt from registration under the Securities Act of 1933, as amended (the “1933 Act”). The security may be resold pursuant to an exemption from registration under the 1933 Act, typically to qualified institutional buyers. The aggregate value of these securities at February 28, 2022 was $236,025, which represented less than 1% of the Fund’s Net Assets. |
| (c) | Security valued using significant unobservable inputs (Level 3). See Note 3. |
| (d) | All or a portion of this security was out on loan at February 28, 2022. |
| (e) | The Fund has a remaining commitment to purchase additional interests, which are subject to the terms of the limited partnership agreements for the following securities: |
| | | | | | | | |
| Security | | Remaining
Commitment | | | Percent
Ownership | |
Exeter Industrial Value Fund L.P. | | | $315,000 | | | | 1.26% | |
| (f) | Non-income producing security. |
| (g) | Affiliated issuer. The issuer and/or the Fund is a wholly-owned subsidiary of Invesco Ltd., or is affiliated by having an investment adviser that is under common control of Invesco Ltd. The table below shows the Fund’s transactions in, and earnings from, its investments in affiliates for the fiscal year ended February 28, 2022. |
| | | | | | | | | | | | | | | | | | | | | | | | | | | | |
| | | Value
February 28, 2021 | | | Purchases at Cost | | | Proceeds from Sales | | | Change in
Unrealized
Appreciation
(Depreciation) | | | Realized
Gain
(Loss) | | | Value
February 28, 2022 | | | Dividend
Income | |
| Investments in Affiliated Money Market Funds: | | | | | | | | | | | | | | | | | | | | | | | | | | | | |
Invesco Government & Agency Portfolio, Institutional Class | | | $ 4,107,238 | | | $ | 95,706,850 | | | $ | (94,388,452 | ) | | | $ - | | | $ | - | | | | $ 5,425,636 | | | $ | 1,058 | |
Invesco Liquid Assets Portfolio, Institutional Class | | | 5,655,340 | | | | 67,872,762 | | | | (68,903,061 | ) | | | (1,540 | ) | | | (22) | | | | 4,623,479 | | | | 534 | |
Invesco Treasury Portfolio, Institutional Class | | | 4,693,987 | | | | 109,379,256 | | | | (107,872,517 | ) | | | - | | | | - | | | | 6,200,726 | | | | 494 | |
| Investments Purchased with Cash Collateral from Securities on Loan: | | | | | | | | | | | | | | | | | | | | | | | | | | | | |
Invesco Private Government Fund | | | - | | | | 284,385,257 | | | | (271,751,985 | ) | | | - | | | | - | | | | 12,633,272 | | | | 3,171* | |
Invesco Private Prime Fund | | | - | | | | 580,520,556 | | | | (551,031,196 | ) | | | (3,055 | ) | | | (8,668) | | | | 29,477,637 | | | | 32,561* | |
Total | | | $14,456,565 | | | $ | 1,137,864,681 | | | $ | (1,093,947,211 | ) | | | $ (4,595 | ) | | $ | (8,690) | | | | $ 58,360,750 | | | $ | 37,818 | |
| | * | Represents the income earned on the investment of cash collateral, which is included in securities lending income on the Statement of Operations. Does not include rebates and fees paid to lending agent or premiums received from borrowers, if any. |
| (h) | The rate shown is the 7-day SEC standardized yield as of February 28, 2022. |
| (i) | The security has been segregated to satisfy the commitment to return the cash collateral received in securities lending transactions upon the borrower’s return of the securities loaned. See Note 1I. |
See accompanying Notes to Financial Statements which are an integral part of the financial statements.
| | |
| 9 | | Invesco Real Estate Fund |
Statement of Assets and Liabilities
February 28, 2022
| | | | |
Assets: | | | | |
Investments in unaffiliated securities, at value (Cost $1,425,480,805)* | | | $1,928,358,119 | |
|
| |
Investments in affiliated money market funds, at value (Cost $58,363,206) | | | 58,360,750 | |
|
| |
Foreign currencies, at value (Cost $223) | | | 214 | |
|
| |
Receivable for: | | | | |
Investments sold | | | 24,089,463 | |
|
| |
Fund shares sold | | | 1,912,452 | |
|
| |
Dividends | | | 657,823 | |
|
| |
Investment for trustee deferred compensation and retirement plans | | | 347,664 | |
|
| |
Other assets | | | 63,449 | |
|
| |
Total assets | | | 2,013,789,934 | |
|
| |
| |
Liabilities: | | | | |
Payable for: | | | | |
Investments purchased | | | 25,125,343 | |
|
| |
Fund shares reacquired | | | 3,195,628 | |
|
| |
Collateral upon return of securities loaned | | | 42,113,964 | |
|
| |
Accrued fees to affiliates | | | 1,041,018 | |
|
| |
Accrued trustees’ and officers’ fees and benefits | | | 19,244 | |
|
| |
Accrued other operating expenses | | | 198,452 | |
|
| |
Trustee deferred compensation and retirement plans | | | 376,225 | |
|
| |
Total liabilities | | | 72,069,874 | |
|
| |
Net assets applicable to shares outstanding | | | $1,941,720,060 | |
|
| |
Net assets consist of: | | | | |
Shares of beneficial interest | | | $1,406,349,258 | |
|
| |
Distributable earnings | | | 535,370,802 | |
|
| |
| | | $ 1,941,720,060 | |
|
| |
| | | | |
Net Assets: | | | | |
Class A | | $ | 834,552,172 | |
|
| |
Class C | | $ | 37,459,265 | |
|
| |
Class R | | $ | 114,999,102 | |
|
| |
Class Y | | $ | 296,637,818 | |
|
| |
Investor Class | | $ | 33,025,629 | |
|
| |
Class R5 | | $ | 283,546,272 | |
|
| |
Class R6 | | $ | 341,499,802 | |
|
| |
|
Shares outstanding, no par value, with an unlimited number of shares authorized: | |
Class A | | | 39,459,129 | |
|
| |
Class C | | | 1,784,944 | |
|
| |
Class R | | | 5,428,557 | |
|
| |
Class Y | | | 14,033,606 | |
|
| |
Investor Class | | | 1,566,396 | |
|
| |
Class R5 | | | 13,411,627 | |
|
| |
Class R6 | | | 16,157,593 | |
|
| |
Class A: | | | | |
Net asset value per share | | $ | 21.15 | |
|
| |
Maximum offering price per share (Net asset value of $21.15 ÷ 94.50%) | | $ | 22.38 | |
|
| |
Class C: | | | | |
Net asset value and offering price per share | | $ | 20.99 | |
|
| |
Class R: | | | | |
Net asset value and offering price per share | | $ | 21.18 | |
|
| |
Class Y: | | | | |
Net asset value and offering price per share | | $ | 21.14 | |
|
| |
Investor Class: | | | | |
Net asset value and offering price per share | | $ | 21.08 | |
|
| |
Class R5: | | | | |
Net asset value and offering price per share | | $ | 21.14 | |
|
| |
Class R6: | | | | |
Net asset value and offering price per share | | $ | 21.14 | |
|
| |
| * | At February 28, 2022, securities with an aggregate value of $40,421,424 were on loan to brokers. |
See accompanying Notes to Financial Statements which are an integral part of the financial statements.
| | |
| 10 | | Invesco Real Estate Fund |
Statement of Operations
For the year ended February 28, 2022
| | | | |
Investment income: | | | | |
| |
Dividends | | $ | 34,386,865 | |
|
| |
Dividends from affiliated money market funds (includes securities lending income of $41,319) | | | 43,405 | |
|
| |
Total investment income | | | 34,430,270 | |
|
| |
| |
Expenses: | | | | |
| |
Advisory fees | | | 14,955,326 | |
|
| |
Administrative services fees | | | 281,604 | |
|
| |
Custodian fees | | | 5,625 | |
|
| |
Distribution fees: | | | | |
Class A | | | 2,188,273 | |
|
| |
Class C | | | 414,163 | |
|
| |
Class R | | | 597,408 | |
|
| |
Investor Class | | | 56,053 | |
|
| |
Transfer agent fees – A, C, R, Y and Investor | | | 3,038,666 | |
|
| |
Transfer agent fees – R5 | | | 293,346 | |
|
| |
Transfer agent fees – R6 | | | 86,872 | |
|
| |
Trustees’ and officers’ fees and benefits | | | 42,607 | |
|
| |
Registration and filing fees | | | 132,793 | |
|
| |
Reports to shareholders | | | 142,929 | |
|
| |
Professional services fees | | | 75,531 | |
|
| |
Other | | | 36,935 | |
|
| |
Total expenses | | | 22,348,131 | |
|
| |
Less: Fees waived and/or expense offset arrangement(s) | | | (6,998 | ) |
|
| |
Net expenses | | | 22,341,133 | |
|
| |
Net investment income | | | 12,089,137 | |
|
| |
| |
Realized and unrealized gain (loss) from: | | | | |
Net realized gain (loss) from: | | | | |
Unaffiliated investment securities | | | 239,264,266 | |
|
| |
Affiliated investment securities | | | (8,690 | ) |
|
| |
| | | 239,255,576 | |
|
| |
Change in net unrealized appreciation (depreciation) of: | | | | |
Unaffiliated investment securities | | | 113,837,778 | |
|
| |
Affiliated investment securities | | | (4,595 | ) |
|
| |
Foreign currencies | | | (14 | ) |
|
| |
| | | 113,833,169 | |
|
| |
Net realized and unrealized gain | | | 353,088,745 | |
|
| |
Net increase in net assets resulting from operations | | $ | 365,177,882 | |
|
| |
See accompanying Notes to Financial Statements which are an integral part of the financial statements.
| | |
| 11 | | Invesco Real Estate Fund |
Statement of Changes in Net Assets
For the years ended February 28, 2022 and 2021
| | | | | | | | |
| | | 2022 | | | 2021 | |
| |
Operations: | | | | | | | | |
Net investment income | | $ | 12,089,137 | | | $ | 19,884,506 | |
|
| |
Net realized gain (loss) | | | 239,255,576 | | | | (71,780,657 | ) |
|
| |
Change in net unrealized appreciation | | | 113,833,169 | | | | 80,023,720 | |
| |
Net increase in net assets resulting from operations | | | 365,177,882 | | | | 28,127,569 | |
| |
| | |
Distributions to shareholders from distributable earnings: | | | | | | | | |
Class A | | | (50,935,385 | ) | | | (42,712,621 | ) |
|
| |
Class C | | | (2,081,738 | ) | | | (1,703,280 | ) |
|
| |
Class R | | | (6,621,764 | ) | | | (4,128,668 | ) |
|
| |
Class Y | | | (19,059,695 | ) | | | (14,655,908 | ) |
|
| |
Investor Class | | | (1,848,651 | ) | | | (2,129,016 | ) |
|
| |
Class R5 | | | (18,230,861 | ) | | | (17,671,184 | ) |
|
| |
Class R6 | | | (23,020,346 | ) | | | (16,566,750 | ) |
| |
Total distributions from distributable earnings | | | (121,798,440 | ) | | | (99,567,427 | ) |
| |
Return of capital: | | | | | | | | |
Class A | | | (1,296,414 | ) | | | - | |
|
| |
Class C | | | (52,984 | ) | | | - | |
|
| |
Class R | | | (168,535 | ) | | | - | |
|
| |
Class Y | | | (485,102 | ) | | | - | |
|
| |
Investor Class | | | (47,051 | ) | | | - | |
|
| |
Class R5 | | | (464,007 | ) | | | - | |
|
| |
Class R6 | | | (585,907 | ) | | | - | |
| |
Total return of capital | | | (3,100,000 | ) | | | - | |
| |
Total distributions | | | (124,898,440 | ) | | | (99,567,427 | ) |
| |
Share transactions–net: | | | | | | | | |
Class A | | | (76,686,465 | ) | | | 206,855,280 | |
|
| |
Class C | | | (6,390,505 | ) | | | 10,947,348 | |
|
| |
Class R | | | (2,326,304 | ) | | | 42,752,924 | |
|
| |
Class Y | | | 4,676,831 | | | | 63,329,437 | |
|
| |
Investor Class | | | 2,011,607 | | | | (5,310,138 | ) |
|
| |
Class R5 | | | 5,285,773 | | | | 3,700,100 | |
|
| |
Class R6 | | | (21,903,084 | ) | | | 116,960,060 | |
| |
Net increase (decrease) in net assets resulting from share transactions | | | (95,332,147 | ) | | | 439,235,011 | |
| |
Net increase in net assets | | | 144,947,295 | | | | 367,795,153 | |
| |
| | |
Net assets: | | | | | | | | |
Beginning of year | | | 1,796,772,765 | | | | 1,428,977,612 | |
| |
End of year | | $ | 1,941,720,060 | | | $ | 1,796,772,765 | |
| |
See accompanying Notes to Financial Statements which are an integral part of the financial statements.
| | |
| 12 | | Invesco Real Estate Fund |
Financial Highlights
The following schedule presents financial highlights for a share of the Fund outstanding throughout the periods indicated.
| | | | | | | | | | | | | | | | | | | | | | | | | | | | | | | | | | | | | | | | | | | | | | | | | | | | | | | | | | | | |
| | | Net asset value, beginning of period | | Net investment income (loss)(a) | | Net gains (losses) on securities (both realized and unrealized) | | Total from investment operations | | Dividends from net investment income | | Distributions from net realized gains | | Return of
capital | | Total distributions | | Net asset value, end of period | | Total return(b) | | Net assets, end of period (000’s omitted) | | Ratio of expenses to average net assets with fee waivers and/or expenses absorbed | | Ratio of expenses to average net assets without fee waivers and/or expenses absorbed | | Ratio of net investment income (loss) to average net assets | | Portfolio turnover (c) |
Class A | | | | | | | | | | | | | | | | | | | | | | | | | | | | | | | | | | | | | | | | | | | | | | | | | | | | | | | | | | | | |
Year ended 02/28/22 | | | $18.67 | | | | $ 0.10 | | | | $ 3.73 | | | | $ 3.83 | | | | $(0.21 | ) | | | $(1.11 | ) | | | $(0.03 | ) | | | $(1.35 | ) | | | $21.15 | | | | 20.12 | % | | | $834,552 | | | | 1.23 | % | | | 1.23 | % | | | 0.45 | % | | | 59 | % |
Year ended 02/28/21 | | | 20.72 | | | | 0.17 | | | | (0.89 | ) | | | (0.72 | ) | | | (0.28 | ) | | | (1.05 | ) | | | – | | | | (1.33 | ) | | | 18.67 | | | | (2.59 | ) | | | 804,058 | | | | 1.28 | | | | 1.28 | | | | 0.98 | | | | 156 | |
Year ended 02/29/20 | | | 20.94 | | | | 0.30 | | | | 1.44 | | | | 1.74 | | | | (0.35 | ) | | | (1.61 | ) | | | – | | | | (1.96 | ) | | | 20.72 | | | | 8.11 | | | | 627,197 | | | | 1.23 | | | | 1.23 | | | | 1.33 | | | | 59 | |
Year ended 02/28/19 | | | 19.32 | | | | 0.32 | | | | 2.70 | | | | 3.02 | | | | (0.28 | ) | | | (1.12 | ) | | | – | | | | (1.40 | ) | | | 20.94 | | | | 15.98 | | | | 661,325 | | | | 1.27 | | | | 1.27 | | | | 1.54 | | | | 47 | |
Year ended 02/28/18 | | | 21.64 | | | | 0.30 | | | | (1.35 | ) | | | (1.05 | ) | | | (0.25 | ) | | | (1.02 | ) | | | – | | | | (1.27 | ) | | | 19.32 | | | | (5.38 | ) | | | 659,464 | | | | 1.27 | | | | 1.27 | | | | 1.38 | | | | 44 | |
Class C | | | | | | | | | | | | | | | | | | | | | | | | | | | | | | | | | | | | | | | | | | | | | | | | | | | | | | | | | | | | |
Year ended 02/28/22 | | | 18.53 | | | | (0.07 | ) | | | 3.71 | | | | 3.64 | | | | (0.04 | ) | | | (1.11 | ) | | | (0.03 | ) | | | (1.18 | ) | | | 20.99 | | | | 19.25 | | | | 37,459 | | | | 1.98 | | | | 1.98 | | | | (0.30 | ) | | | 59 | |
Year ended 02/28/21 | | | 20.56 | | | | 0.04 | | | | (0.88 | ) | | | (0.84 | ) | | | (0.14 | ) | | | (1.05 | ) | | | – | | | | (1.19 | ) | | | 18.53 | | | | (3.33 | ) | | | 38,752 | | | | 2.03 | | | | 2.03 | | | | 0.23 | | | | 156 | |
Year ended 02/29/20 | | | 20.80 | | | | 0.13 | | | | 1.42 | | | | 1.55 | | | | (0.18 | ) | | | (1.61 | ) | | | – | | | | (1.79 | ) | | | 20.56 | | | | 7.25 | | | | 27,928 | | | | 1.98 | | | | 1.98 | | | | 0.58 | | | | 59 | |
Year ended 02/28/19 | | | 19.20 | | | | 0.16 | | | | 2.68 | | | | 2.84 | | | | (0.12 | ) | | | (1.12 | ) | | | – | | | | (1.24 | ) | | | 20.80 | | | | 15.10 | | | | 38,515 | | | | 2.02 | | | | 2.02 | | | | 0.79 | | | | 47 | |
Year ended 02/28/18 | | | 21.50 | | | | 0.14 | | | | (1.34 | ) | | | (1.20 | ) | | | (0.08 | ) | | | (1.02 | ) | | | – | | | | (1.10 | ) | | | 19.20 | | | | (6.04 | ) | | | 76,811 | | | | 2.02 | | | | 2.02 | | | | 0.63 | | | | 44 | |
Class R | | | | | | | | | | | | | | | | | | | | | | | | | | | | | | | | | | | | | | | | | | | | | | | | | | | | | | | | | | | | |
Year ended 02/28/22 | | | 18.70 | | | | 0.04 | | | | 3.73 | | | | 3.77 | | | | (0.15 | ) | | | (1.11 | ) | | | (0.03 | ) | | | (1.29 | ) | | | 21.18 | | | | 19.79 | | | | 114,999 | | | | 1.48 | | | | 1.48 | | | | 0.20 | | | | 59 | |
Year ended 02/28/21 | | | 20.74 | | | | 0.13 | | | | (0.89 | ) | | | (0.76 | ) | | | (0.23 | ) | | | (1.05 | ) | | | – | | | | (1.28 | ) | | | 18.70 | | | | (2.81 | ) | | | 103,667 | | | | 1.53 | | | | 1.53 | | | | 0.73 | | | | 156 | |
Year ended 02/29/20 | | | 20.97 | | | | 0.24 | | | | 1.43 | | | | 1.67 | | | | (0.29 | ) | | | (1.61 | ) | | | – | | | | (1.90 | ) | | | 20.74 | | | | 7.78 | | | | 60,630 | | | | 1.48 | | | | 1.48 | | | | 1.08 | | | | 59 | |
Year ended 02/28/19 | | | 19.35 | | | | 0.27 | | | | 2.70 | | | | 2.97 | | | | (0.23 | ) | | | (1.12 | ) | | | – | | | | (1.35 | ) | | | 20.97 | | | | 15.67 | | | | 68,733 | | | | 1.52 | | | | 1.52 | | | | 1.29 | | | | 47 | |
Year ended 02/28/18 | | | 21.66 | | | | 0.24 | | | | (1.34 | ) | | | (1.10 | ) | | | (0.19 | ) | | | (1.02 | ) | | | – | | | | (1.21 | ) | | | 19.35 | | | | (5.56 | ) | | | 74,367 | | | | 1.52 | | | | 1.52 | | | | 1.13 | | | | 44 | |
Class Y | | | | | | | | | | | | | | | | | | | | | | | | | | | | | | | | | | | | | | | | | | | | | | | | | | | | | | | | | | | | |
Year ended 02/28/22 | | | 18.66 | | | | 0.15 | | | | 3.73 | | | | 3.88 | | | | (0.26 | ) | | | (1.11 | ) | | | (0.03 | ) | | | (1.40 | ) | | | 21.14 | | | | 20.43 | | | | 296,638 | | | | 0.98 | | | | 0.98 | | | | 0.70 | | | | 59 | |
Year ended 02/28/21 | | | 20.71 | | | | 0.22 | | | | (0.90 | ) | | | (0.68 | ) | | | (0.32 | ) | | | (1.05 | ) | | | – | | | | (1.37 | ) | | | 18.66 | | | | (2.33 | ) | | | 256,699 | | | | 1.03 | | | | 1.03 | | | | 1.23 | | | | 156 | |
Year ended 02/29/20 | | | 20.94 | | | | 0.36 | | | | 1.42 | | | | 1.78 | | | | (0.40 | ) | | | (1.61 | ) | | | – | | | | (2.01 | ) | | | 20.71 | | | | 8.33 | | | | 204,951 | | | | 0.98 | | | | 0.98 | | | | 1.58 | | | | 59 | |
Year ended 02/28/19 | | | 19.32 | | | | 0.37 | | | | 2.70 | | | | 3.07 | | | | (0.33 | ) | | | (1.12 | ) | | | – | | | | (1.45 | ) | | | 20.94 | | | | 16.28 | | | | 188,940 | | | | 1.02 | | | | 1.02 | | | | 1.79 | | | | 47 | |
Year ended 02/28/18 | | | 21.63 | | | | 0.35 | | | | (1.34 | ) | | | (0.99 | ) | | | (0.30 | ) | | | (1.02 | ) | | | – | | | | (1.32 | ) | | | 19.32 | | | | (5.09 | ) | | | 191,203 | | | | 1.02 | | | | 1.02 | | | | 1.63 | | | | 44 | |
Investor Class | | | | | | | | | | | | | | | | | | | | | | | | | | | | | | | | | | | | | | | | | | | | | | | | | | | | | | | | | |
Year ended 02/28/22 | | | 18.61 | | | | 0.11 | | | | 3.71 | | | | 3.82 | | | | (0.21 | ) | | | (1.11 | ) | | | (0.03 | | | | (1.35 | ) | | | 21.08 | | | | 20.17 | (d) | | | 33,026 | | | | 1.16 | (d) | | | 1.16 | (d) | | | 0.52 | (d) | | | 59 | |
Year ended 02/28/21 | | | 20.65 | | | | 0.18 | | | | (0.89 | ) | | | (0.71 | ) | | | (0.28 | ) | | | (1.05 | ) | | | – | | | | (1.33 | ) | | | 18.61 | | | | (2.53 | )(d) | | | 27,546 | | | | 1.23 | (d) | | | 1.23 | (d) | | | 1.03 | (d) | | | 156 | |
Year ended 02/29/20 | | | 20.89 | | | | 0.30 | | | | 1.42 | | | | 1.72 | | | | (0.35 | ) | | | (1.61 | ) | | | – | | | | (1.96 | ) | | | 20.65 | | | | 8.06 | (d) | | | 37,537 | | | | 1.22 | (d) | | | 1.22 | (d) | | | 1.34 | (d) | | | 59 | |
Year ended 02/28/19 | | | 19.27 | | | | 0.32 | | | | 2.70 | | | | 3.02 | | | | (0.28 | ) | | | (1.12 | ) | | | – | | | | (1.40 | ) | | | 20.89 | | | | 16.05 | (d) | | | 32,447 | | | | 1.23 | (d) | | | 1.23 | (d) | | | 1.58 | (d) | | | 47 | |
Year ended 02/28/18 | | | 21.58 | | | | 0.30 | | | | (1.34 | ) | | | (1.04 | ) | | | (0.25 | ) | | | (1.02 | ) | | | – | | | | (1.27 | ) | | | 19.27 | | | | (5.33 | )(d) | | | 32,868 | | | | 1.23 | (d) | | | 1.23 | (d) | | | 1.42 | (d) | | | 44 | |
Class R5 | | | | | | | | | | | | | | | | | | | | | | | | | | | | | | | | | | | | | | | | | | | | | | | | | | | | | | | | | | | | |
Year ended 02/28/22 | | | 18.66 | | | | 0.18 | | | | 3.73 | | | | 3.91 | | | | (0.29 | ) | | | (1.11 | ) | | | (0.03 | ) | | | (1.43 | ) | | | 21.14 | | | | 20.58 | | | | 283,546 | | | | 0.86 | | | | 0.86 | | | | 0.82 | | | | 59 | |
Year ended 02/28/21 | | | 20.71 | | | | 0.25 | | | | (0.91 | ) | | | (0.66 | ) | | | (0.34 | ) | | | (1.05 | ) | | | – | | | | (1.39 | ) | | | 18.66 | | | | (2.22 | ) | | | 247,114 | | | | 0.87 | | | | 0.87 | | | | 1.39 | | | | 156 | |
Year ended 02/29/20 | | | 20.94 | | | | 0.38 | | | | 1.43 | | | | 1.81 | | | | (0.43 | ) | | | (1.61 | ) | | | – | | | | (2.04 | ) | | | 20.71 | | | | 8.47 | | | | 268,267 | | | | 0.87 | | | | 0.87 | | | | 1.69 | | | | 59 | |
Year ended 02/28/19 | | | 19.32 | | | | 0.40 | | | | 2.69 | | | | 3.09 | | | | (0.35 | ) | | | (1.12 | ) | | | – | | | | (1.47 | ) | | | 20.94 | | | | 16.41 | | | | 258,447 | | | | 0.88 | | | | 0.88 | | | | 1.93 | | | | 47 | |
Year ended 02/28/18 | | | 21.63 | | | | 0.38 | | | | (1.34 | ) | | | (0.96 | ) | | | (0.33 | ) | | | (1.02 | ) | | | – | | | | (1.35 | ) | | | 19.32 | | | | (4.96 | ) | | | 258,599 | | | | 0.89 | | | | 0.89 | | | | 1.76 | | | | 44 | |
Class R6 | | | | | | | | | | | | | | | | | | | | | | | | | | | | | | | | | | | | | | | | | | | | | | | | | | | | | | | | | | | | |
Year ended 02/28/22 | | | 18.66 | | | | 0.20 | | | | 3.72 | | | | 3.92 | | | | (0.30 | ) | | | (1.11 | ) | | | (0.03 | ) | | | (1.44 | ) | | | 21.14 | | | | 20.67 | | | | 341,500 | | | | 0.78 | | | | 0.78 | | | | 0.90 | | | | 59 | |
Year ended 02/28/21 | | | 20.71 | | | | 0.26 | | | | (0.90 | ) | | | (0.64 | ) | | | (0.36 | ) | | | (1.05 | ) | | | – | | | | (1.41 | ) | | | 18.66 | | | | (2.13 | ) | | | 318,936 | | | | 0.79 | | | | 0.79 | | | | 1.47 | | | | 156 | |
Year ended 02/29/20 | | | 20.93 | | | | 0.40 | | | | 1.44 | | | | 1.84 | | | | (0.45 | ) | | | (1.61 | ) | | | – | | | | (2.06 | ) | | | 20.71 | | | | 8.60 | | | | 202,467 | | | | 0.79 | | | | 0.79 | | | | 1.77 | | | | 59 | |
Year ended 02/28/19 | | | 19.31 | | | | 0.41 | | | | 2.70 | | | | 3.11 | | | | (0.37 | ) | | | (1.12 | ) | | | – | | | | (1.49 | ) | | | 20.93 | | | | 16.52 | | | | 160,145 | | | | 0.80 | | | | 0.80 | | | | 2.01 | | | | 47 | |
Year ended 02/28/18 | | | 21.63 | | | | 0.40 | | | | (1.35 | ) | | | (0.95 | ) | | | (0.35 | ) | | | (1.02 | ) | | | – | | | | (1.37 | ) | | | 19.31 | | | | (4.93 | ) | | | 100,866 | | | | 0.80 | | | | 0.80 | | | | 1.85 | | | | 44 | |
| (a) | Calculated using average shares outstanding. |
| (b) | Includes adjustments in accordance with accounting principles generally accepted in the United States of America and as such, the net asset value for financial reporting purposes and the returns based upon those net asset values may differ from the net asset value and returns for shareholder transactions. Does not include sales charges and is not annualized for periods less than one year, if applicable. |
| (c) | Portfolio turnover is calculated at the fund level and is not annualized for periods less than one year, if applicable. For the year ended February 28, 2021, the portfolio turnover calculation excludes the value of securities purchased of $630,639,314 and sold of $40,029,958 in the effort to realign the Fund’s portfolio holdings after the reorganization of Invesco Oppenheimer Real Estate Fund into the Fund. |
| (d) | The total return, ratio of expenses to average net assets and ratio of net investment income to average net assets reflect actual 12b-1 fees of 0.18%, 0.20%, 0.24% 0.21% and 0.21% for the years ended February 28, 2022, February 28, 2021, February 29, 2020, February 28, 2019 and February 28, 2018, respectively. |
See accompanying Notes to Financial Statements which are an integral part of the financial statements.
| | |
| 13 | | Invesco Real Estate Fund |
Notes to Financial Statements
February 28, 2022
NOTE 1–Significant Accounting Policies
Invesco Real Estate Fund (the “Fund”), is a series portfolio of AIM Investment Securities Funds (Invesco Investment Securities Funds) (the “Trust”). The Trust is organized as a Delaware statutory trust and is registered under the Investment Company Act of 1940, as amended (the “1940 Act”), as an open-end series management investment company authorized to issue an unlimited number of shares of beneficial interest. Information presented in these financial statements pertains only to the Fund. Matters affecting the Fund or each class will be voted on exclusively by the shareholders of the Fund or each class.
The Fund’s investment objective is total return through growth of capital and current income.
The Fund currently consists of seven different classes of shares: Class A, Class C, Class R, Class Y, Investor Class, Class R5 and Class R6. Class Y and Investor Class shares are available only to certain investors. Class A shares are sold with a front-end sales charge unless certain waiver criteria are met. Under certain circumstances, load waived shares may be subject to contingent deferred sales charges (“CDSC”). Class C shares are sold with a CDSC. Class R, Class Y, Investor Class, Class R5 and Class R6 shares are sold at net asset value. Class C shares held for eight years after purchase are eligible for automatic conversion into Class A shares of the same Fund (the “Conversion Feature”). The automatic conversion pursuant to the Conversion Feature will generally occur at the end of the month following the eighth anniversary after a purchase of Class C shares.
The Fund is an investment company and accordingly follows the investment company accounting and reporting guidance in accordance with Financial Accounting Standards Board Accounting Standards Codification Topic 946, Financial Services - Investment Companies.
The following is a summary of the significant accounting policies followed by the Fund in the preparation of its financial statements.
| A. | Security Valuations – Securities, including restricted securities, are valued according to the following policy. |
A security listed or traded on an exchange (except convertible securities) is valued at its last sales price or official closing price as of the close of the customary trading session on the exchange where the security is principally traded, or lacking any sales or official closing price on a particular day, the security may be valued at the closing bid price on that day. Securities traded in the over-the-counter market are valued based on prices furnished by independent pricing services or market makers. When such securities are valued by an independent pricing service they may be considered fair valued. Futures contracts are valued at the final settlement price set by an exchange on which they are principally traded. Listed options are valued at the mean between the last bid and asked prices from the exchange on which they are principally traded. Options not listed on an exchange are valued by an independent source at the mean between the last bid and asked prices. For purposes of determining net asset value (“NAV”) per share, futures and option contracts generally are valued 15 minutes after the close of the customary trading session of the New York Stock Exchange (“NYSE”).
Investments in open-end and closed-end registered investment companies that do not trade on an exchange are valued at the end-of-day net asset value per share. Investments in open-end and closed-end registered investment companies that trade on an exchange are valued at the last sales price or official closing price as of the close of the customary trading session on the exchange where the security is principally traded.
Debt obligations (including convertible securities) and unlisted equities are fair valued using an evaluated quote provided by an independent pricing service. Evaluated quotes provided by the pricing service may be determined without exclusive reliance on quoted prices, and may reflect appropriate factors such as institution-size trading in similar groups of securities, developments related to specific securities, dividend rate (for unlisted equities), yield (for debt obligations), quality, type of issue, coupon rate (for debt obligations), maturity (for debt obligations), individual trading characteristics and other market data. Pricing services generally value debt obligations assuming orderly transactions of institutional round lot size, but a fund may hold or transact in the same securities in smaller, odd lot sizes. Odd lots often trade at lower prices than institutional round lots. Debt obligations are subject to interest rate and credit risks. In addition, all debt obligations involve some risk of default with respect to interest and/or principal payments.
Foreign securities’ (including foreign exchange contracts) prices are converted into U.S. dollar amounts using the applicable exchange rates as of the close of the NYSE. If market quotations are available and reliable for foreign exchange-traded equity securities, the securities will be valued at the market quotations. Because trading hours for certain foreign securities end before the close of the NYSE, closing market quotations may become unreliable. If between the time trading ends on a particular security and the close of the customary trading session on the NYSE, events occur that the investment adviser determines are significant and make the closing price unreliable, the Fund may fair value the security. If the event is likely to have affected the closing price of the security, the security will be valued at fair value in good faith using procedures approved by the Board of Trustees. Adjustments to closing prices to reflect fair value may also be based on a screening process of an independent pricing service to indicate the degree of certainty, based on historical data, that the closing price in the principal market where a foreign security trades is not the current value as of the close of the NYSE. Foreign securities’ prices meeting the approved degree of certainty that the price is not reflective of current value will be priced at the indication of fair value from the independent pricing service. Multiple factors may be considered by the independent pricing service in determining adjustments to reflect fair value and may include information relating to sector indices, American Depositary Receipts and domestic and foreign index futures. Foreign securities may have additional risks including exchange rate changes, potential for sharply devalued currencies and high inflation, political and economic upheaval, the relative lack of issuer information, relatively low market liquidity and the potential lack of strict financial and accounting controls and standards.
Securities for which market prices are not provided by any of the above methods may be valued based upon quotes furnished by independent sources. The last bid price may be used to value equity securities. The mean between the last bid and asked prices is used to value debt obligations, including corporate loans.
Securities for which market quotations are not readily available or became unreliable are valued at fair value as determined in good faith by or under the supervision of the Trust’s officers following procedures approved by the Board of Trustees. Issuer specific events, market trends, bid/asked quotes of brokers and information providers and other market data may be reviewed in the course of making a good faith determination of a security’s fair value.
The Fund may invest in securities that are subject to interest rate risk, meaning the risk that the prices will generally fall as interest rates rise and, conversely, the prices will generally rise as interest rates fall. Specific securities differ in their sensitivity to changes in interest rates depending on their individual characteristics. Changes in interest rates may result in increased market volatility, which may affect the value and/or liquidity of certain Fund investments.
Valuations change in response to many factors including the historical and prospective earnings of the issuer, the value of the issuer’s assets, general market conditions which are not specifically related to the particular issuer, such as real or perceived adverse economic conditions, changes in the general outlook for revenues or corporate earnings, changes in interest or currency rates, regional or global instability, natural or environmental disasters, widespread disease or other public health issues, war, acts of terrorism or adverse investor sentiment generally and market liquidity. Because of the inherent uncertainties of valuation, the values reflected in the financial statements may materially differ from the value received upon actual sale of those investments.
| B. | Securities Transactions and Investment Income – Securities transactions are accounted for on a trade date basis. Realized gains or losses on sales are computed on the basis of specific identification of the securities sold. Interest income (net of withholding tax, if any) is recorded on an accrual basis from settlement date and includes coupon interest and amortization of premium and accretion of discount on debt securities as applicable. Dividend income (net of withholding tax, if any) is recorded on the ex-dividend date. |
The Fund may periodically participate in litigation related to Fund investments. As such, the Fund may receive proceeds from litigation settlements. Any proceeds received are included in the Statement of Operations as realized gain (loss) for investments no longer held and as unrealized gain (loss) for investments still held.
| | |
| 14 | | Invesco Real Estate Fund |
Brokerage commissions and mark ups are considered transaction costs and are recorded as an increase to the cost basis of securities purchased and/or a reduction of proceeds on a sale of securities. Such transaction costs are included in the determination of net realized and unrealized gain (loss) from investment securities reported in the Statement of Operations and the Statement of Changes in Net Assets and the net realized and unrealized gains (losses) on securities per share in the Financial Highlights. Transaction costs are included in the calculation of the Fund’s net asset value and, accordingly, they reduce the Fund’s total returns. These transaction costs are not considered operating expenses and are not reflected in net investment income reported in the Statement of Operations and the Statement of Changes in Net Assets, or the net investment income per share and the ratios of expenses and net investment income reported in the Financial Highlights, nor are they limited by any expense limitation arrangements between the Fund and the investment adviser.
The Fund allocates income and realized and unrealized capital gains and losses to a class based on the relative net assets of each class.
The Fund recharacterizes distributions received from REIT investments based on information provided by the REIT into the following categories: ordinary income, long-term and short-term capital gains, and return of capital. If information is not available on a timely basis from the REIT, the recharacterization will be based on available information which may include the previous year’s allocation. If new or additional information becomes available from the REIT at a later date, a recharacterization will be made in the following year. The Fund records as dividend income the amount recharacterized as ordinary income and as realized gain the amount recharacterized as capital gain in the Statement of Operations, and the amount recharacterized as return of capital as a reduction of the cost of the related investment. These recharacterizations are reflected in the accompanying financial statements.
| C. | Country Determination - For the purposes of making investment selection decisions and presentation in the Schedule of Investments, the investment adviser may determine the country in which an issuer is located and/or credit risk exposure based on various factors. These factors include the laws of the country under which the issuer is organized, where the issuer maintains a principal office, the country in which the issuer derives 50% or more of its total revenues and the country that has the primary market for the issuer’s securities, as well as other criteria. Among the other criteria that may be evaluated for making this determination are the country in which the issuer maintains 50% or more of its assets, the type of security, financial guarantees and enhancements, the nature of the collateral and the sponsor organization. Country of issuer and/or credit risk exposure has been determined to be the United States of America, unless otherwise noted. |
| D. | Distributions - Distributions from net investment income, if any, are declared and paid quarterly and are recorded on the ex-dividend date. Distributions from net realized capital gain, if any, are generally declared and paid annually and recorded on the ex-dividend date. The Fund may elect to treat a portion of the proceeds from redemptions as distributions for federal income tax purposes. |
| E. | Federal Income Taxes - The Fund intends to comply with the requirements of Subchapter M of the Internal Revenue Code of 1986, as amended (the “Internal Revenue Code”), necessary to qualify as a regulated investment company and to distribute substantially all of the Fund’s taxable earnings to shareholders. As such, the Fund will not be subject to federal income taxes on otherwise taxable income (including net realized capital gain) that is distributed to shareholders. Therefore, no provision for federal income taxes is recorded in the financial statements. |
The Fund recognizes the tax benefits of uncertain tax positions only when the position is more likely than not to be sustained. Management has analyzed the Fund’s uncertain tax positions and concluded that no liability for unrecognized tax benefits should be recorded related to uncertain tax positions. Management is not aware of any tax positions for which it is reasonably possible that the total amounts of unrecognized tax benefits will change materially in the next 12 months.
The Fund files tax returns in the U.S. Federal jurisdiction and certain other jurisdictions. Generally, the Fund is subject to examinations by such taxing authorities for up to three years after the filing of the return for the tax period.
| F. | Expenses - Fees provided for under the Rule 12b-1 plan of a particular class of the Fund are charged to the operations of such class. Transfer agency fees and expenses and other shareholder recordkeeping fees and expenses attributable to Class R5 and Class R6 are allocated based on relative net assets of Class R5 and Class R6. Sub-accounting fees attributable to Class R5 are charged to the operations of the class. Transfer agency fees and expenses and other shareholder recordkeeping fees and expenses relating to all other classes are allocated among those classes based on relative net assets. All other expenses are allocated among the classes based on relative net assets. |
| G. | Accounting Estimates - The preparation of financial statements in conformity with accounting principles generally accepted in the United States of America (“GAAP”) requires management to make estimates and assumptions that affect the reported amounts of assets and liabilities at the date of the financial statements and the reported amounts of revenues and expenses during the reporting period including estimates and assumptions related to taxation. Actual results could differ from those estimates by a significant amount. In addition, the Fund monitors for material events or transactions that may occur or become known after the period-end date and before the date the financial statements are released to print. |
| H. | Indemnifications - Under the Trust’s organizational documents, each Trustee, officer, employee or other agent of the Trust is indemnified against certain liabilities that may arise out of the performance of their duties to the Fund. Additionally, in the normal course of business, the Fund enters into contracts, including the Fund’s servicing agreements, that contain a variety of indemnification clauses. The Fund’s maximum exposure under these arrangements is unknown as this would involve future claims that may be made against the Fund that have not yet occurred. The risk of material loss as a result of such indemnification claims is considered remote. |
| I. | Securities Lending - The Fund may lend portfolio securities having a market value up to one-third of the Fund’s total assets. Such loans are secured by collateral equal to no less than the market value of the loaned securities determined daily by the securities lending provider. Such collateral will be cash or debt securities issued or guaranteed by the U.S. Government or any of its sponsored agencies. Cash collateral received in connection with these loans is invested in short-term money market instruments or affiliated, unregistered investment companies that comply with Rule 2a-7 under the 1940 Act and money market funds (collectively, “affiliated money market funds”) and is shown as such on the Schedule of Investments. The Fund bears the risk of loss with respect to the investment of collateral. It is the Fund’s policy to obtain additional collateral from or return excess collateral to the borrower by the end of the next business day, following the valuation date of the securities loaned. Therefore, the value of the collateral held may be temporarily less than the value of the securities on loan. When loaning securities, the Fund retains certain benefits of owning the securities, including the economic equivalent of dividends or interest generated by the security. Lending securities entails a risk of loss to the Fund if, and to the extent that, the market value of the securities loaned were to increase and the borrower did not increase the collateral accordingly, and the borrower failed to return the securities. The securities loaned are subject to termination at the option of the borrower or the Fund. Upon termination, the borrower will return to the Fund the securities loaned and the Fund will return the collateral. Upon the failure of the borrower to return the securities, collateral may be liquidated and the securities may be purchased on the open market to replace the loaned securities. The Fund could experience delays and costs in gaining access to the collateral and the securities may lose value during the delay which could result in potential losses to the Fund. Some of these losses may be indemnified by the lending agent. The Fund bears the risk of any deficiency in the amount of the collateral available for return to the borrower due to any loss on the collateral invested. Dividends received on cash collateral investments for securities lending transactions, which are net of compensation to counterparties, are included in Dividends from affiliated money market funds on the Statement of Operations. The aggregate value of securities out on loan, if any, is shown as a footnote on the Statement of Assets and Liabilities. |
On September 29, 2021, the Board of Trustees appointed Invesco Advisers, Inc. (the “Adviser” or “Invesco”) to serve as an affiliated securities lending agent for the Fund. Prior to September 29, 2021, the Bank of New York Mellon (“BNYM”) served as the sole securities lending agent for the Fund under the securities lending program. BNYM also continues to serve as a lending agent. To the extent the Fund utilizes the Adviser as an affiliated securities lending agent, the Fund conducts its securities lending in accordance with, and in reliance upon, no-action letters issued by the SEC staff that provide guidance on how an affiliate may act as a direct agent lender and receive compensation for those services in a manner consistent with the federal securities laws. For the year ended February 28, 2022, the Fund paid the Adviser $1,301 in fees for securities lending agent services.
| J. | Foreign Currency Translations - Foreign currency is valued at the close of the NYSE based on quotations posted by banks and major currency dealers. |
| | |
| 15 | | Invesco Real Estate Fund |
Portfolio securities and other assets and liabilities denominated in foreign currencies are translated into U.S. dollar amounts at the date of valuation. Purchases and sales of portfolio securities (net of foreign taxes withheld on disposition) and income items denominated in foreign currencies are translated into U.S. dollar amounts on the respective dates of such transactions. The Fund does not separately account for the portion of the results of operations resulting from changes in foreign exchange rates on investments and the fluctuations arising from changes in market prices of securities held. The combined results of changes in foreign exchange rates and the fluctuation of market prices on investments (net of estimated foreign tax withholding) are included with the net realized and unrealized gain or loss from investments in the Statement of Operations. Reported net realized foreign currency gains or losses arise from (1) sales of foreign currencies, (2) currency gains or losses realized between the trade and settlement dates on securities transactions, and (3) the difference between the amounts of dividends, interest, and foreign withholding taxes recorded on the Fund’s books and the U.S. dollar equivalent of the amounts actually received or paid. Net unrealized foreign currency gains and losses arise from changes in the fair values of assets and liabilities, other than investments in securities at fiscal period end, resulting from changes in exchange rates.
The Fund may invest in foreign securities, which may be subject to foreign taxes on income, gains on investments or currency repatriation, a portion of which may be recoverable. Foreign taxes, if any, are recorded based on the tax regulations and rates that exist in the foreign markets in which the Fund invests and are shown in the Statement of Operations.
| K. | Forward Foreign Currency Contracts – The Fund may engage in foreign currency transactions either on a spot (i.e. for prompt delivery and settlement) basis, or through forward foreign currency contracts, to manage or minimize currency or exchange rate risk. |
The Fund may also enter into forward foreign currency contracts for the purchase or sale of a security denominated in a foreign currency in order to “lock in” the U.S. dollar price of that security, or the Fund may also enter into forward foreign currency contracts that do not provide for physical settlement of the two currencies, but instead are settled by a single cash payment calculated as the difference between the agreed upon exchange rate and the spot rate at settlement based upon an agreed upon notional amount (non-deliverable forwards). The Fund will set aside liquid assets in an amount equal to the daily mark-to-market obligation for forward foreign currency contracts.
A forward foreign currency contract is an obligation between two parties (“Counterparties”) to purchase or sell a specific currency for an agreed-upon price at a future date. The use of forward foreign currency contracts does not eliminate fluctuations in the price of the underlying securities the Fund owns or intends to acquire but establishes a rate of exchange in advance. Fluctuations in the value of these contracts are measured by the difference in the contract date and reporting date exchange rates and are recorded as unrealized appreciation (depreciation) until the contracts are closed. When the contracts are closed, realized gains (losses) are recorded. Realized and unrealized gains (losses) on the contracts are included in the Statement of Operations. The primary risks associated with forward foreign currency contracts include failure of the Counterparty to meet the terms of the contract and the value of the foreign currency changing unfavorably. These risks may be in excess of the amounts reflected in the Statement of Assets and Liabilities.
| L. | Other Risks - The Fund’s investments are concentrated in a comparatively narrow segment of the economy. Consequently, the Fund may tend to be more volatile than other mutual funds, and the value of the Fund’s investments may tend to rise and fall more rapidly. |
Because the Fund concentrates its assets in the real estate industry, an investment in the Fund will be closely linked to the performance of the real estate markets. Property values may fall due to increasing vacancies or declining rents resulting from economic, legal, cultural or technological developments.
Emerging markets (also referred to as developing markets) are generally subject to greater market volatility, political, social and economic instability, uncertainty regarding the existence of trading markets and more governmental limitations on foreign investment than more developed markets. In addition, companies operating in emerging markets may be subject to lower trading volume and greater price fluctuations than companies in more developed markets. Securities law in many emerging market countries is relatively new and unsettled. Therefore, laws regarding foreign investment in emerging market securities, securities regulation, title to securities, and shareholder rights may change quickly and unpredictably. In addition, the enforcement of systems of taxation at federal, regional and local levels in emerging market countries may be inconsistent, and subject to sudden change. Other risks of investing in emerging markets securities may include additional transaction costs, delays in settlement procedures, and lack of timely information.
Active trading of portfolio securities may result in added expenses, a lower return and increased tax liability.
| M. | COVID-19 Risk - The COVID-19 strain of coronavirus has resulted in instances of market closures and dislocations, extreme volatility, liquidity constraints and increased trading costs. Efforts to contain its spread have resulted in travel restrictions, disruptions of healthcare systems, business operations (including business closures) and supply chains, layoffs, lower consumer demand and employee availability, and defaults and credit downgrades, among other significant economic impacts that have disrupted global economic activity across many industries. Such economic impacts may exacerbate other pre-existing political, social and economic risks locally or globally and cause general concern and uncertainty. |
The full economic impact and ongoing effects of COVID-19 (or other future epidemics or pandemics) at the macro-level and on individual businesses are unpredictable and may result in significant and prolonged effects on the Fund’s performance.
NOTE 2–Advisory Fees and Other Fees Paid to Affiliates
The Trust has entered into a master investment advisory agreement with the Adviser. Under the terms of the investment advisory agreement, the Fund accrues daily and pays monthly an advisory fee to the Adviser based on the annual rate of the Fund’s average daily net assets as follows:
| | | | | | |
| Average Daily Net Assets | | Rate | |
|
| |
First $250 million | | | 0.750 | % |
|
| |
Next $250 million | | | 0.740% | |
|
| |
Next $500 million | | | 0.730% | |
|
| |
Next $1.5 billion | | | 0.720% | |
|
| |
Next $2.5 billion | | | 0.710% | |
|
| |
Next $2.5 billion | | | 0.700% | |
|
| |
Next $2.5 billion | | | 0.690% | |
|
| |
Over $10 billion | | | 0.680% | |
|
| |
For the year ended February 28, 2022, the effective advisory fee rate incurred by the Fund was 0.73%.
Under the terms of a master sub-advisory agreement between the Adviser and each of Invesco Asset Management Deutschland GmbH, Invesco Asset Management Limited, Invesco Asset Management (Japan) Limited, Invesco Hong Kong Limited, Invesco Senior Secured Management, Inc. and Invesco Canada Ltd. (collectively, the “Affiliated Sub-Advisers”) the Adviser, not the Fund, will pay 40% of the fees paid to the Adviser to any such Affiliated Sub-Adviser(s) that provide(s) discretionary investment management services to the Fund based on the percentage of assets allocated to such Affiliated Sub-Adviser(s).
Effective June 1, 2021, the Adviser has contractually agreed, through at least June 30, 2022, to waive advisory fees and/or reimburse expenses to the extent necessary to limit total annual fund operating expenses after fee waiver and/or expense reimbursement (excluding certain items discussed below) of Class A, Class C, Class R, Class Y, Investor Class, Class R5 and Class R6 to 2.00%, 2.75%, 2.25%, 1.75%, 2.00%, 1.75% and 1.75%, respectively, of the Fund’s average daily net assets (the “expense limits”). Prior to June 1, 2021, the Adviser had contractually agreed to waive advisory fees and/or reimburse expenses of all shares to the extent necessary to limit total annual fund operating expenses after fee waiver and/or expense reimbursement (excluding certain items discussed below) of Class A, Class C,
| | |
| 16 | | Invesco Real Estate Fund |
Class R, Class Y, Investor Class, Class R5 and Class R6 shares to 1.34%, 2.09%, 1.59%, 1.09%, 1.34%, 0.97% and 0.92%, respectively, of the Fund’s average daily net assets. In determining the Adviser’s obligation to waive advisory fees and/or reimburse expenses, the following expenses are not taken into account, and could cause the total annual fund operating expenses after fee waiver and/or reimbursement to exceed the numbers reflected above: (1) interest; (2) taxes; (3) dividend expense on short sales; (4) extraordinary or non-routine items, including litigation expenses; and (5) expenses that the Fund has incurred but did not actually pay because of an expense offset arrangement. Unless Invesco continues the fee waiver agreement, it will terminate on June 30, 2022. During its term, the fee waiver agreement cannot be terminated or amended to increase the expense limits or reduce the advisory fee waivers without approval of the Board of Trustees. The Adviser did not waive fees and/or reimburse expenses during the period under these expense limits.
Further, the Adviser has contractually agreed, through at least June 30, 2023, to waive the advisory fee payable by the Fund in an amount equal to 100% of the net advisory fees the Adviser receives from the affiliated money market funds on investments by the Fund of uninvested cash (excluding investments of cash collateral from securities lending) in such affiliated money market funds.
For the year ended February 28, 2022, the Adviser waived advisory fees of $5,031.
The Trust has entered into a master administrative services agreement with Invesco pursuant to which the Fund has agreed to pay Invesco for certain administrative costs incurred in providing accounting services to the Fund. For the year ended February 28, 2022, expenses incurred under the agreement are shown in the Statement of Operations as Administrative services fees. Invesco has entered into a sub-administration agreement whereby State Street Bank and Trust Company (“SSB”) serves as fund accountant and provides certain administrative services to the Fund. Pursuant to a custody agreement with the Trust on behalf of the Fund, SSB also serves as the Fund’s custodian.
The Trust has entered into a transfer agency and service agreement with Invesco Investment Services, Inc. (“IIS”) pursuant to which the Fund has agreed to pay IIS a fee for providing transfer agency and shareholder services to the Fund and reimburse IIS for certain expenses incurred by IIS in the course of providing such services. IIS may make payments to intermediaries that provide omnibus account services, sub-accounting services and/or networking services. All fees payable by IIS to intermediaries that provide omnibus account services or sub-accounting services are charged back to the Fund, subject to certain limitations approved by the Trust’s Board of Trustees. For the year ended February 28, 2022, expenses incurred under the agreement are shown in the Statement of Operations as Transfer agent fees.
The Trust has entered into master distribution agreements with Invesco Distributors, Inc. (“IDI”) to serve as the distributor for the Class A, Class C, Class R, Investor Class, Class R5 and Class R6 shares of the Fund. The Trust has adopted plans pursuant to Rule 12b-1 under the 1940 Act with respect to the Fund’s Class A, Class C, Class R and Investor Class shares (collectively, the “Plans”). The Fund, pursuant to the Plans, reimburses IDI for its allocated share of expenses incurred for the period, up to a maximum annual rate of 0.25% of the average daily net assets of Class A shares and up to a maximum annual rate of 0.25% of the average daily net assets of Investor Class shares. The Fund pursuant to the Class C Plan and Class R Plan, pays IDI compensation at the annual rate of 1.00% of the average daily net assets of Class C shares and at the annual rate of 0.50% of the average daily net assets of Class R shares, respectively. The fees are accrued daily and paid monthly. Of the Plan payments, up to 0.25% of the average daily net assets of each class of shares may be paid to furnish continuing personal shareholder services to customers who purchase and own shares of such classes. Any amounts not paid as a service fee under the Plans would constitute an asset-based sales charge. Rules of the Financial Industry Regulatory Authority (“FINRA”) impose a cap on the total sales charges, including asset-based sales charges, that may be paid by any class of shares of the Fund. For the year ended February 28, 2022, expenses incurred under the Plans are shown in the Statement of Operations as Distribution fees.
Front-end sales commissions and CDSC (collectively, the “sales charges”) are not recorded as expenses of the Fund. Front-end sales commissions are deducted from proceeds from the sales of Fund shares prior to investment in Class A shares of the Fund. CDSC are deducted from redemption proceeds prior to remittance to the shareholder. During the year ended February 28, 2022, IDI advised the Fund that IDI retained $80,091 in front-end sales commissions from the sale of Class A shares and $2,219 and $2,944 from Class A and Class C shares, respectively, for CDSC imposed upon redemptions by shareholders.
Certain officers and trustees of the Trust are officers and directors of the Adviser, IIS and/or IDI.
NOTE 3–Additional Valuation Information
GAAP defines fair value as the price that would be received to sell an asset or paid to transfer a liability in an orderly transaction between market participants at the measurement date, under current market conditions. GAAP establishes a hierarchy that prioritizes the inputs to valuation methods, giving the highest priority to readily available unadjusted quoted prices in an active market for identical assets (Level 1) and the lowest priority to significant unobservable inputs (Level 3), generally when market prices are not readily available or are unreliable. Based on the valuation inputs, the securities or other investments are tiered into one of three levels. Changes in valuation methods may result in transfers in or out of an investment’s assigned level:
| | |
| Level 1 - | | Prices are determined using quoted prices in an active market for identical assets. |
| Level 2 - | | Prices are determined using other significant observable inputs. Observable inputs are inputs that other market participants may use in pricing a security. These may include quoted prices for similar securities, interest rates, prepayment speeds, credit risk, yield curves, loss severities, default rates, discount rates, volatilities and others. |
| Level 3 - | | Prices are determined using significant unobservable inputs. In situations where quoted prices or observable inputs are unavailable (for example, when there is little or no market activity for an investment at the end of the period), unobservable inputs may be used. Unobservable inputs reflect the Fund’s own assumptions about the factors market participants would use in determining fair value of the securities or instruments and would be based on the best available information. |
The following is a summary of the tiered valuation input levels, as of February 28, 2022. The level assigned to the securities valuations may not be an indication of the risk or liquidity associated with investing in those securities. Because of the inherent uncertainties of valuation, the values reflected in the financial statements may materially differ from the value received upon actual sale of those investments.
| | | | | | | | | | | | | | | | |
| | | Level 1 | | | Level 2 | | | Level 3 | | | Total | |
|
| |
Investments in Securities | | | | | | | | | | | | | | | | |
|
| |
Common Stocks & Other Equity Interests | | $ | 1,928,122,094 | | | $ | - | | | | $236,025 | | | $ | 1,928,358,119 | |
|
| |
Money Market Funds | | | 16,249,841 | | | | 42,110,909 | | | | - | | | | 58,360,750 | |
|
| |
Total Investments | | $ | 1,944,371,935 | | | $ | 42,110,909 | | | | $236,025 | | | $ | 1,986,718,869 | |
|
| |
NOTE 4–Expense Offset Arrangement(s)
The expense offset arrangement is comprised of transfer agency credits which result from balances in demand deposit accounts used by the transfer agent for clearing shareholder transactions. For the year ended February 28, 2022, the Fund received credits from this arrangement, which resulted in the reduction of the Fund’s total expenses of $1,967.
NOTE 5–Trustees’ and Officers’ Fees and Benefits
Trustees’ and Officers’ Fees and Benefits include amounts accrued by the Fund to pay remuneration to certain Trustees and Officers of the Fund. Trustees have the option to defer compensation payable by the Fund, and Trustees’ and Officers’ Fees and Benefits also include amounts accrued by the Fund to fund such deferred
| | |
| 17 | | Invesco Real Estate Fund |
compensation amounts. Those Trustees who defer compensation have the option to select various Invesco Funds in which their deferral accounts shall be deemed to be invested. Finally, certain current Trustees were eligible to participate in a retirement plan that provided for benefits to be paid upon retirement to Trustees over a period of time based on the number of years of service. The Fund may have certain former Trustees who also participate in a retirement plan and receive benefits under such plan. Trustees’ and Officers’ Fees and Benefits include amounts accrued by the Fund to fund such retirement benefits. Obligations under the deferred compensation and retirement plans represent unsecured claims against the general assets of the Fund.
NOTE 6–Cash Balances
The Fund is permitted to temporarily carry a negative or overdrawn balance in its account with SSB, the custodian bank. Such balances, if any at period-end, are shown in the Statement of Assets and Liabilities under the payable caption Amount due custodian. To compensate the custodian bank for such overdrafts, the overdrawn Fund may either (1) leave funds as a compensating balance in the account so the custodian bank can be compensated by earning the additional interest; or (2) compensate by paying the custodian bank at a rate agreed upon by the custodian bank and Invesco, not to exceed the contractually agreed upon rate. The Fund may not purchase additional securities when any borrowings from banks or broker-dealers exceed 5% of the Fund’s total assets, or when any borrowings from an Invesco Fund are outstanding.
NOTE 7–Distributions to Shareholders and Tax Components of Net Assets
Tax Character of Distributions to Shareholders Paid During the Fiscal Years Ended February 28, 2022 and 2021:
| | | | | | | | | | | | |
| | | 2022 | | | | | | 2021 | |
|
| |
Ordinary income* | | $ | 14,213,175 | | | | | | | $ | 28,474,597 | |
|
| |
Long-term capital gain | | | 107,585,265 | | | | | | | | 71,092,830 | |
|
| |
Return of capital | | | 3,100,000 | | | | | | | | - | |
|
| |
Total distributions | | $ | 124,898,440 | | | | | | | $ | 99,567,427 | |
|
| |
| * | Includes short-term capital gain distributions, if any. |
Tax Components of Net Assets at Period-End:
| | | | |
| | | 2022 | |
|
| |
Undistributed long-term capital gain | | $ | 50,697,419 | |
|
| |
Net unrealized appreciation – investments | | | 487,229,750 | |
|
| |
Net unrealized appreciation (depreciation) – foreign currencies | | | (14 | ) |
|
| |
Temporary book/tax differences | | | (267,006 | ) |
|
| |
Late-Year ordinary loss deferral | | | (2,289,347 | ) |
|
| |
Shares of beneficial interest | | | 1,406,349,258 | |
|
| |
Total net assets | | $ | 1,941,720,060 | |
|
| |
The difference between book-basis and tax-basis unrealized appreciation (depreciation) is due to differences in the timing of recognition of gains and losses on investments for tax and book purposes. The Fund’s net unrealized appreciation (depreciation) difference is attributable primarily to wash sales and partnerships.
The temporary book/tax differences are a result of timing differences between book and tax recognition of income and/or expenses. The Fund’s temporary book/tax differences are the result of the trustee deferral of compensation and retirement plan benefits.
Capital loss carryforward is calculated and reported as of a specific date. Results of transactions and other activity after that date may affect the amount of capital loss carryforward actually available for the Fund to utilize. The ability to utilize capital loss carryforward in the future may be limited under the Internal Revenue Code and related regulations based on the results of future transactions.
The Fund does not have a capital loss carryforward as of February 28, 2022.
NOTE 8–Investment Transactions
The aggregate amount of investment securities (other than short-term securities, U.S. Government obligations and money market funds, if any) purchased and sold by the Fund during the year ended February 28, 2022 was $1,182,751,949 and $1,375,810,051, respectively. Cost of investments, including any derivatives, on a tax basis includes the adjustments for financial reporting purposes as of the most recently completed federal income tax reporting period-end.
| | | | |
Unrealized Appreciation (Depreciation) of Investments on a Tax Basis | |
Aggregate unrealized appreciation of investments | | | $517,393,441 | |
|
| |
Aggregate unrealized (depreciation) of investments | | | (30,163,691 | ) |
|
| |
Net unrealized appreciation of investments | | | $487,229,750 | |
|
| |
Cost of investments for tax purposes is $1,499,489,119.
NOTE 9–Reclassification of Permanent Differences
Primarily as a result of differing book/tax treatment of distributions, equalization and return of capital distributions, on February 28, 2022, undistributed net investment income was increased by $7,839,138, undistributed net realized gain was decreased by $13,094,378 and shares of beneficial interest was increased by $5,255,240. Further, as a result of tax deferrals acquired in the reorganization of Invesco Oppenheimer Real Estate Fund into the Fund, and . These reclassifications had no effect on the net assets of the Fund.
| | |
| 18 | | Invesco Real Estate Fund |
NOTE 10–Share Information
| | | | | | | | | | | | | | | | |
| | | Summary of Share Activity | |
|
| |
| | | Year ended | | | Year ended | |
| | | February 28, 2022(a) | | | February 28, 2021 | |
| | | Shares | | | Amount | | | Shares | | | Amount | |
|
| |
Sold: | | | | | | | | | | | | | | | | |
Class A | | | 4,599,639 | | | $ | 101,285,343 | | | | 7,132,556 | | | $ | 126,165,784 | |
|
| |
Class C | | | 370,164 | | | | 8,176,178 | | | | 345,281 | | | | 6,138,107 | |
|
| |
Class R | | | 1,139,728 | | | | 25,110,708 | | | | 786,892 | | | | 13,901,916 | |
|
| |
Class Y | | | 4,501,276 | | | | 96,972,828 | | | | 5,073,488 | | | | 89,768,751 | |
|
| |
Investor Class | | | 286,467 | | | | 6,272,646 | | | | 182,728 | | | | 3,236,680 | |
|
| |
Class R5 | | | 4,256,177 | | | | 94,533,039 | | | | 3,854,748 | | | | 68,248,825 | |
|
| |
Class R6 | | | 4,575,867 | | | | 100,428,834 | | | | 5,151,156 | | | | 90,476,088 | |
|
| |
| | | | |
Issued as reinvestment of dividends: | | | | | | | | | | | | | | | | |
Class A | | | 2,220,547 | | | | 49,862,674 | | | | 2,438,552 | | | | 40,639,632 | |
|
| |
Class C | | | 91,442 | | | | 2,050,259 | | | | 95,609 | | | | 1,581,329 | |
|
| |
Class R | | | 301,053 | | | | 6,783,408 | | | | 246,385 | | | | 4,127,368 | |
|
| |
Class Y | | | 589,585 | | | | 13,217,508 | | | | 616,551 | | | | 10,289,152 | |
|
| |
Investor Class | | | 81,551 | | | | 1,825,391 | | | | 124,462 | | | | 2,055,082 | |
|
| |
Class R5 | | | 834,764 | | | | 18,689,560 | | | | 1,063,534 | | | | 17,633,674 | |
|
| |
Class R6 | | | 1,045,576 | | | | 23,381,188 | | | | 975,532 | | | | 16,324,034 | |
|
| |
| | | | |
Automatic conversion of Class C shares to Class A shares: | | | | | | | | | | | | | | | | |
Class A | | | 297,883 | | | | 6,499,848 | | | | 818,497 | | | | 14,428,058 | |
|
| |
Class C | | | (299,945 | ) | | | (6,499,848 | ) | | | (823,871 | ) | | | (14,428,058 | ) |
|
| |
| | | | |
Issued in connection with acquisitions:(b) | �� | | | | | | | | | | | | | | | |
Class A | | | - | | | | - | | | | 17,572,308 | | | | 293,751,283 | |
|
| |
Class C | | | - | | | | - | | | | 2,249,756 | | | | 37,367,211 | |
|
| |
Class R | | | - | | | | - | | | | 3,800,712 | | | | 63,660,703 | |
|
| |
Class Y | | | - | | | | - | | | | 5,359,726 | | | | 89,531,346 | |
|
| |
Class R5 | | | - | | | | - | | | | 480 | | | | 8,007 | |
|
| |
Class R6 | | | - | | | | - | | | | 13,725,949 | | | | 229,101,643 | |
|
| |
| | | | |
Reacquired: | | | | | | | | | | | | | | | | |
Class A | | | (10,733,231 | ) | | | (234,334,330 | ) | | | (15,160,713 | ) | | | (268,129,477 | ) |
|
| |
Class C | | | (468,088 | ) | | | (10,117,094 | ) | | | (1,133,668 | ) | | | (19,711,241 | ) |
|
| |
Class R | | | (1,556,998 | ) | | | (34,220,420 | ) | | | (2,211,851 | ) | | | (38,937,063 | ) |
|
| |
Class Y | | | (4,816,165 | ) | | | (105,513,505 | ) | | | (7,185,142 | ) | | | (126,259,812 | ) |
|
| |
Investor Class | | | (281,795 | ) | | | (6,086,430 | ) | | | (644,393 | ) | | | (10,601,900 | ) |
|
| |
Class R5 | | | (4,920,442 | ) | | | (107,936,826 | ) | | | (4,631,084 | ) | | | (82,190,406 | ) |
|
| |
Class R6 | | | (6,559,846 | ) | | | (145,713,106 | ) | | | (12,534,667 | ) | | | (218,941,705 | ) |
|
| |
Net increase (decrease) in share activity | | | (4,444,791 | ) | | $ | (95,332,147 | ) | | | 27,289,513 | | | $ | 439,235,011 | |
|
| |
| (a) | There are entities that are record owners of more than 5% of the outstanding shares of the Fund and in the aggregate own 20% of the outstanding shares of the Fund. IDI has an agreement with these entities to sell Fund shares. The Fund, Invesco and/or Invesco affiliates may make payments to these entities, which are considered to be related to the Fund, for providing services to the Fund, Invesco and/or Invesco affiliates including but not limited to services such as securities brokerage, distribution, third party record keeping and account servicing. The Fund has no knowledge as to whether all or any portion of the shares owned of record by these entities are also owned beneficially. |
| (b) | After the close of business on April 17, 2020, the Fund acquired all the net assets of Invesco Oppenheimer Real Estate Fund (the “Target Fund”) pursuant to a plan of reorganization approved by the Board of Trustees of the Fund on February 14, 2020. The reorganization was executed in order to reduce overlap and increase efficiencies in the Adviser’s product line. The acquisition was accomplished by a tax-free exchange of 42,708,931 shares of the Fund for 34,206,907 shares outstanding of the Target Fund as of the close of business on April 17, 2020. Shares of the Target Fund were exchanged for the like class of shares of the Fund, based on the relative net asset value of the Target Fund to the net asset value of the Fund on the close of business, April 17, 2020. The Target Fund’s net assets as of the close of business on April 17, 2020 of $713,420,193, including $37,161,369 of unrealized appreciation, were combined with those of the Fund. The net assets of the Fund immediately before the acquisition were $1,201,814,189 and $1,915,234,382 immediately after the acquisition. |
| | The pro forma results of operations for the year ended February 28, 2021 assuming the reorganization had been completed on March 1, 2020, the beginning of the annual reporting period are as follows: |
| | | | |
Net investment income | | $ | 23,400,431 | |
|
| |
Net realized/unrealized gains (losses) | | | (127,280,092 | ) |
|
| |
Change in net assets resulting from operations | | $ | (103,879,661 | ) |
|
| |
As the combined investment portfolios have been managed as a single integrated portfolio since the acquisition was completed, it is not practicable to separate the amounts of revenue and earnings of the Target Fund that has been included in the Fund’s Statement of Operations since April 18, 2020.
| | |
| 19 | | Invesco Real Estate Fund |
Report of Independent Registered Public Accounting Firm
To the Board of Trustees of AIM Investment Securities Funds (Invesco Investment Securities Funds) and Shareholders of Invesco Real Estate Fund
Opinion on the Financial Statements
We have audited the accompanying statement of assets and liabilities, including the schedule of investments, of Invesco Real Estate Fund (one of the funds constituting AIM Investment Securities Funds (Invesco Investment Securities Funds), referred to hereafter as the “Fund”) as of February 28, 2022, the related statement of operations for the year ended February 28, 2022, the statement of changes in net assets for each of the two years in the period ended February 28, 2022, including the related notes, and the financial highlights for each of the five years in the period ended February 28, 2022 (collectively referred to as the “financial statements”). In our opinion, the financial statements present fairly, in all material respects, the financial position of the Fund as of February 28, 2022, the results of its operations for the year then ended, the changes in its net assets for each of the two years in the period ended February 28, 2022 and the financial highlights for each of the five years in the period ended February 28, 2022 in conformity with accounting principles generally accepted in the United States of America.
Basis for Opinion
These financial statements are the responsibility of the Fund’s management. Our responsibility is to express an opinion on the Fund’s financial statements based on our audits. We are a public accounting firm registered with the Public Company Accounting Oversight Board (United States) (PCAOB) and are required to be independent with respect to the Fund in accordance with the U.S. federal securities laws and the applicable rules and regulations of the Securities and Exchange Commission and the PCAOB.
We conducted our audits of these financial statements in accordance with the standards of the PCAOB. Those standards require that we plan and perform the audit to obtain reasonable assurance about whether the financial statements are free of material misstatement, whether due to error or fraud.
Our audits included performing procedures to assess the risks of material misstatement of the financial statements, whether due to error or fraud, and performing procedures that respond to those risks. Such procedures included examining, on a test basis, evidence regarding the amounts and disclosures in the financial statements. Our audits also included evaluating the accounting principles used and significant estimates made by management, as well as evaluating the overall presentation of the financial statements. Our procedures included confirmation of securities owned as of February 28, 2022 by correspondence with the custodian, transfer agent and brokers; when replies were not received from brokers, we performed other auditing procedures. We believe that our audits provide a reasonable basis for our opinion.
/s/PricewaterhouseCoopers LLP
Houston, Texas
April 28, 2022
We have served as the auditor of one or more of the investment companies in the Invesco group of investment companies since at least 1995. We have not been able to determine the specific year we began serving as auditor.
| | |
| 20 | | Invesco Real Estate Fund |
Calculating your ongoing Fund expenses
Example
As a shareholder of the Fund, you incur two types of costs: (1) transaction costs, which may include sales charges (loads) on purchase payments or contingent deferred sales charges on redemptions, if any; and (2) ongoing costs, including management fees, distribution and/or service (12b-1) fees, and other Fund expenses. This example is intended to help you understand your ongoing costs (in dollars) of investing in the Fund and to compare these costs with ongoing costs of investing in other mutual funds. The example is based on an investment of $1,000 invested at the beginning of the period and held for the entire period September 1, 2021 through February 28, 2022.
Actual expenses
The table below provides information about actual account values and actual expenses. You may use the information in this table, together with the amount you invested, to estimate the expenses that you paid over the period. Simply divide your account value by $1,000 (for example, an $8,600 account value divided by $1,000 = 8.6), then multiply the result by the number in the table under the heading entitled “Actual Expenses Paid During Period” to estimate the expenses you paid on your account during this period.
Hypothetical example for comparison purposes
The table below also provides information about hypothetical account values and hypothetical expenses based on the Fund’s actual expense ratio and an assumed rate of return of 5% per year before expenses, which is not the Fund’s actual return.
The hypothetical account values and expenses may not be used to estimate the actual ending account balance or expenses you paid for the period. You may use this information to compare the ongoing costs of investing in the Fund and other funds. To do so, compare this 5% hypothetical example with the 5% hypothetical examples that appear in the shareholder reports of the other funds.
Please note that the expenses shown in the table are meant to highlight your ongoing costs only and do not reflect any transaction costs, such as sales charges (loads) on purchase payments or contingent deferred sales charges on redemptions, if any. Therefore, the hypothetical information is useful in comparing ongoing costs only, and will not help you determine the relative total costs of owning different funds. In addition, if these transaction costs were included, your costs would have been higher.
| | | | | | | | | | | | |
| | | | | ACTUAL | | HYPOTHETICAL (5% annual return before expenses) | | |
| | | Beginning Account Value (09/01/21) | | Ending Account Value (02/28/22)1 | | Expenses Paid During Period2 | | Ending Account Value (02/28/22) | | Expenses Paid During Period2 | | Annualized Expense Ratio |
Class A | | $1,000.00 | | $960.80 | | $5.88 | | $1,018.79 | | $6.06 | | 1.21% |
Class C | | 1,000.00 | | 957.60 | | 9.51 | | 1,015.08 | | 9.79 | | 1.96 |
Class R | | 1,000.00 | | 960.10 | | 7.10 | | 1,017.55 | | 7.30 | | 1.46 |
Class Y | | 1,000.00 | | 962.00 | | 4.67 | | 1,020.03 | | 4.81 | | 0.96 |
Investor Class | | 1,000.00 | | 961.30 | | 5.35 | | 1,019.34 | | 5.51 | | 1.10 |
Class R5 | | 1,000.00 | | 962.10 | | 4.23 | | 1,020.48 | | 4.36 | | 0.87 |
Class R6 | | 1,000.00 | | 962.90 | | 3.84 | | 1,020.88 | | 3.96 | | 0.79 |
| 1 | The actual ending account value is based on the actual total return of the Fund for the period September 1, 2021 through February 28, 2022, after actual expenses and will differ from the hypothetical ending account value which is based on the Fund’s expense ratio and a hypothetical annual return of 5% before expenses. |
| 2 | Expenses are equal to the Fund’s annualized expense ratio as indicated above multiplied by the average account value over the period, multiplied by 181/365 to reflect the most recent fiscal half year. |
| | |
| 21 | | Invesco Real Estate Fund |
Tax Information
Form 1099-DIV, Form 1042-S and other year–end tax information provide shareholders with actual calendar year amounts that should be included in their tax returns. Shareholders should consult their tax advisers.
The following distribution information is being provided as required by the Internal Revenue Code or to meet a specific state’s requirement.
The Fund designates the following amounts or, if subsequently determined to be different, the maximum amount allowable for its fiscal year ended February 28, 2022:
| | | | | | | | |
Federal and State Income Tax | | | | | | |
Long-Term Capital Gain Distributions | | | $115,941,265 | | | | | |
Qualified Dividend Income* | | | 2.51 | % | | | | |
Corporate Dividends Received Deduction* | | | 0.00 | % | | | | |
U.S. Treasury Obligations* | | | 0.00 | % | | | | |
Qualified Business Income* | | | 93.73 | % | | | | |
Business Interest Income* | | | 0.00 | % | | | | |
|
| * The above percentages are based on ordinary income dividends paid to shareholders during the Fund’s fiscal year. | |
| | |
| 22 | | Invesco Real Estate Fund |
Trustees and Officers
The address of each trustee and officer is AIM Investment Securities Funds (Invesco Investment Securities Funds) (the “Trust”), 11 Greenway Plaza, Suite 1000, Houston, Texas 77046-1173. The trustees serve for the life of the Trust, subject to their earlier death, incapacitation, resignation, retirement or removal as more specifically provided in the Trust’s organizational documents. Each officer serves for a one year term or until their successors are elected and qualified. Column two below includes length of time served with predecessor entities, if any.
| | | | | | | | |
Name, Year of Birth and
Position(s) Held with the Trust | | Trustee and/or Officer Since | | Principal Occupation(s) During Past 5 Years | | Number of Funds in Fund Complex
Overseen by
Trustee | | Other Directorship(s)
Held by Trustee During Past 5 Years |
| Interested Trustee | | | | | | | | |
| Martin L. Flanagan1 - 1960 Trustee and Vice Chair | | 2007 | | Executive Director, Chief Executive Officer and President, Invesco Ltd. (ultimate parent of Invesco and a global investment management firm); Trustee and Vice Chair, The Invesco Funds; Vice Chair, Investment Company Institute; and Member of Executive Board, SMU Cox School of Business Formerly: Advisor to the Board, Invesco Advisers, Inc. (formerly known as Invesco Institutional (N.A.), Inc.); Chairman and Chief Executive Officer, Invesco Advisers, Inc. (registered investment adviser); Director, Chairman, Chief Executive Officer and President, Invesco Holding Company (US), Inc. (formerly IVZ Inc.) (holding company), Invesco Group Services, Inc. (service provider) and Invesco North American Holdings, Inc. (holding company); Director, Chief Executive Officer and President, Invesco Holding Company Limited (parent of Invesco and a global investment management firm); Director, Invesco Ltd.; Chairman, Investment Company Institute and President, Co-Chief Executive Officer, Co-President, Chief Operating Officer and Chief Financial Officer, Franklin Resources, Inc. (global investment management organization) | | 188 | | None |
| 1 | Mr. Flanagan is considered an interested person (within the meaning of Section 2(a)(19) of the 1940 Act) of the Trust because he is an officer of the Adviser to the Trust, and an officer and a director of Invesco Ltd., ultimate parent of the Adviser. |
| | |
| T-1 | | Invesco Real Estate Fund |
Trustees and Officers–(continued)
| | | | | | | | |
Name, Year of Birth and
Position(s) Held with the Trust | | Trustee and/or Officer Since | | Principal Occupation(s) During Past 5 Years | | Number of Funds in Fund Complex
Overseen by
Trustee | | Other Directorship(s)
Held by Trustee During Past 5 Years |
| Independent Trustees | | | | | | | | |
| Christopher L. Wilson - 1957 Trustee and Chair | | 2017 | | Retired Formerly: Director, TD Asset Management USA Inc. (mutual fund complex) (22 portfolios); Managing Partner, CT2, LLC (investing and consulting firm); President/Chief Executive Officer, Columbia Funds, Bank of America Corporation; President/Chief Executive Officer, CDC IXIS Asset Management Services, Inc.; Principal & Director of Operations, Scudder Funds, Scudder, Stevens & Clark, Inc.; Assistant Vice President, Fidelity Investments | | 188 | | Formerly: enaible, Inc. (artificial intelligence technology)
Director, ISO New England, Inc. (non-profit organization managing regional electricity market) |
Beth Ann Brown - 1968 Trustee | | 2019 | | Independent Consultant Formerly: Head of Intermediary Distribution, Managing Director, Strategic Relations, Managing Director, Head of National Accounts, Senior Vice President, National Account Manager and Senior Vice President, Key Account Manager, Columbia Management Investment Advisers LLC; Vice President, Key Account Manager, Liberty Funds Distributor, Inc.; and Trustee of certain Oppenheimer Funds | | 188 | | Director, Board of Directors of Caron Engineering Inc.; Advisor, Board of Advisors of Caron Engineering Inc.; President and Director, Acton Shapleigh Youth Conservation Corps (non-profit)
Formerly: President and Director of Grahamtastic Connection (non-profit) |
Cynthia Hostetler -1962 Trustee | | 2017 | | Non-Executive Director and Trustee of a number of public and private business corporations Formerly: Director, Aberdeen Investment Funds (4 portfolios); Director, Artio Global Investment LLC (mutual fund complex); Director, Edgen Group, Inc. (specialized energy and infrastructure products distributor); Director, Genesee & Wyoming, Inc. (railroads); Head of Investment Funds and Private Equity, Overseas Private Investment Corporation; President, First Manhattan Bancorporation, Inc.; Attorney, Simpson Thacher & Bartlett LLP | | 188 | | Resideo Technologies, Inc. (smart home technology); Vulcan Materials Company (construction materials company); Trilinc Global Impact Fund; Textainer Group Holdings, (shipping container leasing company); Investment Company Institute (professional organization); Independent Directors Council (professional organization) |
Eli Jones - 1961 Trustee | | 2016 | | Professor and Dean Emeritus, Mays Business School - Texas A&M University Formerly: Dean of Mays Business School-Texas A&M University; Professor and Dean, Walton College of Business, University of Arkansas and E.J. Ourso College of Business, Louisiana State University; Director, Arvest Bank | | 188 | | Insperity, Inc. (formerly known as Administaff) (human resources provider); Member of Regional Board of Directors and Board of Directors, First Financial Bancorp (regional bank) |
| Elizabeth Krentzman - 1959 Trustee | | 2019 | | Formerly: Principal and Chief Regulatory Advisor for Asset Management Services and U.S. Mutual Fund Leader of Deloitte & Touche LLP; General Counsel of the Investment Company Institute (trade association); National Director of the Investment Management Regulatory Consulting Practice, Principal, Director and Senior Manager of Deloitte & Touche LLP; Assistant Director of the Division of Investment Management - Office of Disclosure and Investment Adviser Regulation of the U.S. Securities and Exchange Commission and various positions with the Division of Investment Management - Office of Regulatory Policy of the U.S. Securities and Exchange Commission; Associate at Ropes & Gray LLP; and Trustee of certain Oppenheimer Funds | | 188 | | Trustee of the University of Florida National Board Foundation; Member of the Cartica Funds Board of Directors (private investment funds) Formerly: Member of the University of Florida Law Center Association, Inc. Board of Trustees, Audit Committee and Membership Committee |
| Anthony J. LaCava, Jr. - 1956 Trustee | | 2019 | | Formerly: Director and Member of the Audit Committee, Blue Hills Bank (publicly traded financial institution) and Managing Partner, KPMG LLP | | 188 | | Blue Hills Bank; Chairman, Bentley University; Member, Business School Advisory Council; and Nominating Committee, KPMG LLP |
| Prema Mathai-Davis - 1950 Trustee | | 1998 | | Retired Formerly: Co-Founder & Partner of Quantalytics Research, LLC, (a FinTech Investment Research Platform for the Self-Directed Investor); Trustee of YWCA Retirement Fund; CEO of YWCA of the USA; Board member of the NY Metropolitan Transportation Authority; Commissioner of the NYC Department of Aging; Board member of Johns Hopkins Bioethics Institute | | 188 | | Member of Board of Positive Planet US (non-profit) and HealthCare Chaplaincy Network (non-profit) |
| | |
| T-2 | | Invesco Real Estate Fund |
Trustees and Officers–(continued)
| | | | | | | | |
Name, Year of Birth and
Position(s) Held with the Trust | | Trustee and/or Officer Since | | Principal Occupation(s) During Past 5 Years | | Number of Funds in Fund Complex
Overseen by
Trustee | | Other Directorship(s)
Held by Trustee During Past 5 Years |
Independent Trustees–(continued) | | | | | | |
Joel W. Motley - 1952
Trustee | | 2019 | | Director of Office of Finance, Federal Home Loan Bank System; Managing Director of Carmona Motley Inc. (privately held financial advisor); Member of the Council on Foreign Relations and its Finance and Budget Committee; Chairman Emeritus of Board of Human Rights Watch and Member of its Investment Committee; and Member of Investment Committee Board of Historic Hudson Valley (non-profit cultural organization); and Member of the Board, Blue Ocean Acquisition Corp. Formerly: Managing Director of Public Capital Advisors, LLC (privately held financial advisor); Managing Director of Carmona Motley Hoffman, Inc. (privately held financial advisor); Trustee of certain Oppenheimer Funds; Director of Columbia Equity Financial Corp. (privately held financial advisor); and Member of the Vestry of Trinity Church Wall Street | | 188 | | Member of Board of Trust for Mutual Understanding (non-profit promoting the arts and environment); Member of Board of Greenwall Foundation (bioethics research foundation) and its Investment Committee; Member of Board of Friends of the LRC (non-profit legal advocacy); Board Member and Investment Committee Member of Pulitzer Center for Crisis Reporting (non-profit journalism) Positive Planet US |
Teresa M. Ressel - 1962
Trustee | | 2017 | | Non-executive director and trustee of a number of public and private business corporations Formerly: Chief Executive Officer, UBS Securities LLC (investment banking); Chief Operating Officer, UBS AG Americas (investment banking); Sr. Management Team Olayan America, The Olayan Group (international investor/commercial/industrial); Assistant Secretary for Management & Budget and Designated Chief Financial Officer, U.S. Department of Treasury; Director, Atlantic Power Corporation (power generation company) and ON Semiconductor Corporation (semiconductor manufacturing) | | 188 | | None |
Ann Barnett Stern - 1957
Trustee | | 2017 | | President, Chief Executive Officer and Board Member, Houston Endowment, Inc. a private philanthropic institution Formerly: Executive Vice President, Texas Children’s Hospital; Vice President, General Counsel and Corporate Compliance Officer, Texas Children’s Hospital; Attorney at Beck, Redden and Secrest, LLP and Andrews and Kurth LLP | | 188 | | Trustee and Board Vice Chair of Holdsworth Center Trustee and Chair of Nomination/Governance Committee, Good Reason Houston, (non-profit); Trustee and Investment Committee member of University of Texas Law School Foundation (non-profit); Board Member of Greater Houston Partnership (non-profit); Advisory Board member, Baker Institute for Public Policy at Rice University (non-profit) Formerly: Director and Audit Committee Member of Federal Reserve Bank of Dallas |
Robert C. Troccoli - 1949
Trustee | | 2016 | | Retired Formerly: Adjunct Professor, University of Denver - Daniels College of Business; and Managing Partner, KPMG LLP | | 188 | | None |
Daniel S. Vandivort - 1954
Trustee | | 2019 | | President, Flyway Advisory Services LLC (consulting and property management) | | 188 | | Formerly: Trustee, Board of Trustees, Treasurer and Chairman of the Audit and Committee, Huntington Disease Foundation of America; Trustee and Governance Chair, of certain Oppenheimer Funds |
| | |
| T-3 | | Invesco Real Estate Fund |
Trustees and Officers–(continued)
| | | | | | | | |
Name, Year of Birth and Position(s) Held with the Trust | | Trustee and/or Officer Since | | Principal Occupation(s) During Past 5 Years | | Number of Funds in
Fund Complex
Overseen by
Trustee | | Other Directorship(s)
Held by Trustee During Past 5 Years |
| Officers | | | | | | | | |
Sheri Morris - 1964
President and Principal Executive Officer | | 1999 | | Head of Global Fund Services, Invesco Ltd.; President and Principal Executive Officer, The Invesco Funds; Vice President, Invesco Exchange-Traded Fund Trust, Invesco Exchange-Traded Fund Trust II, Invesco India Exchange-Traded Fund Trust, Invesco Actively Managed Exchange-Traded Fund Trust, Invesco Actively Managed Exchange-Traded Commodity Fund Trust and Invesco Exchange-Traded Self-Indexed Fund Trust; and Vice President, OppenheimerFunds, Inc. Formerly: Vice President, Treasurer and Principal Financial Officer, The Invesco Funds; Vice President, Invesco AIM Advisers, Inc., Invesco AIM Capital Management, Inc. and Invesco AIM Private Asset Management, Inc.; Assistant Vice President and Assistant Treasurer, The Invesco Funds; Vice President and Assistant Vice President, Invesco Advisers, Inc.; Assistant Vice President, Invesco AIM Capital Management, Inc. and Invesco AIM Private Asset Management, Inc.; Treasurer, Invesco Exchange-Traded Fund Trust, Invesco Exchange-Traded Fund Trust II, Invesco India Exchange-Traded Fund Trust and Invesco Actively Managed Exchange-Traded Fund Trust and Senior Vice President, Invesco Advisers, Inc. (formerly known as Invesco Institutional (N.A.), Inc.) (registered investment adviser) | | N/A | | N/A |
Jeffrey H. Kupor - 1968
Senior Vice President, Chief Legal Officer and Secretary | | 2018 | | Head of Legal of the Americas, Invesco Ltd.; Senior Vice President and Secretary, Invesco Advisers, Inc. (formerly known as Invesco Institutional (N.A.), Inc.) (registered investment adviser); Senior Vice President and Secretary, Invesco Distributors, Inc. (formerly known as Invesco AIM Distributors, Inc.); Vice President and Secretary, Invesco Investment Services, Inc. (formerly known as Invesco AIM Investment Services, Inc.) Senior Vice President, Chief Legal Officer and Secretary, The Invesco Funds; Secretary and General Counsel, Invesco Investment Advisers LLC (formerly known as Van Kampen Asset Management); Secretary and General Counsel, Invesco Capital Markets, Inc. (formerly known as Van Kampen Funds Inc.) and Chief Legal Officer, Invesco Exchange-Traded Fund Trust, Invesco Exchange-Traded Fund Trust II, Invesco India Exchange-Traded Fund Trust, Invesco Actively Managed Exchange-Traded Fund Trust, Invesco Actively Managed Exchange-Traded Commodity Fund Trust and Invesco Exchange-Traded Self-Indexed Fund Trust;; Secretary and Vice President, Harbourview Asset Management Corporation; Secretary and Vice President, OppenheimerFunds, Inc. and Invesco Managed Accounts, LLC; Secretary and Senior Vice President, OFI Global Institutional, Inc.; Secretary and Vice President, OFI SteelPath, Inc.; Secretary and Vice President, Oppenheimer Acquisition Corp.; Secretary and Vice President, Shareholder Services, Inc.; Secretary and Vice President, Trinity Investment Management Corporation Formerly: Secretary and Vice President, Jemstep, Inc.; Head of Legal, Worldwide Institutional, Invesco Ltd.; Secretary and General Counsel, INVESCO Private Capital Investments, Inc.; Senior Vice President, Secretary and General Counsel, Invesco Management Group, Inc. (formerly known as Invesco AIM Management Group, Inc.); Assistant Secretary, INVESCO Asset Management (Bermuda) Ltd.; Secretary and General Counsel, Invesco Private Capital, Inc.; Assistant Secretary and General Counsel, INVESCO Realty, Inc.; Secretary and General Counsel, Invesco Senior Secured Management, Inc.; Secretary, Sovereign G./P. Holdings Inc.; and Secretary, Invesco Indexing LLC; Secretary, W.L. Ross & Co., LLC | | N/A | | N/A |
| Andrew R. Schlossberg - 1974 Senior Vice President | | 2019 | | Head of the Americas and Senior Managing Director, Invesco Ltd.; Director and Senior Vice President, Invesco Advisers, Inc. (formerly known as Invesco Institutional (N.A.), Inc.) (registered investment adviser); Director and Chairman, Invesco Investment Services, Inc. (formerly known as Invesco AIM Investment Services, Inc.) (registered transfer agent); Senior Vice President, The Invesco Funds; Director, Invesco Investment Advisers LLC (formerly known as Van Kampen Asset Management) Formerly: Director, President and Chairman, Invesco Insurance Agency, Inc.; Director, Invesco UK Limited; Director and Chief Executive, Invesco Asset Management Limited and Invesco Fund Managers Limited; Assistant Vice President, The Invesco Funds; Senior Vice President, Invesco Advisers, Inc. (formerly known as Invesco Institutional (N.A.), Inc.) (registered investment adviser); Director and Chief Executive, Invesco Administration Services Limited and Invesco Global Investment Funds Limited; Director, Invesco Distributors, Inc.; Head of EMEA, Invesco Ltd.; President, Invesco Actively Managed Exchange-Traded Commodity Fund Trust, Invesco Actively Managed Exchange-Traded Fund Trust, Invesco Exchange-Traded Fund Trust, Invesco Exchange-Traded Fund Trust II and Invesco India Exchange-Traded Fund Trust; Managing Director and Principal Executive Officer, Invesco Capital Management LLC | | N/A | | N/A |
| | |
| T-4 | | Invesco Real Estate Fund |
Trustees and Officers–(continued)
| | | | | | | | |
Name, Year of Birth and
Position(s) Held with the Trust | | Trustee and/or Officer Since | | Principal Occupation(s) During Past 5 Years | | Number of Funds in
Fund Complex
Overseen by
Trustee | | Other Directorship(s)
Held by Trustee During Past 5 Years |
| Officers–(continued) | | | | | | | | |
John M. Zerr – 1962
Senior Vice President | | 2006 | | Chief Operating Officer of the Americas; Senior Vice President, Invesco Advisers, Inc. (formerly known as Invesco Institutional (N.A.), Inc.) (registered investment adviser); Senior Vice President, Invesco Distributors, Inc. (formerly known as Invesco AIM Distributors, Inc.); Director and Vice President, Invesco Investment Services, Inc. (formerly known as Invesco AIM Investment Services, Inc.) Senior Vice President, The Invesco Funds; Managing Director, Invesco Capital Management LLC; Director, Invesco Investment Advisers LLC (formerly known as Van Kampen Asset Management); Senior Vice President, Invesco Capital Markets, Inc. (formerly known as Van Kampen Funds Inc.); Manager, Invesco Indexing LLC; Manager, Invesco Specialized Products, LLC; Member, Invesco Canada Funds Advisory Board; Director, President and Chief Executive Officer, Invesco Corporate Class Inc. (corporate mutual fund company); and Director, Chairman, President and Chief Executive Officer, Invesco Canada Ltd. (formerly known as Invesco Trimark Ltd./Invesco Trimark Ltèe) (registered investment adviser and registered transfer agent); President, Invesco, Inc.; President, Invesco Global Direct Real Estate Feeder GP Ltd.; President, Invesco IP Holdings (Canada) Ltd; President, Invesco Global Direct Real Estate GP Ltd.; President, Invesco Financial Services Ltd. / Services Financiers Invesco Ltée; and Director and Chairman, Invesco Trust Company Formerly: President, Trimark Investments Ltd/Services Financiers Invesco Ltee; Director and Senior Vice President, Invesco Insurance Agency, Inc.; Director and Senior Vice President, Invesco Management Group, Inc. (formerly known as Invesco AIM Management Group, Inc.); Secretary and General Counsel, Invesco Management Group, Inc. (formerly known as Invesco AIM Management Group, Inc.); Secretary, Invesco Investment Services, Inc. (formerly known as Invesco AIM Investment Services, Inc.); Chief Legal Officer and Secretary, The Invesco Funds; Secretary and General Counsel, Invesco Investment Advisers LLC (formerly known as Van Kampen Asset Management); Secretary and General Counsel, Invesco Capital Markets, Inc. (formerly known as Van Kampen Funds Inc.); Chief Legal Officer, Invesco Exchange-Traded Fund Trust, Invesco Exchange-Traded Fund Trust II, Invesco India Exchange-Traded Fund Trust, Invesco Actively Managed Exchange-Traded Fund Trust, Invesco Actively Managed Exchange-Traded Commodity Fund Trust and Invesco Exchange-Traded Self-Indexed Fund Trust; Secretary, Invesco Indexing LLC; Director, Secretary, General Counsel and Senior Vice President, Van Kampen Exchange Corp.; Director, Vice President and Secretary, IVZ Distributors, Inc. (formerly known as INVESCO Distributors, Inc.); Director and Vice President, INVESCO Funds Group, Inc.; Director and Vice President, Van Kampen Advisors Inc.; Director, Vice President, Secretary and General Counsel, Van Kampen Investor Services Inc.;Director and Secretary, Invesco Distributors, Inc. (formerly known as Invesco AIM Distributors, Inc.); Director, Senior Vice President, General Counsel and Secretary, Invesco AIM Advisers, Inc. and Van Kampen Investments Inc.; Director, Vice President and Secretary, Fund Management Company; Director, Senior Vice President, Secretary, General Counsel and Vice President, Invesco AIM Capital Management, Inc.; Chief Operating Officer and General Counsel, Liberty Ridge Capital, Inc. (an investment adviser) | | N/A | | N/A |
Gregory G. McGreevey - 1962
Senior Vice President | | 2012 | | Senior Managing Director, Invesco Ltd.; Director, Chairman, President, and Chief Executive Officer, Invesco Advisers, Inc. (formerly known as Invesco Institutional (N.A.), Inc.) (registered investment adviser); Director, Invesco Mortgage Capital, Inc. and Invesco Senior Secured Management, Inc.; Senior Vice President, The Invesco Funds; President, SNW Asset Management Corporation and Invesco Managed Accounts, LLC; Chairman and Director, Invesco Private Capital, Inc.; Chairman and Director, INVESCO Private Capital Investments, Inc.; Chairman and Director, INVESCO Realty, Inc.; and Senior Vice President, Invesco Group Services, Inc. Formerly: Senior Vice President, Invesco Management Group, Inc. and Invesco Advisers, Inc.; Assistant Vice President, The Invesco Funds | | N/A | | N/A |
Adrien Deberghes- 1967
Principal Financial Officer, Treasurer and Vice President | | 2020 | | Head of the Fund Office of the CFO and Fund Administration; Vice President, Invesco Advisers, Inc.; Principal Financial Officer, Treasurer and Vice President, The Invesco Funds; Vice President, Invesco Exchange-Traded Fund Trust, Invesco Exchange-Traded Fund Trust II, Invesco India Exchange-Traded Fund Trust, Invesco Actively Managed Exchange-Traded Fund Trust, Invesco Actively Managed Exchange-Traded Commodity Fund Trust and Invesco Exchange-Traded Self-Indexed Fund Trust Formerly: Senior Vice President and Treasurer, Fidelity Investments | | N/A | | N/A |
Crissie M. Wisdom - 1969
Anti-Money Laundering Compliance Officer | | 2013 | | Anti-Money Laundering and OFAC Compliance Officer for Invesco U.S. entities including: Invesco Advisers, Inc. and its affiliates, Invesco Capital Markets, Inc., Invesco Distributors, Inc., Invesco Investment Services, Inc., The Invesco Funds, Invesco Capital Management, LLC, Invesco Trust Company; and Fraud Prevention Manager for Invesco Investment Services, Inc. | | N/A | | N/A |
| | |
| T-5 | | Invesco Real Estate Fund |
Trustees and Officers–(continued)
| | | | | | | | |
Name, Year of Birth and
Position(s) Held with the Trust | | Trustee and/or Officer Since | | Principal Occupation(s) During Past 5 Years | | Number of Funds in
Fund Complex
Overseen by
Trustee | | Other Directorship(s) Held by Trustee During Past 5 Years |
Officers–(continued) | | | | | | | | |
Todd F. Kuehl – 1969
Chief Compliance Officer and Senior Vice President | | 2020 | | Chief Compliance Officer, Invesco Advisers, Inc. (registered investment adviser); and Chief Compliance Officer, The Invesco Funds and Senior Vice President Formerly: Managing Director and Chief Compliance Officer, Legg Mason (Mutual Funds); Chief Compliance Officer, Legg Mason Private Portfolio Group (registered investment adviser) | | N/A | | N/A |
Michael McMaster – 1962
Chief Tax Officer, Vice President and Assistant Treasurer | | 2020 | | Head of Global Fund Services Tax; Chief Tax Officer, Vice President and Assistant Treasurer, The Invesco Funds; Vice President, Invesco Advisers, Inc.; Assistant Treasurer, Invesco Capital Management LLC, Assistant Treasurer and Chief Tax Officer, Invesco Exchange-Traded Fund Trust, Invesco Exchange-Traded Fund Trust II, Invesco India Exchange-Traded Fund Trust, Invesco Actively Managed Exchange-Traded Fund Trust, Invesco Actively Managed Exchange-Traded Commodity Fund Trust and Invesco Exchange-Traded Self-Indexed Fund Trust; Assistant Treasurer, Invesco Specialized Products, LLC Formerly: Senior Vice President – Managing Director of Tax Services, U.S. Bank Global Fund Services (GFS) | | N/A | | N/A |
The Statement of Additional Information of the Trust includes additional information about the Fund’s Trustees and is available upon request, without charge, by calling 1.800.959.4246. Please refer to the Fund’s Statement of Additional Information for information on the Fund’s sub-advisers.
| | | | | | |
| Office of the Fund | | Investment Adviser | | Distributor | | Auditors |
| 11 Greenway Plaza, Suite 1000 | | Invesco Advisers, Inc. | | Invesco Distributors, Inc. | | PricewaterhouseCoopers LLP |
| Houston, TX 77046-1173 | | 1555 Peachtree Street, N.E. | | 11 Greenway Plaza, Suite 1000 | | 1000 Louisiana Street, Suite 5800 |
| | Atlanta, GA 30309 | | Houston, TX 77046-1173 | | Houston, TX 77002-5678 |
| | | |
| Counsel to the Fund | | Counsel to the Independent Trustees | | Transfer Agent | | Custodian |
| Stradley Ronon Stevens & Young, LLP | | Goodwin Procter LLP | | Invesco Investment Services, Inc. | | State Street Bank and Trust Company |
| 2005 Market Street, Suite 2600 | | 901 New York Avenue, N.W. | | 11 Greenway Plaza, Suite 1000 | | 225 Franklin Street |
| Philadelphia, PA 19103-7018 | | Washington, D.C. 20001 | | Houston, TX 77046-1173 | | Boston, MA 02110-2801 |
| | |
| T-6 | | Invesco Real Estate Fund |
(This page intentionally left blank)
(This page intentionally left blank)
(This page intentionally left blank)

Go paperless with eDelivery
Visit invesco.com/edelivery to enjoy the convenience and security of anytime electronic access to your investment documents.
With eDelivery, you can elect to have any or all of the following materials delivered straight to your inbox to download, save and print from your own computer:
∎ Fund reports and prospectuses
∎ Quarterly statements
∎ Daily confirmations
∎ Tax forms
Invesco mailing information
Send general correspondence to Invesco Investment Services, Inc., P.O. Box 219078, Kansas City, MO 64121-9078.
Important notice regarding delivery of security holder documents
To reduce Fund expenses, only one copy of most shareholder documents may be mailed to shareholders with multiple accounts at the same address (Householding). Mailing of your shareholder documents may be householded indefinitely unless you instruct us otherwise. If you do not want the mailing of these documents to be combined with those for other members of your household, please contact Invesco Investment Services, Inc. at 800 959 4246 or contact your financial institution. We will begin sending you individual copies for each account within 30 days after receiving your request.
Fund holdings and proxy voting information
The Fund provides a complete list of its portfolio holdings four times each year, at the end of each fiscal quarter. For the second and fourth quarters, the list appears, respectively, in the Fund’s semiannual and annual reports to shareholders. For the first and third quarters, the Fund files the list with the Securities and Exchange Commission (SEC) as an exhibit to its reports on Form N-PORT. The most recent list of portfolio holdings is available at invesco.com/completeqtrholdings. Shareholders can also look up the Fund’s Form N-PORT filings on the SEC website, sec.gov. The SEC file numbers for the Fund are shown below.
A description of the policies and procedures that the Fund uses to determine how to vote proxies relating to portfolio securities is available without charge, upon request, from our Client Services department at 800 959 4246, or at invesco.com/ corporate/about-us/esg. The information is also available on the SEC website, sec.gov.
Information regarding how the Fund voted proxies related to its portfolio securities during the most recent 12-month period ended June 30 is available at invesco.com/proxysearch. This information is also available on the SEC website, sec.gov.
Invesco Advisers, Inc. is an investment adviser; it provides investment advisory services to individual and institutional clients and does not sell securities. Invesco Distributors, Inc. is the US distributor for Invesco Ltd.’s retail mutual funds, exchange-traded funds and institutional money market funds. Both are wholly owned, indirect subsidiaries of Invesco Ltd.
| | | | |
| SEC file number(s): 811-05686 and 033-39519 | | Invesco Distributors, Inc. | | REA-AR-1 |

| | |
| | |
| Annual Report to Shareholders | | February 28, 2022 |
Invesco Short Duration Inflation Protected Fund
Nasdaq:
A: LMTAX ∎ A2: SHTIX ∎ Y: LMTYX ∎ R5: ALMIX ∎ R6: SDPSX
Management’s Discussion of Fund Performance
| | | | |
| |
Performance summary | |
For the fiscal year ended February 28, 2022, Class A shares of Invesco Short Duration Inflation Protected Fund (the Fund), at net asset value (NAV), underper-formed the ICE BofA 1-5 Year US Inflation-Linked Treasury Index, the Fund’s style-specific benchmark. | |
Your Fund’s long-term performance appears later in this report. | |
| |
Fund vs. Indexes | |
Total returns, 2/28/21 to 2/28/22, at net asset value (NAV). Performance shown does not include applicable contingent deferred sales charges (CDSC) or front-end sales charges, which would have reduced performance. | |
Class A Shares | | | 4.65 | % |
Class A2 Shares | | | 4.66 | |
Class Y Shares | | | 4.91 | |
Class R5 Shares | | | 4.91 | |
Class R6 Shares | | | 4.84 | |
ICE BofA 1-5 Year US Inflation-Linked Treasury Index▼ (Broad Market/Style- Specific Index) | | | 5.43 | |
Lipper Inflation Protected Bond Funds Index∎ (Peer Group Index) | | | 5.38 | |
Source(s):▼RIMES Technologies Corp.; ∎Lipper Inc. | | | | |
Market conditions and your Fund
In the first quarter of 2021, rising 10-year US Treasury yields increased significantly to 1.74%,1 its highest level since January 2020, reflecting higher inflation expectations. Largely a result of economic optimism, government bond yields rose globally during the first quarter of 2021 as investors began to price in higher levels of economic growth and inflation moving towards a post-pandemic world. On the fiscal front, another stimulus package was signed into law and COVID-19 vaccine approvals and administration ramped up. 30-year Treasury yields moved higher by
0.75% to end the quarter at 2.41%.1 Importantly, short-term rates, which are closely tied to Federal Reserve policy, were quite steady. Two-year US Treasury yields moved up just 0.05% to 0.16%.1
Fixed income markets settled down in the second quarter of 2021, posting gains and rebounding from negative performance experienced during the early part of the fiscal year due to a sharply rising interest rate environment. Despite higher volatility stemming from inflation concerns and the potential for rising interest rates, investors remained optimistic about the strength of the economic recovery after the Bureau of Economic Analysis reported that US gross domestic product grew at a 6.4% annualized rate for the first quarter of 2021.2 As the US COVID-19 vaccination rate neared the 50% threshold, consumers resumed pre-pandemic activities in the third quarter of 2021 and economically sensitive areas such as the consumer discretionary and industrials sectors began to recover.
In the fourth quarter of 2021, concerns about inflation heightened as US inflation rose to 7%,3 its highest level in nearly 40 years. Though the US Federal Reserve (the Fed) left policy rates unchanged in the quarter, the Fed indicated its accommodative
policies were coming to an end in 2022 through a willingness to raise interest rates to combat inflation and the announced reduction of its monthly bond purchase program. Additionally, US interest rate moves and inflation risk significantly affected fixed income valuations during the quarter. The two-year Treasury yield rose moderately from 0.27% to 0.73%, while the 10-year increased slightly from 1.48% to 1.52%.1 The yield curve, as measured by the yield differential between two- and 10-year Treasuries flattened during the quarter. Despite the withdrawal of central bank support and coronavirus variants raising concerns about economic reopenings and the resumption of travel, we believe investors are cautiously optimistic and expect corporate balance sheets to continue to recover meaningfully in 2022.
At the beginning of 2022, geopolitical and economic tensions between Ukraine and Russia culminated with the latter invading Ukraine. World leaders levied sanctions against Russia that we believe will likely have material effects on its fixed income markets, particularly sovereign debt, corporates and levels of liquidity. Regarding inflation concerns, political uncertainty should give central banks a reason to be cautious, with the Fed unlikely to raise rates by more than 0.25% at the March Federal Open Market Committee meeting, whereas before this crisis, a 0.50% increase was increasingly likely.
Against this backdrop, shorter-term US Treasury inflation-protected securities (TIPS) posted positive returns for the fiscal year as the ICE BofA 1-5 Year US Inflation-Linked Treasury Index returned 5.43%. Lower short-term yields coupled with increased inflation expectations were the primary drivers of the Fund’s positive performance. The average yield on the style-specific index decreased 10 basis points and ended the fiscal year at -2.10%.4 Shorter-term TIPS outperformed
their nominal US Treasury counterparts on a maturity matched basis as yields on nominal US Treasuries rose while real yields for 2-year TIPS fell during the fiscal year.5 The difference between yields on a maturity-matched basis and nominal yields on US Treasuries and TIPS is a measure of inflation expectations, also known as break-even inflation (the amount of inflation needed for TIPS to break-even with nominal Treasuries).
We seek to replicate the risk and return characteristics of the Fund’s broad market/ style-specific index, the ICE BofA 1-5 Year US Inflation-Linked Treasury Index, by generally investing in the component securities of the index in their respective weightings. For the fiscal year, the Fund generated positive returns and underperformed its broad market/ style-specific benchmark. The Fund’s performance will typically lag its index due to fees. The rapid rise of inflation, caused by supply chain disruptions and increasing oil prices, helped drive positive returns for the Fund during the fiscal year.
We wish to remind you that the Fund is subject to real interest rate risk, meaning the values of inflation-indexed securities generally fluctuate in response to changes in real interest rates. However, the Fund invests in shorter-duration inflation-indexed securities, which tend to have less real interest rate risk. Inflation-indexed securities typically provide principal and interest payments that are adjusted over time to reflect a rise (inflation) or a drop (deflation) in the general price level for goods and services. However, at maturity, the value of TIPS can not fall below their par value. Real interest rates are tied to the relationship between nominal interest rates and the rate of inflation. If nominal interest rates increase at a faster rate than inflation, real interest rates might rise, leading to a decrease in the value of inflation-indexed securities. Conversely, if inflation rises at a faster rate than nominal interest rates, real interest rates might decline, leading to an increase in the value of inflation-indexed securities. The Fund’s income from its investments in inflation-indexed securities is likely to fluctuate considerably more than the income distributions of its investments in more traditional fixed income securities.
We are monitoring real interest rates and the market, as well as economic and geopolitical factors that may impact the direction, speed and magnitude of changes to real interest rates across the maturity spectrum, including the potential impact of monetary policy changes by the Fed and certain foreign central banks. If real interest rates rise, or fall faster than expected, inflation-indexed security markets may experience increased volatility, which may affect the value and/or liquidity of the Fund’s investments.
Thank you for investing in Invesco Short Duration Inflation Protected Fund and for sharing our long-term investment horizon.
1 Source: US Federal Reserve
| | |
| 2 | | Invesco Short Duration Inflation Protected Fund |
2 Source: US Bureau of Labor Statistics
3 Source: US Bureau of Economic Analysis
4 Source: Bloomberg LP
5 Source: US Department of the Treasury
Portfolio manager(s):
Robert Young
The views and opinions expressed in management’s discussion of Fund performance are those of Invesco Advisers, Inc. and its affiliates. These views and opinions are subject to change at any time based on factors such as market and economic conditions. These views and opinions may not be relied upon as investment advice or recommendations, or as an offer for a particular security. The information is not a complete analysis of every aspect of any market, country, industry, security or the Fund. Statements of fact are from sources considered reliable, but Invesco Advisers, Inc. makes no representation or warranty as to their completeness or accuracy. Although historical performance is no guarantee of future results, these insights may help you understand our investment management philosophy.
See important Fund and, if applicable, index disclosures later in this report.
| | |
| 3 | | Invesco Short Duration Inflation Protected Fund |
Your Fund’s Long-Term Performance
Results of a $10,000 Investment — Oldest Share Class(es)
Fund and index data from 2/29/12
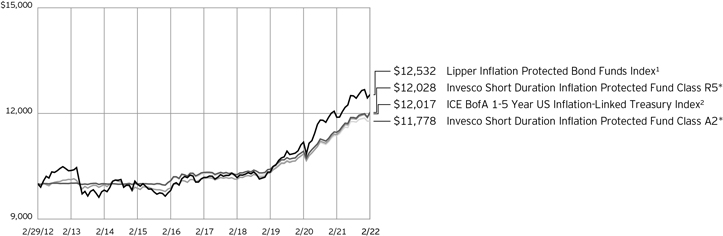
1 Source: Lipper Inc.
2 Source: RIMES Technologies Corp.
*The Fund’s oldest share class (Class R5) does not have a sales charge. Therefore, the second-oldest share class, which has a sales charge (Class A2), is also included in the chart.
Past performance cannot guarantee future results.
The data shown in the chart include reinvested distributions, applicable sales charges and Fund expenses including management
fees. Index results include reinvested dividends, but they do not reflect sales charges. Performance of the peer group, if applicable, reflects fund expenses and management fees;
performance of a market index does not. Performance shown in the chart does not reflect deduction of taxes a shareholder would pay on Fund distributions or sale of Fund shares.
| | |
| 4 | | Invesco Short Duration Inflation Protected Fund |
| | | | |
| |
Average Annual Total Returns | |
As of 2/28/22, including maximum applicable sales charges | |
| |
Class A Shares | | | | |
Inception (10/31/02) | | | 1.71 | % |
10 Years | | | 1.42 | |
5 Years | | | 2.33 | |
1 Year | | | 2.01 | |
| |
Class A2 Shares | | | | |
Inception (12/15/87) | | | 3.78 | % |
10 Years | | | 1.65 | |
5 Years | | | 2.74 | |
1 Year | | | 3.61 | |
| |
Class Y Shares | | | | |
Inception (10/3/08) | | | 1.67 | % |
10 Years | | | 1.86 | |
5 Years | | | 3.13 | |
1 Year | | | 4.91 | |
| |
Class R5 Shares | | | | |
Inception (7/13/87) | | | 4.02 | % |
10 Years | | | 1.86 | |
5 Years | | | 3.10 | |
1 Year | | | 4.91 | |
| |
Class R6 Shares | | | | |
10 Years | | | 1.86 | % |
5 Years | | | 3.15 | |
1 Year | | | 4.84 | |
Class R6 shares incepted on December 31, 2015. Performance shown prior to that date is that of Class A2 shares at net asset value and restated to reflect the 12b-1 fees applicable to Class A2 shares.
The performance data quoted represent past performance and cannot guarantee future results; current performance may be lower or higher. Please visit invesco.com/ performance for the most recent month-end performance. Performance figures reflect reinvested distributions, changes in net asset value and the effect of the maximum sales charge unless otherwise stated. Performance figures do not reflect deduction of taxes a shareholder would pay on Fund distributions or sale of Fund shares. Investment return and principal value will fluctuate so that you may have a gain or loss when you sell shares.
Class A share performance reflects the maximum 2.50% sales charge. Class A2 share performance reflects the maximum 1.00% sales charge. Class Y, Class R5 and Class R6 shares do not have a front-end sales charge or a CDSC; therefore, performance is at net asset value.
The performance of the Fund’s share classes will differ primarily due to different sales charge structures and class expenses.
Fund performance reflects any applicable fee waivers and/or expense reimbursements. Had the adviser not waived fees and/or reimbursed expenses currently or in the past, returns would have been lower. See current prospectus for more information.
| | |
| 5 | | Invesco Short Duration Inflation Protected Fund |
Supplemental Information
Invesco Short Duration Inflation Protected Fund’s investment objective is to provide protection from the negative effects of unanticipated inflation.
| ∎ | Unless otherwise stated, information presented in this report is as of February 28, 2022, and is based on total net assets. |
| ∎ | Unless otherwise noted, all data is provided by Invesco. |
| ∎ | To access your Fund’s reports/prospectus, visit invesco.com/fundreports. |
About indexes used in this report
| ∎ | The ICE BofA 1-5 Year US Inflation- Linked Treasury Index is composed of US Treasury Inflation-Protected Securities with maturities between one and five years. |
| ∎ | The Lipper Inflation Protected Bond Funds Index is an unmanaged index considered representative of inflation protected bond funds tracked by Lipper. |
| ∎ | A direct investment cannot be made in an index. Unless otherwise indicated, index results include reinvested dividends, and they do not reflect sales charges. Perfor- mance of the peer group, if applicable, reflects fund expenses; performance of a market index does not. |
|
|
This report must be accompanied or preceded by a currently effective Fund prospectus, which contains more complete information, including sales charges and expenses. Investors should read it carefully before investing. |
|
| NOT FDIC INSURED | MAY LOSE VALUE | NO BANK GUARANTEE |
| | |
| 6 | | Invesco Short Duration Inflation Protected Fund |
Fund Information
Portfolio Composition
By U.S. Treasury Securities
| | | | | | | | | | |
| Maturity Date | | Coupon
Rate | | % of Total
Net Assets |
| | |
4/15/2023 | | | | 0.62 | % | | | | 6.80 | % |
| | |
7/15/2023 | | | | 0.37 | | | | | 6.36 | |
| | |
1/15/2024 | | | | 0.62 | | | | | 6.37 | |
| | |
4/15/2024 | | | | 0.50 | | | | | 4.65 | |
| | |
7/15/2024 | | | | 0.13 | | | | | 6.30 | |
| | |
10/15/2024 | | | | 0.13 | | | | | 4.98 | |
| | |
1/15/2025 | | | | 2.37 | | | | | 5.74 | |
| | |
1/15/2025 | | | | 0.25 | | | | | 6.29 | |
| | |
4/15/2025 | | | | 0.13 | | | | | 5.00 | |
| | |
7/15/2025 | | | | 0.38 | | | | | 6.38 | |
| | |
10/15/2025 | | | | 0.13 | | | | | 4.84 | |
| | |
1/15/2026 | | | | 0.62 | | | | | 6.62 | |
| | |
1/15/2026 | | | | 2.00 | | | | | 3.94 | |
| | |
4/15/2026 | | | | 0.13 | | | | | 5.56 | |
| | |
7/15/2026 | | | | 0.13 | | | | | 5.64 | |
| | |
10/15/2026 | | | | 0.13 | | | | | 5.20 | |
| | |
1/15/2027 | | | | 0.37 | | | | | 5.91 | |
| | |
1/15/2027 | | | | 2.37 | | | | | 3.32 | |
| | |
Money Market Funds Plus Other Assets Less Liabilities | | | | | | | | | 0.10 | |
The Fund’s holdings are subject to change, and there is no assurance that the Fund will continue to hold any particular security.
Data presented here are as of February 28, 2022.
| | |
| 7 | | Invesco Short Duration Inflation Protected Fund |
Schedule of Investments
February 28, 2022
| | | | | | | | | | | | | | | | |
| | | Interest
Rate | | | Maturity
Date | | | Principal
Amount
(000) | | | Value | |
U.S. Treasury Securities–99.90% | | | | | | | | | | | | | | | | |
U.S. Treasury Inflation – Indexed Notes–99.90%(a) | | | | | | | | | | | | | | | | |
U.S. Treasury Inflation - Indexed Notes | | | 0.62% | | | | 04/15/2023 | | | $ | 38,341 | | | $ | 40,250,244 | |
U.S. Treasury Inflation - Indexed Notes | | | 0.37% | | | | 07/15/2023 | | | | 35,562 | | | | 37,603,361 | |
U.S. Treasury Inflation - Indexed Notes | | | 0.62% | | | | 01/15/2024 | | | | 35,460 | | | | 37,695,351 | |
U.S. Treasury Inflation - Indexed Notes | | | 0.50% | | | | 04/15/2024 | | | | 25,853 | | | | 27,511,189 | |
U.S. Treasury Inflation - Indexed Notes | | | 0.13% | | | | 07/15/2024 | | | | 35,002 | | | | 37,248,633 | |
U.S. Treasury Inflation - Indexed Notes | | | 0.13% | | | | 10/15/2024 | | | | 27,678 | | | | 29,454,155 | |
U.S. Treasury Inflation - Indexed Notes | | | 0.25 - 2.37% | | | | 01/15/2025 | | | | 64,978 | | | | 71,207,127 | |
U.S. Treasury Inflation - Indexed Notes | | | 0.13% | | | | 04/15/2025 | | | | 27,772 | | | | 29,549,813 | |
U.S. Treasury Inflation - Indexed Notes | | | 0.38% | | | | 07/15/2025 | | | | 35,007 | | | | 37,743,968 | |
U.S. Treasury Inflation - Indexed Notes | | | 0.13% | | | | 10/15/2025 | | | | 26,776 | | | | 28,633,427 | |
U.S. Treasury Inflation - Indexed Notes | | | 0.62 - 2.00% | | | | 01/15/2026 | | | | 56,348 | | | | 62,418,986 | |
U.S. Treasury Inflation - Indexed Notes | | | 0.13% | | | | 04/15/2026 | | | | 30,790 | | | | 32,863,676 | |
U.S. Treasury Inflation - Indexed Notes | | | 0.13% | | | | 07/15/2026 | | | | 31,084 | | | | 33,393,039 | |
U.S. Treasury Inflation - Indexed Notes | | | 0.13% | | | | 10/15/2026 | | | | 28,596 | | | | 30,740,846 | |
U.S. Treasury Inflation - Indexed Notes | | | 0.37 - 2.37% | | | | 01/15/2027 | | | | 48,693 | | | | 54,608,938 | |
Total U.S. Treasury Securities (Cost $573,461,843) | | | | | | | | | | | | | | | 590,922,753 | |
| | | | | | | | | Shares | | | | |
Money Market Funds–0.25% | | | | | | | | | | | | | | | | |
Invesco Government & Agency Portfolio, Institutional Class, 0.03%(b)(c) | | | | | | | | | | | 516,175 | | | | 516,175 | |
Invesco Liquid Assets Portfolio, Institutional Class, 0.01%(b)(c) | | | | | | | | | | | 368,666 | | | | 368,666 | |
Invesco Treasury Portfolio, Institutional Class, 0.01%(b)(c) | | | | | | | | | | | 589,914 | | | | 589,914 | |
Total Money Market Funds (Cost $1,474,755) | | | | | | | | | | | | | | | 1,474,755 | |
TOTAL INVESTMENTS IN SECURITIES–100.15% (Cost $574,936,598) | | | | | | | | | | | | | | | 592,397,508 | |
OTHER ASSETS LESS LIABILITIES–(0.15)% | | | | | | | | | | | | | | | (872,058 | ) |
NET ASSETS–100.00% | | | | | | | | | | | | | | $ | 591,525,450 | |
Notes to Schedule of Investments:
| (a) | Principal amount of security and interest payments are adjusted for inflation. See Note 1H. |
| (b) | Affiliated issuer. The issuer and/or the Fund is a wholly-owned subsidiary of Invesco Ltd., or is affiliated by having an investment adviser that is under common control of Invesco Ltd. The table below shows the Fund’s transactions in, and earnings from, its investments in affiliates for the fiscal year ended February 28, 2022. |
| | | | | | | | | | | | | | | | | | | | | | | | | | | | |
| | | Value
February 28, 2021 | | | Purchases at
Cost | | | Proceeds from
Sales | | | Change in
Unrealized
Appreciation | | | Realized
Gain (Loss) | | | Value
February 28,
2022 | | | Dividend Income | |
| Investments in Affiliated Money Market Funds: | | | | | | | | | | | | | | | | | | | | | | | | | | | | |
Invesco Government & Agency Portfolio, Institutional Class | | | $198,866 | | | $ | 39,184,881 | | | $ | (38,867,572 | ) | | | $- | | | $ | - | | | $ | 516,175 | | | | $181 | |
Invesco Liquid Assets Portfolio, Institutional Class | | | 142,011 | | | | 27,810,751 | | | | (27,583,913 | ) | | | - | | | | (183) | | | | 368,666 | | | | 24 | |
Invesco Treasury Portfolio, Institutional Class | | | 227,275 | | | | 44,782,721 | | | | (44,420,082 | ) | | | - | | | | - | | | | 589,914 | | | | 84 | |
Total | | | $568,152 | | | $ | 111,778,353 | | | $ | (110,871,567 | ) | | | $- | | | $ | (183) | | | $ | 1,474,755 | | | | $289 | |
| (c) | The rate shown is the 7-day SEC standardized yield as of February 28, 2022. |
See accompanying Notes to Financial Statements which are an integral part of the financial statements.
| | |
| 8 | | Invesco Short Duration Inflation Protected Fund |
Statement of Assets and Liabilities
February 28, 2022
| | | | |
Assets: | | | | |
| |
Investments in unaffiliated securities, at value (Cost $ 573,461,843) | | | $590,922,753 | |
|
| |
Investments in affiliated money market funds, at value (Cost $ 1,474,755) | | | 1,474,755 | |
|
| |
Receivable for: | | | | |
Fund shares sold | | | 2,514,216 | |
|
| |
Dividends | | | 6 | |
|
| |
Interest | | | 518,319 | |
|
| |
Investment for trustee deferred compensation and retirement plans | | | 84,817 | |
|
| |
Other assets | | | 54,078 | |
|
| |
Total assets | | | 595,568,944 | |
|
| |
| |
Liabilities: | | | | |
Payable for: | | | | |
Investments purchased | | | 1,479,968 | |
|
| |
Fund shares reacquired | | | 2,289,033 | |
|
| |
Accrued fees to affiliates | | | 68,728 | |
|
| |
Accrued trustees’ and officers’ fees and benefits | | | 3,796 | |
|
| |
Accrued other operating expenses | | | 108,204 | |
|
| |
Trustee deferred compensation and retirement plans | | | 93,765 | |
|
| |
Total liabilities | | | 4,043,494 | |
|
| |
Net assets applicable to shares outstanding | | | $591,525,450 | |
|
| |
| |
Net assets consist of: | | | | |
Shares of beneficial interest | | | $584,035,238 | |
|
| |
Distributable earnings | | | 7,490,212 | |
|
| |
| | | $591,525,450 | |
|
| |
| | | | |
Net Assets: | | | | |
Class A | | $ | 126,717,520 | |
|
| |
Class A2 | | $ | 13,778,087 | |
|
| |
Class Y | | $ | 100,464,506 | |
|
| |
Class R5 | | $ | 28,283,270 | |
|
| |
Class R6 | | $ | 322,282,067 | |
|
| |
|
Shares outstanding, no par value, with an unlimited number of shares authorized: | |
Class A | | | 11,654,724 | |
|
| |
Class A2 | | | 1,265,801 | |
|
| |
Class Y | | | 9,226,789 | |
|
| |
Class R5 | | | 2,598,475 | |
|
| |
Class R6 | | | 29,610,766 | |
|
| |
Class A: | | | | |
Net asset value per share | | $ | 10.87 | |
|
| |
Maximum offering price per share
(Net asset value of $10.87 ÷ 97.50%) | | $ | 11.15 | |
|
| |
Class A2: | | | | |
Net asset value per share | | $ | 10.88 | |
|
| |
Maximum offering price per share
(Net asset value of $10.88 ÷ 99.00%) | | $ | 10.99 | |
|
| |
Class Y: | | | | |
Net asset value and offering price per share | | $ | 10.89 | |
|
| |
Class R5: | | | | |
Net asset value and offering price per share | | $ | 10.88 | |
|
| |
Class R6: | | | | |
Net asset value and offering price per share | | $ | 10.88 | |
|
| |
See accompanying Notes to Financial Statements which are an integral part of the financial statements.
| | |
| 9 | | Invesco Short Duration Inflation Protected Fund |
Statement of Operations
For the year ended February 28, 2022
| | | | |
Investment income: | | | | |
| |
Treasury Inflation-Protected Securities inflation adjustments | | $ | 32,914,033 | |
|
| |
Dividends from affiliated money market funds | | | 289 | |
|
| |
Total investment income | | | 32,914,322 | |
|
| |
|
Expenses: | |
| |
Advisory fees | | | 1,121,841 | |
|
| |
Administrative services fees | | | 80,568 | |
|
| |
Custodian fees | | | 11,741 | |
|
| |
Distribution fees: | | | | |
Class A | | | 259,723 | |
|
| |
Class A2 | | | 22,516 | |
|
| |
Transfer agent fees – A, A2, and Y | | | 181,139 | |
|
| |
Transfer agent fees – R5 | | | 10,593 | |
|
| |
Transfer agent fees – R6 | | | 70,578 | |
|
| |
Trustees’ and officers’ fees and benefits | | | 26,863 | |
|
| |
Registration and filing fees | | | 99,292 | |
|
| |
Licensing fees | | | 59,752 | |
|
| |
Reports to shareholders | | | 14,696 | |
|
| |
Professional services fees | | | 42,471 | |
|
| |
Other | | | 15,813 | |
|
| |
Total expenses | | | 2,017,586 | |
|
| |
Less: Fees waived, expenses reimbursed and/or expense offset arrangement(s) | | | (111,774 | ) |
|
| |
Net expenses | | | 1,905,812 | |
|
| |
Net investment income | | | 31,008,510 | |
|
| |
| |
Realized and unrealized gain (loss) from: | | | | |
| |
Net realized gain (loss) from: | | | | |
Unaffiliated investment securities | | | 3,855,977 | |
|
| |
Affiliated investment securities | | | (183 | ) |
|
| |
| | | 3,855,794 | |
|
| |
Change in net unrealized appreciation (depreciation) of unaffiliated investment securities | | | (7,537,836 | ) |
|
| |
Net realized and unrealized gain (loss) | | | (3,682,042 | ) |
|
| |
Net increase in net assets resulting from operations | | $ | 27,326,468 | |
|
| |
See accompanying Notes to Financial Statements which are an integral part of the financial statements.
| | |
| 10 | | Invesco Short Duration Inflation Protected Fund |
Statement of Changes in Net Assets
For the years ended February 28, 2022 and 2021
| | | | | | | | |
| | | 2022 | | | 2021 | |
|
| |
Operations: | | | | | | | | |
| | |
Net investment income | | $ | 31,008,510 | | | $ | 5,663,105 | |
|
| |
Net realized gain | | | 3,855,794 | | | | 2,945,455 | |
|
| |
Change in net unrealized appreciation (depreciation) | | | (7,537,836 | ) | | | 15,217,413 | |
|
| |
Net increase in net assets resulting from operations | | | 27,326,468 | | | | 23,825,973 | |
|
| |
| | |
Distributions to shareholders from distributable earnings: | | | | | | | | |
| | |
Class A | | | (4,781,414 | ) | | | (409,031 | ) |
|
| |
| | |
Class A2 | | | (605,908 | ) | | | (148,205 | ) |
|
| |
| | |
Class Y | | | (2,935,679 | ) | | | (272,300 | ) |
|
| |
| | |
Class R5 | | | (813,165 | ) | | | (34,247 | ) |
|
| |
| | |
Class R6 | | | (15,207,317 | ) | | | (4,537,247 | ) |
|
| |
Total distributions from distributable earnings | | | (24,343,483 | ) | | | (5,401,030 | ) |
|
| |
| | |
Return of capital: | | | | | | | | |
| | |
Class A | | | – | | | | (67,487 | ) |
|
| |
| | |
Class A2 | | | – | | | | (24,453 | ) |
|
| |
| | |
Class Y | | | – | | | | (44,927 | ) |
|
| |
| | |
Class R5 | | | – | | | | (5,650 | ) |
|
| |
| | |
Class R6 | | | – | | | | (748,615 | ) |
|
| |
Total return of capital | | | – | | | | (891,132 | ) |
|
| |
Total distributions | | | (24,343,483 | ) | | | (6,292,162 | ) |
|
| |
| | |
Share transactions–net: | | | | | | | | |
Class A | | | 51,098,411 | | | | 28,775,283 | |
|
| |
Class A2 | | | (1,938,647 | ) | | | (1,609,294 | ) |
|
| |
Class Y | | | 67,294,355 | | | | 14,674,746 | |
|
| |
Class R5 | | | 23,874,708 | | | | 2,140,187 | |
|
| |
Class R6 | | | (72,679,696 | ) | | | (89,951,791 | ) |
|
| |
Net increase (decrease) in net assets resulting from share transactions | | | 67,649,131 | | | | (45,970,869 | ) |
|
| |
Net increase (decrease) in net assets | | | 70,632,116 | | | | (28,437,058 | ) |
|
| |
| | |
Net assets: | | | | | | | | |
| | |
Beginning of year | | | 520,893,334 | | | | 549,330,392 | |
|
| |
| | |
End of year | | $ | 591,525,450 | | | $ | 520,893,334 | |
|
| |
See accompanying Notes to Financial Statements which are an integral part of the financial statements.
| | |
| 11 | | Invesco Short Duration Inflation Protected Fund |
Financial Highlights
The following schedule presents financial highlights for a share of the Fund outstanding throughout the periods indicated.
| | | | | | | | | | | | | | | | | | | | | | | | | | | | | | | | | | | | | | | | | | | | | | | | | | | | | | | | |
| | | Net asset value, beginning of period | | | Net investment income(a) | | | Net gains (losses) on securities (both realized and unrealized) | | | Total from investment operations | | | Dividends from net investment income | | | Return of capital | | | Total distributions | | | Net asset value, end of period | | | Total return(b) | | | Net assets, end of period (000’s omitted) | | | Ratio of expenses to average net assets with fee waivers and/or expenses absorbed | | | Ratio of expenses to average net assets without fee waivers and/or expenses absorbed | | | Ratio of net investment income to average net assets | | | Portfolio
turnover (c) | |
Class A | | | | | | | | | | | | | | | | | | | | | | | | | | | | | | | | | | | | | | | | | | | | | | | | | | | | | | | | |
Year ended 02/28/22 | | $ | 10.82 | | | $ | 0.57 | | | $ | (0.07 | ) | | $ | 0.50 | | | $ | (0.45 | ) | | $ | – | | | $ | (0.45 | ) | | $ | 10.87 | | | | 4.65 | % | | $ | 126,718 | | | | 0.55 | % | | | 0.61 | % | | | 5.23 | % | | | 53 | % |
Year ended 02/28/21 | | | 10.43 | | | | 0.09 | | | | 0.40 | | | | 0.49 | | | | (0.09 | ) | | | (0.01 | ) | | | (0.10 | ) | | | 10.82 | | | | 4.76 | | | | 76,073 | | | | 0.55 | | | | 0.67 | | | | 0.87 | | | | 49 | |
Year ended 02/29/20 | | | 10.16 | | | | 0.22 | | | | 0.24 | | | | 0.46 | | | | (0.16 | ) | | | (0.03 | ) | | | (0.19 | ) | | | 10.43 | | | | 4.61 | | | | 45,383 | | | | 0.55 | | | | 0.66 | | | | 2.17 | | | | 45 | |
Year ended 02/28/19 | | | 10.29 | | | | 0.20 | | | | (0.08 | ) | | | 0.12 | | | | (0.25 | ) | | | – | | | | (0.25 | ) | | | 10.16 | | | | 1.23 | | | | 46,384 | | | | 0.55 | | | | 0.67 | | | | 1.97 | | | | 37 | |
Year ended 02/28/18 | | | 10.58 | | | | 0.20 | | | | (0.29 | ) | | | (0.09 | ) | | | (0.20 | ) | | | – | | | | (0.20 | ) | | | 10.29 | | | | (0.86 | ) | | | 45,609 | | | | 0.55 | | | | 0.65 | | | | 2.02 | | | | 48 | |
Class A2 | | | | | | | | | | | | | | | | | | | | | | | | | | | | | | | | | | | | | | | | | | | | | | | | | | | | | | | | |
Year ended 02/28/22 | | | 10.84 | | | | 0.59 | | | | (0.09 | ) | | | 0.50 | | | | (0.46 | ) | | | – | | | | (0.46 | ) | | | 10.88 | | | | 4.66 | | | | 13,778 | | | | 0.45 | | | | 0.51 | | | | 5.33 | | | | 53 | |
Year ended 02/28/21 | | | 10.45 | | | | 0.10 | | | | 0.40 | | | | 0.50 | | | | (0.09 | ) | | | (0.02 | ) | | | (0.11 | ) | | | 10.84 | | | | 4.86 | | | | 15,618 | | | | 0.45 | | | | 0.57 | | | | 0.97 | | | | 49 | |
Year ended 02/29/20 | | | 10.17 | | | | 0.23 | | | | 0.25 | | | | 0.48 | | | | (0.17 | ) | | | (0.03 | ) | | | (0.20 | ) | | | 10.45 | | | | 4.81 | | | | 16,641 | | | | 0.45 | | | | 0.56 | | | | 2.27 | | | | 45 | |
Year ended 02/28/19 | | | 10.30 | | | | 0.21 | | | | (0.08 | ) | | | 0.13 | | | | (0.26 | ) | | | – | | | | (0.26 | ) | | | 10.17 | | | | 1.33 | | | | 17,255 | | | | 0.45 | | | | 0.57 | | | | 2.07 | | | | 37 | |
Year ended 02/28/18 | | | 10.59 | | | | 0.22 | | | | (0.30 | ) | | | (0.08 | ) | | | (0.21 | ) | | | – | | | | (0.21 | ) | | | 10.30 | | | | (0.76 | ) | | | 19,826 | | | | 0.45 | | | | 0.55 | | | | 2.12 | | | | 48 | |
Class Y | | | | | | | | | | | | | | | | | | | | | | | | | | | | | | | | | | | | | | | | | | | | | | | | | | | | | | | | |
Year ended 02/28/22 | | | 10.84 | | | | 0.60 | | | | (0.07 | ) | | | 0.53 | | | | (0.48 | ) | | | – | | | | (0.48 | ) | | | 10.89 | | | | 4.91 | | | | 100,465 | | | | 0.30 | | | | 0.36 | | | | 5.48 | | | | 53 | |
Year ended 02/28/21 | | | 10.45 | | | | 0.12 | | | | 0.40 | | | | 0.52 | | | | (0.11 | ) | | | (0.02 | ) | | | (0.13 | ) | | | 10.84 | | | | 5.02 | | | | 33,512 | | | | 0.30 | | | | 0.42 | | | | 1.12 | | | | 49 | |
Year ended 02/29/20 | | | 10.18 | | | | 0.25 | | | | 0.24 | | | | 0.49 | | | | (0.19 | ) | | | (0.03 | ) | | | (0.22 | ) | | | 10.45 | | | | 4.86 | | | | 17,906 | | | | 0.30 | | | | 0.41 | | | | 2.42 | | | | 45 | |
Year ended 02/28/19 | | | 10.31 | | | | 0.23 | | | | (0.08 | ) | | | 0.15 | | | | (0.28 | ) | | | – | | | | (0.28 | ) | | | 10.18 | | | | 1.48 | | | | 9,843 | | | | 0.30 | | | | 0.42 | | | | 2.22 | | | | 37 | |
Year ended 02/28/18 | | | 10.59 | | | | 0.24 | | | | (0.29 | ) | | | (0.05 | ) | | | (0.23 | ) | | | – | | | | (0.23 | ) | | | 10.31 | | | | (0.51 | ) | | | 12,778 | | | | 0.30 | | | | 0.40 | | | | 2.27 | | | | 48 | |
Class R5 | | | | | | | | | | | | | | | | | | | | | | | | | | | | | | | | | | | | | | | | | | | | | | | | | | | | | | | | |
Year ended 02/28/22 | | | 10.83 | | | | 0.60 | | | | (0.07 | ) | | | 0.53 | | | | (0.48 | ) | | | – | | | | (0.48 | ) | | | 10.88 | | | | 4.91 | | | | 28,283 | | | | 0.30 | | | | 0.34 | | | | 5.48 | | | | 53 | |
Year ended 02/28/21 | | | 10.44 | | | | 0.12 | | | | 0.40 | | | | 0.52 | | | | (0.11 | ) | | | (0.02 | ) | | | (0.13 | ) | | | 10.83 | | | | 5.02 | | | | 4,640 | | | | 0.30 | | | | 0.34 | | | | 1.12 | | | | 49 | |
Year ended 02/29/20 | | | 10.18 | | | | 0.25 | | | | 0.23 | | | | 0.48 | | | | (0.19 | ) | | | (0.03 | ) | | | (0.22 | ) | | | 10.44 | | | | 4.81 | | | | 2,340 | | | | 0.29 | | | | 0.29 | | | | 2.43 | | | | 45 | |
Year ended 02/28/19 | | | 10.31 | | | | 0.23 | | | | (0.08 | ) | | | 0.15 | | | | (0.28 | ) | | | – | | | | (0.28 | ) | | | 10.18 | | | | 1.50 | | | | 2,976 | | | | 0.28 | | | | 0.28 | | | | 2.24 | | | | 37 | |
Year ended 02/28/18 | | | 10.59 | | | | 0.24 | | | | (0.29 | ) | | | (0.05 | ) | | | (0.23 | ) | | | – | | | | (0.23 | ) | | | 10.31 | | | | (0.50 | ) | | | 723 | | | | 0.29 | | | | 0.29 | | | | 2.28 | | | | 48 | |
Class R6 | | | | | | | | | | | | | | | | | | | | | | | | | | | | | | | | | | | | | | | | | | | | | | | | | | | | | | | | |
Year ended 02/28/22 | | | 10.84 | | | | 0.61 | | | | (0.09 | ) | | | 0.52 | | | | (0.48 | ) | | | – | | | | (0.48 | ) | | | 10.88 | | | | 4.84 | | | | 322,282 | | | | 0.28 | | | | 0.28 | | | | 5.50 | | | | 53 | |
Year ended 02/28/21 | | | 10.45 | | | | 0.12 | | | | 0.40 | | | | 0.52 | | | | (0.11 | ) | | | (0.02 | ) | | | (0.13 | ) | | | 10.84 | | | | 5.05 | | | | 391,051 | | | | 0.27 | | | | 0.27 | | | | 1.15 | | | | 49 | |
Year ended 02/29/20 | | | 10.18 | | | | 0.25 | | | | 0.24 | | | | 0.49 | | | | (0.19 | ) | | | (0.03 | ) | | | (0.22 | ) | | | 10.45 | | | | 4.92 | | | | 467,061 | | | | 0.26 | | | | 0.26 | | | | 2.46 | | | | 45 | |
Year ended 02/28/19 | | | 10.31 | | | | 0.23 | | | | (0.08 | ) | | | 0.15 | | | | (0.28 | ) | | | – | | | | (0.28 | ) | | | 10.18 | | | | 1.52 | | | | 624,598 | | | | 0.27 | | | | 0.27 | | | | 2.25 | | | | 37 | |
Year ended 02/28/18 | | | 10.59 | | | | 0.24 | | | | (0.29 | ) | | | (0.05 | ) | | | (0.23 | ) | | | – | | | | (0.23 | ) | | | 10.31 | | | | (0.48 | ) | | | 709,402 | | | | 0.26 | | | | 0.26 | | | | 2.31 | | | | 48 | |
| (a) | Calculated using average shares outstanding. |
| (b) | Includes adjustments in accordance with accounting principles generally accepted in the United States of America and as such, the net asset value for financial reporting purposes and the returns based upon those net asset values may differ from the net asset value and returns for shareholder transactions. Does not include sales charges and is not annualized for periods less than one year, if applicable. |
| (c) | Portfolio turnover is calculated at the fund level and is not annualized for periods less than one year, if applicable. |
See accompanying Notes to Financial Statements which are an integral part of the financial statements.
| | |
| 12 | | Invesco Short Duration Inflation Protected Fund |
Notes to Financial Statements
February 28, 2022
NOTE 1–Significant Accounting Policies
Invesco Short Duration Inflation Protected Fund (the “Fund”), is a series portfolio of AIM Investment Securities Funds (Invesco Investment Securities Funds) (the “Trust”). The Trust is organized as a Delaware statutory trust and is registered under the Investment Company Act of 1940, as amended (the “1940 Act”), as an open-end series management investment company authorized to issue an unlimited number of shares of beneficial interest. Information presented in these financial statements pertains only to the Fund. Matters affecting the Fund or each class will be voted on exclusively by the shareholders of the Fund or each class.
The Fund’s investment objective is to provide protection from the negative effects of unanticipated inflation.
The Fund currently consists of five different classes of shares: Class A, Class A2, Class Y, Class R5 and Class R6. Class A and Class A2 shares are sold with a front-end sales charge unless certain waiver criteria are met. Under certain circumstances, load waived shares may be subject to contingent deferred sales charges (“CDSC”). Class Y, Class R5 and Class R6 shares are sold at net asset value.
As of the close of business on October 30, 2002, Class A2 shares are closed to new investors.
The Fund is an investment company and accordingly follows the investment company accounting and reporting guidance in accordance with Financial Accounting Standards Board Accounting Standards Codification Topic 946, Financial Services - Investment Companies.
The following is a summary of the significant accounting policies followed by the Fund in the preparation of its financial statements.
| A. | Security Valuations - Securities, including restricted securities, are valued according to the following policy. |
Securities are fair valued using an evaluated quote provided by an independent pricing service approved by the Board of Trustees. Evaluated quotes provided by the pricing service may be determined without exclusive reliance on quoted prices and may reflect appropriate factors such as institution-size trading in similar groups of securities, yield, quality, coupon rate, maturity, type of issue, individual trading characteristics and other market data. Pricing services generally value debt obligations assuming orderly transactions of institutional round lot size, but a fund may hold or transact in the same securities in smaller, odd lot sizes. Odd lots often trade at lower prices than institutional round lots. Debt securities are subject to interest rate and credit risks. In addition, all debt securities involve some risk of default with respect to interest and principal payments.
Securities for which market quotations either are not readily available or became unreliable are valued at fair value as determined in good faith by or under the supervision of the Trust’s officers following procedures approved by the Board of Trustees. Some of the factors which may be considered in determining fair value are fundamental analytical data relating to the investment; the nature and duration of any restrictions on transferability or disposition; trading in similar securities by the same issuer or comparable companies; relevant political, economic or issuer specific news; and other relevant factors under the circumstances.
The Fund may invest in securities that are subject to interest rate risk, meaning the risk that the prices will generally fall as interest rates rise and, conversely, the prices will generally rise as interest rates fall. Specific securities differ in their sensitivity to changes in interest rates depending on their individual characteristics. Changes in interest rates may result in increased market volatility, which may affect the value and/or liquidity of certain Fund investments.
Valuations change in response to many factors including the historical and prospective earnings of the issuer, the value of the issuer’s assets, general market conditions which are not specifically related to the particular issuer, such as real or perceived adverse economic conditions, changes in the general outlook for revenues or corporate earnings, changes in interest or currency rates, regional or global instability, natural or environmental disasters, widespread disease or other public health issues, war, acts of terrorism or adverse investor sentiment generally and market liquidity. Because of the inherent uncertainties of valuation, the values reflected in the financial statements may materially differ from the value received upon actual sale of those investments.
| B. | Securities Transactions and Investment Income - Securities transactions are accounted for on a trade date basis. Realized gains or losses on sales are computed on the basis of specific identification of the securities sold. Interest income (net of withholding tax, if any) is recorded on an accrual basis from settlement date and includes coupon interest and amortization of premium and accretion of discount on debt securities as applicable. Pay-in-kind interest income and non-cash dividend income received in the form of securities in-lieu of cash are recorded at the fair value of the securities received. |
The Fund may periodically participate in litigation related to Fund investments. As such, the Fund may receive proceeds from litigation settlements. Any proceeds received are included in the Statement of Operations as realized gain (loss) for investments no longer held and as unrealized gain (loss) for investments still held.
Brokerage commissions and mark ups are considered transaction costs and are recorded as an increase to the cost basis of securities purchased and/or a reduction of proceeds on a sale of securities. Such transaction costs are included in the determination of net realized and unrealized gain (loss) from investment securities reported in the Statement of Operations and the Statement of Changes in Net Assets and the net realized and unrealized gains (losses) on securities per share in the Financial Highlights. Transaction costs are included in the calculation of the Fund’s net asset value and, accordingly, they reduce the Fund’s total returns. These transaction costs are not considered operating expenses and are not reflected in net investment income reported in the Statement of Operations and the Statement of Changes in Net Assets, or the net investment income per share and the ratios of expenses and net investment income reported in the Financial Highlights, nor are they limited by any expense limitation arrangements between the Fund and the investment adviser.
The Fund allocates realized and unrealized capital gains and losses to a class based on the relative net assets of each class. The Fund allocates income to a class based on the relative value of the settled shares of each class.
| C. | Distributions - Distributions from net investment income, if any, are declared and paid quarterly and are recorded on the ex-dividend date. Distributions from net realized capital gain, if any, are generally declared and paid annually and recorded on the ex-dividend date. The Fund may elect to treat a portion of the proceeds from redemptions as distributions for federal income tax purposes. |
| D. | Federal Income Taxes – The Fund intends to comply with the requirements of Subchapter M of the Internal Revenue Code of 1986, as amended (the “Internal Revenue Code”), necessary to qualify as a regulated investment company and to distribute substantially all of the Fund’s taxable earnings to shareholders. As such, the Fund will not be subject to federal income taxes on otherwise taxable income (including net realized capital gain) that is distributed to shareholders. Therefore, no provision for federal income taxes is recorded in the financial statements. |
The Fund recognizes the tax benefits of uncertain tax positions only when the position is more likely than not to be sustained. Management has analyzed the Fund’s uncertain tax positions and concluded that no liability for unrecognized tax benefits should be recorded related to uncertain tax positions. Management is not aware of any tax positions for which it is reasonably possible that the total amounts of unrecognized tax benefits will change materially in the next 12 months.
The Fund files tax returns in the U.S. Federal jurisdiction and certain other jurisdictions. Generally, the Fund is subject to examinations by such taxing authorities for up to three years after the filing of the return for the tax period.
| E. | Expenses – Fees provided for under the Rule 12b-1 plan of a particular class of the Fund are charged to the operations of such class. Transfer agency fees and expenses and other shareholder recordkeeping fees and expenses attributable to Class R5 and Class R6 are allocated based on relative net assets of Class R5 and Class R6. Sub-accounting fees attributable to Class R5 are charged to the operations of the class. Transfer agency fees and expenses and other shareholder recordkeeping fees and expenses relating to all other classes are allocated among those classes based on relative net assets. All other expenses are allocated among the classes based on relative net assets. |
| F. | Accounting Estimates – The preparation of financial statements in conformity with accounting principles generally accepted in the United States of America (“GAAP”) requires management to make estimates and assumptions that affect the reported amounts of assets and liabilities at the date of the financial statements and the reported amounts of revenues and expenses during the reporting period including estimates and assumptions related to taxation. Actual |
| | |
| 13 | | Invesco Short Duration Inflation Protected Fund |
results could differ from those estimates by a significant amount. In addition, the Fund monitors for material events or transactions that may occur or become known after the period-end date and before the date the financial statements are released to print.
| G. | Indemnifications - Under the Trust’s organizational documents, each Trustee, officer, employee or other agent of the Trust is indemnified against certain liabilities that may arise out of the performance of their duties to the Fund. Additionally, in the normal course of business, the Fund enters into contracts, including the Fund’s servicing agreements, that contain a variety of indemnification clauses. The Fund’s maximum exposure under these arrangements is unknown as this would involve future claims that may be made against the Fund that have not yet occurred. The risk of material loss as a result of such indemnification claims is considered remote. |
| H. | Treasury Inflation-Protected Securities – The Fund may invest in Treasury Inflation-Protected Securities (“TIPS”). TIPS are fixed income securities whose principal value is periodically adjusted to the rate of inflation. The principal value of TIPS will be adjusted upward or downward, and any increase or decrease in the principal amount of TIPS will be shown as Treasury Inflation-Protected Securities inflation adjustments in the Statement of Operations, even though investors do not receive their principal until maturity. |
| I. | COVID-19 Risk - The COVID-19 strain of coronavirus has resulted in instances of market closures and dislocations, extreme volatility, liquidity constraints and increased trading costs. Efforts to contain its spread have resulted in travel restrictions, disruptions of healthcare systems, business operations (including business closures) and supply chains, layoffs, lower consumer demand and employee availability, and defaults and credit downgrades, among other significant economic impacts that have disrupted global economic activity across many industries. Such economic impacts may exacerbate other pre-existing political, social and economic risks locally or globally and cause general concern and uncertainty. |
The full economic impact and ongoing effects of COVID-19 (or other future epidemics or pandemics) at the macro-level and on individual businesses are unpredictable and may result in significant and prolonged effects on the Fund’s performance.
NOTE 2–Advisory Fees and Other Fees Paid to Affiliates
The Trust has entered into a master investment advisory agreement with Invesco Advisers, Inc. (the “Adviser” or “Invesco”). Under the terms of the investment advisory agreement, the Fund accrues daily and pays monthly an advisory fee to the Adviser based on the annual rate of the Fund’s average daily net assets as follows:
| | | | |
| Average Daily Net Assets | | Rate | |
|
| |
First $500 million | | | 0.200% | |
|
| |
Over $500 million | | | 0.175% | |
|
| |
For the year ended February 28, 2022, the effective advisory fee rate incurred by the Fund was 0.20%.
Under the terms of a master sub-advisory agreement between the Adviser and each of Invesco Asset Management Deutschland GmbH, Invesco Asset Management Limited, Invesco Asset Management (Japan) Limited, Invesco Hong Kong Limited, Invesco Senior Secured Management, Inc. and Invesco Canada Ltd. (collectively, the “Affiliated Sub-Advisers”) the Adviser, not the Fund, will pay 40% of the fees paid to the Adviser to any such Affiliated Sub-Adviser(s) that provide(s) discretionary investment management services to the Fund based on the percentage of assets allocated to such Affiliated Sub-Adviser(s).
The Adviser has contractually agreed, through at least June 30, 2022, to waive advisory fees and/or reimburse expenses of all shares to the extent necessary to limit total annual fund operating expenses after fee waiver and/or expense reimbursement (excluding certain items discussed below) of Class A, Class A2, Class Y, Class R5 and Class R6 shares to 0.55%, 0.45%, 0.30%, 0.30% and 0.30%, respectively, of the Fund’s average daily net assets (the “expense limits”). In determining the Adviser’s obligation to waive advisory fees and/or reimburse expenses, the following expenses are not taken into account, and could cause the total annual fund operating expenses after fee waiver and/or expense reimbursement to exceed the numbers reflected above: (1) interest; (2) taxes; (3) dividend expense on short sales; (4) extraordinary or non-routine items, including litigation expenses; and (5) expenses that the Fund has incurred but did not actually pay because of an expense offset arrangement. Unless Invesco continues the fee waiver agreement, it will terminate on June 30, 2022. During its term, the fee waiver agreement cannot be terminated or amended to increase the expense limits or reduce the advisory fee waiver without approval of the Board of Trustees.
The Adviser has contractually agreed, through at least June 30, 2023, to waive the advisory fee payable by the Fund in an amount equal to 100% of the net advisory fees the Adviser receives from the affiliated money market funds on investments by the Fund of uninvested cash in such affiliated money market funds.
For the year ended February 28, 2022, the Adviser waived advisory fees of $194 and reimbursed class level expenses of $63,322, $9,384, $34,152, $4,602 and $0 of Class A, Class A2, Class Y, Class R5 and Class R6 shares, respectively.
The Trust has entered into a master administrative services agreement with Invesco pursuant to which the Fund has agreed to pay Invesco for certain administrative costs incurred in providing accounting services to the Fund. For the year ended February 28, 2022, expenses incurred under the agreement are shown in the Statement of Operations as Administrative services fees. Invesco has entered into a sub-administration agreement whereby State Street Bank and Trust Company (“SSB”) serves as fund accountant and provides certain administrative services to the Fund. Pursuant to a custody agreement with the Trust on behalf of the Fund, SSB also serves as the Fund’s custodian.
The Trust has entered into a transfer agency and service agreement with Invesco Investment Services, Inc. (“IIS”) pursuant to which the Fund has agreed to pay IIS a fee for providing transfer agency and shareholder services to the Fund and reimburse IIS for certain expenses incurred by IIS in the course of providing such services. IIS may make payments to intermediaries that provide omnibus account services, sub-accounting services and/or networking services. All fees payable by IIS to intermediaries that provide omnibus account services or sub-accounting services are charged back to the Fund, subject to certain limitations approved by the Trust’s Board of Trustees. For the year ended February 28, 2022, expenses incurred under the agreement are shown in the Statement of Operations as Transfer agent fees.
The Trust has entered into master distribution agreements with Invesco Distributors, Inc. (“IDI”) to serve as the distributor for the Class A, Class A2, Class Y, Class R5 and Class R6 shares of the Fund. The Trust has adopted plans pursuant to Rule 12b-1 under the 1940 Act with respect to the Fund’s Class A and Class A2 shares (collectively, the “Plans”). The Fund, pursuant to the Plans, pays IDI compensation at the annual rate of 0.25% of the average daily net assets of Class A shares and 0.15% of the Fund’s average daily net assets of Class A2 shares. The fees are accrued daily and paid monthly. Of the Plan payments, up to 0.25% of the average daily net assets of each class of shares may be paid to furnish continuing personal shareholder services to customers who purchase and own shares of such classes. Any amounts not paid as a service fee under the Plans would constitute an asset-based sales charge. Rules of the Financial Industry Regulatory Authority (“FINRA”) also impose a cap on the total sales charges, including asset-based sales charges, that may be paid by any class of shares of the Fund. For the year ended February 28, 2022, expenses incurred under the Plans are shown in the Statement of Operations as Distribution fees.
Front-end sales commissions and CDSC (collectively, the “sales charges”) are not recorded as expenses of the Fund. Front-end sales commissions are deducted from proceeds from the sales of Fund shares prior to investment in Class A and Class A2 shares of the Fund. CDSC are deducted from redemption proceeds prior to remittance to the shareholder. During the year ended February 28, 2022, IDI advised the Fund that IDI retained $24,321 and $140 in front-end sales commissions from the sale of Class A and Class A2 shares, respectively, and $15,761 and $0 from Class A and Class A2 shares, respectively, for CDSC was imposed upon redemptions by shareholders.
Certain officers and trustees of the Trust are officers and directors of the Adviser, IIS and/or IDI.
| | |
| 14 | | Invesco Short Duration Inflation Protected Fund |
NOTE 3–Additional Valuation Information
GAAP defines fair value as the price that would be received to sell an asset or paid to transfer a liability in an orderly transaction between market participants at the measurement date, under current market conditions. GAAP establishes a hierarchy that prioritizes the inputs to valuation methods, giving the highest priority to readily available unadjusted quoted prices in an active market for identical assets (Level 1) and the lowest priority to significant unobservable inputs (Level 3), generally when market prices are not readily available or are unreliable. Based on the valuation inputs, the securities or other investments are tiered into one of three levels. Changes in valuation methods may result in transfers in or out of an investment’s assigned level:
| | |
| Level 1 - | | Prices are determined using quoted prices in an active market for identical assets. |
| Level 2 - | | Prices are determined using other significant observable inputs. Observable inputs are inputs that other market participants may use in pricing a security. These may include quoted prices for similar securities, interest rates, prepayment speeds, credit risk, yield curves, loss severities, default rates, discount rates, volatilities and others. |
| Level 3 - | | Prices are determined using significant unobservable inputs. In situations where quoted prices or observable inputs are unavailable (for example, when there is little or no market activity for an investment at the end of the period), unobservable inputs may be used. Unobservable inputs reflect the Fund’s own assumptions about the factors market participants would use in determining fair value of the securities or instruments and would be based on the best available information. |
The following is a summary of the tiered valuation input levels, as of February 28, 2022. The level assigned to the securities valuations may not be an indication of the risk or liquidity associated with investing in those securities. Because of the inherent uncertainties of valuation, the values reflected in the financial statements may materially differ from the value received upon actual sale of those investments.
| | | | | | | | | | | | | | | | |
| | | Level 1 | | | Level 2 | | | Level 3 | | | Total | |
|
| |
Investments in Securities | | | | | | | | | | | | | | | | |
|
| |
U.S. Treasury Securities | | $ | – | | | $ | 590,922,753 | | | | $– | | | $ | 590,922,753 | |
|
| |
Money Market Funds | | | 1,474,755 | | | | – | | | | – | | | | 1,474,755 | |
|
| |
Total Investments | | $ | 1,474,755 | | | $ | 590,922,753 | | | | $– | | | $ | 592,397,508 | |
|
| |
NOTE 4–Expense Offset Arrangement(s)
The expense offset arrangement is comprised of transfer agency credits which result from balances in demand deposit accounts used by the transfer agent for clearing shareholder transactions. For the year ended February 28, 2022, the Fund received credits from this arrangement, which resulted in the reduction of the Fund’s total expenses of $120.
NOTE 5–Trustees’ and Officers’ Fees and Benefits
Trustees’ and Officers’ Fees and Benefits include amounts accrued by the Fund to pay remuneration to certain Trustees and Officers of the Fund. Trustees have the option to defer compensation payable by the Fund, and Trustees’ and Officers’ Fees and Benefits also include amounts accrued by the Fund to fund such deferred compensation amounts. Those Trustees who defer compensation have the option to select various Invesco Funds in which their deferral accounts shall be deemed to be invested. Finally, certain current Trustees were eligible to participate in a retirement plan that provided for benefits to be paid upon retirement to Trustees over a period of time based on the number of years of service. The Fund may have certain former Trustees who also participate in a retirement plan and receive benefits under such plan. Trustees’ and Officers’ Fees and Benefits include amounts accrued by the Fund to fund such retirement benefits. Obligations under the deferred compensation and retirement plans represent unsecured claims against the general assets of the Fund.
NOTE 6–Cash Balances
The Fund may borrow for leveraging in an amount up to 5% of the Fund’s total assets (excluding the amount borrowed) at the time the borrowing is made. In doing so, the Fund is permitted to temporarily carry a negative or overdrawn balance in its account with SSB, the custodian bank. Such balances, if any at period end, are shown in the Statement of Assets and Liabilities under the payable caption Amount due custodian. To compensate the custodian bank for such overdrafts, the overdrawn Fund may either (1) leave funds as a compensating balance in the account so the custodian bank can be compensated by earning the additional interest; or (2) compensate by paying the custodian bank at a rate agreed upon by the custodian bank and Invesco, not to exceed the contractually agreed upon rate. The Fund may not purchase additional securities when any borrowings from banks or broker-dealers exceed 5% of the Fund’s total assets, or when any borrowings from an Invesco Fund are outstanding.
NOTE 7–Distributions to Shareholders and Tax Components of Net Assets
Tax Character of Distributions to Shareholders Paid During the Fiscal Years Ended February 28, 2022 and 2021:
| | | | | | | | | | | | |
| | | 2022 | | | | | | 2021 | |
|
| |
Ordinary income | | $ | 24,343,483 | | | | | | | $ | 5,401,030 | |
|
| |
Return of capital | | | – | | | | | | | | 891,132 | |
|
| |
Total distributions | | $ | 24,343,483 | | | | | | | $ | 6,292,162 | |
|
| |
Tax Components of Net Assets at Period-End:
| | | | |
| | | 2022 | |
|
| |
Undistributed ordinary income | | $ | 6,507,020 | |
|
| |
Net unrealized appreciation - investments | | | 17,113,802 | |
|
| |
Temporary book/tax differences | | | (57,711 | ) |
|
| |
Capital loss carryforward | | | (16,072,899 | ) |
|
| |
Shares of beneficial interest | | | 584,035,238 | |
|
| |
Total net assets | | $ | 591,525,450 | |
|
| |
| | |
| 15 | | Invesco Short Duration Inflation Protected Fund |
The difference between book-basis and tax-basis unrealized appreciation (depreciation) is due to differences in the timing of recognition of gains and losses on investments for tax and book purposes. The Fund’s net unrealized appreciation (depreciation) difference is attributable primarily to wash sales.
The temporary book/tax differences are a result of timing differences between book and tax recognition of income and/or expenses. The Fund’s temporary book/tax differences are the result of the trustee deferral of compensation and retirement plan benefits.
Capital loss carryforward is calculated and reported as of a specific date. Results of transactions and other activity after that date may affect the amount of capital loss carryforward actually available for the Fund to utilize. The ability to utilize capital loss carryforward in the future may be limited under the Internal Revenue Code and related regulations based on the results of future transactions.
The Fund has a capital loss carryforward as of February 28, 2022, as follows:
| | | | | | | | | | | | | | | | |
| | | Capital Loss Carryforward* | | | | | | | | | | |
|
| |
| Expiration | | | | | Short-Term | | | Long-Term | | | Total | |
|
| |
Not subject to expiration | | | | | | | $225,750 | | | | $15,847,149 | | | | $16,072,899 | |
|
| |
| * | Capital loss carryforward is reduced for limitations, if any, to the extent required by the Internal Revenue Code and may be further limited depending upon a variety of factors, including the realization of net unrealized gains or losses as of the date of any reorganization. |
NOTE 8–Investment Transactions
The aggregate amount of long-term U.S. government obligations (other than short-term securities and money market funds, if any) purchased and sold by the Fund during the year ended February 28, 2022 was $343,058,273 and $300,311,978, respectively. Cost of investments, including any derivatives, on a tax basis includes the adjustments for financial reporting purposes as of the most recently completed federal income tax reporting period-end.
Unrealized Appreciation (Depreciation) of Investments on a Tax Basis
| | | | |
|
| |
Aggregate unrealized appreciation of investments | | | $18,115,693 | |
|
| |
Aggregate unrealized (depreciation) of investments | | | (1,001,891 | ) |
|
| |
Net unrealized appreciation of investments | | $ | 17,113,802 | |
|
| |
Cost of investments for tax purposes is $575,283,706.
NOTE 9–Share Information
| | | | | | | | | | | | | | | | |
| | | Summary of Share Activity | |
|
| |
| | |
| | | Year ended | | | Year ended | |
| | | February 28, 2022(a) | | | February 28, 2021 | |
| | | Shares | | | Amount | | | Shares | | | Amount | |
|
| |
Sold: | | | | | | | | | | | | | | | | |
Class A | | | 7,903,870 | | | $ | 86,807,110 | | | | 4,750,132 | | | $ | 50,511,609 | |
|
| |
Class A2 | | | 11,088 | | | | 121,581 | | | | 25,206 | | | | 266,420 | |
|
| |
Class Y | | | 9,681,062 | | | | 106,438,352 | | | | 3,921,203 | | | | 41,706,136 | |
|
| |
Class R5 | | | 2,344,506 | | | | 25,790,989 | | | | 266,930 | | | | 2,798,633 | |
|
| |
Class R6 | | | 6,007,248 | | | | 66,233,446 | | | | 4,359,471 | | | | 46,067,170 | |
|
| |
| | | | | | | | | | | | | | | | |
| | | | |
Issued as reinvestment of dividends: | | | | | | | | | | | | | | | | |
Class A | | | 395,658 | | | | 4,281,458 | | | | 38,963 | | | | 403,271 | |
|
| |
Class A2 | | | 48,672 | | | | 527,752 | | | | 14,592 | | | | 150,779 | |
|
| |
Class Y | | | 226,566 | | | | 2,452,625 | | | | 24,209 | | | | 253,461 | |
|
| |
Class R5 | | | 20,290 | | | | 219,723 | | | | 2,318 | | | | 24,402 | |
|
| |
Class R6 | | | 1,398,568 | | | | 15,171,414 | | | | 511,986 | | | | 5,284,702 | |
|
| |
| | | | |
Reacquired: | | | | | | | | | | | | | | | | |
Class A | | | (3,672,740 | ) | | | (39,990,157 | ) | | | (2,110,472 | ) | | | (22,139,597 | ) |
|
| |
Class A2 | | | (235,202 | ) | | | (2,587,980 | ) | | | (191,692 | ) | | | (2,026,493 | ) |
|
| |
Class Y | | | (3,772,445 | ) | | | (41,596,622 | ) | | | (2,567,460 | ) | | | (27,284,851 | ) |
|
| |
Class R5 | | | (194,536 | ) | | | (2,136,004 | ) | | | (65,146 | ) | | | (682,848 | ) |
|
| |
Class R6 | | | (13,881,330 | ) | | | (154,084,556 | ) | | | (13,496,433 | ) | | | (141,303,663 | ) |
|
| |
Net increase (decrease) in share activity | | | 6,281,275 | | | $ | 67,649,131 | | | | (4,516,193 | ) | | $ | (45,970,869 | ) |
|
| |
| (a) | There are entities that are record owners of more than 5% of the outstanding shares of the Fund and in the aggregate own 64% of the outstanding shares of the Fund. IDI has an agreement with these entities to sell Fund shares. The Fund, Invesco and/or Invesco affiliates may make payments to these entities, which are considered to be related to the Fund, for providing services to the Fund, Invesco and/or Invesco affiliates including but not limited to services such as securities brokerage, distribution, third party record keeping and account servicing. The Fund has no knowledge as to whether all or any portion of the shares owned of record by these entities are also owned beneficially. |
| | |
| 16 | | Invesco Short Duration Inflation Protected Fund |
Report of Independent Registered Public Accounting Firm
To the Board of Trustees of AIM Investment Securities Funds (Invesco Investment Securities Funds) and Shareholders of Invesco Short Duration Inflation Protected Fund
Opinion on the Financial Statements
We have audited the accompanying statement of assets and liabilities, including the schedule of investments, of Invesco Short Duration Inflation Protected Fund (one of the funds constituting AIM Investment Securities Funds (Invesco Investment Securities Funds), referred to hereafter as the “Fund”) as of February 28, 2022, the related statement of operations for the year ended February 28, 2022, the statement of changes in net assets for each of the two years in the period ended February 28, 2022, including the related notes, and the financial highlights for each of the five years in the period ended February 28, 2022 (collectively referred to as the “financial statements”). In our opinion, the financial statements present fairly, in all material respects, the financial position of the Fund as of February 28, 2022, the results of its operations for the year then ended, the changes in its net assets for each of the two years in the period ended February 28, 2022 and the financial highlights for each of the five years in the period ended February 28, 2022 in conformity with accounting principles generally accepted in the United States of America.
Basis for Opinion
These financial statements are the responsibility of the Fund’s management. Our responsibility is to express an opinion on the Fund’s financial statements based on our audits. We are a public accounting firm registered with the Public Company Accounting Oversight Board (United States) (PCAOB) and are required to be independent with respect to the Fund in accordance with the U.S. federal securities laws and the applicable rules and regulations of the Securities and Exchange Commission and the PCAOB.
We conducted our audits of these financial statements in accordance with the standards of the PCAOB. Those standards require that we plan and perform the audit to obtain reasonable assurance about whether the financial statements are free of material misstatement, whether due to error or fraud.
Our audits included performing procedures to assess the risks of material misstatement of the financial statements, whether due to error or fraud, and performing procedures that respond to those risks. Such procedures included examining, on a test basis, evidence regarding the amounts and disclosures in the financial statements. Our audits also included evaluating the accounting principles used and significant estimates made by management, as well as evaluating the overall presentation of the financial statements. Our procedures included confirmation of securities owned as of February 28, 2022 by correspondence with the custodian, transfer agent and brokers; when replies were not received from brokers, we performed other auditing procedures. We believe that our audits provide a reasonable basis for our opinion.
/s/PricewaterhouseCoopers LLP
Houston, Texas
April 28, 2022
We have served as the auditor of one or more of the investment companies in the Invesco group of investment companies since at least 1995. We have not been able to determine the specific year we began serving as auditor.
| | |
| 17 | | Invesco Short Duration Inflation Protected Fund |
Calculating your ongoing Fund expenses
Example
As a shareholder of the Fund, you incur two types of costs: (1) transaction costs, which may include sales charges (loads) on purchase payments or contingent deferred sales charges on redemptions, if any; and (2) ongoing costs, including management fees, distribution and/or service (12b-1) fees, and other Fund expenses. This example is intended to help you understand your ongoing costs (in dollars) of investing in the Fund and to compare these costs with ongoing costs of investing in other mutual funds. The example is based on an investment of $1,000 invested at the beginning of the period and held for the entire period September 1, 2021 through February 28, 2022.
Actual expenses
The table below provides information about actual account values and actual expenses. You may use the information in this table, together with the amount you invested, to estimate the expenses that you paid over the period. Simply divide your account value by $1,000 (for example, an $8,600 account value divided by $1,000 = 8.6), then multiply the result by the number in the table under the heading entitled “Actual Expenses Paid During Period” to estimate the expenses you paid on your account during this period.
Hypothetical example for comparison purposes
The table below also provides information about hypothetical account values and hypothetical expenses based on the Fund’s actual expense ratio and an assumed rate of return of 5% per year before expenses, which is not the Fund’s actual return.
The hypothetical account values and expenses may not be used to estimate the actual ending account balance or expenses you paid for the period. You may use this information to compare the ongoing costs of investing in the Fund and other funds. To do so, compare this 5% hypothetical example with the 5% hypothetical examples that appear in the shareholder reports of the other funds.
Please note that the expenses shown in the table are meant to highlight your ongoing costs only and do not reflect any transaction costs, such as sales charges (loads) on purchase payments or contingent deferred sales charges on redemptions, if any. Therefore, the hypothetical information is useful in comparing ongoing costs only, and will not help you determine the relative total costs of owning different funds. In addition, if these transaction costs were included, your costs would have been higher.
| | | | | | | | | | | | |
| | | | | ACTUAL | | HYPOTHETICAL
(5% annual return before
expenses) | | |
| | | Beginning
Account Value
(09/01/21) | | Ending
Account Value
(02/28/22)1 | | Expenses
Paid During
Period2 | | Ending
Account Value
(02/28/22) | | Expenses
Paid During
Period2 | | Annualized
Expense Ratio |
Class A | | $1,000.00 | | $1,011.60 | | $2.74 | | $1,022.07 | | $2.76 | | 0.55% |
Class A2 | | 1,000.00 | | 1,011.20 | | 2.24 | | 1,022.56 | | 2.26 | | 0.45 |
Class Y | | 1,000.00 | | 1,012.90 | | 1.50 | | 1,023.31 | | 1.51 | | 0.30 |
Class R5 | | 1,000.00 | | 1,012.00 | | 1.50 | | 1,023.31 | | 1.51 | | 0.30 |
Class R6 | | 1,000.00 | | 1,012.00 | | 1.45 | | 1,023.36 | | 1.45 | | 0.29 |
| 1 | The actual ending account value is based on the actual total return of the Fund for the period September 1, 2021 through February 28, 2022, after actual expenses and will differ from the hypothetical ending account value which is based on the Fund’s expense ratio and a hypothetical annual return of 5% before expenses. |
| 2 | Expenses are equal to the Fund’s annualized expense ratio as indicated above multiplied by the average account value over the period, multiplied by 181/365 to reflect the most recent fiscal half year. |
| | |
| 18 | | Invesco Short Duration Inflation Protected Fund |
Tax Information
Form 1099-DIV, Form 1042-S and other year–end tax information provide shareholders with actual calendar year amounts that should be included in their tax returns. Shareholders should consult their tax advisers.
The following distribution information is being provided as required by the Internal Revenue Code or to meet a specific state’s requirement.
The Fund designates the following amounts or, if subsequently determined to be different, the maximum amount allowable for its fiscal year ended February 28, 2022:
| | | | | | |
Federal and State Income Tax | | | | | |
Qualified Dividend Income* | | | 0.00 | % |
Corporate Dividends Received Deduction* | | | 0.00 | % |
U.S. Treasury Obligations* | | | 100.00 | % |
Qualified Business Income* | | | 0.00 | % |
Business Interest Income* | | | 100.00 | % |
|
| * The above percentages are based on ordinary income dividends paid to shareholders during the Fund’s fiscal year. |
| | |
| 19 | | Invesco Short Duration Inflation Protected Fund |
Trustees and Officers
The address of each trustee and officer is AIM Investment Securities Funds (Invesco Investment Securities Funds) (the “Trust”), 11 Greenway Plaza, Suite 1000, Houston, Texas 77046-1173. The trustees serve for the life of the Trust, subject to their earlier death, incapacitation, resignation, retirement or removal as more specifically provided in the Trust’s organizational documents. Each officer serves for a one year term or until their successors are elected and qualified. Column two below includes length of time served with predecessor entities, if any.
| | | | | | | | |
Name, Year of Birth and Position(s) Held with the Trust | | Trustee and/or Officer Since | | Principal Occupation(s) During Past 5 Years | | Number of Funds in Fund Complex Overseen by Trustee | | Other Directorship(s) Held by Trustee During Past 5 Years |
| Interested Trustee | | | | | | | | |
| Martin L. Flanagan1 – 1960 Trustee and Vice Chair | | 2007 | | Executive Director, Chief Executive Officer and President, Invesco Ltd. (ultimate parent of Invesco and a global investment management firm); Trustee and Vice Chair, The Invesco Funds; Vice Chair, Investment Company Institute; and Member of Executive Board, SMU Cox School of Business Formerly: Advisor to the Board, Invesco Advisers, Inc. (formerly known as Invesco Institutional (N.A.), Inc.); Chairman and Chief Executive Officer, Invesco Advisers, Inc. (registered investment adviser); Director, Chairman, Chief Executive Officer and President, Invesco Holding Company (US), Inc. (formerly IVZ Inc.) (holding company), Invesco Group Services, Inc. (service provider) and Invesco North American Holdings, Inc. (holding company); Director, Chief Executive Officer and President, Invesco Holding Company Limited (parent of Invesco and a global investment management firm); Director, Invesco Ltd.; Chairman, Investment Company Institute and President, Co-Chief Executive Officer, Co-President, Chief Operating Officer and Chief Financial Officer, Franklin Resources, Inc. (global investment management organization) | | 188 | | None |
| 1 | Mr. Flanagan is considered an interested person (within the meaning of Section 2(a)(19) of the 1940 Act) of the Trust because he is an officer of the Adviser to the Trust, and an officer and a director of Invesco Ltd., ultimate parent of the Adviser. |
| | |
| T-1 | | Invesco Short Duration Inflation Protected Fund |
Trustees and Officers–(continued)
| | | | | | | | |
Name, Year of Birth and
Position(s) Held with the Trust | | Trustee and/or Officer Since | | Principal Occupation(s) During Past 5 Years | | Number of Funds in Fund Complex
Overseen by
Trustee | | Other Directorship(s)
Held by Trustee During Past 5 Years |
| Independent Trustees | | | | | | | | |
Christopher L. Wilson – 1957 Trustee and Chair | | 2017 | | Retired Formerly: Director, TD Asset Management USA Inc. (mutual fund complex) (22 portfolios); Managing Partner, CT2, LLC (investing and consulting firm); President/Chief Executive Officer, Columbia Funds, Bank of America Corporation; President/Chief Executive Officer, CDC IXIS Asset Management Services, Inc.; Principal & Director of Operations, Scudder Funds, Scudder, Stevens & Clark, Inc.; Assistant Vice President, Fidelity Investments | | 188 | | Formerly: enaible, Inc. (artificial intelligence technology) Director, ISO New England, Inc. (non-profit organization managing regional electricity market) |
Beth Ann Brown – 1968 Trustee | | 2019 | | Independent Consultant Formerly: Head of Intermediary Distribution, Managing Director, Strategic Relations, Managing Director, Head of National Accounts, Senior Vice President, National Account Manager and Senior Vice President, Key Account Manager, Columbia Management Investment Advisers LLC; Vice President, Key Account Manager, Liberty Funds Distributor, Inc.; and Trustee of certain Oppenheimer Funds | | 188 | | Director, Board of Directors of Caron Engineering Inc.; Advisor, Board of Advisors of Caron Engineering Inc.; President and Director, Acton Shapleigh Youth Conservation Corps (non-profit) Formerly: President and Director of Grahamtastic Connection (non-profit) |
| Cynthia Hostetler – 1962 Trustee | | 2017 | | Non-Executive Director and Trustee of a number of public and private business corporations Formerly: Director, Aberdeen Investment Funds (4 portfolios); Director, Artio Global Investment LLC (mutual fund complex); Director, Edgen Group, Inc. (specialized energy and infrastructure products distributor); Director, Genesee & Wyoming, Inc. (railroads); Head of Investment Funds and Private Equity, Overseas Private Investment Corporation; President, First Manhattan Bancorporation, Inc.; Attorney, Simpson Thacher & Bartlett LLP | | 188 | | Resideo Technologies, Inc. (smart home technology); Vulcan Materials Company (construction materials company); Trilinc Global Impact Fund; Textainer Group Holdings, (shipping container leasing company); Investment Company Institute (professional organization); Independent Directors Council (professional organization) |
| Eli Jones – 1961 Trustee | | 2016 | | Professor and Dean Emeritus, Mays Business School - Texas A&M University Formerly: Dean of Mays Business School-Texas A&M University; Professor and Dean, Walton College of Business, University of Arkansas and E.J. Ourso College of Business, Louisiana State University; Director, Arvest Bank | | 188 | | Insperity, Inc. (formerly known as Administaff) (human resources provider); Member of Regional Board of Directors and Board of Directors, First Financial Bancorp (regional bank) |
| Elizabeth Krentzman – 1959 Trustee | | 2019 | | Formerly: Principal and Chief Regulatory Advisor for Asset Management Services and U.S. Mutual Fund Leader of Deloitte & Touche LLP; General Counsel of the Investment Company Institute (trade association); National Director of the Investment Management Regulatory Consulting Practice, Principal, Director and Senior Manager of Deloitte & Touche LLP; Assistant Director of the Division of Investment Management - Office of Disclosure and Investment Adviser Regulation of the U.S. Securities and Exchange Commission and various positions with the Division of Investment Management – Office of Regulatory Policy of the U.S. Securities and Exchange Commission; Associate at Ropes & Gray LLP; and Trustee of certain Oppenheimer Funds | | 188 | | Trustee of the University of Florida National Board Foundation; Member of the Cartica Funds Board of Directors (private investment funds) Formerly: Member of the University of Florida Law Center Association, Inc. Board of Trustees, Audit Committee and Membership Committee |
| Anthony J. LaCava, Jr. – 1956 Trustee | | 2019 | | Formerly: Director and Member of the Audit Committee, Blue Hills Bank (publicly traded financial institution) and Managing Partner, KPMG LLP | | 188 | | Blue Hills Bank; Chairman, Bentley University; Member, Business School Advisory Council; and Nominating Committee, KPMG LLP |
| Prema Mathai-Davis – 1950 Trustee | | 1998 | | Retired Formerly: Co-Founder & Partner of Quantalytics Research, LLC, (a FinTech Investment Research Platform for the Self-Directed Investor); Trustee of YWCA Retirement Fund; CEO of YWCA of the USA; Board member of the NY Metropolitan Transportation Authority; Commissioner of the NYC Department of Aging; Board member of Johns Hopkins Bioethics Institute | | 188 | | Member of Board of Positive Planet US (non-profit) and HealthCare Chaplaincy Network (non-profit) |
| | |
| T-2 | | Invesco Short Duration Inflation Protected Fund |
Trustees and Officers–(continued)
| | | | | | | | |
Name, Year of Birth and
Position(s) Held with the Trust | | Trustee and/or Officer Since | | Principal Occupation(s) During Past 5 Years | | Number of Funds in Fund Complex Overseen by Trustee | | Other Directorship(s) Held by Trustee During Past 5 Years |
| Independent Trustees–(continued) | | | | | | |
Joel W. Motley – 1952 Trustee | | 2019 | | Director of Office of Finance, Federal Home Loan Bank System; Managing Director of Carmona Motley Inc. (privately held financial advisor); Member of the Council on Foreign Relations and its Finance and Budget Committee; Chairman Emeritus of Board of Human Rights Watch and Member of its Investment Committee; and Member of Investment Committee Board of Historic Hudson Valley (non-profit cultural organization); and Member of the Board, Blue Ocean Acquisition Corp. Formerly: Managing Director of Public Capital Advisors, LLC (privately held financial advisor); Managing Director of Carmona Motley Hoffman, Inc. (privately held financial advisor); Trustee of certain Oppenheimer Funds; Director of Columbia Equity Financial Corp. (privately held financial advisor); and Member of the Vestry of Trinity Church Wall Street | | 188 | | Member of Board of Trust for Mutual Understanding (non-profit promoting the arts and environment); Member of Board of Greenwall Foundation (bioethics research foundation) and its Investment Committee; Member of Board of Friends of the LRC (non-profit legal advocacy); Board Member and Investment Committee Member of Pulitzer Center for Crisis Reporting (non-profit journalism)Positive Planet US |
Teresa M. Ressel – 1962 Trustee | | 2017 | | Non-executive director and trustee of a number of public and private business corporations Formerly: Chief Executive Officer, UBS Securities LLC (investment banking); Chief Operating Officer, UBS AG Americas (investment banking); Sr. Management Team Olayan America, The Olayan Group (international investor/commercial/industrial); Assistant Secretary for Management & Budget and Designated Chief Financial Officer, U.S. Department of Treasury; Director, Atlantic Power Corporation (power generation company) and ON Semiconductor Corporation (semiconductor manufacturing) | | 188 | | None |
Ann Barnett Stern – 1957 Trustee | | 2017 | | President, Chief Executive Officer and Board Member, Houston Endowment, Inc. a private philanthropic institution Formerly: Executive Vice President, Texas Children’s Hospital; Vice President, General Counsel and Corporate Compliance Officer, Texas Children’s Hospital; Attorney at Beck, Redden and Secrest, LLP and Andrews and Kurth LLP | | 188 | | Trustee and Board Vice Chair of Holdsworth Center Trustee and Chair of Nomination/Governance Committee, Good Reason Houston, (non-profit); Trustee and Investment Committee member of University of Texas Law School Foundation (non-profit); Board Member of Greater Houston Partnership (non-profit); Advisory Board member, Baker Institute for Public Policy at Rice University (non-profit) Formerly: Director and Audit Committee Member of Federal Reserve Bank of Dallas |
Robert C. Troccoli – 1949 Trustee | | 2016 | | Retired Formerly: Adjunct Professor, University of Denver – Daniels College of Business; and Managing Partner, KPMG LLP | | 188 | | None |
Daniel S. Vandivort –1954 Trustee | | 2019 | | President, Flyway Advisory Services LLC (consulting and property management) | | 188 | | Formerly: Trustee, Board of Trustees, Treasurer and Chairman of the Audit and Committee, Huntington Disease Foundation of America; Trustee and Governance Chair, of certain Oppenheimer Funds |
| | |
| T-3 | | Invesco Short Duration Inflation Protected Fund |
Trustees and Officers–(continued)
| | | | | | | | |
Name, Year of Birth and
Position(s) Held with the Trust | | Trustee and/or Officer Since | | Principal Occupation(s) During Past 5 Years | | Number of Funds in Fund Complex Overseen by Trustee | | Other Directorship(s) Held by Trustee During Past 5 Years |
| Officers | | | | | | | | |
Sheri Morris – 1964 President and Principal Executive Officer | | 1999 | | Head of Global Fund Services, Invesco Ltd.; President and Principal Executive Officer, The Invesco Funds; Vice President, Invesco Exchange-Traded Fund Trust, Invesco Exchange-Traded Fund Trust II, Invesco India Exchange-Traded Fund Trust, Invesco Actively Managed Exchange-Traded Fund Trust, Invesco Actively Managed Exchange-Traded Commodity Fund Trust and Invesco Exchange-Traded Self-Indexed Fund Trust; and Vice President, OppenheimerFunds, Inc. Formerly: Vice President, Treasurer and Principal Financial Officer, The Invesco Funds; Vice President, Invesco AIM Advisers, Inc., Invesco AIM Capital Management, Inc. and Invesco AIM Private Asset Management, Inc.; Assistant Vice President and Assistant Treasurer, The Invesco Funds; Vice President and Assistant Vice President, Invesco Advisers, Inc.; Assistant Vice President, Invesco AIM Capital Management, Inc. and Invesco AIM Private Asset Management, Inc.; Treasurer, Invesco Exchange-Traded Fund Trust, Invesco Exchange-Traded Fund Trust II, Invesco India Exchange-Traded Fund Trust and Invesco Actively Managed Exchange-Traded Fund Trust and Senior Vice President, Invesco Advisers, Inc. (formerly known as Invesco Institutional (N.A.), Inc.) (registered investment adviser) | | N/A | | N/A |
Jeffrey H. Kupor – 1968 Senior Vice President, Chief Legal Officer and Secretary | | 2018 | | Head of Legal of the Americas, Invesco Ltd.; Senior Vice President and Secretary, Invesco Advisers, Inc. (formerly known as Invesco Institutional (N.A.), Inc.) (registered investment adviser); Senior Vice President and Secretary, Invesco Distributors, Inc. (formerly known as Invesco AIM Distributors, Inc.); Vice President and Secretary, Invesco Investment Services, Inc. (formerly known as Invesco AIM Investment Services, Inc.) Senior Vice President, Chief Legal Officer and Secretary, The Invesco Funds; Secretary and General Counsel, Invesco Investment Advisers LLC (formerly known as Van Kampen Asset Management); Secretary and General Counsel, Invesco Capital Markets, Inc. (formerly known as Van Kampen Funds Inc.) and Chief Legal Officer, Invesco Exchange-Traded Fund Trust, Invesco Exchange-Traded Fund Trust II, Invesco India Exchange-Traded Fund Trust, Invesco Actively Managed Exchange-Traded Fund Trust, Invesco Actively Managed Exchange-Traded Commodity Fund Trust and Invesco Exchange-Traded Self-Indexed Fund Trust;; Secretary and Vice President, Harbourview Asset Management Corporation; Secretary and Vice President, OppenheimerFunds, Inc. and Invesco Managed Accounts, LLC; Secretary and Senior Vice President, OFI Global Institutional, Inc.; Secretary and Vice President, OFI SteelPath, Inc.; Secretary and Vice President, Oppenheimer Acquisition Corp.; Secretary and Vice President, Shareholder Services, Inc.; Secretary and Vice President, Trinity Investment Management Corporation Formerly: Secretary and Vice President, Jemstep, Inc.; Head of Legal, Worldwide Institutional, Invesco Ltd.; Secretary and General Counsel, INVESCO Private Capital Investments, Inc.; Senior Vice President, Secretary and General Counsel, Invesco Management Group, Inc. (formerly known as Invesco AIM Management Group, Inc.); Assistant Secretary, INVESCO Asset Management (Bermuda) Ltd.; Secretary and General Counsel, Invesco Private Capital, Inc.; Assistant Secretary and General Counsel, INVESCO Realty, Inc.; Secretary and General Counsel, Invesco Senior Secured Management, Inc.; Secretary, Sovereign G./P. Holdings Inc.; and Secretary, Invesco Indexing LLC; Secretary, W.L. Ross & Co., LLC | | N/A | | N/A |
Andrew R. Schlossberg – 1974 Senior Vice President | | 2019 | | Head of the Americas and Senior Managing Director, Invesco Ltd.; Director and Senior Vice President, Invesco Advisers, Inc. (formerly known as Invesco Institutional (N.A.), Inc.) (registered investment adviser); Director and Chairman, Invesco Investment Services, Inc. (formerly known as Invesco AIM Investment Services, Inc.) (registered transfer agent); Senior Vice President, The Invesco Funds; Director, Invesco Investment Advisers LLC (formerly known as Van Kampen Asset Management) Formerly: Director, President and Chairman, Invesco Insurance Agency, Inc.; Director, Invesco UK Limited; Director and Chief Executive, Invesco Asset Management Limited and Invesco Fund Managers Limited; Assistant Vice President, The Invesco Funds; Senior Vice President, Invesco Advisers, Inc. (formerly known as Invesco Institutional (N.A.), Inc.) (registered investment adviser); Director and Chief Executive, Invesco Administration Services Limited and Invesco Global Investment Funds Limited; Director, Invesco Distributors, Inc.; Head of EMEA, Invesco Ltd.; President, Invesco Actively Managed Exchange-Traded Commodity Fund Trust, Invesco Actively Managed Exchange-Traded Fund Trust, Invesco Exchange-Traded Fund Trust, Invesco Exchange-Traded Fund Trust II and Invesco India Exchange-Traded Fund Trust; Managing Director and Principal Executive Officer, Invesco Capital Management LLC | | N/A | | N/A |
| | |
| T-4 | | Invesco Short Duration Inflation Protected Fund |
Trustees and Officers–(continued)
| | | | | | | | |
Name, Year of Birth and
Position(s) Held with the Trust | | Trustee and/or Officer Since | | Principal Occupation(s) During Past 5 Years | | Number of Funds in
Fund Complex
Overseen by
Trustee | | Other Directorship(s)
Held by Trustee During Past 5 Years |
| Officers–(continued) | | | | | | | | |
John M. Zerr – 1962 Senior Vice President | | 2006 | | Chief Operating Officer of the Americas; Senior Vice President, Invesco Advisers, Inc. (formerly known as Invesco Institutional (N.A.), Inc.) (registered investment adviser); Senior Vice President, Invesco Distributors, Inc. (formerly known as Invesco AIM Distributors, Inc.); Director and Vice President, Invesco Investment Services, Inc. (formerly known as Invesco AIM Investment Services, Inc.) Senior Vice President, The Invesco Funds; Managing Director, Invesco Capital Management LLC; Director, Invesco Investment Advisers LLC (formerly known as Van Kampen Asset Management); Senior Vice President, Invesco Capital Markets, Inc. (formerly known as Van Kampen Funds Inc.); Manager, Invesco Indexing LLC; Manager, Invesco Specialized Products, LLC; Member, Invesco Canada Funds Advisory Board; Director, President and Chief Executive Officer, Invesco Corporate Class Inc. (corporate mutual fund company); and Director, Chairman, President and Chief Executive Officer, Invesco Canada Ltd. (formerly known as Invesco Trimark Ltd./Invesco Trimark Ltèe) (registered investment adviser and registered transfer agent); President, Invesco, Inc.; President, Invesco Global Direct Real Estate Feeder GP Ltd.; President, Invesco IP Holdings (Canada) Ltd; President, Invesco Global Direct Real Estate GP Ltd.; President, Invesco Financial Services Ltd. / Services Financiers Invesco Ltée; and Director and Chairman, Invesco Trust Company Formerly: President, Trimark Investments Ltd/Services Financiers Invesco Ltee; Director and Senior Vice President, Invesco Insurance Agency, Inc.; Director and Senior Vice President, Invesco Management Group, Inc. (formerly known as Invesco AIM Management Group, Inc.); Secretary and General Counsel, Invesco Management Group, Inc. (formerly known as Invesco AIM Management Group, Inc.); Secretary, Invesco Investment Services, Inc. (formerly known as Invesco AIM Investment Services, Inc.); Chief Legal Officer and Secretary, The Invesco Funds; Secretary and General Counsel, Invesco Investment Advisers LLC (formerly known as Van Kampen Asset Management); Secretary and General Counsel, Invesco Capital Markets, Inc. (formerly known as Van Kampen Funds Inc.); Chief Legal Officer, Invesco Exchange-Traded Fund Trust, Invesco Exchange-Traded Fund Trust II, Invesco India Exchange-Traded Fund Trust, Invesco Actively Managed Exchange-Traded Fund Trust, Invesco Actively Managed Exchange-Traded Commodity Fund Trust and Invesco Exchange-Traded Self-Indexed Fund Trust; Secretary, Invesco Indexing LLC; Director, Secretary, General Counsel and Senior Vice President, Van Kampen Exchange Corp.; Director, Vice President and Secretary, IVZ Distributors, Inc. (formerly known as INVESCO Distributors, Inc.); Director and Vice President, INVESCO Funds Group, Inc.; Director and Vice President, Van Kampen Advisors Inc.; Director, Vice President, Secretary and General Counsel, Van Kampen Investor Services Inc.;Director and Secretary, Invesco Distributors, Inc. (formerly known as Invesco AIM Distributors, Inc.); Director, Senior Vice President, General Counsel and Secretary, Invesco AIM Advisers, Inc. and Van Kampen Investments Inc.; Director, Vice President and Secretary, Fund Management Company; Director, Senior Vice President, Secretary, General Counsel and Vice President, Invesco AIM Capital Management, Inc.; Chief Operating Officer and General Counsel, Liberty Ridge Capital, Inc. (an investment adviser) | | N/A | | N/A |
Gregory G. McGreevey – 1962 Senior Vice President | | 2012 | | Senior Managing Director, Invesco Ltd.; Director, Chairman, President, and Chief Executive Officer, Invesco Advisers, Inc. (formerly known as Invesco Institutional (N.A.), Inc.) (registered investment adviser); Director, Invesco Mortgage Capital, Inc. and Invesco Senior Secured Management, Inc.; Senior Vice President, The Invesco Funds; President, SNW Asset Management Corporation and Invesco Managed Accounts, LLC; Chairman and Director, Invesco Private Capital, Inc.; Chairman and Director, INVESCO Private Capital Investments, Inc.; Chairman and Director, INVESCO Realty, Inc.; and Senior Vice President, Invesco Group Services, Inc. Formerly: Senior Vice President, Invesco Management Group, Inc. and Invesco Advisers, Inc.; Assistant Vice President, The Invesco Funds | | N/A | | N/A |
Adrien Deberghes – 1967 Principal Financial Officer, Treasurer and Vice President | | 2020 | | Head of the Fund Office of the CFO and Fund Administration; Vice President, Invesco Advisers, Inc.; Principal Financial Officer, Treasurer and Vice President, The Invesco Funds; Vice President, Invesco Exchange-Traded Fund Trust, Invesco Exchange-Traded Fund Trust II, Invesco India Exchange-Traded Fund Trust, Invesco Actively Managed Exchange-Traded Fund Trust, Invesco Actively Managed Exchange-Traded Commodity Fund Trust and Invesco Exchange-Traded Self-Indexed Fund Trust Formerly: Senior Vice President and Treasurer, Fidelity Investments | | N/A | | N/A |
Crissie M. Wisdom – 1969 Anti-Money Laundering Compliance Officer | | 2013 | | Anti-Money Laundering and OFAC Compliance Officer for Invesco U.S. entities including: Invesco Advisers, Inc. and its affiliates, Invesco Capital Markets, Inc., Invesco Distributors, Inc., Invesco Investment Services, Inc., The Invesco Funds, Invesco Capital Management, LLC, Invesco Trust Company; and Fraud Prevention Manager for Invesco Investment Services, Inc. | | N/A | | N/A |
| | |
| T-5 | | Invesco Short Duration Inflation Protected Fund |
Trustees and Officers–(continued)
| | | | | | | | |
Name, Year of Birth and
Position(s) Held with the Trust | | Trustee and/or Officer Since | | Principal Occupation(s) During Past 5 Years | | Number of Funds in
Fund Complex
Overseen by
Trustee | | Other Directorship(s)
Held by Trustee During Past 5 Years |
| Officers–(continued) | | | | | | | | |
Todd F. Kuehl – 1969 Chief Compliance Officer and Senior Vice President | | 2020 | | Chief Compliance Officer, Invesco Advisers, Inc. (registered investment adviser); and Chief Compliance Officer, The Invesco Funds and Senior Vice President Formerly: Managing Director and Chief Compliance Officer, Legg Mason (Mutual Funds); Chief Compliance Officer, Legg Mason Private Portfolio Group (registered investment adviser) | | N/A | | N/A |
Michael McMaster – 1962 Chief Tax Officer, Vice President and Assistant Treasurer | | 2020 | | Head of Global Fund Services Tax; Chief Tax Officer, Vice President and Assistant Treasurer, The Invesco Funds; Vice President, Invesco Advisers, Inc.; Assistant Treasurer, Invesco Capital Management LLC, Assistant Treasurer and Chief Tax Officer, Invesco Exchange-Traded Fund Trust, Invesco Exchange-Traded Fund Trust II, Invesco India Exchange-Traded Fund Trust, Invesco Actively Managed Exchange-Traded Fund Trust, Invesco Actively Managed Exchange-Traded Commodity Fund Trust and Invesco Exchange-Traded Self-Indexed Fund Trust; Assistant Treasurer, Invesco Specialized Products, LLC Formerly: Senior Vice President – Managing Director of Tax Services, U.S. Bank Global Fund Services (GFS) | | N/A | | N/A |
The Statement of Additional Information of the Trust includes additional information about the Fund’s Trustees and is available upon request, without charge, by calling 1.800.959.4246. Please refer to the Fund’s Statement of Additional Information for information on the Fund’s sub-advisers.
| | | | | | |
| Office of the Fund | | Investment Adviser | | Distributor | | Auditors |
| 11 Greenway Plaza, Suite 1000 | | Invesco Advisers, Inc. | | Invesco Distributors, Inc. | | PricewaterhouseCoopers LLP |
| Houston, TX 77046-1173 | | 1555 Peachtree Street, N.E. | | 11 Greenway Plaza, Suite 1000 | | 1000 Louisiana Street, Suite 5800 |
| | Atlanta, GA 30309 | | Houston, TX 77046-1173 | | Houston, TX 77002-5678 |
| | | |
| Counsel to the Fund | | Counsel to the Independent Trustees | | Transfer Agent | | Custodian |
| Stradley Ronon Stevens & Young, LLP | | Goodwin Procter LLP | | Invesco Investment Services, Inc. | | State Street Bank and Trust Company |
| 2005 Market Street, Suite 2600 | | 901 New York Avenue, N.W. | | 11 Greenway Plaza, Suite 1000 | | 225 Franklin Street |
| Philadelphia, PA 19103-7018 | | Washington, D.C. 20001 | | Houston, TX 77046-1173 | | Boston, MA 02110-2801 |
| | |
| T-6 | | Invesco Short Duration Inflation Protected Fund |
(This page intentionally left blank)
(This page intentionally left blank)

Go paperless with eDelivery
Visit invesco.com/edelivery to enjoy the convenience and security of anytime electronic access to your investment documents.
With eDelivery, you can elect to have any or all of the following materials delivered straight to your inbox to download, save and print from your own computer:
∎ Fund reports and prospectuses
∎ Quarterly statements
∎ Daily confirmations
∎ Tax forms
Invesco mailing information
Send general correspondence to Invesco Investment Services, Inc., P.O. Box 219078, Kansas City, MO 64121-9078.
Important notice regarding delivery of security holder documents
To reduce Fund expenses, only one copy of most shareholder documents may be mailed to shareholders with multiple accounts at the same address (Householding). Mailing of your shareholder documents may be householded indefinitely unless you instruct us otherwise. If you do not want the mailing of these documents to be combined with those for other members of your household, please contact Invesco Investment Services, Inc. at 800 959 4246 or contact your financial institution. We will begin sending you individual copies for each account within 30 days after receiving your request.
Fund holdings and proxy voting information
The Fund provides a complete list of its portfolio holdings four times each year, at the end of each fiscal quarter. For the second and fourth quarters, the list appears, respectively, in the Fund’s semiannual and annual reports to shareholders. For the first and third quarters, the Fund files the list with the Securities and Exchange Commission (SEC) as an exhibit to its reports on Form N-PORT. The most recent list of portfolio holdings is available at invesco.com/completeqtrholdings. Shareholders can also look up the Fund’s Form N-PORT filings on the SEC website, sec.gov. The SEC file numbers for the Fund are shown below.
A description of the policies and procedures that the Fund uses to determine how to vote proxies relating to portfolio securities is available without charge, upon request, from our Client Services department at 800 959 4246, or at invesco.com/ corporate/about-us/esg. The information is also available on the SEC website, sec.gov.
Information regarding how the Fund voted proxies related to its portfolio securities during the most recent 12-month period ended June 30 is available at invesco.com/proxysearch. This information is also available on the SEC website, sec.gov.
Invesco Advisers, Inc. is an investment adviser; it provides investment advisory services to individual and institutional clients and does not sell securities. Invesco Distributors, Inc. is the US distributor for Invesco Ltd.’s retail mutual funds, exchange-traded funds and institutional money market funds. Both are wholly owned, indirect subsidiaries of Invesco Ltd.

| | | | |
| SEC file number(s): 811-05686 and 003-39519 | | Invesco Distributors, Inc. | | SDIP-AR-1 |

| | |
| | |
| Annual Report to Shareholders | | February 28, 2022 |
Invesco Short Term Bond Fund
Nasdaq:
A: STBAX ∎ C: STBCX ∎ R: STBRX ∎ Y: STBYX ∎ R5: ISTBX ∎ R6: ISTFX
Management’s Discussion of Fund Performance
| | | | |
| |
Performance summary For the fiscal year ended February 28, 2022, Class A shares of Invesco Short Term Bond Fund (the Fund), at net asset value (NAV), underperformed the Bloomberg 1-3 Year Government/Credit Index, the Fund’s style-specific benchmark. Your Fund’s long-term performance appears later in this report. | |
| | |
Fund vs. Indexes | | | | |
Total returns, 2/28/21 to 2/28/22, at net asset value (NAV). Performance shown does not include applicable contingent deferred sales charges (CDSC) or front-end sales charges, which would have reduced performance. | |
| |
Class A Shares | | | -2.20 | % |
Class C Shares | | | -2.52 | |
Class R Shares | | | -2.54 | |
Class Y Shares | | | -1.94 | |
Class R5 Shares | | | -1.89 | |
Class R6 Shares | | | -1.95 | |
Bloomberg U.S. Aggregate Bond Index▼ (Broad Market Index) | | | -2.64 | |
Bloomberg 1-3 Year Government/Credit Index▼ (Style-Specific Index) | | | -1.62 | |
Lipper Short Investment Grade Debt Funds Index∎ (Peer Group Index) | | | -1.40 | |
Source(s): ▼RIMES Technologies Corp.; ∎Lipper Inc. | |
Market conditions and your Fund
In the first quarter of 2021, rising 10-year US Treasury yields increased significantly to 1.74%,1 its highest level since January 2020, reflecting higher inflation expectations. Largely a result of economic optimism, government bond yields rose globally during the first quarter of 2021 as investors began to price in higher levels of economic growth and inflation moving towards a post-pandemic world. On the fiscal front, another stimulus package was signed into law and COVID-19 vaccine approvals and administration ramped up. 30-year Treasury yields moved higher by 0.75% to end the quarter at 2.41%.1 Importantly, short-term rates, which are closely tied to the US Federal Reserve (the Fed) policy, were quite steady. Two-year US Treasury yields moved up just 0.05% to 0.16%.1
Fixed income markets settled down in the second quarter of 2021, posting gains and rebounding from negative performance experienced during the early part of the fiscal year due to a sharply rising interest rate environment. Despite higher volatility stemming from inflation concerns and the potential for rising interest rates, investors remained optimistic about the strength of the economic recovery after the Bureau of Economic Analysis reported that US gross domestic product grew at a 6.4% annualized rate for the first quarter of 2021.2 As the US COVID-19 vaccination rate neared the 50% threshold, consumers resumed pre-pandemic activities in the third quarter of 2021 and economically sensitive areas such as the consumer discretionary and industrials sectors began to recover.
In the fourth quarter of 2021, concerns about inflation heightened as US inflation rose to 7%,3 its highest level in nearly 40 years. Though the Fed left policy rates unchanged in the quarter, the Fed indicated its accommodative policies were coming to an
end in 2022 through a willingness to raise interest rates to combat inflation and the announced reduction of its monthly bond purchase program. Additionally, US interest rate moves and inflation risk significantly affected fixed income valuations during the quarter. The two-year Treasury yield rose moderately from 0.27% to 0.73%, while the 10-year increased slightly from 1.48% to 1.52%.1 The yield curve, as measured by the yield differential between two- and 10-year Treasuries flattened during the quarter. Despite the withdrawal of central bank support and coronavi-rus variants raising concerns about economic reopenings and the resumption of travel, we believe investors are cautiously optimistic and expect corporate balance sheets to continue to recover meaningfully in 2022.
At the beginning of 2022, geopolitical and economic tensions between Ukraine and Russia culminated with the latter invading Ukraine. World leaders levied sanctions against Russia that we believe will likely have material effects on its fixed income markets, particularly sovereign debt, corporates and levels of liquidity. Regarding inflation concerns, political uncertainty should give central banks a reason to be cautious, with the Fed unlikely to raise rates by more than 0.25% at the March Federal Open Market Committee meeting, whereas before this crisis, a 0.50% increase was increasingly likely.
The Fund, at NAV, generated negative returns for the fiscal year and underperformed its style-specific benchmark, the Bloomberg 1-3 Year Government/Credit Index.
The Fund’s overweight allocation to and security selection in the investment-grade corporate credit sector was the primary detractor of Fund performance relative to the style-specific benchmark during the fiscal year, as investment-grade spreads widened. In particular, an overweight allocation to and security selection in the communications,
finance companies and consumer cyclical sub-sectors detracted the most from the Fund’s relative performance. Overweight allocation to and security selection in the energy, transportation and capital goods sub-sectors contributed most to Fund performance. Our overall duration positioning during the fiscal year contributed to the Fund’s performance while the Fund’s cash position detracted from relative performance due to trading friction and higher than usual bid/offers.
During the fiscal year, we used several strategies in seeking to manage overall risk in the Fund and manage liquidity needs. Throughout the fiscal year, approximately 30% of the portfolio, on average, had a final maturity of less than one year; this provided sufficient liquidity and an important buffer against credit market volatility. The Fund did not use any credit derivatives during the fiscal year.
The Fund may use active duration and yield curve positioning for risk management and for generating alpha versus its style-specific benchmark. (Alpha is a measure of performance on a risk-adjusted basis.) Duration measures a portfolio’s price sensitivity to interest rate changes, with a shorter duration portfolio tending to be less sensitive to these changes. Duration of the portfolio was maintained near the style-specific benchmark, on average and the timing of changes and the degree of variance from the Fund’s style-specific benchmark during the fiscal year had a minimal impact on relative Fund performance. Yield curve positioning, obtained by overweight exposure to longer maturities and underweight exposure to shorter-term maturities, benefited the Fund during the fiscal year. Buying and selling US Treasury futures was an important tool used for the management of interest rate risk and to maintain our targeted portfolio duration.
Please note that our strategy may be implemented using derivative instruments, including futures, forward foreign currency contracts, swaps and options. Therefore, a portion of the performance of the strategy, both positive and negative, can be attributed to these instruments. Derivatives can be a cost-effective way to gain or hedge exposure to certain risks. However, derivatives may amplify traditional investment risks through the creation of leverage and may be less liquid than traditional securities.
We wish to remind you that the Fund is subject to interest rate risk, meaning when interest rates rise, the value of fixed income securities tends to fall. The risk may be greater in the current market environment because interest rates are near historic lows. The degree to which the value of fixed income securities may decline due to rising interest rates may vary depending on the speed and magnitude of the increase in interest rates, as well as individual security characteristics, such as price, maturity, duration and coupon
| | |
| 2 | | Invesco Short Term Bond Fund |
and market forces, such as supply and demand for similar securities. We are monitoring interest rates and the market, economic and geopolitical factors that may impact the direction, speed and magnitude of changes to interest rates across the maturity spectrum, including the potential impact of monetary policy changes by the Fed and certain foreign central banks. If interest rates rise or fall faster than expected, markets may experience increased volatility, which may affect the value and/or liquidity of certain of the Fund’s investments.
Thank you for investing in Invesco Short Term Bond Fund and for sharing our long-term investment horizon.
1 Source: US Department of the Treasury
2 Source: US Bureau of Economic Analysis
3 Source: US Bureau of Labor Statistics
Portfolio manager(s):
Matthew Brill
Chuck Burge
Michael Hyman
Todd Schomberg
The views and opinions expressed in management’s discussion of Fund performance are those of Invesco Advisers, Inc. and its affiliates. These views and opinions are subject to change at any time based on factors such as market and economic conditions. These views and opinions may not be relied upon as investment advice or recommendations, or as an offer for a particular security. The information is not a complete analysis of every aspect of any market, country, industry, security or the Fund. Statements of fact are from sources considered reliable, but Invesco Advisers, Inc. makes no representation or warranty as to their completeness or accuracy. Although historical performance is no guarantee of future results, these insights may help you understand our investment management philosophy.
See important Fund and, if applicable, index disclosures later in this report.
| | |
| 3 | | Invesco Short Term Bond Fund |
Your Fund’s Long-Term Performance
Results of a $10,000 Investment - Oldest Share Class(es)
Fund and index data from 2/29/12
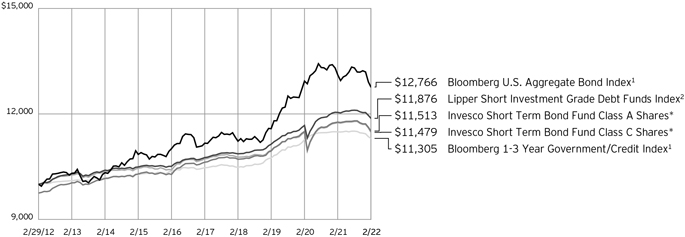
| 1 | Source: RIMES Technologies Corp. |
| * | The Fund’s oldest share class (Class C) does not have a sales charge. Therefore, the second oldest share class with a sales charge (Class A), is also included in the chart. |
Past performance cannot guarantee future results.
The data shown in the chart include reinvested distributions, applicable sales charges and Fund expenses including management
fees. Index results include reinvested dividends, but they do not reflect sales charges. Performance of the peer group, if applicable, reflects fund expenses and management fees;
performance of a market index does not. Performance shown in the chart does not reflect deduction of taxes a shareholder would pay on Fund distributions or sale of Fund shares.
| | |
| 4 | | Invesco Short Term Bond Fund |
| | | | |
| |
Average Annual Total Returns | |
As of 2/28/22, including maximum applicable sales charges | |
| |
Class A Shares | | | | |
Inception (4/30/04) | | | 1.75 | % |
10 Years | | | 1.42 | |
5 Years | | | 1.09 | |
1 Year | | | -4.62 | |
| |
Class C Shares | | | | |
Inception (8/30/02) | | | 1.88 | % |
10 Years | | | 1.39 | |
5 Years | | | 1.25 | |
1 Year | | | -3.01 | |
| |
Class R Shares | | | | |
Inception (4/30/04) | | | 1.60 | % |
10 Years | | | 1.33 | |
5 Years | | | 1.28 | |
1 Year | | | -2.54 | |
| |
Class Y Shares | | | | |
Inception (10/3/08) | | | 2.15 | % |
10 Years | | | 1.84 | |
5 Years | | | 1.79 | |
1 Year | | | -1.94 | |
| |
Class R5 Shares | | | | |
Inception (4/30/04) | | | 2.15 | % |
10 Years | | | 1.90 | |
5 Years | | | 1.86 | |
1 Year | | | -1.89 | |
| |
Class R6 Shares | | | | |
10 Years | | | 1.91 | % |
5 Years | | | 1.88 | |
1 Year | | | -1.95 | |
Class R6 shares incepted on September 24, 2012. Performance shown prior to that date is that of Class C shares and includes the 12b-1 fees applicable to Class C shares.
The performance data quoted represent past performance and cannot guarantee future results; current performance may be lower or higher. Please visit invesco.com/ performance for the most recent month-end performance. Performance figures reflect reinvested distributions, changes in net asset value and the effect of the maximum sales charge unless otherwise stated. Performance figures do not reflect deduction of taxes a shareholder would pay on Fund distributions or sale of Fund shares. Investment return and principal value will fluctuate so that you may have a gain or loss when you sell shares.
Class A share performance reflects the maximum 2.50% sales charge and Class C share performance reflects the applicable contingent deferred sales charge (CDSC) for the period involved. The CDSC on Class C shares is 0.50% for the first year after purchase. Class R, Class Y, Class R5 and Class R6 shares do not have a front-end sales charge or a CDSC; therefore, performance is at net asset value.
The performance of the Fund’s share classes will differ primarily due to different sales charge structures and class expenses.
Fund performance reflects any applicable fee waivers and/or expense reimbursements. Had the adviser not waived fees and/or reimbursed expenses currently or in the past, returns would have been lower. See current prospectus for more information.
| | |
| 5 | | Invesco Short Term Bond Fund |
Supplemental Information
Invesco Short Term Bond Fund’s investment objective is total return, comprised of current income and capital appreciation.
| ∎ | | Unless otherwise stated, information presented in this report is as of February 28, 2022, and is based on total net assets. |
| ∎ | | Unless otherwise noted, all data is provided by Invesco. |
| ∎ | | To access your Fund’s reports/prospectus, visit invesco.com/fundreports. |
About indexes used in this report
| ∎ | | The Bloomberg U.S. Aggregate Bond Index is an unmanaged index considered representative of the US investment-grade, fixed-rate bond market. |
| ∎ | | The Bloomberg 1-3 Year Government/ Credit Index is an unmanaged index considered representative of short-term US corporate and US government bonds with maturities of one to three years. |
| ∎ | | The Lipper Short Investment Grade Debt Funds Index is an unmanaged index considered representative of short investment-grade debt funds tracked by Lipper. |
| ∎ | | The Fund is not managed to track the performance of any particular index, including the index(es) described here, and consequently, the performance of the Fund may deviate significantly from the performance of the index(es). |
| ∎ | | A direct investment cannot be made in an index. Unless otherwise indicated, index results include reinvested dividends, and they do not reflect sales charges. Performance of the peer group, if applicable, reflects fund expenses; performance of a market index does not. |
|
This report must be accompanied or preceded by a currently effective Fund prospectus, which contains more complete information, including sales charges and expenses. Investors should read it carefully before investing. |
| |
|
| NOT FDIC INSURED | MAY LOSE VALUE | NO BANK GUARANTEE |
| | |
| 6 | | Invesco Short Term Bond Fund |
Fund Information
Portfolio Composition
| | | | |
| By security type | | % of total net assets |
U.S. Dollar Denominated Bonds & Notes | | 71.51% |
Asset-Backed Securities | | 25.05 |
Security Types Each Less Than 1% of Portfolio | | 2.44 |
Money Market Funds Plus Other Assets Less Liabilities | | 1.00 |
The Fund’s holdings are subject to change, and there is no assurance that the Fund will continue to hold any particular security.
* Excluding money market fund holdings, if any.
Data presented here are as of February 28, 2022.
Top Five Debt Issuers*
| | | | |
| | | | | % of total net assets |
| 1. | | Goldman Sachs Group, Inc. (The) | | 2.83% |
| 2. | | Citigroup, Inc. | | 1.97 |
| 3. | | Pacific Gas and Electric Co. | | 1.68 |
| 4. | | Energy Transfer L.P. | | 1.55 |
| 5. | | Ford Motor Credit Co. LLC | | 1.50 |
| | |
| 7 | | Invesco Short Term Bond Fund |
Schedule of Investments(a)
February 28, 2022
| | | | | | | | |
| | | Principal
Amount | | | Value | |
U.S. Dollar Denominated Bonds & Notes–71.51% |
Advertising–0.22% | | | | | |
Interpublic Group of Cos., Inc. (The), 4.20%, 04/15/2024 | | $ | 2,219,000 | | | $ | 2,320,146 | |
WPP Finance 2010 (United Kingdom), 3.75%, 09/19/2024 | | | 3,791,000 | | | | 3,929,589 | |
| | | | | | | | 6,249,735 | |
| |
Aerospace & Defense–1.55% | | | | | |
Boeing Co. (The),
1.95%, 02/01/2024 | | | 12,672,000 | | | | 12,628,375 | |
1.43%, 02/04/2024 | | | 5,949,000 | | | | 5,855,199 | |
2.75%, 02/01/2026(b) | | | 10,499,000 | | | | 10,512,192 | |
2.20%, 02/04/2026 | | | 6,965,000 | | | | 6,799,625 | |
L3Harris Technologies, Inc., 3.85%, 06/15/2023 | | | 3,686,000 | | | | 3,780,185 | |
Textron, Inc., 4.30%, 03/01/2024 | | | 4,114,000 | | | | 4,275,108 | |
| | | | | | | | 43,850,684 | |
| |
Agricultural Products–0.14% | | | | | |
Bunge Ltd. Finance Corp., 4.35%, 03/15/2024 | | | 3,883,000 | | | | 4,036,696 | |
| | |
Airlines–1.56% | | | | | | | | |
American Airlines Pass-Through Trust, Series 2021-1, Class B,
3.95%, 07/11/2030 | | | 3,254,000 | | | | 3,114,100 | |
British Airways Pass-Through Trust (United Kingdom), Series 2019-1, Class A, 3.35%, 06/15/2029(c) | | | 902,644 | | | | 888,334 | |
Delta Air Lines Pass-Through Trust, Series 2019-1, Class A, 3.40%, 04/25/2024 | | | 1,852,000 | | | | 1,863,941 | |
Delta Air Lines, Inc./SkyMiles IP Ltd.,
4.50%, 10/20/2025(c) | | | 26,177,000 | | | | 26,883,192 | |
United Airlines Pass-Through Trust, Series 2016-2, Class B, 3.65%, 10/07/2025 | | | 2,289,093 | | | | 2,239,916 | |
Series 2020-1, Class A, 5.88%, 10/15/2027 | | | 7,291,090 | | | | 7,710,860 | |
United Airlines, Inc., 4.38%, 04/15/2026(c) | | | 1,404,000 | | | | 1,402,175 | |
| | | | | | | | 44,102,518 | |
| |
Apparel Retail–0.41% | | | | | |
Ross Stores, Inc., 3.38%, 09/15/2024 | | | 2,568,000 | | | | 2,640,416 | |
4.60%, 04/15/2025 | | | 8,456,000 | | | | 9,027,058 | |
| | | | | | | | 11,667,474 | |
Apparel, Accessories & Luxury Goods–0.12% | |
Hanesbrands, Inc., 4.63%, 05/15/2024(b)(c) | | | 3,232,000 | | | | 3,280,108 | |
|
Asset Management & Custody Banks–0.94% | |
Ameriprise Financial, Inc., 3.00%, 03/22/2022 | | | 3,000,000 | | | | 3,003,849 | |
3.00%, 04/02/2025 | | | 1,497,000 | | | | 1,525,256 | |
Apollo Management Holdings L.P.,
4.95%, 01/14/2050(c)(d) | | | 2,475,000 | | | | 2,449,202 | |
| | | | | | | | |
| | | Principal Amount | | | Value | |
Asset Management & Custody Banks–(continued) | |
Blackstone Secured Lending Fund, 2.75%, 09/16/2026 | | $ | 9,221,000 | | | $ | 8,855,262 | |
FS KKR Capital Corp., 1.65%, 10/12/2024 | | | 4,338,000 | | | | 4,161,657 | |
Hercules Capital, Inc., 2.63%, 09/16/2026 | | | 2,144,000 | | | | 2,042,945 | |
3.38%, 01/20/2027(b) | | | 4,522,000 | | | | 4,369,665 | |
| | | | | | | | 26,407,836 | |
Automobile Manufacturers–3.80% | | | | | |
Daimler Finance North America LLC (Germany), 2.70%, 06/14/2024(c) | | | 5,270,000 | | | | 5,346,581 | |
Ford Motor Credit Co. LLC,
3.09%, 01/09/2023 | | | 3,285,000 | | | | 3,309,605 | |
2.30%, 02/10/2025(b) | | | 29,538,000 | | | | 28,690,407 | |
2.70%, 08/10/2026 | | | 10,647,000 | | | | 10,207,811 | |
Harley-Davidson Financial Services, Inc., 3.35%, 06/08/2025(c) | | | 4,786,000 | | | | 4,839,104 | |
Hyundai Capital America, 3.10%, 04/05/2022(c) | | | 6,011,000 | | | | 6,019,755 | |
5.75%, 04/06/2023(b)(c) | | | 7,402,000 | | | | 7,695,679 | |
5.88%, 04/07/2025(b)(c) | | | 6,208,000 | | | | 6,799,829 | |
Hyundai Capital Services, Inc. (South Korea), 2.13%, 04/24/2025(c) | | | 8,000,000 | | | | 7,821,811 | |
Kia Corp. (South Korea),
2.38%, 02/14/2025(c) | | | 3,501,000 | | | | 3,495,738 | |
1.75%, 10/16/2026(c) | | | 864,000 | | | | 836,003 | |
2.75%, 02/14/2027(c) | | | 3,555,000 | | | | 3,542,959 | |
Nissan Motor Acceptance Co. LLC, 1.13%, 09/16/2024(c) | | | 7,542,000 | | | | 7,265,605 | |
Nissan Motor Co. Ltd. (Japan), 3.04%, 09/15/2023(c) | | | 7,361,000 | | | | 7,433,500 | |
Toyota Motor Corp. (Japan), 2.36%, 07/02/2024 | | | 3,697,000 | | | | 3,726,174 | |
| | | | | | | | 107,030,561 | |
| |
Automotive Retail–0.38% | | | | | |
AutoZone, Inc., 3.63%, 04/15/2025(b) | | | 4,557,000 | | | | 4,716,992 | |
Lithia Motors, Inc., 4.63%, 12/15/2027(b)(c) | | | 6,000,000 | | | | 6,142,110 | |
| | | | | | | | 10,859,102 | |
| |
Biotechnology–0.89% | | | | | |
AbbVie, Inc.,
3.85%, 06/15/2024 | | | 7,600,000 | | | | 7,863,302 | |
2.60%, 11/21/2024 | | | 13,231,000 | | | | 13,367,246 | |
Shire Acquisitions Investments Ireland DAC, 2.88%, 09/23/2023 | | | 3,791,000 | | | | 3,841,608 | |
| | | | | | 25,072,156 | |
| |
Broadcasting–0.06% | | | | | |
Fox Corp.,
4.03%, 01/25/2024(b) | | | 1,180,000 | | | | 1,223,361 | |
3.05%, 04/07/2025 | | | 360,000 | | | | 367,446 | |
| | | | | | | | 1,590,807 | |
See accompanying Notes to Financial Statements which are an integral part of the financial statements.
| | |
| 8 | | Invesco Short Term Bond Fund |
| | | | | | | | |
| | | Principal Amount | | | Value | |
Cable & Satellite–0.39% | | | | | | | | |
Charter Communications Operating LLC/Charter Communications Operating Capital Corp., 4.50%, 02/01/2024 | | $ | 3,696,000 | | | $ | 3,848,047 | |
Comcast Corp., 3.30%, 04/01/2027 | | | 5,320,000 | | | | 5,529,332 | |
Sirius XM Radio, Inc., 3.13%, 09/01/2026(c) | | | 1,595,000 | | | | 1,525,394 | |
| | | | | | | | 10,902,773 | |
|
Computer & Electronics Retail–0.55% | |
Dell International LLC/EMC Corp., 4.00%, 07/15/2024 | | | 8,518,000 | | | | 8,844,209 | |
5.85%, 07/15/2025 | | | 2,000,000 | | | | 2,191,929 | |
Leidos, Inc.,
2.95%, 05/15/2023 | | | 3,077,000 | | | | 3,117,586 | |
3.63%, 05/15/2025 | | | 1,227,000 | | | | 1,265,724 | |
| | | | | | | | 15,419,448 | |
|
Construction Machinery & Heavy Trucks–0.47% | |
Daimler Trucks Finance North | | | | | | | | |
America LLC (Germany), 0.80% (SOFR + 0.75%), 12/13/2024(c)(e) | | | 5,000,000 | | | | 5,009,083 | |
1.63%, 12/13/2024(c) | | | 4,400,000 | | | | 4,318,971 | |
Wabtec Corp., 4.40%, 03/15/2024 | | | 3,698,000 | | | | 3,833,351 | |
| | | | | | | | 13,161,405 | |
| | |
Consumer Finance–0.47% | | | | | | | | |
Ally Financial, Inc., 1.45%, 10/02/2023 | | | 3,504,000 | | | | 3,461,494 | |
Capital One Financial Corp., 3.20%, 01/30/2023 | | | 3,882,000 | | | | 3,938,060 | |
Discover Bank, 2.45%, 09/12/2024 | | | 2,450,000 | | | | 2,453,032 | |
Synchrony Financial, 4.25%, 08/15/2024 | | | 3,179,000 | | | | 3,297,017 | |
| | | | | | | | 13,149,603 | |
| | |
Copper–0.76% | | | | | | | | |
Freeport-McMoRan, Inc.,
4.55%, 11/14/2024 | | | 6,000,000 | | | | 6,271,050 | |
4.38%, 08/01/2028 | | | 15,000,000 | | | | 15,213,000 | |
| | | | | | | | 21,484,050 | |
|
Data Processing & Outsourced Services–0.51% | |
Block, Inc., 2.75%, 06/01/2026(b)(c) | | | 6,014,000 | | | | 5,841,428 | |
Fiserv, Inc., 3.80%, 10/01/2023 | | | 3,699,000 | | | | 3,806,698 | |
Global Payments, Inc., 4.00%, 06/01/2023 | | | 4,619,000 | | | | 4,734,560 | |
| | | | | | | | 14,382,686 | |
| | |
Distillers & Vintners–0.16% | | | | | | | | |
Pernod Ricard S.A. (France), 4.25%, 07/15/2022(c) | | | 4,343,000 | | | | 4,392,880 | |
| | |
Distributors–0.27% | | | | | | | | |
Genuine Parts Co., 1.75%, 02/01/2025 | | | 7,878,000 | | | | 7,750,662 | |
| | | | | | | | |
| | | Principal Amount | | | Value | |
Diversified Banks–10.40% | | | | | | | | |
Banco Bilbao Vizcaya Argentaria S.A. (Spain), 1.13%, 09/18/2025(b) | | $ | 6,895,000 | | | $ | 6,558,110 | |
Banco del Estado de Chile (Chile), 2.70%, 01/09/2025(c) | | | 6,415,000 | | | | 6,426,100 | |
Bank of America Corp.,
3.00%, 12/20/2023(d) | | | 2,569,000 | | | | 2,592,847 | |
3.86%, 07/23/2024(d) | | | 4,528,000 | | | | 4,632,430 | |
0.71% (SOFR + 0.66%), 02/04/2025(e) | | | 4,200,000 | | | | 4,204,696 | |
1.84%, 02/04/2025(b)(d) | | | 4,714,000 | | | | 4,670,709 | |
1.20%, 10/24/2026(d) | | | 7,920,000 | | | | 7,493,441 | |
1.10% (SOFR + 1.05%), 02/04/2028(e) | | | 4,360,000 | | | | 4,361,472 | |
2.55%, 02/04/2028(d) | | | 5,970,000 | | | | 5,877,276 | |
Bank of Ireland Group PLC (Ireland),
4.50%, 11/25/2023(c) | | | 2,997,000 | | | | 3,103,024 | |
Bank of Montreal (Canada),
Series E,
3.30%, 02/05/2024 | | | 3,105,000 | | | | 3,181,790 | |
Bank of Nova Scotia (The) (Canada), 0.60% (SOFR + 0.55%), 03/02/2026(e) | | | 20,000,000 | | | | 19,992,971 | |
Barclays PLC (United Kingdom),
1.01%, 12/10/2024(d) | | | 3,758,000 | | | | 3,664,516 | |
BBVA Bancomer S.A. (Mexico),
1.88%, 09/18/2025(c) | | | 2,970,000 | | | | 2,884,271 | |
BPCE S.A. (France),
0.62% (SOFR + 0.57%), 01/14/2025(c)(e) | | | 4,404,000 | | | | 4,399,556 | |
1.63%, 01/14/2025(c) | | | 6,480,000 | | | | 6,365,294 | |
Citigroup, Inc.,
0.78%, 10/30/2024(d) | | | 15,840,000 | | | | 15,491,333 | |
0.98%, 05/01/2025(d) | | | 6,599,000 | | | | 6,411,804 | |
1.28%, 11/03/2025(b)(d) | | | 2,401,000 | | | | 2,325,758 | |
0.74% (SOFR + 0.69%), 01/25/2026(b)(e) | | | 2,198,000 | | | | 2,201,479 | |
2.01%, 01/25/2026(d) | | | 10,000,000 | | | | 9,846,477 | |
1.46% (3 mo. USD LIBOR + 1.25%), 07/01/2026(e) | | | 15,308,000 | | | | 15,591,642 | |
Series V, 4.70%(b)(d)(f) | | | 3,790,000 | | | | 3,719,127 | |
Citizens Bank N.A., 2.65%, 05/26/2022 | | | 3,881,000 | | | | 3,892,419 | |
Corp. Andina de Fomento (Supranational), 1.25%, 10/26/2024 | | | 7,660,000 | | | | 7,498,854 | |
Danske Bank A/S (Denmark), 1.26% (3 mo. USD LIBOR +
1.06%), 09/12/2023(c)(e) | | | 5,898,000 | | | | 5,920,763 | |
3.24%, 12/20/2025(c)(d) | | | 1,779,000 | | | | 1,800,682 | |
Federation des Caisses Desjardins du Quebec (Canada), 2.05%, 02/10/2025(c) | | | 4,334,000 | | | | 4,278,812 | |
HSBC Holdings PLC (United Kingdom),
3.95%, 05/18/2024(d) | | | 2,956,000 | | | | 3,022,601 | |
0.63% (SOFR + 0.58%), 11/22/2024(e) | | | 2,496,000 | | | | 2,499,170 | |
1.16%, 11/22/2024(d) | | | 5,280,000 | | | | 5,167,314 | |
Industrial & Commercial Bank of China Ltd. (China), 2.96%, 11/08/2022 | | | 905,000 | | | | 912,048 | |
ING Groep N.V. (Netherlands), 1.06% (SOFR + 1.01%), 04/01/2027(b)(e) | | | 8,913,000 | | | | 8,969,072 | |
6.50%, 12/31/2049(d)(f) | | | 7,693,000 | | | | 8,029,800 | |
See accompanying Notes to Financial Statements which are an integral part of the financial statements.
| | |
| 9 | | Invesco Short Term Bond Fund |
| | | | | | | | |
| | | Principal
Amount | | | Value | |
Diversified Banks-(continued) | |
JPMorgan Chase & Co., 2.78%, 04/25/2023(d) | | $ | 3,885,000 | | | $ | 3,892,147 | |
Series HH, 4.60%(d)(f) | | | 5,455,000 | | | | 5,370,448 | |
Series V, 3.53% (3 mo. USD LIBOR + 3.32%)(e)(f) | | | 1,390,000 | | | | 1,383,050 | |
Lloyds Banking Group PLC (United Kingdom), 2.91%, 11/07/2023(d) | | | 3,515,000 | | | | 3,540,955 | |
Mizuho Financial Group Cayman 3 Ltd. (Japan), 4.60%, 03/27/2024(b)(c) | | | 6,500,000 | | | | 6,769,033 | |
Mizuho Financial Group, Inc. (Japan), 1.24%, 07/10/2024(d) | | | 3,520,000 | | | | 3,480,516 | |
NatWest Markets PLC (United Kingdom), 0.58% (SOFR + 0.53%), 08/12/2024(c)(e) | | | 1,429,000 | | | | 1,430,507 | |
Nordea Bank Abp (Finland), 1.00%, 06/09/2023(c) | | | 3,260,000 | | | | 3,236,048 | |
6.63%(c)(d)(f) | | | 3,478,000 | | | | 3,743,198 | |
PNC Bank N.A., 2.50%, 08/27/2024 | | | 3,183,000 | | | | 3,217,006 | |
Royal Bank of Canada (Canada), 0.49% (SOFR + 0.44%), 01/21/2025(e) | | | 15,000,000 | | | | 15,008,938 | |
0.57% (SOFR + 0.53%), 01/20/2026(e) | | | 8,000,000 | | | | 7,982,700 | |
0.76% (SOFR + 0.71%), 01/21/2027(e) | | | 12,008,000 | | | | 12,026,538 | |
Societe Generale S.A. (France), 2.23%, 01/21/2026(c)(d) | | | 10,000,000 | | | | 9,771,395 | |
1.49%, 12/14/2026(c)(d) | | | 4,718,000 | | | | 4,412,319 | |
Standard Chartered PLC (United Kingdom),
1.32%, 10/14/2023(c)(d) | | | 2,220,000 | | | | 2,210,321 | |
1.21%, 03/23/2025(c)(d) | | | 2,625,000 | | | | 2,558,490 | |
1.82%, 11/23/2025(c)(d) | | | 1,422,000 | | | | 1,383,498 | |
Sumitomo Mitsui Trust Bank Ltd. (Japan), 1.55%, 03/25/2026(b)(c) | | | 2,465,000 | | | | 2,373,846 | |
Wells Fargo & Co., 0.81%, 05/19/2025(d) | | | 1,539,000 | | | | 1,489,810 | |
| | | | | | | | 293,268,421 | |
| |
Diversified Capital Markets-1.31% | | | | | |
Credit Suisse AG (Switzerland),
2.80%, 04/08/2022 | | | 2,795,000 | | | | 2,801,455 | |
2.95%, 04/09/2025 | | | 2,512,000 | | | | 2,545,563 | |
Credit Suisse Group AG (Switzerland), 2.59%, 09/11/2025(c)(d) | | | 3,699,000 | | | | 3,681,964 | |
1.31%, 02/02/2027(c)(d) | | | 8,448,000 | | | | 7,838,464 | |
7.13%(c)(d)(f) | | | 4,482,000 | | | | 4,544,703 | |
Deutsche Bank AG (Germany), 3.96%, 11/26/2025(d) | | | 5,000,000 | | | | 5,115,721 | |
Macquarie Group Ltd. (Australia),
3.19%, 11/28/2023(c)(d) | | | 4,342,000 | | | | 4,383,100 | |
1.20%, 10/14/2025(b)(c)(d) | | | 6,286,000 | | | | 6,079,806 | |
| | | | | | | | 36,990,776 | |
| | |
Education Services-0.36% | | | | | | | | |
Grand Canyon University, 3.25%, 10/01/2023 | | | 10,234,000 | | | | 10,285,170 | |
| | | | | | | | |
| | | Principal
Amount | | | Value | |
Electric Utilities-3.87% | | | | | | | | |
Alliant Energy Finance LLC, 3.75%, 06/15/2023(c) | | $ | 3,696,000 | | | $ | 3,778,251 | |
American Electric Power Co., Inc., 2.03%, 03/15/2024 | | | 4,038,000 | | | | 4,031,120 | |
Constellation Energy Generation LLC, 3.25%, 06/01/2025 | | | 4,676,000 | | | | 4,776,636 | |
EDP Finance B.V. (Portugal), 3.63%, 07/15/2024(c) | | | 3,835,000 | | | | 3,931,996 | |
Eversource Energy, 2.90%, 03/01/2027 | | | 15,000,000 | | | | 15,106,822 | |
Fells Point Funding Trust, 3.05%, 01/31/2027(b)(c) | | | 16,000,000 | | | | 15,865,691 | |
Mercury Chile Holdco LLC (Chile), 6.50%, 01/24/2027(c) | | | 4,412,000 | | | | 4,265,389 | |
NextEra Energy Operating Partners
L.P., 4.25%, 09/15/2024(c) | | | 375,000 | | | | 378,716 | |
NRG Energy, Inc., 3.75%, 06/15/2024(c) | | | 3,926,000 | | | | 4,005,545 | |
Pacific Gas and Electric Co., 1.75%, 06/16/2022 | | | 12,144,000 | | | | 12,134,454 | |
3.25%, 02/16/2024(b) | | | 35,000,000 | | | | 35,245,365 | |
Southern Co. (The), Series 21-A, 3.75%, 09/15/2051(d) | | | 3,069,000 | | | | 2,862,149 | |
Vistra Operations Co. LLC, 3.55%, 07/15/2024(c) | | | 2,772,000 | | | | 2,809,673 | |
| | | | | | | | 109,191,807 | |
|
Electronic Equipment & Instruments-0.06% | |
Vontier Corp., 1.80%, 04/01/2026 | | | 1,954,000 | | | | 1,827,693 | |
|
Fertilizers & Agricultural Chemicals-0.08% | |
CF Industries, Inc., 3.45%, 06/01/2023 | | | 2,163,000 | | | | 2,203,859 | |
|
Financial Exchanges & Data-0.47% | |
FactSet Research Systems, Inc., 2.90%, 03/01/2027 | | | 3,076,000 | | | | 3,099,569 | |
Intercontinental Exchange, Inc., 0.70%, 06/15/2023 | | | 3,988,000 | | | | 3,943,588 | |
Moody’s Corp., 2.63%, 01/15/2023 | | | 6,101,000 | | | | 6,156,464 | |
| | | | | | | | 13,199,621 | |
|
Food Retail-0.10% | |
Albertson’s Cos., Inc./Safeway, Inc./New Albertson’s L.P./Albertson’s LLC, 3.50%, 02/15/2023(c) | | | 2,922,000 | | | | 2,932,738 | |
|
Health Care Distributors-0.32% | |
McKesson Corp., 1.30%, 08/15/2026 | | | 9,477,000 | | | | 8,980,445 | |
| | |
Health Care Equipment-0.08% | | | | | | | | |
Becton, Dickinson and Co., 3.36%, 06/06/2024 | | | 2,094,000 | | | | 2,146,852 | |
| | |
Health Care Facilities-0.14% | | | | | | | | |
HCA, Inc., 5.38%, 02/01/2025 | | | 3,756,000 | | | | 3,981,848 | |
| | |
Health Care REITs-0.31% | | | | | | | | |
Ventas Realty L.P., 2.65%, 01/15/2025 | | | 3,928,000 | | | | 3,949,625 | |
See accompanying Notes to Financial Statements which are an integral part of the financial statements.
| | |
| 10 | | Invesco Short Term Bond Fund |
| | | | | | | | |
| | | Principal
Amount | | | Value | |
Health Care REITs-(continued) | |
Welltower, Inc., 3.63%, 03/15/2024 | | $ | 4,623,000 | | | $ | 4,751,249 | |
| | | | | | | | 8,700,874 | |
| | |
Health Care Services-0.29% | | | | | | | | |
Cigna Corp., 3.75%, 07/15/2023 | | | 2,581,000 | | | | 2,648,855 | |
CVS Health Corp., 2.63%, 08/15/2024(b) | | | 3,619,000 | | | | 3,665,058 | |
Fresenius Medical Care US Finance III, Inc. (Germany), 1.88%, 12/01/2026(c) | | | 1,866,000 | | | | 1,787,970 | |
| | | | | | | | 8,101,883 | |
| | |
Homebuilding-0.61% | | | | | | | | |
D.R. Horton, Inc., 4.75%, 02/15/2023 | | | 4,820,000 | | | | 4,921,361 | |
Lennar Corp., 4.88%, 12/15/2023 | | | 5,000,000 | | | | 5,217,591 | |
Meritage Homes Corp., 6.00%, 06/01/2025 | | | 6,000,000 | | | | 6,397,200 | |
Toll Brothers Finance Corp., 4.88%, 11/15/2025 | | | 502,000 | | | | 533,011 | |
| | | | | | | | 17,069,163 | |
|
Hotels, Resorts & Cruise Lines-1.25% | |
Expedia Group, Inc.,
3.60%, 12/15/2023 | | | 4,537,000 | | | | 4,639,662 | |
4.63%, 08/01/2027 | | | 13,553,000 | | | | 14,518,020 | |
Hyatt Hotels Corp.,
1.10% (SOFR + 1.05%), 10/01/2023(e) | | | 10,000,000 | | | | 10,017,691 | |
1.80%, 10/01/2024(b) | | | 6,160,000 | | | | 6,031,208 | |
| | | | | | | | 35,206,581 | |
|
Housewares & Specialties-0.03% | |
Newell Brands, Inc., 4.35%, 04/01/2023 | | | 743,000 | | | | 756,831 | |
|
Independent Power Producers & Energy Traders-0.23% | |
AES Corp. (The), 1.38%, 01/15/2026 | | | 6,926,000 | | | | 6,586,561 | |
| | |
Industrial Machinery-0.13% | | | | | | | | |
Weir Group PLC (The) (United Kingdom), 2.20%, 05/13/2026(c) | | | 3,757,000 | | | | 3,615,261 | |
|
Insurance Brokers-0.10% | |
Marsh & McLennan Cos., Inc., 3.88%, 03/15/2024 | | | 2,665,000 | | | | 2,759,280 | |
| | |
Integrated Oil & Gas-0.89% | | | | | | | | |
BP Capital Markets PLC (United Kingdom), 4.38%(d)(f) | | | 3,000,000 | | | | 3,007,500 | |
Exxon Mobil Corp., 2.99%, 03/19/2025 | | | 5,582,000 | | | | 5,733,978 | |
Gray Oak Pipeline LLC, 2.60%, 10/15/2025(c) | | | 6,070,000 | | | | 6,006,710 | |
Occidental Petroleum Corp., 6.95%, 07/01/2024 | | | 7,000,000 | | | | 7,603,680 | |
SA Global Sukuk Ltd. (Saudi Arabia), 0.95%, 06/17/2024(c) | | | 2,734,000 | | | | 2,650,186 | |
| | | | | | | | 25,002,054 | |
| | | | | | | | |
| | | Principal
Amount | | | Value | |
Integrated Telecommunication Services-1.33% | |
AT&T, Inc.,
0.69% (SOFR + 0.64%),
03/25/2024(b)(e) | | $ | 4,711,000 | | | $ | 4,711,885 | |
1.38% (3 mo. USD LIBOR + 1.18%), 06/12/2024(b)(e) | | | 2,732,000 | | | | 2,781,374 | |
British Telecommunications PLC (United Kingdom), 4.50%, 12/04/2023 | | | 3,771,000 | | | | 3,912,848 | |
NBN Co. Ltd. (Australia), 0.88%, 10/08/2024(b)(c) | | | 13,200,000 | | | | 12,757,273 | |
Verizon Communications, Inc., 0.55% (SOFR + 0.50%), 03/22/2024(b)(e) | | | 3,472,000 | | | | 3,481,888 | |
1.45%, 03/20/2026(b) | | | 10,209,000 | | | | 9,866,636 | |
| | | | | | | | 37,511,904 | |
| |
Interactive Media & Services-0.57% | | | | | |
Tencent Holdings Ltd. (China), 2.99%, 01/19/2023(c) | | | 4,039,000 | | | | 4,077,179 | |
3.28%, 04/11/2024(c) | | | 10,000,000 | | | | 10,218,764 | |
1.81%, 01/26/2026(b)(c) | | | 1,973,000 | | | | 1,911,014 | |
| | | | | | | | 16,206,957 | |
| |
Internet & Direct Marketing Retail-0.40% | | | | | |
Meituan (China), 2.13%, 10/28/2025(b)(c) | | | 5,622,000 | | | | 5,171,334 | |
Prosus N.V. (China), 3.26%, 01/19/2027(c) | | | 6,310,000 | | | | 6,050,548 | |
| | | | | | | | 11,221,882 | |
| |
Internet Services & Infrastructure-0.09% | | | | | |
VeriSign, Inc.,
5.25%, 04/01/2025 | | | 1,858,000 | | | | 1,990,308 | |
4.75%, 07/15/2027 | | | 583,000 | | | | 602,271 | |
| | | | | | | | 2,592,579 | |
| |
Investment Banking & Brokerage-3.99% | | | | | |
Brookfield Finance, Inc. (Canada), 3.90%, 01/25/2028(b) | | | 3,690,000 | | | | 3,878,443 | |
Cantor Fitzgerald L.P., 6.50%, 06/17/2022(c) | | | 4,519,000 | | | | 4,586,791 | |
Goldman Sachs Group, Inc. (The), 0.48% (SOFR + 0.43%), 03/08/2023(b)(e) | | | 12,507,000 | | | | 12,501,014 | |
2.91%, 06/05/2023(d) | | | 4,620,000 | | | | 4,638,785 | |
0.67% (SOFR + 0.62%), 12/06/2023(e) | | | 2,000,000 | | | | 2,002,537 | |
0.63% (SOFR + 0.58%), 03/08/2024(e) | | | 8,497,000 | | | | 8,488,725 | |
0.75% (SOFR + 0.70%), 01/24/2025(b)(e) | | | 4,070,000 | | | | 4,074,802 | |
1.76%, 01/24/2025(d) | | | 5,116,000 | | | | 5,061,297 | |
0.84% (SOFR + 0.79%), 12/09/2026(e) | | | 11,447,000 | | | | 11,408,335 | |
1.09%, 12/09/2026(d) | | | 4,738,000 | | | | 4,459,280 | |
0.86% (SOFR + 0.81%), 03/09/2027(e) | | | 15,315,000 | | �� | | 15,237,457 | |
0.87% (SOFR + 0.82%), 09/10/2027(e) | | | 1,000,000 | | | | 996,438 | |
1.95%, 10/21/2027(d) | | | 5,416,000 | | | | 5,192,847 | |
1.17% (SOFR + 1.12%), 02/24/2028(e) | | | 2,000,000 | | | | 2,010,338 | |
2.64%, 02/24/2028(b)(d) | | | 3,887,000 | | | | 3,833,336 | |
See accompanying Notes to Financial Statements which are an integral part of the financial statements.
| | |
| 11 | | Invesco Short Term Bond Fund |
| | | | | | | | |
| | | Principal
Amount | | | Value | |
Investment Banking & Brokerage-(continued) | |
Morgan Stanley,
2.75%, 05/19/2022(b) | | $ | 5,175,000 | | | $ | 5,196,031 | |
0.73%, 04/05/2024(d) | | | 7,072,000 | | | | 6,976,415 | |
0.67% (SOFR + 0.63%), 01/24/2025(b)(e) | | | 2,901,000 | | | | 2,905,190 | |
0.99%, 12/10/2026(b)(d) | | | 6,519,000 | | | | 6,108,605 | |
Series I, 0.86%, 10/21/2025(d) | | | 2,589,000 | | | | 2,479,671 | |
National Securities Clearing Corp., 1.50%, 04/23/2025(b)(c) | | | 595,000 | | | | 583,947 | |
| | | | | | | | 112,620,284 | |
|
Life & Health Insurance-4.74% | |
Athene Global Funding, 1.20%, 10/13/2023(b)(c) | | | 7,220,000 | | | | 7,125,539 | |
0.76% (SOFR + 0.72%), 01/07/2025(c)(e) | | | 10,000,000 | | | | 10,002,894 | |
1.72%, 01/07/2025(c) | | | 9,708,000 | | | | 9,477,818 | |
1.45%, 01/08/2026(b)(c) | | | 2,716,000 | | | | 2,595,743 | |
2.95%, 11/12/2026(b)(c) | | | 5,573,000 | | | | 5,593,509 | |
Brighthouse Financial Global Funding,
1.20%, 12/15/2023(c) | | | 9,186,000 | | | | 9,025,440 | |
0.81% (SOFR + 0.76%), 04/12/2024(c)(e) | | | 4,000,000 | | | | 4,017,586 | |
1.00%, 04/12/2024(c) | | | 2,514,000 | | | | 2,448,851 | |
1.75%, 01/13/2025(c) | | | 8,400,000 | | | | 8,222,980 | |
1.55%, 05/24/2026(c) | | | 4,062,000 | | | | 3,911,780 | |
CNO Global Funding, 1.65%, 01/06/2025(c) | | | 3,360,000 | | | | 3,286,753 | |
Delaware Life Global Funding, Series 22-1, 3.31%, 03/10/2025(c) | | | 6,041,000 | | | | 6,041,000 | |
Equitable Financial Life Global Funding, 0.44% (SOFR + 0.39%), 04/06/2023(c)(e) | | | 10,000,000 | | | | 10,000,548 | |
0.80%, 08/12/2024(c) | | | 7,542,000 | | | | 7,270,379 | |
F&G Global Funding, 0.90%, 09/20/2024(c) | | | 6,785,000 | | | | 6,539,633 | |
GA Global Funding Trust, 1.25%, 12/08/2023(c) | | | 10,746,000 | | | | 10,554,405 | |
1.00%, 04/08/2024(c) | | | 7,576,000 | | | | 7,326,477 | |
0.80%, 09/13/2024(c) | | | 7,200,000 | | | | 6,892,794 | |
1.63%, 01/15/2026(b)(c) | | | 1,221,000 | | | | 1,173,677 | |
Pacific Life Global Funding II, 0.67% (SOFR + 0.62%), 06/04/2026(c)(e) | | | 3,704,000 | | | | 3,716,361 | |
Reliance Standard Life Global Funding II, 2.50%,
10/30/2024(c) | | | 8,350,000 | | | | 8,385,060 | |
| | | | | | | | 133,609,227 | |
|
Managed Health Care-0.39% | |
Humana, Inc., 2.90%, 12/15/2022 | | | 3,835,000 | | | | 3,873,818 | |
UnitedHealth Group, Inc., 2.38%, 08/15/2024(b) | | | 7,000,000 | | | | 7,098,462 | |
| | | | | | | | 10,972,280 | |
|
Metal & Glass Containers-0.03% | |
Ball Corp., 4.88%, 03/15/2026(b) | | | 846,000 | | | | 886,278 | |
| | | | | | | | |
| | | Principal
Amount | | | Value | |
Movies & Entertainment-0.88% | | | | | | | | |
Netflix, Inc.,
5.75%, 03/01/2024 | | $ | 6,120,000 | | | $ | 6,510,273 | |
5.88%, 02/15/2025(b) | | | 5,000,000 | | | | 5,437,250 | |
4.38%, 11/15/2026(b) | | | 10,000,000 | | | | 10,572,450 | |
Tencent Music Entertainment Group (China), 1.38%, 09/03/2025 | | | 2,372,000 | | | | 2,249,087 | |
| | | | | | | | 24,769,060 | |
| | |
Multi-line Insurance-0.06% | | | | | | | | |
American International Group, Inc., 2.50%, 06/30/2025 | | | 1,586,000 | | | | 1,593,754 | |
| | |
Multi-Utilities-0.99% | | | | | | | | |
Algonquin Power & Utilities Corp. (Canada), 4.75%, 01/18/2082(b)(d) | | | 6,667,000 | | | | 6,334,583 | |
Ameren Corp., 2.50%, 09/15/2024 | | | 2,585,000 | | | | 2,600,264 | |
CenterPoint Energy, Inc., 2.50%, 09/01/2024(b) | | | 9,432,000 | | | | 9,492,292 | |
Dominion Energy, Inc., 3.07%, 08/15/2024(g) | | | 4,622,000 | | | | 4,707,282 | |
DTE Energy Co., Series C, 2.53%, 10/01/2024 | | | 4,809,000 | | | | 4,833,056 | |
| | | | | | | | 27,967,477 | |
| | |
Office REITs-0.40% | | | | | | | | |
Office Properties Income Trust, 4.25%, 05/15/2024 | | | 9,616,000 | | | | 9,834,316 | |
2.65%, 06/15/2026 | | | 1,639,000 | | | | 1,560,091 | |
| | | | | | | | 11,394,407 | |
| |
Oil & Gas Equipment & Services-0.14% | | | | | |
Schlumberger Holdings Corp., 3.75%, 05/01/2024(c) | | | 3,885,000 | | | | 3,996,765 | |
| |
Oil & Gas Exploration & Production-1.07% | | | | | |
Callon Petroleum Co., 9.00%, 04/01/2025(c) | | | 5,000,000 | | | | 5,369,025 | |
Canadian Natural Resources Ltd. (Canada), 2.95%, 01/15/2023(b) | | | 3,836,000 | | | | 3,876,823 | |
Continental Resources, Inc., 2.27%, 11/15/2026(c) | | | 2,857,000 | | | | 2,726,849 | |
Coterra Energy, Inc., 4.38%, 06/01/2024(c) | | | 3,694,000 | | | | 3,833,415 | |
Devon Energy Corp., 5.25%, 10/15/2027 | | | 9,117,000 | | | | 9,453,269 | |
EQT Corp., 3.13%, 05/15/2026(c) | | | 2,000,000 | | | | 1,969,400 | |
Galaxy Pipeline Assets Bidco Ltd. (United Arab Emirates), 2.16%, 03/31/2034(c) | | | 3,169,000 | | | | 2,953,860 | |
| | | | | | | | 30,182,641 | |
| |
Oil & Gas Refining & Marketing-0.03% | | | | | |
Phillips 66, 3.70%, 04/06/2023 | | | 776,000 | | | | 793,049 | |
| |
Oil & Gas Storage & Transportation-4.76% | | | | | |
Enbridge, Inc. (Canada),
0.68% (SOFR + 0.63%), 02/16/2024(e) | | | 4,330,000 | | | | 4,342,371 | |
2.15%, 02/16/2024 | | | 7,247,000 | | | | 7,261,928 | |
2.50%, 02/14/2025(b) | | | 5,524,000 | | | | 5,546,936 | |
See accompanying Notes to Financial Statements which are an integral part of the financial statements.
| | |
| 12 | | Invesco Short Term Bond Fund |
| | | | | | |
| | | Principal
Amount | | | Value |
|
Oil & Gas Storage & Transportation-(continued) |
Energy Transfer L.P.,
4.25%, 03/15/2023 | | $ | 2,921,000 | | | $ 2,978,038 |
5.88%, 01/15/2024 | | | 3,787,000 | | | 4,004,191 |
2.90%, 05/15/2025 | | | 4,079,000 | | | 4,099,217 |
5.50%, 06/01/2027 | | | 29,551,000 | | | 32,600,711 |
Enterprise Products Operating LLC, Series D, 4.88%, 08/16/2077(d) | | | 5,002,000 | | | 4,289,273 |
EQM Midstream Partners L.P., 4.75%, 07/15/2023 | | | 1,245,000 | | | 1,246,955 |
Kinder Morgan, Inc.,
3.15%, 01/15/2023 | | | 3,142,000 | | | 3,179,554 |
1.75%, 11/15/2026(b) | | | 10,999,000 | | | 10,519,050 |
MPLX L.P.,
3.50%, 12/01/2022 | | | 5,543,000 | | | 5,615,830 |
1.75%, 03/01/2026 | | | 9,603,000 | | | 9,208,668 |
ONEOK Partners L.P., 4.90%, 03/15/2025 | | | 4,160,000 | | | 4,419,984 |
ONEOK, Inc., 5.85%, 01/15/2026 | | | 3,715,000 | | | 4,151,910 |
Plains All American Pipeline L.P./PAA Finance Corp., 3.85%, 10/15/2023 | | | 3,884,000 | | | 3,967,542 |
Tennessee Gas Pipeline Co. LLC, 7.00%, 10/15/2028 | | | 15,720,000 | | | 19,119,243 |
Western Midstream Operating L.P., 1.84% (3 mo. USD LIBOR + 1.60%), 01/13/2023(e) | | | 3,208,000 | | �� | 3,196,208 |
Williams Cos., Inc. (The), 3.35%, 08/15/2022 | | | 4,437,000 | | | 4,458,321 |
| | | | | | | 134,205,930 |
|
Other Diversified Financial Services-2.34% |
AerCap Ireland Capital DAC/AerCap Global Aviation Trust (Ireland),
1.15%, 10/29/2023 | | | 17,369,000 | | | 16,974,996 |
1.65%, 10/29/2024 | | | 8,800,000 | | | 8,547,089 |
2.45%, 10/29/2026 | | | 5,962,000 | | | 5,755,498 |
Blackstone Private Credit Fund, 1.75%, 09/15/2024(c) | | | 4,132,000 | | | 3,983,898 |
2.35%, 11/22/2024(c) | | | 6,334,000 | | | 6,163,371 |
2.70%, 01/15/2025(c) | | | 6,323,000 | | | 6,174,250 |
2.63%, 12/15/2026(c) | | | 6,734,000 | | | 6,271,986 |
Equitable Holdings, Inc., 3.90%, 04/20/2023 | | | 3,004,000 | | | 3,074,809 |
Fuqing Investment Management Ltd. (China), 4.00%, 06/12/2022(c) | | | 2,500,000 | | | 2,492,500 |
OWL Rock Core Income Corp., 4.70%, 02/08/2027(c) | | | 3,430,000 | | | 3,397,208 |
USAA Capital Corp., 1.50%, 05/01/2023(c) | | | 3,254,000 | | | 3,251,499 |
| | | | | | | 66,087,104 |
|
Packaged Foods & Meats-0.31% |
Conagra Brands, Inc., 4.30%, 05/01/2024 | | | 3,792,000 | | | 3,936,538 |
JDE Peet’s N.V. (Netherlands), 1.38%, 01/15/2027(c) | | | 5,106,000 | | | 4,745,442 |
| | | | | | | 8,681,980 |
| | |
Paper Packaging-1.38% | | | | | | |
Berry Global, Inc.,
1.57%, 01/15/2026 | | | 1,420,000 | | | 1,353,547 |
4.88%, 07/15/2026(c) | | | 6,049,000 | | | 6,139,524 |
1.65%, 01/15/2027 | | | 8,141,000 | | | 7,597,544 |
| | | | | | |
| | | Principal
Amount | | | Value |
|
Paper Packaging-(continued) |
Packaging Corp. of America, 3.65%, 09/15/2024 | | $ | 3,240,000 | | | $ 3,348,695 |
Sealed Air Corp.,
5.50%, 09/15/2025(c) | | | 938,000 | | | 983,737 |
1.57%, 10/15/2026(c) | | | 2,477,000 | | | 2,333,862 |
Sonoco Products Co., 1.80%, 02/01/2025 | | | 17,600,000 | | | 17,237,926 |
| | | | | | | 38,994,835 |
|
Paper Products-0.14% |
Georgia-Pacific LLC, 1.75%, 09/30/2025(c) | | | 3,924,000 | | | 3,833,233 |
| | |
Pharmaceuticals-0.77% | | | | | | |
Bayer US Finance II LLC, 3.88%, 12 /15/2023(c) | | | 5,174,000 | | | 5,317,084 |
Mylan, Inc., 3.13%, 01/15/2023(c) | | | 3,836,000 | | | 3,875,877 |
Takeda Pharmaceutical Co. Ltd. (Japan), 4.40%, 11/26/2023 | | | 3,787,000 | | | 3,933,109 |
Viatris, Inc.,
1.13%, 06/22/2022 | | | 5,715,000 | | | 5,718,151 |
1.65%, 06/22/2025 | | | 2,993,000 | | | 2,892,923 |
| | | | | | | 21,737,144 |
|
Real Estate Development-0.49% |
Agile Group Holdings Ltd. (China),
5.75%, 01/02/2025(c) | | | 202,000 | | | 80,800 |
6.05%, 10/13/2025(c) | | | 1,650,000 | | | 643,500 |
5.50%, 05/17/2026(c) | | | 413,000 | | | 152,810 |
Country Garden Holdings Co. Ltd. (China),
4.75%, 07/25/2022(c) | | | 2,300,000 | | | 2,190,750 |
5.40%, 05/27/2025(c) | | | 400,000 | | | 310,000 |
3.13%, 10/22/2025(c) | | | 1,903,000 | | | 1,364,451 |
5.63%, 12/15/2026(c) | | | 400,000 | | | 306,000 |
Greentown China Holdings Ltd. (China), 4.70%, 04/29/2025(c) | | | 987,000 | | | 964,299 |
Logan Group Co. Ltd. (China), 7.50%, 08/25/2022(c) | | | 470,000 | | | 220,900 |
4.25%, 07/12/2025(c) | | | 1,059,000 | | | 317,700 |
Shimao Group Holdings Ltd. (China), 4.75%, 07/03/2022(c) | | | 1,772,000 | | | 851,446 |
Sino-Ocean Land Treasure Finance I Ltd. (China), 6.00%, 07/30/2024(c) | | | 3,204,000 | | | 3,095,746 |
Sino-Ocean Land Treasure IV Ltd. (China), 5.25%, 04/30/2022(c) | | | 807,000 | | | 805,020 |
3.25%, 05/05/2026(c) | | | 3,000,000 | | | 2,477,076 |
| | | | | | | 13,780,498 |
|
Regional Banks-1.63% |
Citizens Financial Group, Inc., 4.30%, 12/03/2025 | | | 12,541,000 | | | 13,220,304 |
Fifth Third Bancorp, 1.63%, 05/05/2023 | | | 3,691,000 | | | 3,687,347 |
Huntington Bancshares, Inc., 2.63%, 08/06/2024 | | | 3,236,000 | | | 3,265,676 |
M&T Bank Corp.,
3.55%, 07/26/2023 | | | 1,530,000 | | | 1,566,965 |
PNC Financial Services Group, Inc. (The), 3.50%, 01/23/2024 | | | 3,545,000 | | | 3,651,187 |
See accompanying Notes to Financial Statements which are an integral part of the financial statements.
| | |
| 13 | | Invesco Short Term Bond Fund |
| | | | | | |
| | | Principal
Amount | | | Value |
|
Regional Banks–(continued) |
Santander Holdings USA, Inc., 3.50%, 06/07/2024 | | $ | 3,153,000 | | | $ 3,216,106 |
Synovus Financial Corp., 3.13%, 11/01/2022 | | | 2,040,000 | | | 2,053,026 |
Truist Bank,
1.25%, 03/09/2023 | | | 8,483,000 | | | 8,472,240 |
3.20%, 04/01/2024 | | | 3,144,000 | | | 3,225,733 |
3.69%, 08/02/2024(d) | | | 3,420,000 | | | 3,506,474 |
| | | | | | | 45,865,058 |
|
Reinsurance–0.25% |
Swiss Re America Holding Corp., 7.00%, 02/15/2026 | | | 6,108,000 | | | 7,153,639 |
|
Renewable Electricity–0.12% |
Adani Green Energy Ltd. (India), 4.38%, 09/08/2024(c) | | | 3,542,000 | | | 3,504,101 |
|
Restaurants–0.11% |
Aramark Services, Inc., 5.00%, 04/01/2025(b)(c) | | | 3,034,000 | | | 3,059,213 |
|
Retail REITs–0.54% |
Kite Realty Group L.P., 4.00%, 10/01/2026 | | | 6,674,000 | | | 6,983,095 |
Simon Property Group L.P., 0.48% (SOFR + 0.43%), 01/11/2024(b)(e) | | | 6,443,000 | | | 6,449,479 |
3.50%, 09/01/2025 | | | 1,689,000 | | | 1,744,910 |
| | | | | | | 15,177,484 |
|
Semiconductors–1.16% |
Broadcom, Inc., 3.46%, 09/15/2026 | | | 11,771,000 | | | 12,126,098 |
Marvell Technology, Inc., 4.20%, 06/22/2023 | | | 3,695,000 | | | 3,797,764 |
Microchip Technology, Inc., 4.33%, 06/01/2023 | | | 3,694,000 | | | 3,800,938 |
4.25%, 09/01/2025 | | | 8,330,000 | | | 8,550,915 |
NXP B.V./NXP Funding LLC (China), 4.63%, 06/01/2023(c) | | | 4,387,000 | | | 4,526,653 |
| | | | | | | 32,802,368 |
|
Sovereign Debt–0.37% |
Turkey Government International Bond (Turkey), 5.60%, 11/14/2024 | | | 5,347,000 | | | 5,210,117 |
4.75%, 01/26/2026 | | | 5,690,000 | | | 5,214,606 |
| | | | | | | 10,424,723 |
|
Specialized Finance–0.32% |
Element Fleet Management Corp. (Canada), 1.60%, 04/06/2024(c) | | | 2,016,000 | | | 1,983,495 |
National Rural Utilities Cooperative Finance Corp., 1.88%, 02/07/2025 | | | 7,012,000 | | | 6,962,039 |
| | | | | | | 8,945,534 |
|
Specialized REITs–0.73% |
American Tower Corp., 3.00%, 06/15/2023 | | | 4,767,000 | | | 4,839,249 |
Equinix, Inc., 2.63%, 11/18/2024 | | | 11,850,000 | | | 11,926,615 |
| | | | | | |
| | | Principal
Amount | | | Value |
|
Specialized REITs–(continued) |
GLP Capital L.P./GLP Financing II, Inc., 3.35%, 09/01/2024 | | $ | 3,698,000 | | | $ 3,749,842 |
| | | | | | | 20,515,706 |
|
Specialty Chemicals–0.80% |
Avient Corp., 5.25%, 03/15/2023 | | | 3,767,000 | | | 3,866,128 |
Celanese US Holdings LLC, 3.50%, 05/08/2024 | | | 3,700,000 | | | 3,781,835 |
DuPont de Nemours, Inc., 4.21%, 11/15/2023 | | | 3,049,000 | | | 3,159,536 |
PPG Industries, Inc., 2.40%, 08/15/2024 | | | 3,976,000 | | | 4,011,379 |
Sasol Financing USA LLC (South Africa), 4.38%, 09/18/2026 | | | 7,859,000 | | | 7,696,672 |
| | | | | | | 22,515,550 |
|
Steel–0.38% |
ArcelorMittal S.A. (Luxembourg), 3.60%, 07/16/2024 | | | 3,881,000 | | | 3,954,445 |
POSCO Holdings, Inc. (South Korea), 2.38%, 01/17/2023(c) | | | 5,021,000 | | | 5,047,438 |
Steel Dynamics, Inc., 2.40%, 06/15/2025 | | | 1,738,000 | | | 1,734,584 |
| | | | | | | 10,736,467 |
|
Systems Software–0.12% |
Oracle Corp., 2.50%, 04/01/2025 | | | 3,455,000 | | | 3,451,969 |
|
Technology Hardware, Storage & Peripherals–0.15% |
Hewlett Packard Enterprise Co., 4.40%, 10/15/2022 | | | 4,254,000 | | | 4,317,001 |
|
Thrifts & Mortgage Finance–0.39% |
Rocket Mortgage LLC/Rocket Mortgage Co-Issuer, Inc., 2.88%, 10/15/2026(b)(c) | | | 11,810,000 | | | 11,115,100 |
|
Tobacco–0.52% |
Altria Group, Inc., 2.35%, 05/06/2025 | | | 1,549,000 | | | 1,545,010 |
BAT Capital Corp. (United Kingdom), 3.22%, 08/15/2024 | | | 4,899,000 | | | 4,961,108 |
2.79%, 09/06/2024 | | | 4,148,000 | | | 4,176,428 |
Imperial Brands Finance PLC (United Kingdom), 3.13%, 07/26/2024(c) | | | 3,882,000 | | | 3,927,814 |
| | | | | | | 14,610,360 |
|
Trading Companies & Distributors–0.89% |
Air Lease Corp.,
2.30%, 02/01/2025 | | | 4,000,000 | | | 3,955,397 |
1.88%, 08/15/2026 | | | 6,160,000 | | | 5,842,922 |
Aircastle Ltd., 5.00%, 04/01/2023 | | | 15,000,000 | | | 15,412,014 |
| | | | | | | 25,210,333 |
|
Trucking–1.41% |
Penske Truck Leasing Co. L.P./PTL Finance Corp., 3.45%, 07/01/2024(c) | | | 5,542,000 | | | 5,671,717 |
4.00%, 07/15/2025(c) | | | 4,719,000 | | | 4,913,616 |
Ryder System, Inc., 2.50%, 09/01/2024 | | | 5,974,000 | | | 5,997,833 |
4.63%, 06/01/2025 | | | 5,716,000 | | | 6,073,517 |
3.35%, 09/01/2025 | | | 7,704,000 | | | 7,894,809 |
See accompanying Notes to Financial Statements which are an integral part of the financial statements.
| | |
| 14 | | Invesco Short Term Bond Fund |
| | | | | | |
| | | Principal
Amount | | | Value |
|
Trucking–(continued) |
Triton Container International Ltd. (Bermuda),
0.80%, 08/01/2023(c) | | $ | 1,760,000 | | | $ 1,728,597 |
2.05%, 04/15/2026(c) | | | 7,801,000 | | | 7,537,896 |
| | | | | | | 39,817,985 |
|
Wireless Telecommunication Services–1.64% |
Rogers Communications, Inc.
(Canada), 3.63%, 12/15/2025 | | | 11,973,000 | | | 12,443,083 |
Sprint Spectrum Co. LLC/Sprint Spectrum Co. II LLC/Sprint Spectrum Co. III LLC, 4.74%, 03/20/2025(c) | | | 9,979,125 | | | 10,282,124 |
T-Mobile USA, Inc.,
2.25%, 02/15/2026(b) | | | 4,337,000 | | | 4,190,171 |
2.25%, 02/15/2026(c) | | | 4,604,000 | | | 4,448,132 |
2.63%, 04/15/2026(b) | | | 7,499,000 | | | 7,371,142 |
VEON Holdings B.V. (Netherlands), 4.00%, 04/09/2025(c) | | | 3,001,000 | | | 1,305,435 |
Vodafone Group PLC (United Kingdom), 3.75%, 01/16/2024 | | | 5,888,000 | | | 6,094,743 |
| | | | | | | 46,134,830 |
Total U.S. Dollar Denominated Bonds & Notes
(Cost $2,040,230,808) | | | 2,016,595,591 |
|
Asset-Backed Securities–25.05% |
American Credit Acceptance Receivables Trust,
Series 2018-3, Class D, 4.14%, 10/15/2024(c) | | | 32,177 | | | 32,227 |
Series 2019-2, Class D, 3.41%, 06/12/2025(c) | | | 1,935,000 | | | 1,957,812 |
Series 2019-3, Class C, 2.76%, 09/12/2025(c) | | | 575,448 | | | 577,024 |
AmeriCredit Automobile Receivables Trust,
Series 2017-4, Class D, 3.08%, 12/18/2023 | | | 1,480,000 | | | 1,487,916 |
Series 2018-3, Class C, 3.74%, 10/18/2024 | | | 3,465,000 | | | 3,517,716 |
Series 2019-2, Class C, 2.74%, 04/18/2025 | | | 1,335,000 | | | 1,354,556 |
Series 2019-2, Class D, 2.99%, 06/18/2025 | | | 3,700,000 | | | 3,753,892 |
Series 2019-3, Class D, 2.58%, 09/18/2025 | | | 1,830,000 | | | 1,842,598 |
Angel Oak Mortgage Trust,
Series 2020-1, Class A1, 2.16%, 12/25/2059(c)(h) | | | 1,391,039 | | | 1,389,859 |
Series 2020-3, Class A1, 1.69%, 04/25/2065(c)(h) | | | 4,036,947 | | | 4,024,056 |
Series 2020-5, Class A1, 1.37%, 05/25/2065(c)(h) | | | 2,610,957 | | | 2,586,836 |
Series 2021-3, Class A1, 1.07%, 05/25/2066(c)(h) | | | 4,249,481 | | | 4,189,233 |
Series 2021-7, Class A1, 1.98%, 10/25/2066(c)(h) | | | 13,744,612 | | | 13,395,725 |
Series 2022-1, Class A1, 2.88%, 12/25/2066(c)(h) | | | 7,918,893 | | | 7,911,677 |
Angel Oak Mortgage Trust I LLC,
Series 2018-3, Class A1, 3.65%, 09/25/2048(c)(h) | | | 728,663 | | | 728,828 |
Series 2019-2, Class A1, 3.63%, 03/25/2049(c)(h) | | | 855,918 | | | 856,878 |
| | | | | | |
| | | Principal
Amount | | | Value |
Bain Capital Credit CLO Ltd.,
Series 2017-2A, Class AR2, 1.44% (3 mo. USD LIBOR + 1.18%), 07/25/2034(c)(e) | | $ | 11,812,000 | | | $ 11,782,978 |
BAMLL Commercial Mortgage Securities Trust, Series 2015-200P, Class A, 3.22%, 04/14/2033(c) | | | 20,000,000 | | | 20,285,454 |
Banc of America Mortgage Trust,
Series 2004-D, Class 2A2, 2.58%, 05/25/2034(h) | | | 18,121 | | | 18,674 |
Bayview MSR Opportunity Master Fund Trust, Series 2021-4, Class A3, 3.00%, 10/25/2051(c)(h) | | | 6,372,603 | | | 6,297,016 |
Series 2021-4, Class A4, 2.50%, 10/25/2051(c)(h) | | | 6,371,663 | | | 6,135,199 |
Series 2021-4, Class A8, 2.50%, 10/25/2051(c)(h) | | | 6,236,218 | | | 6,128,080 |
Series 2021-5, Class A1, 3.00%, 11/25/2051(c)(h) | | | 6,767,718 | | | 6,697,927 |
Bear Stearns Adjustable Rate Mortgage Trust,
Series 2003-6, Class 1A3, 2.43%, 08/25/2033(h) | | | 21,760 | | | 22,509 |
Series 2005-9, Class A1, 0.76% (1 yr. U.S. Treasury Yield Curve Rate + 2.30%), 10/25/2035(e) | | | 128,840 | | | 131,634 |
Series 2006-1, Class A1, 0.65% (1 yr. U.S. Treasury Yield Curve Rate + 2.25%), 02/25/2036(e) | | | 239,060 | | | 244,089 |
Benchmark Mortgage Trust,
Series 2018-B1, Class XA, IO, 0.49%, 01/15/2051(i) | | | 25,462,469 | | | 605,678 |
BRAVO Residential Funding Trust,
Series 2021-NQM2, Class A1, 0.97%, 03/25/2060(c)(h) | | | 3,148,005 | | | 3,116,436 |
BX Commercial Mortgage Trust,
Series 2021-ACNT, Class A, 1.04% (1 mo. USD LIBOR + 0.85%), 11/15/2038(c)(e) | | | 3,455,000 | | | 3,422,436 |
Series 2021-VOLT, Class A, 0.89% (1 mo. USD LIBOR + 0.70%), 09/15/2036(c)(e) | | | 6,565,000 | | | 6,385,067 |
Series 2021-VOLT, Class B, 1.14% (1 mo. USD LIBOR + 0.95%), 09/15/2036(c)(e) | | | 11,325,000 | | | 10,969,822 |
Series 2021-VOLT, Class C, 1.29% (1 mo. USD LIBOR + 1.10%), 09/15/2036(c)(e) | | | 2,795,000 | | | 2,690,511 |
Series 2021-VOLT, Class D, 1.84% (1 mo. USD LIBOR + 1.65%), 09/15/2036(c)(e) | | | 6,464,000 | | | 6,241,435 |
Series 2021-XL2, Class B, 1.19%
(1 mo. USD LIBOR + 1.00%), 10/15/2038(c)(e) | | | 2,495,000 | | | 2,445,974 |
See accompanying Notes to Financial Statements which are an integral part of the financial statements.
| | |
| 15 | | Invesco Short Term Bond Fund |
| | | | | | | | |
| | | Principal
Amount | | | Value | |
BX Trust,
| | | | | | | | |
Series 2021-LGCY, Class A, 0.70% (1 mo. USD LIBOR + 0.51%), 10/15/2023(c)(e) | | | $25,000,000 | | | $ | 24,082,640 | |
Series 2022-LBA6, Class A, 1.10% (1.00% + SOFR Term Rate), 01/15/2039(c)(e) | | | 5,550,000 | | | | 5,484,003 | |
Series 2022-LBA6, Class B, 1.40% (1.30% + SOFR Term Rate), 01/15/2039(c)(e) | | | 3,435,000 | | | | 3,387,751 | |
Series 2022-LBA6, Class C, 1.70% (1.60% + SOFR Term Rate), 01/15/2039(c)(e) | | | 1,835,000 | | | | 1,809,747 | |
CarMax Auto Owner Trust, | | | | | | | | |
Series 2018-1, Class D, 3.37%, 07/15/2024 | | | 810,000 | | | | 810,874 | |
Series 2018-3, Class A3, 3.13%, 06/15/2023 | | | 250,805 | | | | 251,438 | |
Series 2018-4, Class C, 3.85%, 07/15/2024 | | | 1,170,000 | | | | 1,189,415 | |
CCG Receivables Trust, | | | | | | | | |
Series 2018-2, Class C, 3.87%, 12/15/2025(c) | | | 755,000 | | | | 755,931 | |
Series 2019-1, Class B, 3.22%, 09/14/2026(c) | | | 2,540,000 | | | | 2,567,752 | |
Series 2019-1, Class C, 3.57%, 09/14/2026(c) | | | 555,000 | | | | 562,417 | |
Series 2019-2, Class B, 2.55%, 03/15/2027(c) | | | 1,445,000 | | | | 1,454,973 | |
Series 2019-2, Class C, 2.89%, 03/15/2027(c) | | | 695,000 | | | | 698,805 | |
CD Mortgage Trust, | | | | | | | | |
Series 2017- CD6, Class XA, IO, 0.92%, 11/13/2050(i) | | | 8,637,408 | | | | 289,279 | |
Cedar Funding IX CLO Ltd., | | | | | | | | |
Series 2018-9A, Class A1, 1.23% (3 mo. USD LIBOR + 0.98%), 04/20/2031(c)(e) | | | 5,813,000 | | | | 5,772,228 | |
Chase Home Lending Mortgage Trust, | | | | | | | | |
Series 2019-ATR1, Class A15, 4.00%, 04/25/2049(c)(h) | | | 115,263 | | | | 115,896 | |
Series 2019-ATR2, Class A3, 3.50%, 07/25/2049(c)(h) | | | 2,139,247 | | | | 2,152,537 | |
Chase Mortgage Finance Trust, ,
| | | | | | | | |
Series 2005-A2, Class 1A3, 2.96%, 01/25/2036(h) | | | 287,535 | | | | 276,351 | |
CIFC Funding Ltd. (Cayman Islands), | | | | | | | | |
Series 2014-5A, Class A1R2, 1.44% (3 mo. USD LIBOR + 1.20%), 10/17/2031(c)(e) | | | 2,390,000 | | | | 2,383,322 | |
Series 2016-1A, Class ARR, 1.34% (3 mo. USD LIBOR + 1.08%), 10/21/2031(c)(e) | | | 2,424,000 | | | | 2,414,028 | |
Citigroup Commercial Mortgage Trust, | | | | | | | | |
Series 2013-GC17, Class XA, IO, 1.00%, 11/10/2046(i) | | | 10,801,599 | | | | 145,062 | |
Series 2014-GC21, Class AA, 3.48%, 05/10/2047 | | | 447,495 | | | | 455,048 | |
Series 2017-C4, Class XA, IO, 1.08%, 10/12/2050(i) | | | 22,867,125 | | | | 953,651 | |
| | | | | | | | |
| | | Principal
Amount | | | Value | |
Citigroup Mortgage Loan Trust, Inc., | | | | | | | | |
Series 2004-UST1, Class A4, 1.89%, 08/25/2034(h) | | $ | 76,307 | | | $ | 74,814 | |
Series 2006-AR1, Class 1A1, 3.15% (1 yr. U.S. Treasury Yield Curve Rate + 2.40%), 10/25/2035(e) | | | 595,967 | | | | 617,191 | |
Series 2019-IMC1, Class A1, 2.72%, 07/25/2049(c)(h) | | | 1,780,359 | | | | 1,776,396 | |
Series 2021-INV3, Class A3, 2.50%, 05/25/2051(c)(h) | | | 6,488,606 | | | | 6,247,802 | |
COLT Mortgage Loan Trust, | | | | | | | | |
Series 2020-1, Class A1, 2.49%, 02/25/2050(c)(h) | | | 1,846,044 | | | | 1,846,044 | |
Series 2020-1, Class A2, 2.69%, 02/25/2050(c)(h) | | | 476,895 | | | | 476,895 | |
Series 2020-1R, Class A1, 1.26%, 09/25/2065(c)(h) | | | 1,255,323 | | | | 1,245,217 | |
Series 2020-2, Class A1, 1.85%, 03/25/2065(c)(h) | | | 1,062,980 | | | | 1,064,673 | |
Series 2021-5, Class A1, 1.73%, 11/26/2066(c)(h) | | | 9,622,891 | | | | 9,433,945 | |
Series 2022-1, Class A1, 2.28%, 12/27/2066(c)(h) | | | 4,803,464 | | | | 4,750,083 | |
Series 2022-2, Class A1, 2.99%, 02/25/2067(c)(g) | | | 4,940,000 | | | | 4,945,553 | |
COMM Mortgage Trust, | | | | | | | | |
Series 2012-CR5, Class XA, IO, 1.49%, 12/10/2045(i) | | | 11,183,138 | | | | 70,403 | |
Series 2014-CR20, Class ASB, 3.31%, 11/10/2047 | | | 388,416 | | | | 395,012 | |
Countrywide Home Loans Mortgage Pass-Through Trust, | | | | | | | | |
Series 2005-17, Class 1A8, 5.50%, 09/25/2035 | | | 246,913 | | | | 244,647 | |
Series 2005-JA, Class A7, 5.50%, 11/25/2035 | | | 341,937 | | | | 332,169 | |
Credit Suisse Mortgage Capital Ctfs., | | | | | | | | |
Series 2020-SPT1, Class A1, 1.62%, 04/25/2065(c)(g) | | | 2,101,134 | | | | 2,098,710 | |
Series 2022-ATH1, Class A1A, 2.87%, 01/25/2067(c)(h) | | | 6,525,000 | | | | 6,528,901 | |
Series 2022-ATH1, Class A1B, 3.35%, 01/25/2067(c)(h) | | | 2,955,000 | | | | 2,966,915 | |
Credit Suisse Mortgage Capital Trust, | | | | | | | | |
Series 2020-AFC1, Class A1, 2.24%, 02/25/2050(c)(h) | | | 5,732,265 | | | | 5,686,431 | |
Series 2021-INV1, Class A4, 2.50%, 07/25/2056(c)(h) | | | 15,675,374 | | | | 15,462,220 | |
Series 2021-NQM1, Class A1, 0.81%, 05/25/2065(c)(h) | | | 1,518,380 | | | | 1,495,189 | |
Series 2021-NQM2, Class A1, 1.18%, 02/25/2066(c)(h) | | | 6,607,303 | | | | 6,456,328 | |
Dell Equipment Finance Trust, | | | | | | | | |
Series 2019-2, Class D, 2.48%, 04/22/2025(c) | | | 1,530,000 | | | | 1,533,988 | |
See accompanying Notes to Financial Statements which are an integral part of the financial statements.
| | |
| 16 | | Invesco Short Term Bond Fund |
| | | | | | | | |
| | | Principal
Amount | | | Value | |
Drive Auto Receivables Trust, | | | | | | | | |
Series 2018-2, Class D, 4.14%, 08/15/2024 | | $ | 719,979 | | | $ | 726,558 | |
Series 2018-3, Class D, 4.30%, 09/16/2024 | | | 917,311 | | | | 926,999 | |
Series 2018-5, Class C, 3.99%, 01/15/2025 | | | 223,220 | | | | 223,841 | |
Series 2019-3, Class C, 2.90%, 08/15/2025 | | | 1,559,081 | | | | 1,567,468 | |
Series 2019-3, Class D, 3.18%, 10/15/2026 | | | 2,885,000 | | | | 2,934,964 | |
Dryden 93 CLO Ltd., Series 2021-93A, Class A1A, 1.24% (3 mo. USD LIBOR + 1.08%), 01/15/2034(c)(e) | | | 1,705,121 | | | | 1,700,328 | |
DT Auto Owner Trust, | | | | | | | | |
Series 2018-2A, Class D, 4.15%, 03/15/2024(c) | | | 323,714 | | | | 325,646 | |
Series 2019-3A, Class C, 2.74%, 04/15/2025(c) | | | 1,325,732 | | | | 1,330,810 | |
Ellington Financial Mortgage Trust, | | | | | | | | |
Series 2020-1, Class A1, 2.01%, 05/25/2065(c)(h) | | | 702,472 | | | | 703,307 | |
Series 2021-1, Class A1, 0.80%, 02/25/2066(c)(h) | | | 1,725,788 | | | | 1,683,931 | |
Series 2022-1, Class A1, 2.21%, 01/25/2067(c)(h) | | | 4,417,325 | | | | 4,385,644 | |
Exeter Automobile Receivables Trust, | | | | | | | | |
Series 2019-1A, Class D, 4.13%, 12/16/2024(c) | | | 3,568,335 | | | | 3,615,173 | |
Series 2019-2A, Class C, 3.30%, 03/15/2024(c) | | | 678,592 | | | | 679,999 | |
Series 2019-4A, Class D, 2.58%, 09/15/2025(c) | | | 3,225,000 | | | | 3,259,361 | |
Flagstar Mortgage Trust, | | | | | | | | |
Series 2021-11IN, Class A6, 3.70%, 11/25/2051(c)(h) | | | 10,684,082 | | | | 10,479,758 | |
Series 2021-8INV, Class A6, 2.50%, 09/25/2051(c)(h) | | | 2,287,220 | | | | 2,248,751 | |
FREMF Mortgage Trust, | | | | | | | | |
Series 2012-K23, Class C, 3.66%, 10/25/2045(c)(h) | | | 5,250,000 | | | | 5,291,331 | |
Series 2013-K25, Class C, 3.62%, 11/25/2045(c)(h) | | | 2,362,000 | | | | 2,386,816 | |
Series 2013-K26, Class C, 3.60%, 12/25/2045(c)(h) | | | 1,642,030 | | | | 1,657,747 | |
Series 2013-K27, Class C, 3.50%, 01/25/2046(c)(h) | | | 530,000 | | | | 535,541 | |
Series 2013-K28, Class C, 3.49%, 06/25/2046(c)(h) | | | 530,000 | | | | 536,883 | |
Series 2013-K29, Class C, 3.47%, 05/25/2046(c)(h) | | | 1,915,000 | | | | 1,942,387 | |
Series 2013-K30, Class C, 3.56%, 06/25/2045(c)(h) | | | 917,000 | | | | 929,853 | |
Series 2015-K721, Class B, 3.68%, 11/25/2047(c)(h) | | | 1,150,000 | | | | 1,159,730 | |
Series 2017-K724, Class B, 5.26%, 12/25/2049(c)(h) | | | 1,395,000 | | | | 1,419,058 | |
GCAT Trust, | | | | | | | | |
Series 2019-NQM3, Class A1, 2.69%, 11/25/2059(c)(h) | | | 3,016,322 | | | | 3,018,799 | |
Series 2020-NQM2, Class A1, 1.56%, 04/25/2065(c)(g) | | | 1,163,238 | | | | 1,156,434 | |
| | | | | | | | |
| | | Principal
Amount | | | Value | |
GoldenTree Loan Management US CLO 1 Ltd., Series 2021-9A, Class A, 1.32% (3 mo. USD LIBOR + 1.07%), 01/20/2033(c)(e) | | $ | 6,000,000 | | | $ | 5,978,796 | |
GoldenTree Loan Management US CLO 2 Ltd., Series 2017-2A, Class AR, 1.16% (3 mo. USD LIBOR + 0.91%),11/20/2030(c)(e) | | | 7,612,000 | | | | 7,587,352 | |
GoldenTree Loan Management US CLO 5 Ltd., Series 2019-5A, Class AR, 1.32% (3 mo. USD LIBOR + 1.07%),10/20/2032(c)(e) | | | 7,000,000 | | | | 6,975,206 | |
Golub Capital Partners CLO 35(B) Ltd., Series 2017-35A, Class AR, 1.44% (3 mo. USD LIBOR + 1.19%), 07/20/2029(c)(e) | | | 8,788,056 | | | | 8,770,094 | |
GS Mortgage Securities Trust, | | | | | | | | |
Series 2013-GCJ12, Class AAB, 2.68%, 06/10/2046 | | | 67,440 | | | | 67,727 | |
Series 2014-GC18, Class AAB, 3.65%, 01/10/2047 | | | 353,158 | | | | 358,847 | |
GS Mortgage-Backed Securities Trust, Series 2021-INV1, Class A6, 2.50%, 12/25/2051(c)(h) | | | 5,565,735 | | | | 5,469,061 | |
GSR Mortgage Loan Trust, Series 2005-AR, Class 6A1, 3.07%, 07/25/2035(h) | | | 46,376 | | | | 47,858 | |
Hertz Vehicle Financing LLC, | | | | | | | | |
Series 2021-1A, Class A, 1.21%, 12/26/2025(c) | | | 1,584,000 | | | | 1,540,539 | |
Series 2021-1A, Class B, 1.56%, 12/26/2025(c) | | | 700,000 | | | | 680,046 | |
Hilton Grand Vacations Trust, Series 2019 AA, Class A, 2.34%, 07/25/2033(c) | | | 2,108,306 | | | | 2,103,362 | |
ICG US CLO Ltd., Series 2016-1A, Class A1RR, 1.55% (3 mo. USD LIBOR + 1.25%), 04/29/2034(c)(e) | | | 3,000,000 | | | | 2,988,360 | |
IP Lending II Ltd., Series 2021-2A, Class SNR, 3.65%, 07/15/2025(c)(j) | | | 5,000,000 | | | | 4,859,066 | |
IP Lending III Ltd., Series 2022-3A, Class SNR, 3.38%, 11/02/2026(c)(j) | | | 3,978,000 | | | | 3,969,315 | |
JP Morgan Chase Commercial Mortgage Securities Trust, | | | | | | | | |
Series 2013-C16, Class AS, 4.52%, 12/15/2046 | | | 2,335,000 | | | | 2,403,592 | |
Series 2016-JP3, Class A2, 2.43%, 08/15/2049 | | | 285,654 | | | | 285,218 | |
JP Morgan Mortgage Trust, Series 2007-A1, Class 5A1, 2.39%, 07/25/2035(h) | | | 201,116 | | | | 204,926 | |
JPMBB Commercial Mortgage Securities Trust, Series 2015- C27, Class XA, IO, 1.16%, 02/15/2048(i) | | | 26,462,635 | | | | 755,529 | |
See accompanying Notes to Financial Statements which are an integral part of the financial statements.
| | |
| 17 | | Invesco Short Term Bond Fund |
| | | | | | | | |
| | | Principal
Amount | | | Value | |
KNDL Mortgage Trust, | | | | | | | | |
Series 2019-KNSQ, Class A, 0.99% (1 mo. USD LIBOR + 0.80%), 05/15/2036(c)(e) | | $ | 7,750,000 | | | $ | 7,682,429 | |
Series 2019-KNSQ, Class C, 1.24% (1 mo. USD LIBOR + 1.05%), 05/15/2036(c)(e) | | | 4,250,000 | | | | 4,205,901 | |
Lehman Structured Securities Corp., Series 2002-GE1, Class A, 0.00%, 07/26/2024(c)(h) | | | 19,407 | | | | 6,540 | |
Life Mortgage Trust, | | | | | | | | |
Series 2021-BMR, Class A, 0.89% (1 mo. USD LIBOR + 0.70%), 03/15/2038(c)(e) | | | 7,254,320 | | | | 7,117,325 | |
Series 2021-BMR, Class B, 1.07% (1 mo. USD LIBOR + 0.88%), 03/15/2038(c)(e) | | | 3,519,033 | | | | 3,440,256 | |
Master Credit Card Trust II, Series 2020-1A, Class A, 1.99%, 09/21/2024(c) | | | 15,000,000 | | | | 15,107,734 | |
Med Trust, | | | | | | | | |
Series 2021-MDLN, Class A, 1.14% (1 mo. USD LIBOR + 0.95%), 11/15/2038(c)(e) | | | 4,135,000 | | | | 4,078,696 | |
Series 2021-MDLN, Class B, 1.64% (1 mo. USD LIBOR + 1.45%), 11/15/2038(c)(e) | | | 6,685,000 | | | | 6,593,547 | |
Mello Mortgage Capital Acceptance Trust, | | | | | | | | |
Series 2021-INV2, Class A4, 2.50%, 08/25/2051(c)(h) | | | 4,214,165 | | | | 4,155,351 | |
Series 2021-INV3, Class A4, 2.50%, 10/25/2051(c)(h) | | | 4,129,979 | | | | 4,058,798 | |
Merrill Lynch Mortgage Investors Trust, Series 2005-3, Class 3A, 2.06%, 11/25/2035(h) | | | 435,368 | | | | 436,815 | |
MFA Trust, | | | | | | | | |
Series 2021-AEI1, Class A3, 2.50%, 08/25/2051(c)(h) | | | 4,568,202 | | | | 4,398,668 | |
Series 2021-AEI1, Class A4, 2.50%, 08/25/2051(c)(h) | | | 5,642,551 | | | | 5,544,826 | |
Series 2021-INV2, Class A1, 1.91%, 11/25/2056(c)(h) | | | 8,833,874 | | | | 8,572,929 | |
MMAF Equipment Finance LLC, | | | | | | | | |
Series 2020-A, Class A2, 0.74%, 04/09/2024(c) | | | 3,104,488 | | | | 3,096,755 | |
Series 2020-A, Class A3, 0.97%, 04/09/2027(c) | | | 5,800,000 | | | | 5,654,864 | |
Morgan Stanley Bank of America Merrill Lynch Trust, Series 2013-C9, Class AS, 3.46%, 05/15/2046 | | | 2,235,000 | | | | 2,255,905 | |
Morgan Stanley Capital I Trust, | | | | | | | | |
Series 2017-CLS, Class A, 0.89% (1 mo. USD LIBOR + 0.70%), 11/15/2034(c)(e) | | | 8,028,000 | | | | 7,986,302 | |
Series 2017-CLS, Class B, 1.04% (1 mo. USD LIBOR + 0.85%), 11/15/2034(c)(e) | | | 3,944,000 | | | | 3,916,416 | |
Series 2017-CLS, Class C, 1.19% (1 mo. USD LIBOR + 1.00%), 11/15/2034(c)(e) | | | 2,676,000 | | | | 2,655,088 | |
Series 2017-HR2, Class XA, IO, 0.78%, 12/15/2050(i) | | | 8,614,550 | | | | 313,266 | |
| | | | | | | | |
| | | Principal
Amount | | | Value | |
Motel Trust, | | | | | | | | |
Series 2021-MTL6, Class A, 1.09% (1 mo. USD LIBOR + 0.90%), 09/15/2038(c)(e) | | $ | 1,860,365 | | | $ | 1,838,790 | |
Series 2021-MTL6, Class B, 1.39% (1 mo. USD LIBOR + 1.20%), 09/15/2038(c)(e) | | | 747,982 | | | | 738,231 | |
MVW LLC, Series 2019-2A, Class A, 2.22%, 10/20/2038(c) | | | 2,099,917 | | | | 2,090,937 | |
MVW Owner Trust, Series 2019-1A, Class A, 2.89%, 11/20/2036(c) | | | 1,689,137 | | | | 1,704,467 | |
Neuberger Berman Loan Advisers CLO 24 Ltd., Series 2017-24A, Class AR, 1.27% (3 mo. USD LIBOR + 1.02%), 04/19/2030(c)(e) | | | 7,455,000 | | | | 7,418,769 | |
New Residential Mortgage Loan Trust, | | | | | | | | |
Series 2019-NQM4, Class A1, 2.49%, 09/25/2059(c)(h) | | | 947,105 | | | | 949,136 | |
Series 2020-NQM1, Class A1, 2.46%, 01/26/2060(c)(h) | | | 1,535,287 | | | | 1,534,082 | |
OBX Trust, | | | | | | | | |
Series 2019-EXP1, Class 1A3, 4.00%, 01/25/2059(c)(h) | | | 398,792 | | | | 402,221 | |
Series 2022-NQM1, Class A1, 2.31%, 11/25/2061(c)(h) | | | 5,724,826 | | | | 5,666,561 | |
Series 2022-NQM2, Class A1, 2.93%, 01/25/2062(c)(h) | | | 6,532,000 | | | | 6,526,697 | |
Series 2022-NQM2, Class A1A, 2.78%, 01/25/2062(c)(g) | | | 4,342,000 | | | | 4,344,465 | |
Series 2022-NQM2, Class A1B, 3.38%, 01/25/2062(c)(g) | | | 3,610,000 | | | | 3,607,408 | |
Oceanview Mortgage Trust, Series 2021-3, Class A5, 2.50%, 07/25/2051(c)(h) | | | 4,975,561 | | | | 4,891,827 | |
OCP CLO Ltd. (Cayman Islands), | | | | | | | | |
Series 2017-13A, Class A1AR, 1.20% (3 mo. USD LIBOR + 0.96%), 07/15/2030(c)(e) | | | 5,145,000 | | | | 5,145,473 | |
Series 2020-8RA, Class A1, 1.46% (3 mo. USD LIBOR + 1.22%), 01/17/2032(c)(e) | | | 9,602,000 | | | | 9,590,698 | |
Octagon Investment Partners 49 Ltd., Series 2020-5A, Class A1, 1.46% (3 mo. USD LIBOR + 1.22%), 01/15/2033(c)(e) | | | 8,832,000 | | | | 8,812,331 | |
OHA Loan Funding Ltd., Series 2016-1A, Class AR, 1.51% (3 mo. USD LIBOR + 1.26%), 01/20/2033(c)(e) | | | 7,550,413 | | | | 7,517,833 | |
Onslow Bay Mortgage Loan Trust, Series 2021-NQM4, Class A1, 1.96%, 10/25/2061(c)(h) | | | 6,643,259 | | | | 6,456,213 | |
PPM CLO 3 Ltd., Series 2019-3A, Class AR, 1.33% (3 mo. USD LIBOR + 1.09%), 04/17/2034(c)(e) | | | 3,874,000 | | | | 3,838,894 | |
Prestige Auto Receivables Trust, Series 2019-1A, Class C, 2.70%, 10/15/2024(c) | | | 1,560,000 | | | | 1,567,282 | |
Progress Residential Trust, | | | | | | | | |
Series 2020-SFR1, Class A, 1.73%, 04/17/2037(c) | | | 5,005,000 | | | | 4,881,373 | |
Series 2021-SFR10, Class A, 2.39%, 12/17/2040(c) | | | 3,725,000 | | | | 3,632,824 | |
See accompanying Notes to Financial Statements which are an integral part of the financial statements.
| | |
| 18 | | Invesco Short Term Bond Fund |
| | | | | | | | |
| | | Principal
Amount | | | Value | |
Residential Accredit Loans, Inc. Trust, Series 2006-QS13, Class 1A8, 6.00%, 09/25/2036 | | $ | 3,954 | | | $ | 3,688 | |
Residential Mortgage Loan Trust, Series 2019-3, Class A1, 2.63%, 09/25/2059(c)(h) | | | 488,164 | | | | 485,697 | |
Series 2020-1, Class A1, 2.38%, 01/26/2060(c)(h) | | | 1,457,057 | | | | 1,446,916 | |
Santander Drive Auto Receivables Trust, Series 2018-1, Class D, 3.32%, 03/15/2024 | | | 277,309 | | | | 277,662 | |
Series 2018-2, Class D, 3.88%, 02/15/2024 | | | 833,075 | | | | 837,555 | |
Series 2019-2, Class D, 3.22%, 07/15/2025 | | | 2,675,000 | | | | 2,702,143 | |
Series 2019-3, Class D, 2.68%, 10/15/2025 | | | 2,230,000 | | | | 2,247,865 | |
Santander Retail Auto Lease Trust, Series 2019-B, Class C, 2.77%, 08/21/2023(c) | | | 1,555,000 | | | | 1,561,952 | |
Series 2019-C, Class C, 2.39%, 11/20/2023(c) | | | 2,845,000 | | | | 2,859,985 | |
Sequoia Mortgage Trust, Series 2013-3, Class A1, 2.00%, 03/25/2043(h) | | | 569,723 | | | | 556,708 | |
Series 2013-6, Class A2, 3.00%, 05/25/2043(h) | | | 806,231 | | | | 793,877 | |
Series 2013-7, Class A2, 3.00%, 06/25/2043(h) | | | 501,022 | | | | 494,148 | |
Sierra Timeshare Receivables Funding LLC, Series 2019-3A, Class A, 2.34%, 08/20/2036(c) | | | 2,422,202 | | | | 2,417,388 | |
Sonic Capital LLC, Series 2021-1A, Class A2I, 2.19%, 08/20/2051(c) | | | 4,590,792 | | | | 4,344,196 | |
STAR Trust, Series 2021-SFR1, Class A, 0.72% (1 mo. USD LIBOR + 0.60%), 04/17/2038(c)(e) | | | 18,579,790 | | | | 18,490,555 | |
Starwood Mortgage Residential Trust, Series 2020-1, Class A1, 2.28%, 02/25/2050(c)(h) | | | 552,036 | | | | 550,061 | |
Series 2020-INV1, Class A1, 1.03%, 11/25/2055(c)(h) | | | 2,089,132 | | | | 2,064,847 | |
Series 2022-1, Class A1, 2.45%, 12/25/2066(c)(h) | | | 5,934,618 | | | | 5,892,356 | |
Structured Asset Securities Corp. Pass-Through Ctfs., Series 2002-AL1, Class AIO, 3.45%, 02/25/2032(h) | | | 604,697 | | | | 130,593 | |
Textainer Marine Containers VII Ltd., Series 2021-2A, Class A, 2.23%, 04/20/2046(c) | | | 7,746,667 | | | | 7,551,247 | |
TICP CLO XV Ltd., Series 2020-15A, Class A, 1.53% (3 mo. USD LIBOR + 1.28%), 04/20/2033(c)(e) | | | 7,162,000 | | | | 7,134,663 | |
Towd Point Mortgage Trust, Series 2017-2, Class A1, 2.75%, 04/25/2057(c)(h) | | | 1,226,428 | | | | 1,233,024 | |
UBS Commercial Mortgage Trust, Series 2017-C5, Class XA, IO,
0.98%, 11/15/2050(i) | | | 14,785,137 | | | | 566,874 | |
Vendee Mortgage Trust, Series 1995-2B, Class 2, IO, 0.79%, 06/15/2025(k) | | | 644,174 | | | | 5,631 | |
| | | | | | | | |
| | | Principal
Amount | | | Value | |
Verus Securitization Trust, Series 2020-1, Class A1, 2.42%, 01/25/2060(c)(g) | | $ | 1,970,804 | | | $ | 1,971,338 | |
Series 2020-INV1, Class A1, 0.33%, 03/25/2060(c)(h) | | | 735,313 | | | | 732,683 | |
Series 2021-1, Class A1B, 1.32%, 01/25/2066(c)(h) | | | 3,786,957 | | | | 3,699,273 | |
Series 2021-2, Class A1, 1.03%, 02/25/2066(c)(h) | | | 2,257,094 | | | | 2,211,146 | |
Series 2021-7, Class A1, 1.83%, 10/25/2066(c)(h) | | | 6,722,450 | | | | 6,572,371 | |
Series 2021-R1, Class A1, 0.82%, 10/25/2063(c)(h) | | | 3,583,725 | | | | 3,555,417 | |
Series 2022-1, Class A1, 2.72%, 01/25/2067(c)(g) | | | 4,345,000 | | | | 4,321,137 | |
Visio Trust, Series 2020-1R, Class A1, 1.31%, 11/25/2055(c) | | | 2,223,697 | | | | 2,195,863 | |
WaMu Mortgage Pass-Through Ctfs. Trust, Series 2003-AR10, Class A7, 2.49%, 10/25/2033(h) | | | 107,716 | | | | 108,666 | |
Series 2005-AR14, Class 1A4, 2.83%, 12/25/2035(h) | | | 42,373 | | | | 42,977 | |
Series 2005-AR16, Class 1A1, 2.64%, 12/25/2035(h) | | | 196,642 | | | | 199,842 | |
Wells Fargo Commercial Mortgage Trust, Series 2015-NXS1, Class A2, 2.63%, 05/15/2048 | | | 65,312 | | | | 65,289 | |
Series 2017-C42, Class XA, IO, 0.87%, 12/15/2050(i) | | | 11,972,101 | | | | 522,518 | |
Wendy’s Funding LLC, Series 2019-1A, Class A2I, 3.78%, 06/15/2049(c) | | | 6,440,000 | | | | 6,572,137 | |
Westlake Automobile Receivables Trust, Series 2019-2A, Class C, 2.84%, 07/15/2024(c) | | | 1,354,990 | | | | 1,359,195 | |
Series 2019-3A, Class C, 2.49%, 10/15/2024(c) | | | 3,254,007 | | | | 3,265,410 | |
WFRBS Commercial Mortgage Trust, Series 2012-C10, Class XA, IO, 1.48%, 12/15/2045(c)(i) | | | 3,105,882 | | | | 21,628 | |
Series 2013-C16, Class B, 5.00%, 09/15/2046(h) | | | 4,500,000 | | | | 4,575,493 | |
World Financial Network Credit Card Master Trust, Series 2019-B, Class A, 2.49%, 04/15/2026 | | | 3,665,000 | | | | 3,684,235 | |
Series 2019-C, Class A, 2.21%, 07/15/2026 | | | 3,130,000 | | | | 3,152,675 | |
Zaxby’s Funding LLC, Series 2021-1A, Class A2, 3.24%, 07/30/2051(c) | | | 9,945,025 | | | | 9,702,333 | |
Total Asset-Backed Securities
(Cost $718,589,733) | | | | 706,478,617 | |
|
U.S. Treasury Securities–0.93% | |
U.S. Treasury Bills–0.26% | |
0.30% - 0.42%, 05/26/2022(l)(m) | | | 7,389,000 | | | | 7,383,572 | |
See accompanying Notes to Financial Statements which are an integral part of the financial statements.
| | |
| 19 | | Invesco Short Term Bond Fund |
| | | | | | | | |
| | | Principal
Amount | | | Value | |
| | |
U.S. Treasury Notes–0.67% | | | | | | | | |
1.50%, 02/29/2024 | | $ | 2,901,000 | | | $ | 2,903,550 | |
1.00%, 12/15/2024 | | | 0 | | | | 0 | |
1.50%, 02/15/2025 | | | 15,050,400 | | | | 14,991,609 | |
1.88%, 02/28/2027 | | | 930,600 | | | | 936,853 | |
| | | | | | | | 18,832,012 | |
Total U.S. Treasury Securities (Cost $26,130,941) | | | | | | | 26,215,584 | |
|
U.S. Government Sponsored Agency Mortgage-Backed Securities–0.87% | |
Collateralized Mortgage Obligations–0.52% | | | | | |
Fannie Mae Interest STRIPS, IO, 7.50%, 05/25/2023 to 11/25/2029(k) | | | 561,960 | | | | 103,905 | |
6.50%, 02/25/2032 to 07/25/2032(k) | | | 297,665 | | | | 50,534 | |
6.00%, 12/25/2032 to 09/25/2035(k) | | | 726,370 | | | | 113,440 | |
5.50%, 11/25/2033 to 06/25/2035(k) | | | 570,657 | | | | 93,594 | |
PO, 0.00%, 09/25/2032(n) | | | 23,864 | | | | 22,040 | |
Fannie Mae REMICs, 7.50%, 09/25/2022 | | | 28,074 | | | | 28,410 | |
6.50%, 06/25/2023 to 11/25/2029 | | | 75,672 | | | | 81,667 | |
1.19% (1 mo. USD LIBOR + 1.00%), 04/25/2032(e) | | | 41,988 | | | | 42,967 | |
0.64% (1 mo. USD LIBOR + 0.50%), 10/18/2032(e) | | | 20,015 | | | | 20,149 | |
0.59% (1 mo. USD LIBOR + 0.40%), 11/25/2033 to 03/25/2042(e) | | | 102,678 | | | | 103,585 | |
5.50%, 04/25/2035 to 07/25/2046(k) | | | 3,363,208 | | | | 2,766,346 | |
23.88% (24.57% — (3.67 x 1 mo. USD LIBOR)), 03/25/2036(e) | | | 74,871 | | | | 115,633 | |
23.51% (24.20% — (3.67 x 1 mo. USD LIBOR)), 06/25/2036(e) | | | 305,675 | | | | 445,419 | |
5.00%, 04/25/2040 to 09/25/2047(e)(k) | | | 5,985,709 | | | | 1,211,735 | |
4.00%, 03/25/2041 to 08/25/2047(k) | | | 1,166,720 | | | | 202,038 | |
0.64% (1 mo. USD LIBOR + 0.45%), 02/25/2047(e) | | | 59,183 | | | | 59,372 | |
IO, 6.51% (6.70% - (1.00 x 1 mo. USD LIBOR)), 02/25/2024 to 02/25/2035(e)(k) | | | 761,806 | | | | 120,611 | |
3.00%, 11/25/2027(k) | | | 1,018,135 | | | | 53,674 | |
7.76% (7.90% - (1.00 x 1 mo. USD LIBOR)), 11/18/2031 to 12/18/2031(e)(k) | | | 159,842 | | | | 27,068 | |
7.71% (7.90% - (1.00 x 1 mo. USD LIBOR)), 11/25/2031(e)(k) | | | 31,630 | | | | 5,624 | |
7.76% (7.95% - (1.00 x 1 mo. USD LIBOR)), 01/25/2032 to 07/25/2032(e)(k) | | | 191,409 | | | | 28,829 | |
7.86% (8.00% - (1.00 x 1 mo. USD LIBOR)), 03/18/2032(e)(k) | | | 64,174 | | | | 12,253 | |
7.91% (8.10% - (1.00 x 1 mo. USD LIBOR)), 03/25/2032 to 04/25/2032(e)(k) | | | 89,710 | | | | 17,258 | |
| | | | | | | | |
| | | Principal
Amount | | | Value | |
|
Collateralized Mortgage Obligations–(continued) | |
6.81% (7.00% - (1.00 x 1 mo. USD LIBOR)), 04/25/2032(e)(k) | | $ | 60,719 | | | $ | 9,367 | |
7.61% (7.80% - (1.00 x 1 mo. USD LIBOR)), 04/25/2032(e)(k) | | | 30,826 | | | | 5,693 | |
7.81% (8.00% - (1.00 x 1 mo. USD LIBOR)), 07/25/2032 to 09/25/2032(e)(k) | | | 201,548 | | | | 39,467 | |
7.96% (8.10% - (1.00 x 1 mo. USD LIBOR)), 12/18/2032(e)(k) | | | 139,490 | | | | 23,890 | |
8.06% (8.25% - (1.00 x 1 mo. USD LIBOR)), 02/25/2033 to 05/25/2033(e)(k) | | | 170,483 | | | | 36,893 | |
7.00%, 04/25/2033(k) | | | 847,166 | | | | 167,377 | |
5.86% (6.05% - (1.00 x 1 mo. USD LIBOR)), 03/25/2035 to 07/25/2038(e)(k) | | | 381,832 | | | | 50,732 | |
6.56% (6.75% - (1.00 x 1 mo. USD LIBOR)), 03/25/2035 to 05/25/2035(e)(k) | | | 282,119 | | | | 28,065 | |
6.41% (6.60% - (1.00 x 1 mo. USD LIBOR)), 05/25/2035(e)(k) | | | 159,452 | | | | 20,445 | |
3.50%, 08/25/2035(k) | | | 3,573,833 | | | | 448,813 | |
6.35% (6.54% - (1.00 x 1 mo. USD LIBOR)), 06/25/2037(e)(k) | | | 120,507 | | | | 19,434 | |
6.36% (6.55% - (1.00 x 1 mo. USD LIBOR)), 10/25/2041(e)(k) | | | 407,808 | | | | 59,601 | |
5.96% (6.15% - (1.00 x 1 mo. USD LIBOR)), 12/25/2042(e)(k) | | | 669,927 | | | | 134,334 | |
4.50%, 02/25/2043(k) | | | 248,593 | | | | 38,843 | |
Freddie Mac Multifamily Structured Pass-Through Ctfs., Series KC02, Class X1, IO, 1.91%, 03/25/2024(i) | | | 53,950,063 | | | | 351,868 | |
Series KC03, Class X1, IO, 0.63%, 11/25/2024(i) | | | 37,428,410 | | | | 434,952 | |
Series K734, Class X1, IO, 0.65%, 02/25/2026(i) | | | 27,479,791 | | | | 602,714 | |
Series K735, Class X1, IO, 1.10%, 05/25/2026(i) | | | 27,013,344 | | | | 947,755 | |
Series K093, Class X1, IO, 0.95%, 05/25/2029(i) | | | 22,313,833 | | | | 1,330,962 | |
Freddie Mac REMICs,
1.67% (COF 11 + 1.45%), 12/15/2023(e) | | | 218,630 | | | | 220,909 | |
6.50%, 04/15/2028 to 06/15/2032 | | | 745,085 | | | | 829,354 | |
6.00%, 01/15/2029 to 04/15/2029 | | | 348,326 | | | | 379,987 | |
7.50%, 09/15/2029 | | | 50,767 | | | | 57,072 | |
8.00%, 03/15/2030 | | | 32,115 | | | | 36,933 | |
1.14% (1 mo. USD LIBOR + 0.95%), 08/15/2031 to 01/15/2032(e) | | | 62,765 | | | | 64,284 | |
1.19% (1 mo. USD LIBOR + 1.00%), 12/15/2031 to 03/15/2032(e) | | | 128,602 | | | | 131,160 | |
0.69% (1 mo. USD LIBOR + 0.50%), 01/15/2033(e) | | | 2,693 | | | | 2,734 | |
5.00%, 08/15/2035 | | | 1,212,619 | | | | 1,341,094 | |
4.00%, 06/15/2038 to 03/15/2045(k) | | | 584,519 | | | | 137,050 | |
See accompanying Notes to Financial Statements which are an integral part of the financial statements.
| | |
| 20 | | Invesco Short Term Bond Fund |
| | | | | | | | |
| | | Principal
Amount | | | Value | |
|
Collateralized Mortgage Obligations–(continued) | |
IO, 5.81% (6.00% - (1.00 x 1 mo. USD LIBOR)), 03/15/2024 to 04/15/2038(e)(k) | | $ | 189,838 | | | $ | 12,169 | |
3.00%, 06/15/2027 to 12/15/2027(k) | | | 3,434,125 | | | | 185,178 | |
2.50%, 05/15/2028(k) | | | 726,852 | | | | 36,518 | |
8.58% (8.70% - (1.00 x 1 mo. USD LIBOR)), 07/17/2028(e)(k) | | | 28,303 | | | | 1,642 | |
7.86% (8.05% - (1.00 x 1 mo. USD LIBOR)), 02/15/2029(e)(k) | | | 158,561 | | | | 19,389 | |
7.56% (7.75% - (1.00 x 1 mo. USD LIBOR)), 06/15/2029(e)(k) | | | 139,422 | | | | 16,101 | |
7.91% (8.10% - (1.00 x 1 mo. USD LIBOR)), 06/15/2029 to 09/15/2029(e)(k) | | | 90,704 | | | | 12,069 | |
6.51% (6.70% - (1.00 x 1 mo. USD LIBOR)), 01/15/2035(e)(k) | | | 425,659 | | | | 51,645 | |
6.56% (6.75% - (1.00 x 1 mo. USD LIBOR)), 02/15/2035(e)(k) | | | 91,587 | | | | 11,271 | |
6.53% (6.72% - (1.00 x 1 mo. USD LIBOR)), 05/15/2035(e)(k) | | | 302,622 | | | | 37,394 | |
5.96% (6.15% - (1.00 x 1 mo. USD LIBOR)), 07/15/2035(e)(k) | | | 409,926 | | | | 41,928 | |
6.81% (7.00% - (1.00 x 1 mo. USD LIBOR)), 12/15/2037(e)(k) | | | 58,444 | | | | 10,434 | |
5.88% (6.07% - (1.00 x 1 mo. USD LIBOR)), 05/15/2038(e)(k) | | | 806,914 | | | | 124,366 | |
6.06% (6.25% - (1.00 x 1 mo. USD LIBOR)), 12/15/2039(e)(k) | | | 158,533 | | | | 23,229 | |
5.91% (6.10% - (1.00 x 1 mo. USD LIBOR)), 01/15/2044(e)(k) | | | 820,122 | | | | 100,310 | |
Freddie Mac STRIPS,
IO, 3.00%, 12/15/2027(k) | | | 1,470,754 | | | | 85,270 | |
3.27%, 12/15/2027(i) | | | 365,850 | | | | 18,813 | |
6.50%, 02/01/2028(k) | | | 14,759 | | | | 1,819 | |
7.00%, 09/01/2029(k) | | | 123,279 | | | | 19,463 | |
7.50%, 12/15/2029(k) | | | 51,956 | | | | 8,844 | |
6.00%, 12/15/2032(k) | | | 49,092 | | | | 7,064 | |
| | | | | | | | 14,502,849 | |
|
Federal Home Loan Mortgage Corp. (FHLMC)–0.08% | |
9.00%, 08/01/2022 to 05/01/2025 | | | 2,074 | | | | 2,192 | |
6.00%, 03/01/2023 to 07/01/2024 | | | 107,034 | | | | 115,347 | |
8.50%, 05/01/2024 to 08/17/2026 | | | 31,165 | | | | 31,483 | |
7.00%, 10/25/2024 to 03/01/2035 | | | 705,368 | | | | 770,984 | |
6.50%, 07/01/2028 to 04/01/2034 | | | 67,686 | | | | 73,989 | |
7.50%, 01/01/2032 to 02/01/2032 | | | 405,502 | | | | 456,034 | |
5.00%, 07/01/2033 to 06/01/2034 | | | 207,817 | | | | 230,553 | |
5.50%, 09/01/2039 | | | 471,888 | | | | 530,310 | |
ARM, 1.90% (6 mo. USD LIBOR + 1.64%), 07/01/2036(e) | | | 14,691 | | | | 15,289 | |
| | | | | | | | |
| | | Principal
Amount | | | Value | |
|
Federal Home Loan Mortgage Corp. (FHLMC)–(continued) | |
2.51% (1 yr. USD LIBOR + 2.14%), 02/01/2037(e) | | $ | 6,647 $ | | | | 7,080 | |
2.45% (1 yr. USD LIBOR + 2.08%), 01/01/2038(e) | | | 6,902 | | | | 7,159 | |
| | | | | | | | 2,240,420 | |
|
Federal National Mortgage Association (FNMA)–0.22% | |
5.00%, 06/01/2022 | | | 47 | | | | 48 | |
8.00%, 12/01/2022 to 07/01/2032 | | | 68,556 | | | | 69,894 | |
6.50%, 11/01/2023 to 10/01/2035 | | | 1,225,044 | | | | 1,339,094 | |
7.00%, 11/01/2025 to 08/01/2036 | | | 1,485,266 | | | | 1,620,120 | |
7.50%, 02/01/2027 to 08/01/2033 | | | 947,815 | | | | 1,055,758 | |
9.00%, 01/01/2030 | | | 28,221 | | | | 28,652 | |
8.50%, 05/01/2030 to 07/01/2032 | | | 67,779 | | | | 72,623 | |
6.00%, 06/01/2030 to 03/01/2037 | | | 1,466,402 | | | | 1,664,062 | |
5.50%, 02/01/2035 to 05/01/2036 | | | 200,973 | | | | 224,670 | |
ARM, 2.33% (1 yr. U.S. Treasury Yield Curve Rate + 2.22%), 11/01/2032(e) | | | 16,833 | | | | 16,884 | |
2.30% (1 yr. U.S. Treasury Yield Curve Rate + 2.20%), 05/01/2035(e) | | | 28,625 | | | | 30,165 | |
2.03% (1 yr. USD LIBOR + 1.69%), 03/01/2038(e) | | | 6,382 | | | | 6,669 | |
| | | | | | | | 6,128,639 | |
|
Government National Mortgage Association (GNMA)–0.05% | |
8.00%, 07/15/2022 to 08/15/2028 | | | 8,322 | | | | 8,360 | |
7.50%, 10/15/2022 to 11/15/2026 | | | 17,128 | | | | 18,018 | |
6.50%, 07/15/2023 to 02/15/2034 | | | 438,534 | | | | 477,268 | |
7.00%, 10/15/2026 to 01/20/2030 | | | 72,440 | | | | 75,751 | |
8.50%, 07/20/2027 | | | 21,392 | | | | 22,292 | |
IO, 6.42% (6.55% – (1.00 x 1 mo. | | | | | | | | |
USD LIBOR)), 04/16/2037(e)(k) | | | 777,978 | | | | 122,531 | |
6.52% (6.65% – (1.00 x 1 mo. | | | | | | | | |
USD LIBOR)), 04/16/2041(e)(k) | | | 1,209,187 | | | | 158,730 | |
4.50%, 09/16/2047(k) | | | 2,024,744 | | | | 309,042 | |
6.07% (6.20% – (1.00 x 1 mo. USD LIBOR)), 10/16/2047(e)(k) | | | 2,022,246 | | | | 333,817 | |
| | | | | | | | 1,525,809 | |
Total U.S. Government Sponsored Agency Mortgage-Backed Securities
(Cost $25,084,979) | | | | 24,397,717 | |
See accompanying Notes to Financial Statements which are an integral part of the financial statements.
| | |
| 21 | | Invesco Short Term Bond Fund |
| | | | | | | | |
| | | Principal
Amount | | | Value | |
|
Agency Credit Risk Transfer Notes-0.33% | |
Fannie Mae Connecticut Avenue Securities,
Series 2016-C02, Class 1M2, 6.19% (1 mo. USD LIBOR + 6.00%), 09/25/2028(e) | | $
| 1,418,742
|
| | $ | 1,470,928 | |
Series 2018-R07, Class 1M2, 2.59% (1 mo. USD LIBOR + 2.40%), 04/25/2031(c)(e) | | | 580,288 | | | | 581,494 | |
Series 2019-R02, Class 1M2, 2.49% (1 mo. USD LIBOR + 2.30%), 08/25/2031(c)(e) | | | 225,153 | | | | 226,006 | |
Series 2019-R03, Class 1M2, 2.34% (1 mo. USD LIBOR + 2.15%), 09/25/2031(c)(e) | | | 221,092 | | | | 221,894 | |
Freddie Mac, Series 2013-DN2, Class M2, STACR® , 4.44% (1 mo. USD LIBOR + 4.25%), 11/25/2023(e) | | | 1,371,497 | | | | 1,403,646 | |
Series 2014-DN1, Class M3, STACR® , 4.69% (1 mo. USD LIBOR + 4.50%), 02/25/2024(e) | | | 822,353 | | | | 843,307 | |
Series 2014-DN3, Class M3, STACR® , 4.19% (1 mo. USD LIBOR + 4.00%), 08/25/2024(e) | | | 605,967 | | | | 612,487 | |
Series 2014-DN4, Class M3, STACR® , 4.74% (1 mo. USD LIBOR + 4.55%), 10/25/2024(e) | | | 87,835 | | | | 89,233 | |
Series 2018-HQA1, Class M2, STACR® , 2.49% (1 mo. USD LIBOR + 2.30%), 09/25/2030(e) | | | 1,168,726 | | | | 1,179,852 | |
Series 2018-DNA2, Class M1, STACR® , 0.99% (1 mo. USD LIBOR + 0.80%), 12/25/2030(c)(e) | | | 236,705 | | | | 236,715 | |
Series 2018-HRP1, Class M2, STACR® , 1.84% (1 mo. USD LIBOR + 1.65%), 04/25/2043(c)(e) | | | 1,224,053 | | | | 1,224,388 | |
Series 2018-HQA2, Class M1, STACR® , 0.94% (1 mo. USD LIBOR + 0.75%), 10/25/2048(c)(e) | | | 364,551 | | | | 364,410 | |
Series 2019-HRP1, Class M2, STACR® , 1.59% (1 mo. USD LIBOR + 1.40%), 02/25/2049(c)(e) | | | 778,938 | | | | 774,658 | |
Total Agency Credit Risk Transfer Notes
(Cost $9,314,988) | | | | | | | 9,229,018 | |
Investment Abbreviations:
| | | | | | | | |
| ARM | | - Adjustable Rate Mortgage |
| CLO | | - Collateralized Loan Obligation |
| COF | | - Cost of Funds |
| Ctfs. | | - Certificates |
| IO | | - Interest Only |
| LIBOR | | - London Interbank Offered Rate |
| Pfd. | | - Preferred |
| PO | | - Principal Only |
| REIT | | - Real Estate Investment Trust |
| REMICs | | - Real Estate Mortgage Investment Conduits |
| SOFR | | - Secured Overnight Financing Rate |
| STACR® | | - Structured Agency Credit Risk |
| STRIPS | | - Separately Traded Registered Interest and Principal Security |
| USD | | - U.S. Dollar |
| | | | | | | | |
| | |
| | | Shares | | | Value | |
|
Preferred Stocks-0.31% | |
Diversified Banks-0.24% | | | | | | | | |
JPMorgan Chase & Co., 3.77% (3 mo. USD LIBOR + 3.47%), Series I, Pfd.(e) | | | 6,974,000 | | | $ | 6,954,290 | |
| | |
Regional Banks-0.07% | | | | | | | | |
PNC Financial Services Group, Inc. (The),
6.13%, Series P, Pfd.(d) | | | 75,000 | | | | 1,890,750 | |
Total Preferred Stocks
(Cost $9,050,745) | | | | | | | 8,845,040 | |
| | |
Money Market Funds-0.65% | | | | | | | | |
Invesco Government & Agency Portfolio, Institutional Class, 0.03%(o)(p) | | | 6,295,561 | | | | 6,295,561 | |
Invesco Liquid Assets Portfolio, Institutional Class, 0.01%(o)(p) | | | 4,723,759 | | | | 4,723,759 | |
Invesco Treasury Portfolio, Institutional Class, 0.01%(o)(p) | | | 7,194,927 | | | | 7,194,927 | |
Total Money Market Funds (Cost $18,214,088) | | | | | | | 18,214,247 | |
TOTAL INVESTMENTS IN SECURITIES
(excluding investments purchased with cash collateral from securities on loan)-99.65%
(Cost $2,846,616,282) | | | | | | | 2,809,975,814 | |
|
Investments Purchased with Cash Collateral from Securities on Loan | |
|
Money Market Funds-4.12% | |
Invesco Private Government Fund, 0.12%(o)(p)(q) | | | 34,080,644 | | | | 34,080,644 | |
Invesco Private Prime Fund,
0.08%(o)(p)(q) | | | 82,094,632 | | | | 82,102,844 | |
Total Investments Purchased with Cash Collateral
from Securities on Loan (Cost $116,187,056) | | | | | | | 116,183,488 | |
TOTAL INVESTMENTS IN SECURITIES-103.77%
(Cost $2,962,803,338) | | | | | | | 2,926,159,302 | |
OTHER ASSETS LESS LIABILITIES-(3.77)% | | | | | | | (106,240,344 | ) |
NET ASSETS-100.00% | | | | | | $ | 2,819,918,958 | |
See accompanying Notes to Financial Statements which are an integral part of the financial statements.
| | |
| 22 | | Invesco Short Term Bond Fund |
Notes to Schedule of Investments:
| (a) | Industry and/or sector classifications used in this report are generally according to the Global Industry Classification Standard, which was developed by and is the exclusive property and a service mark of MSCI Inc. and Standard & Poor’s. |
| (b) | All or a portion of this security was out on loan at February 28, 2022. |
| (c) | Security purchased or received in a transaction exempt from registration under the Securities Act of 1933, as amended (the “1933 Act”). The security may be resold pursuant to an exemption from registration under the 1933 Act, typically to qualified institutional buyers. The aggregate value of these securities at February 28, 2022 was $1,273,009,066, which represented 45.14% of the Fund’s Net Assets. |
| (d) | Security issued at a fixed rate for a specific period of time, after which it will convert to a variable rate. |
| (e) | Interest or dividend rate is redetermined periodically. Rate shown is the rate in effect on February 28, 2022. |
| (f) | Perpetual bond with no specified maturity date. |
| (g) | Step coupon bond. The interest rate represents the coupon rate at which the bond will accrue at a specified future date. |
| (h) | Interest rate is redetermined periodically based on the cash flows generated by the pool of assets backing the security, less any applicable fees. The rate shown is the rate in effect on February 28, 2022. |
| (i) | Interest only security. Principal amount shown is the notional principal and does not reflect the maturity value of the security. Interest rate is redetermined periodically based on the cash flows generated by the pool of assets backing the security, less any applicable fees. The rate shown is the rate in effect on February 28, 2022. |
| (j) | Security valued using significant unobservable inputs (Level 3). See Note 3. |
| (k) | Interest only security. Principal amount shown is the notional principal and does not reflect the maturity value of the security. |
| (l) | All or a portion of the value was pledged as collateral to cover margin requirements for open futures contracts. See Note 1J. |
| (m) | Security traded on a discount basis. The interest rate shown represents the discount rate at the time of purchase by the Fund. |
| (n) | Zero coupon bond issued at a discount. |
| (o) | Affiliated issuer. The issuer and/or the Fund is a wholly-owned subsidiary of Invesco Ltd., or is affiliated by having an investment adviser that is under common control of Invesco Ltd. The table below shows the Fund’s transactions in, and earnings from, its investments in affiliates for the fiscal year ended February 28, 2022. |
| | | | | | | | | | | | | | | | | | | | | | | | | | | | |
| | | Value
February 28, 2021 | | | Purchases at Cost | | | Proceeds from Sales | | | Change in
Unrealized
Appreciation
(Depreciation) | | | Realized
Gain
(Loss) | | | Value
February 28, 2022 | | | Dividend Income | |
Investments in Affiliated Money Market Funds: | | | | | | | | | | | | | | | | | | | | | | | | | |
Invesco Government & Agency Portfolio, Institutional Class | | $ | 52,258,944 | | | $ | 378,486,580 | | | | $ (424,449,963) | | | | $- | | | | $- | | | | $6,295,561 | | | | $7,161 | |
Invesco Liquid Assets Portfolio, Institutional Class | | | 38,508,674 | | | | 269,546,909 | | | | (303,328,981 | ) | | | (4,855) | | | | 2,012 | | | | 4,723,759 | | | | 2,134 | |
Invesco Treasury Portfolio, Institutional Class | | | 59,724,507 | | | | 432,556,091 | | | | (485,085,671 | ) | | | - | | | | - | | | | 7,194,927 | | | | 3,164 | |
| Investments Purchased with Cash Collateral from Securities on Loan: | | | | | | | | | | | | | | | | | | | | | | | | | |
Invesco Private Government Fund | | | 1,957,312 | | | | 462,891,070 | | | | (430,767,738) | | | | - | | | | - | | | | 34,080,644 | | | | 5,729* | |
Invesco Private Prime Fund | | | 2,935,968 | | | | 931,491,835 | | | | (852,298,995) | | | | (3,568) | | | | (22,396) | | | | 82,102,844 | | | | 57,163* | |
Total | | $ | 155,385,405 | | | $ | 2,474,972,485 | | | | $(2,495,931,348) | | | | $(8,423) | | | | $(20,384) | | | | $134,397,735 | | | | $75,351 | |
| | * | Represents the income earned on the investment of cash collateral, which is included in securities lending income on the Statement of Operations. Does not include rebates and fees paid to lending agent or premiums received from borrowers, if any. |
| (p) | The rate shown is the 7-day SEC standardized yield as of February 28, 2022. |
| (q) | The security has been segregated to satisfy the commitment to return the cash collateral received in securities lending transactions upon the borrower’s return of the securities loaned. See Note 1I. |
| | | | | | | | | | | | | | | | | | | | |
Open Futures Contracts | |
| Long Futures Contracts | | Number of Contracts | | | Expiration
Month | | | Notional Value | | | Value | | | Unrealized
Appreciation
(Depreciation) | |
Interest Rate Risk | |
U.S. Treasury 2 Year Notes | | | 4,770 | | | | June-2022 | | | $ | 1,026,630,701 | | | $ | 3,096,865 | | | $ | 3,096,865 | |
|
Short Futures Contracts | |
Interest Rate Risk | |
U.S. Treasury 5 Year Notes | | | 3,822 | | | | June-2022 | | | | (452,070,937 | ) | | | (3,498,965 | ) | | | (3,498,965 | ) |
U.S. Treasury 10 Year Notes | | | 974 | | | | June-2022 | | | | (124,124,125 | ) | | | (555,484 | ) | | | (555,484 | ) |
U.S. Treasury 10 Year Ultra Notes | | | 223 | | | �� | June-2022 | | | | (31,516,172 | ) | | | (402,094 | ) | | | (402,094 | ) |
U.S. Treasury Long Bonds | | | 49 | | | | June-2022 | | | | (7,677,688 | ) | | | (56,575 | ) | | | (56,575 | ) |
Subtotal-Short Futures Contracts | | | | | | | | | | | | | | | (4,513,118 | ) | | | (4,513,118 | ) |
Total Futures Contracts | | | | | | | | | | | | | | $ | (1,416,253 | ) | | $ | (1,416,253 | ) |
See accompanying Notes to Financial Statements which are an integral part of the financial statements.
| | |
| 23 | | Invesco Short Term Bond Fund |
Statement of Assets and Liabilities
February 28, 2022
| | | | | | | | |
Assets: | | | | | |
| |
Investments in unaffiliated securities, at value (Cost $ 2,828,402,194)* | | | $ | 2,791,761,567 | |
Investments in affiliated money market funds, at value (Cost $ 134,401,144) | | | | 134,397,735 | |
Cash | | | | 2,632,486 | |
Receivable for: | | | | | |
Investments sold | | | | 13,554,238 | |
Fund shares sold | | | | 4,207,637 | |
Dividends | | | | 10,802 | |
Interest | | | | 15,442,434 | |
Investment for trustee deferred compensation and retirement plans | | | | 204,252 | |
Other assets | | | | 86,724 | |
Total assets | | | | 2,962,297,875 | |
| |
Liabilities: | | | | | |
Other investments: | | | | | |
Variation margin payable-futures contracts | | | | 2,023,896 | |
Payable for: | | | | | |
Investments purchased | | | | 15,369,270 | |
Dividends | | | | 566,449 | |
Fund shares reacquired | | | | 6,902,897 | |
Collateral upon return of securities loaned | | | | 116,187,056 | |
Accrued fees to affiliates | | | | 830,919 | |
Accrued trustees’ and officers’ fees and benefits | | | | 51,423 | |
Accrued other operating expenses | | | | 219,974 | |
Trustee deferred compensation and retirement plans | | | | 227,033 | |
Total liabilities | | | | 142,378,917 | |
Net assets applicable to shares outstanding | | | $ | 2,819,918,958 | |
| |
Net assets consist of: | | | | | |
Shares of beneficial interest | | | $ | 2,921,717,579 | |
Distributable earnings (loss) | | | | (101,798,621 | ) |
| | | | | | | $ | 2,819,918,958 | |
| | | | |
Net Assets: | | | | |
| |
Class A | | $ | 1,407,707,462 | |
| |
Class C | | $ | 183,817,187 | |
| |
Class R | | $ | 45,537,243 | |
| |
Class Y | | $ | 583,783,906 | |
| |
Class R5 | | $ | 704,538 | |
| |
Class R6 | | $ | 598,368,622 | |
| |
|
Shares outstanding, no par value, with an unlimited number of shares authorized: | |
| |
Class A | | | 168,110,531 | |
| |
Class C | | | 21,948,293 | |
| |
Class R | | | 5,424,973 | |
| |
Class Y | | | 69,676,969 | |
| |
Class R5 | | | 84,286 | |
| |
Class R6 | | | 71,382,199 | |
| |
Class A: | | | | |
Net asset value per share | | $ | 8.37 | |
| |
Maximum offering price per share (Net asset value of $8.37 ÷ 97.50%) | | $ | 8.58 | |
| |
Class C: | | | | |
Net asset value and offering price per share | | $ | 8.38 | |
| |
| |
Class R: | | | | |
Net asset value and offering price per share | | $ | 8.39 | |
| |
Class Y: | | | | |
Net asset value and offering price per share | | $ | 8.38 | |
| |
Class R5: | | | | |
Net asset value and offering price per share | | $ | 8.36 | |
| |
Class R6: | | | | |
Net asset value and offering price per share | | $ | 8.38 | |
| |
| * | At February 28, 2022, securities with an aggregate value of $113,831,525 were on loan to brokers. |
See accompanying Notes to Financial Statements which are an integral part of the financial statements.
| | |
| 24 | | Invesco Short Term Bond Fund |
Statement of Operations
For the year ended February 28, 2022
| | | | |
Investment income: | | | | |
| |
Interest (net of foreign withholding taxes of $3,112) | | $ | 64,204,655 | |
| |
Dividends | | | 114,844 | |
| |
Dividends from affiliated money market funds (includes securities lending income of $93,382) | | | 105,841 | |
| |
Total investment income | | | 64,425,340 | |
| |
| |
Expenses: | | | | |
Advisory fees | | | 9,469,177 | |
| |
Administrative services fees | | | 433,323 | |
| |
Custodian fees | | | 53,290 | |
| |
Distribution fees: | | | | |
Class A | | | 2,228,753 | |
| |
Class C | | | 1,435,053 | |
| |
Class R | | | 243,448 | |
| |
Transfer agent fees – A, C, R and Y | | | 2,817,982 | |
| |
Transfer agent fees – R5 | | | 339 | |
| |
Transfer agent fees – R6 | | | 135,476 | |
| |
Trustees’ and officers’ fees and benefits | | | 68,537 | |
| |
Registration and filing fees | | | 215,811 | |
| |
Reports to shareholders | | | 186,170 | |
| |
Professional services fees | | | 121,573 | |
| |
Other | | | 50,902 | |
| |
Total expenses | | | 17,459,834 | |
| |
Less: Fees waived, expenses reimbursed and/or expense offset arrangement(s) | | | (368,930 | ) |
| |
Net expenses | | | 17,090,904 | |
| |
Net investment income | | | 47,334,436 | |
| |
| |
Realized and unrealized gain (loss) from: | | | | |
Net realized gain (loss) from: | | | | |
Unaffiliated investment securities | | | (4,698,312 | ) |
| |
Affiliated investment securities | | | (20,384 | ) |
| |
Futures contracts | | | 6,040,772 | |
| |
| | | 1,322,076 | |
| |
Change in net unrealized appreciation (depreciation) of: | | | | |
Unaffiliated investment securities | | | (102,945,771 | ) |
| |
Affiliated investment securities | | | (8,423 | ) |
| |
Futures contracts | | | (7,105,202 | ) |
| |
| | | (110,059,396 | ) |
| |
Net realized and unrealized gain (loss) | | | (108,737,320 | ) |
| |
Net increase (decrease) in net assets resulting from operations | | $ | (61,402,884 | ) |
| |
See accompanying Notes to Financial Statements which are an integral part of the financial statements.
| | |
| 25 | �� | Invesco Short Term Bond Fund |
Statement of Changes in Net Assets
For the years ended February 28, 2022 and 2021
| | | | | | | | |
| | | 2022 | | | 2021 | |
| |
| | |
Operations: | | | | | | | | |
Net investment income | | $ | 47,334,436 | | | $ | 51,596,050 | |
| |
Net realized gain | | | 1,322,076 | | | | 1,333,671 | |
| |
Change in net unrealized appreciation (depreciation) | | | (110,059,396 | ) | | | 48,599,828 | |
| |
Net increase (decrease) in net assets resulting from operations | | | (61,402,884 | ) | | | 101,529,549 | |
| |
| | |
Distributions to shareholders from distributable earnings: | | | | | | | | |
Class A | | | (21,025,505 | ) | | | (25,359,066 | ) |
| |
Class C | | | (2,395,084 | ) | | | (3,762,523 | ) |
| |
Class R | | | (514,728 | ) | | | (620,089 | ) |
| |
Class Y | | | (9,796,714 | ) | | | (10,686,786 | ) |
| |
Class R5 | | | (9,131 | ) | | | (12,423 | ) |
| |
Class R6 | | | (10,914,927 | ) | | | (15,233,317 | ) |
| |
Total distributions from distributable earnings | | | (44,656,089 | ) | | | (55,674,204 | ) |
| |
| | |
Share transactions-net: | | | | | | | | |
Class A | | | (67,886,583 | ) | | | 847,839,447 | |
| |
Class C | | | (45,892,566 | ) | | | 74,797,503 | |
| |
Class R | | | (3,226,692 | ) | | | 43,002,288 | |
| |
Class Y | | | (23,708,763 | ) | | | 469,541,828 | |
| |
Class R5 | | | 202,520 | | | | 25,151 | |
| |
Class R6 | | | (24,343,162 | ) | | | (2,255,738 | ) |
| |
Net increase (decrease) in net assets resulting from share transactions | | | (164,855,246 | ) | | | 1,432,950,479 | |
| |
Net increase (decrease) in net assets | | | (270,914,219 | ) | | | 1,478,805,824 | |
| |
| | |
Net assets: | | | | | | | | |
Beginning of year | | | 3,090,833,177 | | | | 1,612,027,353 | |
| |
End of year | | $ | 2,819,918,958 | | | $ | 3,090,833,177 | |
| |
See accompanying Notes to Financial Statements which are an integral part of the financial statements.
| | |
| 26 | | Invesco Short Term Bond Fund |
Financial Highlights
The following schedule presents financial highlights for a share of the Fund outstanding throughout the periods indicated.
| | | | | | | | | | | | | | | | | | | | | | | | | | | | | | | | | | | | | | | | | | | | | | | | | | | | | | | | | | | | | | | | | | | | | | |
| | | Net asset value, beginning of period | | Net investment income(a) | | Net gains (losses) on securities (both realized and unrealized) | | Total from investment operations | | Dividends from net investment income | | Return of capital | | Total
distributions | | Net asset value, end of period | | Total return (b) | | Net assets, end of period (000’s omitted) | | Ratio of expenses to average net assets with fee waivers and/or expenses absorbed | | Ratio of expenses to average net assets without fee waivers and/or expenses absorbed | | Ratio of net investment income to average net assets | | Portfolio turnover (c) |
Class A | | | | | | | | | | | | | | | | | | | | | | | | | | | | | | | | | | | | | | | | | | | | | | | | | | | | | | | | | | | | | | | | | | | | | | |
Year ended 02/28/22 | | | $ | 8.68 | | | | $ | 0.13 | | | | $ | (0.32 | ) | | | $ | (0.19 | ) | | | $ | (0.12 | ) | | | $ | – | | | | $ | (0.12 | ) | | | $ | 8.37 | | | | | (2.20 | )% | | | $ | 1,407,707 | | | | | 0.62 | % | | | | 0.62 | % | | | | 1.49 | % | | | | 141 | % |
Year ended 02/28/21 | | | | 8.66 | | | | | 0.16 | | | | | 0.04 | | | | | 0.20 | | | | | (0.18 | ) | | | | – | | | | | (0.18 | ) | | | | 8.68 | | | | | 2.33 | | | | | 1,527,875 | | | | | 0.63 | | | | | 0.63 | | | | | 1.85 | | | | | 245 | |
Year ended 02/29/20 | | | | 8.47 | | | | | 0.23 | | | | | 0.20 | | | | | 0.43 | | | | | (0.23 | ) | | | | (0.01 | ) | | | | (0.24 | ) | | | | 8.66 | | | | | 5.08 | | | | | 655,357 | | | | | 0.65 | | | | | 0.65 | | | | | 2.62 | | | | | 155 | |
Year ended 02/28/19 | | | | 8.51 | | | | | 0.21 | | | | | (0.03 | ) | | | | 0.18 | | | | | (0.22 | ) | | | | – | | | | | (0.22 | ) | | | | 8.47 | | | | | 2.19 | | | | | 591,443 | | | | | 0.64 | | | | | 0.65 | | | | | 2.52 | | | | | 176 | |
Year ended 02/28/18 | | | | 8.61 | | | | | 0.17 | | | | | (0.10 | ) | | | | 0.07 | | | | | (0.17 | ) | | | | – | | | | | (0.17 | ) | | | | 8.51 | | | | | 0.79 | | | | | 395,766 | | | | | 0.65 | | | | | 0.66 | | | | | 1.98 | | | | | 198 | |
Class C | | | | | | | | | | | | | | | | | | | | | | | | | | | | | | | | | | | | | | | | | | | | | | | | | | | | | | | | | | | | | | | | | | | | | | |
Year ended 02/28/22 | | | | 8.68 | | | | | 0.10 | | | | | (0.31 | ) | | | | (0.21 | ) | | | | (0.09 | ) | | | | – | | | | | (0.09 | ) | | | | 8.38 | | | | | (2.41 | ) | | | | 183,817 | | | | | 0.97 | | | | | 1.12 | | | | | 1.14 | | | | | 141 | |
Year ended 02/28/21 | | | | 8.66 | | | | | 0.13 | | | | | 0.03 | | | | | 0.16 | | | | | (0.14 | ) | | | | – | | | | | (0.14 | ) | | | | 8.68 | | | | | 1.93 | | | | | 237,167 | | | | | 0.98 | | | | | 0.98 | | | | | 1.50 | | | | | 245 | |
Year ended 02/29/20 | | | | 8.47 | | | | | 0.19 | | | | | 0.21 | | | | | 0.40 | | | | | (0.20 | ) | | | | (0.01 | ) | | | | (0.21 | ) | | | | 8.66 | | | | | 4.71 | | | | | 158,968 | | | | | 1.00 | | | | | 1.15 | | | | | 2.27 | | | | | 155 | |
Year ended 02/28/19 | | | | 8.51 | | | | | 0.18 | | | | | (0.03 | ) | | | | 0.15 | | | | | (0.19 | ) | | | | – | | | | | (0.19 | ) | | | | 8.47 | | | | | 1.83 | | | | | 140,247 | | | | | 0.99 | | | | | 1.15 | | | | | 2.17 | | | | | 176 | |
Year ended 02/28/18 | | | | 8.61 | | | | | 0.14 | | | | | (0.10 | ) | | | | 0.04 | | | | | (0.14 | ) | | | | – | | | | | (0.14 | ) | | | | 8.51 | | | | | 0.44 | | | | | 391,791 | | | | | 1.00 | | | | | 1.16 | | | | | 1.63 | | | | | 198 | |
Class R | | | | | | | | | | | | | | | | | | | | | | | | | | | | | | | | | | | | | | | | | | | | | | | | | | | | | | | | | | | | | | | | | | | | | | |
Year ended 02/28/22 | | | | 8.70 | | | | | 0.10 | | | | | (0.32 | ) | | | | (0.22 | ) | | | | (0.09 | ) | | | | – | | | | | (0.09 | ) | | | | 8.39 | | | | | (2.54 | ) | | | | 45,537 | | | | | 0.97 | | | | | 0.97 | | | | | 1.14 | | | | | 141 | |
Year ended 02/28/21 | | | | 8.68 | | | | | 0.13 | | | | | 0.04 | | | | | 0.17 | | | | | (0.15 | ) | | | | – | | | | | (0.15 | ) | | | | 8.70 | | | | | 1.98 | | | | | 50,473 | | | | | 0.98 | | | | | 0.98 | | | | | 1.50 | | | | | 245 | |
Year ended 02/29/20 | | | | 8.49 | | | | | 0.20 | | | | | 0.20 | | | | | 0.40 | | | | | (0.20 | ) | | | | (0.01 | ) | | | | (0.21 | ) | | | | 8.68 | | | | | 4.70 | | | | | 6,210 | | | | | 1.00 | | | | | 1.00 | | | | | 2.27 | | | | | 155 | |
Year ended 02/28/19 | | | | 8.53 | | | | | 0.18 | | | | | (0.03 | ) | | | | 0.15 | | | | | (0.19 | ) | | | | – | | | | | (0.19 | ) | | | | 8.49 | | | | | 1.84 | | | | | 5,035 | | | | | 0.99 | | | | | 1.00 | | | | | 2.17 | | | | | 176 | |
Year ended 02/28/18 | | | | 8.62 | | | | | 0.14 | | | | | (0.09 | ) | | | | 0.05 | | | | | (0.14 | ) | | | | – | | | | | (0.14 | ) | | | | 8.53 | | | | | 0.55 | | | | | 4,693 | | | | | 1.00 | | | | | 1.01 | | | | | 1.63 | | | | | 198 | |
Class Y | | | | | | | | | | | | | | | | | | | | | | | | | | | | | | | | | | | | | | | | | | | | | | | | | | | | | | | | | | | | | | | | | | | | | | |
Year ended 02/28/22 | | | | 8.68 | | | | | 0.14 | | | | | (0.31 | ) | | | | (0.17 | ) | | | | (0.13 | ) | | | | – | | | | | (0.13 | ) | | | | 8.38 | | | | | (1.94 | ) | | | | 583,784 | | | | | 0.47 | | | | | 0.47 | | | | | 1.64 | | | | | 141 | |
Year ended 02/28/21 | | | | 8.66 | | | | | 0.17 | | | | | 0.04 | | | | | 0.21 | | | | | (0.19 | ) | | | | – | | | | | (0.19 | ) | | | | 8.68 | | | | | 2.50 | | | | | 629,462 | | | | | 0.45 | | | | | 0.48 | | | | | 2.03 | | | | | 245 | |
Year ended 02/29/20 | | | | 8.48 | | | | | 0.24 | | | | | 0.19 | | | | | 0.43 | | | | | (0.24 | ) | | | | (0.01 | ) | | | | (0.25 | ) | | | | 8.66 | | | | | 5.11 | | | | | 146,159 | | | | | 0.50 | | | | | 0.50 | | | | | 2.77 | | | | | 155 | |
Year ended 02/28/19 | | | | 8.52 | | | | | 0.23 | | | | | (0.03 | ) | | | | 0.20 | | | | | (0.24 | ) | | | | – | | | | | (0.24 | ) | | | | 8.48 | | | | | 2.35 | | | | | 134,272 | | | | | 0.49 | | | | | 0.50 | | | | | 2.67 | | | | | 176 | |
Year ended 02/28/18 | | | | 8.61 | | | | | 0.18 | | | | | (0.09 | ) | | | | 0.09 | | | | | (0.18 | ) | | | | – | | | | | (0.18 | ) | | | | 8.52 | | | | | 1.06 | | | | | 128,874 | | | | | 0.50 | | | | | 0.51 | | | | | 2.13 | | | | | 198 | |
Class R5 | | | | | | | | | | | | | | | | | | | | | | | | | | | | | | | | | | | | | | | | | | | | | | | | | | | | | | | | | | | | | | | | | | | | | | |
Year ended 02/28/22 | | | | 8.66 | | | | | 0.15 | | | | | (0.31 | ) | | | | (0.16 | ) | | | | (0.14 | ) | | | | – | | | | | (0.14 | ) | | | | 8.36 | | | | | (1.89 | ) | | | | 705 | | | | | 0.41 | | | | | 0.41 | | | | | 1.70 | | | | | 141 | |
Year ended 02/28/21 | | | | 8.65 | | | | | 0.18 | | | | | 0.03 | | | | | 0.21 | | | | | (0.20 | ) | | | | – | | | | | (0.20 | ) | | | | 8.66 | | | | | 2.48 | | | | | 524 | | | | | 0.38 | | | | | 0.38 | | | | | 2.10 | | | | | 245 | |
Year ended 02/29/20 | | | | 8.47 | | | | | 0.25 | | | | | 0.18 | | | | | 0.43 | | | | | (0.24 | ) | | | | (0.01 | ) | | | | (0.25 | ) | | | | 8.65 | | | | | 5.20 | | | | | 496 | | | | | 0.40 | | | | | 0.40 | | | | | 2.87 | | | | | 155 | |
Year ended 02/28/19 | | | | 8.51 | | | | | 0.23 | | | | | (0.03 | ) | | | | 0.20 | | | | | (0.24 | ) | | | | – | | | | | (0.24 | ) | | | | 8.47 | | | | | 2.45 | | | | | 1,765 | | | | | 0.39 | | | | | 0.40 | | | | | 2.77 | | | | | 176 | |
Year ended 02/28/18 | | | | 8.60 | | | | | 0.19 | | | | | (0.09 | ) | | | | 0.10 | | | | | (0.19 | ) | | | | – | | | | | (0.19 | ) | | | | 8.51 | | | | | 1.17 | | | | | 1,699 | | | | | 0.38 | | | | | 0.39 | | | | | 2.25 | | | | | 198 | |
Class R6 | | | | | | | | | | | | | | | | | | | | | | | | | | | | | | | | | | | | | | | | | | | | | | | | | | | | | | | | | | | | | | | | | | | | | | |
Year ended 02/28/22 | | | | 8.69 | | | | | 0.15 | | | | | (0.32 | ) | | | | (0.17 | ) | | | | (0.14 | ) | | | | – | | | | | (0.14 | ) | | | | 8.38 | | | | | (1.95 | ) | | | | 598,369 | | | | | 0.37 | | | | | 0.37 | | | | | 1.74 | | | | | 141 | |
Year ended 02/28/21 | | | | 8.67 | | | | | 0.18 | | | | | 0.04 | | | | | 0.22 | | | | | (0.20 | ) | | | | – | | | | | (0.20 | ) | | | | 8.69 | | | | | 2.62 | | | | | 645,331 | | | | | 0.35 | | | | | 0.35 | | | | | 2.13 | | | | | 245 | |
Year ended 02/29/20 | | | | 8.49 | | | | | 0.25 | | | | | 0.19 | | | | | 0.44 | | | | | (0.25 | ) | | | | (0.01 | ) | | | | (0.26 | ) | | | | 8.67 | | | | | 5.23 | | | | | 644,838 | | | | | 0.37 | | | | | 0.37 | | | | | 2.90 | | | | | 155 | |
Year ended 02/28/19 | | | | 8.53 | | | | | 0.24 | | | | | (0.03 | ) | | | | 0.21 | | | | | (0.25 | ) | | | | – | | | | | (0.25 | ) | | | | 8.49 | | | | | 2.46 | | | | | 564,219 | | | | | 0.38 | | | | | 0.39 | | | | | 2.78 | | | | | 176 | |
Year ended 02/28/18 | | | | 8.62 | | | | | 0.19 | | | | | (0.09 | ) | | | | 0.10 | | | | | (0.19 | ) | | | | – | | | | | (0.19 | ) | | | | 8.53 | | | | | 1.17 | | | | | 575,750 | | | | | 0.38 | | | | | 0.39 | | | | | 2.25 | | | | | 198 | |
| (a) | Calculated using average shares outstanding. |
| (b) | Includes adjustments in accordance with accounting principles generally accepted in the United States of America and as such, the net asset value for financial reporting purposes and the returns based upon those net asset values may differ from the net asset value and returns for shareholder transactions. Does not include sales charges and is not annualized for periods less than one year, if applicable. |
| (c) | Portfolio turnover is calculated at the fund level and is not annualized for periods less than one year, if applicable. For the year ended February 28, 2021, the portfolio turnover calculation excludes the value of securities purchased of $1,288,591,313 in connection with the acquisition of Invesco Oppenheimer Limited-Term Bond Fund into the Fund. |
See accompanying Notes to Financial Statements which are an integral part of the financial statements.
| | |
| 27 | | Invesco Short Term Bond Fund |
Notes to Financial Statements
February 28, 2022
NOTE 1–Significant Accounting Policies
Invesco Short Term Bond Fund (the “Fund”), is a series portfolio of AIM Investment Securities Funds (Invesco Investment Securities Funds) (the “Trust”). The Trust is organized as a Delaware statutory trust and is registered under the Investment Company Act of 1940, as amended (the “1940 Act”), as an open-end series management investment company authorized to issue an unlimited number of shares of beneficial interest. Information presented in these financial statements pertains only to the Fund. Matters affecting the Fund or each class will be voted on exclusively by the shareholders of the Fund or each class.
The Fund’s investment objective is total return, comprised of current income and capital appreciation.
The Fund currently consists of six different classes of shares: Class A, Class C, Class R, Class Y, Class R5 and Class R6. Class Y shares are available only to certain investors. Class A shares are sold with a front-end sales charge unless certain waiver criteria are met. Under certain circumstances, load waived shares may be subject to contingent deferred sales charges (“CDSC”). Class C shares are sold with a CDSC. Class R, Class Y, Class R5 and Class R6 shares are sold at net asset value. Class C shares held for eight years after purchase are eligible for automatic conversion into Class A shares of the same Fund (the “Conversion Feature”). The automatic conversion pursuant to the Conversion Feature will generally occur at the end of the month following the eighth anniversary after a purchase of Class C shares.
The Fund is an investment company and accordingly follows the investment company accounting and reporting guidance in accordance with Financial Accounting Standards Board Accounting Standards Codification Topic 946, Financial Services – Investment Companies.
The following is a summary of the significant accounting policies followed by the Fund in the preparation of its financial statements.
| A. | Security Valuations – Securities, including restricted securities, are valued according to the following policy. |
Debt obligations (including convertible securities) and unlisted equities are fair valued using an evaluated quote provided by an independent pricing service. Evaluated quotes provided by the pricing service may be determined without exclusive reliance on quoted prices, and may reflect appropriate factors such as institution-size trading in similar groups of securities, developments related to specific securities, dividend rate (for unlisted equities), yield (for debt obligations), quality, type of issue, coupon rate (for debt obligations), maturity (for debt obligations), individual trading characteristics and other market data. Pricing services generally value debt obligations assuming orderly transactions of institutional round lot size, but a fund may hold or transact in the same securities in smaller, odd lot sizes. Odd lots often trade at lower prices than institutional round lots. Debt obligations are subject to interest rate and credit risks. In addition, all debt obligations involve some risk of default with respect to interest and/or principal payments.
A security listed or traded on an exchange (except convertible securities) is valued at its last sales price or official closing price as of the close of the customary trading session on the exchange where the security is principally traded, or lacking any sales or official closing price on a particular day, the security may be valued at the closing bid price on that day. Securities traded in the over-the-counter market are valued based on prices furnished by independent pricing services or market makers. When such securities are valued by an independent pricing service they may be considered fair valued. Futures contracts are valued at the final settlement price set by an exchange on which they are principally traded. Listed options are valued at the mean between the last bid and asked prices from the exchange on which they are principally traded. Options not listed on an exchange are valued by an independent source at the mean between the last bid and asked prices. For purposes of determining net asset value (“NAV”) per share, futures and option contracts generally are valued 15 minutes after the close of the customary trading session of the New York Stock Exchange (“NYSE”).
Investments in open-end and closed-end registered investment companies that do not trade on an exchange are valued at the end-of-day net asset value per share. Investments in open-end and closed-end registered investment companies that trade on an exchange are valued at the last sales price or official closing price as of the close of the customary trading session on the exchange where the security is principally traded.
Foreign securities’ (including foreign exchange contracts) prices are converted into U.S. dollar amounts using the applicable exchange rates as of the close of the NYSE. If market quotations are available and reliable for foreign exchange-traded equity securities, the securities will be valued at the market quotations. Because trading hours for certain foreign securities end before the close of the NYSE, closing market quotations may become unreliable. If between the time trading ends on a particular security and the close of the customary trading session on the NYSE, events occur that the investment adviser determines are significant and make the closing price unreliable, the Fund may fair value the security. If the event is likely to have affected the closing price of the security, the security will be valued at fair value in good faith using procedures approved by the Board of Trustees. Adjustments to closing prices to reflect fair value may also be based on a screening process of an independent pricing service to indicate the degree of certainty, based on historical data, that the closing price in the principal market where a foreign security trades is not the current value as of the close of the NYSE. Foreign securities’ prices meeting the approved degree of certainty that the price is not reflective of current value will be priced at the indication of fair value from the independent pricing service. Multiple factors may be considered by the independent pricing service in determining adjustments to reflect fair value and may include information relating to sector indices, American Depositary Receipts and domestic and foreign index futures. Foreign securities may have additional risks including exchange rate changes, potential for sharply devalued currencies and high inflation, political and economic upheaval, the relative lack of issuer information, relatively low market liquidity and the potential lack of strict financial and accounting controls and standards.
Securities for which market prices are not provided by any of the above methods may be valued based upon quotes furnished by independent sources. The last bid price may be used to value equity securities. The mean between the last bid and asked prices is used to value debt obligations, including corporate loans.
Securities for which market quotations are not readily available or became unreliable are valued at fair value as determined in good faith by or under the supervision of the Trust’s officers following procedures approved by the Board of Trustees. Issuer specific events, market trends, bid/asked quotes of brokers and information providers and other market data may be reviewed in the course of making a good faith determination of a security’s fair value.
The Fund may invest in securities that are subject to interest rate risk, meaning the risk that the prices will generally fall as interest rates rise and, conversely, the prices will generally rise as interest rates fall. Specific securities differ in their sensitivity to changes in interest rates depending on their individual characteristics. Changes in interest rates may result in increased market volatility, which may affect the value and/or liquidity of certain Fund investments.
Valuations change in response to many factors including the historical and prospective earnings of the issuer, the value of the issuer’s assets, general market conditions which are not specifically related to the particular issuer, such as real or perceived adverse economic conditions, changes in the general outlook for revenues or corporate earnings, changes in interest or currency rates, regional or global instability, natural or environmental disasters, widespread disease or other public health issues, war, acts of terrorism or adverse investor sentiment generally and market liquidity. Because of the inherent uncertainties of valuation, the values reflected in the financial statements may materially differ from the value received upon actual sale of those investments.
| B. | Securities Transactions and Investment Income – Securities transactions are accounted for on a trade date basis. Realized gains or losses on sales are computed on the basis of specific identification of the securities sold. Interest income (net of withholding tax, if any) is recorded on an accrual basis from settlement date and includes coupon interest and amortization of premium and accretion of discount on debt securities as applicable. Pay-in-kind interest income and non-cash dividend income received in the form of securities in-lieu of cash are recorded at the fair value of the securities received. Paydown gains and losses on mortgage and asset-backed securities are recorded as adjustments to interest income. Dividend income (net of withholding tax, if any) is recorded on the ex-dividend date. |
The Fund may periodically participate in litigation related to Fund investments. As such, the Fund may receive proceeds from litigation settlements. Any proceeds received are included in the Statement of Operations as realized gain (loss) for investments no longer held and as unrealized gain (loss) for investments still held.
| | |
| 28 | | Invesco Short Term Bond Fund |
Brokerage commissions and mark ups are considered transaction costs and are recorded as an increase to the cost basis of securities purchased and/or a reduction of proceeds on a sale of securities. Such transaction costs are included in the determination of net realized and unrealized gain (loss) from investment securities reported in the Statement of Operations and the Statement of Changes in Net Assets and the net realized and unrealized gains (losses) on securities per share in the Financial Highlights. Transaction costs are included in the calculation of the Fund’s net asset value and, accordingly, they reduce the Fund’s total returns. These transaction costs are not considered operating expenses and are not reflected in net investment income reported in the Statement of Operations and the Statement of Changes in Net Assets, or the net investment income per share and the ratios of expenses and net investment income reported in the Financial Highlights, nor are they limited by any expense limitation arrangements between the Fund and the investment adviser.
The Fund allocates realized and unrealized capital gains and losses to a class based on the relative net assets of each class. The Fund allocates income to a class based on the relative value of the settled shares of each class.
| C. | Country Determination – For the purposes of making investment selection decisions and presentation in the Schedule of Investments, the investment adviser may determine the country in which an issuer is located and/or credit risk exposure based on various factors. These factors include the laws of the country under which the issuer is organized, where the issuer maintains a principal office, the country in which the issuer derives 50% or more of its total revenues and the country that has the primary market for the issuer’s securities, as well as other criteria. Among the other criteria that may be evaluated for making this determination are the country in which the issuer maintains 50% or more of its assets, the type of security, financial guarantees and enhancements, the nature of the collateral and the sponsor organization. Country of issuer and/or credit risk exposure has been determined to be the United States of America, unless otherwise noted. |
| D. | Distributions – Distributions from net investment income, if any, are declared daily and paid monthly. Distributions from net realized capital gain, if any, are generally declared and paid annually and recorded on the ex-dividend date. The Fund may elect to treat a portion of the proceeds from redemptions as distributions for federal income tax purposes. |
| E. | Federal Income Taxes – The Fund intends to comply with the requirements of Subchapter M of the Internal Revenue Code of 1986, as amended (the “Internal Revenue Code”), necessary to qualify as a regulated investment company and to distribute substantially all of the Fund’s taxable earnings to shareholders. As such, the Fund will not be subject to federal income taxes on otherwise taxable income (including net realized capital gain) that is distributed to shareholders. Therefore, no provision for federal income taxes is recorded in the financial statements. |
The Fund recognizes the tax benefits of uncertain tax positions only when the position is more likely than not to be sustained. Management has analyzed the Fund’s uncertain tax positions and concluded that no liability for unrecognized tax benefits should be recorded related to uncertain tax positions. Management is not aware of any tax positions for which it is reasonably possible that the total amounts of unrecognized tax benefits will change materially in the next 12 months.
The Fund files tax returns in the U.S. Federal jurisdiction and certain other jurisdictions. Generally, the Fund is subject to examinations by such taxing authorities for up to three years after the filing of the return for the tax period.
| F. | Expenses – Fees provided for under the Rule 12b-1 plan of a particular class of the Fund are charged to the operations of such class. Transfer agency fees and expenses and other shareholder recordkeeping fees and expenses attributable to Class R5 and Class R6 are allocated based on relative net assets of Class R5 and Class R6. Sub-accounting fees attributable to Class R5 are charged to the operations of the class. Transfer agency fees and expenses and other shareholder recordkeeping fees and expenses relating to all other classes are allocated among those classes based on relative net assets. All other expenses are allocated among the classes based on relative net assets. |
| G. | Accounting Estimates – The preparation of financial statements in conformity with accounting principles generally accepted in the United States of America (“GAAP”) requires management to make estimates and assumptions that affect the reported amounts of assets and liabilities at the date of the financial statements and the reported amounts of revenues and expenses during the reporting period including estimates and assumptions related to taxation. Actual results could differ from those estimates by a significant amount. In addition, the Fund monitors for material events or transactions that may occur or become known after the period-end date and before the date the financial statements are released to print. |
| H. | Indemnifications – Under the Trust’s organizational documents, each Trustee, officer, employee or other agent of the Trust is indemnified against certain liabilities that may arise out of the performance of their duties to the Fund. Additionally, in the normal course of business, the Fund enters into contracts, including the Fund’s servicing agreements, that contain a variety of indemnification clauses. The Fund’s maximum exposure under these arrangements is unknown as this would involve future claims that may be made against the Fund that have not yet occurred. The risk of material loss as a result of such indemnification claims is considered remote. |
| I. | Securities Lending – The Fund may lend portfolio securities having a market value up to one-third of the Fund’s total assets. Such loans are secured by collateral equal to no less than the market value of the loaned securities determined daily by the securities lending provider. Such collateral will be cash or debt securities issued or guaranteed by the U.S. Government or any of its sponsored agencies. Cash collateral received in connection with these loans is invested in short-term money market instruments or affiliated, unregistered investment companies that comply with Rule 2a-7 under the 1940 Act and money market funds (collectively, “affiliated money market funds”) and is shown as such on the Schedule of Investments. The Fund bears the risk of loss with respect to the investment of collateral. It is the Fund’s policy to obtain additional collateral from or return excess collateral to the borrower by the end of the next business day, following the valuation date of the securities loaned. Therefore, the value of the collateral held may be temporarily less than the value of the securities on loan. When loaning securities, the Fund retains certain benefits of owning the securities, including the economic equivalent of dividends or interest generated by the security. Lending securities entails a risk of loss to the Fund if, and to the extent that, the market value of the securities loaned were to increase and the borrower did not increase the collateral accordingly, and the borrower failed to return the securities. The securities loaned are subject to termination at the option of the borrower or the Fund. Upon termination, the borrower will return to the Fund the securities loaned and the Fund will return the collateral. Upon the failure of the borrower to return the securities, collateral may be liquidated and the securities may be purchased on the open market to replace the loaned securities. The Fund could experience delays and costs in gaining access to the collateral and the securities may lose value during the delay which could result in potential losses to the Fund. Some of these losses may be indemnified by the lending agent. The Fund bears the risk of any deficiency in the amount of the collateral available for return to the borrower due to any loss on the collateral invested. Dividends received on cash collateral investments for securities lending transactions, which are net of compensation to counterparties, are included in Dividends from affiliated money market funds on the Statement of Operations. The aggregate value of securities out on loan, if any, is shown as a footnote on the Statement of Assets and Liabilities. |
On September 29, 2021, the Board of Trustees appointed Invesco Advisers, Inc. (the “Adviser” or “Invesco”) to serve as an affiliated securities lending agent for the Fund. Prior to September 29, 2021, the Bank of New York Mellon (“BNYM”) served as the sole securities lending agent for the Fund under the securities lending program. BNYM also continues to serve as a lending agent. To the extent the Fund utilizes the Adviser as an affiliated securities lending agent, the Fund conducts its securities lending in accordance with, and in reliance upon, no-action letters issued by the SEC staff that provide guidance on how an affiliate may act as a direct agent lender and receive compensation for those services in a manner consistent with the federal securities laws. For the year ended February 28, 2022, there were no securities lending transactions with the Adviser.
| J. | Futures Contracts - The Fund may enter into futures contracts to manage exposure to interest rate, equity and market price movements and/or currency risks. A futures contract is an agreement between two parties (“Counterparties”) to purchase or sell a specified underlying security, currency or commodity (or delivery of a cash settlement price, in the case of an index future) for a fixed price at a future date. The Fund currently invests only in exchange-traded futures and they are standardized as to maturity date and underlying financial instrument. Initial margin deposits required upon entering into futures contracts are satisfied by the segregation of specific securities or cash as collateral at the futures commission merchant (broker). During the period the futures contracts are open, changes in the value of the contracts are recognized as unrealized gains or losses by recalculating the value of the contracts on a daily basis. Subsequent or |
| | |
| 29 | | Invesco Short Term Bond Fund |
| | variation margin payments are received or made depending upon whether unrealized gains or losses are incurred. These amounts are reflected as receivables or payables on the Statement of Assets and Liabilities. When the contracts are closed or expire, the Fund recognizes a realized gain or loss equal to the difference between the proceeds from, or cost of, the closing transaction and the Fund’s basis in the contract. The net realized gain (loss) and the change in unrealized gain (loss) on futures contracts held during the period is included on the Statement of Operations. The primary risks associated with futures contracts are market risk and the absence of a liquid secondary market. If the Fund were unable to liquidate a futures contract and/or enter into an offsetting closing transaction, the Fund would continue to be subject to market risk with respect to the value of the contracts and continue to be required to maintain the margin deposits on the futures contracts. Futures contracts have minimal Counterparty risk since the exchange’s clearinghouse, as Counterparty to all exchange-traded futures, guarantees the futures against default. Risks may exceed amounts recognized in the Statement of Assets and Liabilities. |
| K. | LIBOR Risk - The Fund may have investments in financial instruments that utilize the London Interbank Offered Rate (“LIBOR”) as the reference or benchmark rate for variable interest rate calculations. LIBOR is intended to measure the rate generally at which banks can lend and borrow from one another in the relevant currency on an unsecured basis. The UK Financial Conduct Authority (FCA), the regulator that oversees LIBOR, announced that the majority of LIBOR rates would cease to be published or would no longer be representative on January 1, 2022. Although the publication of most LIBOR rates ceased at the end of 2021, a selection of widely used USD LIBOR rates continues to be published until June 2023 to allow for an orderly transition away from these rates. |
There remains uncertainty and risks relating to the continuing LIBOR transition and its effects on the Fund and the instruments in which the Fund invests. There can be no assurance that the composition or characteristics of any alternative reference rates (“ARRs”) or financial instruments in which the Fund invests that utilize ARRs will be similar to or produce the same value or economic equivalence as LIBOR or that these instruments will have the same volume or liquidity. Additionally, there remains uncertainty and risks relating to certain “legacy” USD LIBOR instruments that were issued or entered into before December 31, 2021 and the process by which a replacement interest rate will be identified and implemented into these instruments when USD LIBOR is ultimately discontinued. The effects of such uncertainty and risks in “legacy” USD LIBOR instruments held by the Fund could result in losses to the Fund.
| L. | Collateral - To the extent the Fund has designated or segregated a security as collateral and that security is subsequently sold, it is the Fund’s practice to replace such collateral no later than the next business day. This practice does not apply to securities pledged as collateral for securities lending transactions. |
| M. | Other Risks - Active trading of portfolio securities may result in added expenses, a lower return and increased tax liability. |
| N. | COVID-19 Risk - The COVID-19 strain of coronavirus has resulted in instances of market closures and dislocations, extreme volatility, liquidity constraints and increased trading costs. Efforts to contain its spread have resulted in travel restrictions, disruptions of healthcare systems, business operations (including business closures) and supply chains, layoffs, lower consumer demand and employee availability, and defaults and credit downgrades, among other significant economic impacts that have disrupted global economic activity across many industries. Such economic impacts may exacerbate other pre-existing political, social and economic risks locally or globally and cause general concern and uncertainty. |
The full economic impact and ongoing effects of COVID-19 (or other future epidemics or pandemics) at the macro-level and on individual businesses are unpredictable and may result in significant and prolonged effects on the Fund’s performance.
NOTE 2–Advisory Fees and Other Fees Paid to Affiliates
The Trust has entered into a master investment advisory agreement with the Adviser. Under the terms of the investment advisory agreement, the Fund accrues daily and pays monthly an advisory fee to the Adviser based on the annual rate of the Fund’s average daily net assets as follows:
| | | | |
| Average Daily Net Assets | | Rate | |
First $ 500 million | | | 0.350 | % |
Next $500 million | | | 0.325 | % |
Next $1.5 billion | | | 0.300 | % |
Next $2.5 billion | | | 0.290 | % |
Over $5 billion | | | 0.280 | % |
For the year ended February 28, 2022, the effective advisory fee rate incurred by the Fund was 0.31%.
Under the terms of a master sub-advisory agreement between the Adviser and each of Invesco Asset Management Deutschland GmbH, Invesco Asset Management Limited, Invesco Asset Management (Japan) Limited, Invesco Hong Kong Limited, Invesco Senior Secured Management, Inc. and Invesco Canada Ltd. (collectively, the “Affiliated Sub-Advisers”) the Adviser, not the Fund, will pay 40% of the fees paid to the Adviser to any such Affiliated Sub-Adviser(s) that provide(s) discretionary investment management services to the Fund based on the percentage of assets allocated to such Affiliated Sub-Adviser(s).
Effective June 1, 2021, the Adviser has contractually agreed, through at least June 30, 2022 to waive advisory fees and/or reimburse expenses of all shares to the extent necessary to limit total annual fund operating expenses after fee waiver and/or expense reimbursement (excluding certain items discussed below) of Class A, Class C, Class R, Class Y, Class R5 and Class R6 shares to 1.40%, 1.75% (after 12b-1 fee waivers), 1.75%. 1.25%, 1.25% and 1.25%, respectively, of the Fund’s average daily net assets. Prior to June 1, 2021, the Adviser had contractually agreed to waive advisory fees and/or reimburse expenses of all shares to the extent necessary to limit total annual fund operating expenses after fee waiver and/or expense reimbursement (excluding certain items discussed below) of Class A, Class C, Class R, Class Y, Class R5 and Class R6 shares to 0.75%, 1.59% (after 12b-1 fee waivers), 1.09%, 0.45%, 0.44% and 0.39%, respectively, of the Fund’s average daily net assets. In determining the Adviser’s obligation to waive advisory fees and/or reimburse expenses, the following expenses are not taken into account, and could cause the total annual fund operating expenses after fee waiver and/or expense reimbursement to exceed the numbers reflected above: (1) interest; (2) taxes; (3) dividend expense on short sales; (4) extraordinary items or non-routine items, including litigation expenses; and (5) expenses that the Fund has incurred but did not actually pay because of an expense offset arrangement. Unless Invesco continues the fee waiver agreement, it will terminate on June 30, 2022. During its term, the fee waiver agreement cannot be terminated or amended to increase the expense limits or reduce the advisory fee waiver without approval of the Board of Trustees.
Further, the Adviser has contractually agreed, through at least June 30, 2023, to waive the advisory fee payable by the Fund in an amount equal to 100% of the net advisory fees the Adviser receives from the affiliated money market funds on investments by the Fund of uninvested cash (excluding investments of cash collateral from securities lending) in such affiliated money market funds.
For the year ended February 28, 2022, the Adviser waived advisory fees of $21,334 and reimbursed class level expenses of $0, $0, $0, $14,707, $0 and $0 of Class A, Class C, Class R, Class Y, Class R5 and Class R6 shares, respectively.
The Trust has entered into a master administrative services agreement with Invesco pursuant to which the Fund has agreed to pay Invesco for certain administrative costs incurred in providing accounting services to the Fund. For the year ended February 28, 2022, expenses incurred under the agreement are shown in the Statement of Operations as Administrative services fees. Invesco has entered into a sub-administration agreement whereby State Street Bank and Trust Company (“SSB”) serves as fund accountant and provides certain administrative services to the Fund. Pursuant to a custody agreement with the Trust on behalf of the Fund, SSB also serves as the Fund’s custodian.
The Trust has entered into a transfer agency and service agreement with Invesco Investment Services, Inc. (“IIS”) pursuant to which the Fund has agreed to pay IIS a fee for providing transfer agency and shareholder services to the Fund and reimburse IIS for certain expenses incurred by IIS in the course of providing such services. IIS may make payments to intermediaries that provide omnibus account services, sub-accounting services and/or networking services. All fees payable by IIS to
| | |
| 30 | | Invesco Short Term Bond Fund |
intermediaries that provide omnibus account services or sub-accounting services are charged back to the Fund, subject to certain limitations approved by the Trust’s Board of Trustees. For the year ended February 28, 2022, expenses incurred under the agreement are shown in the Statement of Operations as Transfer agent fees.
The Trust has entered into master distribution agreements with Invesco Distributors, Inc. (“IDI”) to serve as the distributor for the Class A, Class C, Class R, Class Y, Class R5 and Class R6 shares of the Fund. The Trust has adopted plans pursuant to Rule 12b-1 under the 1940 Act with respect to the Fund’s Class A, Class C and Class R shares (collectively, the “Plans”). The Fund, pursuant to the Plans, reimburses IDI compensation at the annual rate of 0.15% of the Fund’s average daily net assets of Class A shares. The Fund pursuant to the Class C Plan and Class R Plan, pays IDI compensation at the annual rate of 0.65% of the average daily net assets of Class C shares and 0.50% of the average daily net assets of Class R shares. The fees are accrued daily and paid monthly. Of the Plan payments, up to 0.25% of the average daily net assets of each class of shares may be paid to furnish continuing personal shareholder services to customers who purchase and own shares of such classes. Any amounts not paid as a service fee under the Plans would constitute an asset-based sales charge. Rules of the Financial Industry Regulatory Authority (“FINRA”) impose a cap on the total sales charges, including asset-based sales charges, that may be paid by any class of shares of the Fund. IDI has contractually agreed, through at least June 30, 2022, to waive 12b-1 fees for Class C shares to the extent necessary to limit 12b-1 fees to 0.50% of average daily net assets. 12b-1 fees before fee waivers under this agreement are shown as Distribution fees in the Statement of Operations. For the year ended February 28, 2022, 12b-1 fees incurred for Class C shares were $1,103,887 after fee waivers of $331,166.
Front-end sales commissions and CDSC (collectively, the “sales charges”) are not recorded as expenses of the Fund. Front-end sales commissions are deducted from proceeds from the sales of Fund shares prior to investment in Class A shares of the Fund. CDSC are deducted from redemption proceeds prior to remittance to the shareholder. During the year ended February 28, 2022, IDI advised the Fund that IDI retained $121,816 in front-end sales commissions from the sale of Class A shares and $227,685 and $693 from Class A and Class C shares, respectively, for CDSC imposed upon redemptions by shareholders.
Certain officers and trustees of the Trust are officers and directors of the Adviser, IIS and/or IDI.
NOTE 3–Additional Valuation Information
GAAP defines fair value as the price that would be received to sell an asset or paid to transfer a liability in an orderly transaction between market participants at the measurement date, under current market conditions. GAAP establishes a hierarchy that prioritizes the inputs to valuation methods, giving the highest priority to readily available unadjusted quoted prices in an active market for identical assets (Level 1) and the lowest priority to significant unobservable inputs (Level 3), generally when market prices are not readily available or are unreliable. Based on the valuation inputs, the securities or other investments are tiered into one of three levels. Changes in valuation methods may result in transfers in or out of an investment’s assigned level:
| | |
| Level 1 - | | Prices are determined using quoted prices in an active market for identical assets. |
| Level 2 - | | Prices are determined using other significant observable inputs. Observable inputs are inputs that other market participants may use in pricing a security. These may include quoted prices for similar securities, interest rates, prepayment speeds, credit risk, yield curves, loss severities, default rates, discount rates, volatilities and others. |
| Level 3 - | | Prices are determined using significant unobservable inputs. In situations where quoted prices or observable inputs are unavailable (for example, when there is little or no market activity for an investment at the end of the period), unobservable inputs may be used. Unobservable inputs reflect the Fund’s own assumptions about the factors market participants would use in determining fair value of the securities or instruments and would be based on the best available information. |
The following is a summary of the tiered valuation input levels, as of February 28, 2022. The level assigned to the securities valuations may not be an indication of the risk or liquidity associated with investing in those securities. Because of the inherent uncertainties of valuation, the values reflected in the financial statements may materially differ from the value received upon actual sale of those investments.
| | | | | | | | | | | | | | | | |
| | | Level 1 | | | Level 2 | | | Level 3 | | | Total | |
| |
Investments in Securities | | | | | | | | | | | | | | | | |
| |
U.S. Dollar Denominated Bonds & Notes | | $ | - | | | $ | 2,016,595,591 | | | $ | - | | | $ | 2,016,595,591 | |
| |
Asset-Backed Securities | | | - | | | | 697,650,236 | | | | 8,828,381 | | | | 706,478,617 | |
| |
U.S. Treasury Securities | | | - | | | | 26,215,584 | | | | - | | | | 26,215,584 | |
| |
U.S. Government Sponsored Agency Mortgage-Backed Securities | | | - | | | | 24,397,717 | | | | - | | | | 24,397,717 | |
| |
Agency Credit Risk Transfer Notes | | | - | | | | 9,229,018 | | | | - | | | | 9,229,018 | |
| |
Preferred Stocks | | | 1,890,750 | | | | 6,954,290 | | | | - | | | | 8,845,040 | |
| |
Money Market Funds | | | 18,214,247 | | | | 116,183,488 | | | | - | | | | 134,397,735 | |
| |
Total Investments in Securities | | | 20,104,997 | | | | 2,897,225,924 | | | | 8,828,381 | | | | 2,926,159,302 | |
| |
Other Investments - Assets* | | | | | | | | | | | | | | | | |
| |
Futures Contracts | | | 3,096,865 | | | | - | | | | - | | | | 3,096,865 | |
| |
Other Investments - Liabilities* | | | | | | | | | | | | | | | | |
| |
Futures Contracts | | | (4,513,118 | ) | | | - | | | | - | | | | (4,513,118 | ) |
| |
Total Other Investments | | | (1,416,253 | ) | | | - | | | | - | | | | (1,416,253 | ) |
| |
Total Investments | | $ | 18,688,744 | | | $ | 2,897,225,924 | | | $ | 8,828,381 | | | $ | 2,924,743,049 | |
| |
| * | Unrealized appreciation (depreciation). |
NOTE 4–Derivative Investments
The Fund may enter into an International Swaps and Derivatives Association Master Agreement (“ISDA Master Agreement”) under which a fund may trade OTC derivatives. An OTC transaction entered into under an ISDA Master Agreement typically involves a collateral posting arrangement, payment netting provisions and close-out netting provisions. These netting provisions allow for reduction of credit risk through netting of contractual obligations. The enforceability of the netting provisions of the ISDA Master Agreement depends on the governing law of the ISDA Master Agreement, among other factors.
For financial reporting purposes, the Fund does not offset OTC derivative assets or liabilities that are subject to ISDA Master Agreements in the Statement of Assets and Liabilities.
| | |
| 31 | | Invesco Short Term Bond Fund |
Value of Derivative Investments at Period-End
The table below summarizes the value of the Fund’s derivative investments, detailed by primary risk exposure, held as of February 28, 2022:
| | | | |
| | | Value | |
| |
| Derivative Assets | | Interest
Rate Risk | |
|
Unrealized appreciation on futures contracts – Exchange-Traded(a) | | $ | 3,096,865 | |
|
Derivatives not subject to master netting agreements | | | (3,096,865 | ) |
|
Total Derivative Assets subject to master netting agreements | | $ | - | |
|
| | | | |
| | | Value | |
| Derivative Liabilities | | Interest
Rate Risk | |
|
Unrealized depreciation on futures contracts – Exchange-Traded(a) | | $ | (4,513,118 | ) |
|
Derivatives not subject to master netting agreements | | | 4,513,118 | |
|
Total Derivative Liabilities subject to master netting agreements | | $ | - | |
|
| (a) | The daily variation margin receivable (payable) at period-end is recorded in the Statement of Assets and Liabilities. |
Effect of Derivative Investments for the year ended February 28, 2022
The table below summarizes the gains (losses) on derivative investments, detailed by primary risk exposure, recognized in earnings during the period:
| | | | |
| | | Location of Gain (Loss) on
Statement of Operations | |
| | | |
| | | Interest
Rate Risk | |
|
Realized Gain: | | | | |
Futures contracts | | | $ 6,040,772 | |
|
Change in Net Unrealized Appreciation (Depreciation): | | | | |
Futures contracts | | | (7,105,202) | |
|
Total | | | $(1,064,430) | |
|
The table below summarizes the average notional value of derivatives held during the period.
| | | | |
| | | Futures Contracts | |
|
Average notional value | | $ | 1,974,355,508 | |
|
NOTE 5–Expense Offset Arrangement(s)
The expense offset arrangement is comprised of transfer agency credits which result from balances in demand deposit accounts used by the transfer agent for clearing shareholder transactions. For the year ended February 28, 2022, the Fund received credits from this arrangement, which resulted in the reduction of the Fund’s total expenses of $1,723.
NOTE 6–Trustees’ and Officers’ Fees and Benefits
Trustees’ and Officers’ Fees and Benefits include amounts accrued by the Fund to pay remuneration to certain Trustees and Officers of the Fund. Trustees have the option to defer compensation payable by the Fund, and Trustees’ and Officers’ Fees and Benefits also include amounts accrued by the Fund to fund such deferred compensation amounts. Those Trustees who defer compensation have the option to select various Invesco Funds in which their deferral accounts shall be deemed to be invested. Finally, certain current Trustees were eligible to participate in a retirement plan that provided for benefits to be paid upon retirement to Trustees over a period of time based on the number of years of service. The Fund may have certain former Trustees who also participate in a retirement plan and receive benefits under such plan. Trustees’ and Officers’ Fees and Benefits include amounts accrued by the Fund to fund such retirement benefits. Obligations under the deferred compensation and retirement plans represent unsecured claims against the general assets of the Fund.
NOTE 7–Cash Balances
The Fund may borrow for leveraging in an amount up to 5% of the Fund’s total assets (excluding the amount borrowed) at the time the borrowing is made. In doing so, the Fund is permitted to temporarily carry a negative or overdrawn balance in its account with SSB, the custodian bank. Such balances, if any at period end, are shown in the Statement of Assets and Liabilities under the payable caption Amount due custodian. To compensate the custodian bank for such overdrafts, the overdrawn Fund may either (1) leave funds as a compensating balance in the account so the custodian bank can be compensated by earning the additional interest; or (2) compensate by paying the custodian bank at a rate agreed upon by the custodian bank and Invesco, not to exceed the contractually agreed upon rate. The Fund may not purchase additional securities when any borrowings from banks or broker-dealers exceed 5% of the Fund’s total assets, or when any borrowings from an Invesco Fund are outstanding.
| | |
| 32 | | Invesco Short Term Bond Fund |
NOTE 8–Distributions to Shareholders and Tax Components of Net Assets
Tax Character of Distributions to Shareholders Paid During the Fiscal Years Ended February 28, 2022 and 2021:
| | | | | | | | |
| | | 2022 | | | 2021 | |
| |
Ordinary income* | | $ | 44,420,780 | | | $ | 53,012,499 | |
| |
Long–term capital gain | | | 235,309 | | | | 2,661,705 | |
| |
Total distributions | | $ | 44,656,089 | | | $ | 55,674,204 | |
| |
| * | Includes short–term capital gain distributions, if any. |
Tax Components of Net Assets at Period–End:
| | | | |
| | | 2022 | |
| |
Undistributed ordinary income | | $ | 3,155,029 | |
| |
Net unrealized appreciation (depreciation)–investments | | | (37,004,378 | ) |
| |
Temporary book/tax differences | | | (216,367 | ) |
| |
Capital loss carryforward | | | (67,732,905 | ) |
| |
Shares of beneficial interest | | | 2,921,717,579 | |
| |
Total net assets | | $ | 2,819,918,958 | |
| |
The difference between book-basis and tax-basis unrealized appreciation (depreciation) is due to differences in the timing of recognition of gains and losses on investments for tax and book purposes. The Fund’s net unrealized appreciation (depreciation) difference is attributable primarily to amortization and accretion on debt securities and derivative instruments.
The temporary book/tax differences are a result of timing differences between book and tax recognition of income and/or expenses. The Fund’s temporary book/tax differences are the result of the trustee deferral of compensation and retirement plan benefits.
Capital loss carryforward is calculated and reported as of a specific date. Results of transactions and other activity after that date may affect the amount of capital loss carryforward actually available for the Fund to utilize. The ability to utilize capital loss carryforward in the future may be limited under the Internal Revenue Code and related regulations based on the results of future transactions.
The Fund has a capital loss carryforward as of February 28, 2022, as follows:
| | | | | | | | | | | | |
| Capital Loss Carryforward* | |
| |
| |
| Expiration | | Short-Term | | | Long-Term | | | Total | |
| |
Not subject to expiration | | $ | 34,576,752 | | | $ | 33,156,153 | | | $ | 67,732,905 | |
| |
| * | Capital loss carryforward is reduced for limitations, if any, to the extent required by the Internal Revenue Code and may be further limited depending upon a variety of factors, including the realization of net unrealized gains or losses as of the date of any reorganization. |
NOTE 9–Investment Transactions
The aggregate amount of investment securities (other than short-term securities, U.S. Government obligations and money market funds, if any) purchased and sold by the Fund during the year ended February 28, 2022 was $1,969,624,272 and $1,914,839,156, respectively. Cost of investments, including any derivatives, on a tax basis includes the adjustments for financial reporting purposes as of the most recently completed federal income tax reporting period-end.
| | | | |
| Unrealized Appreciation (Depreciation) of Investments on a Tax Basis | |
| |
Aggregate unrealized appreciation of investments | | $ | 21,994,651 | |
| |
Aggregate unrealized (depreciation) of investments | | | (58,999,029 | ) |
| |
Net unrealized appreciation (depreciation) of investments | | $ | (37,004,378 | ) |
| |
Cost of investments for tax purposes is $2,961,747,427.
NOTE 10–Reclassification of Permanent Differences
Primarily as a result of differing book/tax treatment of distributions and amortization and accretion on debt securities, on February 28, 2022, undistributed net investment income was increased by $62,302 and undistributed net realized gain (loss) was decreased by $62,302. This reclassification had no effect on the net assets or the distributable earnings (loss) of the Fund.
NOTE 11–Share Information
| | | | | | | | | | | | | | |
| | | Summary of Share Activity | |
| | | Year ended February 28, 2022(a) | | | Year ended
February 28, 2021 | |
| | | Shares | | Amount | | | Shares | | | Amount | |
| |
Sold: | | | | | | | | | | | | | | |
Class A | | 47,121,642 | | $ | 405,494,521 | | | | 58,881,176 | | | $ | 505,448,194 | |
| |
Class C | | 7,301,728 | | | 62,972,099 | | | | 13,661,101 | | | | 117,320,096 | |
| |
Class R | | 1,248,996 | | | 10,778,096 | | | | 1,792,362 | | | | 15,480,563 | |
| |
Class Y | | 36,676,908 | | | 315,378,024 | | | | 44,840,702 | | | | 385,439,426 | |
| |
Class R5 | | 28,429 | | | 242,350 | | | | 14,730 | | | | 124,587 | |
| |
Class R6 | | 16,074,685 | | | 138,582,798 | | | | 11,206,731 | | | | 96,386,151 | |
| |
| | |
| 33 | | Invesco Short Term Bond Fund |
| | | | | | | | | | | | | | | | |
| | | Summary of Share Activity | |
| |
| | | Year ended February 28, 2022(a) | | | Year ended February 28, 2021 | |
| | | | | | | | |
| | | Shares | | | Amount | | | Shares | | | Amount | |
| |
Issued as reinvestment of dividends: | | | | | | | | | | | | | | | | |
Class A | | | 2,044,656 | | | $ | 17,572,982 | | | | 2,488,914 | | | $ | 21,390,097 | |
| |
Class C | | | 227,765 | | | | 1,959,880 | | | | 362,060 | | | | 3,104,680 | |
| |
Class R | | | 58,729 | | | | 506,199 | | | | 70,805 | | | | 611,740 | |
| |
Class Y | | | 688,982 | | | | 5,923,725 | | | | 749,468 | | | | 6,456,337 | |
| |
Class R5 | | | 1,038 | | | | 8,892 | | | | 1,406 | | | | 12,017 | |
| |
Class R6 | | | 1,234,546 | | | | 10,623,341 | | | | 1,745,870 | | | | 14,966,771 | |
| |
| | | | |
Automatic conversion of Class C shares to Class A shares: | | | | | | | | | | | | | | | | |
Class A | | | 1,658,543 | | | | 14,242,266 | | | | 5,113,852 | | | | 44,216,450 | |
| |
Class C | | | (1,658,225 | ) | | | (14,242,266 | ) | | | (5,113,278 | ) | | | (44,216,450 | ) |
| |
| | | | |
Issued in connection with acquisitions:(b) | | | | | | | | | | | | | | | | |
Class A | | | - | | | | - | | | | 81,158,649 | | | | 682,135,260 | |
| |
Class C | | | - | | | | - | | | | 11,583,605 | | | | 97,310,533 | |
| |
Class R | | | - | | | | - | | | | 4,433,094 | | | | 37,326,256 | |
| |
Class Y | | | - | | | | - | | | | 45,739,122 | | | | 384,550,934 | |
| |
Class R5 | | | - | | | | - | | | | 1,183 | | | | 9,928 | |
| |
Class R6 | | | - | | | | - | | | | 15,510,515 | | | | 130,528,698 | |
| |
| | | | |
Reacquired: | | | | | | | | | | | | | | | | |
Class A | | | (58,766,805 | ) | | | (505,196,352 | ) | | | (47,246,252 | ) | | | (405,350,554 | ) |
| |
Class C | | | (11,240,934 | ) | | | (96,582,279 | ) | | | (11,536,618 | ) | | | (98,721,356 | ) |
| |
Class R | | | (1,684,427 | ) | | | (14,510,987 | ) | | | (1,210,156 | ) | | | (10,416,271 | ) |
| |
Class Y | | | (40,179,180 | ) | | | (345,010,512 | ) | | | (35,707,062 | ) | | | (306,904,869 | ) |
| |
Class R5 | | | (5,702 | ) | | | (48,722 | ) | | | (14,102 | ) | | | (121,381 | ) |
| |
Class R6 | | | (20,202,696 | ) | | | (173,549,301 | ) | | | (28,533,148 | ) | | | (244,137,358 | ) |
| |
Net increase (decrease) in share activity | | | (19,371,322 | ) | | $ | (164,855,246 | ) | | | 169,994,729 | | | $ | 1,432,950,479 | |
| |
| (a) | There are entities that are record owners of more than 5% of the outstanding shares of the Fund and in the aggregate own 49% of the outstanding shares of the Fund. IDI has an agreement with these entities to sell Fund shares. The Fund, Invesco and/or Invesco affiliates may make payments to these entities, which are considered to be related to the Fund, for providing services to the Fund, Invesco and/or Invesco affiliates including but not limited to services such as securities brokerage, distribution, third party record keeping and account servicing. The Fund has no knowledge as to whether all or any portion of the shares owned of record by these entities are also owned beneficially. |
| (b) | After the close of business on May 15, 2020, the Fund acquired all the net assets of Invesco Oppenheimer Limited-Term Bond Fund (the “Target Fund”) pursuant to a plan of reorganization approved by the Board of Trustees of the Fund on February 14, 2020. The reorganization was executed in order to reduce overlap and increase efficiencies in the Adviser’s product line. The acquisition was accomplished by a tax-free exchange of 158,426,168 shares of the Fund for 298,121,720 shares outstanding of the Target Fund as of the close of business on May 15, 2020. Shares of the Target Fund were exchanged for the like class of shares of the Fund, based on the relative net asset value of the Target Fund to the net asset value of the Fund on the close of business, May 15, 2020. The Target Fund’s net assets as of the close of business on May 15, 2020 of $1,331,861,609, including $(3,211,961) of unrealized appreciation (depreciation), were combined with those of the Fund. The net assets of the Fund immediately before the acquisition were $1,589,317,925 and $2,921,179,534 immediately after the acquisition. |
The pro forma results of operations for the year ended February 28, 2021 assuming the reorganization had been completed on March 1, 2020, the beginning of the annual reporting period are as follows:
| | | | |
Net investment income | | $ | 59,556,930 | |
Net realized/unrealized gains | | | 1,730,190 | |
Change in net assets resulting from operations | | $ | 61,287,120 | |
| | |
| 34 | | Invesco Short Term Bond Fund |
Report of Independent Registered Public Accounting Firm
To the Board of Trustees of AIM Investment Securities Funds (Invesco Investment Securities Funds) and Shareholders of Invesco Short Term Bond Fund
Opinion on the Financial Statements
We have audited the accompanying statement of assets and liabilities, including the schedule of investments, of Invesco Short Term Bond Fund (one of the funds constituting AIM Investment Securities Funds (Invesco Investment Securities Funds), referred to hereafter as the “Fund”) as of February 28, 2022, the related statement of operations for the year ended February 28, 2022, the statement of changes in net assets for each of the two years in the period ended February 28, 2022, including the related notes, and the financial highlights for each of the five years in the period ended February 28, 2022 (collectively referred to as the “financial statements”). In our opinion, the financial statements present fairly, in all material respects, the financial position of the Fund as of February 28, 2022, the results of its operations for the year then ended, the changes in its net assets for each of the two years in the period ended February 28, 2022 and the financial highlights for each of the five years in the period ended February 28, 2022 in conformity with accounting principles generally accepted in the United States of America.
Basis for Opinion
These financial statements are the responsibility of the Fund’s management. Our responsibility is to express an opinion on the Fund’s financial statements based on our audits. We are a public accounting firm registered with the Public Company Accounting Oversight Board (United States) (PCAOB) and are required to be independent with respect to the Fund in accordance with the U.S. federal securities laws and the applicable rules and regulations of the Securities and Exchange Commission and the PCAOB.
We conducted our audits of these financial statements in accordance with the standards of the PCAOB. Those standards require that we plan and perform the audit to obtain reasonable assurance about whether the financial statements are free of material misstatement, whether due to error or fraud.
Our audits included performing procedures to assess the risks of material misstatement of the financial statements, whether due to error or fraud, and performing procedures that respond to those risks. Such procedures included examining, on a test basis, evidence regarding the amounts and disclosures in the financial statements. Our audits also included evaluating the accounting principles used and significant estimates made by management, as well as evaluating the overall presentation of the financial statements. Our procedures included confirmation of securities owned as of February 28, 2022 by correspondence with the custodian, transfer agent and brokers; when replies were not received from brokers, we performed other auditing procedures. We believe that our audits provide a reasonable basis for our opinion.
/s/PricewaterhouseCoopers LLP
Houston, Texas
April 28, 2022
We have served as the auditor of one or more of the investment companies in the Invesco group of investment companies since at least 1995. We have not been able to determine the specific year we began serving as auditor.
| | |
| 35 | | Invesco Short Term Bond Fund |
Calculating your ongoing Fund expenses
Example
As a shareholder of the Fund, you incur two types of costs: (1) transaction costs, which may include sales charges (loads) on purchase payments or contingent deferred sales charges on redemptions, if any; and (2) ongoing costs, including management fees, distribution and/or service (12b-1) fees, and other Fund expenses. This example is intended to help you understand your ongoing costs (in dollars) of investing in the Fund and to compare these costs with ongoing costs of investing in other mutual funds. The example is based on an investment of $1,000 invested at the beginning of the period and held for the entire period September 1, 2021 through February 28, 2022.
Actual expenses
The table below provides information about actual account values and actual expenses. You may use the information in this table, together with the amount you invested, to estimate the expenses that you paid over the period. Simply divide your account value by $1,000 (for example, an $8,600 account value divided by $1,000 = 8.6), then multiply the result by the number in the table under the heading entitled “Actual Expenses Paid During Period” to estimate the expenses you paid on your account during this period.
Hypothetical example for comparison purposes
The table below also provides information about hypothetical account values and hypothetical expenses based on the Fund’s actual expense ratio and an assumed rate of return of 5% per year before expenses, which is not the Fund’s actual return.
The hypothetical account values and expenses may not be used to estimate the actual ending account balance or expenses you paid for the period. You may use this information to compare the ongoing costs of investing in the Fund and other funds. To do so, compare this 5% hypothetical example with the 5% hypothetical examples that appear in the shareholder reports of the other funds.
Please note that the expenses shown in the table are meant to highlight your ongoing costs only and do not reflect any transaction costs, such as sales charges (loads) on purchase payments or contingent deferred sales charges on redemptions, if any. Therefore, the hypothetical information is useful in comparing ongoing costs only, and will not help you determine the relative total costs of owning different funds. In addition, if these transaction costs were included, your costs would have been higher.
| | | | | | | | | | | | |
| | | | | |
| | | | | ACTUAL | | HYPOTHETICAL (5% annual return before expenses) | | |
| | | | | | | |
| | | Beginning
Account Value
(09/01/21) | | Ending
Account Value
(02/28/22)1 | | Expenses
Paid During
Period2 | | Ending
Account Value
(02/28/22) | | Expenses
Paid During
Period2 | | Annualized
Expense Ratio |
| | | | | | | |
Class A | | $1,000.00 | | $975.00 | | $2.99 | | $1,021.77 | | $3.06 | | 0.61% |
| | | | | | | |
Class C | | 1,000.00 | | 973.40 | | 4.70 | | 1,020.03 | | 4.81 | | 0.96 |
| | | | | | | |
Class R | | 1,000.00 | | 973.30 | | 4.70 | | 1,020.03 | | 4.81 | | 0.96 |
| | | | | | | |
Class Y | | 1,000.00 | | 976.90 | | 2.25 | | 1,022.51 | | 2.31 | | 0.46 |
| | | | | | | |
Class R5 | | 1,000.00 | | 977.00 | | 2.06 | | 1,022.71 | | 2.11 | | 0.42 |
| | | | | | | |
Class R6 | | 1,000.00 | | 976.20 | | 1.86 | | 1,022.91 | | 1.91 | | 0.38 |
| 1 | The actual ending account value is based on the actual total return of the Fund for the period September 1, 2021 through February 28, 2022, after actual expenses and will differ from the hypothetical ending account value which is based on the Fund’s expense ratio and a hypothetical annual return of 5% before expenses. |
| 2 | Expenses are equal to the Fund’s annualized expense ratio as indicated above multiplied by the average account value over the period, multiplied by 181/365 to reflect the most recent fiscal half year. |
| | |
| 36 | | Invesco Short Term Bond Fund |
Tax Information
Form 1099-DIV, Form 1042-S and other year–end tax information provide shareholders with actual calendar year amounts that should be included in their tax returns. Shareholders should consult their tax advisers.
The following distribution information is being provided as required by the Internal Revenue Code or to meet a specific state’s requirement.
The Fund designates the following amounts or, if subsequently determined to be different, the maximum amount allowable for its fiscal year ended February 28, 2022:
| | | | | | |
| | | Federal and State Income Tax | | | | |
| | Long-Term Capital Gain Distributions | | $ 235,309 |
| | Qualified Dividend Income* | | 1.73% |
| | Corporate Dividends Received Deduction* | | 1.54% |
| | U.S. Treasury Obligations* | | 1.06% |
| | Qualified Business Income* | | 0.00% |
| | Business Interest Income* | | 98.00% |
| | * | The above percentages are based on ordinary income dividends paid to shareholders during the Fund’s fiscal year. |
| | |
| 37 | | Invesco Short Term Bond Fund |
Trustees and Officers
The address of each trustee and officer is AIM Investment Securities Funds (Invesco Investment Securities Funds) (the “Trust”), 11 Greenway Plaza, Suite 1000, Houston, Texas 77046-1173. The trustees serve for the life of the Trust, subject to their earlier death, incapacitation, resignation, retirement or removal as more specifically provided in the Trust’s organizational documents. Each officer serves for a one year term or until their successors are elected and qualified. Column two below includes length of time served with predecessor entities, if any.
| | | | | | | | |
Name, Year of Birth and �� Position(s) Held with the Trust | | Trustee and/or Officer Since | | Principal Occupation(s) During Past 5 Years | | Number of Funds in Fund Complex Overseen by Trustee | | Other Directorship(s) Held by Trustee During Past 5 Years |
| Interested Trustee | | | | | | | | |
Martin L. Flanagan1 – 1960
Trustee and Vice Chair | | 2007 | | Executive Director, Chief Executive Officer and President, Invesco Ltd. (ultimate parent of Invesco and a global investment management firm); Trustee and Vice Chair, The Invesco Funds; Vice Chair, Investment Company Institute; and Member of Executive Board, SMU Cox School of Business | | 188 | | None |
| | | | | |
| | | | | Formerly: Advisor to the Board, Invesco Advisers, Inc. (formerly known as Invesco Institutional (N.A.), Inc.); Chairman and Chief Executive Officer, Invesco Advisers, Inc. (registered investment adviser); Director, Chairman, Chief Executive Officer and President, Invesco Holding Company (US), Inc. (formerly IVZ Inc.) (holding company), Invesco Group Services, Inc. (service provider) and Invesco North American Holdings, Inc. (holding company); Director, Chief Executive Officer and President, Invesco Holding Company Limited (parent of Invesco and a global investment management firm); Director, Invesco Ltd.; Chairman, Investment Company Institute and President, Co-Chief Executive Officer, Co-President, Chief Operating Officer and Chief Financial Officer, Franklin Resources, Inc. (global investment management organization) | | | | |
| 1 | Mr. Flanagan is considered an interested person (within the meaning of Section 2(a)(19) of the 1940 Act) of the Trust because he is an officer of the Adviser to the Trust, and an officer and a director of Invesco Ltd., ultimate parent of the Adviser. |
| | |
| T-1 | | Invesco Short Term Bond Fund |
Trustees and Officers–(continued)
| | | | | | | | |
Name, Year of Birth and Position(s) Held with the Trust | | Trustee and/or Officer Since | | Principal Occupation(s) During Past 5 Years | | Number of Funds in Fund Complex Overseen by Trustee | | Other Directorship(s) Held by Trustee During Past 5 Years |
Independent Trustees |
| | | | | |
Christopher L. Wilson – 1957
Trustee and Chair | | 2017 | | Retired Formerly: Director, TD Asset Management USA Inc. (mutual fund complex) (22 portfolios); Managing Partner, CT2, LLC (investing and consulting firm); President/Chief Executive Officer, Columbia Funds, Bank of America Corporation; President/Chief Executive Officer, CDC IXIS Asset Management Services, Inc.; Principal & Director of Operations, Scudder Funds, Scudder, Stevens & Clark, Inc.; Assistant Vice President, Fidelity Investments | | 188 | | Formerly: enaible, Inc. (artificial intelligence technology) Director, ISO New England, Inc. (non-profit organization managing regional electricity market) |
| | | | | |
Beth Ann Brown – 1968
Trustee | | 2019 | | Independent Consultant Formerly: Head of Intermediary Distribution, Managing Director, Strategic Relations, Managing Director, Head of National Accounts, Senior Vice President, National Account Manager and Senior Vice President, Key Account Manager, Columbia Management Investment Advisers LLC; Vice President, Key Account Manager, Liberty Funds Distributor, Inc.; and Trustee of certain Oppenheimer Funds | | 188 | | Director, Board of Directors of Caron Engineering Inc.; Advisor, Board of Advisors of Caron Engineering Inc.; President and Director, Acton Shapleigh Youth Conservation Corps (non-profit) Formerly: President and Director of Grahamtastic Connection (non-profit) |
| | | | | |
Cynthia Hostetler – 1962
Trustee | | 2017 | | Non-Executive Director and Trustee of a number of public and private business corporations Formerly: Director, Aberdeen Investment Funds (4 portfolios); Director, Artio Global Investment LLC (mutual fund complex); Director, Edgen Group, Inc. (specialized energy and infrastructure products distributor); Director, Genesee & Wyoming, Inc. (railroads); Head of Investment Funds and Private Equity, Overseas Private Investment Corporation; President, First Manhattan Bancorporation, Inc.; Attorney, Simpson Thacher & Bartlett LLP | | 188 | | Resideo Technologies, Inc. (smart home technology); Vulcan Materials Company (construction materials company); Trilinc Global Impact Fund; Textainer Group Holdings, (shipping container leasing company); Investment Company Institute (professional organization); Independent Directors Council (professional organization) |
| | | | | |
Eli Jones – 1961
Trustee | | 2016 | | Professor and Dean Emeritus, Mays Business School - Texas A&M University Formerly: Dean of Mays Business School-Texas A&M University; Professor and Dean, Walton College of Business, University of Arkansas and E.J. Ourso College of Business, Louisiana State University; Director, Arvest Bank | | 188 | | Insperity, Inc. (formerly known as Administaff) (human resources provider); Member of Regional Board of Directors and Board of Directors, First Financial Bancorp (regional bank) |
| | | | | |
Elizabeth Krentzman – 1959
Trustee | | 2019 | | Formerly: Principal and Chief Regulatory Advisor for Asset Management Services and U.S. Mutual Fund Leader of Deloitte & Touche LLP; General Counsel of the Investment Company Institute (trade association); National Director of the Investment Management Regulatory Consulting Practice, Principal, Director and Senior Manager of Deloitte & Touche LLP; Assistant Director of the Division of Investment Management - Office of Disclosure and Investment Adviser Regulation of the U.S. Securities and Exchange Commission and various positions with the Division of Investment Management – Office of Regulatory Policy of the U.S. Securities and Exchange Commission; Associate at Ropes & Gray LLP; and Trustee of certain Oppenheimer Funds | | 188 | | Trustee of the University of Florida National Board Foundation; Member of the Cartica Funds Board of Directors (private investment funds) Formerly: Member of the University of Florida Law Center Association, Inc. Board of Trustees, Audit Committee and Membership Committee |
| | | | | |
Anthony J. LaCava, Jr. – 1956
Trustee | | 2019 | | Formerly: Director and Member of the Audit Committee, Blue Hills Bank (publicly traded financial institution) and Managing Partner, KPMG LLP | | 188 | | Blue Hills Bank; Chairman, Bentley University; Member, Business School Advisory Council; and Nominating Committee, KPMG LLP |
| | | | | |
Prema Mathai-Davis – 1950
Trustee | | 1998 | | Retired Formerly: Co-Founder & Partner of Quantalytics Research, LLC, (a FinTech Investment Research Platform for the Self-Directed Investor); Trustee of YWCA Retirement Fund; CEO of YWCA of the USA; Board member of the NY Metropolitan Transportation Authority; Commissioner of the NYC Department of Aging; Board member of Johns Hopkins Bioethics Institute | | 188 | | Member of Board of Positive Planet US (non-profit) and HealthCare Chaplaincy Network (non-profit) |
| | |
| T-2 | | Invesco Short Term Bond Fund |
Trustees and Officers–(continued)
| | | | | | | | |
Name, Year of Birth and Position(s) Held with the Trust | | Trustee and/or Officer Since | | Principal Occupation(s) During Past 5 Years | | Number of Funds in Fund Complex Overseen by Trustee | | Other Directorship(s) Held by Trustee During Past 5 Years |
Independent Trustees–(continued) |
| | | | | |
Joel W. Motley – 1952
Trustee | | 2019 | | Director of Office of Finance, Federal Home Loan Bank System; Managing Director of Carmona Motley Inc. (privately held financial advisor); Member of the Council on Foreign Relations and its Finance and Budget Committee; Chairman Emeritus of Board of Human Rights Watch and Member of its Investment Committee; and Member of Investment Committee Board of Historic Hudson Valley (non-profit cultural organization); and Member of the Board, Blue Ocean Acquisition Corp. Formerly: Managing Director of Public Capital Advisors, LLC (privately held financial advisor); Managing Director of Carmona Motley Hoffman, Inc. (privately held financial advisor); Trustee of certain Oppenheimer Funds; Director of Columbia Equity Financial Corp. (privately held financial advisor); and Member of the Vestry of Trinity Church Wall Street | | 188 | | Member of Board of Trust for Mutual Understanding (non-profit promoting the arts and environment); Member of Board of Greenwall Foundation (bioethics research foundation) and its Investment Committee; Member of Board of Friends of the LRC (non-profit legal advocacy); Board Member and Investment Committee Member of Pulitzer Center for Crisis Reporting (non-profit journalism)Positive Planet US |
| | | | | |
Teresa M. Ressel – 1962
Trustee | | 2017 | | Non-executive director and trustee of a number of public and private business corporations Formerly: Chief Executive Officer, UBS Securities LLC (investment banking); Chief Operating Officer, UBS AG Americas (investment banking); Sr. Management Team Olayan America, The Olayan Group (international investor/commercial/industrial); Assistant Secretary for Management & Budget and Designated Chief Financial Officer, U.S. Department of Treasury; Director, Atlantic Power Corporation (power generation company) and ON Semiconductor Corporation (semiconductor manufacturing) | | 188 | | None |
| | | | | |
Ann Barnett Stern – 1957
Trustee | | 2017 | | President, Chief Executive Officer and Board Member, Houston Endowment, Inc. a private philanthropic institution Formerly: Executive Vice President, Texas Children’s Hospital; Vice President, General Counsel and Corporate Compliance Officer, Texas Children’s Hospital; Attorney at Beck, Redden and Secrest, LLP and Andrews and Kurth LLP | | 188 | | Trustee and Board Vice Chair of Holdsworth Center Trustee and Chair of Nomination/Governance Committee, Good Reason Houston, (non-profit); Trustee and Investment Committee member of University of Texas Law School Foundation (non-profit); Board Member of Greater Houston Partnership (non-profit); Advisory Board member, Baker Institute for Public Policy at Rice University (non-profit) Formerly: Director and Audit Committee Member of Federal Reserve Bank of Dallas |
| | | | | |
Robert C. Troccoli – 1949
Trustee | | 2016 | | Retired Formerly: Adjunct Professor, University of Denver – Daniels College of Business; and Managing Partner, KPMG LLP | | 188 | | None |
| | | | | |
Daniel S. Vandivort – 1954
Trustee | | 2019 | | President, Flyway Advisory Services LLC (consulting and property management) | | 188 | | Formerly: Trustee, Board of Trustees, Treasurer and Chairman of the Audit and Committee, Huntington Disease Foundation of America; Trustee and Governance Chair, of certain Oppenheimer Funds |
| | |
| T-3 | | Invesco Short Term Bond Fund |
Trustees and Officers–(continued)
| | | | | | | | |
Name, Year of Birth and Position(s) Held with the Trust | | Trustee and/or Officer Since | | Principal Occupation(s) During Past 5 Years | | Number of Funds in Fund Complex Overseen by Trustee | | Other Directorship(s) Held by Trustee During Past 5 Years |
Officers | | | | | | | | |
| | | | | |
Sheri Morris – 1964
President and Principal Executive
Officer | | 1999 | | Head of Global Fund Services, Invesco Ltd.; President and Principal Executive Officer, The Invesco Funds; Vice President, Invesco Exchange-Traded Fund Trust, Invesco Exchange-Traded Fund Trust II, Invesco India Exchange-Traded Fund Trust, Invesco Actively Managed Exchange-Traded Fund Trust, Invesco Actively Managed Exchange-Traded Commodity Fund Trust and Invesco Exchange-Traded Self-Indexed Fund Trust; and Vice President, OppenheimerFunds, Inc. Formerly: Vice President, Treasurer and Principal Financial Officer, The Invesco Funds; Vice President, Invesco AIM Advisers, Inc., Invesco AIM Capital Management, Inc. and Invesco AIM Private Asset Management, Inc.; Assistant Vice President and Assistant Treasurer, The Invesco Funds; Vice President and Assistant Vice President, Invesco Advisers, Inc.; Assistant Vice President, Invesco AIM Capital Management, Inc. and Invesco AIM Private Asset Management, Inc.; Treasurer, Invesco Exchange-Traded Fund Trust, Invesco Exchange-Traded Fund Trust II, Invesco India Exchange-Traded Fund Trust and Invesco Actively Managed Exchange-Traded Fund Trust and Senior Vice President, Invesco Advisers, Inc. (formerly known as Invesco Institutional (N.A.), Inc.) (registered investment adviser) | | N/A | | N/A |
| | | | | |
Jeffrey H. Kupor – 1968
Senior Vice President, Chief Legal
Officer and Secretary | | 2018 | | Head of Legal of the Americas, Invesco Ltd.; Senior Vice President and Secretary, Invesco Advisers, Inc. (formerly known as Invesco Institutional (N.A.), Inc.) (registered investment adviser); Senior Vice President and Secretary, Invesco Distributors, Inc. (formerly known as Invesco AIM Distributors, Inc.); Vice President and Secretary, Invesco Investment Services, Inc. (formerly known as Invesco AIM Investment Services, Inc.) Senior Vice President, Chief Legal Officer and Secretary, The Invesco Funds; Secretary and General Counsel, Invesco Investment Advisers LLC (formerly known as Van Kampen Asset Management); Secretary and General Counsel, Invesco Capital Markets, Inc. (formerly known as Van Kampen Funds Inc.) and Chief Legal Officer, Invesco Exchange-Traded Fund Trust, Invesco Exchange-Traded Fund Trust II, Invesco India Exchange-Traded Fund Trust, Invesco Actively Managed Exchange-Traded Fund Trust, Invesco Actively Managed Exchange-Traded Commodity Fund Trust and Invesco Exchange-Traded Self-Indexed Fund Trust;; Secretary and Vice President, Harbourview Asset Management Corporation; Secretary and Vice President, OppenheimerFunds, Inc. and Invesco Managed Accounts, LLC; Secretary and Senior Vice President, OFI Global Institutional, Inc.; Secretary and Vice President, OFI SteelPath, Inc.; Secretary and Vice President, Oppenheimer Acquisition Corp.; Secretary and Vice President, Shareholder Services, Inc.; Secretary and Vice President, Trinity Investment Management Corporation Formerly: Secretary and Vice President, Jemstep, Inc.; Head of Legal, Worldwide Institutional, Invesco Ltd.; Secretary and General Counsel, INVESCO Private Capital Investments, Inc.; Senior Vice President, Secretary and General Counsel, Invesco Management Group, Inc. (formerly known as Invesco AIM Management Group, Inc.); Assistant Secretary, INVESCO Asset Management (Bermuda) Ltd.; Secretary and General Counsel, Invesco Private Capital, Inc.; Assistant Secretary and General Counsel, INVESCO Realty, Inc.; Secretary and General Counsel, Invesco Senior Secured Management, Inc.; Secretary, Sovereign G./P. Holdings Inc.; and Secretary, Invesco Indexing LLC; Secretary, W.L. Ross & Co., LLC | | N/A | | N/A |
| | | | | |
Andrew R. Schlossberg –1974
Senior Vice President | | 2019 | | Head of the Americas and Senior Managing Director, Invesco Ltd.; Director and Senior Vice President, Invesco Advisers, Inc. (formerly known as Invesco Institutional (N.A.), Inc.) (registered investment adviser); Director and Chairman, Invesco Investment Services, Inc. (formerly known as Invesco AIM Investment Services, Inc.) (registered transfer agent); Senior Vice President, The Invesco Funds; Director, Invesco Investment Advisers LLC (formerly known as Van Kampen Asset Management) Formerly: Director, President and Chairman, Invesco Insurance Agency, Inc.; Director, Invesco UK Limited; Director and Chief Executive, Invesco Asset Management Limited and Invesco Fund Managers Limited; Assistant Vice President, The Invesco Funds; Senior Vice President, Invesco Advisers, Inc. (formerly known as Invesco Institutional (N.A.), Inc.) (registered investment adviser); Director and Chief Executive, Invesco Administration Services Limited and Invesco Global Investment Funds Limited; Director, Invesco Distributors, Inc.; Head of EMEA, Invesco Ltd.; President, Invesco Actively Managed Exchange-Traded Commodity Fund Trust, Invesco Actively Managed Exchange-Traded Fund Trust, Invesco Exchange-Traded Fund Trust, Invesco Exchange-Traded Fund Trust II and Invesco India Exchange-Traded Fund Trust; Managing Director and Principal Executive Officer, Invesco Capital Management LLC | | N/A | | N/A |
| | |
| T-4 | | Invesco Short Term Bond Fund |
Trustees and Officers–(continued)
| | | | | | | | |
Name, Year of Birth and Position(s) Held with the Trust | | Trustee and/or Officer Since | | Principal Occupation(s) During Past 5 Years | | Number of Funds in Fund Complex Overseen by Trustee | | Other Directorship(s) Held by Trustee During Past 5 Years |
Officers–(continued) |
| | | | | |
John M. Zerr – 1962
Senior Vice President | | 2006 | | Chief Operating Officer of the Americas; Senior Vice President, Invesco Advisers, Inc. (formerly known as Invesco Institutional (N.A.), Inc.) (registered investment adviser); Senior Vice President, Invesco Distributors, Inc. (formerly known as Invesco AIM Distributors, Inc.); Director and Vice President, Invesco Investment Services, Inc. (formerly known as Invesco AIM Investment Services, Inc.) Senior Vice President, The Invesco Funds; Managing Director, Invesco Capital Management LLC; Director, Invesco Investment Advisers LLC (formerly known as Van Kampen Asset Management); Senior Vice President, Invesco Capital Markets, Inc. (formerly known as Van Kampen Funds Inc.); Manager, Invesco Indexing LLC; Manager, Invesco Specialized Products, LLC; Member, Invesco Canada Funds Advisory Board; Director, President and Chief Executive Officer, Invesco Corporate Class Inc. (corporate mutual fund company); and Director, Chairman, President and Chief Executive Officer, Invesco Canada Ltd. (formerly known as Invesco Trimark Ltd./Invesco Trimark Ltèe) (registered investment adviser and registered transfer agent); President, Invesco, Inc.; President, Invesco Global Direct Real Estate Feeder GP Ltd.; President, Invesco IP Holdings (Canada) Ltd; President, Invesco Global Direct Real Estate GP Ltd.; President, Invesco Financial Services Ltd. / Services Financiers Invesco Ltée; and Director and Chairman, Invesco Trust Company Formerly: President, Trimark Investments Ltd/Services Financiers Invesco Ltee; Director and Senior Vice President, Invesco Insurance Agency, Inc.; Director and Senior Vice President, Invesco Management Group, Inc. (formerly known as Invesco AIM Management Group, Inc.); Secretary and General Counsel, Invesco Management Group, Inc. (formerly known as Invesco AIM Management Group, Inc.); Secretary, Invesco Investment Services, Inc. (formerly known as Invesco AIM Investment Services, Inc.); Chief Legal Officer and Secretary, The Invesco Funds; Secretary and General Counsel, Invesco Investment Advisers LLC (formerly known as Van Kampen Asset Management); Secretary and General Counsel, Invesco Capital Markets, Inc. (formerly known as Van Kampen Funds Inc.); Chief Legal Officer, Invesco Exchange-Traded Fund Trust, Invesco Exchange-Traded Fund Trust II, Invesco India Exchange-Traded Fund Trust, Invesco Actively Managed Exchange-Traded Fund Trust, Invesco Actively Managed Exchange-Traded Commodity Fund Trust and Invesco Exchange-Traded Self-Indexed Fund Trust; Secretary, Invesco Indexing LLC; Director, Secretary, General Counsel and Senior Vice President, Van Kampen Exchange Corp.; Director, Vice President and Secretary, IVZ Distributors, Inc. (formerly known as INVESCO Distributors, Inc.); Director and Vice President, INVESCO Funds Group, Inc.; Director and Vice President, Van Kampen Advisors Inc.; Director, Vice President, Secretary and General Counsel, Van Kampen Investor Services Inc.;Director and Secretary, Invesco Distributors, Inc. (formerly known as Invesco AIM Distributors, Inc.); Director, Senior Vice President, General Counsel and Secretary, Invesco AIM Advisers, Inc. and Van Kampen Investments Inc.; Director, Vice President and Secretary, Fund Management Company; Director, Senior Vice President, Secretary, General Counsel and Vice President, Invesco AIM Capital Management, Inc.; Chief Operating Officer and General Counsel, Liberty Ridge Capital, Inc. (an investment adviser) | | N/A | | N/A |
| | | | | |
Gregory G. McGreevey –1962
Senior Vice President | | 2012 | | Senior Managing Director, Invesco Ltd.; Director, Chairman, President, and Chief Executive Officer, Invesco Advisers, Inc. (formerly known as Invesco Institutional (N.A.), Inc.) (registered investment adviser); Director, Invesco Mortgage Capital, Inc. and Invesco Senior Secured Management, Inc.; Senior Vice President, The Invesco Funds; President, SNW Asset Management Corporation and Invesco Managed Accounts, LLC; Chairman and Director, Invesco Private Capital, Inc.; Chairman and Director, INVESCO Private Capital Investments, Inc.; Chairman and Director, INVESCO Realty, Inc.; and Senior Vice President, Invesco Group Services, Inc. Formerly: Senior Vice President, Invesco Management Group, Inc. and Invesco Advisers, Inc.; Assistant Vice President, The Invesco Funds | | N/A | | N/A |
| | | | | |
Adrien Deberghes – 1967
Principal Financial Officer,
Treasurer and Vice President | | 2020 | | Head of the Fund Office of the CFO and Fund Administration; Vice President, Invesco Advisers, Inc.; Principal Financial Officer, Treasurer and Vice President, The Invesco Funds; Vice President, Invesco Exchange-Traded Fund Trust, Invesco Exchange-Traded Fund Trust II, Invesco India Exchange-Traded Fund Trust, Invesco Actively Managed Exchange-Traded Fund Trust, Invesco Actively Managed Exchange-Traded Commodity Fund Trust and Invesco Exchange-Traded Self-Indexed Fund Trust Formerly: Senior Vice President and Treasurer, Fidelity Investments | | N/A | | N/A |
| | | | | |
Crissie M. Wisdom – 1969
Anti-Money Laundering
Compliance Officer | | 2013 | | Anti-Money Laundering and OFAC Compliance Officer for Invesco U.S. entities including: Invesco Advisers, Inc. and its affiliates, Invesco Capital Markets, Inc., Invesco Distributors, Inc., Invesco Investment Services, Inc., The Invesco Funds, Invesco Capital Management, LLC, Invesco Trust Company; and Fraud Prevention Manager for Invesco Investment Services, Inc. | | N/A | | N/A |
| | |
| T-5 | | Invesco Short Term Bond Fund |
Trustees and Officers–(continued)
| | | | | | | | |
Name, Year of Birth and Position(s) Held with the Trust | | Trustee and/or Officer Since | | Principal Occupation(s) During Past 5 Years | | Number of Funds in Fund Complex Overseen by Trustee | | Other Directorship(s) Held by Trustee During Past 5 Years |
Officers–(continued) |
| | | | | |
Todd F. Kuehl – 1969
Chief Compliance Officer and Senior Vice President | | 2020 | | Chief Compliance Officer, Invesco Advisers, Inc. (registered investment adviser); and Chief Compliance Officer, The Invesco Funds and Senior Vice President Formerly: Managing Director and Chief Compliance Officer, Legg Mason (Mutual Funds); Chief Compliance Officer, Legg Mason Private Portfolio Group (registered investment adviser) | | N/A | | N/A |
| | | | | |
Michael McMaster – 1962
Chief Tax Officer, Vice President and Assistant Treasurer | | 2020 | | Head of Global Fund Services Tax; Chief Tax Officer, Vice President and Assistant Treasurer, The Invesco Funds; Vice President, Invesco Advisers, Inc.; Assistant Treasurer, Invesco Capital Management LLC, Assistant Treasurer and Chief Tax Officer, Invesco Exchange-Traded Fund Trust, Invesco Exchange-Traded Fund Trust II, Invesco India Exchange-Traded Fund Trust, Invesco Actively Managed Exchange-Traded Fund Trust, Invesco Actively Managed Exchange-Traded Commodity Fund Trust and Invesco Exchange-Traded Self-Indexed Fund Trust; Assistant Treasurer, Invesco Specialized Products, LLC Formerly: Senior Vice President – Managing Director of Tax Services, U.S. Bank Global Fund Services (GFS) | | N/A | | N/A |
The Statement of Additional Information of the Trust includes additional information about the Fund’s Trustees and is available upon request, without charge, by calling 1.800.959.4246. Please refer to the Fund’s Statement of Additional Information for information on the Fund’s sub-advisers.
| | | | | | |
| Office of the Fund | | Investment Adviser | | Distributor | | Auditors |
11 Greenway Plaza, Suite 1000
Houston, TX 77046-1173 | | Invesco Advisers, Inc.
1555 Peachtree Street, N.E.
Atlanta, GA 30309 | | Invesco Distributors, Inc.
11 Greenway Plaza, Suite 1000
Houston, TX 77046-1173 | | PricewaterhouseCoopers LLP
1000 Louisiana Street, Suite 5800
Houston, TX 77002-5678 |
| | | |
| Counsel to the Fund | | Counsel to the Independent Trustees | | Transfer Agent | | Custodian |
Stradley Ronon Stevens & Young, LLP
2005 Market Street, Suite 2600
Philadelphia, PA 19103-7018 | | Goodwin Procter LLP
901 New York Avenue, N.W.
Washington, D.C. 20001 | | Invesco Investment Services, Inc.
11 Greenway Plaza, Suite 1000
Houston, TX 77046-1173 | | State Street Bank and Trust Company
225 Franklin Street
Boston, MA 02110-2801 |
| | |
| T-6 | | Invesco Short Term Bond Fund |

Go paperless with eDelivery
Visit invesco.com/edelivery to enjoy the convenience and security of anytime electronic access to your investment documents.
With eDelivery, you can elect to have any or all of the following materials delivered straight to your inbox to download, save and print from your own computer:
| ∎ | | Fund reports and prospectuses |
Invesco mailing information
Send general correspondence to Invesco Investment Services, Inc., P.O. Box 219078, Kansas City, MO 64121-9078.
Important notice regarding delivery of security holder documents
To reduce Fund expenses, only one copy of most shareholder documents may be mailed to shareholders with multiple accounts at the same address (Householding). Mailing of your shareholder documents may be householded indefinitely unless you instruct us otherwise. If you do not want the mailing of these documents to be combined with those for other members of your household, please contact Invesco Investment Services, Inc. at 800 959 4246 or contact your financial institution. We will begin sending you individual copies for each account within 30 days after receiving your request.
Fund holdings and proxy voting information
The Fund provides a complete list of its portfolio holdings four times each year, at the end of each fiscal quarter. For the second and fourth quarters, the list appears, respectively, in the Fund’s semiannual and annual reports to shareholders. For the first and third quarters, the Fund files the list with the Securities and Exchange Commission (SEC) as an exhibit to its reports on Form N-PORT. The most recent list of portfolio holdings is available at invesco.com/completeqtrholdings. Shareholders can also look up the Fund’s Form N-PORT filings on the SEC website, sec.gov. The SEC file numbers for the Fund are shown below.
A description of the policies and procedures that the Fund uses to determine how to vote proxies relating to portfolio securities is available without charge, upon request, from our Client Services department at 800 959 4246, or at invesco.com/ corporate/about-us/esg. The information is also available on the SEC website, sec.gov.
Information regarding how the Fund voted proxies related to its portfolio securities during the most recent 12-month period ended June 30 is available at invesco.com/proxysearch. This information is also available on the SEC website, sec.gov.
Invesco Advisers, Inc. is an investment adviser; it provides investment advisory services to individual and institutional clients and does not sell securities. Invesco Distributors, Inc. is the US distributor for Invesco Ltd.’s retail mutual funds, exchange-traded funds and institutional money market funds. Both are wholly owned, indirect subsidiaries of Invesco Ltd.
| | | | | | |
| SEC file number(s): 811-05686 and 033-39519 | | Invesco Distributors, Inc. | | STB-AR-1 |

| | |
| Annual Report to Shareholders | | February 28, 2022 |
Invesco U.S. Government Money Portfolio
|
| Nasdaq: |
| Invesco Cash Reserve: GMQXX ∎ C: GMCXX ∎ R: GMLXX ∎ Y: OMBXX ∎ R6: GMRXX |
Management’s Discussion of your Fund
About your Fund
This annual report for Invesco U.S. Government Money Portfolio covers the fiscal year ended February 28, 2022. As of that date, the Fund’s net assets totaled $1.3 billion. As of the same date, the Fund’s weighted average maturity was 31 days and the Fund’s weighted average life was 107 days.1
Market conditions affecting money market funds
In the first quarter of 2021, rising 10-year US Treasury yields increased significantly to 1.74%,2 its highest level since January 2020, reflecting higher inflation expectations. Largely a result of economic optimism, government bond yields rose globally during the first quarter of 2021 as investors began to price in higher levels of economic growth and inflation moving towards a post-pandemic world. Short-term rates, which are closely tied to US Federal Reserve (Fed) policy, remained steady, as the Fed remained accommodative and maintained the federal funds target range at 0.00% to 0.25% throughout 2021 and into 2022.3 As a result, yields on money market funds remained close to the zero bound for the year.
During the second quarter of 2021, the Federal Open Markets Committee (FOMC) moved to increase the rates of interest on excess reserves (IOER) and reverse repo (RRP) by 0.05% to 0.15% and 0.05%3 respectively at the June FOMC meeting, to mitigate the downward pressure on front-end rates given the surge in government money market funds assets in the first half of 2021, which coincided with diminishing supply over the same time frame. Despite higher volatility stemming from inflation concerns and the potential for rising interest rates, investors remained optimistic about the strength of the economic recovery after the Bureau of Economic Analysis reported that US gross domestic product grew at a 6.4% annualized rate for the first quarter of 2021.4 As the US COVID-19 vaccination rate neared the 50% threshold, consumers resumed pre-pandemic activities in the third quarter of 2021 and economically sensitive areas such as the consumer discretionary and industrials sectors began to recover.
In the fourth quarter of 2021, concerns about inflation heightened as US inflation rose to 7%,5 its highest level in nearly 40 years, and money market curves steepened as markets began to anticipate the start of a Fed hiking cycle. The Fed indicated its accommodative policies were coming to an end in 2022 through a willingness to raise
interest rates to combat inflation in 2022 and also announced it would ramp up its tapering of asset purchases.
At the beginning of 2022, geopolitical and economic tensions dominated headlines as Russia invaded Ukraine. Regarding inflation concerns, political uncertainty should give central banks a reason to be cautious. Following the end of the fiscal year, the Fed raised interest rates by 0.25% at the March 2022 Federal Open Market Committee meeting, whereas before this crisis, a 0.50% increase appeared to be increasingly likely.
Thank you for investing in Invesco U.S. Government Money Portfolio. We believe our long-term approach to short-term investing makes us a strong partner for investors seeking premier liquidity management.
1 Weighted average maturity (WAM) is an average of the maturities of all securities held in the portfolio, weighted by each security’s percentage of net assets. The days to maturity for WAM is the lower of the stated maturity date or next interest rate reset date. WAM reflects how a portfolio would react to interest rate changes. Weighted average life (WAL) is an average of all the maturities of all securities held in the portfolio, weighted by each security’s percentage of net assets. The days to maturity for WAL is the lower of the stated maturity date or next demand feature date. WAL reflects how a portfolio would react to deteriorating credit (widening spreads) or tightening liquidity conditions.
2 Source: US Department of the Treasury
3 Source: US Federal Reserve
4 Source: US Bureau of Economic Statistics
5 Source: US Bureau of Labor Statistics
Team managed by Invesco Advisers, Inc.
The views and opinions expressed in management’s discussion of Fund performance are those of Invesco Advisers, Inc. and its affiliates. These views and opinions are subject to change at any time based on factors such as market and economic conditions. These views and opinions may not be relied upon as investment advice or recommendations, or as an offer for a particular security. The information is not a complete analysis of every aspect of any market, country, industry, security or the Fund. Statements of fact are from sources considered reliable, but Invesco Advisers, Inc. makes no representation or warranty as to their completeness or accuracy. Although historical performance is no guarantee of future results, these insights may help you understand our investment management philosophy.
See important Fund and, if applicable, index disclosures later in this report.
| | | | |
Portfolio Composition by Maturity* In days, as of 02/28/2022 | |
1-7 | | | 28.3 | % |
8-30 | | | 8.2 | |
31-60 | | | 18.9 | |
61-90 | | | 8.8 | |
91-180 | | | 17.4 | |
181+ | | | 18.4 | |
* The number of days to maturity of each holding is determined in accordance with the provisions of Rule 2a-7 under the Investment Company Act of 1940.
You could lose money by investing in the Fund. Although the Fund seeks to preserve your investment at $1.00 per share, it cannot guarantee it will do so. An investment in the Fund is not insured or guaranteed by the Federal Deposit Insurance Corporation or any other government agency. The Fund’s sponsor has no legal obligation to provide financial support to the Fund, and you should not expect that the sponsor will provide financial support to the Fund at any time.
| | |
| 2 | | Invesco U.S. Government Money Portfolio |
Invesco U.S. Government Money Portfolio’s investment objective is to seek income consistent with stability of principal.
∎Unless otherwise stated, information presented in this report is as of February 28, 2022, and is based on total net assets.
∎Unless otherwise noted, all data is provided by Invesco.
∎To access your Fund’s reports/prospectus, visit invesco.com/fundreports.
| | |
This report must be accompanied or preceded by a currently effective Fund prospectus, which contains more complete information, including sales charges and expenses. Investors should read it carefully before investing. | | |
|
| NOT FDIC INSURED | MAY LOSE VALUE | NO BANK GUARANTEE |
| | |
| 3 | | Invesco U.S. Government Money Portfolio |
Schedule of Investments
February 28, 2022
| | | | | | | | | | | | | | | | |
| | | Interest
Rate | | | Maturity
Date | | | Principal
Amount
(000) | | | Value | |
|
| |
U.S. Treasury Securities-61.46% | | | | | | | | | | | | | | | | |
U.S. Treasury Bills-50.79%(a) | | | | | | | | | | | | | | | | |
| | | | |
U.S. Treasury Bills | | | 0.06 | % | | | 03/01/2022 | | | $ | 6,000 | | | $ | 6,000,000 | |
| | | | |
U.S. Treasury Bills | | | 0.05 | % | | | 03/03/2022 | | | | 35,000 | | | | 34,999,903 | |
| | | | |
U.S. Treasury Bills | | | 0.06 | % | | | 03/10/2022 | | | | 25,000 | | | | 24,999,656 | |
| | | | |
U.S. Treasury Bills | | | 0.05 | % | | | 03/15/2022 | | | | 10,000 | | | | 9,999,817 | |
| | | | |
U.S. Treasury Bills | | | 0.06 | % | | | 03/17/2022 | | | | 30,000 | | | | 29,999,267 | |
| | | | |
U.S. Treasury Bills | | | 0.08 | % | | | 03/22/2022 | | | | 25,000 | | | | 24,998,833 | |
| | | | |
U.S. Treasury Bills | | | 0.07 | % | | | 03/29/2022 | | | | 11,000 | | | | 10,999,397 | |
| | | | |
U.S. Treasury Bills | | | 0.09 | % | | | 03/31/2022 | | | | 30,000 | | | | 29,997,875 | |
| | | | |
U.S. Treasury Bills | | | 0.14 | % | | | 04/05/2022 | | | | 28,000 | | | | 27,996,189 | |
| | | | |
U.S. Treasury Bills | | | 0.09 | % | | | 04/07/2022 | | | | 30,000 | | | | 29,997,225 | |
| | | | |
U.S. Treasury Bills | | | 0.25 | % | | | 04/12/2022 | | | | 35,000 | | | | 34,989,792 | |
| | | | |
U.S. Treasury Bills | | | 0.25 | % | | | 04/19/2022 | | | | 15,000 | | | | 14,994,896 | |
| | | | |
U.S. Treasury Bills | | | 0.07 | % | | | 04/21/2022 | | | | 29,000 | | | | 28,997,330 | |
| | | | |
U.S. Treasury Bills | | | 0.11 | % | | | 04/26/2022 | | | | 80,000 | | | | 79,980,711 | |
| | | | |
U.S. Treasury Bills | | | 0.19 | % | | | 04/28/2022 | | | | 8,000 | | | | 7,997,551 | |
| | | | |
U.S. Treasury Bills | | | 0.24 | % | | | 05/05/2022 | | | | 40,000 | | | | 39,982,667 | |
| | | | |
U.S. Treasury Bills | | | 0.29 | % | | | 05/12/2022 | | | | 25,000 | | | | 24,985,500 | |
| | | | |
U.S. Treasury Bills | | | 0.23 | % | | | 05/17/2022 | | | | 10,000 | | | | 9,995,078 | |
| | | | |
U.S. Treasury Bills | | | 0.28 | % | | | 05/24/2022 | | | | 5,000 | | | | 4,996,792 | |
| | | | |
U.S. Treasury Bills | | | 0.38 | % | | | 05/26/2022 | | | | 14,000 | | | | 13,987,291 | |
| | | | |
U.S. Treasury Bills | | | 0.28 | % | | | 05/31/2022 | | | | 25,000 | | | | 24,982,305 | |
| | | | |
U.S. Treasury Bills | | | 0.09 | % | | | 06/02/2022 | | | | 48,000 | | | | 47,961,740 | |
| | | | |
U.S. Treasury Bills | | | 0.34 | % | | | 06/07/2022 | | | | 20,000 | | | | 19,981,489 | |
| | | | |
U.S. Treasury Bills | | | 0.11 | % | | | 06/09/2022 | | | | 3,000 | | | | 2,999,125 | |
| | | | |
U.S. Treasury Bills | | | 0.07 | % | | | 06/16/2022 | | | | 10,000 | | | | 9,997,919 | |
| | | | |
U.S. Treasury Bills | | | 0.55 | % | | | 06/21/2022 | | | | 15,000 | | | | 14,974,333 | |
| | | | |
U.S. Treasury Bills | | | 0.57 | % | | | 06/28/2022 | | | | 25,000 | | | | 24,952,896 | |
| | | | |
U.S. Treasury Bills | | | 0.08 | % | | | 07/14/2022 | | | | 7,000 | | | | 6,998,031 | |
| | | | |
U.S. Treasury Bills | | | 0.08 | % | | | 08/11/2022 | | | | 20,000 | | | | 19,992,756 | |
| | | | |
U.S. Treasury Bills | | | 0.71 | % | | | 08/25/2022 | | | | 14,000 | | | | 13,951,128 | |
U.S. Treasury Bills | | | 0.08 | % | | | 09/08/2022 | | | | 8,000 | | | | 7,996,817 | |
| |
| | | | | | | | | | | | | | | 685,684,309 | |
| |
| | | | |
U.S. Treasury Floating Rate Notes-10.22% | | | | | | | | | | | | | | | | |
| | | | |
U.S. Treasury Floating Rate Notes (3 mo. U.S. Treasury Bill Money Market Yield Rate + 0.11%)(b) | | | 0.47 | % | | | 04/30/2022 | | | | 10,000 | | | | 10,000,266 | |
| | | | |
U.S. Treasury Floating Rate Notes (3 mo. U.S. Treasury Bill Money Market Yield Rate + 0.06%)(b) | | | 0.42 | % | | | 10/31/2022 | | | | 25,000 | | | | 24,999,898 | |
| | | | |
U.S. Treasury Floating Rate Notes (3 mo. U.S. Treasury Bill Money Market Yield Rate + 0.05%)(b) | | | 0.41 | % | | | 01/31/2023 | | | | 10,000 | | | | 10,000,149 | |
| | | | |
U.S. Treasury Floating Rate Notes (3 mo. U.S. Treasury Bill Money Market Yield Rate + 0.03%)(b) | | | 0.39 | % | | | 04/30/2023 | | | | 38,000 | | | | 38,001,227 | |
| | | | |
U.S. Treasury Floating Rate Notes (3 mo. U.S. Treasury Bill Money Market Yield Rate + 0.03%)(b) | | | 0.39 | % | | | 07/31/2023 | | | | 21,000 | | | | 21,000,301 | |
| | | | |
U.S. Treasury Floating Rate Notes (3 mo. U.S. Treasury Bill Money Market Yield Rate + 0.04%)(b) | | | 0.40 | % | | | 10/31/2023 | | | | 29,000 | | | | 29,000,354 | |
U.S. Treasury Floating Rate Notes (3 mo. U.S. Treasury Bill Money Market Yield Rate -0.02%)(b) | | | 0.35 | % | | | 01/31/2024 | | | | 5,000 | | | | 4,998,349 | |
| |
| | | | | | | | | | | | | | | 138,000,544 | |
| |
| | | | |
U.S. Treasury Notes-0.45% | | | | | | | | | | | | | | | | |
| | | | |
U.S. Treasury Notes (Cost $6,047,714) | | | 2.00 | % | | | 07/31/2022 | | | | 6,000 | | | | 6,047,714 | |
| |
Total U.S. Treasury Securities (Cost $829,732,567) | | | | | | | | | | | | | | | 829,732,567 | |
| |
See accompanying Notes to Financial Statements which are an integral part of the financial statements.
| | |
| 4 | | Invesco U.S. Government Money Portfolio |
| | | | | | | | | | | | | | | | |
| | | Interest
Rate | | | Maturity
Date | | | Principal
Amount
(000) | | | Value | |
|
| |
U.S. Government Sponsored Agency Securities-13.33% | | | | | | | | | | | | | | | | |
Federal Farm Credit Bank (FFCB)-9.63% | | | | | | | | | | | | | | | | |
| | | | |
Federal Farm Credit Bank (SOFR + 0.04%)(b) | | | 0.09 | % | | | 07/11/2022 | | | $ | 10,000 | | | $ | 9,999,816 | |
| | | | |
Federal Farm Credit Bank (SOFR + 0.19%)(b) | | | 0.24 | % | | | 07/14/2022 | | | | 7,000 | | | | 7,000,000 | |
| | | | |
Federal Farm Credit Bank (SOFR + 0.07%)(b) | | | 0.12 | % | | | 08/11/2022 | | | | 20,000 | | | | 19,999,997 | |
| | | | |
Federal Farm Credit Bank (SOFR + 0.03%)(b) | | | 0.08 | % | | | 10/12/2022 | | | | 7,000 | | | | 6,999,869 | |
| | | | |
Federal Farm Credit Bank (SOFR + 0.01%)(b) | | | 0.06 | % | | | 11/16/2022 | | | | 7,000 | | | | 6,999,899 | |
| | | | |
Federal Farm Credit Bank (SOFR + 0.07%)(b) | | | 0.12 | % | | | 11/18/2022 | | | | 5,000 | | | | 5,000,000 | |
| | | | |
Federal Farm Credit Bank (SOFR + 0.06%)(b) | | | 0.11 | % | | | 12/28/2022 | | | | 5,000 | | | | 5,000,000 | |
| | | | |
Federal Farm Credit Bank (SOFR + 0.06%)(b) | | | 0.11 | % | | | 01/20/2023 | | | | 5,000 | | | | 5,000,000 | |
| | | | |
Federal Farm Credit Bank (SOFR + 0.06%)(b) | | | 0.11 | % | | | 02/09/2023 | | | | 7,000 | | | | 7,000,000 | |
| | | | |
Federal Farm Credit Bank (SOFR + 0.05%)(b) | | | 0.10 | % | | | 02/17/2023 | | | | 9,000 | | | | 9,000,000 | |
| | | | |
Federal Farm Credit Bank (SOFR + 0.04%)(b) | | | 0.09 | % | | | 03/10/2023 | | | | 6,000 | | | | 6,000,000 | |
| | | | |
Federal Farm Credit Bank (SOFR + 0.04%)(b) | | | 0.09 | % | | | 05/19/2023 | | | | 3,000 | | | | 3,000,000 | |
| | | | |
Federal Farm Credit Bank (SOFR + 0.03%)(b) | | | 0.08 | % | | | 06/14/2023 | | | | 3,500 | | | | 3,500,000 | |
| | | | |
Federal Farm Credit Bank (SOFR + 0.02%)(b) | | | 0.07 | % | | | 06/23/2023 | | | | 7,000 | | | | 6,999,606 | |
| | | | |
Federal Farm Credit Bank (SOFR + 0.03%)(b) | | | 0.08 | % | | | 07/07/2023 | | | | 4,000 | | | | 4,000,000 | |
| | | | |
Federal Farm Credit Bank (SOFR + 0.04%)(b) | | | 0.09 | % | | | 09/20/2023 | | | | 8,000 | | | | 8,000,000 | |
| | | | |
Federal Farm Credit Bank (SOFR + 0.05%)(b) | | | 0.10 | % | | | 09/29/2023 | | | | 3,000 | | | | 3,000,000 | |
| | | | |
Federal Farm Credit Bank (SOFR + 0.05%)(b) | | | 0.10 | % | | | 10/16/2023 | | | | 2,000 | | | | 2,000,000 | |
| | | | |
Federal Farm Credit Bank (SOFR + 0.06%)(b) | | | 0.11 | % | | | 12/13/2023 | | | | 3,000 | | | | 3,000,000 | |
| | | | |
Federal Farm Credit Bank (SOFR + 0.06%)(b) | | | 0.11 | % | | | 01/10/2024 | | | | 4,000 | | | | 4,000,000 | |
Federal Farm Credit Bank (SOFR + 0.04%)(b) | | | 0.09 | % | | | 01/25/2024 | | | | 4,500 | | | | 4,500,000 | |
| |
| | | | | | | | | | | | | | | 129,999,187 | |
| |
| | | | |
Federal Home Loan Bank (FHLB)-2.59% | | | | | | | | | | | | | | | | |
| | | | |
Federal Home Loan Bank (SOFR + 0.06%)(b) | | | 0.11 | % | | | 05/12/2022 | | | | 15,000 | | | | 15,000,000 | |
| | | | |
Federal Home Loan Bank (SOFR + 0.07%)(b) | | | 0.12 | % | | | 11/10/2022 | | | | 5,000 | | | | 5,000,000 | |
Federal Home Loan Bank (SOFR + 0.06%)(b) | | | 0.11 | % | | | 12/08/2022 | | | | 15,000 | | | | 15,000,000 | |
| |
| | | | | | | | | | | | | | | 35,000,000 | |
| |
| | | | |
Federal National Mortgage Association (FNMA)-1.11% | | | | | | | | | | | | | | | | |
| | | | |
Federal National Mortgage Association (SOFR + 0.22%)(b) | | | 0.27 | % | | | 03/16/2022 | | | | 10,000 | | | | 10,000,000 | |
Federal National Mortgage Association (SOFR + 0.20%)(b) | | | 0.25 | % | | | 06/15/2022 | | | | 5,000 | | | | 5,000,000 | |
| |
| | | | | | | | | | | | | | | 15,000,000 | |
| |
Total U.S. Government Sponsored Agency Securities
(Cost $179,999,187) | | | | | | | | | | | | | | | 179,999,187 | |
| |
TOTAL INVESTMENTS IN SECURITIES (excluding Repurchase Agreements)-74.79%
(Cost $1,009,731,754) | | | | | | | | | | | | | | | 1,009,731,754 | |
| |
| | | | |
| | | | | | | | | Repurchase
Amount | | | | |
| | | | |
Repurchase Agreements-32.97%(c) | | | | | | | | | | | | | | | | |
| | | | |
Credit Agricole Corporate & Investment Bank, agreement dated 02/28/2022, maturing value of $130,000,181 (collateralized by domestic agency mortgage-backed securities valued at $132,600,184;
1.50% - 3.50%; 03/01/2036 - 12/01/2051) | | | 0.05 | % | | | 03/01/2022 | | | | 130,000,181 | | | | 130,000,000 | |
| | | | |
RBC Dominion Securities Inc., agreement dated 02/28/2022, maturing value of $145,000,201 (collateralized by domestic agency mortgage-backed securities valued at $147,900,206; 2.50% - 4.50%;
07/01/2048 - 10/20/2051) | | | 0.05 | % | | | 03/01/2022 | | | | 145,000,201 | | | | 145,000,000 | |
TD Securities (USA) LLC, term agreement dated 02/23/2022, maturing value of $170,001,818 (collateralized by domestic agency mortgage-backed securities valued at $174,527,944; 2.00% - 5.99%;
06/20/2049 - 02/01/2052)(d) | | | 0.06 | % | | | 03/02/2022 | | | | 170,001,818 | | | | 170,000,000 | |
| |
Total Repurchase Agreements (Cost $445,000,000) | | | | | | | | | | | | | | | 445,000,000 | |
| |
TOTAL INVESTMENTS IN SECURITIES(e)-107.76%
(Cost $1,454,731,754) | | | | | | | | | | | | | | | 1,454,731,754 | |
| |
OTHER ASSETS LESS LIABILITIES-(7.76)% | | | | | | | | | | | | | | | (104,781,513 | ) |
| |
NET ASSETS-100.00% | | | | | | | | | | | | | | $ | 1,349,950,241 | |
| |
Investment Abbreviations:
SOFR -Secured Overnight Financing Rate
See accompanying Notes to Financial Statements which are an integral part of the financial statements.
| | |
| 5 | | Invesco U.S. Government Money Portfolio |
Notes to Schedule of Investments:
| (a) | Security traded on a discount basis. The interest rate shown represents the discount rate at the time of purchase by the Fund. |
| (b) | Interest or dividend rate is redetermined periodically. Rate shown is the rate in effect on February 28, 2022. |
| (c) | Principal amount equals value at period end. See Note 1I. |
| (d) | The Fund may demand payment of the term repurchase agreement upon one to seven business days’ notice depending on the timing of the demand. |
| (e) | Also represents cost for federal income tax purposes. |
See accompanying Notes to Financial Statements which are an integral part of the financial statements.
| | |
| 6 | | Invesco U.S. Government Money Portfolio |
Statement of Assets and Liabilities
February 28, 2022
| | | | |
Assets: | | | | |
| |
Investments in unaffiliated securities, excluding
repurchase agreements, at value and cost | | $ | 1,009,731,754 | |
Repurchase agreements, at value and cost | | | 445,000,000 | |
Cash | | | 536,243 | |
Receivable for: | | | | |
Fund shares sold | | | 1,214,825 | |
Interest | | | 80,070 | |
Fund expenses absorbed | | | 470,070 | |
Investment for trustee deferred compensation and
retirement plans | | | 129,002 | |
Total assets | | | 1,457,161,964 | |
| |
Liabilities: | | | | |
Payable for: | | | | |
Investments purchased | | | 104,904,051 | |
Fund shares reacquired | | | 1,651,833 | |
Dividends | | | 130 | |
Accrued fees to affiliates | | | 380,905 | |
Accrued trustees’ and officers’ fees and benefits | | | 2,549 | |
Accrued operating expenses | | | 49,039 | |
Trustee deferred compensation and retirement plans | | | 223,216 | |
Total liabilities | | | 107,211,723 | |
Net assets applicable to shares outstanding | | $ | 1,349,950,241 | |
| | | | |
Net assets consist of: | | | | |
| |
Shares of beneficial interest | | $ | 1,350,180,020 | |
| |
Distributable earnings (loss) | | | (229,779 | ) |
| | | $ | 1,349,950,241 | |
| |
Net Assets: | | | | |
| |
Invesco Cash Reserve | | $ | 53,480,818 | |
| |
Class C | | $ | 8,104,572 | |
| |
Class R | | $ | 5,041,619 | |
| |
Class Y | | $ | 1,283,313,232 | |
| |
Class R6 | | $ | 10,000 | |
| |
Shares outstanding, no par value,
unlimited number of shares authorized: | | | | |
| |
Invesco Cash Reserve | | | 53,480,529 | |
| |
Class C | | | 8,104,502 | |
| |
Class R | | | 5,041,589 | |
| |
Class Y | | | 1,283,306,604 | |
| |
Class R6 | | | 10,000 | |
| |
Net asset value, offering and redemption price per share for each class | | $ | 1.00 | |
See accompanying Notes to Financial Statements which are an integral part of the financial statements.
| | |
| 7 | | Invesco U.S. Government Money Portfolio |
Statement of Operations
For the year ended February 28, 2022
| | | | |
Investment income: | | | | |
| |
Interest | | $ | 1,050,618 | |
| |
Expenses: | | | | |
| |
Advisory fees | | | 5,859,859 | |
| |
Administrative services fees | | | 625,236 | |
| |
Custodian fees | | | 9,455 | |
| |
Distribution fees: | | | | |
Invesco Cash Reserve | | | 75,543 | |
Class C | | | 85,257 | |
Class R | | | 25,228 | |
Transfer agent fees - Invesco Cash Reserve, C, R and Y | | | 2,910,073 | |
Transfer agent fees - R6 | | | 5 | |
Trustees’ and officers’ fees and benefits | | | 38,966 | |
Registration and filing fees | | | 96,991 | |
Reports to shareholders | | | 110,057 | |
Professional services fees | | | 48,466 | |
Other | | | 23,170 | |
Total expenses | | | 9,908,306 | |
Less: Fees waived, expenses reimbursed and expense offset arrangement(s) | | | (8,923,228 | ) |
Net expenses | | | 985,078 | |
Net investment income | | | 65,540 | |
Net realized gain (loss) from unaffiliated investment securities | | | (7,637 | ) |
Net increase in net assets resulting from operations | | $ | 57,903 | |
See accompanying Notes to Financial Statements which are an integral part of the financial statements.
| | |
| 8 | | Invesco U.S. Government Money Portfolio |
Statement of Changes in Net Assets
For the year ended February 28, 2022 and 2021
| | | | | | | | |
| | | 2022 | | | 2021 | |
Operations: | | | | | | | | |
| | |
Net investment income | | $ | 65,540 | | | $ | 618,237 | |
|
| |
| | |
Net realized gain (loss) | | | (7,637 | ) | | | 5,310 | |
Net increase in net assets resulting from operations | | | 57,903 | | | | 623,547 | |
| | |
Distributions to shareholders from distributable earnings: | | | | | | | | |
| | |
Invesco Cash Reserve | | | (2,953 | ) | | | (8,309 | ) |
|
| |
| | |
Class C | | | (502 | ) | | | (1,070 | ) |
|
| |
| | |
Class R | | | (293 | ) | | | (573 | ) |
|
| |
| | |
Class Y | | | (61,788 | ) | | | (608,278 | ) |
|
| |
| | |
Class R6 | | | (4 | ) | | | (7 | ) |
|
| |
Total distributions from distributable earnings | | | (65,540 | ) | | | (618,237 | ) |
|
| |
| | |
Share transactions-net: | | | | | | | | |
| | |
Invesco Cash Reserve | | | (7,223,024 | ) | | | 47,829,569 | |
|
| |
| | |
Class C | | | (2,914,449 | ) | | | 8,705,815 | |
|
| |
| | |
Class R | | | (815,540 | ) | | | 4,757,966 | |
|
| |
| | |
Class Y | | | (187,178,723 | ) | | | (88,128,122 | ) |
|
| |
Net increase (decrease) in net assets resulting from share transactions | | | (198,131,736 | ) | | | (26,834,772 | ) |
|
| |
Net increase (decrease) in net assets | | | (198,139,373 | ) | | | (26,829,462 | ) |
|
| |
| | |
Net assets: | | | | | | | | |
| | |
Beginning of year | | | 1,548,089,614 | | | | 1,574,919,076 | |
|
| |
| | |
End of year | | $ | 1,349,950,241 | | | $ | 1,548,089,614 | |
|
| |
See accompanying Notes to Financial Statements which are an integral part of the financial statements.
| | |
| 9 | | Invesco U.S. Government Money Portfolio |
Financial Highlights
The following schedule presents financial highlights for a share of the Fund outstanding throughout the periods indicated.
| | | | | | | | | | | | | | | | | | | | | | | | | | | | | | | | | | | | | | | | | | | | | | | | | | | | | | | | | | | | | | | | | |
| | | Net asset
value,
beginning
of period | | Net
investment
income(a) | | Net gains
(losses) on securities
(both
realized and
unrealized) | | Total from
investment
operations | | Dividends
from net
investment
income | | Distributions
from net
realized
gains | | Total
distributions | | Net asset
value, end
of period | | Total
return(b) | | Net assets, end of period
(000’s omitted) | | Ratio of
expenses
to average net assets with fee waivers
and/or expenses
absorbed | | Ratio of
expenses
to average net assets
without
fee waivers
and/or expenses
absorbed(c) | | Ratio of net
investment
income
to average
net assets |
Invesco Cash Reserve | | | | | | | | | | | | | | | | | | | | | | | | | | | | | | | | | | | | | | | | | | | | | | | | | | | | | | | | | | | | | | | | | |
Year ended 02/28/22 | | | | $1.00 | | | | | $0.00 | | | | | $(0.00 | ) | | | | $0.00 | | | | | $(0.00 | ) | | | | $ - | | | | | $(0.00 | ) | | | | $1.00 | | | | | 0.01 | % | | | | $ 53,481 | | | | | 0.07 | % | | | | 0.83 | % | | | | 0.00 | % |
Year ended 02/28/21 | | | | 1.00 | | | | | 0.00 | | | | | 0.00 | | | | | 0.00 | | | | | (0.00 | ) | | | | - | | | | | (0.00 | ) | | | | 1.00 | | | | | 0.03 | | | | | 60,704 | | | | | 0.18 | | | | | 0.89 | | | | | 0.04 | |
Seven months ended 02/29/20 | | | | 1.00 | | | | | 0.01 | | | | | (0.00 | ) | | | | 0.01 | | | | | (0.01 | ) | | | | - | | | | | (0.01 | ) | | | | 1.00 | | | | | 0.66 | | | | | 12,874 | | | | | 0.72 | (d) | | | | 0.94 | (d) | | | | 1.14 | (d) |
Period ended 07/31/19(e) | | | | 1.00 | | | | | 0.00 | | | | | 0.00 | | | | | 0.00 | | | | | (0.00 | ) | | | | (0.00 | ) | | | | (0.00 | ) | | | | 1.00 | | | | | 0.30 | | | | | 3,285 | | | | | 0.67 | (d) | | | | 0.86 | (d) | | | | 1.67 | (d) |
Class C | | | | | | | | | | | | | | | | | | | | | | | | | | | | | | | | | | | | | | | | | | | | | | | | | | | | | | | | | | | | | | | | | |
Year ended 02/28/22 | | | | 1.00 | | | | | 0.00 | | | | | (0.00 | ) | | | | 0.00 | | | | | (0.00 | ) | | | | - | | | | | (0.00 | ) | | | | 1.00 | | | | | 0.01 | | | | | 8,105 | | | | | 0.07 | | | | | 1.68 | | | | | 0.00 | |
Year ended 02/28/21 | | | | 1.00 | | | | | 0.00 | | | | | 0.00 | | | | | 0.00 | | | | | (0.00 | ) | | | | - | | | | | (0.00 | ) | | | | 1.00 | | | | | 0.01 | | | | | 11,019 | | | | | 0.19 | | | | | 1.74 | | | | | 0.03 | |
Seven months ended 02/29/20 | | | | 1.00 | | | | | 0.00 | | | | | (0.00 | ) | | | | 0.00 | | | | | (0.00 | ) | | | | - | | | | | (0.00 | ) | | | | 1.00 | | | | | 0.17 | | | | | 2,313 | | | | | 1.55 | (d) | | | | 1.79 | (d) | | | | 0.31 | (d) |
Period ended 07/31/19(e) | | | | 1.00 | | | | | 0.00 | | | | | 0.00 | | | | | 0.00 | | | | | (0.00 | ) | | | | (0.00 | ) | | | | (0.00 | ) | | | | 1.00 | | | | | 0.16 | | | | | 497 | | | | | 1.43 | (d) | | | | 1.64 | (d) | | | | 0.91 | (d) |
Class R | | | | | | | | | | | | | | | | | | | | | | | | | | | | | | | | | | | | | | | | | | | | | | | | | | | | | | | | | | | | | | | | | |
Year ended 02/28/22 | | | | 1.00 | | | | | 0.00 | | | | | (0.00 | ) | | | | 0.00 | | | | | (0.00 | ) | | | | - | | | | | (0.00 | ) | | | | 1.00 | | | | | 0.01 | | | | | 5,042 | | | | | 0.07 | | | | | 1.18 | | | | | 0.00 | |
Year ended 02/28/21 | | | | 1.00 | | | | | 0.00 | | | | | 0.00 | | | | | 0.00 | | | | | (0.00 | ) | | | | - | | | | | (0.00 | ) | | | | 1.00 | | | | | 0.02 | | | | | 5,857 | | | | | 0.19 | | | | | 1.24 | | | | | 0.03 | |
Seven months ended 02/29/20 | | | | 1.00 | | | | | 0.00 | | | | | (0.00 | ) | | | | 0.00 | | | | | (0.00 | ) | | | | - | | | | | (0.00 | ) | | | | 1.00 | | | | | 0.46 | | | | | 1,099 | | | | | 1.05 | (d) | | | | 1.28 | (d) | | | | 0.81 | (d) |
Period ended 07/31/19(e) | | | | 1.00 | | | | | 0.00 | | | | | 0.00 | | | | | 0.00 | | | | | (0.00 | ) | | | | (0.00 | ) | | | | (0.00 | ) | | | | 1.00 | | | | | 0.23 | | | | | 182 | | | | | 1.08 | (d) | | | | 1.08 | (d) | | | | 1.27 | (d) |
Class Y | | | | | | | | | | | | | | | | | | | | | | | | | | | | | | | | | | | | | | | | | | | | | | | | | | | | | | | | | | | | | | | | | |
Year ended 02/28/22 | | | | 1.00 | | | | | 0.00 | | | | | (0.00 | ) | | | | 0.00 | | | | | (0.00 | ) | | | | - | | | | | (0.00 | ) | | | | 1.00 | | | | | 0.01 | | | | | 1,283,313 | | | | | 0.07 | | | | | 0.68 | | | | | 0.00 | |
Year ended 02/28/21 | | | | 1.00 | | | | | 0.00 | | | | | 0.00 | | | | | 0.00 | | | | | (0.00 | ) | | | | - | | | | | (0.00 | ) | | | | 1.00 | | | | | 0.04 | | | | | 1,470,499 | | | | | 0.18 | | | | | 0.74 | | | | | 0.04 | |
Seven months ended 02/29/20 | | | | 1.00 | | | | | 0.01 | | | | | (0.00 | ) | | | | 0.01 | | | | | (0.01 | ) | | | | - | | | | | (0.01 | ) | | | | 1.00 | | | | | 0.74 | | | | | 1,558,623 | | | | | 0.58 | (d) | | | | 0.80 | (d) | | | | 1.28 | (d) |
Year ended 07/31/19 | | | | 1.00 | | | | | 0.02 | | | | | 0.00 | | | | | 0.02 | | | | | (0.02 | ) | | | | (0.00 | ) | | | | (0.02 | ) | | | | 1.00 | | | | | 1.77 | | | | | 1,669,766 | | | | | 0.58 | | | | | 0.62 | | | | | 1.76 | |
Year ended 07/31/18 | | | | 1.00 | | | | | 0.01 | | | | | (0.00 | ) | | | | 0.01 | | | | | (0.01 | ) | | | | - | | | | | (0.01 | ) | | | | 1.00 | | | | | 0.84 | | | | | 40,384 | | | | | 0.60 | | | | | 0.61 | | | | | 0.83 | |
Year ended 07/31/17 | | | | 1.00 | | | | | 0.00 | | | | | 0.00 | | | | | 0.00 | | | | | (0.00 | ) | | | | - | | | | | (0.00 | ) | | | | 1.00 | | | | | 0.10 | | | | | 42,261 | | | | | 0.51 | | | | | 0.64 | | | | | 0.07 | |
Class R6 | | | | | | | | | | | | | | | | | | | | | | | | | | | | | | | | | | | | | | | | | | | | | | | | | | | | | | | | | | | | | | | | | |
Year ended 02/28/22 | | | | 1.00 | | | | | 0.00 | | | | | (0.00 | ) | | | | 0.00 | | | | | (0.00 | ) | | | | - | | | | | (0.00 | ) | | | | 1.00 | | | | | 0.01 | | | | | 10 | | | | | 0.07 | | | | | 0.53 | | | | | 0.00 | |
Year ended 02/28/21 | | | | 1.00 | | | | | 0.00 | | | | | 0.00 | | | | | 0.00 | | | | | (0.00 | ) | | | | - | | | | | (0.00 | ) | | | | 1.00 | | | | | 0.05 | | | | | 10 | | | | | 0.16 | | | | | 0.57 | | | | | 0.06 | |
Seven months ended 02/29/20 | | | | 1.00 | | | | | 0.01 | | | | | (0.00 | ) | | | | 0.01 | | | | | (0.01 | ) | | | | - | | | | | (0.01 | ) | | | | 1.00 | | | | | 0.80 | | | | | 10 | | | | | 0.48 | (d) | | | | 0.54 | (d) | | | | 1.38 | (d) |
Period ended 07/31/19(e) | | | | 1.00 | | | | | 0.00 | | | | | 0.00 | | | | | 0.00 | | | | | (0.00 | ) | | | | (0.00 | ) | | | | (0.00 | ) | | | | 1.00 | | | | | 0.34 | | | | | 10 | | | | | 0.48 | (d) | | | | 0.48 | (d) | | | | 1.88 | (d) |
| (a) | Calculated using average shares outstanding. |
| (b) | Includes adjustments in accordance with accounting principles generally accepted in the United States of America and does not include sales charges and is not annualized for periods less than one year, if applicable. |
| (c) | Does not include indirect expenses from affiliated fund fees and expenses of 0.00% for the seven months ended February 29, 2020 and the years ended July 31, 2019, 2018 and 2017, respectively. |
| (e) | Commencement date after the close of business on May 24, 2019. |
See accompanying Notes to Financial Statements which are an integral part of the financial statements.
| | |
| 10 | | Invesco U.S. Government Money Portfolio |
Notes to Financial Statements
February 28, 2022
NOTE 1–Significant Accounting Policies
Invesco U.S. Government Money Portfolio, (the “Fund”) is a series portfolio of AIM Investment Securities Funds (Invesco Investment Securities Funds) (the “Trust”). The Trust is a Delaware statutory trust registered under the Investment Company Act of 1940, as amended (the “1940 Act”), as an open-end series management investment company authorized to issue an unlimited number of shares of beneficial interest. Information presented in these financial statements pertains only to the Fund. Matters affecting the Fund or each class will be voted on exclusively by the shareholders of such Fund or each class.
The Fund’s investment objective is to seek income consistent with stability of principal.
The Fund currently consists of five different classes of shares: Invesco Cash Reserve, Class C, Class R, Class Y and Class R6. Class Y shares are available only to certain investors. Class C shares are sold with a contingent deferred sales charges (“CDSC”). Invesco Cash Reserve, Class R, Class Y and Class R6 shares are sold at net asset value. Class C shares held for eight years after purchase are eligible for automatic conversion into Invesco Cash Reserve shares of the same Fund (the “Conversion Feature”). The automatic conversion pursuant to the Conversion Feature will generally occur at the end of the month following the eighth anniversary after a purchase of Class C shares.
The Fund is an investment company and accordingly follows the investment company accounting and reporting guidance in accordance with Financial Accounting Standards Board Accounting Standards Codification Topic 946, Financial Services – Investment Companies.
The Fund is a “government money market fund” as defined in Rule 2a-7 under the 1940 Act and seeks to maintain a stable or constant NAV of $1.00 per share using an amortized cost method of valuation. “Government money market funds” are required to invest at least 99.5% of their total assets in cash, Government Securities (as defined in the 1940 Act), and/ or repurchase agreements collateralized fully by cash or Government Securities. The Board of Trustees has elected not to subject the Fund to the liquidity fee and redemption gate requirement at this time, as permitted by Rule 2a-7.
The following is a summary of the significant accounting policies followed by the Fund in the preparation of its financial statements.
| A. | Security Valuations - The Fund’s securities are recorded on the basis of amortized cost which approximates value as permitted by Rule 2a-7 under the 1940 Act. This method values a security at its cost on the date of purchase and, thereafter, assumes a constant amortization to maturity of any premiums or accretion of any discounts. |
Because of the inherent uncertainties of valuation, the values reflected in the financial statements may materially differ from the value received upon actual sale of those investments.
The Fund may invest in securities that are subject to interest rate risk, meaning the risk that the prices will generally fall as interest rates rise and, conversely, the prices will generally rise as interest rates fall. Specific securities differ in their sensitivity to changes in interest rates depending on their individual characteristics. Changes in interest rates may result in increased market volatility, which may affect the value and/or liquidity of certain Fund investments.
| B. | Securities Transactions and Investment Income - Securities transactions are accounted for on a trade date basis. Realized gains or losses on sales are computed on the basis of specific identification of the securities sold. Interest income (net of withholding tax, if any) is recorded on the accrual basis from settlement date and includes coupon interest and amortization of premium and accretion of discount on debt securities as applicable. |
The Fund may periodically participate in litigation related to Fund investments. As such, the Fund may receive proceeds from litigation settlements. Any proceeds received are included in the Statement of Operations as realized gain (loss) for investments no longer held and as unrealized gain (loss) for investments still held.
Brokerage commissions and mark ups are considered transaction costs and are recorded as an increase to the cost basis of securities purchased and/or a reduction of proceeds on a sale of securities. Such transaction costs are included in the determination of net realized gain (loss) from investment securities reported in the Statement of Operations and the Statement of Changes in Net Assets and the net realized gains (losses) on securities per share in the Financial Highlights. Transaction costs are included in the calculation of the Fund’s net asset value and, accordingly, they reduce the Fund’s total returns. These transaction costs are not considered operating expenses and are not reflected in net investment income reported in the Statement of Operations and the Statement of Changes in Net Assets, or the net investment income per share and the ratios of expenses and net investment income reported in the Financial Highlights, nor are they limited by any expense limitation arrangements between the Fund and the investment adviser.
The Fund allocates realized capital gains and losses to a class based on the relative net assets of each class. The Fund allocates income to a class based on the relative value of the settled shares of each class.
| C. | Country Determination - For the purposes of making investment selection decisions and presentation in the Schedule of Investments, the investment adviser may determine the country in which an issuer is located and/or credit risk exposure based on various factors. These factors include the laws of the country under which the issuer is organized, where the issuer maintains a principal office, the country in which the issuer derives 50% or more of its total revenues and the country that has the primary market for the issuer’s securities, as well as other criteria. Among the other criteria that may be evaluated for making this determination are the country in which the issuer maintains 50% or more of its assets, the type of security, financial guarantees and enhancements, the nature of the collateral and the sponsor organization. Country of issuer and/or credit risk exposure has been determined to be the United States of America, unless otherwise noted. |
| D. | Distributions - Distributions from net investment income, if any, are declared daily and paid monthly. Distributions from net realized capital gain, if any, are generally declared and paid annually and recorded on the ex-dividend date. |
| E. | Federal Income Taxes - The Fund intends to comply with the requirements of Subchapter M of the Internal Revenue Code of 1986, as amended (the “Internal Revenue Code”), necessary to qualify as a regulated investment company and to distribute substantially all of the Fund’s taxable earnings to shareholders. As such, the Fund will not be subject to federal income taxes on otherwise taxable income (including net realized capital gain) that is distributed to shareholders. Therefore, no provision for federal income taxes is recorded in the financial statements. |
The Fund recognizes the tax benefits of uncertain tax positions only when the position is more likely than not to be sustained. Management has analyzed the Fund’s uncertain tax positions and concluded that no liability for unrecognized tax benefits should be recorded related to uncertain tax positions. Management is not aware of any tax positions for which it is reasonably possible that the total amounts of unrecognized tax benefits will change materially in the next 12 months.
The Fund files tax returns in the U.S. Federal jurisdiction and certain other jurisdictions. Generally, the Fund is subject to examinations by such taxing authorities for up to three years after the filing of the return for the tax period.
| F. | Expenses - Fees provided for under the Rule 12b-1 plan of a particular class of the Fund are charged to the operations of such class. Transfer agency fees and expenses and other shareholder recordkeeping fees and expenses attributable to Class R6 are charged to such class. Transfer agency fees and expenses and other shareholder recordkeeping fees and expenses relating to all other classes are allocated among those classes based on relative net assets. All other expenses are allocated among the classes based on relative net assets. |
| G. | Accounting Estimates - The preparation of financial statements in conformity with accounting principles generally accepted in the United States of America (“GAAP”) requires management to make estimates and assumptions that affect the reported amounts of assets and liabilities at the date of the financial statements and the reported amounts of revenues and expenses during the reporting period including estimates and assumptions related to taxation. Actual results could differ from those estimates by a significant amount. In addition, the Fund monitors for material events or transactions that may occur or become known after the period-end date and before the date the financial statements are released to print. |
| | |
| 11 | | Invesco U.S. Government Money Portfolio |
| H. | Indemnifications - Under the Trust’s organizational documents, each Trustee, officer, employee or other agent of the Trust is indemnified against certain liabilities that may arise out of the performance of their duties to the Fund. Additionally, in the normal course of business, the Fund enters into contracts, including the Fund’s servicing agreements, that contain a variety of indemnification clauses. The Fund’s maximum exposure under these arrangements is unknown as this would involve future claims that may be made against the Fund that have not yet occurred. The risk of material loss as a result of such indemnification claims is considered remote. |
| I. | Repurchase Agreements - The Fund may enter into repurchase agreements. Collateral on repurchase agreements, including the Fund’s pro-rata interest in joint repurchase agreements, is taken into possession by the Fund upon entering into the repurchase agreement. Collateral consisting of U.S. Government Securities and U.S. Government Sponsored Agency Securities is marked to market daily to ensure its market value is at least 102% of the sales price of the repurchase agreement. The investments in some repurchase agreements, pursuant to procedures approved by the Board of Trustees, are through participation with other mutual funds, private accounts and certain non-registered investment companies managed by the investment adviser or its affiliates (“Joint repurchase agreements”). The principal amount of the repurchase agreement is equal to the value at period-end. If the seller of a repurchase agreement fails to repurchase the security in accordance with the terms of the agreement, the Fund might incur expenses in enforcing its rights, and could experience losses, including a decline in the value of the collateral and loss of income. |
| J. | Other Risks - Investments in obligations issued by agencies and instrumentalities of the U.S. Government may vary in the level of support they receive from the government. The government may choose not to provide financial support to government sponsored agencies or instrumentalities if it is not legally obligated to do so. In this case, if the issuer defaulted, the Fund may not be able to recover its investment in such issuer from the U.S. Government. Additionally, from time to time, uncertainty regarding the status of negotiations in the U.S. Government to increase the statutory debt limit, commonly called the “debt ceiling”, could increase the risk that the U.S. Government may default on payments on certain U.S. Government securities, cause the credit rating of the U.S. Government to be downgraded, increase volatility in the stock and bond markets, result in higher interest rates, reduce prices of U.S. Treasury securities, and/or increase the costs of various kinds of debt. If a U.S. Government-sponsored entity is negatively impacted by legislative or regulatory action, is unable to meet its obligations, or its creditworthiness declines, the performance of the Fund that holds securities of that entity will be adversely impacted. |
| K. | COVID-19 Risk - The COVID-19 strain of coronavirus has resulted in instances of market closures and dislocations, extreme volatility, liquidity constraints and increased trading costs. Efforts to contain its spread have resulted in travel restrictions, disruptions of healthcare systems, business operations (including business closures) and supply chains, layoffs, lower consumer demand and employee availability, and defaults and credit downgrades, among other significant economic impacts that have disrupted global economic activity across many industries. Such economic impacts may exacerbate other pre-existing political, social and economic risks locally or globally and cause general concern and uncertainty. |
The full economic impact and ongoing effects of COVID-19 (or other future epidemics or pandemics) at the macro-level and on individual businesses are unpredictable and may result in significant and prolonged effects on the Fund’s performance.
NOTE 2–Advisory Fees and Other Fees Paid to Affiliates
The Trust has entered into a master investment advisory agreement with Invesco Advisers, Inc. (the “Adviser” or “Invesco”). Under the terms of the investment advisory agreement, the Fund accrues daily and pays monthly an advisory fee to the Adviser based on the annual rate of the Fund’s average daily net assets as follows:
| | | | |
| Average Daily Net Assets* | | Rate | |
|
| |
First $500 million | | | 0.450% | |
Next $500 million | | | 0.425% | |
Next $500 million | | | 0.400% | |
Next $1.5 billion | | | 0.375% | |
Over $3 billion | | | 0.350% | |
| *The | advisory fee paid by the Fund shall be reduced by any amounts paid by the Fund under the administrative services agreement with the Adviser. |
For the the year ended February 28, 2022, the effective advisory fees incurred by the Fund was 0.41%.
Under the terms of a master sub-advisory agreement between the Adviser and each of Invesco Asset Management Deutschland GmbH, Invesco Asset Management Limited, Invesco Asset Management (Japan) Limited, Invesco Hong Kong Limited, Invesco Senior Secured Management, Inc. and Invesco Canada Ltd. and separate sub-advisory agreements with Invesco Capital Management LLC, and Invesco Asset Management (India) Private Limited (collectively, the “Affiliated Sub-Advisers”) the Adviser, not the Fund, will pay 40% of the fees paid to the Adviser to any such Affiliated Sub-Adviser(s) that provide(s) discretionary investment management services to the Fund based on the percentage of assets allocated to such Affiliated Sub-Adviser(s). Invesco has also entered into a Sub-Advisory Agreement with OppenheimerFunds, Inc. to provide discretionary management services to the Funds.
The Adviser has contractually agreed, through June 30, 2022, to waive advisory fees and/or reimburse expenses of all shares to the extent necessary to limit the total annual fund operating expenses after fee waiver and/or expense reimbursement (excluding certain items discussed below) of Invesco Cash Reserve, Class C, Class R, Class Y, and Class R6 shares to 0.73%, 1.58%, 1.08%, 0.58%, and 0.48%, respectively, of the Fund’s average daily net assets (the “expense limits”). In determining the Adviser’s obligation to waive advisory fees and/or reimburse expenses, the following expenses are not taken into account, and could cause total annual fund operating expenses after fee waivers and/or expense reimbursement to exceed the numbers reflected above: (1) interest; (2) taxes; (3) dividend expenses on short sales; (4) extraordinary or non-routine items, including litigation expenses; and (5) expenses that the Fund has incurred but did not actually pay because of an expense offset arrangement. Unless Invesco continues the fee waiver agreement, it will terminate on June 30, 2022. During its term, the fee waiver agreement cannot be terminated or amended to increase the expense limits or reduce the advisory fee waiver without approval of the Board of Trustees.
Further, Invesco and/or Invesco Distributors, Inc. (“IDI”) voluntarily waived fees and/or reimbursed expenses in order to increase the Fund’s yield. Voluntary fee waivers and/or reimbursements may be modified or discontinued at any time upon consultation with the Board of Trustees without further notice to investors.
For the year ended February 28, 2022, the Adviser contractually reimbursed class level expenses of $52,466, $8,882, $5,256, $1,413,707 and $5, of Invesco Cash Reserve, Class C, Class R, Class Y and Class R6 shares, respectively, and Invesco voluntarily waived advisory fees of $5,827,122 and reimbursed class level expenses $126,201, $93,833, $30,303 and $1,364,995 of Invesco Cash Reserve, Class C, Class R and Class Y shares, respectively, in order to increase the yield.
The Trust has entered into a master administrative services agreement with Invesco pursuant to which the Fund has agreed to pay Invesco for certain administrative costs incurred in providing accounting services to the Fund. For the year ended February 28, 2022, expenses incurred under the agreement are shown in the Statement of Operations as Administrative services fees. Also, Invesco has entered into a sub-administration agreement whereby The Bank of New York Mellon (“BNY Mellon”) serves as custodian and fund accountant and provides certain administrative services to the Fund.
The Trust has entered into a transfer agency and service agreement with Invesco Investment Services, Inc. (“IIS”) pursuant to which the Fund has agreed to pay IIS a fee for providing transfer agency and shareholder services to the Fund and reimburse IIS for certain expenses incurred by IIS in the course of providing such services. IIS may make payments to intermediaries that provide omnibus account services, sub-accounting services and/or networking services. All fees payable by IIS to intermediaries that provide omnibus account services or sub-accounting services are charged back to the Fund, subject to certain limitations approved by the Trust’s Board of Trustees. For the year ended February 28, 2022, expenses incurred under the agreement are shown in the Statement of Operations as Transfer agent fees.
| | |
| 12 | | Invesco U.S. Government Money Portfolio |
The Trust has entered into master distribution agreements with IDI to serve as the distributor for the Invesco Cash Reserve, Class C, and Class R shares of the Fund. The Trust has adopted plans pursuant to Rule 12b-1 under the 1940 Act with respect to the Fund’s Invesco Cash Reserve, Class C and Class R shares (collectively the “Plan”). The Fund pursuant to the Plan, pays IDI compensation at the annual rate of 0.15% of the average daily net assets of Invesco Cash Reserve shares, 1.00% of the average daily net assets of Class C shares and 0.50% of the average daily net assets of Class R shares. The fees are accrued daily and paid monthly. Any amounts not paid as a service fee under the Plan would constitute an asset-based sales charge. Rules of the Financial Industry Regulatory Authority (“FINRA”) impose a cap on the total sales charges, including asset-based sales charges, that may be paid by any class of shares of the Fund plans. For the the year ended February 28, 2022, expenses incurred under the plans are shown in the Statement of Operations as Distribution fees.
Front-end sales commissions and CDSC (collectively, the “sales charges”) are not recorded as expenses of the Fund. Front-end sales commissions are deducted from proceeds from the sales of Fund shares prior to investment in Class A shares of the Fund. CDSC are deducted from redemption proceeds prior to remittance to the shareholder. During the year ended February 28, 2022, IDI advised the Fund that IDI imposed CDSC on redemptions by shareholders for Class C shares of $2,441.
Certain officers and trustees of the Trust are officers and directors of the Adviser, IIS and/or IDI.
NOTE 3–Additional Valuation Information
GAAP defines fair value as the price that would be received to sell an asset or paid to transfer a liability in an orderly transaction between market participants at the measurement date, under current market conditions. GAAP establishes a hierarchy that prioritizes the inputs to valuation methods, giving the highest priority to readily available unadjusted quoted prices in an active market for identical assets (Level 1) and the lowest priority to significant unobservable inputs (Level 3), generally when market prices are not readily available or are unreliable. Based on the valuation inputs, the securities or other investments are tiered into one of three levels. Changes in valuation methods may result in transfers in or out of an investment’s assigned level: Level 1 – Prices are determined using quoted prices in an active market for identical assets.
| | |
| Level 1 – | | Prices are determined using quoted prices in an active market for identical assets. |
| Level 2 – | | Prices are determined using other significant observable inputs. Observable inputs are inputs that other market participants may use in pricing a security. These may include quoted prices for similar securities, interest rates, prepayment speeds, credit risk, yield curves, loss severities, default rates, discount rates, volatilities and others. |
| Level 3 – | | Prices are determined using significant unobservable inputs. In situations where quoted prices or observable inputs are unavailable (for example, when there is little or no market activity for an investment at the end of the period), unobservable inputs may be used. Unobservable inputs reflect the Fund’s own assumptions about the factors market participants would use in determining fair value of the securities or instruments and would be based on the best available information. |
As of February 28, 2022, all of the securities in this Fund were valued based on Level 2 inputs (see the Schedule of Investments for security categories). The level assigned to the securities valuations may not be an indication of the risk or liquidity associated with investing in those securities. Because of the inherent uncertainties of valuation, the values reflected in the financial statements may materially differ from the value received upon actual sale of those investments.
NOTE 4–Expense Offset Arrangement(s)
The expense offset arrangement is comprised of transfer agency credits which result from balances in demand deposit accounts used by the transfer agent for clearing shareholder transactions. For the year ended February 28, 2022, the Fund received credits from this arrangement, which resulted in the reduction of the Fund’s total expenses of $458.
NOTE 5–Trustees’ and Officers’ Fees and Benefits
Trustees’ and Officers’ Fees and Benefits include amounts accrued by the Fund to pay remuneration to certain Trustees and Officers of the Fund. Trustees have the option to defer compensation payable by the Fund, and Trustees’ and Officers’ Fees and Benefits also include amounts accrued by the Fund to fund such deferred compensation amounts. Those Trustees who defer compensation have the option to select various Invesco Funds in which their deferral accounts shall be deemed to be invested. Finally, certain current Trustees were eligible to participate in a retirement plan that provided for benefits to be paid upon retirement to Trustees over a period of time based on the number of years of service. The Fund may have certain former Trustees who also participate in a retirement plan and receive benefits under such plan. Trustees’ and Officers’ Fees and Benefits include amounts accrued by the Fund to fund such retirement benefits. Obligations under the deferred compensation and retirement plans represent unsecured claims against the general assets of the Fund.
NOTE 6–Cash Balances
The Fund is permitted to temporarily carry a negative or overdrawn balance in its account with BNY Mellon, the custodian bank. Such balances, if any at period-end, are shown in the Statement of Assets and Liabilities under the payable caption Amount due custodian. To compensate the custodian bank for such overdrafts, the overdrawn Fund may either (1) leave funds as a compensating balance in the account so the custodian bank can be compensated by earning the additional interest; or (2) compensate by paying the custodian bank at a rate agreed upon by the custodian bank and Invesco, not to exceed the contractually agreed upon rate.
NOTE 7–Distributions to Shareholders and Tax Components of Net Assets
Tax Character of Distributions to Shareholders Paid During the Years Ended February 28, 2022 and February 28, 2021:
| | | | | | | | | | | | |
| | | 2022 | | | | | | 2021 | |
|
| |
Ordinary income* | | $ | 65,540 | | | | | | | $ | 618,237 | |
|
| |
| * | Includes short-term capital gain distributions, if any. |
Tax Components of Net Assets at Period-End:
| | | | |
| | | 2022 | |
|
| |
Undistributed ordinary income | | $ | 1,075 | |
|
| |
Temporary book/tax differences | | | (223,217 | ) |
|
| |
Capital loss carryforward | | | (7,637 | ) |
|
| |
Shares of beneficial interest | | | 1,350,180,020 | |
|
| |
Total net assets | | $ | 1,349,950,241 | |
|
| |
| | |
| 13 | | Invesco U.S. Government Money Portfolio |
The temporary book/tax differences are a result of timing differences between book and tax recognition of income and/or expenses. The Fund’s temporary book/tax differences are the result of the trustee deferral of compensation and retirement plan benefits.
Capital loss carryforward is calculated and reported as of a specific date. Results of transactions and other activity after that date may affect the amount of capital loss carryforward actually available for the Fund to utilize. The ability to utilize capital loss carryforward in the future may be limited under the Internal Revenue Code and related regulations based on the results of future transactions.
The Fund has a capital loss carryforward as of February 28, 2022 as follows:
| | | | | | | | | | | | |
Capital Loss Carryforward* | |
| Expiration | | Short-Term | | | Long-Term | | | Total | |
|
| |
Not subject to expiration | | | $7,637 | | | | $- | | | | $7,637 | |
|
| |
| * | Capital loss carryforwards are reduced for limitations, if any, to the extent required by the Internal Revenue Code and may be further limited depending upon a variety of factors, including the realization of net unrealized gains or losses as of the date of any reorganization. |
NOTE 8–Reclassification of Permanent Differences
Primarily as a result of differing book/tax treatment of differing book/tax treatment of equalization and federal taxes, on February 28, 2022, undistributed net investment income was decreased by $46,321 and shares of beneficial interest was increased by $46,321. This reclassification had no effect on the net assets or the distributable earnings of the Fund.
NOTE 9–Share Information
| | | | | | | | | | | | | | | | |
| | | Summary of Share Activity | |
|
| |
| | | Years ended February 28, | |
| | | 2022 | | | 2021 | |
| | | Shares | | | Amount | | | Shares | | | Amount | |
|
| |
| | | | |
Sold: | | | | | | | | | | | | | | | | |
Invesco Cash Reserve | | | 32,606,251 | | | $ | 32,606,251 | | | | 104,717,832 | | | $ | 104,717,832 | |
|
| |
Class C | | | 4,837,791 | | | | 4,837,791 | | | | 29,269,887 | | | | 29,269,887 | |
|
| |
Class R | | | 4,368,523 | | | | 4,368,523 | | | | 10,100,878 | | | | 10,100,878 | |
|
| |
Class Y | | | 277,034,909 | | | | 277,034,909 | | | | 474,869,673 | | | | 474,869,673 | |
|
| |
| | | | |
Issued as reinvestment of dividends: | | | | | | | | | | | | | | | | |
Invesco Cash Reserve | | | 2,953 | | | | 2,953 | | | | 8,309 | | | | 8,309 | |
|
| |
Class C | | | 502 | | | | 502 | | | | 1,070 | | | | 1,070 | |
|
| |
Class R | | | 293 | | | | 293 | | | | 573 | | | | 573 | |
|
| |
Class Y | | | 61,788 | | | | 61,788 | | | | 608,278 | | | | 608,278 | |
|
| |
| | | | |
Automatic Conversion of Class C shares to Invesco Cash Reserve shares: | | | | | | | | | | | | | | | | |
Invesco Cash Reserve | | | 896,898 | | | | 896,898 | | | | 2,474,092 | | | | 2,474,092 | |
|
| |
Class C | | | (896,898 | ) | | | (896,898 | ) | | | (2,474,092 | ) | | | (2,474,092 | ) |
|
| |
| | | | |
Reacquired: | | | | | | | | | | | | | | | | |
Invesco Cash Reserve | | | (40,729,126 | ) | | | (40,729,126 | ) | | | (59,370,664 | ) | | | (59,370,664 | ) |
|
| |
Class C | | | (6,855,844 | ) | | | (6,855,844 | ) | | | (18,091,050 | ) | | | (18,091,050 | ) |
|
| |
Class R | | | (5,184,356 | ) | | | (5,184,356 | ) | | | (5,343,485 | ) | | | (5,343,485 | ) |
|
| |
Class Y | | | (464,275,420 | ) | | | (464,275,420 | ) | | | (563,606,073 | ) | | | (563,606,073 | ) |
|
| |
Net increase (decrease) in share activity | | | (198,131,736 | ) | | $ | (198,131,736 | ) | | | (26,834,772 | ) | | $ | (26,834,772 | ) |
|
| |
| | |
| 14 | | Invesco U.S. Government Money Portfolio |
Report of Independent Registered Public Accounting Firm
To the Board of Trustees of AIM Investment Securities Funds (Invesco Investment Securities Funds) and Shareholders of Invesco U.S. Government Money Portfolio
Opinion on the Financial Statements
We have audited the accompanying statement of assets and liabilities, including the schedule of investments, of Invesco U.S. Government Money Portfolio (one of the funds constituting AIM Investment Securities Funds (Invesco Investment Securities Funds), referred to hereafter as the “Fund”) as of February 28, 2022, the related statement of operations for the year ended February 28, 2022, the statement of changes in net assets for each of the two years in the period ended February 28, 2022, including the related notes, and the financial highlights for each of the periods indicated in the table below (collectively referred to as the “financial statements”). In our opinion, the financial statements present fairly, in all material respects, the financial position of the Fund as of February 28, 2022, the results of its operations for the year then ended, the changes in its net assets for each of the two years in the period ended February 28, 2022 and the financial highlights for each of the periods indicated in the table below in conformity with accounting principles generally accepted in the United States of America.
|
| |
Financial Highlights |
For each of the two years in the period ended February 28, 2022, the seven months ended February 29, 2020 and the year ended July 31, 2019 for Class Y For each of the two years in the period ended February 28, 2022, the seven months ended February 29, 2020 and the period May 24, 2019 (commencement date) through July 31, 2019 for Invesco Cash Reserve, Class C, Class R and Class R6 |
The financial statements of Oppenheimer Government Money Market Fund (subsequently renamed Invesco U.S. Government Money Portfolio) as of and for the year ended July 31, 2018 and the financial highlights for each of the periods ended on or prior to July 31, 2018 (not presented herein, other than the financial highlights) were audited by other auditors whose report dated September 26, 2018 expressed an unqualified opinion on those financial statements and financial highlights.
Basis for Opinion
These financial statements are the responsibility of the Fund’s management. Our responsibility is to express an opinion on the Fund’s financial statements based on our audits. We are a public accounting firm registered with the Public Company Accounting Oversight Board (United States) (PCAOB) and are required to be independent with respect to the Fund in accordance with the U.S. federal securities laws and the applicable rules and regulations of the Securities and Exchange Commission and the PCAOB.
We conducted our audits of these financial statements in accordance with the standards of the PCAOB. Those standards require that we plan and perform the audit to obtain reasonable assurance about whether the financial statements are free of material misstatement, whether due to error or fraud.
Our audits included performing procedures to assess the risks of material misstatement of the financial statements, whether due to error or fraud, and performing procedures that respond to those risks. Such procedures included examining, on a test basis, evidence regarding the amounts and disclosures in the financial statements. Our audits also included evaluating the accounting principles used and significant estimates made by management, as well as evaluating the overall presentation of the financial statements. Our procedures included confirmation of securities owned as of February 28, 2022 by correspondence with the custodian and brokers; when replies were not received from brokers, we performed other auditing procedures. We believe that our audits provide a reasonable basis for our opinion.
/s/PricewaterhouseCoopers LLP
Houston, Texas
April 28, 2022
We have served as the auditor of one or more of the investment companies in the Invesco group of investment companies since at least 1995. We have not been able to determine the specific year we began serving as auditor.
| | |
| 15 | | Invesco U.S. Government Money Portfolio |
Calculating your ongoing Fund expenses
Example
As a shareholder of the Fund, you incur two types of costs: (1) transaction costs, which may include sales charges (loads) on purchase payments or contingent deferred sales charges on redemptions, if any; and (2) ongoing costs, including management fees, distribution and/or service (12b-1) fees, and other Fund expenses. This example is intended to help you understand your ongoing costs (in dollars) of investing in the Fund and to compare these costs with ongoing costs of investing in other mutual funds. The example is based on an investment of $1,000 invested at the beginning of the period and held for the entire period September 1, 2021 through February 28, 2022.
Actual expenses
The table below provides information about actual account values and actual expenses. You may use the information in this table, together with the amount you invested, to estimate the expenses that you paid over the period. Simply divide your account value by $1,000 (for example, an $8,600 account value divided by $1,000 = 8.6), then multiply the result by the number in the table under the heading entitled “Actual Expenses Paid During Period” to estimate the expenses you paid on your account during this period.
Hypothetical example for comparison purposes
The table below also provides information about hypothetical account values and hypothetical expenses based on the Fund’s actual expense ratio and an assumed rate of return of 5% per year before expenses, which is not the Fund’s actual return.
The hypothetical account values and expenses may not be used to estimate the actual ending account balance or expenses you paid for the period. You may use this information to compare the ongoing costs of investing in the Fund and other funds. To do so, compare this 5% hypothetical example with the 5% hypothetical examples that appear in the shareholder reports of the other funds.
Please note that the expenses shown in the table are meant to highlight your ongoing costs only and do not reflect any transaction costs, such as sales charges (loads) on purchase payments or contingent deferred sales charges on redemptions, if any. Therefore, the hypothetical information is useful in comparing ongoing costs only, and will not help you determine the relative total costs of owning different funds. In addition, if these transaction costs were included, your costs would have been higher.
| | | | | | | | | | | | |
Class | | | | ACTUAL | | HYPOTHETICAL
(5% annual return before expenses) | | |
| | Beginning
Account Value
(09/01/21) | | Ending
Account Value
(02/28/22)1 | | Expenses
Paid During
Period2 | | Ending
Account Value
(02/28/22) | | Expenses
Paid During
Period2 | | Annualized
Expense Ratio |
Invesco Cash Reserve | | $1,000.00 | | $1,000.00 | | $0.40 | | $1,024.40 | | $0.40 | | 0.08% |
C | | 1,000.00 | | 1,000.00 | | 0.40 | | 1,024.40 | | 0.40 | | 0.08 |
R | | 1,000.00 | | 1,000.00 | | 0.40 | | 1,024.40 | | 0.40 | | 0.08 |
Y | | 1,000.00 | | 1,000.00 | | 0.40 | | 1,024.40 | | 0.40 | | 0.08 |
R6 | | 1,000.00 | | 1,000.00 | | 0.40 | | 1,024.40 | | 0.40 | | 0.08 |
| 1 | The actual ending account value is based on the actual total return of the Fund for the period September 1, 2021 through February 28, 2022, after actual expenses and will differ from the hypothetical ending account value which is based on the Fund’s expense ratio and a hypothetical annual return of 5% before expenses. |
| 2 | Expenses are equal to the Fund’s annualized expense ratio as indicated above multiplied by the average account value over the period, multiplied by 181/365 to reflect the most recent fiscal half year. |
| | |
| 16 | | Invesco U.S. Government Money Portfolio |
Tax Information
Form 1099-DIV, Form 1042-S and other year-end tax information provide shareholders with actual calendar year amounts that should be included in their tax returns. Shareholders should consult their tax advisers.
The following distribution information is being provided as required by the Internal Revenue Code or to meet a specific state’s requirement.
The Fund designates the following amounts or, if subsequently determined to be different, the maximum amount allowable for its fiscal year ended February 28, 2022:
| | | | | | |
| | Federal and State Income Tax | | | |
| | Qualified Dividend Income* | | | 0.00 | % |
| | Qualified Business Income* | | | 0.00 | % |
| | Corporate Dividends Received Deduction* | | | 0.00 | % |
| | U.S. Treasury Obligations* | | | 100.00 | % |
| | Business Interest Income* | | | 100.00 | % |
| | |
| | | * The above percentages are based on ordinary income dividends paid to shareholders during the Fund’s fiscal year. |
| | |
| 17 | | Invesco U.S. Government Money Portfolio |
Trustees and Officers
The address of each trustee and officer is AIM Investment Securities Funds (Invesco Investment Securities Funds) (the “Trust”), 11 Greenway Plaza, Suite 1000, Houston, Texas 77046-1173. The trustees serve for the life of the Trust, subject to their earlier death, incapacitation, resignation, retirement or removal as more specifically provided in the Trust’s organizational documents. Each officer serves for a one year term or until their successors are elected and qualified. Column two below includes length of time served with predecessor entities, if any.
| | | | | | | | |
Name, Year of Birth and
Position(s) Held with the Trust | | Trustee and/or Officer Since | | Principal Occupation(s) During Past 5 Years | | Number of Funds in Fund Complex
Overseen by
Trustee | | Other Directorship(s) Held by Trustee During Past 5 Years |
| Interested Trustee | | | | | | | | |
| Martin L. Flanagan1 – 1960 Trustee and Vice Chair | | 2007 | | Executive Director, Chief Executive Officer and President, Invesco Ltd. (ultimate parent of Invesco and a global investment management firm); Trustee and Vice Chair, The Invesco Funds; Vice Chair, Investment Company Institute; and Member of Executive Board, SMU Cox School of Business Formerly: Advisor to the Board, Invesco Advisers, Inc. (formerly known as Invesco Institutional (N.A.), Inc.); Chairman and Chief Executive Officer, Invesco Advisers, Inc. (registered investment adviser); Director, Chairman, Chief Executive Officer and President, Invesco Holding Company (US), Inc. (formerly IVZ Inc.) (holding company), Invesco Group Services, Inc. (service provider) and Invesco North American Holdings, Inc. (holding company); Director, Chief Executive Officer and President, Invesco Holding Company Limited (parent of Invesco and a global investment management firm); Director, Invesco Ltd.; Chairman, Investment Company Institute and President, Co-Chief Executive Officer, Co-President, Chief Operating Officer and Chief Financial Officer, Franklin Resources, Inc. (global investment management organization) | | 188 | | None |
| 1 | Mr. Flanagan is considered an interested person (within the meaning of Section 2(a)(19) of the 1940 Act) of the Trust because he is an officer of the Adviser to the Trust, and an officer and a director of Invesco Ltd., ultimate parent of the Adviser. |
| | |
| T-1 | | Invesco U.S. Government Money Portfolio |
Trustees and Officers–(continued)
| | | | | | | | |
Name, Year of Birth and
Position(s) Held with the Trust | | Trustee and/or Officer Since | | Principal Occupation(s) During Past 5 Years | | Number of Funds in Fund Complex
Overseen by
Trustee | | Other Directorship(s) Held by Trustee During Past 5 Years |
| Independent Trustees | | | | | | |
| Christopher L. Wilson – 1957 Trustee and Chair | | 2017 | | Retired Formerly: Director, TD Asset Management USA Inc. (mutual fund complex) (22 portfolios); Managing Partner, CT2, LLC (investing and consulting firm); President/Chief Executive Officer, Columbia Funds, Bank of America Corporation; President/Chief Executive Officer, CDC IXIS Asset Management Services, Inc.; Principal & Director of Operations, Scudder Funds, Scudder, Stevens & Clark, Inc.; Assistant Vice President, Fidelity Investments | | 188 | | Formerly: enaible, Inc. (artificial intelligence technology) Director, ISO New England, Inc. (non-profit organization managing regional electricity market) |
Beth Ann Brown – 1968 Trustee | | 2019 | | Independent Consultant Formerly: Head of Intermediary Distribution, Managing Director, Strategic Relations, Managing Director, Head of National Accounts, Senior Vice President, National Account Manager and Senior Vice President, Key Account Manager, Columbia Management Investment Advisers LLC; Vice President, Key Account Manager, Liberty Funds Distributor, Inc.; and Trustee of certain Oppenheimer Funds | | 188 | | Director, Board of Directors of Caron Engineering Inc.; Advisor, Board of Advisors of Caron Engineering Inc.; President and Director, Acton Shapleigh Youth Conservation Corps (non-profit) Formerly: President and Director of Grahamtastic Connection (non-profit) |
Cynthia Hostetler – 1962 Trustee | | 2017 | | Non-Executive Director and Trustee of a number of public and private business corporations Formerly: Director, Aberdeen Investment Funds (4 portfolios); Director, Artio Global Investment LLC (mutual fund complex); Director, Edgen Group, Inc. (specialized energy and infrastructure products distributor); Director, Genesee & Wyoming, Inc. (railroads); Head of Investment Funds and Private Equity, Overseas Private Investment Corporation; President, First Manhattan Bancorporation, Inc.; Attorney, Simpson Thacher & Bartlett LLP | | 188 | | Resideo Technologies, Inc. (smart home technology); Vulcan Materials Company (construction materials company); Trilinc Global Impact Fund; Textainer Group Holdings, (shipping container leasing company); Investment Company Institute (professional organization); Independent Directors Council (professional organization) |
Eli Jones – 1961 Trustee | | 2016 | | Professor and Dean Emeritus, Mays Business School - Texas A&M University Formerly: Dean of Mays Business School-Texas A&M University; Professor and Dean, Walton College of Business, University of Arkansas and E.J. Ourso College of Business, Louisiana State University; Director, Arvest Bank | | 188 | | Insperity, Inc. (formerly known as Administaff) (human resources provider); Member of Regional Board of Directors and Board of Directors, First Financial Bancorp (regional bank) |
| Elizabeth Krentzman – 1959 Trustee | | 2019 | | Formerly: Principal and Chief Regulatory Advisor for Asset Management Services and U.S. Mutual Fund Leader of Deloitte & Touche LLP; General Counsel of the Investment Company Institute (trade association); National Director of the Investment Management Regulatory Consulting Practice, Principal, Director and Senior Manager of Deloitte & Touche LLP; Assistant Director of the Division of Investment Management - Office of Disclosure and Investment Adviser Regulation of the U.S. Securities and Exchange Commission and various positions with the Division of Investment Management – Office of Regulatory Policy of the U.S. Securities and Exchange Commission; Associate at Ropes & Gray LLP; and Trustee of certain Oppenheimer Funds | | 188 | | Trustee of the University of Florida National Board Foundation; Member of the Cartica Funds Board of Directors (private investment funds) Formerly: Member of the University of Florida Law Center Association, Inc. Board of Trustees, Audit Committee and Membership Committee |
| Anthony J. LaCava, Jr. – 1956 Trustee | | 2019 | | Formerly: Director and Member of the Audit Committee, Blue Hills Bank (publicly traded financial institution) and Managing Partner, KPMG LLP | | 188 | | Blue Hills Bank; Chairman, Bentley University; Member, Business School Advisory Council; and Nominating Committee, KPMG LLP |
| Prema Mathai-Davis – 1950 Trustee | | 1998 | | Retired Formerly: Co-Founder & Partner of Quantalytics Research, LLC, (a FinTech Investment Research Platform for the Self-Directed Investor); Trustee of YWCA Retirement Fund; CEO of YWCA of the USA; Board member of the NY Metropolitan Transportation Authority; Commissioner of the NYC Department of Aging; Board member of Johns Hopkins Bioethics Institute | | 188 | | Member of Board of Positive Planet US (non-profit) and HealthCare Chaplaincy Network (non-profit) |
| | |
| T-2 | | Invesco U.S. Government Money Portfolio |
Trustees and Officers–(continued)
| | | | | | | | |
Name, Year of Birth and
Position(s) Held with the Trust | | Trustee and/or Officer Since | | Principal Occupation(s) During Past 5 Years | | Number of Funds in Fund Complex
Overseen by
Trustee | | Other Directorship(s) Held by Trustee During Past 5 Years |
| Independent Trustees–(continued) | | | | |
Joel W. Motley – 1952
Trustee | | 2019 | | Director of Office of Finance, Federal Home Loan Bank System; Managing Director of Carmona Motley Inc. (privately held financial advisor); Member of the Council on Foreign Relations and its Finance and Budget Committee; Chairman Emeritus of Board of Human Rights Watch and Member of its Investment Committee; and Member of Investment Committee Board of Historic Hudson Valley (non-profit cultural organization); and Member of the Board, Blue Ocean Acquisition Corp. Formerly: Managing Director of Public Capital Advisors, LLC (privately held financial advisor); Managing Director of Carmona Motley Hoffman, Inc. (privately held financial advisor); Trustee of certain Oppenheimer Funds; Director of Columbia Equity Financial Corp. (privately held financial advisor); and Member of the Vestry of Trinity Church Wall Street | | 188 | | Member of Board of Trust for Mutual Understanding (non-profit promoting the arts and environment); Member of Board of Greenwall Foundation (bioethics research foundation) and its Investment Committee; Member of Board of Friends of the LRC (non-profit legal advocacy); Board Member and Investment Committee Member of Pulitzer Center for Crisis Reporting (non-profit journalism)Positive Planet US |
Teresa M. Ressel – 1962
Trustee | | 2017 | | Non-executive director and trustee of a number of public and private business corporations Formerly: Chief Executive Officer, UBS Securities LLC (investment banking); Chief Operating Officer, UBS AG Americas (investment banking); Sr. Management Team Olayan America, The Olayan Group (international investor/commercial/industrial); Assistant Secretary for Management & Budget and Designated Chief Financial Officer, U.S. Department of Treasury; Director, Atlantic Power Corporation (power generation company) and ON Semiconductor Corporation (semiconductor manufacturing) | | 188 | | None |
Ann Barnett Stern – 1957
Trustee | | 2017 | | President, Chief Executive Officer and Board Member, Houston Endowment, Inc. a private philanthropic institution Formerly: Executive Vice President, Texas Children’s Hospital; Vice President, General Counsel and Corporate Compliance Officer, Texas Children’s Hospital; Attorney at Beck, Redden and Secrest, LLP and Andrews and Kurth LLP | | 188 | | Trustee and Board Vice Chair of Holdsworth Center Trustee and Chair of Nomination/Governance Committee, Good Reason Houston, (non-profit); Trustee and Investment Committee member of University of Texas Law School Foundation (non-profit); Board Member of Greater Houston Partnership (non-profit); Advisory Board member, Baker Institute for Public Policy at Rice University (non-profit) Formerly: Director and Audit Committee Member of Federal Reserve Bank of Dallas |
Robert C. Troccoli – 1949
Trustee | | 2016 | | Retired Formerly: Adjunct Professor, University of Denver – Daniels College of Business; and Managing Partner, KPMG LLP | | 188 | | None |
Daniel S. Vandivort – 1954
Trustee | | 2019 | | President, Flyway Advisory Services LLC (consulting and property management) | | 188 | | Formerly: Trustee, Board of Trustees, Treasurer and Chairman of the Audit and Committee, Huntington Disease Foundation of America; Trustee and Governance Chair, of certain Oppenheimer Funds |
| | |
| T-3 | | Invesco U.S. Government Money Portfolio |
Trustees and Officers–(continued)
| | | | | | | | |
Name, Year of Birth and
Position(s)
Held with the Trust | | Trustee and/or
Officer Since | | Principal Occupation(s) During Past 5 Years | | Number of Funds in Fund Complex
Overseen by
Trustee | | Other Directorship(s) Held by Trustee During Past 5
Years |
| Officers | | | | | | | | |
Sheri Morris – 1964
President and Principal Executive Officer | | 1999 | | Head of Global Fund Services, Invesco Ltd.; President and Principal Executive Officer, The Invesco Funds; Vice President, Invesco Exchange-Traded Fund Trust, Invesco Exchange-Traded Fund Trust II, Invesco India Exchange-Traded Fund Trust, Invesco Actively Managed Exchange-Traded Fund Trust, Invesco Actively Managed Exchange-Traded Commodity Fund Trust and Invesco Exchange-Traded Self-Indexed Fund Trust; and Vice President, OppenheimerFunds, Inc. Formerly: Vice President, Treasurer and Principal Financial Officer, The Invesco Funds; Vice President, Invesco AIM Advisers, Inc., Invesco AIM Capital Management, Inc. and Invesco AIM Private Asset Management, Inc.; Assistant Vice President and Assistant Treasurer, The Invesco Funds; Vice President and Assistant Vice President, Invesco Advisers, Inc.; Assistant Vice President, Invesco AIM Capital Management, Inc. and Invesco AIM Private Asset Management, Inc.; Treasurer, Invesco Exchange-Traded Fund Trust, Invesco Exchange-Traded Fund Trust II, Invesco India Exchange-Traded Fund Trust and Invesco Actively Managed Exchange-Traded Fund Trust and Senior Vice President, Invesco Advisers, Inc. (formerly known as Invesco Institutional (N.A.), Inc.) (registered investment adviser) | | N/A | | N/A |
Jeffrey H. Kupor – 1968
Senior Vice President, Chief Legal Officer and Secretary | | 2018 | | Head of Legal of the Americas, Invesco Ltd.; Senior Vice President and Secretary, Invesco Advisers, Inc. (formerly known as Invesco Institutional (N.A.), Inc.) (registered investment adviser); Senior Vice President and Secretary, Invesco Distributors, Inc. (formerly known as Invesco AIM Distributors, Inc.); Vice President and Secretary, Invesco Investment Services, Inc. (formerly known as Invesco AIM Investment Services, Inc.) Senior Vice President, Chief Legal Officer and Secretary, The Invesco Funds; Secretary and General Counsel, Invesco Investment Advisers LLC (formerly known as Van Kampen Asset Management); Secretary and General Counsel, Invesco Capital Markets, Inc. (formerly known as Van Kampen Funds Inc.) and Chief Legal Officer, Invesco Exchange-Traded Fund Trust, Invesco Exchange-Traded Fund Trust II, Invesco India Exchange-Traded Fund Trust, Invesco Actively Managed Exchange-Traded Fund Trust, Invesco Actively Managed Exchange-Traded Commodity Fund Trust and Invesco Exchange-Traded Self-Indexed Fund Trust;; Secretary and Vice President, Harbourview Asset Management Corporation; Secretary and Vice President, OppenheimerFunds, Inc. and Invesco Managed Accounts, LLC; Secretary and Senior Vice President, OFI Global Institutional, Inc.; Secretary and Vice President, OFI SteelPath, Inc.; Secretary and Vice President, Oppenheimer Acquisition Corp.; Secretary and Vice President, Shareholder Services, Inc.; Secretary and Vice President, Trinity Investment Management Corporation Formerly: Secretary and Vice President, Jemstep, Inc.; Head of Legal, Worldwide Institutional, Invesco Ltd.; Secretary and General Counsel, INVESCO Private Capital Investments, Inc.; Senior Vice President, Secretary and General Counsel, Invesco Management Group, Inc. (formerly known as Invesco AIM Management Group, Inc.); Assistant Secretary, INVESCO Asset Management (Bermuda) Ltd.; Secretary and General Counsel, Invesco Private Capital, Inc.; Assistant Secretary and General Counsel, INVESCO Realty, Inc.; Secretary and General Counsel, Invesco Senior Secured Management, Inc.; Secretary, Sovereign G./P. Holdings Inc.; and Secretary, Invesco Indexing LLC; Secretary, W.L. Ross & Co., LLC | | N/A | | N/A |
| Andrew R. Schlossberg – 1974 Senior Vice President | | 2019 | | Head of the Americas and Senior Managing Director, Invesco Ltd.; Director and Senior Vice President, Invesco Advisers, Inc. (formerly known as Invesco Institutional (N.A.), Inc.) (registered investment adviser); Director and Chairman, Invesco Investment Services, Inc. (formerly known as Invesco AIM Investment Services, Inc.) (registered transfer agent); Senior Vice President, The Invesco Funds; Director, Invesco Investment Advisers LLC (formerly known as Van Kampen Asset Management) Formerly: Director, President and Chairman, Invesco Insurance Agency, Inc.; Director, Invesco UK Limited; Director and Chief Executive, Invesco Asset Management Limited and Invesco Fund Managers Limited; Assistant Vice President, The Invesco Funds; Senior Vice President, Invesco Advisers, Inc. (formerly known as Invesco Institutional (N.A.), Inc.) (registered investment adviser); Director and Chief Executive, Invesco Administration Services Limited and Invesco Global Investment Funds Limited; Director, Invesco Distributors, Inc.; Head of EMEA, Invesco Ltd.; President, Invesco Actively Managed Exchange-Traded Commodity Fund Trust, Invesco Actively Managed Exchange-Traded Fund Trust, Invesco Exchange-Traded Fund Trust, Invesco Exchange-Traded Fund Trust II and Invesco India Exchange-Traded Fund Trust; Managing Director and Principal Executive Officer, Invesco Capital Management LLC | | N/A | | N/A |
| | |
| T-4 | | Invesco U.S. Government Money Portfolio |
Trustees and Officers–(continued)
| | | | | | | | |
Name, Year of Birth and
Position(s) Held with the Trust | | Trustee and/or Officer Since | | Principal Occupation(s) During Past 5 Years | | Number of Funds in Fund Complex
Overseen by
Trustee | | Other Directorship(s) Held by Trustee During Past 5 Years |
| Officers–(continued) | | | | | | | | |
John M. Zerr – 1962 Senior Vice President | | 2006 | | Chief Operating Officer of the Americas; Senior Vice President, Invesco Advisers, Inc. (formerly known as Invesco Institutional (N.A.), Inc.) (registered investment adviser); Senior Vice President, Invesco Distributors, Inc. (formerly known as Invesco AIM Distributors, Inc.); Director and Vice President, Invesco Investment Services, Inc. (formerly known as Invesco AIM Investment Services, Inc.) Senior Vice President, The Invesco Funds; Managing Director, Invesco Capital Management LLC; Director, Invesco Investment Advisers LLC (formerly known as Van Kampen Asset Management); Senior Vice President, Invesco Capital Markets, Inc. (formerly known as Van Kampen Funds Inc.); Manager, Invesco Indexing LLC; Manager, Invesco Specialized Products, LLC; Member, Invesco Canada Funds Advisory Board; Director, President and Chief Executive Officer, Invesco Corporate Class��Inc. (corporate mutual fund company); and Director, Chairman, President and Chief Executive Officer, Invesco Canada Ltd. (formerly known as Invesco Trimark Ltd./Invesco Trimark Ltèe) (registered investment adviser and registered transfer agent); President, Invesco, Inc.; President, Invesco Global Direct Real Estate Feeder GP Ltd.; President, Invesco IP Holdings (Canada) Ltd; President, Invesco Global Direct Real Estate GP Ltd.; President, Invesco Financial Services Ltd. / Services Financiers Invesco Ltée; and Director and Chairman, Invesco Trust Company Formerly: President, Trimark Investments Ltd/Services Financiers Invesco Ltee; Director and Senior Vice President, Invesco Insurance Agency, Inc.; Director and Senior Vice President, Invesco Management Group, Inc. (formerly known as Invesco AIM Management Group, Inc.); Secretary and General Counsel, Invesco Management Group, Inc. (formerly known as Invesco AIM Management Group, Inc.); Secretary, Invesco Investment Services, Inc. (formerly known as Invesco AIM Investment Services, Inc.); Chief Legal Officer and Secretary, The Invesco Funds; Secretary and General Counsel, Invesco Investment Advisers LLC (formerly known as Van Kampen Asset Management); Secretary and General Counsel, Invesco Capital Markets, Inc. (formerly known as Van Kampen Funds Inc.); Chief Legal Officer, Invesco Exchange-Traded Fund Trust, Invesco Exchange-Traded Fund Trust II, Invesco India Exchange-Traded Fund Trust, Invesco Actively Managed Exchange-Traded Fund Trust, Invesco Actively Managed Exchange-Traded Commodity Fund Trust and Invesco Exchange-Traded Self-Indexed Fund Trust; Secretary, Invesco Indexing LLC; Director, Secretary, General Counsel and Senior Vice President, Van Kampen Exchange Corp.; Director, Vice President and Secretary, IVZ Distributors, Inc. (formerly known as INVESCO Distributors, Inc.); Director and Vice President, INVESCO Funds Group, Inc.; Director and Vice President, Van Kampen Advisors Inc.; Director, Vice President, Secretary and General Counsel, Van Kampen Investor Services Inc.;Director and Secretary, Invesco Distributors, Inc. (formerly known as Invesco AIM Distributors, Inc.); Director, Senior Vice President, General Counsel and Secretary, Invesco AIM Advisers, Inc. and Van Kampen Investments Inc.; Director, Vice President and Secretary, Fund Management Company; Director, Senior Vice President, Secretary, General Counsel and Vice President, Invesco AIM Capital Management, Inc.; Chief Operating Officer and General Counsel, Liberty Ridge Capital, Inc. (an investment adviser) | | N/A | | N/A |
| Gregory G. McGreevey – 1962 Senior Vice President | | 2012 | | Senior Managing Director, Invesco Ltd.; Director, Chairman, President, and Chief Executive Officer, Invesco Advisers, Inc. (formerly known as Invesco Institutional (N.A.), Inc.) (registered investment adviser); Director, Invesco Mortgage Capital, Inc. and Invesco Senior Secured Management, Inc.; Senior Vice President, The Invesco Funds; President, SNW Asset Management Corporation and Invesco Managed Accounts, LLC; Chairman and Director, Invesco Private Capital, Inc.; Chairman and Director, INVESCO Private Capital Investments, Inc.; Chairman and Director, INVESCO Realty, Inc.; and Senior Vice President, Invesco Group Services, Inc. Formerly: Senior Vice President, Invesco Management Group, Inc. and Invesco Advisers, Inc.; Assistant Vice President, The Invesco Funds | | N/A | | N/A |
Adrien Deberghes– 1967
Principal Financial Officer, Treasurer and Vice President | | 2020 | | Head of the Fund Office of the CFO and Fund Administration; Vice President, Invesco Advisers, Inc.; Principal Financial Officer, Treasurer and Vice President, The Invesco Funds; Vice President, Invesco Exchange-Traded Fund Trust, Invesco Exchange-Traded Fund Trust II, Invesco India Exchange-Traded Fund Trust, Invesco Actively Managed Exchange-Traded Fund Trust, Invesco Actively Managed Exchange-Traded Commodity Fund Trust and Invesco Exchange-Traded Self-Indexed Fund Trust Formerly: Senior Vice President and Treasurer, Fidelity Investments | | N/A | | N/A |
Crissie M. Wisdom – 1969 Anti-Money Laundering Compliance Officer | | 2013 | | Anti-Money Laundering and OFAC Compliance Officer for Invesco U.S. entities including: Invesco Advisers, Inc. and its affiliates, Invesco Capital Markets, Inc., Invesco Distributors, Inc., Invesco Investment Services, Inc., The Invesco Funds, Invesco Capital Management, LLC, Invesco Trust Company; and Fraud Prevention Manager for Invesco Investment Services, Inc. | | N/A | | N/A |
| | |
| T-5 | | Invesco U.S. Government Money Portfolio |
Trustees and Officers–(continued)
| | | | | | | | |
Name, Year of Birth and
Position(s) Held with the Trust | | Trustee and/or Officer Since | | Principal Occupation(s) During Past 5 Years | | Number of Funds in Fund Complex
Overseen by
Trustee | | Other Directorship(s) Held by Trustee During Past 5 Years |
| Officers–(continued) | | | | | | | | |
Todd F. Kuehl – 1969 Chief Compliance Officer and Senior Vice President | | 2020 | | Chief Compliance Officer, Invesco Advisers, Inc. (registered investment adviser); and Chief Compliance Officer, The Invesco Funds and Senior Vice President Formerly: Managing Director and Chief Compliance Officer, Legg Mason (Mutual Funds); Chief Compliance Officer, Legg Mason Private Portfolio Group (registered investment adviser) | | N/A | | N/A |
Michael McMaster – 1962 Chief Tax Officer, Vice President and Assistant Treasurer | | 2020 | | Head of Global Fund Services Tax; Chief Tax Officer, Vice President and Assistant Treasurer, The Invesco Funds; Vice President, Invesco Advisers, Inc.; Assistant Treasurer, Invesco Capital Management LLC, Assistant Treasurer and Chief Tax Officer, Invesco Exchange-Traded Fund Trust, Invesco Exchange-Traded Fund Trust II, Invesco India Exchange-Traded Fund Trust, Invesco Actively Managed Exchange-Traded Fund Trust, Invesco Actively Managed Exchange-Traded Commodity Fund Trust and Invesco Exchange-Traded Self-Indexed Fund Trust; Assistant Treasurer, Invesco Specialized Products, LLC Formerly: Senior Vice President – Managing Director of Tax Services, U.S. Bank Global Fund Services (GFS) | | N/A | | N/A |
The Statement of Additional Information of the Trust includes additional information about the Fund’s Trustees and is available upon request, without charge, by calling 1.800.959.4246. Please refer to the Fund’s Statement of Additional Information for information on the Fund’s sub-advisers.
| | | | | | |
| Office of the Fund | | Investment Adviser | | Distributor | | Auditors |
| 11 Greenway Plaza, Suite 1000 | | Invesco Advisers, Inc. | | Invesco Distributors, Inc. | | PricewaterhouseCoopers LLP |
| Houston, TX 77046-1173 | | 1555 Peachtree Street, N.E. | | 11 Greenway Plaza, Suite 1000 | | 1000 Louisiana Street, Suite 5800 |
| | Atlanta, GA 30309 | | Houston, TX 77046-1173 | | Houston, TX 77002-5678 |
| | | |
| Counsel to the Fund | | Counsel to the Independent Trustees | | Transfer Agent | | Custodian |
| Stradley Ronon Stevens & Young, LLP | | Goodwin Procter LLP | | Invesco Investment Services, Inc. | | Bank of New York Mellon |
| 2005 Market Street, Suite 2600 | | 901 New York Avenue, N.W. | | 11 Greenway Plaza, Suite 1000 | | 2 Hanson Place |
| Philadelphia, PA 19103-7018 | | Washington, D.C. 20001 | | Houston, TX 77046-1173 | | Brooklyn, NY 11217-1431 |
| | |
| T-6 | | Invesco U.S. Government Money Portfolio |

Go paperless with eDelivery
Visit invesco.com/edelivery to enjoy the convenience and security of anytime electronic access to your investment documents.
With eDelivery, you can elect to have any or all of the following materials delivered straight to your inbox to download, save and print from your own computer:
| ∎ | | Fund reports and prospectuses |
Invesco mailing information
Send general correspondence to Invesco Investment Services, Inc., P.O. Box 219078, Kansas City, MO 64121-9078.
Important notice regarding delivery of security holder documents
To reduce Fund expenses, only one copy of most shareholder documents may be mailed to shareholders with multiple accounts at the same address (Householding). Mailing of your shareholder documents may be householded indefinitely unless you instruct us otherwise. If you do not want the mailing of these documents to be combined with those for other members of your household, please contact Invesco Investment Services, Inc. at 800 959 4246 or contact your financial institution. We will begin sending you individual copies for each account within 30 days after receiving your request.
Fund holdings and proxy voting information
The Fund provides a complete list of its portfolio holdings in various monthly and quarterly regulatory filings. The Fund files a complete schedule of portfolio holdings with the Securities and Exchange Commission (SEC) monthly on Form N-MFP. For the second and fourth quarters, the list appears, respectively, in the Fund’s semiannual and annual reports to shareholders. The most recent list of portfolio holdings is available at invesco.com/us. Shareholders can also look up the Fund’s Form N-MFP filings on the SEC website, sec.gov. The SEC file numbers for the Fund are shown below.
A description of the policies and procedures that the Fund uses to determine how to vote proxies relating to portfolio securities is available without charge, upon request, from our Client Services department at 800 959 4246, or at invesco.com/ corporate/about-us/esg. The information is also available on the SEC website, sec.gov.
Information regarding how the Fund voted proxies related to its portfolio securities during the most recent 12-month period ended June 30 is available at invesco.com/proxysearch. This information is also available on the SEC website, sec.gov.
Invesco Advisers, Inc. is an investment adviser; it provides investment advisory services to individual and institutional clients and does not sell securities. Invesco Distributors, Inc. is the US distributor for Invesco Ltd.’s retail mutual funds, exchange-traded funds and institutional money market funds. Both are wholly owned, indirect subsidiaries of Invesco Ltd.

| | | | |
| SEC file number(s): 811-05686 and 033-39519 | | Invesco Distributors, Inc. | | O-GMKT-AR-1 |
There were no amendments to the Code of Ethics (the “Code”) that applies to the Registrant’s Principal Executive Officer (“PEO”) and Principal Financial Officer (“PFO”) during the period covered by the report. The Registrant did not grant any waivers, including implicit waivers, from any provisions of the Code to the PEO or PFO during the period covered by this report.
| ITEM 3. | AUDIT COMMITTEE FINANCIAL EXPERT. |
The Board of Trustees has determined that the Registrant has at least one audit committee financial expert serving on its Audit Committee. The Audit Committee financial experts are Cynthia Hostetler, Anthony J. LaCava, Jr., and Robert C. Troccoli. Cynthia Hostetler, Anthony J. LaCava, Jr., and Robert C. Troccoli are “independent” within the meaning of that term as used in Form N-CSR.
| ITEM 4. | PRINCIPAL ACCOUNTANT FEES AND SERVICES. |
Pursuant to PCAOB Rule 3526, PricewaterhouseCoopers LLC (“PwC”) advised the Registrant’s Audit Committee of the following matters identified since the previous annual Form N-CSR filing that may be reasonably thought to bear on PwC’s independence. PwC advised the Audit Committee that one PwC Senior Associate held a financial interest directly in an investment company within the Invesco Funds Investment Company Complex that was inconsistent with the requirements of Rule 2-01(c)(1) of Regulation S-X. In reporting the matters to the Audit Committee, PwC noted, among other things, that the impermissible holding was disposed of by the individual, the individual was not in the chain of command of the audit or the audit partners of the Funds, the audit services performed by the individual were reviewed by team members at least two levels higher than the individual and the individual did not have any decision making responsibility for matters that materially affected the audit, the financial interest was not material to the net worth of the individual or his respective immediate family members and senior leadership of the Funds’ audit engagement team was unaware of the impermissible holdings until after the matters were confirmed to be independence exceptions or the individual ceased providing services. Based on the mitigating factors noted above, PwC advised the Audit Committee that it concluded that its objectivity and impartiality with respect to all issues encompassed within the audit engagement has not been impaired and it believes that a reasonable investor with knowledge of all relevant facts and circumstances for the violations would conclude PwC is capable of exercising objective and impartial judgment on all issues encompassed within the audits of the financial statements of the Funds in the Registrant for the impacted periods.
(a) to (d)
Fees Billed by PwC Related to the Registrant
PwC billed the Registrant aggregate fees for services rendered to the Registrant for the last two fiscal years as shown in the following table. The Audit Committee pre-approved all audit and non-audit services provided to the Registrant.
| | | | | | | | |
| | | Fees Billed for Services
Rendered to the
Registrant for fiscal
year end 2022 | | | Fees Billed for Services
Rendered to the
Registrant for fiscal
year end 2021 | |
Audit Fees | | $ | 390,551 | | | $ | 418,844 | |
Audit-Related Fees(1) | | $ | 0 | | | $ | 44,200 | |
Tax Fees(2) | | $ | 229,757 | | | $ | 148,042 | |
All Other Fees | | $ | 0 | | | $ | 0 | |
Total Fees | | $ | 620,308 | | | $ | 611,086 | |
| (1) | Audit-Related Fees for the fiscal year ended February 28, 2021 includes fees billed for reviewing regulatory filings. |
| (2) | Tax Fees for the fiscal years ended February 28, 2022 and February 28, 2021 includes fees billed for preparation of U.S. Tax Returns and Taxable Income calculations, including excise tax and year-to-date estimates for various book-to-tax differences. |
Fees Billed by PwC Related to Invesco and Invesco Affiliates
PwC billed Invesco Advisers, Inc. (“Invesco”), the Registrant’s adviser, and any entity controlling, controlled by or under common control with Invesco that provides ongoing services to the Registrant (“Invesco Affiliates”) aggregate fees for pre-approved non-audit services rendered to Invesco and Invesco Affiliates for the last two fiscal years as shown in the following table. The Audit Committee pre-approved all non-audit services provided to Invesco and Invesco Affiliates that were required to be pre-approved.
| | | | | | | | |
| | | Fees Billed for Non-Audit
Services Rendered to
Invesco and Invesco
Affiliates for fiscal year
end 2022 That Were
Required to be Pre-Approved by the Registrant’s Audit Committee | | | Fees Billed for Non-Audit
Services Rendered to
Invesco and Invesco
Affiliates for fiscal year
end 2021 That Were
Required to be Pre-Approved by the Registrant’s Audit Committee | |
Audit-Related Fees(1) | | $ | 801,000 | | | $ | 701,000 | |
Tax Fees | | $ | 0 | | | $ | 0 | |
All Other Fees | | $ | 0 | | | $ | 0 | |
| | | | | | | | |
Total Fees | | $ | 801,000 | | | $ | 701,000 | |
| (1) | Audit-Related Fees for the fiscal years ended 2022 and 2021 include fees billed related to reviewing controls at a service organization. |
(e)(1)
PRE-APPROVAL OF AUDIT AND NON-AUDIT SERVICES
POLICIES AND PROCEDURES
As adopted by the Audit Committees
of the Invesco Funds (the “Funds”)
Last Amended March 29, 2017
| | I. | Statement of Principles |
The Audit Committees (the “Audit Committee”) of the Boards of Trustees of the Funds (the “Board”) have adopted these policies and procedures (the “Procedures”) with respect to the pre-approval of audit and non-audit services to be provided by the Funds’ independent auditor (the “Auditor”) to the Funds, and to the Funds’ investment adviser(s) and any entity controlling, controlled by, or under common control with the investment adviser(s) that provides ongoing services to the Funds (collectively, “Service Affiliates”).
Under Section 202 of the Sarbanes-Oxley Act of 2002, all audit and non-audit services provided to the Funds by the Auditor must be preapproved by the Audit Committee. Rule 2-01 of Regulation S-X requires that the Audit Committee also pre-approve a Service Affiliate’s engagement of the Auditor for non-audit services if the engagement relates directly to the operations and financial reporting of the Funds (a “Service Affiliate’s Covered Engagement”).
These Procedures set forth the procedures and the conditions pursuant to which the Audit Committee may pre-approve audit and non-audit services for the Funds and a Service Affiliate’s Covered Engagement pursuant to rules and regulations of the Securities and Exchange Commission (“SEC”) and other organizations and regulatory bodies applicable to the Funds (“Applicable Rules”).1 They address both general pre-approvals without consideration of specific case-by-case services (“general pre-approvals”) and pre-approvals on a case-by-case basis (“specific pre-approvals”). Any services requiring pre-approval that are not within the scope of general pre-approvals hereunder are subject to specific pre-approval. These Procedures also address the delegation by the Audit Committee of pre-approval authority to the Audit Committee Chair or Vice Chair.
| | II. | Pre-Approval of Fund Audit Services |
The annual Fund audit services engagement, including terms and fees, is subject to specific pre-approval by the Audit Committee. Audit services include the annual financial statement audit and other procedures required to be performed by an independent auditor to be able to form an opinion on the Funds’ financial statements. The Audit Committee will receive, review and consider sufficient information concerning a proposed Fund audit engagement to make a reasonable evaluation of the Auditor’s qualifications and independence. The Audit Committee will oversee the Fund audit services engagement as necessary, including approving any changes in terms, audit scope, conditions and fees.
In addition to approving the Fund audit services engagement at least annually and specifically approving any changes, the Audit Committee may generally or specifically pre-approve engagements for other audit services, which are those services that only an independent auditor reasonably can provide. Other audit
| 1 | Applicable Rules include, for example, New York Stock Exchange (“NYSE”) rules applicable to closed-end funds managed by Invesco and listed on NYSE. |
services may include services associated with SEC registration statements, periodic reports and other documents filed with the SEC.
| | III. | General and Specific Pre-Approval of Non-Audit Fund Services |
The Audit Committee will consider, at least annually, the list of General Pre-Approved Non-Audit Services which list may be terminated or modified at any time by the Audit Committee. To inform the Audit Committee’s review and approval of General Pre-Approved Non-Audit Services, the Funds’ Treasurer (or his or her designee) and Auditor shall provide such information regarding independence or other matters as the Audit Committee may request.
Any services or fee ranges that are not within the scope of General Pre-Approved Non-Audit Services have not received general pre-approval and require specific pre-approval. Each request for specific pre-approval by the Audit Committee for services to be provided by the Auditor to the Funds must be submitted to the Audit Committee by the Funds’ Treasurer (or his or her designee) and must include detailed information about the services to be provided, the fees or fee ranges to be charged, and other relevant information sufficient to allow the Audit Committee to consider whether to pre-approve such engagement, including evaluating whether the provision of such services will impair the independence of the Auditor and is otherwise consistent with Applicable Rules.
| | IV. | Non-Audit Service Types |
The Audit Committee may provide either general or specific pre-approval of audit-related, tax or other services, each as described in more detail below.
“Audit-related services” are assurance and related services that are reasonably related to the performance of the audit or review of the Fund’s financial statements or that are traditionally performed by an independent auditor. Audit-related services include, among others, accounting consultations related to accounting, financial reporting or disclosure matters not classified as “Audit services”; assistance with understanding and implementing new accounting and financial reporting guidance from rulemaking authorities; services related to mergers, acquisitions or dispositions; compliance with ratings agency requirements and interfund lending activities; and assistance with internal control reporting requirements.
“Tax services” include, but are not limited to, the review and signing of the Funds’ federal tax returns, the review of required distributions by the Funds and consultations regarding tax matters such as the tax treatment of new investments or the impact of new regulations. The Audit Committee will not approve proposed services of the Auditor which the Audit Committee believes are to be provided in connection with a service or transaction initially recommended by the Auditor, the sole business purpose of which may be tax avoidance and the tax treatment of which may not be supported in the Internal Revenue Code and related regulations. The Audit Committee will consult with the Funds’ Treasurer (or his or her designee) and may consult with outside counsel or advisers as necessary to ensure the consistency of tax services rendered by the Auditor with the foregoing policy. The Auditor shall not represent any Fund or any Service Affiliate before a tax court, district court or federal court of claims.
Each request to provide tax services under either the general or specific pre-approval of the Audit Committee will include a description from the Auditor in writing of (i) the scope of the service, the fee structure for the engagement, and any side letter or other amendment to the engagement letter, or any other agreement (whether oral, written, or otherwise) between the Auditor and the Funds, relating to the service; and (ii) any compensation arrangement or other agreement, such as a referral agreement, a referral fee or fee-sharing arrangement, between the Auditor (or an affiliate of the Auditor) and any person (other than the Funds or Service Affiliates receiving the services) with respect to the promoting, marketing, or recommending of a transaction covered by the service. The Auditor will also discuss with the Audit Committee the potential effects of the services on the independence of the Auditor, and document the substance of its discussion with the Audit Committee.
The Audit Committee may pre-approve other non-audit services so long as the Audit Committee believes that the service will not impair the independence of the Auditor. Appendix I includes a list of services that the Auditor is prohibited from performing by the SEC rules. Appendix I also includes a list of services that would impair the Auditor’s independence unless the Audit Committee reasonably concludes that the results of the services will not be subject to audit procedures during an audit of the Funds’ financial statements.
| | V. | Pre-Approval of Service Affiliate’s Covered Engagements |
Rule 2-01 of Regulation S-X requires that the Audit Committee pre-approve a Service Affiliate’s engagement of the Auditor for non-audit services if the engagement relates directly to the operations and financial reporting of the Funds, defined above as a “Service Affiliate’s Covered Engagement”.
The Audit Committee may provide either general or specific pre-approval of any Service Affiliate’s Covered Engagement, including for audit-related, tax or other services, as described above, if the Audit Committee believes that the provision of the services to a Service Affiliate will not impair the independence of the Auditor with respect to the Funds. Any Service Affiliate’s Covered Engagements that are not within the scope of General Pre-Approved Non-Audit Services have not received general pre-approval and require specific pre-approval.
Each request for specific pre-approval by the Audit Committee of a Service Affiliate’s Covered Engagement must be submitted to the Audit Committee by the Funds’ Treasurer (or his or her designee) and must include detailed information about the services to be provided, the fees or fee ranges to be charged, a description of the current status of the pre-approval process involving other audit committees in the Invesco investment company complex (as defined in Rule 2-201 of Regulation S-X) with respect to the proposed engagement, and other relevant information sufficient to allow the Audit Committee to consider whether the provision of such services will impair the independence of the Auditor from the Funds. Additionally, the Funds’ Treasurer (or his or her designee) and the Auditor will provide the Audit Committee with a statement that the proposed engagement requires pre-approval by the Audit Committee, the proposed engagement, in their view, will not impair the independence of the Auditor and is consistent with Applicable Rules, and the description of the proposed engagement provided to the Audit Committee is consistent with that presented to or approved by the Invesco audit committee.
Information about all Service Affiliate engagements of the Auditor for non-audit services, whether or not subject to pre-approval by the Audit Committee, shall be provided to the Audit Committee at least quarterly, to allow the Audit Committee to consider whether the provision of such services is
compatible with maintaining the Auditor’s independence from the Funds. The Funds’ Treasurer and Auditor shall provide the Audit Committee with sufficiently detailed information about the scope of services provided and the fees for such services, to ensure that the Audit Committee can adequately consider whether the provision of such services is compatible with maintaining the Auditor’s independence from the Funds.
| | VI. | Pre-Approved Fee Levels or Established Amounts |
Pre-approved fee levels or ranges for audit and non-audit services to be provided by the Auditor to the Funds, and for a Service Affiliate’s Covered Engagement, under general pre-approval or specific pre-approval will be set periodically by the Audit Committee. Any proposed fees exceeding 110% of the maximum pre-approved fee levels or ranges for such services or engagements will be promptly presented to the Audit Committee and will require specific pre-approval by the Audit Committee before payment of any additional fees is made.
The Audit Committee hereby delegates, subject to the dollar limitations set forth below, specific authority to its Chair, or in his or her absence, Vice Chair, to pre-approve audit and non-audit services proposed to be provided by the Auditor to the Funds and/or a Service Affiliate’s Covered Engagement, between Audit Committee meetings. Such delegation does not preclude the Chair or Vice Chair from declining, on a case by case basis, to exercise his or her delegated authority and instead convening the Audit Committee to consider and pre-approve any proposed services or engagements.
Notwithstanding the foregoing, the Audit Committee must pre-approve: (a) any non-audit services to be provided to the Funds for which the fees are estimated to exceed $500,000; (b) any Service Affiliate’s Covered Engagement for which the fees are estimated to exceed $500,000; or (c) any cost increase to any previously approved service or engagement that exceeds the greater of $250,000 or 50% of the previously approved fees up to a maximum increase of $500,000.
| | VIII. | Compliance with Procedures |
Notwithstanding anything herein to the contrary, failure to pre-approve any services or engagements that are not required to be pre-approved pursuant to the de minimis exception provided for in Rule 2-01(c)(7)(i)(C) of Regulation S-X shall not constitute a violation of these Procedures. The Audit Committee has designated the Funds’ Treasurer to ensure services and engagements are pre-approved in compliance with these Procedures. The Funds’ Treasurer will immediately report to the Chair of the Audit Committee, or the Vice Chair in his or her absence, any breach of these Procedures that comes to the attention of the Funds’ Treasurer or any services or engagements that are not required to be pre-approved pursuant to the de minimis exception provided for in Rule 2-01(c)(7)(i)(C) of Regulation S-X.
On at least an annual basis, the Auditor will provide the Audit Committee with a summary of all non-audit services provided to any entity in the investment company complex (as defined in section 2-01(f)(14) of Regulation S-X, including the Funds and Service Affiliates) that were not pre-approved, including the nature of services provided and the associated fees.
| | IX. | Amendments to Procedures |
All material amendments to these Procedures must be approved in advance by the Audit Committee. Non-material amendments to these Procedures may be made by the Legal and Compliance Departments
and will be reported to the Audit Committee at the next regularly scheduled meeting of the Audit Committee.
Appendix I
Non-Audit Services That May Impair the Auditor’s Independence
The Auditor is not independent if, at any point during the audit and professional engagement, the Auditor provides the following non-audit services:
| | • | Broker-dealer, investment adviser, or investment banking services ; |
| | • | Expert services unrelated to the audit; |
| | • | Any service or product provided for a contingent fee or a commission; |
| | • | Services related to marketing, planning, or opining in favor of the tax treatment of confidential transactions or aggressive tax position transactions, a significant purpose of which is tax avoidance; |
| | • | Tax services for persons in financial reporting oversight roles at the Fund; and |
| | • | Any other service that the Public Company Oversight Board determines by regulation is impermissible. |
An Auditor is not independent if, at any point during the audit and professional engagement, the Auditor provides the following non-audit services unless it is reasonable to conclude that the results of the services will not be subject to audit procedures during an audit of the Funds’ financial statements:
| | • | Bookkeeping or other services related to the accounting records or financial statements of the audit client; |
| | • | Financial information systems design and implementation; |
| | • | Appraisal or valuation services, fairness opinions, or contribution-in-kind reports; |
| | • | Internal audit outsourcing services. |
(e)(2) There were no amounts that were pre-approved by the Audit Committee pursuant to the de minimus exception under Rule 2-01 of Regulation S-X.
(f) Not applicable.
(g) In addition to the amounts shown in the tables above, PwC billed Invesco and Invesco Affiliates aggregate fees of $5,931,000 for the fiscal year ended February 28, 2022 and $6,219,000 for the fiscal year ended February 28, 2021. In total, PwC billed the Registrant, Invesco and Invesco Affiliates aggregate non-audit fees of $6,961,757 for the fiscal year ended February 28, 2022 and $7,068,042 for the fiscal year ended February 28, 2021.
PwC provided audit services to the Investment Company complex of approximately $30 million.
(h) The Audit Committee also has considered whether the provision of non-audit services that were rendered to Invesco and Invesco Affiliates that were not required to be pre-approved pursuant to SEC regulations, if any, is compatible with maintaining PwC’s independence.
| ITEM 5. | AUDIT COMMITTEE OF LISTED REGISTRANTS. |
Not applicable.
| ITEM 6. | SCHEDULE OF INVESTMENTS. |
Investments in securities of unaffiliated issuers is included as part of the reports to stockholders filed under Item 1 of this Form.
| ITEM 7. | DISCLOSURE OF PROXY VOTING POLICIES AND PROCEDURES FOR CLOSED-END MANAGEMENT INVESTMENT COMPANIES. |
Not applicable.
| ITEM 8. | PORTFOLIO MANAGERS OF CLOSED-END MANAGEMENT COMPANIES. |
Not applicable.
| ITEM 9. | PURCHASES OF EQUITY SECURITIES BY CLOSED-END MANAGEMENT INVESTMENT COMPANY AND AFFILIATED PURCHASERS. |
Not applicable.
| ITEM 10. | SUBMISSION OF MATTERS TO A VOTE OF SECURITY HOLDERS. |
None.
| ITEM 11. | CONTROLS AND PROCEDURES. |
| | (a) | As of April 19, 2022, an evaluation was performed under the supervision and with the participation of the officers of the Registrant, including the Principal Executive Officer (“PEO”) and Principal Financial Officer (“PFO”), to assess the effectiveness of the Registrant’s disclosure controls and procedures, as that term is defined in Rule 30a-3(c) under the Investment Company Act of 1940 (“Act”), as amended. Based on that evaluation, the Registrant’s officers, including the PEO and PFO, concluded that, as of April 19, 2022, the Registrant’s disclosure controls and procedures were reasonably designed so as to ensure: (1) that information required to be disclosed by the Registrant on Form N-CSR is recorded, processed, summarized and reported within the time periods specified by the rules and forms of the Securities and Exchange Commission; and (2) that material information relating to the Registrant is made known to the PEO and PFO as appropriate to allow timely decisions regarding required disclosure. |
| | (b) | There have been no changes in the Registrant’s internal control over financial reporting (as defined in Rule 30a-3(d) under the Act) that occurred during the period covered by this report that have materially affected, or are reasonably likely to materially affect, the Registrant’s internal control over financial reporting. |
| ITEM 12. | DISCLOSURE OF SECURITIES LENDING ACTIVITIES FOR CLOSED-END MANAGEMENT INVESTMENT COMPANIES. |
Not applicable.
.
SIGNATURES
Pursuant to the requirements of the Securities Exchange Act of 1934 and the Investment Company Act of 1940, the Registrant has duly caused this report to be signed on its behalf by the undersigned, thereunto duly authorized.
Registrant: AIM Investment Securities Funds (Invesco Investment Securities Funds)
| | |
| By: | | /s/ Sheri Morris |
| | Sheri Morris |
| | Principal Executive Officer |
| |
| Date: | | May 6, 2022 |
Pursuant to the requirements of the Securities and Exchange Act of 1934 and the Investment Company Act of 1940, this report has been signed below by the following persons on behalf of the Registrant and in the capacities and on the dates indicated.
| | |
| By: | | /s/ Sheri Morris |
| | Sheri Morris |
| | Principal Executive Officer |
| |
| Date: | | May 6, 2022 |
| | |
| By: | | /s/ Adrien Deberghes |
| | Adrien Deberghes |
| | Principal Financial Officer |
| |
| Date: | | May 6, 2022 |